Exhibit 99.1

7+( 75$9(/(56 &203$1,(6,1& ,QYHVWRU3UHVHQWDWLRQ JANUARY 2025
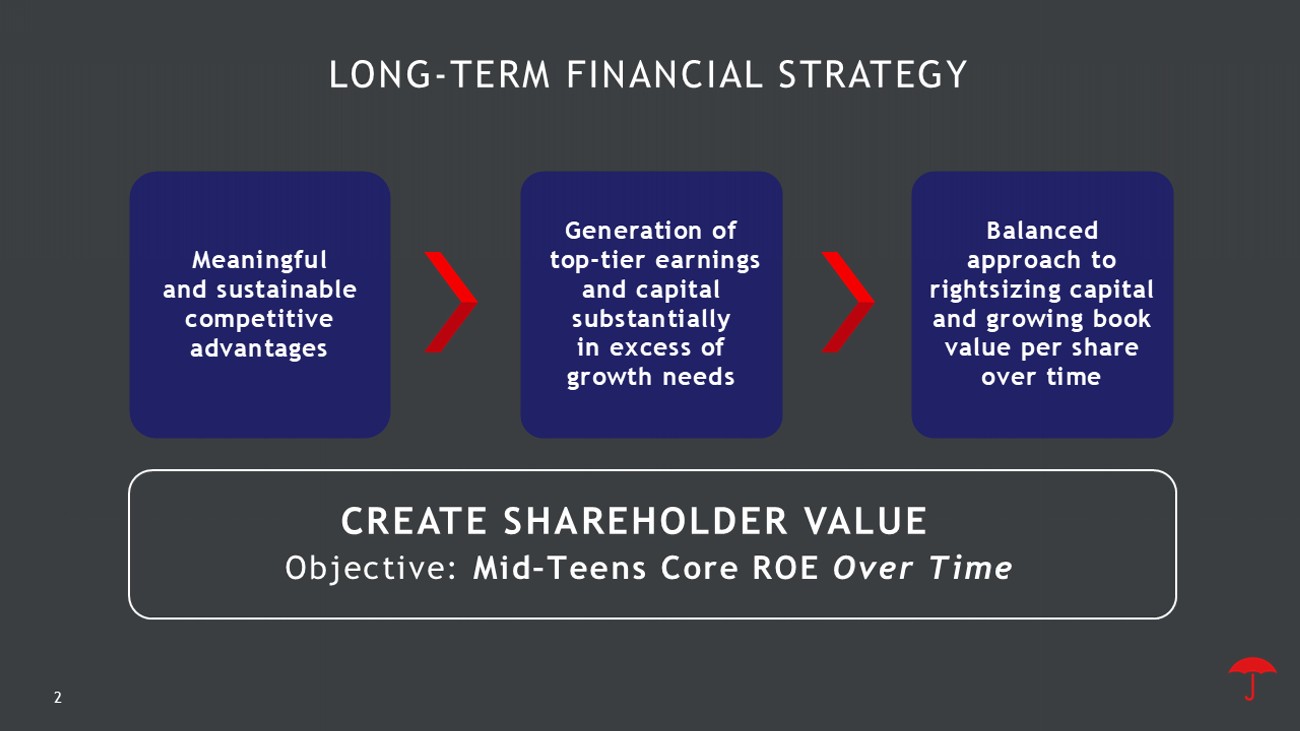
CREATE SHAREHOLDER VALUE 2EMHFWLYH 0LG ² 7HHQV&RUH52( 2YHU7LPH LONG - TERM FINANCIAL STRATEGY Meaningful and sustainable competitive advantages Generation of top - tier earnings and capital substantially in excess of growth needs %DODQFHG DSSURDFKWR ULJKWVL]LQJFDSLWDO DQGJURZLQJERRN YDOXHSHUVKDUH RYHUWLPH

“The investments that we’re making … are designed, in large part, to position us to grow over time at leading returns .” 2017 Extend our advantage in risk expertise Provide great experiences Improve productivity & efficiency

‡ 0HDQLQJIXOO\LQFUHDVHGRXURYHUDOO WHFKQRORJ\ VSHQG RYHUWKHODVWVHYHQ\HDUV ‡ 6LJQLILFDQWO\ UHGXFHGRXUH[SHQVHUDWLR DWWKH VDPHWLPHWKURXJKRXUVWUDWHJLFIRFXVRQ RSWLPL]LQJSURGXFWLYLW\DQGHIILFLHQF\ ‡ ,PSURYHGWKHPL[ RIRXUWHFKQRORJ\VSHQG Ⱦ ,QFUHDVHGRXU VSHQGLQJRQVWUDWHJLFWHFKQRORJ\ LQLWLDWLYHVE\RYHU ZKLOHKDYLQJFDUHIXOO\ PDQDJHGJURZWKLQURXWLQHEXWQHFHVVDU\ H[SHQGLWXUHV TECHNOLOGY INVESTMENTS $

% $22.4B 28.5% AVG = 31.7% AVG = 91.0% 93.0% $9.1B $3.7B % $1.3B % $69.7B Accelerating NWP Growth Consistently Strong Underlying Profitability 3 ,PSURYHG([SHQVH5DWLR +LJKHU8QGHUO\LQJ8QGHUZULWLQJ,QFRPH Higher Cash Flow From Operations Growing Invested Assets 5 DIWHU WD[ 5 1 Represents growth from 2012 through 2016 . 2 Represents growth from 2016 through 2024 . 3 Underlying underwriting combined ratio which excludes the impact of net prior year reserve development and catastrophe losses . 4 Underlying underwriting income which excludes the impact of net prior year reserve development and catastrophe losses . 5 Invested assets excludes net unrealized investment gains (losses) . '(/,%(5$7($1'',6&,3/,1('(;(&87,21 2012 - 2016 2012 - 2016

CORE INCOME & CORE EARNINGS PER SHARE 2024 Full Year CORE INCOME versus 2023 Full Year ($ in millions, after - tax) )XOO<HDU $3,072 Core Income $13.13 Core EPS 2024 Full Year +64% yoy $5,025 Core Income +64% yoy $21.58 Core EPS PYD $113 PYD $559 NII $2,436 NII $2,952 CATs $(2,361) CATs $(2,632) Underlying Underwriting $3,221 Underlying Underwriting $4,454 Other $(337) Other $(308) (4,000) (2,000) - 2,000 4,000 6,000 8,000 10,000 2023 Full Year 2024 Full Year

Proprietary and confidential. Do not distribute. 7 INDUSTRY LEADING RETURNS OVER TIME Outperformance relative to peers accompanied by significantly lower volatility Ξ &RQQLQJ ,QF DV SXEOLVKHG LQ &RQQLQJ ͛ Ɛ WƌŽƉĞƌƚLJ Ͳ ĂƐƵĂůƚLJ &ŽƌĞĐĂƐƚ Θ ŶĂůLJƐŝƐ ďLJ >ŝŶĞ ŽĨ /ŶƐƵƌĂŶĐĞ ͕ ϮϬϮϰ Y Ϯ ĞĚŝƟŽŶ ͘ hƐĞĚ ǁŝƚŚ ƉĞƌŵŝƐƐŝŽŶ ͘ ,ŝƐƚŽƌŝĐĂů ĚĂƚĂ ͗ Ξ 6 3 *OREDO 0DUNHW ,QWHOOLJHQFH //& 8VHG ZLWK SHUPLVVLRQ < 7UHDVXU\ \LHOG LV FDOFXODWHG DV DYHUDJH RI HDFK \HDU 9RODWLOLW\ DV PHDVXUHG E\ 6KDUSH 5DWLR FDOFXODWHG DV WKH PHDQ RI &RPSDQ\ ´ ; µ 2SHUDWLQJ 52( DV 5HSRUWHG RU 1HW ,QFRPH 52( H[ 5HDOL]HG *DLQV DQG /RVVHV DV FDOFXODWHG E\ %ORRPEHUJ LI 2SHUDWLQJ 52( LV QRW GLVFORVHG OHVV WKH <HDU 8 6 7UHDVXU\ PHDQ IRU HDFK UHVSHFWLYH \HDU GLYLGHG E\ &RPSDQ\ ´ ; µ 2SHUDWLQJ 52( VWDQGDUG GHYLDWLRQ 3HHU *URXS LQFOXGHV $,* $// &% &,1) &1$ +,* 3*5 7+* DQG :5% ‹ %ORRPEHUJ )LQDQFH / 3 8VHG ZLWK SHUPLVVLRQ RI %ORRPEHUJ 2SHUDWLQJ52(DV5HSRUWHGRU1HW,QFRPH52(H[ 5HDOL]HG*DLQVDQG/RVVHVDVFDOFXODWHGE\%ORRPEHUJLI2SHUDWLQJ52(LVQRWGLV FORVHG ‹ %ORRPEHUJ)LQDQFH/38VHGZLWKSHUPLVVLRQRI%ORRPEHUJ Volatility of Core Return on Equity vs. Peers Low Leading Core ROE at Industry - Low Volatility 2% 4% 6% 10% 12% 14% U.S. P&C Insurers 1 0% 2% 4% 6% 8% 10% 12% 14% 16% 18% Return on Equity vs. Industry Core Return on Equity vs. Risk - Free Rate TRV Core Return on Equity 5LVN )UHH5DWH <7UHDVXU\<LHOG ROE Consistently Outperforms 2014 - 23 Core Return on Equity (Average) 4 Peers: AIG, ALL, CB, CINF, CNA, HIG, PGR, THG, WRB 10Y Volatility 3 +LJK Core ROE: Strong Margin Over the Risk - Free Rate Ξ &RQQLQJ ,QF DV SXEOLVKHG LQ &RQQLQJ ͛ Ɛ WƌŽƉĞƌƚLJ Ͳ ĂƐƵĂůƚLJ &ŽƌĞĐĂƐƚ Θ ŶĂůLJƐŝƐ ďLJ >ŝŶĞ ŽĨ /ŶƐƵƌĂŶĐĞ ͕ ϮϬϮϰ Y Ϯ ĞĚŝƟŽŶ ͘ hƐĞĚ ǁŝƚŚ ƉĞƌŵŝƐƐŝŽŶ ͘ ,ŝƐƚŽƌŝĐĂů ĚĂƚĂ ͗ Ξ 6 3 *OREDO 0DUNHW ,QWHOOLJHQFH //& 8VHG ZLWK SHUPLVVLRQ < 7UHDVXU\ \LHOG LV FDOFXODWHG DV DYHUDJH RI HDFK \HDU 9RODWLOLW\ DV PHDVXUHG E\ 6KDUSH 5DWLR FDOFXODWHG DV WKH PHDQ RI &RPSDQ\ ´ ; µ 2SHUDWLQJ 52( DV 5HSRUWHG RU 1HW ,QFRPH 52( H[ 5HDOL]HG *DLQV DQG /RVVHV DV FDOFXODWHG E\ %ORRPEHUJ LI 2SHUDWLQJ 52( LV QRW GLVFORVHG OHVV WKH <HDU 8 6 7UHDVXU\ PHDQ IRU HDFK UHVSHFWLYH \HDU GLYLGHG E\ &RPSDQ\ ´ ; µ 2SHUDWLQJ 52( VWDQGDUG GHYLDWLRQ 3HHU *URXS LQFOXGHV $,* $// &% &,1) &1$ +,* 3*5 7+* DQG :5% ‹ %ORRPEHUJ )LQDQFH / 3 8VHG ZLWK SHUPLVVLRQ RI %ORRPEHUJ 2SHUDWLQJ52(DV5HSRUWHGRU1HW,QFRPH52(H[ 5HDOL]HG*DLQVDQG/RVVHVDVFDOFXODWHGE\%ORRPEHUJLI2SHUDWLQJ52(LVQRWGLV FORVHG ‹ %ORRPEHUJ)LQDQFH/38VHGZLWKSHUPLVVLRQRI%ORRPEHUJ

Adjusted Book Value 1 Per Share 'LYLGHQGV3HU6KDUH Cumulative Share Buybacks ($ in billions) 8 1 Excludes net unrealized investment gains (losses), net of tax, included in shareholders’ equity %$/$1&('$3352$&+72&$3,7$/0$1$*(0(17 $36.21 $1.01 $4.15

9 &$/,)251,$:,/'),5( • Beginning in early January 2025, a series of severe wildfires principally impacting the Pacific Palisades neighborhood and Eaton Canyon area in Southern California were fueled by drought conditions and high winds; the fires were also spread by wind - driven embers, which ignited fires in areas generally considered to be at relatively lower risk for wildfire • Losses from these fires will have a material impact on Travelers 1Q25 earnings • Travelers will take time to refine its analysis before providing a loss estimate; the event is very recent and, to some degree, still ongoing • Travelers expects that its wildfire losses will primarily be related to personal property exposures from the Pacific Palisades and Eaton Fires, both of which include mass affluent and middle market homes; losses will also come from related coverages, such as additional living expenses, additional replacement cost protection, and ordinance and law • Travelers also expects additional exposure from any FAIR Plan assessment and from commercial insurance • Travelers generally writes Homeowners policies in California on its Quantum Home 2.0 form, which includes coverage for wildfire; to a much lesser extent, Travelers writes Difference in Conditions (DIC) policies, which exclude coverage for wildfire

:+<75$9(/(56" 10 5HSUHVHQWVWKHFKDQJHLQVWRFNSULFHSOXVWKHFXPXODWLYHDPRXQWRIGLYLGHQGVDVVXPLQJGLYLGHQGUHLQYHVWPHQW)RUHDFK\HDUR QW KHFKDUWWRWDOUHWXUQ LVFDOFXODWHGZLWK-DQXDU\ DVWKHVWDUWLQJSRLQWDQG'HFHPEHU RIWKHUHOHYDQW\HDUDVWKHHQGLQJSRLQW ‹ %ORRPEHUJ)LQDQFH/38VHGZLWK SHUPLVVLRQRI%ORRPEHUJ x Track record of growth x Leading returns x Low volatility 6WURQJ6KDUHKROGHU9DOXH :HKDYHVXFFHVVIXOO\FUHDWHGYDOXHRYHU WLPHWKURXJKSHULRGVRIZHDWKHU YRODWLOLW\GHYHORSPHQWVLPSDFWLQJORVV WUHQGVDQGH[WUHPHHFRQRPLF JHRSROLWLFDODQGRWKHUFRQGLWLRQV )URPKHUHZHDUHLQQRYDWLQJRQWRSRI DIRXQGDWLRQRIH[FHOOHQFHWRHQVXUHRXU FRQWLQXHGVXFFHVVWKURXJKFRPSHWLWLYH DGYDQWDJHVWKDWDUHUHOHYDQW GLIIHUHQWLDWLQJDQGGLIILFXOWWRUHSOLFDWH 1/1/2008 Total Shareholder Return 1 S&P 500 'RZ-RQHV S&P 500 P&C 6 3 )LQDQFLDOV (100%) 0% 100% 200% 300% 400% 500% 600% 700%


Disclosure In this presentation, we may refer to some non - GAAP financial measures. For a reconciliation of these measures to the most comparable GAAP measures, please see the pages that follow. For a glossary of selected insurance terms, as well as other info rma tion about Travelers, we refer you to our most recent annual report on Form 10 - K filed with the Securities and Exchange Commission (S EC), as updated by our subsequent periodic filings with the SEC , all of which are available at the SEC’s website ( sec.gov ). This presentation should be read with Travelers’ fourth quarter 2024 webcast presentation, earnings press release and financi al supplement, all of which can be found at the “Investors” section at travelers.com . Travelers may use its website and/or social media outlets, such as Facebook and X, as distribution channels of material information. Financial and other important information regarding the company is routinely accessible through and posted on our website at investor.travelers.com , our Facebook page at facebook.com/travelers and our X account (@Travelers) at twitter.com/travelers . In addition, you may automatically receive email alerts and other information about Travelers when you enroll your email address by visiting the Email Notification section at investor.travelers.com . S&P Global Market Intelligence (“SPGMI”) Disclaimer. Information obtained from SPGMI should not be relied on as investment advice. SPGMI does not guarantee the accuracy or completeness of information obtained from it and shall not be responsible for any errors or omissions with respect to such information or be liable for any results or losses arising out of the use of such information. Reproduction of SPGMI information is prohibited without the prior written permission of SPGMI.

(;3/$1$725<127( This presentation contains, and management may make, certain “forward - looking statements” within the meaning of the Private Secu rities Litigation Reform Act of 1995. All statements, other than statements of historical facts, may be forward - looking statemen ts. Words such as “may,” “will,” “should,” “likely,” “probably,” “anticipates,” “expects,” “intends,” “plans,” “projects,” “believes,” “views,” “ensures,” “es tim ates” and similar expressions are used to identify these forward - looking statements. These statements include, among other thing s, the Company’s statements about: • the Company’s outlook, the impact of trends on its business and its future results of operations and financial condition; • the impact of legislative or regulatory actions or court decisions; • share repurchase plans; • future pension plan contributions; • the sufficiency of the Company’s reserves, including asbestos; • the impact of emerging claims issues as well as other insurance and non - insurance litigation; • the cost and availability of reinsurance coverage; • catastrophe losses (including the recent California wildfires and the 2025 Plan) and modeling; • the impact of investment, economic and underwriting market conditions, including interest rates and inflation; • the Company’s approach to managing its investment portfolio; • the impact of changing climate conditions; • strategic and operational initiatives to improve growth, profitability and competitiveness; • the Company’s competitive advantages and innovation agenda, including executing on that agenda with respect to artificial int ell igence; • the Company’s cybersecurity policies and practices; • new product offerings; • the impact of developments in the tort environment; • the impact of developments in the geopolitical environment; and • the impact of the Company’s acquisition of Corvus Insurance Holdings, Inc. The Company cautions investors that such statements are subject to risks and uncertainties, many of which are difficult to pr edi ct and generally beyond the Company’s control, that could cause actual results to differ materially from those expressed in, or implied or projected by, the forward - looking information and statements. Some of the factors that could cause actual results to differ include, but are not limite d t o, the following: Insurance - Related Risks • high levels of catastrophe losses, including the recent California wildfires; • actual claims may exceed the Company’s claims and claim adjustment expense reserves, or the estimated level of claims and cla im adjustment expense reserves may increase, including as a result of, among other things, changes in the legal/tort, regulatory an d economic environments, including increased inflation; • the Company’s potential exposure to asbestos and environmental claims and related litigation; • the Company is exposed to, and may face adverse developments involving, mass tort claims; and • the effects of emerging claim and coverage issues on the Company’s business are uncertain, and court decisions or legislative ch anges that take place after the Company issues its policies can result in an unexpected increase in the number of claims. Financial, Economic and Credit Risks • a period of financial market disruption or an economic downturn; • the Company’s investment portfolio is subject to credit and interest rate risk, and may suffer reduced or low returns or mate ria l realized or unrealized losses; • the Company is exposed to credit risk related to reinsurance and structured settlements, and reinsurance coverage may not be ava ilable to the Company; • the Company is exposed to credit risk in certain of its insurance operations and with respect to certain guarantee or indemni fic ation arrangements that it has with third parties; • a downgrade in the Company’s claims - paying and financial strength ratings; and • the Company’s insurance subsidiaries may be unable to pay dividends to the Company’s holding company in sufficient amounts. Business and Operational Risks • the intense competition that the Company faces, including with respect to attracting and retaining employees, and the impact of innovation, technological change and changing customer preferences on the insurance industry and the markets in which it oper ate s; • disruptions to the Company’s relationships with its independent agents and brokers or the Company’s inability to manage effec tiv ely a changing distribution landscape; • the Company’s efforts to develop new products or services, expand in targeted markets, improve business processes and workflo ws or make acquisitions may not be successful and may create enhanced risks; • the Company's pricing and capital models may provide materially different indications than actual results; • loss of or significant restrictions on the use of particular types of underwriting criteria, such as credit scoring, or other da ta or methodologies, in the pricing and underwriting of the Company’s products; • the Company is subject to additional risks associated with its business outside the United States; and • future pandemics (including new variants of COVID - 19). Technology and Intellectual Property Risks • as a result of cyber attacks (the risk of which could be exacerbated by geopolitical tensions) or otherwise, the Company may exp erience difficulties with technology, data and network security or outsourcing relationships; • the Company’s dependence on effective information technology systems and on continuing to develop and implement improvements in technology; and • the Company may be unable to protect and enforce its own intellectual property or may be subject to claims for infringing the in tellectual property of others. Regulatory and Compliance Risks • changes in regulation, including changes in tax laws; and • the Company's compliance controls may not be effective. In addition, the Company’s share repurchase plans depend on a variety of factors, including the Company’s financial position, ea rnings, share price, catastrophe losses, maintaining capital levels appropriate for the Company’s business operations, change s i n levels of written premiums, funding of the Company’s qualified pension plan, capital requirements of the Company’s operating subsidiaries, legal requirements, re gul atory constraints, other investment opportunities (including mergers and acquisitions and related financings), market conditi ons , changes in tax laws and other factors. Our forward - looking statements speak only as of the date of this presentation or as of the date they are made, and we undertake no obligation to update forward - looking statements. For a more detailed discussion of these factors, see the information under t he captions “Risk Factors,” “Management’s Discussion and Analysis of Financial Condition and Results of Operations” and “Forward Looking Statements” in o ur most recent annual report on Form 10 - K filed with the SEC on February 15, 2024, as updated by our periodic filings with the SEC.

14 7KHIROORZLQJPHDVXUHVDUHXVHGE\WKH&RPSDQ\ · VPDQDJHPHQWWRHYDOXDWHILQDQFLDOSHUIRUPDQFHDJDLQVWKLVWRULFDOUHVXOWVWRHVWDEOLVKSHUIRUPDQFHWDUJHWVRQDFRQVROLGDWHG ED VLVDQGIRURWKHUUHDVRQVDVGLVFXVVHG EHORZ,QVRPHFDVHVWKHVHPHDVXUHVDUHFRQVLGHUHGQRQ *$$3ILQDQFLDOPHDVXUHVXQGHUDSSOLFDEOH6(&UXOHVEHFDXVHWKH\DUHQRW GLVSOD\HGDVVHSDUDWHOLQHLWHPVLQWKHFRQVROLGDWHGILQDQFLDOVWDWHPHQWVRUDUHQRW UHTXLUHGWREHGLVFORVHGLQWKHQRWHVWRILQDQFLDOVWDWHPHQWVRULQVRPHFDVHVLQFOXGHRUH[FOXGHFHUWDLQLWHPVQRWRUGLQDU LO\ LQFOXGHGRUH[FOXGHGLQWKHPRVWFRPSDUDEOH*$$3ILQDQFLDOPHDVXUH5HFRQFLOLDWLRQVRIWKHVH PHDVXUHVWRWKHPRVWFRPSDUDEOH*$$3PHDVXUHVDOVRIROORZ ,QWKHRSLQLRQRIWKH&RPSDQ\ · VPDQDJHPHQWDGLVFXVVLRQRIWKHVHPHDVXUHVSURYLGHVLQYHVWRUVILQDQFLDODQDO\VWVUDWLQJDJHQFLHVDQGRWKHUILQDQFLDOVWDW HPH QWXVHUVZLWKDEHWWHUXQGHUVWDQGLQJRIWKHVLJQLILFDQWIDFWRUV WKDWFRPSULVHWKH&RPSDQ\ · VSHULRGLFUHVXOWVRIRSHUDWLRQVDQGKRZPDQDJHPHQWHYDOXDWHVWKH&RPSDQ\ · VILQDQFLDOSHUIRUPDQFH 6RPHRIWKHVHPHDVXUHVH[FOXGHQHWUHDOL]HGLQYHVWPHQWJDLQVORVVHVQHWRIWD[DQGRUQHWXQUHDOL]HGLQYHVWPHQWJDLQVOR VVH VQHWRIWD[LQFOXGHGLQVKDUHKROGHUV · HTXLW\ZKLFKFDQEHVLJQLILFDQWO\LPSDFWHGE\ERWK GLVFUHWLRQDU\DQGRWKHUHFRQRPLFIDFWRUVDQGDUHQRWQHFHVVDULO\LQGLFDWLYHRIRSHUDWLQJWUHQGV 2WKHUFRPSDQLHVPD\FDOFXODWHWKHVHPHDVXUHVGLIIHUHQWO\DQGWKHUHIRUHWKHLUPHDVXUHVPD\QRWEHFRPSDUDEOHWRWKRVHXVHG E\ WKH&RPSDQ\ · VPDQDJHPHQW 5(&21&,/,$7,212)1(7,1&20(72&25(,1&20($1'&25(,1&20(72$)7(5 7$;81'(5/<,1*81'(5:5,7,1*,1&20( 8QGHUZULWLQJJDLQORVVLVQHWHDUQHGSUHPLXPVDQGIHHLQFRPHOHVVFODLPVDQGFODLPDGMXVWPHQWH[SHQVHVDQGLQVXUDQFH UHODWHGH [SHQVHV,QWKHRSLQLRQRIWKH&RPSDQ\ · VPDQDJHPHQWLWLVLPSRUWDQWWRPHDVXUHWKH SURILWDELOLW\RIHDFKVHJPHQWH[FOXGLQJWKHUHVXOWVRILQYHVWLQJDFWLYLWLHVZKLFKDUHPDQDJHGVHSDUDWHO\IURPWKHLQVXUDQFH EXV LQHVV7KLVPHDVXUHLVXVHGWRDVVHVVHDFKVHJPHQW · VEXVLQHVVSHUIRUPDQFHDQGDVDWRROLQ PDNLQJEXVLQHVVGHFLVLRQV8QGHUZULWLQJJDLQH[FOXGLQJWKHLPSDFWRIFDWDVWURSKHVDQGQHWIDYRUDEOHXQIDYRUDEOHSULRU\HDU OR VVUHVHUYHGHYHORSPHQWLVWKHXQGHUZULWLQJJDLQDGMXVWHGWRH[FOXGHFODLPVDQGFODLP DGMXVWPHQWH[SHQVHVUHLQVWDWHPHQWSUHPLXPVDQGDVVHVVPHQWVUHODWHGWRFDWDVWURSKHVDQGORVVUHVHUYHGHYHORSPHQWUHODWHGWRW LPH SHULRGVSULRUWRWKHFXUUHQW\HDU,QWKHRSLQLRQRIWKH&RPSDQ\ · VPDQDJHPHQWWKLV PHDVXUHLVPHDQLQJIXOWRXVHUVRIWKHILQDQFLDOVWDWHPHQWVWRXQGHUVWDQGWKH&RPSDQ\ · VSHULRGLFHDUQLQJVDQGWKHYDULDELOLW\RIHDUQLQJVFDXVHGE\WKHXQSUHGLFWDEOHQDWXUHLHWKHWLPLQJDQGDPRXQWRIFDWDV WUR SKHVDQG ORVVUHVHUYHGHYHORSPHQW7KLVPHDVXUHLVDOVRUHIHUUHGWRDVXQGHUO\LQJXQGHUZULWLQJJDLQXQGHUO\LQJXQGHUZULWLQJPDUJLQX QGH UO\LQJXQGHUZULWLQJLQFRPHRUXQGHUO\LQJXQGHUZULWLQJUHVXOW $FDWDVWURSKHLVDVHYHUHORVVGHVLJQDWHGRUUHDVRQDEO\H[SHFWHGE\WKH&RPSDQ\WREHGHVLJQDWHGDFDWDVWURSKHE\RQHRUPR UH LQGXVWU\UHFRJQL]HGRUJDQL]DWLRQVWKDWWUDFNDQGUHSRUWRQLQVXUHGORVVHVUHVXOWLQJIURP FDWDVWURSKLFHYHQWVVXFKDV3URSHUW\&ODLP6HUYLFHV3&6IRUHYHQWVLQWKH8QLWHG6WDWHVDQG&DQDGD&DWDVWURSKHVFDQEHFD XVH GE\YDULRXVQDWXUDOHYHQWVLQFOXGLQJDPRQJRWKHUVKXUULFDQHVWRUQDGRHVDQGRWKHU ZLQGVWRUPVHDUWKTXDNHVKDLOZLOGILUHVVHYHUHZLQWHUZHDWKHUIORRGVWVXQDPLVYROFDQLFHUXSWLRQVDQGRWKHUQDWXUDOO\ RFFXUU LQJHYHQWVVXFKDVVRODUIODUHV&DWDVWURSKHVFDQDOVREHPDQ PDGHVXFKDVWHUURULVWDWWDFNV DQGRWKHULQWHQWLRQDOO\GHVWUXFWLYHDFWVLQFOXGLQJWKRVHLQYROYLQJQXFOHDUELRORJLFDOFKHPLFDODQGUDGLRORJLFDOHYHQWVF\E HU HYHQWVH[SORVLRQVDQGGHVWUXFWLRQRILQIUDVWUXFWXUH(DFKFDWDVWURSKHKDVXQLTXHFKDUDFWHULVWLFV DQGFDWDVWURSKHVDUHQRWSUHGLFWDEOHDVWRWLPLQJRUDPRXQW7KHLUHIIHFWVDUHLQFOXGHGLQQHWDQGFRUHLQFRPHORVVDQGFOD LPV DQGFODLPDGMXVWPHQWH[SHQVHUHVHUYHVXSRQRFFXUUHQFH$FDWDVWURSKHPD\UHVXOWLQWKH SD\PHQWRIUHLQVXUDQFHUHLQVWDWHPHQWSUHPLXPVDQGDVVHVVPHQWVIURPYDULRXVSRROV 7KH&RPSDQ\ · VWKUHVKROGIRUGLVFORVLQJFDWDVWURSKHVLVSULPDULO\GHWHUPLQHGDWWKHUHSRUWDEOHVHJPHQWOHYHO,IDWKUHVKROGIRURQHVHJPH QW RUDFRPELQDWLRQWKHUHRILVUHDFKHGDQGWKHRWKHUVHJPHQWVKDYHORVVHVIURPWKH VDPHHYHQWORVVHVIURPWKHHYHQWDUHLGHQWLILHGDVFDWDVWURSKHORVVHVLQWKHVHJPHQWUHVXOWVDQGIRUWKHFRQVROLGDWHGUHVXOW VR IWKH&RPSDQ\$GGLWLRQDOO\DQDJJUHJDWHWKUHVKROGLVDSSOLHGIRULQWHUQDWLRQDOEXVLQHVVDFURVV DOOUHSRUWDEOHVHJPHQWV7KHWKUHVKROGIRU UDQJHGIURP PLOOLRQWR PLOOLRQRIORVVHVEHIRUHUHLQVXUDQFHDQGWD[HV 1HWIDYRUDEOHXQIDYRUDEOHSULRU\HDUORVVUHVHUYHGHYHORSPHQWLVWKHLQFUHDVHRUGHFUHDVHLQLQFXUUHGFODLPVDQGFODLPDGMX VWP HQWH[SHQVHVDVDUHVXOWRIWKHUH HVWLPDWLRQRIFODLPVDQGFODLPDGMXVWPHQWH[SHQVHUHVHUYHV DWVXFFHVVLYHYDOXDWLRQGDWHVIRUDJLYHQJURXSRIFODLPVZKLFKPD\EHUHODWHGWRRQHRUPRUHSULRU\HDUV,QWKHRSLQLRQRI WK H&RPSDQ\ · VPDQDJHPHQWDGLVFXVVLRQRIORVVUHVHUYHGHYHORSPHQWLVPHDQLQJIXOWRXVHUVRI WKHILQDQFLDOVWDWHPHQWVDVLWDOORZVWKHPWRDVVHVVWKHLPSDFWEHWZHHQSULRUDQGFXUUHQW\HDUGHYHORSPHQWRQLQFXUUHGFODLPV DQ GFODLPDGMXVWPHQWH[SHQVHVQHWDQGFRUHLQFRPHORVVDQGFKDQJHVLQFODLPVDQGFODLP DGMXVWPHQWH[SHQVHUHVHUYHOHYHOVIURPSHULRGWRSHULRG Glossary of Financial Measures and Reconciliations of GAAP Measures to Non - GAAP Measures

1 Impact is recognized in the accounting period in which the change is enacted 2 2017 reflects impact of Tax Cuts and Jobs Act of 2017 (TCJA) *ORVVDU\RI)LQDQFLDO0HDVXUHVDQG5HFRQFLOLDWLRQVRI*$$3 0HDVXUHVWR1RQ *$$30HDVXUHV ($ in millions, after-tax) 2024 2023 2022 2021 2020 2019 2018 2017 2016 2015 2014 Net income 4,999$ 2,991$ 2,842$ 3,662$ 2,697$ 2,622$ 2,523$ 2,056$ 3,014$ 3,439$ 3,692$ Net realized investment (gains) losses 26 81 156 (132) (11) (85) (93) (142) (47) (2) (51) Impact of changes in tax laws and/or tax rates (1) (2) - - - (8) - - - 129 - - - Core income 5,025 3,072 2,998 3,522 2,686 2,537 2,430 2,043 2,967 3,437 3,641 Net investment income (2,952) (2,436) (2,170) (2,541) (1,908) (2,097) (2,102) (1,872) (1,846) (1,905) (2,216) Other (income) expense, including interest expense 308 337 277 235 232 214 248 179 78 193 159 Underwriting income 2,381 973 1,105 1,216 1,010 654 576 350 1,199 1,725 1,584 Impact of net (favorable) unfavorable prior year reserve development (559) (113) (512) (424) (276) 47 (409) (378) (510) (617) (616) Impact of catastrophes 2,632 2,361 1,480 1,459 1,274 699 1,355 1,267 576 338 462 Underlying underwriting income 4,454$ 3,221$ 2,073$ 2,251$ 2,008$ 1,400$ 1,522$ 1,239$ 1,265$ 1,446$ 1,430$ Twelve Months Ended December 31,
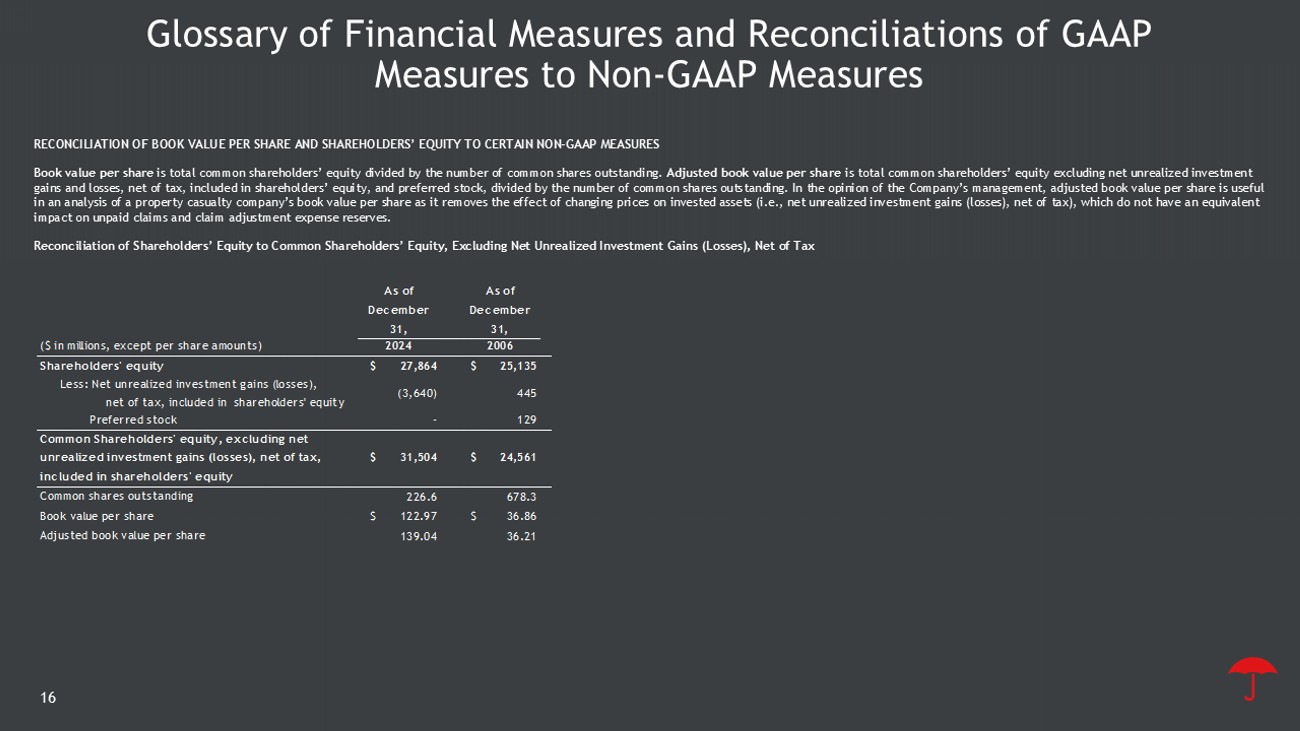
RECONCILIATION OF BOOK VALUE PER SHARE AND SHAREHOLDERS’ EQUITY TO CERTAIN NON - GAAP MEASURES Book value per share is total common shareholders’ equity divided by the number of common shares outstanding. Adjusted book value per share is total common shareholders’ equity excluding net unrealized investment gains and losses, net of tax, included in shareholders’ equity, and preferred stock, divided by the number of common shares o uts tanding. In the opinion of the Company’s management, adjusted book value per share is useful in an analysis of a property casualty company’s book value per share as it removes the effect of changing prices on invested ass ets (i.e., net unrealized investment gains (losses), net of tax), which do not have an equivalent impact on unpaid claims and claim adjustment expense reserves. Reconciliation of Shareholders’ Equity to Common Shareholders’ Equity, Excluding Net Unrealized Investment Gains (Losses), Ne t o f Tax *ORVVDU\RI)LQDQFLDO0HDVXUHVDQG5HFRQFLOLDWLRQVRI*$$3 0HDVXUHVWR1RQ *$$30HDVXUHV As of December 31, As of December 31, ($ in millions, except per share amounts) 2024 2006 Shareholders' equity $ 27,864 $ 25,135 Less: Net unrealized investment gains (losses), net of tax, included in shareholders' equity (3,640) 445 Preferred stock - 129 Common Shareholders' equity, excluding net unrealized investment gains (losses), net of tax, included in shareholders' equity $ 31,504 $ 24,561 Common shares outstanding 226.6 678.3 Book value per share $ 122.97 $ 36.86 Adjusted book value per share 139.04 36.21

17 *ORVVDU\RI)LQDQFLDO0HDVXUHVDQG5HFRQFLOLDWLRQVRI*$$3 0HDVXUHVWR1RQ *$$30HDVXUHV 2024 2023 Diluted income per share Net income 21.47$ 12.79$ Adjustments: Net realized investment losses, after-tax 0.11 0.34 Core income 21.58$ 13.13$ Twelve Months Ended December 31, RECONCILIATION OF NET INCOME PER SHARE TO CORE INCOME PER SHARE ON DILUTED BASIS 5(&21&,/,$7,212),19(67('$66(7672,19(67('$66(76(;&/8',1*1(7815($/,=(',19(670(17*$,16/266(6 ($ in millions) 2024 2023 2022 2021 2020 2019 2018 2017 2016 2015 2014 Invested assets 94,223$ 88,810$ 80,454$ 87,375$ 84,423$ 77,884$ 72,278$ 72,502$ 70,488$ 70,470$ 73,261$ Less: Net unrealized investment gains (losses), pre-tax (4,609) (3,970) (6,220) 3,060 5,175 2,853 (137) 1,414 1,112 1,974 3,008 Invested assets excluding net unrealized investment gains (losses) 98,832$ 92,780$ 86,674$ 84,315$ 79,248$ 75,031$ 72,415$ 71,088$ 69,376$ 68,496$ 70,253$ As of December 31,

investor. travelers.com