UNITED STATES
SECURITIES AND EXCHANGE COMMISSION
Washington, D.C. 20549
FORM N-CSR
CERTIFIED SHAREHOLDER REPORT OF REGISTERED
MANAGEMENT INVESTMENT COMPANIES
Investment Company Act file number 811-06106
Pioneer Mid Cap Value Fund
(Exact name of registrant as specified in charter)
60 State Street, Boston, MA 02109
(Address of principal executive offices) (ZIP code)
Terrence J. Cullen, Amundi Asset Management, Inc.,
60 State Street, Boston, MA 02109
(Name and address of agent for service)
Registrant’s telephone number, including area code: (617) 742-7825
Date of fiscal year end: October 31, 2022
Date of reporting period: November 1, 2021 through April 30, 2022
Form N-CSR is to be used by management investment companies to file reports with the Commission not later than 10 days after the transmission to stockholders of any report that is required to be transmitted to stockholders under Rule 30e-1 under the Investment Company Act of 1940 (17 CFR 270.30e-1). The Commission may use the information provided on Form N-CSR in its regulatory, disclosure review, inspection, and policymaking roles.
A registrant is required to disclose the information specified by Form N-CSR, and the Commission will make this information public. A registrant is not required to respond to the collection of information contained in Form N-CSR unless the Form displays a currently valid Office of Management and Budget (“OMB”) control number. Please direct comments concerning the accuracy of the information collection burden estimate and any suggestions for reducing the burden to Secretary, Securities and Exchange Commission, 450 Fifth Street, NW, Washington, DC 20549-0609. The OMB has reviewed this collection of information under the clearance requirements of 44 U.S.C. ss. 3507.
Pioneer Mid Cap Value Fund
Semiannual Report | April 30, 2022
| A: PCGRX | C: PCCGX | K: PMCKX | R: PCMRX | Y: PYCGX |

visit us: www.amundi.com/us
Pioneer Mid Cap Value Fund | Semiannual Report | 4/30/22 1
President’s Letter
Dear Shareholders,
For two years now, investors have faced unprecedented challenges, as the COVID-19 pandemic has not only dominated the headlines since March 2020, but has also led to significant changes in government and central-bank policies, both in the US and abroad, and affected the everyday lives of each of us. With 2022 now well underway, the situation, while improved, has continued to evolve.
Widespread distribution of the COVID-19 vaccines approved for emergency use in late 2020 led to a general decline in virus-related hospitalizations in the US and had a positive effect on overall market sentiment during most of the 2021 calendar year. The passage of two additional fiscal stimulus packages by US lawmakers in December 2020 and January 2021 also helped drive a strong market rally. Then, the late-2021 emergence of the highly infectious Omicron variant of the virus led to surges in cases and hospitalizations, especially outside of the US, but also in certain areas of this country. That development contributed to a slowdown in the global economic recovery, as some foreign governments reinstated strict virus-containment measures that had been relaxed after the rollout of the vaccines. Many of those renewed restrictions were lifted as case numbers again began to decline during the late-winter months, but it appears the possibility of further virus-containment measures could be with us for a while longer, given that occasional surges in new cases have continued to arise, particularly in non-US locations.
In the US, while performance of most asset classes, especially equities, was positive for the full 2021 calendar year, 2022, so far, has featured a less-friendly market environment. Volatility in the fixed-income markets has remained high and we have seen negative returns for most asset classes. Meanwhile, equity markets, both domestic and global, have experienced significant underperformance over the first several months of the year. Concerns over global supply chain issues, rising inflation, the enactment of less-accommodative monetary policies from the Federal Reserve System (Fed), and partisan debates in Washington, DC over future spending and tax policies, are among the many factors that have led to greater uncertainty and an increase in market volatility. In addition, Russia's recent incursion into Ukraine has resulted in even greater market volatility, as economic sanctions placed on Russia by many Western countries have exacerbated the existing supply-chain issues and helped drive energy prices, including gas prices, to very high levels.
In our view, the long-term impact on the global economy from COVID-19, while currently unknown, is likely to be considerable, as it is clear that several industries have already felt greater effects than others, and could continue to struggle for quite some time. Of course, geopolitical concerns, whether they are related to the conflict in Ukraine or other crises in different areas of the globe, can always have an effect on the markets, and so our investment teams will remain vigilant and continue to monitor the geopolitical landscape.
2 Pioneer Mid Cap Value Fund | Semiannual Report | 4/30/22
At the outset of the pandemic, we temporarily closed our offices and instituted a work-from-home policy, but have since re-opened our US locations. However, we have been maintaining all the necessary precautions, which at times may have us working more remotely than in person in order to ensure a safe working environment as new variants of the COVID-19 virus continue to arise and spread. I am proud of the careful planning that has taken place. Throughout the pandemic, our business has continued to operate without any disruption, and we all look forward to regaining a bit of normalcy after so many months of remote working.
Since 1928, Amundi US’s investment process has been built on a foundation of fundamental research and active management, principles which have guided our investment decisions for more than 90 years. We believe active management – that is, making active investment decisions – can help mitigate the risks during periods of market volatility.
At Amundi US, active management begins with our own fundamental, bottom-up research process. Our team of dedicated research analysts and portfolio managers analyzes each security under consideration, communicating frequently with the management teams of the companies and other entities issuing the securities, and working together to identify those securities that best meet our investment criteria for our family of funds. Our risk management approach begins with each and every security, as we strive to carefully understand the potential opportunity, while considering any and all risk factors.
Today, as investors, we have many options. It is our view that active management can serve shareholders well, not only when markets are thriving, but also during periods of market stress.
As you consider your long-term investment goals, we encourage you to work with your financial professional to develop an investment plan that paves the way for you to pursue both your short-term and long-term goals.
We greatly appreciate the trust you have placed in us and look forward to continuing to serve you in the future.
Sincerely,

Lisa M. Jones
Head of the Americas, President and CEO of US
Amundi Asset Management US, Inc.
June 2022
Any information in this shareowner report regarding market or economic trends or the factors influencing the Fund’s historical or future performance are statements of opinion as of the date of this report. Past performance is no guarantee of future results.
Pioneer Mid Cap Value Fund | Semiannual Report | 4/30/22 3
Portfolio Management Discussion | 4/30/22
Domestic mid-cap stocks fell slightly during the six-month period ended April 30, 2022. In the following interview, Timothy Stanish and Raymond Haddad discuss the market environment and the factors that affected the performance of Pioneer Mid Cap Value Fund during the period. Mr. Stanish, a vice president, a portfolio EVA (economic value added) analyst, and a portfolio manager at Amundi Asset Management US, Inc. (Amundi US), and Mr. Haddad, a vice president and a portfolio manager at Amundi US, are responsible for the day-to-day management of the Fund.
| Q | How did the Fund perform during the six-month period ended April 30, 2022? |
| A | Pioneer Mid Cap Value Fund’s Class A shares returned -1.17% at net asset value during the six-month period ended April 30, 2022, while the Fund’s benchmark, the Russell Midcap Value Index (the Russell Index), returned -4.84%. During the same period, the average return of the 409 mutual funds in Morningstar’s Mid-Cap Value Funds category was -2.68%. |
| Q | How would you describe the investment environment for equity investors during the six-month period ended April 30, 2022? |
| A | The six-month period saw heightened market volatility amid a marked shift in economic conditions and investor sentiment. Early in the period, markets rose as the US economy grew at its fastest pace in 37 years, responding to continued monetary and fiscal stimulus from the US Federal Reserve (Fed) and US government. However, the rapid pace of economic growth and the difficulties created by the ongoing COVID-19 pandemic strained global supply chains, pushing inflation to its highest level since the early 1980s. At the same time, corporate earnings benefited from strong demand and consumers’ ability and willingness to pay higher prices. |
US stocks had a challenging start to 2022, however, as investors reflected on the Fed’s increasingly hawkish signaling with regard to monetary policy, which included the ending of its pandemic-era quantitative easing program as well as its intention to begin increasing the target range of the federal funds rate in response to rising inflation. Inflationary pressures persisted, and the Russian invasion of Ukraine in February added to steep rises in commodity prices and further supply-chain disruptions. In addition, new COVID-19 lockdowns in China in the wake of increased infection rates helped stoke fears of a global recession.
4 Pioneer Mid Cap Value Fund | Semiannual Report | 4/30/22
Within the US stock market, mid-cap stocks performed generally in line with large-cap stocks for the six-month period, outperforming small caps as market participants became increasingly uncomfortable with taking on the higher risk of investing in smaller companies. Value stocks outperformed growth stocks during the period, as rising interest rates weighed on the performance of companies in the growth segment, particularly those whose valuations are based largely on anticipated earnings far into the future.
Within the Fund’s benchmark, the Russell Index, the energy sector stood out as the strongest performer during the six-month period, and materials stocks also gained ground as commodity prices rose. Certain defensive sectors, including utilities and consumer staples, also performed well. Conversely, the communication services sector was the weakest performer in the benchmark, and consumer discretionary, industrials, financials, and information technology stocks also weighed on the Russell Index’s performance.
| Q | How did you position the Fund’s portfolio during the six-month period ended April 30, 2022, and how did the positioning affect performance relative to the benchmark? |
| A | We maintained the Fund’s overweight positions versus the benchmark in cyclical stocks within the materials, energy, and financial sectors. This stance was based on our view that the continued economic reopening as the pandemic slowly transitions into an endemic stage could spur stronger corporate profits and result in better share-price performance for the intrinsically undervalued stocks in those sectors. By contrast, we maintained significant benchmark-relative underweight exposures in the Fund to the consumer staples, information technology, communication services, and industrials sectors. Those positions reflected our view that rising interest rates could slow business growth, due in part to rising cost of capital, while inflation weighs on demand. (Cost of capital represents a calculation of the minimum return a company would need to justify a capital-budgeting project, such as building a new factory.) |
From a sector perspective, the Fund’s stock selection results in the health care and consumer discretionary sectors were the most significant positive contributors to relative performance for the six-month period, while the Fund’s overweight allocation to the energy sector also aided benchmark-relative returns.
Pioneer Mid Cap Value Fund | Semiannual Report | 4/30/22 5
By contrast, stock selection within, and an underweight allocation to, the consumer staples sector detracted the most from the Fund’s benchmark-relative performance for the six-month period. Stock selection results within the information technology and real estate sectors also notably detracted from relative returns.
| Q | Which investments contributed positively to the Fund’s benchmark-relative performance during the six-month period ended April 30, 2022? |
| A | Key positive contributors to the Fund’s relative performance among individual stocks during the period included positions in drug distribution and medical supplier McKesson, oilfield services provider Schlumberger, and downstream energy company Marathon Petroleum. McKesson continued to execute well in its pharmaceutical distribution business, while taking prudent actions to improve its asset portfolio. Recovering patient-engagement levels also helped support the business amid investor concerns about opioid-related lawsuits. |
Schlumberger benefited from the rising energy prices throughout the six-month period. In the latter part of the period, the Russian invasion of Ukraine led to a further spike in crude oil and natural gas pricing, which provided an additional boost to Schlumberger’s shares. In addition to being a dominant company in its segment, Schlumberger also has a reputation as a technology leader, which, in our view, gives the company premium pricing power and a sustainable competitive advantage. We anticipate oil-and-gas spending to remain elevated for the intermediate term as exploration-and-production companies invest to boost production in order to meet higher levels of demand.
Lastly, shares of Marathon Petroleum rallied during the period as the company continued to benefit from soaring prices of crude oil and refined energy products, and the energy sector’s broad recovery helped bolster the company’s refinery and retail gasoline operations.
6 Pioneer Mid Cap Value Fund | Semiannual Report | 4/30/22
| Q | Which individual holdings detracted from the Fund’s benchmark-relative performance during the six-month period ended April 30, 2022? |
| A | Notable detractors from the Fund’s benchmark-relative results for the period included portfolio positions in regional financial institution First Republic Bank, homebuilder Lennar, and flow-control equipment specialist Ingersoll Rand. Lack of portfolio exposure to some of the stronger-performing stocks in the energy sector also detracted from the Fund’s relative returns. |
First Republic is a regional bank based in San Francisco. Despite solid performance in its underlying business, First Republic’s stock price fell sharply in January 2022 after one of its co-CEOs unexpectedly resigned, while the other took a six-month leave of absence for health reasons. Despite the appointment of its CFO as a permanent replacement, First Republic continued to struggle as volatile fluctuations in interest rates created uncertainty among investors about the potential long-term impact of interest rates on the bank, and the industry more broadly.
Lennar is one of the largest US homebuilders. The stock underperformed over the six-month period as market participants grew concerned about the potential effects of rising interest rates on both housing prices and affordability. However, we believe the current share price reflects a good deal of the market’s skepticism about Lennar’s future prospects, and so we have retained the Fund’s position.
Lastly, Ingersoll Rand is one of the world's largest makers of flow-control equipment. The war in Ukraine has raised concerns about the company’s European exposures, which weighed on investor sentiment despite Ingersoll’s reporting solid first-quarter financial results and 2022 guidance. We continue to see value in Ingersoll Rand, as the company operates in secular growth areas and, in our view, has a skillful management team.
Pioneer Mid Cap Value Fund | Semiannual Report | 4/30/22 7
| Q | Did the Fund have any exposure to derivative securities during the six-month period ended April 30, 2022? |
| A | No, the Fund had no exposure to derivatives during the six-month period. |
| Q | What is your investment outlook and how have you positioned the Fund entering the second half of its fiscal year? |
| A | As we look ahead to the coming year, we continue to see cross-currents affecting the outlook for US equities. On one hand, we believe the economy could continue to heal from the worst of the pandemic. On the other hand, the war in Ukraine has raised new global geopolitical risks, and the higher commodity prices that have resulted from the Russian invasion could complicate the Fed’s job of fighting inflation. We believe there is considerable risk that the Fed may not be successful in eliminating inflationary pressures without choking off economic growth. |
Slower growth combined with persistent inflation could set the stage for “stagflation” conditions last seen in the 1970s, which remains the most worrying scenario, in our view.
We have therefore maintained the Fund’s benchmark-relative overweight positions in the financial, materials, and energy sectors. Although we have grown more cautious due to the current economic and geopolitical environment, we still see value in the Fund’s holdings in those areas of the market. In particular, the portfolio’s energy holdings primarily represent stock-specific investment cases where we believe the price of oil is not the sole determining factor for future performance. We have found the recent capital discipline on display among energy companies to be admirable, and believe that could lead to long-term value creation in the sector.
By contrast, we have continued to reduce the Fund’s exposure to the more cyclical and lower-quality (in our opinion) areas of the market, such as cruise line operators and airlines. We see ongoing structural headwinds for companies in those industries, and believe such stocks have the potential to become classic “value traps” - stocks that are inexpensive for a good reason. Airline stocks, to a certain extent, have already discounted a recovery from the pandemic-induced lows, but we think higher fuel costs combined with a sluggish return to pre-pandemic levels of business travel could weigh on the entire industry for some time. Thus, we are inclined to remain on the sidelines with respect to airlines until we have better visibility about the industry’s operating environment.
8 Pioneer Mid Cap Value Fund | Semiannual Report | 4/30/22
Lastly, we have continued to increase the Fund’s weighting in utilities. The portfolio’s slight benchmark-relative overweight allocation is based on our view that valuations in the sector have remained attractive compared to historical levels.
Overall, we remain committed to investing the portfolio in shares of companies that we view as highly profitable, with strong balance sheets and sustainable business models. We seek to hold shares of companies that we feel are capable of surviving recessions and emerging with the financial firepower to invest and thrive during the subsequent recovery. We continue to believe that the Fund’s current positioning could be well-suited for the economic and market conditions that we feel are likely to prevail during the remainder of the year, and beyond.
Please refer to the Schedule of Investments on pages 20–24 for a full listing of Fund securities.
All investments are subject to risk, including the possible loss of principal. In the past several years, financial markets have experienced increased volatility and heightened uncertainty. The market prices of securities may go up or down, sometimes rapidly or unpredictably, due to general market conditions, such as real or perceived adverse economic, political, or regulatory conditions, recessions, inflation, changes in interest or currency rates, lack of liquidity in the bond markets, the spread of infectious illness or other public health issues, armed conflict including Russia's military invasion of Ukraine, sanctions against Russia, other nations or individuals or companies and possible countermeasures, or adverse investor sentiment. These conditions may continue, recur, worsen or spread.
Investments in mid-sized companies may offer the potential for higher returns, but are also subject to greater short-term price fluctuations than investments in larger, more established companies.
Investing in foreign and/or emerging markets securities involves risks relating to interest rates, currency exchange rates, economic, and political conditions.
The Fund invests in REIT securities, the value of which can fall for a variety of reasons, such as declines in rental income, fluctuating interest rates, poor property management, environmental liabilities, uninsured damage, increased competition, or changes in real estate tax laws.
When interest rates rise, the prices of fixed income securities in the fund will generally fall. Conversely, when interest rates fall, the prices of fixed income securities in the Fund will generally rise.
Pioneer Mid Cap Value Fund | Semiannual Report | 4/30/22 9
At times, the Fund’s investments may represent industries or industry sectors that are interrelated or have common risks, making the Fund more susceptible to any economic, political, or regulatory developments or other risks affecting those industries and sectors.
These risks may increase share price volatility.
Before investing, consider the product’s investment objectives, risks, charges and expenses. Contact your advisor or Amundi Asset Management US, Inc., for a prospectus or summary prospectus containing this information. Read it carefully.
Any information in this shareholder report regarding market or economic trends or the factors influencing the Fund’s historical or future performance are statements of opinion as of the date of this report. Past performance is no guarantee of future results.
10 Pioneer Mid Cap Value Fund | Semiannual Report | 4/30/22
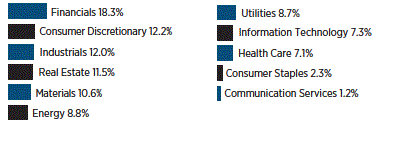
| Portfolio Summary | 4/30/22 |
| Sector Distribution |
| (As a percentage of total investments)* |
| 10 Largest Holdings | ||
| (As a percentage of total investments)* | ||
| 1. | McKesson Corp. | 3.74% |
| 2. | Marathon Petroleum Corp. | 3.32 |
| 3. | Public Service Enterprise Group, Inc. | 2.92 |
| 4. | CenterPoint Energy, Inc. | 2.74 |
| 5. | M&T Bank Corp. | 2.63 |
| 6. | Exelon Corp. | 2.48 |
| 7. | Pioneer Natural Resources Co. | 2.36 |
| 8. | Hartford Financial Services Group, Inc. | 2.33 |
| 9. | Ross Stores, Inc. | 2.25 |
| 10. | Reliance Steel & Aluminum Co. | 2.13 |
| * | Excludes short-term investments and all derivative contracts except for options purchased. The Fund is actively managed, and current holdings may be different. The holdings listed should not be considered recommendations to buy or sell any securities. |
Pioneer Mid Cap Value Fund | Semiannual Report | 4/30/22 11
Prices and Distributions | 4/30/22
Net Asset Value per Share
| Class | 4/30/22 | 10/31/21 |
| A | $24.87 | $28.99 |
| C | $14.95 | $18.93 |
| K | $24.88 | $29.06 |
| R | $24.16 | $28.20 |
| Y | $27.40 | $31.58 |
Distributions per Share: 11/1/21–4/30/22
| Net Investment | Short-Term | Long-Term | |
| Class | Income | Capital Gains | Capital Gains |
| A | $0.1598 | $ — | $3.5900 |
| C | $0.0562 | $ — | $3.5900 |
| K | $0.2491 | $ — | $3.5900 |
| R | $0.0314 | $ — | $3.5900 |
| Y | $0.2263 | $ — | $3.5900 |
Index Definitions
The Russell Midcap Value Index is an unmanaged index that measures the performance of U.S. mid-cap value stocks. Index returns are calculated monthly, assume reinvestment of dividends and, unlike Fund returns, do not reflect any fees, expenses or sales charges. It is not possible to invest directly in an index.
The index defined here pertains to the “Value of $10,000 Investment” and “Value of $5 Million Investment” charts on pages 13–17.
12 Pioneer Mid Cap Value Fund | Semiannual Report | 4/30/22
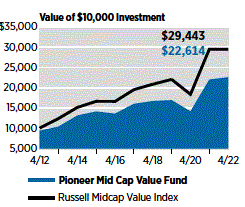
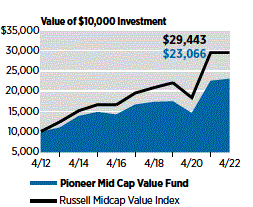
| Performance Update | 4/30/22 | Class A Shares |
Investment Returns
The mountain chart on the right shows the change in value of a $10,000 investment made in Class A shares of Pioneer Mid Cap Value Fund at public offering price during the periods shown, compared to that of the Russell Midcap Value Index.
| Average Annual Total Returns | |||
| (As of April 30, 2022) | |||
| Net | Public | Russell | |
| Asset | Offering | Midcap | |
| Value | Price | Value | |
| Period | (NAV) | (POP) | Index |
| 10 years | 9.15% | 8.50% | 11.40% |
| 5 years | 7.10 | 5.84 | 8.61 |
| 1 year | 2.65 | -3.24 | 0.00 |
| Expense Ratio |
| (Per prospectus dated March 1, 2022) |
| Gross |
| 1.05% |
Call 1-800-225-6292 or visit www.amundi.com/us for the most recent month-end performance results. Current performance may be lower or higher than the performance data quoted.
The performance data quoted represents past performance, which is no guarantee of future results. Investment return and principal value will fluctuate, and shares, when redeemed, may be worth more or less than their original cost.
NAV results represent the percent change in net asset value per share. POP returns reflect deduction of maximum 5.75% sales charge. NAV returns would have been lower had sales charges been reflected. All results are historical and assume the reinvestment of dividends and capital gains. Other share classes are available for which performance and expenses will differ.
Performance results reflect any applicable expense waivers in effect during the periods shown. Without such waivers Fund performance would be lower. Waivers may not be in effect for all funds. Certain fee waivers are contractual through a specified period. Otherwise, fee waivers can be rescinded at any time. See the prospectus and financial statements for more information.
The performance table and graph do not reflect the deduction of fees and taxes that a shareowner would pay on Fund distributions or the redemption of Fund shares.
Please refer to the financial highlights for a more current expense ratio.
Pioneer Mid Cap Value Fund | Semiannual Report | 4/30/22 13
| Performance Update | 4/30/22 | Class C Shares |
Investment Returns
The mountain chart on the right shows the change in value of a $10,000 investment made in Class C shares of Pioneer Mid Cap Value Fund during the periods shown, compared to that of the Russell Midcap Value Index.
| Average Annual Total Returns | |||
| (As of April 30, 2022) | |||
| Russell | |||
| Midcap | |||
| If | If | Value | |
| Period | Held | Redeemed | Index |
| 10 years | 8.22% | 8.22% | 11.40% |
| 5 years | 6.19 | 6.19 | 8.61 |
| 1 year | 1.74 | 0.92 | 0.00 |
| Expense Ratio |
| (Per prospectus dated March 1, 2022) |
| Gross |
| 1.94% |
Call 1-800-225-6292 or visit www.amundi.com/us for the most recent month-end performance results. Current performance may be lower or higher than the performance data quoted.
The performance data quoted represents past performance, which is no guarantee of future results. Investment return and principal value will fluctuate, and shares, when redeemed, may be worth more or less than their original cost.
Class C shares held for less than one year are subject to a 1% contingent deferred sales charge (CDSC). “If Held” results represent the percent change in net asset value per share. “If Redeemed” returns reflect deduction of the CDSC for the one-year period, assuming a complete redemption of shares at the last price calculated on the last business day of the period, and no CDSC for the five- and 10-year periods. All results are historical and assume the reinvestment of dividends and capital gains. Other share classes are available for which performance and expenses will differ.
Performance results reflect any applicable expense waivers in effect during the periods shown. Without such waivers Fund performance would be lower. Waivers may not be in effect for all funds. Certain fee waivers are contractual through a specified period. Otherwise, fee waivers can be rescinded at any time. See the prospectus and financial statements for more information.
The performance table and graph do not reflect the deduction of fees and taxes that a shareowner would pay on Fund distributions or the redemption of Fund shares.
Please refer to the financial highlights for a more current expense ratio.
14 Pioneer Mid Cap Value Fund | Semiannual Report | 4/30/22
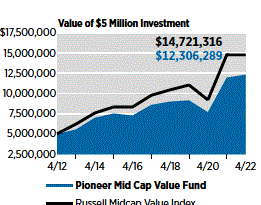
| Performance Update | 4/30/22 | Class K Shares |
Investment Returns
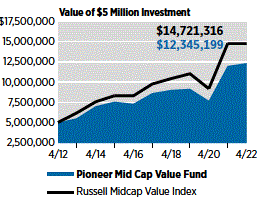
The mountain chart on the right shows the change in value of a $5 million investment made in Class K shares of Pioneer Mid Cap Value Fund during the periods shown, compared to that of the Russell Midcap Value Index.
| Average Annual Total Returns | ||
| (As of April 30, 2022) | ||
| Net | Russell | |
| Asset | Midcap | |
| Value | Value | |
| Period | (NAV) | Index |
| 10 years | 9.42% | 11.40% |
| 5 years | 7.47 | 8.61 |
| 1 year | 3.01 | 0.00 |
| Expense Ratio |
| (Per prospectus dated March 1, 2022) |
| Gross |
| 0.71% |
Call 1-800-225-6292 or visit www.amundi.com/us for the most recent month-end performance results. Current performance may be lower or higher than the performance data quoted.
The performance data quoted represents past performance, which is no guarantee of future results. Investment return and principal value will fluctuate, and shares, when redeemed, may be worth more or less than their original cost.
The performance shown for Class K shares for the period prior to the commencement of operations of Class K shares on March 2, 2015, is the net asset value performance of the Fund’s Class A shares, which has not been restated to reflect any differences in expenses, including Rule 12b-1 fees applicable to Class A shares. Since fees for Class A shares generally are higher than those of Class K shares, the performance of Class K shares prior to their inception on March 2, 2015, would have been higher than the performance shown. For the period beginning March 2, 2015, the actual performance of Class K shares is reflected. Class K shares are not subject to sales charges and are available for limited groups of eligible investors, including institutional investors. All results are historical and assume the reinvestment of dividends and capital gains.
Performance results reflect any applicable expense waivers in effect during the periods shown. Without such waivers Fund performance would be lower. Waivers may not be in effect for all funds. Certain fee waivers are contractual through a specified period. Otherwise, fee waivers can be rescinded at any time. See the prospectus and financial statements for more information.
The performance table and graph do not reflect the deduction of fees and taxes that a shareowner would pay on Fund distributions or the redemption of Fund shares.
Please refer to the financial highlights for a more current expense ratio.
Pioneer Mid Cap Value Fund | Semiannual Report | 4/30/22 15
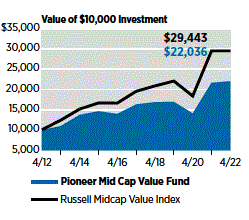
| Performance Update | 4/30/22 | Class R Shares |
Investment Returns
The mountain chart on the right shows the change in value of a $10,000 investment made in Class R shares of Pioneer Mid Cap Value Fund during the periods shown, compared to that of the Russell Midcap Value Index.
| Average Annual Total Returns | ||
| (As of April 30, 2022) | ||
| Net | Russell | |
| Asset | Midcap | |
| Value | Value | |
| Period | (NAV) | Index |
| 10 years | 8.72% | 11.40% |
| 5 years | 6.66 | 8.61 |
| 1 year | 2.21 | 0.00 |
| Expense Ratio |
| (Per prospectus dated March 1, 2022) |
| Gross |
| 1.51% |
Call 1-800-225-6292 or visit www.amundi.com/us for the most recent month-end performance results. Current performance may be lower or higher than the performance data quoted.
The performance data quoted represents past performance, which is no guarantee of future results. Investment return and principal value will fluctuate, and shares, when redeemed, may be worth more or less than their original cost.
Class R shares are not subject to sales charges and are available for limited groups of eligible investors, including institutional investors. All results are historical and assume the reinvestment of dividends and capital gains. Other share classes are available for which performance and expenses will differ.
Performance results reflect any applicable expense waivers in effect during the periods shown. Without such waivers Fund performance would be lower. Waivers may not be in effect for all funds. Certain fee waivers are contractual through a specified period. Otherwise, fee waivers can be rescinded at any time. See the prospectus and financial statements for more information.
The performance table and graph do not reflect the deduction of fees and taxes that a shareowner would pay on Fund distributions or the redemption of Fund shares.
Please refer to the financial highlights for a more current expense ratio.
16 Pioneer Mid Cap Value Fund | Semiannual Report | 4/30/22
| Performance Update | 4/30/22 | Class Y Shares |
Investment Returns
The mountain chart on the right shows the change in value of a $5 million investment made in Class Y shares of Pioneer Mid Cap Value Fund during the periods shown, compared to that of the Russell Midcap Value Index.
| Average Annual Total Returns | ||
| (As of April 30, 2022) | ||
| Net | Russell | |
| Asset | Midcap | |
| Value | Value | |
| Period | (NAV) | Index |
| 10 years | 9.46% | 11.40% |
| 5 years | 7.37 | 8.61 |
| 1 year | 2.89 | 0.00 |
| Expense Ratio |
| (Per prospectus dated March 1, 2022) |
| Gross |
| 0.79% |
Call 1-800-225-6292 or visit www.amundi.com/us for the most recent month-end performance results. Current performance may be lower or higher than the performance data quoted.
The performance data quoted represents past performance, which is no guarantee of future results. Investment return and principal value will fluctuate, and shares, when redeemed, may be worth more or less than their original cost.
Class Y shares are not subject to sales charges and are available for limited groups of eligible investors, including institutional investors. All results are historical and assume the reinvestment of dividends and capital gains. Other share classes are available for which performance and expenses will differ.
Performance results reflect any applicable expense waivers in effect during the periods shown. Without such waivers Fund performance would be lower. Waivers may not be in effect for all funds. Certain fee waivers are contractual through a specified period. Otherwise, fee waivers can be rescinded at any time. See the prospectus and financial statements for more information.
The performance table and graph do not reflect the deduction of fees and taxes that a shareowner would pay on Fund distributions or the redemption of Fund shares.
Please refer to the financial highlights for a more current expense ratio.
Pioneer Mid Cap Value Fund | Semiannual Report | 4/30/22 17
Comparing Ongoing Fund Expenses
As a shareowner in the Fund, you incur two types of costs:
| (1) | ongoing costs, including management fees, distribution and/or service (12b-1) fees, and other Fund expenses; and |
| (2) | transaction costs, including sales charges (loads) on purchase payments. |
This example is intended to help you understand your ongoing expenses (in dollars) of investing in the Fund and to compare these costs with the ongoing costs of investing in other mutual funds. The example is based on an investment of $1,000 at the beginning of the Fund’s latest six-month period and held throughout the six months.
Using the Tables
Actual Expenses
The first table below provides information about actual account values and actual expenses. You may use the information in this table, together with the amount you invested, to estimate the expenses that you paid over the period as follows:
| (1) | Divide your account value by $1,000 |
Example: an $8,600 account value ÷ $1,000 = 8.6
| (2) | Multiply the result in (1) above by the corresponding share class’s number in the third row under the heading entitled “Expenses Paid During Period” to estimate the expenses you paid on your account during this period. |
Expenses Paid on a $1,000 Investment in Pioneer Mid Cap Value Fund
Based on actual returns from November 1, 2021 through April 30, 2022.
| Share Class | A | C | K | R | Y |
| Beginning Account | $1,000.00 | $1,000.00 | $1,000.00 | $1,000.00 | $1,000.00 |
| Value on 11/1/21 | |||||
| Ending Account | $988.30 | $983.50 | $989.70 | $985.90 | $989.50 |
| Value on 4/30/22 | |||||
| Expenses Paid | $5.52 | $9.74 | $3.90 | $7.63 | $4.29 |
| During Period* |
| * | Expenses are equal to the Fund’s annualized expense ratio of 1.12%, 1.98%, 0.79%, 1.55%, and 0.87% for Class A, Class C, Class K, Class R, and Class Y shares, respectively, multiplied by the average account value over the period, multiplied by 181/365 (to reflect the one-half year period). |
18 Pioneer Mid Cap Value Fund | Semiannual Report | 4/30/22
Hypothetical Example for Comparison Purposes
The table below provides information about hypothetical account values and hypothetical expenses based on the Fund’s actual expense ratio and an assumed rate of return of 5% per year before expenses, which is not the Fund’s actual return. The hypothetical account values and expenses may not be used to estimate the actual ending account balance or expenses you paid for the period.
You may use this information to compare the ongoing costs of investing in the Fund and other funds. To do so, compare this 5% hypothetical example with the 5% hypothetical examples that appear in the shareholder reports of the other funds.
Please note that the expenses shown in the tables are meant to highlight your ongoing costs only and do not reflect any transaction costs, such as sales charges (loads) that are charged at the time of the transaction. Therefore, the table below is useful in comparing ongoing costs only and will not help you determine the relative total costs of owning different funds. In addition, if these transaction costs were included, your costs would have been higher.
Expenses Paid on a $1,000 Investment in Pioneer Mid Cap Value Fund
Based on a hypothetical 5% per year return before expenses, reflecting the period from November 1, 2021 through April 30, 2022.
| Share Class | A | C | K | R | Y |
| Beginning Account | $1,000.00 | $1,000.00 | $1,000.00 | $1,000.00 | $1,000.00 |
| Value on 11/1/21 | |||||
| Ending Account | $1,019.24 | $1,014.98 | $1,020.88 | $1,017.11 | $1,020.48 |
| Value on 4/30/22 | |||||
| Expenses Paid | $5.61 | $9.89 | $3.96 | $7.75 | $4.36 |
| During Period* |
| * | Expenses are equal to the Fund’s annualized expense ratio of 1.12%, 1.98%, 0.79%, 1.55%, and 0.87% for Class A, Class C, Class K, Class R, and Class Y shares, respectively, multiplied by the average account value over the period, multiplied by 181/365 (to reflect the one-half year period). |
Pioneer Mid Cap Value Fund | Semiannual Report | 4/30/22 19
Schedule of Investments | 4/30/22
(unaudited)
| Shares | Value | ||
| UNAFFILIATED ISSUERS — 100.0% | |||
| COMMON STOCKS — 96.5% of Net Assets | |||
| Auto Components — 0.8% | |||
| 170,753 | BorgWarner, Inc. | $ 6,288,833 | |
| Total Auto Components | $ 6,288,833 | ||
| Banks — 10.7% | |||
| 287,847 | Citizens Financial Group, Inc. | $ 11,341,172 | |
| 66,989 | First Republic Bank | 9,996,099 | |
| 114,478 | M&T Bank Corp. | 19,076,614 | |
| 177,281 | Popular, Inc. | 13,826,145 | |
| 574,623 | Regions Financial Corp. | 11,906,188 | |
| 254,060 | Zions Bancorp N.A. | 14,356,931 | |
| Total Banks | $ 80,503,149 | ||
| Beverages — 1.0% | |||
| 142,857 | Molson Coors Beverage Co., Class B | $ 7,734,278 | |
| Total Beverages | $ 7,734,278 | ||
| Building Products — 1.2% | |||
| 64,645 | Trane Technologies Plc | $ 9,043,189 | |
| Total Building Products | $ 9,043,189 | ||
| Capital Markets — 1.8% | |||
| 41,809 | Nasdaq, Inc. | $ 6,579,483 | |
| 107,260 | State Street Corp. | 7,183,202 | |
| Total Capital Markets | $ 13,762,685 | ||
| Chemicals — 2.8% | |||
| 174,790 | Mosaic Co. | $ 10,910,392 | |
| 78,675 | PPG Industries, Inc. | 10,069,613 | |
| Total Chemicals | $ 20,980,005 | ||
| Communications Equipment — 1.3% | |||
| 43,994 | Motorola Solutions, Inc. | $ 9,401,078 | |
| Total Communications Equipment | $ 9,401,078 | ||
| Containers & Packaging — 4.3% | |||
| 36,773 | Crown Holdings, Inc. | $ 4,046,501 | |
| 635,373 | Graphic Packaging Holding Co. | 13,851,131 | |
| 228,228 | Sealed Air Corp. | 14,654,520 | |
| Total Containers & Packaging | $ 32,552,152 | ||
| Electric Utilities — 2.9% | |||
| 65,933 | Constellation Energy Corp. | $ 3,903,893 | |
| 384,086 | Exelon Corp. | 17,967,543 | |
| Total Electric Utilities | $ 21,871,436 | ||
The accompanying notes are an integral part of these financial statements.
20 Pioneer Mid Cap Value Fund | Semiannual Report | 4/30/22
| Shares | Value | ||
| Electrical Equipment — 2.7% | |||
| 79,780 | Eaton Corp. Plc | $ 11,569,695 | |
| 96,055 | Emerson Electric Co. | 8,662,240 | |
| Total Electrical Equipment | $ 20,231,935 | ||
| Electronic Equipment, Instruments & Components — 2.6% | |||
| 50,029 | CDW Corp. | $ 8,163,732 | |
| 39,350(a) | Keysight Technologies, Inc. | 5,519,625 | |
| 168,264 | National Instruments Corp. | 6,081,061 | |
| Total Electronic Equipment, Instruments & Components | $ 19,764,418 | ||
| Energy Equipment & Services — 1.3% | |||
| 318,475 | Baker Hughes Co. | $ 9,879,094 | |
| Total Energy Equipment & Services | $ 9,879,094 | ||
| Equity Real Estate Investment Trusts (REITs) — 10.5% | |||
| 26,670 | AvalonBay Communities, Inc. | $ 6,066,891 | |
| 40,520 | Camden Property Trust | 6,357,183 | |
| 52,388 | Extra Space Storage, Inc. | 9,953,720 | |
| 107,680 | First Industrial Realty Trust, Inc. | 6,245,440 | |
| 127,522 | Gaming and Leisure Properties, Inc. | 5,659,426 | |
| 207,954 | Host Hotels & Resorts, Inc. | 4,231,864 | |
| 458,916 | Kimco Realty Corp. | 11,624,342 | |
| 16,738 | SBA Communications Corp. | 5,809,927 | |
| 25,680 | Sun Communities, Inc. | 4,508,638 | |
| 111,254 | Ventas, Inc. | 6,180,160 | |
| 132,307 | Welltower, Inc. | 12,014,799 | |
| Total Equity Real Estate Investment Trusts (REITs) | $ 78,652,390 | ||
| Food Products — 1.2% | |||
| 408,886(a) | Hostess Brands, Inc. | $ 9,277,623 | |
| Total Food Products | $ 9,277,623 | ||
| Health Care Equipment & Supplies — 1.1% | |||
| 35,912 | STERIS Plc | $ 8,046,084 | |
| Total Health Care Equipment & Supplies | $ 8,046,084 | ||
| Health Care Providers & Services — 3.6% | |||
| 87,611 | McKesson Corp. | $ 27,125,242 | |
| Total Health Care Providers & Services | $ 27,125,242 | ||
| Hotels, Restaurants & Leisure — 5.7% | |||
| 102,326 | Darden Restaurants, Inc. | $ 13,479,404 | |
| 80,172(a) | Expedia Group, Inc. | 14,010,057 | |
| 97,459(a) | Hilton Worldwide Holdings, Inc. | 15,134,408 | |
| Total Hotels, Restaurants & Leisure | $ 42,623,869 |
The accompanying notes are an integral part of these financial statements.
Pioneer Mid Cap Value Fund | Semiannual Report | 4/30/22 21
Schedule of Investments | 4/30/22
(unaudited) (continued)
| Shares | Value | ||
| Household Durables — 1.4% | |||
| 133,484 | Lennar Corp., Class A | $ 10,210,191 | |
| Total Household Durables | $ 10,210,191 | ||
| Insurance — 5.2% | |||
| 202,446 | Aflac, Inc. | $ 11,596,107 | |
| 241,480 | Hartford Financial Services Group, Inc. | 16,886,696 | |
| 464,709 | Old Republic International Corp. | 10,228,245 | |
| Total Insurance | $ 38,711,048 | ||
| Life Sciences Tools & Services — 1.3% | |||
| 133,911(a) | Syneos Health, Inc. | $ 9,787,555 | |
| Total Life Sciences Tools & Services | $ 9,787,555 | ||
| Machinery — 5.2% | |||
| 92,722 | AGCO Corp. | $ 11,812,783 | |
| 285,732 | Ingersoll Rand, Inc. | 12,560,779 | |
| 121,822 | PACCAR, Inc. | 10,117,317 | |
| 41,002 | Stanley Black & Decker, Inc. | 4,926,390 | |
| Total Machinery | $ 39,417,269 | ||
| Media — 1.2% | |||
| 210,110(a) | Liberty Media Corp.-Liberty SiriusXM | $ 8,799,407 | |
| Total Media | $ 8,799,407 | ||
| Metals & Mining — 3.1% | |||
| 47,231 | Alcoa Corp. | $ 3,202,262 | |
| 77,919 | Reliance Steel & Aluminum Co. | 15,447,442 | |
| 118,200 | Teck Resources, Ltd., Class B | 4,663,041 | |
| Total Metals & Mining | $ 23,312,745 | ||
| Multi-Utilities — 5.5% | |||
| 649,799 | CenterPoint Energy, Inc. | $ 19,890,347 | |
| 303,781 | Public Service Enterprise Group, Inc. | 21,161,385 | |
| Total Multi-Utilities | $ 41,051,732 | ||
| Oil, Gas & Consumable Fuels — 7.1% | |||
| 129,136 | Coterra Energy, Inc. | $ 3,717,826 | |
| 275,917 | Marathon Petroleum Corp. | 24,076,517 | |
| 65,867 | Oasis Petroleum, Inc. | 8,737,916 | |
| 73,669 | Pioneer Natural Resources Co. | 17,125,832 | |
| Total Oil, Gas & Consumable Fuels | $ 53,658,091 | ||
| Pharmaceuticals — 0.9% | |||
| 200,873 | Organon & Co. | $ 6,494,224 | |
| Total Pharmaceuticals | $ 6,494,224 |
The accompanying notes are an integral part of these financial statements.
22 Pioneer Mid Cap Value Fund | Semiannual Report | 4/30/22
| Shares | Value | |
| Real Estate Management & Development — 0.7% | ||
| 59,770(a) | CBRE Group, Inc., Class A | $ 4,963,301 |
| Total Real Estate Management & Development | $ 4,963,301 | |
| Road & Rail — 1.3% | ||
| 58,920 | JB Hunt Transport Services, Inc. | $ 10,066,482 |
| Total Road & Rail | $ 10,066,482 | |
| Semiconductors & Semiconductor Equipment — 0.9% | ||
| 62,015 | MKS Instruments, Inc. | $ 7,068,470 |
| Total Semiconductors & Semiconductor Equipment | $ 7,068,470 | |
| Software — 0.9% | ||
| 83,328 | Dolby Laboratories, Inc., Class A | $ 6,455,420 |
| Total Software | $ 6,455,420 | |
| Specialty Retail — 3.9% | ||
| 21,784(a) | O’Reilly Automotive, Inc. | $ 13,213,085 |
| 163,928 | Ross Stores, Inc. | 16,355,097 |
| Total Specialty Retail | $ 29,568,182 | |
| Technology Hardware, Storage & Peripherals — 1.3% | ||
| 640,501 | Hewlett Packard Enterprise Co. | $ 9,870,120 |
| Total Technology Hardware, Storage & Peripherals | $ 9,870,120 | |
| Trading Companies & Distributors — 1.1% | ||
| 173,967(a) | AerCap Holdings NV | $ 8,125,999 |
| Total Trading Companies & Distributors | $ 8,125,999 | |
| TOTAL COMMON STOCKS | ||
| (Cost $589,586,146) | $725,297,696 | |
| SHORT TERM INVESTMENTS — 3.5% of | ||
| Net Assets | ||
| Open-End Fund — 3.5% | ||
| 26,478,313(b) | Dreyfus Government Cash Management, Institutional | |
| Shares, 0.24% | $ 26,478,313 | |
| $ 26,478,313 | ||
| TOTAL SHORT TERM INVESTMENTS | ||
| (Cost $26,478,313) | $ 26,478,313 | |
| TOTAL INVESTMENTS IN UNAFFILIATED ISSUERS — 100.0% | ||
| (Cost $616,064,459) | $751,776,009 | |
| OTHER ASSETS AND LIABILITIES — (0.0)% | $ (310,460) | |
| NET ASSETS — 100.0% | $751,465,549 | |
| (a) | Non-income producing security. |
| (b) | Rate periodically changes. Rate disclosed is the 7-day yield at April 30, 2022. |
The accompanying notes are an integral part of these financial statements.
Pioneer Mid Cap Value Fund | Semiannual Report | 4/30/22 23
Schedule of Investments | 4/30/22
(unaudited) (continued)
Purchases and sales of securities (excluding short term investments) for the six months ended April 30, 2022, aggregated $251,199,982 and $272,692,559, respectively.
The Fund is permitted to engage in purchase and sale transactions (“cross trades”) with certain funds and accounts for which Amundi Asset Management US, Inc. (the “Adviser”) serves as the Fund’s investment adviser, as set forth in Rule 17a-7 under the Investment Company Act of 1940, pursuant to procedures adopted by the Board of Trustees. Under these procedures, cross trades are effected at current market prices. During the six months ended April 30, 2022, the Fund did not engage in any cross trade activity.
At April 30, 2022, the net unrealized appreciation on investments based on cost for federal tax purposes of $616,782,953 was as follows:
| Aggregate gross unrealized appreciation for all investments in which | |
| there is an excess of value over tax cost | $154,656,380 |
| Aggregate gross unrealized depreciation for all investments in which | |
| there is an excess of tax cost over value | (19,663,324) |
| Net unrealized appreciation | $134,993,056 |
Various inputs are used in determining the value of the Fund’s investments. These inputs are summarized in the three broad levels below.
Level 1 – unadjusted quoted prices in active markets for identical securities.
Level 2 – other significant observable inputs (including quoted prices for similar securities, interest rates, prepayment speeds, credit risks, etc.). See Notes to Financial Statements — Note 1A.
Level 3 – significant unobservable inputs (including the Fund’s own assumptions in determining fair value of investments). See Notes to Financial Statements — Note 1A.
The following is a summary of the inputs used as of April 30, 2022, in valuing the Fund’s investments:
| Level 1 | Level 2 | Level 3 | Total | |
| Common Stocks | $725,297,696 | $ — | $ — | $725,297,696 |
| Open-End Fund | 26,478,313 | — | — | 26,478,313 |
| Total Investments | ||||
| in Securities | $751,776,009 | $ — | $ — | $751,776,009 |
During the six months ended April 30, 2022, there were no transfers in or out of Level 3.
The accompanying notes are an integral part of these financial statements.
24 Pioneer Mid Cap Value Fund | Semiannual Report | 4/30/22
Statement of Assets and Liabilities | 4/30/22
(unaudited)
| ASSETS: | |
| Investments in unaffiliated issuers, at value (cost $616,064,459) | $751,776,009 |
| Receivables — | |
| Fund shares sold | 225,619 |
| Dividends | 204,876 |
| Interest | 5,982 |
| Other assets | 57,864 |
| Total assets | $752,270,350 |
| LIABILITIES: | |
| Payables — | |
| Fund shares repurchased | $ 409,342 |
| Distributions | 6,186 |
| Trustees’ fees | 2,307 |
| Professional fees | 40,870 |
| Transfer agent fees | 198,943 |
| Printing fees | 9,905 |
| Due to affiliates | |
| Management fees | 58,122 |
| Other due to affiliates | 43,458 |
| Accrued expenses | 35,668 |
| Total liabilities | $ 804,801 |
| NET ASSETS: | |
| Paid-in capital | $573,908,472 |
| Distributable earnings | 177,557,077 |
| Net assets | $751,465,549 |
| NET ASSET VALUE PER SHARE: | |
| No par value (unlimited number of shares authorized) | |
| Class A (based on $702,609,580/28,256,856 shares) | $ 24.87 |
| Class C (based on $9,735,082/651,242 shares) | $ 14.95 |
| Class K (based on $1,032,462/41,490 shares) | $ 24.88 |
| Class R (based on $7,074,511/292,853 shares) | $ 24.16 |
| Class Y (based on $31,013,914/1,131,995 shares) | $ 27.40 |
| MAXIMUM OFFERING PRICE PER SHARE: | |
| Class A (based on $24.87 net asset value per share/100%-5.75% | |
| maximum sales charge) | $ 26.39 |
The accompanying notes are an integral part of these financial statements.
Pioneer Mid Cap Value Fund | Semiannual Report | 4/30/22 25
Statement of Operations (unaudited)
FOR THE SIX MONTHS ENDED 4/30/22
| INVESTMENT INCOME: | ||
| Dividends from unaffiliated issuers (net of foreign taxes | ||
| withheld $9,751) | $ 7,000,790 | |
| Interest from unaffiliated issuers | 4,446 | |
| Total Investment Income | $ 7,005,236 | |
| EXPENSES: | ||
| Management fees | ||
| Basic fee | $ 2,674,924 | |
| Performance adjustment | (26,270) | |
| Administrative expenses | 152,789 | |
| Transfer agent fees | ||
| Class A | 288,428 | |
| Class C | 8,451 | |
| Class K | 22 | |
| Class R | 10,462 | |
| Class Y | 12,057 | |
| Distribution fees | ||
| Class A | 924,075 | |
| Class C | 51,892 | |
| Class R | 19,173 | |
| Shareowner communications expense | 118,512 | |
| Custodian fees | 4,944 | |
| Registration fees | 34,502 | |
| Professional fees | 48,068 | |
| Printing expense | 14,844 | |
| Trustees’ fees | 16,447 | |
| Insurance expense | 3 | |
| Miscellaneous | 56,260 | |
| Total expenses | $ 4,409,583 | |
| Net investment income | $ 2,595,653 | |
| REALIZED AND UNREALIZED GAIN (LOSS) ON INVESTMENTS: | ||
| Net realized gain (loss) on: | ||
| Investments in unaffiliated issuers | $41,389,237 | |
| Other assets and liabilities denominated in foreign currencies | 69,480 | $ 41,458,717 |
| Change in net unrealized appreciation (depreciation) on: | ||
| Investments in unaffiliated issuers | $(53,010,030) | |
| Net realized and unrealized gain (loss) on investments | $(11,551,313) | |
| Net decrease in net assets resulting from operations | $ (8,955,660) | |
The accompanying notes are an integral part of these financial statements.
26 Pioneer Mid Cap Value Fund | Semiannual Report | 4/30/22
Statements of Changes in Net Assets
| Six Months | ||
| Ended | ||
| 4/30/22 | Year Ended | |
| (unaudited) | 10/31/21 | |
| FROM OPERATIONS: | ||
| Net investment income (loss) | $ 2,595,653 | $ 4,681,488 |
| Net realized gain (loss) on investments | 41,458,717 | 145,140,112 |
| Change in net unrealized appreciation (depreciation) | ||
| on investments | (53,010,030) | 102,365,286 |
| Net increase (decrease) in net assets resulting | ||
| from operations | $ (8,955,660) | $252,186,886 |
| DISTRIBUTIONS TO SHAREOWNERS: | ||
| Class A ($3.75 and $0.17 per share, respectively) | $ (96,012,358) | $ (4,608,921) |
| Class C ($3.65 and $0.03 per share, respectively) | (2,044,663) | (19,531) |
| Class K ($3.84 and $0.24 per share, respectively) | (122,372) | (5,413) |
| Class R ($3.62 and $0.10 per share, respectively) | (1,017,855) | (33,607) |
| Class Y ($3.82 and $0.22 per share, respectively) | (3,002,242) | (154,858) |
| Total distributions to shareowners | $(102,199,490) | $ (4,822,330) |
| FROM FUND SHARE TRANSACTIONS: | ||
| Net proceeds from sales of shares | $ 20,273,977 | $ 28,608,017 |
| Reinvestment of distributions | 98,539,497 | 4,598,938 |
| Cost of shares repurchased | (44,690,306) | (95,997,067) |
| Net increase (decrease) in net assets resulting from | ||
| Fund share transactions | $ 74,123,168 | $ (62,790,112) |
| Net increase (decrease) in net assets | $ (37,031,982) | $184,574,444 |
| NET ASSETS: | ||
| Beginning of period | $ 788,497,531 | $603,923,087 |
| End of period | $ 751,465,549 | $788,497,531 |
The accompanying notes are an integral part of these financial statements.
Pioneer Mid Cap Value Fund | Semiannual Report | 4/30/22 27
Statements of Changes in Net Assets
(continued)
| Six Months | Six Months | |||
| Ended | Ended | Year | Year | |
| 4/30/22 | 4/30/22 | Ended | Ended | |
| Shares | Amount | 10/31/21 | 10/31/21 | |
| (unaudited) | (unaudited) | Shares | Amount | |
| Class A | ||||
| Shares sold | 294,750 | $ 7,733,702 | 705,253 | $ 18,522,202 |
| Reinvestment of distributions | 3,728,953 | 92,539,020 | 190,436 | 4,395,290 |
| Less shares repurchased | (1,432,270) | (37,905,710) | (3,274,770) | (84,673,482) |
| Net increase (decrease) | 2,591,433 | $ 62,367,012 | (2,379,081) | $(61,755,990) |
| Class C | ||||
| Shares sold | 33,580 | $ 544,059 | 110,850 | $ 1,923,613 |
| Reinvestment of distributions | 137,075 | 2,044,595 | 1,290 | 19,531 |
| Less shares repurchased | (89,255) | (1,450,037) | (244,527) | (4,078,275) |
| Net increase (decrease) | 81,400 | $ 1,138,617 | (132,387) | $ (2,135,131) |
| Class K | ||||
| Shares sold | 21,773 | $ 574,249 | 11,280 | $ 307,295 |
| Reinvestment of distributions | 4,603 | 114,702 | 212 | 4,894 |
| Less shares repurchased | (13,537) | (351,954) | (5,770) | (147,857) |
| Net increase | 12,839 | $ 336,997 | 5,722 | $ 164,332 |
| Class R | ||||
| Shares sold | 26,464 | $ 674,697 | 48,109 | $ 1,254,346 |
| Reinvestment of distributions | 42,171 | 1,011,416 | 1,482 | 33,413 |
| Less shares repurchased | (68,123) | (1,752,293) | (104,175) | (2,618,411) |
| Net increase (decrease) | 512 | $ (66,180) | (54,584) | $ (1,330,652) |
| Class Y | ||||
| Shares sold | 365,314 | $ 10,747,270 | 233,078 | $ 6,600,561 |
| Reinvestment of distributions | 103,321 | 2,829,764 | 5,811 | 145,810 |
| Less shares repurchased | (113,030) | (3,230,312) | (157,014) | (4,479,042) |
| Net increase | 355,605 | $ 10,346,722 | 81,875 | $ 2,267,329 |
The accompanying notes are an integral part of these financial statements.
28 Pioneer Mid Cap Value Fund | Semiannual Report | 4/30/22
Financial Highlights
| Six Months | ||||||
| Ended | Year | Year | Year | Year | Year | |
| 4/30/22 | Ended | Ended | Ended | Ended | Ended | |
| (unaudited) | 10/31/21 | 10/31/20 | 10/31/19 | 10/31/18 | 10/31/17 | |
| Class A | ||||||
| Net asset value, beginning of period | $ 28.99 | $ 20.39 | $ 22.77 | $ 22.50 | $ 26.27 | $ 23.66 |
| Increase (decrease) from investment operations: | ||||||
| Net investment income (loss) (a) | $ 0.09 | $ 0.17 | $ 0.19 | $ 0.18 | $ 0.16 | $ 0.11 |
| Net realized and unrealized gain (loss) on investments | (0.46) | 8.60 | (2.32) | 2.36 | (1.82) | 4.10 |
| Net increase (decrease) from investment operations | $ (0.37) | $ 8.77 | $ (2.13) | $ 2.54 | $ (1.66) | $ 4.21 |
| Distributions to shareowners: | ||||||
| Net investment income | $ (0.16) | $ (0.17) | $ (0.17) | $ (0.18) | $ (0.09) | $ (0.11) |
| Net realized gain | (3.59) | — | (0.08) | (2.09) | (2.02) | (1.49) |
| Total distributions | $ (3.75) | $ (0.17) | $ (0.25) | $ (2.27) | $ (2.11) | $ (1.60) |
| Net increase (decrease) in net asset value | $ (4.12) | $ 8.60 | $ (2.38) | $ 0.27 | $ (3.77) | $ 2.61 |
| Net asset value, end of period | $ 24.87 | $ 28.99 | $ 20.39 | $ 22.77 | $ 22.50 | $ 26.27 |
| Total return (b) | (1.17)%(c) | 43.21% | (9.48)% | 12.44%(d) | (7.05)% | 18.56% |
| Ratio of net expenses to average net assets | 1.12%(e) | 1.05% | 1.08% | 1.06% | 1.02% | 1.04% |
| Ratio of net investment income (loss) to average net assets | 0.67%(e) | 0.64% | 0.94% | 0.85% | 0.63% | 0.43% |
| Portfolio turnover rate | 33%(c) | 68% | 65% | 94% | 78% | 58% |
| Net assets, end of period (in thousands) | $702,610 | $744,113 | $571,772 | $710,565 | $710,468 | $839,636 |
| (a) | The per-share data presented above is based on the average shares outstanding for the period presented. |
| (b) | Assumes initial investment at net asset value at the beginning of each period, reinvestment of all distributions, the complete redemption of the investment at net asset value at the end of each period and no sales charges. Total return would be reduced if sales charges were taken into account. |
| (c) | Not annualized. |
| (d) | If the Fund had not recognized gains in settlement of class action lawsuits during the year ended October 31, 2019, the total return would have been 12.34%. |
| (e) | Annualized. |
The accompanying notes are an integral part of these financial statements.
Pioneer Mid Cap Value Fund | Semiannual Report | 4/30/22 29
Financial Highlights (continued)
| Six Months | ||||||
| Ended | Year | Year | Year | Year | Year | |
| 4/30/22 | Ended | Ended | Ended | Ended | Ended | |
| (unaudited) | 10/31/21 | 10/31/20 | 10/31/19 | 10/31/18 | 10/31/17 | |
| Class C | ||||||
| Net asset value, beginning of period | $18.93 | $ 13.36 | $ 15.01 | $ 15.53 | $ 18.82 | $ 17.42 |
| Increase (decrease) from investment operations: | ||||||
| Net investment income (loss) (a) | $ (0.02) | $ (0.04) | $ 0.01 | $ (0.00)(b) | $ (0.03) | $ (0.07) |
| Net realized and unrealized gain (loss) on investments | (0.31) | 5.64 | (1.53) | 1.57 | (1.24) | 2.96 |
| Net increase (decrease) from investment operations | $ (0.33) | $ 5.60 | $ (1.52) | $ 1.57 | $ (1.27) | $ 2.89 |
| Distributions to shareowners: | ||||||
| Net investment income | $ (0.06) | $ (0.03) | $ (0.05) | $ — | $ — | $ — |
| Net realized gain | (3.59) | — | (0.08) | (2.09) | (2.02) | (1.49) |
| Total distributions | $ (3.65) | $ (0.03) | $ (0.13) | $ (2.09) | $ (2.02) | $ (1.49) |
| Net increase (decrease) in net asset value | $ (3.98) | $ 5.57 | $ (1.65) | $ (0.52) | $ (3.29) | $ 1.40 |
| Net asset value, end of period | $14.95 | $ 18.93 | $ 13.36 | $ 15.01 | $ 15.53 | $ 18.82 |
| Total return (c) | (1.65)%(d) | 41.99% | (10.25)% | 11.40%(e) | (7.77)%(f) | 17.55% |
| Ratio of net expenses to average net assets | 1.98%(g) | 1.94% | 1.96% | 1.94% | 1.83% | 1.87% |
| Ratio of net investment income (loss) to average net assets | (0.19)%(g) | (0.24)% | 0.07% | (0.01)% | (0.15)% | (0.40)% |
| Portfolio turnover rate | 33%(d) | 68% | 65% | 94% | 78% | 58% |
| Net assets, end of period (in thousands) | $9,735 | $10,785 | $ 9,380 | $13,845 | $18,495 | $48,840 |
| (a) | The per-share data presented above is based on the average shares outstanding for the period presented. |
| (b) | Amount rounds to less than $0.01 per share. |
| (c) | Assumes initial investment at net asset value at the beginning of each period, reinvestment of all distributions, the complete redemption of the investment at net asset value at the end of each period and no sales charges. Total return would be reduced if sales charges were taken into account. |
| (d) | Not annualized. |
| (e) | If the Fund had not recognized gains in settlement of class action lawsuits during the year ended October 31, 2019, the total return would have been 11.31%. |
| (f) | If the Fund had not recognized gains in settlement of class action lawsuits during the year ended October 31, 2018, the total return would have been (7.82)% . |
| (g) | Annualized. |
The accompanying notes are an integral part of these financial statements.
30 Pioneer Mid Cap Value Fund | Semiannual Report | 4/30/22
| Six Months | ||||||
| Ended | Year | Year | Year | Year | Year | |
| 4/30/22 | Ended | Ended | Ended | Ended | Ended | |
| (unaudited) | 10/31/21 | 10/31/20 | 10/31/19 | 10/31/18 | 10/31/17 | |
| Class K | ||||||
| Net asset value, beginning of period | $29.06 | $20.43 | $22.82 | $22.56 | $26.34 | $ 23.72 |
| Increase (decrease) from investment operations: | ||||||
| Net investment income (loss) (a) | $ 0.13 | $ 0.26 | $ 0.26 | $ 0.26 | $ 0.21 | $ 0.19 |
| Net realized and unrealized gain (loss) on investments | (0.47) | 8.61 | (2.31) | 2.34 | (1.79) | 4.11 |
| Net increase (decrease) from investment operations | $ (0.34) | $ 8.87 | $ (2.05) | $ 2.60 | $ (1.58) | $ 4.30 |
| Distributions to shareowners: | ||||||
| Net investment income | $ (0.25) | $ (0.24) | $ (0.26) | $ (0.25) | $ (0.18) | $ (0.19) |
| Net realized gain | (3.59) | — | (0.08) | (2.09) | (2.02) | (1.49) |
| Total distributions | $ (3.84) | $ (0.24) | $ (0.34) | $ (2.34) | $ (2.20) | $ (1.68) |
| Net increase (decrease) in net asset value | $ (4.18) | $ 8.63 | $ (2.39) | $ 0.26 | $ (3.78) | $ 2.62 |
| Net asset value, end of period | $24.88 | $29.06 | $20.43 | $22.82 | $22.56 | $ 26.34 |
| Total return (b) | (1.03)%(c) | 43.72% | (9.17)% | 12.83%(d) | (6.75)%(e) | 18.98% |
| Ratio of net expenses to average net assets | 0.79%(f) | 0.71% | 0.72% | 0.69% | 0.68% | 0.68% |
| Ratio of net investment income (loss) to average net assets | 0.99%(f) | 0.98% | 1.29% | 1.23% | 0.83% | 0.74% |
| Portfolio turnover rate | 33%(c) | 68% | 65% | 94% | 78% | 58% |
| Net assets, end of period (in thousands) | $1,032 | $ 832 | $ 468 | $1,554 | $1,693 | $26,373 |
| (a) | The per-share data presented above is based on the average shares outstanding for the period presented. |
| (b) | Assumes initial investment at net asset value at the beginning of each period, reinvestment of all distributions and the complete redemption of the investment at net asset value at the end of each period. |
| (c) | Not annualized. |
| (d) | If the Fund had not recognized gains in settlement of class action lawsuits during the year ended October 31, 2019, the total return would have been 12.76%. |
| (e) | If the Fund had not recognized gains in settlement of class action lawsuits during the year ended October 31, 2018, the total return would have been (6.80)% . |
| (f) | Annualized. |
The accompanying notes are an integral part of these financial statements.
Pioneer Mid Cap Value Fund | Semiannual Report | 4/30/22 31
Financial Highlights (continued)
| Six Months | ||||||
| Ended | Year | Year | Year | Year | Year | |
| 4/30/22 | Ended | Ended | Ended | Ended | Ended | |
| (unaudited) | 10/31/21 | 10/31/20 | 10/31/19 | 10/31/18 | 10/31/17 | |
| Class R | ||||||
| Net asset value, beginning of period | $28.20 | $19.87 | $22.18 | $ 21.94 | $ 25.70 | $ 23.18 |
| Increase (decrease) from investment operations: | ||||||
| Net investment income (loss) (a) | $ 0.03 | $ 0.05 | $ 0.12 | $ 0.09 | $ 0.04 | $0.00(b) |
| Net realized and unrealized gain (loss) on investments | (0.45) | 8.38 | (2.27) | 2.31 | (1.78) | 4.02 |
| Net increase (decrease) from investment operations | $ (0.42) | $ 8.43 | $ (2.15) | $ 2.40 | $ (1.74) | $ 4.02 |
| Distributions to shareowners: | ||||||
| Net investment income | $ (0.03) | $ (0.10) | $ (0.08) | $ (0.07) | $ — | $ (0.01) |
| Net realized gain | (3.59) | — | (0.08) | (2.09) | (2.02) | (1.49) |
| Total distributions | $ (3.62) | $ (0.10) | $ (0.16) | $ (2.16) | $ (2.02) | $ (1.50) |
| Net increase (decrease) in net asset value | $ (4.04) | $ 8.33 | $ (2.31) | $ 0.24 | $ (3.76) | $ 2.52 |
| Net asset value, end of period | $24.16 | $28.20 | $19.87 | $ 22.18 | $ 21.94 | $ 25.70 |
| Total return (c) | (1.41)%(d) | 42.54% | (9.79)% | 11.97%(e) | (7.50)% | 18.11% |
| Ratio of net expenses to average net assets | 1.55%(f) | 1.51% | 1.42% | 1.47% | 1.48% | 1.46% |
| Ratio of net investment income (loss) to average net assets | 0.25%(f) | 0.18% | 0.61% | 0.45% | 0.18% | 0.02% |
| Portfolio turnover rate | 33%(d) | 68% | 65% | 94% | 78% | 58% |
| Net assets, end of period (in thousands) | $7,075 | $8,245 | $6,893 | $ 9,814 | $10,244 | $14,579 |
| (a) | The per-share data presented above is based on the average shares outstanding for the period presented. |
| (b) | Amount rounds to less than $0.01 per share. |
| (c) | Assumes initial investment at net asset value at the beginning of each period, reinvestment of all distributions and the complete redemption of the investment at net asset value at the end of each period. |
| (d) | Not annualized. |
| (e) | If the Fund had not recognized gains in settlement of class action lawsuits during the year ended October 31, 2019, the total return would have been 11.87%. |
| (f) | Annualized. |
The accompanying notes are an integral part of these financial statements.
32 Pioneer Mid Cap Value Fund | Semiannual Report | 4/30/22
| Six Months | ||||||
| Ended | Year | Year | Year | Year | Year | |
| 4/30/22 | Ended | Ended | Ended | Ended | Ended | |
| (unaudited) | 10/31/21 | 10/31/20 | 10/31/19 | 10/31/18 | 10/31/17 | |
| Class Y | ||||||
| Net asset value, beginning of period | $ 31.58 | $ 22.19 | $ 24.74 | $ 24.26 | $ 28.16 | $ 25.25 |
| Increase (decrease) from investment operations: | ||||||
| Net investment income (loss) (a) | $ 0.12 | $ 0.26 | $ 0.28 | $ 0.25 | $ 0.23 | $ 0.18 |
| Net realized and unrealized gain (loss) on investments | (0.48) | 9.35 | (2.52) | 2.55 | (1.97) | 4.38 |
| Net increase (decrease) from investment operations | $ (0.36) | $ 9.61 | $ (2.24) | $ 2.80 | $ (1.74) | $ 4.56 |
| Distributions to shareowners: | ||||||
| Net investment income | $ (0.23) | $ (0.22) | $ (0.23) | $ (0.23) | $ (0.14) | $ (0.16) |
| Net realized gain | (3.59) | — | (0.08) | (2.09) | (2.02) | (1.49) |
| Total distributions | $ (3.82) | $ (0.22) | $ (0.31) | $ (2.32) | $ (2.16) | $ (1.65) |
| Net increase (decrease) in net asset value | $ (4.18) | $ 9.39 | $ (2.55) | $ 0.48 | $ (3.90) | $ 2.91 |
| Net asset value, end of period | $ 27.40 | $ 31.58 | $ 22.19 | $ 24.74 | $ 24.26 | $ 28.16 |
| Total return (b) | (1.05)%(c) | 43.58% | (9.23)% | 12.70%(d) | (6.85)% | 18.85% |
| Ratio of net expenses to average net assets | 0.87%(e) | 0.79% | 0.81% | 0.82% | 0.78% | 0.81% |
| Ratio of net investment income (loss) to average net assets | 0.85%(e) | 0.89% | 1.25% | 1.08% | 0.88% | 0.66% |
| Portfolio turnover rate | 33%(c) | 68% | 65% | 94% | 78% | 58% |
| Net assets, end of period (in thousands) | $31,014 | $24,521 | $15,409 | $27,724 | $27,410 | $39,423 |
| (a) | The per-share data presented above is based on the average shares outstanding for the period presented. |
| (b) | Assumes initial investment at net asset value at the beginning of each period, reinvestment of all distributions and the complete redemption of the investment at net asset value at the end of each period. |
| (c) | Not annualized. |
| (d) | If the Fund had not recognized gains in settlement of class action lawsuits during the year ended October 31, 2019, the total return would have been 12.60%. |
| (e) | Annualized. |
The accompanying notes are an integral part of these financial statements.
Pioneer Mid Cap Value Fund | Semiannual Report | 4/30/22 33
Notes to Financial Statements | 4/30/22
(unaudited)
1. Organization and Significant Accounting Policies
Pioneer Mid Cap Value Fund (the “Fund”) is a Delaware statutory trust. The Fund is registered under the Investment Company Act of 1940 as a diversified, open-end management investment company. The investment objective of the Fund is to seek capital appreciation by investing in a diversified portfolio of securities consisting primarily of common stocks.
The Fund offers five classes of shares designated as Class A, Class C, Class K, Class R and Class Y shares. Each class of shares represents an interest in the same portfolio of investments of the Fund and has identical rights (based on relative net asset values) to assets and liquidation proceeds. Share classes can bear different rates of class-specific fees and expenses, such as transfer agent and distribution fees. Differences in class-specific fees and expenses will result in differences in net investment income and, therefore, the payment of different dividends from net investment income earned by each class. The Amended and Restated Declaration of Trust of the Fund gives the Board of Trustees the flexibility to specify either per-share voting or dollar-weighted voting when submitting matters for shareowner approval. Under per share voting, each share of a class of the Fund is entitled to one vote. Under dollarweighted voting, a shareowner’s voting power is determined not by the number of shares owned, but by the dollar value of the shares on the record date. Each share class has exclusive voting rights with respect to matters affecting only that class, including with respect to the distribution plan for that class. There is no distribution plan for Class Y shares.
Amundi Asset Management US, Inc., an indirect, wholly owned subsidiary of Amundi and Amundi’s wholly owned subsidiary, Amundi USA, Inc., serves as the Fund’s investment adviser (the “Adviser”). Amundi Distributor US, Inc., an affiliate of the Adviser, serves as the Fund’s distributor (the “Distributor”).
In March 2020, FASB issued an Accounting Standard Update, ASU 2020-04, Reference Rate Reform (Topic 848) — Facilitation of the Effects of Reference Rate Reform on Financial Reporting (“ASU 2020-04”), which provides optional, temporary relief with respect to the financial reporting of contracts subject to certain types of modifications due to the planned discontinuation of the London Interbank Offered Rate (“LIBOR”) and other LIBOR-based reference rates at the end of 2021. The temporary relief provided by ASU 2020-04 is effective for certain reference rate-related
34 Pioneer Mid Cap Value Fund | Semiannual Report | 4/30/22
contract modifications that occur during the period from March 12, 2020 through December 31, 2023. Management is evaluating the impact of ASU 2020-04 on the Fund’s investments, derivatives, debt and other contracts, if applicable, that will undergo reference rate-related modifications as a result of the reference rate reform.
The Fund is an investment company and follows investment company accounting and reporting guidance under U.S. Generally Accepted Accounting Principles (“U.S. GAAP”). U.S. GAAP requires the management of the Fund to make estimates and assumptions that affect the reported amounts of assets and liabilities, the disclosure of contingent assets and liabilities at the date of the financial statements, and the reported amounts of income, expenses and gain or loss on investments during the reporting period. Actual results could differ from those estimates.
The following is a summary of significant accounting policies followed by the Fund in the preparation of its financial statements:
A. Security Valuation
The net asset value of the Fund is computed once daily, on each day the New York Stock Exchange (“NYSE”) is open, as of the close of regular trading on the NYSE.
Equity securities that have traded on an exchange are valued by using the last sale price on the principal exchange where they are traded. Equity securities that have not traded on the date of valuation, or securities for which sale prices are not available, generally are valued using the mean between the last bid and asked prices or, if both last bid and asked prices are not available, at the last quoted bid price. Last sale and bid and asked prices are provided by independent third party pricing services. In the case of equity securities not traded on an exchange, prices are typically determined by independent third party pricing services using a variety of techniques and methods.
Shares of open-end registered investment companies (including money market mutual funds) are valued at such funds’ net asset value. Shares of exchange-listed closed-end funds are valued by using the last sale price on the principal exchange where they are traded. Securities for which independent pricing services or broker-dealers are unable to supply prices or for which market prices and/or quotations are not readily available or are considered to be unreliable are valued by a fair valuation team comprised of certain personnel of the Adviser pursuant to procedures adopted by the Portfolio’s Board of Trustees. The Adviser’s fair valuation team uses fair value methods approved by the Valuation Committee of the Board of Trustees. The Adviser’s fair valuation team is responsible for
Pioneer Mid Cap Value Fund | Semiannual Report | 4/30/22 35
monitoring developments that may impact fair valued securities and for discussing and assessing fair values on an ongoing basis, and at least quarterly, with the Valuation Committee of the Board of Trustees.
Inputs used when applying fair value methods to value a security may include credit ratings, the financial condition of the company, current market conditions and comparable securities. The Fund may use fair value methods if it is determined that a significant event has occurred after the close of the exchange or market on which the security trades and prior to the determination of the Fund’s net asset value. Examples of a significant event might include political or economic news, corporate restructurings, natural disasters, terrorist activity or trading halts. Thus, the valuation of the Fund’s securities may differ significantly from exchange prices, and such differences could be material.
At April 30, 2022, no securities were valued using fair value methods (other than securities valued using prices supplied by independent pricing services, broker-dealers or using a third party insurance industry valuation model).
B. Investment Income and Transactions
Dividend income is recorded on the ex-dividend date, except that certain dividends from foreign securities where the ex-dividend date may have passed are recorded as soon as the Fund becomes aware of the ex-dividend data in the exercise of reasonable diligence.
Interest income, including interest on income-bearing cash accounts, is recorded on the accrual basis. Dividend and interest income are reported net of unrecoverable foreign taxes withheld at the applicable country rates and net of income accrued on defaulted securities.
Interest and dividend income payable by delivery of additional shares is reclassified as PIK (payment-in-kind) income upon receipt and is included in interest and dividend income, respectively.
Security transactions are recorded as of trade date. Gains and losses on sales of investments are calculated on the identified cost method for both financial reporting and federal income tax purposes.
C. Federal Income Taxes
It is the Fund’s policy to comply with the requirements of the Internal Revenue Code applicable to regulated investment companies and to distribute all of its net taxable income and net realized capital gains, if any, to its shareowners. Therefore, no provision for federal income taxes is
36 Pioneer Mid Cap Value Fund | Semiannual Report | 4/30/22
required. As of October 31, 2021, the Fund did not accrue any interest or penalties with respect to uncertain tax positions, which, if applicable, would be recorded as an income tax expense on the Statement of Operations. Tax returns filed within the prior three years remain subject to examination by federal and state tax authorities.
The amount and character of income and capital gain distributions to shareowners are determined in accordance with federal income tax rules, which may differ from U.S. GAAP. Distributions in excess of net investment income or net realized gains are temporary over distributions for financial statement purposes resulting from differences in the recognition or classification of income or distributions for financial statement and tax purposes. Capital accounts within the financial statements are adjusted for permanent book/tax differences to reflect tax character, but are not adjusted for temporary differences.
A portion of the dividend income recorded by the Fund is from distributions by publicly traded real estate investment trusts (“REITs”), and such distributions for tax purposes may also consist of capital gains and return of capital. The actual return of capital and capital gains portions of such distributions will be determined by formal notifications from the REITs subsequent to the calendar year-end. Distributions received from the REITs that are determined to be a return of capital are recorded by the Fund as a reduction of the cost basis of the securities held and those determined to be capital gain are reflected as such on the Statement of Operations.
The tax character of current year distributions payable will be determined at the end of the current taxable year. The tax character of distributions paid during the year ended October 31, 2021 was as follows:
| 2021 | |
| Distributions paid from: | |
| Ordinary income | $4,822,330 |
| Total | $4,822,330 |
The following shows the components of distributable earnings (losses) on a federal income tax basis at October 31, 2021:
| 2021 | |
| Distributable earnings/(losses): | |
| Undistributed ordinary income | $ 3,364,311 |
| Undistributed long-term capital gains | 97,344,830 |
| Net unrealized appreciation | 188,003,086 |
| Total | $288,712,227 |
Pioneer Mid Cap Value Fund | Semiannual Report | 4/30/22 37
The differences between book-basis and tax-basis unrealized appreciation is attributable to the tax deferral of losses on wash sales.
D. Fund Shares
The Fund records sales and repurchases of its shares as of trade date. The Distributor earned $11,208 in underwriting commissions on the sale of Class A shares during the six months ended April 30, 2022.
E. Class Allocations
Income, common expenses and realized and unrealized gains and losses are calculated at the Fund level and allocated daily to each class of shares based on its respective percentage of adjusted net assets at the beginning of the day.
Distribution fees are calculated based on the average daily net asset value attributable to Class A, Class C and Class R shares of the Fund, respectively (see Note 5). Class K and Class Y shares do not pay distribution fees. All expenses and fees paid to the Fund’s transfer agent for its services are allocated among the classes of shares based on the number of accounts in each class and the ratable allocation of related out-of-pocket expenses (see Note 4).
Distributions to shareowners are recorded as of the ex-dividend date. Distributions paid by the Fund with respect to each class of shares are calculated in the same manner and at the same time, except that net investment income dividends to Class A, Class C, Class K, Class R and Class Y shares can reflect different transfer agent and distribution expense rates.
F. Risks
The value of securities held by the Fund may go up or down, sometimes rapidly or unpredictably, due to general market conditions, such as real or perceived adverse economic, political or regulatory conditions, recessions, the spread of infectious illness or other public health issues, inflation, changes in interest rates, armed conflict including Russia’s military invasion of Ukraine, sanctions against Russia, other nations or individuals or companies and possible countermeasures, lack of liquidity in the bond markets or adverse investor sentiment. In the past several years, financial markets have experienced increased volatility, depressed valuations, decreased liquidity and heightened uncertainty. These conditions may continue, recur, worsen or spread. Interest rates are very low, which means there is more risk that they may go up. The U.S. Federal Reserve has recently started to raise certain interest rates. A general rise in interest rates could adversely affect the price and liquidity of fixed-income securities and could also result in increased redemptions from the Fund.
38 Pioneer Mid Cap Value Fund | Semiannual Report | 4/30/22
Rates of inflation have recently risen. The value of assets or income from an investment may be worth less in the future as inflation decreases the value of money. As inflation increases, the real value of the Fund’s assets can decline as can the value of the Fund’s distributions.
The global pandemic of the novel coronavirus respiratory disease designated COVID-19 has resulted in major disruption to economies and markets around the world, including the United States. Global financial markets have experienced extreme volatility and severe losses, and trading in many instruments has been disrupted. Liquidity for many instruments has been greatly reduced for periods of time. Some sectors of the economy and individual issuers have experienced particularly large losses. These circumstances may continue for an extended period of time, and may continue to affect adversely the value and liquidity of the Fund’s investments. Following Russia’s recent invasion of Ukraine, Russian securities have lost all, or nearly all, their market value. Other securities or markets could be similarly affected by past or future geopolitical or other events or conditions.
Governments and central banks, including the U.S. Federal Reserve, have taken extraordinary and unprecedented actions to support local and global economies and the financial markets. These actions have resulted in significant expansion of public debt, including in the U.S. The consequences of high public debt, including its future impact on the economy and securities markets, may not be known for some time.
At times, the Fund’s investments may represent industries or industry sectors that are interrelated or have common risks, making the Fund more susceptible to any economic, political, or regulatory developments or other risks affecting those industries and sectors.
Russia launched a large-scale invasion of Ukraine on February 24, 2022. In response to the military action by Russia, various countries, including the U.S., the United Kingdom, and European Union issued broad-ranging economic sanctions against Russia and Belarus and certain companies and individuals. Since then, Russian securities have lost all, or nearly all, their market value, and many other issuers, securities and markets have been adversely affected. The United States and other countries may impose sanctions on other countries, companies and individuals in light of Russia’s military invasion. The extent and duration of the military action or future escalation of such hostilities, the extent and impact of existing and future sanctions, market disruptions and volatility, and the result of any diplomatic negotiations cannot be predicted. These and any related events could have a significant impact on the value and liquidity of certain Fund investments, on Fund performance and the value of an investment in the Fund, particularly with respect to securities and commodities, such as oil
Pioneer Mid Cap Value Fund | Semiannual Report | 4/30/22 39
and natural gas, as well as other sectors with exposure to Russian issuers or issuers in other countries affected by the invasion, and are likely to have collateral impacts on market sectors globally.
The Fund may invest in REIT securities, the value of which can fall for a variety of reasons, such as declines in rental income, fluctuating interest rates, poor property management, environmental liabilities, uninsured damage, increased competition, or changes in real estate tax laws.
At times, the Fund’s investments may represent industries or industry sectors that are interrelated or have common risks, making the Fund more susceptible to any economic, political, or regulatory developments or other risks affecting those industries and sectors. The Fund’s investments in foreign markets and countries with limited developing markets may subject the Fund to a greater degree of risk than investments in a developed market. These risks include disruptive political or economic conditions and the imposition of adverse governmental laws or currency exchange restrictions.
With the increased use of technologies such as the Internet to conduct business, the Fund is susceptible to operational, information security and related risks. While the Fund’s Adviser has established business continuity plans in the event of, and risk management systems to prevent, limit or mitigate, such cyber-attacks, there are inherent limitations in such plans and systems, including the possibility that certain risks have not been identified. Furthermore, the Fund cannot control the cybersecurity plans and systems put in place by service providers to the Fund such as the Fund’s custodian and accounting agent, and the Fund’s transfer agent. In addition, many beneficial owners of Fund shares hold them through accounts at broker-dealers, retirement platforms and other financial market participants over which neither the Fund nor the Adviser exercises control. Each of these may in turn rely on service providers to them, which are also subject to the risk of cyber-attacks. Cybersecurity failures or breaches at the Adviser or the Fund’s service providers or intermediaries have the ability to cause disruptions and impact business operations, potentially resulting in financial losses, interference with the Fund’s ability to calculate its net asset value, impediments to trading, the inability of Fund shareowners to effect share purchases, redemptions or exchanges or receive distributions, loss of or unauthorized access to private shareowner information and violations of applicable privacy and other laws, regulatory fines, penalties, reputational damage, or additional compliance costs. Such costs and losses may not be covered under any insurance. In addition, maintaining vigilance against cyber-attacks may involve substantial costs over time, and system enhancements may themselves be subject to cyber-attacks.
40 Pioneer Mid Cap Value Fund | Semiannual Report | 4/30/22
2. Management Agreement
The Adviser manages the Fund’s portfolio. Management fees payable under the Fund’s Investment Management Agreement with the Adviser are calculated daily and paid monthly at the annual rate of 0.70% of the Fund’s average daily net assets up to $500 million, 0.65% on the next $500 million, 0.625% on the next $3 billion and 0.60% on the excess over $4 billion. The basic fee (fee before performance adjustment) can increase or decrease by a maximum of 0.10% based on the investment performance of the Fund’s Class A shares as compared to the Russell Midcap Value Index. The performance comparison is made for a rolling 36-month period. In addition, the Adviser contractually limits any positive adjustment of the Fund’s management fee to 0.10% of the Fund’s average daily net assets on an annual basis (i.e., to a maximum management fee of 0.80% of average daily net assets after the performance adjustment). For the six months ended April 30, 2022, the aggregate performance adjustment resulted in a decrease of $26,270 to the basic fee. For the six months ended April 30, 2022, the net management fee was equivalent to 0.68% (annualized) of the Fund’s average daily net assets.
In addition, under the management and administration agreements, certain other services and costs, including accounting, regulatory reporting and insurance premiums, are paid by the Fund as administrative reimbursements. Included in “Due to affiliates” reflected on the Statement of Assets and Liabilities is $80,424 in management fees, administrative costs and certain other reimbursements payable to the Adviser at April 30, 2022.
3. Compensation of Trustees and Officers
The Fund pays an annual fee to its Trustees. The Adviser reimburses the Fund for fees paid to the Interested Trustees. The Fund does not pay any salary or other compensation to its officers. For the six months ended April 30, 2022, the Fund paid $16,447 in Trustees’ compensation, which is reflected on Statement of Operations as Trustees’ fees. At April 30, 2022, the Fund had a payable for Trustees’ fees on its Statement of Assets and Liabilities of $2,307.
4. Transfer Agent
For the period from November 1, 2021 to November 21, 2021, DST Asset Manager Solutions, Inc. served as the transfer agent to the Fund at negotiated rates. Effective November 22, 2021, BNY Mellon Investment Servicing (US) Inc. serves as the transfer agent to the Fund at negotiated rates. Transfer agent fees and payables shown on the Statement of
Pioneer Mid Cap Value Fund | Semiannual Report | 4/30/22 41
Operations and the Statement of Assets and Liabilities, respectively, include sub-transfer agent expenses incurred through the Fund’s omnibus relationship contracts.
In addition, the Fund reimbursed the transfer agent for out-of-pocket expenses incurred by the transfer agent related to shareowner communications activities such as proxy and statement mailings, and outgoing phone calls. For the six months ended April 30, 2022, such out-of-pocket expenses by class of shares were as follows:
| Shareowner Communications: | |
| Class A | $113,195 |
| Class C | 3,046 |
| Class K | 122 |
| Class R | 623 |
| Class Y | 1,526 |
| Total | $118,512 |
5. Distribution and Service Plans
The Fund has adopted a distribution plan (the “Plan”) pursuant to Rule 12b-1 of the Investment Company Act of 1940 with respect to its Class A, Class C and Class R shares. Pursuant to the Plan, the Fund pays the Distributor 0.25% of the Fund’s average daily net assets attributable to Class A shares as compensation for personal services and/or account maintenance services or distribution services with regard to Class A shares. Pursuant to the Plan, the Fund also pays the Distributor 1.00% of the average daily net assets attributable to Class C shares. The fee for Class C shares consists of a 0.25% service fee and a 0.75% distribution fee paid as compensation for personal services and/or account maintenance services or distribution services with regard to Class C shares. Pursuant to the Plan, the Fund further pays the Distributor 0.50% of the average daily net assets attributable to Class R shares for distribution services. Included in “Due to affiliates” reflected on the Statement of Assets and Liabilities is $21,156 in distribution fees payable to the Distributor at April 30, 2022.
The Fund also has adopted a separate service plan for Class R shares (the “Service Plan”). The Service Plan authorizes the Fund to pay securities dealers, plan administrators or other service organizations that agree to provide certain services to retirement plans or plan participants holding shares of the Fund a service fee of up to 0.25% of the Fund’s average daily net assets attributable to Class R shares held by such plans.
42 Pioneer Mid Cap Value Fund | Semiannual Report | 4/30/22
In addition, redemptions of Class A and Class C shares may be subject to a contingent deferred sales charge (“CDSC”). A CDSC of 1.00% may be imposed on redemptions of certain net asset value purchases of Class A shares within 12 months of purchase. Redemptions of Class C shares within 12 months of purchase are subject to a CDSC of 1.00% based on the lower of cost or market value of shares being redeemed. Shares purchased as part of an exchange remain subject to any CDSC that applied to the original purchase of those shares. There is no CDSC for Class K, Class R and Class Y shares. Proceeds from the CDSCs are paid to the Distributor. For the six months ended April 30, 2022, CDSCs in the amount of $708 were paid to the Distributor.
6. Line of Credit Facility
The Fund, along with certain other funds in the Pioneer Family of Funds, participates in a committed, unsecured revolving line of credit (“credit facility”). Borrowings are used solely for temporary or emergency purposes. The Fund may borrow up to the lesser of the amount available under the credit facility or the limits set for borrowing by the Fund’s prospectus and the 1940 Act. Effective February 2, 2022, the Fund participates in a credit facility in the amount of $380 million. Prior to February 2, 2022 the Fund participated in a facility in the amount of $450 million. Under such credit facility, depending on the type of loan, interest on borrowings is payable at the London Interbank Offered Rate (“LIBOR”) plus a credit spread. The Fund also pays both an upfront fee and an annual commitment fee to participate in the credit facility. The upfront fee in the amount of 0.10% of the total credit facility and the commitment fee in the amount of 0.25% of the daily unused portion of each lender’s commitment are allocated among participating funds based on an allocation schedule set forth in the credit agreement. For the six months ended April 30, 2022, the Fund had no borrowings under the credit facility.
7. Changes in Custodian and Sub-Administrator, and Transfer Agent
Effective November 22, 2021, The Bank of New York Mellon Corporation (“BNY Mellon”) serves as the Fund’s Custodian and Sub-Administrator.
Effective November 22, 2021, BNY Mellon Investment Servicing (US) Inc. serves as the Fund’s shareholder servicing and transfer agent.
Pioneer Mid Cap Value Fund | Semiannual Report | 4/30/22 43
Trustees, Officers and Service Providers
| Trustees | Officers |
| Thomas J. Perna, Chairman | Lisa M. Jones, President and |
| John E. Baumgardner, Jr. | Chief Executive Officer |
| Diane Durnin | Anthony J. Koenig, Jr., Treasurer |
| Benjamin M. Friedman | and Chief Financial and |
| Lisa M. Jones | Accounting Officer |
| Craig C. MacKay | Christopher J. Kelley, Secretary and |
| Lorraine H. Monchak | Chief Legal Officer |
| Marguerite A. Piret | |
| Fred J. Ricciardi | |
| Kenneth J. Taubes |
Investment Adviser and Administrator
Amundi Asset Management US, Inc.
Custodian and Sub-Administrator
The Bank of New York Mellon Corporation
Independent Registered Public Accounting Firm
Ernst & Young LLP
Principal Underwriter
Amundi Distributor US, Inc.
Legal Counsel
Morgan, Lewis & Bockius LLP
Transfer Agent
BNY Mellon Investment Servicing (US) Inc.
Proxy Voting Policies and Procedures of the Fund are available without charge, upon request, by calling our toll free number (1-800-225-6292). Information regarding how the Fund voted proxies relating to portfolio securities during the most recent 12-month period ended June 30 is publicly available to shareowners at www.amundi.com/us. This information is also available on the Securities and Exchange Commission’s web site at www.sec.gov.
44 Pioneer Mid Cap Value Fund | Semiannual Report | 4/30/22
How to Contact Amundi
We are pleased to offer a variety of convenient ways for you to contact us for assistance or information.
| Call us for: | |
| Account Information, including existing accounts, | |
| new accounts, prospectuses, applications | |
| and service forms | 1-800-225-6292 |
| FactFoneSM for automated fund yields, prices, | |
| account information and transactions | 1-800-225-4321 |
| Retirement plans information | 1-800-622-0176 |
Write to us:
Amundi
P.O. Box 9897
Providence, R.I. 02940-8097
| Our toll-free fax | 1-800-225-4240 |
| Our internet e-mail address | us.askamundi@amundi.com/us |
| (for general questions about Amundi only) | |
| Visit our web site: www.amundi.com/us. | |
This report must be preceded or accompanied by a prospectus.
The Fund files a complete schedule of portfolio holdings with the Securities and Exchange Commission for the first and third quarters of each fiscal year as an exhibit to its reports on Form N-PORT. Shareholders may view the filed Form N-PORT by visiting the Commission’s web site at https://www.sec.gov.

Amundi Asset Management US, Inc.
60 State Street
Boston, MA 02109
www.amundi.com/us
Securities offered through Amundi Distributor US, Inc.,
60 State Street, Boston, MA 02109
Underwriter of Pioneer Mutual Funds, Member SIPC
© 2022 Amundi Asset Management US, Inc. 19385-16-0622
ITEM 2. CODE OF ETHICS.
(a) Disclose whether, as of the end of the period covered by the report, the registrant has adopted a code of ethics that applies to the registrant’s principal executive officer, principal financial officer, principal accounting officer or controller, or persons performing similar functions, regardless of whether these individuals are employed by the registrant or a third party. If the registrant has not adopted such a code of ethics, explain why it has not done so.
The registrant has adopted, as of the end of the period covered by this report, a code of ethics that applies to the registrant’s principal executive officer, principal financial officer, principal accounting officer and controller.
(b) For purposes of this Item, the term “code of ethics” means written standards that are reasonably designed to deter wrongdoing and to promote:
(1) Honest and ethical conduct, including the ethical handling of actual or apparent conflicts of interest between personal and professional relationships;
(2) Full, fair, accurate, timely, and understandable disclosure in reports and documents that a registrant files with, or submits to, the Commission and in other public communications made by the registrant;
(3) Compliance with applicable governmental laws, rules, and regulations;
(4) The prompt internal reporting of violations of the code to an appropriate person or persons identified in the code; and
(5) Accountability for adherence to the code.
(c) The registrant must briefly describe the nature of any amendment, during the period covered by the report, to a provision of its code of ethics that applies to the registrant’s principal executive officer, principal financial officer, principal accounting officer or controller, or persons performing similar functions, regardless of whether these individuals are employed by the registrant or a third party, and that relates to any element of the code of ethics definition enumerated in paragraph (b) of this Item. The registrant must file a copy of any such amendment as an exhibit pursuant to Item 10(a), unless the registrant has elected to satisfy paragraph (f) of this Item by posting its code of ethics on its website pursuant to paragraph (f)(2) of this Item, or by undertaking to provide its code of ethics to any person without charge, upon request, pursuant to paragraph (f)(3) of this Item.
The registrant has made no amendments to the code of ethics during the period covered by this report.
(d) If the registrant has, during the period covered by the report, granted a waiver, including an implicit waiver, from a provision of the code of ethics to the registrant’s principal executive officer, principal financial officer, principal accounting officer or controller, or persons performing similar functions, regardless of whether these individuals are employed by the registrant or a third party, that relates to one or more of the items set forth in paragraph (b) of this Item, the registrant must briefly describe the nature of the waiver, the name of the person to whom the waiver was granted, and the date of the waiver.
Not applicable.
(e) If the registrant intends to satisfy the disclosure requirement under paragraph (c) or (d) of this Item regarding an amendment to, or a waiver from, a provision of its code of ethics that applies to the registrant’s principal executive officer, principal financial officer, principal accounting officer or controller, or persons performing similar functions and that relates to any element of the code of ethics definition
enumerated in paragraph (b) of this Item by posting such information on its Internet website, disclose the registrant’s Internet address and such intention.
Not applicable.
(f) The registrant must:
(1) File with the Commission, pursuant to Item 12(a)(1), a copy of its code of ethics that applies to the registrant’s principal executive officer, principal financial officer, principal accounting officer or controller, or persons performing similar functions, as an exhibit to its annual report on this Form N-CSR (see attachment);
(2) Post the text of such code of ethics on its Internet website and disclose, in its most recent report on this Form N-CSR, its Internet address and the fact that it has posted such code of ethics on its Internet website; or
(3) Undertake in its most recent report on this Form N-CSR to provide to any person without charge, upon request, a copy of such code of ethics and explain the manner in which such request may be made. See Item 10(2)
ITEM 3. AUDIT COMMITTEE FINANCIAL EXPERT.
(a) (1) Disclose that the registrant’s Board of Trustees has determined that the registrant either:
(i) Has at least one audit committee financial expert serving on its audit committee; or
(ii) Does not have an audit committee financial expert serving on its audit committee.
The registrant’s Board of Trustees has determined that the registrant has at least one audit committee financial expert.
(2) If the registrant provides the disclosure required by paragraph (a)(1)(i) of this Item, it must disclose the name of the audit committee financial expert and whether that person is “independent.” In order to be considered “independent” for purposes of this Item, a member of an audit committee may not, other than in his or her capacity as a member of the audit committee, the Board of Trustees, or any other board committee:
(i) Accept directly or indirectly any consulting, advisory, or other compensatory fee from the issuer; or
(ii) Be an “interested person” of the investment company as defined in Section 2(a)(19) of the Act (15 U.S.C. 80a-2(a)(19)).
Mr. Fred J. Ricciardi, an independent Trustee, is such an audit committee financial expert.
(3) If the registrant provides the disclosure required by paragraph (a)(1) (ii) of this Item, it must explain why it does not have an audit committee financial expert.
Not applicable.
ITEM 4. PRINCIPAL ACCOUNTANT FEES AND SERVICES.
(a) Disclose, under the caption AUDIT FEES, the aggregate fees billed for each of the last two fiscal years for professional services rendered by the principal accountant for the audit of the registrant’s annual financial statements or services that are normally provided by the accountant in connection with statutory and regulatory filings or engagements for those fiscal years.
N/A
(b) Disclose, under the caption AUDIT-RELATED FEES, the aggregate fees billed in each of the last two fiscal years for assurance and related services by the principal accountant that are reasonably related to the performance of the audit of the registrant’s financial statements and are not reported under paragraph (a) of this Item. Registrants shall describe the nature of the services comprising the fees disclosed under this category.
N/A
(c) Disclose, under the caption TAX FEES, the aggregate fees billed in each of the last two fiscal years for professional services rendered by the principal accountant for tax compliance, tax advice, and tax planning. Registrants shall describe the nature of the services comprising the fees disclosed under this category.
N/A
(d) Disclose, under the caption ALL OTHER FEES, the aggregate fees billed in each of the last two fiscal years for products and services provided by the principal accountant, other than the services reported in paragraphs (a) through (c) of this Item. Registrants shall describe the nature of the services comprising the fees disclosed under this category.
N/A
(e) (1) Disclose the audit committee’s pre-approval policies and procedures described in paragraph (c)(7) of Rule 2-01 of Regulation S-X.
PIONEER FUNDS
APPROVAL OF AUDIT, AUDIT-RELATED, TAX AND OTHER SERVICES
PROVIDED BY THE INDEPENDENT AUDITOR
SECTION I - POLICY PURPOSE AND APPLICABILITY
The Pioneer Funds recognize the importance of maintaining the independence of their outside auditors. Maintaining independence is a shared responsibility involving Amundi Asset Management US, Inc., the audit committee and the independent auditors.
The Funds recognize that a Fund’s independent auditors: 1) possess knowledge of the Funds, 2) are able to incorporate certain services into the scope of the audit, thereby avoiding redundant work, cost and disruption of Fund personnel and processes, and 3) have expertise that has value to the Funds. As a result, there are situations where it is desirable to use the Fund’s independent auditors for services in addition to the annual audit and where the potential for conflicts of interests are minimal. Consequently, this policy, which is intended to comply with Rule 210.2-01(C)(7), sets forth guidelines and procedures to be followed by the Funds when retaining the independent audit firm to perform audit, audit-related tax and other services under those circumstances, while also maintaining independence.
Approval of a service in accordance with this policy for a Fund shall also constitute approval for any other Fund whose pre-approval is required pursuant to Rule 210.2-01(c)(7)(ii).
In addition to the procedures set forth in this policy, any non-audit services that may be provided consistently with Rule 210.2-01 may be approved by the Audit Committee itself and any pre-approval that may be waived in accordance with Rule 210.2-01(c)(7)(i)(C) is hereby waived.
Selection of a Fund’s independent auditors and their compensation shall be determined by the Audit Committee and shall not be subject to this policy.
| SECTION II - POLICY | ||
| SERVICE CATEGORY | SERVICE CATEGORY DESCRIPTION | SPECIFIC PRE-APPROVED SERVICE SUBCATEGORIES |
| I. AUDIT SERVICES | Services that are directly | o Accounting research assistance |
| related to performing the | o SEC consultation, registration | |
| independent audit of the Funds | statements, and reporting | |
| o Tax accrual related matters | ||
| o Implementation of new accounting standards | ||
| o Compliance letters (e.g. rating agency letters) | ||
| o Regulatory reviews and assistance | ||
| regarding financial matters | ||
| o Semi-annual reviews (if requested) | ||
| o Comfort letters for closed end offerings | ||
| II. AUDIT-RELATED | Services which are not | o AICPA attest and agreed-upon procedures |
| SERVICES | prohibited under Rule | o Technology control assessments |
| 210.2-01(C)(4) (the “Rule”) | o Financial reporting control assessments | |
| and are related extensions of | o Enterprise security architecture | |
| the audit services support the | assessment | |
| audit, or use the knowledge/expertise | ||
| gained from the audit procedures as a | ||
| foundation to complete the project. | ||
| In most cases, if the Audit-Related | ||
| Services are not performed by the | ||
| Audit firm, the scope of the Audit | ||
| Services would likely increase. | ||
| The Services are typically well-defined | ||
| and governed by accounting | ||
| professional standards (AICPA, | ||
| SEC, etc.) | ||
| AUDIT COMMITTEE APPROVAL POLICY | AUDIT COMMITTEE REPORTING POLICY |
| o “One-time” pre-approval | o A summary of all such |
| for the audit period for all | services and related fees |
| pre-approved specific service | reported at each regularly |
| subcategories. Approval of the | scheduled Audit Committee |
| independent auditors as | meeting. |
| auditors for a Fund shall | |
| constitute pre approval for | |
| these services. | |
| o “One-time” pre-approval | o A summary of all such |
| for the fund fiscal year within | services and related fees |
| a specified dollar limit | (including comparison to |
| for all pre-approved | specified dollar limits) |
| specific service subcategories | reported quarterly. |
| o Specific approval is | |
| needed to exceed the | |
| pre-approved dollar limit for | |
| these services (see general | |
| Audit Committee approval policy | |
| below for details on obtaining | |
| specific approvals) | |
| o Specific approval is | |
| needed to use the Fund’s | |
| auditors for Audit-Related | |
| Services not denoted as | |
| “pre-approved”, or | |
| to add a specific service | |
| subcategory as “pre-approved” | |
| o Specific approval is | |||
| needed to exceed the | |||
| pre-approved dollar limit for | |||
| these services (see general | |||
| Audit Committee approval policy | |||
| below for details on obtaining | |||
| specific approvals) | |||
| o Specific approval is | |||
| needed to use the Fund’s | |||
| auditors for Audit-Related | |||
| Services not denoted as | |||
| “pre-approved”, or | |||
| to add a specific service | |||
| subcategory as “pre-approved” | |||
SECTION III - POLICY DETAIL, CONTINUED
| SERVICE CATEGORY | SERVICE CATEGORY DESCRIPTION | SPECIFIC PRE-APPROVED SERVICE |
| SUBCATEGORIES | ||
| III. TAX SERVICES | Services which are not | o Tax planning and support |
| prohibited by the Rule, | o Tax controversy assistance | |
| if an officer of the Fund | o Tax compliance, tax returns, excise | |
| determines that using the | tax returns and support | |
| Fund’s auditor to provide | o Tax opinions | |
| these services creates | ||
| significant synergy in | ||
| the form of efficiency, | ||
| minimized disruption, or | ||
| the ability to maintain a | ||
| desired level of | ||
| confidentiality. | ||
| AUDIT COMMITTEE APPROVAL POLICY | AUDIT COMMITTEE REPORTING POLICY | |
| o “One-time” pre-approval | o A summary of | |
| for the fund fiscal year | all such services and | |
| within a specified dollar limit | related fees | |
| (including comparison | ||
| to specified dollar | ||
| limits) reported | ||
| quarterly. | ||
| o Specific approval is | ||
| needed to exceed the | ||
| pre-approved dollar limits for | ||
| these services (see general | ||
| Audit Committee approval policy | ||
| below for details on obtaining | ||
| specific approvals) | ||
| o Specific approval is | ||
| needed to use the Fund’s | ||
| auditors for tax services not | ||
| denoted as pre-approved, or to | ||
| add a specific service subcategory as | ||
| “pre-approved” | ||
SECTION III - POLICY DETAIL, CONTINUED
| SERVICE CATEGORY | SERVICE CATEGORY DESCRIPTION | SPECIFIC PRE-APPROVED SERVICE |
| SUBCATEGORIES | ||
| IV. OTHER SERVICES | Services which are not | o Business Risk Management support |
| prohibited by the Rule, | o Other control and regulatory | |
| A. SYNERGISTIC, | if an officer of the Fund | compliance projects |
| UNIQUE QUALIFICATIONS | determines that using the | |
| Fund’s auditor to provide | ||
| these services creates | ||
| significant synergy in | ||
| the form of efficiency, | ||
| minimized disruption, | ||
| the ability to maintain a | ||
| desired level of | ||
| confidentiality, or where | ||
| the Fund’s auditors | ||
| posses unique or superior | ||
| qualifications to provide | ||
| these services, resulting | ||
| in superior value and | ||
| results for the Fund. | ||
| AUDIT COMMITTEE APPROVAL POLICY | AUDIT COMMITTEE REPORTING POLICY |
| o “One-time” pre-approval | o A summary of |
| for the fund fiscal year within | all such services and |
| a specified dollar limit | related fees |
| (including comparison | |
| to specified dollar | |
| limits) reported | |
| quarterly. | |
| o Specific approval is | |
| needed to exceed the | |
| pre-approved dollar limits for | |
| these services (see general | |
| Audit Committee approval policy | |
| below for details on obtaining | |
| specific approvals) | |
| o Specific approval is | |
| needed to use the Fund’s | |
| auditors for “Synergistic” or | |
| “Unique Qualifications” Other | |
| Services not denoted as | |
| pre-approved to the left, or to | |
| add a specific service | |
| subcategory as “pre-approved” | |
SECTION III - POLICY DETAIL, CONTINUED
| SERVICE CATEGORY | SERVICE CATEGORY DESCRIPTION | SPECIFIC PROHIBITED SERVICE |
| SUBCATEGORIES | ||
| PROHIBITED SERVICES | Services which result | 1. Bookkeeping or other services |
| in the auditors losing | related to the accounting records or | |
| independence status | financial statements of the audit | |
| under the Rule. | client* | |
| 2. Financial information systems design | ||
| and implementation* | ||
| 3. Appraisal or valuation services, | ||
| fairness* opinions, or | ||
| contribution-in-kind reports | ||
| 4. Actuarial services (i.e., setting | ||
| actuarial reserves versus actuarial | ||
| audit work)* | ||
| 5. Internal audit outsourcing services* | ||
| 6. Management functions or human | ||
| resources | ||
| 7. Broker or dealer, investment | ||
| advisor, or investment banking services | ||
| 8. Legal services and expert services | ||
| unrelated to the audit | ||
| 9. Any other service that the Public | ||
| Company Accounting Oversight Board | ||
| determines, by regulation, is | ||
| impermissible | ||
| AUDIT COMMITTEE APPROVAL POLICY | AUDIT COMMITTEE REPORTING POLICY |
| o These services are not to be | o A summary of all |
| performed with the exception of the(*) | services and related |
| services that may be permitted | fees reported at each |
| if they would not be subject to audit | regularly scheduled |
| procedures at the audit client (as | Audit Committee meeting |
| defined in rule 2-01(f)(4)) level | will serve as continual |
| the firm providing the service. | confirmation that has |
| not provided any | |
| restricted services. |
GENERAL AUDIT COMMITTEE APPROVAL POLICY:
o For all projects, the officers of the Funds and the Fund’s auditors will each make an assessment to determine that any proposed projects will not impair independence.
o Potential services will be classified into the four non-restricted service categories and the “Approval of Audit, Audit-Related, Tax and Other Services” Policy above will be applied. Any services outside the specific pre-approved service subcategories set forth above must be specifically approved by the Audit Committee.
o At least quarterly, the Audit Committee shall review a report summarizing the services by service category, including fees, provided by the Audit firm as set forth in the above policy.
(2) Disclose the percentage of services described in each of paragraphs (b) through (d) of this Item that were approved by the audit committee pursuant to paragraph (c)(7)(i)(C) of Rule 2-01 of Regulation S-X.
N/A
.
(f) If greater than 50 percent, disclose the percentage of hours expended on the principal accountants engagement to audit the registrant’s financial statements for the most recent fiscal year that were attributed to work performed by persons other than the principal accountant’s full-time, permanent employees.
N/A
(g) Disclose the aggregate non-audit fees billed by the registrants accountant for services rendered to the registrant, and rendered to the registrants investment adviser (not including any sub-adviser whose role is primarily portfolio management and is subcontracted with or overseen by another investment adviser), and any entity controlling, controlled by, or under common control with the adviser that provides ongoing services to the registrant for each of the last two fiscal years of the registrant.
N/A
(h) Disclose whether the registrants audit committee of the Board of Trustees has considered whether the provision of non-audit services that were rendered to the registrants investment adviser (not including any subadviser whose role is primarily portfolio management and is subcontracted with or overseen by another investment adviser), and any entity controlling, controlled by, or under common control with the investment adviser that provides ongoing services to the registrant that were not pre-approved pursuant to paragraph (c)(7)(ii) of Rule 2-01 of Regulation S-X is compatible with maintaining the principal accountant’s independence.
The Fund’s audit committee of the Board of Trustees has considered whether the provision of non-audit services that were rendered to the Affiliates (as defined) that were not pre- approved pursuant to paragraph (c)(7)(ii) of Rule 2-01 of Regulation S-X is compatible with maintaining the principal accountant’s independence.
ITEM 5. AUDIT COMMITTEE OF LISTED REGISTRANTS
(a) If the registrant is a listed issuer as defined in Rule 10A-3 under the Exchange Act (17 CFR 240.10A-3), state whether or not the registrant has a separately-designated standing audit committee established in accordance with Section 3(a)(58)(A) of the Exchange Act (15 U.S.C. 78c(a)(58)(A)). If the registrant has such a committee, however designated, identify each committee member. If the entire board of directors is acting as the registrant’s audit committee as specified in Section 3(a)(58)(B) of the Exchange Act (15 U.S.C. 78c(a)(58)(B)), so state.
N/A
(b) If applicable, provide the disclosure required by Rule 10A-3(d) under the Exchange Act (17 CFR 240.10A-3(d)) regarding an exemption from the listing standards for audit committees.
N/A
ITEM 6. SCHEDULE OF INVESTMENTS.
File Schedule of Investments in securities of unaffiliated issuers as of the close of the reporting period as set forth in 210.1212 of Regulation S-X [17 CFR 210.12-12], unless the schedule is included as part of the report to shareholders filed under Item 1 of this Form.
Included in Item 1
ITEM 7. DISCLOSURE OF PROXY VOTING POLICIES AND PROCEDURES FOR CLOSED-END MANAGEMENT INVESTMENT COMPANIES.
A closed-end management investment company that is filing an annual report on this Form N-CSR must, unless it invests exclusively in non-voting securities, describe the policies and procedures that it uses to determine how to vote proxies relating to portfolio securities, including the procedures that the company uses when a vote presents a conflict between the interests of its shareholders, on the one hand, and those of the company’s investment adviser; principal underwriter; or any affiliated person (as defined in Section 2(a)(3) of the Investment Company Act of 1940 (15 U.S.C. 80a-2(a)(3)) and the rules thereunder) of the company, its investment adviser, or its principal underwriter, on the other. Include any policies and procedures of the company’s investment adviser, or any other third party, that the company uses, or that are used on the company’s behalf, to determine how to vote proxies relating to portfolio securities.
N/A
ITEM 8. PORTFOLIO MANAGERS OF CLOSED-END MANAGEMENT INVESTMENT COMPANIES.
(a) If the registrant is a closed-end management investment company that is filing an annual report on this Form N-CSR, provide the following information:
(1) State the name, title, and length of service of the person or persons employed by or associated with the registrant or an investment adviser of the registrant who are primarily responsible for the day-to-day management of the registrant’s portfolio (“Portfolio Manager”). Also state each Portfolio Manager’s business experience during the past 5 years.
N/A
ITEM 9. PURCHASES OF EQUITY SECURITIES BY CLOSED-END MANAGEMENT INVESTMENT COMPANY AND AFFILIATED PURCHASERS.
(a) If the registrant is a closed-end management investment company, in the following tabular format, provide the information specified in paragraph (b) of this Item with respect to any purchase made by or on behalf of the registrant or any affiliated purchaser, as defined in Rule 10b-18(a)(3) under the Exchange Act (17 CFR 240.10b-18(a)(3)), of shares or other units of any class of the registrant’s equity securities that is registered by the registrant pursuant to Section 12 of the Exchange Act (15 U.S.C. 781).
N/A
ITEM 10. SUBMISSION OF MATTERS TO A VOTE OF SECURITY HOLDERS.
Describe any material changes to the procedures by which shareholders may recommend nominees to the registrant’s board of directors, where those changes were implemented after the registrant last provided disclosure in response to the requirements of Item 407(c)(2)(iv) of Regulation S-R(17 CFR 229.407)(as required by Item 22(b)(15)) of Schedule 14A (17 CFR 240.14a-101), or this Item.
There have been no material changes to the procedures by which the shareholders may recommend nominees to the registrant’s board of directors since the registrant last provided disclosure in response to the requirements of Item 407(c)(2)(iv) of Regulation S-R of Schedule 14(A) in its definitive proxy statement, or this item.
ITEM 11. CONTROLS AND PROCEDURES.
(a) Disclose the conclusions of the registrant’s principal executive and principal financials officers, or persons performing similar functions, regarding the effectiveness of the registrant’s disclosure controls and procedures (as defined in Rule 30a-3(c) under the Act (17 CFR 270.30a-3(c))) as of a date within 90 days of the filing date of the report that includes the disclosure required by this paragraph, based on the evaluation of these controls and procedures required by Rule 30a-3(b) under the Act (17 CFR 270.30(a)-3(b) and Rules 13a-15(b) or 15d-15(b) under the Exchange Act (17 CFR 240.13a-15(b) or 240.15d-15(b)).
The registrant’s principal executive officer and principal financial officer have concluded that the registrant’s disclosure controls and procedures are effective based on the evaluation of these controls and procedures as of a date within 90 days of the filing date of this report.
(b) Disclose any change in the registrant’s internal control over financial reporting (as defined in Rule 30a-3(d) under the Act (17CFR 270.30a-3(d)) that occured during the second fiscal quarter of the period covered by this report that has materially affected, or is reasonably likely to materially affect, the registrant’s internal control over financial reporting.
There were no significant changes in the registrant’s internal control over financial reporting that occurred during the second fiscal quarter of the period covered by this report that have materially affected, or are reasonably likely to materially affect, the registrant’s internal control over financial reporting.
Item 12. Disclosure of Securities Lending Activities for Closed-End Management Investment Companies.
(a) If the registrant is a closed-end management investment company, provide the following dollar amounts of income and compensation related to the securities lending activities of the registrant during its most recent fiscal year:
N/A
(1) Gross income from securities lending activities;
N/A
(2) All fees and/or compensation for each of the following securities lending activities and related services: any share of revenue generated by the securities lending program paid to the securities lending agent(s) (revenue split); fees paid for cash collateral management services (including fees deducted from a pooled cash collateral reinvestment vehicle) that are not included in the revenue split; administrative fees that are not included in the revenue split; fees for indemnification that are not included in the revenue split; rebates paid to borrowers; and any other fees relating to the securities lending program that are not included in the revenue split, including a description of those other fees;
N/A
(3) The aggregate fees/compensation disclosed pursuant to paragraph (2); and
N/A
(4) Net income from securities lending activities (i.e., the dollar amount in paragraph (1) minus the dollar amount in paragraph (3)).
If a fee for a service is included in the revenue split, state that the fee is included in the revenue split.
N/A
(b) If the registrant is a closed-end management investment company, describe the services provided to the registrant by the securities lending agent in the registrants most recent fiscal year.
N/A
ITEM 13. EXHIBITS.
(a) File the exhibits listed below as part of this Form. Letter or number the exhibits in the sequence indicated.
SIGNATURES
[See General Instruction F]
Pursuant to the requirements of the Securities Exchange Act of 1934 and the Investment Company Act of 1940, the registrant has duly caused this report to be signed on its behalf by the undersigned, thereunto duly authorized.
(Registrant) Pioneer Mid Cap Value Fund
By (Signature and Title)* /s/ Lisa M. Jones
Lisa M. Jones, President and Chief Executive Officer
Date July 1, 2022
Pursuant to the requirements of the Securities Exchange Act of 1934 and the Investment Company Act of 1940, this report has been signed below by the following persons on behalf of the registrant and in the capacities and on the dates indicated.
By (Signature and Title)* /s/ Lisa M. Jones
Lisa M. Jones, President and Chief Executive Officer
Date July 1, 2022
By (Signature and Title)* /s/ Anthony J. Koenig, Jr.
Anthony J. Koenig, Jr., Managing Director, Chief Operations Officer & Treasurer of the Funds
Date July 1, 2022
* Print the name and title of each signing officer under his or her signature.