First Quarter 2015 April 23, 2015 Earnings Release Conference Call

design develop deliver advanced technology 2 Forward - Looking Statements This document contains forward - looking statements within the scope of the Securities Act of 1933 and the Securities Exchange Act of 1934 . The words “expect,” “estimate,” “anticipate,” “predict ” and similar expressions, and the negatives thereof, often identify forward - looking statements, which are not limited to historical facts . Our forward - looking statements include, among other things, our sales and earnings per share guidance for the second quarter of 2015 , as well as other statements, express or implied, concerning : future operating results or the ability to generate sales, income or cash flow ; and Benchmark’s business and growth strategies, including expected internal growth and performance goals . Although Benchmark believes these statements are based upon reasonable assumptions, they involve risks and uncertainties relating to our operations, markets and business environment generally . If one or more of these risks or uncertainties materialize, or underlying assumptions prove incorrect, actual outcomes may vary materially from those indicated . All forward - looking statements included in this document are based upon information available to Benchmark as of the date of this document, and the Company assumes no obligation to update them . Readers are advised to consult further disclosures on related subjects, particularly in Item 1 A, “Risk Factors” of the Company’s Annual Report on Form 10 - K for the year ended December 31 , 2014 , in its other filings with the Securities and Exchange Commission and in its press releases . This document includes certain financial measures, such as earnings and earnings per share, that exclude certain items and therefore are not in accordance with generally accepted accounting principles (“GAAP”) . A detailed reconciliation between GAAP results and results excluding special items (“non - GAAP”) is included in our earnings release and in the Appendix of this document .
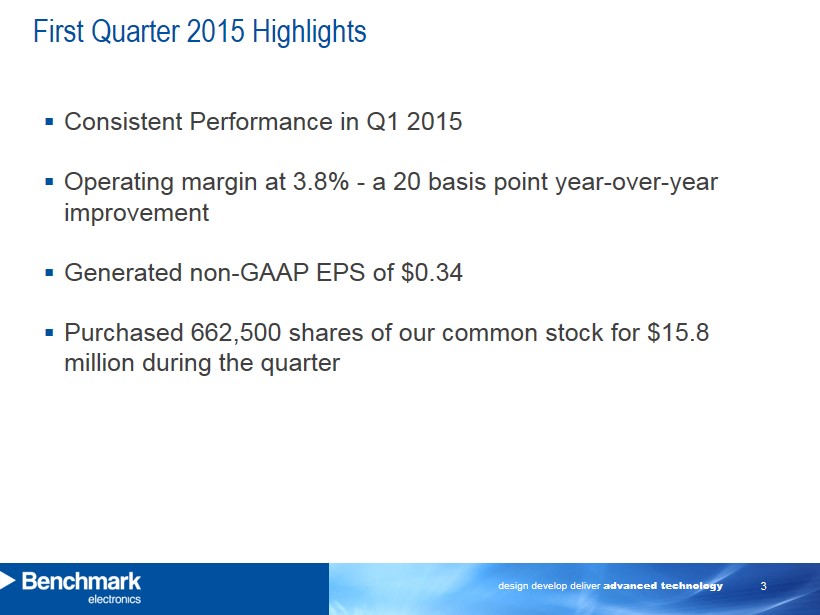
design develop deliver advanced technology 3 ▪ Consistent Performance in Q1 2015 ▪ Operating margin at 3.8% - a 20 basis point year - over - year improvement ▪ Generated non - GAAP EPS of $0.34 ▪ Purchased 662,500 shares of our common stock for $15.8 million during the quarter First Quarter 2015 Highlights
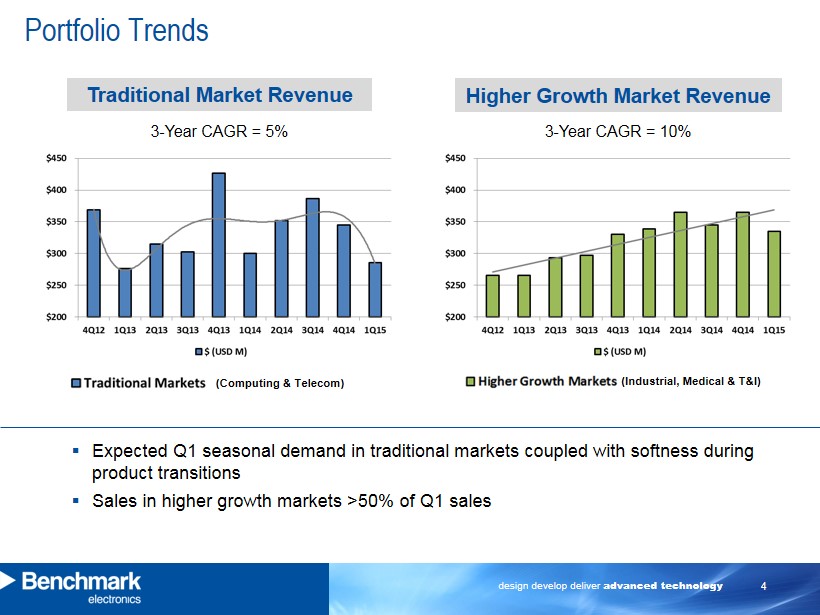
design develop deliver advanced technology 4 Portfolio Trends Traditional Market Revenue ▪ Expected Q1 seasonal demand in traditional m arkets coupled with softness during product transitions ▪ Sales in higher growth markets >50% of Q1 sales Higher Growth Market Revenue (Computing & Telecom) 3 - Year CAGR = 5% 3 - Year CAGR = 10% (Industrial, Medical & T&I)
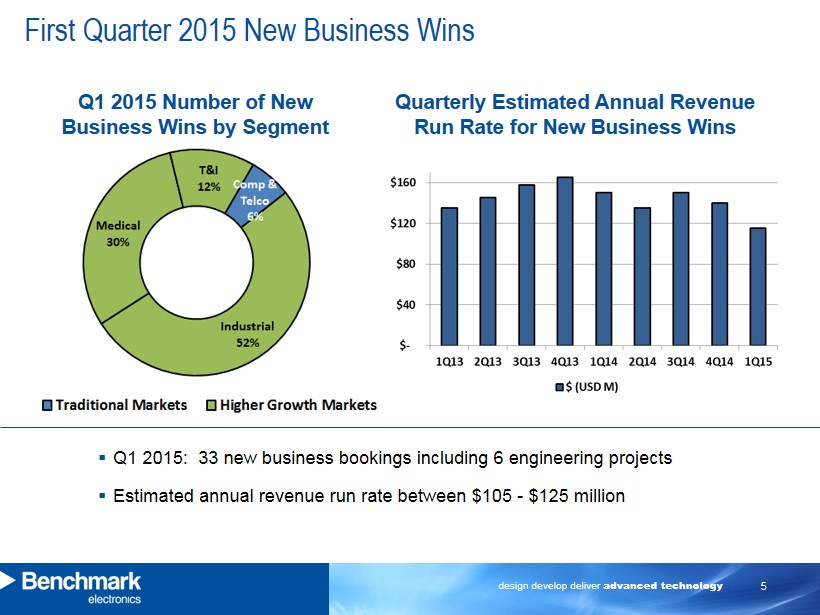
design develop deliver advanced technology 5 First Quarter 2015 New Business Wins Q1 2015 Number of New Business Wins by Segment ▪ Q1 2015: 33 new business bookings including 6 engineering projects ▪ E stimated annual revenue run rate between $105 - $125 million Quarterly Estimated Annual Revenue Run Rate for New Business Wins
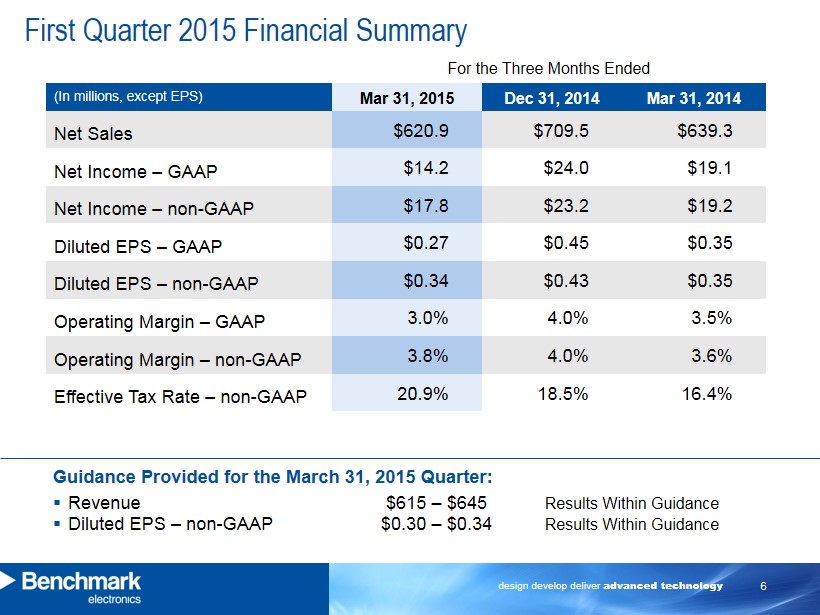
design develop deliver advanced technology 6 First Quarter 2015 Financial Summary (In millions, except EPS) Mar 31, 2015 Dec 31, 2014 Mar 31, 2014 Net Sales $620.9 $709.5 $639.3 Net Income – GAAP $14.2 $24.0 $19.1 Net Income – non - GAAP $17.8 $23.2 $19.2 Diluted EPS – GAAP $0.27 $0.45 $0.35 Diluted EPS – non - GAAP $0.34 $0.43 $0.35 Operating Margin – GAAP 3.0% 4.0% 3.5% Operating Margin – non - GAAP 3.8% 4.0% 3.6% Effective Tax Rate – non - GAAP 20.9% 18.5% 16.4% For the Three Months Ended Guidance Provided for the March 31, 2015 Quarter: ▪ Revenue $615 – $645 Results Within Guidance ▪ Diluted EPS – non - GAAP $0.30 – $0.34 Results Within Guidance
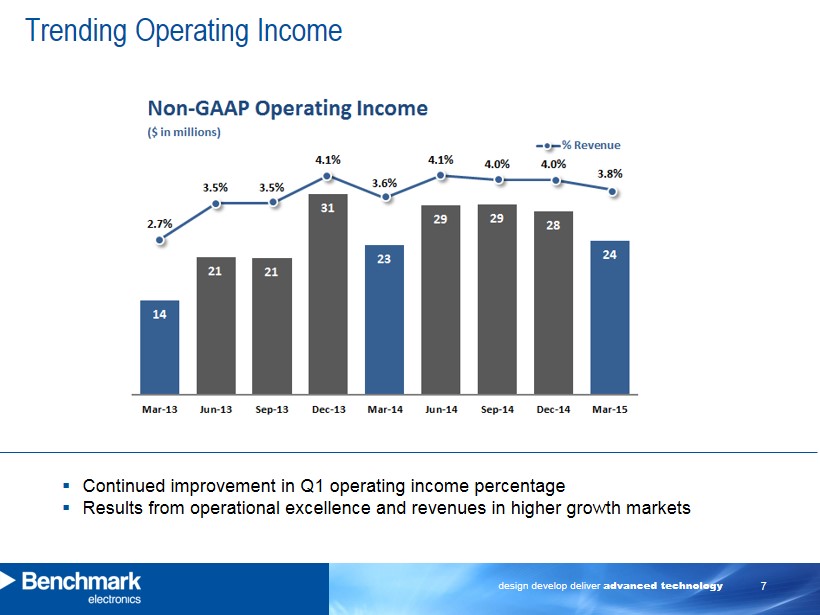
design develop deliver advanced technology 7 Trending Operating Income ▪ Continued improvement in Q1 operating income percentage ▪ Results from operational excellence and revenues in higher growth markets

design develop deliver advanced technology 8 First Quarter Industry Sector Update Revenue by Industry Sector Sector (in millions) Mar 31, 2015 Dec 31, 2014 Mar 31 , 2014 Q1 YoY Industrial Control Equipment 32% $199 32% $230 29% $185 7% Telecommunication Equipment 27% $166 29% $202 27% $170 (2%) Computing 19% $120 20% $143 20% $131 (9%) Medical Devices 13% $81 11% $81 11% $73 11% Testing and Instrumentation 9% $55 8% $54 13% $80 (32%) * Total Revenue $621 $710 $639 Q1 - 2015 Q1 - 2014 *Testing & Instrumentation in Q1 - 14 included a one time project build
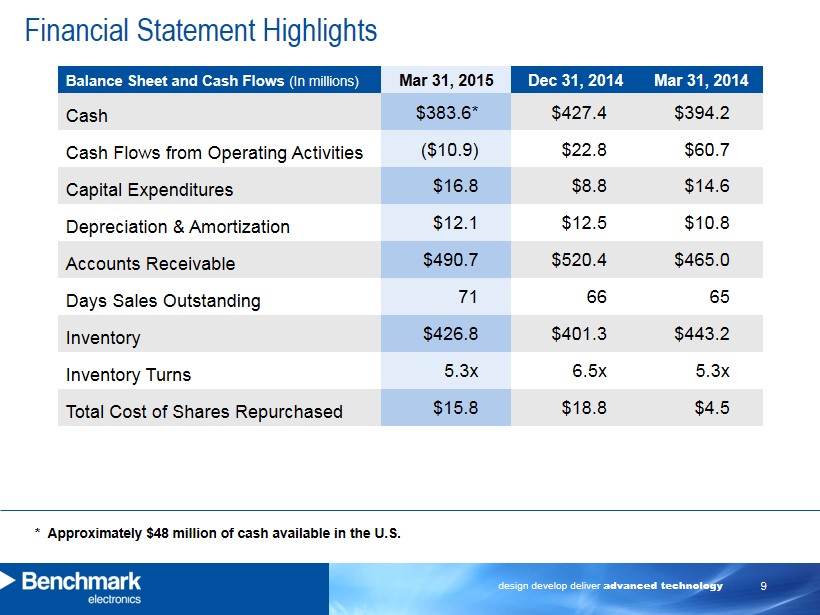
design develop deliver advanced technology 9 Financial Statement Highlights Balance Sheet and Cash Flows (In millions) Mar 31, 2015 Dec 31, 2014 Mar 31, 2014 Cash $383.6* $427.4 $394.2 Cash Flows from Operating Activities ($10.9) $22.8 $60.7 Capital Expenditures $16.8 $8.8 $14.6 Depreciation & Amortization $12.1 $12.5 $10.8 Accounts Receivable $490.7 $520.4 $465.0 Days Sales Outstanding 71 66 65 Inventory $426.8 $401.3 $443.2 Inventory Turns 5.3x 6.5x 5.3x Total Cost of Shares Repurchased $15.8 $18.8 $4.5 * Approximately $48 million of cash available in the U.S.
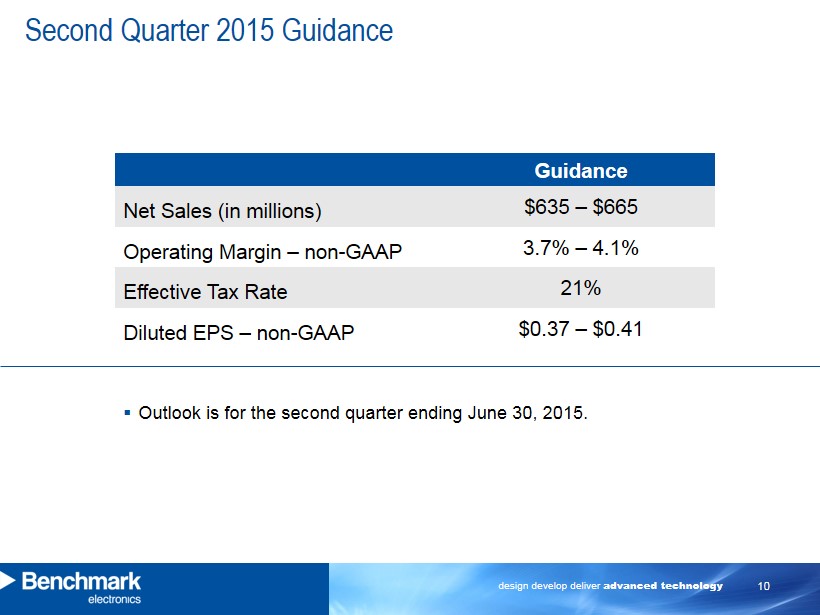
design develop deliver advanced technology 10 Second Quarter 2015 Guidance Guidance Net Sales (in millions) $635 – $665 Operating Margin – non - GAAP 3.7% – 4.1% Effective Tax Rate 21% Diluted EPS – non - GAAP $0.37 – $0.41 ▪ Outlook is for the second quarter ending June 30, 2015.
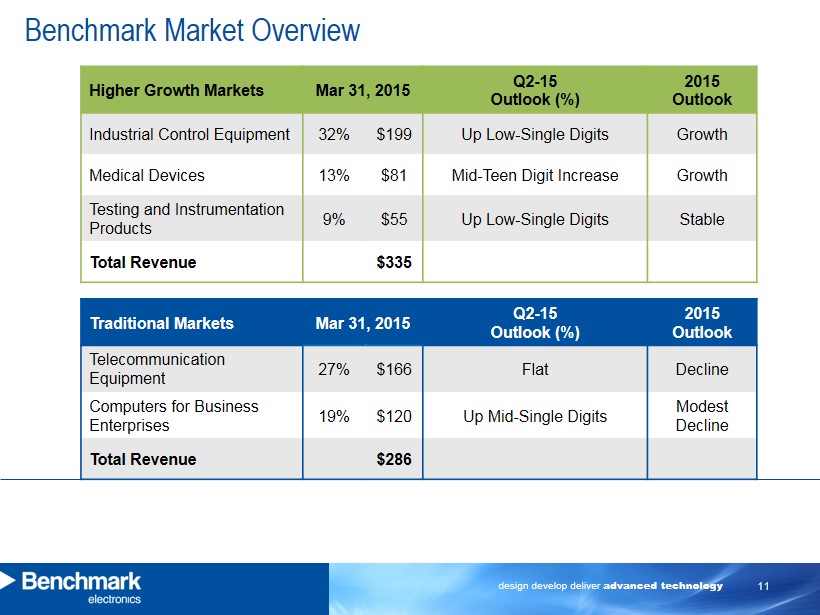
design develop deliver advanced technology 11 Benchmark Market Overview Higher Growth Markets Mar 31 , 2015 Q2 - 15 Outlook (%) 2015 Outlook Industrial Control Equipment 32% $199 Up Low - Single Digits Growth Medical Devices 13% $81 Mid - Teen Digit Increase Growth Testing and Instrumentation Products 9% $55 Up Low - Single Digits Stable Total Revenue $335 Traditional Markets Mar 31, 2015 Q2 - 15 Outlook (%) 2015 Outlook Telecommunication Equipment 27% $166 Flat Decline Computers for Business Enterprises 19% $120 Up Mid - Single Digits Modest Decline Total Revenue $286

design develop deliver advanced technology 12 ▪ Q1 Results – Consistent ▪ Strategic Priorities: o Portfolio Management o Operational Excellence o Customer Focus ▪ Continued Focus on Operating Margin Expansion Summary First Quarter 2015
design develop deliver advanced technology 13 Appendix
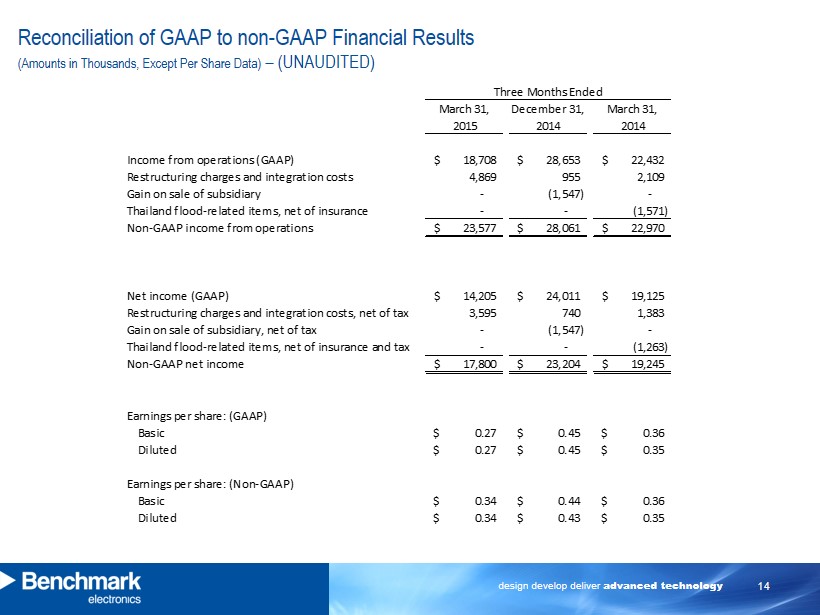
design develop deliver advanced technology 14 Reconciliation of GAAP to non - GAAP Financial Results (Amounts in Thousands, Except Per Share Data) – (UNAUDITED) March 31, December 31, March 31, 2015 2014 2014 18,708$ 28,653$ 22,432$ 4,869 955 2,109 - (1,547) - - - (1,571) 23,577$ 28,061$ 22,970$ 14,205$ 24,011$ 19,125$ 3,595 740 1,383 - (1,547) - - - (1,263) 17,800$ 23,204$ 19,245$ Basic 0.27$ 0.45$ 0.36$ Diluted 0.27$ 0.45$ 0.35$ Basic 0.34$ 0.44$ 0.36$ Diluted 0.34$ 0.43$ 0.35$ Earnings per share: (Non-GAAP) Non-GAAP income from operations Thailand flood-related items, net of insurance and tax Non-GAAP net income Earnings per share: (GAAP) Restructuring charges and integration costs, net of tax Three Months Ended Gain on sale of subsidiary, net of tax Income from operations (GAAP) Net income (GAAP) Thailand flood-related items, net of insurance Restructuring charges and integration costs Gain on sale of subsidiary