Exhibit 99.2
© 2018 Benchmark Electronics, Inc. Benchmark Electronics, Inc. Q1 2019 Earnings April 24, 2019
| 2 © 2018 Benchmark Electronics, Inc. Forward - Looking Statements This document contains forward - looking statements within the meaning of Section 27A of the Securities Act of 1933 and Section 21 E of the Securities Exchange Act of 1934. The words “expect,” “estimate,” “anticipate,” “predict” and similar expressions, and the n egatives thereof, often identify forward - looking statements, which are not limited to historical facts. Forward - looking statements inclu de, among other things: guidance for 2019 results; projected annual revenues resulting from new program bookings; statements , express or implied, concerning future operating results or margins, the ability to generate sales and income or cash flow; and Benchmark ’s business and growth strategies and expected growth and performance. Although Benchmark believes these statements are based upon reasonable assumptions, they involve risks and uncertainties relating to operations, markets and the business environmen t generally. If one or more of these risks or uncertainties materializes, or underlying assumptions prove incorrect , actual outcomes may vary materially from those indicated. Readers are advised to consult further disclosures on these risks and uncertainties, part icularly in Item 1A, “Risk Factors”, of the Company’s Annual Report on Form 10 - K for the year ended December 31, 2018 and in its subsequent filings with the Securities and Exchange Commission. All forward - looking statements included in this document are based upon information available to the Company as of the date of this document, and it assumes no obligation to update them. Non - GAAP Financial Information This document includes certain financial measures that exclude items and therefore are not in accordance with U.S. generally accepted accounting principles (“GAAP”). A detailed reconciliation between GAAP results and results excluding special items (“n on - GAAP”) is included in the Appendix of this document. Management discloses non - GAAP information to provide investors with additional information to analyze the Company’s performance and underlying trends. Management uses non - GAAP measures that exclude certain items in order to better assess operating performance and help investors compare results with our previous guidance. This document also references “free cash flow”, which the Company defines as cash flow from operations less additions to property, plant and equipment and purchased software. The Company’s non - GAAP information is not necessarily comparable to the non - GAAP information used by other companies. Non - GAAP information should not be viewed as a substitute for, or superior to, net income or other data prepared in accordance with GAAP as a measure of the Company’s profitability or liquidity. Readers should consider the types of events and transactions for which adjustments have been made.

| 3 © 2018 Benchmark Electronics, Inc. Implementation of ASC 606 – Revenue from Contracts with Customers Effective January 1, 2018, the Company implemented ASC 606 the accounting standard governing “Revenue from Contracts with Customers” using the full retrospective transition method. Under ASC 606, revenue is recognized as or when the customer obta ins control of the goods or services promised in a contract. Given the nature of the terms and conditions in substantially all o f t he Company’s customer contracts, the Company now recognizes revenue over time (beginning at work - in - process (“WIP”)) for the majori ty of its contracts. All historical financial information represented in this presentation has been adjusted to reflect the retrospective implementation of ASC 606. As part of ASC 606, we are also required to reclassify finished goods and WIP meeting “the over time criteria” from inventory to a new line item called contract assets on the face of the balance sheet. Contract assets are defined as the Company’s right to cons ide ration for work completed but not billed.

| 4 © 2018 Benchmark Electronics, Inc. CEO Perspective Jeff Benck President & Chief Executive Officer ► Began as CEO on March 18, 2019 ► +25 years in technology industry ► Deep experience with products & solutions
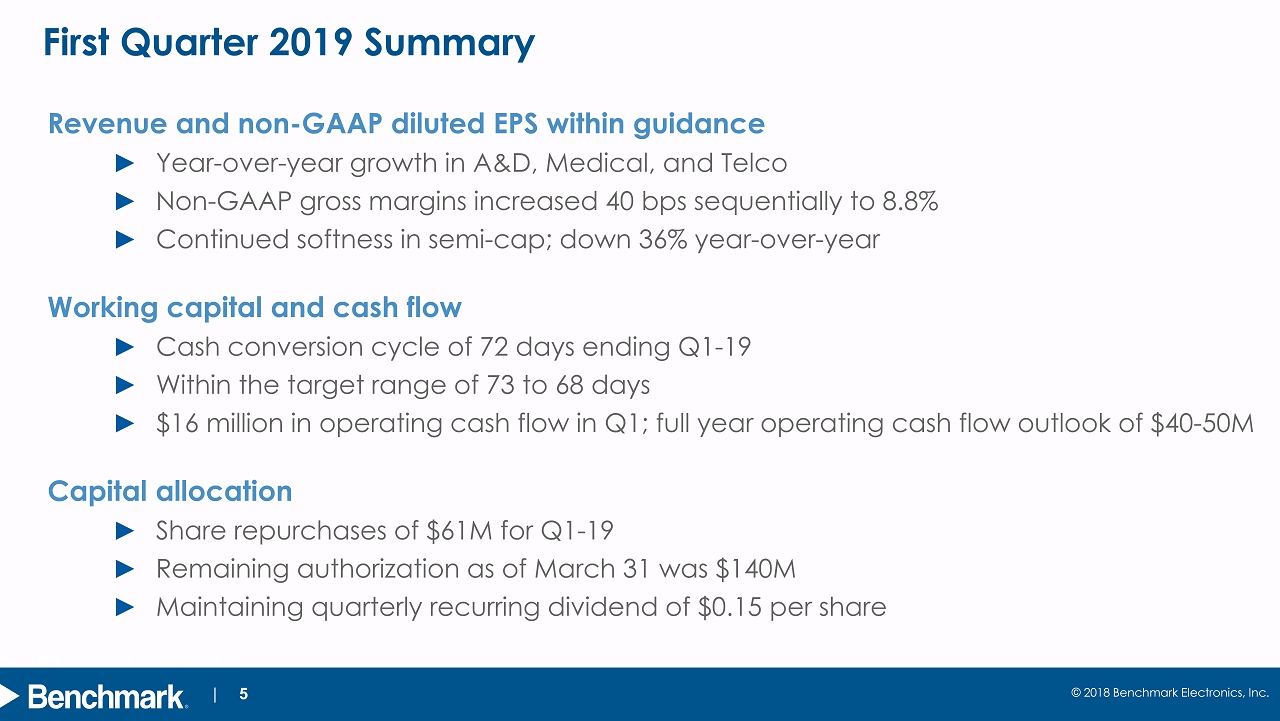
© 2018 Benchmark Electronics, Inc. | 5 First Quarter 2019 Summary Revenue and non - GAAP diluted EPS within g uidance ► Year - over - year growth in A&D, Medical, and Telco ► Non - GAAP gross margins increased 40 bps sequentially to 8.8% ► Continued softness in semi - cap; down 36% year - over - year Working capital and cash flow ► Cash conversion cycle of 7 2 days ending Q1 - 19 ► Within the target range of 73 to 68 days ► $ 16 million in operating cash flow in Q1; full year operating cash flow outlook of $40 - 50M Capital allocation ► Share repurchases of $61M for Q1 - 19 ► Remaining authorization as of March 31 was $140M ► Maintaining quarterly recurring dividend of $0.15 per share
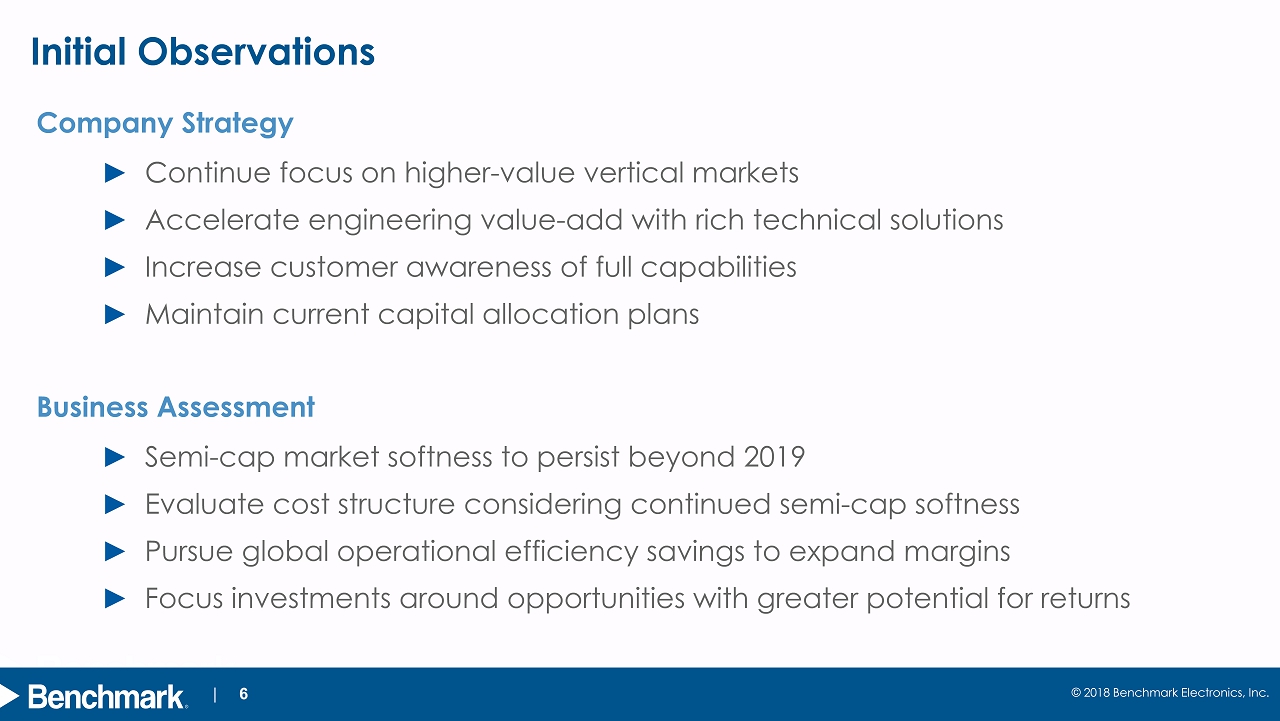
© 2018 Benchmark Electronics, Inc. | 6 Initial Observations Company Strategy ► Continue focus on higher - value vertical markets ► Accelerate engineering value - add with rich technical solutions ► Increase customer awareness of full capabilities ► Maintain current c apital allocation plans Business Assessment ► Semi - cap market softness to persist beyond 2019 ► Evaluate cost structure considering continued semi - cap softness ► Pursue global operational efficiency savings to expand margins ► Focus investments around opportunities with greater potential for returns

© 2018 Benchmark Electronics, Inc. | 7 Focus Areas Optimize Go - to - Market ► Improve customer engagement ► Evaluate organizational alignment and resource deployment ► Increase revenue conversion of new opportunities & reduce program attrition Business Execution and Efficiencies ► Assess overall customer experience ► Accelerate process and tools standardization ► M anufacturing and design transformation efficiencies
| 8 © 2018 Benchmark Electronics, Inc. CFO Updates & Q1 - 19 Financial Highlights Roop Lakkaraju Chief Financial Officer
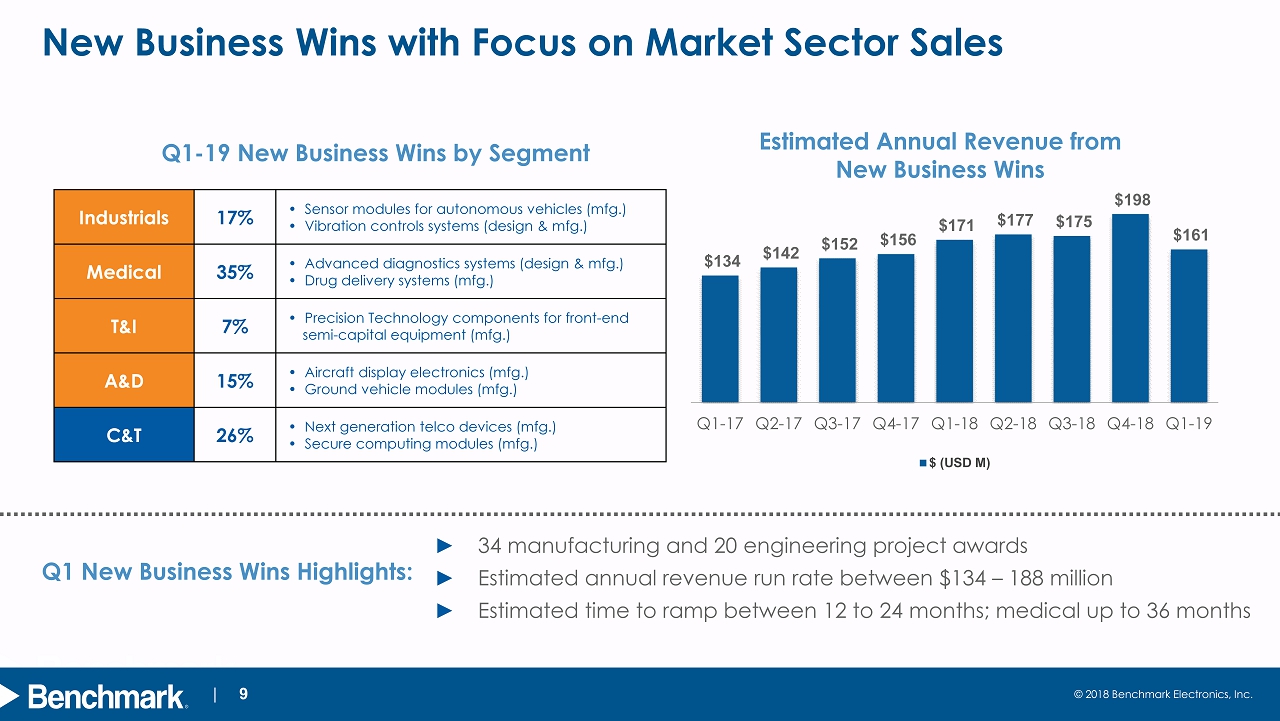
© 2018 Benchmark Electronics, Inc. | 9 New Business Wins with Focus on Market Sector Sales Q1 - 19 New Business Wins by Segment Estimated Annual Revenue from New Business Wins ► 34 manufacturing and 20 engineering project awards ► Estimated annual revenue run rate between $134 – 188 million ► Estimated time to ramp between 12 to 24 months; medical up to 36 months Q1 New Business Wins Highlights: Industrials 17% • Sensor modules for autonomous vehicles ( mfg .) • Vibration controls systems (design & mfg .) Medical 35% • Advanced diagnostics systems (design & mfg .) • Drug delivery systems (mfg .) T&I 7 % • Precision Technology components for front - end semi - capital equipment (mfg.) A&D 15% • Aircraft display electronics (mfg .) • Ground vehicle modules (mfg.) C&T 26% • Next generation telco devices (mfg .) • Secure computing modules (mfg .) $134 $142 $152 $156 $171 $177 $175 $198 $161 $- $10 $20 $30 $40 $50 $60 $70 $80 $90 $100 $110 $120 $130 $140 $150 $160 $170 $180 $190 $200 Q1-17 Q2-17 Q3-17 Q4-17 Q1-18 Q2-18 Q3-18 Q4-18 Q1-19 $ (USD M)

© 2018 Benchmark Electronics, Inc. | 10 First Quarter 2019 Financial Summary For the Three Months Ended (In millions, except EPS) Mar. 31 , 2019 Dec. 31 , 2018 Q/Q Mar. 31 , 2018 Y/Y Net Sales $603 $657 (8%) $608 (1%) GAAP Operating Margin 2.7% 2.3% 40 bps 3.0% (30 bps) GAAP Diluted EPS $0.34 $0.64 (47%) ($0.49) 170% Non - GAAP Operating Margin 2.9% 3.2% (30 bps) 3.7% (80 bps) Non - GAAP Diluted EPS $0.33 $0.41 (21%) $0.41 (20%) GAAP ROIC 5.7% 6.2% (50 bps) 9.1% (340 bps) Non - GAAP ROIC 8.3% 9.2% (90 bps) 11.2% (290 bps) See APPENDIX 1 for a reconciliation of GAAP to non - GAAP Financial Results Our Guidance for the First Quarter: ► Revenue (in millions) $570 – $610 ► Diluted EPS – non - GAAP $0.29 – $0.37

© 2018 Benchmark Electronics, Inc. | 11 Higher - Value Markets Mar. 31 , 2019 Dec. 31 , 2018 Q/Q Industrials 20% $116 18% $121 (4%) Aerospace & Defense 17% $104 16% $105 (1%) Medical 17% $103 16% $104 -- Test & Instrument. 11% $66 11% $70 (5%) Total Revenue $389 $400 (3%) Revenue by Market Sector (1) In millions Traditional Markets Mar. 31 , 2019 Dec. 31 , 2018 Q/Q Computing 21% $124 26% $171 (27%) Telecommunication s 14% $90 13% $86 4% Total Revenue $214 $257 (17%) Mar. 31 , 2018 Y/Y 17% $103 20% 14% $83 7% $186 14% For the Three Months Ended Mar. 31 , 2018 Y/Y 20% $125 (8%) 16% $98 8% 16% $97 7% 17% $102 (36%) $422 (8%) (1) (1) (1) (1) (1) (1)

© 2018 Benchmark Electronics, Inc. | 12 GAAP Key Business Trends Return on Invested Capital (LTM) Operating Margin ($M) SG&A ($M) Revenue & Gross Margin ($ M ) NOPAT Inv. Capital 18.0 14.3 11.0 15.3 16.1 3.0% 2.2% 1.7% 2.3% 2.7% 0.0% 1.0% 2.0% 3.0% 4.0% 5.0% 6.0% 7.0% 0.0 10.0 20.0 30.0 40.0 50.0 60.0 Q1-18 Q2-18 Q3-18 Q4-18 Q1-19 35.7 35.8 37.6 34.0 33.8 5.9% 5.4% 5.9% 5.2% 5.6% 0.0% 1.0% 2.0% 3.0% 4.0% 5.0% 6.0% 7.0% 8.0% 0.0 10.0 20.0 30.0 40.0 50.0 60.0 70.0 Q1-18 Q2-18 Q3-18 Q4-18 Q1-19 608 661 641 657 603 9.6% 8.2% 8.2% 8.4% 8.9% 1.0% 3.0% 5.0% 7.0% 9.0% 11.0% 13.0% 15.0% 0 200 400 600 800 1,000 1,200 1,400 Q1-18 Q2-18 Q3-18 Q4-18 Q1-19 GAAP ROIC = ( GAAP TTM income from operations – GAAP Tax Impact ) · (Average Invested Capital for last 5 quarters) 850 848 848 829 835 77 70 59 51 47 9.1% 8.2% 7.0% 6.2% 5.7% -25.0% -20.0% -15.0% -10.0% -5.0% 0.0% 5.0% 10.0% 15.0% 20.0% 0 200 400 600 800 1000 1200 1400 1600 1800 2000 Q1-18 Q2-18 Q3-18 Q4-18 Q1-19

© 2018 Benchmark Electronics, Inc. | 13 Non - GAAP Key Business Trends Operating Margin ($M) SG&A ($M) Revenue & Gross Margin ($ M ) NOPAT Inv. Capital Non - GAAP ROIC = (Non - GAAP TTM income from operations – Non - GAAP Tax Impact) · [Average Invested Capital for last 5 quarters] (1) Excludes the impact of customer insolvency. 35.7 35.8 35.9 34.0 35.5 5.9% 5.4% 5.6% 5.2% 5.9% 0.0% 1.0% 2.0% 3.0% 4.0% 5.0% 6.0% 7.0% 8.0% 9.0% 0.0 10.0 20.0 30.0 40.0 50.0 60.0 70.0 Q1-18 Q2-18 Q3-18 Q4-18 Q1-19 (1) (1) 608 661 641 657 603 9.5% 8.2% 8.5% 8.4% 8.8% 10.1% 9.2% 9.3% 9.5% 9.4% -1.0% 1.0% 3.0% 5.0% 7.0% 9.0% 11.0% 13.0% 15.0% 0 200 400 600 800 1,000 1,200 1,400 Q1-18 Q2-18 Q3-18 Q4-18 Q1-19 As Reported W/O Legacy Computing Contract (1) (1) 22.2 18.1 18.5 21.1 17.3 3.7% 2.7% 2.9% 3.2% 2.9% 0.0% 1.0% 2.0% 3.0% 4.0% 5.0% 6.0% 7.0% 0.0 10.0 20.0 30.0 40.0 50.0 60.0 Q1-18 Q2-18 Q3-18 Q4-18 Q1-19 (1) (1) 850 848 848 829 835 95 89 83 76 70 11.2% 10.5% 9.8% 9.2% 8.3% -50.0% -40.0% -30.0% -20.0% -10.0% 0.0% 10.0% 20.0% 0 200 400 600 800 1000 1200 1400 1600 1800 Q1-18 Q2-18 Q3-18 Q4-18 Q1-19 Return on Invested Capital (LTM) (1) (1) (1) (1) (1) (1) (1) (1) (1) (1) (1) (1) (1) (1)
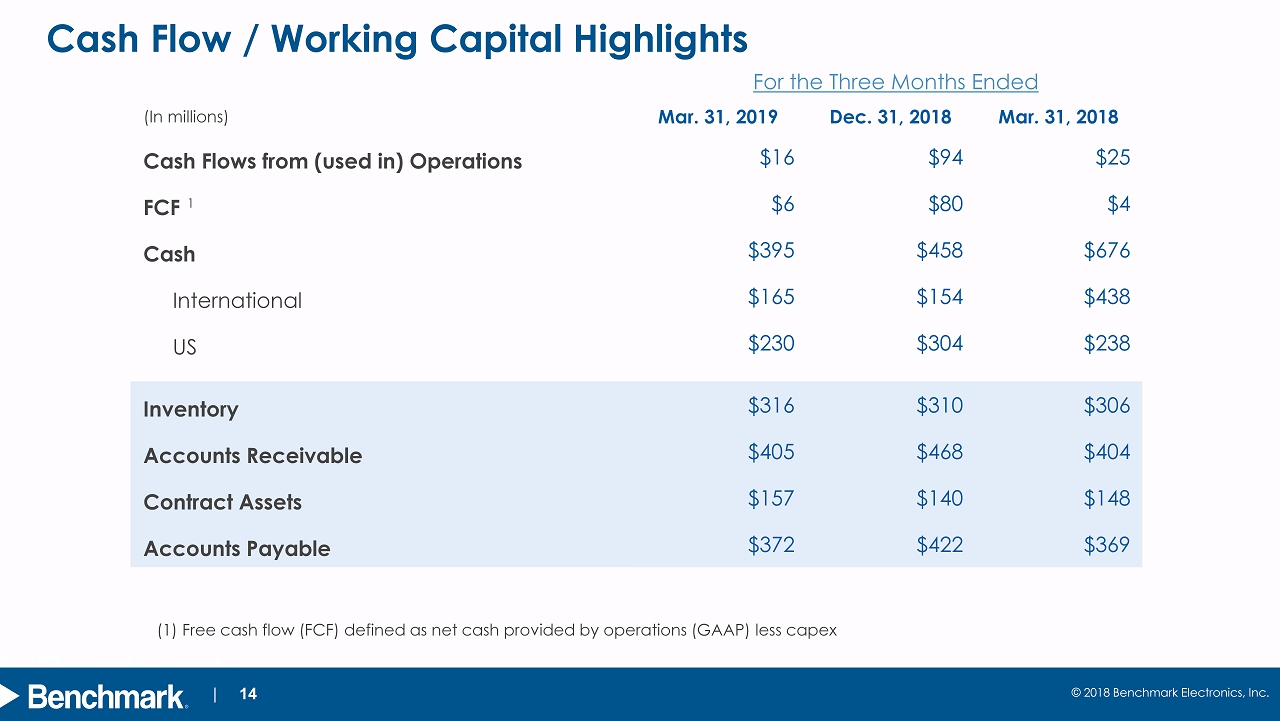
© 2018 Benchmark Electronics, Inc. | 14 Cash Flow / Working Capital Highlights (1) Free cash flow (FCF) defined as net cash provided by operations (GAAP) less capex (In millions) Mar. 31 , 2019 Dec. 31 , 2018 Mar. 31 , 2018 Cash Flows from (used in) Operations $16 $94 $25 FCF $6 $80 $4 Cash $395 $458 $676 International $165 $154 $438 US $230 $304 $238 Inventory $316 $310 $306 Accounts Receivable $405 $468 $404 Contract Assets $157 $140 $148 Accounts Payable $372 $422 $369 For the Three Months Ended 1
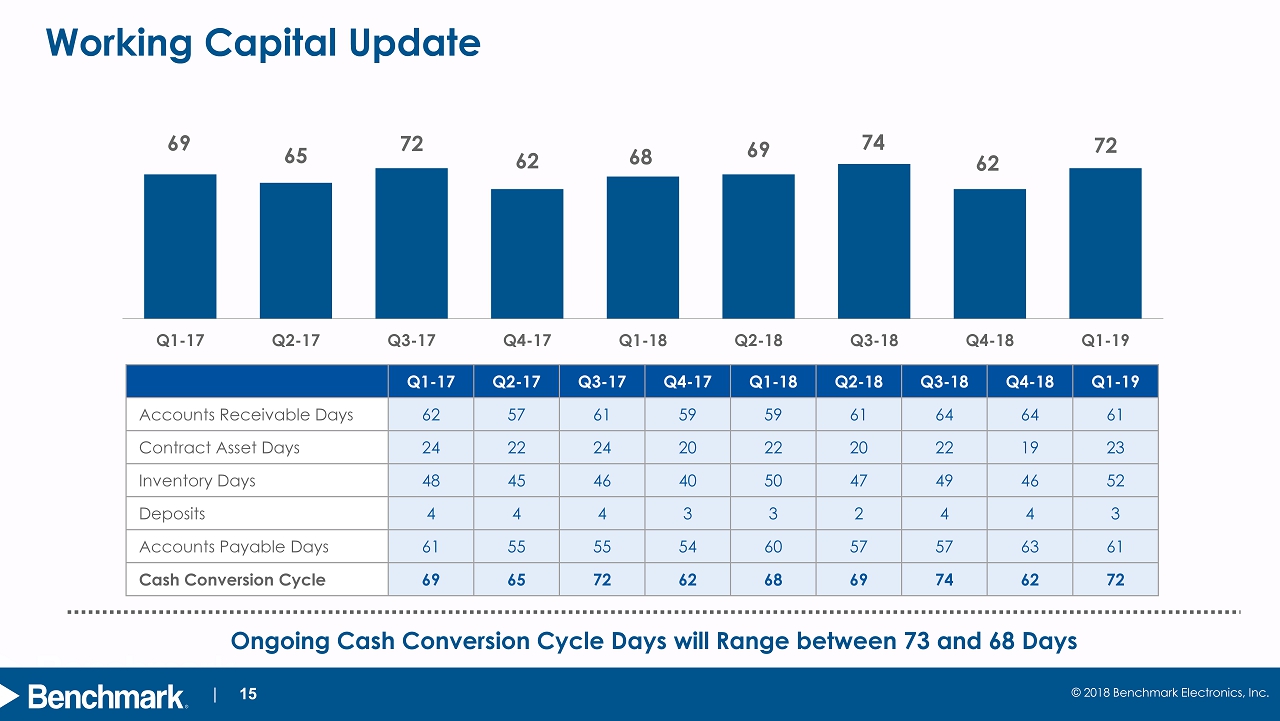
© 2018 Benchmark Electronics, Inc. | 15 Working Capital Update Ongoing Cash Conversion Cycle Days will Range between 73 and 68 Days Q1 - 17 Q2 - 17 Q3 - 17 Q4 - 17 Q1 - 18 Q2 - 18 Q3 - 18 Q4 - 18 Q1 - 19 Accounts Receivable Days 62 57 61 59 59 61 64 64 61 Contract Asset Days 24 22 24 20 22 20 22 19 23 Inventory Days 48 45 46 40 50 47 49 46 52 Deposits 4 4 4 3 3 2 4 4 3 Accounts Payable Days 61 55 55 54 60 57 57 63 61 Cash Conversion Cycle 69 65 72 62 68 69 74 62 72 69 65 72 62 68 69 74 62 72 0 20 40 60 80 100 120 Q1-17 Q2-17 Q3-17 Q4-17 Q1-18 Q2-18 Q3-18 Q4-18 Q1-19
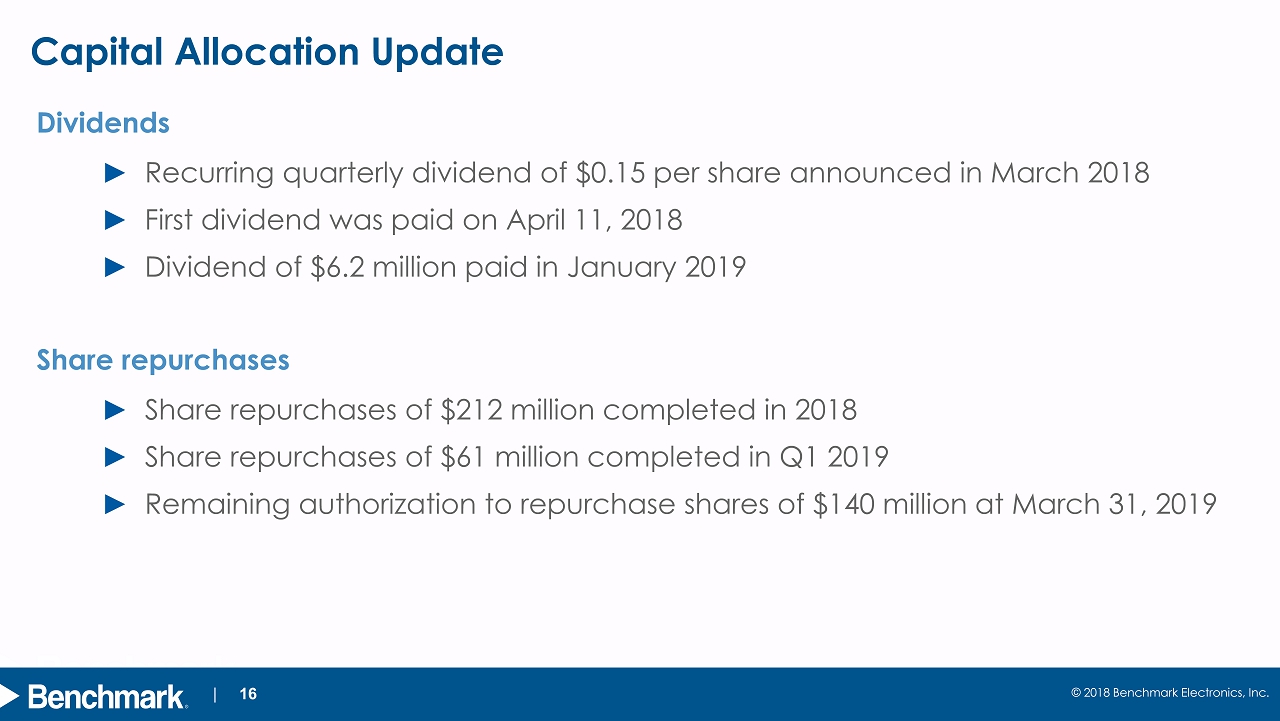
© 2018 Benchmark Electronics, Inc. | 16 Capital Allocation Update Dividends ► Recurring quarterly dividend of $0.15 per share announced in March 2018 ► First dividend was paid on April 11, 2018 ► Dividend of $6.2 million paid in January 2019 Share repurchases ► Share repurchases of $212 million completed in 2018 ► Share repurchases of $61 million completed in Q1 2019 ► Remaining authorization to repurchase shares of $140 million at March 31, 2019
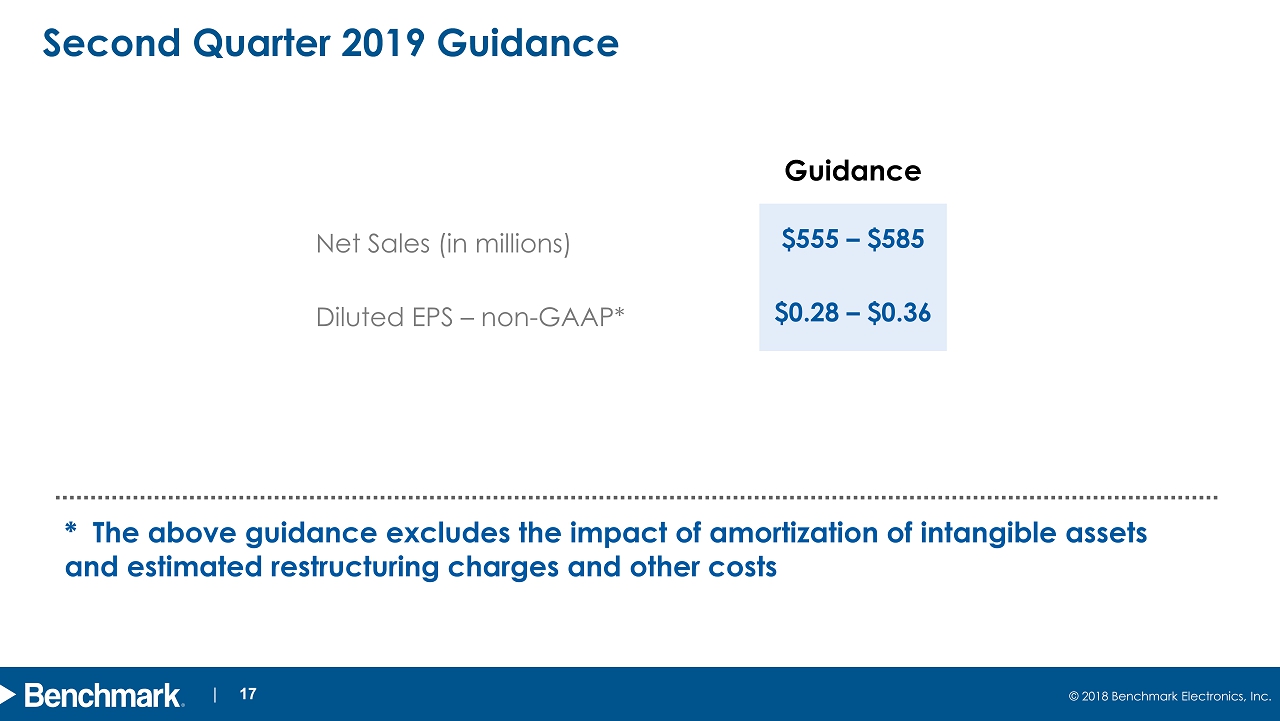
© 2018 Benchmark Electronics, Inc. | 17 Second Quarter 2019 Guidance * The above guidance excludes the impact of amortization of intangible assets and estimated restructuring charges and other costs Guidance Net Sales (in millions) $555 – $585 Diluted EPS – non - GAAP* $0.28 – $0.36

© 2018 Benchmark Electronics, Inc. | 18 Sequential Modeling Information ( Including Legacy Computing Contract) Higher - Value Markets Q2 - 19 Outlook (%) Industrials Flat Aerospace & Defense Up High Singles Medical Up Mid Singles Test & Instrumentation Down Mid Doubles Traditional Markets Q2 - 19 Outlook (%) Computing Down Low Doubles Telecommunication s Down >20% Q2 - 19 Guidance Operating Margin - non - GAAP * 2.5% – 3.1% Interest Expense (in millions) $1.9 Effective Tax Rate 20% Weighted Average Shares (m) 39.0 * The above guidance excludes the impact of amortization of intangible assets and estimated restructuring charges and other costs
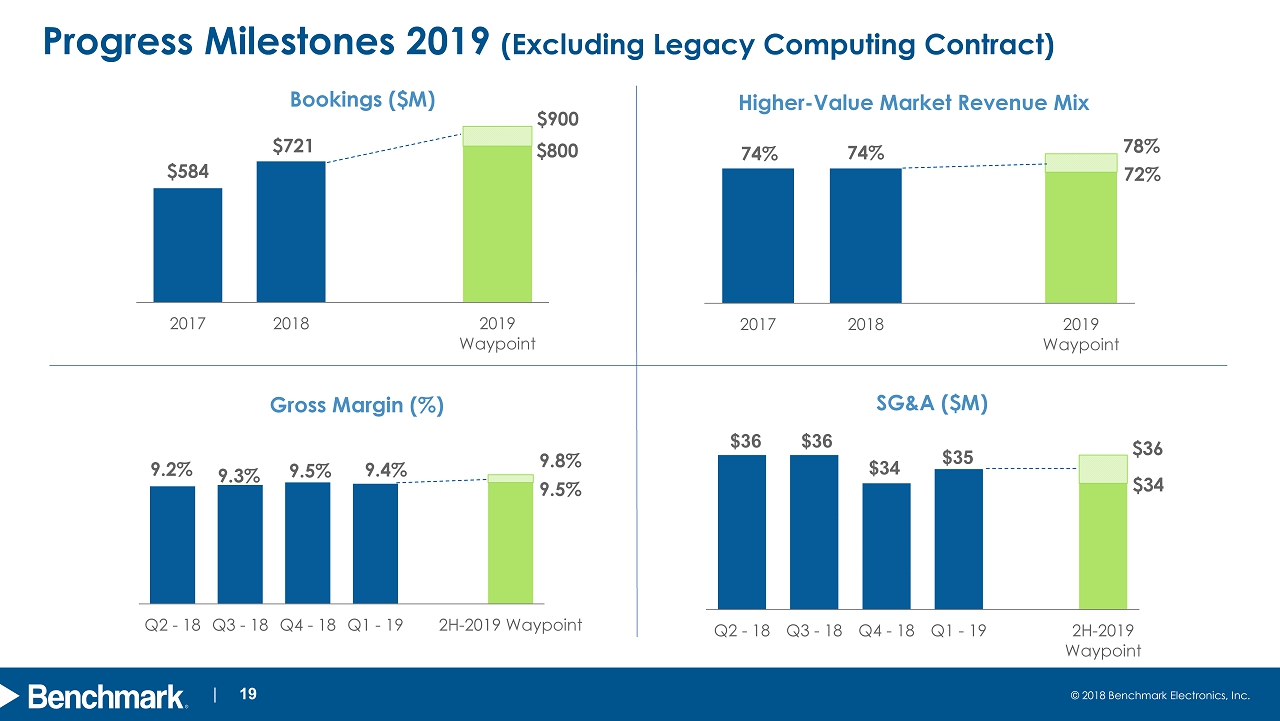
© 2018 Benchmark Electronics, Inc. | 19 $584 $721 2017 2018 2019 Waypoint 74% 74% 0% 10% 20% 30% 40% 50% 60% 70% 80% 90% 100% 2017 2018 2019 Waypoint $36 $36 $34 $35 $25 $27 $29 $31 $33 $35 $37 $39 Q2 - 18 Q3 - 18 Q4 - 18 Q1 - 19 2H-2019 Waypoint 9.2% 9.3% 9.5% 9.4% -1.0% 1.0% 3.0% 5.0% 7.0% 9.0% 11.0% 13.0% 15.0% Q2 - 18 Q3 - 18 Q4 - 18 Q1 - 19 2H-2019 Waypoint Progress Milestones 2019 (Excluding Legacy Computing Contract) SG&A ($M) Gross Margin (%) Higher - Value Market Revenue Mix Bookings ($ M ) $900 $34 72% 9.8% $800 78% $36 9.5%

| 20 © 2018 Benchmark Electronics, Inc. Appendix
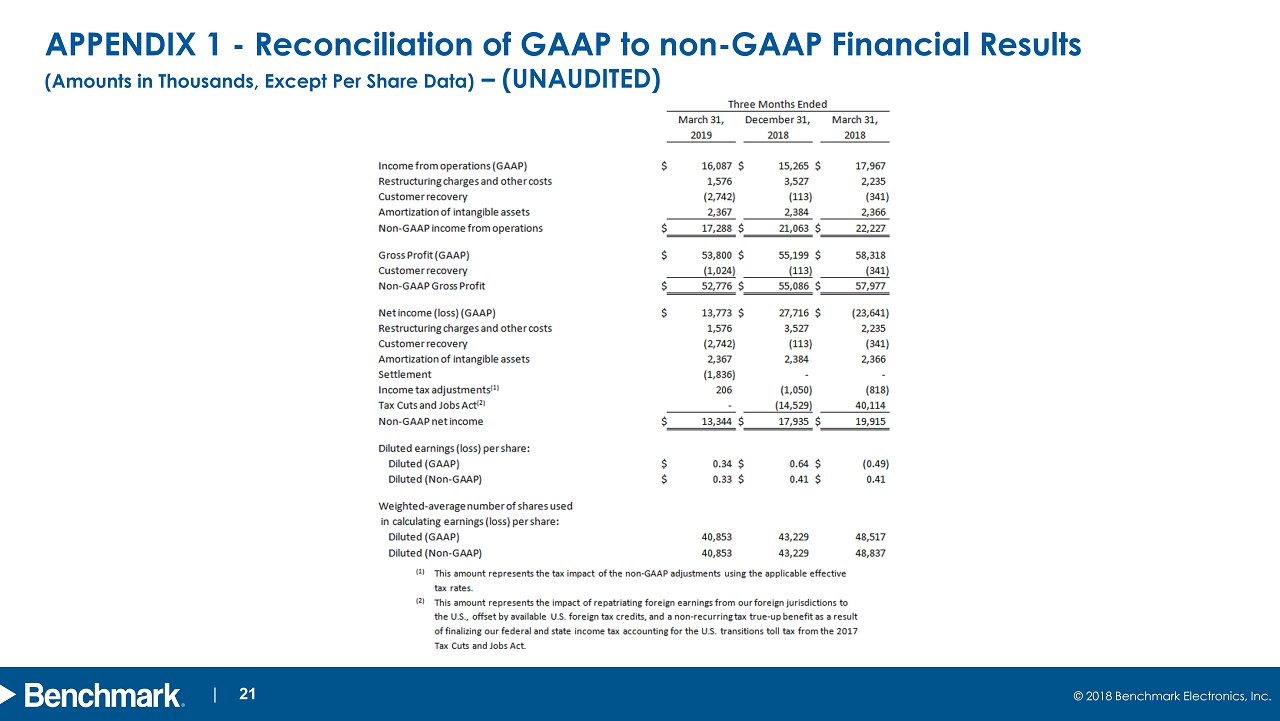
design develop deliver advanced technology 21 © 2018 Benchmark Electronics, Inc. | 21 APPENDIX 1 - Reconciliation of GAAP to non - GAAP Financial Results (Amounts in Thousands, Except Per Share Data) – (UNAUDITED)

design develop deliver advanced technology 22 © 2018 Benchmark Electronics, Inc. | 22 APPENDIX 2 - Reconciliation of GAAP to non - GAAP Financial Measures (Amounts in Thousands, Except Per Share Data) – (UNAUDITED) Mar 31, 2019 Dec 31, 2018 Mar 31, 2018 GAAP gross profit 53,800$ 55,199$ 58,318$ Customer Insolvency (recovery) (1,024) (113) (341) Non-GAAP gross profit 52,776$ 55,086$ 57,977$ GAAP SG&A Expenses 33,770$ 34,023$ 35,750$ Customer Insolvency (recovery) (1,718) - - Non-GAAP SG&A Expenses 35,488$ 34,023$ 35,750$ Three Months Ended

design develop deliver advanced technology 23 © 2018 Benchmark Electronics, Inc. | 23 APPENDIX 3 - Reconciliation of Free Cash Flow (Amounts in Thousands, Except Per Share Data) – (UNAUDITED) Mar 31, 2019 Dec 31, 2018 Mar 31, 2018 Net Cash provided by Operations 16,414$ 93,980$ 24,530$ Additions to property, plant and equipment and software (10,074) (13,799) (20,877) Free Cash Flow 6,340$ 80,181$ 3,653$ Three Months Ended

design develop deliver advanced technology 24 © 2018 Benchmark Electronics, Inc. | 24 $2,169 $2,243 2017 2018 With Legacy Computing Contract Without Legacy Computing Contract ► $280 - $320M annual Impact ► ~3.5% growth without legacy Computing contract Appendix 4: Reminder - Impact of Legacy Computing Contract $2,454 9.2% 8.6% 2017 2018 Without Legacy Computing Contract With Legacy Computing Contract 10.1% 9.5% ► 80 to 90 bps favorable annual impact without legacy Computing contract $2,566 Revenue (M$) Gross Margin % ► Legacy Computing contract that expires Dec. 31, 2019 will not be renewed in its current form ► Recent historical revenue impact in the range of $280M - $320M per year ► Resulting annual improvement in gross margin will be 80 to 90 basis points ► During the transition in 2019, we will discuss results with and without this contract

design develop deliver advanced technology 25 © 2018 Benchmark Electronics, Inc. | 25 Appendix 5: 2020 Modeling Information to Reflect Expiration of Legacy Computing Contract in 2019 Traditional Markets 2020 Outlook Computing Revenue Down $280 - $320M 2020 Outlook Gross Margin - non - GAAP * Up 80 to 90 bps * The above guidance excludes the impact of amortization of intangible assets and estimated restructuring charges and other costs