Exhibit 99.2
© 2018 Benchmark Electronics, Inc. Benchmark Electronics, Inc. Q3 2019 Earnings October 24, 2019
| 2 © 2018 Benchmark Electronics, Inc. Forward - Looking Statements This document contains forward - looking statements within the meaning of Section 27A of the Securities Act of 1933 and Section 21 E of the Securities Exchange Act of 1934. The words “expect,” “estimate,” “anticipate,” “predict” and similar expressions, and the n egatives thereof, often identify forward - looking statements, which are not limited to historical facts. Forward - looking statements inclu de, among other things: guidance for 2019 results; projected annual revenues resulting from new program bookings; statements , express or implied, concerning future operating results or margins, the ability to generate sales and income or cash flow; and Benchmark ’s business and growth strategies and expected growth and performance. Although Benchmark believes these statements are based upon reasonable assumptions, they involve risks and uncertainties relating to operations, markets and the business environmen t generally. If one or more of these risks or uncertainties materializes, or underlying assumptions prove incorrect , actual outcomes may vary materially from those indicated. Readers are advised to consult further disclosures on these risks and uncertainties, part icularly in Item 1A, “Risk Factors”, of the Company’s Annual Report on Form 10 - K for the year ended December 31, 2018 and in its subsequent filings with the Securities and Exchange Commission. All forward - looking statements included in this document are based upon information available to the Company as of the date of this document, and it assumes no obligation to update them. Non - GAAP Financial Information This document includes certain financial measures that exclude items and therefore are not in accordance with U.S. generally accepted accounting principles (“GAAP”). A detailed reconciliation between GAAP results and results excluding special items (“n on - GAAP”) is included in the Appendix of this document. Management discloses non - GAAP information to provide investors with additional information to analyze the Company’s performance and underlying trends. Management uses non - GAAP measures that exclude certain items in order to better assess operating performance and help investors compare results with our previous guidance. This document also references “free cash flow”, which the Company defines as cash flow from operations less additions to property, plant and equipment and purchased software. The Company’s non - GAAP information is not necessarily comparable to the non - GAAP information used by other companies. Non - GAAP information should not be viewed as a substitute for, or superior to, net income or other data prepared in accordance with GAAP as a measure of the Company’s profitability or liquidity. Readers should consider the types of events and transactions for which adjustments have been made.
| 3 © 2018 Benchmark Electronics, Inc. CEO Perspective Jeff Benck President & Chief Executive Officer
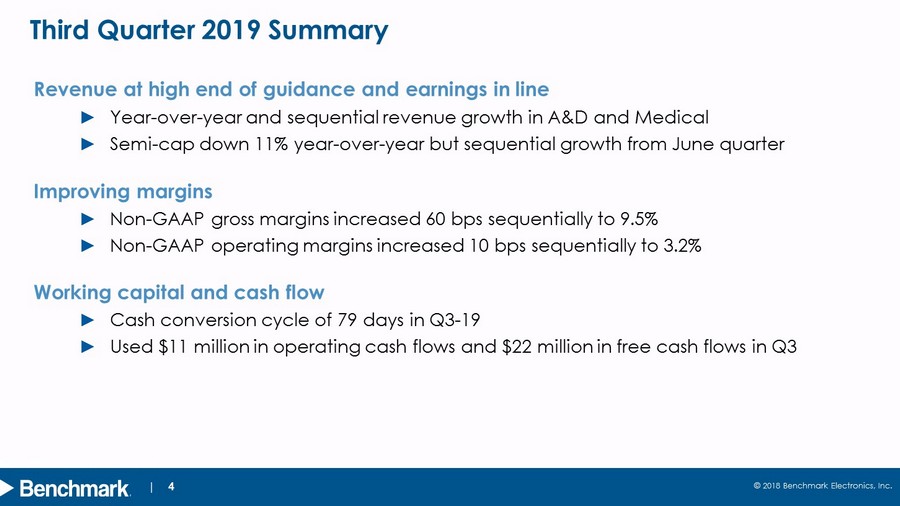
© 2018 Benchmark Electronics, Inc. | 4 Third Quarter 2019 Summary Revenue at high end of guidance and earnings in line ► Year - over - year and sequential revenue growth in A&D and Medical ► Semi - cap down 11% year - over - year but sequential growth from June quarter Improving margins ► Non - GAAP gross margins increased 60 bps sequentially to 9.5 % ► Non - GAAP operating margins increased 10 bps sequentially to 3.2% Working capital and cash flow ► Cash conversion cycle of 79 days in Q3 - 19 ► Used $11 million in operating cash flows and $22 million in free cash flows in Q3
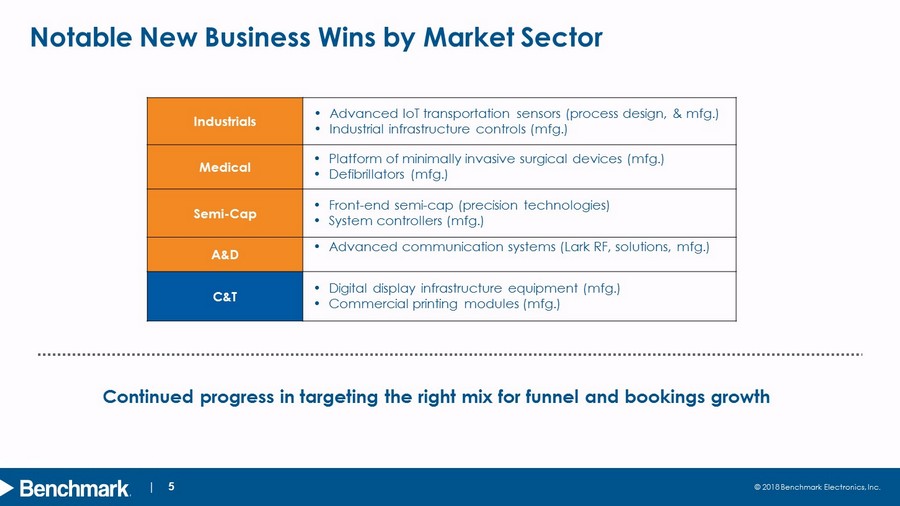
© 2018 Benchmark Electronics, Inc. | 5 Notable New Business Wins by Market Sector Industrials • Advanced IoT transportation sensors (process design, & mfg.) • Industrial infrastructure controls (mfg.) Medical • Platform of minimally invasive surgical devices (mfg .) • Defibrillator s (mfg .) Semi - Cap • Front - end semi - cap (precision technologies) • System controllers (mfg.) A&D • Advanced communication systems (Lark RF, solutions, mfg.) C&T • Digital display infrastructure equipment (mfg .) • Commercial printing modules (mfg .) Continued progress in targeting the right mix for funnel and bookings growth
| 6 © 2018 Benchmark Electronics, Inc. CFO Updates & Q3 - 19 Financial Highlights Roop Lakkaraju Chief Financial Officer
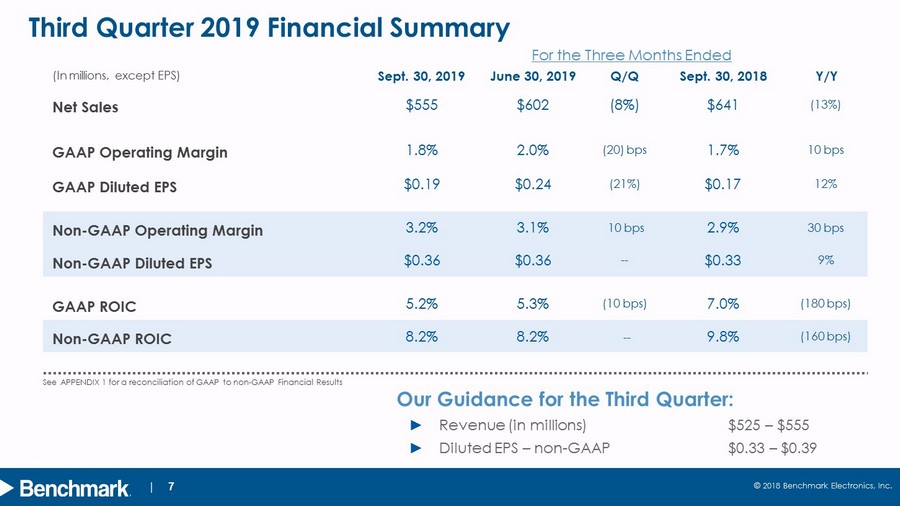
© 2018 Benchmark Electronics, Inc. | 7 Third Quarter 2019 Financial Summary For the Three Months Ended (In millions, except EPS) Sept. 30 , 2019 June 30 , 2019 Q/Q Sept. 30 , 2018 Y/Y Net Sales $555 $602 (8%) $641 (13%) GAAP Operating Margin 1.8% 2.0% (20) bps 1.7% 10 bps GAAP Diluted EPS $0.19 $0.24 (21%) $0.17 12% Non - GAAP Operating Margin 3.2% 3.1% 10 bps 2.9% 30 bps Non - GAAP Diluted EPS $0.36 $0.36 -- $0.33 9% GAAP ROIC 5.2% 5.3% (10 bps) 7.0% ( 180 bps) Non - GAAP ROIC 8.2% 8.2% -- 9.8% ( 160 bps) See APPENDIX 1 for a reconciliation of GAAP to non - GAAP Financial Results Our Guidance for the Third Quarter: ► Revenue (in millions) $525 – $ 555 ► Diluted EPS – non - GAAP $0.33 – $0.39
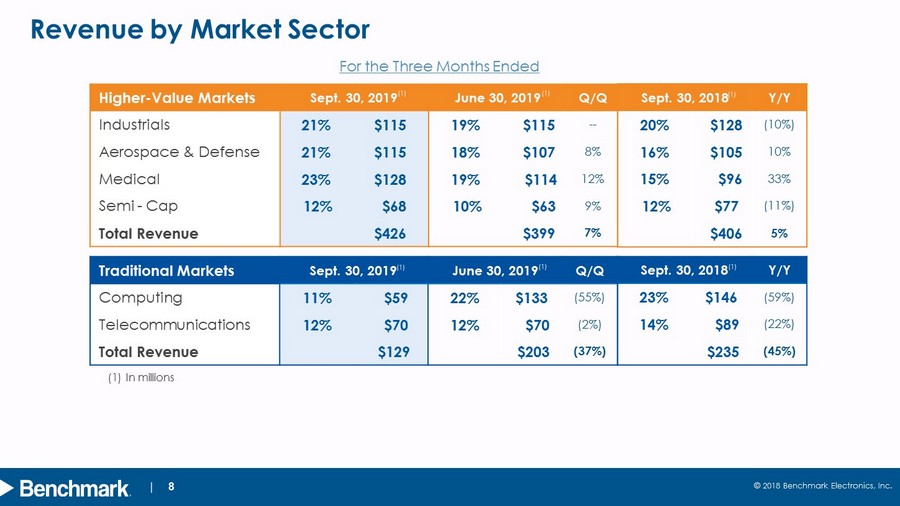
© 2018 Benchmark Electronics, Inc. | 8 Higher - Value Markets Sept. 30 , 2019 June 30 , 2019 Q/Q Industrials 21% $115 19% $115 -- Aerospace & Defense 21% $115 18% $107 8% Medical 23% $128 19% $114 12% Semi - Cap 12% $68 10% $63 9% Total Revenue $426 $399 7% Revenue by Market Sector (1) In millions Traditional Markets Sept. 30 , 2019 June 30 , 2019 Q/Q Computing 11% $59 22% $133 (55%) Telecommunication s 12% $70 12% $70 (2%) Total Revenue $129 $203 (37%) Sept. 30 , 2018 Y/Y 23% $146 (59%) 14% $89 (22%) $235 (45%) For the Three Months Ended Sept. 30 , 2018 Y/Y 20% $128 (10%) 16% $105 10% 15% $96 33% 12% $77 (11%) $406 5% (1) (1) (1) (1) (1) (1)
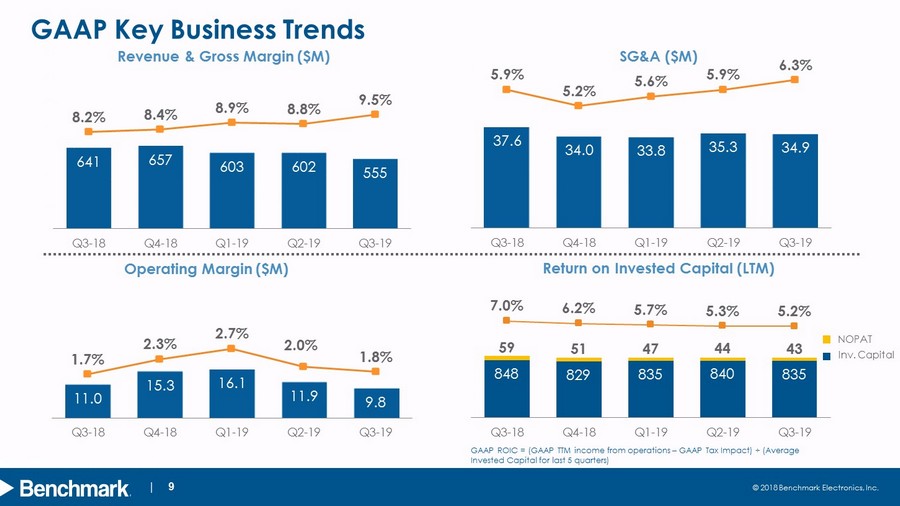
© 2018 Benchmark Electronics, Inc. | 9 GAAP Key Business Trends Return on Invested Capital (LTM) Operating Margin ($M) SG&A ($M) Revenue & Gross Margin ($ M ) NOPAT Inv. Capital 11.0 15.3 16.1 11.9 9.8 1.7% 2.3% 2.7% 2.0% 1.8% 0.0% 1.0% 2.0% 3.0% 4.0% 5.0% 6.0% 7.0% 0.0 10.0 20.0 30.0 40.0 50.0 60.0 Q3-18 Q4-18 Q1-19 Q2-19 Q3-19 37.6 34.0 33.8 35.3 34.9 5.9% 5.2% 5.6% 5.9% 6.3% 0.0% 1.0% 2.0% 3.0% 4.0% 5.0% 6.0% 7.0% 8.0% 0.0 10.0 20.0 30.0 40.0 50.0 60.0 70.0 Q3-18 Q4-18 Q1-19 Q2-19 Q3-19 641 657 603 602 555 8.2% 8.4% 8.9% 8.8% 9.5% 1.0% 3.0% 5.0% 7.0% 9.0% 11.0% 13.0% 15.0% 0 200 400 600 800 1,000 1,200 1,400 Q3-18 Q4-18 Q1-19 Q2-19 Q3-19 GAAP ROIC = ( GAAP TTM income from operations – GAAP Tax Impact ) · (Average Invested Capital for last 5 quarters) 848 829 835 840 835 59 51 47 44 43 7.0% 6.2% 5.7% 5.3% 5.2% -25.0% -20.0% -15.0% -10.0% -5.0% 0.0% 5.0% 10.0% 15.0% 20.0% 0 200 400 600 800 1000 1200 1400 1600 1800 2000 Q3-18 Q4-18 Q1-19 Q2-19 Q3-19
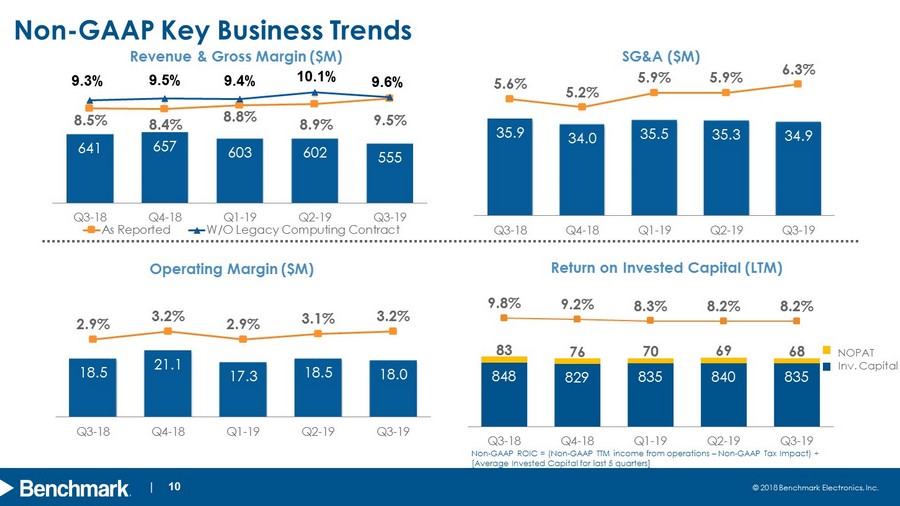
design develop deliver advanced technology 10 © 2018 Benchmark Electronics, Inc. | 10 Non - GAAP Key Business Trends Operating Margin ($M) SG&A ($M) Revenue & Gross Margin ($ M ) NOPAT Inv. Capital Non - GAAP ROIC = (Non - GAAP TTM income from operations – Non - GAAP Tax Impact) · [Average Invested Capital for last 5 quarters] 35.9 34.0 35.5 35.3 34.9 5.6% 5.2% 5.9% 5.9% 6.3% 0.0% 1.0% 2.0% 3.0% 4.0% 5.0% 6.0% 7.0% 8.0% 9.0% 0.0 10.0 20.0 30.0 40.0 50.0 60.0 70.0 Q3-18 Q4-18 Q1-19 Q2-19 Q3-19 641 657 603 602 555 8.5% 8.4% 8.8% 8.9% 9.5% 9.3% 9.5% 9.4% 10.1% 9.6% -1.0% 1.0% 3.0% 5.0% 7.0% 9.0% 11.0% 13.0% 15.0% 0 200 400 600 800 1,000 1,200 1,400 Q3-18 Q4-18 Q1-19 Q2-19 Q3-19 As Reported W/O Legacy Computing Contract 18.5 21.1 17.3 18.5 18.0 2.9% 3.2% 2.9% 3.1% 3.2% 0.0% 1.0% 2.0% 3.0% 4.0% 5.0% 6.0% 7.0% 0.0 10.0 20.0 30.0 40.0 50.0 60.0 Q3-18 Q4-18 Q1-19 Q2-19 Q3-19 848 829 835 840 835 83 76 70 69 68 9.8% 9.2% 8.3% 8.2% 8.2% -50.0% -40.0% -30.0% -20.0% -10.0% 0.0% 10.0% 20.0% 0 200 400 600 800 1000 1200 1400 1600 1800 Q3-18 Q4-18 Q1-19 Q2-19 Q3-19 Return on Invested Capital (LTM)
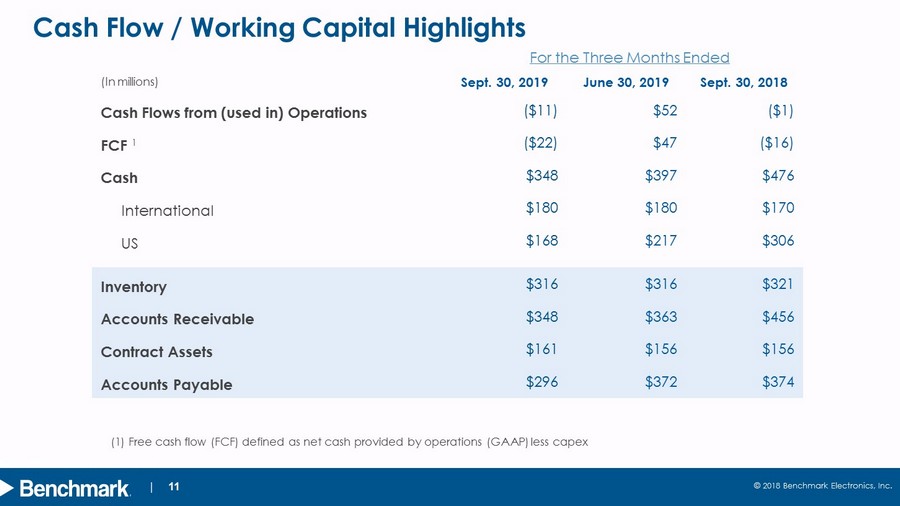
© 2018 Benchmark Electronics, Inc. | 11 Cash Flow / Working Capital Highlights (1) Free cash flow (FCF) defined as net cash provided by operations (GAAP) less capex (In millions) Sept. 30 , 2019 June 30 , 2019 Sept. 30 , 2018 Cash Flows from (used in) Operations ($11) $52 ($1) FCF ($22) $47 ($16) Cash $348 $397 $476 International $180 $180 $170 US $168 $217 $306 Inventory $316 $316 $321 Accounts Receivable $348 $363 $456 Contract Assets $161 $156 $156 Accounts Payable $296 $372 $374 For the Three Months Ended 1
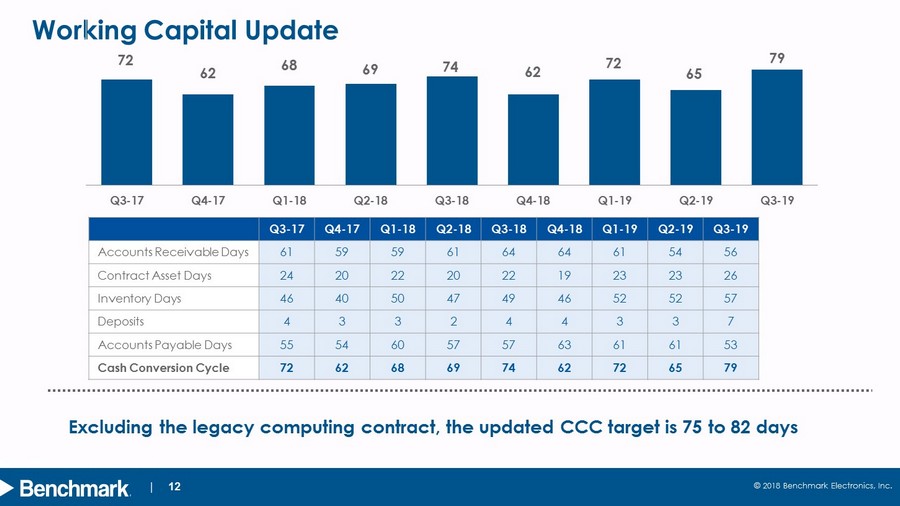
© 2018 Benchmark Electronics, Inc. | 12 Working Capital Update Q3 - 17 Q4 - 17 Q1 - 18 Q2 - 18 Q3 - 18 Q4 - 18 Q1 - 19 Q2 - 19 Q3 - 19 Accounts Receivable Days 61 59 59 61 64 64 61 54 56 Contract Asset Days 24 20 22 20 22 19 23 23 26 Inventory Days 46 40 50 47 49 46 52 52 57 Deposits 4 3 3 2 4 4 3 3 7 Accounts Payable Days 55 54 60 57 57 63 61 61 53 Cash Conversion Cycle 72 62 68 69 74 62 72 65 79 72 62 68 69 74 62 72 65 79 0 20 40 60 80 100 120 Q3-17 Q4-17 Q1-18 Q2-18 Q3-18 Q4-18 Q1-19 Q2-19 Q3-19 Excluding the legacy computing contract, the updated CCC target is 75 to 82 days
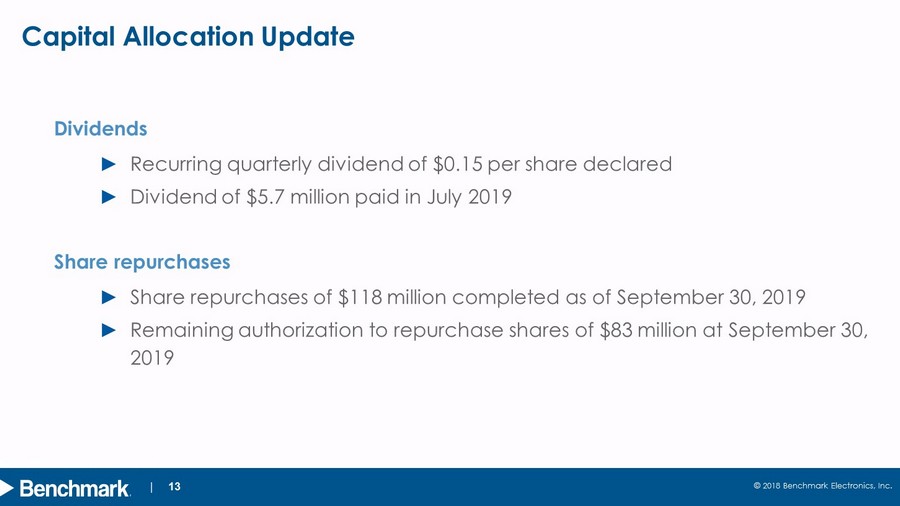
© 2018 Benchmark Electronics, Inc. | 13 Capital Allocation Update Dividends ► Recurring quarterly dividend of $0.15 per share declared ► Dividend of $5.7 million paid in July 2019 Share repurchases ► Share repurchases of $118 million completed as of September 30, 2019 ► Remaining authorization to repurchase shares of $83 million at September 30, 2019

© 2018 Benchmark Electronics, Inc. | 14 Fourth Quarter 2019 Guidance * The above guidance excludes the impact of amortization of intangible assets and estimated restructuring charges and other costs Guidance Net Sales (in millions) $ 520 – $570 Diluted EPS – non - GAAP* $0.34 – $ 0.42
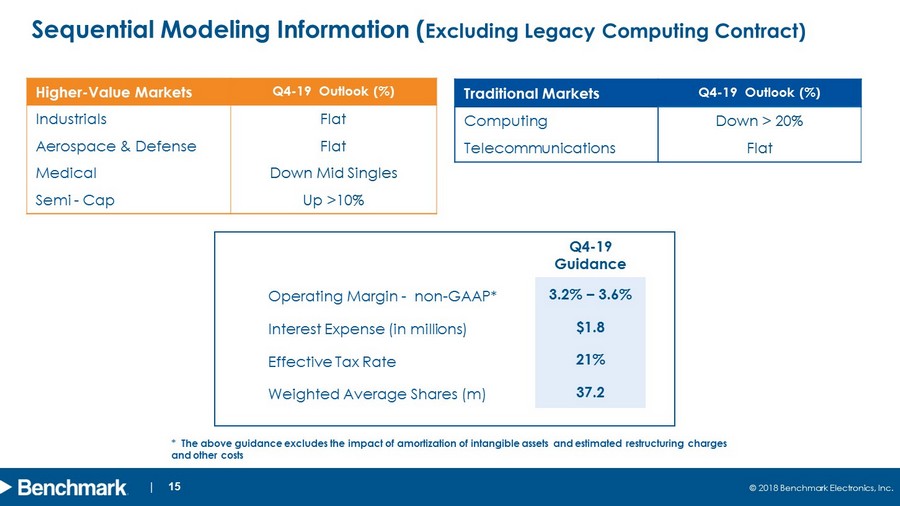
© 2018 Benchmark Electronics, Inc. | 15 Sequential Modeling Information ( Excluding Legacy Computing Contract) Higher - Value Markets Q4 - 19 Outlook (%) Industrials Flat Aerospace & Defense Flat Medical Down Mid Singles Semi - Cap Up >10% Traditional Markets Q4 - 19 Outlook (%) Computing Down > 20% Telecommunication s Flat Q4 - 19 Guidance Operating Margin - non - GAAP * 3.2% – 3.6% Interest Expense (in millions) $1.8 Effective Tax Rate 21% Weighted Average Shares (m) 37.2 * The above guidance excludes the impact of amortization of intangible assets and estimated restructuring charges and other costs
© 2018 Benchmark Electronics, Inc. | 16 Strategic Initiative Updates Jeff Benck - CEO
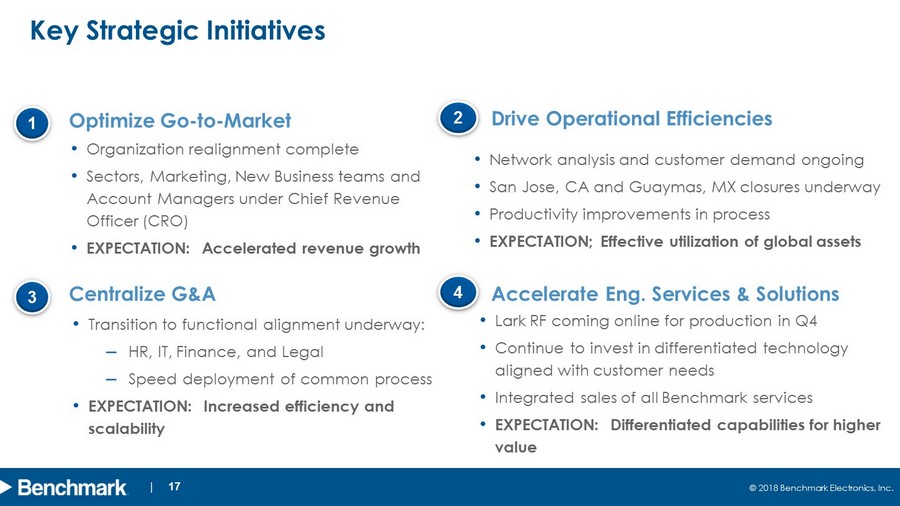
© 2018 Benchmark Electronics, Inc. | 17 Key Strategic Initiatives Optimize Go - to - Market 1 2 3 4 Drive Operational Efficiencies Centralize G&A Accelerate Eng. Services & Solutions • Organization realignment complete • Sectors, Marketing, New Business teams and Account Managers under Chief Revenue Officer (CRO) • EXPECTATION: Accelerated revenue growth • Transition to functional alignment underway: ‒ HR, IT, Finance, and Legal ‒ Speed deployment of common process • EXPECTATION: Increased efficiency and scalability • Network analysis and customer demand ongoing • San Jose, CA and Guaymas, MX closures underway • Productivity improvements in process • EXPECTATION; Effective utilization of global assets • Lark RF coming online for production in Q4 • Continue to invest in differentiated technology aligned with customer needs • Integrated sales of all Benchmark services • EXPECTATION: Differentiated capabilities for higher value

| 18 © 2018 Benchmark Electronics, Inc. Appendix
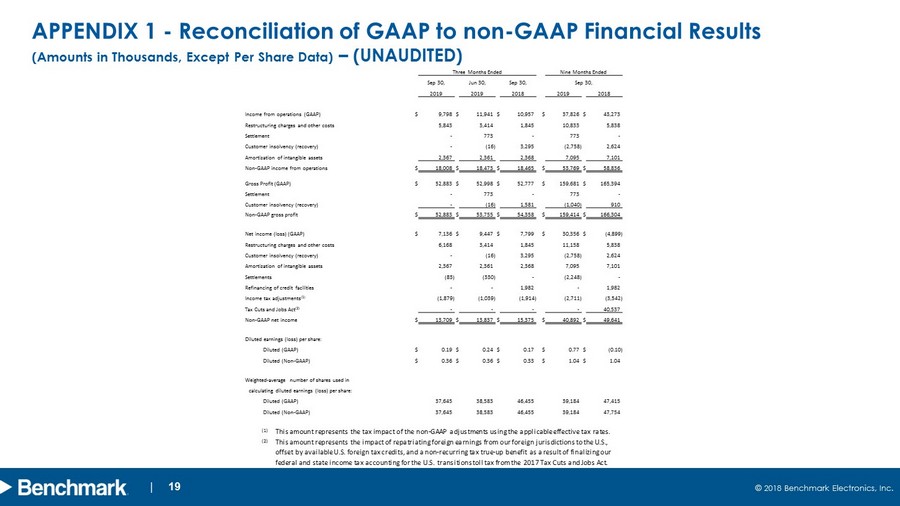
design develop deliver advanced technology 19 © 2018 Benchmark Electronics, Inc. | 19 APPENDIX 1 - Reconciliation of GAAP to non - GAAP Financial Results (Amounts in Thousands, Except Per Share Data) – (UNAUDITED) (1) This amount represents the tax impact of the non-GAAP adjustments using the applicable effective tax rates. (2) This amount represents the impact of repatriating foreign earnings from our foreign jurisdictions to the U.S., offset by available U.S. foreign tax credits, and a non-recurring tax true-up benefit as a result of finalizing our federal and state income tax accounting for the U.S. transitions toll tax from the 2017 Tax Cuts and Jobs Act. Three Months Ended Nine Months Ended Sep 30, Jun 30, Sep 30, Sep 30, 2019 2019 2018 2019 2018 Income from operations (GAAP) $ 9,798 $ 11,941 $ 10,957 $ 37,826 $ 43,273 Restructuring charges and other costs 5,843 3,414 1,845 10,833 5,838 Settlement - 773 - 773 - Customer insolvency (recovery) - (16) 3,295 (2,758) 2,624 Amortization of intangible assets 2,367 2,361 2,368 7,095 7,101 Non - GAAP income from operations $ 18,008 $ 18,473 $ 18,465 $ 53,769 $ 58,836 Gross Profit (GAAP) $ 52,883 $ 52,998 $ 52,777 $ 159,681 $ 165,394 Settlement - 773 - 773 - Customer insolvency (recovery) - (16) 1,581 (1,040) 910 Non - GAAP gross profit $ 52,883 $ 53,755 $ 54,358 $ 159,414 $ 166,304 Net income (loss) (GAAP) $ 7,136 $ 9,447 $ 7,799 $ 30,356 $ (4,899) Restructuring charges and other costs 6,168 3,414 1,845 11,158 5,838 Customer insolvency (recovery) - (16) 3,295 (2,758) 2,624 Amortization of intangible assets 2,367 2,361 2,368 7,095 7,101 Settlements (83) (330) - (2,248) - Refinancing of credit facilities - - 1,982 - 1,982 Income tax adjustments (1) (1,879) (1,039) (1,914) (2,711) (3,542) Tax Cuts and Jobs Act (2) - - - - 40,537 Non - GAAP net income $ 13,709 $ 13,837 $ 15,375 $ 40,892 $ 49,641 Diluted earnings (loss) per share: Diluted (GAAP) $ 0.19 $ 0.24 $ 0.17 $ 0.77 $ (0.10) Diluted (Non - GAAP) $ 0.36 $ 0.36 $ 0.33 $ 1.04 $ 1.04 Weighted - average number of shares used in calculating diluted earnings (loss) per share: Diluted (GAAP) 37,645 38,583 46,455 39,184 47,415 Diluted (Non - GAAP) 37,645 38,583 46,455 39,184 47,754
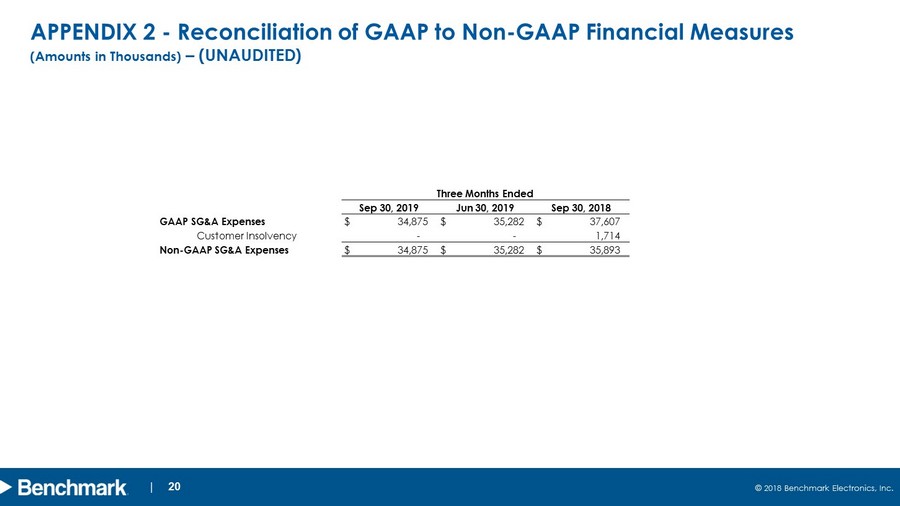
design develop deliver advanced technology 20 © 2018 Benchmark Electronics, Inc. | 20 APPENDIX 2 - Reconciliation of GAAP to Non - GAAP Financial Measures (Amounts in Thousands) – (UNAUDITED) Three Months Ended Sep 30, 2019 Jun 30, 2019 Sep 30, 2018 GAAP SG&A Expenses $ 34,875 $ 35,282 $ 37,607 Customer Insolvency - - 1,714 Non - GAAP SG&A Expenses $ 34,875 $ 35,282 $ 35,893

design develop deliver advanced technology 21 © 2018 Benchmark Electronics, Inc. | 21 APPENDIX 3 - Reconciliation of Free Cash Flow (Amounts in Thousands) – (UNAUDITED) Three Months Ended Sep 30, 2019 Jun 30, 2019 Sep 30, 2018 Net Cash Provided by (Used in) Operations $ (11,458) $ 52,358 $ (1,111) Additions to property, plant and equipment and software (10,447) (5,421) (14,570) Free Cash Flow (Free Cash Flow Used) $ (21,905) $ 46,937 $ (15,681)