Exhibit 99.2

| 1 Q1 - 20 Earnings Call April 29, 2020
| 2 | 2 This press release contains forward - looking statements within the meaning of Section 27A of the Securities Act of 1933 and Section 21E of the Securities Exchange Act of 1934. The words "expect," "estimate," "anticipate," "could" "predict" and similar expressions, and the negatives thereof, often identify forward - looking statements, which are not limited to historical facts. Forward - looking statements include, among other things, the estimated financial impact of the COVID - 19 pandemic, guidance for second quarter 2020 results, the company’s anticipated plans and responses to the COVID - 19 pandemic, statements, express or implied, concerning future operating results or margins, the ability to generate sales and income or cash flow, and expected revenue mix; and Benchmark’s business and growth strategies. Although the company believes these statements are based upon reasonable assumptions, they involve risks and uncertainties relating to operations, markets and the business environment generally. These statements also depend on the duration and severity of the COVID - 19 pandemic and related risks, including government and other third - party responses to it and the consequences for the global economy, our business and the businesses of our suppliers and customers. Events relating to or resulting from the COVID - 19 crisis, including the possibility of customer demand fluctuations, supply chain constraints, or the ability to utilize our manufacturing facilities at sufficient levels to cover our fixed operating costs, may have resulting impacts on the company’s business, financial condition, results of operations, and the company’s ability (or inability) to execute on its plans to respond to the COVID - 19 pandemic. If one or more of these risks or uncertainties materializes, or underlying assumptions prove incorrect, actual outcomes may vary materially from those indicated. Readers are advised to consult further disclosures on these risks and uncertainties, particularly in Part 1, Item 1A, "Risk Factors" of the company's Annual Report on Form 10 - K for the year ended December 31, 2019 and in its subsequent filings with the Securities and Exchange Commission. All forward - looking statements included in this document are based upon information available to the company as of the date of this document, and it assumes no obligation to update them. This document includes certain financial measures that exclude items and therefore are not in accordance with U.S. generally accepted accounting principles (“GAAP”). A detailed reconciliation between GAAP results and results excluding special items (“non - GAAP”) is included in the Appendix of this document. In situations where a non - GAAP reconciliation has not been provided, the company was unable to provide such a reconciliation without unreasonable effort due to the uncertainty and inherent difficulty predicting the occurrence, the financial impact and the periods in which the non - GAAP adjustments may be recognized. Management discloses non-GAAP information to provide investors with additional information to analyze the Company’s performance and underlying trends. Management uses non-GAAP measures that exclude certain items in order to better assess operating performance and help investors compare results with our previous guidance. This document also references “free cash flow”, which the Company defines as cash flow from operations less additions to property, plant and equipment and purchased software. The Company’s non-GAAP information is not necessarily comparable to the non-GAAP information used by other companies. Non-GAAP information should not be viewed as a substitute for, or superior to, net income or other data prepared in accordance with GAAP as a measure of the Company’s profitability or liquidity. Readers should consider the types of events and transactions for which adjustments have been made. Forward - Looking Statements Non - GAAP Financial Information
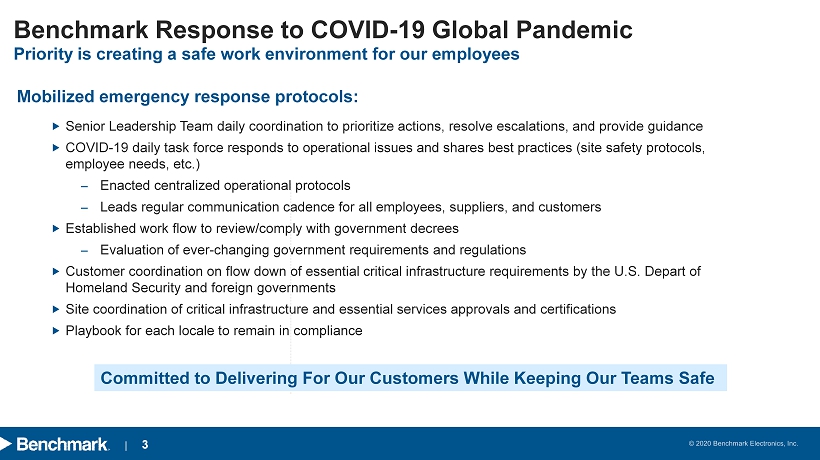
| 3 Senior Leadership Team daily coordination to prioritize actions, resolve escalations, and provide guidance COVID - 19 daily task force responds to operational issues and shares best practices (site safety protocols, employee needs, etc.) ‒ Enacted centralized operational protocols ‒ Leads regular communication cadence for all employees, suppliers, and customers Established work flow to review/comply with government decrees ‒ Evaluation of ever - changing government requirements and regulations Customer coordination on flow down of essential critical infrastructure requirements by the U.S. Depart of Homeland Security and foreign governments Site coordination of critical infrastructure and essential services approvals and certifications Playbook for each locale to remain in compliance Benchmark Response to COVID - 19 Global Pandemic Mobilized emergency response protocols: Priority is creating a safe work environment for our employees Committed to Delivering For Our Customers While Keeping Our Teams Safe
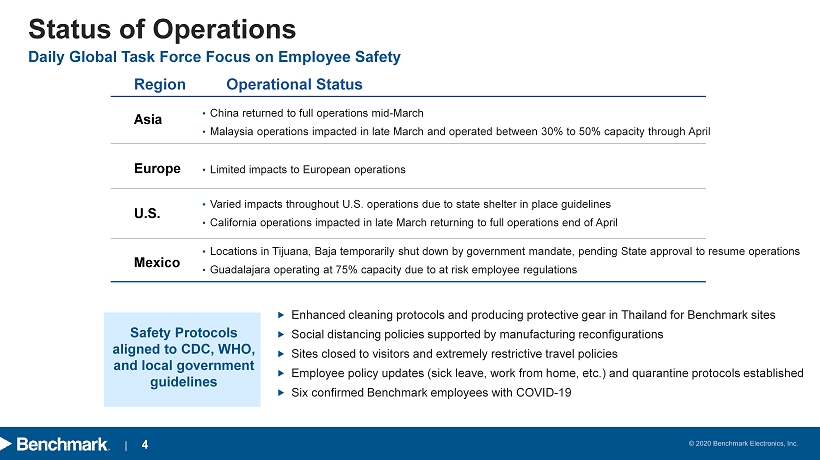
| 4 Status of Operations Asia Europe U.S. Mexico • Varied impacts throughout U.S. operations due to state shelter in place guidelines • California operations impacted in late March returning to full operations end of April • China returned to full operations mid - March • Malaysia operations impacted in late March and operated between 30% to 50% capacity through April • Locations in Tijuana, Baja temporarily shut down by government mandate, pending State approval to resume operations • Guadalajara operating at 75% capacity due to at risk employee regulations Region Operational Status • Limited impacts to European operations Enhanced cleaning protocols and producing protective gear in Thailand for Benchmark sites Social distancing policies supported by manufacturing reconfigurations Sites closed to visitors and extremely restrictive travel policies Employee policy updates (sick leave, work from home, etc.) and quarantine protocols established Six confirmed Benchmark employees with COVID - 19 Safety Protocols aligned to CDC, WHO, and local government guidelines Daily Global Task Force Focus on Employee Safety

| 5 Helping Support the Fight Against COVID - 19 ▪ Twelve COVID - 19 related programs ▪ 7 screening and testing devices ‒ X - Ray, MRI, and Ultrasound ‒ POC COVID - 19 quick test device ‒ POC Sepsis testing device ▪ 2 therapeutic fluid delivery devices ▪ 3 sites supporting ventilator programs ▪ Engineering and manufacturing support ▪ Rapid prototyping and production ramps Assisting leading medical device companies in the front line fight Diagnostic Imaging Handheld Devices Ventilators Fluid Management and Testing

| 6 Roop Lakkaraju Chief Financial Officer
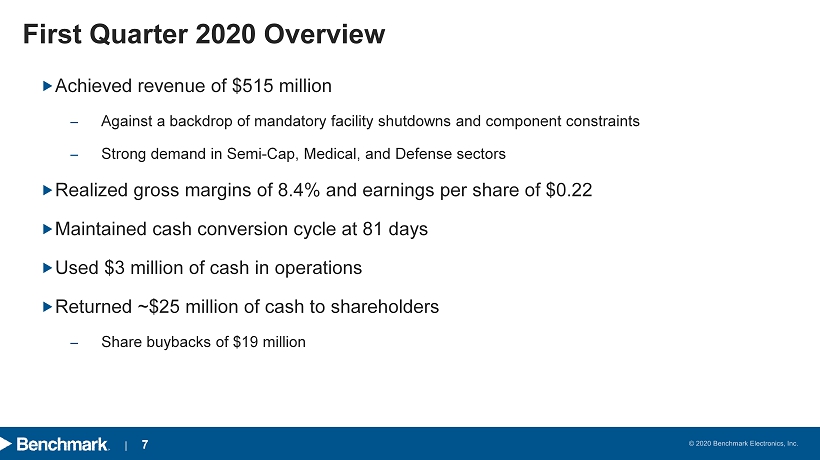
| 7 First Quarter 2020 Overview Achieved revenue of $515 million ‒ Against a backdrop of mandatory facility shutdowns and component constraints ‒ Strong demand in Semi - Cap, Medical, and Defense sectors Realized gross margins of 8.4% and earnings per share of $0.22 Maintained cash conversion cycle at 81 days Used $3 million of cash in operations Returned ~$25 million of cash to shareholders ‒ Share buybacks of $19 million

| 8 Revenue by Mix and Market Sector For the Three Months Ended Higher - Value Markets Mar. 31 , 2020 Dec. 31 , 2019 Q/Q Mar. 31 , 2019 Y/Y Medical 23% $118 20% $103 15% 17% $103 14% Semi - Cap 16% $83 16% $81 2% 11% $66 25% Aerospace & Defense 23% $119 21% $106 13% 17% $104 15% Industrials 20% $103 21% $107 (4%) 20% $116 (12%) Total Mix and Revenue 82% $423 78% $397 6% 65% $389 8% Dollars in millions Traditional Markets Mar. 31 , 2020 Dec. 31 , 2019 Q/Q Mar. 30 , 2019 Y/Y Computing 7% $36 9% $45 (18%) 21% $124 (71%) Telecommunications 11% $56 13% $66 (16%) 14% $90 (37%) Total Mix and Revenue 18% $92 22% $111 (17%) 35% $214 (57%)
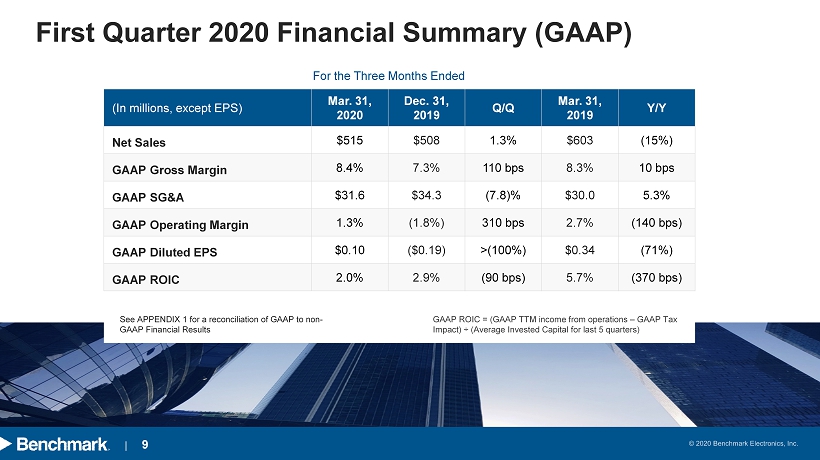
| 9 First Quarter 2020 Financial Summary (GAAP) See APPENDIX 1 for a reconciliation of GAAP to non - GAAP Financial Results For the Three Months Ended (In millions, except EPS) Mar. 31 , 2020 Dec. 31 , 2019 Q/Q Mar. 31 , 2019 Y/Y Net Sales $515 $508 1.3% $603 (15%) GAAP Gross Margin 8.4% 7.3% 110 bps 8.3% 10 bps GAAP SG&A $31.6 $34.3 (7.8)% $30.0 5.3% GAAP Operating Margin 1.3% (1.8%) 310 bps 2.7% (140 bps) GAAP Diluted EPS $0.10 ($0.19) >(100%) $0.34 (71%) GAAP ROIC 2.0% 2.9% (90 bps) 5.7% (370 bps) GAAP ROIC = (GAAP TTM income from operations – GAAP Tax Impact) ÷ (Average Invested Capital for last 5 quarters)

| 10 First Quarter 2020 Financial Summary (Non - GAAP) For the Three Months Ended (In millions, except EPS) Mar. 31 , 2020 Dec. 31 , 2019 Q/Q Mar. 31 , 2019 Y/Y Net Sales $515 $508 1.3% $603 (15%) Non - GAAP Gross Margin 8.4% 7.4% 100 bps 8.1% 30 bps Non - GAAP SG&A $31.6 $24.2 30.6% $31.7 (0.3%) Non - GAAP Operating Margin 2.3% 2.6% (30 bps) 2.9% (60 bps) Non - GAAP Diluted EPS $0.22 $0.27 (18%) $0.33 (33%) Non - GAAP ROIC 7.1% 7.4% (30 bps) 8.3% (120 bps) See APPENDIX 1 for a reconciliation of GAAP to non - GAAP Financial Results Non - GAAP ROIC = (Non - GAAP TTM income from operations – Non - GAAP Tax Impact) ÷ [Average Invested Capital for last 5 quarters]
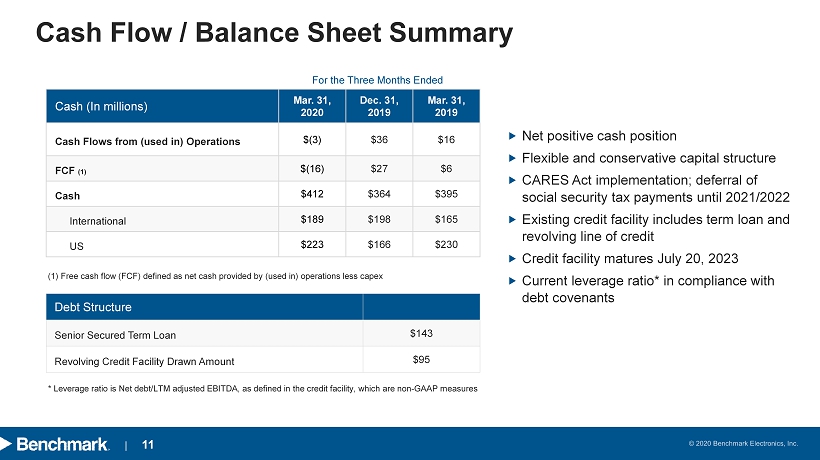
| 11 Cash (In millions) Mar. 31 , 2020 Dec. 31 , 2019 Mar. 31, 2019 Cash Flows from (used in) Operations $(3) $36 $16 FCF (1) $(16) $27 $6 Cash $412 $364 $395 International $189 $198 $165 US $223 $166 $230 Cash Flow / Balance Sheet Summary For the Three Months Ended (1) Free cash flow (FCF) defined as net cash provided by (used in) operations less capex Net positive cash position Flexible and conservative capital structure CARES Act implementation; deferral of social security tax payments until 2021/2022 Existing credit facility includes term loan and revolving line of credit Credit facility matures July 20, 2023 Current leverage ratio* in compliance with debt covenants Debt Structure Senior Secured Term Loan $143 Revolving Credit Facility Drawn Amount $95 * Leverage ratio is Net debt/LTM adjusted EBITDA, as defined in the credit facility, which are non - GAAP measures
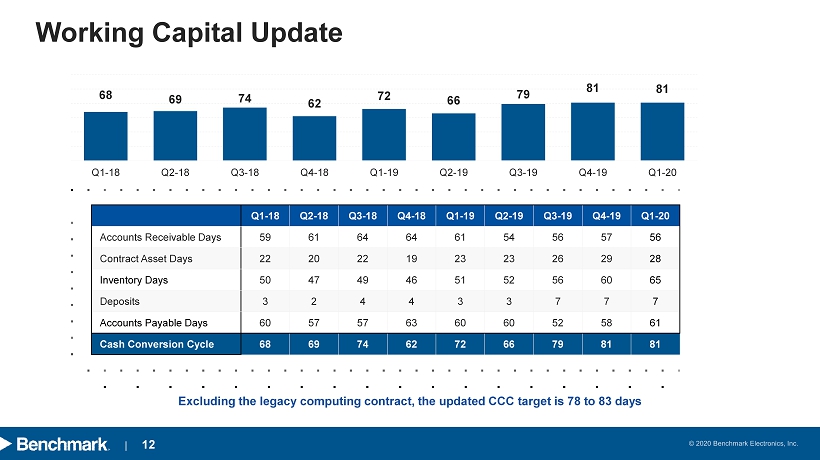
| 12 Working Capital Update Q1 - 18 Q2 - 18 Q3 - 18 Q4 - 18 Q1 - 19 Q2 - 19 Q3 - 19 Q4 - 19 Q1 - 20 Accounts Receivable Days 59 61 64 64 61 54 56 57 56 Contract Asset Days 22 20 22 19 23 23 26 29 28 Inventory Days 50 47 49 46 51 52 56 60 65 Deposits 3 2 4 4 3 3 7 7 7 Accounts Payable Days 60 57 57 63 60 60 52 58 61 Cash Conversion Cycle 68 69 74 62 72 66 79 81 81 Excluding the legacy computing contract, the updated CCC target is 78 to 83 days 68 69 74 62 72 66 79 81 81 Q1-18 Q2-18 Q3-18 Q4-18 Q1-19 Q2-19 Q3-19 Q4-19 Q1-20

| 13 Capital Allocation Update Dividends Quarterly dividend of $0.15 per share totaling $5.5 million paid in January 2020 Recurring quarterly dividend increased by 6.7% to $0.16 per share and paid to shareholders as of March 31, 2020 on April 14, 2020 Recurring quarterly dividends to continue until further notice Share Repurchases Share repurchases of $19 million completed in Q1 2020 Share repurchase program expanded by $150 million; remaining authorization to repurchase shares of $210 million at March 31, 2020 No share repurchases planned in the second quarter

| 14 Jeff Benck President & Chief Executive Officer
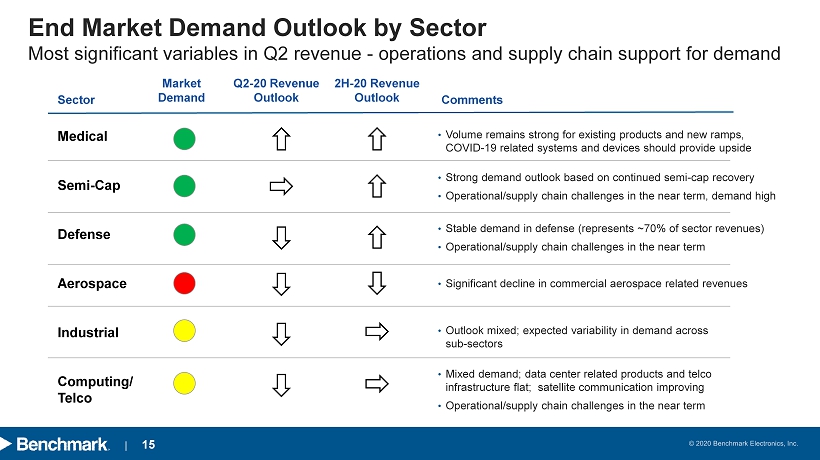
| 15 End Market Demand Outlook by Sector Most significant variables in Q2 revenue - operations and supply chain support for demand Medical Semi - Cap Defense Aerospace Industrial Computing/ Telco • Volume remains strong for existing products and new ramps, COVID - 19 related systems and devices should provide upside • Stable demand in defense (represents ~70% of sector revenues) • Operational/supply chain challenges in the near term • Strong demand outlook based on continued semi - cap recovery • Operational/supply chain challenges in the near term, demand high • Outlook mixed; expected variability in demand across sub - sectors • Mixed demand; data center related products and telco infrastructure flat; satellite communication improving • Operational/supply chain challenges in the near term Market Demand Sector Comments • Significant decline in commercial aerospace related revenues Q2 - 20 Revenue Outlook 2H - 20 Revenue Outlook
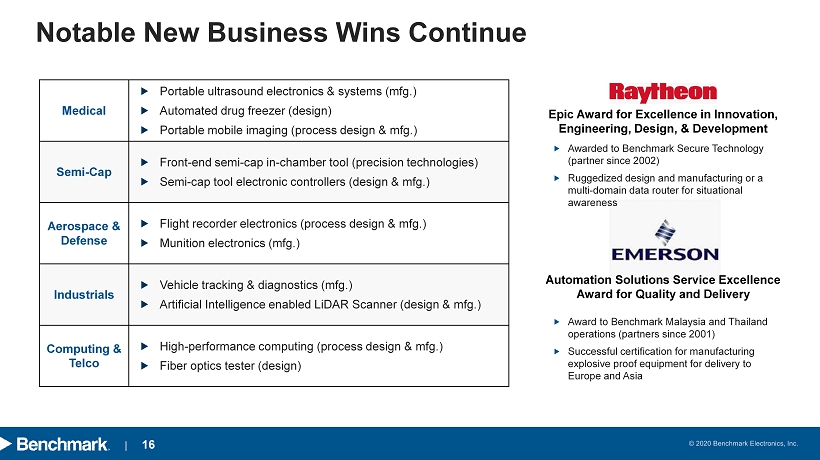
| 16 Notable New Business Wins Continue Medical Portable ultrasound electronics & systems ( mfg.) Automated drug freezer (design) Portable mobile imaging ( process design & mfg.) Semi - Cap Front - end semi - cap in - chamber tool (precision technologies) Semi - cap tool electronic controllers (design & mfg.) Aerospace & Defense Flight recorder electronics (process design & mfg.) Munition electronics (mfg.) Industrials Vehicle tracking & diagnostics (mfg.) Artificial Intelligence enabled LiDAR Scanner (design & mfg.) Computing & Telco High - performance computing (process design & mfg.) Fiber optics tester (design) Epic Award for Excellence in Innovation, Engineering, Design, & Development Awarded to Benchmark Secure Technology (partner since 2002) Ruggedized design and manufacturing or a multi - domain data router for situational awareness Automation Solutions Service Excellence Award for Quality and Delivery Award to Benchmark Malaysia and Thailand operations (partners since 2001) Successful certification for manufacturing explosive proof equipment for delivery to Europe and Asia

| 17 Updated “Guideposts” Suspending quarterly guidance due to current environment 2Q Revenue: Expect modest sequential quarterly revenue decline; varied operational impacts as a result of labor and supply chain constraints; timing of government actions pending to permit factories to return to higher production levels (particularly in Mexico) Full Year Revenue: Expect second quarter to be lowest revenue quarter in 2020; still expect higher - value markets >80% of revenue and potential for annual growth in Medical, Semi - Cap, and A&D Margins: Expect sequential quarterly margin decline; Q2 challenged from lower revenues, inefficient utilization of facilities, expense increases, and supply chain constraints due to COVID - 19; expect to recover to 9% gross margin range in second half of 2020 Expenses: Proactive cost management planning for Q2 and out quarters if pandemic recovery is elongated; levers include compensation adjustments, merit delays, employee furloughs, travel, and discretionary professional services reductions Investments: Maintaining critical investments in resources and capabilities given our demand outlook and new program ramps from wins in the past 24 months

| 18 Unchanged: Key Strategic Initiatives Staying focused on longer term horizon Change the relationship with our customers; differentiate with technology Revenue at the right target margin profile Focus on the Customer Be the best at what we do Effective asset utilization and margin expansion Drive Enterprise Efficiencies Invest in People, Process, and Solutions Revenue growth and margin expansion Growing our Business Drive empowerment, accountability, and ownership High functioning teams in a great workplace Engage Talent and Shift Culture

| 19 Appendix
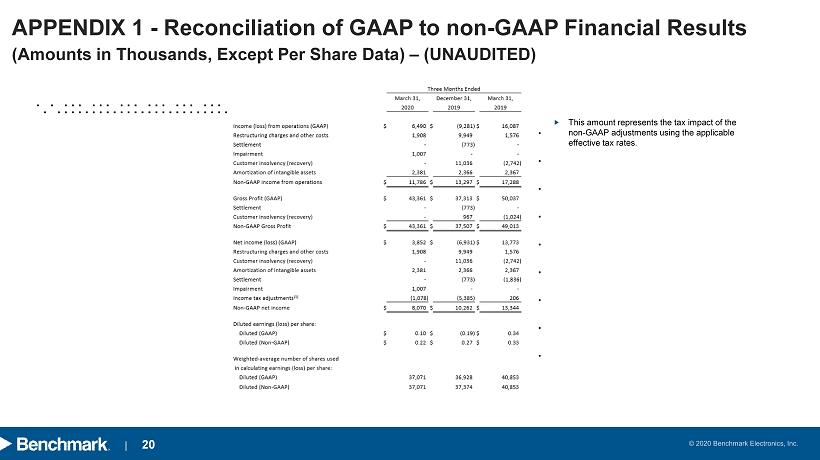
| 20 (Amounts in Thousands, Except Per Share Data) – (UNAUDITED) APPENDIX 1 - Reconciliation of GAAP to non - GAAP Financial Results This amount represents the tax impact of the non - GAAP adjustments using the applicable effective tax rates.

| 21 (Amounts in Thousands) – (UNAUDITED) APPENDIX 2 - Reconciliation of GAAP to Non - GAAP Financial Measures Three Months Ended Mar. 31 , 2020 Dec. 31 , 2019 Mar. 31, 2019 GAAP Gross Profit $43,361 $37,313 $50,037 Settlement - (773) - Customer insolvency (recovery) - 967 (1,024) Non - GAAP Gross Profit $43,361 $37,507 $49,013 GAAP SG&A Expenses $31,575 $34,281 $30,007 Customer insolvency (recovery) - 10,069 (1,718) Non - GAAP SG&A Expenses $31,575 $24,212 $31,725

| 22 (Amounts in Thousands) – (UNAUDITED) APPENDIX 3 - Reconciliation of Free Cash Flow Three Months Ended Mar. 31 , 2020 Dec. 31 , 2019 Mar. 31, 2019 Net Cash Provided by (Used in) Operations $(3,109) $35,822 $16,414 Additions to property, plant and equipment and software (12,896) (9,176) (10,074) Free Cash Flow (Free Cash Flow Used) $(16,005) $26,646 $6,340