UNITED STATES
SECURITIES AND EXCHANGE COMMISSION
Washington, D.C. 20549
FORM N-CSR
CERTIFIED SHAREHOLDER REPORT OF REGISTERED
MANAGEMENT INVESTMENT COMPANIES
Investment Company Act file number 811-06110
Western Asset Funds, Inc.
(Exact name of registrant as specified in charter)
55 Water Street, New York, NY 10041
(Address of principal executive offices) (Zip code)
Robert I. Frenkel, Esq.
Legg Mason & Co., LLC
100 First Stamford Place
Stamford, CT 06902
(Name and address of agent for service)
Registrant’s telephone number, including area code: 1-877-721-1926
Date of fiscal year end: December 31
Date of reporting period: December 31, 2010
| ITEM 1. | REPORT TO STOCKHOLDERS. |
The Annual Report to Stockholders is filed herewith.
December 31, 2010

Annual Repor t
Western Asset
Core Plus Bond
Portfolio
INVESTMENT PRODUCTS: NOT FDIC INSURED • NO BANK GUARANTEE • MAY LOSE VALUE
| | |
| II | | Western Asset Core Plus Bond Portfolio |
Fund objective
The Fund seeks to maximize total return, consistent with prudent investment management and liquidity needs, by investing to obtain an average duration which is expected to range within 30% of the average duration of the domestic bond market as a whole.
Letter from the president
Dear Shareholder,
We are pleased to provide the annual report of Western Asset Core Plus Bond Portfolio for the twelve-month reporting period ended December 31, 2010. Please read on for a detailed look at prevailing economic and market conditions during the Fund’s reporting period and to learn how those conditions have affected Fund performance.
As always, we remain committed to providing you with excellent service and a full spectrum of investment choices. We also remain committed to supplementing the support you receive from your financial advisor. One way we accomplish this is through our website, www.leggmason.com/individualinvestors. Here you can gain immediate access to market and investment information, including:
| Ÿ | | Fund prices and performance, |
| Ÿ | | Market insights and commentaries from our portfolio managers, and |
| Ÿ | | A host of educational resources. |
We look forward to helping you meet your financial goals.
Sincerely,

R. Jay Gerken, CFA
President
February 9, 2011
| | | | |
| Western Asset Core Plus Bond Portfolio | | | III | |
Investment commentary
Economic review
Despite continued headwinds from high unemployment and issues in the housing market, the U.S. economy continued to expand over the twelve months ended December 31, 2010. Toward the end of the reporting period, fears regarding moderating economic growth were replaced with optimism for a strengthening economy in 2011. With investor sentiment improving, U.S. equities moved sharply higher in the fourth quarter, while rising interest rates negatively impacted some sectors of the fixed-income market. All told, during 2010, investors who took on additional risk in their portfolios were generally rewarded.
In September 2010, the National Bureau of Economic Research (“NBER”), the organization charged with determining when recessions start and end, announced that the recession that began in December 2007 had concluded in June 2009. However, the NBER said, “In determining that a trough occurred in June 2009, the committee did not conclude that economic conditions since that month have been favorable or that the economy has returned to operating at normal capacity.” The NBER’s point is well-taken given continued areas of weakness in the U.S. economy.
Although the U.S. Department of Commerce continued to report positive U.S. gross domestic product (“GDP”)i growth, the expansion has moderated since peaking at 5.0% in the fourth quarter of 2009. A slower drawdown in business inventories and renewed consumer spending were contributing factors spurring the economy’s solid growth at the end of 2009. However, the economy grew at a more modest pace in 2010. According to the Commerce Department, GDP growth was 3.7%, 1.7% and 2.6% during the first, second and third quarters of 2010, respectively. The initial estimate for fourth quarter GDP was a 3.2% expansion.
Turning to the job market, while the unemployment rate moved lower in December 2010, it remained elevated throughout the reporting period. While 384,000 new jobs were created during the fourth quarter and the unemployment rate fell from 9.8% in November to 9.4% in December 2010, there continued to be some disturbing trends in the labor market. The unemployment rate has now exceeded 9.0% for twenty consecutive months, the longest period since the government began tracking this data in 1949. In addition, the U.S. Department of Labor reported in December that a total of 14.5 million Americans looking for work have yet to find a job, and 44% of these individuals have been out of work for more than six months.
There was mixed news in the housing market during the period. According to the National Association of Realtors (“NAR”), existing-home sales increased 7.0% and 8.0% in March and April, respectively, after sales had fallen for the period from December 2009 through February 2010. The rebound was largely attributed to people rushing to take advantage of the government’s $8,000 tax credit for first-time home buyers that expired at the end of April. However, with the end of the tax credit, existing-home sales then declined from May through July. Sales then generally rose from August through the end of the year. In total, existing-home sales volume in 2010 was 4.9 million, the lowest amount since 1997. Looking at home prices, the NAR reported that the median existing-home price for all housing types rose a tepid 0.3% in 2010. The inventory of unsold homes was an 8.1 month supply in December at the current sales level, versus a 9.5 month supply in November.
The manufacturing sector was one area of the economy that remained relatively strong during 2010. Based on the Institute
| | |
| IV | | Western Asset Core Plus Bond Portfolio |
Investment commentary (cont’d)
for Supply Management’s PMIii, the manufacturing sector has grown seventeen consecutive months since it began expanding in August 2009. After reaching a six-year peak of 60.4 in April 2010 (a reading below 50 indicates a contraction, whereas a reading above 50 indicates an expansion), PMI data indicated somewhat more modest growth through the remainder of the year. However, in December, the manufacturing sector expanded at its fastest pace in seven months, with a reading of 57.0 versus 56.6 in November.
Financial market overview
The financial markets experienced several periods of volatility during the reporting period that tested the resolve of novice and experienced investors alike. During most of the first four months of the reporting period, the financial markets were largely characterized by healthy investor risk appetite and solid results by stocks and lower-quality bonds. The market then experienced sharp sell-offs in late April and in May, and again beginning in mid-November. During those periods, investors tended to favor the relative safety of U.S. Treasury securities. However, these setbacks proved to be only temporary and, in each case, risk aversion was replaced with solid demand for riskier assets.
Due to signs that certain areas of the economy were moderating in the second half of the reporting period, the Federal Reserve Board (“Fed”)iii took further actions to spur the economy. At its August 10th meeting, the Fed announced an ongoing program that calls for using the proceeds from expiring agency debt and agency mortgage-backed securities to purchase longer-dated Treasury securities.
In addition, the Fed remained cautious throughout the reporting period given pockets of weakness in the economy. At its meeting in September 2010, the Fed said, “The Committee will continue to monitor
the economic outlook and financial developments and is prepared to provide additional accommodation if needed to support the economic recovery. . . .” This led to speculation that the Fed may again move to purchase large amounts of agency and Treasury securities in an attempt to avoid a double-dip recession and ward off deflation.
The Fed then took additional action in early November. Citing that “the pace of recovery in output and employment continues to be slow,” the Fed announced another round of quantitative easing to help stimulate the economy, entailing the purchase of $600 billion of long-term U.S. Treasury securities by the end of the second quarter of 2011. This, coupled with the Fed’s previously announced program to use the proceeds of expiring securities to purchase Treasuries, means it could buy a total of $850 billion to $900 billion of Treasury securities by the end of June 2011. At its final meeting of the year in December, the Fed said it “will regularly review the pace of its securities purchases and the overall size of the asset-purchase program in light of incoming information and will adjust the program as needed to best foster maximum employment and price stability.”
Fixed-income market review
Continuing the trend that began in the second quarter of 2009, nearly every spread sector (non-Treasury) outperformed equal-durationiv Treasuries during most of the first four months of the reporting period. Over that time, investor confidence was high given encouraging economic data, continued low interest rates, benign inflation and rebounding corporate profits. Robust investor appetite was then replaced with heightened risk aversion toward the end of April and during the month of May. This was due to the escalating sovereign debt crisis in Europe, uncertainties regarding new financial reforms in the U.S. and some worse-than-expected economic data.
| | | | |
| Western Asset Core Plus Bond Portfolio | | | V | |
Most spread sectors then produced positive absolute returns in June and July, as investor demand for these securities again increased. There was another bout of risk aversion in August, given fears that the economy may slip back into a recession. However, with the Fed indicating the possibility of another round of quantitative easing, most spread sectors rallied in September and October. The spread sectors started to weaken again toward the middle of November as financial troubles in Ireland resulted in a re-emergence of the European sovereign debt crisis. While several spread sectors regained their footing in December, others remained weak given ongoing uncertainties in Europe and concerns regarding economic growth in China and its potential impact on the global economy.
Both short- and long-term Treasury yields fluctuated but, overall, moved lower during the twelve months ended December 31, 2010. When the period began, two- and ten-year Treasury yields were 1.14% and 3.85%, respectively. On April 5, 2010, two- and ten-year Treasury yields peaked at 1.18% and 4.01%, respectively. Subsequent to hitting their highs for the period, yields largely declined during much of the next six months, with two-year Treasuries hitting their low for the year of 0.33% on November 4, 2010. Ten-year Treasuries reached their 2010 trough of 2.41% in early October. Yields then moved sharply higher given expectations for stronger growth in 2011 and the potential for rising inflation.
When the period ended on December 31, 2010, two-year Treasury yields were 0.61% and ten-year Treasury yields were 3.30%. For the twelve months ended December 31, 2010, the Barclays Capital U.S. Aggregate Indexv returned 6.54%.
The U.S. high-yield bond market produced strong results during the reporting period. The asset class posted positive returns during each month, except for May and November 2010 when risk aversion rose sharply. The high-yield market was supported by better-than-expected corporate profits and overall strong investor demand. All told, the Barclays Capital U.S. High Yield – 2% Issuer Cap Indexvi returned 14.94% for the twelve months ended December 31, 2010.
As always, thank you for your confidence in our stewardship of your assets.
Sincerely,
R. Jay Gerken, CFA
President
January 28, 2011
All investments are subject to risk including the possible loss of principal. Past performance is no guarantee of future results. All index performance reflects no deduction for fees, expenses or taxes. Please note that an investor cannot invest directly in an index.
| i | Gross domestic product (“GDP”) is the market value of all final goods and services produced within a country in a given period of time. |
| ii | The Institute for Supply Management's PMI is based on a survey of purchasing executives who buy the raw materials for manufacturing at more than 350 companies. It offers an early reading on the health of the manufacturing sector. |
| iii | The Federal Reserve Board ("Fed") is responsible for the formulation of policies designed to promote economic growth, full employment, stable prices and a sustainable pattern of international trade and payments. |
| iv | Duration is the measure of the price sensitivity of a fixed-income security to an interest rate change of 100 basis points. Calculation is based on the weighted average of the present values for all cash flows. |
| v | The Barclays Capital U.S. Aggregate Index is a broad-based bond index comprised of government, corporate, mortgage- and asset-backed issues, rated investment grade or higher, and having at least one year to maturity. |
| vi | The Barclays Capital U.S. High Yield – 2% Issuer Cap Index is an index of the 2% Issuer Cap component of the Barclays Capital U.S. Corporate High Yield Index, which covers the U.S. dollar-denominated, non-investment grade, fixed-rate, taxable corporate bond market. |
| | | | |
| Western Asset Core Plus Bond Portfolio 2010 Annual Report | | | 1 | |
Fund overview
Q. What is the Fund’s investment strategy?
A. The Fund seeks to maximize total return, consistent with prudent investment management and liquidity needs, by investing to obtain the average durationi specified below. The Fund invests in a portfolio of fixed-income securities of various maturities and, under normal market conditions, will invest at least 80% of its net assets in debt and fixed-income securities. Although the Fund may invest in debt and fixed-income securities of any maturity, under normal market conditions, the target dollar-weighted average effective durationii for the Fund is expected to range within 30% of the average duration of the domestic bond market as a whole as measured by Western Asset Management Company (“Western Asset”), the Fund’s adviser. (Generally, this range is 2.5 to seven years.)
The Fund may invest up to 20% of its total assets in non-U.S. dollar-denominated securities. Up to 20% of the Fund’s net assets may be invested in debt securities that are not rated Baa or BBB or above at the time of purchase by one or more nationally recognized statistical rating organizations but are rated at least B-/B3 or, if unrated, securities that we determine to be of comparable quality at the time of purchase. The Fund may invest up to 25% of its total assets in the securities of non-U.S. issuers.
The Fund may also enter into various derivative transactions for both hedging and non-hedging purposes, including for purposes of enhancing returns. These derivative transactions include, but are not limited to, futures, options, swaps and forwards.
At Western Asset, we utilize a fixed- income team approach, with decisions derived from interaction among various investment management sector specialists. The sector teams are comprised of Western Asset’s senior portfolio managers, research ana-
lysts and an in-house economist. Under this team approach, management of client fixed-income portfolios will reflect a consensus of interdisciplinary views within the Western Asset organization.
Q. What were the overall market conditions during the Fund’s reporting period?
A. During the twelve months ended December 31, 2010, the riskier segments of the fixed-income market produced strong results and outperformed U.S. Treasuries. This was due, in part, to improving economic conditions following the lengthy downturn from mid-2008 through mid-2009. Also supporting the spread sectors (non-U.S. Treasuries) was overall solid demand from investors seeking incremental yields given the low rates available from short-term fixed-income securities.
The spread sectors rallied during most of the reporting period, with notable exceptions being in late April and May 2010, as well as August and November 2010. Starting toward the end of April, there was a “flight to quality,” triggered by concerns regarding the escalating sovereign debt crisis in Europe. In addition, investor sentiment was negatively impacted by uncertainties surrounding financial reform legislation in the U.S. and signs that economic growth was moderating. Collectively, this caused investors to flock to the relative safety of Treasury securities, driving their yields lower and prices higher.
Robust investor risk appetite largely resumed during June and July, and again in September and October. These turnarounds occurred as the situation in Europe appeared to stabilize, the financial reform bill was signed into law and the Federal Reserve Board (“Fed”)iii continued to indicate that it would keep short-term rates low for an extended period. Investor risk aversion briefly returned in November
| | |
| 2 | | Western Asset Core Plus Bond Portfolio 2010 Annual Report |
Fund overview (cont’d)
when fears regarding the European debt crisis re-emerged. However, investor sentiment improved in December, given expectations for strengthening economic conditions in 2011.
The yields on two- and ten-year Treasuries began the fiscal year at 1.14% and 3.85%, respectively. Treasury yields fluctuated during the twelve-month reporting period given mixed signals regarding the economy and uncertainties regarding Fed monetary policy. Yields moved sharply lower in October 2010 in anticipation of additional quantitative easing (“QE2”) by the Fed. Yields then reversed course toward the end of the period as certain economic data were stronger than expected and there were concerns regarding future inflation. During the fiscal year, two-year Treasury yields moved as high as 1.18% and as low as 0.33%, while ten-year Treasuries rose as high as 4.01% and fell as low as 2.41%. On December 31, 2010, yields on two- and ten-year Treasuries were 0.61% and 3.30%, respectively.
The Barclays Capital U.S. Aggregate Indexiv returned 6.54% for the twelve months ended December 31, 2010. Comparatively, riskier fixed-income securities, including high-yield bonds, produced stronger results. Over the fiscal year, the Barclays Capital U.S. High Yield – 2% Issuer Cap Indexv (the “Index”) returned 14.94%. While the emerging market debt asset class also generated strong absolute returns during the fiscal year, it lagged the U.S. high-yield market. Over the twelve months ended December 31, 2010, the JPMorgan Emerging Markets Bond Index Global (“EMBI Global”)vi returned 12.04%.
Q. How did we respond to these changing market conditions?
A. A number of adjustments were made to the Fund during the reporting period. We reduced our exposure to U.S. Treasuries and cash as we found what we believed to be more attractive opportunities elsewhere. In particular, we increased the Fund’s exposure to agency mortgage-backed securities (“MBS”) and investment grade Financials.
The Fund used U.S. Treasury futures and options, Eurodollar futures and options, and interest rate swaps and swaptions to manage our duration and yield curvevii exposure. Credit default swaps were utilized to manage and hedge our credit exposure. Total return swaps were used to gain exposure to specific portions of the fixed-income market. Euro-bund futures were utilized to manage exposure to the German yield curve. We also used currency forwards to manage our foreign currency exposure. Overall, the use of these derivative instruments contributed to performance during the twelve-month reporting period.
Performance review
For the twelve months ended December 31, 2010, Class I shares of Western Asset Core Plus Bond Portfolio returned 11.97%. The Fund’s unmanaged benchmark, the Barclays Capital U.S. Aggregate Index, returned 6.54% over the same time frame. The Lipper Intermediate Investment Grade Debt Funds Category Average1 returned 7.73% for the same period.
| 1 | Lipper, Inc., a wholly-owned subsidiary of Reuters, provides independent insight on global collective investments. Returns are based on the twelve-month period ended December 31, 2010, including the reinvestment of all distributions, including returns of capital, if any, calculated among the 567 funds in the Fund’s Lipper category. |
| | | | |
| Western Asset Core Plus Bond Portfolio 2010 Annual Report | | | 3 | |
| | | | | | | | |
| Performance Snapshot as of December 31, 2010 | |
| (unaudited) | | 6 months | | | 12 months | |
| Western Asset Core Plus Bond Portfolio: | |
Class IS1 | | | 3.77 | % | | | 12.10 | % |
Class I1 | | | 3.66 | % | | | 11.97 | % |
Class FI1 | | | 3.63 | % | | | 11.80 | % |
Barclays Capital U.S. Aggregate Index | | | 1.15 | % | | | 6.54 | % |
| Lipper Intermediate Investment Grade Debt Funds Category Average2 | | | 2.25 | % | | | 7.73 | % |
The performance shown represents past performance. Past performance is no guarantee of future results and current performance may be higher or lower than the performance shown above. Principal value, investment returns and yields will fluctuate and investors’ shares, when redeemed, may be worth more or less than their original cost. To obtain performance data current to the most recent month-end, please visit our website at www.leggmason.com/individualinvestors.
All share class returns assume the reinvestment of all distributions, including returns of capital, if any, at net asset value and the deduction of all Fund expenses. Returns have not been adjusted to include the deduction of taxes that a shareholder would pay on Fund distributions. Performance figures for periods shorter than one year represent cumulative figures and are not annualized.
Performance figures reflect compensating balance arrangements, expense reimbursements and/or fee waivers, without which the performance would have been lower.
The 30-Day SEC Yields for the period ended December 31, 2010 for Class IS, Class I and Class FI shares were 3.31%, 3.26% and 3.04%, respectively. Absent current expense reimbursements and/or fee waivers, the 30-Day SEC Yield for Class FI shares would have been 2.88%. The 30-Day SEC Yield is the average annualized net investment income per share for the 30-day period indicated and is subject to change.
| | | | |
| Total Annual Operating Expenses (unaudited) |
As of the Fund’s most current prospectus dated April 30, 2010, the gross total operating expense ratios for Class IS, Class I and Class FI shares were 0.43%, 0.46% and 0.86%, respectively.
Actual expenses may be higher. For example, expenses may be higher than those shown if average net assets decrease. Net assets are more likely to decrease and Fund expense ratios are more likely to increase when markets are volatile.
As a result of an expense limitation arrangement, the ratio of expenses, other than brokerage, interest, taxes, deferred organizational expenses and extraordinary expenses to average net assets will not exceed 0.45% for Class IS shares and 0.70% for Class FI shares. This expense limitation arrangement cannot be terminated prior to April 30, 2011 without the Board of Directors’ consent.
The manager is permitted to recapture amounts forgone or reimbursed to a class within three years after the day on which the manager earned the fee or incurred the expense if the class’ total annual operating expenses have fallen to a level below the lower of the limit described above or the limit then in effect.
Q. What were the leading contributors to performance?
A. The largest contributor to the Fund’s relative performance during the reporting period was our overweight to non-agency MBS. The combination of the government’s aggressive programs to aid the housing market and signs that housing prices appeared to be stabilizing helped these securities generate strong results. In addition, the sector was supported by ongoing demand from asset managers participating in the Public-Private Investment Program (“PPIP”).
| 1 | Class IS, Class I and Class FI shares were formerly known as Institutional Select Class, Institutional Class and Financial Intermediary Class shares, respectively. Fund share classes were renamed in April 2010. |
| 2 | Lipper, Inc., a wholly-owned subsidiary of Reuters, provides independent insight on global collective investments. Returns are based on the period ended December 31, 2010, including the reinvestment of all distributions, including returns of capital, if any, calculated among the 580 funds for the six-month period and among the 567 funds for the twelve-month period in the Fund’s Lipper category. |
| | |
| 4 | | Western Asset Core Plus Bond Portfolio 2010 Annual Report |
Fund overview (cont’d)
An overweight to high-yield bonds also enhanced results. The asset class was among the best performing fixed-income sectors during the reporting period given declining default rates and solid demand from investors looking to generate incremental yield. Among the Fund’s strongest high-yield holdings were overweight positions in Ally Financial Inc. (formerly known as GMAC Inc.), Ford Motor Credit Co. and American International Group Inc.
An overweight to the investment grade corporate bond market was also rewarded. The sector performed well due to generally better-than-expected corporate profits and overall robust demand. In particular, our Financials holdings General Electric Capital Corp., Citigroup Inc. and SLM Corp. produced the best results. Additionally, Time Warner Cable Inc., CVS Caremark Corp. and Delta Air Lines Inc. were beneficial for performance.
We tactically adjusted the Fund’s duration during the reporting period. Overall, the portfolio’s duration was longer than that of the benchmark, which enhanced results as interest rates declined during the reporting period.
Q. What were the leading detractors from performance?
A. The largest detractor from relative performance for the period was our non-U.S. dollar exposure. In particular, a short position in the Japanese yen was a drag on results as the yen appreciated versus other currencies over the twelve months ended December 31, 2010.
Elsewhere, our exposure to U.S. Treasury Inflation-Protected Securities (“TIPS”)viii slightly detracted from performance given modest inflation in the U.S. during the reporting period.
Thank you for your investment in Western Asset Core Plus Bond Portfolio. As always, we appreciate that you have chosen us to manage your assets and we remain focused on achieving the Fund’s investment goals.
Sincerely,
Western Asset Management Company
January 18, 2011
RISKS: Bonds are subject to a variety of risks, including interest rate, credit and inflation risks. As interest rates rise, bond prices fall, reducing the value of the Fund’s share price. The Fund may invest in high-yield bonds, which are rated below investment grade and carry more risk than higher-rated securities. Investments in asset-backed and mortgage-backed securities involve additional risks, including prepayment and extension risks. Non-U.S. investments are subject to currency fluctuations and social, economic and political risk. These risks are magnified in emerging markets. The Fund may use derivatives, such as options, futures and swaps, which can be illiquid, may disproportionately increase losses, and have a potentially large impact on Fund performance. Please see the Fund’s prospectus for a more complete discussion of these and other risks, and the Fund’s investment strategies.
| | | | |
| Western Asset Core Plus Bond Portfolio 2010 Annual Report | | | 5 | |
Portfolio holdings and breakdowns are as of December 31, 2010 and are subject to change and may not be representative of the portfolio managers’ current or future investments. Please refer to pages 13 through 48 for a list and percentage breakdown of the Fund’s holdings.
The mention of sector breakdowns is for informational purposes only and should not be construed as a recommendation to purchase or sell any securities. The information provided regarding such sectors is not a sufficient basis upon which to make an investment decision. Investors seeking financial advice regarding the appropriateness of investing in any securities or investment strategies discussed should consult their financial professional. The Fund’s top five sector holdings (as a percentage of net assets) as of December 31, 2010 were: Corporate
Bonds & Notes (32.4%), Mortgage-Backed Securities (30.9%), Collateralized Mortgage Obligations (18.1%), U.S. Government & Agency Obligations (8.5%) and Asset-Backed Securities (4.7%). The Fund’s portfolio composition is subject to change at any time.
All investments are subject to risk including the possible loss of principal. Past performance is no guarantee of future results. All index performance reflects no deduction for fees, expenses or taxes. Please note that an investor cannot invest directly in an index.
The information provided is not intended to be a forecast of future events, a guarantee of future results or investment advice. Views expressed may differ from those of the firm as a whole.
| i | Duration is the measure of the price sensitivity of a fixed-income security to an interest rate change of 100 basis points. Calculation is based on the weighted average of the present values for all cash flows. |
| ii | Effective duration measures the expected sensitivity of market price to changes in interest rates, taking into account the effects of structural complexities. (For example, some bonds can be prepaid by the issuer.) |
| iii | The Federal Reserve Board ("Fed") is responsible for the formulation of policies designed to promote economic growth, full employment, stable prices and a sustainable pattern of international trade and payments. |
| iv | The Barclays Capital U.S. Aggregate Index is a broad-based bond index comprised of government, corporate, mortgage- and asset-backed issues, rated investment grade or higher, and having at least one year to maturity. |
| v | The Barclays Capital U.S. High Yield – 2% Issuer Cap Index is an index of the 2% Issuer Cap component of the Barclays Capital U.S. Corporate High Yield Index, which covers the U.S. dollar-denominated, non-investment grade, fixed-rate, taxable corporate bond market. |
| vi | The JPMorgan Emerging Markets Bond Index Global ("EMBI Global") tracks total returns for U.S. dollar- denominated debt instruments issued by emerging market sovereign and quasi-sovereign entities: Brady bonds, loans, Eurobonds and local market instruments. |
| vii | The yield curve is the graphical depiction of the relationship between the yield on bonds of the same credit quality but different maturities. |
| viii | U.S. Treasury Inflation-Protected Securities ("TIPS") are inflation-indexed securities issued by the U.S. Treasury in five-year, ten-year and twenty-year maturities. The principal is adjusted to the Consumer Price Index, the commonly used measure of inflation. The coupon rate is constant, but generates a different amount of interest when multiplied by the inflation-adjusted principal. |
| | |
| 6 | | Western Asset Core Plus Bond Portfolio 2010 Annual Report |
Fund at a glance† (unaudited)
Investment breakdown (%) as a percent of total investments
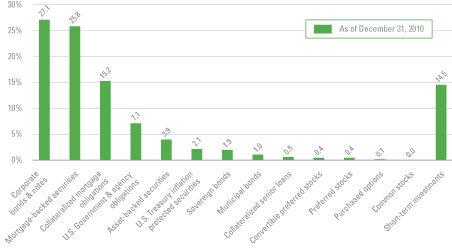
| † | The bar graph above represents the composition of the Fund’s investments as of December 31, 2010 and does not include derivatives such as futures contracts, options written and swaps. The Fund is actively managed. As a result, the composition of the Fund’s investments is subject to change at any time. |
| | | | |
| Western Asset Core Plus Bond Portfolio 2010 Annual Report | | | 7 | |
Fund expenses (unaudited)
Example
As a shareholder of the Fund, you may incur two types of costs: (1) transaction costs and (2) ongoing costs, including management fees; distribution and/or service (12b-1) fees; and other Fund expenses. This example is intended to help you understand your ongoing costs (in dollars) of investing in the Fund and to compare these costs with the ongoing costs of investing in other mutual funds.
This example is based on an investment of $1,000 invested on July 1, 2010 and held for the six months ended December 31, 2010.
Actual expenses
The table below titled “Based on Actual Total Return” provides information about actual account values and actual expenses. You may use the information provided in this table, together with the amount you invested, to estimate the expenses that you paid over the period. To estimate the expenses you paid on your account, divide your ending account value by $1,000 (for example, an $8,600 ending account value divided by $1,000 = 8.6), then multiply the result by the number under the heading entitled “Expenses Paid During the Period”.
Hypothetical example for comparison purposes
The table below titled “Based on Hypothetical Total Return” provides information about hypothetical account values and hypothetical expenses based on the actual expense ratio and an assumed rate of return of 5.00% per year before expenses, which is not the Fund’s actual return. The hypothetical account values and expenses may not be used to estimate the actual ending account balance or expenses you paid for the period. You may use the information provided in this table to compare the ongoing costs of investing in the Fund and other funds. To do so, compare the 5.00% hypothetical example relating to the Fund with the 5.00% hypothetical examples that appear in the shareholder reports of the other funds.
Please note that the expenses shown in the table below are meant to highlight your ongoing costs only and do not reflect any transactional costs, such as front-end or back-end sales charges (loads). Therefore, the table is useful in comparing ongoing costs only, and will not help you determine the relative total costs of owning different funds. In addition, if these transaction costs were included, your costs would have been higher.
| | | | | | | | | | | | | | | | | | | | | | | | | | | | | | | | | | | | | | | | | | | | | | |
| Based on actual total return1 | | | | | | Based on hypothetical total return1 | |
| | | Actual
Total
Return2 | | | Beginning
Account
Value | | | Ending
Account
Value | | | Annualized
Expense
Ratio | | | Expenses
Paid
During
the
Period3 | | | | | | | | Hypothetical
Annualized
Total Return | | | Beginning
Account
Value | | | Ending
Account
Value | | | Annualized
Expense
Ratio | | | Expenses
Paid
During
the
Period3 | |
| Class IS4 | | | 3.77 | % | | $ | 1,000.00 | | | $ | 1,037.70 | | | | 0.43 | % | | $ | 2.21 | | | | | | | Class IS4 | | | 5.00 | % | | $ | 1,000.00 | | | $ | 1,023.04 | | | | 0.43 | % | | $ | 2.19 | |
| Class I4 | | | 3.66 | | | | 1,000.00 | | | | 1,036.60 | | | | 0.45 | | | | 2.31 | | | | | | | Class I4 | | | 5.00 | | | | 1,000.00 | | | | 1,022.94 | | | | 0.45 | | | | 2.29 | |
| Class FI4 | | | 3.63 | | | | 1,000.00 | | | | 1,036.30 | | | | 0.70 | | | | 3.59 | | | | | | | Class FI4 | | | 5.00 | | | | 1,000.00 | | | | 1,021.68 | | | | 0.70 | | | | 3.57 | |
| 1 | For the six months ended December 31, 2010. |
| 2 | Assumes the reinvestment of all distributions, including returns of capital, if any, at net asset value. Total return is not annualized, as it may not be representative of the total return for the year. Performance figures may reflect compensating balance arrangements and/or expense reimbursements. In the absence of compensating balance arrangements and/or expense reimbursements, the total return would have been lower. Past performance is no guarantee of future results. |
| 3 | Expenses (net of compensating balance arrangements and/or expense reimbursements) are equal to each class’ respective annualized expense ratio multiplied by the average account value over the period, multiplied by the number of days in the most recent fiscal half-year (184), then divided by 365. |
| 4 | In April 2010, Institutional Select Class, Institutional Class and Financial Intermediary Class shares were renamed Class IS, Class I and Class FI shares, respectively. |
| | |
| 8 | | Western Asset Core Plus Bond Portfolio 2010 Annual Report |
Fund performance (unaudited)
| | | | | | | | | | | | |
| Average annual total returns1 | | | | |
| | | Class IS‡ | | | Class I‡ | | | Class FI‡ | |
| Twelve Months Ended 12/31/10 | | | 12.10 | % | | | 11.97 | % | | | 11.80 | % |
| Five Years Ended 12/31/10 | | | N/A | | | | 6.91 | | | | 6.64 | |
| Ten Years Ended 12/31/10 | | | N/A | | | | 7.23 | | | | N/A | |
| Inception* through 12/31/10 | | | 13.26 | | | | 6.92 | | | | 6.59 | |
| | | | |
| Cumulative total returns1 | |
| Class IS‡ (Inception date of 8/4/08 through 12/31/10) | | | 34.96 | % |
| Class I‡ (12/31/00 through 12/31/10) | | | 101.03 | |
| Class FI‡ (Inception date of 1/8/02 through 12/31/10) | | | 77.34 | |
All figures represent past performance and are not a guarantee of future results. Investment return and principal value of an investment will fluctuate so that an investor’s shares, when redeemed, may be worth more or less than their original cost. The returns shown do not reflect the deduction of taxes that a shareholder would pay on Fund distributions or the redemption of Fund shares. Performance figures may reflect compensating balance arrangements, fee waivers and/or expense reimbursements. In the absence of compensating balance arrangements, fee waivers and/or expense reimbursements, the total return would have been lower.
| 1 | Assumes the reinvestment of all distributions, including returns of capital, if any, at net asset value. |
| * | Inception dates for Class IS, I and FI are August 4, 2008, July 8, 1998 and January 8, 2002, respectively. |
| ‡ | In April 2010, Institutional Select Class, Institutional Class and Financial Intermediary Class shares were renamed Class IS, Class I and Class FI shares, respectively. |
| | | | |
| Western Asset Core Plus Bond Portfolio 2010 Annual Report | | | 9 | |
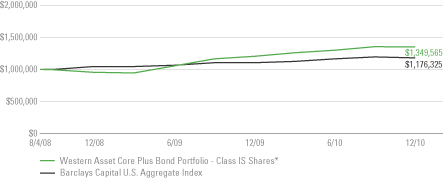
Historical performance
Value of $1,000,000 invested in
Class IS Shares of Western Asset Core Plus Bond Portfolio vs. Barclays Capital U.S. Aggregate Index† —
August 4, 2008 - December 2010
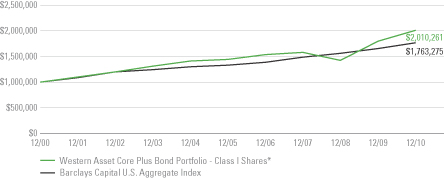
Value of $1,000,000 invested in
Class I Shares of Western Asset Core Plus Bond Portfolio vs. Barclays Capital U.S. Aggregate Index† —
December 2000 - December 2010
| | |
| 10 | | Western Asset Core Plus Bond Portfolio 2010 Annual Report |
Fund performance (unaudited) (cont’d)
Value of $1,000,000 invested in
Class FI Shares of Western Asset Core Plus Bond Portfolio vs. Barclays Capital U.S. Aggregate Index† —
January 8, 2002 - December 2010
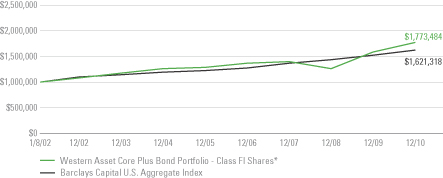
All figures represent past performance and are not a guarantee of future results. Investment return and principal value of an investment will fluctuate so that an investor’s shares, when redeemed, may be worth more or less than their original cost. The returns shown do not reflect the deduction of taxes that a shareholder would pay on Fund distributions or the redemption of Fund shares. Performance figures may reflect compensating balance arrangements, fee waivers and/or expense reimbursements. In the absence of compensating balance arrangements, fee waivers and/or expense reimbursements, the total return would have been lower.
| † | Hypothetical illustration of $1,000,000 invested in Class IS, I and FI shares of Western Asset Core Plus Bond Portfolio on August 4, 2008 (commencement of operations), December 31, 2000 and January 8, 2002 (commencement of operations), respectively, assuming the reinvestment of all distributions, including returns of capital, if any, at net asset value through December 31, 2010. The hypothetical illustration also assumes a $1,000,000 investment in the Barclays Capital U.S. Aggregate Index. The Barclays Capital U.S. Aggregate Index is a broad-based bond index comprised of government, corporate, mortgage- and asset-backed issues, rated investment grade or higher, and having at least one year to maturity. The Index is unmanaged and not subject to the same management and trading expenses as a mutual fund. Please note that an investor cannot invest directly in an index. |
| * | In April 2010, Institutional Select Class, Institutional Class and Financial Intermediary Class shares were renamed Class IS, Class I and Class FI shares, respectively. |
| | | | |
| Western Asset Core Plus Bond Portfolio 2010 Annual Report | | | 11 | |
Spread duration (unaudited)
Economic exposure — December 31, 2010
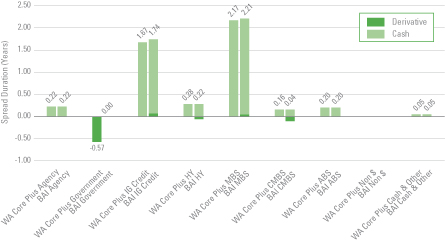
Spread duration measures the sensitivity to changes in spreads. The spread over Treasuries is the annual risk premium demanded by investors to hold non-Treasury securities. Spread duration is quantified as the % change in price resulting from a 100 basis points change in spreads. For a security with positive spread duration, an increase in spreads would result in a price decline and a decline in spreads would result in a price increase. This chart highlights the market sector exposure of the Fund’s sectors relative to the selected benchmark sectors as of the end of the reporting period.
| | |
| ABS | | — Asset Backed Securities |
| BAI | | — Barclays Capital U.S. Aggregate Index |
| CMBS | | — Commercial Mortgage Backed Securities |
| HY | | — High Yield |
| IG Credit | | — Investment Grade Credit |
| MBS | | — Mortgage Backed Securities |
| Non $ | | — Non-U.S. Dollar |
| WA Core Plus | | —Western Asset Core Plus Bond Portfolio |
| | |
| 12 | | Western Asset Core Plus Bond Portfolio 2010 Annual Report |
Effective duration (unaudited)
Interest rate exposure — December 31, 2010
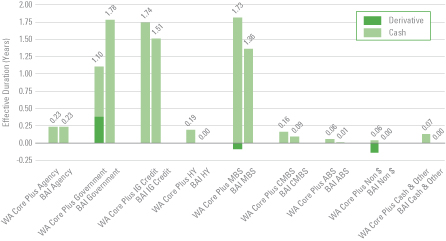
Effective duration measures the sensitivity to changes in relevant interest rates. Effective duration is quantified as the % change in price resulting from a 100 basis points change in interest rates. For a security with positive effective duration, an increase in interest rates would result in a price decline and a decline in interest rates would result in a price increase. This chart highlights the interest rate exposure of the Fund’s sectors relative to the selected benchmark sectors as of the end of the reporting period.
| | |
| ABS | | — Asset Backed Securities |
| BAI | | — Barclays Capital U.S. Aggregate Index |
| CMBS | | — Commercial Mortgage Backed Securities |
| HY | | — High Yield |
| IG Credit | | — Investment Grade Credit |
| MBS | | — Mortgage Backed Securities |
| Non $ | | — Non-U.S. Dollar |
| WA Core Plus | | —Western Asset Core Plus Bond Portfolio |
| | | | |
| Western Asset Core Plus Bond Portfolio 2010 Annual Report | | | 13 | |
Schedule of investments
December 31, 2010
Western Asset Core Plus Bond Portfolio
| | | | | | | | | | | | | | | | |
| Security | | Rate | | | Maturity
Date | | | Face
Amount† | | | Value | |
| Corporate Bonds & Notes — 32.4% | | | | | | | | | | | | | | | | |
| Consumer Discretionary — 3.1% | | | | | | | | | | | | | | | | |
Automobiles — 0.2% | | | | | | | | | | | | | | | | |
DaimlerChrysler North America Holding Corp., Notes | | | 5.875 | % | | | 3/15/11 | | | | 500,000 | | | $ | 505,070 | |
DaimlerChrysler North America Holding Corp., Notes | | | 7.300 | % | | | 1/15/12 | | | | 3,315,000 | | | | 3,522,131 | |
DaimlerChrysler North America Holding Corp., Notes | | | 6.500 | % | | | 11/15/13 | | | | 1,390,000 | | | | 1,573,576 | |
Ford Motor Credit Co., LLC, Notes | | | 7.000 | % | | | 10/1/13 | | | | 5,000,000 | | | | 5,360,500 | |
Motors Liquidation Co. | | | 9.450 | % | | | 11/1/11 | | | | 2,514,000 | | | | 823,335 | (a) |
Motors Liquidation Co. | | | 8.100 | % | | | 6/15/24 | | | | 368,000 | | | | 124,200 | (a) |
Motors Liquidation Co. | | | 8.375 | % | | | 7/5/33 | | | | 9,520,000 | EUR | | | 4,198,120 | (a) |
Motors Liquidation Co., Debentures | | | 9.400 | % | | | 7/15/21 | | | | 674,000 | | | | 219,050 | (a) |
Motors Liquidation Co., step bond | | | 0.000 | % | | | 3/15/36 | | | | 8,887,000 | | | | 1,555,225 | (a) |
Total Automobiles | | | | | | | | | | | | | | | 17,881,207 | |
Diversified Consumer Services — 0.1% | | | | | | | | | | | | | | | | |
Service Corp. International, Senior Notes | | | 7.500 | % | | | 4/1/27 | | | | 5,385,000 | | | | 5,156,138 | |
Hotels, Restaurants & Leisure — 0.2% | | | | | | | | | | | | | | | | |
Inn of the Mountain Gods Resort & Casino, Senior Notes | | | 12.000 | % | | | 11/15/10 | | | | 1,070,000 | | | | 557,737 | (b)(c)* |
Marriott International Inc. | | | 5.810 | % | | | 11/10/15 | | | | 7,950,000 | | | | 8,632,023 | |
McDonald’s Corp., Medium Term Notes | | | 5.350 | % | | | 3/1/18 | | | | 310,000 | | | | 347,823 | |
MGM MIRAGE Inc., Senior Notes | | | 7.625 | % | | | 1/15/17 | | | | 1,270,000 | | | | 1,187,450 | |
MGM Resorts International, Senior Secured Notes | | | 11.125 | % | | | 11/15/17 | | | | 1,645,000 | | | | 1,891,750 | |
Mohegan Tribal Gaming Authority, Senior Subordinated Notes | | | 8.000 | % | | | 4/1/12 | | | | 245,000 | | | | 204,575 | |
Station Casinos Inc., Senior Notes | | | 7.750 | % | | | 8/15/16 | | | | 9,760,000 | | | | 976 | (a)(c) |
Total Hotels, Restaurants & Leisure | | | | | | | | | | | | | | | 12,822,334 | |
Media — 2.1% | | | | | | | | | | | | | | | | |
CBS Corp. | | | 7.625 | % | | | 1/15/16 | | | | 5,500,000 | | | | 6,413,066 | |
Charter Communications Operating LLC/Charter Communications Operating Capital,
Senior Secured Notes | | | 10.875 | % | | | 9/15/14 | | | | 3,670,000 | | | | 4,101,225 | (d) |
Comcast Cable Communications Inc., Senior Notes | | | 6.750 | % | | | 1/30/11 | | | | 210,000 | | | | 210,864 | |
Comcast Cable Communications LLC, Notes | | | 8.875 | % | | | 5/1/17 | | | | 40,000 | | | | 49,975 | |
Comcast Corp., Notes | | | 6.500 | % | | | 1/15/15 | | | | 3,760,000 | | | | 4,281,617 | |
Comcast Corp., Notes | | | 5.875 | % | | | 2/15/18 | | | | 10,000 | | | | 11,102 | |
Comcast Corp., Notes | | | 6.450 | % | | | 3/15/37 | | | | 11,139,000 | | | | 11,901,632 | |
Comcast Corp., Senior Notes | | | 6.500 | % | | | 1/15/17 | | | | 3,140,000 | | | | 3,619,704 | |
Comcast Corp., Senior Notes | | | 5.650 | % | | | 6/15/35 | | | | 10,050,000 | | | | 9,763,233 | |
Comcast Corp., Senior Notes | | | 6.950 | % | | | 8/15/37 | | | | 8,460,000 | | | | 9,568,835 | |
See Notes to Financial Statements.
| | |
| 14 | | Western Asset Core Plus Bond Portfolio 2010 Annual Report |
Schedule of investments (cont’d)
December 31, 2010
Western Asset Core Plus Bond Portfolio
| | | | | | | | | | | | | | | | |
| Security | | Rate | | | Maturity
Date | | | Face
Amount† | | | Value | |
Media — continued | | | | | | | | | | | | | | | | |
Comcast Corp., Senior Notes | | | 6.400 | % | | | 3/1/40 | | | | 4,950,000 | | | $ | 5,305,732 | |
COX Communications Inc., Senior Notes | | | 5.450 | % | | | 12/15/14 | | | | 4,750,000 | | | | 5,229,161 | |
CSC Holdings Inc., Senior Notes | | | 6.750 | % | | | 4/15/12 | | | | 500,000 | | | | 519,375 | |
CSC Holdings LLC, Senior Notes | | | 8.625 | % | | | 2/15/19 | | | | 1,105,000 | | | | 1,248,650 | |
DISH DBS Corp., Senior Notes | | | 7.000 | % | | | 10/1/13 | | | | 6,340,000 | | | | 6,767,950 | |
DISH DBS Corp., Senior Notes | | | 6.625 | % | | | 10/1/14 | | | | 255,000 | | | | 264,562 | |
DISH DBS Corp., Senior Notes | | | 7.750 | % | | | 5/31/15 | | | | 1,610,000 | | | | 1,710,625 | |
EchoStar DBS Corp., Senior Notes | | | 7.125 | % | | | 2/1/16 | | | | 2,065,000 | | | | 2,132,112 | |
Gannett Co. Inc. | | | 6.375 | % | | | 4/1/12 | | | | 4,560,000 | | | | 4,696,800 | |
News America Inc. | | | 6.750 | % | | | 1/9/38 | | | | 200,000 | | | | 212,970 | |
News America Inc., Senior Notes | | | 6.200 | % | | | 12/15/34 | | | | 260,000 | | | | 272,996 | |
News America Inc., Senior Notes | | | 6.650 | % | | | 11/15/37 | | | | 1,330,000 | | | | 1,473,096 | |
Reed Elsevier Capital Inc., Notes | | | 8.625 | % | | | 1/15/19 | | | | 12,205,000 | | | | 15,517,352 | |
Time Warner Cable Inc., Senior Notes | | | 8.750 | % | | | 2/14/19 | | | | 15,640,000 | | | | 19,901,400 | |
Time Warner Cable Inc., Senior Notes | | | 8.250 | % | | | 4/1/19 | | | | 12,830,000 | | | | 15,937,080 | |
Time Warner Cable Inc., Senior Notes | | | 4.125 | % | | | 2/15/21 | | | | 2,150,000 | | | | 2,045,826 | |
Time Warner Cable Inc., Senior Notes | | | 6.750 | % | | | 6/15/39 | | | | 4,955,000 | | | | 5,472,669 | |
Time Warner Cable Inc., Senior Notes | | | 5.875 | % | | | 11/15/40 | | | | 13,640,000 | | | | 13,494,870 | |
Time Warner Entertainment Co., LP, Senior Notes | | | 8.375 | % | | | 7/15/33 | | | | 20,000 | | | | 25,240 | |
United Business Media Ltd., Notes | | | 5.750 | % | | | 11/3/20 | | | | 5,920,000 | | | | 5,683,555 | (d) |
Viacom Inc. | | | 6.250 | % | | | 4/30/16 | | | | 6,750,000 | | | | 7,681,696 | |
Total Media | | | | | | | | | | | | | | | 165,514,970 | |
Multiline Retail — 0.2% | | | | | | | | | | | | | | | | |
Neiman Marcus Group Inc., Senior Notes | | | 9.000 | % | | | 10/15/15 | | | | 4,414,018 | | | | 4,623,684 | (e) |
Sears Holding Corp., Senior Secured Notes | | | 6.625 | % | | | 10/15/18 | | | | 3,460,000 | | | | 3,226,450 | (d) |
Target Corp. | | | 4.000 | % | | | 6/15/13 | | | | 5,340,000 | | | | 5,703,125 | |
Total Multiline Retail | | | | | | | | | | | | | | | 13,553,259 | |
Specialty Retail — 0.3% | | | | | | | | | | | | | | | | |
Autozone Inc. | | | 6.950 | % | | | 6/15/16 | | | | 10,890,000 | | | | 12,609,193 | |
Home Depot Inc. | | | 5.250 | % | | | 12/16/13 | | | | 5,510,000 | | | | 6,047,479 | |
Home Depot Inc. | | | 5.400 | % | | | 3/1/16 | | | | 8,230,000 | | | | 9,222,579 | |
Total Specialty Retail | | | | | | | | | | | | | | | 27,879,251 | |
Total Consumer Discretionary | | | | | | | | | | | | | | | 242,807,159 | |
| Consumer Staples — 1.9% | | | | | | | | | | | | | | | | |
Beverages — 0.4% | | | | | | | | | | | | | | | | |
Anheuser-Busch InBev Worldwide Inc., Senior Notes | | | 5.375 | % | | | 1/15/20 | | | | 14,670,000 | | | | 15,896,236 | |
See Notes to Financial Statements.
| | | | |
| Western Asset Core Plus Bond Portfolio 2010 Annual Report | | | 15 | |
Western Asset Core Plus Bond Portfolio
| | | | | | | | | | | | | | | | |
| Security | | Rate | | | Maturity
Date | | | Face
Amount† | | | Value | |
Beverages — continued | | | | | | | | | | | | | | | | |
Anheuser-Busch InBev Worldwide Inc., Senior Notes | | | 5.000 | % | | | 4/15/20 | | | | 4,620,000 | | | $ | 4,883,026 | |
Diageo Finance BV | | | 3.250 | % | | | 1/15/15 | | | | 11,360,000 | | | | 11,705,367 | |
PepsiCo Inc., Senior Notes | | | 7.900 | % | | | 11/1/18 | | | | 45,000 | | | | 57,897 | |
Total Beverages | | | | | | | | | | | | | | | 32,542,526 | |
Food & Staples Retailing — 0.6% | | | | | | | | | | | | | | | | |
CVS Caremark Corp., Senior Notes | | | 6.600 | % | | | 3/15/19 | | | | 16,900,000 | | | | 19,787,686 | |
CVS Corp. | | | 5.789 | % | | | 1/10/26 | | | | 104,397 | | | | 105,556 | (d) |
CVS Pass-Through Trust, Secured Notes | | | 5.298 | % | | | 1/11/27 | | | | 484,868 | | | | 481,256 | (d)(f) |
CVS Pass-Through Trust, Secured Notes | | | 5.880 | % | | | 1/10/28 | | | | 5,331,367 | | | | 5,409,418 | |
CVS Pass-Through Trust, Secured Notes | | | 6.036 | % | | | 12/10/28 | | | | 15,665,740 | | | | 16,066,626 | |
CVS Pass-Through Trust, Secured Notes | | | 6.943 | % | | | 1/10/30 | | | | 3,067,018 | | | | 3,334,156 | |
Delhaize Group, Senior Notes | | | 6.500 | % | | | 6/15/17 | | | | 120,000 | | | | 136,041 | |
Kroger Co., Senior Notes | | | 6.400 | % | | | 8/15/17 | | | | 1,270,000 | | | | 1,458,163 | |
Kroger Co., Senior Notes | | | 6.150 | % | | | 1/15/20 | | | | 1,830,000 | | | | 2,073,685 | |
Safeway Inc., Senior Notes | | | 6.350 | % | | | 8/15/17 | | | | 310,000 | | | | 346,173 | |
Wal-Mart Stores Inc., Notes | | | 5.800 | % | | | 2/15/18 | | | | 180,000 | | | | 206,826 | |
Wal-Mart Stores Inc., Notes | | | 6.200 | % | | | 4/15/38 | | | | 2,260,000 | | | | 2,572,818 | |
Total Food & Staples Retailing | | | | | | | | | | | | | | | 51,978,404 | |
Food Products — 0.4% | | | | | | | | | | | | | | | | |
Ahold Lease USA Inc., Pass-Through Certificates, Series 2001 A-2 | | | 8.620 | % | | | 1/2/25 | | | | 7,604,620 | | | | 8,973,452 | (f) |
Kraft Foods Inc., Senior Notes | | | 5.375 | % | | | 2/10/20 | | | | 18,810,000 | | | | 20,244,620 | |
Total Food Products | | | | | | | | | | | | | | | 29,218,072 | |
Household Products — 0.2% | | | | | | | | | | | | | | | | |
Reynolds Group DL Escrow Inc./Reynolds Group Escrow LLC, Senior Secured Notes | | | 7.750 | % | | | 10/15/16 | | | | 13,255,000 | | | | 14,017,163 | (d) |
Tobacco — 0.3% | | | | | | | | | | | | | | | | |
Altria Group Inc., Senior Notes | | | 9.250 | % | | | 8/6/19 | | | | 11,630,000 | | | | 15,177,615 | |
Reynolds American Inc., Senior Notes | | | 7.250 | % | | | 6/1/12 | | | | 1,720,000 | | | | 1,839,273 | |
Reynolds American Inc., Senior Notes | | | 6.750 | % | | | 6/15/17 | | | | 8,430,000 | | | | 9,422,354 | |
Reynolds American Inc., Senior Secured Notes | | | 7.625 | % | | | 6/1/16 | | | | 100,000 | | | | 116,223 | |
Total Tobacco | | | | | | | | | | | | | | | 26,555,465 | |
Total Consumer Staples | | | | | | | | | | | | | | | 154,311,630 | |
| Energy — 4.6% | | | | | | | | | | | | | | | | |
Energy Equipment & Services — 0.1% | | | | | | | | | | | | | | | | |
Baker Hughes Inc., Senior Notes | | | 7.500 | % | | | 11/15/18 | | | | 230,000 | | | | 288,408 | |
Complete Production Services Inc., Senior Notes | | | 8.000 | % | | | 12/15/16 | | | | 5,355,000 | | | | 5,542,425 | |
See Notes to Financial Statements.
| | |
| 16 | | Western Asset Core Plus Bond Portfolio 2010 Annual Report |
Schedule of investments (cont’d)
December 31, 2010
Western Asset Core Plus Bond Portfolio
| | | | | | | | | | | | | | | | |
| Security | | Rate | | | Maturity
Date | | | Face
Amount† | | | Value | |
Energy Equipment & Services — continued | | | | | | | | | | | | | | | | |
Transocean Inc., Senior Notes | | | 5.250 | % | | | 3/15/13 | | | | 360,000 | | | $ | 379,536 | |
Transocean Ltd. | | | 6.000 | % | | | 3/15/18 | | | | 6,015,000 | | | | 6,317,506 | |
Total Energy Equipment & Services | | | | | | | | | | | | | | | 12,527,875 | |
Oil, Gas & Consumable Fuels — 4.5% | | | | | | | | | | | | | | | | |
Anadarko Finance Co., Senior Notes | | | 7.500 | % | | | 5/1/31 | | | | 11,507,000 | | | | 12,723,854 | |
Anadarko Petroleum Corp., Senior Notes | | | 6.375 | % | | | 9/15/17 | | | | 5,660,000 | | | | 6,165,478 | |
Anadarko Petroleum Corp., Senior Notes | | | 8.700 | % | | | 3/15/19 | | | | 15,000 | | | | 18,318 | |
Apache Corp., Senior Notes | | | 6.000 | % | | | 1/15/37 | | | | 240,000 | | | | 263,930 | |
Apache Corp., Senior Notes | | | 5.100 | % | | | 9/1/40 | | | | 15,000,000 | | | | 14,574,555 | |
BP Capital Markets PLC, Guaranteed Notes | | | 5.250 | % | | | 11/7/13 | | | | 19,410,000 | | | | 21,021,282 | |
BP Capital Markets PLC, Guaranteed Notes | | | 3.875 | % | | | 3/10/15 | | | | 6,440,000 | | | | 6,642,796 | |
Chesapeake Energy Corp., Senior Notes | | | 6.875 | % | | | 8/15/18 | | | | 270,000 | | | | 274,050 | |
Chesapeake Energy Corp., Senior Notes | | | 7.250 | % | | | 12/15/18 | | | | 5,855,000 | | | | 6,059,925 | |
Chesapeake Energy Corp., Senior Notes | | | 6.625 | % | | | 8/15/20 | | | | 3,720,000 | | | | 3,664,200 | |
Compagnie Generale de Geophysique-Veritas, Senior Notes | | | 7.500 | % | | | 5/15/15 | | | | 1,970,000 | | | | 2,004,475 | |
Compagnie Generale de Geophysique-Veritas, Senior Notes | | | 7.750 | % | | | 5/15/17 | | | | 8,594,000 | | | | 8,808,850 | |
Conoco Funding Co. | | | 7.250 | % | | | 10/15/31 | | | | 810,000 | | | | 1,001,512 | |
ConocoPhillips | | | 5.900 | % | | | 10/15/32 | | | | 10,000 | | | | 10,988 | |
ConocoPhillips Holding Co., Senior Notes | | | 6.950 | % | | | 4/15/29 | | | | 638,000 | | | | 784,098 | |
CONSOL Energy Inc., Senior Notes | | | 8.250 | % | | | 4/1/20 | | | | 5,910,000 | | | | 6,382,800 | (d) |
Devon Energy Corp. | | | 6.300 | % | | | 1/15/19 | | | | 14,500,000 | | | | 17,063,788 | |
Devon Energy Corp., Debentures | | | 7.950 | % | | | 4/15/32 | | | | 970,000 | | | | 1,287,967 | |
El Paso Corp., Medium-Term Notes | | | 7.800 | % | | | 8/1/31 | | | | 3,267,000 | | | | 3,249,825 | |
El Paso Corp., Senior Subordinated Notes | | | 7.000 | % | | | 6/15/17 | | | | 19,000,000 | | | | 20,050,985 | |
Energy Transfer Partners LP | | | 6.125 | % | | | 2/15/17 | | | | 5,305,000 | | | | 5,831,707 | |
Energy Transfer Partners LP, Senior Notes | | | 9.700 | % | | | 3/15/19 | | | | 13,630,000 | | | | 17,616,230 | |
Enterprise Products Operating LLP, Senior Bonds | | | 6.300 | % | | | 9/15/17 | | | | 4,300,000 | | | | 4,852,047 | |
Gazprom, Loan Participation Notes | | | 6.212 | % | | | 11/22/16 | | | | 1,996,000 | | | | 2,115,760 | (d) |
Hess Corp., Notes | | | 8.125 | % | | | 2/15/19 | | | | 22,800,000 | | | | 28,804,836 | |
Hess Corp., Notes | | | 7.875 | % | | | 10/1/29 | | | | 5,290,000 | | | | 6,639,056 | |
Hess Corp., Notes | | | 7.300 | % | | | 8/15/31 | | | | 1,035,000 | | | | 1,241,290 | |
Kerr-McGee Corp., Notes | | | 6.950 | % | | | 7/1/24 | | | | 2,780,000 | | | | 3,021,807 | |
Kerr-McGee Corp., Notes | | | 7.875 | % | | | 9/15/31 | | | | 8,240,000 | | | | 9,445,875 | |
Kinder Morgan Energy Partners LP, Medium-Term Notes | | | 6.950 | % | | | 1/15/38 | | | | 1,447,000 | | | | 1,572,310 | |
Kinder Morgan Energy Partners LP, Notes | | | 6.750 | % | | | 3/15/11 | | | | 40,000 | | | | 40,444 | |
See Notes to Financial Statements.
| | | | |
| Western Asset Core Plus Bond Portfolio 2010 Annual Report | | | 17 | |
Western Asset Core Plus Bond Portfolio
| | | | | | | | | | | | | | | | |
| Security | | Rate | | | Maturity
Date | | | Face
Amount† | | | Value | |
Oil, Gas & Consumable Fuels — continued | | | | | | | | | | | | | | | | |
Kinder Morgan Energy Partners LP, Senior Notes | | | 7.125 | % | | | 3/15/12 | | | | 7,670,000 | | | $ | 8,182,310 | |
Kinder Morgan Energy Partners LP, Senior Notes | | | 5.850 | % | | | 9/15/12 | | | | 20,000 | | | | 21,445 | |
Kinder Morgan Energy Partners LP, Senior Notes | | | 5.000 | % | | | 12/15/13 | | | | 1,879,000 | | | | 2,041,475 | |
Kinder Morgan Energy Partners LP, Senior Notes | | | 6.000 | % | | | 2/1/17 | | | | 5,190,000 | | | | 5,730,040 | |
Noble Energy Inc., Senior Notes | | | 8.250 | % | | | 3/1/19 | | | | 14,600,000 | | | | 18,243,999 | |
Occidental Petroleum Corp., Senior Notes | | | 7.000 | % | | | 11/1/13 | | | | 360,000 | | | | 416,240 | |
Peabody Energy Corp., Senior Notes | | | 6.500 | % | | | 9/15/20 | | | | 6,170,000 | | | | 6,586,475 | |
Pemex Project Funding Master Trust, Senior Bonds | | | 6.625 | % | | | 6/15/35 | | | | 21,623,000 | | | | 22,001,273 | |
Pemex Project Funding Master Trust, Senior Notes | | | 0.903 | % | | | 12/3/12 | | | | 104,000 | | | | 103,324 | (d)(g) |
Petrobras International Finance Co., Senior Notes | | | 6.125 | % | | | 10/6/16 | | | | 6,250,000 | | | | 6,875,144 | |
Petrobras International Finance Co., Senior Notes | | | 5.750 | % | | | 1/20/20 | | | | 5,457,000 | | | | 5,662,009 | |
QEP Resources Inc., Senior Notes | | | 6.875 | % | | | 3/1/21 | | | | 6,550,000 | | | | 6,877,500 | |
Range Resources Corp., Senior Subordinated Notes | | | 6.750 | % | | | 8/1/20 | | | | 6,330,000 | | | | 6,527,813 | |
SandRidge Energy Inc., Senior Notes | | | 9.875 | % | | | 5/15/16 | | | | 5,170,000 | | | | 5,467,275 | (d) |
Seariver Maritime Financial Holdings | | | 0.000 | % | | | 9/1/12 | | | | 70,000 | | | | 67,324 | |
Shell International Finance BV, Senior Notes | | | 4.375 | % | | | 3/25/20 | | | | 1,910,000 | | | | 2,003,317 | |
Shell International Finance BV, Senior Notes | | | 6.375 | % | | | 12/15/38 | | | | 11,845,000 | | | | 14,039,049 | |
Williams Cos. Inc., Debentures | | | 7.500 | % | | | 1/15/31 | | | | 733,000 | | | | 823,197 | |
Williams Cos. Inc., Notes | | | 7.875 | % | | | 9/1/21 | | | | 12,737,000 | | | | 15,033,952 | |
Williams Cos. Inc., Senior Notes | | | 7.750 | % | | | 6/15/31 | | | | 392,000 | | | | 442,122 | |
Williams Partners LP, Senior Notes | | | 5.250 | % | | | 3/15/20 | | | | 13,680,000 | | | | 14,180,688 | |
Total Oil, Gas & Consumable Fuels | | | | | | | | | | | | | | | 354,561,009 | |
Total Energy | | | | | | | | | | | | | | | 367,088,884 | |
| Financials — 12.5% | | | | | | | | | | | | | | | | |
Capital Markets — 1.8% | | | | | | | | | | | | | | | | |
Bear Stearns Co. Inc., Senior Notes | | | 6.400 | % | | | 10/2/17 | | | | 925,000 | | | | 1,054,535 | |
Bear Stearns Cos. LLC, Senior Notes | | | 7.250 | % | | | 2/1/18 | | | | 4,670,000 | | | | 5,534,240 | |
Credit Suisse Guernsey Ltd., Junior Subordinated Notes | | | 5.860 | % | | | 5/15/17 | | | | 150,000 | | | | 141,750 | (g)(h) |
Goldman Sachs Capital II, Junior Subordinated Bonds | | | 5.793 | % | | | 6/1/12 | | | | 1,810,000 | | | | 1,533,975 | (g)(h) |
Goldman Sachs Group Inc. | | | 5.625 | % | | | 1/15/17 | | | | 1,420,000 | | | | 1,501,562 | |
Goldman Sachs Group Inc., Senior Notes | | | 6.600 | % | | | 1/15/12 | | | | 4,385,000 | | | | 4,636,975 | |
Goldman Sachs Group Inc., Senior Notes | | | 5.300 | % | | | 2/14/12 | | | | 584,000 | | | | 611,085 | |
Goldman Sachs Group Inc., Senior Notes | | | 3.625 | % | | | 8/1/12 | | | | 2,429,000 | | | | 2,506,740 | |
Goldman Sachs Group Inc., Senior Notes | | | 5.450 | % | | | 11/1/12 | | | | 3,892,000 | | | | 4,162,595 | |
Goldman Sachs Group Inc., Senior Notes | | | 4.750 | % | | | 7/15/13 | | | | 1,184,000 | | | | 1,261,284 | |
Goldman Sachs Group Inc., Senior Notes | | | 5.250 | % | | | 10/15/13 | | | | 3,599,000 | | | | 3,894,903 | |
See Notes to Financial Statements.
| | |
| 18 | | Western Asset Core Plus Bond Portfolio 2010 Annual Report |
Schedule of investments (cont’d)
December 31, 2010
Western Asset Core Plus Bond Portfolio
| | | | | | | | | | | | | | | | |
| Security | | Rate | | | Maturity
Date | | | Face
Amount† | | | Value | |
Capital Markets — continued | | | | | | | | | | | | | | | | |
Goldman Sachs Group Inc., Senior Notes | | | 5.375 | % | | | 3/15/20 | | | | 44,380,000 | | | $ | 45,860,561 | |
Kaupthing Bank HF, Senior Notes | | | 5.750 | % | | | 10/4/11 | | | | 5,550,000 | | | | 1,484,625 | (a)(c)(d) |
Kaupthing Bank HF, Senior Notes | | | 7.625 | % | | | 2/28/15 | | | | 80,340,000 | | | | 21,490,950 | (a)(c)(d) |
Lehman Brothers Holdings Capital Trust VII, Medium-Term Notes | | | 5.857 | % | | | 5/31/12 | | | | 5,530,000 | | | | 553 | (a)(g)(h) |
Lehman Brothers Holdings Inc., Subordinated Notes | | | 6.500 | % | | | 7/19/17 | | | | 5,280,000 | | | | 528 | (a) |
Merrill Lynch and Co. Inc. | | | 6.050 | % | | | 5/16/16 | | | | 390,000 | | | | 401,821 | |
Morgan Stanley, Medium-Term Notes | | | 0.739 | % | | | 10/18/16 | | | | 7,380,000 | | | | 6,816,006 | (g) |
Morgan Stanley, Medium-Term Notes | | | 5.550 | % | | | 4/27/17 | | | | 16,755,000 | | | | 17,455,359 | |
Morgan Stanley, Subordinated Notes | | | 4.750 | % | | | 4/1/14 | | | | 8,460,000 | | | | 8,663,268 | |
UBS AG Stamford CT, Senior Notes | | | 3.875 | % | | | 1/15/15 | | | | 11,430,000 | | | | 11,780,010 | |
UBS AG Stamford CT, Senior Notes | | | 4.875 | % | | | 8/4/20 | | | | 4,870,000 | | | | 4,954,446 | |
Total Capital Markets | | | | | | | | | | | | | | | 145,747,771 | |
Commercial Banks — 3.6% | | | | | | | | | | | | | | | | |
BAC Capital Trust XIV, Junior Subordinated Notes | | | 5.630 | % | | | 3/15/12 | | | | 2,240,000 | | | | 1,590,848 | (g)(h) |
Bank of Tokyo-Mitsubishi UFJ Ltd., Senior Notes | | | 3.850 | % | | | 1/22/15 | | | | 12,310,000 | | | | 12,834,283 | (d) |
Bank One Corp., Subordinated Notes | | | 5.900 | % | | | 11/15/11 | | | | 2,000,000 | | | | 2,085,658 | |
BankAmerica Institutional Capital A, Junior Subordinated Bonds | | | 8.070 | % | | | 12/31/26 | | | | 459,000 | | | | 461,869 | (d) |
Barclays Bank PLC, Senior Notes | | | 5.200 | % | | | 7/10/14 | | | | 3,015,000 | | | | 3,256,447 | |
Barclays Bank PLC, Subordinated Notes | | | 6.050 | % | | | 12/4/17 | | | | 11,715,000 | | | | 12,017,282 | (d) |
Commonwealth Bank of Australia, Senior Notes | | | 3.750 | % | | | 10/15/14 | | | | 10,260,000 | | | | 10,643,755 | (d) |
Commonwealth Bank of Australia, Senior Notes | | | 5.000 | % | | | 10/15/19 | | | | 4,390,000 | | | | 4,595,096 | (d) |
Credit Agricole SA, Subordinated Notes | | | 8.375 | % | | | 10/13/19 | | | | 22,940,000 | | | | 23,570,850 | (d)(g)(h) |
Glitnir Banki HF, Notes | | | 6.330 | % | | | 7/28/11 | | | | 10,670,000 | | | | 3,174,325 | (a)(c)(d) |
Glitnir Banki HF, Notes | | | 6.375 | % | | | 9/25/12 | | | | 18,040,000 | | | | 5,366,900 | (a)(c)(d) |
HBOS Capital Funding LP, Tier 1 Notes, Perpetual Bonds | | | 6.071 | % | | | 6/30/14 | | | | 60,000 | | | | 48,900 | (d)(g)(h) |
HBOS Treasury Services PLC | | | 5.250 | % | | | 2/21/17 | | | | 4,570,000 | | | | 4,739,323 | (d) |
HSBC Capital Funding LP, Subordinated Notes | | | 4.610 | % | | | 6/27/13 | | | | 2,090,000 | | | | 1,973,602 | (d)(g)(h) |
Hypothekenbank in Essen AG | | | 5.000 | % | | | 1/20/12 | | | | 1,380,000 | | | | 1,435,378 | (d) |
ICICI Bank Ltd., Subordinated Bonds | | | 6.375 | % | | | 4/30/22 | | | | 7,003,000 | | | | 6,674,356 | (d)(g) |
ICICI Bank Ltd., Subordinated Bonds | | | 6.375 | % | | | 4/30/22 | | | | 4,969,000 | | | | 4,981,721 | (d)(g) |
Intesa Sanpaolo SpA, Senior Notes | | | 3.625 | % | | | 8/12/15 | | | | 7,280,000 | | | | 7,037,853 | (d) |
Korea Development Bank | | | 5.500 | % | | | 11/13/12 | | | | 60,000 | | | | 63,637 | |
Landsbanki Islands HF, Senior Notes | | | 6.100 | % | | | 8/25/11 | | | | 28,520,000 | | | | 3,137,200 | (a)(c)(d) |
Lloyds TSB Bank PLC, Medium-Term Notes, Senior Bonds | | | 4.375 | % | | | 1/12/15 | | | | 12,300,000 | | | | 12,297,196 | (d) |
Lloyds TSB Bank PLC, Notes | | | 5.800 | % | | | 1/13/20 | | | | 1,720,000 | | | | 1,698,268 | (d) |
See Notes to Financial Statements.
| | | | |
| Western Asset Core Plus Bond Portfolio 2010 Annual Report | | | 19 | |
Western Asset Core Plus Bond Portfolio
| | | | | | | | | | | | | | | | |
| Security | | Rate | | | Maturity
Date | | | Face
Amount† | | | Value | |
Commercial Banks — continued | | | | | | | | | | | | | | | | |
NB Capital Trust IV, Junior Subordinated Notes | | | 8.250 | % | | | 4/15/27 | | | | 6,300,000 | | | $ | 6,378,750 | |
Nordea Bank AB, Senior Notes | | | 3.700 | % | | | 11/13/14 | | | | 9,790,000 | | | | 10,091,189 | (d) |
Nordea Bank AB, Senior Notes | | | 4.875 | % | | | 1/27/20 | | | | 950,000 | | | | 974,607 | (d) |
Rabobank Nederland NV, Junior Subordinated Notes | | | 11.000 | % | | | 6/30/19 | | | | 13,172,000 | | | | 17,024,810 | (d)(g)(h) |
Resona Preferred Global Securities Cayman Ltd., Junior Subordinated Bonds | | | 7.191 | % | | | 7/30/15 | | | | 12,200,000 | | | | 12,108,622 | (d)(g)(h) |
Royal Bank of Scotland Group PLC, Junior Subordinated Notes, Medium-Term Notes | | | 7.640 | % | | | 9/29/17 | | | | 7,500,000 | | | | 4,987,500 | (g)(h) |
Royal Bank of Scotland Group PLC, Senior Notes | | | 6.400 | % | | | 10/21/19 | | | | 20,510,000 | | | | 20,640,300 | |
Royal Bank of Scotland PLC, Senior Notes | | | 4.875 | % | | | 3/16/15 | | | | 4,130,000 | | | | 4,224,676 | |
Royal Bank of Scotland PLC, Senior Notes | | | 3.950 | % | | | 9/21/15 | | | | 21,330,000 | | | | 20,968,072 | |
Santander US Debt SA Unipersonal, Senior Notes | | | 3.724 | % | | | 1/20/15 | | | | 15,000,000 | | | | 14,211,900 | (d) |
Santander US Debt SA Unipersonal, Senior Notes | | | 3.781 | % | | | 10/7/15 | | | | 2,200,000 | | | | 2,067,083 | (d) |
Sumitomo Mitsui Banking Corp., Senior Notes | | | 3.150 | % | | | 7/22/15 | | | | 13,440,000 | | | | 13,679,151 | (d) |
SunTrust Capital, Trust Preferred Securities | | | 6.100 | % | | | 12/15/36 | | | | 3,140,000 | | | | 2,873,100 | (g) |
Wachovia Capital Trust III, Junior Subordinated Bonds | | | 5.800 | % | | | 3/15/11 | | | | 8,420,000 | | | | 7,304,350 | (g)(h) |
Wachovia Corp., Senior Notes | | | 5.750 | % | | | 2/1/18 | | | | 13,275,000 | | | | 14,739,259 | |
Wachovia Corp., Subordinated Notes | | | 5.250 | % | | | 8/1/14 | | | | 720,000 | | | | 767,876 | |
Wells Fargo & Co., Notes | | | 5.300 | % | | | 8/26/11 | | | | 75,000 | | | | 77,302 | |
Wells Fargo & Co., Subordinated Notes | | | 5.000 | % | | | 11/15/14 | | | | 130,000 | | | | 138,043 | |
Wells Fargo Capital X, Capital Securities | | | 5.950 | % | | | 12/15/36 | | | | 6,995,000 | | | | 6,752,022 | |
Total Commercial Banks | | | | | | | | | | | | | | | 283,693,359 | |
Consumer Finance — 0.9% | | | | | | | | | | | | | | | | |
Ally Financial Inc., Senior Notes | | | 6.625 | % | | | 5/15/12 | | | | 177,000 | | | | 183,638 | |
Ally Financial Inc., Senior Notes | | | 8.300 | % | | | 2/12/15 | | | | 320,000 | | | | 352,000 | |
Ally Financial Inc., Senior Notes | | | 8.000 | % | | | 3/15/20 | | | | 950,000 | | | | 1,037,875 | |
American Express Co., Subordinated Debentures | | | 6.800 | % | | | 9/1/66 | | | | 10,485,000 | | | | 10,380,150 | (g) |
American Express Credit Corp., Senior Notes | | | 5.125 | % | | | 8/25/14 | | | | 21,660,000 | | | | 23,353,465 | |
American General Finance Corp., Medium-Term Notes | | | 6.900 | % | | | 12/15/17 | | | | 5,440,000 | | | | 4,392,800 | |
Caterpillar Financial Services Corp., Senior Notes | | | 6.200 | % | | | 9/30/13 | | | | 290,000 | | | | 325,578 | |
HSBC Finance Corp. | | | 7.000 | % | | | 5/15/12 | | | | 160,000 | | | | 171,671 | |
HSBC Finance Corp., Senior Subordinated Notes | | | 6.676 | % | | | 1/15/21 | | | | 17,270,000 | | | | 17,447,553 | (d) |
HSBC Finance Corp., Subordinated Notes | | | 6.375 | % | | | 11/27/12 | | | | 520,000 | | | | 563,766 | |
SLM Corp. | | | 5.000 | % | | | 4/15/15 | | | | 740,000 | | | | 712,886 | |
SLM Corp., Medium-Term Notes, Senior Notes | | | 5.375 | % | | | 5/15/14 | | | | 1,700,000 | | | | 1,708,378 | |
SLM Corp., Medium-Term Notes, Senior Notes | | | 5.050 | % | | | 11/14/14 | | | | 4,690,000 | | | | 4,482,158 | |
See Notes to Financial Statements.
| | |
| 20 | | Western Asset Core Plus Bond Portfolio 2010 Annual Report |
Schedule of investments (cont’d)
December 31, 2010
Western Asset Core Plus Bond Portfolio
| | | | | | | | | | | | | | | | |
| Security | | Rate | | | Maturity
Date | | | Face
Amount† | | | Value | |
Consumer Finance — continued | | | | | | | | | | | | | | | | |
SLM Corp., Medium-Term Notes, Senior Notes | | | 5.625 | % | | | 8/1/33 | | | | 4,160,000 | | | $ | 3,264,148 | |
Total Consumer Finance | | | | | | | | | | | | | | | 68,376,066 | |
Diversified Financial Services — 5.5% | | | | | | | | | | | | | | | | |
Air 2 US, Notes | | | 8.027 | % | | | 10/1/19 | | | | 8,656,870 | | | | 8,613,586 | (d) |
Bank of America Corp. | | | 5.750 | % | | | 12/1/17 | | | | 480,000 | | | | 499,500 | |
Bank of America Corp., Senior Notes | | | 4.500 | % | | | 4/1/15 | | | | 25,520,000 | | | | 25,936,869 | |
Bank of America Corp., Senior Notes | | | 7.625 | % | | | 6/1/19 | | | | 5,845,000 | | | | 6,730,138 | |
Bank of America Corp., Senior Notes | | | 5.625 | % | | | 7/1/20 | | | | 20,750,000 | | | | 21,154,459 | |
Bank of America Corp., Subordinated Notes | | | 5.420 | % | | | 3/15/17 | | | | 2,030,000 | | | | 2,011,629 | |
Boeing Capital Corp., Senior Notes | | | 4.700 | % | | | 10/27/19 | | | | 5,760,000 | | | | 6,106,735 | |
Citigroup Inc., Notes | | | 6.500 | % | | | 8/19/13 | | | | 150,000 | | | | 164,709 | |
Citigroup Inc., Senior Notes | | | 6.000 | % | | | 12/13/13 | | | | 20,500,000 | | | | 22,401,067 | |
Citigroup Inc., Senior Notes | | | 6.375 | % | | | 8/12/14 | | | | 5,040,000 | | | | 5,570,243 | |
Citigroup Inc., Senior Notes | | | 5.500 | % | | | 10/15/14 | | | | 1,101,000 | | | | 1,186,269 | |
Citigroup Inc., Senior Notes | | | 6.010 | % | | | 1/15/15 | | | | 18,410,000 | | | | 20,196,249 | |
Citigroup Inc., Senior Notes | | | 5.875 | % | | | 5/29/37 | | | | 6,040,000 | | | | 5,908,872 | |
Citigroup Inc., Senior Notes | | | 6.875 | % | | | 3/5/38 | | | | 33,410,000 | | | | 37,059,675 | |
Citigroup Inc., Subordinated Notes | | | 5.000 | % | | | 9/15/14 | | | | 270,000 | | | | 279,309 | |
Citigroup Inc., Subordinated Notes | | | 6.125 | % | | | 8/25/36 | | | | 180,000 | | | | 172,477 | |
European Investment Bank, Senior Bonds | | | 4.625 | % | | | 3/21/12 | | | | 50,000 | | | | 52,413 | |
General Electric Capital Corp., Medium-Term Notes | | | 5.450 | % | | | 1/15/13 | | | | 1,175,000 | | | | 1,263,594 | |
General Electric Capital Corp., Senior Notes | | | 2.125 | % | | | 12/21/12 | | | | 53,010,000 | | | | 54,464,382 | |
General Electric Capital Corp., Senior Notes | | | 5.625 | % | | | 5/1/18 | | | | 530,000 | | | | 577,972 | |
General Electric Capital Corp., Senior Notes | | | 5.500 | % | | | 1/8/20 | | | | 2,330,000 | | | | 2,491,905 | |
General Electric Capital Corp., Senior Notes | | | 6.875 | % | | | 1/10/39 | | | | 48,530,000 | | | | 56,084,180 | |
General Electric Capital Corp., Subordinated Debentures | | | 6.375 | % | | | 11/15/67 | | | | 47,395,000 | | | | 46,921,050 | (g) |
ILFC E-Capital Trust I | | | 5.900 | % | | | 12/21/65 | | | | 14,410,000 | | | | 10,909,235 | (d)(g) |
ILFC E-Capital Trust II, Bonds | | | 6.250 | % | | | 12/21/65 | | | | 2,760,000 | | | | 2,152,800 | (d)(g) |
International Lease Finance Corp., Senior Secured Notes | | | 6.500 | % | | | 9/1/14 | | | | 5,440,000 | | | | 5,766,400 | (d) |
International Lease Finance Corp., Senior Secured Notes | | | 6.750 | % | | | 9/1/16 | | | | 27,110,000 | | | | 28,939,925 | (d) |
JPMorgan Chase & Co. | | | 4.400 | % | | | 7/22/20 | | | | 10,770,000 | | | | 10,600,329 | |
JPMorgan Chase & Co., Senior Notes | | | 6.300 | % | | | 4/23/19 | | | | 9,630,000 | | | | 10,961,396 | |
JPMorgan Chase & Co., Senior Notes | | | 4.250 | % | | | 10/15/20 | | | | 13,010,000 | | | | 12,706,216 | |
JPMorgan Chase & Co., Subordinated Notes | | | 5.750 | % | | | 1/2/13 | | | | 4,430,000 | | | | 4,800,158 | |
JPMorgan Chase & Co., Subordinated Notes | | | 5.150 | % | | | 10/1/15 | | | | 490,000 | | | | 518,233 | |
See Notes to Financial Statements.
| | | | |
| Western Asset Core Plus Bond Portfolio 2010 Annual Report | | | 21 | |
Western Asset Core Plus Bond Portfolio
| | | | | | | | | | | | | | | | |
| Security | | Rate | | | Maturity
Date | | | Face
Amount† | | | Value | |
Diversified Financial Services — continued | | | | | | | | | | | | | | | | |
JPMorgan Chase & Co., Subordinated Notes | | | 6.125 | % | | | 6/27/17 | | | | 60,000 | | | $ | 65,828 | |
MUFG Capital Finance 1 Ltd., Preferred Securities | | | 6.346 | % | | | 7/25/16 | | | | 7,400,000 | | | | 7,456,884 | (g)(h) |
Patrons’ Legacy | | | 5.775 | % | | | 12/23/63 | | | | 8,900,000 | | | | 8,587,610 | (d)(f) |
Pemex Finance Ltd., Notes | | | 9.030 | % | | | 2/15/11 | | | | 500 | | | | 504 | |
PHH Corp. | | | 7.125 | % | | | 3/1/13 | | | | 5,940,000 | | | | 5,925,150 | |
TNK-BP Finance SA, Senior Notes | | | 6.625 | % | | | 3/20/17 | | | | 3,575,000 | | | | 3,798,438 | (d) |
Total Diversified Financial Services | | | | | | | | | | | | | | | 439,036,388 | |
Insurance — 0.5% | | | | | | | | | | | | | | | | |
American International Group Inc., Junior Subordinated Debentures | | | 6.250 | % | | | 3/15/37 | | | | 360,000 | | | | 318,366 | |
ASIF Global Financing XIX | | | 4.900 | % | | | 1/17/13 | | | | 2,180,000 | | | | 2,245,400 | (d) |
Berkshire Hathaway Inc., Senior Notes | | | 3.200 | % | | | 2/11/15 | | | | 14,460,000 | | | | 14,920,985 | |
MetLife Capital Trust IV, Junior Subordinated Notes | | | 7.875 | % | | | 12/15/37 | | | | 8,900,000 | | | | 9,411,750 | (d) |
MetLife Inc., Junior Subordinated Debentures | | | 6.400 | % | | | 12/15/66 | | | | 2,905,000 | | | | 2,730,700 | |
MetLife Inc., Senior Notes | | | 7.717 | % | | | 2/15/19 | | | | 2,120,000 | | | | 2,602,790 | |
MetLife Inc., Senior Notes | | | 4.750 | % | | | 2/8/21 | | | | 6,300,000 | | | | 6,432,445 | |
MetLife Inc., Senior Notes | | | 5.875 | % | | | 2/6/41 | | | | 2,770,000 | | | | 2,920,488 | |
Total Insurance | | | | | | | | | | | | | | | 41,582,924 | |
Real Estate Investment Trusts (REITs) — 0.1% | | | | | | | | | | | | | | | | |
Health Care Property Investors Inc. | | | 6.450 | % | | | 6/25/12 | | | | 6,240,000 | | | | 6,582,901 | |
Thrifts & Mortgage Finance — 0.1% | | | | | | | | | | | | | | | | |
Countrywide Financial Corp., Medium-Term Notes | | | 5.800 | % | | | 6/7/12 | | | | 350,000 | | | | 368,234 | |
Countrywide Financial Corp., Subordinated Notes | | | 6.250 | % | | | 5/15/16 | | | | 6,441,000 | | | | 6,605,155 | |
Total Thrifts & Mortgage Finance | | | | | | | | | | | | | | | 6,973,389 | |
Total Financials | | | | | | | | | | | | | | | 991,992,798 | |
| Health Care — 2.1% | | | | | | | | | | | | | | | | |
Health Care Equipment & Supplies — 0.1% | | | | | | | | | | | | | | | | |
Medtronic Inc., Senior Notes | | | 4.450 | % | | | 3/15/20 | | | | 6,810,000 | | | | 7,069,979 | |
Health Care Providers & Services — 1.0% | | | | | | | | | | | | | | | | |
AmerisourceBergen Corp. | | | 5.625 | % | | | 9/15/12 | | | | 6,445,000 | | | | 6,884,291 | |
AmerisourceBergen Corp. | | | 5.875 | % | | | 9/15/15 | | | | 5,350,000 | | | | 5,899,932 | |
Community Health Systems Inc., Senior Notes | | | 8.875 | % | | | 7/15/15 | | | | 5,820,000 | | | | 6,111,000 | |
DaVita Inc., Senior Notes | | | 6.625 | % | | | 11/1/20 | | | | 3,050,000 | | | | 3,019,500 | |
HCA Inc., Debentures | | | 7.500 | % | | | 11/15/95 | | | | 15,410,000 | | | | 12,250,950 | |
HCA Inc., Notes | | | 7.690 | % | | | 6/15/25 | | | | 723,000 | | | | 694,080 | |
HCA Inc., Notes | | | 7.500 | % | | | 11/6/33 | | | | 1,105,000 | | | | 1,016,600 | |
HCA Inc., Senior Notes | | | 7.875 | % | | | 2/1/11 | | | | 1,000,000 | | | | 1,002,500 | |
HCA Inc., Senior Notes | | | 6.300 | % | | | 10/1/12 | | | | 299,000 | | | | 305,728 | |
See Notes to Financial Statements.
| | |
| 22 | | Western Asset Core Plus Bond Portfolio 2010 Annual Report |
Schedule of investments (cont’d)
December 31, 2010
Western Asset Core Plus Bond Portfolio
| | | | | | | | | | | | | | | | |
| Security | | Rate | | | Maturity
Date | | | Face
Amount† | | | Value | |
Health Care Providers & Services — continued | | | | | | | | | | | | | | | | |
HCA Inc., Senior Notes | | | 6.250 | % | | | 2/15/13 | | | | 1,243,000 | | | $ | 1,267,860 | |
HCA Inc., Senior Notes | | | 5.750 | % | | | 3/15/14 | | | | 311,000 | | | | 306,335 | |
Tenet Healthcare Corp., Senior Notes | | | 9.250 | % | | | 2/1/15 | | | | 11,570,000 | | | | 12,322,050 | |
Tenet Healthcare Corp., Senior Secured Notes | | | 9.000 | % | | | 5/1/15 | | | | 1,250,000 | | | | 1,387,500 | |
Tenet Healthcare Corp., Senior Secured Notes | | | 8.875 | % | | | 7/1/19 | | | | 1,220,000 | | | | 1,378,600 | |
UnitedHealth Group Inc. | | | 4.875 | % | | | 4/1/13 | | | | 18,130,000 | | | | 19,372,775 | |
UnitedHealth Group Inc., Senior Notes | | | 4.875 | % | | | 2/15/13 | | | | 180,000 | | | | 191,636 | |
WellPoint Inc., Notes | | | 5.875 | % | | | 6/15/17 | | | | 3,040,000 | | | | 3,398,115 | |
WellPoint Inc., Notes | | | 7.000 | % | | | 2/15/19 | | | | 5,500,000 | | | | 6,474,248 | |
Total Health Care Providers & Services | | | | | | | | | | | | | | | 83,283,700 | |
Pharmaceuticals — 1.0% | | | | | | | | | | | | | | | | |
Abbott Laboratories, Senior Notes | | | 5.125 | % | | | 4/1/19 | | | | 24,230,000 | | | | 26,678,781 | |
Merck and Co. Inc. | | | 6.000 | % | | | 9/15/17 | | | | 340,000 | | | | 397,319 | |
Pfizer Inc., Senior Notes | | | 6.200 | % | | | 3/15/19 | | | | 17,695,000 | | | | 20,727,233 | |
Roche Holdings Inc., Senior Notes | | | 6.000 | % | | | 3/1/19 | | | | 9,990,000 | | | | 11,616,762 | (d) |
Wyeth, Notes | | | 5.950 | % | | | 4/1/37 | | | | 15,055,000 | | | | 16,660,269 | |
Total Pharmaceuticals | | | | | | | | | | | | | | | 76,080,364 | |
Total Health Care | | | | | | | | | | | | | | | 166,434,043 | |
| Industrials — 2.1% | | | | | | | | | | | | | | | | |
Aerospace & Defense — 0.3% | | | | | | | | | | | | | | | | |
Boeing Co., Senior Notes | | | 6.000 | % | | | 3/15/19 | | | | 8,200,000 | | | | 9,434,256 | |
Boeing Co., Senior Notes | | | 4.875 | % | | | 2/15/20 | | | | 3,100,000 | | | | 3,337,119 | |
L-3 Communications Corp., Senior Subordinated Notes | | | 5.875 | % | | | 1/15/15 | | | | 800,000 | | | | 815,000 | |
Raytheon Co., Senior Notes | | | 3.125 | % | | | 10/15/20 | | | | 4,410,000 | | | | 4,066,413 | |
Systems 2001 Asset Trust | | | 6.664 | % | | | 9/15/13 | | | | 6,357,929 | | | | 6,975,284 | (d) |
Total Aerospace & Defense | | | | | | | | | | | | | | | 24,628,072 | |
Airlines — 0.7% | | | | | | | | | | | | | | | | |
Continental Airlines Inc. | | | 6.503 | % | | | 12/15/12 | | | | 1,065,000 | | | | 1,078,312 | |
Continental Airlines Inc., Pass-Through Certificates | | | 6.545 | % | | | 2/2/19 | | | | 7,345,953 | | | | 7,786,710 | |
Continental Airlines Inc., Pass-Through Certificates | | | 6.900 | % | | | 7/2/19 | | | | 50,994 | | | | 54,181 | |
Continental Airlines Inc., Pass-Through Certificates | | | 5.983 | % | | | 4/19/22 | | | | 9,077,086 | | | | 9,576,326 | |
Continental Airlines Inc., Pass-Through Certificates | | | 6.703 | % | | | 12/15/22 | | | | 183,249 | | | | 193,786 | |
DAE Aviation Holdings Inc., Senior Notes | | | 11.250 | % | | | 8/1/15 | | | | 1,950,000 | | | | 2,018,250 | (d) |
Delta Air Lines Inc., Pass-Through Certificates | | | 7.711 | % | | | 9/18/11 | | | | 350,000 | | | | 358,750 | |
Delta Air Lines Inc., Pass-Through Certificates | | | 7.111 | % | | | 3/18/13 | | | | 950,000 | | | | 980,875 | |
Delta Air Lines Inc., Pass-Through Certificates | | | 6.821 | % | | | 8/10/22 | | | | 14,509,854 | | | | 15,380,446 | |
Northwest Airlines Corp., Pass-Through Certificates | | | 7.575 | % | | | 9/1/20 | | | | 8,492,058 | | | | 9,128,962 | |
See Notes to Financial Statements.
| | | | |
| Western Asset Core Plus Bond Portfolio 2010 Annual Report | | | 23 | |
Western Asset Core Plus Bond Portfolio
| | | | | | | | | | | | | | | | |
| Security | | Rate | | | Maturity
Date | | | Face
Amount† | | | Value | |
Airlines — continued | | | | | | | | | | | | | | | | |
Northwest Airlines Inc. | | | 0.766 | % | | | 2/6/15 | | | | 990,474 | | | $ | 896,379 | (g) |
Southwest Airlines Co., Pass-Through Certificates Notes | | | 5.125 | % | | | 3/1/17 | | | | 5,320,000 | | | | 5,339,711 | |
United Airlines, Pass-Through Trust, Pass-Through Certificates, Secured Notes | | | 9.750 | % | | | 1/15/17 | | | | 5,748,422 | | | | 6,610,685 | |
Total Airlines | | | | | | | | | | | | | | | 59,403,373 | |
Building Products — 0.2% | | | | | | | | | | | | | | | | |
Masco Corp. | | | 7.125 | % | | | 8/15/13 | | | | 5,830,000 | | | | 6,258,464 | |
Masco Corp. | | | 6.125 | % | | | 10/3/16 | | | | 8,270,000 | | | | 8,451,692 | |
Total Building Products | | | | | | | | | | | | | | | 14,710,156 | |
Commercial Services & Supplies — 0.2% | | | | | | | | | | | | | | | | |
Allied Waste North America Inc., Senior Notes | | | 6.875 | % | | | 6/1/17 | | | | 2,660,000 | | | | 2,926,000 | |
Waste Management Inc. | | | 5.000 | % | | | 3/15/14 | | | | 6,938,000 | | | | 7,498,660 | |
Waste Management Inc. | | | 7.125 | % | | | 12/15/17 | | | | 500,000 | | | | 586,395 | |
Waste Management Inc., Senior Notes | | | 6.375 | % | | | 11/15/12 | | | | 2,110,000 | | | | 2,301,027 | |
Total Commercial Services & Supplies | | | | | | | | | | | | | | | 13,312,082 | |
Industrial Conglomerates — 0.6% | | | | | | | | | | | | | | | | |
General Electric Co., Notes | | | 5.000 | % | | | 2/1/13 | | | | 5,195,000 | | | | 5,553,315 | |
Tyco International Group SA, Guaranteed Notes | | | 6.750 | % | | | 2/15/11 | | | | 35,798,000 | | | | 36,046,259 | |
Tyco International Group SA, Notes | | | 6.000 | % | | | 11/15/13 | | | | 4,198,000 | | | | 4,657,001 | |
Total Industrial Conglomerates | | | | | | | | | | | | | | | 46,256,575 | |
Road & Rail — 0.1% | | | | | | | | | | | | | | | | |
Kansas City Southern de Mexico, Senior Notes | | | 12.500 | % | | | 4/1/16 | | | | 4,092,000 | | | | 5,012,700 | |
Total Industrials | | | | | | | | | | | | | | | 163,322,958 | |
| Information Technology — 0.2% | | | | | | | | | | | | | | | | |
Communications Equipment — 0.2% | | | | | | | | | | | | | | | | |
Motorola Inc. | | | 8.000 | % | | | 11/1/11 | | | | 10,850,000 | | | | 11,426,754 | |
IT Services — 0.0% | | | | | | | | | | | | | | | | |
Electronic Data Systems Corp. | | | 6.000 | % | | | 8/1/13 | | | | 775,000 | | | | 863,844 | |
International Business Machines Corp | | | 4.750 | % | | | 11/29/12 | | | | 40,000 | | | | 42,943 | |
International Business Machines Corp., Senior Notes | | | 5.600 | % | | | 11/30/39 | | | | 1,500,000 | | | | 1,634,294 | |
Total IT Services | | | | | | | | | | | | | | | 2,541,081 | |
Semiconductors & Semiconductor Equipment — 0.0% | | | | | | | | | |
National Semiconductor Corp., Senior Notes | | | 6.600 | % | | | 6/15/17 | | | | 1,320,000 | | | | 1,458,275 | |
Total Information Technology | | | | | | | | | | | | | | | 15,426,110 | |
| Materials — 1.6% | | | | | | | | | | | | | | | | |
Chemicals — 0.0% | | | | | | | | | | | | | | | | |
Potash Corp. of Saskatchewan Inc., Senior Notes | | | 4.875 | % | | | 3/30/20 | | | | 320,000 | | | | 334,306 | |
Westlake Chemical Corp., Senior Notes | | | 6.625 | % | | | 1/15/16 | | | | 810,000 | | | | 837,337 | |
Total Chemicals | | | | | | | | | | | | | | | 1,171,643 | |
See Notes to Financial Statements.
| | |
| 24 | | Western Asset Core Plus Bond Portfolio 2010 Annual Report |
Schedule of investments (cont’d)
December 31, 2010
Western Asset Core Plus Bond Portfolio
| | | | | | | | | | | | | | | | |
| Security | | Rate | | | Maturity
Date | | | Face
Amount† | | | Value | |
Containers & Packaging — 0.3% | | | | | | | | | | | | | | | | |
Ball Corp., Senior Notes | | | 6.750 | % | | | 9/15/20 | | | | 8,384,000 | | | $ | 8,803,200 | |
Ball Corp., Senior Notes | | | 5.750 | % | | | 5/15/21 | | | | 9,920,000 | | | | 9,597,600 | |
Reynolds Group Issuer Inc./Reynolds Group Issuer LLC, Senior Secured Notes | | | 7.125 | % | | | 4/15/19 | | | | 2,480,000 | | | | 2,523,400 | (d) |
Total Containers & Packaging | | | | | | | | | | | | | | | 20,924,200 | |
Metals & Mining — 1.3% | | | | | | | | | | | | | | | | |
Barrick Gold Corp., Senior Notes | | | 6.950 | % | | | 4/1/19 | | | | 7,165,000 | | | | 8,792,028 | |
BHP Billiton Finance USA Ltd., Senior Notes | | | 6.500 | % | | | 4/1/19 | | | | 23,410,000 | | | | 27,837,861 | |
Corporacion Nacional del Cobre, Senior Notes | | | 4.750 | % | | | 10/15/14 | | | | 2,590,000 | | | | 2,766,781 | (d) |
Freeport-McMoRan Copper & Gold Inc., Senior Notes | | | 8.375 | % | | | 4/1/17 | | | | 14,195,000 | | | | 15,703,219 | |
Rio Tinto Finance USA Ltd., Notes | | | 6.500 | % | | | 7/15/18 | | | | 6,528,000 | | | | 7,610,636 | |
Rio Tinto Finance USA Ltd., Senior Notes | | | 1.875 | % | | | 11/2/15 | | | | 1,480,000 | | | | 1,424,371 | |
Rio Tinto Finance USA Ltd., Senior Notes | | | 3.500 | % | | | 11/2/20 | | | | 14,380,000 | | | | 13,650,488 | |
Steel Dynamics Inc., Senior Notes | | | 6.750 | % | | | 4/1/15 | | | | 5,890,000 | | | | 5,963,625 | |
Steel Dynamics Inc., Senior Notes | | | 7.750 | % | | | 4/15/16 | | | | 1,980,000 | | | | 2,083,950 | |
Teck Resources Ltd., Senior Secured Notes | | | 9.750 | % | | | 5/15/14 | | | | 297,000 | | | | 371,657 | |
Teck Resources Ltd., Senior Secured Notes | | | 10.250 | % | | | 5/15/16 | | | | 367,000 | | | | 454,163 | |
Vale Overseas Ltd., Notes | | | 8.250 | % | | | 1/17/34 | | | | 1,710,000 | | | | 2,126,739 | |
Vale Overseas Ltd., Notes | | | 6.875 | % | | | 11/21/36 | | | | 12,386,000 | | | | 13,624,377 | |
Total Metals & Mining | | | | | | | | | | | | | | | 102,409,895 | |
Paper & Forest Products — 0.0% | | | | | | | | | | | | | | | | |
Georgia-Pacific Corp., Notes | | | 8.125 | % | | | 5/15/11 | | | | 9,000 | | | | 9,292 | |
Total Materials | | | | | | | | | | | | | | | 124,515,030 | |
| Telecommunication Services — 2.4% | | | | | | | | | | | | | | | | |
Diversified Telecommunication Services — 1.7% | | | | | | | | | | | | | | | | |
AT&T Inc. | | | 6.300 | % | | | 1/15/38 | | | | 1,360,000 | | | | 1,434,729 | |
AT&T Inc., Global Notes | | | 5.600 | % | | | 5/15/18 | | | | 15,700,000 | | | | 17,517,181 | |
AT&T Inc., Senior Notes | | | 6.400 | % | | | 5/15/38 | | | | 3,257,000 | | | | 3,462,204 | |
BellSouth Corp. | | | 5.200 | % | | | 9/15/14 | | | | 8,250,000 | | | | 9,006,401 | |
BellSouth Corp., Notes | | | 4.750 | % | | | 11/15/12 | | | | 640,000 | | | | 682,688 | |
British Telecommunications PLC, Bonds | | | 9.875 | % | | | 12/15/30 | | | | 11,210,000 | | | | 14,941,036 | |
CenturyTel Inc. | | | 6.000 | % | | | 4/1/17 | | | | 8,270,000 | | | | 8,483,738 | |
Deutsche Telekom International Finance BV, Senior Notes | | | 5.750 | % | | | 3/23/16 | | | | 20,180,000 | | | | 22,601,318 | |
Intelsat Jackson Holdings Ltd., Senior Notes | | | 9.500 | % | | | 6/15/16 | | | | 1,367,000 | | | | 1,442,185 | |
Intelsat Jackson Holdings Ltd., Senior Notes | | | 8.500 | % | | | 11/1/19 | | | | 2,460,000 | | | | 2,675,250 | (d) |
Intelsat Jackson Holdings SA, Senior Notes | | | 7.250 | % | | | 10/15/20 | | | | 5,150,000 | | | | 5,201,500 | (d) |
See Notes to Financial Statements.
| | | | |
| Western Asset Core Plus Bond Portfolio 2010 Annual Report | | | 25 | |
Western Asset Core Plus Bond Portfolio
| | | | | | | | | | | | | | | | |
| Security | | Rate | | | Maturity
Date | | | Face
Amount† | | | Value | |
Diversified Telecommunication Services — continued | | | | | | | | | |
Qwest Communications International Inc., Senior Notes | | | 7.500 | % | | | 2/15/14 | | | | 2,754,000 | | | $ | 2,788,425 | |
Qwest Corp., Debentures | | | 6.875 | % | | | 9/15/33 | | | | 5,600,000 | | | | 5,502,000 | |
Qwest Corp., Senior Notes | | | 7.500 | % | | | 10/1/14 | | | | 2,680,000 | | | | 3,001,600 | |
SBC Communications Inc., Notes | | | 5.100 | % | | | 9/15/14 | | | | 8,640,000 | | | | 9,452,998 | |
Telecom Italia Capital, Senior Notes | | | 5.250 | % | | | 10/1/15 | | | | 6,280,000 | | | | 6,429,828 | |
Telecom Italia Capital SA | | | 5.250 | % | | | 11/15/13 | | | | 1,260,000 | | | | 1,312,676 | |
Telecom Italia Capital SA, Senior Notes | | | 4.950 | % | | | 9/30/14 | | | | 3,730,000 | | | | 3,821,545 | |
Telefonica Emisiones SAU, Senior Notes | | | 5.134 | % | | | 4/27/20 | | | | 10,625,000 | | | | 10,229,123 | |
Verizon Global Funding Corp., Notes | | | 7.375 | % | | | 9/1/12 | | | | 155,000 | | | | 171,132 | |
Verizon New York Inc., Senior Debentures | | | 6.875 | % | | | 4/1/12 | | | | 3,942,000 | | | | 4,205,132 | |
Windstream Corp., Senior Notes | | | 8.625 | % | | | 8/1/16 | | | | 574,000 | | | | 604,135 | |
Total Diversified Telecommunication Services | | | | | | | | | | | | 134,966,824 | |
Wireless Telecommunication Services — 0.7% | | | | | | | | | | | | | | | | |
America Movil SAB de CV, Senior Notes | | | 5.625 | % | | | 11/15/17 | | | | 6,290,000 | | | | 6,857,100 | |
America Movil SAB de CV, Senior Notes | | | 5.000 | % | | | 3/30/20 | | | | 4,980,000 | | | | 5,176,451 | |
Cellco Partnership/Verizon Wireless Capital LLC, Senior Notes | | | 8.500 | % | | | 11/15/18 | | | | 18,795,000 | | | | 24,594,197 | |
Cricket Communications Inc., Senior Secured Notes | | | 7.750 | % | | | 5/15/16 | | | | 6,215,000 | | | | 6,448,063 | |
Rogers Cable Inc., Senior Secured Notes | | | 7.875 | % | | | 5/1/12 | | | | 687,000 | | | | 746,309 | |
Rogers Cable Inc., Senior Secured Second Priority Notes | | | 6.750 | % | | | 3/15/15 | | | | 130,000 | | | | 150,903 | |
Rogers Wireless Inc., Secured Notes | | | 6.375 | % | | | 3/1/14 | | | | 1,850,000 | | | | 2,078,667 | |
Sprint Capital Corp., Global Notes | | | 6.900 | % | | | 5/1/19 | | | | 720,000 | | | | 711,000 | |
Sprint Capital Corp., Senior Notes | | | 8.375 | % | | | 3/15/12 | | | | 8,577,000 | | | | 9,070,178 | |
Sprint Capital Corp., Senior Notes | | | 8.750 | % | | | 3/15/32 | | | | 3,440,000 | | | | 3,474,400 | |
Total Wireless Telecommunication Services | | | | | | | | | | | | 59,307,268 | |
Total Telecommunication Services | | | | | | | | | | | | | | | 194,274,092 | |
| Utilities — 1.9% | | | | | | | | | | | | | | | | |
Electric Utilities — 0.6% | | | | | | | | | | | | | | | | |
Detroit Edison Co. | | | 5.200 | % | | | 10/15/12 | | | | 10,000 | | | | 10,698 | |
Duke Energy Corp., Senior Notes | | | 5.625 | % | | | 11/30/12 | | | | 1,010,000 | | | | 1,094,453 | |
FirstEnergy Corp., Notes | | | 6.450 | % | | | 11/15/11 | | | | 142,000 | | | | 147,778 | |
FirstEnergy Corp., Notes | | | 7.375 | % | | | 11/15/31 | | | | 25,665,000 | | | | 27,055,094 | |
Hydro-Quebec, Global Debentures | | | 6.300 | % | | | 5/11/11 | | | | 1,720,000 | | | | 1,755,427 | |
Pacific Gas & Electric Co., First Mortgage Bonds | | | 6.050 | % | | | 3/1/34 | | | | 2,650,000 | | | | 2,901,482 | |
Pacific Gas & Electric Co., Senior Notes | | | 8.250 | % | | | 10/15/18 | | | | 40,000 | | | | 51,970 | |
Pacific Gas & Electric Co., Senior Notes | | | 5.800 | % | | | 3/1/37 | | | | 11,790,000 | | | | 12,495,301 | |
See Notes to Financial Statements.
| | |
| 26 | | Western Asset Core Plus Bond Portfolio 2010 Annual Report |
Schedule of investments (cont’d)
December 31, 2010
Western Asset Core Plus Bond Portfolio
| | | | | | | | | | | | | | | | |
| Security | | Rate | | | Maturity
Date | | | Face
Amount† | | | Value | |
Electric Utilities — continued | | | | | | | | | | | | | | | | |
Progress Energy Inc. | | | 7.100 | % | | | 3/1/11 | | | | 52,000 | | | $ | 52,529 | |
Total Electric Utilities | | | | | | | | | | | | | | | 45,564,732 | |
Gas Utilities — 0.1% | | | | | | | | | | | | | | | | |
Southern Natural Gas Co., Senior Notes | | | 5.900 | % | | | 4/1/17 | | | | 50,000 | | | | 53,618 | (d) |
Southern Natural Gas Co., Senior Notes | | | 8.000 | % | | | 3/1/32 | | | | 9,410,000 | | | | 10,780,463 | |
Total Gas Utilities | | | | | | | | | | | | | | | 10,834,081 | |
Independent Power Producers & Energy Traders — 1.1% | | | | | | | | | | | | | |
AES Corp., Senior Notes | | | 7.750 | % | | | 3/1/14 | | | | 3,777,000 | | | | 4,031,948 | |
AES Corp., Senior Notes | | | 7.750 | % | | | 10/15/15 | | | | 7,490,000 | | | | 7,995,575 | |
AES Corp., Senior Notes | | | 8.000 | % | | | 6/1/20 | | | | 3,299,000 | | | | 3,496,940 | |
Calpine Construction Finance Co. LP and CCFC Finance Corp., Senior Secured Notes | | | 8.000 | % | | | 6/1/16 | | | | 7,205,000 | | | | 7,655,312 | (d) |
Calpine Corp., Senior Secured Notes | | | 7.500 | % | | | 2/15/21 | | | | 7,650,000 | | | | 7,535,250 | (d) |
Energy Future Holdings Corp., Senior Notes | | | 11.250 | % | | | 11/1/17 | | | | 20,096,363 | | | | 12,057,818 | (e) |
Energy Future Intermediate Holding Co. LLC/EFIH Finance Inc., Senior Secured Notes | | | 10.000 | % | | | 12/1/20 | | | | 45,406,000 | | | | 46,825,982 | |
NRG Energy Inc., Senior Notes | | | 7.375 | % | | | 2/1/16 | | | | 2,546,000 | | | | 2,609,650 | |
NRG Energy Inc., Senior Notes | | | 7.375 | % | | | 1/15/17 | | | | 595,000 | | | | 612,850 | |
Total Independent Power Producers & Energy Traders | | | | | | | | | | | | 92,821,325 | |
Multi-Utilities — 0.1% | | | | | | | | | | | | | | | | |
Dominion Resources Inc., Senior Notes | | | 5.700 | % | | | 9/17/12 | | | | 5,495,000 | | | | 5,912,867 | |
Dominion Resources Inc., Senior Notes | | | 8.875 | % | | | 1/15/19 | | | | 90,000 | | | | 116,614 | |
Total Multi-Utilities | | | | | | | | | | | | | | | 6,029,481 | |
Total Utilities | | | | | | | | | | | | | | | 155,249,619 | |
Total Corporate Bonds & Notes (Cost — $2,567,140,547) | | | | | | | | 2,575,422,323 | |
| Asset-backed Securities — 4.7% | | | | | | | | | | | | | | | | |
ACE Securities Corp., 2006-GP1 A | | | 0.391 | % | | | 2/25/31 | | | | 283,094 | | | | 212,961 | (g) |
ACE Securities Corp., 2006-SL3 A1 | | | 0.361 | % | | | 6/25/36 | | | | 864,713 | | | | 142,037 | (g) |
AESOP Funding II LLC, 2010-3A A | | | 4.640 | % | | | 5/20/16 | | | | 3,630,000 | | | | 3,823,680 | (d) |
AESOP Funding II LLC, 2010-5A A | | | 3.150 | % | | | 3/20/17 | | | | 7,310,000 | | | | 7,138,819 | (d) |
AFC Home Equity Loan Trust, 2002-2 2A | | | 0.561 | % | | | 6/25/30 | | | | 346,459 | | | | 160,112 | (g) |
Ameriquest Mortgage Securities Inc., 2003-1 M1 | | | 1.611 | % | | | 2/25/33 | | | | 1,416,307 | | | | 1,138,738 | (g) |
Asset-Backed Securities Corp., Home Equity Loan Trust, 2001-HE3 A1 | | | 0.800 | % | | | 11/15/31 | | | | 191,169 | | | | 169,895 | (g) |
Bear Stearns Asset Backed Securities Trust, 2005-CL1 A1 | | | 0.761 | % | | | 9/25/34 | | | | 6,695,416 | | | | 5,038,166 | (g) |
Bear Stearns Asset-Backed Securities Trust, 2006-1 A | | | 0.541 | % | | | 2/25/36 | | | | 1,065,549 | | | | 1,024,641 | (g) |
Bear Stearns Second Lien Trust, 2007-SV1A A1 | | | 0.481 | % | | | 12/25/36 | | | | 3,042,107 | | | | 2,702,833 | (d)(g) |
See Notes to Financial Statements.
| | | | |
| Western Asset Core Plus Bond Portfolio 2010 Annual Report | | | 27 | |
Western Asset Core Plus Bond Portfolio
| | | | | | | | | | | | | | |
| Security | | Rate | | | Maturity
Date | | Face
Amount† | | | Value | |
| Asset-backed Securities — continued | | | | | | | | | | | | | | |
Brazos Higher Education Authority Inc., 2010-1 A2 | | | 1.502 | % | | 2/25/35 | | | 16,100,000 | | | $ | 14,985,880 | (g) |
CDC Mortgage Capital Trust, 2002-HE1 A | | | 0.881 | % | | 1/25/33 | | | 347,404 | | | | 263,702 | (g) |
Chase Issuance Trust, 2007-A17 A | | | 5.120 | % | | 10/15/14 | | | 100,000 | | | | 107,398 | |
Chase Issuance Trust, 2009-A2 A2 | | | 1.810 | % | | 4/15/14 | | | 160,000 | | | | 162,654 | (g) |
Citigroup Mortgage Loan Trust Inc., 2004-RES1 M1 | | | 1.236 | % | | 11/25/34 | | | 7,463,421 | | | | 6,227,098 | (g) |
Conseco Finance Securitizations Corp., 2000-4 A6 | | | 8.310 | % | | 5/1/32 | | | 1,705,121 | | | | 1,343,206 | (g) |
Contimortgage Home Equity Trust, 1997-4 B1F | | | 7.330 | % | | 10/15/28 | | | 795,749 | | | | 765,447 | |
Countrywide Asset-Backed Certificates, 2002-BC1 | | | 0.921 | % | | 4/25/32 | | | 112,321 | | | | 67,925 | (g) |
Countrywide Asset-Backed Certificates, 2003-1 | | | 0.941 | % | | 6/25/33 | | | 253,377 | | | | 179,135 | (g) |
Countrywide Asset-Backed Certificates, 2003-BC3 A2 | | | 0.881 | % | | 9/25/33 | | | 637,078 | | | | 535,856 | (g) |
Countrywide Asset-Backed Certificates, 2004-2 M1 | | | 0.761 | % | | 5/25/34 | | | 390,000 | | | | 291,025 | (g) |
Countrywide Asset-Backed Certificates, 2004-15 | | | 4.614 | % | | 12/25/32 | | | 4,296,672 | | | | 4,259,158 | (g) |
Countrywide Asset-Backed Certificates, 2006-SD4 A1 | | | 0.601 | % | | 12/25/36 | | | 188,879 | | | | 85,475 | (d)(g) |
Countrywide Home Equity Loan Trust, 2002-F A | | | 0.610 | % | | 11/15/28 | | | 198,273 | | | | 177,385 | (g) |
Countrywide Home Equity Loan Trust, 2004-I A | | | 0.550 | % | | 2/15/34 | | | 301,048 | | | | 185,203 | (g) |
Countrywide Home Equity Loan Trust, 2006-E 2A | | | 0.400 | % | | 7/15/36 | | | 268,885 | | | | 149,410 | (g) |
Countrywide Home Equity Loan Trust, 2006-HW 2A1B | | | 0.410 | % | | 11/15/36 | | | 1,806,367 | | | | 1,371,975 | (g) |
Countrywide Home Equity Loan Trust, 2006-RES | | | 0.520 | % | | 6/15/29 | | | 365,124 | | | | 192,822 | (d)(g) |
Credit-Based Asset Servicing and Securitization, 2007-RP1 A | | | 0.571 | % | | 5/25/46 | | | 25,916,799 | | | | 15,940,127 | (d)(f)(g) |
Credit-Based Asset Servicing and Securitization LLC, 2006-MH1 AF2 | | | 5.650 | % | | 10/25/36 | | | 275,245 | | | | 277,469 | (d) |
EFS Volunteer LLC, 2010-1 A2 | | | 1.389 | % | | 10/25/35 | | | 8,750,000 | | | | 8,181,652 | (d)(g) |
EMC Mortgage Loan Trust, 2002-B A1 | | | 0.911 | % | | 2/25/41 | | | 376,630 | | | | 319,750 | (d)(g) |
Fairbanks Capital Mortgage Loan Trust, 1999-1 A | | | 1.461 | % | | 5/25/28 | | | 605,241 | | | | 546,995 | (d)(g) |
First Franklin Mortgage Loan Asset-Backed Certificates, 2004-FF3 M1 | | | 1.086 | % | | 5/25/34 | | | 13,235,210 | | | | 11,363,950 | (g) |
GMAC Mortgage Corp. Loan Trust, 2004-HE3 A2VN | | | 0.501 | % | | 10/25/34 | | | 38,947,894 | | | | 28,591,649 | (g) |
GMAC Mortgage Corp. Loan Trust, 2006-HE1 A | | | 0.471 | % | | 11/25/36 | | | 1,415,716 | | | | 780,050 | (g) |
Green Tree Financial Corp., 1992-2 B | | | 9.150 | % | | 1/15/18 | | | 68,565 | | | | 38,588 | |
Green Tree Financial Corp., 1993-2 | | | 8.000 | % | | 7/15/18 | | | 221,034 | | | | 223,283 | |
Green Tree Financial Corp., 1996-5 B1 | | | 8.100 | % | | 7/15/27 | | | 1,355,657 | | | | 139,916 | (g) |
Green Tree Home Improvement Loan Trust, 1996-A | | | 7.400 | % | | 2/15/26 | | | 115,169 | | | | 75,383 | |
Greenpoint Mortgage Funding Trust, 2005-HE1 | | | 0.661 | % | | 9/25/34 | | | 2,405,433 | | | | 2,088,491 | (g) |
GSAA Home Equity Trust, 2005-6 A3 | | | 0.631 | % | | 6/25/35 | | | 5,000,000 | | | | 3,225,175 | (g) |
GSAA Home Equity Trust, 2007-6 A4 | | | 0.561 | % | | 5/25/47 | | | 24,440,000 | | | | 15,331,285 | (g) |
GSAMP Trust, 2006-S4 A1 | | | 0.351 | % | | 5/25/36 | | | 142,182 | | | | 17,290 | (g) |
Hertz Vehicle Financing LLC, 2009-2A A2 | | | 5.290 | % | | 3/25/16 | | | 11,800,000 | | | | 12,816,633 | (d) |
See Notes to Financial Statements.
| | |
| 28 | | Western Asset Core Plus Bond Portfolio 2010 Annual Report |
Schedule of investments (cont’d)
December 31, 2010
Western Asset Core Plus Bond Portfolio
| | | | | | | | | | | | | | |
| Security | | Rate | | | Maturity
Date | | Face
Amount† | | | Value | |
| Asset-backed Securities — continued | | | | | | | | | | | | | | |
Honda Auto Receivables Owner Trust, 2009-2 A3 | | | 2.790 | % | | 1/15/13 | | | 68,464 | | | $ | 69,231 | |
Indymac Home Equity Loan Asset-Backed Trust, 2001-A | | | 0.521 | % | | 3/25/31 | | | 65,700 | | | | 45,108 | (g) |
Indymac Seconds Asset Backed Trust, 2006-A A | | | 0.391 | % | | 6/25/36 | | | 505,619 | | | | 60,184 | (g) |
Kentucky Higher Education Student Loan Corp., 2010-1 A2 | | | 1.487 | % | | 5/1/34 | | | 7,155,000 | | | | 7,022,632 | (g) |
Keycorp Student Loan Trust, 2003-A 1A2 | | | 0.548 | % | | 10/25/32 | | | 3,790,094 | | | | 3,689,748 | (g) |
Lehman ABS Manufactured Housing Contract, 2001-B A3 | | | 4.350 | % | | 5/15/14 | | | 2,288,702 | | | | 2,306,415 | |
Lehman ABS Manufactured Housing Contract, 2001-B A6 | | | 6.467 | % | | 8/15/28 | | | 1,556,940 | | | | 1,594,040 | (g) |
Lehman XS Trust, 2005-5N 1A1 | | | 0.561 | % | | 11/25/35 | | | 13,221,506 | | | | 9,696,996 | (g) |
Lehman XS Trust, 2005-5N 3A1A | | | 0.561 | % | | 11/25/35 | | | 3,742,044 | | | | 2,875,416 | (g) |
Lehman XS Trust, 2006-2N 1A1 | | | 0.521 | % | | 2/25/46 | | | 3,113,607 | | | | 1,904,721 | (g) |
Lehman XS Trust, 2006-4N A2A | | | 0.481 | % | | 4/25/46 | | | 5,155,417 | | | | 2,949,424 | (g) |
Lehman XS Trust, 2007-9 1A1 | | | 0.381 | % | | 6/25/37 | | | 427,118 | | | | 269,573 | (g) |
Long Beach Mortgage Loan Trust, 2006-8 2A4 | | | 0.501 | % | | 9/25/36 | | | 7,088,187 | | | | 2,647,062 | (g) |
Long Beach Mortgage Loan Trust, 2006-9 2A3 | | | 0.421 | % | | 10/25/36 | | | 5,884,243 | | | | 2,289,883 | (g) |
Merrill Lynch Mortgage Investors Inc., 2005-SD1 A2 | | | 5.666 | % | | 5/25/46 | | | 502,401 | | | | 500,256 | (g) |
Merrill Lynch Mortgage Investors Trust, 2007-SD1 A1 | | | 0.711 | % | | 2/25/47 | | | 19,272,222 | | | | 9,484,728 | (g) |
Morgan Stanley ABS Capital I, 2003-HE3 M1 | | | 1.281 | % | | 10/25/33 | | | 1,332,835 | | | | 1,116,268 | (g) |
Morgan Stanley Mortgage Loan Trust, 2006-4SL A1 | | | 0.411 | % | | 3/25/36 | | | 254,375 | | | | 67,687 | (g) |
MSCC HELOC Trust, 2005-1 A | | | 0.451 | % | | 7/25/17 | | | 1,364,531 | | | | 1,056,301 | (g) |
Nelnet Student Loan Trust, 2008-4 A4 | | | 1.768 | % | | 4/25/24 | | | 430,000 | | | | 440,107 | (g) |
Nissan Auto Receivables Owner Trust, 2009-A A3 | | | 3.200 | % | | 2/15/13 | | | 43,881 | | | | 44,479 | |
Option One Mortgage Loan Trust, 2003-1 A2 | | | 1.101 | % | | 2/25/33 | | | 10,345 | | | | 8,483 | (g) |
Option One Mortgage Loan Trust, Series 2002-6, Class A2 | | | 1.061 | % | | 11/25/32 | | | 1,353,854 | | | | 1,113,955 | (g) |
Origen Manufactured Housing, 2006-A A2 | | | 1.756 | % | | 10/15/37 | | | 32,000,000 | | | | 20,480,000 | (g) |
Origen Manufactured Housing Contract Trust, 2005-B | | | 5.910 | % | | 1/15/37 | | | 4,797,000 | | | | 4,864,252 | |
Origen Manufactured Housing Contract Trust, 2005-B | | | 5.990 | % | | 1/15/37 | | | 1,500,000 | | | | 1,511,655 | |
Origen Manufactured Housing Contract Trust, 2005-B | | | 6.480 | % | | 1/15/37 | | | 2,100,000 | | | | 2,136,822 | |
Ownit Mortgage Loan Asset-Backed Certificates, 2004-1 M2 | | | 2.061 | % | | 7/25/35 | | | 3,020,698 | | | | 2,403,558 | (g) |
Pegasus Aviation Lease Securitization, 2000-1 A2 | | | 8.370 | % | | 3/25/30 | | | 4,475,000 | | | | 1,879,500 | (d) |
Provident Bank Home Equity Loan Trust, 2002-2 A2 | | | 0.801 | % | | 8/25/31 | | | 191,835 | | | | 86,713 | (g) |
RAAC, 2007-RP2 M1 | | | 0.911 | % | | 2/25/46 | | | 600,000 | | | | 20,434 | (d)(g) |
RAAC Series, 2006-RP2 A | | | 0.511 | % | | 2/25/37 | | | 271,001 | | | | 195,135 | (d)(g) |
RAAC Series, 2006-RP3 A | | | 0.531 | % | | 5/25/36 | | | 29,469 | | | | 18,909 | (d)(g) |
See Notes to Financial Statements.
| | | | |
| Western Asset Core Plus Bond Portfolio 2010 Annual Report | | | 29 | |
Western Asset Core Plus Bond Portfolio
| | | | | | | | | | | | | | |
| Security | | Rate | | | Maturity
Date | | Face
Amount† | | | Value | |
| Asset-backed Securities — continued | | | | | | | | | | | | | | |
RAAC Series, 2006-RP4 A | | | 0.551 | % | | 1/25/46 | | | 19,558,215 | | | $ | 14,837,019 | (d)(g) |
RAAC Series, 2007-SP3 A1 | | | 1.461 | % | | 9/25/47 | | | 595,491 | | | | 454,431 | (g) |
Renaissance Home Equity Loan Trust, 2003-4 A3 | | | 0.881 | % | | 3/25/34 | | | 13,536,233 | | | | 12,434,478 | (g) |
Renaissance Home Equity Loan Trust, 2005-1 | | | 0.591 | % | | 5/25/35 | | | 2,040,443 | | | | 1,700,244 | (g) |
Residential Asset Mortgage Products Inc., 2003-RS4 AIIB | | | 0.921 | % | | 5/25/33 | | | 605,217 | | | | 345,993 | (g) |
Residential Asset Mortgage Products Inc., 2003-RS7 MII1 | | | 1.386 | % | | 8/25/33 | | | 4,055,477 | | | | 3,057,879 | (g) |
Residential Funding Mortgage Securities II, 2003-HS3 | | | 0.551 | % | | 8/25/33 | | | 114,908 | | | | 90,080 | (g) |
Residential Funding Securities Corp., 2002-RP2 A1 | | | 1.011 | % | | 10/25/32 | | | 4,598,790 | | | | 2,595,097 | (d)(f)(g) |
SACO I Trust, 2006-3 A3 | | | 0.721 | % | | 4/25/36 | | | 2,129,716 | | | | 618,670 | (g) |
SACO I Trust, 2006-5 1A | | | 0.561 | % | | 4/25/36 | | | 175,887 | | | | 53,010 | (g) |
SACO I Trust, 2006-6 A | | | 0.391 | % | | 6/25/36 | | | 278,550 | | | | 88,797 | (g) |
Saxon Asset Securities Trust, 2002-3 M1 | | | 1.386 | % | | 12/25/32 | | | 3,618,281 | | | | 2,953,733 | (g) |
Saxon Asset Securities Trust, 2003-3 M1 | | | 0.911 | % | | 12/25/33 | | | 11,091,879 | | | | 9,655,514 | (g) |
Securitized Asset Backed Receivables LLC, 2007-BR3 A2B | | | 0.481 | % | | 4/25/37 | | | 32,787,000 | | | | 14,199,755 | (g) |
Securitized Asset-Backed Receivables LLC, 2007-BR2 A2 | | | 0.491 | % | | 2/25/37 | | | 16,474,720 | | | | 7,901,029 | (g) |
SLM Student Loan Trust, 2003-11 A6 | | | 0.592 | % | | 12/15/25 | | | 9,900,000 | | | | 9,256,500 | (d)(g) |
SLM Student Loan Trust, 2006-5 A5 | | | 0.398 | % | | 1/25/27 | | | 14,430,000 | | | | 13,611,174 | (g) |
Southern Pacific Secured Assets Corp., 1998-2 A1 | | | 0.601 | % | | 7/25/29 | | | 14,247 | | | | 8,447 | (g) |
Structured Asset Securities Corp., 2004-6XS A5B | | | 5.550 | % | | 3/25/34 | | | 7,213,167 | | | | 7,032,146 | |
Structured Asset Securities Corp., 2005-SC1 1A2 | | | 8.556 | % | | 5/25/31 | | | 548,419 | | | | 439,562 | (d)(g) |
Structured Asset Securities Corp., 2006-ARS1 A1 | | | 0.371 | % | | 2/25/36 | | | 676,478 | | | | 17,060 | (d)(g) |
Student Loan Consolidation Center, 2002-1 A1 | | | 2.898 | % | | 3/1/42 | | | 800,000 | | | | 725,760 | (d)(g) |
Student Loan Consolidation Center, 2002-2 A16 | | | 1.841 | % | | 7/1/42 | | | 2,200,000 | | | | 1,995,840 | (d)(g) |
Student Loan Consolidation Center, 2002-2 A9 | | | 1.845 | % | | 7/1/42 | | | 5,400,000 | | | | 4,898,880 | (d)(g) |
Terwin Mortgage Trust, 2006-10SLC A1 | | | 2.393 | % | | 10/25/37 | | | 23,751,921 | | | | 8,840,037 | (d)(g) |
Truman Capital Mortgage Loan Trust, 2006-1 A | | | 0.521 | % | | 3/25/36 | | | 16,698,386 | | | | 10,814,693 | (d)(g) |
UCFC Home Equity Loan, 1998-C | | | 5.935 | % | | 1/15/30 | | | 2,444 | | | | 2,317 | |
Vanderbilt Mortgage Finance, 1997-B 1B2 | | | 8.155 | % | | 10/7/26 | | | 154,986 | | | | 139,030 | |
Vanderbilt Mortgage Finance, 1997-C 1B2 | | | 7.830 | % | | 8/7/27 | | | 319,992 | | | | 304,207 | (g) |
Vanderbilt Mortgage Finance, 1999-D IIB4 | | | 3.515 | % | | 1/7/30 | | | 4,100,000 | | | | 3,060,132 | (g) |
Total Asset-backed Securities (Cost — $453,719,960) | | | | | | | 369,841,511 | |
| Collateralized Mortgage Obligations — 18.1% | | | | | | | | | | | | | | |
American Home Mortgage Assets, 2006-3 3A12 | | | 0.451 | % | | 10/25/46 | | | 14,214,441 | | | | 8,035,878 | (g) |
American Home Mortgage Investment Trust, 2005-4 1A1 | | | 0.551 | % | | 11/25/45 | | | 11,640,133 | | | | 7,807,119 | (g) |
See Notes to Financial Statements.
| | |
| 30 | | Western Asset Core Plus Bond Portfolio 2010 Annual Report |
Schedule of investments (cont’d)
December 31, 2010
Western Asset Core Plus Bond Portfolio
| | | | | | | | | | | | | | |
| Security | | Rate | | | Maturity
Date | | Face
Amount† | | | Value | |
| Collateralized Mortgage Obligations — continued | | | | | | | | | | | | | | |
Banc of America Commercial Mortgage Inc., 2005-5 A4 | | | 5.115 | % | | 10/10/45 | | | 2,190,000 | | | $ | 2,346,867 | (g) |
Banc of America Commercial Mortgage Inc., 2007-5 A3 | | | 5.620 | % | | 2/10/51 | | | 2,430,000 | | | | 2,555,618 | |
Banc of America Funding Corp., 2003-1 A1 | | | 6.000 | % | | 5/20/33 | | | 177,438 | | | | 185,807 | |
Banc of America Funding Corp., 2005-F 2A1 | | | 3.079 | % | | 9/20/35 | | | 15,637,296 | | | | 9,223,800 | (g) |
Banc of America Funding Corp., 2006-8T2 A2 | | | 5.791 | % | | 10/25/36 | | | 8,907 | | | | 8,337 | |
Bayview Commercial Asset Trust, 2006-2A A1 | | | 0.491 | % | | 7/25/36 | | | 1,391,257 | | | | 1,084,201 | (d)(g) |
Bayview Commercial Asset Trust, 2006-SP1 A1 | | | 0.531 | % | | 4/25/36 | | | 1,041,055 | | | | 980,081 | (d)(g) |
Bear Stearns ARM Trust, 2005-12 11A1 | | | 3.137 | % | | 2/25/36 | | | 494,127 | | | | 344,771 | (g) |
Bear Stearns Commercial Mortgage Securities, 2007-PW15 A4 | | | 5.331 | % | | 2/11/44 | | | 15,529,000 | | | | 15,945,045 | |
Bear Stearns Commercial Mortgage Securities, 2007-PW17 A3 | | | 5.736 | % | | 6/11/50 | | | 6,250,000 | | | | 6,561,107 | |
Chevy Chase Mortgage Funding Corp., 2005-4A A1 | | | 0.461 | % | | 10/25/36 | | | 1,307,749 | | | | 770,826 | (d)(g) |
Citigroup Mortgage Loan Trust Inc., 2005-5 | | | 2.265 | % | | 8/25/35 | | | 186,245 | | | | 104,075 | (g) |
Citigroup Mortgage Loan Trust Inc., 2005-10 1A1A | | | 3.078 | % | | 12/25/35 | | | 279,206 | | | | 183,916 | (g) |
Citigroup Mortgage Loan Trust Inc., 2005-HE2 A | | | 0.661 | % | | 5/25/35 | | | 4,816,103 | | | | 4,561,115 | (d)(g) |
Citigroup Mortgage Loan Trust Inc., 2006-AR9 1A3 | | | 0.501 | % | | 11/25/36 | | | 37,346,000 | | | | 22,665,773 | (g) |
Citigroup Mortgage Loan Trust Inc., 2006-AR9 1A4 | | | 0.501 | % | | 11/25/36 | | | 14,321,209 | | | | 8,016,454 | (g) |
Countrywide Alternative Loan Trust, 2003-20CB 1A1 | | | 5.500 | % | | 10/25/33 | | | 16,410,899 | | | | 17,188,939 | |
Countrywide Alternative Loan Trust, 2004-33 2A1 | | | 3.169 | % | | 12/25/34 | | | 34,429 | | | | 27,894 | (g) |
Countrywide Alternative Loan Trust, 2004-J9 3A4 | | | 0.651 | % | | 10/25/34 | | | 59,210 | | | | 55,332 | (g) |
Countrywide Alternative Loan Trust, 2005-38 A3 | | | 0.611 | % | | 9/25/35 | | | 13,992,944 | | | | 8,779,033 | (g) |
Countrywide Alternative Loan Trust, 2005-44 1A1 | | | 0.591 | % | | 10/25/35 | | | 17,673,398 | | | | 10,725,738 | (g) |
Countrywide Alternative Loan Trust, 2005-44 2A1 | | | 0.571 | % | | 10/25/35 | | | 8,951,699 | | | | 5,968,904 | (g) |
Countrywide Alternative Loan Trust, 2005-56 3A1 | | | 0.551 | % | | 11/25/35 | | | 11,038,103 | | | | 6,290,924 | (g) |
Countrywide Alternative Loan Trust, 2005-56 4A1 | | | 0.571 | % | | 11/25/35 | | | 5,615,258 | | | | 3,532,665 | (g) |
Countrywide Alternative Loan Trust, 2005-72 A1 | | | 0.531 | % | | 1/25/36 | | | 3,700,715 | | | | 2,514,462 | (g) |
Countrywide Alternative Loan Trust, 2006-0A1 2A1 | | | 0.471 | % | | 3/20/46 | | | 139,538 | | | | 80,050 | (g) |
Countrywide Alternative Loan Trust, 2006-0A10 4A1 | | | 0.451 | % | | 8/25/46 | | | 590,316 | | | | 351,315 | (g) |
Countrywide Alternative Loan Trust, 2006-0A2 A1 | | | 0.471 | % | | 5/20/46 | | | 13,055,467 | | | | 7,274,976 | (g) |
Countrywide Alternative Loan Trust, 2006-OA2 A5 | | | 0.491 | % | | 5/20/46 | | | 6,665,204 | | | | 3,012,032 | (g) |
Countrywide Alternative Loan Trust, 2006-OA9 2A1B | | | 0.461 | % | | 7/20/46 | | | 662,297 | | | | 309,340 | (g) |
Countrywide Alternative Loan Trust, 2006-OA18 A2 | | | 0.501 | % | | 12/25/36 | | | 257,224 | | | | 72,345 | (g) |
Countrywide Alternative Loan Trust, 2006-OC2 2A3 | | | 0.551 | % | | 2/25/36 | | | 10,000,000 | | | | 2,984,860 | (g) |
Countrywide Home Loan Mortgage Pass Through Trust, 2006-HYB1 2A1 | | | 4.241 | % | | 3/20/36 | | | 183,341 | | | | 126,653 | (g) |
See Notes to Financial Statements.
| | | | |
| Western Asset Core Plus Bond Portfolio 2010 Annual Report | | | 31 | |
Western Asset Core Plus Bond Portfolio
| | | | | | | | | | | | | | |
| Security | | Rate | | | Maturity
Date | | Face
Amount† | | | Value | |
| Collateralized Mortgage Obligations — continued | | | | | | | | | | | | | | |
Countrywide Home Loan Mortgage Pass-Through Trust, 2005-9 1A1 | | | 0.561 | % | | 5/25/35 | | | 6,743,274 | | | $ | 4,385,711 | (g) |
Countrywide Home Loans, 2005-R3 AF | | | 0.661 | % | | 9/25/35 | | | 5,774,828 | | | | 4,935,064 | (d)(g) |
Countrywide Home Loans, 2006-OA5 1A1 | | | 0.461 | % | | 4/25/46 | | | 4,148,787 | | | | 2,415,432 | (g) |
Countrywide Home Loans Pass-Through Certificates, 2006-HYB3 2A1A | | | 5.439 | % | | 5/20/36 | | | 720,081 | | | | 540,503 | (g) |
Credit Suisse Mortgage Capital Certificates, 2006-C1 A4 | | | 5.539 | % | | 2/15/39 | | | 11,030,000 | | | | 11,868,967 | (g) |
Credit Suisse Mortgage Capital Certificates, 2007-C4 A3 | | | 5.804 | % | | 9/15/39 | | | 8,600,000 | | | | 8,934,786 | (g) |
Credit Suisse Mortgage Capital Certificates, 2007-C5 A3 | | | 5.694 | % | | 9/15/40 | | | 2,740,000 | | | | 2,848,730 | (g) |
CS First Boston Mortgage Securities Corp., 2005-C5 A4 | | | 5.100 | % | | 8/15/38 | | | 3,875,000 | | | | 4,141,922 | (g) |
Deutsche Mortgage Securities Inc., 2005-WF1 1A3 | | | 5.200 | % | | 6/26/35 | | | 29,770,000 | | | | 27,366,489 | (d)(g) |
Downey Savings & Loan Association Mortgage Loan Trust, 2006-AR1 1A1A | | | 1.248 | % | | 3/19/46 | | | 1,676,550 | | | | 975,459 | (g) |
Federal Home Loan Mortgage Corp. (FHLMC), 3111 HZ | | | 6.000 | % | | 2/15/36 | | | 14,259,563 | | | | 14,743,743 | |
Federal Home Loan Mortgage Corp. (FHLMC), 3641 Z | | | 5.500 | % | | 2/15/36 | | | 33,344,460 | | | | 36,007,309 | |
Federal Home Loan Mortgage Corp. (FHLMC), 3688 PB | | | 4.500 | % | | 8/15/32 | | | 21,121,000 | | | | 21,333,729 | |
Federal Home Loan Mortgage Corp. (FHLMC), 3738 BP | | | 4.000 | % | | 12/15/38 | | | 11,300,000 | | | | 11,053,045 | |
Federal Home Loan Mortgage Corp. (FHLMC), K007 X1 | | | 1.245 | % | | 4/25/20 | | | 31,089,606 | | | | 2,345,720 | (g) |
Federal Home Loan Mortgage Corp. (FHLMC), K008 X1 | | | 1.688 | % | | 6/25/20 | | | 43,666,768 | | | | 4,523,733 | (g) |
Federal Home Loan Mortgage Corp. (FHLMC), K009 X1 | | | 1.522 | % | | 8/25/20 | | | 35,199,789 | | | | 3,256,068 | (g) |
Federal National Mortgage Association (FNMA), 2010-123 PM | | | 4.000 | % | | 7/25/40 | | | 19,331,985 | | | | 18,303,498 | |
Federal National Mortgage Association (FNMA), 2010-75 PU | | | 4.500 | % | | 4/25/39 | | | 25,865,000 | | | | 26,195,870 | |
FFCA Secured Lending Corp., 1999-1A IO | | | 0.860 | % | | 9/18/25 | | | 23,697 | | | | 198 | (c)(d)(g) |
First Horizon Alternative Mortgage Securities, 2006-FA8 1A8 | | | 0.631 | % | | 2/25/37 | | | 566,622 | | | | 292,322 | (g) |
GE Capital Commercial Mortgage Corp., 2007-C1 A4 | | | 5.543 | % | | 12/10/49 | | | 11,000,000 | | | | 11,325,639 | |
GMAC Mortgage Corp. Loan Trust, 2005-AR6 2A1 | | | 3.448 | % | | 11/19/35 | | | 234,065 | | | | 193,971 | (g) |
Government National Mortgage Association (GNMA), 2005-13 SD | | | 6.539 | % | | 2/20/35 | | | 5,063,679 | | | | 787,734 | (g) |
Government National Mortgage Association (GNMA), 2005-81 SD | | | 6.039 | % | | 12/20/34 | | | 9,882,769 | | | | 1,063,073 | (g) |
Government National Mortgage Association (GNMA), 2005-82 NS | | | 6.039 | % | | 7/20/34 | | | 5,880,384 | | | | 774,752 | (g) |
Government National Mortgage Association (GNMA), 2006-47 SA | | | 6.539 | % | | 8/16/36 | | | 14,330,489 | | | | 2,660,077 | (g) |
See Notes to Financial Statements.
| | |
| 32 | | Western Asset Core Plus Bond Portfolio 2010 Annual Report |
Schedule of investments (cont’d)
December 31, 2010
Western Asset Core Plus Bond Portfolio
| | | | | | | | | | | | | | |
| Security | | Rate | | | Maturity
Date | | Face
Amount† | | | Value | |
| Collateralized Mortgage Obligations — continued | | | | | | | | | | | | | | |
Government National Mortgage Association (GNMA), 2008-60 SH | | | 5.889 | % | | 7/16/38 | | | 5,249,653 | | | $ | 632,329 | (g) |
Government National Mortgage Association (GNMA), 2009-10 ST | | | 6.189 | % | | 3/16/34 | | | 5,974,590 | | | | 676,956 | (g) |
Government National Mortgage Association (GNMA), 2009-106 CM | | | 6.339 | % | | 1/16/34 | | | 2,664,884 | | | | 333,747 | (g) |
Government National Mortgage Association (GNMA), 2009-106 PD | | | 4.500 | % | | 4/20/38 | | | 5,800,000 | | | | 5,897,495 | |
Government National Mortgage Association (GNMA), 2009-35 SP | | | 6.139 | % | | 5/16/37 | | | 14,552,399 | | | | 1,905,814 | (g) |
Government National Mortgage Association (GNMA), 2009-61 WQ | | | 5.989 | % | | 11/16/35 | | | 14,193,548 | | | | 1,926,185 | (g) |
Government National Mortgage Association (GNMA), 2009-87 KI | | | 6.039 | % | | 9/20/35 | | | 6,483,606 | | | | 779,811 | (g) |
Government National Mortgage Association (GNMA), 2009-87 SI | | | 6.489 | % | | 2/20/35 | | | 7,279,265 | | | | 1,081,199 | (g) |
Government National Mortgage Association (GNMA), 2009-87 TS | | | 5.839 | % | | 7/20/35 | | | 13,973,344 | | | | 1,877,111 | (g) |
Government National Mortgage Association (GNMA), 2010-14 SA | | | 7.739 | % | | 12/20/32 | | | 7,044,096 | | | | 1,006,203 | (g) |
Government National Mortgage Association (GNMA), 2010-14 SC | | | 4.543 | % | | 8/20/35 | | | 11,708,512 | | | | 1,563,265 | (g) |
Government National Mortgage Association (GNMA), 2010-14 SH | | | 5.739 | % | | 2/16/40 | | | 7,196,281 | | | | 1,096,702 | (g) |
Government National Mortgage Association (GNMA), 2010-14 SX | | | 6.189 | % | | 2/16/40 | | | 17,983,202 | | | | 2,437,258 | (g) |
Government National Mortgage Association (GNMA), 2010-42 LW | | | 5.000 | % | | 6/20/39 | | | 4,500,000 | | | | 4,609,789 | |
Government National Mortgage Association (GNMA), 2010-42 PC | | | 5.000 | % | | 7/20/39 | | | 7,100,000 | | | | 7,283,788 | |
Government National Mortgage Association (GNMA), 2010-47 VS | | | 5.989 | % | | 11/16/37 | | | 10,774,474 | | | | 1,408,842 | (g) |
Government National Mortgage Association (GNMA), 2010-47 XN | | | 6.289 | % | | 4/16/34 | | | 12,884,508 | | | | 1,115,296 | (g) |
Government National Mortgage Association (GNMA), 2010-59 PB | | | 4.500 | % | | 7/20/39 | | | 14,600,000 | | | | 15,021,282 | |
Government National Mortgage Association (GNMA), 2010-61 PD | | | 4.500 | % | | 10/20/38 | | | 19,980,000 | | | | 20,283,810 | |
Government National Mortgage Association (GNMA), 2010-73 TZ | | | 4.500 | % | | 2/20/40 | | | 12,272,544 | | | | 11,910,526 | |
Government National Mortgage Association (GNMA), 2010-86 PB | | | 4.500 | % | | 10/20/39 | | | 40,000,000 | | | | 40,557,672 | |
See Notes to Financial Statements.
| | | | |
| Western Asset Core Plus Bond Portfolio 2010 Annual Report | | | 33 | |
Western Asset Core Plus Bond Portfolio
| | | | | | | | | | | | | | |
| Security | | Rate | | | Maturity
Date | | Face
Amount† | | | Value | |
| Collateralized Mortgage Obligations — continued | | | | | | | | | | | | | | |
Government National Mortgage Association (GNMA), 2010-87 SK, IO | | | 6.239 | % | | 7/16/40 | | | 20,055,999 | | | $ | 2,762,160 | (g) |
Government National Mortgage Association (GNMA), 2010-116 LB | | | 5.000 | % | | 5/20/40 | | | 62,371,006 | | | | 63,904,703 | |
Government National Mortgage Association (GNMA), 2010-116 MH | | | 5.000 | % | | 7/20/40 | | | 30,000,000 | | | | 30,902,367 | |
Government National Mortgage Association (GNMA), 2010-118 IO | | | 1.869 | % | | 4/16/53 | | | 30,474,389 | | | | 2,669,636 | (g) |
Government National Mortgage Association (GNMA), 2010-148 IX, IO | | | 1.482 | % | | 10/16/52 | | | 51,965,324 | | | | 4,609,932 | (g) |
Greenpoint Mortgage Funding Trust, 2005-AR5 2A2 | | | 0.531 | % | | 11/25/46 | | | 3,919,896 | | | | 901,576 | (g) |
Greenpoint Mortgage Funding Trust, 2006-AR3 3A1 | | | 0.491 | % | | 4/25/36 | | | 4,210,127 | | | | 1,896,111 | (g) |
Greenpoint Mortgage Funding Trust, 2007-AR2 1A1 | | | 0.391 | % | | 4/25/47 | | | 29,772,954 | | | | 24,169,535 | (g) |
Greenwich Capital Commercial Funding Corp., 2007-GG11 A4 | | | 5.736 | % | | 12/10/49 | | | 23,270,000 | | | | 24,588,236 | |
GS Mortgage Securities Corp. II, 2005-GG4 AABA | | | 4.680 | % | | 7/10/39 | | | 15,481,767 | | | | 16,132,000 | |
GSMPS Mortgage Loan Trust, 2005-RP2 1AF | | | 0.611 | % | | 3/25/35 | | | 15,946,494 | | | | 13,399,600 | (d)(g) |
GSMPS Mortgage Loan Trust, 2005-RP3 1AF | | | 0.611 | % | | 9/25/35 | | | 24,962,631 | | | | 20,708,674 | (d)(g) |
GSR Mortgage Loan Trust, 2005-AR7 1A1 | | | 3.223 | % | | 11/25/35 | | | 2,166,741 | | | | 1,584,178 | (g) |
Harborview Mortgage Loan Trust, 2005-3 | | | 0.501 | % | | 6/19/35 | | | 13,654,056 | | | | 9,251,620 | (g) |
Harborview Mortgage Loan Trust, 2005-7 1A1 | | | 3.504 | % | | 6/19/45 | | | 5,158,515 | | | | 3,134,185 | (g) |
Harborview Mortgage Loan Trust, 2006-2 | | | 2.978 | % | | 2/25/36 | | | 3,365,511 | | | | 1,880,244 | (g) |
Harborview Mortgage Loan Trust, 2006-7 2A1A | | | 0.461 | % | | 9/19/46 | | | 2,835,622 | | | | 1,765,333 | (g) |
Harborview Mortgage Loan Trust, 2006-13 A | | | 0.441 | % | | 11/19/46 | | | 632,046 | | | | 339,740 | (g) |
Harborview Mortgage Loan Trust, 2007-4 2A1 | | | 0.481 | % | | 7/19/47 | | | 26,362,321 | | | | 16,888,704 | (g) |
Impac CMB Trust, 2003-4 1A1 | | | 0.901 | % | | 10/25/33 | | | 85,219 | | | | 69,280 | (g) |
IMPAC CMB Trust, 2007-A A | | | 0.511 | % | | 5/25/37 | | | 17,710,982 | | | | 14,403,492 | (g) |
IMPAC Secured Assets Corp., 2005-2 A1 | | | 0.581 | % | | 3/25/36 | | | 347,011 | | | | 187,040 | (g) |
IMPAC Secured Assets Corp., 2006-1 1A2B | | | 0.461 | % | | 5/25/36 | | | 124,606 | | | | 54,609 | (g) |
Impac Secured Assets Corp., 2006-2 2A1 | | | 0.611 | % | | 8/25/36 | | | 3,768,037 | | | | 3,401,471 | (g) |
Indymac Inda Mortgage Loan Trust, 2007-AR7 1A1 | | | 5.874 | % | | 11/25/37 | | | 9,590,759 | | | | 7,707,047 | (g) |
Indymac Index Mortgage Loan Trust, 2004-AR2 2A1 | | | 0.881 | % | | 6/25/34 | | | 29,673 | | | | 19,162 | (g) |
Indymac Index Mortgage Loan Trust, 2005-AR1 1A1 | | | 2.772 | % | | 3/25/35 | | | 242,993 | | | | 186,439 | (g) |
Indymac Index Mortgage Loan Trust, 2005-AR15 A2 | | | 5.047 | % | | 9/25/35 | | | 7,868,933 | | | | 6,543,128 | (g) |
Indymac Index Mortgage Loan Trust, 2006-AR6 2A1A | | | 0.461 | % | | 6/25/47 | | | 506,056 | | | | 281,444 | (g) |
Indymac Index Mortgage Loan Trust, 2006-AR15 A1 | | | 0.381 | % | | 7/25/36 | | | 213,608 | | | | 119,261 | (g) |
Indymac INDX Mortgage Loan Trust, 2004-AR15 | | | 2.731 | % | | 2/25/35 | | | 327,577 | | | | 231,250 | (g) |
Indymac INDX Mortgage Loan Trust, 2005-AR9 1A1 | | | 2.801 | % | | 7/25/35 | | | 109,322 | | | | 68,131 | (g) |
Indymac INDX Mortgage Loan Trust, 2005-AR13 | | | 2.697 | % | | 8/25/35 | | | 541,848 | | | | 312,940 | (g) |
See Notes to Financial Statements.
| | |
| 34 | | Western Asset Core Plus Bond Portfolio 2010 Annual Report |
Schedule of investments (cont’d)
December 31, 2010
Western Asset Core Plus Bond Portfolio
| | | | | | | | | | | | | | |
| Security | | Rate | | | Maturity
Date | | Face
Amount† | | | Value | |
| Collateralized Mortgage Obligations — continued | | | | | | | | | | | | | | |
JPMorgan Chase Commercial Mortgage Securities Corp., 2006-LDP8 A4 | | | 5.399 | % | | 5/15/45 | | | 310,000 | | | $ | 330,031 | |
JPMorgan Chase Commercial Mortgage Securities Corp., 2006-LDP9 A3 | | | 5.336 | % | | 5/15/47 | | | 19,329,000 | | | | 20,060,154 | |
JPMorgan Chase Commercial Mortgage Securities Corp., 2006-LDP9 HS | | | 5.747 | % | | 5/15/47 | | | 5,000,000 | | | | 400,000 | (d)(g) |
JPMorgan Chase Commercial Mortgage Securities Corp., 2007-LD12 A4 | | | 5.882 | % | | 2/15/51 | | | 15,270,000 | | | | 16,167,180 | (g) |
JPMorgan Mortgage Trust, 2004-A3 SF3 | | | 4.282 | % | | 6/25/34 | | | 164,088 | | | | 159,069 | (g) |
JPMorgan Mortgage Trust, 2007-A2 4A2 | | | 5.934 | % | | 4/25/37 | | | 10,700,000 | | | | 8,647,676 | (g) |
La Hipotecaria SA, 2007-1GA A | | | 5.500 | % | | 12/23/36 | | | 298,803 | | | | 286,851 | (d)(g) |
LB-UBS Commercial Mortgage Trust, 2001-C3 X, STRIPS | | | 0.905 | % | | 6/15/36 | | | 7,282,757 | | | | 15,740 | (c)(d)(g) |
LB-UBS Commercial Mortgage Trust, 2005-C3 A5 | | | 4.739 | % | | 7/15/30 | | | 3,000,000 | | | | 3,169,584 | |
LB-UBS Commercial Mortgage Trust, 2005-C3 AAB | | | 4.664 | % | | 7/15/30 | | | 3,576,578 | | | | 3,719,937 | |
LB-UBS Commercial Mortgage Trust, 2005-C5 A4 | | | 4.954 | % | | 9/15/30 | | | 1,570,000 | | | | 1,674,579 | |
LB-UBS Commercial Mortgage Trust, 2007-C6 A4 | | | 5.858 | % | | 7/15/40 | | | 8,135,000 | | | | 8,547,200 | (g) |
LB-UBS Commercial Mortgage Trust, 2007-C7 A3 | | | 5.866 | % | | 9/15/45 | | | 11,660,000 | | | | 12,268,945 | (g) |
Lehman XS Trust, 2007-8H A1 | | | 0.391 | % | | 6/25/37 | | | 45,518,593 | | | | 22,957,803 | (g) |
Luminent Mortgage Trust, 2006-4 A1A | | | 0.451 | % | | 5/25/46 | | | 433,818 | | | | 247,612 | (g) |
Luminent Mortgage Trust, 2006-7 2A1 | | | 0.431 | % | | 12/25/36 | | | 4,080,669 | | | | 2,650,692 | (g) |
MASTR Adjustable Rate Mortgages Trust, 2004-13 3A7 | | | 2.899 | % | | 11/21/34 | | | 1,830,000 | | | | 1,698,423 | (g) |
MASTR Adjustable Rate Mortgages Trust, 2004-15 1A1 | | | 3.572 | % | | 12/25/34 | | | 25,224 | | | | 18,770 | (g) |
MASTR Adjustable Rate Mortgages Trust, 2005-1 7A1 | | | 2.763 | % | | 2/25/35 | | | 453,836 | | | | 388,107 | (g) |
MASTR Adjustable Rate Mortgages Trust, 2006-2 3A1 | | | 3.126 | % | | 1/25/36 | | | 1,746,891 | | | | 1,525,193 | (g) |
MASTR Adjustable Rate Mortgages Trust, 2006-OA1 1A1 | | | 0.471 | % | | 4/25/46 | | | 430,988 | | | | 254,310 | (g) |
MASTR Adjustable Rate Mortgages Trust, 2007-3 12A1 | | | 0.461 | % | | 5/25/47 | | | 756,276 | | | | 425,900 | (g) |
MASTR ARM Trust, 2004-4 3A1 | | | 2.516 | % | | 5/25/34 | | | 1,191,759 | | | | 1,123,736 | (g) |
MASTR ARM Trust, 2007-R5 A1 | | | 2.840 | % | | 11/25/35 | | | 6,173,485 | | | | 3,836,136 | (d)(g) |
MASTR Reperforming Loan Trust, 2005-1 1A1 | | | 6.000 | % | | 8/25/34 | | | 3,984,890 | | | | 3,948,587 | (d) |
MASTR Reperforming Loan Trust, 2005-1 1A3 | | | 7.000 | % | | 8/25/34 | | | 5,561,979 | | | | 5,668,235 | (d) |
MASTR Reperforming Loan Trust, 2005-2 1A1F | | | 0.611 | % | | 5/25/35 | | | 4,654,171 | | | | 3,799,237 | (d)(g) |
Merrill Lynch Mortgage Investors Inc., 2005-A2 A4 | | | 2.773 | % | | 2/25/35 | | | 102,982 | | | | 103,390 | (g) |
Merrill Lynch Mortgage Investors Trust, 2006-A1 1A1 | | | 3.793 | % | | 3/25/36 | | | 29,091,899 | | | | 18,653,057 | (g) |
Merrill Lynch Mortgage Trust, 2005-CK1 A6 | | | 5.241 | % | | 11/12/37 | | | 15,560,000 | | | | 16,748,691 | (g) |
Merrill Lynch Mortgage Trust, 2005-MCP1 | | | 4.747 | % | | 6/12/43 | | | 6,000,000 | | | | 6,335,320 | (g) |
Merrill Lynch Mortgage Trust, 2007-C1 A4 | | | 5.826 | % | | 6/12/50 | | | 3,785,000 | | | | 4,030,936 | (g) |
See Notes to Financial Statements.
| | | | |
| Western Asset Core Plus Bond Portfolio 2010 Annual Report | | | 35 | |
Western Asset Core Plus Bond Portfolio
| | | | | | | | | | | | | | |
| Security | | Rate | | | Maturity
Date | | Face
Amount† | | | Value | |
| Collateralized Mortgage Obligations — continued | | | | | | | | | | | | | | |
Merrill Lynch/Countrywide Commercial Mortgage Trust, 2007-5 A4 | | | 5.378 | % | | 8/12/48 | | | 3,677,000 | | | $ | 3,754,852 | |
Merrill Lynch/Countrywide Commercial Mortgage Trust, 2007-6 A4 | | | 5.485 | % | | 3/12/51 | | | 18,230,000 | | | | 18,586,927 | (g) |
Merrill Lynch/Countrywide Commercial Mortgage Trust, 2007-8 A3 | | | 5.965 | % | | 8/12/49 | | | 7,605,000 | | | | 8,184,731 | (g) |
MLCC Mortgage Investors Inc., 2003-B A1 | | | 0.601 | % | | 4/25/28 | | | 2,153,245 | | | | 2,020,146 | (g) |
MLCC Mortgage Investors Inc., 2006-1 1A | | | 2.177 | % | | 2/25/36 | | | 611,221 | | | | 507,278 | (g) |
Morgan Stanley Capital I, 2005-HQ6 A4A | | | 4.989 | % | | 8/13/42 | | | 10,000,000 | | | | 10,588,683 | |
Morgan Stanley Capital I, 2007-HQ11 A31 | | | 5.439 | % | | 2/12/44 | | | 3,995,000 | | | | 4,134,951 | |
Morgan Stanley Capital I, 2007-HQ13 A3 | | | 5.569 | % | | 12/15/44 | | | 2,606,000 | | | | 2,675,719 | |
Morgan Stanley Capital I, 2007-IQ14 A4 | | | 5.692 | % | | 4/15/49 | | | 13,000,000 | | | | 13,473,125 | (g) |
Morgan Stanley Capital I, 2007-IQ15 A4 | | | 5.879 | % | | 6/11/49 | | | 9,230,199 | | | | 9,883,499 | (g) |
Morgan Stanley Mortgage Loan Trust, 2004-8AR 4A1 | | | 2.794 | % | | 10/25/34 | | | 8,128 | | | | 6,969 | (g) |
Morgan Stanley Mortgage Loan Trust, 2004-10AR 4A | | | 5.466 | % | | 11/25/34 | | | 3,218,715 | | | | 3,140,774 | (g) |
Morgan Stanley Mortgage Loan Trust, 2005-3AR 2A2 | | | 2.660 | % | | 7/25/35 | | | 5,553,937 | | | | 4,060,206 | (g) |
Morgan Stanley Mortgage Loan Trust, 2006-6AR 3A1 | | | 5.785 | % | | 5/25/36 | | | 8,254,062 | | | | 4,993,724 | (g) |
NCUA Guaranteed Notes, 2010-C1 A2 | | | 2.900 | % | | 10/29/20 | | | 1,080,000 | | | | 1,050,060 | |
NCUA Guaranteed Notes, 2010-C1 APT | | | 2.650 | % | | 10/29/20 | | | 11,254,236 | | | | 10,958,504 | |
Novastar Mortgage-Backed Notes, 2006-MTA1 2A1A | | | 0.451 | % | | 9/25/46 | | | 423,309 | | | | 268,885 | (g) |
Prime Mortgage Trust, 2005-2 2A1 | | | 7.241 | % | | 10/25/32 | | | 769,457 | | | | 762,741 | (g) |
Prime Mortgage Trust, 2006-DR1 2A2 | | | 6.000 | % | | 5/25/35 | | | 61,386,466 | | | | 51,606,497 | (d) |
RBSGC Mortgage Pass-Through Certificates, 2007-B 1A4 | | | 0.711 | % | | 1/25/37 | | | 34,405,264 | | | | 20,281,490 | (g) |
Residential Accredit Loans Inc., 2005-Q03 A1 | | | 0.661 | % | | 10/25/45 | | | 1,933,315 | | | | 1,078,921 | (g) |
Residential Accredit Loans Inc., 2006-QO8 1A1A | | | 0.351 | % | | 10/25/46 | | | 296,935 | | | | 293,368 | (g) |
Residential Accredit Loans Inc., 2006-QO1O A1 | | | 0.421 | % | | 1/25/37 | | | 10,531,170 | | | | 6,236,033 | (g) |
Residential Accredit Loans Inc., 2007-QO4 A1A | | | 0.451 | % | | 5/25/47 | | | 10,993,865 | | | | 6,856,621 | (g) |
Residential Accredit Loans Inc., 2007-QS4 3A9 | | | 6.000 | % | | 3/25/37 | | | 8,562,569 | | | | 5,671,863 | |
Residential Asset Mortgage Products Inc., 2004-SL2 A4 | | | 8.500 | % | | 10/25/31 | | | 166,866 | | | | 168,340 | |
Residential Asset Mortgage Products Inc., 2004-SL4 A5 | | | 7.500 | % | | 7/25/32 | | | 1,559,465 | | | | 1,552,066 | |
Residential Asset Mortgage Products Inc., 2005-SL2 A4 | | | 7.500 | % | | 2/25/32 | | | 7,859,900 | | | | 8,097,764 | |
Residential Asset Securitization Trust, 2003-A14 A1 | | | 4.750 | % | | 2/25/19 | | | 1,193,096 | | | | 1,227,761 | |
Sequoia Mortgage Trust, 4 A | | | 0.981 | % | | 11/22/24 | | | 5,986 | | | | 4,786 | (g) |
Structured ARM Loan Trust, 2004-16 5A2 | | | 5.070 | % | | 11/25/34 | | | 25,092,327 | | | | 22,825,712 | (g) |
Structured ARM Loan Trust, 2005-19XS 2A1 | | | 0.561 | % | | 10/25/35 | | | 305,315 | | | | 225,127 | (g) |
See Notes to Financial Statements.
| | |
| 36 | | Western Asset Core Plus Bond Portfolio 2010 Annual Report |
Schedule of investments (cont’d)
December 31, 2010
Western Asset Core Plus Bond Portfolio
| | | | | | | | | | | | | | |
| Security | | Rate | | | Maturity
Date | | Face
Amount† | | | Value | |
| Collateralized Mortgage Obligations — continued | | | | | | | | | | | |
Structured Asset Mortgage Investments Inc., 2002-AR5 A1 | | | 0.711 | % | | 5/19/33 | | | 1,551,649 | | | $ | 1,408,278 | (g) |
Structured Asset Mortgage Investments Inc., 2003-AR1 A1 | | | 1.001 | % | | 10/19/33 | | | 564,220 | | | | 478,824 | (g) |
Structured Asset Mortgage Investments Inc., 2006-AR3 11A1 | | | 0.471 | % | | 4/25/36 | | | 4,434,800 | | | | 2,601,600 | (g) |
Structured Asset Mortgage Investments Inc., 2006-AR6 1A1 | | | 0.441 | % | | 7/25/46 | | | 398,708 | | | | 236,253 | (g) |
Structured Asset Mortgage Investments Inc., 2006-AR7 A1A | | | 0.471 | % | | 8/25/36 | | | 14,404,175 | | | | 8,995,955 | (g) |
Structured Asset Mortgage Investments Inc., 2007-AR4 GA4B | | | 0.441 | % | | 9/25/47 | | | 897,444 | | | | 522,543 | (g) |
Thornburg Mortgage Securities Trust, 2004-03 A | | | 1.001 | % | | 9/25/44 | | | 1,023,516 | | | | 971,438 | (g) |
Thornburg Mortgage Securities Trust, 2004-1 | | | 2.170 | % | | 3/25/44 | | | 77,359 | | | | 72,882 | (g) |
Thornburg Mortgage Securities Trust, 2007-4 2A1 | | | 6.196 | % | | 9/25/37 | | | 30,082,830 | | | | 28,012,169 | (g) |
Thornburg Mortgage Securities Trust, 2007-4 3A1 | | | 6.180 | % | | 9/25/37 | | | 31,198,038 | | | | 30,289,738 | (g) |
Voyager BRSTN Delaware Trust, IO, 2009-1 UAU7 | | | 0.503 | % | | 12/26/36 | | | 1,655,174 | | | | 674,240 | (c)(d)(g) |
Voyager Dwnys Delaware Trust, 2009-1 UGL2 | | | 1.248 | % | | 3/20/47 | | | 931,669 | | | | 89,440 | (c)(d)(f)(g) |
WaMu Mortgage Pass-Through Certificates, 2005-AR14 1A1 | | | 2.671 | % | | 12/25/35 | | | 259,808 | | | | 251,795 | (g) |
WaMu Mortgage Pass-Through Certificates, 2007-HY7 2A3 | | | 5.629 | % | | 7/25/37 | | | 22,912,259 | | | | 14,796,004 | (g) |
Washington Mutual Inc., 2005-AR15 A1A1 | | | 0.521 | % | | 11/25/45 | | | 14,611,303 | | | | 12,277,279 | (g) |
Washington Mutual Inc., Mortgage Pass-Through Certificates, 2005-AR06 2A1A | | | 0.491 | % | | 4/25/45 | | | 8,600,182 | | | | 7,201,448 | (g) |
Washington Mutual Inc., Mortgage Pass-Through Certificates, 2005-AR08 1A1A | | | 0.531 | % | | 7/25/45 | | | 8,161,159 | | | | 6,854,484 | (g) |
Washington Mutual Inc., Mortgage Pass-Through Certificates, 2005-AR1 A1A | | | 0.581 | % | | 1/25/45 | | | 2,013,177 | | | | 1,690,191 | (g) |
Washington Mutual Inc., Mortgage Pass-Through Certificates, 2005-AR11 A1A | | | 0.581 | % | | 8/25/45 | | | 27,512,748 | | | | 23,254,160 | (g) |
Washington Mutual Inc., Mortgage Pass-Through Certificates, 2005-AR13 A1A1 | | | 0.551 | % | | 10/25/45 | | | 15,856,323 | | | | 13,379,201 | (g) |
Washington Mutual Inc., Mortgage Pass-Through Certificates, 2005-AR15 A1A2 | | | 0.541 | % | | 11/25/45 | | | 23,246,825 | | | | 17,845,425 | (g) |
Washington Mutual Inc., Mortgage Pass-Through Certificates, 2005-AR17 A1A1 | | | 0.531 | % | | 12/25/45 | | | 335,776 | | | | 285,377 | (g) |
Washington Mutual Inc., Mortgage Pass-Through Certificates, 2005-AR17 A1A2 | | | 0.551 | % | | 12/25/45 | | | 13,923,063 | | | | 10,792,588 | (g) |
Washington Mutual Inc., Mortgage Pass-Through Certificates, 2005-AR19 A1A1 | | | 0.531 | % | | 12/25/45 | | | 20,326,123 | | | | 17,475,201 | (g) |
See Notes to Financial Statements.
| | | | |
| Western Asset Core Plus Bond Portfolio 2010 Annual Report | | | 37 | |
Western Asset Core Plus Bond Portfolio
| | | | | | | | | | | | | | | | |
| Security | | Rate | | | Maturity
Date | | | Face
Amount† | | | Value | |
| Collateralized Mortgage Obligations — continued | | | | | | | | | | | | | |
Washington Mutual Inc., Mortgage Pass-Through Certificates, 2005-AR19 A1A2 | | | 0.551 | % | | | 12/25/45 | | | | 22,175,850 | | | $ | 17,132,108 | (g) |
Washington Mutual Inc., Mortgage Pass-Through Certificates, 2006-AR10 1A1 | | | 5.854 | % | | | 9/25/36 | | | | 416,691 | | | | 324,298 | (g) |
Washington Mutual Inc., Mortgage Pass-Through Certificates, 2007-0A5 1A | | | 1.078 | % | | | 6/25/47 | | | | 27,811,213 | | | | 18,465,199 | (g) |
Washington Mutual Inc., Mortgage Pass-Through Certificates, 2007-HY4 4A1 | | | 5.357 | % | | | 9/25/36 | | | | 104,686 | | | | 84,315 | (g) |
Wells Fargo Alternative Loan Trust, 2007-PA2 2A1 | | | 0.691 | % | | | 6/25/37 | | | | 41,540,141 | | | | 22,041,697 | (g) |
Wells Fargo Mortgage Backed Securities Trust, 2006-AR8 2A3 | | | 2.904 | % | | | 4/25/36 | | | | 160,558 | | | | 146,255 | (g) |
Wells Fargo Mortgage Backed Securities Trust, 2006-AR8 3A2 | | | 3.287 | % | | | 4/25/36 | | | | 5,713,000 | | | | 4,480,717 | (g) |
Total Collateralized Mortgage Obligations (Cost — $1,601,749,559) | | | | | | | | 1,440,598,410 | |
| Collateralized Senior Loans — 0.6% | | | | | | | | | | | | | | | | |
| Consumer Discretionary — 0.1% | | | | | | | | | | | | | | | | |
Auto Components — 0.0% | | | | | | | | | | | | | | | | |
Allison Transmission Inc., Term Loan, Tranche B | | | 3.020 - 3.040 | % | | | 8/7/14 | | | | 920,530 | | | | 898,476 | (i) |
Diversified Consumer Services — 0.0% | | | | | | | | | | | | | |
Thomson Medical Education, First Lien Term Loan | | | 2.550 | % | | | 7/3/14 | | | | 967,500 | | | | 909,450 | (i) |
Media — 0.1% | | | | | | | | | | | | | | | | |
Carmike Cinemas Inc., Term Loan | | | 5.500 | % | | | 1/27/16 | | | | 1,344,131 | | | | 1,346,771 | (i) |
Charter Communications Operating LLC, Term Loan C | | | 3.560 | % | | | 9/6/16 | | | | 1,727,571 | | | | 1,702,836 | (i) |
SuperMedia Inc., Term Loan | | | 11.000 | % | | | 12/31/15 | | | | 2,263 | | | | 3,937 | (i) |
Univision Communications Inc., Term Loan B2 | | | 4.511 | % | | | 3/31/17 | | | | 881,899 | | | | 837,489 | (i) |
UPC Broadband Holding, Term Loan, Tranche N1 | | | 2.501 | % | | | 12/31/14 | | | | 648,288 | | | | 634,917 | (i) |
UPC Broadband Holding BV, Term Loan T | | | 4.251 | % | | | 12/30/16 | | | | 351,712 | | | | 347,667 | (i) |
Total Media | | | | | | | | | | | | | | | 4,873,617 | |
Total Consumer Discretionary | | | | | | | | | | | | | | | 6,681,543 | |
| Financials — 0.0% | | | | | | | | | | | | | | | | |
Diversified Financial Services — 0.0% | | | | | | | | | | | | | |
CCM Merger Inc., Term Loan, Tranche B | | | 8.500 | % | | | 7/13/12 | | | | 837,949 | | | | 838,299 | (i) |
| Industrials — 0.0% | | | | | | | | | | | | | | | | |
Commercial Services & Supplies — 0.0% | | | | | | | | | | | | | |
Nielsen Finance LLC, Term Loan C | | | 4.014 | % | | | 5/2/16 | | | | 1,557,724 | | | | 1,540,200 | (i) |
See Notes to Financial Statements.
| | |
| 38 | | Western Asset Core Plus Bond Portfolio 2010 Annual Report |
Schedule of investments (cont’d)
December 31, 2010
Western Asset Core Plus Bond Portfolio
| | | | | | | | | | | | | | | | |
| Security | | Rate | | | Maturity
Date | | | Face
Amount† | | | Value | |
Industrial Conglomerates — 0.0% | | | | | | | | | | | | | | | | |
Penafore, LLC, Term Loan B | | | 6.250 | % | | | 9/29/16 | | | | 493,311 | | | $ | 499,653 | (i) |
Total Industrials | | | | | | | | | | | | | | | 2,039,853 | |
| Information Technology — 0.5% | | | | | | | | | | | | | | | | |
Communications Equipment — 0.0% | | | | | | | | | | | | | |
Panamsat Corp., Term Loan, Tranche A | | | 2.790 | % | | | 7/3/12 | | | | 750,000 | | | | 747,375 | (i) |
IT Services — 0.5% | | | | | | | | | | | | | | | | |
First Data Corp., Term Loan, Tranche B1 | | | 3.011 | % | | | 9/24/14 | | | | 34,256,784 | | | | 31,569,785 | (i) |
SunGard Data Systems Inc., Term Loan B | | | 2.010-3.911 | % | | | 2/26/16 | | | | 1,818,422 | | | | 1,800,807 | (i) |
Total IT Services | | | | | | | | | | | | | | | 33,370,592 | |
Semiconductors & Semiconductor Equipment — 0.0% | | | | | | | | | |
Sensata Technologies, Term Loan, Tranche B | | | 2.038 | % | | | 4/26/13 | | | | 994,792 | | | | 969,424 | (i) |
Total Information Technology | | | | | | | | | | | | | | | 35,087,391 | |
| Utilities — 0.0% | | | | | | | | | | | | | | | | |
Electric Utilities — 0.0% | | | | | | | | | | | | | | | | |
TXU, Term Loan, Tranche B2 | | | 3.764 | % | | | 10/10/14 | | | | 1,209,375 | | | | 932,868 | (i) |
Total Collateralized Senior Loans (Cost — $47,937,736) | | | | | | | | 45,579,954 | |
| Mortgage-Backed Securities — 30.9% | | | | | | | | | | | | | | | | |
FHLMC — 0.7% | | | | | | | | | | | | | | | | |
Federal Home Loan Mortgage Corp. (FHLMC) | | | 6.000 | % | | | 4/1/11-11/1/36 | | | | 2,848,720 | | | | 3,097,325 | |
Federal Home Loan Mortgage Corp. (FHLMC) | | | 5.500 | % | | | 12/1/13-7/1/20 | | | | 552,348 | | | | 595,675 | |
Federal Home Loan Mortgage Corp. (FHLMC) | | | 7.000 | % | | | 10/1/16-4/1/32 | | | | 757,083 | | | | 862,136 | |
Federal Home Loan Mortgage Corp. (FHLMC) | | | 6.500 | % | | | 7/1/29 | | | | 177,852 | | | | 199,980 | |
Federal Home Loan Mortgage Corp. (FHLMC) | | | 4.658 | % | | | 8/1/35 | | | | 8,104,012 | | | | 8,495,534 | (g) |
Federal Home Loan Mortgage Corp. (FHLMC) | | | 2.758 | % | | | 9/1/35 | | | | 3,091,002 | | | | 3,226,580 | (g) |
Federal Home Loan Mortgage Corp. (FHLMC) | | | 5.085 | % | | | 9/1/35 | | | | 1,043,645 | | | | 1,106,172 | (g) |
Federal Home Loan Mortgage Corp. (FHLMC) | | | 2.772 | % | | | 10/1/35 | | | | 2,159,944 | | | | 2,256,950 | (g) |
Federal Home Loan Mortgage Corp. (FHLMC) | | | 4.564 | % | | | 12/1/35 | | | | 3,374,784 | | | | 3,523,606 | (g) |
Federal Home Loan Mortgage Corp. (FHLMC) | | | 5.147 | % | | | 12/1/35 | | | | 243,462 | | | | 259,465 | (g) |
Federal Home Loan Mortgage Corp. (FHLMC) | | | 5.746 | % | | | 2/1/37 | | | | 19,329 | | | | 20,540 | (g) |
See Notes to Financial Statements.
| | | | |
| Western Asset Core Plus Bond Portfolio 2010 Annual Report | | | 39 | |
Western Asset Core Plus Bond Portfolio
| | | | | | | | | | | | | | | | |
| Security | | Rate | | | Maturity
Date | | | Face
Amount† | | | Value | |
FHLMC — continued | | | | | | | | | | | | | | | | |
Federal Home Loan Mortgage Corp. (FHLMC) | | | 5.631 | % | | | 5/1/37 | | | | 2,322,117 | | | $ | 2,458,767 | (g) |
Federal Home Loan Mortgage Corp. (FHLMC) | | | 5.769 | % | | | 5/1/37 | | | | 170,265 | | | | 180,949 | (g) |
Federal Home Loan Mortgage Corp. (FHLMC) | | | 5.785 | % | | | 5/1/37 | | | | 4,013,443 | | | | 4,252,903 | (g) |
Federal Home Loan Mortgage Corp. (FHLMC) | | | 5.860 | % | | | 5/1/37 | | | | 38,788 | | | | 41,006 | (g) |
Federal Home Loan Mortgage Corp. (FHLMC) | | | 5.362 | % | | | 6/1/37 | | | | 541,721 | | | | 574,154 | (g) |
Federal Home Loan Mortgage Corp. (FHLMC) | | | 5.813 | % | | | 6/1/37 | | | | 840,289 | | | | 888,841 | (g) |
Federal Home Loan Mortgage Corp. (FHLMC) | | | 5.866 | % | | | 7/1/37 | | | | 19,104,838 | | | | 20,467,589 | (g) |
Federal Home Loan Mortgage Corp. (FHLMC) | | | 5.675 | % | | | 8/1/37 | | | | 5,466,702 | | | | 5,800,929 | (g) |
Federal Home Loan Mortgage Corp. (FHLMC) | | | 6.025 | % | | | 9/1/37 | | | | 113,421 | | | | 121,862 | (g) |
Federal Home Loan Mortgage Corp. (FHLMC) | | | 4.000 | % | | | 1/13/41 | | | | 2,900,000 | | | | 2,878,702 | (j) |
Total FHLMC | | | | | | | | | | | | | | | 61,309,665 | |
FNMA — 20.2% | | | | | | | | | | | | | | | | |
Federal National Mortgage Association (FNMA) | | | 6.500 | % | | | 5/1/14-4/1/36 | | | | 6,542,265 | | | | 7,306,260 | |
Federal National Mortgage Association (FNMA) | | | 5.500 | % | | | 1/1/17-9/1/36 | | | | 36,306,353 | | | | 39,123,806 | |
Federal National Mortgage Association (FNMA) | | | 9.500 | % | | | 11/1/21 | | | | 660 | | | | 740 | |
Federal National Mortgage Association (FNMA) | | | 6.000 | % | | | 4/1/24-12/1/39 | | | | 121,591,085 | | | | 132,352,912 | |
Federal National Mortgage Association (FNMA) | | | 3.500 | % | | | 11/1/25 | | | | 1,000,000 | | | | 1,009,219 | |
Federal National Mortgage Association (FNMA) | | | 3.500 | % | | | 1/19/26-1/13/41 | | | | 286,830,000 | | | | 287,805,956 | (j) |
Federal National Mortgage Association (FNMA) | | | 7.000 | % | | | 8/1/29-7/1/32 | | | | 2,391,617 | | | | 2,723,881 | |
Federal National Mortgage Association (FNMA) | | | 7.500 | % | | | 11/1/29 | | | | 12,499 | | | | 14,334 | |
Federal National Mortgage Association (FNMA) | | | 2.647 | % | | | 5/1/35 | | | | 2,252,209 | | | | 2,350,909 | (g) |
Federal National Mortgage Association (FNMA) | | | 3.046 | % | | | 6/1/35 | | | | 6,159,593 | | | | 6,477,438 | (g) |
Federal National Mortgage Association (FNMA) | | | 5.325 | % | | | 6/1/35 | | | | 1,525,290 | | | | 1,614,407 | (g) |
Federal National Mortgage Association (FNMA) | | | 2.844 | % | | | 8/1/35 | | | | 1,126,560 | | | | 1,178,762 | (g) |
Federal National Mortgage Association (FNMA) | | | 2.851 | % | | | 9/1/35 | | | | 1,891,873 | | | | 1,978,492 | (g) |
Federal National Mortgage Association (FNMA) | | | 2.926 | % | | | 9/1/35 | | | | 4,023,692 | | | | 4,214,765 | (g) |
See Notes to Financial Statements.
| | |
| 40 | | Western Asset Core Plus Bond Portfolio 2010 Annual Report |
Schedule of investments (cont’d)
December 31, 2010
Western Asset Core Plus Bond Portfolio
| | | | | | | | | | | | | | | | |
| Security | | Rate | | | Maturity
Date | | | Face
Amount† | | | Value | |
FNMA — continued | | | | | | | | | | | | | | | | |
Federal National Mortgage Association (FNMA) | | | 2.748 | % | | | 10/1/35 | | | | 1,566,238 | | | $ | 1,640,934 | (g) |
Federal National Mortgage Association (FNMA) | | | 2.775 | % | | | 10/1/35 | | | | 1,224,341 | | | | 1,282,720 | (g) |
Federal National Mortgage Association (FNMA) | | | 2.785 | % | | | 10/1/35 | | | | 1,696,447 | | | | 1,771,209 | (g) |
Federal National Mortgage Association (FNMA) | | | 3.476 | % | | | 10/1/35 | | | | 1,533,931 | | | | 1,599,844 | (g) |
Federal National Mortgage Association (FNMA) | | | 2.267 | % | | | 11/1/35 | | | | 188,729 | | | | 193,598 | (g) |
Federal National Mortgage Association (FNMA) | | | 2.273 | % | | | 11/1/35 | | | | 232,987 | | | | 238,769 | (g) |
Federal National Mortgage Association (FNMA) | | | 2.292 | % | | | 11/1/35 | | | | 184,177 | | | | 188,888 | (g) |
Federal National Mortgage Association (FNMA) | | | 2.300 | % | | | 11/1/35 | | | | 164,705 | | | | 168,978 | (g) |
Federal National Mortgage Association (FNMA) | | | 2.326 | % | | | 11/1/35 | | | | 166,953 | | | | 171,502 | (g) |
Federal National Mortgage Association (FNMA) | | | 5.273 | % | | | 12/1/35 | | | | 2,236,729 | | | | 2,388,232 | (g) |
Federal National Mortgage Association (FNMA) | | | 5.477 | % | | | 2/1/36 | | | | 314,132 | | | | 328,367 | (g) |
Federal National Mortgage Association (FNMA) | | | 5.527 | % | | | 2/1/37 | | | | 10,162,776 | | | | 10,757,997 | (g) |
Federal National Mortgage Association (FNMA) | | | 5.723 | % | | | 8/1/37 | | | | 577,812 | | | | 613,883 | (g) |
Federal National Mortgage Association (FNMA) | | | 5.430 | % | | | 11/1/37 | | | | 159,380 | | | | 169,189 | (g) |
Federal National Mortgage Association (FNMA) | | | 4.000 | % | | | 1/13/41-2/10/41 | | | | 188,700,000 | | | | 187,582,293 | (j) |
Federal National Mortgage Association (FNMA) | | | 4.500 | % | | | 1/13/41 | | | | 244,200,000 | | | | 250,648,345 | (j) |
Federal National Mortgage Association (FNMA) | | | 5.000 | % | | | 1/13/41 | | | | 7,300,000 | | | | 7,674,125 | (j) |
Federal National Mortgage Association (FNMA) | | | 5.500 | % | | | 1/13/41-2/10/41 | | | | 358,700,000 | | | | 383,608,855 | (j) |
Federal National Mortgage Association (FNMA) | | | 6.000 | % | | | 1/13/41-2/10/41 | | | | 171,100,000 | | | | 185,938,063 | (j) |
Federal National Mortgage Association (FNMA) | | | 6.500 | % | | | 1/13/41 | | | | 69,100,000 | | | | 76,787,375 | (j) |
Total FNMA | | | | | | | | | | | | | | | 1,601,905,047 | |
See Notes to Financial Statements.
| | | | |
| Western Asset Core Plus Bond Portfolio 2010 Annual Report | | | 41 | |
Western Asset Core Plus Bond Portfolio
| | | | | | | | | | | | | | | | |
| Security | | Rate | | | Maturity
Date | | | Face
Amount† | | | Value | |
GNMA — 10.0% | | | | | | | | | | | | | | | | |
Government National Mortgage Association (GNMA) | | | 7.500 | % | | | 3/15/23-9/15/31 | | | | 164,703 | | | $ | 190,028 | |
Government National Mortgage Association (GNMA) | | | 7.000 | % | | | 7/15/23-7/15/31 | | | | 434,143 | | | | 496,812 | |
Government National Mortgage Association (GNMA) | | | 6.500 | % | | | 4/15/28-3/15/39 | | | | 19,888,572 | | | | 22,875,830 | |
Government National Mortgage Association (GNMA) | | | 6.000 | % | | | 1/15/29-11/15/35 | | | | 38,482,016 | | | | 42,724,989 | |
Government National Mortgage Association (GNMA) | | | 8.000 | % | | | 12/15/30-1/15/31 | | | | 22,873 | | | | 25,573 | |
Government National Mortgage Association (GNMA) | | | 0.661 | % | | | 8/20/31 | | | | 1,593 | | | | 1,593 | (g) |
Government National Mortgage Association (GNMA) | | | 5.500 | % | | | 7/15/33-6/15/35 | | | | 10,821,370 | | | | 11,753,578 | |
Government National Mortgage Association (GNMA) | | | 5.000 | % | | | 4/20/35-11/20/40 | | | | 54,270,737 | | | | 57,769,050 | |
Government National Mortgage Association (GNMA) | | | 4.500 | % | | | 3/15/40 | | | | 9,256,001 | | | | 9,622,322 | |
Government National Mortgage Association (GNMA) | | | 4.000 | % | | | 1/20/41 | | | | 418,900,000 | | | | 421,329,011 | (j) |
Government National Mortgage Association (GNMA) | | | 4.500 | % | | | 1/20/41 | | | | 139,500,000 | | | | 144,818,437 | (j) |
Government National Mortgage Association (GNMA) | | | 5.500 | % | | | 1/20/41 | | | | 61,500,000 | | | | 66,458,437 | (j) |
Government National Mortgage Association (GNMA) | | | 6.000 | % | | | 1/20/41 | | | | 11,100,000 | | | | 12,172,034 | (j) |
Government National Mortgage Association (GNMA) II | | | 5.500 | % | | | 1/20/41 | | | | 1,400,000 | | | | 1,506,323 | (j) |
Total GNMA | | | | | | | | | | | | | | | 791,744,017 | |
Total Mortgage-Backed Securities (Cost — $2,435,516,713) | | | | | | | | 2,454,958,729 | |
| Municipal Bonds — 1.2% | | | | | | | | | | | | | | | | |
California — 0.2% | | | | | | | | | | | | | | | | |
California State, GO, Build America Bonds | | | 7.300 | % | | | 10/1/39 | | | | 8,300,000 | | | | 8,358,930 | |
Los Angeles, CA, Department of Water & Power Revenue, Build America Bonds | | | 6.574 | % | | | 7/1/45 | | | | 5,660,000 | | | | 5,772,634 | |
Total California | | | | | | | | | | | | | | | 14,131,564 | |
Delaware — 0.2% | | | | | | | | | | | | | | | | |
Northstar Education Finance Inc., DE, Student Loan Asset Backed Note | | | 1.751 | % | | | 1/29/46 | | | | 16,150,000 | | | | 13,243,000 | (f)(g) |
See Notes to Financial Statements.
| | |
| 42 | | Western Asset Core Plus Bond Portfolio 2010 Annual Report |
Schedule of investments (cont’d)
December 31, 2010
Western Asset Core Plus Bond Portfolio
| | | | | | | | | | | | | | | | |
| Security | | Rate | | | Maturity
Date | | | Face
Amount† | | | Value | |
Georgia — 0.1% | | | | | | | | | | | | | | | | |
Municipal Electric Authority, GA, Build America Bonds, Plant Vogtle Units 3&4 Project J | | | 6.637 | % | | | 4/1/57 | | | | 5,150,000 | | | $ | 5,034,125 | |
Municipal Electric Authority, GA, Build America Bonds, Plant Vogtle Units 3&4 Project M | | | 6.655 | % | | | 4/1/57 | | | | 2,820,000 | | | | 2,727,560 | |
Total Georgia | | | | | | | | | | | | | | | 7,761,685 | |
Pennsylvania — 0.6% | | | | | | | | | | | | | | | | |
Pennsylvania State Higher Education Assistance Agency, Student Loan Revenue | | | 1.460 | % | | | 5/1/46 | | | | 49,975,000 | | | | 44,227,875 | (g) |
Pennsylvania State Higher Education Assistance Agency, Student Loan Revenue | | | 1.120 | % | | | 5/1/46 | | | | 2,825,000 | | | | 2,535,438 | (g) |
Total Pennsylvania | | | | | | | | | | | | | | | 46,763,313 | |
Texas — 0.1% | | | | | | | | | | | | | | | | |
Brazos Higher Education Authority Inc., Student Loan Revenue Note | | | 1.761 | % | | | 6/25/42 | | | | 11,850,000 | | | | 10,191,000 | (g) |
Total Municipal Bonds (Cost — $92,163,402) | | | | | | | | | | | | 92,090,562 | |
| Sovereign Bonds — 2.2% | | | | | | | | | | | | | | | | |
Brazil — 1.1% | | | | | | | | | | | | | | | | |
Brazil Nota do Tesouro Nacional, Notes | | | 10.000 | % | | | 1/1/12 | | | | 126,605,000 | BRL | | | 74,898,222 | |
Brazil Nota do Tesouro Nacional, Notes | | | 10.000 | % | | | 1/1/14 | | | | 8,102,000 | BRL | | | 4,621,434 | |
Brazil Nota do Tesouro Nacional, Notes | | | 10.000 | % | | | 1/1/17 | | | | 13,407,000 | BRL | | | 7,403,523 | |
Total Brazil | | | | | | | | | | | | | | | 86,923,179 | |
Canada — 0.0% | | | | | | | | | | | | | | | | |
Province of British Columbia | | | 4.300 | % | | | 5/30/13 | | | | 180,000 | | | | 193,865 | |
Malaysia — 0.2% | | | | | | | | | | | | | | | | |
Government of Malaysia, Senior Bonds | | | 3.835 | % | | | 8/12/15 | | | | 55,100,000 | MYR | | | 18,168,705 | |
Mexico — 0.6% | | | | | | | | | | | | | | | | |
Mexican Bonos, Bonds | | | 8.000 | % | | | 6/11/20 | | | | 378,180,000 | MXN | | | 32,796,015 | |
United Mexican States, Bonds | | | 10.000 | % | | | 12/5/24 | | | | 39,070,000 | MXN | | | 3,943,697 | |
United Mexican States, Medium-Term Notes | | | 5.625 | % | | | 1/15/17 | | | | 374,000 | | | | 413,644 | |
United Mexican States, Medium-Term Notes | | | 6.750 | % | | | 9/27/34 | | | | 4,913,000 | | | | 5,527,125 | |
United Mexican States, Medium-Term Notes | | | 6.050 | % | | | 1/11/40 | | | | 2,852,000 | | | | 2,916,170 | |
Total Mexico | | | | | | | | | | | | | | | 45,596,651 | |
Russia — 0.3% | | | | | | | | | | | | | | | | |
RSHB Capital, Loan Participation Notes, Senior Secured Bonds | | | 6.299 | % | | | 5/15/17 | | | | 5,615,000 | | | | 5,643,075 | (d) |
Russian Foreign Bond-Eurobond, Senior Bonds | | | 7.500 | % | | | 3/31/30 | | | | 18,692,970 | | | | 21,618,420 | (d) |
Total Russia | | | | | | | | | | | | | | | 27,261,495 | |
Total Sovereign Bonds (Cost — $158,019,481) | | | | | | | | | | | | 178,143,895 | |
See Notes to Financial Statements.
| | | | |
| Western Asset Core Plus Bond Portfolio 2010 Annual Report | | | 43 | |
Western Asset Core Plus Bond Portfolio
| | | | | | | | | | | | | | | | |
| Security | | Rate | | | Maturity
Date | | | Face
Amount† | | | Value | |
| U.S. Government & Agency Obligations — 8.5% | | | | | | | | | | | | | |
U.S. Government Agencies — 2.9% | | | | | | | | | | | | | | | | |
Federal Home Loan Bank (FHLB), Bonds | | | 0.200 | % | | | 4/20/11 | | | | 25,000,000 | | | $ | 25,001,475 | |
Federal Home Loan Bank (FHLB), Global Bonds | | | 5.500 | % | | | 7/15/36 | | | | 2,240,000 | | | | 2,467,421 | |
Federal National Mortgage Association (FNMA), Bonds | | | 6.625 | % | | | 11/15/30 | | | | 11,095,000 | | | | 13,999,327 | |
Federal National Mortgage Association (FNMA), Debentures | | | 0.000 | % | | | 10/9/19 | | | | 62,140,000 | | | | 39,236,625 | |
Federal National Mortgage Association (FNMA), Senior Notes | | | 5.000 | % | | | 3/15/16 | | | | 40,420,000 | | | | 45,663,727 | |
Federal National Mortgage Association (FNMA), Senior Notes | | | 5.625 | % | | | 7/15/37 | | | | 10,490,000 | | | | 11,788,400 | |
Federal National Mortgage Association (FNMA), Subordinated Notes | | | 5.250 | % | | | 8/1/12 | | | | 6,110,000 | | | | 6,527,307 | |
Financing Corp. (FICO) Strip | | | 0.000 | % | | | 4/5/19 | | | | 320,000 | | | | 240,042 | |
Financing Corp. (FICO) Strip, Bonds | | | 0.000 | % | | | 11/2/18 | | | | 13,500,000 | | | | 10,388,291 | |
Financing Corp. (FICO) Strip, Debentures | | | 0.000 | % | | | 11/30/17 | | | | 1,240,000 | | | | 997,817 | |
Financing Corp. (FICO) Strip, Debentures | | | 0.000 | % | | | 2/8/18 | | | | 3,815,000 | | | | 3,041,509 | |
Financing Corp. (FICO) Strip, Debentures | | | 0.000 | % | | | 5/11/18 | | | | 14,313,000 | | | | 11,265,805 | |
Financing Corp. (FICO) Strip, Debentures | | | 0.000 | % | | | 8/3/18 | | | | 23,073,000 | | | | 17,966,391 | |
Financing Corp. (FICO) Strip, Debentures | | | 0.000 | % | | | 3/7/19 | | | | 11,319,000 | | | | 8,528,799 | |
Financing Corp. (FICO) Strip, Debentures | | | 0.000 | % | | | 6/6/19 | | | | 1,850,000 | | | | 1,374,228 | |
Financing Corp. (FICO) Strip, Notes | | | 0.000 | % | | | 4/6/18 | | | | 11,535,000 | | | | 9,123,608 | |
Financing Corp. (FICO) Strip, Notes | | | 0.000 | % | | | 8/3/18 | | | | 13,681,000 | | | | 10,653,066 | |
Financing Corp. (FICO) Strip, Notes | | | 0.000 | % | | | 9/26/19 | | | | 708,000 | | | | 516,282 | |
Tennessee Valley Authority, Bonds | | | 5.980 | % | | | 4/1/36 | | | | 120,000 | | | | 138,701 | |
Tennessee Valley Authority, Global Power Bonds 2000 | | | 7.125 | % | | | 5/1/30 | | | | 840,000 | | | | 1,095,809 | |
Tennessee Valley Authority, Notes | | | 5.250 | % | | | 9/15/39 | | | | 7,700,000 | | | | 8,140,563 | |
Total U.S. Government Agencies | | | | | | | | | | | | | | | 228,155,193 | |
U.S. Government Obligations — 5.6% | | | | | | | | | | | | | | | | |
U.S. Treasury Bonds | | | 3.875 | % | | | 8/15/40 | | | | 730,000 | | | | 672,398 | |
U.S. Treasury Notes | | | 1.375 | % | | | 2/15/13 | | | | 330,000 | | | | 334,976 | |
U.S. Treasury Notes | | | 0.500 | % | | | 11/15/13 | | | | 1,356,000 | | | | 1,338,520 | |
U.S. Treasury Notes | | | 0.750 | % | | | 12/15/13 | | | | 36,700,000 | | | | 36,439,100 | |
U.S. Treasury Notes | | | 2.125 | % | | | 12/31/15 | | | | 23,320,000 | | | | 23,443,876 | |
U.S. Treasury Notes | | | 2.750 | % | | | 5/31/17 | | | | 10,080,000 | | | | 10,208,359 | |
U.S. Treasury Notes | | | 2.250 | % | | | 11/30/17 | | | | 64,630,000 | | | | 62,847,634 | |
U.S. Treasury Notes | | | 2.750 | % | | | 12/31/17 | | | | 34,100,000 | | | | 34,174,611 | |
U.S. Treasury Notes | | | 2.625 | % | | | 8/15/20 | | | | 23,460,000 | | | | 22,241,182 | |
See Notes to Financial Statements.
| | |
| 44 | | Western Asset Core Plus Bond Portfolio 2010 Annual Report |
Schedule of investments (cont’d)
December 31, 2010
Western Asset Core Plus Bond Portfolio
| | | | | | | | | | | | | | | | |
| Security | | Rate | | | Maturity
Date | | | Face
Amount† | | | Value | |
U.S. Government Obligations — continued | | | | | | | | | | | | | | | | |
U.S. Treasury Notes | | | 2.625 | % | | | 11/15/20 | | | | 266,980,000 | | | $ | 251,837,161 | |
U.S. Treasury Strip Principal (STRIPS) | | | 0.000 | % | | | 11/15/24 | | | | 510,000 | | | | 286,782 | |
Total U.S. Government Obligations | | | | | | | | | | | | | | | 443,824,599 | |
Total U.S. Government & Agency Obligations (Cost — $665,257,741) | | | | | | | | 671,979,792 | |
| U.S. Treasury Inflation Protected Securities — 2.5% | | | | | | | | | | | | | |
U.S. Treasury Bonds, Inflation Indexed | | | 2.375 | % | | | 1/15/25 | | | | 39,239,317 | | | | 43,665,983 | (k) |
U.S. Treasury Bonds, Inflation Indexed | | | 2.000 | % | | | 1/15/26 | | | | 38,070,645 | | | | 40,423,297 | (k) |
U.S. Treasury Bonds, Inflation Indexed | | | 2.375 | % | | | 1/15/27 | | | | 95,684,553 | | | | 106,336,922 | |
U.S. Treasury Bonds, Inflation Indexed | | | 1.750 | % | | | 1/15/28 | | | | 3,077,535 | | | | 3,132,835 | (k) |
U.S. Treasury Bonds, Inflation Indexed | | | 3.625 | % | | | 4/15/28 | | | | 4,678,543 | | | | 6,039,339 | (k) |
Total U.S. Treasury Inflation Protected Securities (Cost — $174,623,514) | | | | 199,598,376 | |
| | | | |
| | | | | | | | | Shares | | | | |
| Common Stocks — 0.0% | | | | | | | | | | | | | | | | |
| Consumer Discretionary — 0.0% | | | | | | | | | | | | | | | | |
Media — 0.0% | | | | | | | | | | | | | | | | |
Citadel Broadcasting Corp., Class A Shares (Cost—$58,034) | | | | 2,967 | | | | 86,785 | * |
| Convertible Preferred Stocks — 0.5% | | | | | | | | | | | | | | | | |
| Consumer Discretionary — 0.5% | | | | | | | | | | | | | | | | |
Automobiles — 0.5% | | | | | | | | | | | | | | | | |
Motors Liquidation Co., Senior Debentures, Series A | | | 4.500 | % | | | | | | | 25,191 | | | | 200,268 | * |
Motors Liquidation Co., Senior Debentures, Series B | | | 5.250 | % | | | | | | | 2,272,284 | | | | 18,632,729 | * |
Motors Liquidation Co., Senior Debentures, Series C | | | 6.250 | % | | | | | | | 2,372,768 | | | | 19,812,613 | * |
Total Consumer Discretionary | | | | | | | | | | | | | | | 38,645,610 | |
| Financials — 0.0% | | | | | | | | | | | | | | | | |
Thrifts & Mortgage Finance — 0.0% | | | | | | | | | | | | | | | | |
Federal National Mortgage Association (FNMA) | | | 5.375 | % | | | | | | | 29 | | | | 50,750 | * |
| Utilities — 0.0% | | | | | | | | | | | | | | | | |
Electric Utilities — 0.0% | | | | | | | | | | | | | | | | |
AES Trust III | | | 6.750 | % | | | | | | | 71,200 | | | | 3,488,800 | |
Total Convertible Preferred Stocks (Cost — $23,074,992) | | | | | | | | | | | | 42,185,160 | |
| Preferred Stocks — 0.5% | | | | | | | | | | | | | | | | |
| Consumer Discretionary — 0.2% | | | | | | | | | | | | | | | | |
Automobiles — 0.2% | | | | | | | | | | | | | | | | |
Motors Liquidation Co. | | | 7.250 | % | | | | | | | 45,400 | | | | 360,930 | * |
Motors Liquidation Co. | | | 1.500 | % | | | | | | | 836,487 | | | | 6,792,274 | * |
Motors Liquidation Co. | | | 7.250 | % | | | | | | | 127,900 | | | | 1,016,805 | * |
See Notes to Financial Statements.
| | | | |
| Western Asset Core Plus Bond Portfolio 2010 Annual Report | | | 45 | |
Western Asset Core Plus Bond Portfolio
| | | | | | | | | | | | | | | | |
| Security | | Rate | | | | | |
Shares | | | Value | |
Automobiles — continued | | | | | | | | | | | | | | | | |
Motors Liquidation Co., Senior Notes | | | 7.250 | % | | | | | | | 56,300 | | | $ | 447,585 | * |
Motors Liquidation Co., Senior Notes | | | 7.375 | % | | | | | | | 327,800 | | | | 2,606,010 | * |
Motors Liquidation Co., Senior Notes | | | 7.500 | % | | | | | | | 259,700 | | | | 2,064,615 | * |
Total Consumer Discretionary | | | | | | | | | | | | | | | 13,288,219 | |
| Financials — 0.3% | | | | | | | | | | | | | | | | |
Diversified Financial Services — 0.3% | | | | | | | | | | | | | | | | |
Citigroup Capital XII, Junior Subordinated Notes | | | 8.500 | % | | | | | | | 481,950 | | | | 12,752,397 | (g) |
Citigroup Capital XIII, Junior Subordinated Notes | | | 7.875 | % | | | | | | | 415,325 | | | | 11,176,396 | *(g) |
Total Diversified Financial Services | | | | | | | | | | | | 23,928,793 | |
Thrifts & Mortgage Finance — 0.0% | | | | | | | | | | | | | | | | |
Federal Home Loan Mortgage Corp. (FHLMC) | | | 8.375 | % | | | | | | | 1,737,615 | | | | 1,092,960 | *(g) |
Federal National Mortgage Association (FNMA) | | | 0.000 | % | | | | | | | 53,100 | | | | 40,356 | *(g) |
Federal National Mortgage Association (FNMA) | | | 8.250 | % | | | | | | | 1,193,775 | | | | 668,514 | *(g) |
Total Thrifts & Mortgage Finance | | | | | | | | | | | | | | | 1,801,830 | |
Total Financials | | | | | | | | | | | | | | | 25,730,623 | |
Total Preferred Stocks (Cost — $122,286,107) | | | | | | | | | | | | 39,018,842 | |
| | | | |
| | | | | | Expiration
Date | | | Contracts | | | | |
| Purchased Options — 0.2% | | | | | | | | | | | | | | | | |
Eurodollar Mid Curve 2-Year Futures, Call @ $98.25 | | | | | | | 3/11/11 | | | | 1,387 | | | | 364,087 | |
Interest rate swaption with Banc of America Securities LLC, Call @ 3.50% | | | | | | | 11/2/17 | | | | 38,950,000 | | | | 1,144,110 | |
Interest rate swaption with Banc of America Securities LLC, Put @ 6.00% | | | | | | | 11/2/17 | | | | 194,800,000 | | | | 8,893,691 | |
Interest rate swaption with Barclays Capital Inc., Call @ 0.85% | | | | | | | 3/16/11 | | | | 134,200,000 | | | | 428,059 | (f) |
Interest rate swaption with Credit Suisse First Boston Inc., Call @ 2.80% | | | | | | | 3/16/11 | | | | 65,300,000 | | | | 119,231 | |
Interest rate swaption with Credit Suisse First Boston Inc., Call @ 3.50% | | | | | | | 11/2/17 | | | | 3,300,000 | | | | 96,934 | |
Interest rate swaption with Credit Suisse First Boston Inc., Put @ 2.80% | | | | | | | 3/16/11 | | | | 21,770,000 | | | | 1,335,531 | |
Interest rate swaption with Credit Suisse First Boston Inc., Put @ 4.35% | | | | | | | 3/16/11 | | | | 196,100,000 | | | | 423,341 | |
Interest rate swaption with Credit Suisse First Boston Inc., Put @ 6.00% | | | | | | | 11/2/17 | | | | 16,700,000 | | | | 762,447 | |
Total Purchased Options (Cost — $19,095,621) | | | | | | | | 13,567,431 | |
Total Investments before Short-term Investments (Cost — $8,360,643,407) | | | | 8,123,071,770 | |
See Notes to Financial Statements.
| | |
| 46 | | Western Asset Core Plus Bond Portfolio 2010 Annual Report |
Schedule of investments (cont’d)
December 31, 2010
Western Asset Core Plus Bond Portfolio
| | | | | | | | | | | | | | |
| Security | | Rate | | | Maturity
Date | | Face Amount† | | | Value | |
| Short-Term Investments — 17.4% | | | | | | | | | | | | | | |
Commercial Paper — 0.5% | | | | | | | | | | | | | | |
Credit Agricole North America Inc.
(Cost—$39,462,872) | | | 0.290 | % | | 1/14/11 | | | 39,467,000 | | | $ | 39,462,872 | (l) |
Sovereign Bonds — 0.5% | | | | | | | | | | | | | | |
Egypt Treasury Bills | | | 8.482 | % | | 2/15/11 | | | 22,700,000 | EGP | | | 3,869,435 | (l) |
Egypt Treasury Bills | | | 8.675 | % | | 2/22/11 | | | 30,850,000 | EGP | | | 5,248,608 | (l) |
Egypt Treasury Bills | | | 8.828 | % | | 3/8/11 | | | 91,600,000 | EGP | | | 15,531,762 | (l) |
Egypt Treasury Bills | | | 8.959 | % | | 3/8/11 | | | 29,225,000 | EGP | | | 4,955,412 | (l) |
Egypt Treasury Bills | | | 9.469 | % | | 5/24/11 | | | 42,225,000 | EGP | | | 7,012,478 | (l) |
Total Sovereign Bonds (Cost — $36,852,371) | | | | | | | 36,617,695 | |
U.S. Government Agencies — 3.9% | | | | | | | | | | | | | | |
Federal Home Loan Bank (FHLB), Discount Notes | | | 0.150 | % | | 5/9/11 | | | 12,200,000 | | | | 12,194,449 | (l) |
Federal Home Loan Bank (FHLB), Discount Notes | | | 0.271 | % | | 9/19/11 | | | 94,000,000 | | | | 93,851,198 | (l) |
Federal Home Loan Mortgage Corp. (FHLMC), Discount Notes | | | 0.180 | % | | 5/9/11 | | | 4,730,000 | | | | 4,727,848 | (k)(l) |
Federal Home Loan Mortgage Corp. (FHLMC), Discount Notes | | | 0.200 | % | | 6/1/11 | | | 21,972,000 | | | | 21,957,455 | (l) |
Federal Home Loan Mortgage Corp. (FHLMC), Discount Notes | | | 0.240 | % | | 7/26/11 | | | 100,000,000 | | | | 99,898,000 | (l) |
Federal National Mortgage Association (FNMA), Discount Notes | | | 0.165 | % | | 4/1/11 | | | 6,400,000 | | | | 6,398,278 | (l) |
Federal National Mortgage Association (FNMA), Discount Notes | | | 0.200 | % | | 5/2/11 | | | 40,000,000 | | | | 39,982,800 | (l) |
Federal National Mortgage Association (FNMA), Discount Notes | | | 0.185 | % | | 5/16/11 | | | 30,043,000 | | | | 30,028,579 | (l) |
Total U.S. Government Agencies (Cost — $308,945,324) | | | | | | | 309,038,607 | |
U.S. Government Obligations — 4.9% | | | | | | | | | | | | | | |
U.S. Treasury Bills | | | 0.100 | % | | 2/24/11 | | | 64,200,000 | | | | 64,190,370 | (l) |
U.S. Treasury Bills | | | 0.120 | % | | 4/14/11 | | | 107,100,000 | | | | 107,058,873 | (l) |
U.S. Treasury Bills | | | 0.118 | % | | 4/21/11 | | | 64,200,000 | | | | 64,173,999 | (l) |
U.S. Treasury Bills | | | 0.202 | % | | 6/2/11 | | | 10,000,000 | | | | 9,993,540 | (k)(l) |
U.S. Treasury Bills | | | 0.155 | % | | 6/9/11 | | | 36,400,000 | | | | 36,373,792 | (l) |
U.S. Treasury Bills | | | 0.180 | % | | 6/23/11 | | | 107,100,000 | | | | 107,007,466 | (l) |
Total U.S. Government Obligations (Cost — $388,804,460) | | | | | | | 388,798,040 | |
Repurchase Agreements — 7.6% | | | | | | | | | | | | | | |
Barclays Capital Inc. repurchase agreement dated 12/31/10; Proceeds at maturity—$62,339,623; (Fully collateralized by U.S. government obligations, 4.500% due 5/15/38; Market value—$63,585,759) | | | 0.120 | % | | 1/3/11 | | | 62,339,000 | | | | 62,339,000 | |
See Notes to Financial Statements.
| | | | |
| Western Asset Core Plus Bond Portfolio 2010 Annual Report | | | 47 | |
Western Asset Core Plus Bond Portfolio
| | | | | | | | | | | | | | | | |
| Security | | Rate | | | Maturity
Date | | | Face Amount† | | | Value | |
Deutsche Bank Securities Inc. repurchase agreement dated 12/31/10; Proceeds at maturity —$65,288,143; (Fully collateralized by U.S. government agency obligations, 3.500% due 8/17/20; Market value — $66,592,741) | | | 0.210 | % | | | 1/3/11 | | | | 65,287,000 | | | $ | 65,287,000 | |
Goldman Sachs & Co. repurchase agreement dated 12/31/10; Proceeds at maturity — $229,267,866; (Fully collateralized by U.S. government agency obligations, 1.500% due 11/23/15; Market value — $233,855,013) | | | 0.150 | % | | | 1/3/11 | | | | 229,265,000 | | | | 229,265,000 | |
Morgan Stanley repurchase agreement dated 12/31/10; Proceeds at maturity — $248,163,861; (Fully collateralized by U.S. government agency obligations, 1.500% due 4/27/15; Market value — $253,125,252) | | | 0.090 | % | | | 1/3/11 | | | | 248,162,000 | | | | 248,162,000 | |
Total Repurchase Agreements (Cost — $605,053,000) | | | | | | | | 605,053,000 | |
Total Short-Term Investments (Cost — $1,379,118,027) | | | | | | | | 1,378,970,214 | |
Total Investments — 119.7% (Cost — $9,739,761,434#) | | | | | | | | | | | | 9,502,041,984 | |
Liabilities in Excess of Other Assets — (19.7)% | | | | | | | | | | | | | | | (1,565,666,711 | ) |
Total Net Assets — 100.0% | | | | | | | | | | | | | | $ | 7,936,375,273 | |
| † | Face amount denominated in U.S. dollars, unless otherwise noted. |
| * | Non-income producing security. |
| (a) | Securities are in default as of December 31, 2010. |
| (b) | The maturity principal is currently in default as of December 31, 2010. |
| (d) | Security is exempt from registration under Rule 144A of the Securities Act of 1933. This security may be resold in transactions that are exempt from registration, normally to qualified institutional buyers. This security has been deemed liquid pursuant to guidelines approved by the Board of Directors, unless otherwise noted. |
| (e) | Payment-in-kind security for which part of the income earned may be paid as additional principal. |
| (f) | Security is valued in good faith at fair value in accordance with procedures approved by the Board of Directors (See Note 1). |
| (g) | Variable rate security. Interest rate disclosed is as of the most recent information available. |
| (h) | Security has no maturity date. The date shown represents the next call date. |
| (i) | Interest rates disclosed represent the effective rates on collateralized senior loans. Ranges in interest rates are attributable to multiple contracts under the same loan. |
| (j) | This security is traded on a to-be-announced (“TBA”) basis (See Note 1). |
| (k) | All or a portion of this security is held at the broker as collateral for open futures contracts. |
| (l) | Rate shown represents yield-to-maturity. |
| # | Aggregate cost for federal income tax purposes is $9,747,170,574. |
See Notes to Financial Statements.
| | |
| 48 | | Western Asset Core Plus Bond Portfolio 2010 Annual Report |
Schedule of investments (cont’d)
December 31, 2010
Western Asset Core Plus Bond Portfolio
| | |
Abbreviations used in this schedule: |
| ARM | | — Adjustable Rate Mortgage |
| BRL | | — Brazilian Real |
| CMB | | — Cash Management Bill |
| EGP | | — Egyptian Pound |
| EUR | | — Euro |
| GO | | — General Obligation |
| HELOC | | — Home Equity Line of Credit |
| IO | | — Interest Only |
| MXN | | — Mexican Peso |
| MYR | | — Malaysian Ringgit |
| STRIPS | | — Separate Trading of Registered Interest and Principal Securities |
| | | | | | | | | | | | | | | | |
| Schedule of Written Options | | | | | | | | | | | | |
| Security | | Expiration
Date | | | Strike
Price | | | Contracts | | | Value | |
Eurodollar Futures, Call | | | 3/14/11 | | | | $98.75 | | | | 600 | | | $ | 1,346,250 | |
Eurodollar Futures, Call | | | 3/14/11 | | | | 98.88 | | | | 566 | | | | 1,096,625 | |
Eurodollar Futures, Call | | | 3/14/11 | | | | 99.63 | | | | 351 | | | | 61,425 | |
Eurodollar Futures, Put | | | 3/14/11 | | | | 99.63 | | | | 351 | | | | 52,650 | |
Eurodollar Mid Curve 2-Year Futures, Call | | | 3/11/11 | | | | 98.50 | | | | 1,387 | | | | 173,375 | |
U.S. Treasury 10-Year Notes Futures, Call | | | 2/18/11 | | | | 122.00 | | | | 510 | | | | 398,437 | |
U.S. Treasury 10-Year Notes Futures, Put | | | 2/18/11 | | | | 122.50 | | | | 506 | | | | 1,359,875 | |
U.S. Treasury 10-Year Notes Futures, Put | | | 2/18/11 | | | | 121.00 | | | | 406 | | | | 710,500 | |
U.S. Treasury 10-Year Notes Futures, Put | | | 2/18/11 | | | | 124.00 | | | | 164 | | | | 630,375 | |
| | | | |
| | | | | | Strike
Rate | | | Notional
Par | | | | |
Interest rate swaption with Banc of America Securities LLC, Put | | | 11/2/17 | | | | 7.25% | | | | 155,800,000 | | | $ | 4,330,975 | |
Interest rate swaption with Banc of America Securities LLC, Put | | | 11/2/17 | | | | 9.50 | | | | 155,800,000 | | | | 2,516,949 | |
Interest rate swaption with Barclays Capital Inc., Call | | | 3/16/11 | | | | 0.75 | | | | 268,300,000 | | | | 363,807 | ‡ |
Interest rate swaption with Barclays Capital Inc., Call | | | 10/2/13 | | | | 4.95 | | | | 124,690,000 | | | | 9,604,210 | |
Interest rate swaption with Barclays Capital Inc., Put | | | 10/2/13 | | | | 4.95 | | | | 124,690,000 | | | | 5,965,980 | |
Interest rate swaption with Credit Suisse First Boston Inc., Put | | | 11/2/17 | | | | 7.25 | | | | 13,300,000 | | | | 369,717 | |
Interest rate swaption with Credit Suisse First Boston Inc., Put | | | 11/2/17 | | | | 9.50 | | | | 13,300,000 | | | | 214,862 | |
Interest rate swaption with JPMorgan Securities Inc., Call | | | 10/3/13 | | | | 4.86 | | | | 124,700,000 | | | | 9,066,339 | |
Interest rate swaption with JPMorgan Securities Inc., Put | | | 10/3/13 | | | | 4.86 | | | | 124,700,000 | | | | 6,330,632 | |
Total Written Options (Premiums Received — $39,448,431) | | | | | | | | | | | $ | 44,592,983 | |
| ‡ | Security is valued in good faith at fair value in accordance with procedures approved by the Board of Directors (See Note 1). |
| | | | |
| Western Asset Core Plus Bond Portfolio 2010 Annual Report | | | 49 | |
Statement of assets and liabilities
December 31, 2010
| | | | |
| |
| Assets: | | | | |
Investments, at value (Cost — $9,739,761,434) | | $ | 9,502,041,984 | |
Foreign currency, at value (Cost — $1,845,391) | | | 1,787,891 | |
Cash | | | 2,871,312 | |
Receivable for securities sold | | | 2,882,315,277 | |
Deposits with brokers for swap contracts | | | 62,270,000 | |
Interest receivable | | | 57,488,512 | |
Unrealized appreciation on swaps | | | 21,931,509 | |
Receivable for Fund shares sold | | | 12,965,037 | |
Premiums paid for open swaps | | | 11,461,148 | |
Unrealized appreciation on forward foreign currency contracts | | | 6,121,337 | |
Receivable from broker — variation margin on open futures contracts | | | 5,455,519 | |
Foreign currency collateral for open futures contracts, at value (Cost — $3,769,420) | | | 3,814,637 | |
Deposits with brokers for open futures contracts | | | 2,049,564 | |
Receivable for open swap contracts | | | 772,484 | |
Principal paydown receivable | | | 617,176 | |
Prepaid expenses | | | 104,112 | |
Other receivables | | | 1,019 | |
Total Assets | | | 12,574,068,518 | |
| |
| Liabilities: | | | | |
Payable for securities purchased | | | 4,509,570,819 | |
Written options, at value (premium received $39,448,431) | | | 44,592,983 | |
Unrealized depreciation on swaps | | | 40,750,447 | |
Payable for Fund shares repurchased | | | 10,844,174 | |
Premiums received for open swaps | | | 9,586,453 | |
Unrealized depreciation on forward foreign currency contracts | | | 7,152,231 | |
Payable for open swap contracts | | | 6,385,626 | |
Distributions payable | | | 4,908,104 | |
Investment management fee payable | | | 2,572,605 | |
Distribution fees payable | | | 193,262 | |
Directors’ fees payable | | | 90,266 | |
Accrued expenses | | | 1,046,275 | |
Total Liabilities | | | 4,637,693,245 | |
| Total Net Assets | | $ | 7,936,375,273 | |
| |
| Net Assets: | | | | |
Par value (Note 7) | | $ | 736,073 | |
Paid-in capital in excess of par value | | | 8,687,278,628 | |
Undistributed net investment income | | | 31,344,489 | |
Accumulated net realized loss on investments, futures contracts, written options,
swap contracts and foreign currency transactions | | | (509,642,556) | |
Net unrealized depreciation on investments, futures contracts, written options,
swap contracts and foreign currencies | | | (273,341,361) | |
| Total Net Assets | | $ | 7,936,375,273 | |
See Notes to Financial Statements.
| | |
| 50 | | Western Asset Core Plus Bond Portfolio 2010 Annual Report |
Statement of assets and liabilities (cont’d)
December 31, 2010
| | | | |
| |
| Shares Outstanding: | | | | |
ClassIS1 | | | 169,255,507 | |
ClassI1 | | | 481,167,286 | |
ClassFI1 | | | 85,650,018 | |
| |
| Net Asset Value: | | | | |
ClassIS1 | | | $10.78 | |
ClassI1 | | | $10.78 | |
ClassFI1 | | | $10.78 | |
| 1 | In April 2010, Institutional Select Class, Institutional Class and Financial Intermediary Class shares were renamed Class IS, Class I and Class FI shares, respectively. |
See Notes to Financial Statements.
| | | | |
| Western Asset Core Plus Bond Portfolio 2010 Annual Report | | | 51 | |
Statement of operations
For the Year Ended December 31, 2010
| | | | |
| |
| Investment Income: | | | | |
Interest | | $ | 373,160,291 | |
Dividends | | | 1,352,581 | |
Total Investment Income | | | 374,512,872 | |
| |
| Expenses: | | | | |
Investment management fee (Note 2) | | | 32,449,238 | |
Distribution fees (Notes 2 and 5) | | | 2,191,912 | |
Transfer agent fees (Note 5) | | | 1,651,550 | |
Custody fees | | | 923,200 | |
Directors’ fees | | | 437,890 | |
Legal fees | | | 216,644 | |
Shareholder reports (Note 5) | | | 88,482 | |
Audit and tax | | | 87,201 | |
Insurance | | | 81,882 | |
Registration fees | | | 56,368 | |
Miscellaneous expenses | | | 23,568 | |
Total Expenses | | | 38,207,935 | |
Less: Fee waivers and/or expense reimbursements (Notes 2 and 5) | | | (538,164) | |
Compensating balance arrangements (Note 1) | | | (1,944) | |
Net Expenses | | | 37,667,827 | |
| Net Investment Income | | | 336,845,045 | |
| |
| Realized and Unrealized Gain (Loss) on Investments, Futures Contracts, Written Options, Swap Contracts and Foreign Currency Transactions (Notes 1, 3 and 4): | | | | |
Net Realized Gain (Loss) From: | | | | |
Investment transactions | | | 134,851,041 | |
Futures contracts | | | (1,119,255) | |
Written options | | | 15,194,670 | |
Swap contracts | | | (14,252,332) | |
Foreign currency transactions | | | 11,615,272 | |
Net Realized Gain | | | 146,289,396 | |
Change in Net Unrealized Appreciation (Depreciation) From: | | | | |
Investments | | | 423,499,676 | |
Futures contracts | | | (3,482,551) | |
Written options | | | 1,139,202 | |
Swap contracts | | | 27,368,283 | |
Foreign currencies | | | (16,684,555) | |
Change in Net Unrealized Appreciation (Depreciation) | | | 431,840,055 | |
Net Gain on Investments, Futures Contracts, Written Options, Swap Contracts
and Foreign Currency Transactions | | | 578,129,451 | |
| Increase in Net Assets From Operations | | $ | 914,974,496 | |
See Notes to Financial Statements.
| | |
| 52 | | Western Asset Core Plus Bond Portfolio 2010 Annual Report |
Statements of changes in net assets
| | | | | | | | |
| For the Years Ended December 31, | | 2010 | | | 2009 | |
| | |
| Operations: | | | | | | | | |
Net investment income | | $ | 336,845,045 | | | $ | 417,222,146 | |
Net realized gain (loss) | | | 146,289,396 | | | | (329,058,405) | |
Change in net unrealized appreciation (depreciation) | | | 431,840,055 | | | | 1,715,806,402 | |
Increase in Net Assets From Operations | | | 914,974,496 | | | | 1,803,970,143 | |
| | |
| Distributions to Shareholders From (Notes 1 and 6): | | | | | | | | |
Net investment income | | | (416,208,329) | | | | (488,706,607) | |
Net realized gains | | | — | | | | (113,478,222) | |
Decrease in Net Assets From Distributions to Shareholders | | | (416,208,329) | | | | (602,184,829) | |
| | |
| Fund Share Transactions (Note 7): | | | | | | | | |
Net proceeds from sale of shares | | | 1,551,885,411 | | | | 1,643,838,217 | |
Reinvestment of distributions | | | 383,101,489 | | | | 542,889,333 | |
Cost of shares repurchased | | | (2,556,900,880) | | | | (4,336,464,664) | |
Decrease in Net Assets From Fund Share Transactions | | | (621,913,980) | | | | (2,149,737,114) | |
Decrease in Net Assets | | | (123,147,813) | | | | (947,951,800) | |
| | |
| Net Assets: | | | | | | | | |
Beginning of year | | | 8,059,523,086 | | | | 9,007,474,886 | |
End of year* | | $ | 7,936,375,273 | | | $ | 8,059,523,086 | |
* Includes undistributed net investment income of: | | | $31,344,489 | | | | $104,833,740 | |
See Notes to Financial Statements.
| | | | |
| Western Asset Core Plus Bond Portfolio 2010 Annual Report | | | 53 | |
Financial highlights
| | | | | | | | | | | | |
For a share of each class of capital stock outstanding throughout each year ended December 31, unless
otherwise noted: | |
| Class IS Shares1,2 | | 2010 | | | 2009 | | | 20083 | |
| | | |
| Net asset value, beginning of year | | | $10.13 | | | | $8.66 | | | | $9.34 | |
| | | |
| Income (loss) from operations: | | | | | | | | | | | | |
Net investment income | | | 0.45 | | | | 0.48 | | | | 0.20 | |
Net realized and unrealized gain (loss) | | | 0.76 | | | | 1.70 | | | | (0.62) | |
Total income (loss) from operations | | | 1.21 | | | | 2.18 | | | | (0.42) | |
| | | |
| Less distributions from: | | | | | | | | | | | | |
Net investment income | | | (0.56) | | | | (0.57) | | | | (0.26) | |
Net realized gains | | | — | | | | (0.14) | | | | — | |
Total distributions | | | (0.56) | | | | (0.71) | | | | (0.26) | |
| | | |
| Net asset value, end of year | | | $10.78 | | | | $10.13 | | | | $8.66 | |
Total return4 | | | 12.10 | % | | | 26.11 | % | | | (4.54) | % |
| | | |
| Net assets, end of year (000s) | | | $1,824,251 | | | | $1,835,921 | | | | $1,559,843 | |
| | | |
| Ratios to average net assets: | | | | | | | | | | | | |
Gross expenses | | | 0.43 | % | | | 0.43 | % | | | 0.44 | %5 |
Net expenses6 | | | 0.43 | | | | 0.43 | 7 | | | 0.44 | 5,7 |
Net investment income | | | 4.2 | | | | 5.2 | | | | 5.7 | 5 |
| | | |
| Portfolio turnover rate | | | 464 | % | | | 202 | % | | | 124 | %8 |
| 1 | In April 2010, Institutional Select Class shares were renamed Class IS shares. |
| 2 | Per share amounts have been calculated using the average shares method. |
| 3 | For the period August 4, 2008 (commencement of operations) to December 31, 2008. |
| 4 | Performance figures may reflect compensating balance arrangements, fee waivers and/or expense reimbursements. In the absence of compensating balance arrangements, fee waivers and/or expense reimbursements, the total return would have been lower. Past performance is no guarantee of future results. Total returns for periods of less than one year are not annualized. |
| 6 | The impact of compensating balance arrangements, if any, was less than 0.01%. |
| 7 | Reflects fee waivers and/or expense reimbursements. |
See Notes to Financial Statements.
| | |
| 54 | | Western Asset Core Plus Bond Portfolio 2010 Annual Report |
Financial highlights (cont’d)
| | | | | | | | | | | | | | | | | | | | | | | | |
For a share of each class of capital stock outstanding throughout each year ended December 31, unless
otherwise noted: | |
| Class I Shares1 | | 2010 | | | 2009 | | | 20082 | | | 20083 | | | 20073 | | | 20063 | |
| | | | | | |
| Net asset value, beginning of year | | | $10.14 | | | | $8.66 | | | | $9.87 | | | | $10.55 | | | | $10.24 | | | | $10.52 | |
| | | | | | |
| Income (loss) from operations: | | | | | | | | | | | | | | | | | | | | | | | | |
Net investment income | | | 0.45 | 4 | | | 0.48 | 4 | | | 0.39 | 4 | | | 0.55 | 4 | | | 0.51 | 4 | | | 0.45 | |
Net realized and unrealized gain (loss) | | | 0.75 | | | | 1.71 | | | | (1.17) | | | | (0.62) | | | | 0.33 | | | | (0.18) | |
Total income (loss) from operations | | | 1.20 | | | | 2.19 | | | | (0.78) | | | | (0.07) | | | | 0.84 | | | | 0.27 | |
| | | | | | |
| Less distributions from: | | | | | | | | | | | | | | | | | | | | | | | | |
Net investment income | | | (0.56) | | | | (0.57) | | | | (0.43) | | | | (0.53) | | | | (0.53) | | | | (0.52) | |
Net realized gains | | | — | | | | (0.14) | | | | — | | | | (0.08) | | | | (0.00) | 5 | | | (0.03) | |
Total distributions | | | (0.56) | | | | (0.71) | | | | (0.43) | | | | (0.61) | | | | (0.53) | | | | (0.55) | |
| | | | | | |
| Net asset value, end of year | | | $10.78 | | | | $10.14 | | | | $8.66 | | | | $9.87 | | | | $10.55 | | | | $10.24 | |
Total return6 | | | 11.97 | % | | | 26.20 | % | | | (8.01) | % | | | (0.72) | % | | | 8.48 | % | | | 2.57 | % |
| | | | | | |
| Net assets, end of year (000s) | | | $5,188,774 | | | | $5,466,554 | | | | $6,607,180 | | | | $12,943,882 | | | | $11,495,842 | | | | $6,896,815 | |
| | | | | | |
| Ratios to average net assets: | | | | | | | | | | | | | | | | | | | | | | | | |
Gross expenses | | | 0.45 | % | | | 0.46 | % | | | 0.46 | %7 | | | 0.43 | % | | | 0.44 | % | | | 0.45 | % |
Net expenses8 | | | 0.45 | | | | 0.46 | | | | 0.46 | 7 | | | 0.43 | 9 | | | 0.44 | 9 | | | 0.45 | 9 |
Net investment income | | | 4.2 | | | | 5.2 | | | | 5.5 | 7 | | | 5.4 | | | | 4.9 | | | | 4.3 | |
| | | | | | |
| Portfolio turnover rate | | | 464 | % | | | 202 | % | | | 124 | %10 | | | 488 | % | | | 449 | % | | | 549 | % |
| 1 | In April 2010, Institutional Class shares were renamed Class I shares. |
| 2 | For the period April 1, 2008 through December 31, 2008. |
| 3 | For the year ended March 31. |
| 4 | Per share amounts have been calculated using the average shares method. |
| 5 | Amount represents less than $0.005 per share. |
| 6 | Performance figures may reflect compensating balance arrangements, fee waivers and/or expense reimbursements. In the absence of compensating balance arrangements, fee waivers and/or expense reimbursements, the total return would have been lower. Past performance is no guarantee of future results. Total returns for periods of less than one year are not annualized. |
| 8 | The impact of compensating balance arrangements, if any, was less than 0.01%. |
| 9 | Reflects fee waivers and/or expense reimbursements. |
See Notes to Financial Statements.
| | | | |
| Western Asset Core Plus Bond Portfolio 2010 Annual Report | | | 55 | |
| | | | | | | | | | | | | | | | | | | | | | | | |
For a share of each class of capital stock outstanding throughout each year ended December 31, unless
otherwise noted: | |
| Class FI Shares1 | | 2010 | | | 2009 | | | 20082 | | | 20083 | | | 20073 | | | 20063 | |
| | | | | | |
| Net asset value, beginning of year | | | $10.13 | | | | $8.66 | | | | $9.88 | | | | $10.56 | | | | $10.24 | | | | $10.52 | |
| | | | | | |
| Income (loss) from operations: | | | | | | | | | | | | | | | | | | | | | | | | |
Net investment income | | | 0.42 | 4 | | | 0.45 | 4 | | | 0.37 | 4 | | | 0.52 | 4 | | | 0.48 | 4 | | | 0.42 | |
Net realized and unrealized gain (loss) | | | 0.76 | | | | 1.71 | | | | (1.17) | | | | (0.62) | | | | 0.35 | | | | (0.18) | |
Total income (loss) from operations | | | 1.18 | | | | 2.16 | | | | (0.80) | | | | (0.10) | | | | 0.83 | | | | 0.24 | |
| | | | | | |
| Less distributions from: | | | | | | | | | | | | | | | | | | | | | | | | |
Net investment income | | | (0.53) | | | | (0.55) | | | | (0.42) | | | | (0.50) | | | | (0.51) | | | | (0.49) | |
Net realized gains | | | — | | | | (0.14) | | | | — | | | | (0.08) | | | | (0.00) | 5 | | | (0.03) | |
Total distributions | | | (0.53) | | | | (0.69) | | | | (0.42) | | | | (0.58) | | | | (0.51) | | | | (0.52) | |
| | | | | | |
| Net asset value, end of year | | | $10.78 | | | | $10.13 | | | | $8.66 | | | | $9.88 | | | | $10.56 | | | | $10.24 | |
Total return6 | | | 11.80 | % | | | 25.78 | % | | | (8.28) | % | | | (0.97) | % | | | 8.30 | % | | | 2.32 | % |
| | | | | | |
| Net assets, end of year (000s) | | | $923,350 | | | | $757,048 | | | | $840,452 | | | | $1,215,985 | | | | $767,903 | | | | $503,217 | |
| | | | | | |
| Ratios to average net assets: | | | | | | | | | | | | | | | | | | | | | | | | |
Gross expenses | | | 0.76 | % | | | 0.86 | % | | | 0.77 | %7 | | | 0.68 | % | | | 0.69 | % | | | 0.70 | % |
Net expenses8,9 | | | 0.70 | | | | 0.70 | | | | 0.70 | 7 | | | 0.68 | | | | 0.69 | | | | 0.70 | |
Net investment income | | | 3.9 | | | | 4.9 | | | | 5.2 | 7 | | | 5.1 | | | | 4.7 | | | | 4.0 | |
| | | | | | |
| Portfolio turnover rate | | | 464 | % | | | 202 | % | | | 124 | %10 | | | 488 | % | | | 449 | % | | | 549 | % |
| 1 | In April 2010, Financial Intermediary Class shares were renamed Class FI shares. |
| 2 | For the period April 1, 2008 through December 31, 2008. |
| 3 | For the year ended March 31. |
| 4 | Per share amounts have been calculated using the average shares method. |
| 5 | Amount represents less than $0.005 per share. |
| 6 | Performance figures may reflect compensating balance arrangements, fee waivers and/or expense reimbursements. In the absence of compensating balance arrangements, fee waivers and/or expense reimbursements, the total return would have been lower. Past performance is no guarantee of future results. Total returns for periods of less than one year are not annualized. |
| 8 | The impact of compensating balance arrangements, if any, was less than 0.01%. |
| 9 | Reflects fee waivers and/or expense reimbursements. |
See Notes to Financial Statements.
| | |
| 56 | | Western Asset Core Plus Bond Portfolio 2010 Annual Report |
Notes to financial statements
1. Organization and significant accounting policies
Western Asset Core Plus Bond Portfolio (the “Fund”) is a separate diversified investment series of Western Asset Funds, Inc. (the “Corporation”). The Corporation, a Maryland Corporation, is registered under the Investment Company Act of 1940, as amended (the “1940 Act”), as an open-end management investment company.
The Fund offers three classes of shares: Class IS, Class I and Class FI. Prior to April 2010, Class IS, Class I and Class FI shares were known as Institutional Select Class, Institutional Class and Financial Intermediary Class shares, respectively. Shares in the Class FI bear a distribution fee. The income and expenses of the Fund are allocated proportionately to each class of shares based on daily net assets, except for Rule 12b-1 distribution fees, which are charged only on the Class FI shares, and transfer agent and shareholder servicing expenses, and certain other expenses, which are determined separately for each class.
The following are significant accounting policies consistently followed by the Fund and are in conformity with U.S. generally accepted accounting principles (“GAAP”). Estimates and assumptions are required to be made regarding assets, liabilities and changes in net assets resulting from operations when financial statements are prepared. Changes in the economic environment, financial markets and any other parameters used in determining these estimates could cause actual results to differ. Subsequent events have been evaluated through the date the financial statements were issued.
(a) Investment valuation. Debt securities are valued at the last quoted bid price provided by an independent pricing service that are based on transactions in debt obligations, quotations from bond dealers, market transactions in comparable securities and various other relationships between securities. Publicly traded foreign government debt securities are typically traded internationally in the over-the-counter market and are valued at the bid prices as of the close of business of that market. Futures contracts are valued daily at the settlement price established by the board of trade or exchange on which they are traded. Equity securities for which market quotations are available are valued at the last reported sales price or official closing price on the primary market or exchange on which they trade. When reliable prices are not readily available, such as when the value of a security has been significantly affected by events after the close of the exchange or market on which the security is principally traded, but before the Fund calculates its net asset value, the Fund values these securities as determined in accordance with procedures approved by the Fund’s Board of Directors. Short-term obligations with maturities of 60 days or less are valued at amortized cost, which approximates fair value.
The Fund has adopted Financial Accounting Standards Board Codification Topic 820 (“ASC Topic 820”). ASC Topic 820 establishes a single definition of fair value, creates a three-tier hierarchy as a framework for measuring fair value based on inputs used to value the Fund’s investments, and requires additional disclosure about fair value. The hierarchy of inputs is summarized below.
| Ÿ | | Level 1 — quoted prices in active markets for identical investments |
| | | | |
| Western Asset Core Plus Bond Portfolio 2010 Annual Report | | | 57 | |
| Ÿ | | Level 2 — other significant observable inputs (including quoted prices for similar investments, interest rates, prepayment speeds, credit risk, etc.) |
| Ÿ | | Level 3 — significant unobservable inputs (including the Fund’s own assumptions in determining the fair value of investments) |
The inputs or methodology used for valuing securities are not necessarily an indication of the risk associated with investing in those securities.
The Fund uses valuation techniques to measure fair value that are consistent with the market approach and/or income approach, depending on the type of security and the particular circumstance. The market approach uses prices and other relevant information generated by market transactions involving identical or comparable securities. The income approach uses valuation techniques to discount estimated future cash flows to present value.
The following is a summary of the inputs used in valuing the Fund’s assets and liabilities carried at fair value:
| | | | | | | | | | | | | | | | |
| ASSETS | |
| Description | | Quoted Prices
(Level 1) | | | Other Significant
Observable Inputs
(Level 2) | | | Significant
Unobservable
Inputs
(Level 3) | | | Total | |
| Long-term investments†: | | | | | | | | | | | | | | | | |
Corporate bonds & notes | | | — | | | $ | 2,557,861,261 | | | $ | 17,561,062 | | | $ | 2,575,422,323 | |
Asset-backed securities | | | — | | | | 367,246,414 | | | | 2,595,097 | | | | 369,841,511 | |
Collateralized mortgage obligations | | | — | | | | 1,440,508,970 | | | | 89,440 | | | | 1,440,598,410 | |
Collateralized senior loans | | | — | | | | 45,579,954 | | | | — | | | | 45,579,954 | |
Mortgage-backed securities | | | — | | | | 2,454,958,729 | | | | — | | | | 2,454,958,729 | |
Municipal bonds | | | — | | | | 78,847,562 | | | | 13,243,000 | | | | 92,090,562 | |
Sovereign bonds | | | — | | | | 178,143,895 | | | | — | | | | 178,143,895 | |
U.S. government & agency obligations | | | — | | | | 671,979,792 | | | | — | | | | 671,979,792 | |
U.S. treasury inflation protected securities | | | — | | | | 199,598,376 | | | | — | | | | 199,598,376 | |
Common stocks | | $ | 86,785 | | | | — | | | | — | | | | 86,785 | |
Convertible preferred stocks | | | 3,488,800 | | | | 38,696,360 | | | | — | | | | 42,185,160 | |
Preferred stocks | | | 25,730,623 | | | | 13,288,219 | | | | — | | | | 39,018,842 | |
Purchased options | | | 364,087 | | | | 13,203,344 | | | | — | | | | 13,567,431 | |
| Total long-term investments | | $ | 29,670,295 | | | $ | 8,059,912,876 | | | $ | 33,488,599 | | | $ | 8,123,071,770 | |
| Short-term investments† | | | — | | | | 1,378,970,214 | | | | — | | | | 1,378,970,214 | |
| Total investments | | $ | 29,670,295 | | | $ | 9,438,883,090 | | | $ | 33,488,599 | | | $ | 9,502,041,984 | |
| | |
| 58 | | Western Asset Core Plus Bond Portfolio 2010 Annual Report |
Notes to financial statements (cont’d)
| | | | | | | | | | | | | | | | |
| ASSETS | |
| Description | | Quoted Prices
(Level 1) | | | Other Significant
Observable Inputs
(Level 2) | | | Significant
Unobservable
Inputs
(Level 3) | | | Total | |
| Other financial instruments: | | | | | | | | | | | | | | | | |
Futures contracts | | $ | 2,978,134 | | | | — | | | | — | | | $ | 2,978,134 | |
Forward foreign currency contracts | | | — | | | $ | 6,121,337 | | | | — | | | | 6,121,337 | |
Credit default swaps on corporate issues — sell protection‡ | | | — | | | | 5,266,855 | | | | — | | | | 5,266,855 | |
Credit default swaps on corporate issues — buy protection‡ | | | — | | | | 6,862,539 | | | | — | | | | 6,862,539 | |
Credit default swaps on credit indices — sell protection‡ | | | — | | | | 7,595,809 | | | | — | | | | 7,595,809 | |
Credit default swaps on credit indices — buy protection‡ | | | — | | | | 6,418,098 | | | | — | | | | 6,418,098 | |
Total return swaps | | | — | | | | 1,256,248 | | | | — | | | | 1,256,248 | |
| Total other financial instruments | | $ | 2,978,134 | | | $ | 33,520,886 | | | | — | | | $ | 36,499,020 | |
| Total | | $ | 32,648,429 | | | $ | 9,472,403,976 | | | $ | 33,488,599 | | | $ | 9,538,541,004 | |
| | | | | | | | | | | | | | | | |
| LIABILITIES | |
| Description | | Quoted Prices
(Level 1) | | | Other Significant
Observable Inputs
(Level 2) | | | Significant
Unobservable
Inputs
(Level 3) | | | Total | |
| Other financial instruments: | | | | | | | | | | | | | | | | |
Written options | | $ | 5,829,512 | | | $ | 38,763,471 | | | | — | | | $ | 44,592,983 | |
Futures contracts | | | 13,764,208 | | | | — | | | | — | | | | 13,764,208 | |
Forward foreign currency contracts | | | — | | | | 7,152,231 | | | | — | | | | 7,152,231 | |
Interest rate swaps‡ | | | — | | | | 32,864,503 | | | | — | | | | 32,864,503 | |
Credit default swaps on corporate issues — sell protection‡ | | | — | | | | 1,582,490 | | | | — | | | | 1,582,490 | |
Credit default swaps on corporate issues — buy protection‡ | | | — | | | | 162,108 | | | | — | | | | 162,108 | |
Credit default swaps on credit indices — sell protection‡ | | | — | | | | 2,387,594 | | | | — | | | | 2,387,594 | |
Credit default swaps on credit indices — buy protection‡ | | | — | | | | 7,347,097 | | | | — | | | | 7,347,097 | |
| Total | | $ | 19,593,720 | | | $ | 90,259,494 | | | | — | | | $ | 109,853,214 | |
| † | See Schedule of Investments for additional detailed categorizations. |
| ‡ | Values include any premiums paid or received with respect to swap contracts. |
| | | | |
| Western Asset Core Plus Bond Portfolio 2010 Annual Report | | | 59 | |
The following is a reconciliation of investments in which significant unobservable inputs (Level 3) were used in determining fair value:
| | | | | | | | | | | | | | | | | | | | | | | | |
| Investments in Securities | | Corporate
Bonds &
Notes | | | Asset-
Backed
Securities | | | Collateralized
Mortgage
Obligations | | | Municipal
Bonds | | | Preferred
Stocks | | | Total | |
Balance as of
December 31, 2009 | | $ | 2,061,675 | | | | — | | | $ | 92,062 | | | | — | | | $ | 269,028 | | | $ | 2,422,765 | |
| Accrued premiums/discounts | | | (16,184) | | | | — | | | | 16 | | | $ | 15,109 | | | | — | | | | (1,059) | |
| Realized gain (loss)1 | | | — | | | | — | | | | 51 | | | | — | | | | (1,356,147) | | | | (1,356,096) | |
| Change in unrealized appreciation (depreciation)2 | | | 285,609 | | | | — | | | | 4,776 | | | | (15,109) | | | | 1,525,067 | | | | 1,800,343 | |
| Net purchases (sales) | | | 8,726,302 | | | | — | | | | (12,590) | | | | 13,243,000 | | | | (437,948) | | | | 21,518,764 | |
| Transfers in to Level 3 | | | 8,587,610 | | | $ | 2,595,097 | | | | 89,440 | | | | — | | | | — | | | | 11,272,147 | |
| Transfers out of Level 3 | | | (2,083,950) | | | | — | | | | (84,315) | | | | — | | | | — | | | | (2,168,265) | |
Balance as of
December 31, 2010 | | $ | 17,561,062 | | | $ | 2,595,097 | | | $ | 89,440 | | | $ | 13,243,000 | | | | — | | | $ | 33,488,599 | |
| Net change in unrealized appreciation (depreciation) for investments in securities still held at December 31, 20102 | | $ | 263,334 | | | | — | | | | — | | | $ | (15,109) | | | | — | | | $ | 248,225 | |
| 1 | This amount is included in net realized gain (loss) from investment transactions in the accompanying Statement of Operations. |
| 2 | This amount is included in the change in net unrealized appreciation (depreciation) in the accompanying Statement of Operations. Change in unrealized appreciation (depreciation) includes net unrealized appreciation (depreciation) resulting from changes in investment values during the reporting period and the reversal of previously recorded unrealized appreciation (depreciation) when gains or losses are realized. |
(b) Repurchase agreements. The Fund may enter into repurchase agreements with institutions that its investment adviser has determined are creditworthy. Each repurchase agreement is recorded at cost. Under the terms of a typical repurchase agreement, the Fund acquires a debt security subject to an obligation of the seller to repurchase, and of the Fund to resell, the security at an agreed-upon price and time, thereby determining the yield during the Fund’s holding period. When entering into repurchase agreements, it is the Fund’s policy that its custodian or a third party custodian, acting on the Fund’s behalf, take possession of the underlying collateral securities, the market value of which, at all times, at least equals the principal amount of the repurchase transaction, including accrued interest. To the extent that any repurchase transaction maturity exceeds one business day, the value of the collateral is marked-to-market and measured against the value of the agreement in an effort to ensure the adequacy of the collateral. If the counterparty defaults, the Fund generally has the right to use the collateral to satisfy the terms of the repurchase transaction. However, if the market value of the collateral declines during the period in which the Fund seeks to assert its rights or if bankruptcy proceedings are commenced with respect to the seller of the security, realization of the collateral by the Fund may be delayed or limited.
| | |
| 60 | | Western Asset Core Plus Bond Portfolio 2010 Annual Report |
Notes to financial statements (cont’d)
(c) Securities traded on a when-issued basis. The Fund may trade securities on a when-issued basis. In a when-issued transaction, the securities are purchased or sold by the Fund with payment and delivery taking place in the future in order to secure what is considered to be an advantageous price and yield to the Fund at the time of entering into the transaction.
Purchasing such securities involves risk of loss if the value of the securities declines prior to settlement. These securities are subject to market fluctuations and their current value is determined in the same manner as for other securities.
(d) Securities traded on a to-be-announced basis. The Fund may trade securities on a to-be-announced (“TBA”) basis. In a TBA transaction, the Fund commits to purchasing or selling securities which have not yet been issued by the issuer and for which specific information, such as the face amount, maturity date and underlying pool of investments in U.S. government agency mortgage pass-through securities, is not announced. Securities purchased on a TBA basis are not settled until they are delivered to the Fund. Beginning on the date the Fund enters into a TBA transaction, cash, U.S. government securities or other liquid high-grade debt obligations are segregated in an amount equal in value to the purchase price of the TBA security. These securities are subject to market fluctuations and their current value is determined in the same manner as for other securities.
(e) Mortgage dollar rolls. The Fund may enter into mortgage dollar rolls in which the Fund sells mortgage-backed securities for delivery in the current month, realizing a gain or loss, and simultaneously contracts to repurchase substantially similar (same type, coupon and maturity) securities to settle on a specified future date.
The Fund executes its mortgage dollar rolls entirely in the TBA market, whereby the Fund makes a forward commitment to purchase a security and, instead of accepting delivery, the position is offset by a sale of the security with a simultaneous agreement to repurchase at a future date. The Fund accounts for mortgage dollar rolls as purchases and sales.
The risk of entering into mortgage dollar rolls is that the market value of the securities the Fund is obligated to repurchase under the agreement may decline below the repurchase price. In the event the buyer of securities under a mortgage dollar roll files for bankruptcy or becomes insolvent, the Fund’s use of the proceeds of the mortgage dollar roll may be restricted pending a determination by the counterparty, or its trustee or receiver, whether to enforce the Fund’s obligation to repurchase the securities.
(f) Inflation-indexed bonds. Inflation-indexed bonds are fixed-income securities whose principal value or interest rate is periodically adjusted according to the rate of inflation. As the index measuring inflation changes, the principal value or interest rate of inflation-indexed bonds will be adjusted accordingly. Inflation adjustments to the principal amount of inflation-indexed bonds are reflected as an increase or decrease to investment income on the Statement of Operations. Repayment of the original bond principal upon maturity (as adjusted for inflation) is guaranteed in the case of U.S. Treasury inflation-indexed bonds. For bonds that do not provide a similar guarantee, the adjusted principal value of the bond repaid at maturity may be less than the original principal.
| | | | |
| Western Asset Core Plus Bond Portfolio 2010 Annual Report | | | 61 | |
(g) Forward foreign currency contracts. The Fund enters into forward foreign currency contracts to hedge against foreign currency exchange rate risk on its non-U.S. dollar denominated securities or to facilitate settlement of a foreign currency denominated portfolio transaction. A forward foreign currency contract is an agreement between two parties to buy and sell a currency at a set price with delivery and settlement at a future date. The contract is marked-to-market daily and the change in value is recorded by the Fund as an unrealized gain or loss. When a forward foreign currency contract is closed, through either delivery or offset by entering into another forward foreign currency contract, the Fund recognizes a realized gain or loss equal to the difference between the value of the contract at the time it was opened and the value of the contract at the time it is closed.
Forward foreign currency contracts involve elements of market risk in excess of the amounts reflected on the Statement of Assets and Liabilities. The Fund bears the risk of an unfavorable change in the foreign exchange rate underlying the forward foreign currency contract. Risks may also arise upon entering into these contracts from the potential inability of the counterparties to meet the terms of their contracts.
(h) Loan participations. The Fund may invest in loans arranged through private negotiation between one or more financial institutions. The Fund’s investment in any such loan may be in the form of a participation in or an assignment of the loan. In connection with purchasing participations, the Fund generally will have no right to enforce compliance by the borrower with the terms of the loan agreement related to the loan, or any rights of off-set against the borrower and the Fund may not benefit directly from any collateral supporting the loan in which it has purchased the participation.
The Fund assumes the credit risk of the borrower, the lender that is selling the participation and any other persons interpositioned between the Fund and the borrower. In the event of the insolvency of the lender selling the participation, the Fund may be treated as a general creditor of the lender and may not benefit from any off-set between the lender and the borrower.
(i) Written options. When the Fund writes an option, an amount equal to the premium received by the Fund is recorded as a liability, the value of which is marked-to-market daily to reflect the current market value of the option written. If the option expires, the premium received is recorded as a realized gain. When a written call option is exercised, the difference between the premium received plus the option exercise price and the Fund’s basis in the underlying security (in the case of a covered written call option), or the cost to purchase the underlying security (in the case of an uncovered written call option), including brokerage commission, is recognized as a realized gain or loss. When a written put option is exercised, the amount of the premium received is subtracted from the cost of the security purchased by the Fund from the exercise of the written put option to form the Fund’s basis in the underlying security purchased. The writer or buyer of an option traded on an exchange can liquidate the position before the exercise of the option by entering into a closing transaction. The cost of a closing transaction is deducted from the original premium received resulting in a realized gain or loss to the Fund.
| | |
| 62 | | Western Asset Core Plus Bond Portfolio 2010 Annual Report |
Notes to financial statements (cont’d)
The risk in writing a covered call option is that the Fund may forego the opportunity of profit if the market price of the underlying security increases and the option is exercised. The risk in writing a put option is that the Fund may incur a loss if the market price of the underlying security decreases and the option is exercised. The risk in writing an uncovered call option is that the Fund is exposed to the risk of loss if the market price of the underlying security increases. In addition, there is the risk that the Fund may not be able to enter into a closing transaction because of an illiquid secondary market.
(j) Futures contracts. The Fund uses futures contracts to gain exposure to, or hedge against, changes in the value of interest rates or foreign currencies. A futures contract represents a commitment for the future purchase or sale of an asset at a specified price on a specified date.
Upon entering into a futures contract, the Fund is required to deposit cash or cash equivalents with a broker in an amount equal to a certain percentage of the contract amount. This is known as the “initial margin” and subsequent payments (“variation margin”) are made or received by the Fund each day, depending on the daily fluctuation in the value of the contract. For certain futures, including foreign denominated futures, variation margin is not settled daily, but is recorded as a net variation margin payable or receivable. Futures contracts are valued daily at the settlement price established by the board of trade or exchange on which they are traded. The daily changes in contract value are recorded as unrealized gains or losses in the Statement of Operations and the Fund recognizes a realized gain or loss when the contract is closed.
Futures contracts involve, to varying degrees, risk of loss in excess of the amounts reflected in the financial statements. In addition, there is the risk that the Fund may not be able to enter into a closing transaction because of an illiquid secondary market.
(k) Swap agreements. The Fund invests in swaps for the purpose of managing its exposure to interest rate, credit or market risk, or for other purposes. The use of swaps involves risks that are different from those associated with ordinary portfolio transactions.
Swap contracts are marked-to-market daily and changes in value are recorded as unrealized appreciation (depreciation). Gains or losses are realized upon termination of the swap agreement. Collateral, in the form of restricted cash or securities, may be required to be held in segregated accounts with the Fund’s custodian in compliance with the terms of the swap contracts. Securities posted as collateral for swap contracts are identified in the Schedule of Investments and restricted cash, if any, is identified on the Statement of Assets and Liabilities. Risks may exceed amounts recorded in the Statement of Assets and Liabilities. These risks include changes in the returns of the underlying instruments, failure of the counterparties to perform under the contracts’ terms, and the possible lack of liquidity with respect to the swap agreements.
Payments received or made at the beginning of the measurement period are reflected as a premium or deposit, respectively, on the Statement of Assets and
| | | | |
| Western Asset Core Plus Bond Portfolio 2010 Annual Report | | | 63 | |
Liabilities. These upfront payments are amortized over the life of the swap and are recognized as realized gain or loss in the Statement of Operations. Net periodic payments received or paid by the Fund as well as liquidation payments received or made at the termination of the swap are recognized as realized gains or losses in the Statement of Operations.
As disclosed in the Fair Values of Derivatives — Statement of Assets and Liabilities table that follows each Fund’s summary of open swap contracts, the aggregate fair value of credit default swaps in a net liability position as of December 31, 2010 was $11,479,289. The aggregate fair value of assets posted as collateral, net of assets received as collateral, for all swaps was $44,521,460. If a defined credit event had occurred as of December 31, 2010, the swaps’ credit-risk-related contingent features would have been triggered and the Fund would have been required to pay up to $568,936,153 less the value of the contracts’ related reference obligations
Credit default swaps
The Fund enters into credit default swap (“CDS”) contracts for investment purposes, to manage its credit risk or to add leverage. CDS agreements involve one party making a stream of payments to another party in exchange for the right to receive a specified return in the event of a default by a third party, typically corporate or sovereign issuers, on a specified obligation, or in the event of a write-down, principal shortfall, interest shortfall or default of all or part of the referenced entities comprising a credit index. The Fund may use a CDS to provide protection against defaults of the issuers (i.e., to reduce risk where the Fund has exposure to an issuer) or to take an active long or short position with respect to the likelihood of a particular issuer’s default. As a seller of protection, the Fund generally receives an upfront payment or a stream of payments throughout the term of the swap provided that there is no credit event. If the Fund is a seller of protection and a credit event occurs, as defined under the terms of that particular swap agreement, the maximum potential amount of future payments (undiscounted) that the Fund could be required to make under a credit default swap agreement would be an amount equal to the notional amount of the agreement. These amounts of potential payments will be partially offset by any recovery of values from the respective referenced obligations. As a seller of protection, the Fund effectively adds leverage to its portfolio because, in addition to its total net assets, the Fund is subject to investment exposure on the notional amount of the swap. As a buyer of protection, the Fund generally receives an amount up to the notional value of the swap if a credit event occurs.
Implied spreads are the theoretical prices a lender receives for credit default protection. When spreads rise, market perceived credit risk rises and when spreads fall, market perceived credit risk falls. The implied credit spread of a particular referenced entity reflects the cost of buying/selling protection and may include upfront payments required to enter into the agreement. Wider credit spreads and decreasing market values, when compared to the notional amount of the swap, represent a deterioration of the referenced entity’s credit soundness and a greater likelihood or risk of default or other credit event occurring as defined under the terms of the agreement. Credit spreads utilized in determining the period end market value of credit default swap agreements on corporate or sovereign issues are disclosed in
| | |
| 64 | | Western Asset Core Plus Bond Portfolio 2010 Annual Report |
Notes to financial statements (cont’d)
the Notes to Financial Statements and serve as an indicator of the current status of the payment/performance risk and represent the likelihood or risk of default for credit derivatives. For credit default swap agreements on asset-backed securities and credit indices, the quoted market prices and resulting values, particularly in relation to the notional amount of the contract as well as the annual payment rate, serve as an indication of the current status of the payment/performance risk.
The Fund’s maximum risk of loss from counterparty risk, as the protection buyer, is the fair value of the contract (this risk is mitigated by the posting of collateral by the counterparty to the Fund to cover the Fund’s exposure to the counterparty). As the protection seller, the Fund’s maximum risk is the notional amount of the contract. Credit default swaps are considered to have credit risk-related contingent features since they require payment by the protection seller to the protection buyer upon the occurrence of a defined credit event.
Entering into a CDS agreement involves, to varying degrees, elements of credit, market and documentation risk in excess of the related amounts recognized on the Statement of Assets and Liabilities. Such risks involve the possibility that there will be no liquid market for these agreements, that the counterparty to the agreement may default on its obligation to perform or disagree as to the meaning of the contractual terms in the agreement, and that there will be unfavorable changes in net interest rates.
Interest rate swaps
The Fund enters into interest rate swap contracts. Interest rate swaps are agreements between two parties to exchange cash flows based on a notional principal amount. The Fund may elect to pay a fixed rate and receive a floating rate, or, receive a fixed rate and pay a floating rate on a notional principal amount. Interest rate swaps are marked-to-market daily based upon quotations from market makers and the change, if any, is recorded as an unrealized gain or loss in the Statement of Operations. When a swap contract is terminated early, the Fund records a realized gain or loss equal to the difference between the original cost and the settlement amount of the closing transaction.
The risks of interest rate swaps include changes in market conditions that will affect the value of the contract or changes in the present value of the future cash flow streams and the possible inability of the counterparty to fulfill its obligations under the agreement. The Fund’s maximum risk of loss from counterparty credit risk is the discounted net value of the cash flows to be received from the counterparty over the contract’s remaining life, to the extent that that amount is positive. This risk is mitigated by the posting of collateral by the counterparty to the Fund to cover the Fund’s exposure to the counterparty.
Total return swaps
The Fund enters into total return swaps for investment purposes. Total return swaps are agreements to exchange the return generated by one instrument for the return generated by another instrument. For example, the agreement to pay a predetermined or fixed interest rate in exchange for a market-linked return based on a notional amount. To the extent the total return of a referenced index or instrument
| | | | |
| Western Asset Core Plus Bond Portfolio 2010 Annual Report | | | 65 | |
exceeds the offsetting interest obligation, the Fund will receive a payment from the counterparty. To the extent it is less, the Fund will make a payment to the counterparty.
(l) Foreign currency translation. Investment securities and other assets and liabilities denominated in foreign currencies are translated into U.S. dollar amounts based upon prevailing exchange rates on the date of valuation. Purchases and sales of investment securities and income and expense items denominated in foreign currencies are translated into U.S. dollar amounts based upon prevailing exchange rates on the respective dates of such transactions.
The Fund does not isolate that portion of the results of operations resulting from fluctuations in foreign exchange rates on investments from the fluctuations arising from changes in market prices of securities held. Such fluctuations are included with the net realized and unrealized gain or loss on investments.
Net realized foreign exchange gains or losses arise from sales of foreign currencies, including gains and losses on forward foreign currency contracts, currency gains or losses realized between the trade and settlement dates on securities transactions, and the difference between the amounts of dividends, interest, and foreign withholding taxes recorded on the Fund’s books and the U.S. dollar equivalent of the amounts actually received or paid. Net unrealized foreign exchange gains and losses arise from changes in the values of assets and liabilities, other than investments in securities, on the date of valuation, resulting from changes in exchange rates.
Foreign security and currency transactions may involve certain considerations and risks not typically associated with those of U.S. dollar denominated transactions as a result of, among other factors, the possibility of lower levels of governmental supervision and regulation of foreign securities markets and the possibility of political or economic instability.
(m) Stripped securities. The Fund may invest in “Stripped Securities,” a term used collectively for components, or strips, of fixed income securities. Stripped securities can be principal only securities (“PO”), which are debt obligations that have been stripped of unmatured interest coupons or, interest only securities (“IO”), which are unmatured interest coupons that have been stripped from debt obligations. The market value of Stripped Securities will fluctuate in response to changes in economic conditions, rates of pre-payment, interest rates and the market’s perception of the securities. However, fluctuations in response to interest rates may be greater in Stripped Securities than for debt obligations of comparable maturities that pay interest currently. The amount of fluctuation may increase with a longer period of maturity.
The yield to maturity on IO’s is sensitive to the rate of principal repayments (including prepayments) on the related underlying debt obligation and principal payments may have a material effect on yield to maturity. If the underlying debt obligation experiences greater than anticipated prepayments of principal, the Fund may not fully recoup its initial investment in IO’s.
(n) Swaptions. The Fund writes swaption contracts to manage exposure to fluctuations in interest rates and to enhance portfolio yield. Swaption contracts written by the Fund represent an option that gives the purchaser the right, but not the obliga-
| | |
| 66 | | Western Asset Core Plus Bond Portfolio 2010 Annual Report |
Notes to financial statements (cont’d)
tion, to enter into a previously agreed upon swap contract at a future date. If a written call swaption is exercised, the writer enters a swap and is obligated to pay the fixed rate and receive a floating rate in exchange. If a written put swaption is exercised, the writer enters a swap and is obligated to pay the floating rate and receive a fixed rate in exchange. Swaptions are marked-to-market daily based upon quotations from market makers. Changes in the value of the swaption are reported as unrealized gains or losses in the Statement of Operations.
When the Fund writes a swaption, an amount equal to the premium received by the Fund is recorded as a liability, the value of which is marked-to-market daily to reflect the current market value of the swaption written. If the swaption expires, the Fund realizes a gain equal to the amount of the premium received.
(o) Credit and market risk. Investments in securities that are collateralized by residential real estate mortgages are subject to certain credit and liquidity risks. When market conditions result in an increase in default rates of the underlying mortgages and foreclosure values of underlying real estate properties are materially below the outstanding amount of these underlying mortgages, collection of the full amount of accrued interest and principal on these investments may be doubtful. Such market conditions may significantly impair the value and liquidity of these investments and may result in a lack of correlation between their credit ratings and values.
(p) Security transactions and investment income. Security transactions are accounted for on a trade date basis. Interest income, adjusted for amortization of premium and accretion of discount, is recorded on the accrual basis. Dividend income is recorded on the ex-dividend date. The cost of investments sold is determined by use of the specific identification method. To the extent any issuer defaults or a credit event occurs that impacts the issuer, the Fund may halt any additional interest income accruals and consider the realizability of interest accrued up to the date of default or credit event.
(q) Distributions to shareholders. Distributions from net investment income of the Fund are declared each business day to shareholders of record, and are paid monthly. Distributions of net realized gains, if any, are declared at least annually. Distributions are recorded on the ex-dividend date and are determined in accordance with income tax regulations, which may differ from GAAP.
(r) Share class accounting. Investment income, common expenses and realized/unrealized gains (losses) on investments are allocated to the various classes of the Fund on the basis of daily net assets of each class. Fees relating to a specific class are charged directly to that share class.
(s) Compensating balance arrangements. The Fund has an arrangement with its custodian bank whereby a portion of the custodian’s fees is paid indirectly by credits earned on the Fund’s cash on deposit with the bank. The amount is shown as a reduction of expenses in the Statement of Operations.
(t) Federal and other taxes. It is the Fund’s policy to comply with the federal income and excise tax requirements of the Internal Revenue Code of 1986 (the “Code”), as amended, applicable to regulated investment companies. Accordingly, the Fund
| | | | |
| Western Asset Core Plus Bond Portfolio 2010 Annual Report | | | 67 | |
intends to distribute its taxable income and net realized gains, if any, to shareholders in accordance with timing requirements imposed by the Code. Therefore, no federal or state income tax provision is required in the Fund’s financial statements.
Management has analyzed the Fund’s tax positions taken on income tax returns for all open tax years and has concluded that as of December 31, 2010, no provision for income tax is required in the Fund’s financial statements. The Fund’s federal and state income and federal excise tax returns for tax years for which the applicable statutes of limitations have not expired are subject to examination by Internal Revenue Service and state departments of revenue.
Under the applicable foreign tax laws, a withholding tax may be imposed on interest, dividends and capital gains at various rates.
(u) Reclassification. GAAP requires that certain components of net assets be reclassified to reflect permanent differences between financial and tax reporting. These reclassifications have no effect on net assets or net asset values per share. During the current year, the following reclassifications have been made:
| | | | | | | | |
| | | Undistributed Net
Investment Income | | | Accumulated Net
Realized Loss | |
| (a) | | $ | 5,874,033 | | | $ | (5,874,033) | |
| (a) | Reclassifications are primarily due to foreign currency transactions treated as ordinary income for tax purposes, losses from mortgage backed securities treated as capital losses for tax purposes and book/tax differences in the treatment of swap contracts. |
2. Investment management agreement and other transactions with affiliates
The Fund has an investment management agreement with Legg Mason Partners Fund Advisor, LLC (“LMPFA”). Western Asset Management Company (“Western Asset”) is the investment adviser. Western Asset Management Company Limited (“WAML”), Western Asset Management Company Pte. Ltd. (“Western Singapore”) and Western Asset Management Company Ltd (“Western Japan”) share advisory responsibilities with Western Asset. LMPFA, Western Asset, WAML, Western Singapore and Western Japan are wholly owned subsidiaries of Legg Mason, Inc (“Legg Mason”).
LMPFA provides the Fund with management and administrative services for which the Fund pays a fee calculated daily and paid monthly, at an annual rate of 0.450% of the Fund’s average daily net assets up to $500 million, 0.425% of the Fund’s average daily net assets of the next $500 million and 0.400% of the Fund’s average daily net assets in excess of $1 billion. The manager has agreed to forgo fees and/or reimburse operating expenses (other than interest, taxes, extraordinary expenses and brokerage commissions) so that total operating expenses are not expected to exceed 0.45% and 0.70% for Class IS and Class FI shares, respectively. Western Asset and WAML also agreed to waive their advisory fees (which are paid by LMPFA and not the Fund) under corresponding amounts under the Fee Cap. This arrangement cannot be terminated prior to April 30, 2011 without the Board’s consent.
With respect to Class IS and Class FI shares, the manager is permitted to recapture amounts forgone or reimbursed to a class within three years after the day on which
| | |
| 68 | | Western Asset Core Plus Bond Portfolio 2010 Annual Report |
Notes to financial statements (cont’d)
the manager earned the fee or incurred the expense if the class’s total annual operating expenses have fallen to a level below the lower of the limit described above or the limit then in effect.
During the year ended December 31, 2010, waivers and/or reimbursed expenses for the Fund amounted to $538,164. The maximum amounts subject to recapture are $3,982 and $2,271,961 for Class IS and Class FI shares, respectively.
Legg Mason Investor Services, LLC, a wholly-owned broker-dealer subsidiary of Legg Mason serves as the distributor of the Fund’s shares.
3. Investments
During the year ended December 31, 2010, the aggregate cost of purchases and proceeds from sales of investments (excluding short-term investments) and U.S Government & Agency Obligations were as follows:
| | | | | | | | |
| | | Investments | | | U.S. Government & Agency Obligations | |
| Purchases | | $ | 1,453,915,828 | | | $ | 35,930,611,860 | |
| Sales | | | 1,502,161,156 | | | | 36,257,528,918 | |
At December 31, 2010, the aggregate gross unrealized appreciation and depreciation of investments for federal income tax purposes were as follows:
| | | | |
| Gross unrealized appreciation | | $ | 365,511,839 | |
| Gross unrealized depreciation | | | (610,640,429) | |
| Net unrealized depreciation | | $ | (245,128,590) | |
At December 31, 2010, the Fund had the following open futures contracts:
| | | | | | | | | | | | | | | | | | | | |
| | | Number of
Contracts | | | Expiration
Date | | | Basis
Value | | | Market
Value | | | Unrealized
Gain (Loss) | |
| Contracts to Buy: | | | | | | | | | | | | | | | | | | | | |
| 90-day Eurodollar | | | 423 | | | | 3/11 | | | $ | 105,295,875 | | | $ | 105,364,013 | | | $ | 68,138 | |
| U.S. Treasury 2-year Notes | | | 49 | | | | 3/11 | | | | 10,748,003 | | | | 10,726,406 | | | | (21,597) | |
| U.S. Treasury 5-year Notes | | | 585 | | | | 3/11 | | | | 68,913,058 | | | | 68,865,469 | | | | (47,589) | |
| U.S. Treasury 10-year Notes | | | 408 | | | | 3/11 | | | | 48,961,326 | | | | 49,138,500 | | | | 177,174 | |
U.S. Treasury Ultra
Long-term Bonds | | | 3,770 | | | | 3/11 | | | | 491,991,902 | | | | 479,143,437 | | | | (12,848,465) | |
| | | | | | | | | | | | | | | | | | | $ | (12,672,339) | |
| Contracts to Sell: | | | | | | | | | | | | | | | | | | | | |
| German Euro Bund | | | 835 | | | | 3/11 | | | $ | 138,975,649 | | | $ | 139,822,206 | | | $ | (846,557) | |
| U.S. Treasury 30-year Bonds | | | 675 | | | | 3/11 | | | | 85,167,197 | | | | 82,434,375 | | | | 2,732,822 | |
| | | | | | | | | | | | | | | | | | | $ | 1,886,265 | |
| Net unrealized loss on open futures contracts | | | $ | (10,786,074) | |
| | | | |
| Western Asset Core Plus Bond Portfolio 2010 Annual Report | | | 69 | |
During the year ended December 31, 2010, written option transactions for the Fund were as follows:
| | | | | | | | |
| | | Number of Contracts | | | Premiums | |
| Written options, outstanding December 31, 2009 | | | 874,069,311 | | | $ | 45,455,876 | |
| Options written | | | 1,673,150,170 | | | | 22,065,990 | |
| Options closed | | | (343,859,426) | | | | (19,023,814) | |
| Options exercised | | | (2,635) | | | | (1,408,983) | |
| Options expired | | | (1,098,072,579) | | | | (7,640,638) | |
| Written options, outstanding December 31, 2010 | | | 1,105,284,841 | | | $ | 39,448,431 | |
At December 31, 2010, the Fund had the following open forward foreign currency contracts:
| | | | | | | | | | | | | | | | | | |
| Foreign Currency | | Counterparty | | Local
Currency | | | Market
Value | | | Settlement
Date | | | Unrealized
Gain (Loss) | |
| Contracts to Buy: | | | | | | | | | | | | | | | | | | |
| British Pound | | JP Morgan Chase & Co. | | | 29,600,000 | | | $ | 46,133,253 | | | | 2/14/11 | | | $ | (1,256,643) | |
| Canadian Dollar | | Deutsche Bank AG | | | 54,164,500 | | | | 54,426,655 | | | | 2/14/11 | | | | 398,307 | |
| Canadian Dollar | | JP Morgan Chase & Co. | | | 18,877,545 | | | | 18,968,912 | | | | 2/14/11 | | | | 353,472 | |
| Euro | | Citibank N.A. | | | 65,577,026 | | | | 87,620,475 | | | | 2/14/11 | | | | (2,236,117) | |
| Euro | | Credit Suisse First Boston Inc. | | | 31,793,419 | | | | 42,480,647 | | | | 2/14/11 | | | | (828,984) | |
| Euro | | UBS AG | | | 6,170,609 | | | | 8,244,834 | | | | 2/14/11 | | | | (225,191) | |
| Japanese Yen | | Goldman Sachs Group Inc. | | | 3,505,750,760 | | | | 43,200,386 | | | | 2/14/11 | | | | 278,782 | |
| | | | | | | | | | | | | | | | | $ | (3,516,374) | |
| Contracts to Sell: | | | | | | | | | | | | | | | | | | |
| British Pound | | Citibank N.A. | | | 12,611,199 | | | $ | 19,655,258 | | | | 2/14/11 | | | $ | 610,939 | |
| British Pound | | Deutsche Bank AG | | | 36,646,033 | | | | 57,114,890 | | | | 2/14/11 | | | | 1,835,752 | |
| Euro | | Citibank N.A. | | | 60,111,977 | | | | 80,318,372 | | | | 2/14/11 | | | | (841,322) | |
| Euro | | Goldman Sachs Group Inc. | | | 47,500,000 | | | | 63,466,931 | | | | 2/14/11 | | | | 1,138,769 | |
| Euro | | JP Morgan Chase & Co. | | | 58,815,000 | | | | 78,585,422 | | | | 2/14/11 | | | | 1,505,316 | |
| Japanese Yen | | Deutsche Bank AG | | | 3,600,000,000 | | | | 44,361,793 | | | | 2/14/11 | | | | (604,766) | |
| Japanese Yen | | JP Morgan Chase & Co. | | | 7,129,387,100 | | | | 87,853,443 | | | | 2/14/11 | | | | (1,159,208) | |
| | | | | | | | | | | | | | | | | $ | 2,485,480 | |
| Net unrealized loss on open forward foreign currency contracts | | | $ | (1,030,894) | |
At December 31, 2010, the Fund held the following open swap contracts:
| | | | | | | | | | | | | | | | | | | | | | |
| INTEREST RATE SWAPS | |
| Swap Counterparty | | Notional
Amount | | | Termination
Date | | | Payments
Made By
The Fund‡ | | Payments
Received By
The Fund‡ | | | Upfront
Premiums
Paid
(Received) | | | Unrealized
Appreciation
(Depreciation) | |
| Banc of America Securities LLC | | $ | 8,100,000 | | | | 3/1/13 | | | 5.104% semi-annually | | | 3-Month LIBOR | | | | — | | | $ | (738,547) | |
| Banc of America Securities LLC | | | 5,510,000 | | | | 12/16/13 | | | 5.381% semi-annually | | | 3-Month LIBOR | | | | — | | | | (664,256) | |
| Banc of America Securities LLC | | | 7,950,000 | | | | 11/10/15 | | | 4.864% semi-annually | | | 3-Month LIBOR | | | | — | | | | (1,021,216) | |
| | |
| 70 | | Western Asset Core Plus Bond Portfolio 2010 Annual Report |
Notes to financial statements (cont’d)
| | | | | | | | | | | | | | | | | | | | | | |
| INTEREST RATE SWAPS | |
| Swap Counterparty | | Notional
Amount | | | Termination
Date | | | Payments
Made By
The Fund‡ | | Payments
Received By
The Fund‡ | | | Upfront
Premiums
Paid
(Received) | | | Unrealized
Appreciation
(Depreciation) | |
| Banc of America Securities LLC | | $ | 5,500,000 | | | | 1/15/16 | | | 5.451% semi-annually | | | 3-Month LIBOR | | | | — | | | $ | (867,480) | |
| Banc of America Securities LLC | | | 8,270,000 | | | | 10/3/16 | | | 5.425% semi-annually | | | 3-Month LIBOR | | | | — | | | | (1,341,631) | |
| Banc of America Securities LLC | | | 212,490,000 | | | | 2/15/25 | | | 4.295% semi-annually | | | 3-Month LIBOR | | | | — | | | | (12,013,590) | |
| Barclay’s Capital Inc. | | | 10,850,000 | | | | 11/1/11 | | | 5.439% semi-annually | | | 3-Month LIBOR | | | | — | | | | (454,493) | |
| Barclay’s Capital Inc. | | | 6,240,000 | | | | 6/25/12 | | | 5.060% semi-annually | | | 3-Month LIBOR | | | | — | | | | (413,208) | |
| Barclay’s Capital Inc. | | | 6,330,000 | | | | 9/15/12 | | | 5.189% semi-annually | | | 3-Month LIBOR | | | | — | | | | (487,267) | |
| Barclay’s Capital Inc. | | | 66,810,000 | | | | 11/20/19 | | | 3.900% semi-annually | | | 3-Month LIBOR | | | | — | | | | (3,676,427) | |
| Credit Suisse First Boston Inc. | | | 5,300,000 | | | | 8/15/13 | | | 5.023% semi-annually | | | 3-Month LIBOR | | | | — | | | | (541,659) | |
| Credit Suisse First Boston Inc. | | | 6,630,000 | | | | 3/15/14 | | | 5.131% semi-annually | | | 3-Month LIBOR | | | | — | | | | (787,716) | |
| Credit Suisse First Boston Inc. | | | 5,350,000 | | | | 9/15/15 | | | 5.160% semi-annually | | | 3-Month LIBOR | | | | — | | | | (754,512) | |
| Credit Suisse First Boston Inc. | | | 4,880,000 | | | | 3/1/17 | | | 5.335% semi-annually | | | 3-Month LIBOR | | | | — | | | | (779,693) | |
| Deutsche Bank AG | | | 10,890,000 | | | | 6/15/16 | | | 5.183% semi-annually | | | 3-Month LIBOR | | | | — | | | | (1,605,630) | |
| Deutsche Bank AG | | | 8,270,000 | | | | 4/1/17 | | | 5.435% semi-annually | | | 3-Month LIBOR | | | | — | | | | (1,373,363) | |
| JP Morgan Chase & Co. | | | 8,250,000 | | | | 9/15/14 | | | 5.000% semi-annually | | | 3-Month LIBOR | | | | — | | | | (1,014,138) | |
| JP Morgan Chase & Co. | | | 59,100,000 | | | | 3/17/20 | | | 3.600% semi-annually | | | 3-Month LIBOR | | | $ | 79,473 | | | | (1,722,607) | |
| Morgan Stanley & Co. Inc. | | | 5,540,000 | | | | 3/15/12 | | | 4.763% semi-annually | | | 3-Month LIBOR | | | | — | | | | (284,577) | |
| Morgan Stanley & Co. Inc. | | | 6,600,000 | | | | 4/30/16 | | | 5.189% semi-annually | | | 3-Month LIBOR | | | | — | | | | (971,615) | |
| RBS Greenwich | | | 4,560,000 | | | | 4/1/12 | | | 5.011% semi-annually | | | 3-Month LIBOR | | | | — | | | | (256,687) | |
| RBS Greenwich | | | 8,230,000 | | | | 3/1/16 | | | 5.120% semi-annually | | | 3-Month LIBOR | | | | — | | | | (1,173,664) | |
| Total | | $ | 471,650,000 | | | | | | | | | | | | | $ | 79,473 | | | $ | (32,943,976) | |
| | | | | | | | | | | | | | | | | | | | | | | | |
| CREDIT DEFAULT SWAPS ON CORPORATE ISSUES — SELL PROTECTION1 | |
Swap Counterparty
(Reference Entity) | | Notional
Amount2 | | | Termination
Date | | | Implied
Credit Spread
At
December 31,
20103 | | Periodic
Payments
Received By
The Fund‡ | | Market
Value | | | Upfront
Premiums
Paid
(Received) | | | Unrealized
Appreciation
(Depreciation) | |
Deutsche Bank AG (AES Corp.,
7.750%, due 3/1/14) | | $ | 1,700,000 | | | | 12/20/16 | | | 3.80% | | 2.210% quarterly | | $ | (135,863) | | | | — | | | $ | (135,863) | |
Deutsche Bank AG (AES Corp.,
7.750%, due 3/1/14) | | | 2,500,000 | | | | 12/20/16 | | | 3.80% | | 2.200% quarterly | | | (201,057) | | | | — | | | | (201,057) | |
| Deutsche Bank AG (Ford Motor Credit Co., 7.250%, due 10/25/11) | | | 4,450,000 | | | | 9/20/17 | | | 2.23% | | 3.650% quarterly | | | 350,700 | | | | — | | | | 350,700 | |
| | | | |
| Western Asset Core Plus Bond Portfolio 2010 Annual Report | | | 71 | |
| | | | | | | | | | | | | | | | | | | | | | | | |
| CREDIT DEFAULT SWAPS ON CORPORATE ISSUES — SELL PROTECTION1 | |
Swap Counterparty
(Reference Entity) | | Notional
Amount2 | | | Termination
Date | | | Implied
Credit Spread
At
December 31,
20103 | | Periodic
Payments
Received By
The Fund‡ | | Market
Value | | | Upfront
Premiums
Paid
(Received) | | | Unrealized
Appreciation
(Depreciation) | |
| Deutsche Bank AG (Ford Motor Credit Co., 7.250%, due 10/25/11) | | $ | 3,500,000 | | | | 9/20/17 | | | 2.23% | | 3.650% quarterly | | $ | 275,831 | | | | — | | | $ | 275,831 | |
| Deutsche Bank AG (Ford Motor Credit Co., 7.450%, due 7/16/31) | | | 2,600,000 | | | | 3/20/15 | | | 2.20% | | 2.930% quarterly | | | 75,550 | | | | — | | | | 75,550 | |
| Goldman Sachs Group Inc. (Ford Motor Credit Co., 7.000%, due 10/1/13) | | | 9,200,000 | | | | 9/20/11 | | | 0.75% | | 3.800% quarterly | | | 204,457 | | | | — | | | | 204,457 | |
| Goldman Sachs Group Inc. (Ford Motor Credit Co., 7.000%, due 10/1/13) | | | 6,400,000 | | | | 9/20/17 | | | 2.23% | | 3.770% quarterly | | | 546,999 | | | | — | | | | 546,999 | |
Goldman Sachs Group Inc. (Ford Motor Credit Co.,
7.450%, due 7/16/31) | | | 10,000,000 | | | | 9/20/11 | | | 0.55% | | 6.800% quarterly | | | 456,581 | | | | — | | | | 456,581 | |
Goldman Sachs Group Inc. (Ford Motor Credit Co.,
7.450%, due 7/16/31) | | | 8,400,000 | | | | 9/20/11 | | | 0.55% | | 6.800% quarterly | | | 383,528 | | | | — | | | | 383,528 | |
| Goldman Sachs Group Inc. (TXU Corp., 5.550%, due 11/15/14) | | | 2,700,000 | | | | 9/20/12 | | | 11.69% | | 3.240% quarterly | | | (350,215) | | | | — | | | | (350,215) | |
| Merrill Lynch & Co. Inc. (AES Corp., 7.750%, due 3/1/14) | | | 3,600,000 | | | | 3/20/17 | | | 3.84% | | 2.600% quarterly | | | (230,007) | | | | — | | | | (230,007) | |
| Merrill Lynch & Co. Inc. (AES Corp., 7.750%, due 3/1/14) | | | 5,600,000 | | | | 3/20/17 | | | 3.84% | | 2.800% quarterly | | | (299,909) | | | | — | | | | (299,909) | |
RBS Greenwich (Countrywide Home Loans Inc.,
4.000%, due 3/22/11) | | | 7,400,000 | | | | 3/20/12 | | | 0.80% | | 0.600% quarterly | | | (18,413) | | | | — | | | | (18,413) | |
RBS Greenwich (Countrywide Home Loans Inc.,
4.000%, due 3/22/11) | | | 9,900,000 | | | | 9/20/12 | | | 0.94% | | 0.660% quarterly | | | (40,885) | | | | — | | | | (40,885) | |
| RBS Greenwich (Eastman Kodak Co., 7.250%, due 11/15/13) | | | 3,260,000 | | | | 9/20/12 | | | 3.79% | | 2.250% quarterly | | | (83,647) | | | | — | | | | (83,647) | |
| RBS Greenwich (Ford Motor Credit Co., 7.000%, due 10/1/13) | | | 8,900,000 | | | | 9/20/11 | | | 0.75% | | 3.750% quarterly | | | 197,790 | | | $ | (15,500) | | | | 213,290 | |
| RBS Greenwich (Ford Motor Credit Co., 7.000%, due 10/1/13) | | | 8,200,000 | | | | 3/20/12 | | | 0.65% | | 5.380% quarterly | | | 476,585 | | | | — | | | | 476,585 | |
| | |
| 72 | | Western Asset Core Plus Bond Portfolio 2010 Annual Report |
Notes to financial statements (cont’d)
| | | | | | | | | | | | | | | | | | | | | | | | | | |
| CREDIT DEFAULT SWAPS ON CORPORATE ISSUES — SELL PROTECTION1 | |
Swap Counterparty
(Reference Entity) | | Notional
Amount2 | | | Termination
Date | | | Implied
Credit Spread
At
December 31,
20103 | | | Periodic
Payments
Received By
The Fund‡ | | Market
Value | | | Upfront
Premiums
Paid
(Received) | | | Unrealized
Appreciation
(Depreciation) | |
| RBS Greenwich (Ford Motor Credit Co., 7.450%, due 7/16/31) | | $ | 18,400,000 | | | | 9/20/11 | | | | 0.55% | | | 6.750% quarterly | | $ | 833,391 | | | | — | | | $ | 833,391 | |
| RBS Greenwich (Ford Motor Credit Co., 7.450%, due 7/16/31) | | | 7,400,000 | | | | 6/20/12 | | | | 0.74% | | | 5.850% quarterly | | | 558,426 | | | | — | | | | 558,426 | |
| RBS Greenwich (Ford Motor Credit Co., 7.450%, due 7/16/31) | | | 6,900,000 | | | | 6/20/12 | | | | 0.74% | | | 5.150% quarterly | | | 449,314 | | | | — | | | | 449,314 | |
| RBS Greenwich (Ford Motor Credit Co., 7.450%, due 7/16/31) | | | 2,500,000 | | | | 6/20/12 | | | | 0.74% | | | 5.100% quarterly | | | 160,948 | | | | — | | | | 160,948 | |
| RBS Greenwich (General Motors Acceptance Corp., 6.000%, due 4/1/11) | | | 780,000 | | | | 12/20/11 | | | | 1.05% | | | 1.340% quarterly | | | 2,226 | | | | — | | | | 2,226 | |
| RBS Greenwich (General Motors Acceptance Corp., 6.875%, due 8/28/12) | | | 680,000 | | | | 12/20/11 | | | | 1.05% | | | 1.200% quarterly | | | 1,013 | | | | — | | | | 1,013 | |
| RBS Greenwich (General Motors Acceptance Corp., 6.875%, due 8/28/12) | | | 8,500,000 | | | | 3/20/12 | | | | 1.30% | | | 1.170% quarterly | | | (13,146) | | | | — | | | | (13,146) | |
| RBS Greenwich (General Motors Acceptance Corp., 6.875%, due 8/28/12) | | | 9,400,000 | | | | 3/20/12 | | | | 1.30% | | | 1.400% quarterly | | | 11,774 | | | | — | | | | 11,774 | |
| RBS Greenwich (General Motors Acceptance Corp., 6.875%, due 8/28/12) | | | 4,200,000 | | | | 12/20/16 | | | | 2.57% | | | 1.550% quarterly | | | (209,348) | | | | — | | | | (209,348) | |
RBS Greenwich (SLM Corp.,
5.125%, due 8/27/12) | | | 24,300,000 | | | | 6/20/12 | | | | 1.28% | | | 1.760% quarterly | | | 170,844 | | | | — | | | | 170,844 | |
RBS Greenwich (SLM Corp.,
5.125%, due 8/27/12) | | | 3,600,000 | | | | 9/20/12 | | | | 1.47% | | | 2.400% quarterly | | | 56,987 | | | | — | | | | 56,987 | |
RBS Greenwich (SLM Corp.,
5.125%, due 8/27/12) | | | 3,600,000 | | | | 9/20/12 | | | | 1.47% | | | 2.350% quarterly | | | 53,911 | | | | — | | | | 53,911 | |
| Total | | $ | 188,570,000 | | | | | | | | | | | | | $ | 3,684,365 | | | $ | (15,500) | | | $ | 3,699,865 | |
| | | | |
| Western Asset Core Plus Bond Portfolio 2010 Annual Report | | | 73 | |
| | | | | | | | | | | | | | | | | | | | | | |
| CREDIT DEFAULT SWAPS ON CORPORATE ISSUES — BUY PROTECTION4 | |
Swap Counterparty (Reference Entity) | | Notional Amount2 | | | Termination
Date | | | Periodic
Payments
Made By
The Fund‡ | | Market Value | | | Upfront
Premiums
Paid
(Received) | | | Unrealized
Appreciation
(Depreciation) | |
Banc of America Securities LLC (Home Depot Inc.,
3.750%, due 9/15/09) | | $ | 5,510,000 | | | | 12/20/13 | | | 0.635% quarterly | | $ | (52,801) | | | | — | | | $ | (52,801) | |
Banc of America Securities LLC (Marriot International Inc.,
4.625%, due 6/15/12 ) | | | 7,950,000 | | | | 12/20/15 | | | 0.730% monthly | | | 14,792 | | | | — | | | | 14,792 | |
| Banc of America Securities LLC (Masco Corp., 5.875%, due 7/15/12) | | | 8,270,000 | | | | 12/20/16 | | | 1.040% quarterly | | | 586,214 | | | | — | | | | 586,214 | |
Banc of America Securities LLC (PHH Corporate Note,
7.125%, due 3/1/13 ) | | | 5,940,000 | | | | 3/20/13 | | | 1.050% monthly | | | 441,027 | | | | — | | | | 441,027 | |
Banc of America Securities LLC (Viacom Inc.,
4.625%, due 5/15/18) | | | 5,500,000 | | | | 12/20/15 | | | 1.130% quarterly | | | (71,640) | | | | — | | | | (71,640) | |
| Barclay’s Capital Inc. (AmerisourceBergen Corp., 5.625%, due 9/15/12) | | | 6,330,000 | | | | 9/20/12 | | | 0.500% quarterly | | | 2,660 | | | | — | | | | 2,660 | |
| Barclay’s Capital Inc. (Health Care Property Investments Inc., 6.450%, due 6/25/12) | | | 6,240,000 | | | | 6/20/12 | | | 0.630% quarterly | | | 10,146 | | | | — | | | | 10,146 | |
| Barclay’s Capital Inc. (Motorola Inc., 6.500%, due 9/1/25) | | | 10,850,000 | | | | 12/20/11 | | | 0.320% quarterly | | | 6,234 | | | | — | | | | 6,234 | |
| Credit Suisse First Boston Inc. (AmerisourceBergen Corp., 8.125%, due 9/1/08) | | | 5,350,000 | | | | 9/20/15 | | | 0.900% quarterly | | | 7,168 | | | | — | | | | 7,168 | |
Credit Suisse First Boston Inc. (Masco Corp.,
5.875%, due 7/15/12) | | | 5,830,000 | | | | 9/20/13 | | | 0.750% quarterly | | | 151,201 | | | | — | | | | 151,201 | |
Credit Suisse First Boston Inc. (Southwest Airlines Co.,
5.250%, due 10/1/14) | | | 4,880,000 | | | | 3/20/17 | | | 0.690% quarterly | | | 117,656 | | | | — | | | | 117,656 | |
| Credit Suisse First Boston Inc. (Waste Management Inc., 7.375%, due 8/1/10) | | | 6,630,000 | | | | 3/20/14 | | | 0.490% quarterly | | | 42,779 | | | | — | | | | 42,779 | |
| Deutsche Bank AG (Autozone Inc., 6.950%, due 6/15/16) | | | 10,890,000 | | | | 6/20/16 | | | 0.580% quarterly | | | 60,284 | | | | — | | | | 60,284 | |
| Deutsche Bank AG (CenturyTel Inc., 7.875%, due 8/15/12) | | | 8,270,000 | | | | 3/20/17 | | | 0.890% quarterly | | | 319,812 | | | | — | | | | 319,812 | |
| Goldman Sachs Group Inc. (JPM Chase Commercial Mortgage, 5.797%, due 5/15/47) | | | 5,000,000 | | | | 5/15/47 | | | 0.750% monthly | | | 4,439,840 | | | | — | | | | 4,439,840 | * |
JP Morgan Chase & Co. (Bell South Corp.,
6.000%, due 10/15/11) | | | 8,250,000 | | | | 9/20/14 | | | 0.280% quarterly | | | (12,833) | | | | — | | | | (12,833) | |
| Morgan Stanley & Co. Inc. (Gannett Co., 6.375%, due 4/1/12) | | | 4,560,000 | | | | 3/20/12 | | | 0.460% quarterly | | | 8,456 | | | | — | | | | 8,456 | |
| | |
| 74 | | Western Asset Core Plus Bond Portfolio 2010 Annual Report |
Notes to financial statements (cont’d)
| | | | | | | | | | | | | | | | | | | | | | |
| CREDIT DEFAULT SWAPS ON CORPORATE ISSUES — BUY PROTECTION4 | |
Swap Counterparty (Reference Entity) | | Notional Amount2 | | | Termination
Date | | | Periodic
Payments
Made By
The Fund‡ | | Market Value | | | Upfront
Premiums
Paid
(Received) | | | Unrealized
Appreciation
(Depreciation) | |
Morgan Stanley & Co. Inc. (Viacom Inc.,
6.250%, due 4/30/16) | | $ | 10,540,000 | | | | 3/20/12 | | | 0.360% quarterly | | $ | (16,285) | | | | — | | | $ | (16,285) | |
| Morgan Stanley & Co. Inc. (Weyerhaeuser Co. Note, 7.125%, due 7/15/23) | | | 5,540,000 | | | | 3/20/12 | | | 0.740% quarterly | | | (8,549) | | | | — | | | | (8,549) | |
| RBS Greenwich (Home Depot Inc., 5.400%, due 3/1/16) | | | 8,230,000 | | | | 3/20/16 | | | 0.480% monthly | | | 6,367 | | | | — | | | | 6,367 | |
| RBS Greenwich (Washington Mutual 2005-AR11, 1-Month LIBOR + 120 bp, due 8/25/45) | | | 656,047 | | | | 8/25/45 | | | 2.550% monthly | | | 647,903 | 5 | | | — | | | | 647,903 | * |
| Total | | $ | 141,216,047 | | | | | | | | | $ | 6,700,431 | | | | — | | | $ | 6,700,431 | |
| | | | | | | | | | | | | | | | | | | | | | |
| CREDIT DEFAULT SWAPS ON CREDIT INDICES — SELL PROTECTION1 | |
Swap Counterparty
(Reference Entity) | | Notional Amount2 | | | Termination
Date | | | Periodic
Payments
Received By
The Fund‡ | | Market Value5 | | | Upfront
Premiums
Paid
(Received) | | | Unrealized
Appreciation
(Depreciation) | |
| Barclay’s Capital Inc. (CDX IG HVOL 9) | | $ | 1,866,660 | | | | 12/20/12 | | | 1.400% quarterly | | $ | (22,535) | | | $ | (35,138) | | | $ | 12,603 | |
| Barclay’s Capital Inc. (CDX IG HVOL 9) | | | 38,546,529 | | | | 12/20/12 | | | 1.400% quarterly | | | (465,357) | | | | (719,056) | | | | 253,699 | |
| Barclay’s Capital Inc. (CDX North America Crossover Index) | | | 30,613,224 | | | | 12/20/12 | | | 1.400% quarterly | | | (369,581) | | | | (1,019,772) | | | | 650,191 | |
| Credit Suisse First Boston Inc. (ABX.HE-AAA 06-1) | | | 68,067 | | | | 7/25/45 | | | 0.180% monthly | | | (8,083) | | | | (5,817) | | | | (2,266) | |
| Credit Suisse First Boston Inc. (CDX HY 10) | | | 10,614,000 | | | | 6/20/13 | | | 5.000% quarterly | | | 739,363 | | | | (709,174) | | | | 1,448,537 | |
| Deutsche Bank AG (ABX.HE-AAA 06-1) | | | 279,832 | | | | 7/25/45 | | | 0.180% monthly | | | (33,230) | | | | (22,796) | | | | (10,434) | |
| Deutsche Bank AG (iBoxx IG Hi-Vol2) | | | 11,174,667 | | | | 9/20/14 | | | 1.300% quarterly | | | (125,304) | | | | 23,515 | | | | (148,819) | |
| Goldman Sachs Group Inc. (CDX HY 9) | | | 8,780,000 | | | | 12/20/12 | | | 2.000% quarterly | | | 181,648 | | | | — | | | | 181,648 | |
| Goldman Sachs Group Inc. (CDX HY 9) | | | 35,500,000 | | | | 12/20/12 | | | 1.800% quarterly | | | 594,117 | | | | — | | | | 594,117 | |
| Goldman Sachs Group Inc. (CDX IG HVOL 10) | | | 146,906,142 | | | | 6/20/13 | | | 3.500% quarterly | | | 4,856,144 | | | | 1,281,462 | | | | 3,574,682 | |
| Goldman Sachs Group Inc. (iBoxx HY 6B) | | | 12,812,400 | | | | 6/20/11 | | | 3.000% quarterly | | | 133,067 | | | | 18,012 | | | | 115,055 | |
| Goldman Sachs Group Inc. (iBoxx HY 6B) | | | 9,737,424 | | | | 6/20/11 | | | 3.000% quarterly | | | 101,131 | | | | 11,273 | | | | 89,858 | |
JP Morgan Chase & Co.
(CDX HY 6B) | | | 21,354,000 | | | | 6/20/11 | | | 3.000% quarterly | | | 221,778 | | | | 30,027 | | | | 191,751 | |
JP Morgan Chase & Co.
(CDX IG HVOL 9) | | | 11,199,960 | | | | 12/20/12 | | | 1.400% quarterly | | | (135,212) | | | | (207,489) | | | | 72,277 | |
| | | | |
| Western Asset Core Plus Bond Portfolio 2010 Annual Report | | | 75 | |
| | | | | | | | | | | | | | | | | | | | | | |
| CREDIT DEFAULT SWAPS ON CREDIT INDICES — SELL PROTECTION1 | |
Swap Counterparty
(Reference Entity) | | Notional Amount2 | | | Termination
Date | | | Periodic
Payments
Received By
The Fund‡ | | Market Value5 | | | Upfront
Premiums
Paid
(Received) | | | Unrealized
Appreciation
(Depreciation) | |
| Merrill Lynch & Co. Inc. (ABX.HE-AAA 06-1) | | $ | 7,880,670 | | | | 7/25/45 | | | 0.180% monthly | | $ | (935,830) | | | $ | (508,168) | | | $ | (427,662) | |
Merrill Lynch & Co. Inc.
(CDX HY 9) | | | 9,220,000 | | | | 12/20/12 | | | 2.300% quarterly | | | 245,420 | | | | — | | | | 245,420 | |
Merrill Lynch & Co. Inc.
(CDX HY 9) | | | 9,340,000 | | | | 12/20/12 | | | 2.000% quarterly | | | 193,233 | | | | — | | | | 193,233 | |
| Morgan Stanley & Co. Inc. (CMBX 4 2007-2 AAA) | | | 7,090,000 | | | | 2/17/51 | | | 0.350% monthly | | | (292,462) | | | | (837,399) | | | | 544,937 | |
| Morgan Stanley & Co. Inc. (PrimeX.ARM.1) | | | 3,691,289 | | | | 6/25/36 | | | 4.420% monthly | | | 164,954 | | | | 98,892 | | | | 66,062 | |
| Morgan Stanley & Co. Inc. (PrimeX.ARM.1) | | | 3,691,289 | | | | 6/25/36 | | | 4.420% monthly | | | 164,954 | | | | 80,913 | | | | 84,041 | |
| Total | | $ | 380,366,153 | | | | | | | | | $ | 5,208,215 | | | $ | (2,520,715) | | | $ | 7,728,930 | |
| | | | | | | | | | | | | | | | | | | | | | |
| CREDIT DEFAULT SWAPS ON CREDIT INDICES — BUY PROTECTION4 | |
Swap Counterparty
(Reference Entity) | | Notional
Amount 2 | | | Termination
Date | | | Periodic
Payments
Made By
The Fund‡ | | Market
Value5 | | | Upfront
Premiums
Paid
(Received) | | | Unrealized
Appreciation
(Depreciation) | |
| Banc of America Securities LLC (CMBX 3 2007-1 AAA) | | $ | 10,730,000 | | | | 12/13/49 | | | 0.080% monthly | | $ | 429,200 | | | $ | 639,887 | | | $ | (210,687) | |
| Banc of America Securities LLC (CMBX 3 2007-1 AAA) | | | 5,310,000 | | | | 12/13/49 | | | 0.080% monthly | | | 212,400 | | | | 204,641 | | | | 7,759 | |
| Banc of America Securities LLC (CMBX 4 2007-2 AAA) | | | 9,310,000 | | | | 2/17/51 | | | 0.350% monthly | | | 384,037 | | | | 429,065 | | | | (45,028) | |
Barclay’s Capital Inc.
(MARKIT CDX HY 15) | | | 44,000,000 | | | | 12/20/15 | | | 5.000% quarterly | | | (1,317,796) | | | | (1,155,000) | | | | (162,796) | |
Barclay’s Capital Inc.
(MARKIT CDX HY 15) | | | 68,200,000 | | | | 12/20/15 | | | 5.000% quarterly | | | (2,042,583) | | | | (1,875,500) | | | | (167,083) | |
| Citigroup Global Markets (CMBX 3 2007-1 AAA) | | | 8,590,000 | | | | 12/13/49 | | | 0.080% monthly | | | 343,600 | | | | 277,614 | | | | 65,986 | |
| Credit Suisse First Boston Inc. (CDX IG HVOL 10) | | | 10,266,630 | | | | 6/20/13 | | | 3.500% quarterly | | | (339,375) | | | | (263,686) | | | | (75,689) | |
| Credit Suisse First Boston Inc. (CMBX 3 2007-1 AAA) | | | 9,030,000 | | | | 12/13/49 | | | 0.080% monthly | | | 361,200 | | | | 716,658 | | | | (355,458) | |
| Credit Suisse First Boston Inc. (CMBX 3 2007-1 AAA) | | | 6,690,000 | | | | 12/13/49 | | | 0.080% monthly | | | 267,600 | | | | 330,851 | | | | (63,251) | |
| Credit Suisse First Boston Inc. (CMBX 3 2007-1 AAA) | | | 5,630,000 | | | | 12/13/49 | | | 0.080% monthly | | | 225,200 | | | | 276,949 | | | | (51,749) | |
| Credit Suisse First Boston Inc. (MARKIT CDX HY 15) | | | 27,500,000 | | | | 12/20/15 | | | 5.000% quarterly | | | (823,622) | | | | (755,833) | | | | (67,789) | |
| Goldman Sachs Group Inc. (CMBX 3 2007-1 AAA) | | | 27,350,000 | | | | 12/13/49 | | | 0.080% monthly | | | 1,094,000 | | | | 1,327,156 | | | | (233,156) | |
| Goldman Sachs Group Inc. (CMBX 3 2007-1 AAA) | | | 16,780,000 | | | | 12/13/49 | | | 0.080% monthly | | | 671,200 | | | | 1,541,663 | | | | (870,463) | |
| | |
| 76 | | Western Asset Core Plus Bond Portfolio 2010 Annual Report |
Notes to financial statements (cont’d)
| | | | | | | | | | | | | | | | | | | | | | |
| CREDIT DEFAULT SWAPS ON CREDIT INDICES — BUY PROTECTION4 | |
Swap Counterparty
(Reference Entity) | | Notional
Amount 2 | | | Termination
Date | | | Periodic
Payments
Made By
The Fund‡ | | Market
Value5 | | | Upfront
Premiums
Paid
(Received) | | | Unrealized
Appreciation
(Depreciation) | |
| Goldman Sachs Group Inc. (CMBX 3 2007-1 AAA) | | $ | 11,490,000 | | | | 12/13/49 | | | 0.080% monthly | | $ | 459,600 | | | $ | 543,217 | | | $ | (83,617) | |
| Goldman Sachs Group Inc. (CMBX 3 2007-1 AAA) | | | 5,440,000 | | | | 12/13/49 | | | 0.080% monthly | | | 217,600 | | | | 260,573 | | | | (42,973) | |
JP Morgan Chase & Co.
(CDX HY 6B) | | | 9,908,256 | | | | 6/20/11 | | | 3.000% quarterly | | | 102,905 | | | | 4,916 | | | | 97,989 | |
JP Morgan Chase & Co.
(CDX IG HVOL 10) | | | 27,719,901 | | | | 6/20/13 | | | 3.500% quarterly | | | (916,312) | | | | (596,939) | | | | (319,373) | |
| JP Morgan Securities Inc. (CMBX 3 2007-1 AAA) | | | 5,230,000 | | | | 12/13/49 | | | 0.080% monthly | | | 209,200 | | | | 201,557 | | | | 7,643 | |
| JP Morgan Securities Inc. (MARKIT CDX HY 15) | | | 14,000,000 | | | | 12/20/15 | | | 5.000% quarterly | | | (419,299) | | | | (234,186) | | | | (185,113) | |
| Morgan Stanley & Co. Inc. (CMBX 1 2006-1 AAA) | | | 12,110,000 | | | | 10/12/52 | | | 0.100% monthly | | | 295,181 | | | | 711,709 | | | | (416,528) | |
| Morgan Stanley & Co. Inc. (CMBX 3 2007-1 AAA) | | | 8,110,000 | | | | 12/13/49 | | | 0.080% monthly | | | 324,400 | | | | 322,608 | | | | 1,792 | |
| Morgan Stanley & Co. Inc. (CMBX 4 2007-2 AAA) | | | 9,900,000 | | | | 2/17/51 | | | 0.350% monthly | | | 408,375 | | | | 616,940 | | | | (208,565) | |
| Morgan Stanley & Co. Inc. (MARKIT CDX HY 15) | | | 25,000,000 | | | | 12/20/15 | | | 5.000% quarterly | | | (748,747) | | | | (625,000) | | | | (123,747) | |
| RBS Greenwich (CDX HY 10) | | | 10,614,000 | | | | 6/20/13 | | | 5.000% quarterly | | | (739,363) | | | | 1,050,264 | | | | (1,789,627) | |
| RBS Securities Inc. (CMBX 3 2007-1 AAA) | | | 10,310,000 | | | | 12/13/49 | | | 0.080% monthly | | | 412,400 | | | | 381,313 | | | | 31,087 | |
| Total | | $ | 399,218,787 | | | | | | | | | $ | (928,999) | | | $ | 4,331,437 | | | $ | (5,260,436) | |
| | | | | | | | | | | | | | | | | | | | | | |
| TOTAL RETURN SWAPS | |
| Swap Counterparty | | Notional
Amount | | | Termination
Date | | | Periodic
Payments
Made By
The Fund | | Periodic
Payments
Received By
The Fund | | | Upfront
Premiums
Paid
(Received) | | | Unrealized
Appreciation
(Depreciation) | |
| Banc of America Securities LLC | | $ | 10,730,000 | | | | 4/1/11 | | | TRX-CMBS Reset | | | TRX-CMBS | | | | — | | | $ | 353,758 | * |
| Barclays Capital Inc. | | | 52,057,994 | | | | 1/12/40 | | | 1-month LIBOR‡ | | | IOS.FN30.400.09‡ | | | | — | | | | 43,170 | * |
| Goldman Sachs Group Inc. | | | 16,780,000 | | | | 4/1/11 | | | TRX-CMBS Reset | | | TRX-CMBS | | | | — | | | | 553,220 | * |
| Goldman Sachs Group Inc. | | | 9,030,000 | | | | 4/1/11 | | | TRX-CMBS Reset | | | TRX-CMBS | | | | — | | | | 297,710 | * |
| Morgan Stanley & Co. Inc. | | | 10,117,278 | | | | 1/12/40 | | | 1-month LIBOR‡ | | | IOS.FN30.400.09‡ | | | | — | | | | 8,390 | * |
| Total | | $ | 98,715,272 | | | | | | | | | | | | | | — | | | $ | 1,256,248 | |
| 1 | If the Fund is a seller of protection and a credit event occurs, as defined under the terms of that particular swap agreement, the Fund will either (i) pay to the buyer of protection an amount equal to the notional amount of the swap and take delivery of the referenced obligation or underlying securities comprising the referenced index or (ii) pay a net settlement amount in the form of cash or securities equal to the notional amount of the swap less the recovery value of the referenced obligation or underlying securities comprising the referenced index. |
| 2 | The maximum potential amount the Fund could be required to pay as a seller of credit protection or receive as a buyer of credit protection if a credit event occurs as defined under the terms of that particular swap agreement. |
| 3 | Implied credit spreads, utilized in determining the market value of credit default swap agreements on corporate issues or sovereign issues of an emerging country as of period end serve as an indicator of the current status of the payment/performance risk and represent the likelihood or risk of default for the credit derivative. The implied credit spread of a |
| | | | |
| Western Asset Core Plus Bond Portfolio 2010 Annual Report | | | 77 | |
| | particular referenced entity reflects the cost of buying/selling protection and may include upfront payments required to be made to enter into the agreement. Wider credit spreads represent a deterioration of the referenced entity’s credit soundness and a greater likelihood or risk of default or other credit event occurring as defined under the terms of the agreement. A credit spread identified as “Defaulted” indicates a credit event has occurred for the referenced entity or obligation. |
| 4 | If the Fund is a buyer of protection and a credit event occurs, as defined under the terms of that particular swap agreement, the Fund will either (i) receive from the seller of protection an amount equal to the notional amount of the swap and deliver the underlying securities comprising the referenced index or (ii) receive a net settlement amount in the form of cash or securities equal to the notional amount of the swap less the recovery value of the underlying securities comprising the referenced index. |
| 5 | The quoted market prices and resulting values for credit default swap agreements on asset-backed securities and credit indices serve as an indicator of the current status of the payment/performance risk and represent the likelihood of an expected liability (or profit) for the credit derivative should the notional amount of the swap agreement been closed/sold as of the period end. Decreasing market values when compared to the notional amount of the swap, represent a deterioration of the referenced entity’s credit soundness and a greater likelihood or risk of default or other credit event occurring as defined under the terms of the agreement. |
| ‡ | Percentage shown is an annual percentage rate. |
| * | Security is valued in good faith at fair value in accordance with procedures approved by the Board of Directors. |
4. Derivative instruments and hedging activities
Financial Accounting Standards Board Codification Topic 815 requires enhanced disclosure about an entity’s derivative and hedging activities.
Below is a table, grouped by derivative type that provides information about the fair value and the location of derivatives within the Statement of Assets and Liabilities at December 31, 2010.
| | | | | | | | | | | | | | | | |
| ASSET DERIVATIVES1 | |
| | | Interest Rate
Contracts Risk | | | Foreign Exchange
Contracts Risk | | | Credit
Contracts Risk | | | Total | |
| Purchased options2 | | $ | 13,567,431 | | | | — | | | | — | | | $ | 13,567,431 | |
| Futures contracts3 | | | 2,978,134 | | | | — | | | | — | | | | 2,978,134 | |
| Swap contracts4 | | | 51,560 | | | | — | | | $ | 27,347,989 | | | | 27,399,549 | |
| Forward foreign currency contracts | | | — | | | $ | 6,121,337 | | | | — | | | | 6,121,337 | |
| Total | | $ | 16,597,125 | | | $ | 6,121,337 | | | $ | 27,347,989 | | | $ | 50,066,451 | |
| | | | | | | | | | | | | | | | |
| LIABILITY DERIVATIVES1 | |
| | | Interest Rate
Contracts Risk | | | Foreign Exchange
Contracts Risk | | | Credit
Contracts Risk | | | Total | |
| Written options | | $ | 44,592,983 | | | | — | | | | — | | | $ | 44,592,983 | |
| Futures contracts3 | | | 12,917,651 | | | $ | 846,557 | | | | — | | | | 13,764,208 | |
| Swap contracts4 | | | 32,864,503 | | | | — | | | $ | 11,479,289 | | | | 44,343,792 | |
| Forward foreign currency contracts | | | — | | | | 7,152,231 | | | | — | | | | 7,152,231 | |
| Total | | $ | 90,375,137 | | | $ | 7,998,788 | | | $ | 11,479,289 | | | $ | 109,853,214 | |
| 1 | Generally, the balance sheet location for asset derivatives is receivables/net unrealized appreciation (depreciation) and for liability derivatives is payables/net unrealized appreciation (depreciation). |
| 2 | Market value of purchased options is reported in Investments at value in the Statement of Assets and Liabilities. |
| 3 | Includes cumulative appreciation (depreciation) of futures contracts as reported in the footnotes. Only variation margin is reported within the receivables and/or payables of the Statement of Assets and Liabilities. |
| 4 | Values include premiums paid (received) on swap contracts which are shown separately in the Statement of Assets and Liabilities. |
| | |
| 78 | | Western Asset Core Plus Bond Portfolio 2010 Annual Report |
Notes to financial statements (cont’d)
The following tables provide information about the effect of derivatives and hedging activities on the Fund’s Statement of Operations for the year ended December 31, 2010. The first table provides additional detail about the amounts and sources of gains (losses) realized on derivatives during the period. The second table provides additional information about the change in unrealized appreciation (depreciation) resulting from the Fund’s derivatives and hedging activities during the period.
| | | | | | | | | | | | | | | | |
| AMOUNT OF REALIZED GAIN (LOSS) ON DERIVATIVES RECOGNIZED | |
| | | Interest Rate
Contracts Risk | | | Foreign Exchange
Contracts Risk | | | Credit
Contracts Risk | | | Total | |
| Purchased options | | $ | (270,176) | | | | — | | | | — | | | $ | (270,176) | |
| Written options | | | 15,194,670 | | | | — | | | | — | | | | 15,194,670 | |
| Futures contracts | | | (1,039,378) | | | | (79,877) | | | | — | | | | (1,119,255) | |
| Swap contracts | | | (23,629,138) | | | | — | | | $ | 9,376,806 | | | | (14,252,332) | |
| Forward foreign currency contracts | | | — | | | $ | 25,720,049 | | | | — | | | | 25,720,049 | |
| Total | | $ | (9,744,022) | | | $ | 25,640,172 | | | $ | 9,376,806 | | | $ | 25,272,956 | |
| | | | | | | | | | | | | | | | |
| CHANGE IN UNREALIZED APPRECIATION (DEPRECIATION) ON DERIVATIVES RECOGNIZED | |
| | | Interest Rate
Contracts Risk | | | Foreign Exchange
Contracts Risk | | | Credit
Contracts Risk | | | Total | |
| Purchased options | | $ | (11,865,350) | | | | — | | | | — | | | $ | (11,865,350) | |
| Written options | | | 1,139,202 | | | | — | | | | — | | | | 1,139,202 | |
| Futures contracts | | | (2,635,994) | | | $ | (846,557) | | | | — | | | | (3,482,551) | |
| Swap contracts | | | (18,625,517) | | | | — | | | $ | 45,993,800 | | | | 27,368,283 | |
| Forward foreign currency contracts | | | — | | | | 16,788,009 | | | | — | | | | 16,788,009 | |
| Total | | $ | (31,987,659) | | | $ | 15,941,452 | | | $ | 45,993,800 | | | $ | 29,947,593 | |
During the year ended December 31, 2010, the volume of derivative activity for the Fund was as follows:
| | | | |
| | | Average Market
Value | |
| Purchased options | | $ | 8,876,468 | |
| Written options | | | 44,261,019 | |
| Forward foreign currency contracts (to buy) | | | 231,558,238 | |
| Forward foreign currency contracts (to sell) | | | 496,870,114 | |
| Futures contracts (to buy) | | | 1,882,551,033 | |
| Futures contracts (to sell) | | | 858,765,898 | |
| | | Average Notional
Balance‡ | |
| Interest rate swap contracts | | $ | 740,202,692 | |
| Credit default swap contracts (to buy protection) | | | 656,421,227 | |
| Credit default swap contracts (to sell protection) | | | 1,478,643,944 | |
| Total return swap contracts | | | 24,565,713 | |
| ‡ | Amounts are denominated in U.S. dollars, unless otherwise noted. |
| | | | |
| Western Asset Core Plus Bond Portfolio 2010 Annual Report | | | 79 | |
The Fund’s contracts with derivative counterparties contain several credit related contingent features that if triggered would allow its derivatives counterparties to close out and demand payment or additional collateral to cover their exposure from the Fund. Credit related contingent features are established between the Fund and its derivatives counterparties to reduce the risk that the Fund will not fulfill its payment obligations to its counterparties. These triggering features include, but are not limited to, a percentage decrease in the Fund’s net assets and/or a percentage decrease in the Fund’s Net Asset Value or NAV. The contingent features are established within the Fund’s International Swap and Derivatives Association, Inc. master agreements which govern positions in swaps, over-the-counter options, and forward currency exchange contracts for each individual counterparty.
As of December 31, 2010, the total value of swap positions with credit related contingent features in a net liability position was $44,343,792. If a contingent feature would have been triggered as of December 31, 2010, the Fund would have been required to pay this amount in cash to its counterparties. The Fund posted collateral for its swap transactions in the amount of $62,270,000.
5. Class specific expenses, waivers and/or reimbursements
The Fund has adopted a Rule 12b-1 distribution plan and under that plan the Fund pays a distribution fee with respect to its Class FI shares calculated at the annual rate of 0.25% of the average daily net assets of the Class FI. Distribution fees are accrued and paid monthly.
For the year ended December 31, 2010, class specific expenses were as follows:
| | | | | | | | | | | | |
| | | Distribution Fees | | | Transfer Agent
Fees | | | Shareholder
Reports | |
| Class IS1 | | | — | | | $ | 17,515 | | | $ | 25,997 | |
| Class I1 | | | — | | | | 912,593 | | | | 53,450 | |
| Class FI1 | | $ | 2,191,912 | | | | 721,442 | | | | 9,035 | |
| Total | | $ | 2,191,912 | | | $ | 1,651,550 | | | $ | 88,482 | |
| 1 | In April 2010, Institutional Select Class, Institutional Class and Financial Intermediary Class shares were renamed Class IS, Class I and Class FI shares, respectively. |
For the year ended December 31, 2010, waivers and/or reimbursements by class were as follows:
| | | | |
| | | Waivers/
Reimbursements | |
| Class IS1 | | | — | |
| Class I1 | | | — | |
| Class FI1 | | $ | 538,164 | |
| Total | | $ | 538,164 | |
| 1 | In April 2010, Institutional Select Class, Institutional Class and Financial Intermediary Class shares were renamed Class IS, Class I and Class FI shares, respectively. |
| | |
| 80 | | Western Asset Core Plus Bond Portfolio 2010 Annual Report |
Notes to financial statements (cont’d)
6. Distributions to shareholders by class
| | | | | | | | |
| | | Year Ended
December 31, 2010 | | | Year Ended
December 31, 2009 | |
| Net Investment Income: | |
| Class IS1 | | $ | 96,552,213 | | | $ | 98,821,329 | |
| Class I1 | | | 276,058,958 | | | | 349,841,866 | |
| Class FI1 | | | 43,597,158 | | | | 40,043,412 | |
| Total | | $ | 416,208,329 | | | $ | 488,706,607 | |
|
| Net Realized Gains: | |
| Class IS1 | | | — | | | $ | 22,083,719 | |
| Class I1 | | | — | | | | 82,194,816 | |
| Class FI1 | | | — | | | | 9,199,687 | |
| Total | | | — | | | $ | 113,478,222 | |
| 1 | In April 2010, Institutional Select Class, Institutional Class and Financial Intermediary Class shares were renamed Class IS, Class I and Class FI shares, respectively. |
7. Capital shares
At December 31, 2010, the Corporation had 21.15 billion shares of capital stock authorized with a par value of $0.001 per share. Transactions in shares of the Fund were as follows:
| | | | | | | | | | | | | | | | |
| | | Year Ended
December 31, 2010 | | | Year Ended
December 31, 2009 | |
| | | Shares | | | Amount | | | Shares | | | Amount | |
| Class IS1 | | | | | | | | | | | | | | | | |
| Shares sold | | | 34,241,677 | | | $ | 364,278,613 | | | | 63,248,090 | | | $ | 601,541,786 | |
| Shares issued on reinvestment | | | 8,188,825 | | | | 87,484,500 | | | | 11,566,955 | | | | 108,468,213 | |
| Shares repurchased | | | (54,383,907) | | | | (576,805,855) | | | | (73,803,380) | | | | (677,088,372) | |
| Net increase (decrease) | | | (11,953,405) | | | $ | (125,042,742) | | | | 1,011,665 | | | $ | 32,921,627 | |
| | | | |
| Class I1 | | | | | | | | | | | | | | | | |
| Shares sold | | | 86,145,492 | | | $ | 921,419,204 | | | | 83,122,713 | | | $ | 785,109,184 | |
| Shares issued on reinvestment | | | 23,558,345 | | | | 251,732,393 | | | | 41,608,644 | | | | 387,836,215 | |
| Shares repurchased | | | (167,794,427) | | | | (1,785,200,718) | | | | (348,715,515) | | | | (3,185,312,307) | |
| Net decrease | | | (58,090,590) | | | $ | (612,049,121) | | | | (223,984,158) | | | $ | (2,012,366,908) | |
| | | | |
| Class FI1 | | | | | | | | | | | | | | | | |
| Shares sold | | | 25,181,075 | | | $ | 266,187,594 | | | | 27,353,342 | | | $ | 257,187,247 | |
| Shares issued on reinvestment | | | 4,102,144 | | | | 43,884,596 | | | | 4,981,465 | | | | 46,584,905 | |
| Shares repurchased | | | (18,336,478) | | | | (194,894,307) | | | | (54,702,172) | | | | (474,063,985) | |
| Net increase (decrease) | | | 10,946,741 | | | $ | 115,177,883 | | | | (22,367,365) | | | $ | (170,291,833) | |
| 1 | In April 2010, Institutional Select Class, Institutional Class and Financial Intermediary Class shares were renamed Class IS, Class I and Class FI shares, respectively. |
| | | | |
| Western Asset Core Plus Bond Portfolio 2010 Annual Report | | | 81 | |
8. Income tax information and distributions to shareholders
Subsequent to the fiscal year end, the Fund has made the following distributions:
| | | | | | | | | | | | |
Record Date Payable Date | | Institutional
Select Class | | | Institutional Class | | | Financial
Intermediary Class | |
Daily 1/31/2011 | | $ | 0.037238 | | | $ | 0.037076 | | | $ | 0.035050 | |
The tax character of distributions paid during the fiscal years ended December 31, were as follows:
| | | | | | | | |
| | | 2010 | | | 2009 | |
| Distributions Paid From: | | | | | | | | |
| Ordinary income | | $ | 416,208,329 | | | $ | 602,184,829 | |
As of December 31, 2010, the components of accumulated earnings on a tax basis were as follows:
| | | | |
| Undistributed ordinary income — net | | $ | 33,493,060 | |
| Capital loss carryforward* | | | (505,470,565) | |
| Other book/tax temporary differences(a) | | | 1,088,578 | |
| Unrealized appreciation (depreciation)(b) | | | (280,750,501) | |
| Total accumulated earnings (losses) — net | | $ | (751,639,428) | |
| * | During the taxable year ended December 31, 2010, the Fund utilized $119,901,180 of its capital loss carryforward available from prior years. As of December 31, 2010, the Fund had the following net capital loss carryforwards remaining: |
| | | | |
| Year of Expiration | | Amount | |
| 12/31/2017 | | $ | (505,470,565 | ) |
This amount will be available to offset future taxable capital gains. Under the recently enacted Regulated Investment Company Modernization Act of 2010, the Fund will be permitted to carry forward capital losses incurred in taxable years beginning after December 22, 2010 for an unlimited period. However, any losses incurred during those future years will be required to be utilized prior to the losses incurred in pre-enactment taxable years. As a result of this ordering rule, pre-enactment capital loss carryforwards may be more likely to expire unused. Additionally, post-enactment capital losses that are carried forward will retain their character as either short-term or long-term capital losses rather than being considered all short-term as under previous law.
| (a) | Other book/tax temporary differences are attributable primarily to the tax deferral of losses on straddles, the realization for tax purposes of unrealized losses on certain futures and foreign currency contracts, differences between book/tax accrual of interest income on securities in default and book/tax differences in the timing of the deductibility of various expenses. |
| (b) | The difference between book-basis and tax-basis unrealized appreciation/(depreciation) is attributable primarily to the tax deferral of losses on wash sales and book/tax basis adjustments on certain securities. |
9. Other tax information
On December 22, 2010, President Obama signed into law the Regulated Investment Company Modernization Act of 2010 (the “Act”). The Act updates certain tax rules applicable to regulated investment companies (“RICs”). The various provisions of the Act will generally be effective for RICs with taxable years beginning after December 22, 2010. Additional information regarding the impact of the Act on the Fund, if any, will be contained within the relevant sections of the notes to the financial statements for the fiscal year ending December 31, 2011.
| | |
| 82 | | Western Asset Core Plus Bond Portfolio 2010 Annual Report |
Report of independent registered public accounting firm
To the Board of Directors of Western Asset Funds, Inc. and to the Shareholders of Western Asset Core Plus Bond Portfolio:
In our opinion, the accompanying statement of assets and liabilities, including the schedule of investments, and the related statements of operations and of changes in net assets and the financial highlights present fairly, in all material respects, the financial position of Western Asset Core Plus Bond Portfolio (one of the Portfolios comprising Western Asset Funds, Inc., the “Fund”) at December 31, 2010, the results of its operations, the changes in its net assets, and the financial highlights for each of the periods presented, in conformity with accounting principles generally accepted in the United States of America. These financial statements and financial highlights (hereafter referred to as “financial statements”) are the responsibility of the Fund’s management; our responsibility is to express an opinion on these financial statements based on our audits. We conducted our audits of these financial statements in accordance with the standards of the Public Company Accounting Oversight Board (United States). Those standards require that we plan and perform the audit to obtain reasonable assurance about whether the financial statements are free of material misstatement. An audit includes examining, on a test basis, evidence supporting the amounts and disclosures in the financial statements, assessing the accounting principles used and significant estimates made by management, and evaluating the overall financial statement presentation. We believe that our audits, which included confirmation of securities at December 31, 2010 by correspondence with the custodian and brokers, provide a reasonable basis for our opinion.
PricewaterhouseCoopers LLP
Baltimore, Maryland
February 22, 2011
| | | | |
| Western Asset Core Plus Bond Portfolio | | | 83 | |
Board approval of investment management and advisory agreements (unaudited)
The Executive and Contracts Committee of the Board of Directors considered the Investment Management Agreement between the Corporation and LMPFA with respect to the Fund and the Investment Advisory Agreements between LMPFA and Western Asset Management Company (“Western Asset”), Western Asset Management Company Limited in London (“WAML”), Western Asset Management Company Pte. Ltd. in Singapore (“Western Singapore”) and Western Asset Management Company Ltd in Japan (“Western Japan,” and together with Western Singapore and WAML the “Non-U.S. Advisers” and together with Western Asset, the “Advisers”) (collectively, the “Agreements”) with respect to the Fund at meetings held on September 8, October 21 and October 28, 2010. At a meeting held on November 17, 2010, the Executive and Contracts Committee reported to the full Board of Directors its considerations and recommendation with respect to the Agreements, and the Board of Directors, including a majority of the Independent Directors, considered and approved renewal of the Agreements.
The Directors noted that although Western Asset’s business is operated through separate legal entities, such as the Non-U.S. Advisers, its business is highly integrated and senior investment personnel at Western Asset have supervisory oversight responsibility over the investment decisions made by the Non-U.S. Advisers. Therefore, in connection with their deliberations noted below, the Directors primarily focused on the information provided by Western Asset when considering the approval of the Investment Advisory Agreements between LMPFA and the Non-U.S. Advisers with respect to the Fund. The Directors also noted that the Fund does not pay any management fees directly to Western Asset or to any of the Non-U.S. Advisers because LMPFA pays the Advisers for services provided to the Fund out of the management fee LMPFA receives from the Fund.
In arriving at their decision to renew the Agreements, the Directors met with representatives of Western Asset, including relevant investment advisory personnel, as well as representatives of LMPFA; reviewed a variety of information prepared by LMPFA and Western Asset and materials provided by Lipper Inc. (“Lipper”) and counsel to the Independent Directors; reviewed performance and expense information for the Fund’s peer group of comparable funds selected and prepared by Lipper and for certain other comparable products available from Western Asset, including separate accounts managed by Western Asset; and requested and reviewed additional information as necessary. These reviews were in addition to information obtained by the Directors at their regular quarterly meetings with respect to the Fund’s performance and other relevant matters, and related discussions with Western Asset’s personnel.
As part of their review, the Directors examined LMPFA’s ability to provide high quality oversight and administrative and shareholder support services to the Fund, and the Advisers’ ability to provide high quality investment management services to the Fund. The Directors considered the experience of LMPFA’s personnel in providing the types of services that LMPFA is responsible for providing to the Fund; the ability of LMPFA to attract and retain capable personnel; the capability and integrity of LMPFA’s senior management and staff; and the level of skill required to provide
| | |
| 84 | | Western Asset Core Plus Bond Portfolio |
Board approval of investment management and advisory agreements (unaudited) (cont’d)
such services to the Fund. The Directors considered the investment philosophy and research and decision-making processes of the Advisers; the experience of their key advisory personnel responsible for management of the Fund; the ability of the Advisers to attract and retain capable research and advisory personnel; the capability and integrity of the Advisers’ senior management and staff; and the level of skill required to manage the Fund. In addition, the Directors reviewed the quality of LMPFA’s and the Advisers’ services with respect to regulatory compliance and compliance with the investment policies of the Fund and conditions that might affect LMPFA’s or an Adviser’s ability to provide high quality services to the Fund in the future under the Agreements, including its business reputation, financial condition and operational stability. Based on the foregoing, the Directors concluded that the Advisers’ investment process, research capabilities and philosophy were well suited to the Fund given the Fund’s investment objectives and policies, and that LMPFA and each of the Advisers would be able to meet any reasonably foreseeable obligations under the Agreements.
In reviewing the quality of the services provided to the Fund, the Directors also reviewed comparisons of the performance of the Fund to the performance of certain comparable funds in its peer group and to its investment benchmark over the one-, three-, five- and ten-year periods ended August 31, 2010. In that connection, the Directors noted that the performance of the Fund exceeded its peer average performance for each period. With respect to the Fund, the Directors considered the factors involved in its performance relative to the performance of its investment benchmark and peer group.
The Directors also considered the management fee payable by the Fund to LMPFA, the total expenses payable by the Fund and the fact that LMPFA pays to the Advisers the entire management fee it receives from the Fund. They reviewed information concerning management fees paid to investment advisers of similarly-managed funds, as well as fees paid by the Advisers’ other clients, including separate accounts managed by the Advisers. The Directors observed that although the management fee paid by the Fund to LMPFA was slightly higher than the average of the fees paid by funds in its peer group, total expenses for the Fund were lower than the average of the funds in its peer group. The Directors noted that the management fee paid by the Fund was generally higher than the fees paid by other clients of the Advisers for accounts with similar investment strategies, but that the administrative and operational responsibilities for the Advisers with respect to the Fund were also relatively higher. In light of this difference, the Directors concluded that the management fee paid by the Fund relative to the fees paid by the Advisers’ other clients was reasonable.
The Directors further evaluated the benefits of the advisory relationship to LMPFA and the Advisers, including, among others, the profitability of the relationship to LMPFA and the Advisers; the direct and indirect benefits that LMPFA and each Adviser may receive from its relationship with the Fund, including any “fallout benefits,” such as reputational value derived from serving as investment manager or adviser to the Fund; and the affiliations between LMPFA, the Advisers and certain
| | | | |
| Western Asset Core Plus Bond Portfolio | | | 85 | |
service providers for the Fund. In that connection, the Directors concluded that LMPFA and each Adviser’s profitability was consistent with levels of profitability that had been determined by courts not to be excessive. The Directors noted that Western Asset does not have soft dollar arrangements.
Finally, the Directors considered, in light of the profitability information provided by LMPFA and Western Asset, the extent to which economies of scale would be realized by the Advisers as the assets of the Fund grow. They further concluded that the Fund’s assets were currently at a level at which the Advisers potentially may realize economies of scale from any future growth in the Fund, and noted that fee breakpoints had been implemented to capture a portion of any economies of scale for the benefit of the Fund’s shareholders. The Directors determined that the management fee structure for the Fund is reasonable.
In their deliberations with respect to these matters, the Independent Directors were advised by their independent counsel, who is independent of LMPFA and the Advisers within the meaning of Securities and Exchange Commission rules regarding the independence of counsel. The Independent Directors weighed each of the foregoing matters in light of the advice given to them by their independent counsel as to the law applicable to the review of investment advisory contracts. In arriving at a decision, the Directors, including the Independent Directors, did not identify any single matter as all-important or controlling, and the foregoing summary does not detail all the matters considered. The Directors judged the terms and conditions of the Agreements, including the investment advisory fees, in light of all of the surrounding circumstances.
Based upon their review, the Directors, including all of the Independent Directors, determined, in the exercise of their business judgment, that they were generally satisfied with the quality of services being provided by LMPFA and the Advisers, but they would continue to closely monitor the performance of LMPFA and the Advisers; that the fees to be paid to the Advisers and LMPFA under the relevant Agreements were fair and reasonable, given the scope and quality of the services rendered by the Advisers and LMPFA; and that approval of the Agreements was in the best interest of the Fund and its shareholders.
| | |
| 86 | | Western Asset Core Plus Bond Portfolio |
Additional information (unaudited)
Information about Directors and Officers
The business and affairs of Western Asset Core Plus Bond Portfolio (the “Fund”) are conducted by management under the supervision and subject to the direction of its Board of Directors. The business address of each Director is c/o Western Asset Management Company, 385 East Colorado Blvd., Pasadena, California 91101. Information pertaining to the Directors and officers of the Fund is set forth below.
The Statement of Additional Information includes additional information about Directors and is available, without charge, upon request by calling the Fund at 1-877-721-1926.
| | |
| Independent Directors | | |
| Ronald J. Arnault | | |
| Year of birth | | 1943 |
| Position(s) held with Fund | | Director |
| Term of office and length of time served1 | | Served since 1997 |
| Principal occupations during the past five years | | Retired. |
| Number of portfolios in fund complex overseen2 | | 12 |
| Other directorships held | | None |
| Anita L. DeFrantz | | |
| Year of birth | | 1952 |
| Position(s) held with Fund | | Director |
| Term of office and length of time served1 | | Served since 1998 |
| Principal occupations during the past five years | | President (1987-present) and Director (1990-present) of LA84 (formerly Amateur Athletic Foundation of Los Angeles); President and Director of Kids in Sports (1994-present); Vice President, International Rowing Federation (1986-present); Member of the International Olympic Committee (1986-present). |
| Number of portfolios in fund complex overseen2 | | 12 |
| Other directorships held | | OBN Holdings, Inc. (film, television and media company) |
| Avedick B. Poladian | | |
| Year of birth | | 1951 |
| Position(s) held with Fund | | Director |
| Term of office and length of time served1 | | Served since 2007 |
| Principal occupations during the past five years | | Executive Vice President and Chief Operating Officer of Lowe Enterprises, Inc. (real estate and hospitality firm) (2002-present); Partner, Arthur Andersen, LLP (1974-2002). |
| Number of portfolios in fund complex overseen2 | | 12 |
| Other directorships held | | Occidental Petroleum Corporation and Public Storage |
| | | | |
| Western Asset Core Plus Bond Portfolio | | | 87 | |
| | |
| Independent Directors cont’d | | |
| William E. B. Siart | | |
| Year of birth | | 1946 |
| Position(s) held with Fund | | Director and Chairman |
| Term of office and length of time served1 | | Served since 1997 |
| Principal occupations during the past five years | | Trustee of The Getty Trust (2005-present); Chairman of Walt Disney Concert Hall, Inc. (1998-2006); Chairman of Excellent Education Development (2000-present). |
| Number of portfolios in fund complex overseen2 | | 12 |
| Other directorships held | | None |
| Jaynie Miller Studenmund | | |
| Year of birth | | 1954 |
| Position(s) held with Fund | | Director |
| Term of office and length of time served1 | | Served since 2004 |
| Principal occupations during the past five years | | Director of Orbitz Worldwide, Inc. (2007-present) (online travel company); Director of MarketTools, Inc. (2010-present) (market research software provider); Director of Forest Lawn (2002-present) (memorial parks); Director of eHarmony, Inc. (2005-2011) (online dating company); Director of aQuantive Inc. (2004-2007) (digital marketing services company); Chief Operating Officer of Overture Services, Inc. (2001-2004) (commercial online search); and President and Chief Operating Officer of Paymybills.com (2000-2001) (online personal bill management service) |
| Number of portfolios in fund complex overseen2 | | 12 |
| Other directorships held | | Orbitz Worldwide (global on-line travel company) |
| Interested Directors | | |
| R. Jay Gerken3 | | |
| Year of birth | | 1951 |
| Position(s) held with Fund | | Director and President |
| Term of office and length of time served1 | | Served as a Director since 2006 and as President since 2007 |
| Principal occupations during the past five years | | Managing Director of Legg Mason & Co. (since 2005); Officer and Trustee/Director of 148 funds associated with LMPFA or its affiliates (since 2006) and Legg Mason & Co. predecessors (prior to 2006); President and Chief Executive Officer of LMPFA (since 2006); President and Chief Executive Officer of Smith Barney Fund Management LLC (“SBFM”) and Citi Fund Management Inc. (“CFM”) (formerly registered investment advisers) (since 2002); formerly: Chairman, President and Chief Executive Officer of Travelers Investment Adviser, Inc. (prior to 2005). |
| Number of portfolios in fund complex overseen2 | | 148 |
| Other directorships held | | N/A |
| | |
| 88 | | Western Asset Core Plus Bond Portfolio |
Additional information (unaudited) (cont’d)
Information about Directors and Officers
| | |
| Interested Directors cont’d | | |
| Ronald L. Olson4 | | |
| Year of birth | | 1941 |
| Position(s) held with Fund | | Director |
| Term of office and length of time served1 | | Served since 2005 |
| Principal occupations during the past five years | | Senior Partner of Munger, Tolles & Olson LLP (a law partnership) (1968-present). |
| Number of portfolios in fund complex overseen2 | | 13 |
| Other directorships held | | Edison International, City National Corporation (financial services company), The Washington Post Company, and Berkshire Hathaway, Inc. |
| Officers5 | | |
Kaprel Ozsolak 55 Water Street New York, NY 10041 | | |
| Year of birth | | 1965 |
| Position(s) held with Fund | | Principal Financial and Accounting Officer |
| Term of office and length of time served1 | | Served since 2010 |
| Principal occupations during the past five years | | Director of Legg Mason & Co. (since 2005); Chief Financial Officer of certain mutual funds associated with Legg Mason & Co. or its affiliates (since 2007) and Legg Mason & Co. predecessors (prior to 2007); formerly, Treasurer of certain mutual funds associated with Legg Mason & Co. or its affiliates (prior to 2010) and Legg Mason & Co. predecessors (prior to 2005); formerly, Controller of certain mutual funds associated with Legg Mason & Co. predecessors (prior to 2004) |
| Number of portfolios in fund complex overseen2 | | N/A |
| Other directorships held | | N/A |
| | | | |
| Western Asset Core Plus Bond Portfolio | | | 89 | |
| | |
| Officers5 cont’d | | |
Erin K. Morris 100 International Drive Baltimore, MD 21202 | | |
| Year of birth | | 1966 |
| Position(s) held with Fund | | Treasurer |
| Term of office and length of time served1 | | Served since 2006 |
| Principal occupations during the past five years | | Vice President and Manager Global Funds Administration, Legg Mason & Co., LLC (2005-present); Assistant Vice President and Manager, Fund Accounting Legg Mason Wood Walker, Incorporated (2002-2005); Treasurer, Western Asset Funds, Inc., Western Asset Income Fund and Western Asset Premier Bond Fund (2006-present); Western Asset/Claymore Inflation-Linked Securities & Income Fund and Western Asset/Claymore Inflation-Linked Opportunities & Income Fund (2010-present); Assistant Treasurer Legg Mason Partners Fund Complex (2007-present); Formerly Assistant Treasurer, Western Asset Funds, Inc., Western Asset Income Fund and Western Asset Premier Bond Fund (2001-2006); Western Asset/Claymore Inflation-Linked Securities & Income Fund (2003-2009) and Western Asset/Claymore Inflation-Linked Opportunities & Income Fund (2004-2009). |
| Number of portfolios in fund complex overseen2 | | N/A |
| Other directorships held | | N/A |
| | |
| 90 | | Western Asset Core Plus Bond Portfolio |
Additional information (unaudited) (cont’d)
Information about Directors and Officers
| | |
| Officers5 cont’d | | |
Todd F. Kuehl 100 International Drive Baltimore, MD 21202 | | |
| Year of birth | | 1968 |
| Position(s) held with Fund | | Chief Compliance Officer |
| Term of office and length of time served1 | | Served since 2007 |
| Principal occupations during the past five years | | Director, Legg Mason & Co., LLC (2006-present); Chief Compliance Officer of Legg Mason Private Portfolio Group (2009-present); Chief Compliance Officer of Western Asset/Claymore Inflation-Linked Securities & Income Fund, Western Asset/Claymore Inflation-Linked Opportunities & Income Fund, Western Asset Income Fund, Western Asset Premier Bond Fund and Western Asset Funds, Inc. (2007-present) and Barrett Growth Fund and Barrett Opportunity Fund (2006-2008); Branch Chief, Division of Investment Management, U.S. Securities and Exchange Commission (2002-2006). |
| Number of portfolios in fund complex overseen2 | | N/A |
| Other directorships held | | N/A |
Robert I. Frenkel 100 First Stamford Place Stamford, CT 06902 | | |
| Year of birth | | 1954 |
| Position(s) held with Fund | | Secretary and Chief Legal Officer |
| Term of office and length of time served1 | | Served since 2009 |
| Principal occupations during the past five years | | Vice President and Deputy General Counsel of Legg Mason, Inc. (since 2006); Managing Director and General Counsel of Global Mutual Funds for Legg Mason & Co. (since 2006) and Legg Mason & Co. predecessors (since 1994); Secretary and Chief Legal Officer of certain mutual funds associated with Legg Mason & Co. or its affiliates (since 2006) and Legg Mason & Co. predecessors (prior to 2006). |
| Number of portfolios in fund complex overseen2 | | N/A |
| Other directorships held | | N/A |
| 1 | Each Officer holds office until his or her respective successor is chosen and qualified, or in each case until he or she sooner dies, resigns, is removed with or without cause or becomes disqualified. Each of the Directors of the Corporation holds office until his or her successor shall have been duly elected and shall qualify, subject to prior death, resignation, retirement, disqualification or removed from office and applicable law and the rules of the New York Stock Exchange. |
| 2 | In addition to overseeing the nine portfolios of the Corporation each Director also serves as a Trustee of Western Asset Premier Bond Fund and as a Director of Western Asset Income Fund, Inc. (closed-end investment companies), which are considered part of the same Fund Complex as the Fund. In addition, Mr. Gerken serves as Director/Trustee to 147 other portfolios associated with Legg Mason & Co., LLC or its affiliates. Legg Mason & Co., LLC is an affiliate of Western Asset Management Co. (“WAM”). |
| 3 | Mr. Gerken is an “Interested person” (as defined in section 2(a)(19) of the Investment Company Act of 1940, as amended (the “1940 Act”)) of each Fund because of his positions with subsidiaries of, and ownership of shares of common stock of, Legg Mason, Inc., the parent company of WAM. |
| 4 | Mr. Olson is an “Interested person” (as defined above) of each Fund because his law firm has provided legal services to WAM. |
| 5 | Each officer of the Corporation is an “Interested person” (as defined above) of the Corporation. |
| | | | |
| Western Asset Core Plus Bond Portfolio | | | 91 | |
Important tax information (unaudited)
The following information is provided with respect to the distributions paid during the taxable year ended December 31, 2010:
| | | | | | |
| Record Date: | | Daily | | Daily | | Daily |
| Payable Date: | | January 2010 -
March 2010 | | April 30, 2010 | | May 2010 -
December 2010 |
| Ordinary Income: | | | | | | |
Qualified Dividend Income for Individuals | | 0.30% | | 0.23% | | 0.10% |
Dividends qualifying for the dividends received deduction for corporations | | 0.30% | | 0.23% | | 0.10% |
| Interest from Federal Obligations | | 9.54% | | 9.54% | | 9.54% |
The law varies in each state as to whether and what percentage of dividend income attributable to Federal obligations is exempt from state income tax. We recommend that you consult with your tax adviser to determine if any portion of the dividends you received is exempt from state income taxes.
Please retain this information for your records.
Western Asset
Core Plus Bond Portfolio
Directors
William E. B. Siart, Chairman
Ronald J. Arnault
Anita L. DeFrantz
R. Jay Gerken
Ronald L. Olson
Avedick B. Poladian
Jaynie Miller Studenmund
Investment manager
Legg Mason Partners Fund Advisor, LLC
Investment advisers
Western Asset Management Company
Western Asset Management Company Limited
Western Asset Management Company Ltd.
Western Asset Management Company Pte. Ltd.
Transfer agent
Boston Financial Data Services
2000 Crown Colony Drive
Quincy, MA 02169
Custodian
State Street Bank and Trust Company
Independent registered public accounting firm
PricewaterhouseCoopers LLP
Baltimore, MD
Legal counsel
Ropes & Gray LLP
1211 Avenue of the Americas
New York, NY 10036
Western Asset Core Plus Bond Portfolio
The Fund is a separate investment series of Western Asset Funds, Inc.
Western Asset Core Plus Bond Portfolio
Legg Mason Funds
55 Water Street
New York, NY 10041
The Fund files its complete schedule of portfolio holdings with the Securities and Exchange Commission (“SEC”) for the first and third quarters of each fiscal year on Form N-Q. The Fund’s Forms N-Q are available on the SEC’s website at www.sec.gov. The Fund’s Forms N-Q may be reviewed and copied at the SEC’s Public Reference Room in Washington, D.C., and information on the operation of the Public Reference Room may be obtained by calling 1-800-SEC-0330. To obtain information on Form N-Q, shareholders can call the Fund at 1-877-721-1926.
Information on how the Fund voted proxies relating to portfolio securities during the prior 12-month period ended June 30th of each year and a description of the policies and procedures that the Fund uses to determine how to vote proxies related to portfolio transactions are available (1) without charge, upon request, by calling the Fund at 1-877-721-1926, (2) on the Fund’s website at www.leggmason.com/individualinvestors and (3) on the SEC’s website at www.sec.gov.
This report is submitted for the general information of the shareholders of Western Asset Core Plus Bond Portfolio. This report is not authorized for distribution to prospective investors in the Fund unless preceded or accompanied by a current prospectus.
Investors should consider the Fund’s investment objectives, risks, charges and expenses carefully before investing. The prospectus contains this and other important information about the Fund. Please read the prospectus carefully before investing.
www.leggmason.com/individualinvestors
©2011 Legg Mason Investor Services, LLC
Member FINRA, SIPC
Privacy policy
We are committed to keeping nonpublic personal information about you secure and confidential. This notice is intended to help you understand how we fulfill this commitment. From time to time, we may collect a variety of personal information about you, including:
| Ÿ | | Information we receive from you on applications and forms, via the telephone, and through our websites; |
| Ÿ | | Information about your transactions with us, our affiliates, or others (such as your purchases, sales, or account balances); and |
| Ÿ | | Information we receive from consumer reporting agencies. |
We do not disclose nonpublic personal information, about our customers or former customers, except to our affiliates (such as broker-dealers or investment advisers within the Legg Mason family of companies) or as is otherwise permitted by applicable law or regulation. For example, we may share this information with others in order to process your transactions or service an account. We may also provide this information to companies that perform marketing services on our behalf, such as printing and mailing, or to other financial institutions with whom we have joint marketing agreements. When we enter into such agreements, we will require these companies to protect the confidentiality of this information and to use it only to perform the services for which we hired them.
With respect to our internal security procedures, we maintain physical, electronic, and procedural safeguards to protect your nonpublic personal information, and we restrict access to this information.
If you decide at some point either to close your account(s) or become an inactive customer, we will continue to adhere to our privacy policies and practices with respect to your nonpublic personal information.
|
| NOT PART OF THE ANNUAL REPORT |
Western Asset Management Company
Legg Mason, Inc. Subsidiaries
www.leggmason.com/individualinvestors
©2011 Legg Mason Investor Services, LLC Member FINRA, SIPC
WASX013139 2/11 SR11-1302
The registrant has adopted a code of ethics that applies to the registrant’s principal executive officer, principal financial officer, principal accounting officer or controller.
| ITEM 3. | AUDIT COMMITTEE FINANCIAL EXPERT. |
The Board of Directors of the registrant has determined that Mr. Ronald J. Arnault, possesses the technical attributes identified in Instruction 2(b) of Item 3 to Form N-CSR to qualify as “audit committee financial expert,” and have designated Mr. Arnault as the Audit Committee’s financial expert. Mr. Arnault is “independent” Trustees pursuant to paragraph (a) (2) of Item 3 to Form N-CSR.
| ITEM 4. | PRINCIPAL ACCOUNTANT FEES AND SERVICES |
a) Audit Fees. The aggregate fees billed in the last two fiscal years ending December 31, 2009 and December 31, 2010 (the “Reporting Periods”) for professional services rendered by the Registrant’s principal accountant (the “Auditor”) for the audit of the Registrant’s annual financial statements, or services that are normally provided by the Auditor in connection with the statutory and regulatory filings or engagements for the Reporting Periods, were $444,700 in 2009 and $456,100 in 2010.
b) Audit-Related Fees. The aggregate fees billed in the Reporting Period for assurance and related services by the Auditor that are reasonably related to the performance of the Registrant’s financial statements were $0 in 2009 and $0 in 2010. These services consisted of procedures performed in connection with the Re-domiciliation of the various reviews of Prospectus supplements, and consent issuances related to the N-1A filings for the Western Asset Funds, Inc.
In addition, there were no Audit-Related Fees billed in the Reporting Period for assurance and related services by the Auditor to the Registrant’s investment adviser (not including any sub-adviser whose role is primarily portfolio management and is subcontracted with or overseen by another investment adviser), and any entity controlling, controlled by or under common control with the investment adviser that provides ongoing services to the Western Asset Funds, Inc. (“service affiliates”), that were reasonably related to the performance of the annual audit of the service affiliates. Accordingly, there were no such fees that required pre-approval by the Audit Committee for the Reporting Periods.
(c) Tax Fees. The aggregate fees billed in the Reporting Periods for professional services rendered by the Auditor for tax compliance, tax advice and tax planning (“Tax Services”) were $47,500 in 2009 and $48,800 in 2010. These services consisted of (i) review or preparation of U.S. federal, state, local and excise tax returns; (ii) U.S. federal, state and local tax planning, advice and assistance regarding statutory, regulatory or administrative developments, and (iii) tax advice regarding tax qualification matters and/or treatment of various financial instruments held or proposed to be acquired or held.
There were no fees billed for tax services by the Auditors to service affiliates during the Reporting Periods that required pre-approval by the Audit Committee.
d) All Other Fees. The aggregate other fees billed in the Reporting Periods for products and services provided by the Auditor were $0 in 2010, other than the services reported in paragraphs (a) through (c) for the Item for the Western Asset Funds, Inc. There were no other non-audit services rendered by the Auditor to Legg Mason Partners Fund Advisors, LLC (“LMPFA”), and any entity controlling, controlled by or under common control with LMPFA that provided ongoing services to Western Asset Funds, Inc. requiring pre-approval by the Audit Committee in the Reporting Period.
All Other Fees. There were no other non-audit services rendered by the Auditor to Legg Mason Partners Fund Advisors, LLC (“LMPFA”), and any entity controlling, controlled by or under common control with LMPFA that provided ongoing services to Western Asset Funds, Inc. requiring pre-approval by the Audit Committee in the Reporting Period.
(e) Audit Committee’s pre–approval policies and procedures described in paragraph (c) (7) of Rule 2-01 of Regulation S-X.
(1) The Charter for the Audit Committee (the “Committee”) of the Board of each registered investment company (the “Fund”) advised by LMPFA or one of their affiliates (each, an “Adviser”) requires that the Committee shall approve (a) all audit and permissible non-audit services to be provided to the Fund and (b) all permissible non-audit services to be provided by the Fund’s independent auditors to the Adviser and any Covered Service Providers if the engagement relates directly to the operations and financial reporting of the Fund. The Committee may implement policies and procedures by which such services are approved other than by the full Committee.
The Committee shall not approve non-audit services that the Committee believes may impair the independence of the auditors. As of the date of the approval of this Audit Committee Charter, permissible non-audit services include any professional services (including tax services), that are not prohibited services as described below, provided to the Fund by the independent auditors, other than those provided to the Fund in connection with an audit or a review of the financial statements of the Fund. Permissible non-audit services may not include: (i) bookkeeping or other services related to the accounting records or financial statements of the Fund; (ii) financial information systems design and implementation; (iii) appraisal or valuation services, fairness opinions or contribution-in-kind reports; (iv) actuarial services; (v) internal audit outsourcing services; (vi) management functions or human resources; (vii) broker or dealer, investment adviser or investment banking services; (viii) legal services and expert services unrelated to the audit; and (ix) any other service the Public Company Accounting Oversight Board determines, by regulation, is impermissible.
Pre-approval by the Committee of any permissible non-audit services is not required so long as: (i) the aggregate amount of all such permissible non-audit services provided to the Fund, the Adviser and any service providers controlling, controlled by or under common control with the Adviser that provide ongoing services to the Fund (“Covered Service Providers”) constitutes not more than 5% of the total amount of revenues paid to the independent auditors during the fiscal year in which the permissible non-audit services are provided to (a) the Fund, (b) the Adviser and (c) any entity controlling, controlled by or under common control with the Adviser that provides ongoing services to the Fund during the fiscal year in which the services are provided that would have to be approved by the Committee; (ii) the permissible non-audit services were not recognized by the Fund at the time of the engagement to be non-audit services; and (iii) such services are promptly brought to the attention of the Committee and approved by the Committee (or its delegate(s)) prior to the completion of the audit.
(2) For the Western Asset Funds, Inc., the percentage of fees that were approved by the audit committee, with respect to: Audit-Related Fees were 100% and 100% for 2009 and 2010; Tax Fees were 100% and 100% for 2009 and 2010; and Other Fees were 100% and 100% for 2009 and 2010.
(f) N/A
(g) Non-audit fees billed by the Auditor for services rendered to Western Asset Funds, Inc., LMPFA and any entity controlling, controlled by, or under common control with LMPFA that provides ongoing services to Western Asset Funds, Inc. during the reporting period were $0 in 2010.
(h) Yes. Western Asset Funds, Inc.’s Audit Committee has considered whether the provision of non-audit services that were rendered to Service Affiliates, which were not pre-approved (not requiring pre-approval), is compatible with maintaining the Accountant’s independence. All services provided by the Auditor to the Western Asset Funds, Inc. or to Service Affiliates, which were required to be pre-approved, were pre-approved as required.
| ITEM 5. | AUDIT COMMITTEE OF LISTED REGISTRANTS. |
a) The independent board members are acting as the registrant’s audit committee as specified in Section 3(a)(58)(B) of the Exchange Act. The Audit Committee consists of the following Board members:
Ronald J. Arnault
Anita L. DeFrantz
Avedick B. Poladian
William E.B. Siart
Jaynie Miller Studenmund
b) Not applicable.
| ITEM 6. | SCHEDULE OF INVESTMENTS. |
Included herein under Item 1.
| ITEM 7. | DISCLOSURE OF PROXY VOTING POLICIES AND PROCEDURES FOR CLOSED-END MANAGEMENT INVESTMENT COMPANIES. |
Not applicable.
| ITEM 8. | PORTFOLIO MANAGERS OF CLOSED-END MANAGEMENT INVESTMENT COMPANIES. |
Not applicable.
| ITEM 9. | PURCHASES OF EQUITY SECURITIES BY CLOSED-END MANAGEMENT INVESTMENT COMPANY AND AFFILIATED PURCHASERS. |
Not applicable.
| ITEM 10. | SUBMISSION OF MATTERS TO A VOTE OF SECURITY HOLDERS. |
Not applicable.
| ITEM 11. | CONTROLS AND PROCEDURES. |
| | (a) | The registrant’s principal executive officer and principal financial officer have concluded that the registrant’s disclosure controls and procedures (as defined in Rule 30a- 3(c) under the Investment Company Act of 1940, as amended (the “1940 Act”)) are effective as of a date within 90 days of the filing date of this report that includes the disclosure required by this paragraph, based on their evaluation of the disclosure controls and procedures required by Rule 30a-3(b) under the 1940 Act and 15d-15(b) under the Securities Exchange Act of 1934. |
| | (b) | There were no changes in the registrant’s internal control over financial reporting (as defined in Rule 30a-3(d) under the 1940 Act) that occurred during the registrant’s last fiscal half-year (the registrant’s second fiscal half-year in the case of an annual report) that have materially affected, or are likely to materially affect the registrant’s internal control over financial reporting. |
(a) (1) Code of Ethics attached hereto.
Exhibit 99.CODE ETH
(a) (2) Certifications pursuant to section 302 of the Sarbanes-Oxley Act of 2002 attached hereto.
Exhibit 99.CERT
(b) Certifications pursuant to Section 906 of the Sarbanes-Oxley Act of 2002 attached hereto.
Exhibit 99.906CERT
SIGNATURES
Pursuant to the requirements of the Securities Exchange Act of 1934 and the Investment Company Act of 1940, the registrant has duly caused this Report to be signed on its behalf by the undersigned, there unto duly authorized.
| | |
| Western Asset Funds, Inc. |
| |
| By: | | /S/ R. JAY GERKEN |
| | (R. Jay Gerken) |
| | President and Principal Executive Officer of Western Asset Funds, Inc. |
| |
| Date: | | March 1, 2011 |
Pursuant to the requirements of the Securities Exchange Act of 1934 and the Investment Company Act of 1940, this report has been signed below by the following persons on behalf of the registrant and in the capacities and on the dates indicated.
| | |
| By: | | /S/ R. JAY GERKEN |
| | (R. Jay Gerken) |
| | President and Principal Executive Officer of Western Asset Funds, Inc. |
| |
| Date: | | March 1, 2011 |
| |
| By: | | /S/ KAPREL OZSOLAK |
| | (Kaprel Ozsolak) |
| | Principal Financial and Accounting Officer |
| | Western Asset Funds, Inc. |
| |
| Date: | | March 1, 2011 |