UNITED STATES
SECURITIES AND EXCHANGE COMMISSION
Washington, D.C. 20549
FORM N-CSR
CERTIFIED SHAREHOLDER REPORT OF REGISTERED
MANAGEMENT INVESTMENT COMPANIES
Investment Company Act file number 811-06110
Western Asset Funds, Inc.
(Exact name of registrant as specified in charter)
620 Eighth Avenue,
49th Floor, New York, NY 10018
(Address of principal executive offices) (Zip code)
Robert I. Frenkel, Esq.
Legg Mason & Co., LLC
100 First Stamford Place
Stamford, CT 06902
(Name and address of agent for service)
Registrant’s telephone number, including area code: 1-877-721-1926
Date of fiscal year end: December 31
Date of reporting period: December 31, 2012
| ITEM 1. | REPORT TO STOCKHOLDERS. |
The Annual Report to Stockholders is filed herewith.
December 31, 2012

Annual Repor t
Western Asset
High Yield
Fund
INVESTMENT PRODUCTS: NOT FDIC INSURED • NO BANK GUARANTEE • MAY LOSE VALUE
| | |
| II | | Western Asset High Yield Fund |
Fund objective
The Fund seeks to maximize total return, consistent with prudent investment management.
Fund name change
Prior to May 1, 2012, the Fund was known as Western Asset High Yield Portfolio. There was no change in the Fund’s investment objective or investment policies as a result of the name change.
Letter from the president

Dear Shareholder,
We are pleased to provide the annual report of Western Asset High Yield Fund for the twelve-month reporting period ended December 31, 2012. Please read on for a detailed look at prevailing economic and market conditions during the Fund’s reporting period and to learn how those conditions have affected Fund performance.
Special shareholder notice
Effective September 1, 2012, the individuals responsible for day-to-day portfolio management, development of investment strategy, oversight and coordination of the Fund are Stephen A. Walsh, Michael C. Buchanan and Walter E. Kilcullen. Mr. Walsh has been responsible for the day-to-day management of the Fund since its inception in 2001. Messrs. Buchanan and Kilcullen have been responsible for the day-to-day management of the Fund since 2005 and September 2012, respectively. Messrs. Walsh, Buchanan and Kilcullen have been employed by Western Asset Management Company (“Western Asset”) as investment professionals for at least the past five years. These individuals work together with the broader Western Asset investment management team on portfolio structure, duration weighting and term structure decisions.
As always, we remain committed to providing you with excellent service and a full spectrum of investment choices. We also remain committed to supplementing the support you receive from your financial advisor. One way we accomplish this is through our website, www.leggmason.com/individualinvestors. Here you can gain immediate access to market and investment information, including:
| Ÿ | | Fund prices and performance, |
| Ÿ | | Market insights and commentaries from our portfolio managers, and |
| Ÿ | | A host of educational resources. |
We look forward to helping you meet your financial goals.
Sincerely,

R. Jay Gerken, CFA
President
January 31, 2013
| | | | |
| Western Asset High Yield Fund | | | III | |
Investment commentary
Economic review
The U.S. economy continued to grow over the twelve months ended December 31, 2012, but it did so at an uneven pace. U.S. gross domestic product (“GDP”)i growth, as reported by the U.S. Department of Commerce, was 2.0% in the first quarter of 2012. The economy then slowed in the second quarter, as GDP growth was a tepid 1.3%. Economic growth accelerated to 3.1% in the third quarter, partially due to increased private inventory investment, higher federal government spending and moderating imports. However, this was a temporary uptick, as the Commerce Department’s initial estimate showed that fourth quarter GDP contracted 0.1%. This was the first negative reading since the second quarter of 2009, and was driven by a reversal of the above factors, as private inventory investment and federal government spending weakened.
While there was some improvement in the U.S. job market, unemployment remained elevated throughout the reporting period. When the period began, unemployment, as reported by the U.S. Department of Labor, was 8.3%. Unemployment then generally declined and was 7.8% in September 2012, the lowest rate since January 2009, but still high by historical standards. The unemployment rate then rose to 7.9% in October, before falling to 7.8% in November, where it remained in December. The number of longer-term unemployed continued to be a headwind for the economy, as roughly 39% of the 12.2 million people without a job have been out of work for more than six months.
Meanwhile, the housing market brightened, as sales generally improved and home prices continued to rebound. According to the National Association of Realtors (“NAR”), while existing-home sales dipped 1.0% on a seasonally adjusted basis in December 2012 versus the previous month, they were still 12.8% higher than in December 2011. In addition, the NAR reported that the median existing-home price for all housing types was $180,800 in December 2012, up 11.5% from December 2011. This marked the tenth consecutive month that home prices rose compared to the same period a year earlier. Furthermore, the inventory of homes available for sale fell 8.5% in December, which represents a 4.4 month supply at the current sales pace. This represents the lowest inventory since May 2005.
The manufacturing sector expanded during much of the reporting period, although it experienced several soft patches. Based on the Institute for Supply Management’s PMI (“PMI”)ii, after expanding 34 consecutive months, the PMI fell to 49.7 in June 2012, which represented the first contraction in the manufacturing sector since July 2009 (a reading below 50 indicates a contraction, whereas a reading above 50 indicates an expansion). Manufacturing continued to contract in July and August before ticking up to 51.5 in September and 51.7 in October. The PMI fell back to contraction territory with a reading of 49.5 in November, its lowest level since July 2009. However, manufacturing again expanded in December, with the PMI increasing to 50.7.
The Federal Reserve Board (“Fed”)iii took a number of actions as it sought to meet its dual mandate of fostering maximum employment and price stability. As has been the case since December 2008, the Fed kept the federal funds rateiv at a historically low range between zero and 0.25%. In January 2012, the Fed extended the period it expects to keep rates on hold until at least through late 2014. At its June 2012 meeting, the Fed announced that it would continue its program of purchasing longer-term Treasury securities and selling an equal amount of shorter-term Treasury securities (often referred to as “Operation Twist”) until the end of 2012. In September, the Fed announced a third round of
| | |
| IV | | Western Asset High Yield Fund |
Investment commentary (cont’d)
quantitative easing (“QE3”), which involves purchasing $40 billion each month of agency mortgage-backed securities on an open-end basis. In addition, the Fed further extended the duration that it expects to keep the federal funds rate on hold, until at least mid-2015. Finally, at its meeting in December, the Fed announced that it would continue purchasing $40 billion per month of agency mortgage-backed securities, as well as initially purchasing $45 billion a month of longer-term Treasuries. The Fed also said that it would keep the federal funds rate on hold “…as long as the unemployment rate remains above 6.5%, inflation between one and two years ahead is projected to be no more than a half percentage point above the Committee’s 2.0% longer-run goal, and longer-term inflation expectations continue to be well anchored.”
As always, thank you for your confidence in our stewardship of your assets.
Sincerely,
R. Jay Gerken, CFA
President
January 31, 2013
All investments are subject to risk including the possible loss of principal. Past performance is no guarantee of future results.
| i | Gross domestic product (“GDP”) is the market value of all final goods and services produced within a country in a given period of time. |
| ii | The Institute for Supply Management’s PMI is based on a survey of purchasing executives who buy the raw materials for manufacturing at more than 350 companies. It offers an early reading on the health of the manufacturing sector. |
| iii | The Federal Reserve Board (“Fed”) is responsible for the formulation of policies designed to promote economic growth, full employment, stable prices and a sustainable pattern of international trade and payments. |
| iv | The federal funds rate is the rate charged by one depository institution on an overnight sale of immediately available funds (balances at the Federal Reserve) to another depository institution; the rate may vary from depository institution to depository institution and from day to day. |
| | | | |
| Western Asset High Yield Fund 2012 Annual Report | | | 1 | |
Fund overview
Q. What is the Fund’s investment strategy?
A. The Fund’s investment objective is to maximize total return, consistent with prudent investment management. Under normal market conditions, the Fund will invest at least 80% of its net assets in U.S. dollar-denominated debt or fixed-income securities that are rated below investment grade at the time of purchase by one or more nationally recognized statistical rating organizations or securities we determine to be of comparable quality. The Fund considers securities that are rated below Baa or BBB to be rated below investment grade.
In deciding among the securities in which the Fund may invest, we take into account the credit quality, country of issue, interest rate, liquidity, maturity and yield of a security as well as other factors, including the Fund’s effective durationi and prevailing and anticipated market conditions. The Fund is permitted to invest up to 20% of its total assets in non-U.S. dollar-denominated non-U.S. securities.
The Fund may also enter into various derivative transactions for both hedging and non-hedging purposes, including for purposes of enhancing returns. These derivative transactions include, but are not limited to, futures, options, swaps and forwards. In particular, the Fund may use interest rate swaps, credit default swaps (on individual securities and/or baskets of securities), future contracts and/or mortgage-backed securities to a significant extent, although the amounts invested in these instruments may change from time to time. Other instruments may also be used to a significant extent from time to time.
At Western Asset Management Company (“Western Asset”), we utilize a fixed-income team approach, with decisions derived from interaction among various investment management sector specialists. The sector teams are comprised of Western Asset’s senior portfolio management personnel, research analysts and an in-house economist. Under this team approach, management of client fixed-income portfolios will reflect a consensus of interdisciplinary views within the Western Asset organization.
Q. What were the overall market conditions during the Fund’s reporting period?
A. The spread sectors (non-Treasuries) overcame several periods of heightened risk aversion and outperformed equal-durationii Treasuries over the twelve months ended December 31, 2012. To a great extent, demand for the spread sectors was robust during the first two months of the reporting period. This was due to several factors, including signs that the U.S. economy was gathering momentum and some progress in the European sovereign debt crisis. However, fears that the economy may be experiencing a soft patch and contagion fears from Europe led to flights to quality during portions of March, April and May 2012. The spread sectors then generally rallied over the last seven months of the period as investor sentiment was largely positive.
Short-term U.S. Treasury yields fluctuated in 2012, but ended the year where they began. In contrast, 10-year Treasury yields fell from 1.89% to 1.78% during the twelve months ended December 31, 2012. When the period began, two-year Treasury yields were 0.25%. They moved as low as 0.21% on January 17, 2012 and as high as 0.41% on March 20, 2012. Ten-year Treasury yields were 1.89% at the beginning of the period and peaked at 2.39% on March 19, 2012. On July 25, 2012, ten-year Treasuries closed at an all-time low of 1.43%. Yields then moved higher due to some positive developments in Europe and additional Federal Reserve Board (“Fed”)iii actions to stimulate the economy. When the reporting period ended on December 31, 2012, two-year Treasury yields were 0.25% and ten-year Treasury yields were 1.78%.
| | |
| 2 | | Western Asset High Yield Fund 2012 Annual Report |
Fund overview (cont’d)
All told, the Barclays U.S. Aggregate Indexiv returned 4.22% for the twelve months ended December 31, 2012. Comparatively, riskier fixed-income securities, including high-yield bonds, produced superior results. Over the fiscal year, the Barclays U.S. Corporate High Yield — 2% Issuer Cap Indexv (the “Index”) gained 15.78%. During this period, as measured by the Index, lower-quality CCC-rated bonds outperformed higher-quality BB-rated securities, as they returned 18.34% and 14.49%, respectively.
Q. How did we respond to these changing market conditions?
A. A number of adjustments were made to the Fund’s portfolio during the reporting period. We maintained the Fund’s lower-quality bias given what we felt were favorable conditions in the high-yield market, including overall solid fundamentals, low defaults and positive supply/demand technicals. Against this backdrop, we reduced the Fund’s cash position and increased its allocation to B-rated and CCC-rated securities. In contrast, we reduced the Fund’s exposure to securities rated BB and above. Elsewhere, we added to the Fund’s allocations to the Basic Industry1, Capital Goods2, Energy and Financials sectors, while reducing its weightings in the Consumer Cyclicals3 and Transportation sectors. We also actively participated in the new issue market and purchased securities that we felt were attractively valued.
High-yield index swaps (CDX) and high-yield index swaptions, which were used to manage our high-yield exposure, modestly contributed to performance. The Fund utilized currency forwards to hedge its currency exposure, which was a slight drag on results. Finally, we bought protection on Spanish sovereign credit default swaps as a downside hedge against further deterioration in the European sovereign debt crisis. They slightly benefited performance during the reporting period.
Performance review
For the twelve months ended December 31, 2012, Class I shares of Western Asset High Yield Fund returned 17.76%. The Fund’s unmanaged benchmark, the Barclays U.S. Corporate High Yield — 2% Issuer Cap Index, returned 15.78% for the same period. The Lipper High Yield Funds Category Average4 returned 14.66% over the same time frame.
| 1 | Basic Industry consists of the following industries: Chemicals, Metals & Mining and Paper. |
| 2 | Capital Goods consists of the following industries: Aerospace & Defense, Building Materials, Diversified Manufacturing, Construction Machines, Packaging and Environmental. |
| 3 | Consumer Cyclicals consists of the following industries: Automotive, Entertainment, Gaming, Home Construction, Lodging, Retailers, Restaurants, Textiles and other consumer services. |
| 4 | Lipper, Inc., a wholly-owned subsidiary of Reuters, provides independent insight on global collective investments. Returns are based on the twelve-month period ended December 31, 2012, including the reinvestment of all distributions, including returns of capital, if any, calculated among the 514 funds in the Fund’s Lipper category, and excluding sales charges. |
| | | | |
| Western Asset High Yield Fund 2012 Annual Report | | | 3 | |
| | | | | | | | |
Performance Snapshot as of December 31, 2012
(unaudited) | |
| (excluding sales charges) | | 6 months | | | 12 months | |
| Western Asset High Yield Fund: | | | | | | | | |
Class A | | | 9.17 | % | | | N/A | |
Class C | | | 8.76 | % | | | N/A | |
Class R | | | 9.01 | % | | | N/A | |
Class I | | | 9.36 | % | | | 17.76 | % |
Class IS | | | 9.38 | % | | | 17.67 | % |
| Barclays U.S. Corporate High Yield — 2% Issuer Cap Index | | | 7.97 | % | | | 15.78 | % |
Lipper High Yield Funds
Category Average1 | | | 7.51 | % | | | 14.66 | % |
The performance shown represents past performance. Past performance is no guarantee of future results and current performance may be higher or lower than the performance shown above. Principal value, investment returns and yields will fluctuate and investors’ shares, when redeemed, may be worth more or less than their original cost. To obtain performance data current to the most recent month-end, please visit our website at www.leggmason.com/individualinvestors.
All share class returns assume the reinvestment of all distributions at net asset value and the deduction of all Fund expenses. Returns have not been adjusted to include sales charges that may apply or the deduction of taxes that a shareholder would pay on Fund distributions. If sales charges were reflected, the performance quoted would be lower. Performance figures for periods shorter than one year represent cumulative figures and are not annualized.
Fund performance figures reflect fee waivers and/or expense reimbursements, without which the performance would have been lower.
The 30-Day SEC Yields for the period ended December 31, 2012 for Class A, Class C, Class R, Class I and Class IS shares were 5.96%, 5.50%, 5.96%, 6.51% and 6.62%, respectively. Absent fee waivers and/or expense reimbursements, the 30-Day SEC Yields for Class A, Class C, Class R and Class IS shares were 5.30%, 3.72%, 5.74% and 6.61%, respectively. The 30-Day SEC Yield is subject to change and is based on the yield to maturity of the Fund’s investments over a 30-day period and not on the dividends paid by the Fund, which may differ.
Performance of Class A, Class C and Class R shares for the twelve-month period is not shown because these share classes commenced operations on April 30, 2012.
|
| Total Annual Operating Expenses (unaudited) |
As of the Fund’s current prospectus dated May 1, 2012, as supplemented on May 31, 2012, the gross total annual operating expense ratios for Class A, Class C, Class R, Class I and Class IS shares were 1.01%, 1.76%, 1.31%, 0.68% and 0.61%, respectively.
Actual expenses may be higher. For example, expenses may be higher than those shown if average net assets decrease. Net assets are more likely to decrease and Fund expense ratios are more likely to increase when markets are volatile.
As a result of expense limitation arrangements, the ratio of expenses, other than interest, taxes, brokerage commissions, extraordinary expenses and deferred organizational expenses, to average net assets is not expected to exceed 1.05% for Class A shares, 1.80% for Class C shares, 1.30% for Class R shares and 0.65% for Class IS shares. These expense limitation arrangements cannot be terminated prior to December 31, 2014 without the Board of Directors’ consent.
The manager is permitted to recapture amounts waived or reimbursed to a class within two years after the fiscal year in which the manager earned the fee or incurred the expense if the class’ total annual operating expenses have fallen to a level below the expense limitation (“expense cap”) in effect at the time the fees were earned or the expenses incurred. In no case will the manager recapture any amount that would result, on any particular business day of the Fund, in the class’ total annual operating expenses exceeding the expense cap or any other lower limit then in effect.
| 1 | Lipper, Inc., a wholly-owned subsidiary of Reuters, provides independent insight on global collective investments. Returns are based on the period ended December 31, 2012, including the reinvestment of all distributions, including returns of capital, if any, calculated among the 553 funds for the six-month period and among the 514 funds for the twelve-month period in the Fund’s Lipper category, and excluding sales charges. |
| | |
| 4 | | Western Asset High Yield Fund 2012 Annual Report |
Fund overview (cont’d)
Q. What were the leading contributors to performance?
A. The largest contributor to the Fund’s relative performance during the reporting period was our selection of certain securities. In particular, our overweight exposures to Realogy Holdings Corp., Sprint Nextel Corp., Citigroup Inc. and Wind Acquisition Holdings Finance benefited results. Realogy Corp. has a diversified business model that includes real estate franchising, brokerage, relocation and title services. Its business units include Better Homes and Gardens Real Estate, CENTURY 21, Coldwell Banker, Sotheby’s International Realty and Title Resource Group. Investor sentiment for Realogy Holdings Corp. improved as there were signs of a sustainable recovery in the housing market. In addition, in October 2012 the company went public and raised more than $1 billion in additional capital, which will help support its debt obligations. Bonds issued by Sprint Nextel Corp. (and Sprint Capital Corp.) rallied given their attractive valuation, as well as an improved outlook for the wireless competitive landscape and the pricing environment. In addition, Japan’s investment grade rated Softbank made a bid to acquire B-rated Sprint Nextel toward the end of the reporting period, sending Sprint Nextel’s bonds even higher. Our Citigroup, Inc. exposure benefited performance as investor sentiment improved due to continued balance sheet and capital ratio improvement, as well as strengthening fundamentals. Wind Acquisition Holdings Finance is the third largest wireless provider and the second largest wireline provider in Italy. Its bonds performed poorly earlier in the reporting period. We maintained our position, as we felt the weakness was primarily due to the fact that the company is located in Italy, a peripheral European country that was a key concern in the European sovereign debt crisis. As the period progressed, Wind Acquisition Holdings Finance’s bonds rebounded sharply as its fundamentals remained intact and the European Central Bank (“ECB”)vi took actions to support peripheral European countries.
The Fund’s ratings biases were also additive for performance. In particular, an overweight to lower-rated CCC bonds was a positive, as they outperformed the Index. In addition, we underweighted bonds rated BB, which was beneficial given their underperformance versus the Index.
From a sector allocation perspective, the Fund benefited from its overweight to the strong performing Wireless1 and Transportation sectors and its underweight to the weak performing Consumer Non-Cyclicals2 sector.
Q. What were the leading detractors from performance?
A. Although the portfolio outperformed its benchmark, a number of individual holdings detracted from performance, including overweight positions in Petroplus Finance, Overseas Shipholding Group and Xinergy Ltd. Petroplus Finance is a European oil refiner. In December 2011, a $1 billion credit line to the company was frozen by its bank lenders. Petroplus Finance was unable to avoid bankruptcy as it reduced its output and closed several refineries. Overseas Shipholding Group is one of the world’s largest oil tanker companies. It performed poorly as the company’s fundamentals weakened given the volatile pricing environment for shipping rates and weaker oil demand in the U.S. and Europe led to a reduction in Atlantic crossings, an area of concentration for the company. In addition, in October 2012 Overseas Shipholding Group announced that investors could not rely on its financial statements for the last three years while
| 1 | Wireless is included in the Telecommunication Services sector. |
| 2 | Non-Cyclicals consists of the following industries: Consumer Products, Food/Beverage, Health Care, Pharmaceuticals, Supermarkets and Tobacco. |
| | | | |
| Western Asset High Yield Fund 2012 Annual Report | | | 5 | |
they review their accounting treatment for taxes. In November 2012, the company filed for bankruptcy. All told, Overseas Shipholding Group’s bonds significantly declined in value as spread sectors rallied. Xinergy Ltd. is a Central Appalachian coal producer. Xinergy Ltd., along with energy companies in general, performed poorly during the reporting period given moderating global growth. In addition, Xinergy Ltd. was negatively impacted as it shut down production on its thermal coal assets and its cash position declined sharply.
The Fund’s relative performance during the reporting period was negatively impacted by certain sector allocations. In particular, an overweight to Energy was a negative for results as it was the worst performing sector in the Index. An underweight to the top performing sector in the Index, Financials, was also detrimental.
Thank you for your investment in Western Asset High Yield Fund. As always, we appreciate that you have chosen us to manage your assets and we remain focused on achieving the Fund’s investment goals.
Sincerely,
Western Asset Management Company
January 22, 2013
RISKS: Fixed-income securities involve interest rate, credit, inflation and reinvestment risks. As interest rates rise, the value of fixed-income securities falls. Derivatives, such as options, futures and swaps, can be illiquid, may disproportionately increase losses, and have a potentially large impact on Fund performance. International investments are subject to special risks including currency fluctuations and social, economic and political uncertainties, which could increase volatility. These risks are magnified in emerging markets. The use of leverage may increase volatility and possibility of loss. Risks of high-yield securities include greater price volatility, illiquidity and possibility of default. Asset-backed, mortgage-backed or mortgage-related securities are subject to prepayment and extension risks. Please see the Fund’s prospectus for a more complete discussion of these and other risks, and the Fund’s investment strategies.
Portfolio holdings and breakdowns are as of December 31, 2012 and are subject to change and may not be representative of the portfolio managers’ current or future investments. Please refer to pages 13 through 31 for a list and percentage breakdown of the Fund’s holdings.
The mention of sector breakdowns is for informational purposes only and should not be construed as a recommendation to purchase or sell any securities. The information provided regarding such sectors is not a sufficient basis upon which to make an investment decision. Investors seeking financial advice regarding the appropriateness of investing in any securities or investment strategies discussed should consult their financial professional. The Fund’s top five sector holdings (as a percentage of net assets) as of December 31, 2012 were: Energy (20.0%), Consumer Discretionary (17.7%), Industrials (15.3%), Materials (10.5%) and Financials (9.7%). The Fund’s portfolio composition is subject to change at any time.
| | |
| 6 | | Western Asset High Yield Fund 2012 Annual Report |
Fund overview (cont’d)
All investments are subject to risk including the possible loss of principal. Past performance is no guarantee of future results. All index performance reflects no deduction for fees, expenses or taxes. Please note that an investor cannot invest directly in an index.
The information provided is not intended to be a forecast of future events, a guarantee of future results or investment advice. Views expressed may differ from those of the firm as a whole.
| i | Effective duration measures the expected sensitivity of market price to changes in interest rates, taking into account the effects of structural complexities. (For example, some bonds can be prepaid by the issuer.) |
| ii | Duration is the measure of the price sensitivity of a fixed-income security to an interest rate change of 100 basis points. Calculation is based on the weighted average of the present values for all cash flows. |
| iii | The Federal Reserve Board (“Fed”) is responsible for the formulation of policies designed to promote economic growth, full employment, stable prices and a sustainable pattern of international trade and payments. |
| iv | The Barclays U.S. Aggregate Index is a broad-based bond index comprised of government, corporate, mortgage- and asset-backed issues, rated investment grade or higher, and having at least one year to maturity. |
| v | The Barclays U.S. Corporate High Yield — 2% Issuer Cap Index is an index of the 2% Issuer Cap component of the Barclays U.S. Corporate High Yield Index, which covers the U.S. dollar-denominated, non-investment grade, fixed-rate, taxable corporate bond market. |
| vi | The European Central Bank (“ECB”) is responsible for the monetary system of the European Union and the euro currency. |
| | | | |
| Western Asset High Yield Fund 2012 Annual Report | | | 7 | |
Fund at a glance† (unaudited)
Investment breakdown (%) as a percent of total investments
| † | The bar graph above represents the composition of the Fund’s investments as of December 31, 2012 and December 31, 2011 and does not include derivatives, such as written options, forward foreign currency contracts and swap contracts. The Fund is actively managed. As a result, the composition of the Fund’s investments is subject to change at any time. |
| ‡ | Represents less than 0.1%. |
| | |
| 8 | | Western Asset High Yield Fund 2012 Annual Report |
Fund expenses (unaudited)
Example
As a shareholder of the Fund, you may incur two types of costs: (1) transaction costs, including front-end and back-end sales charges (loads) on purchase payments; and (2) ongoing costs, including management fees; service and/or distribution (12b-1) fees; and other Fund expenses. This example is intended to help you understand your ongoing costs (in dollars) of investing in the Fund and to compare these costs with the ongoing costs of investing in other mutual funds.
This example is based on an investment of $1,000 invested on July 1, 2012 and held for the six months ended December 31, 2012.
Actual expenses
The table below titled “Based on Actual Total Return” provides information about actual account values and actual expenses. You may use the information provided in this table, together with the amount you invested, to estimate the expenses that you paid over the period. To estimate the expenses you paid on your account, divide your ending account value by $1,000 (for example, an $8,600 ending account value divided by $1,000 = 8.6), then multiply the result by the number under the heading entitled “Expenses Paid During the Period”.
Hypothetical example for comparison purposes
The table below titled “Based on Hypothetical Total Return” provides information about hypothetical account values and hypothetical expenses based on the actual expense ratio and an assumed rate of return of 5.00% per year before expenses, which is not the Fund’s actual return. The hypothetical account values and expenses may not be used to estimate the actual ending account balance or expenses you paid for the period. You may use the information provided in this table to compare the ongoing costs of investing in the Fund and other funds. To do so, compare the 5.00% hypothetical example relating to the Fund with the 5.00% hypothetical examples that appear in the shareholder reports of the other funds.
Please note that the expenses shown in the table below are meant to highlight your ongoing costs only and do not reflect any transactional costs, such as front-end or back-end sales charges (loads). Therefore, the table is useful in comparing ongoing costs only, and will not help you determine the relative total costs of owning different funds. In addition, if these transaction costs were included, your costs would have been higher.
| | | | | | | | | | | | | | | | | | | | | | | | | | | | | | | | | | | | | | | | | | | | |
Based on actual total return1 | | | | | Based on hypothetical total return1 | |
| | | Actual
Total Return
Without
Sales
Charge2 | | | Beginning
Account
Value | | | Ending
Account
Value | | | Annualized
Expense
Ratio | | | Expenses
Paid
During
the
Period3 | | | | | | | Hypothetical
Annualized
Total Return | | | Beginning
Account
Value | | | Ending
Account
Value | | | Annualized
Expense
Ratio | | | Expenses
Paid
During
the
Period3 | |
Class A | | | 9.17 | % | | $ | 1,000.00 | | | $ | 1,091.70 | | | | 0.93 | % | | $ | 4.89 | | | | | Class A | | | 5.00 | % | | $ | 1,000.00 | | | $ | 1,020.46 | | | | 0.93 | % | | $ | 4.72 | |
Class C | | | 8.76 | | | | 1,000.00 | | | | 1,087.60 | | | | 1.69 | | | | 8.87 | | | | | Class C | | | 5.00 | | | | 1,000.00 | | | | 1,016.64 | | | | 1.69 | | | | 8.57 | |
Class R | | | 9.01 | | | | 1,000.00 | | | | 1,090.10 | | | | 1.30 | | | | 6.83 | | | | | Class R | | | 5.00 | | | | 1,000.00 | | | | 1,018.60 | | | | 1.30 | | | | 6.60 | |
Class I | | | 9.36 | | | | 1,000.00 | | | | 1,093.60 | | | | 0.67 | | | | 3.53 | | | | | Class I | | | 5.00 | | | | 1,000.00 | | | | 1,021.77 | | | | 0.67 | | | | 3.40 | |
Class IS | | | 9.38 | | | | 1,000.00 | | | | 1,093.80 | | | | 0.63 | | | | 3.32 | | | | | Class IS | | | 5.00 | | | | 1,000.00 | | | | 1,021.97 | | | | 0.63 | | | | 3.20 | |
| 1 | For the six months ended December 31, 2012. |
| 2 | Assumes the reinvestment of all distributions, including returns of capital, if any, at net asset value and does not reflect the deduction of applicable sales charge with respect to Class A shares or the applicable contingent deferred sales charge (“CDSC”) with respect to Class C shares. Total return is not annualized, as it may not be representative of the total return for the year. Performance figures may reflect compensating balance arrangements, fee waivers and/or expense reimbursements. In the absence of compensating balance arrangements, fee waivers and/or expense reimbursements, the total return would have been lower. Past performance is no guarantee of future results. |
| 3 | Expenses (net of compensating balance arrangements, fee waivers and/or expense reimbursements) are equal to each class’ respective annualized expense ratio multiplied by the average account value over the period, multiplied by the number of days in the most recent fiscal half-year (184), then divided by 366. |
| | | | |
| Western Asset High Yield Fund 2012 Annual Report | | | 9 | |
Fund performance (unaudited)
| | | | | | | | | | | | | | | | | | | | |
| Average annual total returns | | | | | | | | | | | | | | | |
| Without sales charges1 | | Class A† | | | Class C† | | | Class R† | | | Class I | | | Class IS | |
| Twelve Months Ended 12/31/12 | | | N/A | | | | N/A | | | | N/A | | | | 17.76 | % | | | 17.67 | % |
| Five Years Ended 12/31/12 | | | N/A | | | | N/A | | | | N/A | | | | 8.84 | | | | N/A | |
| Ten Years Ended 12/31/12 | | | N/A | | | | N/A | | | | N/A | | | | 9.34 | | | | N/A | |
| Inception* through 12/31/12 | | | 9.25 | % | | | 8.73 | % | | | 9.05 | % | | | 8.44 | | | | 11.13 | |
| | | | | |
| With sales charges2 | | Class A† | | | Class C† | | | Class R† | | | Class I | | | Class IS | |
| Twelve Months Ended 12/31/12 | | | N/A | | | | N/A | | | | N/A | | | | 17.76 | % | | | 17.67 | % |
| Five Years Ended 12/31/12 | | | N/A | | | | N/A | | | | N/A | | | | 8.84 | | | | N/A | |
| Ten Years Ended 12/31/12 | | | N/A | | | | N/A | | | | N/A | | | | 9.34 | | | | N/A | |
| Inception* through 12/31/12 | | | 4.64 | % | | | 7.73 | % | | | 9.05 | % | | | 8.44 | | | | 11.13 | |
| | | | |
| Cumulative total returns | | | |
| Without sales charges1 | | | |
| Class A (Inception date of 4/30/12 through 12/31/12) | | | 9.25 | % |
| Class C (Inception date of 4/30/12 through 12/31/12) | | | 8.73 | |
| Class R (Inception date of 4/30/12 through 12/31/12) | | | 9.05 | |
| Class I (12/31/02 through 12/31/12) | | | 144.30 | |
| Class IS (Inception date of 8/4/08 through 12/31/12) | | | 59.27 | |
All figures represent past performance and are not a guarantee of future results. Investment return and principal value of an investment will fluctuate so that an investor’s shares, when redeemed, may be worth more or less than their original cost. The returns shown do not reflect the deduction of taxes that a shareholder would pay on Fund distributions or the redemption of Fund shares. Performance figures may reflect compensating balance arrangements, fee waivers and/or expense reimbursements. In the absence of compensating balance arrangements, fee waivers and/or expense reimbursements, the total return would have been lower.
| 1 | Assumes the reinvestment of all distributions, including returns of capital, if any, at net asset value and does not reflect the deduction of the applicable sales charge with respect to Class A shares or the applicable contingent deferred sales charge (“CDSC”) with respect to Class C shares. |
| 2 | Assumes the reinvestment of all distributions, including returns of capital, if any, at net asset value. In addition, Class A shares reflect the deduction of the maximum initial sales charge of 4.25%. Class C shares reflect the deduction of a 1.00% CDSC, which applies if shares are redeemed within one year from purchase payment. |
| * | Inception dates for Class A, C, R, I and IS shares are April 30, 2012, April 30, 2012, April 30, 2012, September 28, 2001 and August 4, 2008, respectively. |
| | |
| 10 | | Western Asset High Yield Fund 2012 Annual Report |
Fund performance (unaudited) (cont’d)
Historical performance
Value of $1,000,000 invested in
Class I Shares of Western Asset High Yield Fund vs. Barclays U.S. Corporate High Yield – 2% Issuer Cap Index† — December 2002 - December 2012
Value of $1,000,000 invested in
Class IS Shares of Western Asset High Yield Fund vs. Barclays U.S. Corporate High Yield – 2% Issuer Cap Index† — August 4, 2008
- December 2012
All figures represent past performance and are not a guarantee of future results. Investment return and principal value of an investment will fluctuate so that an investor’s shares, when redeemed, may be worth more or less than their original cost. The returns shown do not reflect the deduction of taxes that a shareholder would pay on Fund distributions or the redemption of Fund shares. Performance figures may reflect compensating balance arrangements, fee waivers and/or expense reimbursements. In the absence of compensating balance arrangements, fee waivers and/or expense reimbursements, the total return would have been lower.
| † | Hypothetical illustration of $1,000,000 invested in Class I and IS shares of Western Asset High Yield Fund on December 31, 2002 and August 4, 2008 (commencement of operations), respectively, assuming the reinvestment of all distributions, including returns of capital, if any, at net asset value through December 31, 2012. The hypothetical illustration also assumes a $1,000,000 investment in the Barclays U.S. Corporate High Yield - 2% Issuer Cap Index. The Barclays U.S. Corporate High Yield - 2% Issuer Cap Index is an index of the 2% Issuer Cap component of the Barclays U.S. Corporate High Yield Index, which covers the U.S. dollar-denominated, non-investment grade, fixed-rate, taxable corporate bond market. The Index is unmanaged and not subject to the same management and trading expenses as a mutual fund. Please note that an investor cannot invest directly in an index. The performance of the Fund’s other classes may be greater or less than the performance of Class I and IS shares indicated on these charts, depending on whether greater or lesser sales charges and fees were incurred by shareholders investing in the other classes. |
| | | | |
| Western Asset High Yield Fund 2012 Annual Report | | | 11 | |
Spread duration (unaudited)
Economic exposure — December 31, 2012
Spread duration measures the sensitivity to changes in spreads. The spread over Treasuries is the annual risk-premium demanded by investors to hold non-Treasury securities. Spread duration is quantified as the % change in price resulting from a 100 basis points change in spreads. For a security with positive spread duration, an increase in spreads would result in a price decline and a decline in spreads would result in a price increase. This chart highlights the market sector exposure of the Fund’s sectors relative to the selected benchmark sectors as of the end of the reporting period.
| | |
Benchmark | | — Barclays U.S. Corporate High Yield — 2% Issuer Cap Index |
| EM | | — Emerging Markets |
| HY | | — High Yield |
| IG Credit | | — Investment Grade Credit |
| WA High Yield | | — Western Asset High Yield Fund |
| | |
| 12 | | Western Asset High Yield Fund 2012 Annual Report |
Effective duration (unaudited)
Interest rate exposure — December 31, 2012
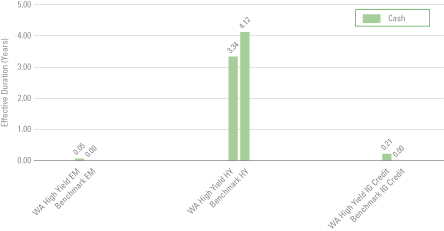
Effective duration measures the sensitivity to changes in relevant interest rates. Effective duration is quantified as the % change in price resulting from a 100 basis points change in interest rates. For a security with positive effective duration, an increase in interest rates would result in a price decline and a decline in interest rates would result in a price increase. This chart highlights the interest rate exposure of the Fund’s sectors relative to the selected benchmark sectors as of the end of the reporting period.
| | |
Benchmark | | — Barclays U.S. Corporate High Yield — 2% Issuer Cap Index |
| EM | | — Emerging Markets |
| HY | | — High Yield |
| IG Credit | | — Investment Grade Credit |
| WA High Yield | | — Western Asset High Yield Fund |
| | | | |
| Western Asset High Yield Fund 2012 Annual Report | | | 13 | |
Schedule of investments
December 31, 2012
Western Asset High Yield Fund
| | | | | | | | | | | | | | |
| Security | | Rate | | | Maturity
Date | | Face
Amount† | | | Value | |
| Corporate Bonds & Notes — 85.7% | | | | | | | | | | | |
| Consumer Discretionary — 16.5% | | | | | | | | | | | |
Auto Components — 0.6% | | | | | | | | | | | |
American Axle & Manufacturing Inc., Senior Notes | | | 6.625 | % | | 10/15/22 | | | 480,000 | | | $ | 487,200 | |
Continental Rubber of America Corp., Senior Secured Notes | | | 4.500 | % | | 9/15/19 | | | 2,410,000 | | | | 2,466,379 | (a) |
Hertz Holdings Netherlands BV, Senior Secured Bonds | | | 8.500 | % | | 7/31/15 | | | 310,000 | EUR | | | 439,874 | (a) |
Total Auto Components | | | | | | | | | | 3,393,453 | |
Automobiles — 0.6% | | | | | | | | | | | | | | |
Chrysler Group LLC/CG Co.-Issuer Inc., Secured Notes | | | 8.250 | % | | 6/15/21 | | | 2,240,000 | | | | 2,464,000 | |
Escrow GCB General Motors | | | — | | | — | | | 1,320,000 | | | | 0 | *(b)(c)(d) |
Escrow GCB General Motors | | | — | | | — | | | 4,090,000 | | | | 0 | *(b)(c)(d) |
Escrow GCB General Motors | | | — | | | — | | | 2,455,000 | | | | 0 | *(b)(c)(d) |
Jaguar Holding Co. II/Jaguar Merger Sub Inc., Senior Notes | | | 9.500 | % | | 12/1/19 | | | 510,000 | | | | 578,850 | (a) |
Total Automobiles | | | | | | | | | | | | | 3,042,850 | |
Diversified Consumer Services — 1.1% | | | | | | | | | | | |
Laureate Education Inc., Senior Notes | | | 9.250 | % | | 9/1/19 | | | 990,000 | | | | 1,034,550 | (a) |
Service Corp. International, Senior Notes | | | 7.500 | % | | 4/1/27 | | | 637,000 | | | | 684,775 | |
ServiceMaster Co., Senior Notes | | | 8.000 | % | | 2/15/20 | | | 1,230,000 | | | | 1,282,275 | |
ServiceMaster Co., Senior Notes | | | 7.000 | % | | 8/15/20 | | | 680,000 | | | | 681,700 | (a) |
Sotheby’s, Senior Notes | | | 5.250 | % | | 10/1/22 | | | 1,170,000 | | | | 1,181,700 | (a) |
Stewart Enterprises Inc., Senior Notes | | | 6.500 | % | | 4/15/19 | | | 750,000 | | | | 802,500 | |
Total Diversified Consumer Services | | | | | | | | | | 5,667,500 | |
Hotels, Restaurants & Leisure — 6.3% | | | | | | | | | | | |
Affinity Gaming LLC/Affinity Gaming Finance Corp., Senior Notes | | | 9.000 | % | | 5/15/18 | | | 1,190,000 | | | | 1,243,550 | (a) |
Bossier Casino Venture Holdco Inc., Senior Secured Bonds | | | 14.000 | % | | 2/9/18 | | | 1,249,876 | | | | 1,118,020 | (a)(b)(c)(e) |
Boyd Gaming Corp., Senior Notes | | | 9.125 | % | | 12/1/18 | | | 160,000 | | | | 163,200 | |
Boyd Gaming Corp., Senior Notes | | | 9.000 | % | | 7/1/20 | | | 2,025,000 | | | | 1,994,625 | (a) |
Caesars Entertainment Operating Co. Inc., Senior Notes | | | 10.750 | % | | 2/1/16 | | | 1,950,000 | | | | 1,579,500 | |
Caesars Entertainment Operating Co. Inc., Senior Secured Notes | | | 10.000 | % | | 12/15/15 | | | 2,190,000 | | | | 1,938,150 | |
Caesars Operating Escrow LLC/Caesars Escrow Corp., Senior Secured Notes | | | 9.000 | % | | 2/15/20 | | | 580,000 | | | | 580,000 | (a) |
Carrols Restaurant Group Inc., Senior Secured Notes | | | 11.250 | % | | 5/15/18 | | | 1,340,000 | | | | 1,467,300 | (a) |
CCM Merger Inc., Senior Notes | | | 9.125 | % | | 5/1/19 | | | 1,690,000 | | | | 1,702,675 | (a) |
See Notes to Financial Statements.
| | |
| 14 | | Western Asset High Yield Fund 2012 Annual Report |
Schedule of investments (cont’d)
December 31, 2012
Western Asset High Yield Fund
| | | | | | | | | | | | | | |
| Security | | Rate | | | Maturity
Date | | Face
Amount† | | | Value | |
Hotels, Restaurants & Leisure — continued | | | | | | | | | | | |
Downstream Development Quapaw, Senior Secured Notes | | | 10.500 | % | | 7/1/19 | | | 1,290,000 | | | $ | 1,393,200 | (a) |
Equinox Holdings Inc., Secured Notes | | | 9.500 | % | | 2/1/16 | | | 500,000 | | | | 527,500 | (a) |
Fontainebleau Las Vegas Holdings LLC/Fontainebleau Las Vegas Capital Corp. | | | 10.250 | % | | 6/15/15 | | | 1,455,000 | | | | 909 | (a)(f) |
Hoa Restaurant Group LLC/Hoa Finance Corp., Senior Secured Notes | | | 11.250 | % | | 4/1/17 | | | 1,840,000 | | | | 1,665,200 | (a) |
Landry’s Holdings II Inc., Senior Notes | | | 10.250 | % | | 1/1/18 | | | 910,000 | | | | 905,450 | (a) |
Landry’s Inc., Senior Notes | | | 9.375 | % | | 5/1/20 | | | 1,150,000 | | | | 1,213,250 | (a) |
Mastro’s Restaurants LLC/RRG Finance Corp., Senior Secured Notes | | | 12.000 | % | | 6/1/17 | | | 1,117,141 | | | | 1,161,827 | (a) |
Mohegan Tribal Gaming Authority, Secured Notes | | | 11.500 | % | | 11/1/17 | | | 190,000 | | | | 203,775 | (a) |
Mohegan Tribal Gaming Authority, Senior Secured Notes | | | 10.500 | % | | 12/15/16 | | | 3,072,000 | | | | 3,010,560 | (a) |
NCL Corp. Ltd., Senior Notes | | | 9.500 | % | | 11/15/18 | | | 4,690,000 | | | | 5,205,900 | |
NCL Corp. Ltd., Senior Secured Notes | | | 11.750 | % | | 11/15/16 | | | 960,000 | | | | 1,084,800 | |
Rivers Pittsburgh Borrower LP/Rivers Pittsburgh Finance Corp., Senior Secured Notes | | | 9.500 | % | | 6/15/19 | | | 330,000 | | | | 358,050 | (a) |
Seven Seas Cruises S de RL LLC, Senior Secured Notes | | | 9.125 | % | | 5/15/19 | | | 1,990,000 | | | | 2,104,425 | |
Snoqualmie Entertainment Authority, Senior Secured Notes | | | 4.476 | % | | 2/1/14 | | | 2,755,000 | | | | 2,686,125 | (a)(g) |
Total Hotels, Restaurants & Leisure | | | | | | | | | | | | | 33,307,991 | |
Household Durables — 0.2% | | | | | | | | | | | | | | |
William Lyon Homes Inc., Senior Notes | | | 8.500 | % | | 11/15/20 | | | 1,110,000 | | | | 1,154,400 | (a) |
Internet & Catalog Retail — 0.4% | | | | | | | | | | | | | | |
Netflix Inc., Senior Notes | | | 8.500 | % | | 11/15/17 | | | 1,870,000 | | | | 1,986,875 | |
Media — 5.3% | | | | | | | | | | | | | | |
Carmike Cinemas Inc., Secured Notes | | | 7.375 | % | | 5/15/19 | | | 490,000 | | | | 529,200 | |
CCO Holdings LLC/CCO Holdings Capital Corp., Senior Notes | | | 8.125 | % | | 4/30/20 | | | 1,760,000 | | | | 1,971,200 | |
CCO Holdings LLC/CCO Holdings Capital Corp., Senior Notes | | | 5.250 | % | | 9/30/22 | | | 1,020,000 | | | | 1,032,750 | |
Cengage Learning Acquisitions Inc., Senior Secured Notes | | | 11.500 | % | | 4/15/20 | | | 2,780,000 | | | | 2,397,750 | (a) |
Clear Channel Worldwide Holdings Inc., Senior Notes | | | 6.500 | % | | 11/15/22 | | | 1,040,000 | | | | 1,079,000 | (a) |
Clear Channel Worldwide Holdings Inc., Senior Notes | | | 6.500 | % | | 11/15/22 | | | 440,000 | | | | 452,100 | (a) |
Clear Channel Worldwide Holdings Inc., Senior Subordinated Notes | | | 7.625 | % | | 3/15/20 | | | 880,000 | | | | 886,600 | |
Clear Channel Worldwide Holdings Inc., Senior Subordinated Notes | | | 7.625 | % | | 3/15/20 | | | 120,000 | | | | 119,700 | |
See Notes to Financial Statements.
| | | | |
| Western Asset High Yield Fund 2012 Annual Report | | | 15 | |
Western Asset High Yield Fund
| | | | | | | | | | | | | | | | |
| Security | | Rate | | | Maturity
Date | | | Face
Amount† | | | Value | |
Media — continued | | | | | | | | | | | | | | | | |
CSC Holdings LLC, Senior Notes | | | 6.750 | % | | | 11/15/21 | | | | 2,000,000 | | | $ | 2,217,500 | (a) |
DISH DBS Corp., Senior Notes | | | 6.750 | % | | | 6/1/21 | | | | 1,000,000 | | | | 1,140,000 | |
Global Generations Merger Subsidiary Inc., Senior Notes | | | 11.000 | % | | | 12/15/20 | | | | 1,060,000 | | | | 1,078,550 | (a) |
Good Sam Enterprises LLC, Secured Notes | | | 11.500 | % | | | 12/1/16 | | | | 1,590,000 | | | | 1,701,300 | |
LBI Media Inc., Senior Secured Notes | | | 9.250 | % | | | 4/15/19 | | | | 1,480,000 | | | | 1,387,500 | (a) |
Nara Cable Funding Ltd., Senior Secured Notes | | | 8.875 | % | | | 12/1/18 | | | | 2,130,000 | | | | 2,167,275 | (a) |
Nielsen Finance LLC/Nielsen Finance Co., Senior Notes | | | 4.500 | % | | | 10/1/20 | | | | 1,690,000 | | | | 1,681,550 | (a) |
Ono Finance II PLC, Senior Bonds | | | 10.875 | % | | | 7/15/19 | | | | 1,150,000 | | | | 1,098,250 | (a) |
Univision Communications Inc., Senior Secured Notes | | | 6.875 | % | | | 5/15/19 | | | | 2,440,000 | | | | 2,537,600 | (a) |
Univision Communications Inc., Senior Secured Notes | | | 6.750 | % | | | 9/15/22 | | | | 1,470,000 | | | | 1,517,775 | (a) |
UPC Holding BV, Senior Notes | | | 9.875 | % | | | 4/15/18 | | | | 1,050,000 | | | | 1,186,500 | (a) |
UPCB Finance III Ltd., Senior Secured Notes | | | 6.625 | % | | | 7/1/20 | | | | 780,000 | | | | 835,575 | (a) |
Virgin Media Finance PLC, Senior Notes | | | 4.875 | % | | | 2/15/22 | | | | 620,000 | | | | 633,950 | |
Total Media | | | | | | | | | | | | | | | 27,651,625 | |
Multiline Retail — 0.4% | | | | | | | | | | | | | | | | |
Bon-Ton Department Stores Inc., Senior Notes | | | 10.250 | % | | | 3/15/14 | | | | 550,000 | | | | 544,500 | |
Bon-Ton Department Stores Inc., Senior Secured Notes | | | 10.625 | % | | | 7/15/17 | | | | 680,000 | | | | 661,300 | (a) |
Neiman Marcus Group Inc., Senior Secured Notes | | | 7.125 | % | | | 6/1/28 | | | | 1,105,000 | | | | 1,099,475 | |
Total Multiline Retail | | | | | | | | | | | | | | | 2,305,275 | |
Specialty Retail — 1.4% | | | | | | | | | | | | | | | | |
American Greetings Corp., Senior Notes | | | 7.375 | % | | | 12/1/21 | | | | 69,000 | | | | 70,898 | |
Dufry Finance SCA, Senior Notes | | | 5.500 | % | | | 10/15/20 | | | | 2,310,000 | | | | 2,390,850 | (a) |
Edcon Proprietary Ltd., Senior Secured Notes | | | 9.500 | % | | | 3/1/18 | | | | 1,100,000 | | | | 1,056,000 | (a) |
Gymboree Corp., Senior Notes | | | 9.125 | % | | | 12/1/18 | | | | 2,380,000 | | | | 2,118,200 | |
New Academy Finance Co. LLC/New Academy Finance Corp., Senior Notes | | | 8.000 | % | | | 6/15/18 | | | | 270,000 | | | | 273,375 | (a)(e) |
Spencer Spirit Holdings Inc./Spencer Gifts LLC/Spirit Halloween Superstores, Senior Notes | | | 11.000 | % | | | 5/1/17 | | | | 1,180,000 | | | | 1,265,550 | (a) |
Total Specialty Retail | | | | | | | | | | | | | | | 7,174,873 | |
Textiles, Apparel & Luxury Goods — 0.2% | | | | | | | | | | | | | |
Empire Today LLC/Empire Today Finance Corp., Senior Secured Notes | | | 11.375 | % | | | 2/1/17 | | | | 840,000 | | | | 892,500 | (a) |
Quiksilver Inc., Senior Notes | | | 6.875 | % | | | 4/15/15 | | | | 230,000 | | | | 225,975 | |
Total Textiles, Apparel & Luxury Goods | | | | | | | | | | | | 1,118,475 | |
Total Consumer Discretionary | | | | | | | | | | | | 86,803,317 | |
See Notes to Financial Statements.
| | |
| 16 | | Western Asset High Yield Fund 2012 Annual Report |
Schedule of investments (cont’d)
December 31, 2012
Western Asset High Yield Fund
| | | | | | | | | | | | | | |
| Security | | Rate | | | Maturity
Date | | Face
Amount† | | | Value | |
| Consumer Staples — 1.9% | | | | | | | | | | | | | | |
Food & Staples Retailing — 0.4% | | | | | | | | | | | | | | |
Post Holdings Inc., Senior Notes | | | 7.375 | % | | 2/15/22 | | | 1,870,000 | | | $ | 2,048,819 | (a) |
Food Products — 0.6% | | | | | | | | | | | | | | |
Harmony Foods Corp., Senior Secured Notes | | | 10.000 | % | | 5/1/16 | | | 720,000 | | | | 775,800 | (a) |
Simmons Foods Inc., Senior Secured Notes | | | 10.500 | % | | 11/1/17 | | | 2,755,000 | | | | 2,500,162 | (a) |
Total Food Products | | | | | | | | | | | | | 3,275,962 | |
Household Products — 0.4% | | | | | | | | | | | | | | |
Harbinger Group Inc., Senior Secured Notes | | | 7.875 | % | | 7/15/19 | | | 750,000 | | | | 743,438 | (a) |
Spectrum Brands Escrow Corp., Senior Notes | | | 6.375 | % | | 11/15/20 | | | 400,000 | | | | 420,000 | (a) |
Spectrum Brands Escrow Corp., Senior Notes | | | 6.625 | % | | 11/15/22 | | | 610,000 | | | | 654,225 | (a) |
Total Household Products | | | | | | | | | | | | | 1,817,663 | |
Tobacco — 0.5% | | | | | | | | | | | | | | |
Alliance One International Inc., Senior Notes | | | 10.000 | % | | 7/15/16 | | | 2,492,000 | | | | 2,622,830 | |
Total Consumer Staples | | | | | | | | | | 9,765,274 | |
| Energy — 18.6% | | | | | | | | | | | | | | |
Energy Equipment & Services — 3.1% | | | | | | | | | | | |
Atwood Oceanics Inc., Senior Notes | | | 6.500 | % | | 2/1/20 | | | 830,000 | | | | 892,250 | |
Compagnie Generale de Geophysique-Veritas, Senior Notes | | | 6.500 | % | | 6/1/21 | | | 830,000 | | | | 888,100 | |
GulfMark Offshore Inc., Senior Notes | | | 6.375 | % | | 3/15/22 | | | 1,200,000 | | | | 1,236,000 | (a) |
Hercules Offshore Inc., Senior Secured Notes | | | 7.125 | % | | 4/1/17 | | | 960,000 | | | | 1,005,600 | (a) |
Hercules Offshore Inc., Senior Secured Notes | | | 10.500 | % | | 10/15/17 | | | 3,430,000 | | | | 3,695,825 | (a) |
Key Energy Services Inc., Senior Notes | | | 6.750 | % | | 3/1/21 | | | 1,210,000 | | | | 1,210,000 | |
Key Energy Services Inc., Senior Notes | | | 6.750 | % | | 3/1/21 | | | 240,000 | | | | 238,800 | (a) |
Oil States International Inc., Senior Notes | | | 6.500 | % | | 6/1/19 | | | 1,200,000 | | | | 1,278,000 | |
Oil States International Inc., Senior Notes | | | 5.125 | % | | 1/15/23 | | | 1,120,000 | | | | 1,135,400 | (a) |
Parker Drilling Co., Senior Notes | | | 9.125 | % | | 4/1/18 | | | 1,640,000 | | | | 1,750,700 | |
Petroleum Geo-Services ASA, Senior Notes | | | 7.375 | % | | 12/15/18 | | | 890,000 | | | | 961,200 | (a) |
SESI LLC, Senior Notes | | | 7.125 | % | | 12/15/21 | | | 1,370,000 | | | | 1,524,125 | |
Vantage Drilling Co., Senior Secured Notes | | | 11.500 | % | | 8/1/15 | | | 820,000 | | | | 893,800 | |
Total Energy Equipment & Services | | | | | | | | | | 16,709,800 | |
Oil, Gas & Consumable Fuels — 15.5% | | | | | | | | | | | |
Access Midstream Partner LP/ACMP Finance Corp., Senior Notes | | | 4.875 | % | | 5/15/23 | | | 1,780,000 | | | | 1,806,700 | |
Arch Coal Inc., Senior Notes | | | 7.000 | % | | 6/15/19 | | | 1,280,000 | | | | 1,190,400 | |
Arch Coal Inc., Senior Notes | | | 9.875 | % | | 6/15/19 | | | 520,000 | | | | 540,800 | (a) |
Arch Coal Inc., Senior Notes | | | 7.250 | % | | 6/15/21 | | | 1,000,000 | | | | 922,500 | |
See Notes to Financial Statements.
| | | | |
| Western Asset High Yield Fund 2012 Annual Report | | | 17 | |
Western Asset High Yield Fund
| | | | | | | | | | | | | | |
| Security | | Rate | | | Maturity
Date | | Face
Amount† | | | Value | |
Oil, Gas & Consumable Fuels — continued | | | | | | | | | | | |
Atlas Pipeline Partners LP/Atlas Pipeline Finance Corp., Senior Notes | | | 6.625 | % | | 10/1/20 | | | 500,000 | | | $ | 517,500 | (a) |
Berry Petroleum Co., Senior Notes | | | 6.375 | % | | 9/15/22 | | | 1,190,000 | | | | 1,237,600 | |
Calumet Specialty Products Partners LP/Calumet Finance Corp., Senior Notes | | | 9.375 | % | | 5/1/19 | | | 1,250,000 | | | | 1,356,250 | |
Calumet Specialty Products Partners LP/Calumet Finance Corp., Senior Notes | | | 9.375 | % | | 5/1/19 | | | 270,000 | | | | 292,950 | |
Calumet Specialty Products Partners LP/Calumet Finance Corp., Senior Notes | | | 9.625 | % | | 8/1/20 | | | 650,000 | | | | 706,875 | (a) |
Carrizo Oil & Gas Inc., Senior Notes | | | 7.500 | % | | 9/15/20 | | | 780,000 | | | | 801,450 | |
Chesapeake Energy Corp., Senior Notes | | | 7.250 | % | | 12/15/18 | | | 1,310,000 | | | | 1,427,900 | |
Chesapeake Midstream Partners LP/CHKM Finance Corp., Senior Notes | | | 5.875 | % | | 4/15/21 | | | 450,000 | | | | 478,125 | |
Chesapeake Midstream Partners LP/CHKM Finance Corp., Senior Notes | | | 6.125 | % | | 7/15/22 | | | 500,000 | | | | 538,750 | |
Chesapeake Oilfield Operating LLC/Chesapeake Oilfield Finance Inc., Senior Notes | | | 6.625 | % | | 11/15/19 | | | 2,310,000 | | | | 2,177,175 | (a) |
Compagnie Generale de Geophysique-Veritas, Senior Notes | | | 9.500 | % | | 5/15/16 | | | 1,625,000 | | | | 1,742,813 | |
Comstock Resources Inc., Senior Notes | | | 9.500 | % | | 6/15/20 | | | 990,000 | | | | 1,064,250 | |
Concho Resources Inc., Senior Notes | | | 7.000 | % | | 1/15/21 | | | 1,460,000 | | | | 1,627,900 | |
CONSOL Energy Inc., Senior Notes | | | 8.250 | % | | 4/1/20 | | | 1,670,000 | | | | 1,807,775 | |
CONSOL Energy Inc., Senior Notes | | | 6.375 | % | | 3/1/21 | | | 70,000 | | | | 71,750 | |
Continental Resources Inc., Senior Notes | | | 7.125 | % | | 4/1/21 | | | 250,000 | | | | 282,500 | |
Continental Resources Inc., Senior Notes | | | 5.000 | % | | 9/15/22 | | | 4,690,000 | | | | 5,053,475 | |
Corral Petroleum Holdings AB, Senior Notes | | | 15.000 | % | | 12/31/17 | | | 2,173,318 | | | | 1,689,755 | (a)(b)(e) |
Crosstex Energy LP/Crosstex Energy Finance Corp., Senior Notes | | | 8.875 | % | | 2/15/18 | | | 1,560,000 | | | | 1,684,800 | |
Crosstex Energy LP/Crosstex Energy Finance
Corp., Senior Notes | | | 7.125 | % | | 6/1/22 | | | 560,000 | | | | 583,800 | (a) |
CVR Refining LLC/Coffeyville Finance Inc., Senior
Secured Notes | | | 6.500 | % | | 11/1/22 | | | 970,000 | | | | 965,150 | (a) |
Denbury Resources Inc. | | | 9.750 | % | | 3/1/16 | | | 750,000 | | | | 795,000 | |
Denbury Resources Inc., Senior Subordinated Notes | | | 8.250 | % | | 2/15/20 | | | 732,000 | | | | 823,500 | |
Energy Transfer Equity LP, Senior Notes | | | 7.500 | % | | 10/15/20 | | | 860,000 | | | | 993,300 | |
Enterprise Products Operating LLP, Subordinated
Notes | | | 7.034 | % | | 1/15/68 | | | 560,000 | | | | 641,200 | (g) |
EPE Holdings LLC/EP Energy Bond Co. Inc., Senior
Notes | | | 8.125 | % | | 12/15/17 | | | 1,120,000 | | | | 1,110,200 | (a)(e) |
EXCO Resources Inc., Senior Notes | | | 7.500 | % | | 9/15/18 | | | 1,460,000 | | | | 1,416,200 | |
Halcon Resources Corp., Senior Notes | | | 9.750 | % | | 7/15/20 | | | 1,520,000 | | | | 1,641,600 | (a) |
See Notes to Financial Statements.
| | |
| 18 | | Western Asset High Yield Fund 2012 Annual Report |
Schedule of investments (cont’d)
December 31, 2012
Western Asset High Yield Fund
| | | | | | | | | | | | | | |
| Security | | Rate | | | Maturity
Date | | Face
Amount† | | | Value | |
Oil, Gas & Consumable Fuels — continued | | | | | | | | | | | |
Halcon Resources Corp., Senior Notes | | | 8.875 | % | | 5/15/21 | | | 860,000 | | | $ | 911,600 | (a) |
Hiland Partners LP/Hiland Partners Finance Corp., Senior Notes | | | 7.250 | % | | 10/1/20 | | | 560,000 | | | | 599,200 | (a) |
Holly Energy Partners LP/Holly Energy Finance Corp., Senior Notes | | | 6.500 | % | | 3/1/20 | | | 2,250,000 | | | | 2,407,500 | (a) |
Kodiak Oil & Gas Corp., Senior Notes | | | 8.125 | % | | 12/1/19 | | | 1,360,000 | | | | 1,499,400 | |
Magnum Hunter Resources Corp., Senior Notes | | | 9.750 | % | | 5/15/20 | | | 1,090,000 | | | | 1,130,875 | (a) |
Magnum Hunter Resources Corp., Senior Notes | | | 9.750 | % | | 5/15/20 | | | 890,000 | | | | 923,375 | (a) |
MarkWest Energy Partners LP/MarkWest Energy Finance Corp., Senior Notes | | | 6.750 | % | | 11/1/20 | | | 140,000 | | | | 152,600 | |
MarkWest Energy Partners LP/MarkWest Energy Finance Corp., Senior Notes | | | 6.500 | % | | 8/15/21 | | | 620,000 | | | | 677,350 | |
MarkWest Energy Partners LP/MarkWest Energy Finance Corp., Senior Notes | | | 6.250 | % | | 6/15/22 | | | 1,850,000 | | | | 2,016,500 | |
MEG Energy Corp., Senior Notes | | | 6.500 | % | | 3/15/21 | | | 1,020,000 | | | | 1,073,550 | (a) |
MEG Energy Corp., Senior Notes | | | 6.375 | % | | 1/30/23 | | | 1,980,000 | | | | 2,064,150 | (a) |
Milagro Oil & Gas Inc., Secured Notes | | | 10.500 | % | | 5/15/16 | | | 1,430,000 | | | | 1,058,200 | |
Overseas Shipholding Group Inc., Senior Notes | | | 8.750 | % | | 12/1/13 | | | 500,000 | | | | 177,500 | (f) |
Overseas Shipholding Group Inc., Senior Notes | | | 8.125 | % | | 3/30/18 | | | 1,460,000 | | | | 518,300 | (f) |
Pacific Drilling V Ltd., Senior Secured Notes | | | 7.250 | % | | 12/1/17 | | | 1,340,000 | | | | 1,390,250 | (a) |
Peabody Energy Corp., Senior Notes | | | 7.875 | % | | 11/1/26 | | | 1,430,000 | | | | 1,544,400 | |
Pioneer Energy Services Corp., Senior Notes | | | 9.875 | % | | 3/15/18 | | | 200,000 | | | | 217,500 | |
Plains Exploration & Production Co., Senior Notes | | | 6.125 | % | | 6/15/19 | | | 710,000 | | | | 773,900 | |
Plains Exploration & Production Co., Senior Notes | | | 8.625 | % | | 10/15/19 | | | 2,390,000 | | | | 2,718,625 | |
Plains Exploration & Production Co., Senior Notes | | | 6.750 | % | | 2/1/22 | | | 1,260,000 | | | | 1,414,350 | |
PT Adaro Indonesia, Senior Notes | | | 7.625 | % | | 10/22/19 | | | 700,000 | | | | 777,000 | (a) |
QEP Resources Inc., Senior Notes | | | 5.375 | % | | 10/1/22 | | | 750,000 | | | | 804,375 | |
Quicksilver Resources Inc., Senior Notes | | | 11.750 | % | | 1/1/16 | | | 4,355,000 | | | | 4,300,562 | |
Range Resources Corp., Senior Notes | | | 5.000 | % | | 8/15/22 | | | 540,000 | | | | 564,300 | |
Range Resources Corp., Senior Subordinated Notes | | | 8.000 | % | | 5/15/19 | | | 150,000 | | | | 166,125 | |
Range Resources Corp., Senior Subordinated Notes | | | 5.750 | % | | 6/1/21 | | | 290,000 | | | | 310,300 | |
Regency Energy Partners LP/Regency Energy Finance Corp., Senior Notes | | | 6.500 | % | | 7/15/21 | | | 380,000 | | | | 416,100 | |
Regency Energy Partners LP/Regency Energy Finance Corp., Senior Notes | | | 5.500 | % | | 4/15/23 | | | 170,000 | | | | 181,475 | |
Samson Investment Co., Senior Notes | | | 9.750 | % | | 2/15/20 | | | 3,720,000 | | | | 3,933,900 | (a) |
SandRidge Energy Inc., Senior Notes | | | 7.500 | % | | 3/15/21 | | | 580,000 | | | | 620,600 | |
SandRidge Energy Inc., Senior Notes | | | 7.500 | % | | 2/15/23 | | | 930,000 | | | | 995,100 | |
Shelf Drilling Holdings Ltd., Senior Secured Notes | | | 8.625 | % | | 11/1/18 | | | 880,000 | | | | 902,000 | (a) |
See Notes to Financial Statements.
| | | | |
| Western Asset High Yield Fund 2012 Annual Report | | | 19 | |
Western Asset High Yield Fund
| | | | | | | | | | | | | | |
| Security | | Rate | | | Maturity
Date | | Face
Amount† | | | Value | |
Oil, Gas & Consumable Fuels — continued | | | | | | | | | | | |
Sidewinder Drilling Inc., Senior Notes | | | 9.750 | % | | 11/15/19 | | | 550,000 | | | $ | 552,750 | (a) |
Targa Resources Partners LP/Targa Resources Partners Finance Corp., Senior Notes | | | 6.375 | % | | 8/1/22 | | | 1,090,000 | | | | 1,188,100 | (a) |
Targa Resources Partners LP/Targa Resources Partners Finance Corp., Senior Notes | | | 5.250 | % | | 5/1/23 | | | 110,000 | | | | 113,850 | (a) |
Teekay Corp., Senior Notes | | | 8.500 | % | | 1/15/20 | | | 1,970,000 | | | | 2,078,350 | |
Tesoro Logistics LP/Tesoro Logistics Finance Corp., Senior Notes | | | 5.875 | % | | 10/1/20 | | | 1,000,000 | | | | 1,037,500 | (a) |
Xinergy Ltd., Senior Secured Notes | | | 9.250 | % | | 5/15/19 | | | 2,270,000 | | | | 1,316,600 | (a) |
Total Oil, Gas & Consumable Fuels | | | | | | | | | | | | | 81,518,055 | |
Total Energy | | | | | | | | | | | | | 98,227,855 | |
| Financials — 6.4% | | | | | | | | | | | | | | |
Capital Markets — 0.6% | | | | | | | | | | | | | | |
Onex USI Acquisition Corp., Senior Notes | | | 7.750 | % | | 1/15/21 | | | 1,300,000 | | | | 1,280,500 | (a) |
UBS AG Stamford CT, Subordinated Notes | | | 7.625 | % | | 8/17/22 | | | 1,630,000 | | | | 1,800,395 | |
Total Capital Markets | | | | | | | | | | | | | 3,080,895 | |
Commercial Banks — 2.5% | | | | | | | | | | | | | | |
Barclays Bank PLC, Subordinated Notes | | | 10.179 | % | | 6/12/21 | | | 1,740,000 | | | | 2,368,871 | (a) |
BBVA US Senior SAU, Senior Notes | | | 4.664 | % | | 10/9/15 | | | 720,000 | | | | 738,228 | |
CIT Group Inc., Senior Notes | | | 4.250 | % | | 8/15/17 | | | 3,120,000 | | | | 3,212,795 | |
CIT Group Inc., Senior Notes | | | 5.500 | % | | 2/15/19 | | | 110,000 | | | | 119,900 | (a) |
Credit Agricole SA, Subordinated Notes | | | 8.375 | % | | 10/13/19 | | | 960,000 | | | | 1,017,600 | (a)(g)(h) |
Intesa Sanpaolo SpA, Senior Notes | | | 3.625 | % | | 8/12/15 | | | 1,310,000 | | | | 1,310,773 | (a) |
Rabobank Nederland NV, Junior Subordinated Notes | | | 11.000 | % | | 6/30/19 | | | 540,000 | | | | 730,350 | (a)(g)(h) |
Royal Bank of Scotland Group PLC, Junior Subordinated Bonds | | | 7.648 | % | | 9/30/31 | | | 1,260,000 | | | | 1,272,600 | (g)(h) |
Royal Bank of Scotland Group PLC, Subordinated Notes | | | 5.000 | % | | 10/1/14 | | | 390,000 | | | | 400,728 | |
Santander Finance Preferred SA Unipersonal, Junior Subordinated Notes | | | 10.500 | % | | 9/29/14 | | | 990,000 | | | | 1,039,607 | (g)(h) |
Societe Generale SA, Junior Subordinated Bonds | | | 1.103 | % | | 4/5/17 | | | 1,850,000 | | | | 1,005,586 | (a)(g)(h) |
Total Commercial Banks | | | | | | | | | | | | | 13,217,038 | |
Consumer Finance — 0.9% | | | | | | | | | | | | | | |
Ally Financial Inc., Senior Notes | | | 4.625 | % | | 6/26/15 | | | 1,380,000 | | | | 1,438,617 | |
Ally Financial Inc., Senior Notes | | | 5.500 | % | | 2/15/17 | | | 750,000 | | | | 802,322 | |
Ally Financial Inc., Senior Notes | | | 8.000 | % | | 3/15/20 | | | 870,000 | | | | 1,065,750 | |
GMAC International Finance BV, Senior Bonds | | | 7.500 | % | | 4/21/15 | | | 820,000 | EUR | | | 1,184,102 | |
Total Consumer Finance | | | | | | | | | | | | | 4,490,791 | |
See Notes to Financial Statements.
| | |
| 20 | | Western Asset High Yield Fund 2012 Annual Report |
Schedule of investments (cont’d)
December 31, 2012
Western Asset High Yield Fund
| | | | | | | | | | | | | | |
| Security | | Rate | | | Maturity
Date | | Face
Amount† | | | Value | |
Diversified Financial Services — 1.9% | | | | | | | | | | | | | | |
Bankrate Inc., Senior Secured Notes | | | 11.750 | % | | 7/15/15 | | | 2,379,000 | | | $ | 2,625,821 | |
International Lease Finance Corp., Senior Notes | | | 8.625 | % | | 9/15/15 | | | 600,000 | | | | 674,250 | |
International Lease Finance Corp., Senior Notes | | | 8.750 | % | | 3/15/17 | | | 900,000 | | | | 1,039,500 | |
International Lease Finance Corp., Senior Notes | | | 8.875 | % | | 9/1/17 | | | 530,000 | | | | 622,793 | |
Nationstar Mortgage LLC/Nationstar Capital Corp., Senior Notes | | | 7.875 | % | | 10/1/20 | | | 1,600,000 | | | | 1,688,000 | (a) |
TransUnion Holding Co. Inc., Senior Notes | | | 8.125 | % | | 6/15/18 | | | 460,000 | | | | 474,950 | (a)(e) |
TransUnion Holding Co. Inc., Senior Notes | | | 9.625 | % | | 6/15/18 | | | 1,340,000 | | | | 1,417,050 | |
ZFS Finance USA Trust II, Bonds | | | 6.450 | % | | 12/15/65 | | | 1,390,000 | | | | 1,487,300 | (a)(g) |
Total Diversified Financial Services | | | | | | | | | | | | | 10,029,664 | |
Insurance — 0.4% | | | | | | | | | | | | | | |
A-S Co-Issuer Subsidiary Inc./A-S Merger Subsidiary LLC, Senior Notes | | | 7.875 | % | | 12/15/20 | | | 640,000 | | | | 640,000 | (a) |
ING Capital Funding Trust III, Junior Subordinated Bonds | | | 3.911 | % | | 3/31/13 | | | 490,000 | | | | 465,192 | (g)(h) |
Liberty Mutual Group Inc., Junior Subordinated Bonds | | | 7.800 | % | | 3/15/37 | | | 830,000 | | | | 923,375 | (a) |
Total Insurance | | | | | | | | | | | | | 2,028,567 | |
Real Estate Investment Trusts (REITs) — 0.1% | | | | | | | | |
Omega Healthcare Investors Inc., Senior Notes | | | 5.875 | % | | 3/15/24 | | | 690,000 | | | | 731,400 | |
Total Financials | | | | | | | | | | | | | 33,578,355 | |
| Health Care — 3.9% | | | | | | | | | | | | | | |
Health Care Equipment & Supplies — 0.1% | | | | | | | | |
Hologic Inc., Senior Notes | | | 6.250 | % | | 8/1/20 | | | 680,000 | | | | 732,700 | (a) |
Health Care Providers & Services — 3.5% | | | | | | | | |
Acadia Healthcare Co. Inc., Senior Notes | | | 12.875 | % | | 11/1/18 | | | 1,190,000 | | | | 1,439,900 | |
American Renal Holdings, Senior Secured Notes | | | 8.375 | % | | 5/15/18 | | | 280,000 | | | | 294,700 | |
AMERIGROUP Corp., Senior Notes | | | 7.500 | % | | 11/15/19 | | | 247,000 | | | | 296,400 | |
CHS/Community Health Systems Inc., Senior Notes | | | 8.000 | % | | 11/15/19 | | | 470,000 | | | | 508,775 | |
CHS/Community Health Systems Inc., Senior Notes | | | 7.125 | % | | 7/15/20 | | | 910,000 | | | | 971,425 | |
CHS/Community Health Systems Inc., Senior Secured Notes | | | 5.125 | % | | 8/15/18 | | | 410,000 | | | | 427,425 | |
CRC Health Corp., Senior Subordinated Notes | | | 10.750 | % | | 2/1/16 | | | 2,570,000 | | | | 2,505,750 | |
DJO Finance LLC/DJO Finance Corp., Senior Notes | | | 9.875 | % | | 4/15/18 | | | 810,000 | | | | 836,325 | (a) |
ExamWorks Group Inc., Senior Notes | | | 9.000 | % | | 7/15/19 | | | 830,000 | | | | 888,100 | |
Fresenius Medical Care U.S. Finance II Inc., Senior Notes | | | 5.875 | % | | 1/31/22 | | | 860,000 | | | | 933,100 | (a) |
HCA Inc., Notes | | | 7.690 | % | | 6/15/25 | | | 1,675,000 | | | | 1,712,687 | |
HCA Inc., Senior Secured Notes | | | 5.875 | % | | 3/15/22 | | | 1,900,000 | | | | 2,066,250 | |
INC Research LLC, Senior Notes | | | 11.500 | % | | 7/15/19 | | | 510,000 | | | | 527,850 | (a) |
See Notes to Financial Statements.
| | | | |
| Western Asset High Yield Fund 2012 Annual Report | | | 21 | |
Western Asset High Yield Fund
| | | | | | | | | | | | | | |
| Security | | Rate | | | Maturity
Date | | Face
Amount† | | | Value | |
Health Care Providers & Services — continued | | | | | | | | |
Physiotherapy Associates Holdings Inc., Senior Notes | | | 11.875 | % | | 5/1/19 | | | 400,000 | | | $ | 356,000 | (a) |
Tenet Healthcare Corp., Senior Secured Notes | | | 6.250 | % | | 11/1/18 | | | 1,000,000 | | | | 1,097,500 | |
Tenet Healthcare Corp., Senior Secured Notes | | | 8.875 | % | | 7/1/19 | | | 1,500,000 | | | | 1,680,000 | |
Tenet Healthcare Corp., Senior Secured Notes | | | 4.750 | % | | 6/1/20 | | | 1,550,000 | | | | 1,573,250 | (a) |
US Oncology Inc. Escrow | | | — | | | — | | | 1,190,000 | | | | 22,313 | * |
Vanguard Health Holdings Co., II LLC, Senior Notes | | | 8.000 | % | | 2/1/18 | | | 195,000 | | | | 201,825 | |
Total Health Care Providers & Services | | | | | | | 18,339,575 | |
Pharmaceuticals — 0.3% | | | | | | | | | | | | | | |
Valeant Pharmaceuticals International, Senior Notes | | | 6.375 | % | | 10/15/20 | | | 990,000 | | | | 1,061,775 | (a) |
VPI Escrow Corp., Senior Notes | | | 6.375 | % | | 10/15/20 | | | 480,000 | | | | 514,800 | (a) |
Total Pharmaceuticals | | | | | | | | | | 1,576,575 | |
Total Health Care | | | | | | | | | | | | | 20,648,850 | |
| Industrials — 14.0% | | | | | | | | | | | | | | |
Aerospace & Defense — 1.7% | | | | | | | | | | | |
Ducommun Inc., Senior Notes | | | 9.750 | % | | 7/15/18 | | | 1,020,000 | | | | 1,096,500 | |
Kratos Defense & Security Solutions Inc., Senior Secured Notes | | | 10.000 | % | | 6/1/17 | | | 3,030,000 | | | | 3,325,425 | |
Triumph Group Inc., Senior Notes | | | 8.625 | % | | 7/15/18 | | | 285,000 | | | | 316,350 | |
Wyle Services Corp., Senior Subordinated Notes | | | 10.500 | % | | 4/1/18 | | | 3,840,000 | | | | 4,185,600 | (a) |
Total Aerospace & Defense | | | | | | | | | | | | | 8,923,875 | |
Airlines — 1.6% | | | | | | | | | | | | | | |
American Airlines Pass-Through Trust, Secured Notes | | | 7.000 | % | | 1/31/18 | | | 858,957 | | | | 889,020 | (a) |
Continental Airlines Inc., Pass-Through Certificates | | | 7.373 | % | | 12/15/15 | | | 386,122 | | | | 410,255 | |
Continental Airlines Inc., Pass-Through Certificates | | | 9.250 | % | | 5/10/17 | | | 1,073,157 | | | | 1,172,424 | |
Continental Airlines Inc., Pass-Through Certificates | | | 8.388 | % | | 11/1/20 | | | 615,877 | | | | 652,830 | |
Continental Airlines Inc., Pass-Through Certificates, Senior Secured Notes | | | 6.125 | % | | 4/29/18 | | | 730,000 | | | | 735,475 | |
Continental Airlines Inc., Pass-Through Certificates, Subordinated Secured Notes | | | 7.339 | % | | 4/19/14 | | | 667,041 | | | | 693,723 | |
DAE Aviation Holdings Inc., Senior Notes | | | 11.250 | % | | 8/1/15 | | | 1,392,000 | | | | 1,430,280 | (a) |
Delta Air Lines Inc., Pass-Through Certificates | | | 8.954 | % | | 8/10/14 | | | 234,054 | | | | 242,526 | |
Delta Air Lines Inc., Pass-Through Certificates | | | 6.821 | % | | 8/10/22 | | | 780,664 | | | | 871,378 | |
Delta Air Lines Inc., Pass-Through Certificates, Subordinated Secured Notes | | | 9.750 | % | | 12/17/16 | | | 467,582 | | | | 523,691 | |
Delta Air Lines Inc., Secured Notes | | | 6.375 | % | | 1/2/16 | | | 230,000 | | | | 239,200 | (a) |
Delta Air Lines Inc., Pass-Through Trust, Secured Notes | | | 6.875 | % | | 5/7/19 | | | 480,000 | | | | 499,800 | (a) |
Total Airlines | | | | | | | | | | | | | 8,360,602 | |
See Notes to Financial Statements.
| | |
| 22 | | Western Asset High Yield Fund 2012 Annual Report |
Schedule of investments (cont’d)
December 31, 2012
Western Asset High Yield Fund
| | | | | | | | | | | | | | |
| Security | | Rate | | | Maturity
Date | | Face
Amount† | | | Value | |
Building Products — 0.5% | | | | | | | | | | | | | | |
Ashton Woods USA LLC/Ashton Woods Finance Co., Senior Subordinated Notes | | | 11.000 | % | | 6/30/15 | | | 1,223,200 | | | $ | 1,210,968 | (a)(c) |
Building Materials Corp. of America, Senior Notes | | | 6.875 | % | | 8/15/18 | | | 640,000 | | | | 691,200 | (a) |
Building Materials Corp. of America, Senior Notes | | | 6.750 | % | | 5/1/21 | | | 480,000 | | | | 530,400 | (a) |
Building Materials Corp. of America, Senior Secured Notes | | | 7.000 | % | | 2/15/20 | | | 190,000 | | | | 207,100 | (a) |
Total Building Products | | | | | | | | | | | | | 2,639,668 | |
Commercial Services & Supplies — 2.4% | | | | | | | | | | | |
Algeco Scotsman Global Finance PLC, Senior Notes | | | 10.750 | % | | 10/15/19 | | | 1,320,000 | | | | 1,300,200 | (a) |
Altegrity Inc., Senior Subordinated Notes | | | 11.750 | % | | 5/1/16 | | | 2,900,000 | | | | 2,146,000 | (a) |
American Reprographics Co., Senior Notes | | | 10.500 | % | | 12/15/16 | | | 2,260,000 | | | | 2,220,450 | |
Geo Group Inc., Senior Notes | | | 7.750 | % | | 10/15/17 | | | 585,000 | | | | 628,875 | |
JM Huber Corp., Senior Notes | | | 9.875 | % | | 11/1/19 | | | 450,000 | | | | 499,500 | (a) |
Monitronics International Inc., Senior Notes | | | 9.125 | % | | 4/1/20 | | | 2,630,000 | | | | 2,708,900 | |
Taylor Morrison Communities Inc./Monarch Communities Inc., Senior Notes | | | 7.750 | % | | 4/15/20 | | | 2,868,000 | | | | 3,040,080 | (a) |
Total Commercial Services & Supplies | | | | | | | | | | | | | 12,544,005 | |
Construction & Engineering — 0.5% | | | | | | | | | | | | | | |
Ausdrill Finance Pty Ltd., Senior Notes | | | 6.875 | % | | 11/1/19 | | | 1,510,000 | | | | 1,494,900 | (a) |
PH Holding LLC, Secured Notes | | | 9.750 | % | | 12/31/17 | | | 1,000,000 | | | | 986,432 | (b)(c) |
Total Construction & Engineering | | | | | | | | | | | | | 2,481,332 | |
Electrical Equipment — 1.0% | | | | | | | | | | | | | | |
313 Group Inc., Senior Secured Notes | | | 6.375 | % | | 12/1/19 | | | 1,270,000 | | | | 1,258,888 | (a) |
Belden Inc., Senior Subordinated Notes | | | 5.500 | % | | 9/1/22 | | | 1,160,000 | | | | 1,191,900 | (a) |
International Wire Group Holdings Inc., Senior Secured Notes | | | 8.500 | % | | 10/15/17 | | | 1,020,000 | | | | 1,030,200 | (a) |
NES Rentals Holdings Inc., Senior Secured Notes | | | 12.250 | % | | 4/15/15 | | | 1,515,000 | | | | 1,564,237 | (a) |
Total Electrical Equipment | | | | | | | | | | | | | 5,045,225 | |
Machinery — 1.7% | | | | | | | | | | | | | | |
Cleaver-Brooks Inc., Senior Secured Notes | | | 8.750 | % | | 12/15/19 | | | 450,000 | | | | 464,625 | (a) |
Dematic SA, Senior Secured Notes | | | 8.750 | % | | 5/1/16 | | | 1,920,000 | | | | 2,052,000 | (a) |
Dematic SA/DH Services Luxembourg Sarl, Senior Notes | | | 7.750 | % | | 12/15/20 | | | 2,070,000 | | | | 2,070,000 | (a) |
Global Brass and Copper Inc., Senior Secured Notes | | | 9.500 | % | | 6/1/19 | | | 1,050,000 | | | | 1,136,625 | (a) |
Mirror PIK SA, Senior Notes | | | 9.000 | % | | 11/1/16 | | | 1,640,000 | | | | 1,656,400 | (a)(e) |
Silver II Borrower/Silver II U.S. Holdings LLC, Senior Notes | | | 7.750 | % | | 12/15/20 | | | 740,000 | | | | 765,900 | (a) |
SPL Logistics Escrow LLC, Senior Secured Notes | | | 8.875 | % | | 8/1/20 | | | 960,000 | | | | 1,017,600 | (a) |
Total Machinery | | | | | | | | | | | | | 9,163,150 | |
See Notes to Financial Statements.
| | | | |
| Western Asset High Yield Fund 2012 Annual Report | | | 23 | |
Western Asset High Yield Fund
| | | | | | | | | | | | | | |
| Security | | Rate | | | Maturity
Date | | Face
Amount† | | | Value | |
Marine — 0.6% | | | | | | | | | | | | | | |
Horizon Lines LLC, Secured Notes | | | 13.000 | % | | 10/15/16 | | | 800,471 | | | $ | 718,423 | |
Horizon Lines LLC, Senior Secured Notes | | | 11.000 | % | | 10/15/16 | | | 1,259,000 | | | | 1,246,410 | |
Navios Maritime Acquisition Corp./Navios Acquisition Finance U.S. Inc., Senior Secured Notes | | | 8.625 | % | | 11/1/17 | | | 1,570,000 | | | | 1,471,875 | |
Total Marine | | | | | | | | | | | | | 3,436,708 | |
Road & Rail — 1.9% | | | | | | | | | | | | | | |
Florida East Coast Holdings Corp., Senior Notes | | | 10.500 | % | | 8/1/17 | | | 2,731,428 | | | | 2,704,114 | (e) |
HDTFS Inc., Senior Notes | | | 6.250 | % | | 10/15/22 | | | 570,000 | | | | 607,050 | (a) |
Jack Cooper Holdings Corp., Senior
Secured Notes | | | 13.750 | % | | 12/15/15 | | | 2,227,000 | | | | 2,371,755 | (a) |
Kansas City Southern de Mexico, Senior Notes | | | 12.500 | % | | 4/1/16 | | | 3,787,000 | | | | 4,127,830 | |
Total Road & Rail | | | | | | | | | | | | | 9,810,749 | |
Trading Companies & Distributors — 0.7% | | | | | | | | |
Ashtead Capital Inc., Senior Secured Notes | | | 6.500 | % | | 7/15/22 | | | 1,330,000 | | | | 1,443,050 | (a) |
H&E Equipment Services Inc., Senior Notes | | | 7.000 | % | | 9/1/22 | | | 1,380,000 | | | | 1,469,700 | (a) |
UR Financing Escrow Corp., Senior Notes | | | 7.625 | % | | 4/15/22 | | | 894,000 | | | | 999,045 | (a) |
Total Trading Companies & Distributors | | | | | | | 3,911,795 | |
Transportation — 1.3% | | | | | | | | | | | | | | |
CMA CGM, Senior Notes | | | 8.500 | % | | 4/15/17 | | | 2,560,000 | | | | 2,041,600 | (a) |
Hapag-Lloyd AG, Senior Notes | | | 9.750 | % | | 10/15/17 | | | 1,700,000 | | | | 1,708,500 | (a) |
Syncreon Global Ireland Ltd./Syncreon Global Finance US Inc., Senior Notes | | | 9.500 | % | | 5/1/18 | | | 2,910,000 | | | | 3,026,400 | (a) |
Syncreon Global Ireland Ltd./Syncreon Global Finance US Inc., Senior Notes | | | 9.500 | % | | 5/1/18 | | | 30,000 | | | | 31,200 | (a) |
Total Transportation | | | | | | | | | | | | | 6,807,700 | |
Transportation Infrastructure — 0.1% | | | | | | | | | | | |
Aguila 3 SA, Senior Secured Notes | | | 7.875 | % | | 1/31/18 | | | 770,000 | | | | 816,200 | (a) |
Total Industrials | | | | | | | | | | | | | 73,941,009 | |
| Information Technology — 1.9% | | | | | | | | | | | |
Communications Equipment — 0.2% | | | | | | | | | | | |
CyrusOne LP/CyrusOne Finance Corp., Senior Notes | | | 6.375 | % | | 11/15/22 | | | 1,110,000 | | | | 1,157,175 | (a) |
Electronic Equipment, Instruments & Components — 0.1% | | | | | | | | |
NXP BV/NXP Funding LLC, Senior Secured Notes | | | 9.750 | % | | 8/1/18 | | | 377,000 | | | | 436,848 | (a) |
Internet Software & Services — 0.2% | | | | | | | | | | | | | | |
Zayo Group LLC/Zayo Capital Inc., Senior
Secured Notes | | | 8.125 | % | | 1/1/20 | | | 860,000 | | | | 956,750 | |
IT Services — 0.7% | | | | | | | | | | | | | | |
First Data Corp., Secured Notes | | | 8.250 | % | | 1/15/21 | | | 1,000,000 | | | | 1,000,000 | (a) |
First Data Corp., Senior Notes | | | 9.875 | % | | 9/24/15 | | | 790,000 | | | | 805,800 | |
See Notes to Financial Statements.
| | |
| 24 | | Western Asset High Yield Fund 2012 Annual Report |
Schedule of investments (cont’d)
December 31, 2012
Western Asset High Yield Fund
| | | | | | | | | | | | | | |
| Security | | Rate | | | Maturity
Date | | Face
Amount† | | | Value | |
IT Services — continued | | | | | | | | | | | | | | |
First Data Corp., Senior Notes | | | 10.550 | % | | 9/24/15 | | | 888,501 | | | $ | 909,603 | |
First Data Corp., Senior Secured Notes | | | 6.750 | % | | 11/1/20 | | | 1,210,000 | | | | 1,222,100 | (a) |
Total IT Services | | | | | | | | | | | | | 3,937,503 | |
Semiconductors & Semiconductor Equipment — 0.1% | | | | | | | | |
Advanced Micro Devices Inc., Senior Notes | | | 7.500 | % | | 8/15/22 | | | 330,000 | | | | 271,425 | (a) |
Software — 0.6% | | | | | | | | | | | | | | |
Legend Acquisition Sub Inc., Senior Notes | | | 10.750 | % | | 8/15/20 | | | 550,000 | | | | 497,750 | (a) |
Nuance Communications Inc., Senior Notes | | | 5.375 | % | | 8/15/20 | | | 2,360,000 | | | | 2,466,200 | (a) |
Total Software | | | | | | | | | | | | | 2,963,950 | |
Total Information Technology | | | | | | | | | | | | | 9,723,651 | |
| Materials — 10.2% | | | | | | | | | | | | | | |
Chemicals — 1.7% | | | | | | | | | | | | | | |
INEOS Group Holdings SA, Senior Notes | | | 7.875 | % | | 2/15/16 | | | 636,000 | EUR | | | 832,353 | (a) |
Kerling PLC, Senior Secured Notes | | | 10.625 | % | | 2/1/17 | | | 724,000 | EUR | | | 917,418 | (a) |
Kloeckner Pentaplast GmbH & Co. KG, Senior
Secured Notes | | | 11.625 | % | | 7/15/17 | | | 440,000 | EUR | | | 644,664 | (a) |
Kloeckner Pentaplast GmbH & Co. KG, Senior
Secured Notes | | | 11.625 | % | | 7/15/17 | | | 330,000 | EUR | | | 483,498 | (a) |
LyondellBasell Industries NV, Senior Notes | | | 5.000 | % | | 4/15/19 | | | 930,000 | | | | 1,027,650 | |
LyondellBasell Industries NV, Senior Notes | | | 6.000 | % | | 11/15/21 | | | 2,190,000 | | | | 2,567,775 | |
LyondellBasell Industries NV, Senior Notes | | | 5.750 | % | | 4/15/24 | | | 930,000 | | | | 1,092,750 | |
Nufarm Australia Ltd., Senior Notes | | | 6.375 | % | | 10/15/19 | | | 500,000 | | | | 522,500 | (a) |
Styrolution Group GmbH, Senior Secured Notes | | | 7.625 | % | | 5/15/16 | | | 608,000 | EUR | | | 836,638 | (a) |
Total Chemicals | | | | | | | | | | | | | 8,925,246 | |
Containers & Packaging — 2.8% | | | | | | | | | | | | | | |
Ardagh Packaging Finance PLC, Senior Notes | | | 9.125 | % | | 10/15/20 | | | 1,590,000 | | | | 1,733,100 | (a) |
Ardagh Packaging Finance PLC, Senior Secured Notes | | | 7.375 | % | | 10/15/17 | | | 640,000 | EUR | | | 919,531 | (a) |
Ardagh Packaging Finance PLC/Ardagh MP Holdings USA Inc., Senior Notes | | | 9.125 | % | | 10/15/20 | | | 710,000 | | | | 770,350 | (a) |
Ardagh Packaging Finance PLC/Ardagh MP Holdings USA Inc., Senior Secured Notes | | | 7.375 | % | | 10/15/17 | | | 690,000 | | | | 749,512 | (a) |
Beverage Packaging Holdings Luxembourg II SA, Senior Secured Notes | | | 9.500 | % | | 6/15/17 | | | 1,850,000 | EUR | | | 2,539,585 | (a) |
Longview Fibre Paper & Packaging Inc., Senior Secured Notes | | | 8.000 | % | | 6/1/16 | | | 1,580,000 | | | | 1,659,000 | (a) |
Reynolds Group Issuer Inc./Reynolds Group Issuer LLC/Reynolds Group Issuer (Luxembourg) SA,
Senior Notes | | | 9.000 | % | | 4/15/19 | | | 1,570,000 | | | | 1,632,800 | |
See Notes to Financial Statements.
| | | | |
| Western Asset High Yield Fund 2012 Annual Report | | | 25 | |
Western Asset High Yield Fund
| | | | | | | | | | | | | | |
| Security | | Rate | | | Maturity
Date | | Face
Amount† | | | Value | |
Containers & Packaging — continued | | | | | | | | | | | | | | |
Reynolds Group Issuer Inc./Reynolds Group Issuer LLC/Reynolds Group Issuer (Luxembourg) SA,
Senior Notes | | | 9.875 | % | | 8/15/19 | | | 980,000 | | | $ | 1,048,600 | |
Reynolds Group Issuer Inc./Reynolds Group Issuer LLC/Reynolds Group Issuer (Luxembourg) SA, Senior Secured Notes | | | 5.750 | % | | 10/15/20 | | | 1,900,000 | | | | 1,961,750 | (a) |
Viskase Cos. Inc., Senior Secured Notes | | | 9.875 | % | | 1/15/18 | | | 2,000,000 | | | | 2,040,000 | (a) |
Total Containers & Packaging | | | | | | | | | | | | | 15,054,228 | |
Metals & Mining — 4.4% | | | | | | | | | | | | | | |
ArcelorMittal, Senior Notes | | | 5.000 | % | | 2/25/17 | | | 900,000 | | | | 908,456 | |
ArcelorMittal, Senior Notes | | | 6.000 | % | | 3/1/21 | | | 1,940,000 | | | | 1,934,438 | |
FMG Resources (August 2006) Pty Ltd., Senior Notes | | | 6.375 | % | | 2/1/16 | | | 410,000 | | | | 424,350 | (a) |
FMG Resources (August 2006) Pty Ltd., Senior Notes | | | 6.000 | % | | 4/1/17 | | | 2,060,000 | | | | 2,101,200 | (a) |
FMG Resources (August 2006) Pty Ltd., Senior Notes | | | 6.875 | % | | 2/1/18 | | | 1,540,000 | | | | 1,590,050 | (a) |
FMG Resources (August 2006) Pty Ltd., Senior Notes | | | 8.250 | % | | 11/1/19 | | | 1,290,000 | | | | 1,373,850 | (a) |
JW Aluminum Co., Senior Secured Notes | | | 11.500 | % | | 11/15/17 | | | 1,660,000 | | | | 1,610,200 | (a) |
Midwest Vanadium Pty Ltd., Senior Secured Notes | | | 11.500 | % | | 2/15/18 | | | 3,760,000 | | | | 2,218,400 | (a)(c) |
Mirabela Nickel Ltd., Senior Notes | | | 8.750 | % | | 4/15/18 | | | 870,000 | | | | 748,200 | (a) |
Molycorp Inc., Senior Secured Notes | | | 10.000 | % | | 6/1/20 | | | 1,930,000 | | | | 1,794,900 | (a) |
Prince Mineral Holding Corp., Senior Secured Notes | | | 11.500 | % | | 12/15/19 | | | 770,000 | | | | 796,950 | (a) |
Rain CII Carbon LLC/CII Carbon Corp., Senior
Secured Notes | | | 8.250 | % | | 1/15/21 | | | 1,320,000 | | | | 1,349,700 | (a) |
Ryerson Inc./Joseph T Ryerson & Son Inc.,
Senior Notes | | | 11.250 | % | | 10/15/18 | | | 500,000 | | | | 460,000 | (a) |
Ryerson Inc./Joseph T Ryerson & Son Inc., Senior Secured Notes | | | 9.000 | % | | 10/15/17 | | | 1,970,000 | | | | 2,009,400 | (a) |
Schaeffler Finance BV, Senior Secured Notes | | | 8.500 | % | | 2/15/19 | | | 200,000 | | | | 226,000 | (a) |
Steel Dynamics Inc., Senior Notes | | | 6.125 | % | | 8/15/19 | | | 680,000 | | | | 720,800 | (a) |
Thompson Creek Metals Co. Inc., Senior Notes | | | 12.500 | % | | 5/1/19 | | | 1,430,000 | | | | 1,379,950 | |
Thompson Creek Metals Co. Inc., Senior Secured Notes | | | 9.750 | % | | 12/1/17 | | | 1,420,000 | | | | 1,505,200 | |
Total Metals & Mining | | | | | | | | | | | | | 23,152,044 | |
Paper & Forest Products — 1.3% | | | | | | | | | | | | | | |
Appleton Papers Inc., Senior Secured Notes | | | 10.500 | % | | 6/15/15 | | | 1,137,000 | | | | 1,205,220 | (a) |
Appleton Papers Inc., Senior Secured Notes | | | 11.250 | % | | 12/15/15 | | | 2,267,000 | | | | 2,448,360 | |
Boise Cascade LLC/Boise Cascade Finance Corp., Senior Notes | | | 6.375 | % | | 11/1/20 | | | 460,000 | | | | 473,800 | (a) |
Sappi Papier Holding GmbH, Senior Secured Notes | | | 8.375 | % | | 6/15/19 | | | 860,000 | | | | 939,550 | (a) |
Verso Paper Holdings LLC/Verso Paper Inc., Senior Secured Notes | | | 11.750 | % | | 1/15/19 | | | 1,150,000 | | | | 1,207,500 | |
See Notes to Financial Statements.
| | |
| 26 | | Western Asset High Yield Fund 2012 Annual Report |
Schedule of investments (cont’d)
December 31, 2012
Western Asset High Yield Fund
| | | | | | | | | | | | | | |
| Security | | Rate | | | Maturity
Date | | Face
Amount† | | | Value | |
Paper & Forest Products — continued | | | | | | | | | | | | | | |
Verso Paper Holdings LLC/Verso Paper Inc., Senior Secured Notes | | | 11.750 | % | | 1/15/19 | | | 671,000 | | | $ | 476,410 | |
Total Paper & Forest Products | | | | | | | | | | | | | 6,750,840 | |
Total Materials | | | | | | | | | | | | | 53,882,358 | |
| Telecommunication Services — 7.2% | | | | | | | | | | | | | | |
Diversified Telecommunication Services — 4.5% | | | | | | | | | | | | | | |
Cincinnati Bell Telephone Co., Senior Debentures | | | 6.300 | % | | 12/1/28 | | | 450,000 | | | | 427,500 | |
Cogent Communications Group Inc., Senior Secured Notes | | | 8.375 | % | | 2/15/18 | | | 1,900,000 | | | | 2,085,250 | (a) |
Inmarsat Finance PLC, Senior Notes | | | 7.375 | % | | 12/1/17 | | | 380,000 | | | | 408,500 | (a) |
Intelsat Jackson Holdings SA, Senior Notes | | | 7.250 | % | | 10/15/20 | | | 640,000 | | | | 694,400 | (a) |
Intelsat Jackson Holdings SA, Senior Notes | | | 7.500 | % | | 4/1/21 | | | 1,000,000 | | | | 1,102,500 | |
Intelsat Luxembourg SA, Senior Notes | | | 11.250 | % | | 2/4/17 | | | 1,920,000 | | | | 2,030,400 | |
Level 3 Financing Inc., Senior Notes | | | 8.625 | % | | 7/15/20 | | | 1,550,000 | | | | 1,720,500 | |
TW Telecom Holdings Inc., Senior Notes | | | 8.000 | % | | 3/1/18 | | | 1,318,000 | | | | 1,443,210 | |
TW Telecom Holdings Inc., Senior Notes | | | 5.375 | % | | 10/1/22 | | | 690,000 | | | | 722,775 | (a) |
UPCB Finance V Ltd., Senior Secured Notes | | | 7.250 | % | | 11/15/21 | | | 1,310,000 | | | | 1,441,000 | (a) |
UPCB Finance VI Ltd., Senior Secured Notes | | | 6.875 | % | | 1/15/22 | | | 660,000 | | | | 714,450 | (a) |
West Corp., Senior Notes | | | 8.625 | % | | 10/1/18 | | | 1,860,000 | | | | 1,948,350 | |
Wind Acquisition Holdings Finance SpA, Senior Notes | | | 12.250 | % | | 7/15/17 | | | 5,079,354 | | | | 5,180,941 | (a)(e) |
Windstream Corp., Senior Notes | | | 7.500 | % | | 6/1/22 | | | 430,000 | | | | 455,800 | |
Windstream Corp., Senior Notes | | | 7.500 | % | | 4/1/23 | | | 3,258,000 | | | | 3,429,045 | |
Total Diversified Telecommunication Services | | | | | | | | | | | | | 23,804,621 | |
Wireless Telecommunication Services — 2.7% | | | | | | | | | | | |
Cricket Communications Inc., Senior Secured Notes | | | 7.750 | % | | 5/15/16 | | | 330,000 | | | | 349,388 | |
MetroPCS Wireless Inc., Senior Notes | | | 7.875 | % | | 9/1/18 | | | 1,200,000 | | | | 1,299,000 | |
MetroPCS Wireless Inc., Senior Notes | | | 6.625 | % | | 11/15/20 | | | 560,000 | | | | 595,000 | |
Sprint Capital Corp., Senior Notes | | | 6.875 | % | | 11/15/28 | | | 1,300,000 | | | | 1,352,000 | |
Sprint Capital Corp., Senior Notes | | | 8.750 | % | | 3/15/32 | | | 3,231,000 | | | | 3,949,897 | |
Sprint Nextel Corp., Senior Notes | | | 9.000 | % | | 11/15/18 | | | 2,400,000 | | | | 2,964,000 | (a) |
Sprint Nextel Corp., Senior Notes | | | 7.000 | % | | 8/15/20 | | | 2,200,000 | | | | 2,403,500 | |
Sprint Nextel Corp., Senior Notes | | | 6.000 | % | | 11/15/22 | | | 1,300,000 | | | | 1,335,750 | |
Total Wireless Telecommunication Services | | | | | | | | | | | | | 14,248,535 | |
Total Telecommunication Services | | | | | | | | | | | | | 38,053,156 | |
| Utilities — 5.1% | | | | | | | | | | | | | | |
Electric Utilities — 2.5% | | | | | | | | | | | | | | |
AES Ironwood LLC, Secured Notes | | | 8.857 | % | | 11/30/25 | | | 2,250,053 | | | | 2,638,187 | |
AES Red Oak LLC, Secured Notes | | | 9.200 | % | | 11/30/29 | | | 2,020,000 | | | | 2,232,100 | |
See Notes to Financial Statements.
| | | | |
| Western Asset High Yield Fund 2012 Annual Report | | | 27 | |
Western Asset High Yield Fund
| | | | | | | | | | | | | | |
| Security | | Rate | | | Maturity
Date | | Face
Amount† | | | Value | |
Electric Utilities — continued | | | | | | | | | | | | | | |
GenOn REMA LLC, Pass-Through Certificates | | | 9.237 | % | | 7/2/17 | | | 773,657 | | | $ | 852,957 | |
GenOn REMA LLC, Pass-Through Certificates | | | 9.681 | % | | 7/2/26 | | | 5,590,000 | | | | 6,009,250 | |
Midwest Generation LLC, Pass-Through Certificates | | | 8.560 | % | | 1/2/16 | | | 1,395,955 | | | | 1,354,076 | (k) |
Total Electric Utilities | | | | | | | | | | | | | 13,086,570 | |
Gas Utilities — 0.2% | | | | | | | | | | | | | | |
Suburban Propane Partners LP/Suburban Energy Finance Corp., Senior Notes | | | 7.375 | % | | 3/15/20 | | | 1,100,000 | | | | 1,190,750 | |
Independent Power Producers & Energy Traders — 2.4% | | | | | | | | |
AES Corp., Senior Notes | | | 9.750 | % | | 4/15/16 | | | 880,000 | | | | 1,051,600 | |
Atlantic Power Corp., Senior Notes | | | 9.000 | % | | 11/15/18 | | | 1,090,000 | | | | 1,139,050 | |
Dynegy Inc., Bonds | | | 7.670 | % | | 11/8/16 | | | 865,000 | | | | 21,625 | (b)(f) |
Energy Future Intermediate Holding Co. LLC/EFIH Finance Inc., Secured Notes | | | 11.750 | % | | 3/1/22 | | | 2,830,000 | | | | 3,141,300 | (a) |
Energy Future Intermediate Holding Co. LLC/EFIH Finance Inc., Senior Secured Notes | | | 6.875 | % | | 8/15/17 | | | 1,210,000 | | | | 1,288,650 | (a) |
Energy Future Intermediate Holding Co. LLC/EFIH Finance Inc., Senior Secured Notes | | | 10.000 | % | | 12/1/20 | | | 476,000 | | | | 536,690 | |
First Wind Holdings Inc., Senior Secured Notes | | | 10.250 | % | | 6/1/18 | | | 1,770,000 | | | | 1,818,675 | (a) |
Foresight Energy LLC/Foresight Energy Corp., Senior Notes | | | 9.625 | % | | 8/15/17 | | | 2,400,000 | | | | 2,568,000 | (a) |
Mirant Mid Atlantic LLC, Pass-Through Certificates | | | 9.125 | % | | 6/30/17 | | | 226,924 | | | | 247,347 | |
Mirant Mid Atlantic LLC, Pass-Through Certificates | | | 10.060 | % | | 12/30/28 | | | 555,348 | | | | 628,932 | |
Total Independent Power Producers & Energy Traders | | | | 12,441,869 | |
Total Utilities | | | | | | | | | | | | | 26,719,189 | |
Total Corporate Bonds & Notes (Cost — $439,031,159) | | | | | | | 451,343,014 | |
| Collateralized Senior Loans — 2.4% | | | | | | | | | | | |
| Consumer Discretionary — 0.7% | | | | | | | | | | | | | | |
Hotels, Restaurants & Leisure — 0.7% | | | | | | | | | | | |
Equinox Fitness Clubs, 2nd Lien Term Loan | | | — | | | 5/16/20 | | | 1,210,000 | | | | 1,210,000 | (i) |
Stockbridge/SBE Holdings LLC, Term Loan B | | | 13.000 | % | | 5/2/17 | | | 2,610,000 | | | | 2,603,475 | (j) |
Total Consumer Discretionary | | | | | | | | | | | | | 3,813,475 | |
| Consumer Staples — 0.1% | | | | | | | | | | | | | | |
Food Products — 0.1% | | | | | | | | | | | | | | |
AdvancePierre Foods Inc., 2nd Lien Term Loan | | | 9.500 | % | | 10/10/17 | | | 520,000 | | | | 528,450 | (j) |
| Energy — 0.4% | | | | | | | | | | | | | | |
Energy Equipment & Services — 0.2% | | | | | | | | | | | | | | |
Frac Tech International LLC, Term Loan B | | | — | | | 5/6/16 | | | 1,140,000 | | | | 944,775 | (i) |
See Notes to Financial Statements.
| | |
| 28 | | Western Asset High Yield Fund 2012 Annual Report |
Schedule of investments (cont’d)
December 31, 2012
Western Asset High Yield Fund
| | | | | | | | | | | | | | |
| Security | | Rate | | | Maturity
Date | | Face
Amount† | | | Value | |
Oil, Gas & Consumable Fuels — 0.2% | | | | | | | | | | | | | | |
Chesapeake Energy Corp., New Term Loan | | | 5.750 | % | | 12/1/17 | | | 970,000 | | | $ | 970,673 | (j) |
Total Energy | | | | | | | | | | | | | 1,915,448 | |
| Health Care — 0.1% | | | | | | | | | | | | | | |
Health Care Equipment & Supplies — 0.1% | | | | | | | | | | | | | | |
Immucor Inc., Term Loan B1 | | | 5.750 | % | | 8/17/18 | | | 503,644 | | | | 508,995 | (j) |
| Industrials — 0.5% | | | | | | | | | | | | | | |
Machinery — 0.4% | | | | | | | | | | | | | | |
Intelligrated Inc., Second Lien Term Loan | | | 10.500 | % | | 12/31/19 | | | 2,090,000 | | | | 2,121,350 | (j) |
Marine — 0.1% | | | | | | | | | | | | | | |
Trico Shipping AS, New Term Loan A | | | 10.000 | % | | 5/13/14 | | | 235,819 | | | | 234,640 | (c)(j) |
Trico Shipping AS, New Term Loan B | | | — | | | 5/13/14 | | | 415,198 | | | | 413,122 | (c)(i) |
Total Marine | | | | | | | | | | | | | 647,762 | |
Total Industrials | | | | | | | | | | | | | 2,769,112 | |
| Information Technology — 0.2% | | | | | | | | | | | | | | |
IT Services — 0.2% | | | | | | | | | | | | | | |
CompuCom Systems Inc., 2nd Lien Term Loan | | | 10.250 | % | | 10/2/19 | | | 1,220,000 | | | | 1,210,850 | (j) |
| Materials — 0.2% | |
Chemicals — 0.2% | | | | | | | | | | | | | | |
Kronos Inc., 2nd Lien New Term Loan | | | 9.750 | % | | 4/30/20 | | | 960,000 | | | | 960,000 | (j) |
| Utilities — 0.2% | |
Electric Utilities — 0.2% | |
Texas Competitive Electric Holdings Co. LLC, Extended Term Loan | | | 4.713-4.810 | % | | 10/10/17 | | | 1,541,517 | | | | 1,032,266 | (j) |
Total Collateralized Senior Loans (Cost — $12,841,482) | | | | 12,738,596 | |
| Convertible Bonds & Notes — 0.1% | |
| Materials — 0.1% | |
Chemicals — 0.1% | |
Hercules Inc. (Cost—$670,049) | | | 6.500 | % | | 6/30/29 | | | 770,000 | | | | 644,398 | |
| Sovereign Bonds — 0.5% | |
Mexico — 0.5% | |
Mexican Bonos, Bonds (Cost — $2,534,997) | | | 6.500 | % | | 6/9/22 | | | 30,430,000 | MXN | | | 2,547,021 | |
| | | | |
| | | | | | | | Shares | | | | |
| Common Stocks — 4.0% | |
| Consumer Discretionary — 0.5% | |
Hotels, Restaurants & Leisure — 0.0% | |
Bossier Casino Venture Holdco Inc. | | | | | | | | | 81,754 | | | | 163,508 | *(b)(c) |
See Notes to Financial Statements.
| | | | |
| Western Asset High Yield Fund 2012 Annual Report | | | 29 | |
Western Asset High Yield Fund
| | | | | | | | | | | | | | |
| Security | | | | | | | Shares | | | Value | |
Media — 0.5% | |
Charter Communications Inc., Class A Shares | | | | | | | | | 33,763 | | | $ | 2,574,091 | * |
Total Consumer Discretionary | | | | | | | | | | | | | 2,737,599 | |
| Energy — 1.0% | |
Energy Equipment & Services — 1.0% | |
KCAD Holdings I Ltd. | | | | | | | | | 424,046,710 | | | | 5,079,231 | *(b)(c) |
| Financials — 1.8% | |
Diversified Financial Services — 0.8% | |
Citigroup Inc. | | | | | | | | | 102,481 | | | | 4,054,152 | |
Real Estate Management & Development — 1.0% | |
Realogy Holdings Corp. | | | | | | | | | 133,245 | | | | 5,415,743 | *(b)(c) |
Total Financials | | | | | | | | | | | | | 9,469,895 | |
| Industrials — 0.7% | |
Building Products — 0.0% | |
Nortek Inc. | | | | | | | | | 1,078 | | | | 71,417 | * |
Marine — 0.7% | |
DeepOcean Group Holding AS | | | | | | | | | 111,195 | | | | 2,254,213 | *(b)(c) |
Horizon Lines Inc., Class A Shares | | | | | | | | | 818,782 | | | | 1,228,173 | * |
Total Marine | | | | | | | | | | | | | 3,482,386 | |
Total Industrials | | | | | | | | | | | | | 3,553,803 | |
| Materials — 0.0% | |
Chemicals — 0.0% | |
LyondellBasell Industries NV, Class A Shares | | | | | | | | | 63 | | | | 3,597 | |
| Utilities — 0.0% | |
Independent Power Producers & Energy Traders — 0.0% | |
Dynegy Inc. | | | | | | | | | 6,686 | | | | 127,903 | * |
Total Common Stocks (Cost — $17,069,789) | | | | | | | | | | | | | 20,972,028 | |
| | | | |
| | | Rate | | | | | | | | | |
| Preferred Stocks — 1.6% | | | | | | | | | | | | | | |
| Financials — 1.5% | | | | | | | | | | | | | | |
Capital Markets — 0.1% | | | | | | | | | | | | | | |
Goldman Sachs Group Inc. | | | 5.950 | % | | | | | 23,130 | | | | 577,788 | |
Consumer Finance — 1.0% | | | | | | | | | | | | | | |
GMAC Capital Trust I | | | 8.125 | % | | | | | 202,065 | | | | 5,385,032 | (g) |
Diversified Financial Services — 0.4% | | | | | | | | | | | |
Citigroup Capital XIII | | | 7.875 | % | | | | | 61,950 | | | | 1,728,405 | (g) |
Total Financials | | | | | | | | | | | | | 7,691,225 | |
See Notes to Financial Statements.
| | |
| 30 | | Western Asset High Yield Fund 2012 Annual Report |
Schedule of investments (cont’d)
December 31, 2012
Western Asset High Yield Fund
| | | | | | | | | | | | | | |
| Security | | Rate | | | | | Shares | | | Value | |
| Industrials — 0.1% | | | | | | | | | | | | | | |
Road & Rail — 0.1% | | | | | | | | | | | | | | |
Jack Cooper Holdings Corp. | | | 20.000 | % | | | | | 5,170 | | | $ | 558,360 | (a)(b)(g) |
Total Preferred Stocks (Cost — $7,555,357) | | | | | | | 8,249,585 | |
| | | | |
| | | | | | Expiration
Date | | Notional
Amount† | | | | |
| Purchased Options — 0.1% | | | | | | | | | | | | | | |
Credit default swaption with BNP Paribas to buy protection on Markit CDX.NA.HY.19 Index,
Put @ $99.00 | | | | | | 2/20/13 | | | 23,200,000 | | | | 306,013 | |
Credit default swaption with BNP Paribas to buy protection on Markit CDX.NA.HY.19 Index,
Put @ $100.00 | | | | | | 3/20/13 | | | 12,000,000 | | | | 279,027 | |
Total Purchased Options (Cost — $383,920) | | | | | | | 585,040 | |
| | | | |
| | | | | | | | Warrants | | | | |
| Warrants — 0.1% | | | | | | | | | | | | | | |
Charter Communications Inc. | | | | | | 11/30/14 | | | 3,493 | | | | 95,184 | * |
Jack Cooper Holdings Corp. | | | | | | 12/15/17 | | | 2,297 | | | | 280,234 | * |
Jack Cooper Holdings Corp. | | | | | | 5/6/18 | | | 1,159 | | | | 141,398 | * |
SemGroup Corp. | | | | | | 11/30/14 | | | 14,326 | | | | 211,738 | *(c) |
Total Warrants (Cost — $70,351) | | | | | | | | | | | | | 728,554 | |
Total Investments before Short-term Investments (Cost — $480,157,104) | | | | 497,808,236 | |
| | | | |
| | | | | | Maturity
Date | | Face
Amount† | | | | |
| Short-Term Investments — 3.8% | | | | | | | | | | | | | | |
Repurchase Agreements — 3.8% | | | | | | | | | | | | | | |
Barclays Capital Inc. repurchase agreement dated 12/31/12; Proceeds at maturity — $19,939,177; (Fully collateralized by U.S. government obligations, 0.250% due 9/15/15; Market value — $20,350,885)
(Cost—$19,939,000) | | | 0.160 | % | | 1/2/13 | | | 19,939,000 | | | | 19,939,000 | |
Total Investments — 98.3 % (Cost — $500,096,104#) | | | | | | | | | | 517,747,236 | |
Other Assets in Excess of Liabilities — 1.7% | | | | | | | | | | | | | 9,127,415 | |
Total Net Assets — 100.0% | | | | | | | | | | | | $ | 526,874,651 | |
| † | Face amount/notional amount denominated in U.S. dollars, unless otherwise noted. |
| * | Non-income producing security. |
| (a) | Security is exempt from registration under Rule 144A of the Securities Act of 1933. This security may be resold in transactions that are exempt from registration, normally to qualified institutional buyers. This security has been deemed liquid pursuant to guidelines approved by the Board of Directors, unless otherwise noted. |
| (b) | Security is valued in good faith in accordance with procedures approved by the Board of Directors (See Note 1). |
See Notes to Financial Statements.
| | | | |
| Western Asset High Yield Fund 2012 Annual Report | | | 31 | |
Western Asset High Yield Fund
| (d) | Value is less than $1. |
| (e) | Payment-in-kind security for which part of the income earned may be paid as additional principal. |
| (f) | The coupon payment on these securities is currently in default as of December 31, 2012. |
| (g) | Variable rate security. Interest rate disclosed is as of the most recent information available. |
| (h) | Security has no maturity date. The date shown represents the next call date. |
| (i) | All or a portion of this loan is unfunded as of December 31, 2012. The interest rate for fully unfunded term loans is to be determined. |
| (j) | Interest rates disclosed represent the effective rates on collateralized senior loans. Ranges in interest rates are attributable to multiple contracts under the same loan. |
| (k) | The issuer filed for bankruptcy. |
| # | Aggregate cost for federal income tax purposes is $500,261,150. |
| | |
Abbreviations used in this schedule: |
| EUR | | — Euro |
| MXN | | — Mexican Peso |
| | | | | | | | | | | | | | | | |
| Schedule of Written Options | | | | | | | | | | |
| Security | | Expiration
Date | | | Strike
Price | | | Notional
Amount† | | | Value | |
| Credit default swaption with BNP Paribas to buy protection on Markit CDX.NA.HY.19 Index, Call | | | 2/20/13 | | | $ | 102.50 | | | | 11,600,000 | | | $ | 43,193 | |
| Credit default swaption with BNP Paribas to sell protection on Markit CDX.NA.HY.19 Index, Put | | | 2/20/13 | | | | 96.00 | | | | 23,200,000 | | | | 150,532 | |
| Credit default swaption with BNP Paribas to sell protection on Markit CDX.NA.HY.19 Index, Put | | | 3/20/13 | | | | 96.50 | | | | 24,000,000 | | | | 282,249 | |
| Total Written Options (Premiums Received — $311,600) | | | | | | | | | | | $ | 475,974 | |
| † | Notional amount denominated in U.S. dollars, unless otherwise noted. |
See Notes to Financial Statements.
| | |
| 32 | | Western Asset High Yield Fund 2012 Annual Report |
Statement of assets and liabilities
December 31, 2012
| | | | |
| |
| Assets: | | | | |
Investments, at value (Cost — $500,096,104) | | $ | 517,747,236 | |
Foreign currency, at value (Cost — $140,685) | | | 141,136 | |
Cash | | | 2,387,777 | |
Interest receivable | | | 9,549,977 | |
Receivable for Fund shares sold | | | 1,034,468 | |
Deposits with brokers for swap contracts | | | 590,000 | |
Receivable for securities sold | | | 160,513 | |
Prepaid expenses | | | 54,063 | |
Total Assets | | | 531,665,170 | |
| |
| Liabilities: | | | | |
Payable for securities purchased | | | 2,498,358 | |
Payable for Fund shares repurchased | | | 728,098 | |
Written options, at value (premiums received — $311,600) | | | 475,974 | |
Swaps, at value (premiums paid — $404,792) | | | 351,582 | |
Investment management fee payable | | | 240,437 | |
Unrealized depreciation on forward foreign currency contracts | | | 211,419 | |
Distributions payable | | | 128,947 | |
Payable for open swap contracts | | | 30,920 | |
Service and/or distribution fees payable | | | 212 | |
Accrued expenses | | | 124,572 | |
Total Liabilities | | | 4,790,519 | |
| Total Net Assets | | $ | 526,874,651 | |
| |
| Net Assets: | | | | |
Par value (Note 7) | | $ | 59,161 | |
Paid-in capital in excess of par value | | | 626,499,110 | |
Undistributed net investment income | | | 81,046 | |
Accumulated net realized loss on investments, written options, swap contracts and foreign currency transactions | | | (116,289,848) | |
Net unrealized appreciation on investments, written options, swap contracts and foreign currencies | | | 16,525,182 | |
| Total Net Assets | | $ | 526,874,651 | |
| |
| Shares Outstanding: | | | | |
Class A | | | 45,768 | |
Class C | | | 17,938 | |
Class R | | | 1,229 | |
Class I | | | 43,491,949 | |
Class IS | | | 15,604,253 | |
See Notes to Financial Statements.
| | | | |
| Western Asset High Yield Fund 2012 Annual Report | | | 33 | |
| | | | |
| |
| Net Asset Value: | | | | |
Class A (and redemption price) | | | $8.86 | |
Class C* | | | $8.85 | |
Class R (and redemption price) | | | $8.87 | |
Class I (and redemption price) | | | $8.87 | |
Class IS (and redemption price) | | | $9.01 | |
| Maximum Public Offering Price Per Share: | | | | |
Class A (based on maximum initial sales charge of 4.25%) | | | $9.25 | |
| * | Redemption price per share is NAV of Class C shares reduced by a 1.00% CDSC if shares are redeemed within one year from purchase payment (See Note 2). |
See Notes to Financial Statements.
| | |
| 34 | | Western Asset High Yield Fund 2012 Annual Report |
Statement of operations
For the Year Ended December 31, 2012
| | | | |
| |
| Investment Income: | | | | |
Interest | | $ | 38,490,244 | |
Dividends | | | 913,686 | |
Less: Foreign taxes withheld | | | (801) | |
Total Investment Income | | | 39,403,129 | |
| |
| Expenses: | | | | |
Investment management fee (Note 2) | | | 2,697,565 | |
Transfer agent fees (Note 5) | | | 172,356 | |
Registration fees | | | 92,925 | |
Fund accounting fees | | | 59,563 | |
Audit and tax | | | 58,397 | |
Legal fees | | | 53,535 | |
Shareholder reports (Note 5) | | | 33,679 | |
Directors’ fees | | | 25,503 | |
Custody fees | | | 11,048 | |
Insurance | | | 10,055 | |
Service and/or distribution fees (Notes 2 and 5) | | | 819 | |
Miscellaneous expenses | | | 1,803 | |
Total Expenses | | | 3,217,248 | |
Less: Fee waivers and/or expense reimbursements (Notes 2 and 5) | | | (1,568) | |
Net Expenses | | | 3,215,680 | |
| Net Investment Income | | | 36,187,449 | |
| |
| Realized And Unrealized Gain (Loss) on Investments, Written Options, Swap Contracts and Foreign Currency Transactions (Notes 1, 3 and 4): | | | | |
Net Realized Gain From: | | | | |
Investment transactions | | | 6,986,562 | |
Written options | | | 1,870,144 | |
Swap contracts | | | 708,587 | |
Foreign currency transactions | | | 365,094 | |
Net Realized Gain | | | 9,930,387 | |
Change in Net Unrealized Appreciation (Depreciation) From: | | | | |
Investments | | | 35,326,807 | |
Written options | | | (164,374) | |
Swap contracts | | | (799,971) | |
Foreign currencies | | | (447,656) | |
Change in Net Unrealized Appreciation (Depreciation) | | | 33,914,806 | |
| Net Gain on Investments, Written Options, Swap Contracts and Foreign Currency Transactions | | | 43,845,193 | |
| Increase in Net Assets From Operations | | $ | 80,032,642 | |
See Notes to Financial Statements.
| | | | |
| Western Asset High Yield Fund 2012 Annual Report | | | 35 | |
Statements of changes in net assets
| | | | | | | | |
| For the Years Ended December 31, | | 2012 | | | 2011 | |
| | |
| Operations: | | | | | | | | |
Net investment income | | $ | 36,187,449 | | | $ | 39,509,778 | |
Net realized gain | | | 9,930,387 | | | | 6,431,934 | |
Change in net unrealized appreciation (depreciation) | | | 33,914,806 | | | | (30,485,338) | |
Increase in Net Assets From Operations | | | 80,032,642 | | | | 15,456,374 | |
| | |
| Distributions To Shareholders From (Notes 1 and 6): | | | | | | | | |
Net investment income | | | (35,611,340) | | | | (39,072,929) | |
Decrease in Net Assets From Distributions to Shareholders | | | (35,611,340) | | | | (39,072,929) | |
| | |
| Fund Share Transactions (Note 7): | | | | | | | | |
Net proceeds from sale of shares | | | 250,964,003 | | | | 376,773,721 | |
Reinvestment of distributions | | | 34,362,585 | | | | 37,735,250 | |
Cost of shares repurchased | | | (248,607,163) | | | | (500,847,534) | |
Increase (Decrease) in Net Assets From Fund Share Transactions | | | 36,719,425 | | | | (86,338,563) | |
Increase (Decrease) in Net Assets | | | 81,140,727 | | | | (109,955,118) | |
| | |
| Net Assets: | | | | | | | | |
Beginning of year | | | 445,733,924 | | | | 555,689,042 | |
End of year* | | $ | 526,874,651 | | | $ | 445,733,924 | |
* Includes undistributed (overdistributed) net investment income, respectively, of: | | | $81,046 | | | | $(141,328) | |
See Notes to Financial Statements.
| | |
| 36 | | Western Asset High Yield Fund 2012 Annual Report |
Financial highlights
| | | | |
For a share of each class of capital stock outstanding throughout each year ended December 31,
unless otherwise noted: | |
| Class A Shares1 | | 20122 | |
| |
| Net asset value, beginning of period | | | $8.61 | |
| |
| Income from operations: | | | | |
Net investment income | | | 0.40 | |
Net realized and unrealized gain | | | 0.37 | |
Total income from operations | | | 0.77 | |
| |
| Less distributions from: | | | | |
Net investment income | | | (0.52) | |
Total distributions | | | (0.52) | |
| |
| Net asset value, end of period | | | $8.86 | |
Total return3 | | | 9.25 | % |
| |
| Net assets, end of period (000s) | | | $406 | |
| |
| Ratios to average net assets: | | | | |
Gross expenses4 | | | 1.12 | % |
Net expenses4,5,6,7 | | | 0.93 | |
Net investment income4 | | | 6.90 | |
| |
| Portfolio turnover rate | | | 86 | % |
| 1 | Per share amounts have been calculated using the average shares method. |
| 2 | For the period April 30, 2012 (commencement of operations) to December 31, 2012. |
| 3 | Performance figures, exclusive of sales charges, may reflect compensating balance arrangements, fee waivers and/or expense reimbursements. In the absence of compensating balance arrangements, fee waivers and/or expense reimbursements, the total return would have been lower. Past performance is no guarantee of future results. Total returns for periods of less than one year are not annualized. |
| 5 | As a result of an expense limitation arrangement, the ratio of expenses, other than interest, taxes, extraordinary expenses, deferred organizational expenses and brokerage commissions, to average net assets of Class A shares did not exceed 1.05%. This expense limitation arrangement cannot be terminated prior to December 31, 2014 without the Board of Directors’ consent. |
| 6 | Reflects fee waivers and/or expense reimbursements. |
| 7 | The impact of compensating balance arrangements, if any, was less than 0.01%. |
See Notes to Financial Statements.
| | | | |
| Western Asset High Yield Fund 2012 Annual Report | | | 37 | |
| | | | |
For a share of each class of capital stock outstanding throughout each year ended December 31,
unless otherwise noted: | |
| Class C Shares1 | | 20122 | |
| |
| Net asset value, beginning of period | | | $8.61 | |
| |
| Income from operations: | | | | |
Net investment income | | | 0.35 | |
Net realized and unrealized gain | | | 0.38 | |
Total income from operations | | | 0.73 | |
| |
| Less distributions from: | | | | |
Net investment income | | | (0.49) | |
Total distributions | | | (0.49) | |
| |
| Net asset value, end of period | | | $8.85 | |
Total return3 | | | 8.73 | % |
| |
| Net assets, end of period (000s) | | | $159 | |
| |
| Ratios to average net assets: | | | | |
Gross expenses4 | | | 2.15 | % |
Net expenses4,5,6,7 | | | 1.69 | |
Net investment income4 | | | 6.07 | |
| |
| Portfolio turnover rate | | | 86 | % |
| 1 | Per share amounts have been calculated using the average shares method. |
| 2 | For the period April 30, 2012 (commencement of operations) to December 31, 2012. |
| 3 | Performance figures, exclusive of CDSC, may reflect compensating balance arrangements, fee waivers and/or expense reimbursements. In the absence of compensating balance arrangements, fee waivers and/or expense reimbursements, the total return would have been lower. Past performance is no guarantee of future results. Total returns for periods of less than one year are not annualized. |
| 5 | As a result of an expense limitation arrangement, the ratio of expenses, other than interest, taxes, extraordinary expenses, deferred organizational expenses and brokerage commissions, to average net assets of Class C shares did not exceed 1.80%. This expense limitation arrangement cannot be terminated prior to December 31, 2014 without the Board of Directors’ consent. |
| 6 | Reflects fee waivers and/or expense reimbursements. |
| 7 | The impact of compensating balance arrangements, if any, was less than 0.01%. |
See Notes to Financial Statements.
| | |
| 38 | | Western Asset High Yield Fund 2012 Annual Report |
Financial highlights (cont’d)
| | | | |
For a share of each class of capital stock outstanding throughout each year ended December 31,
unless otherwise noted: | |
| Class R Shares1 | | 20122 | |
| |
| Net asset value, beginning of period | | | $8.61 | |
| |
| Income from operations: | | | | |
Net investment income | | | 0.38 | |
Net realized and unrealized gain | | | 0.37 | |
Total income from operations | | | 0.75 | |
| |
| Less distributions from: | | | | |
Net investment income | | | (0.49) | |
Total distributions | | | (0.49) | |
| |
| Net asset value, end of period | | | $8.87 | |
Total return3 | | | 9.05 | % |
| |
| Net assets, end of period (000s) | | | $11 | |
| |
| Ratios to average net assets: | | | | |
Gross expenses4 | | | 1.37 | % |
Net expenses4,5,6,7 | | | 1.30 | |
Net investment income4 | | | 6.59 | |
| |
| Portfolio turnover rate | | | 86 | % |
| 1 | Per share amounts have been calculated using the average shares method. |
| 2 | For the period April 30, 2012 (commencement of operations) to December 31, 2012. |
| 3 | Performance figures may reflect compensating balance arrangements, fee waivers and/or expense reimbursements. In the absence of compensating balance arrangements, fee waivers and/or expense reimbursements, the total return would have been lower. Past performance is no guarantee of future results. Total returns for periods of less than one year are not annualized. |
| 5 | As a result of an expense limitation arrangement, the ratio of expenses, other than interest, taxes, extraordinary expenses, deferred organizational expenses and brokerage commissions, to average net assets of Class R shares did not exceed 1.30%. This expense limitation arrangement cannot be terminated prior to December 31, 2014 without the Board of Directors’ consent. |
| 6 | Reflects fee waivers and/or expense reimbursements. |
| 7 | The impact of compensating balance arrangements, if any, was less than 0.01%. |
See Notes to Financial Statements.
| | | | |
| Western Asset High Yield Fund 2012 Annual Report | | | 39 | |
| | | | | | | | | | | | | | | | | | | | | | | | |
For a share of each class of capital stock outstanding throughout each year ended December 31,
unless otherwise noted: | |
| Class I Shares1,2 | | 2012 | | | 2011 | | | 2010 | | | 2009 | | | 20083 | | | 20084 | |
| | | | | | |
| Net asset value, beginning of year | | | $8.10 | | | | $8.71 | | | | $8.27 | | | | $5.99 | | | | $9.30 | | | | $10.75 | |
| | | | | | |
| Income (loss) from operations: | | | | | | | | | | | | | | | | | | | | | | | | |
Net investment income | | | 0.63 | | | | 0.69 | | | | 0.81 | | | | 0.92 | | | | 0.66 | | | | 0.83 | |
Net realized and unrealized gain (loss) | | | 0.77 | | | | (0.52) | | | | 0.48 | | | | 2.32 | | | | (3.05) | | | | (1.41) | |
Total income (loss) from operations | | | 1.40 | | | | 0.17 | | | | 1.29 | | | | 3.24 | | | | (2.39) | | | | (0.58) | |
| | | | | | |
| Less distributions from: | | | | | | | | | | | | | | | | | | | | | | | | |
Net investment income | | | (0.63) | | | | (0.78) | | | | (0.85) | | | | (0.96) | | | | (0.92) | | | | (0.80) | |
Net realized gains | | | — | | | | — | | | | — | | | | — | | | | — | | | | (0.07) | |
Total distributions | | | (0.63) | | | | (0.78) | | | | (0.85) | | | | (0.96) | | | | (0.92) | | | | (0.87) | |
| | | | | | |
| Net asset value, end of year | | | $8.87 | | | | $8.10 | | | | $8.71 | | | | $8.27 | | | | $5.99 | | | | $9.30 | |
Total return5 | | | 17.76 | % | | | 1.87 | % | | | 16.24 | % | | | 56.73 | % | | | (27.19) | % | | | (5.88) | % |
| | | | | | |
| Net assets, end of year (000s) | | | $385,634 | | | | $345,686 | | | | $447,370 | | | | $511,335 | | | | $439,446 | | | | $800,103 | |
| | | | | | |
| Ratios to average net assets: | | | | | | | | | | | | | | | | | | | | | | | | |
Gross expenses | | | 0.66 | % | | | 0.68 | % | | | 0.65 | % | | | 0.62 | % | | | 0.60 | %6 | | | 0.59 | % |
Net expenses | | | 0.66 | 7 | | | 0.68 | 7 | | | 0.65 | 7 | | | 0.62 | 7 | | | 0.60 | 6,7 | | | 0.58 | 8 |
Net investment income | | | 7.37 | | | | 7.88 | | | | 9.39 | | | | 12.80 | | | | 10.40 | 6 | | | 8.30 | |
| | | | | | |
| Portfolio turnover rate | | | 86 | % | | | 103 | % | | | 105 | % | | | 84 | % | | | 41 | %9 | | | 59 | % |
| 1 | In April 2010, Institutional Class shares were renamed Class I shares. |
| 2 | Per share amounts have been calculated using the average shares method. |
| 3 | For the period April 1, 2008 through December 31, 2008. |
| 4 | For the year ended March 31. |
| 5 | Performance figures may reflect compensating balance arrangements, fee waivers and/or expense reimbursements. In the absence of compensating balance arrangements, fee waivers and/or expense reimbursements, the total return would have been lower. Past performance is no guarantee of future results. Total returns for periods of less than one year are not annualized. |
| 7 | The impact of compensating balance arrangements, if any, was less than 0.01%. |
| 8 | The impact of compensating balance arrangements was 0.01%. |
See Notes to Financial Statements.
| | |
| 40 | | Western Asset High Yield Fund 2012 Annual Report |
Financial highlights (cont’d)
| | | | | | | | | | | | | | | | | | | | |
For a share of each class of capital stock outstanding throughout each year ended December 31,
unless otherwise noted: | |
| Class IS Shares1,2 | | 2012 | | | 2011 | | | 2010 | | | 2009 | | | 20083 | |
| | | | | |
| Net asset value, beginning of year | | | $8.23 | | | | $8.84 | | | | $8.38 | | | | $6.06 | | | | $8.86 | |
| | | | | |
| Income (loss) from operations: | | | | | | | | | | | | | | | | | | | | |
Net investment income | | | 0.65 | | | | 0.70 | | | | 0.82 | | | | 0.94 | | | | 0.37 | |
Net realized and unrealized gain (loss) | | | 0.76 | | | | (0.53) | | | | 0.49 | | | | 2.34 | | | | (2.77) | |
Total income (loss) from operations | | | 1.41 | | | | 0.17 | | | | 1.31 | | | | 3.28 | | | | (2.40) | |
| | | | | |
| Less distributions from: | | | | | | | | | | | | | | | | | | | | |
Net investment income | | | (0.63) | | | | (0.78) | | | | (0.85) | | | | (0.96) | | | | (0.40) | |
Total distributions | | | (0.63) | | | | (0.78) | | | | (0.85) | | | | (0.96) | | | | (0.40) | |
| | | | | |
| Net asset value, end of year | | | $9.01 | | | | $8.23 | | | | $8.84 | | | | $8.38 | | | | $6.06 | |
Total return4 | | | 17.67 | % | | | 1.92 | % | | | 16.32 | % | | | 56.74 | % | | | (27.16) | % |
| | | | | |
| Net assets, end of year (000s) | | | $140,665 | | | | $100,048 | | | | $108,319 | | | | $107,301 | | | | $77,795 | |
| | | | | |
| Ratios to average net assets: | | | | | | | | | | | | | | | | | | | | |
Gross expenses | | | 0.63 | % | | | 0.61 | % | | | 0.61 | % | | | 0.61 | % | | | 0.60 | %5 |
Net expenses6,7 | | | 0.63 | 8 | | | 0.61 | | | | 0.61 | | | | 0.61 | | | | 0.60 | 5 |
Net investment income | | | 7.41 | | | | 8.00 | | | | 9.40 | | | | 12.80 | | | | 12.40 | 5 |
| | | | | |
| Portfolio turnover rate | | | 86 | % | | | 103 | % | | | 105 | % | | | 84 | % | | | 41 | %9 |
| 1 | In April 2010, Institutional Select Class shares were renamed Class IS shares. |
| 2 | Per share amounts have been calculated using the average shares method. |
| 3 | For the period August 4, 2008 (commencement of operations) to December 31, 2008. |
| 4 | Performance figures may reflect compensating balance arrangements, fee waivers and/or expense reimbursements. In the absence of compensating balance arrangements, fee waivers and/or expense reimbursements, the total return would have been lower. Past performance is no guarantee of future results. Total returns for periods of less than one year are not annualized. |
| 6 | As a result of an expense limitation arrangement, the ratio of expenses, other than interest, taxes, extraordinary expenses, deferred organizational expenses and brokerage commissions, to average net assets of Class IS shares did not exceed 0.65%. This expense limitation arrangement cannot be terminated prior to December 31, 2014 without the Board of Directors’ consent. |
| 7 | The impact of compensating balance arrangements, if any, was less than 0.01%. |
| 8 | Reflects fee waivers and/or expense reimbursements. |
See Notes to Financial Statements.
| | | | |
| Western Asset High Yield Fund 2012 Annual Report | | | 41 | |
Notes to financial statements
1. Organization and significant accounting policies
Western Asset High Yield Fund (formerly, Western Asset High Yield Portfolio) (the “Fund”) is a separate diversified investment series of Western Asset Funds, Inc. (the “Corporation”). The Corporation, a Maryland corporation, is registered under the Investment Company Act of 1940, as amended (the “1940 Act”), as an open-end management investment company.
The following are significant accounting policies consistently followed by the Fund and are in conformity with U.S. generally accepted accounting principles (“GAAP”). Estimates and assumptions are required to be made regarding assets, liabilities and changes in net assets resulting from operations when financial statements are prepared. Changes in the economic environment, financial markets and any other parameters used in determining these estimates could cause actual results to differ. Subsequent events have been evaluated through the date the financial statements were issued.
(a) Investment valuation. The valuations for fixed income securities (which may include, but are not limited to, corporate, government, municipal, mortgage-backed, collateralized mortgage obligations and asset-backed securities) and certain derivative instruments are typically the prices supplied by independent third party pricing services, which may use market prices or broker/dealer quotations or a variety of valuation techniques and methodologies. The independent third party pricing services use inputs that are observable such as issuer details, interest rates, yield curves, prepayment speeds, credit risks/spreads, default rates and quoted prices for similar securities. Short-term fixed income securities that will mature in 60 days or less are valued at amortized cost, unless it is determined that using this method would not reflect an investment’s fair value. Equity securities for which market quotations are available are valued at the last reported sales price or official closing price on the primary market or exchange on which they trade. When the Fund holds securities or other assets that are denominated in a foreign currency, the Fund will normally use the currency exchange rates as of 4:00 p.m. (Eastern Time). If independent third party pricing services are unable to supply prices for a portfolio investment, or if the prices supplied are deemed by the manager to be unreliable, the market price may be determined by the manager using quotations from one or more broker/dealers or at the transaction price if the security has recently been purchased and no value has yet been obtained from a pricing service or pricing broker. When reliable prices are not readily available, such as when the value of a security has been significantly affected by events after the close of the exchange or market on which the security is principally traded, but before the Fund calculates its net asset value, the Fund values these securities as determined in accordance with procedures approved by the Fund’s Board of Directors.
The Board of Directors is responsible for the valuation process and has delegated the supervision of the daily valuation process to the Legg Mason North American Fund Valuation Committee (the “Valuation Committee”). The Valuation Committee, pursuant to the policies adopted by the Board of Directors, is responsible for making fair value determinations, evaluating the effectiveness of the Fund’s pricing policies, and reporting to the Board of Directors. When determining the reliability of third
| | |
| 42 | | Western Asset High Yield Fund 2012 Annual Report |
Notes to financial statements (cont’d)
party pricing information for investments owned by the Fund, the Valuation Committee, among other things, conducts due diligence reviews of pricing vendors, monitors the daily change in prices and reviews transactions among market participants.
The Valuation Committee will consider pricing methodologies it deems relevant and appropriate when making fair value determinations. Examples of possible methodologies include, but are not limited to, multiple of earnings; discount from market of a similar freely traded security; discounted cash-flow analysis; book value or a multiple thereof; risk premium/yield analysis; yield to maturity; and/or fundamental investment analysis. The Valuation Committee will also consider factors it deems relevant and appropriate in light of the facts and circumstances. Examples of possible factors include, but are not limited to, the type of security; the issuer’s financial statements; the purchase price of the security; the discount from market value of unrestricted securities of the same class at the time of purchase; analysts’ research and observations from financial institutions; information regarding any transactions or offers with respect to the security; the existence of merger proposals or tender offers affecting the security; the price and extent of public trading in similar securities of the issuer or comparable companies; and the existence of a shelf registration for restricted securities.
For each portfolio security that has been fair valued pursuant to the policies adopted by the Board of Directors, the fair value price is compared against the last available and next available market quotations. The Valuation Committee reviews the results of such back testing monthly and fair valuation occurrences are reported to the Board of Directors quarterly.
The Fund uses valuation techniques to measure fair value that are consistent with the market approach and/or income approach, depending on the type of security and the particular circumstance. The market approach uses prices and other relevant information generated by market transactions involving identical or comparable securities. The income approach uses valuation techniques to discount estimated future cash flows to present value.
GAAP establishes a disclosure hierarchy that categorizes the inputs to valuation techniques used to value assets and liabilities at measurement date. These inputs are summarized in the three broad levels listed below:
| Ÿ | | Level 1 — quoted prices in active markets for identical investments |
| Ÿ | | Level 2 — other significant observable inputs (including quoted prices for similar investments, interest rates, prepayment speeds, credit risk, etc.) |
| Ÿ | | Level 3 — significant unobservable inputs (including the Fund’s own assumptions in determining the fair value of investments) |
The inputs or methodologies used to value securities are not necessarily an indication of the risk associated with investing in those securities.
| | | | |
| Western Asset High Yield Fund 2012 Annual Report | | | 43 | |
The following is a summary of the inputs used in valuing the Fund’s assets and liabilities carried at fair value:
| | | | | | | | | | | | | | | | |
| ASSETS | |
| Description | | Quoted Prices
(Level 1) | | | Other Significant
Observable Inputs
(Level 2) | | | Significant
Unobservable
Inputs (Level 3) | | | Total | |
| Long-term investments†: | | | | | | | | | | | | | | | | |
Corporate bonds & notes | | | — | | | $ | 447,527,182 | | | $ | 3,815,832 | | | $ | 451,343,014 | |
Collateralized senior loans | | | — | | | | 12,738,596 | | | | — | | | | 12,738,596 | |
Convertible bonds & notes | | | — | | | | 644,398 | | | | — | | | | 644,398 | |
Sovereign bonds | | | — | | | | 2,547,021 | | | | — | | | | 2,547,021 | |
Common stocks | | $ | 8,059,333 | | | | — | | | | 12,912,695 | | | | 20,972,028 | |
Preferred stocks | | | 7,691,225 | | | | 558,360 | | | | — | | | | 8,249,585 | |
Purchased options | | | — | | | | 585,040 | | | | — | | | | 585,040 | |
Warrants | | | — | | | | 728,554 | | | | — | | | | 728,554 | |
| Total long-term investments | | $ | 15,750,558 | | | $ | 465,329,151 | | | $ | 16,728,527 | | | $ | 497,808,236 | |
| Short-term investments† | | | — | | | | 19,939,000 | | | | — | | | | 19,939,000 | |
| Total investments | | $ | 15,750,558 | | | $ | 485,268,151 | | | $ | 16,728,527 | | | $ | 517,747,236 | |
| LIABILITIES | |
| Description | | Quoted Prices
(Level 1) | | | Other Significant
Observable Inputs
(Level 2) | | | Significant
Unobservable Inputs (Level 3) | | | Total | |
| Other financial instruments: | | | | | | | | | | | | | | | | |
Written options | | | — | | | $ | 475,974 | | | | — | | | $ | 475,974 | |
Forward foreign currency contracts | | | — | | | | 211,419 | | | | — | | | | 211,419 | |
Credit default swaps on credit indices — buy protection‡ | | | — | | | | 351,582 | | | | — | | | | 351,582 | |
| Total | | | — | | | $ | 1,038,975 | | | | — | | | $ | 1,038,975 | |
| † | See Schedule of Investments for additional detailed categorizations. |
| ‡ | Values include any premiums paid or received with respect to swap contracts. |
The following is a reconciliation of investments in which significant unobservable inputs (Level 3) were used in determining fair value:
| | | | | | | | | | | | | | | | | | | | | | | | |
| Investments in Securities | | Corporate
Bonds &
Notes | | | Collateralized
Senior Loans | | | Common Stocks | | | Preferred Stocks | | | Warrants | | | Total | |
| Balance as of December 31, 2011 | | $ | 5,664,669 | | | $ | 2,030,000 | | | $ | 5,423,203 | | | $ | 517,000 | | | $ | 301,297 | | | $ | 13,936,169 | |
| Accrued premiums/discounts | | | 28,538 | | | | — | | | | — | | | | — | | | | — | | | | 28,538 | |
| Realized gain (loss)1 | | | (1,313,747) | | | | — | | | | — | | | | — | | | | — | | | | (1,313,747) | |
Change in unrealized appreciation (depreciation)2 | | | 1,397,816 | | | | — | | | | 3,443,120 | | | | 41,360 | | | | 397,353 | | | | 5,279,649 | |
| Purchases | | | 2,408,578 | | | | — | | | | 4,046,372 | | | | — | | | | — | | | | 6,454,950 | |
| Sales | | | (2,019,892) | | | | (2,030,000) | | | | — | | | | — | | | | (65,280) | | | | (4,115,172) | |
| Transfers into Level 33 | | | 21,625 | | | | — | | | | — | | | | — | | | | — | | | | 21,625 | |
| Transfers out of Level 34 | | | (2,371,755) | | | | — | | | | — | | | | (558,360) | | | | (633,370) | | | | (3,563,485) | |
| Balance as of December 31, 2012 | | $ | 3,815,832 | | | | — | | | $ | 12,912,695 | | | | — | | | | — | | | $ | 16,728,527 | |
| Net change in unrealized appreciation (depreciation) for investments in securities still held at December 31, 20122 | | $ | 310,713 | | | | — | | | $ | 3,443,120 | | | | — | | | | — | | | $ | 3,753,833 | |
| | |
| 44 | | Western Asset High Yield Fund 2012 Annual Report |
Notes to financial statements (cont’d)
The Fund’s policy is to recognize transfers between levels as of the end of the reporting period.
| 1 | This amount is included in net realized gain (loss) from investment transactions in the accompanying Statement of Operations. |
| 2 | This amount is included in the change in net unrealized appreciation (depreciation) in the accompanying Statement of Operations. Change in unrealized appreciation (depreciation) includes net unrealized appreciation (depreciation) resulting from changes in investment values during the reporting period and the reversal of previously recorded unrealized appreciation (depreciation) when gains or losses are realized. |
| 3 | Transferred into Level 3 as a result of the unavailability of a quoted price in an active market for an identical investment or the unavailability of other significant observable inputs. |
| 4 | Transferred out of Level 3 as a result of the availability of a quoted price in an active market for an identical investment or the availability of other significant observable inputs. |
The following table summarizes the valuation techniques used and unobservable inputs approved by the Valuation Committee to determine the fair value of certain, material Level 3 investments. The table does not include Level 3 investments with values derived utilizing prices from prior transactions or third party pricing information without adjustment (e.g., broker quotes, pricing services, net asset values).
| | | | | | | | | | | | | | | | | | | | |
| | | Fair Value at
12/31/12 (000’s) | | | Valuation
Technique(s) | | | Unobservable Input(s) | | | Weighted
Average | | | Impact to
Valuation from
an Increase in
Input* | |
| Equity Securities | | $ | 5,416 | | | | Market approach | | | | Liquidity discount | | | | 2.6 | % | | | Decrease | |
| * | This column represents the directional change in the fair value of the Level 3 investments that would result in an increase from the corresponding input. A decrease to the unobservable input would have the opposite effect. Significant increases and decreases in these inputs in isolation could result in significantly higher or lower fair value measurements. |
(b) Repurchase agreements. The Fund may enter into repurchase agreements with institutions that its investment adviser has determined are creditworthy. Each repurchase agreement is recorded at cost. Under the terms of a typical repurchase agreement, the Fund acquires a debt security subject to an obligation of the seller to repurchase, and of the Fund to resell, the security at an agreed-upon price and time, thereby determining the yield during the Fund’s holding period. When entering into repurchase agreements, it is the Fund’s policy that its custodian or a third party custodian, acting on the Fund’s behalf, take possession of the underlying collateral securities, the market value of which, at all times, at least equals the principal amount of the repurchase transaction, including accrued interest. To the extent that any repurchase transaction maturity exceeds one business day, the value of the collateral is marked-to-market and measured against the value of the agreement in an effort to ensure the adequacy of the collateral. If the counterparty defaults, the Fund generally has the right to use the collateral to satisfy the terms of the repurchase transaction. However, if the market value of the collateral declines during the period in which the Fund seeks to assert its rights or if bankruptcy proceedings are commenced with respect to the seller of the security, realization of the collateral by the Fund may be delayed or limited.
(c) Forward foreign currency contracts. The Fund enters into a forward foreign currency contract to hedge against foreign currency exchange rate risk on its non-U.S. dollar denominated securities or to facilitate settlement of a foreign currency denominated portfolio transaction. A forward foreign currency contract is an
| | | | |
| Western Asset High Yield Fund 2012 Annual Report | | | 45 | |
agreement between two parties to buy and sell a currency at a set price with delivery and settlement at a future date. The contract is marked-to-market daily and the change in value is recorded by the Fund as an unrealized gain or loss. When a forward foreign currency contract is closed, through either delivery or offset by entering into another forward foreign currency contract, the Fund recognizes a realized gain or loss equal to the difference between the value of the contract at the time it was opened and the value of the contract at the time it is closed.
Forward foreign currency contracts involve elements of market risk in excess of the amounts reflected on the Statement of Assets and Liabilities. The Fund bears the risk of an unfavorable change in the foreign exchange rate underlying the forward foreign currency contract. Risks may also arise upon entering into these contracts from the potential inability of the counterparties to meet the terms of their contracts.
(d) Foreign currency translation. Investment securities and other assets and liabilities denominated in foreign currencies are translated into U.S. dollar amounts based upon prevailing exchange rates on the date of valuation. Purchases and sales of investment securities and income and expense items denominated in foreign currencies are translated into U.S. dollar amounts based upon prevailing exchange rates on the respective dates of such transactions.
The Fund does not isolate that portion of the results of operations resulting from fluctuations in foreign exchange rates on investments from the fluctuations arising from changes in market prices of securities held. Such fluctuations are included with the net realized and unrealized gain or loss on investments.
Net realized foreign exchange gains or losses arise from sales of foreign currencies, including gains and losses on forward foreign currency contracts, currency gains or losses realized between the trade and settlement dates on securities transactions, and the difference between the amounts of dividends, interest, and foreign withholding taxes recorded on the Fund’s books and the U.S. dollar equivalent of the amounts actually received or paid. Net unrealized foreign exchange gains and losses arise from changes in the values of assets and liabilities, other than investments in securities, on the date of valuation, resulting from changes in exchange rates.
Foreign security and currency transactions may involve certain considerations and risks not typically associated with those of U.S. dollar denominated transactions as a result of, among other factors, the possibility of lower levels of governmental supervision and regulation of foreign securities markets and the possibility of political or economic instability.
(e) Loan participations. The Fund may invest in loans arranged through private negotiation between one or more financial institutions. The Fund’s investment in any such loan may be in the form of a participation in or an assignment of the loan. In connection with purchasing participations, the Fund generally will have no right to enforce compliance by the borrower with the terms of the loan agreement related to the loan, or any rights of off-set against the borrower and the Fund may not benefit directly from any collateral supporting the loan in which it has purchased the participation.
| | |
| 46 | | Western Asset High Yield Fund 2012 Annual Report |
Notes to financial statements (cont’d)
The Fund assumes the credit risk of the borrower, the lender that is selling the participation and any other persons interpositioned between the Fund and the borrower. In the event of the insolvency of the lender selling the participation, the Fund may be treated as a general creditor of the lender and may not benefit from any off-set between the lender and the borrower.
(f) Unfunded loan commitments. The Fund may enter into certain credit agreements all or a portion of which may be unfunded. The Fund is obligated to fund these commitments at the borrower’s discretion. The commitments are disclosed in the accompanying Schedule of Investments. At December 31, 2012, the Fund had sufficient cash and/or securities to cover these commitments.
(g) Written options. When the Fund writes an option, an amount equal to the premium received by the Fund is recorded as a liability, the value of which is marked-to-market daily to reflect the current market value of the option written. If the option expires, the premium received is recorded as a realized gain. When a written call option is exercised, the difference between the premium received plus the option exercise price and the Fund’s basis in the underlying security (in the case of a covered written call option), or the cost to purchase the underlying security (in the case of an uncovered written call option), including brokerage commission, is recognized as a realized gain or loss. When a written put option is exercised, the amount of the premium received is subtracted from the cost of the security purchased by the Fund from the exercise of the written put option to form the Fund’s basis in the underlying security purchased. The writer or buyer of an option traded on an exchange can liquidate the position before the exercise of the option by entering into a closing transaction. The cost of a closing transaction is deducted from the original premium received resulting in a realized gain or loss to the Fund.
The risk in writing a covered call option is that the Fund may forego the opportunity of profit if the market price of the underlying security increases and the option is exercised. The risk in writing a put option is that the Fund may incur a loss if the market price of the underlying security decreases and the option is exercised. The risk in writing an uncovered call option is that the Fund is exposed to the risk of loss if the market price of the underlying security increases. In addition, there is the risk that the Fund may not be able to enter into a closing transaction because of an illiquid secondary market.
(h) Swaptions. The Fund purchases and writes swaption contracts to manage exposure to an underlying instrument. The Fund may also purchase or write options to manage exposure to fluctuations in interest rates or to enhance yield. Swaption contracts written by the Fund represent an option that gives the purchaser the right, but not the obligation, to enter into a previously agreed upon swap contract at a future date. Swaption contracts purchased by the Fund represent an option that gives the Fund the right, but not the obligation, to enter into a previously agreed upon swap contract at a future date.
When the Fund writes a swaption, an amount equal to the premium received by the Fund is recorded as a liability, the value of which is marked-to-market daily to reflect
| | | | |
| Western Asset High Yield Fund 2012 Annual Report | | | 47 | |
the current market value of the swaption written. If the swaption expires, the Fund realizes a gain equal to the amount of the premium received.
When the Fund purchases a swaption, an amount equal to the premium paid by the Fund is recorded as an investment on the Statement of Assets and Liabilities, the value of which is marked-to-market daily to reflect the current market value of the swaption purchased. If the swaption expires, the Fund realizes a loss equal to the amount of the premium paid.
Swaptions are marked-to-market daily based upon quotations from market makers. Changes in the value of the swaption are reported as unrealized gains or losses in the Statement of Operations.
(i) Swap agreements. The Fund invests in swaps for the purpose of managing its exposure to interest rate, credit or market risk, or for other purposes, including to increase the Fund’s return. The use of swaps involves risks that are different from those associated with other portfolio transactions.
Swap contracts are marked-to-market daily and changes in value are recorded as unrealized appreciation (depreciation). Gains or losses are realized upon termination of the swap agreement. Collateral, in the form of restricted cash or securities, may be required to be held in segregated accounts with the Fund’s custodian in compliance with the terms of the swap contracts. Securities posted as collateral for swap contracts are identified in the Schedule of Investments and restricted cash, if any, is identified on the Statement of Assets and Liabilities. Risks may exceed amounts recorded in the Statement of Assets and Liabilities. These risks include changes in the returns of the underlying instruments, failure of the counterparties to perform under the contracts’ terms, and the possible lack of liquidity with respect to the swap agreements.
Payments received or made at the beginning of the measurement period are reflected as a premium or deposit, respectively, on the Statement of Assets and Liabilities. These upfront payments are amortized over the life of the swap and are recognized as realized gain or loss in the Statement of Operations. Net periodic payments received or paid by the Fund are recognized as a realized gain or loss in the Statement of Operations.
The Fund’s maximum exposure in the event of a defined credit event on a credit default swap to sell protection is the notional amount. As of December 31, 2012, the Fund did not hold any credit default swaps to sell protection.
For average notional amounts of swaps held during the year ended December 31, 2012, see Note 4.
Credit default swaps
The Fund enters into credit default swap (“CDS”) contracts for investment purposes, to manage its credit risk or to add leverage. CDS agreements involve one party making a stream of payments to another party in exchange for the right to receive a specified return in the event of a default by a third party, typically corporate or sovereign issuers, on a specified obligation, or in the event of a write-down,
| | |
| 48 | | Western Asset High Yield Fund 2012 Annual Report |
Notes to financial statements (cont’d)
principal shortfall, interest shortfall or default of all or part of the referenced entities comprising a credit index. The Fund may use a CDS to provide protection against defaults of the issuers (i.e., to reduce risk where the Fund has exposure to an issuer) or to take an active long or short position with respect to the likelihood of a particular issuer’s default. As a seller of protection, the Fund generally receives an upfront payment or a stream of payments throughout the term of the swap provided that there is no credit event. If the Fund is a seller of protection and a credit event occurs, as defined under the terms of that particular swap agreement, the maximum potential amount of future payments (undiscounted) that the Fund could be required to make under a credit default swap agreement would be an amount equal to the notional amount of the agreement. These amounts of potential payments will be partially offset by any recovery of values from the respective referenced obligations. As a seller of protection, the Fund effectively adds leverage to its portfolio because, in addition to its total net assets, the Fund is subject to investment exposure on the notional amount of the swap. As a buyer of protection, the Fund generally receives an amount up to the notional value of the swap if a credit event occurs.
Implied spreads are the theoretical prices a lender receives for credit default protection. When spreads rise, market perceived credit risk rises and when spreads fall, market perceived credit risk falls. The implied credit spread of a particular referenced entity reflects the cost of buying/selling protection and may include upfront payments required to enter into the agreement. Wider credit spreads and decreasing market values, when compared to the notional amount of the swap, represent a deterioration of the referenced entity’s credit soundness and a greater likelihood or risk of default or other credit event occurring as defined under the terms of the agreement. Credit spreads utilized in determining the period end market value of credit default swap agreements on corporate or sovereign issues are disclosed in the Notes to Financial Statements and serve as an indicator of the current status of the payment/performance risk and represent the likelihood or risk of default for credit derivatives. For credit default swap agreements on asset-backed securities and credit indices, the quoted market prices and resulting values, particularly in relation to the notional amount of the contract as well as the annual payment rate, serve as an indication of the current status of the payment/performance risk.
The Fund’s maximum risk of loss from counterparty risk, as the protection buyer, is the fair value of the contract (this risk is mitigated by the posting of collateral by the counterparty to the Fund to cover the Fund’s exposure to the counterparty). As the protection seller, the Fund’s maximum risk is the notional amount of the contract. Credit default swaps are considered to have credit risk-related contingent features since they require payment by the protection seller to the protection buyer upon the occurrence of a defined credit event.
Entering into a CDS agreement involves, to varying degrees, elements of credit, market and documentation risk in excess of the related amounts recognized on the Statement of Assets and Liabilities. Such risks involve the possibility that there will be no liquid market for these agreements, that the counterparty to the agreement may default on its obligation to perform or disagree as to the meaning of the
| | | | |
| Western Asset High Yield Fund 2012 Annual Report | | | 49 | |
contractual terms in the agreement, and that there will be unfavorable changes in net interest rates.
(j) Credit and market risk. The Fund invests in high-yield and emerging market instruments that are subject to certain credit and market risks. The yields of high-yield and emerging market debt obligations reflect, among other things, perceived credit and market risks. The Fund’s investments in securities rated below investment grade typically involve risks not associated with higher rated securities including, among others, greater risk related to timely and ultimate payment of interest and principal, greater market price volatility and less liquid secondary market trading. The consequences of political, social, economic or diplomatic changes may have disruptive effects on the market prices of investments held by the Fund. The Fund’s investments in non-U.S. dollar denominated securities may also result in foreign currency losses caused by devaluations and exchange rate fluctuations.
(k) Foreign investment risks. The Fund’s investments in foreign securities may involve risks not present in domestic investments. Since securities may be denominated in foreign currencies, may require settlement in foreign currencies or pay interest or dividends in foreign currencies, changes in the relationship of these foreign currencies to the U.S. dollar can significantly affect the value of the investments and earnings of the Fund. Foreign investments may also subject the Fund to foreign government exchange restrictions, expropriation, taxation or other political, social or economic developments, all of which affect the market and/or credit risk of the investments.
(l) Counterparty risk and credit-risk-related contingent features of derivative instruments. The Fund may invest in certain securities or engage in other transactions, where the Fund is exposed to counterparty credit risk in addition to broader market risks. The Fund may invest in securities of issuers, which may also be considered counterparties as trading partners in other transactions. This may increase the risk of loss in the event of default or bankruptcy by the counterparty or if the counterparty otherwise fails to meet its contractual obligations. The Fund’s investment manager attempts to mitigate counterparty risk by (i) periodically assessing the creditworthiness of its trading partners, (ii) monitoring and/or limiting the amount of its net exposure to each individual counterparty based on its assessment and (iii) requiring collateral from the counterparty for certain transactions. Market events and changes in overall economic conditions may impact the assessment of such counterparty risk by the investment manager. In addition, declines in the values of underlying collateral received may expose the Fund to increased risk of loss.
The Fund has entered into master agreements with certain of its derivative counterparties that provide for general obligations, representations, agreements, collateral, events of default or termination and credit related contingent features. The credit related contingent features include, but are not limited to, a percentage decrease in the Fund’s net assets or NAV over a specified period of time. If these credit related contingent features were triggered, the derivatives counterparty could terminate the positions and demand payment or require additional collateral.
| | |
| 50 | | Western Asset High Yield Fund 2012 Annual Report |
Notes to financial statements (cont’d)
As of December 31, 2012, the Fund held written options, forward foreign currency contracts and credit default swaps with credit related contingent features which had a liability position of $1,038,975. If a contingent feature in the master agreements would have been triggered, the Fund would have been required to pay this amount to its derivatives counterparties. As of December 31, 2012, the Fund had posted with its counterparties cash and/or securities as collateral to cover the net liability of these derivatives amounting to $590,000, which could be used to reduce the required payment.
(m) Security transactions and investment income. Security transactions are accounted for on a trade date basis. Interest income, adjusted for amortization of premium and accretion of discount, is recorded on the accrual basis. Dividend income is recorded on the ex-dividend date. Foreign dividend income is recorded on the ex-dividend date or as soon as practicable after the Fund determines the existence of a dividend declaration after exercising reasonable due diligence. The cost of investments sold is determined by use of the specific identification method. To the extent any issuer defaults or a credit event occurs that impacts the issuer, the Fund may halt any additional interest income accruals and consider the realizability of interest accrued up to the date of default or credit event.
(n) Distributions to shareholders. Effective October 1, 2012, distributions from net investment income of the Fund are declared each business day to shareholders of record, and are paid monthly. Prior to October 1, 2012, distributions from net investment income of the Fund, if any, were declared and paid on a quarterly basis. Distributions of net realized gains, if any, are declared at least annually. Distributions to shareholders of the Fund are recorded on the ex-dividend date and are determined in accordance with income tax regulations, which may differ from GAAP.
(o) Share class accounting. Investment income, common expenses and realized/unrealized gains (losses) on investments are allocated to the various classes of the Fund on the basis of daily net assets of each class. Fees relating to a specific class are charged directly to that share class.
(p) Compensating balance arrangements. The Fund has an arrangement with its custodian bank whereby a portion of the custodian’s fees is paid indirectly by credits earned on the Fund’s cash on deposit with the bank.
(q) Federal and other taxes. It is the Fund’s policy to comply with the federal income and excise tax requirements of the Internal Revenue Code of 1986 (the “Code”), as amended, applicable to regulated investment companies. Accordingly, the Fund intends to distribute its taxable income and net realized gains, if any, to shareholders in accordance with timing requirements imposed by the Code. Therefore, no federal or state income tax provision is required in the Fund’s financial statements.
Management has analyzed the Fund’s tax positions taken on income tax returns for all open tax years and has concluded that as of December 31, 2012, no provision for income tax is required in the Fund’s financial statements. The Fund’s federal and state income and federal excise tax returns for tax years for which the applicable statutes of limitations have not expired are subject to examination by the Internal Revenue Service and state departments of revenue.
| | | | |
| Western Asset High Yield Fund 2012 Annual Report | | | 51 | |
Under the applicable foreign tax laws, a withholding tax may be imposed on interest, dividends and capital gains at various rates.
(r) Reclassification. GAAP requires that certain components of net assets be reclassified to reflect permanent differences between financial and tax reporting. These reclassifications have no effect on net assets or net asset value per share. During the current year, the following reclassifications have been made:
| | | | | | | | |
| | | Undistributed Net
Investment Income | | | Accumulated Net
Realized Loss | |
| (a) | | $ | (353,735) | | | $ | 353,735 | |
| (a) | Reclassifications are primarily due to foreign currency transactions treated as ordinary income for tax purposes and book/tax differences in the treatment of swaps. |
2. Investment management agreement and other transactions with affiliates
The Fund has an investment management agreement with Legg Mason Partners Fund Advisor, LLC (“LMPFA”). Western Asset Management Company (“Western Asset”) is the investment adviser. LMPFA and Western Asset are wholly-owned subsidiaries of Legg Mason, Inc (“Legg Mason”).
LMPFA provides the Fund with management and administrative services for which the Fund pays a fee calculated daily and paid monthly, at an annual rate of 0.55% of the Fund’s average daily net assets. The investment manager has agreed to waive and/or reimburse operating expenses (other than interest, taxes, extraordinary expenses, deferred organizational expenses and brokerage commissions) so that total operating expenses are not expected to exceed 1.05%, 1.80%, 1.30% and 0.65% for Class A, Class C, Class R and Class IS shares, respectively. Western Asset also agreed to waive its advisory fee (which is paid by LMPFA, and not the Fund) under the Fee Cap. These expense limitation arrangements cannot be terminated prior to December 31, 2014 without the Board of Directors’ consent.
During the year ended December 31, 2012, fees waived and/or expense reimbursed amounted to $1,568.
Prior to July 1, 2012, the investment manager was permitted to recapture amounts waived or reimbursed to a class within three years after the day on which the investment manager earned the fee or incurred the expense if the class’ total annual operating expenses have fallen to a level below the lower of the limit described above or the limit then in effect.
Effective July 1, 2012, the investment manager is permitted to recapture amounts waived and/or reimbursed to a class within two years after the fiscal year in which the investment manager earned the fee or incurred the expense if the class’ total annual operating expenses have fallen to a level below the limits described above. In no case will the investment manager recapture any amount that would result, on any particular business day of the Fund, in the class’ total annual operating expenses exceeding this limit or any other lower limit then in effect.
| | |
| 52 | | Western Asset High Yield Fund 2012 Annual Report |
Notes to financial statements (cont’d)
Pursuant to these arrangements, at December 31, 2012, the Fund had remaining fee waivers and/or expense reimbursements subject to recapture by LMPFA and respective dates of expiration as follows:
| | | | | | | | | | | | | | | | |
| | | Class A† | | | Class C† | | | Class R† | | | Class IS | |
| Expires December 31, 2014 | | $ | 231 | | | $ | 221 | | | $ | 5 | | | $ | 1,111 | |
| † | The class commenced operations on April 30, 2012. |
During the year ended December 31, 2012, LMPFA did not recapture any fees.
Legg Mason Investor Services, LLC (“LMIS”), a wholly-owned broker-dealer subsidiary of Legg Mason, serves as the Fund’s sole and exclusive distributor.
There is a maximum initial sales charge of 4.25% for Class A shares. There is a contingent deferred sales charge (“CDSC”) of 1.00% on Class C shares, which applies if redemption occurs within 12 months from purchase payment. In certain cases, Class A shares have a 1.00% CDSC, which applies if redemption occurs within 18 months from purchase payment. This CDSC only applies to those purchases of Class A shares, which, when combined with current holdings of other shares of funds sold by LMIS, equal or exceed $1,000,000 in the aggregate. These purchases do not incur an initial sales charge.
For the year ended December 31, 2012, LMIS and its affiliates received sales charges of $2,172 on sales of the Fund’s Class A shares. In addition, for the year ended December 31, 2012, there were no CDSCs paid to LMIS and its affiliates.
As of December 31, 2012, Legg Mason and its affiliates owned 16% of the Fund.
All officers and one Director of the Corporation are employees of Legg Mason or its affiliates and do not receive compensation from the Corporation.
3. Investments
During the year ended December 31, 2012, the aggregate cost of purchases and proceeds from sales of investments (excluding short-term investments) were as follows:
| | | | |
| Purchases | | $ | 447,392,178 | |
| Sales | | | 392,103,753 | |
At December 31, 2012, the aggregate gross unrealized appreciation and depreciation of investments for federal income tax purposes were as follows:
| | | | |
| Gross unrealized appreciation | | $ | 30,879,799 | |
| Gross unrealized depreciation | | | (13,393,713) | |
| Net unrealized appreciation | | $ | 17,486,086 | |
| | | | |
| Western Asset High Yield Fund 2012 Annual Report | | | 53 | |
During the year ended December 31, 2012, written option transactions for the Fund were as follows:
| | | | | | | | |
| | | Notional Amount | | | Premiums | |
| Written options, outstanding as of December 31, 2011 | | | — | | | | — | |
| Options written | | $ | 326,633,400 | | | $ | 3,239,094 | |
| Options closed | | | (81,340,000) | | | | (1,626,800) | |
| Options exercised | | | (32,076,000) | | | | (191,486) | |
| Options expired | | | (154,417,400) | | | | (1,109,208) | |
| Written options, outstanding as of December 31, 2012 | | $ | 58,800,000 | | | $ | 311,600 | |
At December 31, 2012, the Fund had the following open forward foreign currency contracts:
| | | | | | | | | | | | | | | | | | |
Foreign
Currency | | Counterparty | | Local
Currency | | | Market
Value | | | Settlement
Date | | | Unrealized
Loss | |
| Contracts to Sell: | |
| Euro | | Credit Suisse | | | 2,940,243 | | | $ | 3,882,520 | | | | 2/15/13 | | | $ | (132,475) | |
| Euro | | Royal Bank of Scotland PLC | | | 300,000 | | | | 396,143 | | | | 2/15/13 | | | | (10,447) | |
| Euro | | Royal Bank of Scotland PLC | | | 1,800,000 | | | | 2,376,856 | | | | 2/15/13 | | | | (68,497) | |
| Net unrealized loss on open forward foreign currency contracts | | | $ | (211,419) | |
At December 31, 2012, the Fund held the following open swap contracts:
| | | | | | | | | | | | | | | | | | | | | | |
| CREDIT DEFAULT SWAPS ON CREDIT INDICES — BUY PROTECTION1 | |
Swap Counterparty
(Reference Entity) | | Notional
Amount2 | | | Termination
Date | | | Periodic
Payments
Made by the
Fund† | | Market
Value3 | | | Upfront
Premiums
Paid
(Received) | | | Unrealized
Depreciation | |
BNP Paribas
(Markit CDX.NA.HY.17 Index) | | $ | 2,976,000 | | | | 12/20/16 | | | 5.000% quarterly | | $ | (73,076) | | | $ | 70,043 | | | $ | (143,119) | |
BNP Paribas
(Markit CDX.NA.HY.17 Index) | | | 1,728,000 | | | | 12/20/16 | | | 5.000% quarterly | | | (42,431) | | | | 42,439 | | | | (84,870) | |
Morgan Stanley & Co. Inc.
(Markit CDX.NA.HY.17 Index) | | | 3,552,000 | | | | 12/20/16 | | | 5.000% quarterly | | | (87,218) | | | | 90,870 | | | | (178,088) | |
Bank of America Securities LLC
(Markit CDX.NA.HY.18 Index) | | | 891,000 | | | | 6/20/17 | | | 5.000% quarterly | | | (12,882) | | | | 3,842 | | | | (16,724) | |
Barclays Capital Inc.
(Markit CDX.NA.HY.18 Index) | | | 2,475,000 | | | | 6/20/17 | | | 5.000% quarterly | | | (35,783) | | | | 29,634 | | | | (65,417) | |
Barclays Capital Inc.
(Markit CDX.NA.HY.18 Index) | | | 3,168,000 | | | | 6/20/17 | | | 5.000% quarterly | | | (45,802) | | | | 15,786 | | | | (61,588) | |
BNP Paribas
(Markit CDX.NA.HY.18 Index) | | | 3,762,000 | | | | 6/20/17 | | | 5.000% quarterly | | | (54,390) | | | | 152,178 | | | | (206,568) | |
| Total | | $ | 18,552,000 | | | | | | | | | $ | (351,582) | | | $ | 404,792 | | | $ | (756,374) | |
| 1 | If the Fund is a buyer of protection and a credit event occurs, as defined under the terms of that particular swap agreement, the Fund will either (i) receive from the seller of protection an amount equal to the notional amount of the swap and deliver the referenced obligation or the underlying securities comprising the referenced index or (ii) receive a net settlement amount in the form of cash or securities equal to the notional amount of the swap less the recovery value of the referenced obligation or the underlying securities comprising the referenced index. |
| 2 | The maximum potential amount the Fund could be required to pay as a seller of credit protection or receive as a buyer of credit protection if a credit event occurs as defined under the terms of that particular swap agreement. |
| | |
| 54 | | Western Asset High Yield Fund 2012 Annual Report |
Notes to financial statements (cont’d)
| 3 | The quoted market prices and resulting values for credit default swap agreements on asset-backed securities and credit indices serve as an indicator of the current status of the payment/performance risk and represent the likelihood of an expected liability (or profit) for the credit derivative should the notional amount of the swap agreement been closed/sold as of the period end. Decreasing market values (sell protection) or increasing market values (buy protection) when compared to the notional amount of the swap, represent a deterioration of the referenced entity’s credit soundness and a greater likelihood or risk of default or other credit event occurring as defined under the terms of the agreement. |
| † | Percentage shown is an annual percentage rate. |
4. Derivative instruments and hedging activities
GAAP requires enhanced disclosure about an entity’s derivative and hedging activities.
Below is a table, grouped by derivative type, that provides information about the fair value and the location of derivatives within the Statement of Assets and Liabilities at December 31, 2012.
| | | | |
| ASSET DERIVATIVES1 | |
| | | Credit Risk | |
| Purchased options2 | | $ | 585,040 | |
| | | | | | | | | | | | |
|
| LIABILITY DERIVATIVES1 | |
| | | Foreign
Exchange Risk | | | Credit Risk | | | Total | |
| Written options | | | — | | | $ | 475,974 | | | $ | 475,974 | |
| Swap contracts3 | | | — | | | | 351,582 | | | | 351,582 | |
| Forward foreign currency contracts | | $ | 211,419 | | | | — | | | | 211,419 | |
| Total | | $ | 211,419 | | | $ | 827,556 | | | $ | 1,038,975 | |
| 1 | Generally, the balance sheet location for asset derivatives is receivables/net unrealized appreciation (depreciation) and for liability derivatives is payables/net unrealized appreciation (depreciation). |
| 2 | Market value of purchased options is reported in Investments at value in the Statement of Assets and Liabilities. |
| 3 | Values include premiums paid (received) on swap contracts which are shown separately in the Statement of Assets and Liabilities. |
The following tables provide information about the effect of derivatives and hedging activities on the Fund’s Statement of Operations for the year ended December 31, 2012. The first table provides additional detail about the amounts and sources of gains (losses) realized on derivatives during the period. The second table provides additional information about the change in unrealized appreciation (depreciation) resulting from the Fund’s derivatives and hedging activities during the period.
| | | | | | | | | | | | |
| AMOUNT OF REALIZED GAIN (LOSS) ON DERIVATIVES RECOGNIZED | |
| | | Foreign Exchange
Risk | | | Credit
Risk | | | Total | |
| Purchased options1 | | | — | | | $ | (1,489,091) | | | $ | (1,489,091) | |
| Written options | | | — | | | | 1,870,144 | | | | 1,870,144 | |
| Swap contracts | | | — | | | | 708,587 | | | | 708,587 | |
| Forward foreign currency contracts | | $ | 343,470 | | | | — | | | | 343,470 | |
| Total | | $ | 343,470 | | | $ | 1,089,640 | | | $ | 1,433,110 | |
| 1 | Net realized gain (loss) from purchased options is reported in net realized gain (loss) from investment transactions in the Statement of Operations. |
| | | | |
| Western Asset High Yield Fund 2012 Annual Report | | | 55 | |
| | | | | | | | | | | | |
| CHANGE IN UNREALIZED APPRECIATION (DEPRECIATION) ON DERIVATIVES RECOGNIZED | |
| | | Foreign Exchange
Risk | | | Credit
Risk | | | Total | |
| Purchased options1 | | | — | | | $ | 201,120 | | | $ | 201,120 | |
| Written options | | | — | | | | (164,374) | | | | (164,374) | |
| Swap contracts | | | — | | | | (799,971) | | | | (799,971) | |
| Forward foreign currency contracts | | $ | (467,640) | | | | — | | | | (467,640) | |
| Total | | $ | (467,640) | | | $ | (763,225) | | | $ | (1,230,865) | |
| 1 | The change in unrealized appreciation (depreciation) from purchased options is reported in the change in net unrealized appreciation (depreciation) from investments in the Statement of Operations. |
During the year ended December 31, 2012, the volume of derivative activity for the Fund was as follows:
| | | | |
| | | Average Market
Value | |
| Purchased options | | $ | 411,866 | |
| Written options | | | 336,870 | |
| Forward foreign currency contracts (to sell) | | | 5,294,327 | |
| |
| | | Average Notional
Balance | |
| Credit default swap contracts (to buy protection) | | $ | 20,419,154 | |
| Credit default swap contracts (to sell protection)† | | | 8,582,308 | |
| † | At December 31, 2012, there were no open positions held in this derivative. |
5. Class specific expenses, waivers and/or expense reimbursements
The Fund has adopted a Rule 12b-1 distribution plan and under that plan the Fund pays a service and/or distribution fee with respect to its Class A, Class C and Class R shares calculated at the annual rate of 0.25%, 1.00% and 0.50% of the average daily net assets of each class, respectively. Service and distribution fees are accrued and paid monthly.
For the year ended December 31, 2012, class specific expenses were as follows:
| | | | | | | | | | | | |
| | | Service and/or Distribution Fees | | | Transfer Agent
Fees | | | Shareholder Reports* | |
| Class A† | | $ | 309 | | | $ | 290 | | | | — | |
| Class C† | | | 475 | | | | 252 | | | | — | |
| Class R† | | | 35 | | | | 18 | | | | — | |
| Class I | | | — | | | | 165,320 | | | $ | 8,935 | |
| Class IS | | | — | | | | 6,476 | | | | 3,061 | |
| Total | | $ | 819 | | | $ | 172,356 | | | $ | 11,996 | |
| * | For the period January 1, 2012 through May 31, 2012. Subsequent to May 31, 2012, these expenses were accrued as common fund expenses. |
| † | For the period April 30, 2012 (commencement of operations) to December 31, 2012. |
| | |
| 56 | | Western Asset High Yield Fund 2012 Annual Report |
Notes to financial statements (cont’d)
For the year ended December 31, 2012, waivers and/or expense reimbursements by class were as follows:
| | | | |
| | | Waivers/Expense
Reimbursements | |
| Class A† | | $ | 231 | |
| Class C† | | | 221 | |
| Class R† | | | 5 | |
| Class I | | | — | |
| Class IS | | | 1,111 | |
| Total | | $ | 1,568 | |
| † | For the period April 30, 2012 (commencement of operations) to December 31, 2012. |
6. Distributions to shareholders by class
| | | | | | | | |
| | | Year Ended
December 31, 2012 | | | Year Ended
December 31, 2011 | |
| Net Investment Income: | |
| Class A† | | $ | 14,164 | | | | — | |
| Class C† | | | 4,366 | | | | — | |
| Class R† | | | 585 | | | | — | |
| Class I | | | 27,480,396 | | | $ | 29,090,368 | |
| Class IS | | | 8,111,829 | | | | 9,982,561 | |
| Total | | $ | 35,611,340 | | | $ | 39,072,929 | |
| † | For the period April 30, 2012 (commencement of operations) to December 31, 2012. |
7. Capital shares
At December 31, 2012, the Corporation had 37.5 billion shares of capital stock authorized with a par value of $0.001 per share. Transactions in shares of each class were as follows:
| | | | | | | | | | | | | | | | |
| | | Year Ended
December 31, 2012 | | | Year Ended
December 31, 2011 | |
| | | Shares | | | Amount | | | Shares | | | Amount | |
| Class A† | |
| Shares sold | | | 45,418 | | | $ | 398,504 | | | | — | | | | — | |
| Shares issued on reinvestment | | | 1,620 | | | | 14,137 | | | | — | | | | — | |
| Shares repurchased | | | (1,270) | | | | (11,102) | | | | — | | | | — | |
| Net increase | | | 45,768 | | | $ | 401,539 | | | | — | | | | — | |
| | | | |
| Class C† | | | | | | | | | | | | | | | | |
| Shares sold | | | 18,879 | | | $ | 164,488 | | | | — | | | | — | |
| Shares issued on reinvestment | | | 498 | | | | 4,341 | | | | — | | | | — | |
| Shares repurchased | | | (1,439) | | | | (12,579) | | | | — | | | | — | |
| Net increase | | | 17,938 | | | $ | 156,250 | | | | — | | | | — | |
| | | | |
| Class R† | | | | | | | | | | | | | | | | |
| Shares sold | | | 1,161 | | | $ | 10,000 | | | | — | | | | — | |
| Shares issued on reinvestment | | | 68 | | | | 585 | | | | — | | | | — | |
| Net increase | | | 1,229 | | | $ | 10,585 | | | | — | | | | — | |
| | | | |
| Western Asset High Yield Fund 2012 Annual Report | | | 57 | |
| | | | | | | | | | | | | | | | |
| | | Year Ended
December 31, 2012 | | | Year Ended
December 31, 2011 | |
| | | Shares | | | Amount | | | Shares | | | Amount | |
| Class I | | | | | | | | | | | | | | | | |
| Shares sold | | | 24,871,827 | | | $ | 213,205,093 | | | | 39,566,506 | | | $ | 337,234,417 | |
| Shares issued on reinvestment | | | 3,091,497 | | | | 26,558,559 | | | | 3,284,135 | | | | 27,752,689 | |
| Shares repurchased | | | (27,165,220) | | | | (234,134,521) | | | | (51,504,196) | | | | (452,159,918) | |
| Net increase (decrease) | | | 798,104 | | | $ | 5,629,131 | | | | (8,653,555) | | | $ | (87,172,812) | |
| | | | |
| Class IS | | | | | | | | | | | | | | | | |
| Shares sold | | | 4,204,414 | | | $ | 37,185,918 | | | | 4,463,493 | | | $ | 39,539,304 | |
| Shares issued on reinvestment | | | 891,706 | | | | 7,784,963 | | | | 1,172,455 | | | | 9,982,561 | |
| Shares repurchased | | | (1,654,872) | | | | (14,448,961) | | | | (5,724,718) | | | | (48,687,616) | |
| Net increase (decrease) | | | 3,441,248 | | | $ | 30,521,920 | | | | (88,770) | | | $ | 834,249 | |
| † | For the period April 30, 2012 (commencement of operations) to December 31, 2012. |
8. Income tax information and distributions to shareholders
Subsequent to the fiscal year end, the Fund has made the following distributions per share:
| | | | | | | | | | | | | | | | | | | | |
Record Date
Payable Date | | Class A | | | Class C | | | Class R | | | Class I | | | Class IS | |
Daily
1/31/2013 | | $ | 0.047107 | | | $ | 0.041549 | | | $ | 0.045340 | | | $ | 0.049922 | | | $ | 0.051049 | |
The tax character of distributions paid during the fiscal years ended December 31 was as follows:
| | | | | | | | |
| | | 2012 | | | 2011 | |
| Distributions Paid From: | | | | | | | | |
| Ordinary income | | $ | 35,611,340 | | | $ | 39,072,929 | |
As of December 31, 2012, the components of accumulated losses on a tax basis were as follows:
| | | | |
| Undistributed ordinary income — net | | $ | 336,475 | |
| Capital loss carryforward* | | | (115,511,416) | |
| Other book/tax temporary differences(a) | | | (868,815) | |
| Unrealized appreciation (depreciation)(b) | | | 16,360,136 | |
| Total accumulated earnings (losses) — net | | $ | (99,683,620) | |
| * | During the taxable year ended December 31, 2012, the Fund utilized $ 9,020,359 of its capital loss carryforward available from prior years. As of December 31, 2012, the Fund had the following net capital loss carryforwards remaining: |
| | | | |
| Year of Expiration | | Amount | |
| 12/31/2016 | | $ | (32,093,148 | ) |
| 12/31/2017 | | | (83,418,268 | ) |
| | | $ | (115,511,416 | ) |
These amounts will be available to offset any future taxable capital gains.
| (a) | Other book/tax temporary differences are attributable primarily to the realization for tax purposes of unrealized losses on certain foreign currency contracts, the deferral of qualified late year losses for tax purposes, book/tax differences in the accrual of interest income on securities in default and book/tax differences in the timing of the deductibility of various expenses. |
| (b) | The difference between book-basis and tax-basis unrealized appreciation (depreciation) is attributable primarily to the tax deferral of losses on wash sales. |
| | |
| 58 | | Western Asset High Yield Fund 2012 Annual Report |
Report of independent registered public accounting firm
To the Board of Directors of Western Asset Funds, Inc. and to the Shareholders of Western Asset High Yield Fund:
In our opinion, the accompanying statement of assets and liabilities, including the schedule of investments, and the related statements of operations and of changes in net assets and the financial highlights present fairly, in all material respects, the financial position of Western Asset High Yield Fund (one of the Funds comprising Western Asset Funds, Inc., the “Fund”) at December 31, 2012, the results of its operations, the changes in its net assets, and the financial highlights for each of the periods presented, in conformity with accounting principles generally accepted in the United States of America. These financial statements and financial highlights (hereafter referred to as “financial statements”) are the responsibility of the Fund’s management; our responsibility is to express an opinion on these financial statements based on our audits. We conducted our audits of these financial statements in accordance with the standards of the Public Company Accounting Oversight Board (United States). Those standards require that we plan and perform the audit to obtain reasonable assurance about whether the financial statements are free of material misstatement. An audit includes examining, on a test basis, evidence supporting the amounts and disclosures in the financial statements, assessing the accounting principles used and significant estimates made by management, and evaluating the overall financial statement presentation. We believe that our audits, which included confirmation of securities at December 31, 2012 by correspondence with the custodian and brokers, provide a reasonable basis for our opinion.
PricewaterhouseCoopers LLP
Baltimore, Maryland
February 21, 2013
| | | | |
| Western Asset High Yield Fund | | | 59 | |
Board approval of investment management and advisory agreements (unaudited)
The Executive and Contracts Committee of the Board of Directors considered the Investment Management Agreement between the Corporation and LMPFA with respect to the Fund and the Investment Advisory Agreement between LMPFA and Western Asset Management Company (“Western Asset”) (collectively, the “Agreements”) with respect to the Fund at meetings held on September 10, October 18 and October 25, 2012. At a meeting held on November 13, 2012, the Executive and Contracts Committee reported to the full Board of Directors its considerations and recommendation with respect to the Agreements, and the Board of Directors, including a majority of the Independent Directors, considered and approved renewal of the Agreements.
In arriving at their decision to renew the Agreements, the Directors met with representatives of Western Asset, including relevant investment advisory personnel, as well as representatives of LMPFA; reviewed a variety of information prepared by LMPFA and Western Asset and materials provided by Lipper Inc. (“Lipper”) and counsel to the Independent Directors; reviewed performance and expense information for the Fund’s peer group of comparable funds selected and prepared by Lipper and for certain other comparable products available from Western Asset, including separate accounts managed by Western Asset; and requested and reviewed additional information as necessary. These reviews were in addition to information obtained by the Directors at their regular quarterly meetings with respect to the Fund’s performance and other relevant matters, and related discussions with Western Asset’s personnel.
As part of their review, the Directors examined LMPFA’s ability to provide high quality oversight and administrative and shareholder support services to the Fund, and Western Asset’s ability to provide high quality investment management services to the Fund. The Directors considered the experience of LMPFA’s personnel in providing the types of services that LMPFA is responsible for providing to the Fund; the ability of LMPFA to attract and retain capable personnel; the capability and integrity of LMPFA’s senior management and staff; and the level of skill required to provide such services to the Fund. The Directors considered the investment philosophy and research and decision-making processes of Western Asset; the experience of its key advisory personnel responsible for management of the Fund; the ability of Western Asset to attract and retain capable research and advisory personnel; the capability and integrity of Western Asset’s senior management and staff; and the level of skill required to manage the Fund. In addition, the Directors reviewed the quality of LMPFA’s and Western Asset’s services with respect to regulatory compliance and compliance with the investment policies of the Fund and conditions that might affect LMPFA’s or Western Asset’s ability to provide high quality services to the Fund in the future under the Agreements, including its business reputation, financial condition and operational stability. Based on the foregoing, the Directors concluded that Western Asset’s investment process, research capabilities and philosophy were well suited to the Fund given the Fund’s investment objectives and policies, and that LMPFA and Western Asset would be able to meet any reasonably foreseeable obligations under the Agreements.
| | |
| 60 | | Western Asset High Yield Fund |
Board approval of investment management and advisory agreements (unaudited) (cont’d)
In reviewing the quality of the services provided to the Fund, the Directors also reviewed comparisons of the performance of the Fund to the performance of certain comparable funds in its peer group and to its investment benchmark over the one-, three- and five-year periods ended August 31, 2012. In that connection, the Directors noted that the performance of the Fund exceeded its peer average performance for the one-, three- and five-year periods, but was lower than its peer average for the ten-year period. With respect to the Fund, the Directors considered the factors involved in its performance relative to the performance of its investment benchmark and peer group.
The Directors also considered the management fee payable by the Fund to LMPFA, the total expenses payable by the Fund and the fact that LMPFA pays to Western Asset the entire management fee it receives from the Fund. They reviewed information concerning management fees paid to investment advisers of similarly-managed funds, as well as fees paid by Western Asset’s other clients, including separate accounts managed by Western Asset. The Directors observed that although the management fee paid by the Fund to LMPFA was approximately equal to the average of the fees paid by funds in its peer group, total expenses for the Fund were lower than the average of the funds in its peer group. The Directors noted that the management fee paid by the Fund was generally higher than the fees paid by other clients of Western Asset for accounts with similar investment strategies, but that the administrative and operational responsibilities for Western Asset with respect to the Fund were also relatively higher. In light of this difference, the Directors concluded that the management fee paid by the Fund relative to the fees paid by Western Asset’s other clients was reasonable.
The Directors further evaluated the benefits of the advisory relationship to LMPFA and Western Asset, including, among others, the profitability of the relationship to LMPFA and Western Asset; the direct and indirect benefits that LMPFA and Western Asset may receive from its relationship with the Fund, including any “fallout benefits,” such as reputational value derived from serving as investment manager or adviser to the Fund; and the affiliations between LMPFA, Western Asset and certain service providers for the Fund. In that connection, the Directors concluded that LMPFA and Western Asset’s profitability was consistent with levels of profitability that had been determined by courts not to be excessive. The Directors noted that Western Asset does not have soft dollar arrangements.
Finally, the Directors considered, in light of the profitability information provided by LMPFA and Western Asset, the extent to which economies of scale would be realized by Western Asset as the assets of the Fund grow. The Directors determined that the lack of breakpoints was appropriate and that the management fee structure for the Fund is reasonable.
In their deliberations with respect to these matters, the Independent Directors were advised by their independent counsel, who is independent of LMPFA and Western Asset within the meaning of Securities and Exchange Commission rules regarding the independence of counsel. The Independent Directors weighed each of the fore-
| | | | |
| Western Asset High Yield Fund | | | 61 | |
going matters in light of the advice given to them by their independent counsel as to the law applicable to the review of investment advisory contracts. In arriving at a decision, the Directors, including the Independent Directors, did not identify any single matter as all-important or controlling, and the foregoing summary does not detail all the matters considered. The Directors judged the terms and conditions of the Agreements, including the investment advisory fees, in light of all of the surrounding circumstances.
Based upon their review, the Directors, including all of the Independent Directors, determined, in the exercise of their business judgment, that they were generally satisfied with the quality of services being provided by LMPFA and Western Asset, but they would continue to closely monitor the performance of LMPFA and Western Asset; that the fees to be paid to Western Asset and LMPFA under the relevant Agreements were fair and reasonable, given the scope and quality of the services rendered by Western Asset and LMPFA; and that approval of the Agreements was in the best interest of the Fund and its shareholders.
| | |
| 62 | | Western Asset High Yield Fund |
Additional information (unaudited)
Information about Directors and Officers
The business and affairs of Western Asset High Yield Fund (the “Fund”) are conducted by management under the supervision and subject to the direction of its Board of Directors. The business address of each Director is 100 International Drive, Attn: Fund Secretary, Baltimore, Maryland 21202. Information pertaining to the Directors and Officers of the Fund is set forth below.
The Statement of Additional Information includes additional information about Directors and is available, without charge, upon request by calling the Fund at 1-877-721-1926.
| | |
| Independent Directors† | | |
| Ronald J. Arnault | | |
| Year of birth | | 1943 |
| Position(s) held with Fund | | Director |
| Term of office and length of time served1 | | Served since 1997 |
| Principal occupations during the past five years | | Retired. |
| Number of portfolios in fund complex overseen2 | | 12 |
| Other directorships held | | None |
| Anita L. DeFrantz | | |
| Year of birth | | 1952 |
| Position(s) held with Fund | | Director |
| Term of office and length of time served1 | | Served since 1998 |
| Principal occupations during the past five years | | President (1987-present) and Director (1990-present) of LA84 (formerly Amateur Athletic Foundation of Los Angeles); Director of Kids in Sports (1994-present); Vice President, International Rowing Federation (1995-present); Member of the International Olympic Committee (1986-present). |
| Number of portfolios in fund complex overseen2 | | 12 |
| Other directorships held | | OBN Holdings, Inc. (film, television and media company) |
| Avedick B. Poladian | | |
| Year of birth | | 1951 |
| Position(s) held with Fund | | Director |
| Term of office and length of time served1 | | Served since 2007 |
| Principal occupations during the past five years | | Executive Vice President and Chief Operating Officer of Lowe Enterprises, Inc. (real estate and hospitality firm) (2002-present); Partner, Arthur Andersen, LLP (1974-2002). |
| Number of portfolios in fund complex overseen2 | | 12 |
| Other directorships held | | Occidental Petroleum Corporation and Public Storage. |
| | | | |
| Western Asset High Yield Fund | | | 63 | |
| | |
| Independent Directors cont’d | | |
| William E. B. Siart | | |
| Year of birth | | 1946 |
| Position(s) held with Fund | | Director and Chairman |
| Term of office and length of time served1 | | Served since 1997 |
| Principal occupations during the past five years | | Trustee of The Getty Trust (2005-present); Chairman of Walt Disney Concert Hall, Inc. (1998-2006); Chairman of Excellent Education Development (2000-present). |
| Number of portfolios in fund complex overseen2 | | 12 |
| Other directorships held | | None |
| Jaynie Miller Studenmund | | |
| Year of birth | | 1954 |
| Position(s) held with Fund | | Director |
| Term of office and length of time served1 | | Served since 2004 |
| Principal occupations during the past five years | | Director of Orbitz Worldwide, Inc. (2007-present) (online travel company); Director of Pinnacle Entertainment, Inc. (2012-present) (gaming and hospitality company); Director of Core Logic, Inc. (2012-present) (information, analytics and business services). Formerly: Director of MarketTools, Inc. (2010-2012) (market research software provider); Director of eHarmony, Inc. (2005-2011) (online dating company). |
| Number of portfolios in fund complex overseen2 | | 12 |
| Other directorships held | | Orbitz Worldwide (global on-line travel company); Pinnacle Entertainment, Inc. (gaming and hospitality company); Core Logic, Inc. (information, analytics and business services). |
| | |
| 64 | | Western Asset High Yield Fund |
Additional information (unaudited) (cont’d)
Information about Directors and Officers
| | |
| Interested Directors | | |
R. Jay Gerken3 Legg Mason 620 Eighth Avenue, New York NY 10018 | | |
| Year of birth | | 1951 |
| Position(s) with Fund | | Director and President |
| Term of office and length of time served2 | | Served as Director since 2006 and as President
since 2007 |
| Principal occupation(s) during past five years | | Managing Director of Legg Mason & Co., LLC (“Legg Mason & Co.”) (since 2005); Officer and Trustee/Director of 161 funds associated with Legg Mason Partners Fund Advisor, LLC (“LMPFA”) or its affiliates (since 2006) and Legg Mason & Co. predecessors (prior to 2006); President and Chief Executive Officer (“CEO”) of LMPFA (since 2006); President and CEO of Smith Barney Fund Management LLC (“SBFM”) (formerly a registered investment adviser) (since 2002) |
| Number of funds in fund complex overseen2 | | 161 |
| Other directorships held | | None |
| Ronald L. Olson4 | | |
| Year of birth | | 1941 |
| Position(s) held with Fund | | Director |
| Term of office and length of time served1 | | Served since 2005 |
| Principal occupations during the past five years | | Senior Partner of Munger, Tolles & Olson LLP (a law partnership) (1968-present). |
| Number of portfolios in fund complex overseen2 | | 12 |
| Other directorships held | | Edison International, City National Corporation (financial services company), The Washington Post Company, and Berkshire Hathaway, Inc. |
| Officers5 | | |
Richard F. Sennett Legg Mason 100 International Drive, Baltimore, MD 21202 | | |
| Year of birth | | 1970 |
| Position(s) with Fund | | Principal Financial Officer |
| Term of office and length of time served2 | | Since 2011 |
| Principal occupation(s) during past five years | | Principal Financial Officer of certain mutual funds associated with Legg Mason & Co. or its affiliates (since 2011); Managing Director of Legg Mason & Co. and Senior Manager of the Treasury Policy group for Legg Mason & Co.’s Global Fiduciary Platform (since 2011); formerly, Chief Accountant within the SEC’s Division of Investment Management (2007 to 2011); formerly, Assistant Chief Accountant within the SEC’s Division of Investment Management (2002 to 2007) |
| | | | |
| Western Asset High Yield Fund | | | 65 | |
| | |
| Officers cont’d | | |
Erin K. Morris 100 International Drive, Baltimore, MD 21202 | | |
| Year of birth | | 1966 |
| Position(s) held with Fund | | Treasurer |
| Term of office and length of time served1 | | Served since 2006 |
| Principal occupations during the past five years | | Vice President Legg Mason & Co., LLC (since 2005); Treasurer of certain mutual funds associated with Legg Mason & Co. or its affiliates (since 2006); formerly, Assistant Treasurer of certain mutual funds associated with Legg Mason & Co. or its affiliates (prior to 2009) |
Todd F. Kuehl 100 International Drive, Baltimore, MD 21202 | | |
| Year of birth | | 1969 |
| Position(s) held with Fund | | Chief Compliance Officer |
| Term of office and length of time served1 | | Served since 2007 |
| Principal occupations during the past five years | | Managing Director of Legg Mason & Co. (since 2011); Chief Compliance Officer of certain mutual funds associated with Legg Mason & Co. or its affiliates (since 2006); formerly, Chief Compliance Officer of Legg Mason Private Portfolio Group (prior to 2010); Branch Chief, Division of Investment Management, U.S. Securities and Exchange Commission (2002 to 2006) |
Robert I. Frenkel 100 First Stamford Place Stamford, CT 06902 | | |
| Year of birth | | 1954 |
| Position(s) held with Fund | | Secretary and Chief Legal Officer |
| Term of office and length of time served1 | | Served since 2009 |
| Principal occupations during the past five years | | Vice President and Deputy General Counsel of Legg Mason, Inc. (since 2006); Managing Director and General Counsel of Global Mutual Funds for Legg Mason & Co. (since 2006) and Legg Mason & Co. predecessors (since 1994); Secretary and Chief Legal Officer of certain mutual funds associated with Legg Mason & Co. or its affiliates (since 2006) and Legg Mason & Co. predecessors (prior to 2006). |
| † | Directors who are not “interested persons” of the Fund within the meaning of Section 2(a)(19) of the 1940 Act. |
| 1 | Each officer holds office until his or her respective successor is chosen and qualified, or in each case until he or she sooner dies, resigns, is removed with or without cause or becomes disqualified. Each of the Directors of the Fund holds office until his or her successor shall have been duly elected and shall qualify, subject to prior death, resignation, retirement, disqualification or removed from office and applicable law and the rules of the New York Stock Exchange. |
| 2 | In addition to overseeing the ten portfolios of the Corporation each Director also serves as a Trustee of Western Asset Premier Bond Fund and as a Director of Western Asset Income Fund, Inc. (closed-end investment companies), which are considered part of the same Fund Complex as the Fund. In addition, Mr. Gerken serves as Director/Trustee to 149 other portfolios associated with Legg Mason & Co., LLC or its affiliates. Legg Mason & Co., LLC is an affiliate of Western Asset Management Co. (“WAM”). |
| 3 | Mr. Gerken is an “interested person” (as defined in section 2(a)(19) of the Investment Company Act of 1940, as amended (the “1940 Act”)) of the Fund because of his positions with subsidiaries of, and ownership of shares of common stock of, Legg Mason, Inc., the parent company of WAM. |
| 4 | Mr. Olson is an “interested person” (as defined above) of the Fund because his law firm has provided legal services to WAM. |
| 5 | Each officer of the Fund is an “interested person” (as defined above) of the Fund. |
Western Asset
High Yield Fund
Directors
William E. B. Siart, Chairman
R. Jay Gerken
President
Ronald J. Arnault
Anita L. DeFrantz
Ronald L. Olson
Avedick B. Poladian
Jaynie Miller Studenmund
Investment manager
Legg Mason Partners Fund Advisor, LLC
Investment adviser
Western Asset Management Company
Transfer agent
Boston Financial Data Services, Inc.
2000 Crown Colony Drive
Quincy, MA 02169
Custodian
State Street Bank and Trust Company
Independent registered public accounting firm
PricewaterhouseCoopers LLP
Baltimore, MD
Legal counsel
Ropes & Gray LLP
1211 Avenue of the Americas
New York, NY 10036
Western Asset High Yield Fund
The Fund is a separate investment series of Western Asset Funds, Inc.
Western Asset High Yield Fund
Legg Mason Funds
620 Eighth Avenue
New York, NY 10018
The Fund files its complete schedule of portfolio holdings with the Securities and Exchange Commission (“SEC”) for the first and third quarters of each fiscal year on Form N-Q. The Fund’s Forms N-Q are available on the SEC’s website at www.sec.gov. The Fund’s Forms N-Q may be reviewed and copied at the SEC’s Public Reference Room in Washington, D.C., and information on the operation of the Public Reference Room may be obtained by calling 1-800-SEC-0330. To obtain information on Form N-Q, shareholders can call the Fund at 1-877-721-1926.
Information on how the Fund voted proxies relating to portfolio securities during the prior 12-month period ended June 30th of each year and a description of the policies and procedures that the Fund uses to determine how to vote proxies related to portfolio transactions are available (1) without charge, upon request, by calling the Fund at 1-877-721-1926, (2) on the Fund’s website at www.leggmason.com/individualinvestors and (3) on the SEC’s website at www.sec.gov.
This report is submitted for the general information of the shareholders of Western Asset High Yield Fund. This report is not authorized for distribution to prospective investors in the Fund unless preceded or accompanied by a current prospectus.
Investors should consider the Fund’s investment objectives, risks, charges and expenses carefully before investing. The prospectus contains this and other important information about the Fund. Please read the prospectus carefully before investing.
www.leggmason.com/individualinvestors
©2013 Legg Mason Investor Services, LLC
Member FINRA, SIPC
Legg Mason Funds Privacy and Security Notice
Your Privacy and the Security of Your Personal Information is Very Important to the Legg Mason Funds
This Privacy and Security Notice (the “Privacy Notice”) addresses the Legg Mason Funds’ privacy and data protection practices with respect to nonpublic personal information the Funds receive. The Legg Mason Funds include any funds sold by the Funds’ distributor, Legg Mason Investor Services, LLC, as well as Legg Mason-sponsored closed-end funds and certain closed-end funds managed or sub-advised by Legg Mason or its affiliates. The provisions of this Privacy Notice apply to your information both while you are a shareholder and after you are no longer invested with the Funds.
The Type of Nonpublic Personal Information the Funds Collect About You
The Funds collect and maintain nonpublic personal information about you in connection with your shareholder account. Such information may include, but is not limited to:
| Ÿ | | Personal information included on applications or other forms; |
| Ÿ | | Account balances, transactions, and mutual fund holdings and positions; |
| Ÿ | | Online account access user IDs, passwords, security challenge question responses; and |
| Ÿ | | Information received from consumer reporting agencies regarding credit history and creditworthiness (such as the amount of an individual’s total debt, payment history, etc.). |
How the Funds Use Nonpublic Personal Information About You
The Funds do not sell or share your nonpublic personal information with third parties or with affiliates for their marketing purposes, or with other financial institutions or affiliates for joint marketing purposes, unless you have authorized the Funds to do so. The Funds do not disclose any nonpublic personal information about you except as may be required to perform transactions or services you have authorized or as permitted or required by law. The Funds may disclose information about you to:
| Ÿ | | Employees, agents, and affiliates on a “need to know” basis to enable the Funds to conduct ordinary business or comply with obligations to government regulators; |
| Ÿ | | Service providers, including the Funds’ affiliates, who assist the Funds as part of the ordinary course of business (such as printing, mailing services, or processing or servicing your account with us) or otherwise perform services on the Funds’ behalf, including companies that may perform marketing services solely for the Funds; |
| Ÿ | | The Funds’ representatives such as legal counsel, accountants and auditors; and |
| Ÿ | | Fiduciaries or representatives acting on your behalf, such as an IRA custodian or trustee of a grantor trust. |
|
| NOT PART OF THE ANNUAL REPORT |
Legg Mason Funds Privacy and Security Notice (cont’d)
Except as otherwise permitted by applicable law, companies acting on the Funds’ behalf are contractually obligated to keep nonpublic personal information the Funds provide to them confidential and to use the information the Funds share only to provide the services the Funds ask them to perform.
The Funds may disclose nonpublic personal information about you when necessary to enforce their rights or protect against fraud, or as permitted or required by applicable law, such as in connection with a law enforcement or regulatory request, subpoena, or similar legal process. In the event of a corporate action or in the event a Fund service provider changes, the Funds may be required to disclose your nonpublic personal information to third parties. While it is the Funds’ practice to obtain protections for disclosed information in these types of transactions, the Funds cannot guarantee their privacy policy will remain unchanged.
Keeping You Informed of the Funds’ Privacy and Security Practices
The Funds will notify you annually of their privacy policy as required by federal law. While the Funds reserve the right to modify this policy at any time they will notify you promptly if this privacy policy changes.
The Funds’ Security Practices
The Funds maintain appropriate physical, electronic and procedural safeguards designed to guard your nonpublic personal information. The Funds’ internal data security policies restrict access to your nonpublic personal information to authorized employees, who may use your nonpublic personal information for Fund business purposes only.
Although the Funds strive to protect your nonpublic personal information, they cannot ensure or warrant the security of any information you provide or transmit to them, and you do so at your own risk. In the event of a breach of the confidentiality or security of your nonpublic personal information, the Funds will attempt to notify you as necessary so you can take appropriate protective steps. If you have consented to the Funds using electronic communications or electronic delivery of statements, they may notify you under such circumstances using the most current email address you have on record with them.
In order for the Funds to provide effective service to you, keeping your account information accurate is very important. If you believe that your account information is incomplete, not accurate or not current, or if you have questions about the Funds’ privacy practices, write the Funds using the contact information on your account statements, email the Funds by clicking on the Contact Us section of the Funds’ website at www.leggmason.com, or contact the Fund at 1-877-721-1926.
Revised April 2011
|
| NOT PART OF THE ANNUAL REPORT |

Western Asset Management Company
Legg Mason, Inc. Subsidiaries
www.leggmason.com/individualinvestors
©2013 Legg Mason Investor Services, LLC Member FINRA, SIPC
WASX013141 2/13 SR13-1872
The registrant has adopted a code of ethics that applies to the registrant’s principal executive officer, principal financial officer, principal accounting officer or controller.
| ITEM 3. | AUDIT COMMITTEE FINANCIAL EXPERT. |
The Board of Directors of the registrant has determined that Mr. Ronald J. Arnault possesses the technical attributes identified in Instruction 2(b) of Item 3 to Form N-CSR to qualify as “audit committee financial expert,” and have designated Mr. Arnault as the Audit Committee’s financial expert. Mr. Arnault is “independent” Directors pursuant to paragraph (a) (2) of Item 3 to Form N-CSR.
| ITEM 4. | PRINCIPAL ACCOUNTANT FEES AND SERVICES |
a) Audit Fees. The aggregate fees billed in the last two fiscal years ending December 31, 2011 and December 31, 2012 (the “Reporting Periods”) for professional services rendered by the Registrant’s principal accountant (the “Auditor”) for the audit of the Registrant’s annual financial statements, or services that are normally provided by the Auditor in connection with the statutory and regulatory filings or engagements for the Reporting Periods, were $468,601 in December 31, 2011 and $354,434 in December 31, 2012.
b) Audit-Related Fees. The aggregate fees billed in the Reporting Period for assurance and related services by the Auditor that are reasonably related to the performance of the Registrant’s financial statements were $0 in December 31, 2011 and $0 in December 31, 2012.
In addition, there were no Audit-Related Fees billed in the Reporting Period for assurance and related services by the Auditor to the Registrant’s investment adviser (not including any sub-adviser whose role is primarily portfolio management and is subcontracted with or overseen by another investment adviser), and any entity controlling, controlled by or under common control with the investment adviser that provides ongoing services to the Western Asset Funds, Inc. (“service affiliates”), that were reasonably related to the performance of the annual audit of the service affiliates. Accordingly, there were no such fees that required pre-approval by the Audit Committee for the Reporting Periods.
(c) Tax Fees. The aggregate fees billed in the Reporting Periods for professional services rendered by the Auditor for tax compliance, tax advice and tax planning (“Tax Services”) were $42,600 in December 31, 2011 and $57,000 in December 31, 2012. These services consisted of (i) review or preparation of U.S. federal, state, local and excise tax returns; (ii) U.S. federal, state and local tax planning, advice and assistance regarding statutory, regulatory or administrative developments, and (iii) tax advice regarding tax qualification matters and/or treatment of various financial instruments held or proposed to be acquired or held.
There were no fees billed for tax services by the Auditors to service affiliates during the Reporting Periods that required pre-approval by the Audit Committee.
d) All Other Fees. The aggregate other fees billed in the Reporting Periods for products and services provided by the Auditor were $0 in December 31, 2011 and $13,130 in December 31, 2012, other than the services reported in paragraphs (a) through (c) for the Item for the Western Asset Funds, Inc.
All Other Fees. There were no other non-audit services rendered by the Auditor to Legg Mason Partners Fund Advisors, LLC (“LMPFA”), and any entity controlling, controlled by or under common control with LMPFA that provided ongoing services to Western Asset Funds, Inc. requiring pre-approval by the Audit Committee in the Reporting Period.
(e) Audit Committee’s pre–approval policies and procedures described in paragraph (c)(7) of Rule 2-01 of Regulation S-X.
(1) The Charter for the Audit Committee (the “Committee”) of the Board of each registered investment company (the “Fund”) advised by LMPFA or one of their affiliates (each, an “Adviser”) requires that the Committee shall approve (a) all audit and permissible non-audit services to be provided to the Fund and (b) all permissible non-audit services to be provided by the Fund’s
independent auditors to the Adviser and any Covered Service Providers if the engagement relates directly to the operations and financial reporting of the Fund. The Committee may implement policies and procedures by which such services are approved other than by the full Committee.
The Committee shall not approve non-audit services that the Committee believes may impair the independence of the auditors. As of the date of the approval of this Audit Committee Charter, permissible non-audit services include any professional services (including tax services), that are not prohibited services as described below, provided to the Fund by the independent auditors, other than those provided to the Fund in connection with an audit or a review of the financial statements of the Fund. Permissible non-audit services may not include: (i) bookkeeping or other services related to the accounting records or financial statements of the Fund; (ii) financial information systems design and implementation; (iii) appraisal or valuation services, fairness opinions or contribution-in-kind reports; (iv) actuarial services; (v) internal audit outsourcing services; (vi) management functions or human resources; (vii) broker or dealer, investment adviser or investment banking services; (viii) legal services and expert services unrelated to the audit; and (ix) any other service the Public Company Accounting Oversight Board determines, by regulation, is impermissible.
Pre-approval by the Committee of any permissible non-audit services is not required so long as: (i) the aggregate amount of all such permissible non-audit services provided to the Fund, the Adviser and any service providers controlling, controlled by or under common control with the Adviser that provide ongoing services to the Fund (“Covered Service Providers”) constitutes not more than 5% of the total amount of revenues paid to the independent auditors during the fiscal year in which the permissible non-audit services are provided to (a) the Fund, (b) the Adviser and (c) any entity controlling, controlled by or under common control with the Adviser that provides ongoing services to the Fund during the fiscal year in which the services are provided that would have to be approved by the Committee; (ii) the permissible non-audit services were not recognized by the Fund at the time of the engagement to be non-audit services; and (iii) such services are promptly brought to the attention of the Committee and approved by the Committee (or its delegate(s)) prior to the completion of the audit.
(2) For the Western Asset Funds, Inc., the percentage of fees that were approved by the audit committee, with respect to: Audit-Related Fees were 100% and 100% for December 31, 2011 and December 31, 2012; Tax Fees were 100% and 100% for December 31, 2011 and December 31, 2012; and Other Fees were 100% and 100% for December 31, 2011 and December 31, 2012.
(f) N/A
(g) Non-audit fees billed by the Auditor for services rendered to Western Asset Funds, Inc., LMPFA and any entity controlling, controlled by, or under common control with LMPFA that provides ongoing services to Western Asset Funds, Inc. during the reporting period were $0 in December 31, 2012.
(h) Yes. Western Asset Funds, Inc.’s Audit Committee has considered whether the provision of non-audit services that were rendered to Service Affiliates, which were not pre-approved (not requiring pre-approval), is compatible with maintaining the Accountant’s independence. All services provided by the Auditor to the Western Asset Funds, Inc. or to Service Affiliates, which were required to be pre-approved, were pre-approved as required.
| ITEM 5. | AUDIT COMMITTEE OF LISTED REGISTRANTS. |
| | a) | The independent board members are acting as the registrant’s audit committee as specified in Section 3(a)(58)(B) of the Exchange Act. The Audit Committee consists of the following Board members: |
Ronald J. Arnault
Anita L. DeFrantz
Avedick B. Poladian
William E.B. Siart
Jaynie Miller Studenmund
| ITEM 6. | SCHEDULE OF INVESTMENTS. |
Included herein under Item 1.
| ITEM 7. | DISCLOSURE OF PROXY VOTING POLICIES AND PROCEDURES FOR CLOSED-END MANAGEMENT INVESTMENT COMPANIES. |
Not applicable.
| ITEM 8. | PORTFOLIO MANAGERS OF CLOSED-END MANAGEMENT INVESTMENT COMPANIES. |
Not applicable.
| ITEM 9. | PURCHASES OF EQUITY SECURITIES BY CLOSED-END MANAGEMENT INVESTMENT COMPANY AND AFFILIATED PURCHASERS. |
Not applicable.
| ITEM 10. | SUBMISSION OF MATTERS TO A VOTE OF SECURITY HOLDERS. |
Not applicable.
| ITEM 11. | CONTROLS AND PROCEDURES. |
| | (a) | The registrant’s principal executive officer and principal financial officer have concluded that the registrant’s disclosure controls and procedures (as defined in Rule 30a- 3(c) under the Investment Company Act of 1940, as amended (the “1940 Act”)) are effective as of a date within 90 days of the filing date of this report that includes the disclosure required by this paragraph, based on their evaluation of the disclosure controls and procedures required by Rule 30a-3(b) under the 1940 Act and 15d-15(b) under the Securities Exchange Act of 1934. |
| | (b) | There were no changes in the registrant’s internal control over financial reporting (as defined in Rule 30a-3(d) under the 1940 Act) that occurred during the second fiscal quarter of the period covered by this report that have materially affected, or are likely to materially affect the registrant’s internal control over financial reporting. |
(a) (1) Code of Ethics attached hereto.
Exhibit 99.CODE ETH
(a) (2) Certifications pursuant to section 302 of the Sarbanes-Oxley Act of 2002 attached hereto.
Exhibit 99.CERT
(b) Certifications pursuant to Section 906 of the Sarbanes-Oxley Act of 2002 attached hereto.
Exhibit 99.906CERT
SIGNATURES
Pursuant to the requirements of the Securities Exchange Act of 1934 and the Investment Company Act of 1940, the registrant has duly caused this Report to be signed on its behalf by the undersigned, there unto duly authorized.
Western Asset Funds, Inc.
| | |
By: | | /s/ R. Jay Gerken |
| | (R. Jay Gerken) |
| | President |
| | Western Asset Funds, Inc. |
| |
| Date: | | February 25, 2013 |
Pursuant to the requirements of the Securities Exchange Act of 1934 and the Investment Company Act of 1940, this report has been signed below by the following persons on behalf of the registrant and in the capacities and on the dates indicated.
| | |
| By: | | /s/ R. Jay Gerken |
| | (R. Jay Gerken) |
| | President |
| | Western Asset Funds, Inc. |
| |
| Date: | | February 25, 2013 |
| | |
| By: | | /s/ Richard F. Sennett |
| | (Richard F. Sennett) |
| | Principal Financial Officer |
| | Western Asset Funds, Inc. |
| |
| Date: | | February 25, 2013 |