UNITED STATES
SECURITIES AND EXCHANGE COMMISSION
Washington, D.C. 20549
FORM N-CSR
CERTIFIED SHAREHOLDER REPORT OF REGISTERED
MANAGEMENT INVESTMENT COMPANIES
Investment Company Act file number 811-06110
Western Asset Funds, Inc.
(Exact name of registrant as specified in charter)
620 Eighth Avenue, 49th Floor, New York, NY 10018
(Address of principal executive offices) (Zip code)
Robert I. Frenkel, Esq.
Legg Mason & Co., LLC
100 First Stamford Place
Stamford, CT 06902
(Name and address of agent for service)
Registrant’s telephone number, including area code: 1-877-721-1926
Date of fiscal year end: December 31
Date of reporting period: June 30, 2013
| ITEM 1. | REPORT TO STOCKHOLDERS. |
The Semi-Annual Report to Stockholders is filed herewith.

Semi-Annual Report  June 30, 2013
WESTERN ASSET
CORE PLUS BOND
FUND
|
INVESTMENT PRODUCTS: NOT FDIC INSURED • NO BANK GUARANTEE • MAY LOSE VALUE |
Fund objective
The Fund seeks to maximize total return, consistent with prudent investment management and liquidity needs, by investing to obtain an average duration which is expected to range within 30% of the average duration of the domestic bond market as a whole.
Letter from the president

Dear Shareholder,
We are pleased to provide the semi-annual report of Western Asset Core Plus Bond Fund for the six-month reporting period ended June 30, 2013. Please read on for Fund performance information and a detailed look at prevailing economic and market conditions during the Fund’s reporting period.
I am pleased to introduce myself as the new President and Chief Executive Officer of the Fund, succeeding R. Jay Gerken, as he embarks upon his retirement. Jay has most recently served as President of the Fund and other funds in the Legg Mason complex. On behalf of all our shareholders and the Fund’s Board of Directors, I would like to thank Jay for his vision and guidance, and wish him all the best.
I am honored to have been appointed to my new role with the Fund. During my 23 year career in the financial industry, I have seen it evolve and expand. Despite these changes, keeping an unwavering focus on our shareholders and their needs remains paramount. This was a consistent focus of Jay’s, and I look forward to following his lead in the years to come.
Effective August 19, 2013, the individuals responsible for day-to-day portfolio management, development of investment strategy, oversight and coordination of the Fund are Stephen A. Walsh, Mark S. Lindbloom, Carl L. Eichstaedt, Michael C. Buchanan, Keith J. Gardner and S. Kenneth Leech. Messrs. Walsh, Lindbloom, Eichstaedt, Buchanan and Gardner have each been employed by Western Asset Management Company (“Western Asset”), the Fund’s subadviser, as an investment professional for at least the past five years. Mr. Walsh, Mr. Eichstaedt and Mr. Gardner have been part of the portfolio management team for the Fund since its inception in 1998. Mr. Lindbloom and Mr. Buchanan have been part of the portfolio management team for the Fund since 2006 and 2005, respectively. Mr. Leech has been a part of the portfolio management team for the Fund since August 2013, and has been employed by Western Asset, as an investment professional for more than 20 years. These investment professionals work together with a broader investment
| | |
| II | | Western Asset Core Plus Bond Fund |
management team. It is anticipated that Mr. Walsh will step down as a member of the Fund’s portfolio management team effective on or about March 31, 2014.
As always, we remain committed to providing you with excellent service and a full spectrum of investment choices. We also remain committed to supplementing the support you receive from your financial advisor. One way we accomplish this is through our website, www.leggmason.com/individualinvestors. Here you can gain immediate access to market and investment information, including:
| Ÿ | | Fund prices and performance, |
| Ÿ | | Market insights and commentaries from our portfolio managers, and |
| Ÿ | | A host of educational resources. |
We look forward to helping you meet your financial goals.
Sincerely,

Kenneth D. Fuller
President and Chief Executive Officer
August 19, 2013
| | |
| Western Asset Core Plus Bond Fund | | III |
Investment commentary
Economic review
The U.S. economy continued to grow over the six months ended June 30, 2013 (the “reporting period”), but the pace was far from robust. Looking back, U.S. gross domestic product (“GDP”)i growth, as reported by the U.S. Department of Commerce, was an anemic 0.1% during the fourth quarter of 2012. This weakness was partially driven by moderating private inventory investment and federal government spending. Economic growth then improved, as first quarter 2013 GDP growth was 1.1%. Accelerating growth was due, in part, to strengthening consumer spending, which rose 2.3% during the first quarter, versus a 1.7% increase during the previous quarter. The U.S. Department of Commerce’s initial reading for second quarter 2013 GDP growth, released after the reporting period ended, was 1.7%. This increase was partially driven by increases in non-residential fixed investment and exports, along with a smaller decline in federal government spending versus the previous quarter.
While there was some improvement in the U.S. job market, unemployment remained elevated throughout the reporting period. When the period began, unemployment, as reported by the U.S. Department of Labor, was 7.9%. Unemployment then fell to 7.7% in February, 7.6% in March and 7.5% in April. It then edged up to 7.6% in May and was unchanged in June. In an encouraging sign, an average of almost 202,000 jobs were created per month during the first half of 2013. In contrast, the monthly average was roughly 183,000 in 2012. In addition, the percentage of longer-term unemployed has declined, as roughly 36.7% of the 11.8 million Americans looking for work in June 2013 have been out of work for more than six months, versus 38.1% in January 2013.
Meanwhile, the housing market brightened, as sales generally improved and home prices continued to rebound. According to the National Association of Realtors (“NAR”), existing-home sales dipped 1.2% on a seasonally adjusted basis in June 2013 versus the previous month and were 1.52% higher than in June 2012. In addition, the NAR reported that the median existing-home price for all housing types was $214,200 in June 2013, up 13.5% from June 2012. This marked the sixteenth consecutive month that home prices rose compared to the same period a year earlier. While the inventory of homes available for sale rose 1.9% in June 2013 to a 5.2 month supply at the current sales pace, it was 7.6% lower than in June 2012.
While manufacturing activity was weak in many international developed countries, it was generally positive in the U.S. Based on the Institute for Supply Management’s Purchasing Managers’ Index (“PMI”)ii, the U.S. manufacturing sector expanded during the first four months of the reporting period. Manufacturing then experienced a setback, falling from 50.7 in April 2013 to 49.0 in May (a reading below 50 indicates a contraction, whereas a reading above 50 indicates an expansion). However, manufacturing then moved back into expansion territory in June, as the PMI increased to 50.9. During June, 12 of the 18 industries within the PMI expanded, versus 10 expanding the prior month.
| | |
| IV | | Western Asset Core Plus Bond Fund |
Market review
Q. How did the Federal Reserve Board (“Fed”)iii respond to the economic environment?
A. The Fed took a number of actions as it sought to meet its dual mandate of fostering maximum employment and price stability. As has been the case since December 2008, the Fed kept the federal funds rateiv at a historically low range between zero and 0.25%. At its meeting in December 2012, prior to the beginning of the reporting period, the Fed announced that it would continue purchasing $40 billion per month of agency mortgage-backed securities (“MBS”), as well as initially purchasing $45 billion a month of longer-term Treasuries. The Fed also said that it would keep the federal funds rate on hold “…as long as the unemployment rate remains above 6.5%, inflation between one and two years ahead is projected to be no more than a half percentage point above the Committee’s 2.0% longer-run goal, and longer-term inflation expectations continue to be well anchored.” At its meeting that ended on June 19, 2013, the Fed did not make any material changes to its official policy statement. However, in a press conference following the meeting, Fed Chairman Bernanke said “…the Committee currently anticipates that it would be appropriate to moderate the monthly pace of purchases later this year; and if the subsequent data remain broadly aligned with our current expectations for the economy, we would continue to reduce the pace of purchases in measured steps through the first half of next year, ending purchases around midyear.” This initially triggered a sharp sell-off in both the stock and bond markets. While the stock market subsequently rallied and reached a new record high on July 12, the bond market did not rebound as sharply. As a result, Treasury yields remained sharply higher than they were prior to Chairman Bernanke’s press conference. At its meeting that ended on July 31, 2013, after the reporting period ended, the Fed did not institute any policy changes and left its $85 billion a month asset purchase program intact.
Q. Did Treasury yields trend higher or lower during the six months ended June 30, 2013?
A. Both short- and long-term Treasury yields moved sharply higher during the reporting period. When the period began, the yield on the two-year Treasury was 0.25%. It fell as low as 0.20% in late April/early May 2013 and was as high as 0.43% on June 25, 2013, before ending the period at 0.36%. The yield on the ten-year Treasury began the period at 1.78%. Ten-year Treasuries reached a low of 1.66% in early May 2013 and peaked at 2.60% on June 25, 2013, before edging down to 2.52% at the end of the period.
Q. What factors impacted the spread sectors (non-Treasuries) during the reporting period?
A. Most spread sectors performed poorly during the reporting period. Spread sector demand was often solid during the first four months of the period as investors looked to generate incremental yield in the low interest rate environment. Even so, there were several periods of volatility given a number of macro issues, including the European sovereign debt crisis, mixed economic data and concerns related to the U.S. “fiscal cliff” and sequestration. The spread sectors then weakened over the last two months of the period amid sharply rising interest rates given the Fed’s plan to begin tapering its
| | |
| Western Asset Core Plus Bond Fund | | V |
Investment commentary (cont’d)
asset purchase program sooner than previously anticipated. The majority of spread sectors generated negative absolute returns and performed largely in line with equal-durationv Treasuries during the reporting period as a whole. For the six months ended June 30, 2013, the Barclays U.S. Aggregate Indexvi fell 2.44%.
Q. How did the high-yield market perform over the six months ended June 30, 2013?
A. The U.S. high-yield bond market was one of the few spread sectors to generate a positive return during the reporting period. The asset class, as measured by the Barclays U.S. Corporate High Yield — 2% Issuer Cap Indexvii, posted positive returns during the first four months of the period. Risk appetite was often solid during that time as investors were drawn to higher yielding securities. However, the high-yield market gave back a large portion of previous gains in May and June. All told, the high-yield market gained 1.42% for the six months ended June 30, 2013.
Performance review
For the six months ended June 30, 2013, Class I shares of Western Asset Core Plus Bond Fund returned -2.10%. The Fund’s unmanaged benchmark, the Barclays U.S. Aggregate Index, returned -2.44% for the same period. The Lipper Intermediate Investment Grade Debt Funds Category Average1 returned -2.56% over the same time frame.
| | | | |
| Performance Snapshot as of June 30, 2013 (unaudited) | |
| (excluding sales charges) | | 6 months | |
| Western Asset Core Plus Bond Fund: | | | | |
Class A | | | -2.25 | % |
Class C | | | -2.67 | % |
Class C1 | | | -2.47 | % |
Class FI | | | -2.23 | % |
Class R | | | -2.42 | % |
Class I | | | -2.10 | % |
Class IS | | | -2.07 | % |
| Barclays U.S. Aggregate Index | | | -2.44 | % |
| Lipper Intermediate Investment Grade Debt Funds Category Average1 | | | -2.56 | % |
The performance shown represents past performance. Past performance is no guarantee of future results and current performance may be higher or lower than the performance shown above. Principal value, investment returns and yields will fluctuate and investors’ shares, when redeemed, may be worth more or less than their original cost. To obtain performance data current to the most recent month-end, please visit our website at www.leggmason.com/individualinvestors.
All share class returns assume the reinvestment of all distributions, including returns of capital, if any, at net asset value and the deduction of all Fund expenses. Returns have not been adjusted to include sales charges that may apply or the deduction of taxes that a shareholder would pay on Fund distributions. If sales charges were reflected, the performance quoted would be lower. Performance figures for periods shorter than one year represent cumulative figures and are not annualized.
| 1 | Lipper, Inc., a wholly-owned subsidiary of Reuters, provides independent insight on global collective investments. Returns are based on the six-month period ended June 30, 2013, including the reinvestment of all distributions, including returns of capital, if any, calculated among the 645 funds in the Fund’s Lipper category, and excluding sales charges. |
| | |
| VI | | Western Asset Core Plus Bond Fund |
The 30-Day SEC Yields for the period ended June 30, 2013 for Class A, Class C, Class C1, Class FI, Class R, Class I and Class IS shares were 2.08%, 1.41%, 1.71%, 2.19%, 1.82%, 2.43% and 2.55%, respectively. Absent fee waivers and/or expense reimbursements, the 30-Day SEC Yields for Class R and Class FI shares would have been 1.64% and 2.13%, respectively. The 30-Day SEC Yield is subject to change and is based on the yield to maturity of the Fund’s investments over a 30-day period and not on the dividends paid by the Fund, which may differ.
|
| Total Annual Operating Expenses (unaudited) |
As of the Fund’s current prospectus dated May 1, 2013, the gross total annual operating expense ratios for Class A, Class C, Class C1, Class FI, Class R, Class I and Class IS shares were 0.81%, 1.48%, 1.26%, 0.75%, 1.24%, 0.46% and 0.43%, respectively.
Actual expenses may be higher. For example, expenses may be higher than those shown if average net assets decrease. Net assets are more likely to decrease and Fund expense ratios are more likely to increase when markets are volatile.
As a result of expense limitation arrangements, the ratio of expenses, other than interest, brokerage commissions, taxes, extraordinary expenses and deferred organizational expenses, to average net assets is not expected to exceed 0.90% for Class A shares, 1.65% for Class C shares, 1.51% for Class C1 shares, 0.85% for Class FI shares, 1.15% for Class R shares shares and 0.45% for Class IS shares. These expense limitation arrangements cannot be terminated prior to December 31, 2014 without the Board of Directors’ consent. The manager currently intends to voluntarily waive fees and/or reimburse operating expenses (other than interest, brokerage commissions, taxes, extraordinary expenses and deferred organizational expenses) so that annual operating expenses are not expected to exceed 0.78% for Class FI shares. This arrangement is expected to continue until April 30, 2014 but may be terminated at any time by the manager.
The manager is permitted to recapture amounts waived or reimbursed to a class within two years after the fiscal year in which the manager earned the fee or incurred the expense if the class’ total annual operating expenses have fallen to a level below the expense limitation (“expense cap”) in effect at the time the fees were earned or the expenses incurred. In no case will the manager recapture any amount that would result, on any particular business day of the Fund, in the class’ total annual operating expenses exceeding the expense cap or any other lower limit then in effect.
As always, thank you for your confidence in our stewardship of your assets.
Sincerely,
Kenneth D. Fuller
President and Chief Executive Officer
August 1, 2013
RISKS: Bonds are subject to a variety of risks, including interest rate, credit and inflation risks. As interest rates rise, bond prices fall, reducing the value of the Fund’s share price. The Fund may invest in high-yield bonds, which are rated below investment grade and carry more risk than higher-rated securities. Investments in asset-backed and mortgage-backed securities involve additional risks, including prepayment and extension risks. Non-U.S.investments are subject to currency fluctuations and social, economic and political
| | |
| Western Asset Core Plus Bond Fund | | VII |
Investment commentary (cont’d)
risks. These risks are magnified in emerging markets. The Fund may use derivatives, such as options, futures and swaps, which can be illiquid, may disproportionately increase losses, and have a potentially large impact on Fund performance. Please see the Fund’s prospectus for a more complete discussion of these and other risks, and the Fund’s investment strategies.
All investments are subject to risk including the possible loss of principal. Past performance is no guarantee of future results. All index performance reflects no deduction for fees, expenses or taxes. Please note that an investor cannot invest directly in an index.
The information provided is not intended to be a forecast of future events, a guarantee of future results or investment advice. Views expressed may differ from those of the firm as a whole.
| i | Gross domestic product (“GDP”) is the market value of all final goods and services produced within a country in a given period of time. |
| ii | The Institute for Supply Management’s PMI is based on a survey of purchasing executives who buy the raw materials for manufacturing at more than 350 companies. It offers an early reading on the health of the manufacturing sector. |
| iii | The Federal Reserve Board (“Fed”) is responsible for the formulation of policies designed to promote economic growth, full employment, stable prices and a sustainable pattern of international trade and payments. |
| iv | The federal funds rate is the rate charged by one depository institution on an overnight sale of immediately available funds (balances at the Federal Reserve) to another depository institution; the rate may vary from depository institution to depository institution and from day to day. |
| v | Duration is the measure of the price sensitivity of a fixed-income security to an interest rate change of 100 basis points. Calculation is based on the weighted average of the present values for all cash flows. |
| vi | The Barclays U.S. Aggregate Index is a broad-based bond index comprised of government, corporate, mortgage- and asset-backed issues, rated investment grade or higher, and having at least one year to maturity. |
| vii | The Barclays U.S. Corporate High Yield — 2% Issuer Cap Index is an index of the 2% Issuer Cap component of the Barclays U.S. Corporate High Yield Index, which covers the U.S. dollar-denominated, non-investment grade, fixed-rate, taxable corporate bond market. |
| | |
| VIII | | Western Asset Core Plus Bond Fund |
Fund at a glance† (unaudited)
Investment breakdown (%) as a percent of total investments
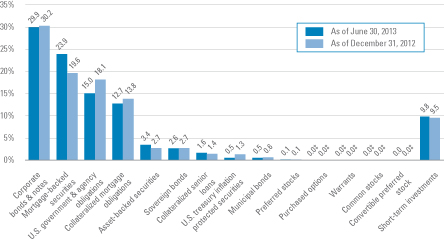
| † | The bar graph above represents the composition of the Fund’s investments as of June 30, 2013 and December 31, 2012 and does not include derivatives such as futures contracts, written options, forward foreign currency contracts and swap contracts. The Fund is actively managed. As a result, the composition of the Fund’s investments is subject to change at any time. |
| ‡ | Represents less than 0.1%. |
| | |
| Western Asset Core Plus Bond Fund 2013 Semi-Annual Report | | 1 |
Fund expenses (unaudited)
Example
As a shareholder of the Fund, you may incur two types of costs: (1) transaction costs including front-end and back-end sales charges (loads) on purchase payments, and (2) ongoing costs, including management fees; service and/or distribution (12b-1) fees; and other Fund expenses. This example is intended to help you understand your ongoing costs (in dollars) of investing in the Fund and to compare these costs with the ongoing costs of investing in other mutual funds.
This example is based on an investment of $1,000 invested on January 1, 2013 and held for the six months ended June 30, 2013.
Actual expenses
The table below titled “Based on Actual Total Return” provides information about actual account values and actual expenses. You may use the information provided in this table, together with the amount you invested, to estimate the expenses that you paid over the period. To estimate the expenses you paid on your account, divide your ending account value by $1,000 (for example, an $8,600 ending account value divided by $1,000 = 8.6), then multiply the result by the number under the heading entitled “Expenses Paid During the Period”.
Hypothetical example for comparison purposes
The table below titled “Based on Hypothetical Total Return” provides information about hypothetical account values and hypothetical expenses based on the actual expense ratio and an assumed rate of return of 5.00% per year before expenses, which is not the Fund’s actual return. The hypothetical account values and expenses may not be used to estimate the actual ending account balance or expenses you paid for the period. You may use the information provided in this table to compare the ongoing costs of investing in the Fund and other funds. To do so, compare the 5.00% hypothetical example relating to the Fund with the 5.00% hypothetical examples that appear in the shareholder reports of the other funds.
Please note that the expenses shown in the table below are meant to highlight your ongoing costs only and do not reflect any transactional costs, such as front-end or back-end sales charges (loads). Therefore, the table is useful in comparing ongoing costs only, and will not help you determine the relative total costs of owning different funds. In addition, if these transaction costs were included, your costs would have been higher.
| | | | | | | | | | | | | | | | | | | | | | | | | | | | | | | | | | | | | | | | | | | | |
| Based on actual total return1 | | | | | Based on hypothetical total return1 | |
| | | Actual
Total Return
Without
Sales
Charge2 | | | Beginning
Account
Value | | | Ending
Account
Value | | | Annualized
Expense
Ratio | | | Expenses
Paid
During
the
Period3 | | | | | | | Hypothetical
Annualized
Total Return | | | Beginning
Account
Value | | | Ending
Account
Value | | | Annualized
Expense
Ratio | | | Expenses
Paid
During
the
Period3 | |
| Class A | | | -2.25 | % | | $ | 1,000.00 | | | $ | 977.50 | | | | 0.80 | % | | $ | 3.92 | | | | | Class A | | | 5.00 | % | | $ | 1,000.00 | | | $ | 1,020.83 | | | | 0.80 | % | | $ | 4.01 | |
| Class C | | | -2.67 | | | | 1,000.00 | | | | 973.30 | | | | 1.50 | | | | 7.34 | | | | | Class C | | | 5.00 | | | | 1,000.00 | | | | 1,017.36 | | | | 1.50 | | | | 7.50 | |
| Class C1 | | | -2.47 | | | | 1,000.00 | | | | 975.30 | | | | 1.26 | | | | 6.17 | | | | | Class C1 | | | 5.00 | | | | 1,000.00 | | | | 1,018.55 | | | | 1.26 | | | | 6.31 | |
| Class FI | | | -2.23 | | | | 1,000.00 | | | | 977.70 | | | | 0.75 | | | | 3.68 | | | | | Class FI | | | 5.00 | | | | 1,000.00 | | | | 1,021.08 | | | | 0.75 | | | | 3.76 | |
| Class R | | | -2.42 | | | | 1,000.00 | | | | 975.80 | | | | 1.15 | | | | 5.63 | | | | | Class R | | | 5.00 | | | | 1,000.00 | | | | 1,019.09 | | | | 1.15 | | | | 5.76 | |
| Class I | | | -2.10 | | | | 1,000.00 | | | | 979.00 | | | | 0.50 | | | | 2.45 | | | | | Class I | | | 5.00 | | | | 1,000.00 | | | | 1,022.32 | | | | 0.50 | | | | 2.51 | |
| Class IS | | | -2.07 | | | | 1,000.00 | | | | 979.30 | | | | 0.43 | | | | 2.11 | | | | | Class IS | | | 5.00 | | | | 1,000.00 | | | | 1,022.66 | | | | 0.43 | | | | 2.16 | |
| | |
| 2 | | Western Asset Core Plus Bond Fund 2013 Semi-Annual Report |
| 1 | For the six months ended June 30, 2013. |
| 2 | Assumes the reinvestment of all distributions, including returns of capital, if any, at net asset value and does not reflect the deduction of the applicable sales charge with respect to Class A shares or the applicable contingent deferred sales charge (“CDSC”) with respect to Class C and Class C1 shares. Total return is not annualized, as it may not be representative of the total return for the year. Performance figures may reflect compensating balance arrangements, fee waivers and/or expense reimbursements. In the absence of compensating balance arrangements, fee waivers and/or expense reimbursements, the total return would have been lower. Past performance is no guarantee of future results. |
| 3 | Expenses (net of compensating balance arrangements, fee waivers and/or expense reimbursements) are equal to each class’ respective annualized expense ratio multiplied by the average account value over the period, multiplied by the number of days in the most recent fiscal half-year (181), then divided by 365. |
| | |
| Western Asset Core Plus Bond Fund 2013 Semi-Annual Report | | 3 |
Spread duration (unaudited)
Economic exposure — June 30, 2013
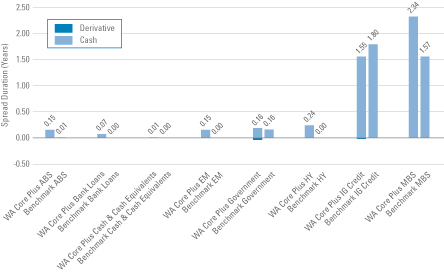
Spread duration measures the sensitivity to changes in spreads. The spread over Treasuries is the annual risk premium demanded by investors to hold non-Treasury securities. Spread duration is quantified as the % change in price resulting from a 100 basis points change in spreads. For a security with positive spread duration, an increase in spreads would result in a price decline and a decline in spreads would result in a price increase. This chart highlights the market sector exposure of the Fund’s sectors relative to the selected benchmark sectors as of the end of the reporting period.
| | |
| ABS | | — Asset-Backed Securities |
Benchmark | | — Barclays U.S. Aggregate Index |
| EM | | — Emerging Markets |
| HY | | — High Yield |
| IG Credit | | — Investment Grade Credit |
| MBS | | — Mortgage-Backed Securities |
| WA Core Plus | | — Western Asset Core Plus Bond Fund |
| | |
| 4 | | Western Asset Core Plus Bond Fund 2013 Semi-Annual Report |
Effective duration (unaudited)
Interest rate exposure — June 30, 2013
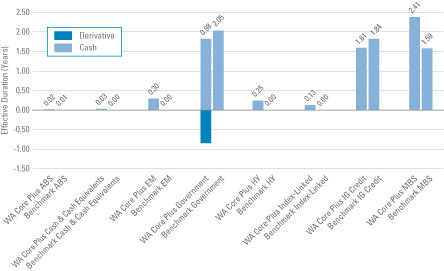
Effective duration measures the sensitivity to changes in relevant interest rates. Effective duration is quantified as the % change in price resulting from a 100 basis points change in interest rates. For a security with positive effective duration, an increase in interest rates would result in a price decline and a decline in interest rates would result in a price increase. This chart highlights the interest rate exposure of the Fund’s sectors relative to the selected benchmark sectors as of the end of the reporting period.
| | |
| ABS | | — Asset-Backed Securities |
Benchmark | | — Barclays U.S. Aggregate Index |
| EM | | — Emerging Markets |
| HY | | — High Yield |
| IG Credit | | — Investment Grade Credit |
| MBS | | — Mortgage-Backed Securities |
| WA Core Plus | | — Western Asset Core Plus Bond Fund |
| | |
| Western Asset Core Plus Bond Fund 2013 Semi-Annual Report | | 5 |
Schedule of investments (unaudited)
June 30, 2013
Western Asset Core Plus Bond Fund
| | | | | | | | | | | | | | | | |
| Security | | Rate | | | Maturity
Date | | | Face Amount† | | | Value | |
| Corporate Bonds & Notes — 33.8% | | | | | | | | | | | | | | | | |
| Consumer Discretionary — 2.9% | | | | | | | | | | | | | | | | |
Automobiles — 0.7% | | | | | | | | | | | | | | | | |
Chrysler Group LLC/CG Co.-Issuer Inc., Secured Notes | | | 8.250 | % | | | 6/15/21 | | | | 4,170,000 | | | $ | 4,602,638 | |
Daimler Finance NA LLC, Senior Notes | | | 1.300 | % | | | 7/31/15 | | | | 9,970,000 | | | | 9,991,944 | (a) |
Daimler Finance NA LLC, Senior Notes | | | 2.625 | % | | | 9/15/16 | | | | 10,450,000 | | | | 10,725,222 | (a) |
DaimlerChrysler North America Holding Corp., Notes | | | 6.500 | % | | | 11/15/13 | | | | 1,390,000 | | | | 1,419,076 | |
Ford Motor Co., Senior Notes | | | 4.750 | % | | | 1/15/43 | | | | 15,320,000 | | | | 13,475,334 | |
Ford Motor Credit Co., LLC, Senior Notes | | | 12.000 | % | | | 5/15/15 | | | | 330,000 | | | | 389,129 | |
Ford Motor Credit Co., LLC, Senior Notes | | | 8.125 | % | | | 1/15/20 | | | | 7,800,000 | | | | 9,395,669 | |
Ford Motor Credit Co., LLC, Senior Notes | | | 5.750 | % | | | 2/1/21 | | | | 4,010,000 | | | | 4,342,533 | |
Ford Motor Credit Co., LLC, Senior Notes | | | 5.875 | % | | | 8/2/21 | | | | 12,560,000 | | | | 13,693,540 | |
Hyundai Capital America, Senior Notes | | | 2.125 | % | | | 10/2/17 | | | | 3,670,000 | | | | 3,548,086 | (a) |
Total Automobiles | | | | | | | | | | | | | | | 71,583,171 | |
Diversified Consumer Services — 0.1% | | | | | | | | | | | | | | | | |
Service Corp. International, Senior Notes | | | 7.625 | % | | | 10/1/18 | | | | 24,000 | | | | 27,360 | |
Service Corp. International, Senior Notes | | | 7.500 | % | | | 4/1/27 | | | | 5,458,000 | | | | 5,962,865 | |
Total Diversified Consumer Services | | | | | | | | | | | | | | | 5,990,225 | |
Hotels, Restaurants & Leisure — 0.1% | | | | | | | | | | | | | | | | |
CityCenter Holdings LLC/CityCenter Finance Corp.,
Senior Secured Notes | | | 7.625 | % | | | 1/15/16 | | | | 1,620,000 | | | | 1,709,100 | |
Marriott International Inc., Senior Notes | | | 5.810 | % | | | 11/10/15 | | | | 7,950,000 | | | | 8,636,363 | |
McDonald’s Corp., Medium Term Notes | | | 5.350 | % | | | 3/1/18 | | | | 310,000 | | | | 355,355 | |
Total Hotels, Restaurants & Leisure | | | | | | | | | | | | | | | 10,700,818 | |
Media — 1.7% | | | | | | | | | | | | | | | | |
CBS Corp., Senior Notes | | | 7.625 | % | | | 1/15/16 | | | | 5,500,000 | | | | 6,248,121 | |
CCO Holdings LLC/CCO Holdings Capital Corp.,
Senior Notes | | | 7.000 | % | | | 1/15/19 | | | | 16,930,000 | | | | 17,945,800 | |
CCO Holdings LLC/CCO Holdings Capital Corp.,
Senior Notes | | | 6.625 | % | | | 1/31/22 | | | | 160,000 | | | | 166,800 | |
Comcast Cable Communications Holdings Inc.,
Senior Notes | | | 9.455 | % | | | 11/15/22 | | | | 3,150,000 | | | | 4,457,370 | |
Comcast Cable Communications LLC, Notes | | | 8.875 | % | | | 5/1/17 | | | | 109,000 | | | | 136,510 | |
Comcast Corp., Notes | | | 6.500 | % | | | 1/15/15 | | | | 2,829,000 | | | | 3,073,239 | |
Comcast Corp., Notes | | | 5.875 | % | | | 2/15/18 | | | | 65,000 | | | | 75,889 | |
Comcast Corp., Senior Notes | | | 6.500 | % | | | 1/15/17 | | | | 3,140,000 | | | | 3,647,367 | |
Comcast Corp., Senior Notes | | | 6.300 | % | | | 11/15/17 | | | | 1,210,000 | | | | 1,429,677 | |
Comcast Corp., Senior Notes | | | 5.650 | % | | | 6/15/35 | | | | 60,000 | | | | 66,550 | |
Comcast Corp., Senior Notes | | | 6.400 | % | | | 3/1/40 | | | | 2,390,000 | | | | 2,856,879 | |
COX Communications Inc., Senior Notes | | | 5.450 | % | | | 12/15/14 | | | | 1,520,000 | | | | 1,621,864 | |
CSC Holdings LLC, Senior Notes | | | 6.750 | % | | | 11/15/21 | | | | 2,235,000 | | | | 2,408,213 | |
See Notes to Financial Statements.
| | |
| 6 | | Western Asset Core Plus Bond Fund 2013 Semi-Annual Report |
Western Asset Core Plus Bond Fund
| | | | | | | | | | | | | | | | |
| Security | | Rate | | | Maturity
Date | | | Face Amount† | | | Value | |
Media — continued | | | | | | | | | | | | | | | | |
DISH DBS Corp., Senior Notes | | | 6.625 | % | | | 10/1/14 | | | | 271,000 | | | $ | 282,518 | |
DISH DBS Corp., Senior Notes | | | 7.750 | % | | | 5/31/15 | | | | 1,695,000 | | | | 1,834,838 | |
DISH DBS Corp., Senior Notes | | | 7.125 | % | | | 2/1/16 | | | | 2,065,000 | | | | 2,235,363 | |
DISH DBS Corp., Senior Notes | | | 7.875 | % | | | 9/1/19 | | | | 50,000 | | | | 56,000 | |
DISH DBS Corp., Senior Notes | | | 6.750 | % | | | 6/1/21 | | | | 3,500,000 | | | | 3,718,750 | |
DISH DBS Corp., Senior Notes | | | 5.875 | % | | | 7/15/22 | | | | 5,000 | | | | 5,075 | |
Lynx I Corp., Senior Secured Notes | | | 5.375 | % | | | 4/15/21 | | | | 3,780,000 | | | | 3,798,900 | (a) |
NBCUniversal Enterprise Inc., Senior Notes | | | 1.974 | % | | | 4/15/19 | | | | 28,540,000 | | | | 27,776,755 | (a) |
News America Inc., Notes | | | 5.300 | % | | | 12/15/14 | | | | 864,000 | | | | 919,259 | |
News America Inc., Senior Notes | | | 4.500 | % | | | 2/15/21 | | | | 8,000 | | | | 8,570 | |
News America Inc., Senior Notes | | | 6.200 | % | | | 12/15/34 | | | | 260,000 | | | | 284,235 | |
News America Inc., Senior Notes | | | 6.650 | % | | | 11/15/37 | | | | 1,350,000 | | | | 1,553,507 | |
News America Inc., Senior Notes | | | 6.750 | % | | | 1/9/38 | | | | 200,000 | | | | 221,411 | |
Time Warner Cable Inc., Debentures | | | 7.300 | % | | | 7/1/38 | | | | 5,000,000 | | | | 5,434,045 | |
Time Warner Cable Inc., Senior Notes | | | 8.750 | % | | | 2/14/19 | | | | 14,420,000 | | | | 17,700,218 | |
Time Warner Cable Inc., Senior Notes | | | 8.250 | % | | | 4/1/19 | | | | 12,300,000 | | | | 14,809,126 | |
Time Warner Cable Inc., Senior Notes | | | 4.125 | % | | | 2/15/21 | | | | 1,690,000 | | | | 1,657,104 | |
Time Warner Cable Inc., Senior Notes | | | 6.750 | % | | | 6/15/39 | | | | 5,065,000 | | | | 5,166,751 | |
Time Warner Cable Inc., Senior Notes | | | 5.875 | % | | | 11/15/40 | | | | 6,010,000 | | | | 5,505,473 | |
Time Warner Cable Inc., Senior Notes | | | 5.500 | % | | | 9/1/41 | | | | 660,000 | | | | 579,996 | |
Time Warner Entertainment Co., LP, Senior Notes | | | 8.375 | % | | | 7/15/33 | | | | 20,000 | | | | 23,572 | |
Time Warner Inc., Senior Debentures | | | 7.700 | % | | | 5/1/32 | | | | 3,100,000 | | | | 3,941,414 | |
Time Warner Inc., Senior Notes | | | 4.700 | % | | | 1/15/21 | | | | 20,000 | | | | 21,402 | |
Time Warner Inc., Senior Notes | | | 4.750 | % | | | 3/29/21 | | | | 9,220,000 | | | | 9,918,387 | |
Time Warner Inc., Senior Notes | | | 7.625 | % | | | 4/15/31 | | | | 215,000 | | | | 271,019 | |
Time Warner Inc., Senior Notes | | | 6.250 | % | | | 3/29/41 | | | | 970,000 | | | | 1,070,288 | |
UBM PLC, Notes | | | 5.750 | % | | | 11/3/20 | | | | 6,060,000 | | | | 6,143,246 | (a) |
Univision Communications Inc., Senior Secured Notes | | | 6.750 | % | | | 9/15/22 | | | | 7,550,000 | | | | 7,927,500 | (a) |
Univision Communications Inc., Senior Secured Notes | | | 5.125 | % | | | 5/15/23 | | | | 4,930,000 | | | | 4,658,850 | (a) |
UPCB Finance III Ltd., Senior Secured Notes | | | 6.625 | % | | | 7/1/20 | | | | 90,000 | | | | 93,150 | (a) |
WPP Finance UK, Senior Notes | | | 8.000 | % | | | 9/15/14 | | | | 3,830,000 | | | | 4,133,378 | |
Total Media | | | | | | | | | | | | | | | 175,884,379 | |
Specialty Retail — 0.3% | | | | | | | | | | | | | | | | |
Autozone Inc., Senior Notes | | | 6.950 | % | | | 6/15/16 | | | | 10,890,000 | | | | 12,516,421 | |
Home Depot Inc., Senior Notes | | | 5.250 | % | | | 12/16/13 | | | | 5,510,000 | | | | 5,628,917 | |
Home Depot Inc., Senior Notes | | | 5.400 | % | | | 3/1/16 | | | | 8,230,000 | | | | 9,170,574 | |
Michaels Stores Inc., Senior Notes | | | 7.750 | % | | | 11/1/18 | | | | 2,900,000 | | | | 3,103,000 | |
Total Specialty Retail | | | | | | | | | | | | | | | 30,418,912 | |
Total Consumer Discretionary | | | | | | | | | | | | | | | 294,577,505 | |
See Notes to Financial Statements.
| | |
| Western Asset Core Plus Bond Fund 2013 Semi-Annual Report | | 7 |
Schedule of investments (unaudited) (cont’d)
June 30, 2013
Western Asset Core Plus Bond Fund
| | | | | | | | | | | | | | | | |
| Security | | Rate | | | Maturity
Date | | | Face Amount† | | | Value | |
| Consumer Staples — 3.0% | | | | | | | | | | | | | | | | |
Beverages — 1.1% | | | | | | | | | | | | | | | | |
Anheuser-Busch InBev Worldwide Inc., Senior Notes | | | 5.375 | % | | | 1/15/20 | | | | 12,580,000 | | | $ | 14,503,142 | |
Anheuser-Busch InBev Worldwide Inc., Senior Notes | | | 5.000 | % | | | 4/15/20 | | | | 4,730,000 | | | | 5,369,189 | |
Anheuser-Busch InBev Worldwide Inc., Senior Notes | | | 2.500 | % | | | 7/15/22 | | | | 16,650,000 | | | | 15,544,407 | |
Diageo Capital PLC, Senior Bonds | | | 4.828 | % | | | 7/15/20 | | | | 620,000 | | | | 700,258 | |
Diageo Finance BV, Senior Notes | | | 3.250 | % | | | 1/15/15 | | | | 10,725,000 | | | | 11,142,674 | |
Diageo Investment Corp., Senior Notes | | | 2.875 | % | | | 5/11/22 | | | | 15,570,000 | | | | 15,032,212 | |
Hawk Acquisition Subordinated Inc., Senior Secured Notes | | | 4.250 | % | | | 10/15/20 | | | | 6,924,000 | | | | 6,621,075 | (a) |
Heineken NV, Senior Notes | | | 1.400 | % | | | 10/1/17 | | | | 11,050,000 | | | | 10,736,202 | (a) |
Molson Coors Brewing Co., Senior Notes | | | 3.500 | % | | | 5/1/22 | | | | 1,370,000 | | | | 1,344,591 | |
PepsiCo Inc., Senior Notes | | | 0.700 | % | | | 8/13/15 | | | | 15,230,000 | | | | 15,226,116 | |
PepsiCo Inc., Senior Notes | | | 7.900 | % | | | 11/1/18 | | | | 109,000 | | | | 139,610 | |
Pernod-Ricard SA, Senior Notes | | | 2.950 | % | | | 1/15/17 | | | | 2,360,000 | | | | 2,414,776 | (a) |
Pernod-Ricard SA, Senior Notes | | | 4.450 | % | | | 1/15/22 | | | | 17,905,000 | | | | 18,238,140 | (a) |
Total Beverages | | | | | | | | | | | | | | | 117,012,392 | |
Food & Staples Retailing — 0.5% | | | | | | | | | | | | | | | | |
CVS Caremark Corp., Senior Notes | | | 2.750 | % | | | 12/1/22 | | | | 16,440,000 | | | | 15,359,826 | |
CVS Corp., Pass-Through Trust, Secured Bonds | | | 5.789 | % | | | 1/10/26 | | | | 92,311 | | | | 104,658 | (a) |
CVS Pass-Through Trust, Secured Notes | | | 5.298 | % | | | 1/11/27 | | | | 430,562 | | | | 460,634 | (a) |
CVS Pass-Through Trust, Secured Notes | | | 5.880 | % | | | 1/10/28 | | | | 4,842,273 | | | | 5,414,547 | |
CVS Pass-Through Trust, Secured Notes | | | 6.036 | % | | | 12/10/28 | | | | 12,567,441 | | | | 14,175,458 | |
CVS Pass-Through Trust, Secured Notes | | | 6.943 | % | | | 1/10/30 | | | | 2,820,953 | | | | 3,321,610 | |
Kroger Co., Senior Notes | | | 6.400 | % | | | 8/15/17 | | | | 1,270,000 | | | | 1,465,656 | |
Safeway Inc., Senior Notes | | | 6.350 | % | | | 8/15/17 | | | | 310,000 | | | | 354,540 | |
Safeway Inc., Senior Notes | | | 4.750 | % | | | 12/1/21 | | | | 2,490,000 | | | | 2,536,899 | |
Wal-Mart Stores Inc., Notes | | | 5.800 | % | | | 2/15/18 | | | | 180,000 | | | | 210,861 | |
Wal-Mart Stores Inc., Notes | | | 6.200 | % | | | 4/15/38 | | | | 2,260,000 | | | | 2,773,156 | |
Wal-Mart Stores Inc., Senior Notes | | | 4.250 | % | | | 4/15/21 | | | | 360,000 | | | | 392,629 | |
Total Food & Staples Retailing | | | | | | | | | | | | | | | 46,570,474 | |
Food Products — 0.5% | | | | | | | | | | | | | | | | |
Ahold Lease USA Inc., Pass-Through Certificates | | | 8.620 | % | | | 1/2/25 | | | | 7,311,470 | | | | 9,039,951 | |
Kraft Foods Group Inc., Senior Notes | | | 5.375 | % | | | 2/10/20 | | | | 11,980,000 | | | | 13,513,141 | |
Kraft Foods Group Inc., Senior Notes | | | 3.500 | % | | | 6/6/22 | | | | 11,590,000 | | | | 11,477,322 | |
Mondelez International Inc., Senior Notes | | | 5.375 | % | | | 2/10/20 | | | | 10,900,000 | | | | 12,226,029 | |
WM Wrigley Jr Co., Senior Notes | | | 4.650 | % | | | 7/15/15 | | | | 2,807,000 | | | | 2,961,261 | |
Total Food Products | | | | | | | | | | | | | | | 49,217,704 | |
Tobacco — 0.9% | | | | | | | | | | | | | | | | |
Altria Group Inc., Senior Notes | | | 8.500 | % | | | 11/10/13 | | | | 200,000 | | | | 205,478 | |
See Notes to Financial Statements.
| | |
| 8 | | Western Asset Core Plus Bond Fund 2013 Semi-Annual Report |
Western Asset Core Plus Bond Fund
| | | | | | | | | | | | | | | | |
| Security | | Rate | | | Maturity
Date | | | Face Amount† | | | Value | |
Tobacco — continued | | | | | | | | | | | | | | | | |
Altria Group Inc., Senior Notes | | | 9.250 | % | | | 8/6/19 | | | | 11,710,000 | | | $ | 15,508,677 | |
Altria Group Inc., Senior Notes | | | 4.750 | % | | | 5/5/21 | | | | 13,410,000 | | | | 14,361,574 | |
Altria Group Inc., Senior Notes | | | 2.850 | % | | | 8/9/22 | | | | 11,920,000 | | | | 11,022,150 | |
Imperial Tobacco Finance PLC, Senior Notes | | | 2.050 | % | | | 2/11/18 | | | | 4,660,000 | | | | 4,580,705 | (a) |
Lorillard Tobacco Co., Senior Notes | | | 8.125 | % | | | 6/23/19 | | | | 2,160,000 | | | | 2,646,821 | |
Philip Morris International Inc., Senior Notes | | | 2.900 | % | | | 11/15/21 | | | | 13,780,000 | | | | 13,381,303 | |
Philip Morris International Inc., Senior Notes | | | 2.500 | % | | | 8/22/22 | | | | 6,170,000 | | | | 5,696,342 | |
Philip Morris International Inc., Senior Notes | | | 4.500 | % | | | 3/20/42 | | | | 8,860,000 | | | | 8,268,436 | |
Reynolds American Inc., Senior Notes | | | 6.750 | % | | | 6/15/17 | | | | 8,430,000 | | | | 9,768,532 | |
Reynolds American Inc., Senior Notes | | | 3.250 | % | | | 11/1/22 | | | | 4,870,000 | | | | 4,527,137 | |
Reynolds American Inc., Senior Secured Notes | | | 7.625 | % | | | 6/1/16 | | | | 250,000 | | | | 291,470 | |
Total Tobacco | | | | | | | | | | | | | | | 90,258,625 | |
Total Consumer Staples | | | | | | | | | | | | | | | 303,059,195 | |
| Energy — 5.6% | | | | | | | | | | | | | | | | |
Energy Equipment & Services — 0.5% | | | | | | | | | | | | | | | | |
Atwood Oceanics Inc., Senior Notes | | | 6.500 | % | | | 2/1/20 | | | | 3,530,000 | | | | 3,662,375 | |
Baker Hughes Inc., Senior Notes | | | 7.500 | % | | | 11/15/18 | | | | 550,000 | | | | 692,560 | |
Baker Hughes Inc., Senior Notes | | | 3.200 | % | | | 8/15/21 | | | | 8,710,000 | | | | 8,820,147 | |
CGG, Senior Notes | | | 7.750 | % | | | 5/15/17 | | | | 11,194,000 | | | | 11,361,910 | |
CGG, Senior Notes | | | 6.500 | % | | | 6/1/21 | | | | 1,420,000 | | | | 1,434,200 | |
Key Energy Services Inc., Senior Notes | | | 6.750 | % | | | 3/1/21 | | | | 11,570,000 | | | | 11,107,200 | |
Schlumberger Norge AS, Senior Notes | | | 4.200 | % | | | 1/15/21 | | | | 2,020,000 | | | | 2,157,289 | (a) |
SESI LLC, Senior Notes | | | 7.125 | % | | | 12/15/21 | | | | 2,450,000 | | | | 2,646,000 | |
Transocean Inc., Senior Notes | | | 6.375 | % | | | 12/15/21 | | | | 4,330,000 | | | | 4,866,764 | |
Transocean Ltd., Senior Notes | | | 6.000 | % | | | 3/15/18 | | | | 6,015,000 | | | | 6,740,656 | |
Total Energy Equipment & Services | | | | | | | | | | | | | | | 53,489,101 | |
Oil, Gas & Consumable Fuels — 5.1% | | | | | | | | | | | | | | | | |
Access Midstream Partner LP/ACMP Finance Corp.,
Senior Notes | | | 4.875 | % | | | 5/15/23 | | | | 840,000 | | | | 779,100 | |
Anadarko Finance Co., Senior Notes | | | 7.500 | % | | | 5/1/31 | | | | 11,507,000 | | | | 14,345,708 | |
Anadarko Petroleum Corp., Senior Notes | | | 6.375 | % | | | 9/15/17 | | | | 11,549,000 | | | | 13,281,119 | |
Anadarko Petroleum Corp., Senior Notes | | | 8.700 | % | | | 3/15/19 | | | | 30,000 | | | | 38,618 | |
Apache Corp., Notes | | | 6.000 | % | | | 9/15/13 | | | | 290,000 | | | | 293,043 | |
Apache Corp., Senior Notes | | | 3.250 | % | | | 4/15/22 | | | | 4,440,000 | | | | 4,373,640 | |
Apache Corp., Senior Notes | | | 6.000 | % | | | 1/15/37 | | | | 240,000 | | | | 270,216 | |
Apache Corp., Senior Notes | | | 5.100 | % | | | 9/1/40 | | | | 13,496,000 | | | | 13,580,202 | |
Apache Corp., Senior Notes | | | 4.750 | % | | | 4/15/43 | | | | 1,770,000 | | | | 1,678,870 | |
Arch Coal Inc., Senior Notes | | | 7.000 | % | | | 6/15/19 | | | | 11,850,000 | | | | 9,865,125 | |
See Notes to Financial Statements.
| | |
| Western Asset Core Plus Bond Fund 2013 Semi-Annual Report | | 9 |
Schedule of investments (unaudited) (cont’d)
June 30, 2013
Western Asset Core Plus Bond Fund
| | | | | | | | | | | | | | | | |
| Security | | Rate | | | Maturity
Date | | | Face Amount† | | | Value | |
Oil, Gas & Consumable Fuels — continued | | | | | | | | | | | | | | | | |
BP Capital Markets PLC, Senior Notes | | | 5.250 | % | | | 11/7/13 | | | | 19,840,000 | | | $ | 20,170,019 | |
BP Capital Markets PLC, Senior Notes | | | 3.875 | % | | | 3/10/15 | | | | 6,580,000 | | | | 6,911,073 | |
BP Capital Markets PLC, Senior Notes | | | 3.561 | % | | | 11/1/21 | | | | 1,300,000 | | | | 1,303,938 | |
BP Capital Markets PLC, Senior Notes | | | 3.245 | % | | | 5/6/22 | | | | 4,240,000 | | | | 4,114,772 | |
Chesapeake Energy Corp., Senior Notes | | | 6.875 | % | | | 11/15/20 | | | | 1,055,000 | | | | 1,144,675 | |
Chesapeake Energy Corp., Senior Notes | | | 6.125 | % | | | 2/15/21 | | | | 5,590,000 | | | | 5,869,500 | |
Chesapeake Energy Corp., Senior Notes | | | 5.750 | % | | | 3/15/23 | | | | 2,620,000 | | | | 2,652,750 | |
Chesapeake Midstream Partners LP/CHKM Finance Corp.,
Senior Notes | | | 5.875 | % | | | 4/15/21 | | | | 7,130,000 | | | | 7,236,950 | |
Chesapeake Midstream Partners LP/CHKM Finance Corp.,
Senior Notes | | | 6.125 | % | | | 7/15/22 | | | | 3,000,000 | | | | 3,037,500 | |
Chevron Corp., Senior Notes | | | 2.427 | % | | | 6/24/20 | | | | 1,470,000 | | | | 1,461,622 | |
Chevron Corp., Senior Notes | | | 3.191 | % | | | 6/24/23 | | | | 4,780,000 | | | | 4,756,822 | |
Concho Resources Inc., Senior Notes | | | 6.500 | % | | | 1/15/22 | | | | 5,757,000 | | | | 6,088,027 | |
Concho Resources Inc., Senior Notes | | | 5.500 | % | | | 10/1/22 | | | | 4,650,000 | | | | 4,603,500 | |
Conoco Funding Co., Senior Bonds | | | 7.250 | % | | | 10/15/31 | | | | 810,000 | | | | 1,062,971 | |
ConocoPhillips, Notes | | | 6.500 | % | | | 2/1/39 | | | | 110,000 | | | | 138,380 | |
ConocoPhillips, Senior Notes | | | 5.900 | % | | | 10/15/32 | | | | 10,000 | | | | 11,598 | |
ConocoPhillips Holding Co., Senior Notes | | | 6.950 | % | | | 4/15/29 | | | | 693,000 | | | | 882,677 | |
CONSOL Energy Inc., Senior Notes | | | 8.250 | % | | | 4/1/20 | | | | 6,950,000 | | | | 7,280,125 | |
CONSOL Energy Inc., Senior Notes | | | 6.375 | % | | | 3/1/21 | | | | 500,000 | | | | 497,500 | |
Continental Resources Inc., Senior Notes | | | 7.125 | % | | | 4/1/21 | | | | 200,000 | | | | 220,000 | |
Continental Resources Inc., Senior Notes | | | 5.000 | % | | | 9/15/22 | | | | 1,220,000 | | | | 1,241,350 | |
Continental Resources Inc., Senior Notes | | | 4.500 | % | | | 4/15/23 | | | | 3,240,000 | | | | 3,150,900 | (a) |
Denbury Resources Inc., Senior Subordinated Notes | | | 4.625 | % | | | 7/15/23 | | | | 3,065,000 | | | | 2,827,463 | |
Devon Energy Corp., Debentures | | | 7.950 | % | | | 4/15/32 | | | | 970,000 | | | | 1,269,577 | |
Devon Energy Corp., Senior Notes | | | 6.300 | % | | | 1/15/19 | | | | 14,500,000 | | | | 16,800,454 | |
Devon Energy Corp., Senior Notes | | | 3.250 | % | | | 5/15/22 | | | | 3,600,000 | | | | 3,486,809 | |
Devon Energy Corp., Senior Notes | | | 5.600 | % | | | 7/15/41 | | | | 280,000 | | | | 290,142 | |
Devon Financing Corp. LLC, Debentures | | | 7.875 | % | | | 9/30/31 | | | | 60,000 | | | | 77,692 | |
El Paso Corp., Medium-Term Notes | | | 7.800 | % | | | 8/1/31 | | | | 3,276,000 | | | | 3,460,052 | |
El Paso Corp., Medium-Term Notes | | | 7.750 | % | | | 1/15/32 | | | | 240,000 | | | | 254,983 | |
El Paso Corp., Senior Subordinated Notes | | | 7.000 | % | | | 6/15/17 | | | | 19,484,000 | | | | 21,182,206 | |
Energy Transfer Equity LP, Senior Notes | | | 7.500 | % | | | 10/15/20 | | | | 3,470,000 | | | | 3,790,975 | |
Enterprise Products Operating LLC, Senior Bonds | | | 6.300 | % | | | 9/15/17 | | | | 13,330,000 | | | | 15,590,808 | |
Enterprise Products Operating LLC, Senior Notes | | | 9.750 | % | | | 1/31/14 | | | | 400,000 | | | | 420,222 | |
Enterprise Products Operating LLC, Senior Notes | | | 5.250 | % | | | 1/31/20 | | | | 10,000 | | | | 11,176 | |
Enterprise Products Operating LLC, Senior Notes | | | 3.350 | % | | | 3/15/23 | | | | 19,040,000 | | | | 18,322,268 | |
See Notes to Financial Statements.
| | |
| 10 | | Western Asset Core Plus Bond Fund 2013 Semi-Annual Report |
Western Asset Core Plus Bond Fund
| | | | | | | | | | | | | | | | |
| Security | | Rate | | | Maturity
Date | | | Face Amount† | | | Value | |
Oil, Gas & Consumable Fuels — continued | | | | | | | | | | | | | | | | |
Enterprise Products Operating LLC, Senior Notes | | | 6.125 | % | | | 10/15/39 | | | | 840,000 | | | $ | 934,147 | |
Enterprise Products Operating LLC, Senior Notes | | | 5.950 | % | | | 2/1/41 | | | | 1,700,000 | | | | 1,852,079 | |
Enterprise Products Operating LLC, Senior Notes | | | 5.700 | % | | | 2/15/42 | | | | 6,507,000 | | | | 6,890,698 | |
Enterprise Products Operating LLC, Senior Notes | | | 4.850 | % | | | 3/15/44 | | | | 990,000 | | | | 938,959 | |
Hess Corp., Notes | | | 8.125 | % | | | 2/15/19 | | | | 18,800,000 | | | | 23,565,462 | |
Kerr-McGee Corp., Notes | | | 6.950 | % | | | 7/1/24 | | | | 4,951,000 | | | | 5,918,633 | |
Kerr-McGee Corp., Notes | | | 7.875 | % | | | 9/15/31 | | | | 8,467,000 | | | | 10,571,701 | |
Kinder Morgan Energy Partners LP, Senior Notes | | | 5.000 | % | | | 12/15/13 | | | | 1,879,000 | | | | 1,914,523 | |
Kinder Morgan Energy Partners LP, Senior Notes | | | 6.000 | % | | | 2/1/17 | | | | 5,211,000 | | | | 5,868,951 | |
Kinder Morgan Energy Partners LP, Senior Notes | | | 3.950 | % | | | 9/1/22 | | | | 4,520,000 | | | | 4,458,867 | |
Kodiak Oil & Gas Corp., Senior Notes | | | 8.125 | % | | | 12/1/19 | | | | 2,500,000 | | | | 2,712,500 | |
MarkWest Energy Partners LP/MarkWest Energy Finance Corp., Senior Notes | | | 6.500 | % | | | 8/15/21 | | | | 1,768,000 | | | | 1,821,040 | |
MarkWest Energy Partners LP/MarkWest Energy Finance Corp., Senior Notes | | | 6.250 | % | | | 6/15/22 | | | | 1,742,000 | | | | 1,794,260 | |
MarkWest Energy Partners LP/MarkWest Energy Finance Corp., Senior Notes | | | 5.500 | % | | | 2/15/23 | | | | 1,710,000 | | | | 1,684,350 | |
MarkWest Energy Partners LP/MarkWest Energy Finance Corp., Senior Notes | | | 4.500 | % | | | 7/15/23 | | | | 3,120,000 | | | | 2,854,800 | |
MEG Energy Corp., Senior Notes | | | 6.375 | % | | | 1/30/23 | | | | 350,000 | | | | 339,500 | (a) |
Noble Energy Inc., Senior Notes | | | 8.250 | % | | | 3/1/19 | | | | 14,890,000 | | | | 18,752,004 | |
Noble Energy Inc., Senior Notes | | | 4.150 | % | | | 12/15/21 | | | | 10,000 | | | | 10,325 | |
Occidental Petroleum Corp., Senior Notes | | | 3.125 | % | | | 2/15/22 | | | | 10,290,000 | | | | 9,968,859 | |
Occidental Petroleum Corp., Senior Notes | | | 2.700 | % | | | 2/15/23 | | | | 9,720,000 | | | | 8,970,384 | |
Peabody Energy Corp., Senior Notes | | | 6.500 | % | | | 9/15/20 | | | | 7,515,000 | | | | 7,533,787 | |
Peabody Energy Corp., Senior Notes | | | 6.250 | % | | | 11/15/21 | | | | 2,660,000 | | | | 2,566,900 | |
Pemex Project Funding Master Trust, Senior Bonds | | | 6.625 | % | | | 6/15/35 | | | | 21,982,000 | | | | 23,081,100 | |
Petrobras International Finance Co., Senior Notes | | | 3.875 | % | | | 1/27/16 | | | | 8,080,000 | | | | 8,312,914 | |
Petrobras International Finance Co., Senior Notes | | | 6.125 | % | | | 10/6/16 | | | | 6,387,000 | | | | 6,982,224 | |
Petrobras International Finance Co., Senior Notes | | | 5.750 | % | | | 1/20/20 | | | | 5,579,000 | | | | 5,804,269 | |
Petrobras International Finance Co., Senior Notes | | | 5.375 | % | | | 1/27/21 | | | | 33,630,000 | | | | 33,787,859 | |
Petroleos Mexicanos, Senior Notes | | | 3.500 | % | | | 1/30/23 | | | | 2,227,000 | | | | 2,054,408 | (a) |
Plains Exploration & Production Co., Senior Notes | | | 6.750 | % | | | 2/1/22 | | | | 5,000,000 | | | | 5,298,880 | |
QEP Resources Inc., Senior Notes | | | 6.875 | % | | | 3/1/21 | | | | 6,650,000 | | | | 7,165,375 | |
QEP Resources Inc., Senior Notes | | | 5.250 | % | | | 5/1/23 | | | | 30,000 | | | | 29,250 | |
Range Resources Corp., Senior Notes | | | 5.000 | % | | | 8/15/22 | | | | 1,020,000 | | | | 997,050 | |
Range Resources Corp., Senior Subordinated Notes | | | 6.750 | % | | | 8/1/20 | | | | 6,330,000 | | | | 6,788,925 | |
Range Resources Corp., Senior Subordinated Notes | | | 5.750 | % | | | 6/1/21 | | | | 3,670,000 | | | | 3,780,100 | |
Regency Energy Partners LP/Regency Energy Finance Corp., Senior Notes | | | 6.500 | % | | | 7/15/21 | | | | 8,981,000 | | | | 9,385,145 | |
See Notes to Financial Statements.
| | |
| Western Asset Core Plus Bond Fund 2013 Semi-Annual Report | | 11 |
Schedule of investments (unaudited) (cont’d)
June 30, 2013
Western Asset Core Plus Bond Fund
| | | | | | | | | | | | | | | | |
| Security | | Rate | | | Maturity
Date | | | Face Amount† | | | Value | |
Oil, Gas & Consumable Fuels — continued | | | | | | | | | | | | | | | | |
Regency Energy Partners LP/Regency Energy Finance Corp., Senior Notes | | | 4.500 | % | | | 11/1/23 | | | | 510,000 | | | $ | 461,550 | (a) |
Shell International Finance BV, Senior Notes | | | 4.375 | % | | | 3/25/20 | | | | 1,980,000 | | | | 2,200,970 | |
Shell International Finance BV, Senior Notes | | | 6.375 | % | | | 12/15/38 | | | | 6,785,000 | | | | 8,741,346 | |
Sinopec Group Overseas Development 2012 Ltd., Senior Notes | | | 2.750 | % | | | 5/17/17 | | | | 6,800,000 | | | | 6,836,564 | (a) |
Statoil ASA, Senior Notes | | | 3.125 | % | | | 8/17/17 | | | | 4,000,000 | | | | 4,220,604 | |
Transocean Inc., Senior Notes | | | 5.050 | % | | | 12/15/16 | | | | 320,000 | | | | 347,976 | |
Williams Cos. Inc., Debentures | | | 7.500 | % | | | 1/15/31 | | | | 499,000 | | | | 568,494 | |
Williams Cos. Inc., Notes | | | 7.875 | % | | | 9/1/21 | | | | 7,959,000 | | | | 9,607,802 | |
Williams Cos. Inc., Senior Notes | | | 7.750 | % | | | 6/15/31 | | | | 287,000 | | | | 335,201 | |
Williams Cos. Inc., Senior Notes | | | 8.750 | % | | | 3/15/32 | | | | 3,035,000 | | | | 3,849,849 | |
Williams Partners LP, Senior Notes | | | 5.250 | % | | | 3/15/20 | | | | 3,340,000 | | | | 3,589,508 | |
WPX Energy Inc., Senior Notes | | | 6.000 | % | | | 1/15/22 | | | | 4,550,000 | | | | 4,595,500 | |
Total Oil, Gas & Consumable Fuels | | | | | | | | | | | | | | | 510,872,709 | |
Total Energy | | | | | | | | | | | | | | | 564,361,810 | |
| Financials — 11.1% | | | | | | | | | | | | | | | | |
Capital Markets — 1.7% | | | | | | | | | | | | | | | | |
Bear Stearns Cos. LLC, Senior Notes | | | 6.400 | % | | | 10/2/17 | | | | 925,000 | | | | 1,066,937 | |
Goldman Sachs Capital II, Junior Subordinated Bonds | | | 4.000 | % | | | 6/1/43 | | | | 1,830,000 | | | | 1,454,850 | (b) |
Goldman Sachs Group Inc., Senior Notes | | | 4.750 | % | | | 7/15/13 | | | | 594,000 | | | | 594,832 | |
Goldman Sachs Group Inc., Senior Notes | | | 5.250 | % | | | 10/15/13 | | | | 80,000 | | | | 80,987 | |
Goldman Sachs Group Inc., Senior Notes | | | 6.000 | % | | | 5/1/14 | | | | 3,890,000 | | | | 4,051,839 | |
Goldman Sachs Group Inc., Senior Notes | | | 2.375 | % | | | 1/22/18 | | | | 18,400,000 | | | | 18,065,709 | |
Goldman Sachs Group Inc., Senior Notes | | | 5.375 | % | | | 3/15/20 | | | | 25,760,000 | | | | 27,950,991 | |
Goldman Sachs Group Inc., Senior Notes | | | 6.000 | % | | | 6/15/20 | | | | 190,000 | | | | 213,488 | |
Goldman Sachs Group Inc., Senior Notes | | | 5.250 | % | | | 7/27/21 | | | | 3,130,000 | | | | 3,348,784 | |
Goldman Sachs Group Inc., Senior Notes | | | 6.250 | % | | | 2/1/41 | | | | 29,580,000 | | | | 33,454,507 | |
Goldman Sachs Group Inc., Subordinated Notes | | | 5.625 | % | | | 1/15/17 | | | | 1,420,000 | | | | 1,538,975 | |
Lehman Brothers Holdings Capital Trust VII, Junior Subordinated Notes | | | 5.857 | % | | | 8/16/13 | | | | 5,550,000 | | | | 0 | (b)(c)(d)(e)(f)(g) |
Lehman Brothers Holdings E-Capital Trust I, Junior Subordinated Notes | | | 0.000 | % | | | 8/19/65 | | | | 190,000 | | | | 0 | (d)(e)(f) |
Lehman Brothers Holdings Inc., Subordinated Notes | | | 6.500 | % | | | 7/19/17 | | | | 5,280,000 | | | | 0 | (b)(c)(d)(e)(f) |
Lehman Brothers Holdings Inc., Subordinated Notes | | | 6.750 | % | | | 12/28/17 | | | | 1,070,000 | | | | 0 | (d)(e)(f) |
Merrill Lynch & Co. Inc., Senior Notes | | | 6.400 | % | | | 8/28/17 | | | | 90,000 | | | | 101,625 | |
Merrill Lynch & Co. Inc., Subordinated Notes | | | 6.050 | % | | | 5/16/16 | | | | 390,000 | | | | 422,295 | |
Morgan Stanley, Medium-Term Notes | | | 0.727 | % | | | 10/18/16 | | | | 7,802,000 | | | | 7,552,874 | (b) |
Morgan Stanley, Medium-Term Notes | | | 5.550 | % | | | 4/27/17 | | | | 7,435,000 | | | | 8,043,057 | |
Morgan Stanley, Senior Notes | | | 5.450 | % | | | 1/9/17 | | | | 3,990,000 | | | | 4,312,184 | |
See Notes to Financial Statements.
| | |
| 12 | | Western Asset Core Plus Bond Fund 2013 Semi-Annual Report |
Western Asset Core Plus Bond Fund
| | | | | | | | | | | | | | | | |
| Security | | Rate | | | Maturity
Date | | | Face Amount† | | | Value | |
Capital Markets — continued | | | | | | | | | | | | | | | | |
Morgan Stanley, Senior Notes | | | 4.750 | % | | | 3/22/17 | | | | 2,010,000 | | | $ | 2,131,919 | |
Morgan Stanley, Senior Notes | | | 5.950 | % | | | 12/28/17 | | | | 4,700,000 | | | | 5,214,843 | |
State Street Corp., Junior Subordinated Notes | | | 4.956 | % | | | 3/15/18 | | | | 28,931,000 | | | | 31,874,556 | |
Temasek Financial I Ltd., Senior Notes | | | 2.375 | % | | | 1/23/23 | | | | 9,854,000 | | | | 8,753,436 | (a) |
UBS AG, Senior Notes | | | 2.250 | % | | | 1/28/14 | | | | 4,655,000 | | | | 4,699,790 | |
UBS AG Stamford CT, Senior Notes | | | 3.875 | % | | | 1/15/15 | | | | 3,673,000 | | | | 3,827,993 | |
UBS AG Stamford CT, Senior Notes | | | 4.875 | % | | | 8/4/20 | | | | 250,000 | | | | 276,051 | |
Vesey Street Investment Trust I, Senior Notes | | | 4.404 | % | | | 9/1/16 | | | | 4,520,000 | | | | 4,813,321 | |
Total Capital Markets | | | | | | | | | | | | | | | 173,845,843 | |
Commercial Banks — 3.4% | | | | | | | | | | | | | | | | |
ANZ National International Ltd., Senior Notes | | | 1.850 | % | | | 10/15/15 | | | | 7,100,000 | | | | 7,200,025 | (a) |
Bank of Tokyo-Mitsubishi UFJ Ltd., Senior Notes | | | 3.850 | % | | | 1/22/15 | | | | 7,500,000 | | | | 7,839,300 | (a) |
Barclays Bank PLC, Subordinated Notes | | | 6.050 | % | | | 12/4/17 | | | | 4,555,000 | | | | 4,927,235 | (a) |
BBVA US Senior SAU, Senior Notes | | | 3.250 | % | | | 5/16/14 | | | | 16,775,000 | | | | 16,925,539 | |
BBVA US Senior SAU, Senior Notes | | | 4.664 | % | | | 10/9/15 | | | | 20,230,000 | | | | 20,839,388 | |
BNP Paribas SA, Senior Notes | | | 2.375 | % | | | 9/14/17 | | | | 10,650,000 | | | | 10,543,500 | |
CIT Group Inc., Senior Notes | | | 4.250 | % | | | 8/15/17 | | | | 690,000 | | | | 693,450 | |
Commonwealth Bank of Australia, Senior Notes | | | 3.750 | % | | | 10/15/14 | | | | 10,490,000 | | | | 10,895,963 | (a) |
Commonwealth Bank of Australia, Senior Notes | | | 1.250 | % | | | 9/18/15 | | | | 17,730,000 | | | | 17,834,607 | |
Commonwealth Bank of Australia, Senior Notes | | | 5.000 | % | | | 10/15/19 | | | | 4,160,000 | | | | 4,655,127 | (a) |
Credit Agricole SA, Senior Notes | | | 2.625 | % | | | 1/21/14 | | | | 6,760,000 | | | | 6,818,812 | (a) |
Credit Agricole SA, Subordinated Notes | | | 8.375 | % | | | 10/13/19 | | | | 14,140,000 | | | | 14,970,725 | (a)(b)(g) |
Intesa Sanpaolo SpA, Senior Notes | | | 3.625 | % | | | 8/12/15 | | | | 7,242,000 | | | | 7,258,273 | (a) |
Intesa Sanpaolo SpA, Senior Notes | | | 3.125 | % | | | 1/15/16 | | | | 3,880,000 | | | | 3,815,041 | |
Intesa Sanpaolo SpA, Senior Notes | | | 3.875 | % | | | 1/16/18 | | | | 2,610,000 | | | | 2,506,151 | |
Lloyds TSB Bank PLC, Subordinated Notes | | | 6.500 | % | | | 9/14/20 | | | | 100,000 | | | | 106,612 | (a) |
M&T Bank Corp., Junior Subordinated Notes | | | 6.875 | % | | | 6/15/16 | | | | 25,360,000 | | | | 26,390,427 | (a)(g) |
National Australia Bank of New York, Senior Notes | | | 1.600 | % | | | 8/7/15 | | | | 6,000,000 | | | | 6,081,654 | |
Nordea Bank AB, Senior Notes | | | 3.700 | % | | | 11/13/14 | | | | 3,620,000 | | | | 3,753,578 | (a) |
Nordea Bank AB, Subordinated Notes | | | 4.875 | % | | | 5/13/21 | | | | 14,640,000 | | | | 15,023,568 | (a) |
Rabobank Nederland NV, Junior Subordinated Notes | | | 11.000 | % | | | 6/30/19 | | | | 11,522,000 | | | | 14,776,965 | (a)(b)(g) |
Royal Bank of Scotland Group PLC, Junior Subordinated Bonds | | | 7.648 | % | | | 9/30/31 | | | | 1,150,000 | | | | 1,052,250 | (b)(g) |
Royal Bank of Scotland Group PLC, Junior Subordinated Notes, Medium-Term Notes | | | 7.640 | % | | | 9/29/17 | | | | 4,700,000 | | | | 4,206,500 | (b)(g) |
Royal Bank of Scotland Group PLC, Senior Notes | | | 2.550 | % | | | 9/18/15 | | | | 2,150,000 | | | | 2,186,032 | |
Royal Bank of Scotland Group PLC, Senior Notes | | | 6.400 | % | | | 10/21/19 | | | | 5,810,000 | | | | 6,455,445 | |
Royal Bank of Scotland Group PLC, Subordinated Notes | | | 5.000 | % | | | 10/1/14 | | | | 190,000 | | | | 194,266 | |
See Notes to Financial Statements.
| | |
| Western Asset Core Plus Bond Fund 2013 Semi-Annual Report | | 13 |
Schedule of investments (unaudited) (cont’d)
June 30, 2013
Western Asset Core Plus Bond Fund
| | | | | | | | | | | | | | | | |
| Security | | Rate | | | Maturity
Date | | | Face Amount† | | | Value | |
Commercial Banks — continued | | | | | | | | | | | | | | | | |
Royal Bank of Scotland Group PLC, Subordinated Notes | | | 4.700 | % | | | 7/3/18 | | | | 1,960,000 | | | $ | 1,902,023 | |
Royal Bank of Scotland Group PLC, Subordinated Notes | | | 6.100 | % | | | 6/10/23 | | | | 12,920,000 | | | | 12,257,372 | |
Santander US Debt SA Unipersonal, Senior Notes | | | 3.724 | % | | | 1/20/15 | | | | 15,300,000 | | | | 15,443,208 | (a) |
Santander US Debt SA Unipersonal, Senior Notes | | | 3.781 | % | | | 10/7/15 | | | | 2,300,000 | | | | 2,344,358 | (a) |
Sumitomo Mitsui Banking Corp., Senior Notes | | | 3.150 | % | | | 7/22/15 | | | | 4,640,000 | | | | 4,833,288 | (a) |
Sumitomo Mitsui Banking Corp., Senior Notes | | | 3.100 | % | | | 1/14/16 | | | | 4,290,000 | | | | 4,468,044 | (a) |
Wachovia Bank N.A., Subordinated Notes | | | 6.000 | % | | | 11/15/17 | | | | 3,920,000 | | | | 4,473,167 | |
Wachovia Capital Trust III, Junior Subordinated Bonds | | | 5.570 | % | | | 8/16/13 | | | | 20,261,000 | | | | 19,881,106 | (b)(g) |
Wachovia Corp., Senior Notes | | | 5.750 | % | | | 2/1/18 | | | | 13,275,000 | | | | 15,289,667 | |
Wachovia Corp., Subordinated Notes | | | 5.250 | % | | | 8/1/14 | | | | 1,612,000 | | | | 1,683,782 | |
Wells Fargo & Co., Senior Notes | | | 3.676 | % | | | 6/15/16 | | | | 8,110,000 | | | | 8,664,870 | |
Wells Fargo & Co., Senior Notes | | | 1.500 | % | | | 1/16/18 | | | | 5,740,000 | | | | 5,598,371 | |
Wells Fargo & Co., Senior Notes | | | 4.600 | % | | | 4/1/21 | | | | 13,950,000 | | | | 15,201,482 | |
Wells Fargo & Co., Subordinated Notes | | | 5.000 | % | | | 11/15/14 | | | | 130,000 | | | | 137,072 | |
Wells Fargo & Co., Subordinated Notes | | | 3.450 | % | | | 2/13/23 | | | | 9,800,000 | | | | 9,359,343 | |
Wells Fargo Capital X, Capital Securities | | | 5.950 | % | | | 12/15/36 | | | | 7,092,000 | | | | 6,985,620 | |
Total Commercial Banks | | | | | | | | | | | | | | | 346,473,206 | |
Consumer Finance — 1.1% | | | | | | | | | | | | | | | | |
Ally Financial Inc., Senior Notes | | | 7.500 | % | | | 9/15/20 | | | | 3,380,000 | | | | 3,895,450 | |
American Express Co., Subordinated Debentures | | | 6.800 | % | | | 9/1/66 | | | | 9,716,000 | | | | 10,371,830 | (b) |
American Express Credit Corp., Senior Notes | | | 5.125 | % | | | 8/25/14 | | | | 22,150,000 | | | | 23,214,928 | |
American Honda Finance Corp., Notes | | | 1.000 | % | | | 8/11/15 | | | | 14,310,000 | | | | 14,333,154 | (a) |
Caterpillar Financial Services Corp., Senior Notes | | | 6.200 | % | | | 9/30/13 | | | | 700,000 | | | | 709,745 | |
General Motors Financial Co. Inc., Senior Notes | | | 2.750 | % | | | 5/15/16 | | | | 3,070,000 | | | | 3,020,112 | (a) |
General Motors Financial Co. Inc., Senior Notes | | | 3.250 | % | | | 5/15/18 | | | | 2,300,000 | | | | 2,236,750 | (a) |
General Motors Financial Co. Inc., Senior Notes | | | 4.250 | % | | | 5/15/23 | | | | 2,680,000 | | | | 2,495,750 | (a) |
HSBC Finance Corp., Senior Notes | | | 6.676 | % | | | 1/15/21 | | | | 18,610,000 | | | | 20,574,267 | |
SLM Corp., Medium-Term Notes | | | 8.000 | % | | | 3/25/20 | | | | 60,000 | | | | 64,950 | |
SLM Corp., Medium-Term Notes, Senior Notes | | | 5.625 | % | | | 8/1/33 | | | | 56,000 | | | | 46,480 | |
SLM Corp., Senior Notes | | | 5.000 | % | | | 4/15/15 | | | | 740,000 | | | | 764,050 | |
SLM Corp., Senior Notes | | | 3.875 | % | | | 9/10/15 | | | | 15,980,000 | | | | 16,140,647 | |
Toyota Motor Credit Corp., Senior Notes | | | 1.250 | % | | | 10/5/17 | | | | 16,560,000 | | | | 16,080,306 | |
Total Consumer Finance | | | | | | | | | | | | | | | 113,948,419 | |
Diversified Financial Services — 4.5% | | | | | | | | | | | | | | | | |
Bank of America Corp., Senior Notes | | | 4.500 | % | | | 4/1/15 | | | | 25,800,000 | | | | 27,062,291 | |
Bank of America Corp., Senior Notes | | | 3.875 | % | | | 3/22/17 | | | | 3,610,000 | | | | 3,780,872 | |
Bank of America Corp., Senior Notes | | | 5.750 | % | | | 12/1/17 | | | | 1,800,000 | | | | 2,000,475 | |
Bank of America Corp., Senior Notes | | | 5.625 | % | | | 7/1/20 | | | | 5,530,000 | | | | 6,088,348 | |
See Notes to Financial Statements.
| | |
| 14 | | Western Asset Core Plus Bond Fund 2013 Semi-Annual Report |
Western Asset Core Plus Bond Fund
| | | | | | | | | | | | | | | | |
| Security | | Rate | | | Maturity
Date | | | Face Amount† | | | Value | |
Diversified Financial Services — continued | | | | | | | | | | | | | | | | |
Bank of America Corp., Senior Notes | | | 5.875 | % | | | 1/5/21 | | | | 28,000,000 | | | $ | 31,513,608 | |
Bank of America Corp., Senior Notes | | | 5.000 | % | | | 5/13/21 | | | | 11,720,000 | | | | 12,496,602 | |
Bank of America Corp., Senior Notes | | | 3.300 | % | | | 1/11/23 | | | | 6,500,000 | | | | 6,143,456 | |
Bank of America Corp., Subordinated Notes | | | 5.420 | % | | | 3/15/17 | | | | 3,000,000 | | | | 3,212,892 | |
Boeing Capital Corp., Senior Notes | | | 4.700 | % | | | 10/27/19 | | | | 5,890,000 | | | | 6,652,667 | |
Citigroup Inc., Junior Subordinated Bonds | | | 5.350 | % | | | 5/15/23 | | | | 6,200,000 | | | | 5,812,500 | (b)(g) |
Citigroup Inc., Junior Subordinated Notes | | | 5.950 | % | | | 1/30/23 | | | | 6,580,000 | | | | 6,547,758 | (b)(g) |
Citigroup Inc., Junior Subordinated Notes | | | 5.900 | % | | | 2/15/23 | | | | 3,420,000 | | | | 3,385,800 | (b)(g) |
Citigroup Inc., Notes | | | 6.500 | % | | | 8/19/13 | | | | 10,000 | | | | 10,074 | |
Citigroup Inc., Senior Notes | | | 6.000 | % | | | 12/13/13 | | | | 21,000,000 | | | | 21,487,830 | |
Citigroup Inc., Senior Notes | | | 5.125 | % | | | 5/5/14 | | | | 226,000 | | | | 233,350 | |
Citigroup Inc., Senior Notes | | | 6.375 | % | | | 8/12/14 | | | | 3,040,000 | | | | 3,208,051 | |
Citigroup Inc., Senior Notes | | | 5.500 | % | | | 10/15/14 | | | | 60,000 | | | | 63,107 | |
Citigroup Inc., Senior Notes | | | 6.010 | % | | | 1/15/15 | | | | 9,530,000 | | | | 10,177,325 | |
Citigroup Inc., Senior Notes | | | 3.953 | % | | | 6/15/16 | | | | 11,150,000 | | | | 11,752,880 | |
Citigroup Inc., Senior Notes | | | 6.000 | % | | | 8/15/17 | | | | 7,720,000 | | | | 8,698,749 | |
Citigroup Inc., Senior Notes | | | 5.375 | % | | | 8/9/20 | | | | 5,850,000 | | | | 6,468,924 | |
Citigroup Inc., Senior Notes | | | 5.875 | % | | | 5/29/37 | | | | 6,040,000 | | | | 6,544,292 | |
Citigroup Inc., Senior Notes | | | 6.875 | % | | | 3/5/38 | | | | 25,130,000 | | | | 30,473,442 | |
Citigroup Inc., Subordinated Notes | | | 5.000 | % | | | 9/15/14 | | | | 2,010,000 | | | | 2,088,846 | |
Citigroup Inc., Subordinated Notes | | | 4.050 | % | | | 7/30/22 | | | | 4,274,000 | | | | 4,107,767 | |
Citigroup Inc., Subordinated Notes | | | 6.125 | % | | | 8/25/36 | | | | 180,000 | | | | 176,236 | |
General Electric Capital Corp., Notes | | | 5.300 | % | | | 2/11/21 | | | | 4,850,000 | | | | 5,320,309 | |
General Electric Capital Corp., Senior Notes | | | 1.625 | % | | | 7/2/15 | | | | 11,870,000 | | | | 12,008,748 | |
General Electric Capital Corp., Senior Notes | | | 4.375 | % | | | 9/16/20 | | | | 30,000 | | | | 31,759 | |
General Electric Capital Corp., Senior Notes | | | 6.875 | % | | | 1/10/39 | | | | 37,150,000 | | | | 45,783,697 | |
General Electric Capital Corp., Subordinated Debentures | | | 6.375 | % | | | 11/15/67 | | | | 39,875,000 | | | | 41,470,000 | (b) |
ILFC E-Capital Trust II, Bonds | | | 6.250 | % | | | 12/21/65 | | | | 2,870,000 | | | | 2,611,700 | (a)(b) |
ING US Inc., Senior Notes | | | 2.900 | % | | | 2/15/18 | | | | 2,450,000 | | | | 2,462,328 | (a) |
International Lease Finance Corp., Senior Secured Notes | | | 6.500 | % | | | 9/1/14 | | | | 5,570,000 | | | | 5,792,800 | (a) |
International Lease Finance Corp., Senior Secured Notes | | | 6.750 | % | | | 9/1/16 | | | | 26,120,000 | | | | 28,209,600 | (a) |
JPMorgan Chase & Co., Senior Notes | | | 1.100 | % | | | 10/15/15 | | | | 24,190,000 | | | | 24,042,393 | |
JPMorgan Chase & Co., Senior Notes | | | 6.300 | % | | | 4/23/19 | | | | 9,630,000 | | | | 11,187,152 | |
JPMorgan Chase & Co., Senior Notes | | | 4.400 | % | | | 7/22/20 | | | | 10,770,000 | | | | 11,262,480 | |
JPMorgan Chase & Co., Senior Notes | | | 4.350 | % | | | 8/15/21 | | | | 1,780,000 | | | | 1,854,303 | |
JPMorgan Chase & Co., Senior Notes | | | 4.500 | % | | | 1/24/22 | | | | 9,480,000 | | | | 9,926,717 | |
JPMorgan Chase & Co., Subordinated Notes | | | 5.150 | % | | | 10/1/15 | | | | 490,000 | | | | 529,406 | |
JPMorgan Chase & Co., Subordinated Notes | | | 6.125 | % | | | 6/27/17 | | | | 309,000 | | | | 348,556 | |
See Notes to Financial Statements.
| | |
| Western Asset Core Plus Bond Fund 2013 Semi-Annual Report | | 15 |
Schedule of investments (unaudited) (cont’d)
June 30, 2013
Western Asset Core Plus Bond Fund
| | | | | | | | | | | | | | | | |
| Security | | Rate | | | Maturity
Date | | | Face Amount† | | | Value | |
Diversified Financial Services — continued | | | | | | | | | | | | | | | | |
JPMorgan Chase & Co., Subordinated Notes | | | 3.375 | % | | | 5/1/23 | | | | 17,478,000 | | | $ | 16,274,814 | |
Nationstar Mortgage LLC/Nationstar Capital Corp.,
Senior Notes | | | 6.500 | % | | | 7/1/21 | | | | 2,360,000 | | | | 2,265,600 | |
Patrons’ Legacy, Secured Notes | | | 5.775 | % | | | 5/23/20 | | | | 8,602,125 | | | | 8,455,889 | (a) |
Total Diversified Financial Services | | | | | | | | | | | | | | | 450,026,393 | |
Insurance — 0.3% | | | | | | | | | | | | | | | | |
American International Group Inc., Junior Subordinated Debentures | | | 6.250 | % | | | 3/15/37 | | | | 610,000 | | | | 622,962 | |
American International Group Inc., Medium-Term Notes, Senior Notes | | | 5.850 | % | | | 1/16/18 | | | | 60,000 | | | | 67,465 | |
American International Group Inc., Senior Notes | | | 3.750 | % | | | 11/30/13 | | | | 1,840,000 | | | | 1,862,704 | (a) |
American International Group Inc., Senior Notes | | | 8.250 | % | | | 8/15/18 | | | | 160,000 | | | | 198,423 | |
Berkshire Hathaway Inc., Senior Notes | | | 3.200 | % | | | 2/11/15 | | | | 6,690,000 | | | | 6,958,483 | |
MetLife Capital Trust IV, Junior Subordinated Notes | | | 7.875 | % | | | 12/15/37 | | | | 8,900,000 | | | | 10,599,072 | (a) |
MetLife Inc., Junior Subordinated Debentures | | | 6.400 | % | | | 12/15/36 | | | | 5,783,000 | | | | 5,913,117 | |
MetLife Inc., Senior Notes | | | 4.750 | % | | | 2/8/21 | | | | 6,300,000 | | | | 6,865,822 | |
Prudential Financial Inc., Senior Notes | | | 4.500 | % | | | 11/16/21 | | | | 300,000 | | | | 316,062 | |
Teachers Insurance & Annuity Association of America —College Retirement Equity Fund, Notes | | | 6.850 | % | | | 12/16/39 | | | | 280,000 | | | | 341,948 | (a) |
Total Insurance | | | | | | | | | | | | | | | 33,746,058 | |
Thrifts & Mortgage Finance — 0.1% | | | | | | | | | | | | | | | | |
Countrywide Financial Corp., Subordinated Notes | | | 6.250 | % | | | 5/15/16 | | | | 6,591,000 | | | | 7,187,373 | |
Total Financials | | | | | | | | | | | | | | | 1,125,227,292 | |
| Health Care — 2.1% | | | | | | | | | | | | | | | | |
Health Care Equipment & Supplies — 0.1% | | | | | | | | | | | | | | | | |
Medtronic Inc., Senior Notes | | | 4.450 | % | | | 3/15/20 | | | | 6,960,000 | | | | 7,577,756 | |
Medtronic Inc., Senior Notes | | | 3.125 | % | | | 3/15/22 | | | | 1,010,000 | | | | 987,097 | |
Total Health Care Equipment & Supplies | | | | | | | | | | | | | | | 8,564,853 | |
Health Care Providers & Services — 1.1% | | | | | | | | | | | | | | | | |
AmerisourceBergen Corp., Senior Notes | | | 5.875 | % | | | 9/15/15 | | | | 5,350,000 | | | | 5,905,870 | |
Express Scripts Holding Co., Senior Notes | | | 3.500 | % | | | 11/15/16 | | | | 32,790,000 | | | | 34,807,765 | |
Fresenius Medical Care U.S. Finance II Inc., Senior Notes | | | 5.875 | % | | | 1/31/22 | | | | 2,730,000 | | | | 2,873,325 | (a) |
Fresenius Medical Care U.S. Finance Inc., Senior Notes | | | 6.875 | % | | | 7/15/17 | | | | 220,000 | | | | 240,350 | |
Fresenius Medical Care U.S. Finance Inc., Senior Notes | | | 5.750 | % | | | 2/15/21 | | | | 2,560,000 | | | | 2,688,000 | (a) |
HCA Inc., Debentures | | | 7.500 | % | | | 11/15/95 | | | | 15,410,000 | | | | 14,331,300 | |
HCA Inc., Notes | | | 7.690 | % | | | 6/15/25 | | | | 723,000 | | | | 780,840 | |
HCA Inc., Notes | | | 7.500 | % | | | 11/6/33 | | | | 1,105,000 | | | | 1,138,150 | |
HCA Inc., Senior Notes | | | 5.750 | % | | | 3/15/14 | | | | 485,000 | | | | 494,700 | |
HCA Inc., Senior Secured Notes | | | 6.500 | % | | | 2/15/20 | | | | 3,330,000 | | | | 3,602,644 | |
See Notes to Financial Statements.
| | |
| 16 | | Western Asset Core Plus Bond Fund 2013 Semi-Annual Report |
Western Asset Core Plus Bond Fund
| | | | | | | | | | | | | | | | |
| Security | | Rate | | | Maturity
Date | | | Face Amount† | | | Value | |
Health Care Providers & Services — continued | | | | | | | | | | | | | | | | |
Humana Inc., Senior Notes | | | 7.200 | % | | | 6/15/18 | | | | 240,000 | | | $ | 285,889 | |
Humana Inc., Senior Notes | | | 3.150 | % | | | 12/1/22 | | | | 4,100,000 | | | | 3,804,923 | |
Tenet Healthcare Corp., Senior Notes | | | 9.250 | % | | | 2/1/15 | | | | 11,570,000 | | | | 12,538,988 | |
Tenet Healthcare Corp., Senior Secured Notes | | | 4.500 | % | | | 4/1/21 | | | | 50,000 | | | | 46,625 | (a) |
UnitedHealth Group Inc., Senior Notes | | | 6.000 | % | | | 2/15/18 | | | | 310,000 | | | | 364,077 | |
UnitedHealth Group Inc., Senior Notes | | | 1.625 | % | | | 3/15/19 | | | | 1,540,000 | | | | 1,488,544 | |
WellPoint Inc., Notes | | | 5.875 | % | | | 6/15/17 | | | | 3,060,000 | | | | 3,476,634 | |
WellPoint Inc., Notes | | | 7.000 | % | | | 2/15/19 | | | | 5,640,000 | | | | 6,771,215 | |
WellPoint Inc., Senior Notes | | | 1.250 | % | | | 9/10/15 | | | | 3,210,000 | | | | 3,215,364 | |
WellPoint Inc., Senior Notes | | | 3.700 | % | | | 8/15/21 | | | | 7,580,000 | | | | 7,642,815 | |
WellPoint Inc., Senior Notes | | | 3.125 | % | | | 5/15/22 | | | | 5,280,000 | | | | 5,006,718 | |
Total Health Care Providers & Services | | | | | | | | | | | | | | | 111,504,736 | |
Life Sciences Tools & Services — 0.1% | | | | | | | | | | | | | | | | |
Thermo Fisher Scientific Inc., Senior Notes | | | 3.600 | % | | | 8/15/21 | | | | 4,520,000 | | | | 4,433,003 | |
Pharmaceuticals — 0.8% | | | | | | | | | | | | | | | | |
AbbVie Inc., Senior Notes | | | 1.750 | % | | | 11/6/17 | | | | 17,500,000 | | | | 17,145,047 | (a) |
AbbVie Inc., Senior Notes | | | 2.900 | % | | | 11/6/22 | | | | 10,730,000 | | | | 10,034,063 | (a) |
GlaxoSmithKline Capital Inc., Senior Bond | | | 6.375 | % | | | 5/15/38 | | | | 7,000,000 | | | | 8,547,056 | |
GlaxoSmithKline Capital PLC, Senior Notes | | | 2.850 | % | | | 5/8/22 | | | | 10,240,000 | | | | 9,829,048 | |
Merck and Co. Inc., Senior Notes | | | 6.000 | % | | | 9/15/17 | | | | 340,000 | | | | 396,865 | |
Pfizer Inc., Senior Notes | | | 6.200 | % | | | 3/15/19 | | | | 8,755,000 | | | | 10,557,173 | |
Roche Holdings Inc., Senior Notes | | | 6.000 | % | | | 3/1/19 | | | | 9,960,000 | | | | 11,892,071 | (a) |
Teva Pharmaceutical Finance Co. BV, Senior Notes | | | 3.650 | % | | | 11/10/21 | | | | 1,760,000 | | | | 1,760,162 | |
Teva Pharmaceutical Finance IV BV, Senior Notes | | | 3.650 | % | | | 11/10/21 | | | | 1,870,000 | | | | 1,870,172 | |
Wyeth, Notes | | | 5.950 | % | | | 4/1/37 | | | | 7,148,000 | | | | 8,386,841 | |
Zoetis Inc., Senior Notes | | | 3.250 | % | | | 2/1/23 | | | | 2,340,000 | | | | 2,223,274 | (a) |
Total Pharmaceuticals | | | | | | | | | | | | | | | 82,641,772 | |
Total Health Care | | | | | | | | | | | | | | | 207,144,364 | |
| Industrials — 1.6% | | | | | | | | | | | | | | | | |
Aerospace & Defense — 0.2% | | | | | | | | | | | | | | | | |
Boeing Co., Senior Notes | | | 6.000 | % | | | 3/15/19 | | | | 8,370,000 | | | | 9,964,644 | |
Boeing Co., Senior Notes | | | 4.875 | % | | | 2/15/20 | | | | 3,180,000 | | | | 3,629,907 | |
Raytheon Co., Senior Notes | | | 3.125 | % | | | 10/15/20 | | | | 4,520,000 | | | | 4,548,268 | |
Total Aerospace & Defense | | | | | | | | | | | | | | | 18,142,819 | |
Airlines — 0.5% | | | | | | | | | | | | | | | | |
Air 2 US, Notes | | | 8.027 | % | | | 10/1/19 | | | | 5,405,595 | | | | 5,811,015 | (a) |
DAE Aviation Holdings Inc., Senior Notes | | | 11.250 | % | | | 8/1/15 | | | | 988,000 | | | | 990,470 | (a) |
Delta Air Lines Inc., Pass-Through Certificates | | | 6.821 | % | | | 8/10/22 | | | | 12,424,519 | | | | 14,045,919 | |
See Notes to Financial Statements.
| | |
| Western Asset Core Plus Bond Fund 2013 Semi-Annual Report | | 17 |
Schedule of investments (unaudited) (cont’d)
June 30, 2013
Western Asset Core Plus Bond Fund
| | | | | | | | | | | | | | | | |
| Security | | Rate | | | Maturity
Date | | | Face Amount† | | | Value | |
Airlines — continued | | | | | | | | | | | | | | | | |
Northwest Airlines Corp., Pass-Through Certificates | | | 7.575 | % | | | 3/1/19 | | | | 6,879,361 | | | $ | 7,945,662 | |
Southwest Airlines Co., Notes | | | 5.125 | % | | | 3/1/17 | | | | 5,320,000 | | | | 5,735,311 | |
United Airlines Inc., Pass-Through Certificates | | | 6.900 | % | | | 1/2/18 | | | | 39,451 | | | | 41,424 | |
United Airlines Inc., Pass-Through Certificates | | | 6.703 | % | | | 6/15/21 | | | | 181,599 | | | | 193,403 | |
United Airlines Inc., Pass-Through Certificates | | | 5.983 | % | | | 4/19/22 | | | | 10,272,552 | | | | 11,402,533 | |
United Airlines Inc., Pass-Through Certificates,
Secured Notes | | | 9.750 | % | | | 1/15/17 | | | | 1,948,789 | | | | 2,241,108 | |
United Airlines Inc., Senior Secured Notes | | | 6.750 | % | | | 9/15/15 | | | | 310,000 | | | | 318,525 | (a) |
Total Airlines | | | | | | | | | | | | | | | 48,725,370 | |
Building Products — 0.2% | | | | | | | | | | | | | | | | |
Building Materials Corp. of America, Senior Notes | | | 6.750 | % | | | 5/1/21 | | | | 105,000 | | | | 111,562 | (a) |
Masco Corp., Senior Debentures | | | 7.125 | % | | | 8/15/13 | | | | 5,830,000 | | | | 5,859,150 | |
Masco Corp., Senior Notes | | | 6.125 | % | | | 10/3/16 | | | | 8,270,000 | | | | 8,931,600 | |
Total Building Products | | | | | | | | | | | | | | | 14,902,312 | |
Commercial Services & Supplies — 0.2% | | | | | | | | | | | | | | | | |
Taylor Morrison Communities Inc./Monarch Communities Inc., Senior Notes | | | 7.750 | % | | | 4/15/20 | | | | 2,730,000 | | | | 2,941,575 | (a) |
Taylor Morrison Communities Inc./Monarch Communities Inc., Senior Notes | | | 5.250 | % | | | 4/15/21 | | | | 6,400,000 | | | | 6,080,000 | (a) |
Waste Management Inc., Senior Notes | | | 5.000 | % | | | 3/15/14 | | | | 6,938,000 | | | | 7,141,311 | |
Waste Management Inc., Senior Notes | | | 7.125 | % | | | 12/15/17 | | | | 500,000 | | | | 588,441 | |
Waste Management Inc., Senior Notes | | | 4.600 | % | | | 3/1/21 | | | | 2,370,000 | | | | 2,544,055 | |
Waste Management Inc., Senior Notes | | | 7.375 | % | | | 5/15/29 | | | | 1,280,000 | | | | 1,586,563 | |
Total Commercial Services & Supplies | | | | | | | | | | | | | | | 20,881,945 | |
Electrical Equipment — 0.3% | | | | | | | | | | | | | | | | |
Eaton Corp., Senior Notes | | | 1.500 | % | | | 11/2/17 | | | | 6,310,000 | | | | 6,125,218 | (a) |
Eaton Corp., Senior Notes | | | 2.750 | % | | | 11/2/22 | | | | 22,785,000 | | | | 21,315,801 | (a) |
Eaton Corp., Senior Notes | | | 4.150 | % | | | 11/2/42 | | | | 6,590,000 | | | | 5,912,528 | (a) |
Total Electrical Equipment | | | | | | | | | | | | | | | 33,353,547 | |
Industrial Conglomerates — 0.1% | | | | | | | | | | | | | | | | |
General Electric Co., Senior Notes | | | 0.850 | % | | | 10/9/15 | | | | 6,700,000 | | | | 6,693,662 | |
United Technologies Corp., Senior Notes | | | 4.500 | % | | | 6/1/42 | | | | 7,330,000 | | | | 7,228,135 | |
Total Industrial Conglomerates | | | | | | | | | | | | | | | 13,921,797 | |
Machinery — 0.1% | | | | | | | | | | | | | | | | |
John Deere Capital Corp., Notes | | | 2.250 | % | | | 4/17/19 | | | | 5,268,000 | | | | 5,261,478 | |
John Deere Capital Corp., Senior Notes | | | 1.700 | % | | | 1/15/20 | | | | 2,490,000 | | | | 2,354,950 | |
Total Machinery | | | | | | | | | | | | | | | 7,616,428 | |
Road & Rail — 0.0% | | | | | | | | | | | | | | | | |
Kansas City Southern de Mexico SA de CV, Senior Notes | | | 6.125 | % | | | 6/15/21 | | | | 256,000 | | | | 290,560 | |
See Notes to Financial Statements.
| | |
| 18 | | Western Asset Core Plus Bond Fund 2013 Semi-Annual Report |
Western Asset Core Plus Bond Fund
| | | | | | | | | | | | | | | | |
| Security | | Rate | | | Maturity
Date | | | Face Amount† | | | Value | |
Transportation Infrastructure — 0.0% | | | | | | | | | | | | | | | | |
Aguila 3 SA, Senior Secured Notes | | | 7.875 | % | | | 1/31/18 | | | | 2,370,000 | | | $ | 2,441,100 | (a) |
Total Industrials | | | | | | | | | | | | | | | 160,275,878 | |
| Information Technology — 0.4% | | | | | | | | | | | | | | | | |
Computers & Peripherals — 0.2% | | | | | | | | | | | | | | | | |
Apple Inc., Senior Notes | | | 2.400 | % | | | 5/3/23 | | | | 25,815,000 | | | | 23,942,483 | |
IT Services — 0.0% | | | | | | | | | | | | | | | | |
Electronic Data Systems Corp., Senior Notes | | | 6.000 | % | | | 8/1/13 | | | | 775,000 | | | | 778,094 | |
First Data Corp., Senior Secured Notes | | | 6.750 | % | | | 11/1/20 | | | | 50,000 | | | | 50,875 | (a) |
International Business Machines Corp., Senior Notes | | | 5.600 | % | | | 11/30/39 | | | | 82,000 | | | | 94,362 | |
International Business Machines Corp., Senior Notes | | | 4.000 | % | | | 6/20/42 | | | | 1,637,000 | | | | 1,536,203 | |
Total IT Services | | | | | | | | | | | | | | | 2,459,534 | |
Semiconductors & Semiconductor Equipment — 0.0% | | | | | | | | | | | | | | | | |
National Semiconductor Corp., Senior Notes | | | 6.600 | % | | | 6/15/17 | | | | 1,360,000 | | | | 1,597,997 | |
Software — 0.2% | | | | | | | | | | | | | | | | |
Oracle Corp., Senior Notes | | | 1.200 | % | | | 10/15/17 | | | | 15,770,000 | | | | 15,316,155 | |
Total Information Technology | | | | | | | | | | | | | | | 43,316,169 | |
| Materials — 3.1% | | | | | | | | | | | | | | | | |
Chemicals — 0.1% | | | | | | | | | | | | | | | | |
Eagle Spinco Inc., Senior Notes | | | 4.625 | % | | | 2/15/21 | | | | 2,610,000 | | | | 2,505,600 | (a) |
Ecolab Inc., Senior Notes | | | 4.350 | % | | | 12/8/21 | | | | 3,890,000 | | | | 4,106,743 | |
LyondellBasell Industries NV, Senior Notes | | | 5.000 | % | | | 4/15/19 | | | | 2,690,000 | | | | 2,926,978 | |
LyondellBasell Industries NV, Senior Notes | | | 6.000 | % | | | 11/15/21 | | | | 4,690,000 | | | | 5,270,181 | |
LyondellBasell Industries NV, Senior Notes | | | 5.750 | % | | | 4/15/24 | | | | 2,690,000 | | | | 2,958,102 | |
Potash Corp. of Saskatchewan Inc., Senior Notes | | | 4.875 | % | | | 3/30/20 | | | | 330,000 | | | | 365,201 | |
Total Chemicals | | | | | | | | | | | | | | | 18,132,805 | |
Containers & Packaging — 0.4% | | | | | | | | | | | | | | | | |
Ardagh Packaging Finance PLC/Ardagh MP Holdings USA Inc., Senior Secured Notes | | | 4.875 | % | | | 11/15/22 | | | | 3,045,000 | | | | 2,847,075 | (a) |
Ball Corp., Senior Notes | | | 6.750 | % | | | 9/15/20 | | | | 7,314,000 | | | | 7,880,835 | |
Ball Corp., Senior Notes | | | 5.750 | % | | | 5/15/21 | | | | 10,140,000 | | | | 10,672,350 | |
Reynolds Group Issuer Inc./Reynolds Group Issuer LLC/Reynolds Group Issuer (Luxembourg) SA, Senior Notes | | | 8.500 | % | | | 5/15/18 | | | | 2,090,000 | | | | 2,152,700 | |
Reynolds Group Issuer Inc./Reynolds Group Issuer LLC/Reynolds Group Issuer (Luxembourg) SA, Senior Secured Notes | | | 7.125 | % | | | 4/15/19 | | | | 4,550,000 | | | | 4,805,938 | |
Reynolds Group Issuer Inc./Reynolds Group Issuer LLC/Reynolds Group Issuer (Luxembourg) SA, Senior Secured Notes | | | 6.875 | % | | | 2/15/21 | | | | 5,165,000 | | | | 5,423,250 | |
Rock-Tenn Co., Senior Notes | | | 3.500 | % | | | 3/1/20 | | | | 2,855,000 | | | | 2,793,680 | |
Rock-Tenn Co., Senior Notes | | | 4.000 | % | | | 3/1/23 | | | | 3,740,000 | | | | 3,603,632 | |
Total Containers & Packaging | | | | | | | | | | | | | | | 40,179,460 | |
See Notes to Financial Statements.
| | |
| Western Asset Core Plus Bond Fund 2013 Semi-Annual Report | | 19 |
Schedule of investments (unaudited) (cont’d)
June 30, 2013
Western Asset Core Plus Bond Fund
| | | | | | | | | | | | | | | | |
| Security | | Rate | | | Maturity
Date | | | Face Amount† | | | Value | |
Metals & Mining — 2.5% | | | | | | | | | | | | | | | | |
ArcelorMittal, Senior Notes | | | 5.000 | % | | | 2/25/17 | | | | 4,082,000 | | | $ | 4,133,025 | |
Barrick Gold Corp., Notes | | | 4.100 | % | | | 5/1/23 | | | | 15,330,000 | | | | 12,807,540 | (a) |
Barrick Gold Corp., Senior Notes | | | 6.950 | % | | | 4/1/19 | | | | 7,305,000 | | | | 7,748,823 | |
Barrick Gold Corp., Senior Notes | | | 3.850 | % | | | 4/1/22 | | | | 4,330,000 | | | | 3,643,353 | |
Barrick North America Finance LLC, Senior Notes | | | 4.400 | % | | | 5/30/21 | | | | 9,779,000 | | | | 8,743,042 | |
BHP Billiton Finance USA Ltd., Senior Notes | | | 6.500 | % | | | 4/1/19 | | | | 20,420,000 | | | | 24,447,049 | |
BHP Billiton Finance USA Ltd., Senior Notes | | | 3.250 | % | | | 11/21/21 | | | | 3,080,000 | | | | 3,011,627 | |
Cliffs Natural Resources Inc., Senior Notes | | | 3.950 | % | | | 1/15/18 | | | | 8,490,000 | | | | 8,111,414 | |
Cliffs Natural Resources Inc., Senior Notes | | | 4.800 | % | | | 10/1/20 | | | | 6,178,000 | | | | 5,568,824 | |
Cliffs Natural Resources Inc., Senior Notes | | | 4.875 | % | | | 4/1/21 | | | | 40,000 | | | | 36,252 | |
Cliffs Natural Resources Inc., Senior Notes | | | 6.250 | % | | | 10/1/40 | | | | 4,470,000 | | | | 3,697,115 | |
FMG Resources (August 2006) Pty Ltd., Senior Notes | | | 7.000 | % | | | 11/1/15 | | | | 3,960,000 | | | | 3,999,600 | (a) |
FMG Resources (August 2006) Pty Ltd., Senior Notes | | | 6.375 | % | | | 2/1/16 | | | | 1,510,000 | | | | 1,508,113 | (a) |
FMG Resources (August 2006) Pty Ltd., Senior Notes | | | 6.000 | % | | | 4/1/17 | | | | 380,000 | | | | 369,550 | (a) |
FMG Resources (August 2006) Pty Ltd., Senior Notes | | | 8.250 | % | | | 11/1/19 | | | | 6,670,000 | | | | 6,870,100 | (a) |
Freeport-McMoRan Copper & Gold Inc., Senior Notes | | | 2.375 | % | | | 3/15/18 | | | | 3,370,000 | | | | 3,205,126 | (a) |
Freeport-McMoRan Copper & Gold Inc., Senior Notes | | | 3.100 | % | | | 3/15/20 | | | | 9,760,000 | | | | 9,021,305 | (a) |
Freeport-McMoRan Copper & Gold Inc., Senior Notes | | | 3.550 | % | | | 3/1/22 | | | | 14,953,000 | | | | 13,582,662 | |
Rio Tinto Finance USA Ltd., Notes | | | 6.500 | % | | | 7/15/18 | | | | 6,628,000 | | | | 7,842,912 | |
Rio Tinto Finance USA Ltd., Senior Notes | | | 1.875 | % | | | 11/2/15 | | | | 1,480,000 | | | | 1,501,441 | |
Rio Tinto Finance USA Ltd., Senior Notes | | | 2.500 | % | | | 5/20/16 | | | | 5,460,000 | | | | 5,613,972 | |
Rio Tinto Finance USA Ltd., Senior Notes | | | 9.000 | % | | | 5/1/19 | | | | 1,080,000 | | | | 1,403,019 | |
Rio Tinto Finance USA Ltd., Senior Notes | | | 3.500 | % | | | 11/2/20 | | | | 12,460,000 | | | | 12,397,189 | |
Rio Tinto Finance USA Ltd., Senior Notes | | | 4.125 | % | | | 5/20/21 | | | | 3,340,000 | | | | 3,395,387 | |
Rio Tinto Finance USA Ltd., Senior Notes | | | 3.750 | % | | | 9/20/21 | | | | 4,990,000 | | | | 4,927,855 | |
Southern Copper Corp., Senior Notes | | | 5.250 | % | | | 11/8/42 | | | | 22,390,000 | | | | 18,372,764 | |
Steel Dynamics Inc., Senior Notes | | | 7.625 | % | | | 3/15/20 | | | | 600,000 | | | | 639,000 | |
Vale Overseas Ltd., Notes | | | 6.875 | % | | | 11/21/36 | | | | 16,044,000 | | | | 16,244,357 | |
Vale Overseas Ltd., Senior Notes | | | 4.375 | % | | | 1/11/22 | | | | 32,397,000 | | | | 30,771,804 | |
Vedanta Resources PLC, Senior Notes | | | 8.750 | % | | | 1/15/14 | | | | 230,000 | | | | 235,175 | (a) |
Xstrata Finance Canada Ltd., Senior Bonds | | | 5.800 | % | | | 11/15/16 | | | | 3,090,000 | | | | 3,370,742 | (a) |
Xstrata Finance Canada Ltd., Senior Notes | | | 2.050 | % | | | 10/23/15 | | | | 13,920,000 | | | | 13,924,399 | (a) |
Xstrata Finance Canada Ltd., Senior Notes | | | 2.700 | % | | | 10/25/17 | | | | 11,790,000 | | | | 11,433,718 | (a) |
Total Metals & Mining | | | | | | | | | | | | | | | 252,578,254 | |
Paper & Forest Products — 0.1% | | | | | | | | | | | | | | | | |
Celulosa Arauco y Constitucion SA, Senior Notes | | | 4.750 | % | | | 1/11/22 | | | | 7,330,000 | | | | 7,280,134 | |
Total Materials | | | | | | | | | | | | | | | 318,170,653 | |
See Notes to Financial Statements.
| | |
| 20 | | Western Asset Core Plus Bond Fund 2013 Semi-Annual Report |
Western Asset Core Plus Bond Fund
| | | | | | | | | | | | | | | | |
| Security | | Rate | | | Maturity
Date | | | Face Amount† | | | Value | |
| Telecommunication Services — 2.5% | | | | | | | | | | | | | | | | |
Diversified Telecommunication Services — 1.8% | | | | | | | | | | | | | | | | |
AT&T Inc., Global Notes | | | 5.500 | % | | | 2/1/18 | | | | 13,583,000 | | | $ | 15,535,638 | |
AT&T Inc., Global Notes | | | 6.550 | % | | | 2/15/39 | | | | 190,000 | | | | 218,169 | |
AT&T Inc., Senior Notes | | | 2.500 | % | | | 8/15/15 | | | | 7,800,000 | | | | 8,037,401 | |
AT&T Inc., Senior Notes | | | 4.450 | % | | | 5/15/21 | | | | 2,930,000 | | | | 3,155,739 | |
AT&T Inc., Senior Notes | | | 3.875 | % | | | 8/15/21 | | | | 6,550,000 | | | | 6,755,618 | |
AT&T Inc., Senior Notes | | | 2.625 | % | | | 12/1/22 | | | | 7,930,000 | | | | 7,258,607 | |
AT&T Inc., Senior Notes | | | 6.300 | % | | | 1/15/38 | | | | 5,960,000 | | | | 6,626,125 | |
AT&T Inc., Senior Notes | | | 5.550 | % | | | 8/15/41 | | | | 3,040,000 | | | | 3,165,263 | |
AT&T Inc., Senior Notes | | | 4.350 | % | | | 6/15/45 | | | | 13,278,000 | | | | 11,552,245 | |
BellSouth Corp., Senior Bonds | | | 5.200 | % | | | 9/15/14 | | | | 8,250,000 | | | | 8,662,962 | |
British Telecommunications PLC, Bonds | | | 9.625 | % | | | 12/15/30 | | | | 5,310,000 | | | | 7,993,908 | |
CenturyLink Inc., Senior Notes | | | 5.800 | % | | | 3/15/22 | | | | 1,000,000 | | | | 985,000 | |
CenturyTel Inc., Senior Notes | | | 6.000 | % | | | 4/1/17 | | | | 8,270,000 | | | | 8,910,925 | |
Deutsche Telekom International Finance BV, Senior Notes | | | 5.750 | % | | | 3/23/16 | | | | 10,121,000 | | | | 11,251,182 | |
Intelsat Jackson Holdings SA, Senior Notes | | | 7.250 | % | | | 4/1/19 | | | | 3,009,000 | | | | 3,148,166 | |
Intelsat Jackson Holdings SA, Senior Notes | | | 7.250 | % | | | 10/15/20 | | | | 6,850,000 | | | | 7,192,500 | |
Intelsat Jackson Holdings SA, Senior Notes | | | 7.500 | % | | | 4/1/21 | | | | 3,000,000 | | | | 3,150,000 | |
Intelsat Jackson Holdings SA, Senior Notes | | | 5.500 | % | | | 8/1/23 | | | | 4,050,000 | | | | 3,807,000 | (a) |
Qwest Corp., Debentures | | | 6.875 | % | | | 9/15/33 | | | | 5,600,000 | | | | 5,418,000 | |
Qwest Corp., Senior Notes | | | 7.500 | % | | | 10/1/14 | | | | 2,870,000 | | | | 3,089,156 | |
Telefonica Emisiones SAU, Senior Notes | | | 6.421 | % | | | 6/20/16 | | | | 610,000 | | | | 669,763 | |
Telefonica Emisiones SAU, Senior Notes | | | 6.221 | % | | | 7/3/17 | | | | 560,000 | | | | 610,683 | |
Telefonica Emisiones SAU, Senior Notes | | | 5.877 | % | | | 7/15/19 | | | | 1,465,000 | | | | 1,581,548 | |
Telefonica Emisiones SAU, Senior Notes | | | 5.134 | % | | | 4/27/20 | | | | 8,495,000 | | | | 8,708,216 | |
Telefonica Emisiones SAU, Senior Notes | | | 5.462 | % | | | 2/16/21 | | | | 1,360,000 | | | | 1,402,084 | |
TW Telecom Holdings Inc., Senior Notes | | | 5.375 | % | | | 10/1/22 | | | | 3,676,000 | | | | 3,648,430 | |
UPCB Finance VI Ltd., Senior Secured Notes | | | 6.875 | % | | | 1/15/22 | | | | 7,755,000 | | | | 8,026,425 | (a) |
Verizon Communications Inc., Senior Notes | | | 8.750 | % | | | 11/1/18 | | | | 3,153,000 | | | | 4,109,431 | |
Verizon Communications Inc., Senior Notes | | | 6.350 | % | | | 4/1/19 | | | | 1,848,000 | | | | 2,192,419 | |
Verizon Communications Inc., Senior Notes | | | 3.500 | % | | | 11/1/21 | | | | 8,710,000 | | | | 8,748,385 | |
Verizon Communications Inc., Senior Notes | | | 2.450 | % | | | 11/1/22 | | | | 1,670,000 | | | | 1,514,186 | |
Verizon Communications Inc., Senior Notes | | | 6.000 | % | | | 4/1/41 | | | | 3,360,000 | | | | 3,769,802 | |
Verizon Communications Inc., Senior Notes | | | 3.850 | % | | | 11/1/42 | | | | 1,310,000 | | | | 1,086,962 | |
Windstream Corp., Senior Notes | | | 7.750 | % | | | 10/1/21 | | | | 8,290,000 | | | | 8,580,150 | |
Total Diversified Telecommunication Services | | | | | | | | | | | | | | | 180,562,088 | |
Wireless Telecommunication Services — 0.7% | | | | | | | | | | | | | | | | |
America Movil SAB de CV, Senior Notes | | | 5.625 | % | | | 11/15/17 | | | | 6,430,000 | | | | 7,266,755 | |
America Movil SAB de CV, Senior Notes | | | 5.000 | % | | | 3/30/20 | | | | 8,180,000 | | | | 8,779,512 | |
Cellco Partnership/Verizon Wireless Capital LLC, Senior Notes | | | 8.500 | % | | | 11/15/18 | | | | 18,045,000 | | | | 23,436,792 | |
See Notes to Financial Statements.
| | |
| Western Asset Core Plus Bond Fund 2013 Semi-Annual Report | | 21 |
Schedule of investments (unaudited) (cont’d)
June 30, 2013
Western Asset Core Plus Bond Fund
| | | | | | | | | | | | | | | | |
| Security | | Rate | | | Maturity
Date | | | Face Amount† | | | Value | |
Wireless Telecommunication Services — continued | | | | | | | | | | | | | | | | |
Rogers Cable Inc., Senior Secured Second Priority Notes | | | 6.750 | % | | | 3/15/15 | | | | 130,000 | | | $ | 142,570 | |
Rogers Communications Inc., Senior Notes | | | 6.800 | % | | | 8/15/18 | | | | 80,000 | | | | 96,583 | |
Rogers Wireless Inc., Secured Notes | | | 6.375 | % | | | 3/1/14 | | | | 1,850,000 | | | | 1,919,079 | |
SoftBank Corp., Senior Notes | | | 4.500 | % | | | 4/15/20 | | | | 10,660,000 | | | | 10,273,575 | (a) |
Sprint Capital Corp., Senior Notes | | | 6.875 | % | | | 11/15/28 | | | | 1,950,000 | | | | 1,872,000 | |
Sprint Capital Corp., Senior Notes | | | 8.750 | % | | | 3/15/32 | | | | 2,231,000 | | | | 2,454,100 | |
Sprint Communications Inc., Senior Notes | | | 9.000 | % | | | 11/15/18 | | | | 13,050,000 | | | | 15,268,500 | (a) |
Sprint Communications Inc., Senior Notes | | | 7.000 | % | | | 8/15/20 | | | | 920,000 | | | | 966,000 | |
Total Wireless Telecommunication Services | | | | | | | | | | | | | | | 72,475,466 | |
Total Telecommunication Services | | | | | | | | | | | | | | | 253,037,554 | |
| Utilities — 1.5% | | | | | | | | | | | | | | | | |
Electric Utilities — 0.9% | | | | | | | | | | | | | | | | |
Duke Energy Carolinas LLC, Secured Bonds | | | 5.300 | % | | | 2/15/40 | | | | 3,000,000 | | | | 3,253,824 | |
Duke Energy Progress Inc., Secured Bonds | | | 2.800 | % | | | 5/15/22 | | | | 400,000 | | | | 383,883 | |
Exelon Corp., Bonds | | | 5.625 | % | | | 6/15/35 | | | | 426,000 | | | | 437,835 | |
FirstEnergy Corp., Notes | | | 7.375 | % | | | 11/15/31 | | | | 26,584,000 | | | | 28,035,380 | |
FirstEnergy Corp., Senior Notes | | | 2.750 | % | | | 3/15/18 | | | | 4,290,000 | | | | 4,176,474 | |
FirstEnergy Corp., Senior Notes | | | 4.250 | % | | | 3/15/23 | | | | 19,250,000 | | | | 17,885,464 | |
MidAmerican Energy Holdings Co., Bonds | | | 6.125 | % | | | 4/1/36 | | | | 160,000 | | | | 181,514 | |
MidAmerican Energy Holdings Co., Senior Bonds | | | 6.500 | % | | | 9/15/37 | | | | 2,025,000 | | | | 2,404,637 | |
Pacific Gas & Electric Co., First Mortgage Bonds | | | 6.050 | % | | | 3/1/34 | | | | 90,000 | | | | 104,933 | |
Pacific Gas & Electric Co., Senior Notes | | | 8.250 | % | | | 10/15/18 | | | | 2,980,000 | | | | 3,843,002 | |
Pacific Gas & Electric Co., Senior Notes | | | 5.800 | % | | | 3/1/37 | | | | 11,790,000 | | | | 13,378,738 | |
Progress Energy Inc., Senior Notes | | | 4.400 | % | | | 1/15/21 | | | | 5,200,000 | | | | 5,522,285 | |
Progress Energy Inc., Senior Notes | | | 6.000 | % | | | 12/1/39 | | | | 7,000,000 | | | | 7,834,750 | |
Total Electric Utilities | | | | | | | | | | | | | | | 87,442,719 | |
Gas Utilities — 0.1% | | | | | | | | | | | | | | | | |
Southern Natural Gas Co., Senior Notes | | | 5.900 | % | | | 4/1/17 | | | | 50,000 | | | | 56,975 | (a) |
Southern Natural Gas Co., Senior Notes | | | 8.000 | % | | | 3/1/32 | | | | 9,413,000 | | | | 12,485,516 | |
Total Gas Utilities | | | | | | | | | | | | | | | 12,542,491 | |
Independent Power Producers & Energy Traders — 0.3% | | | | | | | | | | | | | | | | |
AES Corp., Senior Notes | | | 7.750 | % | | | 10/15/15 | | | | 2,756,000 | | | | 3,038,490 | |
AES Corp., Senior Notes | | | 8.000 | % | | | 6/1/20 | | | | 2,079,000 | | | | 2,370,060 | |
Calpine Corp., Senior Secured Notes | | | 7.500 | % | | | 2/15/21 | | | | 7,938,000 | | | | 8,473,815 | (a) |
Calpine Corp., Senior Secured Notes | | | 7.875 | % | | | 1/15/23 | | | | 1,719,000 | | | | 1,847,925 | (a) |
Energy Future Intermediate Holding Co. LLC/EFIH Finance Inc., Secured Notes | | | 12.250 | % | | | 3/1/22 | | | | 5,920,000 | | | | 6,541,600 | (a) |
Energy Future Intermediate Holding Co. LLC/EFIH Finance Inc., Senior Secured Notes | | | 10.000 | % | | | 12/1/20 | | | | 11,213,000 | | | | 12,278,235 | |
Total Independent Power Producers & Energy Traders | | | | | | | | | | | | | | | 34,550,125 | |
See Notes to Financial Statements.
| | |
| 22 | | Western Asset Core Plus Bond Fund 2013 Semi-Annual Report |
Western Asset Core Plus Bond Fund
| | | | | | | | | | | | | | | | |
| Security | | Rate | | | Maturity
Date | | | Face Amount† | | | Value | |
Multi-Utilities — 0.2% | | | | | | | | | | | | | | | | |
Dominion Resources Inc., Senior Notes | | | 5.600 | % | | | 11/15/16 | | | | 11,983,000 | | | $ | 13,600,741 | |
Dominion Resources Inc., Senior Notes | | | 8.875 | % | | | 1/15/19 | | | | 180,000 | | | | 235,122 | |
Dominion Resources Inc., Senior Notes | | | 7.000 | % | | | 6/15/38 | | | | 3,600,000 | | | | 4,689,738 | |
Total Multi-Utilities | | | | | | | | | | | | | | | 18,525,601 | |
Total Utilities | | | | | | | | | | | | | | | 153,060,936 | |
Total Corporate Bonds & Notes (Cost — $3,313,947,342) | | | | | | | | | | | | 3,422,231,356 | |
| Asset-Backed Securities — 3.8% | | | | | | | | | | | | | | | | |
ACE Securities Corp., 2006-GP1 A | | | 0.453 | % | | | 2/25/31 | | | | 99,016 | | | | 89,803 | (b) |
AFC Home Equity Loan Trust, 2002-2 2A | | | 0.493 | % | | | 6/25/30 | | | | 259,861 | | | | 215,520 | (b) |
Ameriquest Mortgage Securities Inc., 2003-1 M1 | | | 1.543 | % | | | 2/25/33 | | | | 1,090,157 | | | | 1,068,649 | (b) |
Ameriquest Mortgage Securities Inc., 2004-R2 A1A | | | 0.883 | % | | | 4/25/34 | | | | 141,017 | | | | 132,351 | (b) |
Argent Securities Inc., 2005-W5 A2D | | | 0.513 | % | | | 1/25/36 | | | | 17,460,000 | | | | 11,244,118 | (b) |
Asset-Backed Securities Corp. Home Equity, 2003-HE7 M1 | | | 1.168 | % | | | 12/15/33 | | | | 142,130 | | | | 130,138 | (b) |
Avis Budget Rental Car Funding AESOP II LLC, 2010-5A A | | | 3.150 | % | | | 3/20/17 | | | | 7,410,000 | | | | 7,727,711 | (a) |
Avis Budget Rental Car Funding AESOP II LLC, 2012-2A A | | | 2.802 | % | | | 5/20/18 | | | | 8,955,000 | | | | 9,234,118 | (a) |
Avis Budget Rental Car Funding AESOP II LLC, 2012-3A A | | | 2.100 | % | | | 3/20/19 | | | | 5,900,000 | | | | 5,794,951 | (a) |
Avis Budget Rental Car Funding AESOP LLC, 2013-1A A | | | 1.920 | % | | | 9/20/19 | | | | 5,700,000 | | | | 5,567,338 | (a) |
Bear Stearns Asset-Backed Securities Trust, 2004-SD3 A3 | | | 0.763 | % | | | 9/25/34 | | | | 81,464 | | | | 78,305 | (b) |
Bear Stearns Asset-Backed Securities Trust, 2005-CL1 A1 | | | 0.693 | % | | | 9/25/34 | | | | 4,492,602 | | | | 4,018,241 | (b) |
Bear Stearns Asset-Backed Securities Trust, 2006-1 A | | | 0.473 | % | | | 2/25/36 | | | | 487,948 | | | | 479,837 | (b) |
Brazos Student Loan Finance Corp., 2009-1 AS | | | 2.776 | % | | | 12/27/39 | | | | 6,700,000 | | | | 6,883,459 | (b) |
CDC Mortgage Capital Trust, 2002-HE1 A | | | 0.813 | % | | | 1/25/33 | | | | 282,262 | | | | 269,420 | (b) |
CDC Mortgage Capital Trust, 2004-HE3 M1 | | | 1.108 | % | | | 11/25/34 | | | | 184,828 | | | | 173,326 | (b) |
CIT Group Home Equity Loan Trust, 2003-1 A4 | | | 3.930 | % | | | 3/20/32 | | | | 767,370 | | | | 783,573 | |
Contimortgage Home Equity Trust, 1997-4 B1F | | | 7.330 | % | | | 10/15/28 | | | | 468,728 | | | | 494,272 | |
Countrywide Asset-Backed Certificates, 2002-BC1 | | | 0.853 | % | | | 4/25/32 | | | | 95,831 | | | | 64,809 | (b) |
Countrywide Asset-Backed Certificates, 2003-1 | | | 0.873 | % | | | 6/25/33 | | | | 129,669 | | | | 123,296 | (b) |
Countrywide Asset-Backed Certificates, 2003-BC3 A2 | | | 0.813 | % | | | 9/25/33 | | | | 470,971 | | | | 432,472 | (b) |
Countrywide Asset-Backed Certificates, 2004-15 | | | 4.614 | % | | | 12/25/32 | | | | 1,789,942 | | | | 1,755,581 | (b) |
Countrywide Asset-Backed Certificates, 2006-SD4 A1 | | | 0.533 | % | | | 12/25/36 | | | | 152,582 | | | | 85,717 | (a)(b) |
Countrywide Asset-Backed Certificates, 2007-SD1 A1 | | | 0.643 | % | | | 3/25/47 | | | | 514,781 | | | | 274,513 | (a)(b) |
Countrywide Home Equity Loan Trust, 2004-I A | | | 0.483 | % | | | 2/15/34 | | | | 210,366 | | | | 174,118 | (b) |
Countrywide Home Equity Loan Trust, 2006-E 2A | | | 0.333 | % | | | 7/15/36 | | | | 158,751 | | | | 131,365 | (b) |
Countrywide Home Equity Loan Trust, 2006-HW 2A1B | | | 0.343 | % | | | 11/15/36 | | | | 1,332,380 | | | | 1,128,225 | (b) |
Countrywide Home Equity Loan Trust, 2006-I 2A | | | 0.333 | % | | | 1/15/37 | | | | 16,800,319 | | | | 14,712,107 | (b) |
Countrywide Home Equity Loan Trust, 2007-B A | | | 0.343 | % | | | 2/15/37 | | | | 15,257,351 | | | | 12,800,613 | (b) |
Education Funding Capital Trust, 2004-1 A4 | | | 1.694 | % | | | 6/15/43 | | | | 4,600,000 | | | | 4,555,058 | (b) |
EFS Volunteer No. 2 LLC, 2012-1 A2 | | | 1.543 | % | | | 3/25/36 | | | | 200,000 | | | | 201,627 | (a)(b) |
See Notes to Financial Statements.
| | |
| Western Asset Core Plus Bond Fund 2013 Semi-Annual Report | | 23 |
Schedule of investments (unaudited) (cont’d)
June 30, 2013
Western Asset Core Plus Bond Fund
| | | | | | | | | | | | | | | | |
| Security | | Rate | | | Maturity
Date | | | Face Amount† | | | Value | |
| Asset-Backed Securities — continued | | | | | | | | | | | | | | | | |
EFS Volunteer No. 3 LLC, 2012-1 A3 | | | 1.193 | % | | | 4/25/33 | | | | 6,650,000 | | | $ | 6,504,119 | (a)(b) |
EMC Mortgage Loan Trust, 2002-B A1 | | | 0.843 | % | | | 2/25/41 | | | | 254,296 | | | | 229,152 | (a)(b) |
Fairbanks Capital Mortgage Loan Trust, 1999-1 A | | | 1.393 | % | | | 5/25/28 | | | | 323,723 | | | | 298,337 | (a)(b) |
GMAC Mortgage Corp. Loan Trust, 2004-HE3 A2VN | | | 0.433 | % | | | 10/25/34 | | | | 24,757,443 | | | | 20,535,279 | (a)(b) |
GMAC Mortgage Corp. Loan Trust, 2006-HE1 A | | | 0.403 | % | | | 11/25/36 | | | | 139,290 | | | | 106,960 | (b) |
Green Tree Financial Corp., 1992-2 B | | | 9.150 | % | | | 1/15/18 | | | | 11,010 | | | | 1,882 | |
Green Tree Financial Corp., 1993-2 | | | 8.000 | % | | | 7/15/18 | | | | 36,351 | | | | 36,632 | |
Green Tree Financial Corp., 1996-5 B1 | | | 8.100 | % | | | 7/15/26 | | | | 655,108 | | | | 41,095 | (b) |
Green Tree Home Improvement Loan Trust, 1996-A | | | 7.400 | % | | | 2/15/26 | | | | 56,170 | | | | 52,730 | |
Greenpoint Manufactured Housing, 1999-2 A2 | | | 2.959 | % | | | 3/18/29 | | | | 6,850,000 | | | | 6,088,917 | (b) |
Greenpoint Manufactured Housing, 1999-3 2A2 | | | 3.591 | % | | | 6/19/29 | | | | 3,275,000 | | | | 3,033,460 | (b) |
Greenpoint Manufactured Housing, 1999-4 A2 | | | 3.699 | % | | | 2/20/30 | | | | 3,125,000 | | | | 2,684,080 | (b) |
Greenpoint Manufactured Housing, 2001-2 IA2 | | | 3.699 | % | | | 2/20/32 | | | | 4,750,000 | | | | 4,225,657 | (b) |
Greenpoint Manufactured Housing, 2001-2 IIA2 | | | 3.693 | % | | | 3/13/32 | | | | 7,275,000 | | | | 6,335,186 | (b) |
Greenpoint Mortgage Funding Trust, 2005-HE1 | | | 0.793 | % | | | 9/25/34 | | | | 400,865 | | | | 395,837 | (b) |
GSAA Home Equity Trust, 2005-6 A3 | | | 0.563 | % | | | 6/25/35 | | | | 9,785,584 | | | | 8,864,389 | (b) |
GSAA Home Equity Trust, 2007-6 A4 | | | 0.493 | % | | | 5/25/47 | | | | 19,648,946 | | | | 12,890,966 | (b) |
GSAMP Trust, 2006-S4 A1 | | | 0.283 | % | | | 5/25/36 | | | | 131,313 | | | | 23,948 | (b) |
GSRPM Mortgage Loan Trust, 2007-1 A | | | 0.593 | % | | | 10/25/46 | | | | 11,583,960 | | | | 8,227,843 | (a)(b) |
Hertz Vehicle Financing LLC, 2009-2A A2 | | | 5.290 | % | | | 3/25/16 | | | | 5,500,000 | | | | 5,838,591 | (a) |
Hertz Vehicle Financing LLC, 2013-1A A2 | | | 1.830 | % | | | 8/25/19 | | | | 7,750,000 | | | | 7,447,370 | (a) |
Indymac Home Equity Loan Asset-Backed Trust, 2001-A | | | 0.453 | % | | | 3/25/31 | | | | 54,666 | | | | 43,273 | (b) |
Indymac Seconds Asset Backed Trust, 2006-A A | | | 0.453 | % | | | 6/25/36 | | | | 452,557 | | | | 102,638 | (b) |
Keycorp Student Loan Trust, 2003-A 1A2 | | | 0.536 | % | | | 10/25/32 | | | | 3,240,981 | | | | 3,176,372 | (b) |
Lehman XS Trust, 2005-5N 3A1A | | | 0.493 | % | | | 11/25/35 | | | | 2,777,556 | | | | 2,264,247 | (b) |
Lehman XS Trust, 2006-4N A2A | | | 0.413 | % | | | 4/25/46 | | | | 4,126,162 | | | | 2,908,164 | (b) |
Long Beach Mortgage Loan Trust, 2004-6 A3 | | | 1.493 | % | | | 11/25/34 | | | | 12,591,804 | | | | 12,485,327 | (b) |
Long Beach Mortgage Loan Trust, 2006-8 2A4 | | | 0.433 | % | | | 9/25/36 | | | | 5,923,430 | | | | 2,700,812 | (b) |
Long Beach Mortgage Loan Trust, 2006-9 2A3 | | | 0.353 | % | | | 10/25/36 | | | | 5,196,808 | | | | 2,312,969 | (b) |
Merrill Lynch Mortgage Investors Inc., 2005-SD1 A2 | | | 5.666 | % | | | 5/25/46 | | | | 17,238 | | | | 17,181 | (b) |
Morgan Stanley ABS Capital I, 2003-HE3 M1 | | | 1.213 | % | | | 10/25/33 | | | | 967,167 | | | | 880,490 | (b) |
Morgan Stanley Mortgage Loan Trust, 2006-4SL A1 | | | 0.493 | % | | | 3/25/36 | | | | 201,003 | | | | 82,153 | (b) |
Nelnet Student Loan Corp., 2004-2A A5B | | | 0.657 | % | | | 2/25/39 | | | | 400,000 | | | | 370,518 | (b) |
Nelnet Student Loan Trust, 2004-4 A5 | | | 0.436 | % | | | 1/25/37 | | | | 90,173 | | | | 87,177 | (b) |
Northstar Education Finance Inc., 2007-1 A6 | | | 1.216 | % | | | 1/29/46 | | | | 12,175,000 | | | | 11,140,563 | (b) |
Northstar Education Finance Inc., DE, Student Loan Asset Backed Note | | | 0.516 | % | | | 1/29/46 | | | | 6,475,000 | | | | 5,925,111 | (b) |
Novastar Home Equity Loan, 2003-3 A2C | | | 1.253 | % | | | 12/25/33 | | | | 116,408 | | | | 106,654 | (b) |
See Notes to Financial Statements.
| | |
| 24 | | Western Asset Core Plus Bond Fund 2013 Semi-Annual Report |
Western Asset Core Plus Bond Fund
| | | | | | | | | | | | | | | | |
| Security | | Rate | | | Maturity
Date | | | Face Amount† | | | Value | |
| Asset-Backed Securities — continued | | | | | | | | | | | | | | | | |
Option One Mortgage Loan Trust, 2002-6 A2 | | | 0.993 | % | | | 11/25/32 | | | | 969,072 | | | $ | 879,863 | (b) |
Option One Mortgage Loan Trust, 2003-1 A2 | | | 1.033 | % | | | 2/25/33 | | | | 57,983 | | | | 52,228 | (b) |
Origen Manufactured Housing, 2006-A A2 | | | 2.410 | % | | | 10/15/37 | | | | 32,454,968 | | | | 26,922,804 | (b) |
Origen Manufactured Housing, 2007-A A2 | | | 2.591 | % | | | 4/15/37 | | | | 14,679,862 | | | | 12,252,725 | (b) |
Origen Manufactured Housing Contract Trust, 2005-B | | | 5.990 | % | | | 1/15/37 | | | | 1,466,175 | | | | 1,539,217 | |
Origen Manufactured Housing Contract Trust, 2005-B | | | 6.480 | % | | | 1/15/37 | | | | 1,456,921 | | | | 1,563,458 | |
Ownit Mortgage Loan Asset-Backed Certificates, 2004-1 M2 | | | 1.993 | % | | | 7/25/35 | | | | 2,893,099 | | | | 2,704,773 | (b) |
Pegasus Aviation Lease Securitization, 2000-1 A2 | | | 8.370 | % | | | 3/25/30 | | | | 4,475,000 | | | | 1,611,000 | (a) |
Pennsylvania Higher Education Assistance Agency, 2005-1 B1 | | | 2.400 | % | | | 4/25/45 | | | | 500,000 | | | | 453,750 | (b) |
Provident Bank Home Equity Loan Trust, 2002-2 A2 | | | 0.733 | % | | | 8/25/31 | | | | 158,135 | | | | 97,732 | (b) |
RAAC, 2007-RP2 M1 | | | 0.843 | % | | | 2/25/46 | | | | 10,000,000 | | | | 4,000,960 | (a)(b) |
RAAC Series, 2006-RP4 A | | | 0.483 | % | | | 1/25/46 | | | | 59,704 | | | | 55,469 | (a)(b) |
RAAC Series, 2007-RP3 A | | | 0.573 | % | | | 10/25/46 | | | | 6,781,485 | | | | 5,418,170 | (a)(b) |
Renaissance Home Equity Loan Trust, 2003-1 A | | | 1.053 | % | | | 6/25/33 | | | | 36,227 | | | | 34,601 | (b) |
Renaissance Home Equity Loan Trust, 2003-3 A | | | 0.693 | % | | | 12/25/33 | | | | 195,971 | | | | 196,212 | (b) |
Renaissance Home Equity Loan Trust, 2003-4 A3 | | | 0.813 | % | | | 3/25/34 | | | | 10,169,836 | | | | 9,316,729 | (b) |
Renaissance Home Equity Loan Trust, 2005-1 | | | 0.523 | % | | | 5/25/35 | | | | 1,475,758 | | | | 1,325,554 | (b) |
Renaissance Home Equity Loan Trust, 2006-1 AF5 | | | 6.166 | % | | | 5/25/36 | | | | 16,500,000 | | | | 11,750,838 | |
Residential Asset Mortgage Products Inc., 2003-RS4 AIIB | | | 0.853 | % | | | 5/25/33 | | | | 467,977 | | | | 388,472 | (b) |
Residential Asset Mortgage Products Inc., 2003-RS7 MII1 | | | 1.318 | % | | | 8/25/33 | | | | 3,264,715 | | | | 2,809,901 | (b) |
Residential Funding Mortgage Securities II, 2003-HS3 | | | 0.483 | % | | | 8/25/33 | | | | 49,102 | | | | 43,612 | (b) |
Residential Funding Securities Corp., 2002-RP2 A1 | | | 1.693 | % | | | 10/25/32 | | | | 3,349,237 | | | | 2,835,745 | (a)(b) |
SACO I Trust, 2005-2 A | | | 0.593 | % | | | 4/25/35 | | | | 35,087 | | | | 26,309 | (a)(b) |
SACO I Trust, 2006-3 A3 | | | 0.653 | % | | | 4/25/36 | | | | 1,140,731 | | | | 599,442 | (b) |
SACO I Trust, 2006-5 1A | | | 0.493 | % | | | 4/25/36 | | | | 102,015 | | | | 68,824 | (b) |
SACO I Trust, 2006-6 A | | | 0.453 | % | | | 6/25/36 | | | | 149,091 | | | | 93,783 | (b) |
Saxon Asset Securities Trust, 2002-3 M1 | | | 1.318 | % | | | 12/25/32 | | | | 1,413,638 | | | | 1,284,318 | (b) |
Saxon Asset Securities Trust, 2003-3 M1 | | | 1.168 | % | | | 12/25/33 | | | | 8,066,735 | | | | 7,380,804 | (b) |
Saxon Asset Securities Trust, 2005-1 M1 | | | 0.883 | % | | | 5/25/35 | | | | 424,397 | | | | 388,456 | (b) |
SLM Student Loan Trust, 2004-3 A5 | | | 0.446 | % | | | 7/25/23 | | | | 22,550,000 | | | | 22,197,589 | (b) |
SLM Student Loan Trust, 2005-04 A3 | | | 0.396 | % | | | 1/25/27 | | | | 100,000 | | | | 96,339 | (b) |
SLM Student Loan Trust, 2006-5 A5 | | | 0.386 | % | | | 1/25/27 | | | | 14,430,000 | | | | 13,916,162 | (b) |
SLM Student Loan Trust, 2012-06 A3 | | | 0.943 | % | | | 5/26/26 | | | | 2,500,000 | | | | 2,472,395 | (b) |
Soundview Home Loan Trust, 2006-EQ1 A3 | | | 0.353 | % | | | 10/25/36 | | | | 16,750,451 | | | | 13,231,835 | (b) |
Southern Pacific Secured Assets Corp., 1998-2 A1 | | | 0.533 | % | | | 7/25/29 | | | | 9,271 | | | | 8,032 | (b) |
Structured Asset Investment Loan Trust, 2005-HE1 M2 | | | 0.673 | % | | | 7/25/35 | | | | 8,514,970 | | | | 6,148,651 | (b) |
Structured Asset Securities Corp., 2005-SC1 1A2 | | | 8.115 | % | | | 5/25/31 | | | | 430,101 | | | | 382,542 | (a)(b) |
Structured Asset Securities Corp., 2006-ARS1 A1 | | | 0.413 | % | | | 2/25/36 | | | | 1,169,230 | | | | 83,823 | (a)(b) |
See Notes to Financial Statements.
| | |
| Western Asset Core Plus Bond Fund 2013 Semi-Annual Report | | 25 |
Schedule of investments (unaudited) (cont’d)
June 30, 2013
Western Asset Core Plus Bond Fund
| | | | | | | | | | | | | | | | |
| Security | | Rate | | | Maturity
Date | | | Face Amount† | | | Value | |
| Asset-Backed Securities — continued | | | | | | | | | | | | | | | | |
UCFC Home Equity Loan, 1998-C | | | 5.935 | % | | | 1/15/30 | | | | 635 | | | $ | 631 | |
Total Asset-Backed Securities (Cost — $371,084,681) | | | | | | | | | | | | | | | 383,924,458 | |
| Collateralized Mortgage Obligations — 14.4% | | | | | | | | | | | | | | | | |
American Home Mortgage Assets, 2006-3 3A12 | | | 0.383 | % | | | 10/25/46 | | | | 11,219,161 | | | | 8,094,535 | (b) |
Banc of America Commercial Mortgage Inc., 2006-1 AM | | | 5.421 | % | | | 9/10/45 | | | | 3,669,000 | | | | 3,941,155 | (b) |
Banc of America Commercial Mortgage Inc., 2006-2 AM | | | 5.954 | % | | | 5/10/45 | | | | 540,000 | | | | 586,606 | (b) |
Banc of America Commercial Mortgage Inc., 2008-1 A4 | | | 6.395 | % | | | 2/10/51 | | | | 2,600,000 | | | | 2,979,296 | (b) |
Banc of America Funding Corp., 2003-1 A1 | | | 6.000 | % | | | 5/20/33 | | | | 70,555 | | | | 74,205 | |
Banc of America Funding Corp., 2004-B 3A2 | | | 3.200 | % | | | 12/20/34 | | | | 160,287 | | | | 104,663 | (b) |
Banc of America Funding Corp., 2005-F 2A1 | | | 3.132 | % | | | 9/20/35 | | | | 11,561,755 | | | | 8,368,652 | (b) |
Banc of America Mortgage Securities Inc., 2004-K 4A1 | | | 5.289 | % | | | 12/25/34 | | | | 124,568 | | | | 121,028 | (b) |
Bayview Commercial Asset Trust, 2006-SP1 A1 | | | 0.463 | % | | | 4/25/36 | | | | 80,948 | | | | 80,948 | (a)(b) |
BCAP LLC Trust, 2009-RR4 8A2 | | | 3.174 | % | | | 9/26/35 | | | | 4,526,117 | | | | 2,962,366 | (a)(b) |
BCAP LLC Trust, 2010-RR06 4A13 | | | 3.174 | % | | | 9/26/35 | | | | 3,699,805 | | | | 2,471,344 | (a)(b) |
Bear Stearns ARM Trust, 2005-12 11A1 | | | 2.903 | % | | | 2/25/36 | | | | 365,104 | | | | 275,523 | (b) |
Bear Stearns Commercial Mortgage Securities, 2007-PW16 AM | | | 5.905 | % | | | 6/11/40 | | | | 2,795,000 | | | | 3,104,194 | (b) |
Bear Stearns Commercial Mortgage Securities, 2007-PW17 AM | | | 5.915 | % | | | 6/11/50 | | | | 2,115,000 | | | | 2,356,336 | (b) |
CD Commercial Mortgage Trust, 2006-CD2 AM | | | 5.531 | % | | | 1/15/46 | | | | 2,500,000 | | | | 2,673,745 | (b) |
Chevy Chase Mortgage Funding Corp., 2005-4A A1 | | | 0.393 | % | | | 10/25/36 | | | | 956,082 | | | | 758,954 | (a)(b) |
Citigroup Mortgage Loan Trust Inc., 2005-05 | | | 1.631 | % | | | 8/25/35 | | | | 136,814 | | | | 98,624 | (b) |
Citigroup Mortgage Loan Trust Inc., 2005-10 1A1A | | | 3.038 | % | | | 12/25/35 | | | | 201,545 | | | | 145,601 | (b) |
Citigroup Mortgage Loan Trust Inc., 2005-HE2 A | | | 0.593 | % | | | 5/25/35 | | | | 1,532,194 | | | | 1,508,468 | (a)(b) |
Citigroup Mortgage Loan Trust Inc., 2006-AR9 1A3 | | | 0.433 | % | | | 11/25/36 | | | | 37,346,000 | | | | 29,649,251 | (b) |
Citigroup Mortgage Loan Trust Inc., 2006-AR9 1A4 | | | 0.433 | % | | | 11/25/36 | | | | 10,073,079 | | | | 7,426,801 | (b) |
COBALT CMBS Commercial Mortgage Trust, 2007-C2 AMFX | | | 5.526 | % | | | 4/15/47 | | | | 5,445,000 | | | | 5,984,235 | (b) |
Commercial Mortgage Pass-Through Certificates, 2012-CR3 A3 | | | 2.822 | % | | | 11/15/45 | | | | 960,000 | | | | 891,488 | |
Commercial Mortgage Pass-Through Certificates, 2013-WWP A2 | | | 3.424 | % | | | 3/10/31 | | | | 4,770,000 | | | | 4,578,709 | (a) |
Countrywide Alternative Loan Trust, 2003-20CB 1A1 | | | 5.500 | % | | | 10/25/33 | | | | 10,765,496 | | | | 11,364,639 | |
Countrywide Alternative Loan Trust, 2004-33 2A1 | | | 3.043 | % | | | 12/25/34 | | | | 28,259 | | | | 27,701 | (b) |
Countrywide Alternative Loan Trust, 2005-44 1A1 | | | 0.523 | % | | | 10/25/35 | | | | 14,407,289 | | | | 10,951,124 | (b) |
Countrywide Alternative Loan Trust, 2006-0A01 2A1 | | | 0.402 | % | | | 3/20/46 | | | | 191,204 | | | | 135,187 | (b) |
Countrywide Alternative Loan Trust, 2006-0A02 A5 | | | 0.422 | % | | | 5/20/46 | | | | 4,678,678 | | | | 2,625,557 | (b) |
Countrywide Alternative Loan Trust, 2006-0A09 2A1B | | | 0.392 | % | | | 7/20/46 | | | | 432,786 | | | | 235,056 | (b) |
Countrywide Alternative Loan Trust, 2006-0A10 4A1 | | | 0.383 | % | | | 8/25/46 | | | | 457,290 | | | | 297,822 | (b) |
Countrywide Alternative Loan Trust, 2006-0A17 1A1A | | | 0.387 | % | | | 12/20/46 | | | | 648,848 | | | | 430,357 | (b) |
See Notes to Financial Statements.
| | |
| 26 | | Western Asset Core Plus Bond Fund 2013 Semi-Annual Report |
Western Asset Core Plus Bond Fund
| | | | | | | | | | | | | | | | |
| Security | | Rate | | | Maturity
Date | | | Face Amount† | | | Value | |
| Collateralized Mortgage Obligations — continued | | | | | | | | | | | | | | | | |
Countrywide Alternative Loan Trust, 2006-0A18 A2 | | | 0.433 | % | | | 12/25/46 | | | | 180,387 | | | $ | 48,588 | (b) |
Countrywide Home Loan Mortgage Pass Through Trust, 2006-HYB1 2A1 | | | 2.622 | % | | | 3/20/36 | | | | 115,867 | | | | 99,599 | (b) |
Countrywide Home Loans, 2005-R3 AF | | | 0.593 | % | | | 9/25/35 | | | | 4,576,729 | | | | 3,981,535 | (a)(b) |
Countrywide Home Loans, 2006-0A5 1A1 | | | 0.393 | % | | | 4/25/46 | | | | 3,180,764 | | | | 2,371,699 | (b) |
Countrywide Home Loans, 2006-R1 AF2 | | | 0.563 | % | | | 1/25/36 | | | | 7,308,694 | | | | 6,314,931 | (a)(b) |
Countrywide Home Loans Mortgage Pass-Through Trust, 2005-R1 1AF1 | | | 0.553 | % | | | 3/25/35 | | | | 3,248,169 | | | | 2,827,830 | (a)(b) |
Countrywide Home Loans Pass-Through Certificates, 2006-HYB3 2A1A | | | 2.679 | % | | | 5/20/36 | | | | 570,451 | | | | 457,221 | (b) |
Credit Suisse Commercial Mortgage Trust, 2007-C2 AM | | | 5.615 | % | | | 1/15/49 | | | | 10,048,000 | | | | 10,673,990 | (b) |
Credit Suisse Mortgage Capital Certificates, 2006-C5 A3 | | | 5.311 | % | | | 12/15/39 | | | | 6,386,050 | | | | 7,012,739 | |
Credit Suisse Mortgage Capital Certificates, 2007-C1 A3 | | | 5.383 | % | | | 2/15/40 | | | | 140,000 | | | | 150,660 | |
DBUBS Mortgage Trust, 2011-LC3A XA, IO | | | 1.588 | % | | | 8/10/44 | | | | 777,781 | | | | 31,157 | (a)(b) |
Deutsche Mortgage Securities Inc., 2004-4 7AR2 | | | 0.643 | % | | | 6/25/34 | | | | 126,370 | | | | 112,481 | (b) |
Downey Savings & Loan Association Mortgage Loan Trust, 2004-AR1 A2A | | | 1.012 | % | | | 9/19/44 | | | | 203,515 | | | | 184,637 | (b) |
Extended Stay America Trust, 2013-ESH7 A27 | | | 2.958 | % | | | 12/5/31 | | | | 3,520,000 | | | | 3,416,375 | (a) |
Federal Home Loan Mortgage Corp. (FHLMC), -4097 SG Remics IO | | | 5.958 | % | | | 8/15/32 | | | | 2,290,616 | | | | 535,372 | (b) |
Federal Home Loan Mortgage Corp. (FHLMC), 2957 ZA, PAC | | | 5.000 | % | | | 3/15/35 | | | | 24,258,951 | | | | 26,166,020 | |
Federal Home Loan Mortgage Corp. (FHLMC), 3242 SC, IO | | | 6.098 | % | | | 11/15/36 | | | | 4,942,322 | | | | 743,185 | (b) |
Federal Home Loan Mortgage Corp. (FHLMC), 3349 AS, IO | | | 6.308 | % | | | 7/15/37 | | | | 2,298,513 | | | | 349,292 | (b) |
Federal Home Loan Mortgage Corp. (FHLMC), 3368 AI, IO | | | 5.838 | % | | | 9/15/37 | | | | 5,294,625 | | | | 703,620 | (b) |
Federal Home Loan Mortgage Corp. (FHLMC), 3621 SB, IO | | | 6.038 | % | | | 1/15/40 | | | | 11,316,381 | | | | 1,493,031 | (b) |
Federal Home Loan Mortgage Corp. (FHLMC), 3639 EY | | | 5.000 | % | | | 2/15/30 | | | | 11,624,946 | | | | 12,759,552 | |
Federal Home Loan Mortgage Corp. (FHLMC), 3641 Z | | | 5.500 | % | | | 2/15/36 | | | | 38,247,474 | | | | 42,811,736 | |
Federal Home Loan Mortgage Corp. (FHLMC), 3768 MB PAC | | | 4.000 | % | | | 12/15/39 | | | | 27,950,934 | | | | 29,637,046 | |
Federal Home Loan Mortgage Corp. (FHLMC), 3788 IC, IO, PAC | | | 6.000 | % | | | 1/15/41 | | | | 2,866,649 | | | | 427,002 | |
Federal Home Loan Mortgage Corp. (FHLMC), 3806 CZ | | | 5.500 | % | | | 7/15/34 | | | | 29,169,933 | | | | 32,548,307 | |
Federal Home Loan Mortgage Corp. (FHLMC), 3947 SG, IO | | | 5.758 | % | | | 10/15/41 | | | | 27,265,659 | | | | 6,814,558 | (b) |
Federal Home Loan Mortgage Corp. (FHLMC), 3997 SK, IO, PAC-1 | | | 6.408 | % | | | 11/15/41 | | | | 14,898,452 | | | | 3,312,511 | (b) |
Federal Home Loan Mortgage Corp. (FHLMC), 4054 SA, IO | | | 5.858 | % | | | 8/15/39 | | | | 12,180,844 | | | | 1,749,548 | (b) |
Federal Home Loan Mortgage Corp. (FHLMC), 4057 BS, IO | | | 5.858 | % | | | 9/15/39 | | | | 10,774,848 | | | | 2,277,469 | (b) |
Federal Home Loan Mortgage Corp. (FHLMC), 4057 SA, IO | | | 5.858 | % | | | 4/15/39 | | | | 21,692,038 | | | | 4,434,356 | (b) |
Federal Home Loan Mortgage Corp. (FHLMC), 4063 S, IO | | | 5.758 | % | | | 6/15/42 | | | | 3,857,361 | | | | 972,694 | (b) |
Federal Home Loan Mortgage Corp. (FHLMC), 4068 DS, IO | | | 5.808 | % | | | 6/15/42 | | | | 21,581,257 | | | | 4,882,194 | (b) |
Federal Home Loan Mortgage Corp. (FHLMC), 4068 TS, IO | | | 5.808 | % | | | 6/15/42 | | | | 11,381,198 | | | | 2,698,446 | (b) |
See Notes to Financial Statements.
| | |
| Western Asset Core Plus Bond Fund 2013 Semi-Annual Report | | 27 |
Schedule of investments (unaudited) (cont’d)
June 30, 2013
Western Asset Core Plus Bond Fund
| | | | | | | | | | | | | | | | |
| Security | | Rate | | | Maturity
Date | | | Face Amount† | | | Value | |
| Collateralized Mortgage Obligations — continued | | | | | | | | | | | | | | | | |
Federal Home Loan Mortgage Corp. (FHLMC), 4073 SB, IO | | | 5.808 | % | | | 7/15/42 | | | | 16,569,978 | | | $ | 3,924,652 | (b) |
Federal Home Loan Mortgage Corp. (FHLMC), 4076 SW, IO | | | 5.858 | % | | | 7/15/42 | | | | 2,592,780 | | | | 638,844 | (b) |
Federal Home Loan Mortgage Corp. (FHLMC), 4092 AI, IO | | | 3.000 | % | | | 9/15/31 | | | | 11,264,122 | | | | 1,427,584 | |
Federal Home Loan Mortgage Corp. (FHLMC), 4097 ES, IO | | | 5.908 | % | | | 8/15/42 | | | | 14,236,000 | | | | 3,308,474 | (b) |
Federal Home Loan Mortgage Corp. (FHLMC), 4097 ST, IO | | | 5.858 | % | | | 8/15/42 | | | | 3,816,408 | | | | 875,365 | (b) |
Federal Home Loan Mortgage Corp. (FHLMC), 4102 MS, IO | | | 6.408 | % | | | 9/15/42 | | | | 15,141,789 | | | | 3,808,996 | (b) |
Federal Home Loan Mortgage Corp. (FHLMC), 4114 SC, IO | | | 5.908 | % | | | 10/15/42 | | | | 9,095,873 | | | | 2,516,592 | (b) |
Federal Home Loan Mortgage Corp. (FHLMC), 4116 AS, IO | | | 5.958 | % | | | 10/15/42 | | | | 13,901,604 | | | | 3,483,967 | (b) |
Federal Home Loan Mortgage Corp. (FHLMC), 4116 LS, IO | | | 6.008 | % | | | 10/15/42 | | | | 8,768,651 | | | | 1,908,116 | (b) |
Federal Home Loan Mortgage Corp. (FHLMC), 4119 IN, IO | | | 3.500 | % | | | 10/15/32 | | | | 10,653,255 | | | | 1,912,259 | |
Federal Home Loan Mortgage Corp. (FHLMC), 4120 SV, IO | | | 5.958 | % | | | 10/15/42 | | | | 8,049,628 | | | | 1,749,825 | (b) |
Federal Home Loan Mortgage Corp. (FHLMC), 4136 SE, IO | | | 5.958 | % | | | 11/15/42 | | | | 3,041,217 | | | | 739,733 | (b) |
Federal Home Loan Mortgage Corp. (FHLMC), 4136 SG, IO | | | 5.958 | % | | | 11/15/42 | | | | 11,377,638 | | | | 2,794,011 | (b) |
Federal Home Loan Mortgage Corp. (FHLMC), 4136 SJ, IO | | | 5.958 | % | | | 11/15/42 | | | | 2,894,901 | | | | 760,351 | (b) |
Federal Home Loan Mortgage Corp. (FHLMC), 4136 SQ, IO | | | 5.958 | % | | | 11/15/42 | | | | 4,789,884 | | | | 1,218,691 | (b) |
Federal Home Loan Mortgage Corp. (FHLMC), 4147 CS, IO | | | 5.908 | % | | | 12/15/42 | | | | 7,304,785 | | | | 1,933,925 | (b) |
Federal Home Loan Mortgage Corp. (FHLMC), 4150 SP, IO | | | 5.958 | % | | | 1/15/43 | | | | 12,985,690 | | | | 2,943,403 | (b) |
Federal Home Loan Mortgage Corp. (FHLMC), 4174 SA, IO | | | 6.008 | % | | | 5/15/39 | | | | 30,217,902 | | | | 6,585,750 | (b) |
Federal Home Loan Mortgage Corp. (FHLMC), 4199 CS, IO | | | 5.958 | % | | | 5/15/43 | | | | 15,479,034 | | | | 4,122,599 | (b) |
Federal Home Loan Mortgage Corp. (FHLMC), 4199 SB, IO | | | 6.008 | % | | | 5/15/40 | | | | 11,449,045 | | | | 2,758,915 | (b) |
Federal Home Loan Mortgage Corp. (FHLMC), 4203 PS, IO, PAC | | | 6.058 | % | | | 9/15/42 | | | | 7,092,742 | | | | 1,456,150 | (b) |
Federal Home Loan Mortgage Corp. (FHLMC) Reference REMIC, R007 ZA | | | 6.000 | % | | | 5/15/36 | | | | 38,199,287 | | | | 41,495,924 | |
Federal Home Loan Mortgage Corp. (FHLMC), Multi-Family Structured Pass-Through Certificates, IO | | | 1.838 | % | | | 7/25/21 | | | | 42,871,046 | | | | 4,495,415 | (b) |
Federal Home Loan Mortgage Corp. (FHLMC), Multi-Family Structured Pass-Through Certificates, K006 AX1, IO | | | 1.210 | % | | | 1/25/20 | | | | 33,006,838 | | | | 1,810,590 | (b) |
Federal Home Loan Mortgage Corp. (FHLMC), Multi-Family Structured Pass-Through Certificates, K007 X1, IO | | | 1.394 | % | | | 4/25/20 | | | | 112,031,576 | | | | 6,913,469 | (b) |
Federal Home Loan Mortgage Corp. (FHLMC), Multi-Family Structured Pass-Through Certificates, K008 X1, IO | | | 1.827 | % | | | 6/25/20 | | | | 112,355,285 | | | | 9,743,450 | (b) |
Federal Home Loan Mortgage Corp. (FHLMC), Multi-Family Structured Pass-Through Certificates, K009 X1, IO | | | 1.666 | % | | | 8/25/20 | | | | 34,943,806 | | | | 2,654,891 | (b) |
Federal Home Loan Mortgage Corp. (FHLMC), Multi-Family Structured Pass-Through Certificates, K016 X1, IO | | | 1.736 | % | | | 10/25/21 | | | | 27,816,996 | | | | 2,827,876 | (b) |
Federal Home Loan Mortgage Corp. (FHLMC), Multi-Family Structured Pass-Through Certificates, K017 X1, IO | | | 1.600 | % | | | 12/25/21 | | | | 22,358,041 | | | | 2,075,229 | (b) |
Federal Home Loan Mortgage Corp. (FHLMC), Multi-Family Structured Pass-Through Certificates, K024 X1, IO | | | 1.026 | % | | | 9/25/22 | | | | 19,146,647 | | | | 1,215,965 | (b) |
See Notes to Financial Statements.
| | |
| 28 | | Western Asset Core Plus Bond Fund 2013 Semi-Annual Report |
Western Asset Core Plus Bond Fund
| | | | | | | | | | | | | | | | |
| Security | | Rate | | | Maturity
Date | | | Face Amount† | | | Value | |
| Collateralized Mortgage Obligations — continued | | | | | | | | | | | | | | | | |
Federal Home Loan Mortgage Corp. (FHLMC), Multi-Family Structured Pass-Through Certificates, K702 X1, IO | | | 1.716 | % | | | 2/25/18 | | | | 2,733,420 | | | $ | 166,495 | (b) |
Federal Home Loan Mortgage Corp. (FHLMC), Multi-Family Structured Pass-Through Certificates, K703 X1, IO | | | 2.252 | % | | | 5/25/18 | | | | 59,821,816 | | | | 5,203,660 | (b) |
Federal Home Loan Mortgage Corp. (FHLMC), Multi-Family Structured Pass-Through Certificates, KAIV X1, IO | | | 1.388 | % | | | 6/25/21 | | | | 40,768,278 | | | | 3,225,382 | (b) |
Federal National Mortgage Association (FNMA), 2006-104 IC, IO | | | 6.407 | % | | | 11/25/36 | | | | 11,893,442 | | | | 2,597,471 | (b) |
Federal National Mortgage Association (FNMA),
2008-012 KS, IO | | | 6.807 | % | | | 3/25/38 | | | | 4,735,938 | | | | 765,038 | (b) |
Federal National Mortgage Association (FNMA),
2009-101 NS, IO | | | 5.967 | % | | | 12/25/39 | | | | 5,448,107 | | | | 790,525 | (b) |
Federal National Mortgage Association (FNMA),
2010-027 AS, IO | | | 6.287 | % | | | 4/25/40 | | | | 9,610,069 | | | | 1,578,663 | (b) |
Federal National Mortgage Association (FNMA),
2010-027 SG, IO | | | 4.807 | % | | | 4/25/40 | | | | 4,680,168 | | | | 383,595 | (b) |
Federal National Mortgage Association (FNMA),
2010-075 PU PAC | | | 4.500 | % | | | 4/25/39 | | | | 25,865,000 | | | | 26,658,150 | |
Federal National Mortgage Association (FNMA),
2010-100 CS, IO | | | 6.457 | % | | | 9/25/40 | | | | 8,853,548 | | | | 1,423,839 | (b) |
Federal National Mortgage Association (FNMA),
2010-118 YB, IO | | | 6.307 | % | | | 10/25/40 | | | | 10,691,719 | | | | 1,218,146 | (b) |
Federal National Mortgage Association (FNMA),
2010-123 PM, PAC | | | 4.000 | % | | | 7/25/40 | | | | 19,331,985 | | | | 20,506,055 | |
Federal National Mortgage Association (FNMA),
2010-142 SM, IO | | | 6.337 | % | | | 12/25/40 | | | | 1,479,356 | | | | 147,672 | (b) |
Federal National Mortgage Association (FNMA),
2010-150 SN, IO | | | 6.337 | % | | | 1/25/41 | | | | 12,146,240 | | | | 2,002,360 | (b) |
Federal National Mortgage Association (FNMA), 2011-059 NZ | | | 5.500 | % | | | 7/25/41 | | | | 892,798 | | | | 1,020,487 | |
Federal National Mortgage Association (FNMA),
2011-059 SW, IO | | | 6.447 | % | | | 7/25/41 | | | | 7,101,205 | | | | 951,094 | (b) |
Federal National Mortgage Association (FNMA),
2011-063 SW, IO | | | 6.487 | % | | | 7/25/41 | | | | 11,612,661 | | | | 1,385,647 | (b) |
Federal National Mortgage Association (FNMA),
2011-087 SJ, IO | | | 5.757 | % | | | 9/25/41 | | | | 34,067,324 | | | | 5,567,950 | (b) |
Federal National Mortgage Association (FNMA),
2011-096 BS, IO | | | 6.237 | % | | | 5/25/41 | | | | 4,258,225 | | | | 633,873 | (b) |
Federal National Mortgage Association (FNMA),
2011-099 KS, IO | | | 6.507 | % | | | 10/25/26 | | | | 4,885,848 | | | | 859,835 | (b) |
Federal National Mortgage Association (FNMA),
2011-117 LS, IO | | | 6.407 | % | | | 10/25/40 | | | | 5,163,637 | | | | 1,205,815 | (b) |
Federal National Mortgage Association (FNMA),
2012-016 ST, IO | | | 6.257 | % | | | 3/25/42 | | | | 3,722,960 | | | | 656,280 | (b) |
Federal National Mortgage Association (FNMA),
2012-017 WS, IO | | | 6.357 | % | | | 7/25/39 | | | | 7,064,967 | | | | 1,513,543 | (b) |
See Notes to Financial Statements.
| | |
| Western Asset Core Plus Bond Fund 2013 Semi-Annual Report | | 29 |
Schedule of investments (unaudited) (cont’d)
June 30, 2013
Western Asset Core Plus Bond Fund
| | | | | | | | | | | | | | | | |
| Security | | Rate | | | Maturity
Date | | | Face Amount† | | | Value | |
| Collateralized Mortgage Obligations — continued | | | | | | | | | | | | | | | | |
Federal National Mortgage Association (FNMA), 2012-028 B | | | 6.500 | % | | | 6/25/39 | | | | 13,281,520 | | | $ | 14,809,984 | |
Federal National Mortgage Association (FNMA), 2012-046 BA | | | 6.000 | % | | | 5/25/42 | | | | 20,188,162 | | | | 22,324,029 | |
Federal National Mortgage Association (FNMA), 2012-051 B | | | 7.000 | % | | | 5/25/42 | | | | 41,007,038 | | | | 45,998,619 | |
Federal National Mortgage Association (FNMA),
2012-063 AS, IO | | | 6.307 | % | | | 6/25/42 | | | | 11,967,372 | | | | 2,251,119 | (b) |
Federal National Mortgage Association (FNMA),
2012-063 DS, IO | | | 6.357 | % | | | 3/25/39 | | | | 6,307,176 | | | | 1,361,593 | (b) |
Federal National Mortgage Association (FNMA),
2012-066 SA, IO | | | 5.807 | % | | | 6/25/42 | | | | 22,750,776 | | | | 4,091,859 | (b) |
Federal National Mortgage Association (FNMA),
2012-070 IW, IO | | | 3.000 | % | | | 2/25/27 | | | | 3,667,767 | | | | 465,405 | |
Federal National Mortgage Association (FNMA),
2012-070 YS, IO | | | 6.457 | % | | | 2/25/41 | | | | 4,959,338 | | | | 1,086,409 | (b) |
Federal National Mortgage Association (FNMA),
2012-074 AI, IO | | | 3.000 | % | | | 7/25/27 | | | | 13,637,674 | | | | 1,743,727 | |
Federal National Mortgage Association (FNMA),
2012-074 OA, PO | | | 0.000 | % | | | 3/25/42 | | | | 1,571,314 | | | | 1,456,181 | |
Federal National Mortgage Association (FNMA),
2012-074 SA, IO | | | 6.457 | % | | | 3/25/42 | | | | 16,792,550 | | | | 2,935,202 | (b) |
Federal National Mortgage Association (FNMA),
2012-075 AO, PO | | | 0.000 | % | | | 3/25/42 | | | | 997,443 | | | | 924,615 | |
Federal National Mortgage Association (FNMA),
2012-075 DS, IO | | | 5.757 | % | | | 7/25/42 | | | | 27,684,703 | | | | 6,904,416 | (b) |
Federal National Mortgage Association (FNMA),
2012-075 NS, IO | | | 6.407 | % | | | 7/25/42 | | | | 85,826 | | | | 20,112 | (b) |
Federal National Mortgage Association (FNMA),
2012-083 YS, IO | | | 5.207 | % | | | 8/25/42 | | | | 3,712,122 | | | | 555,911 | (b) |
Federal National Mortgage Association (FNMA),
2012-089 AS, IO | | | 5.857 | % | | | 5/25/39 | | | | 475,937 | | | | 89,958 | (b) |
Federal National Mortgage Association (FNMA), 2012-093 IB, IO | | | 3.000 | % | | | 9/25/27 | | | | 10,819,757 | | | | 1,403,699 | |
Federal National Mortgage Association (FNMA),
2012-093 SG, IO | | | 5.907 | % | | | 9/25/42 | | | | 6,261,731 | | | | 1,309,485 | (b) |
Federal National Mortgage Association (FNMA),
2012-093 SM, IO | | | 5.907 | % | | | 9/25/42 | | | | 5,255,857 | | | | 1,187,557 | (b) |
Federal National Mortgage Association (FNMA),
2012-093 UI, IO | | | 3.000 | % | | | 9/25/27 | | | | 1,916,991 | | | | 246,052 | |
Federal National Mortgage Association (FNMA),
2012-098 SA, IO | | | 5.857 | % | | | 5/25/39 | | | | 8,183,225 | | | | 1,698,944 | (b) |
Federal National Mortgage Association (FNMA),
2012-111 JS, IO | | | 5.907 | % | | | 7/25/40 | | | | 12,362,976 | | | | 2,802,944 | (b) |
Federal National Mortgage Association (FNMA),
2012-111 SB, IO | | | 6.407 | % | | | 10/25/42 | | | | 11,464,938 | | | | 2,920,381 | (b) |
Federal National Mortgage Association (FNMA),
2012-120 ES, IO | | | 6.007 | % | | | 11/25/39 | | | | 25,362,878 | | | | 5,896,496 | (b) |
See Notes to Financial Statements.
| | |
| 30 | | Western Asset Core Plus Bond Fund 2013 Semi-Annual Report |
Western Asset Core Plus Bond Fund
| | | | | | | | | | | | | | | | |
| Security | | Rate | | | Maturity
Date | | | Face Amount† | | | Value | |
| Collateralized Mortgage Obligations — continued | | | | | | | | | | | | | | | | |
Federal National Mortgage Association (FNMA),
2012-124 SE, IO | | | 5.957 | % | | | 11/25/42 | | | | 7,153,053 | | | $ | 1,554,245 | (b) |
Federal National Mortgage Association (FNMA),
2012-128 SL, IO | | | 5.957 | % | | | 11/25/42 | | | | 5,514,011 | | | | 1,429,491 | (b) |
Federal National Mortgage Association (FNMA),
2012-128 SQ, IO | | | 5.957 | % | | | 11/25/42 | | | | 8,357,282 | | | | 2,110,908 | (b) |
Federal National Mortgage Association (FNMA),
2012-133 CS, IO | | | 5.957 | % | | | 12/25/42 | | | | 9,484,801 | | | | 2,531,358 | (b) |
Federal National Mortgage Association (FNMA),
2012-133 GS, IO | | | 5.957 | % | | | 12/25/42 | | | | 13,592,354 | | | | 3,441,429 | (b) |
Federal National Mortgage Association (FNMA),
2012-133 SA, IO | | | 5.957 | % | | | 12/25/42 | | | | 2,955,898 | | | | 752,625 | (b) |
Federal National Mortgage Association (FNMA),
2012-134 MS, IO | | | 5.957 | % | | | 12/25/42 | | | | 8,041,066 | | | | 1,972,398 | (b) |
Federal National Mortgage Association (FNMA),
2012-134 SC, IO | | | 5.957 | % | | | 12/25/42 | | | | 11,389,233 | | | | 2,678,528 | (b) |
Federal National Mortgage Association (FNMA),
2012-134 SK, IO | | | 5.957 | % | | | 12/25/42 | | | | 6,814,722 | | | | 1,589,731 | (b) |
Federal National Mortgage Association (FNMA),
2012-139 DI, IO | | | 3.000 | % | | | 12/25/27 | | | | 15,155,109 | | | | 1,887,958 | |
Federal National Mortgage Association (FNMA),
2012-139 NS, IO | | | 6.507 | % | | | 12/25/42 | | | | 18,271,886 | | | | 4,431,444 | (b) |
Federal National Mortgage Association (FNMA),
2012-148 LS, IO | | | 6.007 | % | | | 1/25/43 | | | | 19,013,160 | | | | 3,204,155 | (b) |
Federal National Mortgage Association (FNMA), 2013-009 BC | | | 6.500 | % | | | 7/25/42 | | | | 30,588,657 | | | | 34,661,598 | |
Federal National Mortgage Association (FNMA), 2013-009 CB | | | 5.500 | % | | | 4/25/42 | | | | 59,764,892 | | | | 65,514,275 | |
Federal National Mortgage Association (FNMA),
2013-009 SA, IO | | | 5.957 | % | | | 3/25/42 | | | | 20,556,653 | | | | 2,865,910 | (b) |
Federal National Mortgage Association (FNMA),
2013-009 SG, IO | | | 6.007 | % | | | 3/25/39 | | | | 5,523,746 | | | | 1,309,542 | (b) |
Federal National Mortgage Association (FNMA),
2013-019 SK, IO | | | 5.957 | % | | | 3/25/43 | | | | 6,205,476 | | | | 1,564,577 | (b) |
Federal National Mortgage Association (FNMA),
2013-026 HI, IO | | | 3.000 | % | | | 4/25/32 | | | | 13,115,708 | | | | 1,581,051 | |
Federal National Mortgage Association (FNMA), 384 14, IO | | | 5.500 | % | | | 1/25/40 | | | | 4,240,208 | | | | 615,859 | |
Federal National Mortgage Association (FNMA), 390 C3, IO | | | 6.000 | % | | | 7/25/38 | | | | 7,093,910 | | | | 1,048,590 | |
Federal National Mortgage Association (FNMA), 407 22, IO | | | 5.000 | % | | | 1/25/39 | | | | 2,741,522 | | | | 397,248 | |
Federal National Mortgage Association (FNMA), 407 23, IO | | | 5.000 | % | | | 1/25/39 | | | | 1,423,085 | | | | 214,040 | (b) |
Federal National Mortgage Association (FNMA), 407 27, IO | | | 5.500 | % | | | 1/25/39 | | | | 1,327,087 | | | | 202,587 | (b) |
Federal National Mortgage Association (FNMA), 407 34, IO | | | 5.000 | % | | | 1/25/38 | | | | 1,480,718 | | | | 211,634 | |
Federal National Mortgage Association (FNMA), 407 41, IO | | | 6.000 | % | | | 1/25/38 | | | | 8,251,679 | | | | 1,179,006 | |
Federal National Mortgage Association (FNMA), 409 C01, IO | | | 3.000 | % | | | 11/25/26 | | | | 17,761,614 | | | | 1,887,307 | |
See Notes to Financial Statements.
| | |
| Western Asset Core Plus Bond Fund 2013 Semi-Annual Report | | 31 |
Schedule of investments (unaudited) (cont’d)
June 30, 2013
Western Asset Core Plus Bond Fund
| | | | | | | | | | | | | | | | |
| Security | | Rate | | | Maturity
Date | | | Face Amount† | | | Value | |
| Collateralized Mortgage Obligations — continued | | | | | | | | | | | | | | | | |
Federal National Mortgage Association (FNMA), 409 C02, IO | | | 3.000 | % | | | 4/25/27 | | | | 470,646 | | | $ | 55,852 | |
Federal National Mortgage Association (FNMA), 409 C15, IO | | | 4.000 | % | | | 11/25/39 | | | | 2,033,838 | | | | 197,800 | |
Federal National Mortgage Association (FNMA), 409 C18, IO | | | 4.000 | % | | | 4/25/42 | | | | 8,573,868 | | | | 1,021,248 | |
Federal National Mortgage Association (FNMA) STRIPS,
409 C13, IO | | | 3.500 | % | | | 11/25/41 | | | | 14,239,690 | | | | 1,782,059 | |
Federal National Mortgage Association (FNMA) STRIPS,
409 C22, IO | | | 4.500 | % | | | 11/25/39 | | | | 7,188,102 | | | | 823,553 | |
First Horizon Alternative Mortgage Securities, 2006-FA8 1A8 | | | 0.563 | % | | | 2/25/37 | | | | 192,776 | | | | 118,597 | (b) |
Government National Mortgage Association (GNMA),
2006-016 GS, IO | | | 6.798 | % | | | 4/20/36 | | | | 2,360,881 | | | | 413,347 | (b) |
Government National Mortgage Association (GNMA),
2009-106 SC, IO, PAC | | | 6.158 | % | | | 11/20/39 | | | | 6,599,727 | | | | 1,018,138 | (b) |
Government National Mortgage Association (GNMA),
2009-106 SU, IO | | | 6.008 | % | | | 5/20/37 | | | | 13,903,834 | | | | 1,950,501 | (b) |
Government National Mortgage Association (GNMA),
2010-003 MS, IO, PAC | | | 6.358 | % | | | 11/20/38 | | | | 1,613,922 | | | | 221,631 | (b) |
Government National Mortgage Association (GNMA),
2010-014 SH, IO | | | 5.808 | % | | | 2/16/40 | | | | 5,712,191 | | | | 1,151,066 | (b) |
Government National Mortgage Association (GNMA),
2010-014 SX, IO | | | 6.258 | % | | | 2/16/40 | | | | 9,231,961 | | | | 1,489,164 | (b) |
Government National Mortgage Association (GNMA),
2010-020 SC, IO | | | 5.958 | % | | | 2/20/40 | | | | 20,173,126 | | | | 3,420,404 | (b) |
Government National Mortgage Association (GNMA),
2010-031 GS, IO, PAC | | | 6.308 | % | | | 3/20/39 | | | | 4,638,741 | | | | 777,765 | (b) |
Government National Mortgage Association (GNMA),
2010-042 BS, IO | | | 6.288 | % | | | 4/20/40 | | | | 2,219,796 | | | | 445,862 | (b) |
Government National Mortgage Association (GNMA),
2010-042 PC, PAC | | | 5.000 | % | | | 7/20/39 | | | | 7,100,000 | | | | 8,035,333 | |
Government National Mortgage Association (GNMA),
2010-047 XN, IO | | | 6.358 | % | | | 4/16/34 | | | | 3,257,177 | | | | 173,343 | (b) |
Government National Mortgage Association (GNMA),
2010-050 QS, IO | | | 6.358 | % | | | 12/20/38 | | | | 475,102 | | | | 80,139 | (b) |
Government National Mortgage Association (GNMA),
2010-057 QS, IO | | | 6.308 | % | | | 5/20/40 | | | | 8,840,851 | | | | 1,634,649 | (b) |
Government National Mortgage Association (GNMA),
2010-059 PB, PAC | | | 4.500 | % | | | 7/20/39 | | | | 14,600,000 | | | | 15,995,979 | |
Government National Mortgage Association (GNMA),
2010-060 S, IO | | | 6.308 | % | | | 5/20/40 | | | | 11,872,924 | | | | 1,862,677 | (b) |
Government National Mortgage Association (GNMA),
2010-076 SH, IO | | | 6.308 | % | | | 5/20/40 | | | | 2,888,036 | | | | 604,082 | (b) |
Government National Mortgage Association (GNMA),
2010-085 HS, IO, PAC | | | 6.458 | % | | | 1/20/40 | | | | 1,454,785 | | | | 308,136 | (b) |
See Notes to Financial Statements.
| | |
| 32 | | Western Asset Core Plus Bond Fund 2013 Semi-Annual Report |
Western Asset Core Plus Bond Fund
| | | | | | | | | | | | | | | | |
| Security | | Rate | | | Maturity
Date | | | Face Amount† | | | Value | |
| Collateralized Mortgage Obligations — continued | | | | | | | | | | | | | | | | |
Government National Mortgage Association (GNMA),
2010-086 PB, PAC | | | 4.500 | % | | | 10/20/39 | | | | 40,000,000 | | | $ | 43,739,800 | |
Government National Mortgage Association (GNMA),
2010-093 PS, IO, PAC | | | 6.508 | % | | | 6/20/35 | | | | 6,427,164 | | | | 551,944 | (b) |
Government National Mortgage Association (GNMA),
2010-101 NI, IO, PAC | | | 5.000 | % | | | 11/20/36 | | | | 11,324,575 | | | | 899,799 | |
Government National Mortgage Association (GNMA),
2010-113 BS, IO | | | 5.808 | % | | | 9/20/40 | | | | 12,276,310 | | | | 1,965,409 | (b) |
Government National Mortgage Association (GNMA),
2010-116 MH | | | 5.000 | % | | | 7/20/40 | | | | 30,000,000 | | | | 33,481,380 | |
Government National Mortgage Association (GNMA),
2010-118, IO | | | 1.542 | % | | | 4/16/53 | | | | 19,329,436 | | | | 1,268,050 | (b) |
Government National Mortgage Association (GNMA),
2010-121 SE, IO | | | 5.808 | % | | | 9/20/40 | | | | 10,574,851 | | | | 1,748,481 | (b) |
Government National Mortgage Association (GNMA),
2010-157 SP, IO, PAC | | | 4.058 | % | | | 12/20/40 | | | | 24,298,603 | | | | 2,742,005 | (b) |
Government National Mortgage Association (GNMA),
2010-167 US, IO | | | 6.438 | % | | | 11/20/38 | | | | 3,714,336 | | | | 453,003 | (b) |
Government National Mortgage Association (GNMA),
2010-H10 FC | | | 1.193 | % | | | 5/20/60 | | | | 1,200,641 | | | | 1,221,872 | (b) |
Government National Mortgage Association (GNMA),
2010-H26 LF | | | 0.548 | % | | | 8/20/58 | | | | 1,356,591 | | | | 1,347,236 | (b) |
Government National Mortgage Association (GNMA),
2010-H27 FA | | | 0.578 | % | | | 12/20/60 | | | | 539,482 | | | | 535,289 | (b) |
Government National Mortgage Association (GNMA),
2010-H28 FE | | | 0.598 | % | | | 12/20/60 | | | | 14,125,600 | | | | 14,016,169 | (b) |
Government National Mortgage Association (GNMA),
2011-004 PS, IO, PAC | | | 5.988 | % | | | 9/20/40 | | | | 6,538,097 | | | | 1,091,565 | (b) |
Government National Mortgage Association (GNMA),
2011-032 S, IO | | | 5.808 | % | | | 3/16/41 | | | | 1,701,718 | | | | 179,575 | (b) |
Government National Mortgage Association (GNMA),
2011-040 SA, IO | | | 5.938 | % | | | 2/16/36 | | | | 12,925,158 | | | | 1,847,878 | (b) |
Government National Mortgage Association (GNMA),
2011-070 BS, IO | | | 6.508 | % | | | 12/16/36 | | | | 8,701,174 | | | | 1,202,599 | (b) |
Government National Mortgage Association (GNMA),
2011-135 D | | | 5.000 | % | | | 4/16/40 | | | | 21,900,000 | | | | 24,191,200 | |
Government National Mortgage Association (GNMA),
2011-140 AI, IO | | | 4.000 | % | | | 10/16/26 | | | | 310,335 | | | | 32,516 | |
Government National Mortgage Association (GNMA),
2011-146 YS, IO | | | 6.458 | % | | | 11/16/41 | | | | 5,840,491 | | | | 1,178,720 | (b) |
Government National Mortgage Association (GNMA),
2011-H06 FA | | | 0.648 | % | | | 2/20/61 | | | | 2,000,507 | | | | 1,991,977 | (b) |
Government National Mortgage Association (GNMA),
2011-H08 FG | | | 0.678 | % | | | 3/20/61 | | | | 12,786,640 | | | | 12,750,863 | (b) |
See Notes to Financial Statements.
| | |
| Western Asset Core Plus Bond Fund 2013 Semi-Annual Report | | 33 |
Schedule of investments (unaudited) (cont’d)
June 30, 2013
Western Asset Core Plus Bond Fund
| | | | | | | | | | | | | | | | |
| Security | | Rate | | | Maturity
Date | | | Face Amount† | | | Value | |
| Collateralized Mortgage Obligations — continued | | | | | | | | | | | | | | | | |
Government National Mortgage Association (GNMA),
2011-H09 AF | | | 0.698 | % | | | 3/20/61 | | | | 10,349,121 | | | $ | 10,329,582 | (b) |
Government National Mortgage Association (GNMA),
2012-066 CI, IO | | | 3.500 | % | | | 2/20/38 | | | | 14,743,867 | | | | 2,321,938 | |
Government National Mortgage Association (GNMA),
2012-081 AI, IO | | | 3.500 | % | | | 4/20/27 | | | | 11,356,520 | | | | 1,201,167 | |
Government National Mortgage Association (GNMA),
2012-098 SA, IO | | | 5.908 | % | | | 8/16/42 | | | | 11,952,829 | | | | 2,783,393 | (b) |
GreenPoint Mortgage Funding Trust, 2005-AR4 1A2A | | | 0.513 | % | | | 10/25/45 | | | | 4,619,121 | | | | 3,064,874 | (b) |
Greenpoint Mortgage Funding Trust, 2005-AR5 2A2 | | | 0.463 | % | | | 11/25/46 | | | | 55,610 | | | | 2,040,707 | (b) |
Greenpoint Mortgage Funding Trust, 2006-AR3 3A1 | | | 0.423 | % | | | 4/25/36 | | | | 2,514,646 | | | | 1,501,910 | (b) |
Greenwich Capital Commercial Funding Corp., 2006-GG7 AM | | | 6.056 | % | | | 7/10/38 | | | | 3,065,000 | | | | 3,348,975 | (b) |
GS Mortgage Securities Corp. II, 2011-GC5 X4, IO | | | 1.907 | % | | | 8/10/44 | | | | 303,054 | | | | 23,637 | (a)(b) |
GSMPS Mortgage Loan Trust, 2005-RP2 1AF | | | 0.543 | % | | | 3/25/35 | | | | 12,402,985 | | | | 10,542,004 | (a)(b) |
GSMPS Mortgage Loan Trust, 2005-RP3 1AF | | | 0.543 | % | | | 9/25/35 | | | | 27,306,265 | | | | 22,621,520 | (a)(b) |
GSR Mortgage Loan Trust, 2005-AR7 1A1 | | | 3.150 | % | | | 11/25/35 | | | | 1,774,142 | | | | 1,614,118 | (b) |
Harborview Mortgage Loan Trust, 2005-3 | | | 0.432 | % | | | 6/19/35 | | | | 10,296,078 | | | | 8,447,695 | (b) |
Harborview Mortgage Loan Trust, 2005-7 1A1 | | | 2.817 | % | | | 6/19/45 | | | | 4,090,702 | | | | 2,594,467 | (b) |
Harborview Mortgage Loan Trust, 2006-02 | | | 2.842 | % | | | 2/25/36 | | | | 2,585,020 | | | | 1,974,107 | (b) |
Harborview Mortgage Loan Trust, 2006-07 2A1A | | | 0.392 | % | | | 9/19/46 | | | | 2,768,752 | | | | 2,096,807 | (b) |
Harborview Mortgage Loan Trust, 2006-13 A | | | 0.372 | % | | | 11/19/46 | | | | 453,037 | | | | 299,406 | (b) |
Harborview Mortgage Loan Trust, 2007-4 2A1 | | | 0.412 | % | | | 7/19/47 | | | | 576,170 | | | | 470,808 | (b) |
IMPAC CMB Trust, 2003-4 1A1 | | | 0.833 | % | | | 10/25/33 | | | | 50,639 | | | | 48,781 | (b) |
IMPAC CMB Trust, 2007-A A | | | 0.443 | % | | | 5/25/37 | | | | 12,900,303 | | | | 12,574,558 | (b) |
IMPAC Secured Assets Corp., 2005-1 5A1 | | | 0.463 | % | | | 7/25/35 | | | | 41,066 | | | | 27,259 | (b) |
IMPAC Secured Assets Corp., 2006-2 2A1 | | | 0.543 | % | | | 8/25/36 | | | | 2,008,377 | | | | 1,890,347 | (b) |
Indymac Index Mortgage Loan Trust, 2004-AR2 2A1 | | | 0.813 | % | | | 6/25/34 | | | | 19,307 | | | | 17,777 | (b) |
Indymac Index Mortgage Loan Trust, 2005-AR1 1A1 | | | 2.564 | % | | | 3/25/35 | | | | 196,995 | | | | 187,649 | (b) |
Indymac Index Mortgage Loan Trust, 2006-AR06 2A1A | | | 0.393 | % | | | 6/25/47 | | | | 406,089 | | | | 303,779 | (b) |
Indymac Index Mortgage Loan Trust, 2006-AR15 A1 | | | 0.313 | % | | | 7/25/36 | | | | 145,732 | | | | 100,919 | (b) |
Indymac Index Mortgage Loan Trust, 2006-AR2 1A1B | | | 0.403 | % | | | 4/25/46 | | | | 10,353,324 | | | | 7,965,951 | (b) |
Indymac Index Mortgage Loan Trust, 2007-AR15 2A1 | | | 4.592 | % | | | 8/25/37 | | | | 486,484 | | | | 397,430 | (b) |
Indymac INDX Mortgage Loan Trust, 2005-AR09 1A1 | | | 2.489 | % | | | 7/25/35 | | | | 88,663 | | | | 64,573 | (b) |
Indymac INDX Mortgage Loan Trust, 2005-AR13 | | | 2.515 | % | | | 8/25/35 | | | | 398,885 | | | | 295,471 | (b) |
JPMorgan Chase Commercial Mortgage Securities Corp., 2006-LDP8 AM | | | 5.440 | % | | | 5/15/45 | | | | 4,464,000 | | | | 4,870,630 | |
JPMorgan Chase Commercial Mortgage Securities Corp., 2006-LDP9 A3 | | | 5.336 | % | | | 5/15/47 | | | | 27,869,000 | | | | 30,694,917 | |
JPMorgan Chase Commercial Mortgage Securities Corp.,
2007-CB20 AM | | | 6.078 | % | | | 2/12/51 | | | | 4,115,000 | | | | 4,619,923 | (b) |
See Notes to Financial Statements.
| | |
| 34 | | Western Asset Core Plus Bond Fund 2013 Semi-Annual Report |
Western Asset Core Plus Bond Fund
| | | | | | | | | | | | | | | | |
| Security | | Rate | | | Maturity
Date | | | Face Amount† | | | Value | |
| Collateralized Mortgage Obligations — continued | | | | | | | | | | | | | | | | |
JPMorgan Chase Commercial Mortgage Securities Corp.,
2007-CB20 AMFX | | | 5.930 | % | | | 2/12/51 | | | | 1,550,000 | | | $ | 1,720,219 | (b) |
JPMorgan Chase Commercial Mortgage Securities Corp.,
2011-C5 A3 | | | 4.171 | % | | | 8/15/46 | | | | 558,000 | | | | 582,377 | |
La Hipotecaria SA, 2007-1GA A | | | 5.273 | % | | | 12/23/36 | | | | 224,562 | | | | 222,878 | (a)(b)(d) |
LB-UBS Commercial Mortgage Trust, 2001-C3 X, IO, STRIPS | | | 0.844 | % | | | 6/15/36 | | | | 1,169,187 | | | | 1,131 | (a)(b)(e) |
LB-UBS Commercial Mortgage Trust, 2007-C2 A3 | | | 5.430 | % | | | 2/15/40 | | | | 2,000,000 | | | | 2,193,750 | |
LB-UBS Commercial Mortgage Trust, 2007-C7 AM | | | 6.425 | % | | | 9/15/45 | | | | 4,896,000 | | | | 5,496,240 | (b) |
Luminent Mortgage Trust, 2006-4 A1A | | | 0.383 | % | | | 5/25/46 | | | | 346,044 | | | | 237,183 | (b) |
Luminent Mortgage Trust, 2006-7 2A1 | | | 0.363 | % | | | 12/25/36 | | | | 3,182,784 | | | | 2,348,757 | (b) |
MASTR Adjustable Rate Mortgages Trust, 2004-15 1A1 | | | 3.373 | % | | | 12/25/34 | | | | 19,378 | | | | 18,708 | (b) |
MASTR Adjustable Rate Mortgages Trust, 2004-6 5A1 | | | 2.973 | % | | | 7/25/34 | | | | 621,902 | | | | 604,843 | (b) |
MASTR Adjustable Rate Mortgages Trust, 2005-1 7A1 | | | 2.699 | % | | | 2/25/35 | | | | 584,507 | | | | 554,561 | (b) |
MASTR Adjustable Rate Mortgages Trust, 2006-0A1 1A1 | | | 0.403 | % | | | 4/25/46 | | | | 345,437 | | | | 249,644 | (b) |
MASTR Adjustable Rate Mortgages Trust, 2006-2 3A1 | | | 2.977 | % | | | 1/25/36 | | | | 1,237,250 | | | | 1,166,979 | (b) |
MASTR ARM Trust, 2004-4 3A1 | | | 2.314 | % | | | 5/25/34 | | | | 1,016,678 | | | | 995,923 | (b) |
MASTR Reperforming Loan Trust, 2005-1 1A1 | | | 6.000 | % | | | 8/25/34 | | | | 2,906,303 | | | | 2,993,745 | (a) |
MASTR Reperforming Loan Trust, 2005-1 1A3 | | | 7.000 | % | | | 8/25/34 | | | | 4,447,101 | | | | 4,610,461 | (a) |
MASTR Reperforming Loan Trust, 2005-2 1A1F | | | 0.543 | % | | | 5/25/35 | | | | 4,652,349 | | | | 3,885,953 | (a)(b) |
MASTR Reperforming Loan Trust, 2006-1 1A1F | | | 0.553 | % | | | 7/25/35 | | | | 3,220,336 | | | | 2,731,724 | (a)(b) |
Merrill Lynch Mortgage Investors Inc., 2005-A2 A4 | | | 2.540 | % | | | 2/25/35 | | | | 20,853 | | | | 20,853 | (b) |
Merrill Lynch Mortgage Trust, 2007-C1 A4 | | | 6.038 | % | | | 6/12/50 | | | | 3,110,000 | | | | 3,491,594 | (b) |
Merrill Lynch/Countrywide Commercial Mortgage Trust,
2006-4 AM | | | 5.204 | % | | | 12/12/49 | | | | 2,166,000 | | | | 2,330,752 | (b) |
Merrill Lynch/Countrywide Commercial Mortgage Trust,
2007-8 A3 | | | 6.093 | % | | | 8/12/49 | | | | 920,000 | | | | 1,040,318 | (b) |
MLCC Mortgage Investors Inc., 2003-B A1 | | | 0.873 | % | | | 4/25/28 | | | | 1,435,885 | | | | 1,397,186 | (b) |
MLCC Mortgage Investors Inc., 2006-1 1A | | | 2.590 | % | | | 2/25/36 | | | | 386,917 | | | | 351,555 | (b) |
Morgan Stanley Bank of America Merrill Lynch Trust,
2012-C5 XA, IO | | | 2.081 | % | | | 8/15/45 | | | | 30,329,834 | | | | 3,119,332 | (a)(b) |
Morgan Stanley Bank of America Merrill Lynch Trust,
2012-C6 AS | | | 3.476 | % | | | 11/15/45 | | | | 2,740,000 | | | | 2,620,955 | |
Morgan Stanley Bank of America Merrill Lynch Trust,
2013-C7 A4 | | | 2.918 | % | | | 2/15/46 | | | | 4,080,000 | | | | 3,795,359 | |
Morgan Stanley Bank of America Merrill Lynch Trust,
2013-C7 AS | | | 3.214 | % | | | 2/15/46 | | | | 4,333,000 | | | | 4,032,940 | |
Morgan Stanley Bank of America Merrill Lynch Trust,
2013-C9 AS | | | 3.456 | % | | | 5/15/46 | | | | 4,940,000 | | | | 4,630,311 | |
Morgan Stanley Capital I, 2007-IQ14 A4 | | | 5.692 | % | | | 4/15/49 | | | | 11,080,000 | | | | 12,337,790 | (b) |
Morgan Stanley Capital I Inc., 2007-IQ15 A4 | | | 6.090 | % | | | 6/11/49 | | | | 160,000 | | | | 179,969 | (b) |
See Notes to Financial Statements.
| | |
| Western Asset Core Plus Bond Fund 2013 Semi-Annual Report | | 35 |
Schedule of investments (unaudited) (cont’d)
June 30, 2013
Western Asset Core Plus Bond Fund
| | | | | | | | | | | | | | | | |
| Security | | Rate | | | Maturity
Date | | | Face Amount† | | | Value | |
| Collateralized Mortgage Obligations — continued | | | | | | | | | | | | | | | | |
Morgan Stanley Mortgage Loan Trust, 2004-05AR 2A | | | 2.752 | % | | | 7/25/34 | | | | 90,442 | | | $ | 88,052 | (b) |
Morgan Stanley Mortgage Loan Trust, 2004-08AR 4A1 | | | 2.652 | % | | | 10/25/34 | | | | 6,613 | | | | 6,352 | (b) |
Morgan Stanley Mortgage Loan Trust, 2004-10AR 4A | | | 2.808 | % | | | 11/25/34 | | | | 2,875,239 | | | | 2,825,040 | (b) |
Morgan Stanley Mortgage Loan Trust, 2005-03AR 2A2 | | | 2.524 | % | | | 7/25/35 | | | | 4,797,017 | | | | 3,926,723 | (b) |
Morgan Stanley Mortgage Loan Trust, 2006-06AR 3A1 | | | 2.628 | % | | | 5/25/36 | | | | 6,358,834 | | | | 4,296,563 | (b) |
Mortgage IT Trust, 2005-2 1A1 | | | 0.453 | % | | | 5/25/35 | | | | 65,612 | | | | 62,384 | (b) |
Mortgage IT Trust, 2005-3 A1 | | | 0.493 | % | | | 8/25/35 | | | | 125,778 | | | | 114,651 | (b) |
Nomura Asset Acceptance Corp., 2005-AP2 A5 | | | 4.976 | % | | | 5/25/35 | | | | 336,306 | | | | 309,790 | |
Prime Mortgage Trust, 2005-2 2A1 | | | 7.057 | % | | | 10/25/32 | | | | 432,847 | | | | 465,287 | (b) |
Prime Mortgage Trust, 2006-DR1 2A2 | | | 6.000 | % | | | 5/25/35 | | | | 50,210,000 | | | | 51,477,150 | (a) |
RBSGC Mortgage Pass-Through Certificates, 2007-B 1A4 | | | 0.643 | % | | | 1/25/37 | | | | 22,582,728 | | | | 15,265,495 | (b) |
RBSSP Resecuritization Trust, 2010-3 4A1 | | | 3.371 | % | | | 12/26/35 | | | | 101,562 | | | | 102,880 | (a)(b) |
Residential Accredit Loans Inc., 2005-QO3 A1 | | | 0.593 | % | | | 10/25/45 | | | | 1,567,619 | | | | 1,134,501 | (b) |
Residential Accredit Loans Inc., 2006-QO1 3A1 | | | 0.463 | % | | | 2/25/46 | | | | 11,018,701 | | | | 6,995,663 | (b) |
Residential Accredit Loans Inc., 2006-QO3 A1 | | | 0.403 | % | | | 4/25/46 | | | | 19,385,832 | | | | 9,789,341 | (b) |
Residential Accredit Loans Inc., 2006-QO3 A2 | | | 0.453 | % | | | 4/25/46 | | | | 4,797,936 | | | | 2,449,207 | (b) |
Residential Accredit Loans Inc., 2006-QO3 A3 | | | 0.523 | % | | | 4/25/46 | | | | 6,717,712 | | | | 3,484,914 | (b) |
Residential Accredit Loans Inc., 2007-QS4 3A9 | | | 6.000 | % | | | 3/25/37 | | | | 6,248,806 | | | | 4,966,488 | |
Residential Asset Mortgage Products Inc., 2004-SL2 A4 | | | 8.500 | % | | | 10/25/31 | | | | 131,774 | | | | 143,108 | |
Residential Asset Mortgage Products Inc., 2004-SL4 A5 | | | 7.500 | % | | | 7/25/32 | | | | 1,108,403 | | | | 1,089,590 | |
Residential Asset Mortgage Products Inc., 2005-SL1 A7 | | | 8.000 | % | | | 5/25/32 | | | | 248,129 | | | | 244,403 | |
Residential Asset Securitization Trust, 2003-A14 A1 | | | 4.750 | % | | | 2/25/19 | | | | 379,878 | | | | 389,716 | |
Residential Asset Securitization Trust, PAC, 2004-A2 1A3 | | | 0.593 | % | | | 5/25/34 | | | | 44,564 | | | | 42,386 | (b) |
Sequoia Mortgage Trust, 2007-3 1A1 | | | 0.392 | % | | | 7/20/36 | | | | 407,279 | | | | 359,785 | (b) |
Structured ARM Loan Trust, 2004-08 1A1 | | | 2.632 | % | | | 7/25/34 | | | | 4,284 | | | | 4,164 | (b) |
Structured ARM Loan Trust, 2004-09XS A | | | 0.563 | % | | | 7/25/34 | | | | 108,281 | | | | 102,622 | (b) |
Structured ARM Loan Trust, 2004-16 5A2 | | | 5.070 | % | | | 11/25/34 | | | | 15,162,718 | | | | 14,940,705 | (b) |
Structured ARM Loan Trust, 2005-19XS 2A1 | | | 0.493 | % | | | 10/25/35 | | | | 1,066,482 | | | | 962,457 | (b) |
Structured Asset Mortgage Investments Inc., 2003-AR1 A1 | | | 0.932 | % | | | 10/19/33 | | | | 434,434 | | | | 406,423 | (b) |
Structured Asset Mortgage Investments Inc., 2006-AR3 11A1 | | | 0.403 | % | | | 4/25/36 | | | | 3,153,829 | | | | 2,257,022 | (b) |
Structured Asset Mortgage Investments Inc., 2006-AR6 1A1 | | | 0.373 | % | | | 7/25/46 | | | | 297,244 | | | | 223,068 | (b) |
Structured Asset Securities Corp., 2002-9 A2 | | | 0.493 | % | | | 10/25/27 | | | | 71,097 | | | | 69,687 | (b) |
Structured Asset Securities Corp., 2005-RF1 A | | | 0.543 | % | | | 3/25/35 | | | | 84,457 | | | | 68,486 | (a)(b) |
Thornburg Mortgage Securities Trust, 2004-01 | | | 1.725 | % | | | 3/25/44 | | | | 32,274 | | | | 31,592 | (b) |
Thornburg Mortgage Securities Trust, 2004-03 A | | | 0.933 | % | | | 9/25/44 | | | | 684,268 | | | | 648,824 | (b) |
Thornburg Mortgage Securities Trust, 2007-4 2A1 | | | 6.128 | % | | | 9/25/37 | | | | 16,421,146 | | | | 16,080,588 | (b) |
Thornburg Mortgage Securities Trust, 2007-4 3A1 | | | 6.098 | % | | | 9/25/37 | | | | 15,674,479 | | | | 16,189,056 | (b) |
See Notes to Financial Statements.
| | |
| 36 | | Western Asset Core Plus Bond Fund 2013 Semi-Annual Report |
Western Asset Core Plus Bond Fund
| | | | | | | | | | | | | | | | |
| Security | | Rate | | | Maturity
Date | | | Face Amount† | | | Value | |
| Collateralized Mortgage Obligations — continued | | | | | | | | | | | | | | | | |
UBS Barclays Commercial Mortgage Trust, 2012-C4 AS | | | 3.317 | % | | | 12/10/45 | | | | 5,150,000 | | | $ | 4,845,645 | (a) |
VNO Mortgage Trust, 2012-6AVE A | | | 2.996 | % | | | 11/15/30 | | | | 2,000,000 | | | | 1,864,418 | (a) |
Voyager BRSTN Delaware Trust, 2009-1 UAU7, IO | | | 0.443 | % | | | 12/26/36 | | | | 922,908 | | | | 751,862 | (a)(b) |
Wachovia Bank Commercial Mortgage Trust, 2007-C30 AM | | | 5.383 | % | | | 12/15/43 | | | | 4,299,000 | | | | 4,531,937 | |
Wachovia Bank Commercial Mortgage Trust, 2007-C31 A5 | | | 5.500 | % | | | 4/15/47 | | | | 5,200,000 | | | | 5,820,433 | |
Wachovia Bank Commercial Mortgage Trust, 2007-C34 A3 | | | 5.678 | % | | | 5/15/46 | | | | 100,000 | | | | 112,179 | |
WaMu Mortgage Pass-Through Certificates, 2002-AR19 A6 | | | 2.469 | % | | | 2/25/33 | | | | 96,748 | | | | 94,351 | (b) |
WaMu Mortgage Pass-Through Certificates, 2003-AR9 1A7 | | | 2.429 | % | | | 9/25/33 | | | | 35,310 | | | | 35,324 | (b) |
Washington Mutual Inc., 2005-AR15 A1A1 | | | 0.453 | % | | | 11/25/45 | | | | 11,436,871 | | | | 10,169,506 | (b) |
Washington Mutual Inc., Mortgage Pass-Through Certificates, 2004-AR13 A1A | | | 0.548 | % | | | 11/25/34 | | | | 145,277 | | | | 136,014 | (b) |
Washington Mutual Inc., Mortgage Pass-Through Certificates, 2005-AR01 A1A | | | 0.513 | % | | | 1/25/45 | | | | 1,527,535 | | | | 1,358,460 | (b) |
Washington Mutual Inc., Mortgage Pass-Through Certificates, 2005-AR06 2A1A | | | 0.423 | % | | | 4/25/45 | | | | 6,479,111 | | | | 5,830,643 | (b) |
Washington Mutual Inc., Mortgage Pass-Through Certificates, 2005-AR08 1A1A | | | 0.463 | % | | | 7/25/45 | | | | 6,152,422 | | | | 5,672,108 | (b) |
Washington Mutual Inc., Mortgage Pass-Through Certificates, 2005-AR11 A1A | | | 0.513 | % | | | 8/25/45 | | | | 589,393 | | | | 529,545 | (b) |
Washington Mutual Inc., Mortgage Pass-Through Certificates, 2005-AR13 A1A1 | | | 0.483 | % | | | 10/25/45 | | | | 14,946,218 | | | | 13,509,543 | (b) |
Washington Mutual Inc., Mortgage Pass-Through Certificates, 2005-AR19 A1A1 | | | 0.463 | % | | | 12/25/45 | | | | 15,733,545 | | | | 14,603,059 | (b) |
Washington Mutual Inc., Mortgage Pass-Through Certificates, 2006-AR10 1A1 | | | 2.658 | % | | | 9/25/36 | | | | 2,693,440 | | | | 2,183,895 | (b) |
Washington Mutual Inc., Mortgage Pass-Through Certificates, 2007-0A5 1A | | | 0.923 | % | | | 6/25/47 | | | | 42,571 | | | | 35,215 | (b) |
Washington Mutual Inc., Mortgage Pass-Through Certificates, 2007-HY4 4A1 | | | 2.406 | % | | | 9/25/36 | | | | 474,762 | | | | 391,755 | (b) |
Wells Fargo Alternative Loan Trust, 2007-PA2 2A1 | | | 0.623 | % | | | 6/25/37 | | | | 26,530,270 | | | | 16,183,704 | (b) |
Wells Fargo Mortgage Backed Securities Trust, 2004-Y 1A2 | | | 2.678 | % | | | 11/25/34 | | | | 134,985 | | | | 131,357 | (b) |
Wells Fargo Mortgage Backed Securities Trust,
2005-AR4 2A2 | | | 2.726 | % | | | 4/25/35 | | | | 495,551 | | | | 492,964 | (b) |
Wells Fargo Mortgage Loan Trust, 2010-RR4 2A1 | | | 3.148 | % | | | 8/27/35 | | | | 297,816 | | | | 304,139 | (a)(b) |
Wells Fargo Mortgage-Backed Securities Trust,
2006-AR8 2A3 | | | 2.720 | % | | | 4/25/36 | | | | 70,655 | | | | 65,992 | (b) |
Wells Fargo Mortgage-Backed Securities Trust,
2006-AR8 3A2 | | | 2.710 | % | | | 4/25/36 | | | | 4,765,347 | | | | 4,310,747 | (b) |
WF-RBS Commercial Mortgage Trust, 2011-C2 XA, IO | | | 1.317 | % | | | 2/15/44 | | | | 957,906 | | | | 41,530 | (a)(b) |
WF-RBS Commercial Mortgage Trust, 2012-C7 XA, IO | | | 1.755 | % | | | 6/15/45 | | | | 216,897 | | | | 21,961 | (a)(b) |
Total Collateralized Mortgage Obligations (Cost — $1,476,046,603) | | | | | | | | 1,457,550,501 | |
See Notes to Financial Statements.
| | |
| Western Asset Core Plus Bond Fund 2013 Semi-Annual Report | | 37 |
Schedule of investments (unaudited) (cont’d)
June 30, 2013
Western Asset Core Plus Bond Fund
| | | | | | | | | | | | | | | | |
| Security | | Rate | | | Maturity
Date | | | Face Amount† | | | Value | |
| Collateralized Senior Loans — 1.8% | | | | | | | | | | | | | | | | |
| Consumer Discretionary — 0.7% | | | | | | | | | | | | | | | | |
Auto Components — 0.1% | | | | | | | | | | | | | | | | |
Schaeffler AG, USD Term Loan C | | | 4.250 | % | | | 1/27/17 | | | | 5,044,821 | | | $ | 5,043,247 | (h) |
Diversified Consumer Services — 0.0% | | | | | | | | | | | | | | | | |
ServiceMaster Co., New Term Loan | | | 4.250 | % | | | 1/31/17 | | | | 4,975,000 | | | | 4,919,031 | (h) |
Hotels, Restaurants & Leisure — 0.2% | | | | | | | | | | | | | | | | |
Caesars Entertainment Operating Co., Extended Term Loan B6 | | | 5.443 | % | | | 1/26/18 | | | | 6,187,510 | | | | 5,457,384 | (h) |
Caesars Entertainment Operating Co., Term Loan B4 | | | 9.500 | % | | | 10/31/16 | | | | 1,462,121 | | | | 1,449,937 | (h) |
CCM Merger Inc., New Term Loan B | | | 5.000 | % | | | 3/1/17 | | | | 720,994 | | | | 718,290 | (h) |
Dunkin Brands Inc., Term Loan B3 | | | 3.750-5.000 | % | | | 2/14/20 | | | | 6,358,431 | | | | 6,332,603 | (h) |
Landry’s Inc., Term Loan B | | | 4.750 | % | | | 4/24/18 | | | | 3,443,125 | | | | 3,441,689 | (h) |
Las Vegas Sands LLC, Extended Delayed Draw Term Loan | | | 2.700 | % | | | 11/23/16 | | | | 417,445 | | | | 415,955 | (h) |
Las Vegas Sands LLC, Extended Term Loan B | | | 2.700 | % | | | 11/23/16 | | | | 2,102,353 | | | | 2,094,846 | (h) |
Wendy’s International Inc., Term Loan B | | | 3.250 | % | | | 5/15/19 | | | | 2,051,667 | | | | 2,048,462 | (h) |
Total Hotels, Restaurants & Leisure | | �� | | | | | | | | | | | | | 21,959,166 | |
Media — 0.2% | | | | | | | | | | | | | | | | |
Bresnan Broadband Holdings LLC, Term Loan B | | | — | | | | 12/14/17 | | | | 1,882,259 | | | | 1,885,788 | (h) |
Cengage Learning Acquisitions Inc., Extended Term Loan | | | 5.700 | % | | | 7/5/17 | | | | 4,756,535 | | | | 3,519,836 | (h) |
Getty Images Inc., Term Loan B | | | 4.750 | % | | | 10/18/19 | | | | 2,985,000 | | | | 2,952,911 | (h) |
Univision Communications Inc., Converted Extended Term Loan | | | 4.500 | % | | | 3/2/20 | | | | 6,939,809 | | | | 6,870,411 | (h) |
Virgin Media Investment Holdings Ltd., Term Loan B | | | 3.500 | % | | | 6/5/20 | | | | 5,570,000 | | | | 5,508,207 | (h) |
Total Media | | | | | | | | | | | | | | | 20,737,153 | |
Multiline Retail — 0.1% | | | | | | | | | | | | | | | | |
Neiman Marcus Group Inc., Extended Term Loan | | | 4.000 | % | | | 5/16/18 | | | | 9,550,000 | | | | 9,505,239 | (h) |
Specialty Retail — 0.1% | | | | | | | | | | | | | | | | |
Gymboree Corp., Initial Term Loan | | | 5.000 | % | | | 2/23/18 | | | | 7,694,349 | | | | 7,410,089 | (h) |
Party City Holdings Inc., REFI Term Loan B | | | 4.250 | % | | | 7/29/19 | | | | 1,985,025 | | | | 1,976,341 | (h) |
Total Specialty Retail | | | | | | | | | | | | | | | 9,386,430 | |
Total Consumer Discretionary | | | | | | | | | | | | | | | 71,550,266 | |
| Consumer Staples — 0.1% | | | | | | | | | | | | | | | | |
Food Products — 0.1% | | | | | | | | | | | | | | | | |
Del Monte Foods Co., Term Loan | | | 4.000 | % | | | 3/8/18 | | | | 3,825,449 | | | | 3,806,322 | (h) |
Household Products — 0.0% | | | | | | | | | | | | | | | | |
Visant Holding Corp., Term Loan B | | | 5.250 | % | | | 12/22/16 | | | | 2,750,711 | | | | 2,621,035 | (h) |
Total Consumer Staples | | | | | | | | | | | | | | | 6,427,357 | |
See Notes to Financial Statements.
| | |
| 38 | | Western Asset Core Plus Bond Fund 2013 Semi-Annual Report |
Western Asset Core Plus Bond Fund
| | | | | | | | | | | | | | | | |
| Security | | Rate | | | Maturity
Date | | | Face Amount† | | | Value | |
| Energy — 0.1% | | | | | | | | | | | | | | | | |
Energy Equipment & Services — 0.0% | | | | | | | | | | | | | | | | |
Frac Tech International LLC, Term Loan B | | | 8.500 | % | | | 5/6/16 | | | | 4,332,126 | | | $ | 4,168,125 | (h) |
Oil, Gas & Consumable Fuels — 0.1% | | | | | | | | | | | | | | | | |
Arch Coal Inc., Term Loan B | | | 5.750 | % | | | 5/16/18 | | | | 2,487,442 | | | | 2,468,786 | (h) |
Chesapeake Energy Corp., New Unsecured Term Loan | | | 5.750 | % | | | 12/1/17 | | | | 4,000,000 | | | | 4,040,556 | (h) |
Total Oil, Gas & Consumable Fuels | | | | | | | | | | | | | | | 6,509,342 | |
Total Energy | | | | | | | | | | | | | | | 10,677,467 | |
| Financials — 0.0% | | | | | | | | | | | | | | | | |
Diversified Financial Services — 0.0% | | | | | | | | | | | | | | | | |
Star West Generation LLC, Term Loan B | | | 5.000 | % | | | 3/13/20 | | | | 2,500,000 | | | | 2,529,687 | (h) |
| Health Care — 0.2% | | | | | | | | | | | | | | | | |
Biotechnology — 0.0% | | | | | | | | | | | | | | | | |
Exopack LLC, Term Loan | | | 5.000 | % | | | 5/31/17 | | | | 2,416,950 | | | | 2,422,992 | (h) |
Health Care Providers & Services — 0.1% | | | | | | | | | | | | | | | | |
Capsugel Holdings US Inc., Term Loan B | | | 4.250 | % | | | 8/1/18 | | | | 1,748,369 | | | | 1,758,567 | (h) |
CRC Health Corp., Extended Term Loan | | | 4.695 | % | | | 11/16/15 | | | | 4,818,014 | | | | 4,811,991 | (h) |
Emergency Medical Services Corp., Term Loan B | | | 4.000 | % | | | 5/25/18 | | | | 4,035,231 | | | | 4,021,540 | (h) |
Total Health Care Providers & Services | | | | | | | | | | | | | | | 10,592,098 | |
Health Care Technology — 0.0% | | | | | | | | | | | | | | | | |
Multiplan Inc., New Term Loan B | | | 4.000 | % | | | 8/25/17 | | | | 1,956,522 | | | | 1,957,919 | (h) |
Life Sciences Tools & Services — 0.0% | | | | | | | | | | | | | | | | |
Quintiles Transnational Corp., New Term Loan B | | | 4.500 | % | | | 6/8/18 | | | | 2,908,417 | | | | 2,908,417 | (h) |
Pharmaceuticals — 0.1% | | | | | | | | | | | | | | | | |
Par Pharmaceutical Cos. Inc., REFI Term Loan B | | | 4.250 | % | | | 9/30/19 | | | | 3,731,250 | | | | 3,702,598 | (h) |
Total Health Care | | | | | | | | | | | | | | | 21,584,024 | |
| Industrials — 0.2% | | | | | | | | | | | | | | | | |
Aerospace & Defense — 0.0% | | | | | | | | | | | | | | | | |
FGI Operating Co. LLC, Term Loan | | | 5.500 | % | | | 4/19/19 | | | | 1,980,926 | | | | 1,982,164 | (h) |
Airlines — 0.0% | | | | | | | | | | | | | | | | |
Delta Air Lines Inc., New Term Loan B | | | 4.250 | % | | | 4/20/17 | | | | 3,930,000 | | | | 3,931,965 | (h) |
Commercial Services & Supplies — 0.1% | | | | | | | | | | | | | | | | |
Nielsen Finance LLC, Term Loan E | | | 2.943 | % | | | 5/2/16 | | | | 7,522,052 | | | | 7,529,574 | (h) |
Sensus Metering Systems Inc., First Lien Term Loan | | | 4.750 | % | | | 5/9/17 | | | | 977,500 | | | | 972,612 | (h) |
Total Commercial Services & Supplies | | | | | | | | | | | | | | | 8,502,186 | |
Construction & Engineering — 0.1% | | | | | | | | | | | | | | | | |
BakerCorp International Inc., New Term Loan | | | 4.250 | % | | | 2/14/20 | | | | 4,927,537 | | | | 4,886,476 | (h) |
Total Industrials | | | | | | | | | | | | | | | 19,302,791 | |
See Notes to Financial Statements.
| | |
| Western Asset Core Plus Bond Fund 2013 Semi-Annual Report | | 39 |
Schedule of investments (unaudited) (cont’d)
June 30, 2013
Western Asset Core Plus Bond Fund
| | | | | | | | | | | | | | | | |
| Security | | Rate | | | Maturity
Date | | | Face Amount† | | | Value | |
| Information Technology — 0.2% | | | | | | | | | | | | | | | | |
Internet Software & Services — 0.0% | | | | | | | | | | | | | | | | |
Ancestry.com Inc., Term Loan | | | 5.250 | % | | | 12/28/18 | | | | 3,644,216 | | | $ | 3,628,729 | (h) |
IT Services — 0.2% | | | | | | | | | | | | | | | | |
First Data Corp., 2018 Add on Term Loan | | | 4.193 | % | | | 9/24/18 | | | | 5,000,000 | | | | 4,879,690 | (h) |
First Data Corp., Extended 2018 Term Loan B | | | 4.193 | % | | | 3/23/18 | | | | 14,556,443 | | | | 14,171,309 | (h) |
SunGard Data Systems Inc., Non Extended Term Loan A | | | 1.942 | % | | | 2/28/14 | | | | 4,103 | | | | 4,090 | (h) |
SunGard Data Systems Inc., Term Loan B | | | 4.000 | % | | | 2/26/16 | | | | 1,291,681 | | | | 1,292,327 | (h) |
Total IT Services | | | | | | | | | | | | | | | 20,347,416 | |
Total Information Technology | | | | | | | | | | | | | | | 23,976,145 | |
| Telecommunication Services — 0.2% | | | | | | | | | | | | | | | | |
Diversified Telecommunication Services — 0.1% | | | | | | | | | | | | | | | | |
Intelsat Jackson Holdings Ltd., Term Loan B1 | | | 4.250 | % | | | 4/2/18 | | | | 749,298 | | | | 749,766 | (h) |
Intelsat Jackson Holdings S.A., Term Loan B | | | 4.250 | % | | | 4/2/18 | | | | 3,930,250 | | | | 3,932,707 | (h) |
Total Diversified Telecommunication Services | | | | | | | | | | | | | | | 4,682,473 | |
Wireless Telecommunication Services — 0.1% | | | | | | | | | | | | | | | | |
Crown Castle International Corp., New Term Loan | | | 3.250 | % | | | 1/31/19 | | | | 5,333,427 | | | | 5,308,242 | (h) |
Telesat LLC, Term Loan B | | | 3.500 | % | | | 3/28/19 | | | | 3,960,075 | | | | 3,952,650 | (h) |
Total Wireless Telecommunication Services | | | | | | | | | | | | | | | 9,260,892 | |
Total Telecommunication Services | | | | | | | | | | | | | | | 13,943,365 | |
| Utilities — 0.1% | | | | | | | | | | | | | | | | |
Electric Utilities — 0.0% | | | | | | | | | | | | | | | | |
Equipower Resources Holdings LLC, First Lien Term Loan | | | 5.500 | % | | | 12/21/18 | | | | 2,937,458 | | | | 2,981,520 | (h) |
Independent Power Producers & Energy Traders — 0.1% | | | | | | | | | | | | | |
Windsor Financing LLC, Term Loan B | | | 6.250 | % | | | 12/5/17 | | | | 3,178,048 | | | | 3,241,609 | (h) |
Total Utilities | | | | | | | | | | | | | | | 6,223,129 | |
Total Collateralized Senior Loans (Cost — $178,419,060) | | | | | | | | 176,214,231 | |
| Mortgage-Backed Securities — 27.1% | | | | | | | | | | | | | | | | |
FHLMC — 1.5% | | | | | | | | | | | | | | | | |
Federal Home Loan Mortgage Corp. (FHLMC) | | | 6.000 | % | | | 9/1/13-11/1/36 | | | | 941,900 | | | | 1,003,795 | |
Federal Home Loan Mortgage Corp. (FHLMC) | | | 5.500 | % | | | 12/1/13-12/1/38 | | | | 23,764,048 | | | | 25,530,672 | |
Federal Home Loan Mortgage Corp. (FHLMC) | | | 7.000 | % | | | 10/1/16-4/1/32 | | | | 450,214 | | | | 523,511 | |
Federal Home Loan Mortgage Corp. (FHLMC) | | | 2.500 | % | | | 6/1/27 | | | | 6,884,480 | | | | 6,932,914 | |
Federal Home Loan Mortgage Corp. (FHLMC) | | | 6.500 | % | | | 7/1/29-9/1/39 | | | | 3,998,932 | | | | 4,500,272 | |
Federal Home Loan Mortgage Corp. (FHLMC) | | | 2.850 | % | | | 8/1/35 | | | | 2,832,951 | | | | 2,983,519 | (b) |
Federal Home Loan Mortgage Corp. (FHLMC) | | | 2.695 | % | | | 9/1/35 | | | | 1,984,870 | | | | 2,110,446 | (b) |
Federal Home Loan Mortgage Corp. (FHLMC) | | | 2.709 | % | | | 9/1/35 | | | | 461,197 | | | | 492,535 | (b) |
Federal Home Loan Mortgage Corp. (FHLMC) | | | 2.780 | % | | | 10/1/35 | | | | 1,320,905 | | | | 1,409,497 | (b) |
See Notes to Financial Statements.
| | |
| 40 | | Western Asset Core Plus Bond Fund 2013 Semi-Annual Report |
Western Asset Core Plus Bond Fund
| | | | | | | | | | | | | | | | |
| Security | | Rate | | | Maturity
Date | | | Face Amount† | | | Value | |
FHLMC — continued | | | | | | | | | | | | | | | | |
Federal Home Loan Mortgage Corp. (FHLMC) | | | 2.633 | % | | | 12/1/35 | | | | 1,822,986 | | | $ | 1,936,839 | (b) |
Federal Home Loan Mortgage Corp. (FHLMC) | | | 2.713 | % | | | 12/1/35-6/1/37 | | | | 310,035 | | | | 330,360 | (b) |
Federal Home Loan Mortgage Corp. (FHLMC) | | | 2.872 | % | | | 1/1/36 | | | | 230,407 | | | | 246,349 | (b) |
Federal Home Loan Mortgage Corp. (FHLMC) | | | 1.915 | % | | | 2/1/37 | | | | 48,103 | | | | 50,488 | (b) |
Federal Home Loan Mortgage Corp. (FHLMC) | | | 2.070 | % | | | 2/1/37 | | | | 49,370 | | | | 52,000 | (b) |
Federal Home Loan Mortgage Corp. (FHLMC) | | | 2.147 | % | | | 5/1/37 | | | | 192,854 | | | | 203,519 | (b) |
Federal Home Loan Mortgage Corp. (FHLMC) | | | 2.174 | % | | | 5/1/37 | | | | 2,314,275 | | | | 2,449,606 | (b) |
Federal Home Loan Mortgage Corp. (FHLMC) | | | 2.620 | % | | | 5/1/37 | | | | 128,115 | | | | 135,648 | (b) |
Federal Home Loan Mortgage Corp. (FHLMC) | | | 2.938 | % | | | 5/1/37 | | | | 1,433,027 | | | | 1,529,030 | (b) |
Federal Home Loan Mortgage Corp. (FHLMC) | | | 2.730 | % | | | 6/1/37 | | | | 601,714 | | | | 635,158 | (b) |
Federal Home Loan Mortgage Corp. (FHLMC) | | | 5.764 | % | | | 7/1/37 | | | | 3,703,507 | | | | 3,986,243 | (b) |
Federal Home Loan Mortgage Corp. (FHLMC) | | | 3.047 | % | | | 8/1/37 | | | | 3,022,311 | | | | 3,194,416 | (b) |
Federal Home Loan Mortgage Corp. (FHLMC) | | | 5.000 | % | | | 3/1/38-11/1/41 | | | | 4,512,834 | | | | 4,834,748 | |
Federal Home Loan Mortgage Corp. (FHLMC) | | | 4.000 | % | | | 9/1/42-10/1/42 | | | | 8,059,739 | | | | 8,448,383 | |
Federal Home Loan Mortgage Corp. (FHLMC) | | | 3.500 | % | | | 1/1/43 | | | | 12,317,151 | | | | 12,524,148 | |
Federal Home Loan Mortgage Corp. (FHLMC), Gold | | | 7.000 | % | | | 3/1/39 | | | | 3,846,060 | | | | 4,382,180 | |
Federal Home Loan Mortgage Corp. (FHLMC), Gold | | | 6.500 | % | | | 4/1/16-1/1/32 | | | | 227,056 | | | | 249,362 | |
Federal Home Loan Mortgage Corp. (FHLMC), Gold | | | 6.000 | % | | | 3/1/17 | | | | 257,166 | | | | 272,231 | |
Federal Home Loan Mortgage Corp. (FHLMC), Gold | | | 4.000 | % | | | 10/1/25-7/1/43 | | | | 45,567,840 | | | | 47,889,703 | |
Federal Home Loan Mortgage Corp. (FHLMC), Gold | | | 5.500 | % | | | 11/1/35 | | | | 68,258 | | | | 73,753 | |
Federal Home Loan Mortgage Corp. (FHLMC), Gold | | | 3.500 | % | | | 4/1/43 | | | | 1,490,236 | | | | 1,500,273 | |
Federal Home Loan Mortgage Corp. (FHLMC), Gold Pool | | | 3.500 | % | | | 5/1/43 | | | | 7,809,927 | | | | 7,935,307 | |
Total FHLMC | | | | | | | | | | | | | | | 148,346,905 | |
FNMA — 20.2% | | | | | | | | | | | | | | | | |
Federal National Mortgage Association (FNMA) | | | 6.500 | % | | | 2/1/14-6/1/35 | | | | 1,014,889 | | | | 1,134,459 | |
Federal National Mortgage Association (FNMA) | | | 5.500 | % | | | 1/1/17-5/1/40 | | | | 25,696,543 | | | | 28,000,139 | |
Federal National Mortgage Association (FNMA) | | | 9.500 | % | | | 11/1/21 | | | | 358 | | | | 400 | |
Federal National Mortgage Association (FNMA) | | | 6.000 | % | | | 4/1/24-12/1/39 | | | | 46,226,692 | | | | 50,346,625 | |
Federal National Mortgage Association (FNMA) | | | 2.500 | % | | | 1/1/28-10/1/42 | | | | 27,257,689 | | | | 26,701,827 | |
Federal National Mortgage Association (FNMA) | | | 2.500 | % | | | 7/18/28-7/15/43 | | | | 240,000,000 | | | | 240,758,395 | (i) |
Federal National Mortgage Association (FNMA) | | | 7.000 | % | | | 8/1/29-2/1/39 | | | | 22,010,359 | | | | 24,364,509 | |
Federal National Mortgage Association (FNMA) | | | 7.500 | % | | | 11/1/29 | | | | 8,313 | | | | 9,888 | |
Federal National Mortgage Association (FNMA) | | | 4.500 | % | | | 4/1/31-11/1/41 | | | | 209,284,458 | | | | 223,419,855 | |
Federal National Mortgage Association (FNMA) | | | 5.000 | % | | | 7/1/33-5/1/42 | | | | 76,106,942 | | | | 82,898,089 | |
Federal National Mortgage Association (FNMA) | | | 2.640 | % | | | 5/1/35 | | | | 1,314,771 | | | | 1,390,496 | (b) |
Federal National Mortgage Association (FNMA) | | | 2.411 | % | | | 6/1/35 | | | | 545,674 | | | | 576,848 | (b) |
Federal National Mortgage Association (FNMA) | | | 2.963 | % | | | 6/1/35 | | | | 4,481,099 | | | | 4,782,165 | (b) |
See Notes to Financial Statements.
| | |
| Western Asset Core Plus Bond Fund 2013 Semi-Annual Report | | 41 |
Schedule of investments (unaudited) (cont’d)
June 30, 2013
Western Asset Core Plus Bond Fund
| | | | | | | | | | | | | | | | |
| Security | | Rate | | | Maturity
Date | | | Face Amount† | | | Value | |
FNMA — continued | | | | | | | | | | | | | | | | |
Federal National Mortgage Association (FNMA) | | | 2.753 | % | | | 8/1/35 | | | | 744,409 | | | $ | 794,838 | (b) |
Federal National Mortgage Association (FNMA) | | | 2.810 | % | | | 9/1/35 | | | | 2,467,187 | | | | 2,614,257 | (b) |
Federal National Mortgage Association (FNMA) | | | 2.817 | % | | | 9/1/35 | | | | 1,211,571 | | | | 1,288,146 | (b) |
Federal National Mortgage Association (FNMA) | | | 2.734 | % | | | 10/1/35 | | | | 987,683 | | | | 1,054,770 | (b) |
Federal National Mortgage Association (FNMA) | | | 2.750 | % | | | 10/1/35 | | | | 791,706 | | | | 843,729 | (b) |
Federal National Mortgage Association (FNMA) | | | 2.752 | % | | | 10/1/35 | | | | 880,609 | | | | 939,682 | (b) |
Federal National Mortgage Association (FNMA) | | | 3.480 | % | | | 10/1/35 | | | | 1,412,929 | | | | 1,503,567 | (b) |
Federal National Mortgage Association (FNMA) | | | 2.112 | % | | | 11/1/35 | | | | 96,795 | | | | 101,751 | (b) |
Federal National Mortgage Association (FNMA) | | | 2.134 | % | | | 11/1/35 | | | | 178,023 | | | | 187,383 | (b) |
Federal National Mortgage Association (FNMA) | | | 2.142 | % | | | 11/1/35 | | | | 138,736 | | | | 145,871 | (b) |
Federal National Mortgage Association (FNMA) | | | 2.151 | % | | | 11/1/35 | | | | 116,778 | | | | 122,778 | (b) |
Federal National Mortgage Association (FNMA) | | | 2.837 | % | | | 12/1/35 | | | | 708,217 | | | | 755,366 | (b) |
Federal National Mortgage Association (FNMA) | | | 2.794 | % | | | 2/1/36 | | | | 178,579 | | | | 190,905 | (b) |
Federal National Mortgage Association (FNMA) | | | 1.881 | % | | | 2/1/37 | | | | 6,452,614 | | | | 6,739,935 | (b) |
Federal National Mortgage Association (FNMA) | | | 1.456 | % | | | 8/1/37 | | | | 255,265 | | | | 272,292 | (b) |
Federal National Mortgage Association (FNMA) | | | 2.074 | % | | | 8/1/37 | | | | 287,967 | | | | 303,489 | (b) |
Federal National Mortgage Association (FNMA) | | | 2.726 | % | | | 11/1/37 | | | | 71,787 | | | | 76,081 | (b) |
Federal National Mortgage Association (FNMA) | | | 4.000 | % | | | 11/1/41-7/1/43 | | | | 315,249,991 | | | | 330,401,210 | |
Federal National Mortgage Association (FNMA) | | | 3.500 | % | | | 8/1/42-5/1/43 | | | | 139,260,586 | | | | 139,716,771 | |
Federal National Mortgage Association (FNMA) | | | 3.000 | % | | | 11/1/42-2/1/43 | | | | 16,854,903 | | | | 16,143,369 | |
Federal National Mortgage Association (FNMA) | | | 3.000 | % | | | 7/15/43 | | | | 325,600,000 | | | | 318,121,359 | (i) |
Federal National Mortgage Association (FNMA) | | | 3.500 | % | | | 7/15/43 | | | | 294,000,000 | | | | 298,455,923 | (i) |
Federal National Mortgage Association (FNMA) | | | 4.000 | % | | | 7/15/43 | | | | 110,800,000 | | | | 115,426,764 | (i) |
Federal National Mortgage Association (FNMA) | | | 4.500 | % | | | 7/15/43 | | | | 119,900,000 | | | | 126,869,187 | (i) |
Total FNMA | | | | | | | | | | | | | | | 2,047,453,118 | |
GNMA — 5.4% | | | | | | | | | | | | | | | | |
Government National Mortgage Association (GNMA) | | | 7.500 | % | | | 3/15/23-9/15/31 | | | | 93,983 | | | | 102,034 | |
Government National Mortgage Association (GNMA) | | | 7.000 | % | | | 8/15/23-7/15/31 | | | | 288,902 | | | | 334,331 | |
Government National Mortgage Association (GNMA) | | | 8.500 | % | | | 11/15/27 | | | | 3,806 | | | | 3,826 | |
Government National Mortgage Association (GNMA) | | | 6.500 | % | | | 4/15/28-3/15/39 | | | | 17,483,332 | | | | 19,961,423 | |
Government National Mortgage Association (GNMA) | | | 6.000 | % | | | 1/15/29-11/20/41 | | | | 46,109,501 | | | | 51,304,606 | |
Government National Mortgage Association (GNMA) | | | 8.000 | % | | | 12/15/30-1/15/31 | | | | 21,393 | | | | 23,524 | |
Government National Mortgage Association (GNMA) | | | 0.592 | % | | | 8/20/31 | | | | 1,284 | | | | 1,297 | (b) |
See Notes to Financial Statements.
| | |
| 42 | | Western Asset Core Plus Bond Fund 2013 Semi-Annual Report |
Western Asset Core Plus Bond Fund
| | | | | | | | | | | | | | | | |
| Security | | Rate | | | Maturity
Date | | | Face Amount† | | | Value | |
GNMA — continued | | | | | | | | | | | | | | | | |
Government National Mortgage Association (GNMA) | | | 5.500 | % | | | 7/15/33-6/15/36 | | | | 20,281,912 | | | $ | 22,299,676 | |
Government National Mortgage Association (GNMA) | | | 5.000 | % | | | 4/20/35-11/20/40 | | | | 40,025,242 | | | | 44,029,044 | |
Government National Mortgage Association (GNMA) | | | 4.500 | % | | | 1/20/40-3/20/41 | | | | 135,785,043 | | | | 146,160,546 | |
Government National Mortgage Association (GNMA) | | | 3.000 | % | | | 7/22/43 | | | | 10,800,000 | | | | 10,676,813 | (i) |
Government National Mortgage Association (GNMA) | | | 3.500 | % | | | 7/22/43 | | | | 52,100,000 | | | | 53,443,201 | (i) |
Government National Mortgage Association (GNMA) | | | 4.000 | % | | | 7/22/43 | | | | 34,500,000 | | | | 36,160,312 | (i) |
Government National Mortgage Association (GNMA) II | | | 4.500 | % | | | 7/20/41 | | | | 26,388,949 | | | | 28,286,282 | |
Government National Mortgage Association (GNMA) II | | | 3.500 | % | | | 7/22/43 | | | | 128,200,000 | | | | 131,565,237 | (i) |
Total GNMA | | | | | | | | | | | | | | | 544,352,152 | |
Total Mortgage-Backed Securities (Cost — $2,761,153,500) | | | | | | | | 2,740,152,175 | |
| Municipal Bonds — 0.5% | | | | | | | | | | | | | | | | |
Florida — 0.0% | | | | | | | | | | | | | | | | |
Southwest Student Services Corp. | | | 0.360 | % | | | 12/1/18 | | | | 4,500,000 | | | | 4,198,779 | (b)(j) |
Pennsylvania — 0.5% | | | | | | | | | | | | | | | | |
Pennsylvania State Higher Education Assistance Agency Revenue, Guaranteed Student Loans | | | 0.244 | % | | | 6/1/47 | | | | 1,350,000 | | | | 1,304,427 | (b) |
Pennsylvania State Higher Education Assistance Agency, Student Loan Revenue | | | 0.169 | % | | | 5/1/46 | | | | 43,550,000 | | | | 42,051,401 | (b) |
Pennsylvania State Higher Education Assistance Agency, Student Loan Revenue | | | 0.184 | % | | | 5/1/46 | | | | 4,500,000 | | | | 4,345,537 | (b) |
Pennsylvania State Higher Education Assistance Agency, Student Loan Revenue | | | 0.192 | % | | | 5/1/46 | | | | 2,375,000 | | | | 2,293,381 | (b) |
Total Pennsylvania | | | | | | | | | | | | | | | 49,994,746 | |
Total Municipal Bonds (Cost — $50,402,795) | | | | | | | | 54,193,525 | |
| Sovereign Bonds — 3.0% | | | | | | | | | | | | | | | | |
Brazil — 0.9% | | | | | | | | | | | | | | | | |
Brazil Nota do Tesouro Nacional, Notes | | | 10.000 | % | | | 1/1/14 | | | | 13,190,000 | BRL | | | 5,930,041 | |
Brazil Nota do Tesouro Nacional, Notes | | | 10.000 | % | | | 1/1/17 | | | | 174,264,000 | BRL | | | 76,253,025 | |
Brazil Nota do Tesouro Nacional, Notes | | | 10.000 | % | | | 1/1/21 | | | | 15,241,000 | BRL | | | 6,509,529 | |
Total Brazil | | | | | | | | | | | | | | | 88,692,595 | |
Chile — 0.0% | | | | | | | | | | | | | | | | |
Corporacion Nacional del Cobre de Chile, Senior Notes | | | 4.750 | % | | | 10/15/14 | | | | 2,590,000 | | | | 2,688,379 | (a) |
See Notes to Financial Statements.
| | |
| Western Asset Core Plus Bond Fund 2013 Semi-Annual Report | | 43 |
Schedule of investments (unaudited) (cont’d)
June 30, 2013
Western Asset Core Plus Bond Fund
| | | | | | | | | | | | | | | | |
| Security | | Rate | | | Maturity
Date | | | Face Amount† | | | Value | |
Mexico — 2.1% | | | | | | | | | | | | | | | | |
Mexican Bonos, Bonds | | | 8.000 | % | | | 6/11/20 | | | | 964,063,000 | MXN | | $ | 84,877,230 | |
Mexican Bonos, Bonds | | | 6.500 | % | | | 6/9/22 | | | | 1,342,004,600 | MXN | | | 108,861,617 | |
Mexican Bonos, Bonds | | | 10.000 | % | | | 12/5/24 | | | | 39,070,000 | MXN | | | 4,065,470 | |
United Mexican States, Medium-Term Notes | | | 5.625 | % | | | 1/15/17 | | | | 374,000 | | | | 415,701 | |
United Mexican States, Medium-Term Notes | | | 6.050 | % | | | 1/11/40 | | | | 2,930,000 | | | | 3,193,700 | |
United Mexican States, Senior Notes | | | 4.750 | % | | | 3/8/44 | | | | 6,478,000 | | | | 5,765,420 | |
Total Mexico | | | | | | | | | | | | | | | 207,179,138 | |
Uruguay — 0.0% | | | | | | | | | | | | | | | | |
Republic of Uruguay, Benchmark Bonds | | | 7.875 | % | | | 1/15/33 | | | | 1 | | | | 1 | (k) |
Total Sovereign Bonds (Cost — $326,929,687) | | | | | | | | 298,560,113 | |
| U.S. Government & Agency Obligations — 17.0% | | | | | | | | | | | | | | | | |
U.S. Government Agencies — 3.5% | | | | | | | | | | | | | | | | |
Federal Home Loan Bank (FHLB), Bonds | | | 0.120 | % | | | 7/11/13 | | | | 89,000,000 | | | | 88,999,466 | |
Federal Home Loan Bank (FHLB), Global Bonds | | | 5.500 | % | | | 7/15/36 | | | | 2,585,000 | | | | 3,178,232 | |
Federal National Mortgage Association (FNMA), Bonds | | | 6.625 | % | | | 11/15/30 | | | | 45,010,000 | | | | 61,079,740 | |
Federal National Mortgage Association (FNMA), Debentures | | | 0.000 | % | | | 10/9/19 | | | | 86,850,000 | | | | 72,954,000 | |
Financing Corp. (FICO) Strip | | | 0.000 | % | | | 4/5/19 | | | | 320,000 | | | | 282,558 | |
Financing Corp. (FICO) Strip, Bonds | | | 0.000 | % | | | 11/2/18 | | | | 13,770,000 | | | | 12,558,061 | |
Financing Corp. (FICO) Strip, Debentures | | | 0.000 | % | | | 11/30/17 | | | | 1,240,000 | | | | 1,155,967 | |
Financing Corp. (FICO) Strip, Debentures | | | 0.000 | % | | | 2/8/18 | | | | 3,895,000 | | | | 3,627,402 | |
Financing Corp. (FICO) Strip, Debentures | | | 0.000 | % | | | 5/11/18 | | | | 14,603,000 | | | | 13,429,357 | |
Financing Corp. (FICO) Strip, Debentures | | | 0.000 | % | | | 8/3/18 | | | | 25,773,000 | | | | 23,576,627 | |
Financing Corp. (FICO) Strip, Debentures | | | 0.000 | % | | | 3/7/19 | | | | 14,614,000 | | | | 13,091,075 | |
Financing Corp. (FICO) Strip, Debentures | | | 0.000 | % | | | 6/6/19 | | | | 1,890,000 | | | | 1,672,735 | |
Financing Corp. (FICO) Strip, Notes | | | 0.000 | % | | | 4/6/18 | | | | 11,765,000 | | | | 10,852,989 | |
Financing Corp. (FICO) Strip, Notes | | | 0.000 | % | | | 8/3/18 | | | | 15,231,000 | | | | 13,907,776 | |
Financing Corp. (FICO) Strip, Notes | | | 0.000 | % | | | 9/26/19 | | | | 728,000 | | | | 634,370 | |
Tennessee Valley Authority, Global Power Bonds 2000 | | | 7.125 | % | | | 5/1/30 | | | | 840,000 | | | | 1,158,147 | |
Tennessee Valley Authority, Notes | | | 5.250 | % | | | 9/15/39 | | | | 23,513,000 | | | | 26,455,111 | |
Total U.S. Government Agencies | | | | | | | | | | | | | | | 348,613,613 | |
U.S. Government Obligations — 13.5% | | | | | | | | | | | | | | | | |
U.S. Treasury Bonds | | | 2.750 | % | | | 8/15/42 | | | | 434,053,000 | | | | 374,641,996 | |
U.S. Treasury Bonds | | | 2.750 | % | | | 11/15/42 | | | | 21,784,800 | | | | 18,782,593 | |
U.S. Treasury Bonds | | | 3.125 | % | | | 2/15/43 | | | | 113,060,000 | | | | 105,534,500 | |
U.S. Treasury Bonds | | | 2.875 | % | | | 5/15/43 | | | | 111,660,000 | | | | 98,819,100 | |
U.S. Treasury Notes | | | 0.125 | % | | | 8/31/13 | | | | 1,020,000 | | | | 1,020,080 | |
U.S. Treasury Notes | | | 0.250 | % | | | 6/30/14 | | | | 680,000 | | | | 680,398 | |
See Notes to Financial Statements.
| | |
| 44 | | Western Asset Core Plus Bond Fund 2013 Semi-Annual Report |
Western Asset Core Plus Bond Fund
| | | | | | | | | | | | | | | | |
| Security | | Rate | | | Maturity
Date | | | Face Amount† | | | Value | |
U.S. Government Obligations — continued | | | | | | | | | | | | | | | | |
U.S. Treasury Notes | | | 0.250 | % | | | 8/31/14 | | | | 910,000 | | | $ | 910,391 | |
U.S. Treasury Notes | | | 0.375 | % | | | 11/15/15 | | | | 10,090,000 | | | | 10,067,923 | |
U.S. Treasury Notes | | | 0.750 | % | | | 6/30/17 | | | | 34,300,000 | | | | 33,871,250 | |
U.S. Treasury Notes | | | 0.750 | % | | | 10/31/17 | | | | 184,180,000 | | | | 180,712,259 | |
U.S. Treasury Notes | | | 0.750 | % | | | 3/31/18 | | | | 70,120,000 | | | | 68,251,933 | |
U.S. Treasury Notes | | | 0.625 | % | | | 4/30/18 | | | | 7,120,000 | | | | 6,880,811 | |
U.S. Treasury Notes | | | 1.000 | % | | | 5/31/18 | | | | 80,100,000 | | | | 78,723,241 | |
U.S. Treasury Notes | | | 1.250 | % | | | 2/29/20 | | | | 194,880,000 | | | | 187,617,602 | |
U.S. Treasury Notes | | | 1.375 | % | | | 5/31/20 | | | | 86,010,000 | | | | 83,006,359 | |
U.S. Treasury Notes | | | 1.875 | % | | | 6/30/20 | | | | 670,000 | | | | 667,488 | |
U.S. Treasury Notes | | | 1.625 | % | | | 11/15/22 | | | | 15,752,000 | | | | 14,704,744 | |
U.S. Treasury Notes | | | 1.750 | % | | | 5/15/23 | | | | 106,290,000 | | | | 99,547,175 | |
U.S. Treasury Strip Principal (STRIPS) | | | 0.000 | % | | | 11/15/24 | | | | 6,080,000 | | | | 4,405,720 | |
Total U.S. Government Obligations | | | | | | | | | | | | | | | 1,368,845,563 | |
Total U.S. Government & Agency Obligations (Cost — $1,774,179,975) | | | | 1,717,459,176 | |
| U.S. Treasury Inflation Protected Securities — 0.5% | | | | | | | | | |
U.S. Treasury Bonds, Inflation Indexed | | | 2.125 | % | | | 2/15/40 | | | | 10,597,320 | | | | 12,879,050 | |
U.S. Treasury Bonds, Inflation Indexed | | | 0.750 | % | | | 2/15/42 | | | | 47,215,567 | | | | 41,564,430 | |
Total U.S. Treasury Inflation Protected Securities (Cost — $64,033,192) | | | | 54,443,480 | |
| | | | |
| | | | | | | | | Shares | | | | |
| Common Stocks — 0.0% | | | | | | | | | | | | | | | | |
| Financials — 0.0% | | | | | | | | | | | | | | | | |
Diversified Financial Services — 0.0% | | | | | | | | | | | | | | | | |
PB Investors II LLC (Cost — $9,649,958) | | | | | | | | | | | 80,790 | | | | 0 | (d)(e)(f) |
| Preferred Stocks — 0.1% | | | | | | | | | | | | | | | | |
| Financials — 0.1% | | | | | | | | | | | | | | | | |
Consumer Finance — 0.1% | | | | | | | | | | | | | | | | |
GMAC Capital Trust I | | | 8.125 | % | | | | | | | 454,841 | | | | 11,848,608 | (b) |
Diversified Financial Services — 0.0% | | | | | | | | | | | | | | | | |
Citigroup Capital XIII | | | 7.875 | % | | | | | | | 82,775 | | | | 2,305,284 | (b) |
Total Preferred Stocks (Cost — $13,228,694) | | | | 14,153,892 | |
| | | | |
| | | | | | Expiration
Date | | | Contracts | | | | |
| Purchased Options — 0.0% | | | | | | | | | | | | | | | | |
U.S. Dollar/Euro, Call @ $1.30 (Cost — $2,471,548) | | | | | | | 7/10/13 | | | | 212,150,000 | | | | 1,161,260 | |
See Notes to Financial Statements.
| | |
| Western Asset Core Plus Bond Fund 2013 Semi-Annual Report | | 45 |
Schedule of investments (unaudited) (cont’d)
June 30, 2013
Western Asset Core Plus Bond Fund
| | | | | | | | | | | | | | | | |
| Security | | Rate | | | Maturity
Date | | | Warrants | | | Value | |
| Warrants — 0.0% | | | | | | | | | | | | | | | | |
SemGroup Corp. (Cost — $0) | | | | | | | 11/30/14 | | | | 147 | | | $ | 4,248 | *(d)(e) |
Total Investments before Short-Term Investments (Cost — $10,341,547,035) | | | | 10,320,048,415 | |
| | | | |
| | | | | | | | | Face
Amount† | | | | |
| Short-Term Investments — 11.1% | | | | | | | | | | | | | | | | |
U.S. Government Agencies — 4.7% | | | | | | | | | | | | | | | | |
Federal Home Loan Bank (FHLB) | | | 0.050 | % | | | 7/8/13 | | | | 53,000,000 | | | | 52,999,485 | (l) |
Federal Home Loan Mortgage Corp. (FHLMC), Discount Notes | | | 0.060 | % | | | 8/2/13 | | | | 80,000,000 | | | | 79,995,733 | (l) |
Federal Home Loan Mortgage Corp. (FHLMC), Discount Notes | | | 0.160 | % | | | 10/22/13 | | | | 50,000,000 | | | | 49,992,150 | (l) |
Federal Home Loan Mortgage Corp. (FHLMC), Discount Notes | | | 0.094 | % | | | 12/2/13 | | | | 40,000,000 | | | | 39,984,600 | (l) |
Federal Home Loan Mortgage Corp. (FHLMC), Discount Notes | | | 0.100 | % | | | 12/9/13 | | | | 6,610,000 | | | | 6,607,343 | (l)(m) |
Federal Home Loan Mortgage Corp. (FHLMC), Discount Notes | | | 0.100 | % | | | 12/18/13 | | | | 6,720,000 | | | | 6,717,144 | (l)(m) |
Federal Home Loan Mortgage Corp. (FHLMC), Discount Notes | | | 0.120 | % | | | 1/28/14 | | | | 45,000,000 | | | | 44,973,630 | (l) |
Federal Home Loan Mortgage Corp. (FHLMC), Discount Notes | | | 0.130 | % | | | 4/21/14 | | | | 30,000,000 | | | | 29,968,170 | (l) |
Federal National Mortgage Association (FNMA), Discount Notes | | | 0.095 | % | | | 7/1/13 | | | | 50,000,000 | | | | 50,000,000 | (l) |
Federal National Mortgage Association (FNMA), Discount Notes | | | 0.050 | % | | | 7/5/13 | | | | 30,000,000 | | | | 29,999,833 | (l) |
Federal National Mortgage Association (FNMA), Discount Notes | | | 0.120 | % | | | 8/7/13 | | | | 50,000,000 | | | | 49,993,834 | (l) |
Federal National Mortgage Association (FNMA), Discount Notes | | | 0.150 | % | | | 9/3/13 | | | | 25,000,000 | | | | 24,998,225 | (l) |
Federal National Mortgage Association (FNMA), Discount Notes | | | 0.120 | % | | | 2/24/14 | | | | 11,400,000 | | | | 11,391,712 | (l)(m) |
Total U.S. Government Agencies (Cost — $477,592,350) | | | | | | | | | | | | 477,621,859 | |
U.S. Treasury Bills — 2.6% | | | | | | | | | | | | | | | | |
U.S. Treasury Bills (Cost — $259,781,543) | | | 0.100 | % | | | 5/1/14 | | | | 260,000,000 | | | | 259,736,620 | (m) |
Repurchase Agreements — 3.8% | | | | | | | | | | | | | | | | |
Barclays Capital Inc. repurchase agreement dated 6/28/13; Proceeds at maturity — $174,322,872; (Fully collateralized by U.S. government obligations, 0.625% due 5/31/17; Market value — $177,804,028) | | | 0.060 | % | | | 7/1/13 | | | | 174,322,000 | | | | 174,322,000 | |
Deutsche Bank Securities Inc. repurchase agreement dated 6/28/13; Proceeds at maturity — $75,000,625; (Fully collateralized by U.S. government obligations, 2.000% due 7/15/14; Market value — $76,349,181) | | | 0.100 | % | | | 7/1/13 | | | | 75,000,000 | | | | 75,000,000 | |
See Notes to Financial Statements.
| | |
| 46 | | Western Asset Core Plus Bond Fund 2013 Semi-Annual Report |
Western Asset Core Plus Bond Fund
| | | | | | | | | | | | | | | | |
| Security | | Rate | | | Maturity
Date | | | Face
Amount† | | | Value | |
Repurchase Agreements — continued | | | | | | | | | | | | | | | | |
Deutsche Bank Securities Inc. repurchase agreement dated 6/28/13; Proceeds at maturity — $15,453,193; (Fully collateralized by U.S. government agency obligations, 4.375% due 10/15/15; Market value — $15,762,054) | | | 0.150 | % | | | 7/1/13 | | | | 15,453,000 | | | $ | 15,453,000 | |
Goldman Sachs & Co. repurchase agreement dated 6/28/13; Proceeds at maturity — $125,226,148; (Fully collateralized by U.S. government agency obligations, 1.570% due 1/9/20; Market value — $127,734,263) | | | 0.110 | % | | | 7/1/13 | | | | 125,225,000 | | | | 125,225,000 | |
Total Repurchase Agreements (Cost — $390,000,000) | | | | | | | | | | | | 390,000,000 | |
Total Short-Term Investments (Cost — $1,127,373,893) | | | | | | | | | | | | 1,127,358,479 | |
Total Investments — 113.1% (Cost — $11,468,920,928#) | | | | | | | | | | | | 11,447,406,894 | |
Liabilities in Excess of Other Assets — (13.1)% | | | | | | | | | | | | | | | (1,325,383,803 | ) |
Total Net Assets — 100.0% | | | | | | | | | | | | | | $ | 10,122,023,091 | |
| † | Face amount denominated in U.S. dollars, unless otherwise noted. |
| * | Non-income producing security. |
| (a) | Security is exempt from registration under Rule 144A of the Securities Act of 1933. This security may be resold in transactions that are exempt from registration, normally to qualified institutional buyers. This security has been deemed liquid pursuant to guidelines approved by the Board of Directors, unless otherwise noted. |
| (b) | Variable rate security. Interest rate disclosed is as of the most recent information available. |
| (c) | The coupon payment on these securities is currently in default as of June 30, 2013. |
| (d) | Security is valued in good faith in accordance with procedures approved by the Board of Directors (See Note 1). |
| (f) | Value is less than $1. |
| (g) | Security has no maturity date. The date shown represents the next call date. |
| (h) | Interest rates disclosed represent the effective rates on collateralized senior loans. Ranges in interest rates are attributable to multiple contracts under the same loan. |
| (i) | This security is traded on a to-be-announced (“TBA”) basis (See Note 1). |
| (j) | Income from this issue is considered a preference item for purposes of calculating the alternative minimum tax (“AMT”). |
| (k) | Payment-in-kind security for which the issuer has the option at each interest payment date of making interest payments in cash or additional debt securities. |
| (l) | Rate shown represents yield-to-maturity. |
| (m) | All or a portion of this security is held at the broker as collateral for open futures contracts. |
| # | Aggregate cost for federal income tax purposes is substantially the same. |
See Notes to Financial Statements.
| | |
| Western Asset Core Plus Bond Fund 2013 Semi-Annual Report | | 47 |
Schedule of investments (unaudited) (cont’d)
June 30, 2013
Western Asset Core Plus Bond Fund
| | |
Abbreviations used in this schedule: |
| ARM | | — Adjustable Rate Mortgage |
| BRL | | — Brazilian Real |
| CD | | — Certificate of Deposit |
| EUR | | — Euro |
| IO | | — Interest Only |
| MXN | | — Mexican Peso |
| PAC | | — Planned Amortization Class |
| PO | | — Principal Only |
| REMIC | | — Real Estate Mortgage Investment Conduit |
| STRIPS | | — Separate Trading of Registered Interest and Principal Securities |
| | | | | | | | | | | | | | | | |
| Schedule of Written Options | |
| Security | | Expiration
Date | | | Strike
Rate | | | Notional
Par1† | | | Value | |
| Interest rate swaption with JPMorgan Securities Inc., Call | | | 10/7/13 | | | | 4.86 | % | | | 124,700,000 | | | $ | 23,447,112 | |
| Interest rate swaption with JPMorgan Securities Inc., Put | | | 10/7/13 | | | | 4.86 | % | | | 124,700,000 | | | | 30,395 | |
| Total Written Options (Premiums Received — $15,088,700) | | | | | | | | | | | $ | 23,477,507 | |
| 1 | In the event an option is exercised and a credit event occurs as defined under the terms of the swap agreement, the notional amount is the maximum potential amount that could be required to be paid as a seller of credit protection or received as a buyer of credit protection. |
| † | Notional par denominated in U.S. dollars, unless otherwise noted. |
See Notes to Financial Statements.
| | |
| 48 | | Western Asset Core Plus Bond Fund 2013 Semi-Annual Report |
Statement of assets and liabilities (unaudited)
June 30, 2013
| | | | |
| |
| Assets: | | | | |
Investments, at value (Cost — $11,468,920,928) | | $ | 11,447,406,894 | |
Foreign currency, at value (Cost — $12,370,949) | | | 12,503,466 | |
Receivable for securities sold | | | 777,327,103 | |
Interest receivable | | | 73,357,316 | |
Deposits with brokers for swap contracts | | | 31,954,000 | |
Receivable for Fund shares sold | | | 13,158,888 | |
Unrealized appreciation on forward foreign currency contracts | | | 5,213,689 | |
OTC swaps, at value (net premiums paid — $1,698,259) | | | 4,380,959 | |
Foreign currency collateral for open futures contract, at value (Cost — $2,756,426) | | | 2,667,277 | |
Principal paydown receivable | | | 816,558 | |
Receivable for open swap contracts | | | 88,688 | |
Deposits with brokers for open futures contracts | | | 49,550 | |
Prepaid expenses | | | 125,462 | |
Other receivables | | | 379,980 | |
Total Assets | | | 12,369,429,830 | |
| |
| Liabilities: | | | | |
Payable for securities purchased | | | 2,178,745,633 | |
Payable for Fund shares repurchased | | | 23,910,436 | |
Written options, at value (premiums received — $15,088,700) | | | 23,477,507 | |
OTC swaps, at value (premiums received — $588,159) | | | 9,356,825 | |
Unrealized depreciation on forward foreign currency contracts | | | 3,416,619 | |
Investment management fee payable | | | 3,253,677 | |
Distributions payable | | | 1,672,673 | |
Payable for open swap contracts | | | 1,100,368 | |
Due to custodian | | | 759,322 | |
Service and/or distribution fees payable | | | 695,285 | |
Payable to broker — variation margin on open futures contracts | | | 189,648 | |
Directors’ fees payable | | | 21,417 | |
Accrued expenses | | | 807,329 | |
Total Liabilities | | | 2,247,406,739 | |
| Total Net Assets | | $ | 10,122,023,091 | |
| |
| Net Assets: | | | | |
Par value (Note 7) | | $ | 898,949 | |
Paid-in capital in excess of par value | | | 10,523,567,199 | |
Undistributed net investment income | | | 32,181,605 | |
Accumulated net realized loss on investments, futures contracts, written options, swap contracts and foreign currency transactions | | | (432,228,982) | |
Net unrealized depreciation on investments, futures contracts, written options, swap contracts
and foreign currencies | | | (2,395,680) | |
| Total Net Assets | | $ | 10,122,023,091 | |
See Notes to Financial Statements.
| | |
| Western Asset Core Plus Bond Fund 2013 Semi-Annual Report | | 49 |
Statement of assets and liabilities (unaudited) (cont’d)
| | | | |
| |
| Shares Outstanding: | | | | |
Class A | | | 13,829,964 | |
Class C | | | 1,033,011 | |
Class C1 | | | 3,458,799 | |
Class FI | | | 268,350,939 | |
Class R | | | 27,913 | |
Class I | | | 400,917,891 | |
Class IS | | | 211,330,743 | |
| |
| Net Asset Value: | | | | |
Class A (and redemption price) | | | $11.26 | |
Class C* | | | $11.26 | |
Class C1* | | | $11.25 | |
Class FI (and redemption price) | | | $11.26 | |
Class R (and redemption price) | | | $11.25 | |
Class I (and redemption price) | | | $11.26 | |
Class IS (and redemption price) | | | $11.26 | |
| Maximum Public Offering Price Per Share: | | | | |
Class A (based on maximum initial sales charge of 4.25%) | | | $11.76 | |
| * | Redemption price per share is NAV of Class C and Class C1 shares reduced by a 1.00% CDSC , if shares are redeemed within one year from purchase payment (See Note 2). |
See Notes to Financial Statements.
| | |
| 50 | | Western Asset Core Plus Bond Fund 2013 Semi-Annual Report |
Statement of operations (unaudited)
For the Six Months Ended June 30, 2013
| | | | |
| |
| Investment Income: | | | | |
Interest | | $ | 169,305,299 | |
Dividends | | | 661,474 | |
Total Investment Income | | | 169,966,773 | |
| |
| Expenses: | | | | |
Investment management fee (Note 2) | | | 21,004,346 | |
Service and/or distribution fees (Notes 2 and 5) | | | 4,165,784 | |
Transfer agent fees (Note 5) | | | 3,648,881 | |
Fund accounting fees | | | 346,846 | |
Directors’ fees | | | 231,286 | |
Legal fees | | | 205,421 | |
Custody fees | | | 161,465 | |
Registration fees | | | 117,550 | |
Insurance | | | 92,828 | |
Shareholder reports | | | 51,157 | |
Audit and tax | | | 48,749 | |
Fees recaptured by investment manager (Note 2) | | | 2,816 | |
Miscellaneous expenses | | | 32,020 | |
Total Expenses | | | 30,109,149 | |
Less: Fee waivers and/or expense reimbursements (Notes 2 and 5) | | | (558,935) | |
Net Expenses | | | 29,550,214 | |
| Net Investment Income | | | 140,416,559 | |
| |
| Realized and Unrealized Gain (Loss) on Investments, Futures Contracts, Written Options, Swap Contracts and Foreign Currency Transactions (Notes 1, 3 and 4): | | | | |
Net Realized Gain (Loss) From: | | | | |
Investment transactions | | | (15,920,320) | |
Futures contracts | | | 40,729,017 | |
Written options | | | 1,409,150 | |
Swap contracts | | | (9,424,584) | |
Foreign currency transactions | | | 16,626,886 | |
Net Realized Gain | | | 33,420,149 | |
Change in Net Unrealized Appreciation (Depreciation) From: | | | | |
Investments | | | (443,456,486) | |
Futures contracts | | | 27,634,020 | |
Written options | | | 9,353,967 | |
Swap contracts | | | 5,126,377 | |
Foreign currencies | | | 4,004,070 | |
Change in Net Unrealized Appreciation (Depreciation) | | | (397,338,052) | |
Net Loss on Investments, Futures Contracts, Written Options, Swap Contracts
and Foreign Currency Transactions | | | (363,917,903) | |
| Decrease in Net Assets from Operations | | $ | (223,501,344) | |
See Notes to Financial Statements.
| | |
| Western Asset Core Plus Bond Fund 2013 Semi-Annual Report | | 51 |
Statements of changes in net assets
| | | | | | | | |
For the Six Months Ended June 30, 2013 (unaudited)
and the Year Ended December 31, 2012 | | 2013 | | | 2012 | |
| | |
| Operations: | | | | | | | | |
Net investment income | | $ | 140,416,559 | | | $ | 287,088,342 | |
Net realized gain (loss) | | | 33,420,149 | | | | (25,874,944) | |
Change in net unrealized appreciation (depreciation) | | | (397,338,052) | | | | 504,973,920 | |
Increase (Decrease) in Net Assets From Operations | | | (223,501,344) | | | | 766,187,318 | |
| | |
| Distributions to Shareholders From (Notes 1 and 6): | | | | | | | | |
Net investment income | | | (148,516,081) | | | | (299,935,110) | |
Decrease in Net Assets From Distributions to Shareholders | | | (148,516,081) | | | | (299,935,110) | |
| | |
| Fund Share Transactions (Note 7): | | | | | | | | |
Net proceeds from sale of shares | | | 1,436,063,632 | | | | 2,629,509,186 | |
Reinvestment of distributions | | | 137,048,779 | | | | 273,670,237 | |
Cost of shares repurchased | | | (1,460,467,577) | | | | (2,150,126,579) | |
Net assets of shares issued in connection with merger (Note 8) | | | — | | | | 209,928,772 | |
Increase in Net Assets From Fund Share Transactions | | | 112,644,834 | | | | 962,981,616 | |
Increase (Decrease) in Net Assets | | | (259,372,591) | | | | 1,429,233,824 | |
| | |
| Net Assets: | | | | | | | | |
Beginning of period | | | 10,381,395,682 | | | | 8,952,161,858 | |
End of period* | | $ | 10,122,023,091 | | | $ | 10,381,395,682 | |
* Includes undistributed net investment income of: | | | $32,181,605 | | | | $40,281,127 | |
See Notes to Financial Statements.
| | |
| 52 | | Western Asset Core Plus Bond Fund 2013 Semi-Annual Report |
Financial highlights
| | | | | | | | |
For a share of each class of capital stock outstanding throughout each year ended December 31,
unless otherwise noted: | |
| Class A Shares1 | | 20132 | | | 20123 | |
| | |
| Net asset value, beginning of period | | | $11.67 | | | | $11.34 | |
| | |
| Income (loss) from operations: | | | | | | | | |
Net investment income | | | 0.14 | | | | 0.21 | |
Net realized and unrealized gain (loss) | | | (0.40) | | | | 0.34 | |
Total income (loss) from operations | | | (0.26) | | | | 0.55 | |
| | |
| Less distributions from: | | | | | | | | |
Net investment income | | | (0.15) | | | | (0.22) | |
Total distributions | | | (0.15) | | | | (0.22) | |
| | |
| Net asset value, end of period | | | $11.26 | | | | $11.67 | |
Total return4 | | | (2.25) | % | | | 4.88 | % |
| | |
| Net assets, end of period (000s) | | | $155,708 | | | | $162,174 | |
| | |
| Ratios to average net assets: | | | | | | | | |
Gross expenses5 | | | 0.80 | % | | | 0.81 | % |
Net expenses5,6,7 | | | 0.80 | | | | 0.81 | 8 |
Net investment income5 | | | 2.46 | | | | 2.67 | |
| | |
| Portfolio turnover rate9 | | | 57 | % | | | 127 | % |
| 1 | Per share amounts have been calculated using the average shares method. |
| 2 | For the six months ended June 30, 2013 (unaudited). |
| 3 | For the period April 30, 2012 (commencement of operations) to December 31, 2012. |
| 4 | Performance figures, exclusive of sales charges, may reflect compensating balance arrangements, fee waivers and/or expense reimbursements. In the absence of compensating balance arrangements, fee waivers and/or expense reimbursements, the total return would have been lower. Past performance is no guarantee of future results. Total returns for periods of less than one year are not annualized. |
| 6 | The impact of compensating balance arrangements, if any, was less than 0.01%. |
| 7 | As a result of an expense limitation arrangement, the ratio of expenses, other than interest, brokerage commissions, taxes, extraordinary expenses and deferred organizational expenses, to average net assets of Class A shares did not exceed 0.90%. This expense limitation arrangement cannot be terminated prior to December 31, 2014 without the Board of Directors’ consent. |
| 8 | Reflects fee waivers and/or expense reimbursements. |
| 9 | Excluding mortgage dollar roll transactions. If mortgage dollar roll transactions had been included, the portfolio turnover rate would have been 142% for the six months ended June 30, 2013 and 385% for the period ended December 31, 2012. |
See Notes to Financial Statements.
| | |
| Western Asset Core Plus Bond Fund 2013 Semi-Annual Report | | 53 |
Financial highlights (cont’d)
| | | | | | | | |
For a share of each class of capital stock outstanding throughout each year ended December 31,
unless otherwise noted: | |
| Class C Shares1 | | 20132 | | | 20123 | |
| | |
| Net asset value, beginning of period | | | $11.68 | | | | $11.34 | |
| | |
| Income (loss) from operations: | | | | | | | | |
Net investment income | | | 0.10 | | | | 0.14 | |
Net realized and unrealized gain (loss) | | | (0.41) | | | | 0.36 | |
Total income (loss) from operations | | | (0.31) | | | | 0.50 | |
| | |
| Less distributions from: | | | | | | | | |
Net investment income | | | (0.11) | | | | (0.16) | |
Total distributions | | | (0.11) | | | | (0.16) | |
| | |
| Net asset value, end of period | | | $11.26 | | | | $11.68 | |
Total return4 | | | (2.67) | % | | | 4.45 | % |
| | |
| Net assets, end of period (000s) | | | $11,636 | | | | $6,146 | |
| | |
| Ratios to average net assets: | | | | | | | | |
Gross expenses5 | | | 1.50 | % | | | 1.48 | % |
Net expenses5,6,7 | | | 1.50 | | | | 1.48 | 8 |
Net investment income5 | | | 1.78 | | | | 1.89 | |
| | |
| Portfolio turnover rate9 | | | 57 | % | | | 127 | % |
| 1 | Per share amounts have been calculated using the average shares method. |
| 2 | For the six months ended June 30, 2013 (unaudited). |
| 3 | For the period April 30, 2012 (commencement of operations) to December 31, 2012. |
| 4 | Performance figures, exclusive of CDSC, may reflect compensating balance arrangements, fee waivers and/or expense reimbursements. In the absence of compensating balance arrangements, fee waivers and/or expense reimbursements, the total return would have been lower. Past performance is no guarantee of future results. Total returns for periods of less than one year are not annualized. |
| 6 | The impact of compensating balance arrangements, if any, was less than 0.01%. |
| 7 | As a result of an expense limitation arrangement, the ratio of expenses, other than interest, brokerage commissions, taxes, extraordinary expenses and deferred organizational expenses, to average net assets of Class C shares did not exceed 1.65%. This expense limitation arrangement cannot be terminated prior to December 31, 2014 without the Board of Directors’ consent. |
| 8 | Reflects fee waivers and/or expense reimbursements. |
| 9 | Excluding mortgage dollar roll transactions. If mortgage dollar roll transactions had been included, the portfolio turnover rate would have been 142% for the six months ended June 30, 2013 and 385% for the period ended December 31, 2012. |
See Notes to Financial Statements.
| | |
| 54 | | Western Asset Core Plus Bond Fund 2013 Semi-Annual Report |
| | | | | | | | |
For a share of each class of capital stock outstanding throughout each year ended December 31,
unless otherwise noted: | |
| Class C1 Shares1 | | 20132 | | | 20123 | |
| | |
| Net asset value, beginning of period | | | $11.66 | | | | $11.67 | |
| | |
| Income (loss) from operations: | | | | | | | | |
Net investment income | | | 0.12 | | | | 0.06 | |
Net realized and unrealized loss | | | (0.41) | | | | (0.01) | |
Total income (loss) from operations | | | (0.29) | | | | 0.05 | |
| | |
| Less distributions from: | | | | | | | | |
Net investment income | | | (0.12) | | | | (0.06) | |
Total distributions | | | (0.12) | | | | (0.06) | |
| | |
| Net asset value, end of period | | | $11.25 | | | | $11.66 | |
Total return4 | | | (2.47) | % | | | 0.47 | % |
| | |
| Net assets, end of period (000s) | | | $38,923 | | | | $44,839 | |
| | |
| Ratios to average net assets: | | | | | | | | |
Gross expenses5 | | | 1.26 | % | | | 1.26 | % |
Net expenses5,6,7 | | | 1.26 | | | | 1.26 | 8 |
Net investment income5 | | | 2.01 | | | | 2.22 | |
| | |
| Portfolio turnover rate9 | | | 57 | % | | | 127 | % |
| 1 | Per share amounts have been calculated using the average shares method. |
| 2 | For the six months ended June 30, 2013 (unaudited). |
| 3 | For the period October 4, 2012 (commencement of operations) to December 31, 2012. |
| 4 | Performance figures, exclusive of CDSC, may reflect compensating balance arrangements, fee waivers and/or expense reimbursements. In the absence of compensating balance arrangements, fee waivers and/or expense reimbursements, the total return would have been lower. Past performance is no guarantee of future results. Total returns for periods of less than one year are not annualized. |
| 6 | The impact of compensating balance arrangements, if any, was less than 0.01%. |
| 7 | As a result of an expense limitation arrangement, the ratio of expenses, other than interest, brokerage commissions , taxes, extraordinary expenses and deferred organizational expenses, to average net assets of Class C1 shares did not exceed 1.51%. This expense limitation arrangement cannot be terminated prior to December 31, 2014 without the Board of Directors’ consent. |
| 8 | Reflects fee waivers and/or expense reimbursements. |
| 9 | Excluding mortgage dollar roll transactions. If mortgage dollar roll transactions had been included, the portfolio turnover rate would have been 142% for the six months ended June 30, 2013 and 385% for the period ended December 31, 2012. |
See Notes to Financial Statements.
| | |
| Western Asset Core Plus Bond Fund 2013 Semi-Annual Report | | 55 |
Financial highlights (cont’d)
| | | | | | | | | | | | | | | | | | | | | | | | | | | | |
For a share of each class of capital stock outstanding throughout each year ended December 31,
unless otherwise noted: | |
| Class FI Shares1 | | 20132 | | | 2012 | | | 2011 | | | 20103 | | | 2009 | | | 20084 | | | 20085 | |
| | | | | | | |
| Net asset value, beginning of period | | | $11.67 | | | | $11.10 | | | | $10.78 | | | | $10.13 | | | | $8.66 | | | | $9.88 | | | | $10.56 | |
| | | | | | | |
| Income (loss) from operations: | | | | | | | | | | | | | | | | | | | | | | | | | | | | |
Net investment income | | | 0.14 | | | | 0.32 | | | | 0.33 | | | | 0.42 | | | | 0.45 | | | | 0.37 | | | | 0.52 | |
Net realized and unrealized gain (loss) | | | (0.40) | | | | 0.59 | | | | 0.35 | | | | 0.76 | | | | 1.71 | | | | (1.17) | | | | (0.62) | |
Total income (loss) from operations | | | (0.26) | | | | 0.91 | | | | 0.68 | | | | 1.18 | | | | 2.16 | | | | (0.80) | | | | (0.10) | |
| | | | | | | |
| Less distributions from: | | | | | | | | | | | | | | | | | | | | | | | | | | | | |
Net investment income | | | (0.15) | | | | (0.34) | | | | (0.36) | | | | (0.53) | | | | (0.55) | | | | (0.42) | | | | (0.50) | |
Net realized gains | | | — | | | | — | | | | — | | | | — | | | | (0.14) | | | | — | | | | (0.08) | |
Total distributions | | | (0.15) | | | | (0.34) | | | | (0.36) | | | | (0.53) | | | | (0.69) | | | | (0.42) | | | | (0.58) | |
| | | | | | | |
| Net asset value, end of period | | | $11.26 | | | | $11.67 | | | | $11.10 | | | | $10.78 | | | | $10.13 | | | | $8.66 | | | | $9.88 | |
Total return6 | | | (2.23) | % | | | 8.25 | % | | | 6.37 | % | | | 11.80 | % | | | 25.78 | % | | | (8.28) | % | | | (0.97) | % |
| | | | | | | |
| Net assets, end of period (000s) | | | $3,021,300 | | | | $2,934,467 | | | | $2,122,142 | | | | $923,350 | | | | $757,048 | | | | $840,452 | | | | $1,215,985 | |
| | | | | | | |
| Ratios to average net assets: | | | | | | | | | | | | | | | | | | | | | | | | | | | | |
Gross expenses | | | 0.79 | %7 | | | 0.75 | % | | | 0.78 | % | | | 0.76 | % | | | 0.86 | % | | | 0.77 | %7 | | | 0.68 | % |
Net expenses8,9 | | | 0.75 | 7,10 | | | 0.73 | 10 | | | 0.70 | | | | 0.70 | | | | 0.70 | | | | 0.70 | 7 | | | 0.68 | |
Net investment income | | | 2.51 | 7 | | | 2.79 | | | | 3.04 | | | | 3.90 | | | | 4.90 | | | | 5.20 | 7 | | | 5.10 | |
| | | | | | | |
| Portfolio turnover rate | | | 57 | %11 | | | 127 | %11 | | | 170 | %11 | | | 464 | % | | | 202 | % | | | 124 | %12 | | | 488 | % |
| 1 | Per share amounts have been calculated using the average shares method. |
| 2 | For the six months ended June 30, 2013 (unaudited). |
| 3 | In April 2010, Financial Intermediary Class shares were renamed Class FI shares. |
| 4 | For the period April 1, 2008 through December 31, 2008. |
| 5 | For the year ended March 31. |
| 6 | Performance figures may reflect compensating balance arrangements, fee waivers and/or expense reimbursements. In the absence of compensating balance arrangements, fee waivers and/or expense reimbursements, the total return would have been lower. Past performance is no guarantee of future results. Total returns for periods of less than one year are not annualized. |
| 8 | The impact of compensating balance arrangements, if any, was less than 0.01%. |
| 9 | Reflects fee waivers and/or expense reimbursements. |
| 10 | As a result of an expense limitation arrangement, effective May 1, 2012, the ratio of expenses to average net assets of Class FI shares did not exceed 0.85%. This expense limitation arrangement cannot be terminated prior to December 31, 2014 without the Board of Directors’ consent. The manager currently intends to voluntarily waive fees and/or reimburse operating expenses so that total annual operating expenses are not expected to exceed 0.78%. This arrangement is expected to continue until April 30, 2014, but may be terminated at any time by the manager. Prior to May 1, 2013, the manager voluntarily waived fees and/or reimbursed operating expenses so that the annual operating expenses would not exceed 0.74%. Prior to May 1, 2012, as the result of an expense limitation arrangement, the ratio of expenses to average net assets of Class FI shares did not exceed 0.70%. These expense limitations do not include interest, brokerage commissions, taxes, extraordinary expenses and deferred organizational expenses. |
| 11 | Excluding mortgage dollar roll transactions. If mortgage dollar roll transactions had been included, the portfolio turnover rate would have been 142% for the six months ended June 30, 30,2013 and 385% and 734% for the years ended December 31, 2012 and 2011, respectively. |
See Notes to Financial Statements.
| | |
| 56 | | Western Asset Core Plus Bond Fund 2013 Semi-Annual Report |
| | | | | | | | |
For a share of each class of capital stock outstanding throughout each year ended December 31,
unless otherwise noted: | |
| Class R Shares1 | | 20132 | | | 20123 | |
| | |
| Net asset value, beginning of period | | | $11.66 | | | | $11.34 | |
| | |
| Income (loss) from operations: | | | | | | | | |
Net investment income | | | 0.12 | | | | 0.19 | |
Net realized and unrealized gain (loss) | | | (0.40) | | | | 0.33 | |
Total income (loss) from operations | | | (0.28) | | | | 0.52 | |
| | |
| Less distributions from: | | | | | | | | |
Net investment income | | | (0.13) | | | | (0.20) | |
Total distributions | | | (0.13) | | | | (0.20) | |
| | |
| Net asset value, end of period | | | $11.25 | | | | $11.66 | |
Total return4 | | | (2.42) | % | | | 4.57 | % |
| | |
| Net assets, end of period (000s) | | | $314 | | | | $451 | |
| | |
| Ratios to average net assets: | | | | | | | | |
Gross expenses5 | | | 1.41 | % | | | 1.24 | % |
Net expenses5,6,7,8 | | | 1.15 | | | | 1.02 | |
Net investment income5 | | | 2.10 | | | | 2.45 | |
| | |
| Portfolio turnover rate9 | | | 57 | % | | | 127 | % |
| 1 | Per share amounts have been calculated using the average shares method. |
| 2 | For the six months ended June 30, 2013 (unaudited). |
| 3 | For the period April 30, 2012 (commencement of operations) to December 31, 2012. |
| 4 | Performance figures may reflect compensating balance arrangements, fee waivers and/or expense reimbursements. In the absence of compensating balance arrangements, fee waivers and/or expense reimbursements, the total return would have been lower. Past performance is no guarantee of future results. Total returns for periods of less than one year are not annualized. |
| 6 | The impact of compensating balance arrangements, if any, was less than 0.01%. |
| 7 | Reflects fee waivers and/or expense reimbursements. |
| 8 | As a result of an expense limitation arrangement, the ratio of expenses, other than interest, brokerage commissions taxes, extraordinary expenses and deferred organizational expenses, to average net assets of Class R shares did not exceed 1.15%. This expense limitation arrangement cannot be terminated prior to December 31, 2014 without the Board of Directors’ consent. |
| 9 | Excluding mortgage dollar roll transactions. If mortgage dollar roll transactions had been included, the portfolio turnover rate would have been 142% for the six months ended June 30, 2013 and 385% for the period ended December 31, 2012. |
See Notes to Financial Statements.
| | |
| Western Asset Core Plus Bond Fund 2013 Semi-Annual Report | | 57 |
Financial highlights (cont’d)
| | | | | | | | | | | | | | | | | | | | | | | | | | | | |
For a share of each class of capital stock outstanding throughout each year ended December 31,
unless otherwise noted: | |
| Class I Shares1 | | 20132 | | | 2012 | | | 2011 | | | 20103 | | | 2009 | | | 20084 | | | 20085 | |
| | | | | | | |
Net asset value,
beginning of period | | | $11.67 | | | | $11.11 | | | | $10.78 | | | | $10.14 | | | | $8.66 | | | | $9.87 | | | | $10.55 | |
| | | | | | | |
| Income (loss) from operations: | | | | | | | | | | | | | | | | | | | | | | | | | | | | |
Net investment income | | | 0.16 | | | | 0.35 | | | | 0.36 | | | | 0.45 | | | | 0.48 | | | | 0.39 | | | | 0.55 | |
Net realized and unrealized
gain (loss) | | | (0.40) | | | | 0.58 | | | | 0.35 | | | | 0.75 | | | | 1.71 | | | | (1.17) | | | | (0.62) | |
Total income (loss) from operations | | | (0.24) | | | | 0.93 | | | | 0.71 | | | | 1.20 | | | | 2.19 | | | | (0.78) | | | | (0.07) | |
| | | | | | | |
| Less distributions from: | | | | | | | | | | | | | | | | | | | | | | | | | | | | |
Net investment income | | | (0.17) | | | | (0.37) | | | | (0.38) | | | | (0.56) | | | | (0.57) | | | | (0.43) | | | | (0.53) | |
Net realized gains | | | — | | | | — | | | | — | | | | — | | | | (0.14) | | | | — | | | | (0.08) | |
Total distributions | | | (0.17) | | | | (0.37) | | | | (0.38) | | | | (0.56) | | | | (0.71) | | | | (0.43) | | | | (0.61) | |
| | | | | | | |
| Net asset value, end of period | | | $11.26 | | | | $11.67 | | | | $11.11 | | | | $10.78 | | | | $10.14 | | | | $8.66 | | | | $9.87 | |
Total return6 | | | (2.10) | % | | | 8.44 | % | | | 6.72 | % | | | 11.97 | % | | | 26.20 | % | | | (8.01) | % | | | (0.72) | % |
| | | | | | | |
| Net assets, end of period (000s) | | | $4,515,233 | | | | $4,787,737 | | | | $4,698,991 | | | | $5,188,774 | | | | $5,466,554 | | | | $6,607,180 | | | | $12,943,882 | |
| | | | | | | |
| Ratios to average net assets: | | | | | | | | | | | | | | | | | | | | | | | | | | | | |
Gross expenses | | | 0.50 | %7 | | | 0.46 | % | | | 0.45 | % | | | 0.45 | % | | | 0.46 | % | | | 0.46 | %7 | | | 0.43 | % |
Net expenses8 | | | 0.50 | 7 | | | 0.46 | 9 | | | 0.45 | | | | 0.45 | | | | 0.46 | | | | 0.46 | 7 | | | 0.43 | 9 |
Net investment income | | | 2.76 | 7 | | | 3.06 | | | | 3.28 | | | | 4.20 | | | | 5.20 | | | | 5.50 | 7 | | | 5.40 | |
| | | | | | | |
| Portfolio turnover rate | | | 57 | %10 | | | 127 | %10 | | | 170 | %10 | | | 464 | % | | | 202 | % | | | 124 | %11 | | | 488 | % |
| 1 | Per share amounts have been calculated using the average shares method. |
| 2 | For the six months ended June 30, 2013 (unaudited). |
| 3 | In April 2010, Institutional Class shares were renamed Class I shares. |
| 4 | For the period April 1, 2008 through December 31, 2008. |
| 5 | For the year ended March 31. |
| 6 | Performance figures may reflect compensating balance arrangements, fee waivers and/or expense reimbursements. In the absence of compensating balance arrangements, fee waivers and/or expense reimbursements, the total return would have been lower. Past performance is no guarantee of future results. Total returns for periods of less than one year are not annualized. |
| 8 | The impact of compensating balance arrangements, if any, was less than 0.01%. |
| 9 | Reflects fee waivers and/or expense reimbursements. |
| 10 | Excluding mortgage dollar roll transactions. If mortgage dollar roll transactions had been included, the portfolio turnover rate would have been 142% for the six months ended June 30, 2013 and 385% and 734% for the years ended December 31, 2012 and 2011, respectively. |
See Notes to Financial Statements.
| | |
| 58 | | Western Asset Core Plus Bond Fund 2013 Semi-Annual Report |
| | | | | | | | | | | | | | | | | | | | | | | | |
For a share of each class of capital stock outstanding throughout each year ended December 31,
unless otherwise noted: | |
| Class IS Shares1 | | 20132 | | | 2012 | | | 2011 | | | 20103 | | | 2009 | | | 20084 | |
| | | | | | |
| Net asset value, beginning of period | | | $11.67 | | | | $11.10 | | | | $10.78 | | | | $10.13 | | | | $8.66 | | | | $9.34 | |
| | | | | | |
| Income (loss) from operations: | | | | | | | | | | | | | | | | | | | | | | | | |
Net investment income | | | 0.16 | | | | 0.35 | | | | 0.36 | | | | 0.45 | | | | 0.48 | | | | 0.20 | |
Net realized and unrealized gain (loss) | | | (0.40) | | | | 0.59 | | | | 0.35 | | | | 0.76 | | | | 1.70 | | | | (0.62) | |
Total income (loss) from operations | | | (0.24) | | | | 0.94 | | | | 0.71 | | | | 1.21 | | | | 2.18 | | | | (0.42) | |
| | | | | | |
| Less distributions from: | | | | | | | | | | | | | | | | | | | | | | | | |
Net investment income | | | (0.17) | | | | (0.37) | | | | (0.39) | | | | (0.56) | | | | (0.57) | | | | (0.26) | |
Net realized gains | | | — | | | | — | | | | — | | | | — | | | | (0.14) | | | | — | |
Total distributions | | | (0.17) | | | | (0.37) | | | | (0.39) | | | | (0.56) | | | | (0.71) | | | | (0.26) | |
| | | | | | |
| Net asset value, end of period | | | $11.26 | | | | $11.67 | | | | $11.10 | | | | $10.78 | | | | $10.13 | | | | $8.66 | |
Total return5 | | | (2.07) | % | | | 8.57 | % | | | 6.65 | % | | | 12.10 | % | | | 26.11 | % | | | (4.54) | % |
| | | | | | |
| Net assets, end of period (000s) | | | $2,378,909 | | | | $2,445,582 | | | | $2,131,029 | | | | $1,824,251 | | | | $1,835,921 | | | | $1,559,843 | |
| | | | | | |
| Ratios to average net assets: | | | | | | | | | | | | | | | | | | | | | | | | |
Gross expenses | | | 0.43 | %6,7 | | | 0.43 | % | | | 0.43 | % | | | 0.43 | % | | | 0.43 | % | | | 0.44 | %6 |
Net expenses8 | | | 0.43 | 6,7,9 | | | 0.43 | 9,10 | | | 0.43 | | | | 0.43 | | | | 0.43 | 10 | | | 0.44 | 6,10 |
Net investment income | | | 2.84 | 6 | | | 3.09 | | | | 3.30 | | | | 4.20 | | | | 5.20 | | | | 5.70 | 6 |
| | | | | | |
| Portfolio turnover rate | | | 57 | %11 | | | 127 | %11 | | | 170 | %11 | | | 464 | % | | | 202 | % | | | 124 | %12 |
| 1 | Per share amounts have been calculated using the average shares method. |
| 2 | For the six months ended June 30, 2013 (unaudited). |
| 3 | In April 2010, Institutional Select Class shares were renamed Class IS shares. |
| 4 | For the period August 4, 2008 (inception date) to December 31, 2008. |
| 5 | Performance figures may reflect compensating balance arrangements, fee waivers and/or expense reimbursements. In the absence of compensating balance arrangements, fee waivers and/or expense reimbursements, the total return would have been lower. Past performance is no guarantee of future results. Total returns for periods of less than one year are not annualized. |
| 7 | Reflects recapture of expenses waived/reimbursed from prior fiscal years. |
| 8 | The impact of compensating balance arrangements, if any, was less than 0.01%. |
| 9 | As a result of an expense limitation arrangement, effective May 1, 2012, the ratio of expenses, other than interest, brokerage commissions, taxes, extraordinary expenses and deferred organizational expenses, to average net assets of Class IS shares did not exceed 0.45%. This expense limitation arrangement cannot be terminated prior to December 31, 2014 without the Board of Directors’ consent. |
| 10 | Reflects fee waivers and/or expense reimbursements. |
| 11 | Excluding mortgage dollar roll transactions. If mortgage dollar roll transactions had been included, the portfolio turnover rate would have been 142% for the six months ended June 30, 2013 and 385% and 734% for the years ended December 31, 2012 and 2011, respectively. |
See Notes to Financial Statements.
| | |
| Western Asset Core Plus Bond Fund 2013 Semi-Annual Report | | 59 |
Notes to financial statements (unaudited)
1. Organization and significant accounting policies
Western Asset Core Plus Bond Fund (the “Fund”) is a separate diversified investment series of Western Asset Funds, Inc. (the “Corporation”). The Corporation, a Maryland corporation, is registered under the Investment Company Act of 1940, as amended (the “1940 Act”), as an open-end management investment company.
The following are significant accounting policies consistently followed by the Funds and are in conformity with U.S. generally accepted accounting principles (“GAAP”). Estimates and assumptions are required to be made regarding assets, liabilities and changes in net assets resulting from operations when financial statements are prepared. Changes in the economic environment, financial markets and any other parameters used in determining these estimates could cause actual results to differ. Subsequent events have been evaluated through the date the financial statements were issued.
(a) Investment valuation. The valuations for fixed income securities (which may include, but are not limited to, corporate, government, municipal, mortgage-backed, collateralized mortgage obligations and asset-backed securities) and certain derivative instruments are typically the prices supplied by independent third party pricing services, which may use market prices or broker/dealer quotations or a variety of valuation techniques and methodologies. The independent third party pricing services use inputs that are observable such as issuer details, interest rates, yield curves, prepayment speeds, credit risks/spreads, default rates and quoted prices for similar securities. Short-term fixed income securities that will mature in 60 days or less are valued at amortized cost, unless it is determined that using this method would not reflect an investment’s fair value. Futures contracts are valued daily at the settlement price established by the board of trade or exchange on which they are traded. Equity securities for which market quotations are available are valued at the last reported sales price or official closing price on the primary market or exchange on which they trade. When the Fund holds securities or other assets that are denominated in a foreign currency, the Fund will normally use the currency exchange rates as of 4:00 p.m. (Eastern Time). If independent third party pricing services are unable to supply prices for a portfolio investment, or if the prices supplied are deemed by the manager to be unreliable, the market price may be determined by the manager using quotations from one or more broker/dealers or at the transaction price if the security has recently been purchased and no value has yet been obtained from a pricing service or pricing broker. When reliable prices are not readily available, such as when the value of a security has been significantly affected by events after the close of the exchange or market on which the security is principally traded, but before the Fund calculates its net asset value, the Fund values these securities as determined in accordance with procedures approved by the Fund’s Board of Directors.
The Board of Directors is responsible for the valuation process and has delegated the supervision of the daily valuation process to the Legg Mason North American Fund Valuation Committee (the “Valuation Committee”). The Valuation Committee, pursuant to the policies adopted by the Board of Directors, is responsible for making fair value determinations,
| | |
| 60 | | Western Asset Core Plus Bond Fund 2013 Semi-Annual Report |
evaluating the effectiveness of the Fund’s pricing policies, and reporting to the Board of Directors. When determining the reliability of third party pricing information for investments owned by the Fund, the Valuation Committee, among other things, conducts due diligence reviews of pricing vendors, monitors the daily change in prices and reviews transactions among market participants.
The Valuation Committee will consider pricing methodologies it deems relevant and appropriate when making fair value determinations. Examples of possible methodologies include, but are not limited to, multiple of earnings; discount from market of a similar freely traded security; discounted cash-flow analysis; book value or a multiple thereof; risk premium/yield analysis; yield to maturity; and/or fundamental investment analysis. The Valuation Committee will also consider factors it deems relevant and appropriate in light of the facts and circumstances. Examples of possible factors include, but are not limited to, the type of security; the issuer’s financial statements; the purchase price of the security; the discount from market value of unrestricted securities of the same class at the time of purchase; analysts’ research and observations from financial institutions; information regarding any transactions or offers with respect to the security; the existence of merger proposals or tender offers affecting the security; the price and extent of public trading in similar securities of the issuer or comparable companies; and the existence of a shelf registration for restricted securities.
For each portfolio security that has been fair valued pursuant to the policies adopted by the Board of Directors, the fair value price is compared against the last available and next available market quotations. The Valuation Committee reviews the results of such back testing monthly and fair valuation occurrences are reported to the Board of Directors quarterly.
The Fund uses valuation techniques to measure fair value that are consistent with the market approach and/or income approach, depending on the type of security and the particular circumstance. The market approach uses prices and other relevant information generated by market transactions involving identical or comparable securities. The income approach uses valuation techniques to discount estimated future cash flows to present value.
GAAP establishes a disclosure hierarchy that categorizes the inputs to valuation techniques used to value assets and liabilities at measurement date. These inputs are summarized in the three broad levels listed below:
| Ÿ | | Level 1 — quoted prices in active markets for identical investments |
| Ÿ | | Level 2 — other significant observable inputs (including quoted prices for similar investments, interest rates, prepayment speeds, credit risk, etc.) |
| Ÿ | | Level 3 — significant unobservable inputs (including the Fund’s own assumptions in determining the fair value of investments) |
The inputs or methodologies used to value securities are not necessarily an indication of the risk associated with investing in those securities.
| | |
| Western Asset Core Plus Bond Fund 2013 Semi-Annual Report | | 61 |
Notes to financial statements (unaudited) (cont’d)
The following is a summary of the inputs used in valuing the Fund’s assets and liabilities carried at fair value:
| | | | | | | | | | | | | | | | |
| ASSETS | |
| Description | | Quoted Prices
(Level 1) | | | Other Significant
Observable Inputs
(Level 2) | | | Significant
Unobservable
Inputs
(Level 3) | | | Total | |
| Long-term investments†: | | | | | | | | | | | | | | | | |
Corporate bonds & notes | | | — | | | $ | 3,422,231,356 | | | $ | 0 | * | | $ | 3,422,231,356 | |
Asset-backed securities | | | — | | | | 383,924,458 | | | | — | | | | 383,924,458 | |
Collateralized mortgage obligations | | | — | | | | 1,457,327,623 | | | | 222,878 | | | | 1,457,550,501 | |
Collateralized senior loans | | | — | | | | 176,214,231 | | | | — | | | | 176,214,231 | |
Mortgage-backed securities | | | — | | | | 2,740,152,175 | | | | — | | | | 2,740,152,175 | |
Municipal bonds | | | — | | | | 54,193,525 | | | | — | | | | 54,193,525 | |
Sovereign bonds | | | — | | | | 298,560,113 | | | | — | | | | 298,560,113 | |
U.S. government & agency obligations | | | — | | | | 1,717,459,176 | | | | | | | | 1,717,459,176 | |
U.S. Treasury inflation protected securities | | | — | | | | 54,443,480 | | | | — | | | | 54,443,480 | |
Common stocks | | | — | | | | — | | | | 0 | * | | | 0 | * |
Preferred stocks | | $ | 14,153,892 | | | | — | | | | — | | | | 14,153,892 | |
Purchased options | | | — | | | | 1,161,260 | | | | — | | | | 1,161,260 | |
Warrants | | | — | | | | 4,248 | | | | — | | | | 4,248 | |
| Total long-term investments | | $ | 14,153,892 | | | $ | 10,305,671,645 | | | $ | 222,878 | | | $ | 10,320,048,415 | |
| Short-term investments† | | | — | | | | 1,127,358,479 | | | | — | | | | 1,127,358,479 | |
| Total investments | | $ | 14,153,892 | | | $ | 11,433,030,124 | | | $ | 222,878 | | | $ | 11,447,406,894 | |
| Other financial instruments: | | | | | | | | | | | | | | | | |
Futures contracts | | $ | 35,281,660 | | | | — | | | | — | | | $ | 35,281,660 | |
Forward foreign currency contracts | | | — | | | $ | 5,213,689 | | | | — | | | | 5,213,689 | |
Credit default swaps on corporate issues — sell protection | | | — | | | | 1,735,782 | | | | — | | | | 1,735,782 | |
Credit default swaps on corporate issues — buy protection | | | — | | | | 311,464 | | | | — | | | | 311,464 | |
Credit default swaps on credit indices — sell protection‡ | | | — | | | | 527,622 | | | | — | | | | 527,622 | |
Credit default swaps on credit indices — buy protection‡ | | | — | | | | 1,754,522 | | | | — | | | | 1,754,522 | |
Total return swaps‡ | | | — | | | | 51,569 | | | | — | | | | 51,569 | |
| Total other financial instruments | | $ | 35,281,660 | | | $ | 9,594,648 | | | | — | | | $ | 44,876,308 | |
| Total | | $ | 49,435,552 | | | $ | 11,442,624,772 | | | $ | 222,878 | | | $ | 11,492,283,202 | |
| | |
| 62 | | Western Asset Core Plus Bond Fund 2013 Semi-Annual Report |
| | | | | | | | | | | | | | | | |
| LIABILITIES | |
| Description | | Quoted Prices
(Level 1) | | | Other Significant
Observable Inputs
(Level 2) | | | Significant
Unobservable
Inputs
(Level 3) | | | Total | |
| Other financial instruments: | | | | | | | | | | | | | | | | |
Written options | | | — | | | $ | 23,477,507 | | | | — | | | $ | 23,477,507 | |
Futures contracts | | $ | 3,097,425 | | | | — | | | | — | | | | 3,097,425 | |
Forward foreign currency contracts | | | — | | | | 3,416,619 | | | | — | | | | 3,416,619 | |
Interest rate swaps | | | — | | | | 8,551,565 | | | | — | | | | 8,551,565 | |
Credit default swaps on corporate issues — sell protection‡ | | | — | | | | 292,379 | | | | — | | | | 292,379 | |
Credit default swaps on corporate issues — buy protection | | | — | | | | 512,881 | | | | — | | | | 512,881 | |
| Total | | $ | 3,097,425 | | | $ | 36,250,951 | | | | — | | | $ | 39,348,376 | |
| † | See Schedule of Investments for additional detailed categorizations. |
| ‡ | Values include any premiums paid or received with respect to swap contracts. |
(b) Repurchase agreements. The Fund may enter into repurchase agreements with institutions that its investment adviser has determined are creditworthy. Each repurchase agreement is recorded at cost. Under the terms of a typical repurchase agreement, the Fund acquires a debt security subject to an obligation of the seller to repurchase, and of the Fund to resell, the security at an agreed-upon price and time, thereby determining the yield during the Fund’s holding period. When entering into repurchase agreements, it is the Fund’s policy that its custodian or a third party custodian, acting on the Fund’s behalf, take possession of the underlying collateral securities, the market value of which, at all times, at least equals the principal amount of the repurchase transaction, including accrued interest. To the extent that any repurchase transaction maturity exceeds one business day, the value of the collateral is marked-to-market and measured against the value of the agreement in an effort to ensure the adequacy of the collateral. If the counterparty defaults, the Fund generally has the right to use the collateral to satisfy the terms of the repurchase transaction. However, if the market value of the collateral declines during the period in which the Fund seeks to assert its rights or if bankruptcy proceedings are commenced with respect to the seller of the security, realization of the collateral by the Fund may be delayed or limited.
(c) Securities traded on a to-be-announced basis. The Fund may trade securities on a to-be-announced (“TBA”) basis. In a TBA transaction, the Fund commits to purchasing or selling securities which have not yet been issued by the issuer and for which specific information, such as the face amount, maturity date and underlying pool of investments in U.S. government agency mortgage pass-through securities, is not announced. Securities purchased on a TBA basis are not settled until they are delivered to the Fund. Beginning on the date the Fund enters into a TBA transaction, cash, U.S. government securities or other liquid high-grade debt obligations are segregated in an amount equal in value to the purchase price of the TBA security. These securities are subject to market fluctuations and their current value is determined in the same manner as for other securities.
| | |
| Western Asset Core Plus Bond Fund 2013 Semi-Annual Report | | 63 |
Notes to financial statements (unaudited) (cont’d)
(d) Mortgage dollar rolls. The Fund may enter into mortgage dollar rolls in which the Fund sells mortgage-backed securities for delivery in the current month, realizing a gain or loss, and simultaneously contracts to repurchase substantially similar (same type, coupon and maturity) securities to settle on a specified future date.
The Fund executes its mortgage dollar rolls entirely in the TBA market, whereby the Fund makes a forward commitment to purchase a security and, instead of accepting delivery, the position is offset by a sale of the security with a simultaneous agreement to repurchase at a future date. The Fund accounts for mortgage dollar rolls as purchases and sales.
The risk of entering into mortgage dollar rolls is that the market value of the securities the Fund is obligated to repurchase under the agreement may decline below the repurchase price. In the event the buyer of securities under a mortgage dollar roll files for bankruptcy or becomes insolvent, the Fund’s use of the proceeds of the mortgage dollar roll may be restricted pending a determination by the counterparty, or its trustee or receiver, whether to enforce the Fund’s obligation to repurchase the securities.
(e) Inflation-indexed bonds. Inflation-indexed bonds are fixed-income securities whose principal value or interest rate is periodically adjusted according to the rate of inflation. As the index measuring inflation changes, the principal value or interest rate of inflation-indexed bonds will be adjusted accordingly. Inflation adjustments to the principal amount of inflation-indexed bonds are reflected as an increase or decrease to investment income on the Statement of Operations. Repayment of the original bond principal upon maturity (as adjusted for inflation) is guaranteed in the case of U.S. Treasury inflation-indexed bonds. For bonds that do not provide a similar guarantee, the adjusted principal value of the bond repaid at maturity may be less than the original principal.
(f) Forward foreign currency contracts. The Fund enters into a forward foreign currency contract to hedge against foreign currency exchange rate risk on its non-U.S. dollar denominated securities or to facilitate settlement of a foreign currency denominated portfolio transaction. A forward foreign currency contract is an agreement between two parties to buy and sell a currency at a set price with delivery and settlement at a future date. The contract is marked-to-market daily and the change in value is recorded by the Fund as an unrealized gain or loss. When a forward foreign currency contract is closed, through either delivery or offset by entering into another forward foreign currency contract, the Fund recognizes a realized gain or loss equal to the difference between the value of the contract at the time it was opened and the value of the contract at the time it is closed.
Forward foreign currency contracts involve elements of market risk in excess of the amounts reflected on the Statement of Assets and Liabilities. The Fund bears the risk of an unfavorable change in the foreign exchange rate underlying the forward foreign currency contract. Risks may also arise upon entering into these contracts from the potential inability of the counterparties to meet the terms of their contracts.
(g) Loan participations. The Fund may invest in loans arranged through private negotiation between one or more financial institutions. The Fund’s investment in any such loan may
| | |
| 64 | | Western Asset Core Plus Bond Fund 2013 Semi-Annual Report |
be in the form of a participation in or an assignment of the loan. In connection with purchasing participations, the Fund generally will have no right to enforce compliance by the borrower with the terms of the loan agreement related to the loan, or any rights of off-set against the borrower and the Fund may not benefit directly from any collateral supporting the loan in which it has purchased the participation.
The Fund assumes the credit risk of the borrower, the lender that is selling the participation and any other persons interpositioned between the Fund and the borrower. In the event of the insolvency of the lender selling the participation, the Fund may be treated as a general creditor of the lender and may not benefit from any off-set between the lender and the borrower.
(h) Written options. When the Fund writes an option, an amount equal to the premium received by the Fund is recorded as a liability, the value of which is marked-to-market daily to reflect the current market value of the option written. If the option expires, the premium received is recorded as a realized gain. When a written call option is exercised, the difference between the premium received plus the option exercise price and the Fund’s basis in the underlying security (in the case of a covered written call option), or the cost to purchase the underlying security (in the case of an uncovered written call option), including brokerage commission, is recognized as a realized gain or loss. When a written put option is exercised, the amount of the premium received is subtracted from the cost of the security purchased by the Fund from the exercise of the written put option to form the Fund’s basis in the underlying security purchased. The writer or buyer of an option traded on an exchange can liquidate the position before the exercise of the option by entering into a closing transaction. The cost of a closing transaction is deducted from the original premium received resulting in a realized gain or loss to the Fund.
The risk in writing a covered call option is that the Fund may forego the opportunity of profit if the market price of the underlying security increases and the option is exercised. The risk in writing a put option is that the Fund may incur a loss if the market price of the underlying security decreases and the option is exercised. The risk in writing an uncovered call option is that the Fund is exposed to the risk of loss if the market price of the underlying security increases. In addition, there is the risk that the Fund may not be able to enter into a closing transaction because of an illiquid secondary market.
(i) Futures contracts. The Fund uses futures contracts generally to gain exposure to, or hedge against, changes in interest rates or gain exposure to, or hedge against, changes in certain asset classes. A futures contract represents a commitment for the future purchase or sale of an asset at a specified price on a specified date.
Upon entering into a futures contract, the Fund is required to deposit cash or cash equivalents with a broker in an amount equal to a certain percentage of the contract amount. This is known as the ‘‘initial margin’’ and subsequent payments (‘‘variation margin’’) are made or received by the Fund each day, depending on the daily fluctuation in the value of the contract. For certain futures, including foreign denominated futures, variation margin is
| | |
| Western Asset Core Plus Bond Fund 2013 Semi-Annual Report | | 65 |
Notes to financial statements (unaudited) (cont’d)
not settled daily, but is recorded as a net variation margin payable or receivable. Futures contracts are valued daily at the settlement price established by the board of trade or exchange on which they are traded. The daily changes in contract value are recorded as unrealized gains or losses in the Statement of Operations and the Fund recognizes a realized gain or loss when the contract is closed.
Futures contracts involve, to varying degrees, risk of loss in excess of the amounts reflected in the financial statements. In addition, there is the risk that the Fund may not be able to enter into a closing transaction because of an illiquid secondary market.
(j) Swap agreements. The Fund invests in swaps for the purpose of managing its exposure to interest rate, credit or market risk, or for other purposes. The use of swaps involves risks that are different from those associated with other portfolio transactions. Swap agreements are privately negotiated in the over-the-counter market (“OTC Swaps”) or may be executed on a registered exchange (“Centrally Cleared Swaps”). Unlike Centrally Cleared Swaps, the fund has credit exposure to the counterparties of OTC Swaps.
Swap contracts are marked-to-market daily and changes in value are recorded as unrealized appreciation (depreciation). The daily change in valuation of Centrally Cleared Swaps, if any, is recorded as a receivable or payable for variation margin on the Statement of Assets and Liabilities. Gains or losses are realized upon termination of the swap agreement. Collateral, in the form of restricted cash or securities, may be required to be held in segregated accounts with the Fund’s custodian in compliance with the terms of the swap contracts. Securities posted as collateral for swap contracts are identified in the Schedule of Investments and restricted cash, if any, is identified on the Statement of Assets and Liabilities. Risks may exceed amounts recorded in the Statement of Assets and Liabilities. These risks include changes in the returns of the underlying instruments, failure of the counterparties to perform under the contracts’ terms, and the possible lack of liquidity with respect to the swap agreements.
OTC swaps payments received or made at the beginning of the measurement period are reflected as a premium or deposit, respectively, on the Statement of Assets and Liabilities. These upfront payments are amortized over the life of the swap and are recognized as realized gain or loss in the Statement of Operations. Net periodic payments received or paid by the Fund are recognized as a realized gain or loss in the Statement of Operations.
The Fund’s maximum exposure in the event of a defined credit event on a credit default swap to sell protection is the notional amount. As of June 30, 2013, the total notional value of all credit default swaps to sell protection is $67,296,723. This amount would be offset by the value of the swap’s reference entity, upfront premiums received on the swap and any amounts received from the settlement of a credit default swap where the Fund bought protection for the same referenced security/entity.
For average notional amounts of swaps held during the six months ended June 30, 2013, see Note 4.
| | |
| 66 | | Western Asset Core Plus Bond Fund 2013 Semi-Annual Report |
Credit default swaps
The Fund enters into credit default swap (“CDS”) contracts for investment purposes, to manage its credit risk or to add leverage. CDS agreements involve one party making a stream of payments to another party in exchange for the right to receive a specified return in the event of a default by a third party, typically corporate or sovereign issuers, on a specified obligation, or in the event of a write-down, principal shortfall, interest shortfall or default of all or part of the referenced entities comprising a credit index. The Fund may use a CDS to provide protection against defaults of the issuers (i.e., to reduce risk where the Fund has exposure to an issuer) or to take an active long or short position with respect to the likelihood of a particular issuer’s default. As a seller of protection, the Fund generally receives an upfront payment or a stream of payments throughout the term of the swap provided that there is no credit event. If the Fund is a seller of protection and a credit event occurs, as defined under the terms of that particular swap agreement, the maximum potential amount of future payments (undiscounted) that the Fund could be required to make under a credit default swap agreement would be an amount equal to the notional amount of the agreement. These amounts of potential payments will be partially offset by any recovery of values from the respective referenced obligations. As a seller of protection, the Fund effectively adds leverage to its portfolio because, in addition to its total net assets, the Fund is subject to investment exposure on the notional amount of the swap. As a buyer of protection, the Fund generally receives an amount up to the notional value of the swap if a credit event occurs.
Implied spreads are the theoretical prices a lender receives for credit default protection. When spreads rise, market perceived credit risk rises and when spreads fall, market perceived credit risk falls. The implied credit spread of a particular referenced entity reflects the cost of buying/selling protection and may include upfront payments required to enter into the agreement. Wider credit spreads and decreasing market values, when compared to the notional amount of the swap, represent a deterioration of the referenced entity’s credit soundness and a greater likelihood or risk of default or other credit event occurring as defined under the terms of the agreement. Credit spreads utilized in determining the period end market value of credit default swap agreements on corporate or sovereign issues are disclosed in the Notes to Financial Statements and serve as an indicator of the current status of the payment/performance risk and represent the likelihood or risk of default for credit derivatives. For credit default swap agreements on asset-backed securities and credit indices, the quoted market prices and resulting values, particularly in relation to the notional amount of the contract as well as the annual payment rate, serve as an indication of the current status of the payment/performance risk.
The Fund’s maximum risk of loss from counterparty risk, as the protection buyer, is the fair value of the contract (this risk is mitigated by the posting of collateral by the counterparty to the Fund to cover the Fund’s exposure to the counterparty). As the protection seller, the Fund’s maximum risk is the notional amount of the contract. Credit default swaps are considered to have credit risk-related contingent features since they require payment by the protection seller to the protection buyer upon the occurrence of a defined credit event.
| | |
| Western Asset Core Plus Bond Fund 2013 Semi-Annual Report | | 67 |
Notes to financial statements (unaudited) (cont’d)
Entering into a CDS agreement involves, to varying degrees, elements of credit, market and documentation risk in excess of the related amounts recognized on the Statement of Assets and Liabilities. Such risks involve the possibility that there will be no liquid market for these agreements, that the counterparty to the agreement may default on its obligation to perform or disagree as to the meaning of the contractual terms in the agreement, and that there will be unfavorable changes in net interest rates.
Interest rate swaps
The Fund enters into interest rate swap contracts to manage its exposure to interest rate risk. Interest rate swaps are agreements between two parties to exchange cash flows based on a notional principal amount. The Fund may elect to pay a fixed rate and receive a floating rate, or receive a fixed rate and pay a floating rate, on a notional principal amount. Interest rate swaps are marked-to-market daily based upon quotations from market makers and the change, if any, is recorded as an unrealized gain or loss in the Statement of Operations. When a swap contract is terminated early, the Fund records a realized gain or loss equal to the difference between the original cost and the settlement amount of the closing transaction.
The risks of interest rate swaps include changes in market conditions that will affect the value of the contract or changes in the present value of the future cash flow streams and the possible inability of the counterparty to fulfill its obligations under the agreement. The Fund’s maximum risk of loss from counterparty credit risk is the discounted net value of the cash flows to be received from the counterparty over the contract’s remaining life, to the extent that that amount is positive. This risk is mitigated by the posting of collateral by the counterparty to the Fund to cover the Fund’s exposure to the counterparty.
Total return swaps
The Fund enters into total return swaps for investment purposes. Total return swaps are agreements to exchange the return generated by one instrument for the return generated by another instrument. For example, the agreement to pay a predetermined or fixed interest rate in exchange for a market-linked return based on a notional amount. To the extent the total return of a referenced index or instrument exceeds the offsetting interest obligation, the Fund will receive a payment from the counterparty. To the extent it is less, the Fund will make a payment to the counterparty.
(k) Foreign currency translation. Investment securities and other assets and liabilities denominated in foreign currencies are translated into U.S. dollar amounts based upon prevailing exchange rates on the date of valuation. Purchases and sales of investment securities and income and expense items denominated in foreign currencies are translated into U.S. dollar amounts based upon prevailing exchange rates on the respective dates of such transactions.
The Fund does not isolate that portion of the results of operations resulting from fluctuations in foreign exchange rates on investments from the fluctuations arising from changes in market prices of securities held. Such fluctuations are included with the net realized and unrealized gain or loss on investments.
| | |
| 68 | | Western Asset Core Plus Bond Fund 2013 Semi-Annual Report |
Net realized foreign exchange gains or losses arise from sales of foreign currencies, including gains and losses on forward foreign currency contracts, currency gains or losses realized between the trade and settlement dates on securities transactions, and the difference between the amounts of dividends, interest, and foreign withholding taxes recorded on the Fund’s books and the U.S. dollar equivalent of the amounts actually received or paid. Net unrealized foreign exchange gains and losses arise from changes in the values of assets and liabilities, other than investments in securities, on the date of valuation, resulting from changes in exchange rates.
Foreign security and currency transactions may involve certain considerations and risks not typically associated with those of U.S. dollar denominated transactions as a result of, among other factors, the possibility of lower levels of governmental supervision and regulation of foreign securities markets and the possibility of political or economic instability.
(l) Stripped securities. The Fund may invest in “Stripped Securities,” a term used collectively for components, or strips, of fixed income securities. Stripped securities can be principal only securities (“PO”), which are debt obligations that have been stripped of unmatured interest coupons, or interest only securities (“IO”), which are unmatured interest coupons that have been stripped from debt obligations. The market value of Stripped Securities will fluctuate in response to changes in economic conditions, rates of pre-payment, interest rates and the market’s perception of the securities. However, fluctuations in response to interest rates may be greater in Stripped Securities than for debt obligations of comparable maturities that pay interest currently. The amount of fluctuation may increase with a longer period of maturity.
The yield to maturity on IO’s is sensitive to the rate of principal repayments (including prepayments) on the related underlying debt obligation and principal payments may have a material effect on yield to maturity. If the underlying debt obligation experiences greater than anticipated prepayments of principal, the Fund may not fully recoup its initial investment in IO’s.
(m) Swaptions. The Fund purchases and writes swaption contracts to manage exposure to an underlying instrument. The Fund may also purchase or write options to manage exposure to fluctuations in interest rates or to enhance yield. Swaption contracts written by the Fund represent an option that gives the purchaser the right, but not the obligation, to enter into a previously agreed upon swap contract at a future date. Swaption contracts purchased by the Fund represent an option that gives the Fund the right, but not the obligation, to enter into a previously agreed upon swap contract at a future date.
When the Fund writes a swaption, an amount equal to the premium received by the Fund is recorded as a liability, the value of which is marked-to-market daily to reflect the current market value of the swaption written. If the swaption expires, the Fund realizes a gain equal to the amount of the premium received.
When the Fund purchases a swaption, an amount equal to the premium paid by the Fund is recorded as an investment on the Statement of Assets and Liabilities, the value of which is
| | |
| Western Asset Core Plus Bond Fund 2013 Semi-Annual Report | | 69 |
Notes to financial statements (unaudited) (cont’d)
marked-to-market daily to reflect the current market value of the swaption purchased. If the swaption expires, the Fund realizes a loss equal to the amount of the premium paid.
Swaptions are marked-to-market daily based upon quotations from market makers. Changes in the value of the swaption are reported as unrealized gains or losses in the Statement of Operations.
(n) Credit and market risk. The Fund invests in high-yield and emerging market instruments that are subject to certain credit and market risks. The yields of high-yield and emerging market debt obligations reflect, among other things, perceived credit and market risks. The Fund’s investments in securities rated below investment grade typically involve risks not associated with higher rated securities including, among others, greater risk related to timely and ultimate payment of interest and principal, greater market price volatility and less liquid secondary market trading. The consequences of political, social, economic or diplomatic changes may have disruptive effects on the market prices of investments held by the Fund. The Fund’s investments in non-U.S. dollar denominated securities may also result in foreign currency losses caused by devaluations and exchange rate fluctuations.
Investments in securities that are collateralized by residential real estate mortgages are subject to certain credit and liquidity risks. When market conditions result in an increase in default rates of the underlying mortgages and the foreclosure values of underlying real estate properties are materially below the outstanding amount of these underlying mortgages, collection of the full amount of accrued interest and principal on these investments may be doubtful. Such market conditions may significantly impair the value and liquidity of these investments and may result in a lack of correlation between their credit ratings and values.
(o) Counterparty risk and credit-risk-related contingent features of derivative instruments. The Fund may invest in certain securities or engage in other transactions, where the Fund is exposed to counterparty credit risk in addition to broader market risks. The Fund may invest in securities of issuers, which may also be considered counterparties as trading partners in other transactions. This may increase the risk of loss in the event of default or bankruptcy by the counterparty or if the counterparty otherwise fails to meet its contractual obligations. The Fund’s investment manager attempts to mitigate counterparty risk by (i) periodically assessing the creditworthiness of its trading partners, (ii) monitoring and/or limiting the amount of its net exposure to each individual counterparty based on its assessment and (iii) requiring collateral from the counterparty for certain transactions. Market events and changes in overall economic conditions may impact the assessment of such counterparty risk by the investment manager. In addition, declines in the values of underlying collateral received may expose the Fund to increased risk of loss.
The Fund has entered into master agreements with certain of its derivative counterparties that provide for general obligations, representations, agreements, collateral, events of default or termination and credit related contingent features. The credit related contingent
| | |
| 70 | | Western Asset Core Plus Bond Fund 2013 Semi-Annual Report |
features include, but are not limited to, a percentage decrease in the Fund’s net assets or NAV over a specified period of time. If these credit related contingent features were triggered, the derivatives counterparty could terminate the positions and demand payment or require additional collateral.
Collateral requirements differ by type of derivative. Collateral or margin requirements are set by the broker or exchange clearing house for exchange traded derivatives while collateral terms are contract specific for over-the-counter traded derivatives. Cash collateral that has been pledged to cover obligations of the Fund under derivative contracts, if any, will be reported separately in the Statement of Assets and Liabilities. Securities pledged as collateral, if any, for the same purpose are noted in the Schedule of Investments.
Absent an event of default by the counterparty or a termination of the agreement, the terms of the master agreements do not result in an offset of reported amounts of financial assets and financial liabilities in the Statement of Assets and Liabilities across transactions between the Fund and the applicable counterparty. The enforceability of the right to offset may vary by jurisdiction.
As of June 30, 2013, the Fund held written options, forward foreign currency contracts, credit default swaps and interest rate swaps with credit related contingent features which had a liability position of $36,250,951. If a contingent feature in the master agreements would have been triggered, the Fund would have been required to pay this amount to its derivatives counterparties. As of June 30, 2013, the Fund had posted with its counterparties cash and/or securities as collateral to cover the net liability of these derivatives amounting to $31,954,000, which could be used to reduce the required payment.
(p) Security transactions and investment income. Security transactions are accounted for on a trade date basis. Interest income, adjusted for amortization of premium and accretion of discount, is recorded on the accrual basis. Dividend income is recorded on the ex-dividend date. Foreign dividend income is recorded on the ex-dividend date or as soon as practicable after the Fund determines the existence of a dividend declaration after exercising reasonable due diligence. The cost of investments sold is determined by use of the specific identification method. To the extent any issuer defaults or a credit event occurs that impacts the issuer, the Fund may halt any additional interest income accruals and consider the realizability of interest accrued up to the date of default or credit event.
(q) Distributions to shareholders. Distributions from net investment income of the Fund are declared each business day to shareholders of record, and are paid monthly. Distributions of net realized gains, if any, are declared at least annually. Distributions to shareholders of the Fund are recorded on the ex-dividend date and are determined in accordance with income tax regulations, which may differ from GAAP.
(r) Share class accounting. Investment income, common expenses and realized/unrealized gains (losses) on investments are allocated to the various classes of the Fund on the basis of daily net assets of each class. Fees relating to a specific class are charged directly to that share class.
| | |
| Western Asset Core Plus Bond Fund 2013 Semi-Annual Report | | 71 |
Notes to financial statements (unaudited) (cont’d)
(s) Compensating balance arrangements. The Fund has an arrangement with its custodian bank whereby a portion of the custodian’s fees is paid indirectly by credits earned on the Fund’s cash on deposit with the bank.
(t) Federal and other taxes. It is the Fund’s policy to comply with the federal income and excise tax requirements of the Internal Revenue Code of 1986 (the “Code”), as amended, applicable to regulated investment companies. Accordingly, the Fund intends to distribute its taxable income and net realized gains, if any, to shareholders in accordance with timing requirements imposed by the Code. Therefore, no federal or state income tax provision is required in the Fund’s financial statements.
Management has analyzed the Fund’s tax positions taken on income tax returns for all open tax years and has concluded that as of June 30, 2013, no provision for income tax is required in the Fund’s financial statements. The Fund’s federal and state income and federal excise tax returns for tax years for which the applicable statutes of limitations have not expired are subject to examination by the Internal Revenue Service and state departments of revenue.
Under the applicable foreign tax laws, a withholding tax may be imposed on interest, dividends and capital gains at various rates.
(u) Reclassification. GAAP requires that certain components of net assets be reclassified to reflect permanent differences between financial and tax reporting. These reclassifications have no effect on net assets or net asset value per share.
2. Investment management agreement and other transactions with affiliates
The Fund has an investment management agreement with Legg Mason Partners Fund Advisor, LLC (“LMPFA”). Western Asset Management Company (“Western Asset”) is the investment adviser. Western Asset Management Company Limited (“Western Asset Limited”), Western Asset Management Company Pte. Ltd. (“Western Singapore”) and Western Asset Management Company Ltd (“Western Japan”) share advisory responsibilities with Western Asset. LMPFA, Western Asset, Western Asset Limited, Western Singapore and Western Japan are wholly owned subsidiaries of Legg Mason, Inc (“Legg Mason”).
LMPFA provides the Fund with management and administrative services for which the Fund pays a fee calculated daily and paid monthly, at an annual rate of 0.450% of the Fund’s average daily net assets up to $500 million, 0.425% of the average daily net assets of the next $500 million and 0.400% of the Fund’s average daily net assets in excess of $1 billion.
The investment manager has agreed to waive fees and/or reimburse operating expenses (other than interest, brokerage commissions, taxes, extraordinary expenses and deferred organizational expenses) so that total operating expenses are not expected to exceed: 0.90%, 1.65%, 1.51%, 0.85%, 1.15% and 0.45% for Class A, Class C, Class C1, Class FI, Class R, and Class IS shares, respectively. These arrangements cannot be terminated prior to December 31, 2014 without the Board of Directors’ consent. Prior to May 1, 2012, the
| | |
| 72 | | Western Asset Core Plus Bond Fund 2013 Semi-Annual Report |
investment manager had agreed to waive fees and/or reimburse operating expenses (other than interest, brokerage commissions, taxes, extraordinary expenses and deferred organizational expenses) so that total operating expenses are not expected to exceed: 0.70% and 0.45% for Class FI and Class IS shares, respectively.
The manager currently intends to voluntarily waive fees and/or reimburse expenses other than interest, brokerage commissions, taxes, extraordinary expenses and deferred organizational fees so that total annual operating expenses are not expected to exceed 0.78% for Class FI shares. This arrangement is expected to continue until April 30, 2014, but may be terminated at any time by the investment manager. Prior to May 1, 2013, the manager voluntarily waived fees and/or reimbursed operating expenses so that total annual operating expenses (other than interest, brokerage commissions, taxes, extraordinary expenses and deferred organizational expenses) would not exceed 0.74%.
During the six months ended June 30, 2013, fees waived and/or expenses reimbursed amounted to $558,935.
The investment manager is permitted to recapture amounts waived and/or reimbursed to a class within two years after the fiscal year in which the investment manager earned the fee or incurred the expense if the class’ total annual operating expenses have fallen to a level below the limits described above. In no case will the investment manager recapture any amount that would result, on any particular business day of the Fund, in the class’ total annual operating expenses exceeding this limit or any other lower limit then in effect.
Pursuant to this arrangement, at June 30, 2013, the Fund had remaining fee waivers and/or expense reimbursements subject to recapture by LMPFA and respective dates of expiration as follows:
| | | | | | | | | | | | | | | | | | | | | | | | |
| | | Class A | | | Class C | | | Class C1 | | | Class FI | | | Class R | | | Class I | |
| Expires December 31, 2013 | | | — | | | | — | | | | — | | | $ | 1,417,345 | | | | — | | | | — | |
| Expires December 31, 2014 | | $ | 75 | | | $ | 2 | | | $ | 21 | | | | 467,400 | | | $ | 219 | | | $ | 2,213 | |
| Expires December 31, 2015 | | | — | | | | — | | | | — | | | | 558,497 | | | | 438 | | | | — | |
| Fee waivers/expense reimbursements subject to recapture | | $ | 75 | | | $ | 2 | | | $ | 21 | | | $ | 2,443,242 | | | $ | 657 | | | $ | 2,213 | |
For the six months ended June 30, 2013, LMPFA recaptured $2,816 for Class IS.
Legg Mason Investor Services, LLC (“LMIS”), a wholly-owned broker-dealer subsidiary of Legg Mason, serves as the Fund’s sole and exclusive distributor.
There is a maximum initial sales charge of 4.25% for Class A shares. Class C and Class C1 shares have a 1.00% contingent deferred sales charge (“CDSC”), which applies if redemption occurs within 12 months from purchase payment. In certain cases, Class A shares have a 1.00% CDSC, which applies if redemption occurs within 18 months from purchase payment (or within 12 months for shares purchased prior to August 1, 2012). This CDSC only applies to those purchases of Class A shares, which, when combined with current holdings of other shares of funds sold by LMIS, equal or exceed $1,000,000 in the aggregate. These purchases do not incur an initial sales charge.
| | |
| Western Asset Core Plus Bond Fund 2013 Semi-Annual Report | | 73 |
Notes to financial statements (unaudited) (cont’d)
For the six months ended June 30, 2013, LMIS and its affiliates received sales charges of $35,728 on sales of the Fund’s Class A shares. In addition, for the six months ended June 30, 2013, CDSCs paid to LMIS and its affiliates were:
| | | | | | | | | | | | |
| | | Class A | | | Class C | | | Class C1 | |
| CDSCs | | $ | 460 | | | $ | 5,117 | | | $ | 869 | |
All officers of the Corporation are employees of Legg Mason or its affiliates and do not receive compensation from the Corporation.
3. Investments
During the six months ended June 30, 2013, the aggregate cost of purchases and proceeds from sales of investments (excluding short-term investments) and U.S. Government & Agency Obligations were as follows:
| | | | | | | | |
| | | Investments | | | U.S. Government & Agency Obligations | |
| Purchases | | $ | 1,023,945,427 | | | $ | 14,700,910,253 | |
| Sales | | | 602,547,812 | | | | 14,254,575,089 | |
At June 30, 2013, the aggregate gross unrealized appreciation and depreciation of investments for federal income tax purposes were substabtially as follows:
| | | | |
| Gross unrealized appreciation | | $ | 311,479,992 | |
| Gross unrealized depreciation | | | (332,994,026) | |
| Net unrealized depreciation | | $ | (21,514,034) | |
At June 30, 2013, the Fund had the following open futures contracts:
| | | | | | | | | | | | | | | | | | | | |
| | | Number of
Contracts | | | Expiration
Date | | | Basis
Value | | | Market
Value | | | Unrealized
Gain (Loss) | |
| Contracts to Buy: | | | | | | | | | | | | | | | | | | | | |
| 90-Day Eurodollar | | | 1,087 | | | | 3/15 | | | $ | 269,207,770 | | | $ | 269,508,063 | | | $ | 300,293 | |
| 3-Month Euribor | | | 1,773 | | | | 6/15 | | | | 572,632,756 | | | | 572,398,165 | | | | (234,591) | |
| U.S. Treasury 5-Year Notes | | | 2,730 | | | | 9/13 | | | | 333,320,803 | | | | 330,457,969 | | | | (2,862,834) | |
| | | | | | | | | | | | | | | | | | | | (2,797,132) | |
| | | | | |
| Contracts to Sell: | | | | | | | | | | | | | | | | | | | | |
| U.S. Treasury 2-Year Notes | | | 176 | | | | 9/13 | | | $ | 38,752,209 | | | $ | 38,720,000 | | | $ | 32,209 | |
| U.S. Treasury 10-Year Notes | | | 9,067 | | | | 9/13 | | | | 1,176,137,627 | | | | 1,147,542,188 | | | | 28,595,439 | |
| U.S. Treasury Ultra Long-Term Bonds | | | 443 | | | | 9/13 | | | | 67,625,279 | | | | 65,259,438 | | | | 2,365,841 | |
| U.S. Treasury Ultra Long-Term Bonds | | | 867 | | | | 9/13 | | | | 121,764,409 | | | | 117,776,531 | | | | 3,987,878 | |
| | | | | | | | | | | | | | | | | | | | 34,981,367 | |
| Net unrealized gain on open futures contracts | | | $ | 32,184,235 | |
| | |
| 74 | | Western Asset Core Plus Bond Fund 2013 Semi-Annual Report |
During the six months ended June 30, 2013, written option transactions for the Fund were as follows:
| | | | | | | | |
| | | Number of Contracts/
Notional Amount/
Notional Par | | | Premiums | |
| Written options, outstanding as of December 31, 2012 | | | 249,400,000 | | | $ | 15,088,700 | |
| Options written | | | 106,839,774 | | | | 4,106,185 | |
| Options closed | | | (1,266,970) | | | | (1,843,359) | |
| Options exercised | | | (105,570,706) | | | | (1,885,207) | |
| Options expired | | | (2,098) | | | | (377,619) | |
| Written options, outstanding as of June 30, 2013 | | | 249,400,000 | | | $ | 15,088,700 | |
At June 30, 2013, the Fund held TBA securities with a total cost of $1,343,104,021.
At June 30, 2013, the Fund had the following open forward foreign currency contracts:
| | | | | | | | | | | | | | | | | | |
| Foreign Currency | | Counterparty | | Local
Currency | | | Market
Value | | | Settlement
Date | | | Unrealized
Gain (Loss) | |
| Contracts to Buy: | | | | | | | | | | | | | | | | | | |
| Philippine Peso | | Citibank N.A. | | | 2,282,000,000 | | | $ | 52,799,915 | | | | 8/2/13 | | | $ | (2,698,893) | |
| Euro | | Credit Suisse First Boston Inc. | | | 30,388,132 | | | | 39,562,637 | | | | 8/16/13 | | | | (313,460) | |
| Japanese Yen | | Citibank N.A. | | | 10,029,150,000 | | | | 101,140,337 | | | | 8/16/13 | | | | 108,781 | |
| Japanese Yen | | Citibank N.A. | | | 119,700,000 | | | | 1,207,131 | | | | 8/16/13 | | | | 16,785 | |
| | | | | | | | | | | | | | | | | | (2,886,787) | |
| Contracts to Sell: | | | | | | | | | | | | | | | | | | |
| British Pound | | Citibank N.A. | | | 64,520,000 | | | | 98,100,351 | | | | 8/16/13 | | | | 1,875,002 | |
| Euro | | Citibank N.A. | | | 71,598,951 | | | | 93,215,446 | | | | 8/16/13 | | | | 809,728 | |
| Euro | | Goldman Sachs Group Inc. | | | 42,250,000 | | | | 55,005,730 | | | | 8/16/13 | | | | 494,715 | |
| Euro | | JPMorgan Chase & Co. | | | 50,815,000 | | | | 66,156,596 | | | | 8/16/13 | | | | 483,719 | |
| Euro | | Morgan Stanley Co. Inc. | | | 63,690,000 | | | | 82,918,698 | | | | 8/16/13 | | | | 735,570 | |
| Japanese Yen | | Barclays Bank PLC | | | 5,281,922,000 | | | | 53,266,266 | | | | 8/16/13 | | | | 220,468 | |
| Japanese Yen | | Citibank N.A. | | | 7,658,600,000 | | | | 77,234,201 | | | | 8/16/13 | | | | (404,266) | |
| Japanese Yen | | Citibank N.A. | | | 12,896,776,000 | | | | 130,059,304 | | | | 8/16/13 | | | | 468,921 | |
| | | | | | | | | | | | | | | | | | 4,683,857 | |
| Net unrealized gain on open forward foreign currency contracts | | | | | | | $ | 1,797,070 | |
At June 30, 2013, the Fund held the following open OTC swap contracts:
| | | | | | | | | | | | | | | | | | | | | | |
| INTEREST RATE SWAPS | |
| Swap Counterparty | | Notional
Amount | | | Termination
Date | | | Payments
Made By
The Fund† | | Payments
Received By
The Fund† | | | Upfront
Premiums
Paid
(Received) | | | Unrealized
Appreciation
(Depreciation) | |
| Banc of America Securities LLC | | $ | 5,510,000 | | | | 12/16/13 | | | 5.381% semi-annually | | | 3-Month LIBOR | | | | — | | | $ | (130,579) | |
| Banc of America Securities LLC | | | 7,950,000 | | | | 11/10/15 | | | 4.864% semi-annually | | | 3-Month LIBOR | | | | — | | | | (799,313) | |
| Banc of America Securities LLC | | | 5,500,000 | | | | 1/15/16 | | | 5.451% semi-annually | | | 3-Month LIBOR | | | | — | | | | (669,270) | |
| Banc of America Securities LLC | | | 8,270,000 | | | | 10/3/16 | | | 5.425% semi-annually | | | 3-Month LIBOR | | | | — | | | | (1,211,303) | |
| Credit Suisse | | | 5,300,000 | | | | 8/15/13 | | | 5.023% semi-annually | | | 3-Month LIBOR | | | | — | | | | (32,790) | |
| Credit Suisse | | | 6,630,000 | | | | 3/15/14 | | | 5.131% semi-annually | | | 3-Month LIBOR | | | | — | | | | (229,081) | |
| | |
| Western Asset Core Plus Bond Fund 2013 Semi-Annual Report | | 75 |
Notes to financial statements (unaudited) (cont’d)
| | | | | | | | | | | | | | | | | | | | | | |
| INTEREST RATE SWAPS | |
| Swap Counterparty | | Notional
Amount | | | Termination
Date | | | Payments
Made By
The Fund† | | Payments
Received By
The Fund† | | | Upfront
Premiums
Paid
(Received) | | | Unrealized
Appreciation
(Depreciation) | |
| Credit Suisse | | $ | 5,350,000 | | | | 9/15/15 | | | 5.160% semi-annually | | | 3-Month LIBOR | | | | — | | | $ | (543,578) | |
| Credit Suisse | | | 4,880,000 | | | | 3/1/17 | | | 5.335% semi-annually | | | 3-Month LIBOR | | | | — | | | | (759,131) | |
| Deutsche Bank AG | | | 10,890,000 | | | | 6/15/16 | | | 5.183% semi-annually | | | 3-Month LIBOR | | | | — | | | | (1,408,132) | |
| Deutsche Bank AG | | | 8,270,000 | | | | 4/1/17 | | | 5.435% semi-annually | | | 3-Month LIBOR | | | | — | | | | (1,337,034) | |
| JPMorgan Chase & Co. | | | 8,250,000 | | | | 9/15/14 | | | 5.000% semi-annually | | | 3-Month LIBOR | | | | — | | | | (461,784) | |
| RBS Greenwich | | | 8,230,000 | | | | 3/1/16 | | | 5.120% semi-annually | | | 3-Month LIBOR | | | | — | | | | (969,570) | |
| Total | | $ | 85,030,000 | | | | | | | | | | | | | | — | | | $ | (8,551,565) | |
| | | | | | | | | | | | | | | | | | | | | | | | |
| CREDIT DEFAULT SWAPS ON CORPORATE ISSUES — SELL PROTECTION1 | |
Swap Counterparty
(Reference Entity) | | Notional
Amount2 | | | Termination
Date | | | Implied
Credit
Spread At
June 30,
20133 | | Periodic
Payments
Received By
The Fund† | | Market
Value | | | Upfront
Premiums
Paid
(Received) | | | Unrealized
Appreciation
(Depreciation) | |
Banc of America Securities LLC (AES Corp.,
7.750%, due 3/1/14) | | $ | 5,600,000 | | | | 3/20/17 | | | 2.00% | | 2.800% quarterly | | $ | 161,143 | | | | — | | | $ | 161,143 | |
Banc of America Securities LLC (AES Corp.,
7.750%, due 3/1/14) | | | 3,600,000 | | | | 3/20/17 | | | 2.00% | | 2.600% quarterly | | | 77,847 | | | | — | | | | 77,847 | |
Deutsche Bank AG (AES Corp.,
7.750%, due 3/1/14) | | | 2,500,000 | | | | 12/20/16 | | | 1.81% | | 2.200% quarterly | | | 32,453 | | | | — | | | | 32,453 | |
Deutsche Bank AG (AES Corp.,
7.750%, due 3/1/14) | | | 1,700,000 | | | | 12/20/16 | | | 1.81% | | 2.210% quarterly | | | 22,640 | | | | — | | | | 22,640 | |
Deutsche Bank AG (Ford Motor Credit Co.,
5.000%, due 5/15/18) | | | 4,450,000 | | | | 9/20/17 | | | 1.38% | | 3.650% quarterly | | | 406,027 | | | | — | | | | 406,027 | |
Deutsche Bank AG (Ford Motor Credit Co.,
5.000%, due 5/15/18) | | | 3,500,000 | | | | 9/20/17 | | | 1.38% | | 3.650% quarterly | | | 319,347 | | | | — | | | | 319,347 | |
Deutsche Bank AG (Ford Motor Credit Co.,
7.450%, due 7/16/31) | | | 2,600,000 | | | | 3/20/15 | | | 0.67% | | 2.930% quarterly | | | 101,476 | | | | — | | | | 101,476 | |
Deutsche Bank AG (MetLife Inc.,
5.000%, due 6/15/15) | | | 19,810,000 | | | | 6/20/18 | | | 1.24% | | 1.000% quarterly | | | (225,885) | | | $ | (588,159) | | | | 362,274 | |
| Goldman Sachs Group Inc. (Ford Motor Credit Co., 7.000%, due 10/1/13) | | | 6,400,000 | | | | 9/20/17 | | | 1.38% | | 3.770% quarterly | | | 614,849 | | | | — | | | | 614,849 | |
RBS Greenwich (Ally Financial Inc.,
7.500%, due 9/15/20) | | | 4,200,000 | | | | 12/20/16 | | | 2.03% | | 1.550% quarterly | | | (66,494) | | | | — | | | | (66,494) | |
| Total | | $ | 54,360,000 | | | | | | | | | | | $ | 1,443,403 | | | $ | (588,159) | | | $ | 2,031,562 | |
| | |
| 76 | | Western Asset Core Plus Bond Fund 2013 Semi-Annual Report |
| | | | | | | | | | | | | | | | | | | | | | | | |
| CREDIT DEFAULT SWAPS ON CORPORATE ISSUES — BUY PROTECTION4 | |
Swap Counterparty
(Reference Entity) | | Notional
Amount 2 | | | Termination
Date | | | Implied
Credit
Spread At
June 30,
20133 | | Periodic
Payments
Made By
The Fund† | | Market
Value | | | Upfront
Premiums
Paid
(Received) | | | Unrealized
Appreciation
(Depreciation) | |
Banc of America Securities LLC (Home Depot Inc.,
5.875%, due 12/16/36) | | $ | 5,510,000 | | | | 12/20/13 | | | 0.05% | | 0.635% quarterly | | $ | (15,600) | | | | — | | | $ | (15,600) | |
Banc of America Securities LLC (Marriot International Inc.,
5.810%, due 11/10/15) | | | 7,950,000 | | | | 12/20/15 | | | 0.26% | | 0.730% monthly | | | (91,991) | | | | — | | | | (91,991) | |
Banc of America Securities LLC (Masco Corp.,
6.125%, due 10/3/16) | | | 8,270,000 | | | | 12/20/16 | | | 1.38% | | 1.040% quarterly | | | 95,718 | | | | — | | | | 95,718 | |
Banc of America Securities LLC (Viacom Inc.,
4.625%, due 5/15/18) | | | 5,500,000 | | | | 12/20/15 | | | 0.32% | | 1.130% quarterly | | | (110,195) | | | | — | | | | (110,195) | |
Credit Suisse (AmerisourceBergen Corp.,
5.875%, due 9/15/15) | | | 5,350,000 | | | | 9/20/15 | | | 0.21% | | 0.900% quarterly | | | (82,850) | | | | — | | | | (82,850) | |
Credit Suisse (Masco Corp.,
6.125%, due 10/3/16) | | | 5,830,000 | | | | 9/20/13 | | | 0.34% | | 0.750% quarterly | | | (5,522) | | | | — | | | | (5,522) | |
Credit Suisse (Southwest Airlines Co.,
5.250%, due 10/1/14) | | | 4,880,000 | | | | 3/20/17 | | | 0.76% | | 0.690% quarterly | | | 13,277 | | | | — | | | | 13,277 | |
Credit Suisse (Waste Management Inc.,
5.000%, due 3/15/14) | | | 6,630,000 | | | | 3/20/14 | | | 0.11% | | 0.490% quarterly | | | (18,671) | | | | — | | | | (18,671) | |
Deutsche Bank AG (AutoZone Inc.,
6.950%, due 6/15/16) | | | 10,890,000 | | | | 6/20/16 | | | 0.27% | | 0.580% quarterly | | | (99,273) | | | | — | | | | (99,273) | |
Deutsche Bank AG (CenturyLink Inc.,
6.000%, due 4/1/17) | | | 8,270,000 | | | | 3/20/17 | | | 1.57% | | 0.890% quarterly | | | 202,469 | | | | — | | | | 202,469 | |
JPMorgan Chase & Co. (Bell South Corp.,
6.000%, due 11/15/34) | | | 8,250,000 | | | | 9/20/14 | | | 0.07% | | 0.280% quarterly | | | (21,341) | | | | — | | | | (21,341) | |
RBS Greenwich (Home Depot Inc.,
5.400%, due 3/1/16) | | | 8,230,000 | | | | 3/20/16 | | | 0.18% | | 0.480% monthly | | | (67,438) | | | | — | | | | (67,438) | |
| Total | | $ | 85,560,000 | | | | | | | | | | | $ | (201,417) | | | | — | | | $ | (201,417) | |
| | |
| Western Asset Core Plus Bond Fund 2013 Semi-Annual Report | | 77 |
Notes to financial statements (unaudited) (cont’d)
| | | | | | | | | | | | | | | | | | | | | | |
| CREDIT DEFAULT SWAPS ON CREDIT INDICES — SELL PROTECTION1 | |
Swap Counterparty
(Reference Entity) | | Notional
Amount2 | | | Termination
Date | | | Periodic
Payments
Received By
The Fund† | | Market
Value5 | | | Upfront
Premiums
Paid
(Received) | | | Unrealized
Appreciation
(Depreciation) | |
| Deutsche Bank AG (iBoxx.IG.Hi-Vol2) | | $ | 8,330,933 | | | | 9/20/14 | | | 1.300% quarterly | | $ | 61,286 | | | $ | 5,753 | | | $ | 55,533 | |
| Morgan Stanley & Co. Inc. (PrimeX.ARM.1) | | | 2,302,895 | | | | 6/25/36 | | | 4.420% monthly | | | 233,168 | | | | 55,647 | | | | 177,521 | |
| Morgan Stanley & Co. Inc. (PrimeX.ARM.1) | | | 2,302,895 | | | | 6/25/36 | | | 4.420% monthly | | | 233,168 | | | | 45,529 | | | | 187,639 | |
| Total | | $ | 12,936,723 | | | | | | | | | $ | 527,622 | | | $ | 106,929 | | | $ | 420,693 | |
| | | | | | | | | | | | | | | | | | | | | | |
| CREDIT DEFAULT SWAPS ON CREDIT INDICES — BUY PROTECTION4 | |
Swap Counterparty
(Reference Entity) | | Notional
Amount2 | | | Termination
Date | | | Periodic
Payments
Made By
The Fund† | | Market
Value5 | | | Upfront
Premiums
Paid
(Received) | | | Unrealized
Appreciation
(Depreciation) | |
| BNP Paribas (Markit ITRX EUR) | | $ | 28,000,000 | | | | 6/20/18 | | | 1.000% quarterly | | | $1,153,207 | | | $ | 996,756 | | | $ | 156,451 | |
| BNP Paribas (Markit ITRX EUR) | | | 14,600,000 | | | | 6/20/18 | | | 1.000% quarterly | | | 601,315 | | | | 595,050 | | | | 6,265 | |
| Total | | $ | 42,600,000 | | | | | | | | | | $1,754,522 | | | $ | 1,591,806 | | | $ | 162,716 | |
|
| TOTAL RETURN SWAPS | |
| Swap Counterparty | | Notional
Amount | | | Termination
Date | | | Periodic
Payments
Made By
The Fund† | | Periodic
Payments
Received By
The Fund‡ | | | Upfront
Premiums
Paid
(Received) | | | Unrealized
Appreciation
(Depreciation) | |
| Barclays Capital Inc. | | $ | 2,613,585 | | | | 1/12/41 | | | 1-Month LIBOR | | | IOS.FN30.400.10 | | | | $(476) | | | | $52,045 | |
| 1 | If the Fund is a seller of protection and a credit event occurs, as defined under the terms of that particular swap agreement, the Fund will either (i) pay to the buyer of protection an amount equal to the notional amount of the swap and take delivery of the referenced obligation or underlying securities comprising the referenced index or (ii) pay a net settlement amount in the form of cash or securities equal to the notional amount of the swap less the recovery value of the referenced obligation or underlying securities comprising the referenced index. |
| 2 | The maximum potential amount the Fund could be required to pay as a seller of credit protection or receive as a buyer of credit protection if a credit event occurs as defined under the terms of that particular swap agreement. |
| 3 | Implied credit spreads, utilized in determining the market value of credit default swap agreements on corporate issues or sovereign issues of an emerging country as of period end serve as an indicator of the current status of the payment/performance risk and represent the likelihood or risk of default for the credit derivative. The implied credit spread of a particular referenced entity reflects the cost of buying/selling protection and may include upfront payments required to be made to enter into the agreement. Wider credit spreads represent a deterioration of the referenced entity’s credit soundness and a greater likelihood or risk of default or other credit event occurring as defined under the terms of the agreement. A credit spread identified as “Defaulted” indicates a credit event has occurred for the referenced entity or obligation. |
| 4 | If the Fund is a buyer of protection and a credit event occurs, as defined under the terms of that particular swap agreement, the Fund will either (i) receive from the seller of protection an amount equal to the notional amount of the swap and deliver the referenced obligation or the underlying securities comprising the referenced index or (ii) receive a net settlement amount in the form of cash or securities equal to the notional amount of the swap less the recovery value of the referenced obligation or the underlying securities comprising the referenced index. |
| | |
| 78 | | Western Asset Core Plus Bond Fund 2013 Semi-Annual Report |
| 5 | The quoted market prices and resulting values for credit default swap agreements on asset-backed securities and credit indices serve as an indicator of the current status of the payment/performance risk and represent the likelihood of an expected liability (or profit) for the credit derivative should the notional amount of the swap agreement be closed/sold as of the period end. Decreasing market values (sell protection) or increasing market values (buy protection) when compared to the notional amount of the swap, represent a deterioration of the referenced entity’s credit soundness and a greater likelihood or risk of default or other credit event occurring as defined under the terms of the agreement. |
| † | Percentage shown is an annual percentage rate. |
| ‡ | Periodic payments made/received by the Fund are based on the total return of the referenced entity. |
At June 30, 2013, the Fund held collateral received from Goldman Sachs Group Inc., Morgan Stanley & Co. Inc. and BNP Paribas, in the amounts of $763,366, $607,877 and $1,803,458 on credit default swap contracts valued at $614,849, $466,336 and $1,754,522, respectively. Net exposures to the counterparties were $(148,517), $(141,541) and $(48,936), respectively. Net exposure represents the net receivable/payable that would be due from/to the counterparty in the event of default.
4. Derivative instruments and hedging activities
GAAP requires enhanced disclosure about an entity’s derivative and hedging activities.
Below is a table, grouped by derivative type, that provides information about the fair value and the location of derivatives within the Statement of Assets and Liabilities at June 30, 2013.
| | | | | | | | | | | | | | | | |
| ASSET DERIVATIVES1 | |
| | | Interest
Rate Risk | | | Foreign
Exchange Risk | | | Credit Risk | | | Total | |
| Purchased options2 | | | — | | | $ | 1,161,260 | | | | — | | | $ | 1,161,260 | |
| Futures contracts3 | | $ | 35,281,660 | | | | — | | | | — | | | | 35,281,660 | |
| OTC swap contracts4 | | | 51,569 | | | | — | | | $ | 4,329,390 | | | | 4,380,959 | |
| Forward foreign currency contracts | | | — | | | | 5,213,689 | | | | — | | | | 5,213,689 | |
| Total | | $ | 35,333,229 | | | $ | 6,374,949 | | | $ | 4,329,390 | | | $ | 46,037,568 | |
| | | | | | | | | | | | | | | | |
| LIABILITY DERIVATIVES1 | |
| | | Interest
Rate Risk | | | Foreign
Exchange Risk | | | Credit Risk | | | Total | |
| Written options | | $ | 23,477,507 | | | | — | | | | — | | | $ | 23,477,507 | |
| Futures contracts3 | | | 3,097,425 | | | | — | | | | — | | | | 3,097,425 | |
| OTC swap contracts4 | | | 8,551,565 | | | | — | | | $ | 805,260 | | | | 9,356,825 | |
| Forward foreign currency contracts | | | — | | | $ | 3,416,619 | | | | — | | | | 3,416,619 | |
| Total | | $ | 35,126,497 | | | $ | 3,416,619 | | | $ | 805,260 | | | $ | 39,348,376 | |
| 1 | Generally, the balance sheet location for asset derivatives is receivables/net unrealized appreciation (depreciation) and for liability derivatives is payables/net unrealized appreciation (depreciation). |
| 2 | Market value of purchased options is reported in Investments at value in the Statement of Assets and Liabilities. |
| 3 | Includes cumulative appreciation (depreciation) of futures contracts as reported in the footnotes. Only variation margin is reported within the receivables and/or payables on the Statement of Assets and Liabilities. |
| 4 | Values include premiums paid (received) on swap contracts which are shown seperately in the Statement of Assets and Liabilities. |
| | |
| Western Asset Core Plus Bond Fund 2013 Semi-Annual Report | | 79 |
Notes to financial statements (unaudited) (cont’d)
The following tables provide information about the effect of derivatives and hedging activities on the Fund’s Statement of Operations for the six months ended June 30, 2013. The first table provides additional detail about the amounts and sources of gains (losses) realized on derivatives during the period. The second table provides additional information about the change in unrealized appreciation (depreciation) resulting from the Fund’s derivatives and hedging activities during the period.
| | | | | | | | | | | | | | | | |
| AMOUNT OF REALIZED GAIN (LOSS) ON DERIVATIVES RECOGNIZED | |
| | | Interest Rate
Risk | | | Foreign
Exchange Risk | | | Credit Risk | | | Total | |
| Purchased options1 | | $ | (1,817,218) | | | | — | | | | — | | | $ | (1,817,218) | |
| Written options | | | 1,388,332 | | | $ | 20,818 | | | | — | | | | 1,409,150 | |
| Futures contracts | | | 40,729,017 | | | | — | | | | — | | | | 40,729,017 | |
| OTC swap contracts | | | (1,971,710) | | | | — | | | $ | (7,452,874) | | | | (9,424,584) | |
| Forward foreign currency contracts | | | — | | | | 19,780,137 | | | | — | | | | 19,780,137 | |
| Total | | $ | 38,328,421 | | | $ | 19,800,955 | | | $ | (7,452,874) | | | $ | 50,676,502 | |
| 1 | Net realized gain (loss) from purchased options is reported in net realized gain (loss) from investment transactions in the Statement of Operations. |
| | | | | | | | | | | | | | | | |
| CHANGE IN UNREALIZED APPRECIATION (DEPRECIATION) ON DERIVATIVES RECOGNIZED | |
| | | Interest Rate
Risk | | | Foreign
Exchange Risk | | | Credit Risk | | | Total | |
| Purchased options1 | | $ | 694,375 | | | $ | (1,310,288) | | | | — | | | $ | (615,913) | |
| Written options | | | 9,353,967 | | | | — | | | | — | | | | 9,353,967 | |
| Futures contracts | | | 27,634,020 | | | | — | | | | — | | | | 27,634,020 | |
| OTC swap contracts | | | 2,492,599 | | | | — | | | $ | 2,633,778 | | | | 5,126,377 | |
| Forward foreign currency contracts | | | — | | | $ | 4,555,141 | | | | — | | | | 4,555,141 | |
| Total | | $ | 40,174,961 | | | $ | 3,244,853 | | | $ | 2,633,778 | | | $ | 46,053,592 | |
| 1 | The change in unrealized appreciation (depreciation) from purchased options is reported in the change in net unrealized from investments in the Statement of Operations. |
During the six months ended June 30, 2013, the volume of derivative activity for the Fund was as follows:
| | | | |
| | | Average Market
Value | |
| Purchased options | | $ | 992,749 | |
| Written options | | | 30,817,520 | |
| Futures contracts (to buy) | | | 634,847,097 | |
| Futures contracts (to sell) | | | 2,081,684,643 | |
| Forward foreign currency contracts (to buy) | | | 153,189,093 | |
| Forward foreign currency contracts (to sell) | | | 625,812,311 | |
| |
| | | Average Notional
Balance | |
| Interest rate swap contracts | | $ | 85,030,000 | |
| Credit default swap contracts (to buy protection) | | | 226,730,555 | |
| Credit default swap contracts (to sell protection) | | | 102,493,676 | |
| Total return swap contracts | | | 2,879,481 | |
| | |
| 80 | | Western Asset Core Plus Bond Fund 2013 Semi-Annual Report |
The following table presents by financial instrument, the Fund’s derivative assets net of the related collateral held by the Fund at June 30, 2013:
| | | | | | | | | | | | |
| | | Gross Amount of
Derivative Assets in the
Statement of Assets
and Liabilities1 | | | Collateral Received2,3 | | | Net Amount | |
| Purchased options4 | | $ | 1,161,260 | | | | — | | | $ | 1,161,260 | |
| OTC swap contracts | | | 4,380,959 | | | $ | (3,174,701) | | | | 1,545,252 | |
| Forward foreign currency contracts | | | 5,213,689 | | | | — | | | | 5,213,689 | |
| Total | | $ | 10,755,908 | | | $ | (3,174,701) | | | $ | 7,920,201 | |
The following table presents by financial instrument, the Fund’s derivative liabilities net of the related collateral pledged by the Fund at June 30, 2013:
| | | | | | | | | | | | |
| | | Gross Amount of
Derivative Liabilities in
the Statement of Assets
and Liabilities1 | | | Collateral Pledged2,3,5 | | | Net Amount | |
| Written options | | $ | 23,477,507 | | | | — | | | $ | 23,477,507 | |
| Futures contracts6 | | | 189,648 | | | $ | (189,648) | | | | — | |
| OTC swap contracts | | | 9,356,825 | | | | (9,356,825) | | | | — | |
| Forward foreign currency contracts | | | 3,416,619 | | | | — | | | | 3,416,619 | |
| Total | | $ | 36,440,599 | | | $ | (9,546,473) | | | $ | 26,894,126 | |
| 1 | Absent an event of default or early termination, derivative assets and liabilities are presented gross and not offset in the Statement of Assets and Liabilities. |
| 2 | Gross amounts not offset in the Statement of Assets and Liabilities. |
| 3 | In some instances, the actual collateral received and/or pledged may be more than the amount shown here due to over collateralization. |
| 4 | Market value of purchased options is shown in Investments at value in the Statement of Assets and Liabilities. |
| 5 | See the accompanying Schedule of Investments for securities pledged as collateral for certain derivatives. |
| 6 | Amount represents the current day’s variation margin as reported in the Statement of Assets and Liabilities. It differs from the cumulative appreciation (depreciation) presented in the previous table. |
5. Class specific expenses, waivers and/or expense reimbursements
The Fund has adopted a Rule 12b-1 distribution plan and under that plan the Fund pays a service and/or distribution fee with respect to its Class A, Class C, Class C1, Class FI and Class R shares calculated at the annual rate of 0.25%, 1.00%, 0.70%, 0.25% and 0.50% of the average daily net assets of each class respectively. Service and distribution fees are accrued daily and paid monthly.
The Rule 12b-1 plan for Class FI shares provides for payment of distribution and service fees to LMIS at an annual rate of up to 0.40% of the Class’ average net assets, subject to the authority of the Board of Directors of the Corporation to set a lower amount. The Board of Directors has currently approved payments under the plan of 0.25% of the average daily net assets of Class FI shares.
| | |
| Western Asset Core Plus Bond Fund 2013 Semi-Annual Report | | 81 |
Notes to financial statements (unaudited) (cont’d)
For the six months ended June 30, 2013, class specific expenses were as follows:
| | | | | | | | |
| | | Service and/or
Distribution Fees | | | Transfer Agent
Fees | |
| Class A | | $ | 201,571 | | | $ | 100,170 | |
| Class C | | | 45,544 | | | | 3,317 | |
| Class C1 | | | 147,866 | | | | 26,832 | |
| Class FI | | | 3,769,946 | | | | 1,692,353 | |
| Class R | | | 857 | | | | 816 | |
| Class I | | | — | | | | 1,819,446 | |
| Class IS | | | — | | | | 5,947 | |
| Total | | $ | 4,165,784 | | | $ | 3,648,881 | |
For the six months ended June 30, 2013, waivers and/or expense reimbursements by class were as follows:
| | | | |
| | | Waivers/Expense
Reimbursements | |
| Class A | | | — | |
| Class C | | | — | |
| Class C1 | | | — | |
| Class FI | | $ | 558,497 | |
| Class R | | | 438 | |
| Class I | | | — | |
| Class IS | | | — | |
| Total | | $ | 558,935 | |
6. Distributions to shareholders by class
| | | | | | | | |
| | | Six Months Ended
June 30, 2013 | | | Year Ended
December 31, 2012 | |
| Net Investment Income: | | | | | | | | |
| Class A | | $ | 2,111,963 | | | $ | 1,039,502 | † |
| Class C | | | 87,353 | | | | 20,969 | † |
| Class C1 | | | 457,776 | | | | 250,930 | ‡ |
| Class FI | | | 40,251,978 | | | | 74,355,645 | |
| Class R | | | 3,884 | | | | 2,700 | † |
| Class I | | | 69,105,648 | | | | 151,279,623 | |
| Class IS | | | 36,497,479 | | | | 72,985,741 | |
| Total | | $ | 148,516,081 | | | $ | 299,935,110 | |
| † | For the period April 30, 2012 (commencement of operations) to December 31, 2012. |
| ‡ | For the period October 4, 2012 (commencement of operations) to December 31, 2012. |
| | |
| 82 | | Western Asset Core Plus Bond Fund 2013 Semi-Annual Report |
7. Capital shares
At June 30, 2013, the Corporation had 37.5 billion shares of capital stock authorized with a par value of $0.001 per share. Transactions in shares of each class were as follows:
| | | | | | | | | | | | | | | | |
| | | Six Months Ended
June 30, 2013 | | | Year Ended
December 31, 2012 | |
| | | Shares | | | Amount | | | Shares | | | Amount | |
| Class A | | | | | | | | | | | | | | | | |
| Shares sold | | | 2,418,362 | | | $ | 28,125,573 | | | | 1,299,525 | † | | $ | 15,174,951 | † |
| Shares issued on reinvestment | | | 176,048 | | | | 2,038,146 | | | | 83,837 | † | | | 979,161 | † |
| Shares repurchased | | | (2,661,512) | | | | (30,744,358) | | | | (618,466) | † | | | (7,224,069) | † |
| Shares issued with merger | | | — | | | | — | | | | 13,132,170 | † | | | 153,031,841 | † |
| Net increase (decrease) | | | (67,102) | | | $ | (580,639) | | | | 13,897,066 | † | | $ | 161,961,884 | † |
| | | | |
| Class C | | | | | | | | | | | | | | | | |
| Shares sold | | | 591,982 | | | $ | 6,890,572 | | | | 498,969 | † | | $ | 5,827,359 | † |
| Shares issued on reinvestment | | | 5,856 | | | | 67,711 | | | | 1,526 | † | | | 17,829 | † |
| Shares repurchased | | | (91,246) | | | | (1,056,338) | | | | (84,209) | † | | | (983,983) | † |
| Shares issued with merger | | | — | | | | — | | | | 110,133 | † | | | 1,284,085 | † |
| Net increase | | | 506,592 | | | $ | 5,901,945 | | | | 526,419 | † | | $ | 6,145,290 | † |
| | | | |
| Class C1 | | | | | | | | | | | | | | | | |
| Shares sold | | | 10,569 | | | $ | 123,060 | | | | 23,894 | ‡ | | $ | 278,366 | ‡ |
| Shares issued on reinvestment | | | 36,171 | | | | 418,525 | | | | 19,608 | ‡ | | | 228,871 | ‡ |
| Shares repurchased | | | (432,195) | | | | (5,003,457) | | | | (92,419) | ‡ | | | (1,079,158) | ‡ |
| Shares issued with merger | | | — | | | | — | | | | 3,893,171 | ‡ | | | 45,351,318 | ‡ |
| Net increase (decrease) | | | (385,455) | | | $ | (4,461,872) | | | | 3,844,254 | ‡ | | $ | 44,779,397 | ‡ |
| | | | |
| Class FI | | | | | | | | | | | | | | | | |
| Shares sold | | | 39,556,069 | | | $ | 459,597,091 | | | | 86,652,827 | | | $ | 991,205,097 | |
| Shares issued on reinvestment | | | 3,473,030 | | | | 40,208,312 | | | | 6,459,710 | | | | 74,278,600 | |
| Shares repurchased | | | (26,142,303) | | | | (302,160,721) | | | | (32,784,487) | | | | (374,153,857) | |
| Net increase | | | 16,886,796 | | | $ | 197,644,682 | | | | 60,328,050 | | | $ | 691,329,840 | |
| | | | |
| Class R | | | | | | | | | | | | | | | | |
| Shares sold | | | 3,316 | | | $ | 38,435 | | | | 6,446 | † | | $ | 74,975 | † |
| Shares issued on reinvestment | | | 326 | | | | 3,765 | | | | 230 | † | | | 2,685 | † |
| Shares repurchased | | | (14,385) | | | | (167,296) | | | | (1,656) | † | | | (19,328) | † |
| Shares issued with merger | | | — | | | | — | | | | 33,636 | † | | | 391,578 | † |
| Net increase (decrease) | | | (10,743) | | | $ | (125,096) | | | | 38,656 | † | | $ | 449,910 | † |
| | | | |
| Class I | | | | | | | | | | | | | | | | |
| Shares sold | | | 54,083,604 | | | $ | 628,000,585 | | | | 95,556,669 | | | $ | 1,095,465,938 | |
| Shares issued on reinvestment | | | 5,370,705 | | | | 62,194,149 | | | | 11,602,591 | | | | 133,321,166 | |
| Shares repurchased | | | (68,689,480) | | | | (795,726,958) | | | | (120,952,343) | | | | (1,385,042,353) | |
| Shares issued with merger | | | — | | | | — | | | | 846,616 | | | | 9,869,950 | |
| Net decrease | | | (9,235,171) | | | $ | (105,532,224) | | | | (12,946,467) | | | $ | (146,385,299) | |
| | |
| Western Asset Core Plus Bond Fund 2013 Semi-Annual Report | | 83 |
Notes to financial statements (unaudited) (cont’d)
| | | | | | | | | | | | | | | | |
| | | Six Months Ended
June 30, 2013 | | | Year Ended
December 31, 2012 | |
| | | Shares | | | Amount | | | Shares | | | Amount | |
| Class IS | | | | | | | | | | | | | | | | |
| Shares sold | | | 26,999,527 | | | $ | 313,288,316 | | | | 45,612,814 | | | $ | 521,482,500 | |
| Shares issued on reinvestment | | | 2,775,521 | | | | 32,118,171 | | | | 5,643,413 | | | | 64,841,925 | |
| Shares repurchased | | | (28,052,067) | | | | (325,608,449) | | | | (33,619,677) | | | | (381,623,831) | |
| Net increase | | | 1,722,981 | | | $ | 19,798,038 | | | | 17,636,550 | | | $ | 204,700,594 | |
| † | For the period April 30, 2012 (commencement of operations) to December 31, 2012. |
| ‡ | For the period October 4, 2012 (commencement of operations) to December 31, 2012. |
8. Transfer of net assets
On October 5, 2012, the Fund acquired the assets and certain liabilities of the Legg Mason Western Asset Core Plus Bond Fund (the “Acquired Fund”), pursuant to a plan of reorganization approved by the Acquired Fund shareholders. Total shares issued by the Fund and the total net assets of the Acquired Fund and the Fund on the date of the transfer were as follows:
| | | | | | | | | | | | |
| Acquired Fund | | Shares Issued
by the Fund | | | Total Net Assets of the
Acquired Fund | | | Total Net Assets
of the Fund | |
| Legg Mason Western Asset Core Plus Bond Fund | | | 18,015,726 | | | $ | 209,928,772 | | | $ | 9,885,187,146 | |
As part of the reorganization, for each share they held, shareholders of the Acquired Fund Class A, Class C, Class C1, Class R and Class I received 1.156215, 1.155531, 1.156976, 1.159143 and 1.151423 shares of Class A, Class C, Class C1, Class R and Class I shares, respectively.
The total net assets of the Acquired Fund before acquisition included unrealized appreciation of $9,035,775, accumulated net realized loss of $15,057,366 and undistributed net investment income of $374,991. Total net assets of the Fund immediately after the transfer were $10,095,115,918. The transaction was structured to qualify as a tax-free reorganization under the Internal Revenue Code of 1986, as amended.
Proforma results of operations of the combined entity for the entire year ended December 31, 2012, as though the acquisition had occurred as of the beginning of the year (rather than on the actual acquisition date), are as follows:
| | | | |
| Net investment income | | $ | 290,423,374 | |
| Net realized loss | | | (23,191,651) | |
| Change in net unrealized appreciation | | | 511,370,009 | |
| Increase in net assets from operations | | $ | 778,601,732 | |
Because the combined investment portfolios have been managed as a single portfolio since the acquisition was completed, it is not practicable to separate the amounts of revenue and earnings of the Acquired Fund that have been included in the Fund’s accompanying Statement of Operations since the close of business on October 5, 2012.
| | |
| 84 | | Western Asset Core Plus Bond Fund 2013 Semi-Annual Report |
9. Capital loss carryforward
As of December 31, 2012, the Fund had the following net capital loss carryforwards remaining:
| | | | |
| Year of Expiration | | Amount | |
| 12/31/2013 | | $ | (7,513,499) | |
| 12/31/2014 | | | (808,003) | |
| 12/31/2017 | | | (380,024,017) | |
| | | $ | (388,345,519) | |
These amounts will be available to offset any future taxable capital gains. However, $8,321,502 of this amount is subject to an annual limitation as a result the reorganization discussed in Note 8.
10. Recent accounting pronouncement
The Fund has adopted the disclosure provisions of Financial Accounting Standards Board (“FASB”) Accounting Standards Update 2011-11 (“ASU 2011-11”), Balance Sheet (Topic 210) — Disclosures about Offsetting Assets and Liabilities along with the related scope clarification provisions of FASB Accounting Standards Update 2013-01 (“ASU 2013-01”) entitled Balance Sheet (Topic 210) — Clarifying the Scope of Disclosures about Offsetting Assets and Liabilities. ASU 2011-11 is intended to enhance disclosures on the offsetting of financial assets and liabilities by requiring entities to disclose both gross and net information about financial instruments and transactions that are either offset in the statement of assets and liabilities or subject to a master netting agreement or similar arrangement. ASU 2013-01 limits the scope of ASU 2011-11’s disclosure requirements on offsetting to financial assets and financial liabilities related to derivatives, repurchase and reverse repurchase agreements, and securities lending and securities borrowing transactions.
| | |
| Western Asset Core Plus Bond Fund 2013 Semi-Annual Report | | 85 |
Western Asset
Core Plus Bond Fund
Directors
William E. B. Siart, Chairman
Robert Abeles*
Ronald J. Arnault
Anita L. DeFrantz
Ronald L. Olson
Avedick B. Poladian
Jaynie M. Studenmund
Investment manager
Legg Mason Partners Fund Advisor, LLC
Investment advisers
Western Asset Management Company
Western Asset Management Company Limited
Western Asset Management Company Ltd.
Western Asset Management Company Pte. Ltd.
Transfer agent
Boston Financial Data Services
2000 Crown Colony Drive
Quincy, MA 02169
Custodian
State Street Bank and Trust Company
Independent registered public accounting firm
PricewaterhouseCoopers LLP
Baltimore, MD
Legal counsel
Ropes & Gray LLP
1211 Avenue of the Americas
New York, NY 10036
| * | Effective May 22, 2013, Mr. Abeles became a Director. |
Western Asset Core Plus Bond Fund
The Fund is a separate investment series of Western Asset Funds, Inc.
Western Asset Core Plus Bond Fund
Legg Mason Funds
620 Eighth Avenue, 49th Floor
New York, NY 10018
The Fund files its complete schedule of portfolio holdings with the Securities and Exchange Commission (“SEC”) for the first and third quarters of each fiscal year on Form N-Q. The Fund’s Forms N-Q are available on the SEC’s website at www.sec.gov. The Fund’s Forms N-Q may be reviewed and copied at the SEC’s Public Reference Room in Washington, D.C., and information on the operation of the Public Reference Room may be obtained by calling 1-800-SEC-0330. To obtain information on Form N-Q, shareholders can call the Fund at 1-877-721-1926.
Information on how the Fund voted proxies relating to portfolio securities during the prior 12-month period ended June 30th of each year and a description of the policies and procedures that the Fund uses to determine how to vote proxies related to portfolio transactions are available (1) without charge, upon request, by calling the Fund at 1-877-721-1926, (2) on the Fund’s website at www.leggmason.com/individualinvestors and (3) on the SEC’s website at www.sec.gov.
This report is submitted for the general information of the shareholders of Western Asset Core Plus Bond Fund. This report is not authorized for distribution to prospective investors in the Fund unless preceded or accompanied by a current prospectus.
Investors should consider the Fund’s investment objectives, risks, charges and expenses carefully before investing. The prospectus contains this and other important information about the Fund. Please read the prospectus carefully before investing.
www.leggmason.com/individualinvestors
©2013 Legg Mason Investor Services, LLC
Member FINRA, SIPC
Legg Mason Funds Privacy and Security Notice
Your Privacy and the Security of Your Personal Information is Very Important to the Legg Mason Funds
This Privacy and Security Notice (the “Privacy Notice”) addresses the Legg Mason Funds’ privacy and data protection practices with respect to nonpublic personal information the Funds receive. The Legg Mason Funds include any funds sold by the Funds’ distributor, Legg Mason Investor Services, LLC, as well as Legg Mason-sponsored closed-end funds and certain closed-end funds managed or sub-advised by Legg Mason or its affiliates. The provisions of this Privacy Notice apply to your information both while you are a shareholder and after you are no longer invested with the Funds.
The Type of Nonpublic Personal Information the Funds Collect About You
The Funds collect and maintain nonpublic personal information about you in connection with your shareholder account. Such information may include, but is not limited to:
| Ÿ | | Personal information included on applications or other forms; |
| Ÿ | | Account balances, transactions, and mutual fund holdings and positions; |
| Ÿ | | Online account access user IDs, passwords, security challenge question responses; and |
| Ÿ | | Information received from consumer reporting agencies regarding credit history and creditworthiness (such as the amount of an individual’s total debt, payment history, etc.). |
How the Funds Use Nonpublic Personal Information About You
The Funds do not sell or share your nonpublic personal information with third parties or with affiliates for their marketing purposes, or with other financial institutions or affiliates for joint marketing purposes, unless you have authorized the Funds to do so. The Funds do not disclose any nonpublic personal information about you except as may be required to perform transactions or services you have authorized or as permitted or required by law. The Funds may disclose information about you to:
| Ÿ | | Employees, agents, and affiliates on a “need to know” basis to enable the Funds to conduct ordinary business or comply with obligations to government regulators; |
| Ÿ | | Service providers, including the Funds’ affiliates, who assist the Funds as part of the ordinary course of business (such as printing, mailing services, or processing or servicing your account with us) or otherwise perform services on the Funds’ behalf, including companies that may perform marketing services solely for the Funds; |
| Ÿ | | The Funds’ representatives such as legal counsel, accountants and auditors; and |
| Ÿ | | Fiduciaries or representatives acting on your behalf, such as an IRA custodian or trustee of a grantor trust. |
|
| NOT PART OF THE SEMI-ANNUAL REPORT |
Legg Mason Funds Privacy and Security Notice (cont’d)
Except as otherwise permitted by applicable law, companies acting on the Funds’ behalf are contractually obligated to keep nonpublic personal information the Funds provide to them confidential and to use the information the Funds share only to provide the services the Funds ask them to perform.
The Funds may disclose nonpublic personal information about you when necessary to enforce their rights or protect against fraud, or as permitted or required by applicable law, such as in connection with a law enforcement or regulatory request, subpoena, or similar legal process. In the event of a corporate action or in the event a Fund service provider changes, the Funds may be required to disclose your nonpublic personal information to third parties. While it is the Funds’ practice to obtain protections for disclosed information in these types of transactions, the Funds cannot guarantee their privacy policy will remain unchanged.
Keeping You Informed of the Funds’ Privacy and Security Practices
The Funds will notify you annually of their privacy policy as required by federal law. While the Funds reserve the right to modify this policy at any time they will notify you promptly if this privacy policy changes.
The Funds’ Security Practices
The Funds maintain appropriate physical, electronic and procedural safeguards designed to guard your nonpublic personal information. The Funds’ internal data security policies restrict access to your nonpublic personal information to authorized employees, who may use your nonpublic personal information for Fund business purposes only.
Although the Funds strive to protect your nonpublic personal information, they cannot ensure or warrant the security of any information you provide or transmit to them, and you do so at your own risk. In the event of a breach of the confidentiality or security of your nonpublic personal information, the Funds will attempt to notify you as necessary so you can take appropriate protective steps. If you have consented to the Funds using electronic communications or electronic delivery of statements, they may notify you under such circumstances using the most current email address you have on record with them.
In order for the Funds to provide effective service to you, keeping your account information accurate is very important. If you believe that your account information is incomplete, not accurate or not current, or if you have questions about the Funds’ privacy practices, write the Funds using the contact information on your account statements, email the Funds by clicking on the Contact Us section of the Funds’ website at www.leggmason.com, or contact the Fund at 1-877-721-1926.
Revised April 2011
|
| NOT PART OF THE SEMI-ANNUAL REPORT |

Western Asset Management Company
Legg Mason, Inc. Subsidiaries
www.leggmason.com/individualinvestors
©2013 Legg Mason Investor Services, LLC Member FINRA, SIPC
WASX012826 8/13 SR13-2005
| | |
| ITEM 2. | | CODE OF ETHICS. |
| |
| | Not applicable. |
| |
| ITEM 3. | | AUDIT COMMITTEE FINANCIAL EXPERT. |
| |
| | Not applicable. |
| |
| ITEM 4. | | PRINCIPAL ACCOUNTANT FEES AND SERVICES. |
| |
| | Not applicable. |
| |
| ITEM 5. | | AUDIT COMMITTEE OF LISTED REGISTRANTS. |
| |
| | Not applicable. |
| |
| ITEM 6. | | SCHEDULE OF INVESTMENTS. |
| |
| | Included herein under Item 1. |
| |
| ITEM 7. | | DISCLOSURE OF PROXY VOTING POLICIES AND PROCEDURES FOR CLOSED-END MANAGEMENT INVESTMENT COMPANIES. |
| |
| | Not applicable. |
| |
| ITEM 8. | | PORTFOLIO MANAGERS OF CLOSED-END MANAGEMENT INVESTMENT COMPANIES. |
| |
| | Not applicable. |
| |
| ITEM 9. | | PURCHASES OF EQUITY SECURITIES BY CLOSED-END MANAGEMENT INVESTMENT COMPANY AND AFFILIATED PURCHASERS. |
| |
| | Not applicable. |
| |
| ITEM 10. | | SUBMISSION OF MATTERS TO A VOTE OF SECURITY HOLDERS. |
| |
| | Not applicable. |
| |
| ITEM 11. | | CONTROLS AND PROCEDURES. |
| |
| | (a) The registrant’s principal executive officer and principal financial officer have concluded that the registrant’s disclosure controls and procedures (as defined in Rule 30a- 3(c) under the Investment Company Act of 1940, as amended (the “1940 Act”)) are effective as of a date within 90 days of the filing date of this report that includes the disclosure required by this paragraph, based on their evaluation of the disclosure controls and procedures required by Rule 30a-3(b) under the 1940 Act and 15d-15(b) under the Securities Exchange Act of 1934. |
| |
| | (b) There were no changes in the registrant’s internal control over financial reporting (as defined in Rule 30a-3(d) under the 1940 Act) that occurred during the second fiscal quarter of the period covered by this report that have materially affected, or are likely to materially affect the registrant’s internal control over financial reporting |
| | |
| ITEM 12. | | EXHIBITS. |
| |
| | (a) (1) Not applicable. |
| | Exhibit 99.CODE ETH |
| |
| | (a) (2) Certifications pursuant to section 302 of the Sarbanes-Oxley Act of 2002 attached hereto. |
| | Exhibit 99.CERT |
| |
| | (b) Certifications pursuant to Section 906 of the Sarbanes-Oxley Act of 2002 attached hereto. |
| | Exhibit 99.906CERT |
SIGNATURES
Pursuant to the requirements of the Securities Exchange Act of 1934 and the Investment Company Act of 1940, the registrant has duly caused this Report to be signed on its behalf by the undersigned, there unto duly authorized.
| | |
| Western Asset Funds, Inc. |
| |
| By: | | /s/ Kenneth D. Fuller |
| | Kenneth D. Fuller |
| | Chief Executive Officer |
| | Western Asset Funds, Inc. |
Date: August 23, 2013
Pursuant to the requirements of the Securities Exchange Act of 1934 and the Investment Company Act of 1940, this report has been signed below by the following persons on behalf of the registrant and in the capacities and on the dates indicated.
| | |
| By: | | /s/ Kenneth D. Fuller |
| | Kenneth D. Fuller |
| | Chief Executive Officer |
| | Western Asset Funds, Inc. |
Date: August 23, 2013
| | |
| By: | | /s/ Richard F. Sennett |
| | Richard F. Sennett |
| | Principal Financial Officer |
| | Western Asset Funds, Inc. |
Date: August 23, 2013