UNITED STATES
SECURITIES AND EXCHANGE COMMISSION
Washington, D.C. 20549
FORM N-CSR
CERTIFIED SHAREHOLDER REPORT OF REGISTERED
MANAGEMENT INVESTMENT COMPANIES
Investment Company Act file number 811-06110
Western Asset Funds, Inc.
(Exact name of registrant as specified in charter)
620 Eighth Avenue, 49th Floor, New York, NY 10018
(Address of principal executive offices) (Zip code)
Robert I. Frenkel, Esq.
Legg Mason & Co., LLC
100 First Stamford Place
Stamford, CT 06902
(Name and address of agent for service)
Registrant’s telephone number, including area code: 1-877-721-1926
Date of fiscal year end: October 31
Date of reporting period: October 31, 2014
| ITEM 1. | REPORT TO STOCKHOLDERS. |
The Annual Report to Stockholders is filed herewith.

| | |
| Annual Report | | October 31, 2014 |
WESTERN ASSET
ASIAN OPPORTUNITIES FUND

|
| INVESTMENT PRODUCTS: NOT FDIC INSURED • NO BANK GUARANTEE • MAY LOSE VALUE |
Fund objective
The Fund seeks to maximize total return through income and capital appreciation.
Letter from the president

Dear Shareholder,
We are pleased to provide the annual report of Western Asset Asian Opportunities Fund for the twelve-month reporting period ended October 31, 2014. Please read on for a detailed look at prevailing economic and market conditions during the Fund’s reporting period and to learn how those conditions have affected Fund performance.
As always, we remain committed to providing you with excellent service and a full spectrum of investment choices. We also remain committed to supplementing the support you receive from your financial advisor. One way we accomplish this is through our website, www.leggmason.com/individualinvestors. Here you can gain immediate access to market and investment information, including:
| Ÿ | | Fund prices and performance, |
| Ÿ | | Market insights and commentaries from our portfolio managers, and |
| Ÿ | | A host of educational resources. |
We look forward to helping you meet your financial goals.
Sincerely,

Kenneth D. Fuller
President and Chief Executive Officer
November 28, 2014
| | |
| II | | Western Asset Asian Opportunities Fund |
Investment commentary
Economic review
Since the end of the Great Recession, the U.S. economy has expanded at a slower than usual pace, compared to recent history. U.S. gross domestic product (“GDP”)i growth, as reported by the U.S. Department of Commerce’s revised figures, was 4.5% during the third quarter of 2013, its best reading since the fourth quarter of 2011. During the twelve months ended October 31, 2014 (the “reporting period”), the severe winter weather of January and February played a key role in a sharp reversal in the economy, a 2.1% contraction during the first quarter of 2014. This was the first negative GDP report in three years. Negative contributions were widespread: private inventory investment, exports, state and local government spending and nonresidential and residential fixed investment. Thankfully, this setback was very brief, as second quarter GDP growth was 4.6%, suggesting the recovery has some resilience and the economy continues to recover from the severe consequences of the Great Recession. The second quarter rebound in GDP growth was driven by several factors, including an acceleration in personal consumption expenditures (“PCE”), increased private inventory investment and exports, as well as an upturn in state and local government spending. After the reporting period ended, the Department of Commerce’s second estimate for third quarter GDP growth was 3.9%, driven by contributions from PCE, exports, nonresidential fixed investment and government spending.
The U.S. manufacturing sector continued to support the economy during the reporting period. Based on figures for the Institute for Supply Management’s Purchasing Managers’ Index (“PMI”)ii, U.S. manufacturing expanded during all twelve months of the reporting period (a reading below 50 indicates a contraction, whereas a reading above 50 indicates an expansion). After readings of 57.0 and 56.5 in November and December 2013, respectively, the PMI fell to 51.3 in January 2014, its weakest reading since May 2013. PMI then generally rose over the next several months, reaching a high of 59.0 in August, its best reading since March 2011. While PMI dipped to 56.6 in September, it rose back to 59.0 in October.
The U.S. job market improved during the reporting period. When the period began, unemployment, as reported by the U.S. Department of Labor, was 7.0%. Unemployment generally declined throughout the reporting period and reached a low of 5.8% in October 2014, the lowest level since July 2008.
Growth outside the U.S. was mixed in many countries. In its October 2014 World Economic Outlook, the International Monetary Fund (“IMF”) said “Despite setbacks, an uneven global recovery continues. In advanced economies, the legacies of the pre-crisis boom and the subsequent crisis, including high private and public debt, still cast a shadow on the recovery. Emerging markets are adjusting to rates of economic growth lower than those reached in the pre-crisis boom and the post-crisis recovery. Overall, the pace of recovery is becoming more country specific.” From a regional perspective, the IMF forecasts 2014 growth will be 0.8% in the Eurozone, versus -0.4% in 2013. Japan’s economy is projected to expand 0.9% in 2014, compared to 1.5% in 2013. Elsewhere the IMF projects that overall growth in emerging market countries will decelerate in 2014, with expected growth of 4.4% versus 4.7% in 2013.
| | |
| Western Asset Asian Opportunities Fund | | III |
Investment commentary (cont’d)
The Federal Reserve Board (“Fed”)iii took a number of actions as it sought to meet its dual mandate of fostering maximum employment and price stability. As it has since December 2008, the Fed kept the federal funds rateiv at a historically low range between zero and 0.25%. The Fed also took steps to end its asset purchase program that was announced in December 2012. At that time, the Fed said it would continue purchasing $40 billion per month of agency mortgage-backed securities (“MBS”), as well as $45 billion per month of longer-term Treasuries. Following the meeting that concluded on December 18, 2013, the Fed announced that it would begin reducing its monthly asset purchases, saying “Beginning in January 2014, the Committee will add to its holdings of agency MBS at a pace of $35 billion per month rather than $40 billion per month, and will add to its holdings of longer-term Treasury securities at a pace of $40 billion per month rather than $45 billion per month.” At each of the Fed’s next six meetings (January, March, April, June, July and September 2014), it announced further $10 billion tapering of its asset purchases. At its meeting that ended on October 29, 2014, the Fed announced that its asset purchase program had concluded. The Fed also said that it “currently anticipates that, even after employment and inflation are near mandate-consistent levels, economic conditions may, for some time, warrant keeping the target federal funds rate below levels the Committee views as normal in the longer run.”
Given the economic challenges in the Eurozone, the European Central Bank (“ECB”)v took a number of actions to stimulate growth. In May 2013, before the beginning of the reporting period, the ECB cut rates from 0.75% to 0.50%. The ECB then lowered the rates to a new record low of 0.25% in November 2013. On June 5, 2014, the ECB made a number of additional moves in an attempt to support the region’s economy and ward off deflation: The ECB reduced rates to a new low of 0.15% and announced it would charge commercial banks 0.10% to keep money at the ECB. This “negative deposit rate” was aimed at encouraging commercial banks to lend some of their incremental cash which, in turn, could help to spur growth. On September 4, 2014, the ECB reduced rates to yet another record low of 0.05% and it began charging commercial banks 0.20% to keep money at the ECB. Furthermore, the ECB started purchasing securitized loans and covered bonds in October 2014. In other developed countries, the Bank of England kept rates on hold at 0.50% during the reporting period, as did Japan at a range of zero to 0.10%, its lowest level since 2006. At the end of October 2014, the Bank of Japan announced that it would increase its asset purchases by between 10 trillion yen and 20 trillion yen ($90.7 billion to $181.3 billion) to approximately 80 trillion yen ($725 billion) annually, in an attempt to stimulate growth. Elsewhere, the People’s Bank of China kept rates on hold at 6.0%.
| | |
| IV | | Western Asset Asian Opportunities Fund |
As always, thank you for your confidence in our stewardship of your assets.
Sincerely,
Kenneth D. Fuller
President and Chief Executive Officer
November 28, 2014
All investments are subject to risk including the possible loss of principal. Past performance is no guarantee of future results. Forecasts and predictions are inherently limited and should not be relied upon as an indication of actual or future performance.
| i | Gross domestic product (“GDP”) is the market value of all final goods and services produced within a country in a given period of time. |
| ii | The Institute for Supply Management’s PMI is based on a survey of purchasing executives who buy the raw materials for manufacturing at more than 350 companies. It offers an early reading on the health of the U.S. manufacturing sector. |
| iii | The Federal Reserve Board (“Fed”) is responsible for the formulation of policies designed to promote economic growth, full employment, stable prices and a sustainable pattern of international trade and payments. |
| iv | The federal funds rate is the rate charged by one depository institution on an overnight sale of immediately available funds (balances at the Federal Reserve) to another depository institution; the rate may vary from depository institution to depository institution and from day to day. |
| v | The European Central Bank (“ECB”) is responsible for the monetary system of the European Union and the euro currency. |
| | |
| Western Asset Asian Opportunities Fund | | V |
Fund overview
Q. What is the Fund’s investment strategy?
A. The Fund seeks to maximize total return, through income and capital appreciation. The Fund invests, under normal circumstances, at least 80% of its net assets in securities issued by Asian issuers and other investments that are tied economically to Asia, including, among others, derivatives based on financial instruments and interest rates of Asian issuers, and Asian currencies. Additionally, the Fund will typically invest at least 70% of its net assets in debt and fixed income securities and in derivatives on Asian interest rates and currencies. For these purposes, an Asian issuer is a country (and any of its agencies, instrumentalities or political subdivisions) located in Asia, or an issuer that at the time of investment is organized in Asia, maintains its principal place of business in Asia or is a current or expected to be constituent of the JPMorgan Asian Credit Indexi or the HSBC Asian Local Bond Index (USD)ii (the “Index”). The Fund may invest a substantial portion of its assets, without limit, in securities of issuers located in emerging markets countries.
The Fund may enter into various derivative transactions for both hedging and non-hedging purposes, including for purposes of enhancing returns. These derivative transactions may include, but are not limited to, futures, options, swaps, forwards and structured instruments. In particular, the Fund may use certain derivatives, including interest rate swaps, credit default swaps (on individual securities and/or baskets of securities) and/or futures contracts and related options to a significant extent, although the amount invested in these instruments will likely change from time to time. The Fund may also use other types of derivatives to a significant extent from time to time. The Fund may invest in debt securities that are not rated in the Baa or BBB categories or above (or below-investment grade securities) at the time of purchase by one or more Nationally Recognized Statistical Rating Organizations (“NRSROs”) or unrated securities at the time of purchase that we determine to be of comparable quality. The Fund may invest in securities of all maturities or durations.
Q. What were the overall market conditions during the Fund’s reporting period?
A. The global bond market was volatile at times during the reporting period and Asian fixed-income securities were not immune to these fluctuations. Investor sentiment was impacted by a number of factors, including uncertainties regarding global monetary policy, the conclusion of the Federal Reserve Board’s (“Fed”)iii asset purchase program, concerns regarding moderating growth in China and numerous geopolitical issues. Toward the latter part of the period, the sharply rising U.S. dollar impacted a number of Asian currencies. All told, the HSBC Asian Local Bond Index (USD) returned 2.35% during the twelve months ended October 31, 2014. From a country perspective, Indonesia and South Korea were among the best performers, whereas Singapore and Thailand lagged the Index.
Q. How did we respond to these changing market conditions?
A. A number of adjustments were made to the Fund’s portfolio during the reporting period. At the currency level, we increased the Fund’s allocations to the Chinese offshore renminbi, Indonesian rupiah and Indian rupee, while reducing its exposure to the Thai baht. We feel that Asia is a region
| | |
| Western Asset Asian Opportunities Fund 2014 Annual Report | | 1 |
Fund overview (cont’d)
that will continue to be impacted by weaker G3iv (U.S., Europe and Japan) demand, offset by solid intra-regional demand. Against this backdrop, we feel that domestic consumption-oriented economies such as China, Indonesia and India will show resilience. The Indian rupee and Indonesian rupiah are tactical overweights in the Fund, as we believe they will benefit from structural reforms that will result in both improving macroeconomic fundamentals and medium-term growth. On the rate side, we added durationv exposure to local rates in South Korea. We believe South Korea and Singapore — both of which are overweights in the Fund — will be supported by sound fundamentals and positive supply/demand technicals. We continue to like India and will look to take advantage of a confluence of cyclical and structural tailwinds post Prime Minister Modi’s victory. We are maintaining a cautiously optimistic approach to Indonesia, with hopes that President Jokowi’s recent victory will boost structural dynamics. That being said, we are cautious of the limitations due to the lack of a strong parliamentary mandate on structural reforms.
At the sector level, we continue to maintain a high quality bias in our issuer selection and yield curvevi positioning in the U.S. dollar-denominated space, with a focus on spread duration. In terms of issuer level, our preferred sectors continue to be Asian bank capital, credits issued by government- strategically important companies and utilities.
During the reporting period, we employed Korean Treasury futures to manage the Fund’s duration in Korea. Interest rate swaps in select Asian countries were also used to manage the Fund’s duration where efficient. The use of these duration management tools were positive for performance. Currency forwards, which were utilized to manage the Fund’s currency exposures modestly detracted from results.
Performance review
For the twelve months ended October 31, 2014, Class IS shares of Western Asset Asian Opportunities Fund, returned 2.16%. The Fund’s unmanaged primary benchmark, the HSBC Asian Local Bond Index (USD), returned 2.35%, for the same period. The Lipper International Income Funds Category Average1 returned 1.50% over the same time frame.
| | | | | | | | |
Performance Snapshot as of October 31, 2014
(unaudited) | |
| | | 6 months | | | 12 months | |
Western Asset Asian
Opportunities Fund: | |
Class FI | | | 2.31 | % | | | 1.74 | % |
Class I | | | 2.50 | % | | | 2.13 | % |
Class IS | | | 2.45 | % | | | 2.16 | % |
| HSBC Asian Local Bond Index (USD) | | | 2.64 | % | | | 2.35 | % |
| JPMorgan Asia Credit Index | | | 4.46 | % | | | 7.44 | % |
| Lipper International Income Funds Category Average1 | | | -0.91 | % | | | 1.50 | % |
The performance shown represents past performance. Past performance is no guarantee of future results and current performance may be higher or lower than the performance shown above. Principal value, investment returns and yields will fluctuate
| 1 | Lipper, Inc., a wholly-owned subsidiary of Reuters, provides independent insight on global collective investments. Returns are based on the twelve-month period ended October 31, 2014, including the reinvestment of all distributions, including returns of capital, if any, calculated among the 136 for the six-month period and among the 133 funds for the twelve-month period in the Fund’s Lipper category, and excluding sales charges. |
| | |
| 2 | | Western Asset Asian Opportunities Fund 2014 Annual Report |
and investors’ shares, when redeemed, may be worth more or less than their original cost. To obtain performance data current to the most recent month-end, please visit our website at www.leggmason.com/individualinvestors.
All share class returns assume the reinvestment of all distributions at net asset value and the deduction of all Fund expenses. Returns have not been adjusted to include the deduction of taxes that a shareholder would pay on Fund distributions.
Fund performance figures reflect fee waivers and/or expense reimbursements, without which the performance would have been lower.
The 30-Day SEC Yields for the period ended October 31, 2014 for Class FI, Class I and Class IS shares were 2.49%, 3.02% and 3.13%, respectively. Absent fee waivers and/or expense reimbursements, the 30-Day SEC Yields for Class FI, Class I and Class IS shares would have been 1.70%, 2.20% and 2.49%, respectively. The 30-Day SEC Yield is subject to change and is based on the yield to maturity of the Fund’s investments over a 30-day period and not on the dividends paid by the Fund, which may differ.
|
| Total Annual Operating Expenses (unaudited) |
As of the Fund’s current prospectus dated March 1, 2014, the gross total annual operating expense ratios for Class FI, Class I and Class IS shares were 3.01%, 2.39% and 2.47%, respectively.
Actual expenses may be higher. For example, expenses may be higher than those shown if average net assets decrease. Net assets are more likely to decrease and Fund expense ratios are more likely to increase when markets are volatile.
As a result of expense limitation arrangements, the ratio of expenses, other than interest, brokerage commissions, taxes, extraordinary expenses and deferred organizational expenses, to average net assets is not expected to exceed 1.25% for Class FI shares, 0.90% for Class I shares and 0.80% for Class IS shares. These expense limitation arrangements cannot be terminated prior to December 31, 2016 without the Board of Directors’ consent.
The manager is permitted to recapture amounts waived and/or reimbursed to a class within two years after the fiscal year in which the manager earned the fee or incurred the expense if the class’ total annual operating expenses have fallen to a level below the expense limitation (“expense cap”) in effect at the time the fees were earned or the expenses incurred. In no case will the manager recapture any amount that would result, on any particular business day of the Fund, in the class’ total annual operating expenses exceeding the expense cap or any other lower limit then in effect.
Q. What were the leading contributors to performance?
A. The largest contributor to the Fund’s relative performance during the reporting period was its long duration exposure to Indonesian and Indian rates. We benefited from our tactical curve positioning in Korea and Singapore, driven by each markets’ specific local market technicals. In Korea, we were positioned in the long end of the curve given strong domestic demand and in the belly of the curve due to structural demand by offshore institutional investors. In Singapore, we were positioned in the belly of the curve, driven by what we felt was value and local market’s demand for yield, while not taking on too much duration risk.
| | |
| Western Asset Asian Opportunities Fund 2014 Annual Report | | 3 |
Fund overview (cont’d)
In terms of the Fund’s foreign exchange positioning, we benefited from our structural overweights in Chinese offshore renminbi given the People’s Bank of China’s efforts to support its economy. Our strategic overweights in the Indonesian rupiah and Indian rupee contributed to performance despite periods of volatility, buffeted by the average 6% yield the Fund earned in these currencies. The Fund also benefited from its U.S. dollar-denominated credit exposure, due to the narrowing of Asian investment-grade credit spreads during the reporting period. We continued to be highly selective, with a quality bias in our issuer selection and curve positioning in the U.S. dollar-denominated space, with a focus on spread duration and keeping U.S. Treasury risks to a minimum. Finally, the Fund benefited from our defensive positioning, given our focus on high grade Asian bank capital securities, credit issued by government-linked or critical utilities and select top-tier property developers.
Q. What were the leading detractors from performance?
A. The largest detractor from the Fund’s relative performance was its underweight exposure to Hong Kong rates, as they outperformed the Index given its high U.S. Treasury risk. An overweight to the South Korean won was also negative for performance. Elsewhere, the Fund’s exposure to high yield Chinese property developers was a drag on performance.
Thank you for your investment in Western Asset Asian Opportunities Fund. As always, we appreciate that you have chosen us to manage your assets and we remain focused on achieving the Fund’s investment goals.
Sincerely,
Western Asset Management Company
November 18, 2014
RISKS: Fixed-income securities involve interest-rate, credit, inflation, and reinvestment risks. As interest rates rise, the value of fixed-income securities falls. International investments are subject to special risks, including currency fluctuations and social, economic and political uncertainties, which could increase volatility. These risks are magnified in emerging markets. Because the Fund’s investments are focused on Asian issuers, the Fund’s performance is expected to be closely tied to social, political and economic conditions within Asia and to be more volatile than the performance of more geographically diversified funds. High-yield bonds possess greater price volatility, illiquidity and possibility of default. Derivatives, such as options and futures, can be illiquid, may disproportionately increase losses and have a potentially large impact on portfolio performance. As a non-diversified fund, the Fund is permitted to invest a higher percentage of its assets in any one issuer than a diversified fund, which may magnify the Fund’s losses from events affecting a particular issuer. Please see the Fund’s prospectus for a more complete discussion of these and other risks, and the Fund’s investment strategies.
All investments are subject to risk including the possible loss of principal. Past performance is no guarantee of future results. All index performance reflects no deduction for fees, expenses or taxes. Please note that an investor cannot invest directly in an index.
The information provided is not intended to be a forecast of future events, a guarantee of future results or investment advice. Views expressed may differ from those of the firm as a whole.
| | |
| 4 | | Western Asset Asian Opportunities Fund 2014 Annual Report |
| i | JPMorgan Asian Credit Index (“JACISM”) tracks total returns for U.S. dollar-denominated bond issued by Asia sovereign, quasi-sovereign, and corporate borrowers. |
| ii | The HSBC Asian Local Bond Index (USD) tracks the total return performance of a bond portfolio which consists of local-currency denominated, high quality and liquid bonds in Asia ex-Japan. |
| iii | The Federal Reserve Board (“Fed”) is responsible for the formulation of policies designed to promote economic growth, full employment, stable prices and a sustainable pattern of international trade and payments. |
| iv | The three most systemically important central banks, including the Federal Reserve, European Central Bank, and Bank of Japan. |
| v | Duration is the measure of the price sensitivity of a fixed-income security to an interest rate change of 100 basis points. Calculation is based on the weighted average of the present values for all cash flows. |
| vi | The yield curve is the graphical depiction of the relationship between the yield on bonds of the same credit quality but different maturities. |
| | |
| Western Asset Asian Opportunities Fund 2014 Annual Report | | 5 |
Fund at a glance† (unaudited)
Investment breakdown (%) as a percent of total investments
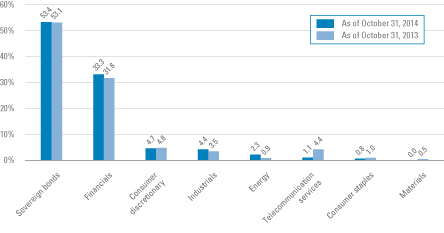
| † | The bar graph above represents the composition of the Fund’s investments as of October 31, 2014 and October 31, 2013 and does not include derivatives such as swap contracts, forward foreign currency contracts and futures contracts. The Fund is actively managed. As a result, the composition of the Fund’s investments is subject to change at any time. |
| | |
| 6 | | Western Asset Asian Opportunities Fund 2014 Annual Report |
Fund expenses (unaudited)
Example
As a shareholder of the Fund, you may incur two types of costs: (1) transaction costs and (2) ongoing costs, including management fees; service and/or distribution (12b-1) fees; and other Fund expenses. This example is intended to help you understand your ongoing costs (in dollars) of investing in the Fund and to compare these costs with the ongoing costs of investing in other mutual funds.
This example is based on an investment of $1,000 invested on May 1, 2014 and held for the six months ended October 31, 2014.
Actual expenses
The table below titled “Based on Actual Total Return” provides information about actual account values and actual expenses. You may use the information provided in this table, together with the amount you invested, to estimate the expenses that you paid over the period. To estimate the expenses you paid on your account, divide your ending account value by $1,000 (for example, an $8,600 ending account value divided by $1,000 = 8.6), then multiply the result by the number under the heading entitled “Expenses Paid During the Period”.
Hypothetical example for comparison purposes
The table below titled “Based on Hypothetical Total Return” provides information about hypothetical account values and hypothetical expenses based on the actual expense ratio and an assumed rate of return of 5.00% per year before expenses, which is not the Fund’s actual return. The hypothetical account values and expenses may not be used to estimate the actual ending account balance or expenses you paid for the period. You may use the information provided in this table to compare the ongoing costs of investing in the Fund and other funds. To do so, compare the 5.00% hypothetical example relating to the Fund with the 5.00% hypothetical examples that appear in the shareholder reports of the other funds.
Please note that the expenses shown in the table below are meant to highlight your ongoing costs only and do not reflect any transactional costs. Therefore, the table is useful in comparing ongoing costs only, and will not help you determine the relative total costs of owning different funds. In addition, if these transaction costs were included, your costs would have been higher.
| | | | | | | | | | | | | | | | | | | | | | | | | | | | | | | | | | | | | | | | | | | | |
| Based on actual total return1 | | | | | Based on hypothetical total return1 | |
| | | Actual
Total Return2 | | | Beginning
Account
Value | | | Ending
Account
Value | | | Annualized
Expense
Ratio | | | Expenses
Paid
During
the
Period3 | | | | | | | Hypothetical
Annualized
Total Return | | | Beginning
Account
Value | | | Ending
Account
Value | | | Annualized
Expense
Ratio | | | Expenses
Paid
During
the
Period3 | |
| Class FI | | | 2.31 | % | | $ | 1,000.00 | | | $ | 1,023.10 | | | | 1.25 | % | | $ | 6.37 | | | | | Class FI | | | 5.00 | % | | $ | 1,000.00 | | | $ | 1,018.90 | | | | 1.25 | % | | $ | 6.36 | |
| Class I | | | 2.50 | | | | 1,000.00 | | | | 1,025.00 | | | | 0.90 | | | | 4.59 | | | | | Class I | | | 5.00 | | | | 1,000.00 | | | | 1,020.67 | | | | 0.90 | | | | 4.58 | |
| Class IS | | | 2.45 | | | | 1,000.00 | | | | 1,024.50 | | | | 0.80 | | | | 4.08 | | | | | Class IS | | | 5.00 | | | | 1,000.00 | | | | 1,021.17 | | | | 0.80 | | | | 4.08 | |
| | |
| Western Asset Asian Opportunities Fund 2014 Annual Report | | 7 |
Fund expenses (unaudited) (cont’d)
| 1 | For the six months ended October 31, 2014. |
| 2 | Assumes the reinvestment of all distributions, including returns of capital, if any, at net asset value. Total return is not annualized, as it may not be representative of the total return for the year. Performance figures may reflect compensating balance arrangements, fee waivers and/or expense reimbursements. In the absence of compensating balance arrangements, fee waivers and/or expense reimbursements, the total return would have been lower. Past performance is no guarantee of future results. |
| 3 | Expenses (net of compensating balance arrangements, fee waivers and/or expense reimbursements) are equal to each class’ respective annualized expense ratio multiplied by the average account value over the period, multiplied by the number of days in the most recent fiscal half-year (184), then divided by 365. |
| | |
| 8 | | Western Asset Asian Opportunities Fund 2014 Annual Report |
Fund performance (unaudited)
| | | | | | | | | | | | |
| Average annual total returns | | | | | | | | | |
| Without sales charges1 | | Class FI | | | Class I | | | Class IS | |
| Twelve Months Ended 10/31/14 | | | 1.74 | % | | | 2.13 | % | | | 2.16 | % |
| Inception* through 10/31/14 | | | -0.46 | | | | -0.03 | | | | -0.02 | |
| | | | |
| Cumulative total returns | | | |
| Without sales charges1 | | | |
| Class FI (Inception date of 10/31/12 through 10/31/14) | | | -0.92 | % |
| Class I (Inception date of 10/31/12 through 10/31/14) | | | -0.06 | |
| Class IS (Inception date of 10/31/12 through 10/31/14) | | | -0.03 | |
All figures represent past performance and are not a guarantee of future results. Investment return and principal value of an investment will fluctuate so that an investor’s shares, when redeemed, may be worth more or less than their original cost. The returns shown do not reflect the deduction of taxes that a shareholder would pay on Fund distributions or the redemption of Fund shares. Performance figures may reflect compensating balance arrangements, fee waivers and/or expense reimbursements. In the absence of compensating balance arrangements, fee waivers and/or expense reimbursements, the total return would have been lower.
| 1 | Assumes the reinvestment of all distributions, including returns of capital, if any, at net asset value. |
| * | Inception date for Class FI, I and IS shares is October 31, 2012. |
| | |
| Western Asset Asian Opportunities Fund 2014 Annual Report | | 9 |
Fund performance (unaudited) (cont’d)
Historical performance
Value of $1,000,000 invested in
Class FI, I and IS Shares of Western Asset Asian Opportunities Fund vs. HSBC Asian Local Bond Index (USD)† — October 31, 2012 - October 2014
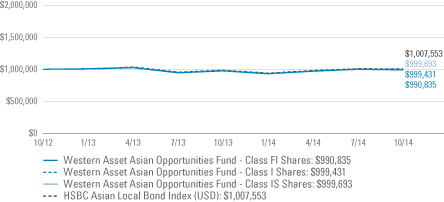
All figures represent past performance and are not a guarantee of future results. Investment return and principal value of an investment will fluctuate so that an investor’s shares, when redeemed, may be worth more or less than their original cost. The returns shown do not reflect the deduction of taxes that a shareholder would pay on Fund distributions or the redemption of Fund shares. Performance figures may reflect compensating balance arrangements, fee waivers and/or expense reimbursements. In the absence of compensating balance arrangements, fee waivers and/or expense reimbursements, the total return would have been lower.
| † | Hypothetical illustration of $1,000,000 invested in Class FI, I and IS shares of Western Asset Asian Opportunities Fund on October 31, 2012 (inception date) assuming the reinvestment of all distributions, including returns of capital, if any, at net asset value through October 31, 2014. The hypothetical illustration also assumes a $1,000,000 investment in the HSBC Asian Local Bond Index (USD). The HSBC Asian Local Bond Index (USD) tracks the total return performance of a bond portfolio which consists of local-currency denominated, high quality and liquid bonds in Asia ex-Japan. The Index is unmanaged and not subject to the same management and trading expenses as a mutual fund. Please note that an investor cannot invest directly in an index. |
| | |
| 10 | | Western Asset Asian Opportunities Fund 2014 Annual Report |
Spread duration (unaudited)
Economic exposure — October 31, 2014
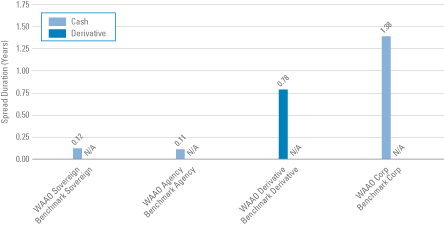
Spread duration measures the sensitivity to changes in spreads. The spread over Treasuries is the annual risk-premium demanded by investors to hold non-Treasury securities. Spread duration is quantified as the % change in price resulting from a 100 basis points change in spreads. For a security with positive spread duration, an increase in spreads would result in a price decline and a decline in spreads would result in a price increase. This chart highlights the market sector exposure of the Fund’s sectors relative to the selected benchmark sectors as of the end of the reporting period.
| | |
| Benchmark | | — HSBC Asian Local Bond Index (USD) |
| WAAO | | — Western Asset Asian Opportunities Fund |
| N/A | | — Not Available |
| | |
| Western Asset Asian Opportunities Fund 2014 Annual Report | | 11 |
Effective duration (unaudited)
Interest rate exposure — October 31, 2014
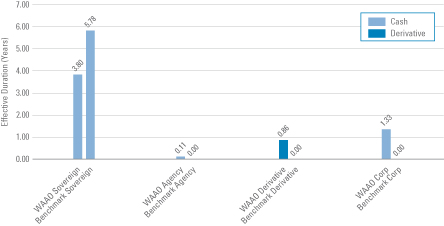
Effective duration measures the sensitivity to changes in relevant interest rates. Effective duration is quantified as the % change in price resulting from a 100 basis points change in interest rates. For a security with positive effective duration, an increase in interest rates would result in a price decline and a decline in interest rates would result in a price increase. This chart highlights the interest rate exposure of the Fund’s sectors relative to the selected benchmark sectors as of the end of the reporting period.
| | |
| Benchmark | | — HSBC Asian Local Bond Index (USD) |
| WAAO | | — Western Asset Asian Opportunities Fund |
| | |
| 12 | | Western Asset Asian Opportunities Fund 2014 Annual Report |
Schedule of investments
October 31, 2014
Western Asset Asian Opportunities Fund
| | | | | | | | | | | | | | | | |
| Security | | Rate | | | Maturity
Date | | | Face
Amount† | | | Value | |
| Sovereign Bonds — 52.5% | | | | | | | | | | | | | | | | |
Indonesia — 12.2% | | | | | | | | | | | | | | | | |
Perusahaan Penerbit SBSN Indonesia, Notes | | | 4.350 | % | | | 9/10/24 | | | | 200,000 | | | $ | 200,500 | (a) |
Perusahaan Penerbit SBSN Indonesia, Senior Bonds | | | 6.000 | % | | | 2/27/16 | | | | 800,000,000 | IDR | | | 64,310 | |
Republic of Indonesia, Senior Bonds | | | 6.250 | % | | | 4/15/17 | | | | 5,300,000,000 | IDR | | | 424,460 | |
Republic of Indonesia, Senior Bonds | | | 7.875 | % | | | 4/15/19 | | | | 2,070,000,000 | IDR | | | 171,458 | |
Republic of Indonesia, Senior Bonds | | | 5.625 | % | | | 5/15/23 | | | | 5,600,000,000 | IDR | | | 396,194 | |
Republic of Indonesia, Senior Bonds | | | 8.375 | % | | | 3/15/24 | | | | 6,330,000,000 | IDR | | | 535,051 | |
Republic of Indonesia, Senior Bonds | | | 6.625 | % | | | 5/15/33 | | | | 4,200,000,000 | IDR | | | 283,709 | |
Republic of Indonesia, Senior Bonds | | | 8.375 | % | | | 3/15/34 | | | | 3,000,000,000 | IDR | | | 246,504 | |
Republic of Indonesia, Senior Bonds | | | 6.375 | % | | | 4/15/42 | | | | 1,030,000,000 | IDR | | | 64,012 | |
Republic of Indonesia, Senior Bonds | | | 8.750 | % | | | 2/15/44 | | | | 1,085,000,000 | IDR | | | 89,147 | |
Total Indonesia | | | | | | | | | | | | | | | 2,475,345 | |
Malaysia — 8.3% | | | | | | | | | | | | | | | | |
Federation of Malaysia, Bonds | | | 4.160 | % | | | 7/15/21 | | | | 1,730,000 | MYR | | | 537,878 | |
Federation of Malaysia, Senior Bonds | | | 4.048 | % | | | 9/30/21 | | | | 310,000 | MYR | | | 95,786 | |
Federation of Malaysia, Senior Bonds | | | 3.480 | % | | | 3/15/23 | | | | 1,900,000 | MYR | | | 564,872 | |
Federation of Malaysia, Senior Bonds | | | 4.181 | % | | | 7/15/24 | | | | 1,000,000 | MYR | | | 311,755 | |
Federation of Malaysia, Senior Bonds | | | 5.248 | % | | | 9/15/28 | | | | 250,000 | MYR | | | 84,188 | |
Federation of Malaysia, Senior Bonds | | | 4.935 | % | | | 9/30/43 | | | | 250,000 | MYR | | | 79,455 | |
Total Malaysia | | | | | | | | | | | | | | | 1,673,934 | |
Philippines — 6.1% | | | | | | | | | | | | | | | | |
Republic of the Philippines, Senior Bonds | | | 6.250 | % | | | 1/14/36 | | | | 15,000,000 | PHP | | | 365,515 | |
Republic of the Philippines, Senior Notes | | | 4.950 | % | | | 1/15/21 | | | | 38,000,000 | PHP | | | 876,858 | |
Total Philippines | | | | | | | | | | | | | | | 1,242,373 | |
Singapore — 2.4% | | | | | | | | | | | | | | | | |
Republic of Singapore, Senior Bonds | | | 3.000 | % | | | 9/1/24 | | | | 170,000 | SGD | | | 140,624 | |
Republic of Singapore, Senior Bonds | | | 2.875 | % | | | 9/1/30 | | | | 190,000 | SGD | | | 150,529 | |
Republic of Singapore, Senior Bonds | | | 2.750 | % | | | 4/1/42 | | | | 250,000 | SGD | | | 187,670 | |
Total Singapore | | | | | | | | | | | | | | | 478,823 | |
South Korea — 16.7% | | | | | | | | | | | | | | | | |
Republic of Korea, Senior Bonds | | | 2.750 | % | | | 3/10/18 | | | | 550,000,000 | KRW | | | 523,611 | |
Republic of Korea, Senior Bonds | | | 4.250 | % | | | 6/10/21 | | | | 1,600,000,000 | KRW | | | 1,660,739 | |
Republic of Korea, Senior Bonds | | | 3.750 | % | | | 6/10/22 | | | | 200,000,000 | KRW | | | 202,881 | |
Republic of Korea, Senior Bonds | | | 3.000 | % | | | 3/10/23 | | | | 16,000,000 | KRW | | | 15,442 | |
Republic of Korea, Senior Bonds | | | 3.375 | % | | | 9/10/23 | | | | 430,000,000 | KRW | | | 426,702 | |
Republic of Korea, Senior Bonds | | | 3.000 | % | | | 9/10/24 | | | | 200,000,000 | KRW | | | 192,693 | |
Republic of Korea, Senior Bonds | | | 4.000 | % | | | 12/10/31 | | | | 341,000,000 | KRW | | | 369,805 | |
Total South Korea | | | | | | | | | | | | | | | 3,391,873 | |
See Notes to Financial Statements.
| | |
| Western Asset Asian Opportunities Fund 2014 Annual Report | | 13 |
Schedule of investments (cont’d)
October 31, 2014
Western Asset Asian Opportunities Fund
| | | | | | | | | | | | | | | | |
| Security | | Rate | | | Maturity
Date | | | Face
Amount† | | | Value | |
Sri Lanka — 1.0% | | | | | | | | | | | | | | | | |
Republic of Sri Lanka, Senior Bonds | | | 5.125 | % | | | 4/11/19 | | | | 200,000 | | | $ | 205,760 | (a) |
Thailand — 5.8% | | | | | | | | | | | | | | | | |
Kingdom of Thailand, Senior Bonds | | | 3.625 | % | | | 6/16/23 | | | | 37,000,000 | THB | | | 1,180,440 | |
Total Sovereign Bonds (Cost — $11,311,162) | | | | | | | | | | | | | | | 10,648,548 | |
| Corporate Bonds & Notes — 45.9% | | | | | | | | | | | | | | | | |
| Consumer Discretionary — 4.7% | | | | | | | | | | | | | | | | |
Multiline Retail — 4.7% | | | | | | | | | | | | | | | | |
Golden Eagle Retail Group Ltd., Senior Notes | | | 4.625 | % | | | 5/21/23 | | | | 500,000 | | | | 453,703 | (a) |
Lotte Shopping Business Management Hong Kong Ltd., Senior Notes | | | 4.000 | % | | | 2/9/15 | | | | 3,000,000 | CNY | | | 491,243 | (b) |
Total Consumer Discretionary | | | | | | | | | | | | | | | 944,946 | |
| Consumer Staples — 0.8% | | | | | | | | | | | | | | | | |
Food Products — 0.8% | | | | | | | | | | | | | | | | |
Fonterra Cooperative Group Ltd., Senior Notes | | | 3.600 | % | | | 1/29/19 | | | | 1,000,000 | CNY | | | 163,132 | (b) |
| Energy — 2.3% | | | | | | | | | | | | | | | | |
Oil, Gas & Consumable Fuels — 2.3% | | | | | | | | | | | | | | | | |
Indo Energy Finance II BV, Notes | | | 6.375 | % | | | 1/24/23 | | | | 200,000 | | | | 161,500 | (a) |
Korea National Oil Corp., Senior Bonds | | | 3.250 | % | | | 7/10/24 | | | | 300,000 | | | | 297,775 | (a) |
Total Energy | | | | | | | | | | | | | | | 459,275 | |
| Financials — 32.7% | | | | | | | | | | | | | | | | |
Banks — 14.6% | | | | | | | | | | | | | | | | |
ABN Amro Bank NV, Subordinated Notes | | | 4.700 | % | | | 10/25/22 | | | | 250,000 | SGD | | | 201,736 | (b)(c) |
Bank of Scotland PLC, Senior Notes | | | 4.400 | % | | | 12/29/16 | | | | 1,000,000 | HKD | | | 135,435 | |
China Construction Bank Asia Corp., Ltd., Senior Notes | | | 3.250 | % | | | 7/2/19 | | | | 400,000 | | | | 401,728 | (b) |
DBS Bank Ltd., Junior Subordinated Notes | | | 0.840 | % | | | 7/15/21 | | | | 200,000 | | | | 195,000 | (b)(c) |
DBS Bank Ltd., Subordinate Notes, Medium-Term Notes | | | 3.100 | % | | | 2/14/23 | | | | 250,000 | SGD | | | 196,211 | (b)(c) |
Export-Import Bank of Korea, Senior Notes | | | 6.000 | % | | | 6/4/16 | | | | 50,000,000 | INR | | | 804,235 | (a) |
Hana Bank, Subordinated Notes | | | 4.375 | % | | | 9/30/24 | | | | 400,000 | | | | 412,910 | (a) |
Lembaga Pembiayaan Ekspor Indonesia, Senior Bonds | | | 6.400 | % | | | 5/23/16 | | | | 250,000,000 | IDR | | | 19,817 | |
State Bank of India, Senior Notes | | | 2.381 | % | | | 1/21/16 | | | | 260,000 | | | | 259,214 | (c) |
United Overseas Bank Ltd., Senior Notes | | | 2.500 | % | | | 6/24/16 | | | | 2,000,000 | CNY | | | 325,140 | (b) |
Total Banks | | | | | | | | | | | | | | | 2,951,426 | |
Diversified Financial Services — 1.3% | | | | | | | | | | | | | | | | |
Indian Railway Finance Corp., Ltd., Senior Notes | | | 3.917 | % | | | 2/26/19 | | | | 250,000 | | | | 258,602 | (b) |
Insurance — 1.9% | | | | | | | | | | | | | | | | |
NTUC Income Insurance Cooperative Ltd., Subordinated Notes | | | 3.650 | % | | | 8/23/27 | | | | 500,000 | SGD | | | 396,157 | (b)(c) |
Real Estate Investment Trusts (REITs) — 3.9% | | | | | | | | | | | | | | | | |
Ascott REIT MTN Pte Ltd., Senior Notes | | | 3.800 | % | | | 12/16/15 | | | | 250,000 | SGD | | | 199,657 | (b) |
See Notes to Financial Statements.
| | |
| 14 | | Western Asset Asian Opportunities Fund 2014 Annual Report |
Western Asset Asian Opportunities Fund
| | | | | | | | | | | | | | | | |
| Security | | Rate | | | Maturity
Date | | | Face
Amount† | | | Value | |
Real Estate Investment Trusts (REITs) — continued | | | | | | | | | | | | | | | | |
LMIRT Capital Pte Ltd., Notes | | | 4.880 | % | | | 7/6/15 | | | | 250,000 | SGD | | $ | 196,734 | |
Mapletree Commercial Trust Treasury Co. Pte Ltd., Senior Notes, Medium-Term Notes | | | 3.600 | % | | | 8/24/20 | | | | 500,000 | SGD | | | 399,114 | (b) |
Total Real Estate Investment Trusts (REITs) | | | | | | | | | | | | | | | 795,505 | |
Real Estate Management & Development — 11.0% | | | | | | | | | | | | | | | | |
Country Garden Holdings Co., Ltd., Senior Notes | | | 10.500 | % | | | 8/11/15 | | | | 660,000 | | | | 684,750 | |
Global Logistic Properties Ltd., Senior Notes | | | 3.375 | % | | | 5/11/16 | | | | 5,000,000 | CNY | | | 814,663 | (b) |
Hong Fok Corp., Ltd., Senior Notes, Medium-Term Notes | | | 4.750 | % | | | 1/24/18 | | | | 250,000 | SGD | | | 196,006 | (b) |
Kaisa Group Holdings Ltd., Senior Notes | | | 8.875 | % | | | 3/19/18 | | | | 200,000 | | | | 202,000 | (a) |
Wheelock Finance Ltd., Senior Notes, Medium-Term Notes | | | 4.050 | % | | | 5/4/17 | | | | 1,000,000 | HKD | | | 134,395 | (b) |
Yuzhou Properties Co., Ltd., Senior Bonds | | | 8.750 | % | | | 10/4/18 | | | | 200,000 | | | | 200,500 | (b) |
Total Real Estate Management & Development | | | | | | | | | | | | | | | 2,232,314 | |
Total Financials | | | | | | | | | | | | | | | 6,634,004 | |
| Industrials — 4.4% | | | | | | | | | | | | | | | | |
Construction & Engineering — 1.0% | | | | | | | | | | | | | | | | |
Alam Synergy Pte Ltd., Senior Notes | | | 6.950 | % | | | 3/27/20 | | | | 200,000 | | | | 198,000 | (a) |
Trading Companies & Distributors — 3.4% | | | | | | | | | | | | | | | | |
BOC Aviation Pte Ltd., Senior Notes | | | 2.000 | % | | | 3/26/15 | | | | 250,000 | SGD | | | 194,665 | (b) |
Noble Group Ltd., Senior Notes | | | 4.000 | % | | | 1/30/16 | | | | 3,000,000 | CNY | | | 492,537 | (b) |
Total Trading Companies & Distributors | | | | | | | | | | | | | | | 687,202 | |
Total Industrials | | | | | | | | | | | | | | | 885,202 | |
| Telecommunication Services — 1.0% | | | | | | | | | | | | | | | | |
Diversified Telecommunication Services — 1.0% | | | | | | | | | | | | | | | | |
Bharti Airtel International Netherlands BV, Senior Bonds | | | 5.350 | % | | | 5/20/24 | | | | 200,000 | | | | 214,936 | (a) |
Total Corporate Bonds & Notes (Cost — $9,491,066) | | | | | | | | | | | | 9,301,495 | |
Total Investments — 98.4% (Cost — $20,802,228#) | | | | | | | | | | | | 19,950,043 | |
Other Assets in Excess of Liabilities — 1.6% | | | | | | | | | | | | | | | 316,367 | |
Total Net Assets — 100.0% | | | | | | | | | | | | | | $ | 20,266,410 | |
| † | Face amount denominated in U.S. dollars, unless otherwise noted. |
| (a) | Security is exempt from registration under Rule 144A of the Securities Act of 1933. This security may be resold in transactions that are exempt from registration, normally to qualified institutional buyers. This security has been deemed liquid pursuant to guidelines approved by the Board of Directors, unless otherwise noted. |
| (b) | Security is exempt from registration under Regulation S of the Securities Act of 1933. Regulation S applies to securities offerings that are made outside of the United States and do not involve direct selling efforts in the United States. This security has been deemed liquid pursuant to guidelines approved by the Board of Directors, unless otherwise noted. |
| (c) | Variable rate security. Interest rate disclosed is as of the most recent information available. |
| # | Aggregate cost for federal income tax purposes is $20,846,441. |
See Notes to Financial Statements.
| | |
| Western Asset Asian Opportunities Fund 2014 Annual Report | | 15 |
Schedule of investments (cont’d)
October 31, 2014
Western Asset Asian Opportunities Fund
| | |
Abbreviations used in this schedule: |
| CNY | | — Chinese Yuan Renminbi |
| HKD | | — Hong Kong Dollar |
| IDR | | — Indonesian Rupiah |
| INR | | — Indian Rupee |
| KRW | | — South Korean Won |
| MYR | | — Malaysian Ringgit |
| PHP | | — Philippine Peso |
| REIT | | — Real Estate Investment Trust |
| SGD | | — Singapore Dollar |
| THB | | — Thai Baht |
| | | | |
| Summary of Investments by Country (unaudited)* | | | |
| South Korea | | | 25.6 | % |
| Singapore | | | 18.0 | |
| Indonesia | | | 14.3 | |
| Malaysia | | | 8.4 | |
| China | | | 7.7 | |
| Philippines | | | 6.2 | |
| Thailand | | | 5.9 | |
| Hong Kong | | | 5.2 | |
| India | | | 3.7 | |
| Korea | | | 1.5 | |
| Sri Lanka | | | 1.0 | |
| Netherlands | | | 1.0 | |
| New Zealand | | | 0.8 | |
| United Kingdom | | | 0.7 | |
| | | | 100.0 | % |
| * | As a percentage of total investments. Please note that the Fund holdings are as of October 31, 2014 and are subject to change. |
See Notes to Financial Statements.
| | |
| 16 | | Western Asset Asian Opportunities Fund 2014 Annual Report |
Statement of assets and liabilities
October 31, 2014
| | | | |
| |
| Assets: | | | | |
Investments, at value (Cost — $20,802,228) | | $ | 19,950,043 | |
Foreign currency, at value (Cost — $29,682) | | | 29,409 | |
Cash | | | 39,060 | |
Interest receivable | | | 230,006 | |
Receivable for open OTC swap contracts | | | 43,003 | |
Unrealized appreciation on forward foreign currency contracts | | | 32,532 | |
Deposits with brokers for open futures contracts | | | 26,081 | |
OTC swaps, at value | | | 8,077 | |
Receivable from broker — variation margin on open futures contracts | | | 5,212 | |
Receivable from investment manager | | | 854 | |
Prepaid expenses | | | 33,867 | |
Total Assets | | | 20,398,144 | |
| |
| Liabilities: | | | | |
Payable for open OTC swap contracts | | | 44,095 | |
Unrealized depreciation on forward foreign currency contracts | | | 28,029 | |
OTC swaps, at value | | | 6,302 | |
Directors’ fees payable | | | 124 | |
Accrued foreign capital gains tax | | | 41 | |
Service and/or distribution fees payable | | | 2 | |
Accrued expenses | | | 53,141 | |
Total Liabilities | | | 131,734 | |
| Total Net Assets | | $ | 20,266,410 | |
| |
| Net Assets: | | | | |
Par value (Note 7) | | $ | 2,117 | |
Paid-in capital in excess of par value | | | 21,026,206 | |
Undistributed net investment income | | | 102,306 | |
Accumulated net realized loss on investments, swap contracts and foreign currency transactions | | | (20,741) | |
Net unrealized depreciation on investments, futures contracts, swap contracts and foreign currencies | | | (843,478) | * |
| Total Net Assets | | $ | 20,266,410 | |
| |
| Shares Outstanding: | | | | |
Class FI | | | 1,035 | |
Class I | | | 28,955 | |
Class IS | | | 2,087,134 | |
| |
| Net Asset Value: | | | | |
Class FI | | | $9.57 | |
Class I | | | $9.59 | |
Class IS | | | $9.57 | |
| * | Net of accrued foreign capital gains tax of $41. |
See Notes to Financial Statements.
| | |
| Western Asset Asian Opportunities Fund 2014 Annual Report | | 17 |
Statement of operations
For the Year Ended October 31, 2014
| | | | |
| |
| Investment Income: | | | | |
Interest | | $ | 819,960 | |
Less: Foreign taxes withheld | | | (58,807) | |
Total Investment Income | | | 761,153 | |
| |
| Expenses: | | | | |
Investment management fee (Note 2) | | | 118,831 | |
Audit and tax fees | | | 63,216 | |
Registration fees | | | 50,943 | |
Shareholder reports | | | 23,401 | |
Custody fees | | | 21,147 | |
Fund accounting fees | | | 21,059 | |
Transfer agent fees (Note 5) | | | 1,671 | |
Directors’ fees | | | 1,190 | |
Insurance | | | 1,017 | |
Legal fees | | | 767 | |
Service and/or distribution fees (Notes 2 and 5) | | | 24 | |
Miscellaneous expenses | | | 2,473 | |
Total Expenses | | | 305,739 | |
Less: Fee waivers and/or expense reimbursements (Notes 2 and 5) | | | (146,981) | |
Net Expenses | | | 158,758 | |
| Net Investment Income | | | 602,395 | |
| |
| Realized and Unrealized Gain (Loss) on Investments, Swap Contracts, Futures Contracts and Foreign Currency Transactions (Notes 1, 3 and 4): | | | | |
Net Realized Gain (Loss) From: | | | | |
Investment transactions | | | 21,522 | † |
Swap contracts | | | 22,996 | |
Foreign currency transactions | | | (3,938) | |
Net Realized Gain | | | 40,580 | |
Change in Net Unrealized Appreciation (Depreciation) From: | | | | |
Investments | | | (240,730) | * |
Futures contracts | | | 5,204 | |
Swap contracts | | | 30,284 | |
Foreign currencies | | | 1,323 | |
Change in Net Unrealized Appreciation (Depreciation) | | | (203,919) | |
| Net Loss on Investments, Swap Contracts, Futures Contracts and Foreign Currency Transactions | | | (163,339) | |
| Increase in Net Assets from Operations | | $ | 439,056 | |
| † | Net of foreign capital gains tax of $1,048. |
| * | Net of change in accrued foreign capital gains tax of $3,369. |
See Notes to Financial Statements.
| | |
| 18 | | Western Asset Asian Opportunities Fund 2014 Annual Report |
Statements of changes in net assets
| | | | | | | | |
For the Year Ended October 31, 2014
and the Period Ended October 31, 2013 | | 2014 | | | 2013† | |
| | |
| Operations: | | | | | | | | |
Net investment income | | $ | 602,395 | | | $ | 541,474 | |
Net realized gain (loss) | | | 40,580 | | | | (343,933) | |
Change in net unrealized appreciation (depreciation) | | | (203,919) | | | | (639,559) | |
Increase (Decrease) in Net Assets From Operations | | | 439,056 | | | | (442,018) | |
| | |
| Distributions to Shareholders From (Notes 1 and 6): | | | | | | | | |
Net investment income | | | (557,056) | | | | (302,007) | |
Net realized gains | | | (4,938) | | | | — | |
Decrease in Net Assets From Distributions to Shareholders | | | (561,994) | | | | (302,007) | |
| | |
| Fund Share Transactions (Note 7): | | | | | | | | |
Net proceeds from sale of shares | | | — | | | | 20,270,000 | |
Reinvestment of distributions | | | 561,994 | | | | 302,007 | |
Cost of shares repurchased | | | (515) | | | | (113) | |
Increase in Net Assets From Fund Share Transactions | | | 561,479 | | | | 20,571,894 | |
Increase in Net Assets | | | 438,541 | | | | 19,827,869 | |
| | |
| Net Assets: | | | | | | | | |
Beginning of year | | | 19,827,869 | | | | — | |
End of year* | | $ | 20,266,410 | | | $ | 19,827,869 | |
* Includes undistributed net investment income of: | | | $102,306 | | | | $18,866 | |
| † | For the period October 31, 2012 (inception date) to October 31, 2013. |
See Notes to Financial Statements.
| | |
| Western Asset Asian Opportunities Fund 2014 Annual Report | | 19 |
Financial highlights
| | | | | | | | |
For a share of each class of capital stock outstanding throughout each year ended October 31,
unless otherwise noted: | |
| Class FI Shares1 | | 2014 | | | 20132 | |
| | |
| Net asset value, beginning of year | | | $9.62 | | | | $10.00 | |
| | |
| Income (loss) from operations: | | | | | | | | |
Net investment income | | | 0.25 | | | | 0.22 | |
Net realized and unrealized loss | | | (0.09) | | | | (0.48) | |
Total income (loss) from operations | | | 0.16 | | | | (0.26) | |
| | |
| Less distributions from: | | | | | | | | |
Net investment income | | | (0.21) | | | | (0.12) | |
Net realized gains | | | (0.00) | 3 | | | — | |
Total distributions | | | (0.21) | | | | (0.12) | |
| | |
| Net asset value, end of year | | | $9.57 | | | | $9.62 | |
Total return4 | | | 1.74 | % | | | (2.61) | % |
| | |
| Net assets, end of year (000s) | | | $10 | | | | $10 | |
| | |
| Ratios to average net assets: | | | | | | | | |
Gross expenses | | | 2.07 | % | | | 3.01 | % |
Net expenses5,6,7 | | | 1.25 | | | | 1.24 | |
Net investment income | | | 2.59 | | | | 2.26 | |
| | |
| Portfolio turnover rate | | | 35 | % | | | 81 | % |
| 1 | Per share amounts have been calculated using the average shares method. |
| 2 | For the period October 31, 2012 (inception date) to October 31, 2013. |
| 3 | Amount represents less than $0.005 per share. |
| 4 | Performance figures may reflect compensating balance arrangements, fee waivers and/or expense reimbursements. In the absence of compensating balance arrangements, fee waivers and/or expense reimbursements, the total return would have been lower. Past performance is no guarantee of future results. |
| 5 | As a result of an expense limitation arrangement, the ratio of expenses, other than interest, brokerage commissions, taxes, extraordinary expenses and deferred organizational expenses, to average net assets of Class FI shares did not exceed 1.25%. This expense limitation arrangement cannot be terminated prior to December 31, 2016 without the Board of Directors’ consent. |
| 6 | The impact of compensating balance arrangements, if any, was less than 0.01%. |
| 7 | Reflects fee waivers and/or expense reimbursements. |
See Notes to Financial Statements.
| | |
| 20 | | Western Asset Asian Opportunities Fund 2014 Annual Report |
| | | | | | | | |
For a share of each class of capital stock outstanding throughout each year ended October 31,
unless otherwise noted: | |
| Class I Shares1 | | 2014 | | | 20132 | |
| | |
| Net asset value, beginning of year | | | $9.65 | | | | $10.00 | |
| | |
| Income (loss) from operations: | | | | | | | | |
Net investment income | | | 0.28 | | | | 0.28 | |
Net realized and unrealized loss | | | (0.08) | | | | (0.49) | |
Total income (loss) from operations | | | 0.20 | | | | (0.21) | |
| | |
| Less distributions from: | | | | | | | | |
Net investment income | | | (0.26) | | | | (0.14) | |
Net realized gains | | | (0.00) | 3 | | | — | |
Total distributions | | | (0.26) | | | | (0.14) | |
| | |
| Net asset value, end of year | | | $9.59 | | | | $9.65 | |
Total return4 | | | 2.13 | % | | | (2.14) | % |
| | |
| Net assets, end of year (000s) | | | $277 | | | | $272 | |
| | |
| Ratios to average net assets: | | | | | | | | |
Gross expenses | | | 1.79 | % | | | 2.39 | % |
Net expenses5,6,7 | | | 0.90 | | | | 0.74 | |
Net investment income | | | 2.94 | | | | 2.88 | |
| | |
| Portfolio turnover rate | | | 35 | % | | | 81 | % |
| 1 | Per share amounts have been calculated using the average shares method. |
| 2 | For the period October 31, 2012 (inception date) to October 31, 2013. |
| 3 | Amount represents less than $0.005 per share. |
| 4 | Performance figures may reflect compensating balance arrangements, fee waivers and/or expense reimbursements. In the absence of compensating balance arrangements, fee waivers and/or expense reimbursements, the total return would have been lower. Past performance is no guarantee of future results. |
| 5 | As a result of an expense limitation arrangement, the ratio of expenses, other than interest, brokerage commissions, taxes, extraordinary expenses and deferred organizational expenses, to average net assets of Class I shares did not exceed 0.90%. This expense limitation arrangement cannot be terminated prior to December 31, 2016 without the Board of Directors’ consent. |
| 6 | The impact of compensating balance arrangements was 0.01%. |
| 7 | Reflects fee waivers and/or expense reimbursements. |
See Notes to Financial Statements.
| | |
| Western Asset Asian Opportunities Fund 2014 Annual Report | | 21 |
Financial highlights (cont’d)
| | | | | | | | |
For a share of each class of capital stock outstanding throughout each year ended October 31,
unless otherwise noted: | |
| Class IS Shares1 | | 2014 | | | 20132 | |
| | |
| Net asset value, beginning of year | | | $9.64 | | | | $10.00 | |
| | |
| Income (loss) from operations: | | | | | | | | |
Net investment income | | | 0.29 | | | | 0.27 | |
Net realized and unrealized loss | | | (0.09) | | | | (0.48) | |
Total income (loss) from operations | | | 0.20 | | | | (0.21) | |
| | |
| Less distributions from: | | | | | | | | |
Net investment income | | | (0.27) | | | | (0.15) | |
Net realized gains | | | (0.00) | 3 | | | | |
Total distributions | | | (0.27) | | | | (0.15) | |
| | |
| Net asset value, end of year | | | $9.57 | | | | $9.64 | |
Total return4 | | | 2.16 | % | | | (2.14) | % |
| | |
| Net assets, end of year (000s) | | | $19,979 | | | | $19,546 | |
| | |
| Ratios to average net assets: | | | | | | | | |
Gross expenses | | | 1.54 | % | | | 2.47 | % |
Net expenses5,6,7 | | | 0.80 | | | | 0.80 | |
Net investment income | | | 3.04 | | | | 2.71 | |
| | |
| Portfolio turnover rate | | | 35 | % | | | 81 | % |
| 1 | Per share amounts have been calculated using the average shares method. |
| 2 | For the period October 31, 2012 (inception date) to October 31, 2013. |
| 3 | Amount represents less than $0.005. |
| 4 | Performance figures may reflect compensating balance arrangements, fee waivers and/or expense reimbursements. In the absence of compensating balance arrangements, fee waivers and/or expense reimbursements, the total return would have been lower. Past performance is no guarantee of future results. |
| 5 | As a result of an expense limitation arrangement, the ratio of expenses, other than interest, brokerage commissions, taxes, extraordinary expenses and deferred organizational expenses, to average net assets of Class IS shares did not exceed 0.80%. This expense limitation arrangement cannot be terminated prior to December 31, 2016 without the Board of Directors’ consent. |
| 6 | The impact of compensating balance arrangements, if any, was less than 0.01%. |
| 7 | Reflects fee waivers and/or expense reimbursements. |
See Notes to Financial Statements.
| | |
| 22 | | Western Asset Asian Opportunities Fund 2014 Annual Report |
Notes to financial statements
1. Organization and significant accounting policies
Western Asset Asian Opportunities Fund (the “Fund”) is a separate non-diversified investment series of Western Asset Funds, Inc. (the “Corporation”). The Corporation, a Maryland corporation, is registered under the Investment Company Act of 1940, as amended (the “1940 Act”), as an open-end management investment company.
The following are significant accounting policies consistently followed by the Fund and are in conformity with U.S. generally accepted accounting principles (“GAAP”). Estimates and assumptions are required to be made regarding assets, liabilities and changes in net assets resulting from operations when financial statements are prepared. Changes in the economic environment, financial markets and any other parameters used in determining these estimates could cause actual results to differ. Subsequent events have been evaluated through the date the financial statements were issued.
(a) Investment valuation. The valuations for fixed income securities (which may include, but are not limited to, corporate, government, municipal, mortgage-backed, collateralized mortgage obligations and asset-backed securities) and certain derivative instruments are typically the prices supplied by independent third party pricing services, which may use market prices or broker/dealer quotations or a variety of valuation techniques and methodologies. The independent third party pricing services use inputs that are observable such as issuer details, interest rates, yield curves, prepayment speeds, credit risks/spreads, default rates and quoted prices for similar securities. Short-term fixed income securities that will mature in 60 days or less are valued at amortized cost, unless it is determined that using this method would not reflect an investment’s fair value. Futures contracts are valued daily at the settlement price established by the board of trade or exchange on which they are traded. Equity securities for which market quotations are available are valued at the last reported sales price or official closing price on the primary market or exchange on which they trade. When the Fund holds securities or other assets that are denominated in a foreign currency, the Fund will normally use the currency exchange rates as of 4:00 p.m. (Eastern Time). If independent third party pricing services are unable to supply prices for a portfolio investment, or if the prices supplied are deemed by the manager to be unreliable, the market price may be determined by the manager using quotations from one or more broker/dealers or at the transaction price if the security has recently been purchased and no value has yet been obtained from a pricing service or pricing broker. When reliable prices are not readily available, such as when the value of a security has been significantly affected by events after the close of the exchange or market on which the security is principally traded, but before the Fund calculates its net asset value, the Fund values these securities as determined in accordance with procedures approved by the Fund’s Board of Directors.
The Board of Directors is responsible for the valuation process and has delegated the supervision of the daily valuation process to the Legg Mason North American Fund Valuation Committee (the “Valuation Committee”). The Valuation Committee, pursuant to the policies adopted by the Board of Directors, is responsible for making fair value determinations,
| | |
| Western Asset Asian Opportunities Fund 2014 Annual Report | | 23 |
Notes to financial statements (cont’d)
evaluating the effectiveness of the Fund’s pricing policies, and reporting to the Board of Directors. When determining the reliability of third party pricing information for investments owned by the Fund, the Valuation Committee, among other things, conducts due diligence reviews of pricing vendors, monitors the daily change in prices and reviews transactions among market participants.
The Valuation Committee will consider pricing methodologies it deems relevant and appropriate when making fair value determinations. Examples of possible methodologies include, but are not limited to, multiple of earnings; discount from market of a similar freely traded security; discounted cash-flow analysis; book value or a multiple thereof; risk premium/yield analysis; yield to maturity; and/or fundamental investment analysis. The Valuation Committee will also consider factors it deems relevant and appropriate in light of the facts and circumstances. Examples of possible factors include, but are not limited to, the type of security; the issuer’s financial statements; the purchase price of the security; the discount from market value of unrestricted securities of the same class at the time of purchase; analysts’ research and observations from financial institutions; information regarding any transactions or offers with respect to the security; the existence of merger proposals or tender offers affecting the security; the price and extent of public trading in similar securities of the issuer or comparable companies; and the existence of a shelf registration for restricted securities.
For each portfolio security that has been fair valued pursuant to the policies adopted by the Board of Directors, the fair value price is compared against the last available and next available market quotations. The Valuation Committee reviews the results of such back testing monthly and fair valuation occurrences are reported to the Board of Directors quarterly.
The Fund uses valuation techniques to measure fair value that are consistent with the market approach and/or income approach, depending on the type of security and the particular circumstance. The market approach uses prices and other relevant information generated by market transactions involving identical or comparable securities. The income approach uses valuation techniques to discount estimated future cash flows to present value.
GAAP establishes a disclosure hierarchy that categorizes the inputs to valuation techniques used to value assets and liabilities at measurement date. These inputs are summarized in the three broad levels listed below:
| Ÿ | | Level 1 — quoted prices in active markets for identical investments |
| Ÿ | | Level 2 — other significant observable inputs (including quoted prices for similar investments, interest rates, prepayment speeds, credit risk, etc.) |
| Ÿ | | Level 3 — significant unobservable inputs (including the Fund’s own assumptions in determining the fair value of investments) |
The inputs or methodologies used to value securities are not necessarily an indication of the risk associated with investing in those securities.
| | |
| 24 | | Western Asset Asian Opportunities Fund 2014 Annual Report |
The following is a summary of the inputs used in valuing the Fund’s assets and liabilities carried at fair value:
| | | | | | | | | | | | | | | | |
| ASSETS | |
| Description | | Quoted Prices
(Level 1) | | | Other Significant
Observable Inputs
(Level 2) | | | Significant
Unobservable
Inputs
(Level 3) | | | Total | |
| Long-term investments†: | | | | | | | | | | | | | | | | |
Sovereign bonds | | | — | | | $ | 10,648,548 | | | | — | | | $ | 10,648,548 | |
Corporate bonds & notes | | | — | | | | 9,301,495 | | | | — | | | | 9,301,495 | |
| Total investments | | | — | | | $ | 19,950,043 | | | | — | | | $ | 19,950,043 | |
| Other financial instruments: | | | | | | | | | | | | | | | | |
Futures contracts | | $ | 5,204 | | | | — | | | | — | | | $ | 5,204 | |
Forward foreign currency contracts | | | — | | | $ | 32,532 | | | | — | | | | 32,532 | |
OTC interest rate swaps | | | — | | | | 8,077 | | | | — | | | | 8,077 | |
| Total other financial instruments | | $ | 5,204 | | | $ | 40,609 | | | | — | | | $ | 45,813 | |
| Total | | $ | 5,204 | | | $ | 19,990,652 | | | | — | | | $ | 19,995,856 | |
|
| LIABILITIES | |
| Description | | Quoted Prices
(Level 1) | | | Other Significant
Observable Inputs (Level 2) | | | Significant
Unobservable
Inputs (Level 3) | | | Total | |
| Other financial instruments: | | | | | | | | | | | | | | | | |
Forward foreign currency contracts | | | — | | | $ | 28,029 | | | | — | | | $ | 28,029 | |
OTC interest rate swaps | | | — | | | | 6,302 | | | | — | | | | 6,302 | |
| Total | | | — | | | $ | 34,331 | | | | — | | | $ | 34,331 | |
| † | See Schedule of Investments for additional detailed categorizations. |
The Fund’s policy is to recognize transfers between levels as of the end of the reporting period. At October 31, 2014, securities valued at $804,235 were transferred from Level 3 to Level 2 within the fair value hierarchy because of the availability of a quoted price in an active market for an identical investment.
(b) Fund concentration. Because the Fund’s investments are focused on Asian issuers, the Fund’s performance is expected to be closely tied to social, political and economic conditions within Asia and to be more volatile than the performance of more geographically diversified funds.
(c) Repurchase agreements. The Fund may enter into repurchase agreements with institutions that its investment adviser has determined are creditworthy. Each repurchase agreement is recorded at cost. Under the terms of a typical repurchase agreement, the Fund acquires a debt security subject to an obligation of the seller to repurchase, and of the Fund to resell, the security at an agreed-upon price and time, thereby determining the yield during the Fund’s holding period. When entering into repurchase agreements, it is the Fund’s policy that its custodian or a third party custodian, acting on the Fund’s behalf, take possession of the underlying collateral securities, the market value of which, at all times, at least equals the principal amount of the repurchase transaction, including accrued interest. To the extent that any repurchase transaction maturity exceeds one business day, the value
| | |
| Western Asset Asian Opportunities Fund 2014 Annual Report | | 25 |
Notes to financial statements (cont’d)
of the collateral is marked-to-market and measured against the value of the agreement in an effort to ensure the adequacy of the collateral. If the counterparty defaults, the Fund generally has the right to use the collateral to satisfy the terms of the repurchase transaction. However, if the market value of the collateral declines during the period in which the Fund seeks to assert its rights or if bankruptcy proceedings are commenced with respect to the seller of the security, realization of the collateral by the Fund may be delayed or limited.
(d) Foreign currency translation. Investment securities and other assets and liabilities denominated in foreign currencies are translated into U.S. dollar amounts based upon prevailing exchange rates on the date of valuation. Purchases and sales of investment securities and income and expense items denominated in foreign currencies are translated into U.S. dollar amounts based upon prevailing exchange rates on the respective dates of such transactions.
The Fund does not isolate that portion of the results of operations resulting from fluctuations in foreign exchange rates on investments from the fluctuations arising from changes in market prices of securities held. Such fluctuations are included with the net realized and unrealized gain or loss on investments.
Net realized foreign exchange gains or losses arise from sales of foreign currencies, including gains and losses on forward foreign currency contracts, currency gains or losses realized between the trade and settlement dates on securities transactions, and the difference between the amounts of dividends, interest, and foreign withholding taxes recorded on the Fund’s books and the U.S. dollar equivalent of the amounts actually received or paid. Net unrealized foreign exchange gains and losses arise from changes in the values of assets and liabilities, other than investments in securities, on the date of valuation, resulting from changes in exchange rates.
Foreign security and currency transactions may involve certain considerations and risks not typically associated with those of U.S. dollar denominated transactions as a result of, among other factors, the possibility of lower levels of governmental supervision and regulation of foreign securities markets and the possibility of political or economic instability.
(e) Forward foreign currency contracts. The Fund enters into a forward foreign currency contract to hedge against foreign currency exchange rate risk on its non-U.S. dollar denominated securities or to facilitate settlement of a foreign currency denominated portfolio transaction. A forward foreign currency contract is an agreement between two parties to buy and sell a currency at a set price with delivery and settlement at a future date. The contract is marked-to-market daily and the change in value is recorded by the Fund as an unrealized gain or loss. When a forward foreign currency contract is closed, through either delivery or offset by entering into another forward foreign currency contract, the Fund recognizes a realized gain or loss equal to the difference between the value of the contract at the time it was opened and the value of the contract at the time it is closed.
Forward foreign currency contracts involve elements of market risk in excess of the amounts reflected on the Statement of Assets and Liabilities. The Fund bears the risk of an unfavorable change in the foreign exchange rate underlying the forward foreign currency
| | |
| 26 | | Western Asset Asian Opportunities Fund 2014 Annual Report |
contract. Risks may also arise upon entering into these contracts from the potential inability of the counterparties to meet the terms of their contracts.
(f) Credit and market risk. The Fund invests in high-yield and emerging market instruments that are subject to certain credit and market risks. The yields of high-yield and emerging market debt obligations reflect, among other things, perceived credit and market risks. The Fund’s investments in securities rated below investment grade typically involve risks not associated with higher rated securities including, among others, greater risk related to timely and ultimate payment of interest and principal, greater market price volatility and less liquid secondary market trading. The consequences of political, social, economic or diplomatic changes may have disruptive effects on the market prices of investments held by the Fund. The Fund’s investments in non-U.S. dollar denominated securities may also result in foreign currency losses caused by devaluations and exchange rate fluctuations.
(g) Swap agreements. The Fund invests in swaps for the purpose of managing its exposure to interest rate, credit or market risk, or for other purposes. The use of swaps involves risks that are different from those associated with other portfolio transactions. Swap agreements are privately negotiated in the over-the-counter market (“OTC Swaps”) or may be executed on a registered exchange (“Centrally Cleared Swaps”). Unlike Centrally Cleared Swaps, the Fund has credit exposure to the counterparties of OTC Swaps.
Swap contracts are marked-to-market daily and changes in value are recorded as unrealized appreciation (depreciation). The daily change in valuation of Centrally Cleared Swaps, if any, is recorded as a receivable or payable for variation margin on the Statement of Assets and Liabilities. Gains or losses are realized upon termination of the swap agreement. Collateral, in the form of restricted cash or securities, may be required to be held in segregated accounts with the Fund’s custodian in compliance with the terms of the swap contracts. Securities posted as collateral for swap contracts are identified in the Schedule of Investments and restricted cash, if any, is identified on the Statement of Assets and Liabilities. Risks may exceed amounts recorded in the Statement of Assets and Liabilities. These risks include changes in the returns of the underlying instruments, failure of the counterparties to perform under the contracts’ terms, and the possible lack of liquidity with respect to the swap agreements.
OTC swap payments received or made at the beginning of the measurement period are reflected as a premium or deposit, respectively, on the Statement of Assets and Liabilities. These upfront payments are amortized over the life of the swap and are recognized as realized gain or loss in the Statement of Operations. Net periodic payments received or paid by the Fund are recognized as a realized gain or loss in the Statement of Operations.
The Fund’s maximum exposure in the event of a defined credit event on a credit default swap to sell protection is the notional amount. As of October 31, 2014, the Fund did not hold any credit default swaps to sell protection.
For average notional amounts of swaps held during the year ended October 31, 2014, see Note 4.
| | |
| Western Asset Asian Opportunities Fund 2014 Annual Report | | 27 |
Notes to financial statements (cont’d)
Interest rate swaps
The Fund enters into interest rate swap contracts to manage its exposure to interest rate risk. Interest rate swaps are agreements between two parties to exchange cash flows based on a notional principal amount. The Fund may elect to pay a fixed rate and receive a floating rate, or receive a fixed rate and pay a floating rate, on a notional principal amount. Interest rate swaps are marked-to-market daily based upon quotations from market makers and the change, if any, is recorded as an unrealized gain or loss in the Statement of Operations. When a swap contract is terminated early, the Fund records a realized gain or loss equal to the difference between the original cost and the settlement amount of the closing transaction.
The risks of interest rate swaps include changes in market conditions that will affect the value of the contract or changes in the present value of the future cash flow streams and the possible inability of the counterparty to fulfill its obligations under the agreement. The Fund’s maximum risk of loss from counterparty credit risk is the discounted net value of the cash flows to be received from the counterparty over the contract’s remaining life, to the extent that that amount is positive. This risk is mitigated by the posting of collateral by the counterparty to the Fund to cover the Fund’s exposure to the counterparty.
(h) Foreign investment risks. The Fund’s investments in foreign securities may involve risks not present in domestic investments. Since securities may be denominated in foreign currencies, may require settlement in foreign currencies or pay interest or dividends in foreign currencies, changes in the relationship of these foreign currencies to the U.S. dollar can significantly affect the value of the investments and earnings of the Fund. Foreign investments may also subject the Fund to foreign government exchange restrictions, expropriation, taxation or other political, social or economic developments, all of which affect the market and/or credit risk of the investments.
(i) Counterparty risk and credit-risk-related contingent features of derivative instruments. The Fund may invest in certain securities or engage in other transactions, where the Fund is exposed to counterparty credit risk in addition to broader market risks. The Fund may invest in securities of issuers, which may also be considered counterparties as trading partners in other transactions. This may increase the risk of loss in the event of default or bankruptcy by the counterparty or if the counterparty otherwise fails to meet its contractual obligations. The Fund’s investment manager attempts to mitigate counterparty risk by (i) periodically assessing the creditworthiness of its trading partners, (ii) monitoring and/or limiting the amount of its net exposure to each individual counterparty based on its assessment and (iii) requiring collateral from the counterparty for certain transactions. Market events and changes in overall economic conditions may impact the assessment of such counterparty risk by the investment manager. In addition, declines in the values of underlying collateral received may expose the Fund to increased risk of loss.
The Fund has entered into master agreements with certain of its derivative counterparties that provide for general obligations, representations, agreements, collateral, events of default or termination and credit related contingent features. The credit related contingent
| | |
| 28 | | Western Asset Asian Opportunities Fund 2014 Annual Report |
features include, but are not limited to, a percentage decrease in the Fund’s net assets or NAV over a specified period of time. If these credit related contingent features were triggered, the derivatives counterparty could terminate the positions and demand payment or require additional collateral.
Collateral requirements differ by type of derivative. Collateral or margin requirements are set by the broker or exchange clearinghouse for exchange traded derivatives while collateral terms are contract specific for over-the-counter traded derivatives. Cash collateral that has been pledged to cover obligations of the Fund under derivative contracts, if any, will be reported separately in the Statement of Assets and Liabilities. Securities pledged as collateral, if any, for the same purpose are noted in the Schedule of Investments.
Absent an event of default by the counterparty or a termination of the agreement, the terms of the master agreements do not result in an offset of reported amounts of financial assets and financial liabilities in the Statement of Assets and Liabilities across transactions between the Fund and the applicable counterparty. The enforceability of the right to offset may vary by jurisdiction.
As of October 31, 2014, the Fund held forward foreign currency contracts and OTC interest rate swaps with credit related contingent features which had a liability position of $34,331. If a contingent feature in the master agreements would have been triggered, the Fund would have been required to pay this amount to its derivatives counterparties.
(j) Security transactions and investment income. Security transactions are accounted for on a trade date basis. Interest income, adjusted for amortization of premium and accretion of discount, is recorded on the accrual basis. Dividend income is recorded on the ex-dividend date. Foreign dividend income is recorded on the ex-dividend date or as soon as practicable after the Fund determines the existence of a dividend declaration after exercising reasonable due diligence. The cost of investments sold is determined by use of the specific identification method. To the extent any issuer defaults or a credit event occurs that impacts the issuer, the Fund may halt any additional interest income accruals and consider the realizability of interest accrued up to the date of default or credit event.
(k) Distributions to shareholders. Distributions from net investment income of the Fund, if any, are declared and paid on a quarterly basis. Distributions of net realized gains, if any, are declared at least annually. Distributions to shareholders of the Fund are recorded on the ex-dividend date and are determined in accordance with income tax regulations, which may differ from GAAP.
(l) Share class accounting. Investment income, common expenses and realized/unrealized gains (losses) on investments are allocated to the various classes of the Fund on the basis of daily net assets of each class. Fees relating to a specific class are charged directly to that share class.
(m) Compensating balance arrangements. The Fund has an arrangement with its custodian bank whereby a portion of the custodian’s fees is paid indirectly by credits earned on the Fund’s cash on deposit with the bank.
| | |
| Western Asset Asian Opportunities Fund 2014 Annual Report | | 29 |
Notes to financial statements (cont’d)
(n) Federal and other taxes. It is the Fund’s policy to comply with the federal income and excise tax requirements of the Internal Revenue Code of 1986 (the “Code”), as amended, applicable to regulated investment companies. Accordingly, the Fund intends to distribute its taxable income and net realized gains, if any, to shareholders in accordance with timing requirements imposed by the Code. Therefore, no federal or state income tax provision is required in the Fund’s financial statements.
Management has analyzed the Fund’s tax positions taken on income tax returns for all open tax years and has concluded that as of October 31, 2014, no provision for income tax is required in the Fund’s financial statements. The Fund’s federal and state income and federal excise tax returns for tax years for which the applicable statutes of limitations have not expired are subject to examination by the Internal Revenue Service and state departments of revenue.
Under the applicable foreign tax laws, a withholding tax may be imposed on interest, dividends and capital gains at various rates. Realized gains upon disposition of securities issued in or by certain foreign countries are subject to capital gains tax imposed by those countries. As of October 31, 2014, there were $41 of capital gains tax liabilities accrued on unrealized gains.
(o) Reclassification. GAAP requires that certain components of net assets be reclassified to reflect permanent differences between financial and tax reporting. These reclassifications have no effect on net assets or net asset values per share. During the current year, the following reclassifications have been made:
| | | | | | | | |
| | | Undistributed Net
Investment Income | | | Accumulated Net
Realized Loss | |
| (a) | | $ | 38,101 | | | $ | (38,101) | |
| (a) | Reclassifications are due to foreign currency transactions treated as ordinary income for tax purposes and book/tax differences in the treatment of swap contracts. |
2. Investment management agreement and other transactions with affiliates
Legg Mason Partners Fund Advisor, LLC (“LMPFA”) is the Fund’s investment manager. Western Asset Management Company (“Western Asset”), Western Asset Management Company Limited (“Western Asset Limited”), Western Asset Management Company Pte. Ltd. (“Western Singapore”) and Western Asset Management Company Ltd. (“Western Japan”) are the Fund’s subadvisers. LMPFA, Western Asset, Western Asset Limited, Western Singapore and Western Japan are wholly-owned subsidiaries of Legg Mason, Inc. (“Legg Mason”).
LMPFA provides administrative and certain oversight services to the Fund. The Fund pays LMPFA an investment management fee, calculated daily and paid monthly, at an annual rate of 0.60% of the Fund’s average daily net assets.
As a result of expense limitation arrangements between the Fund and LMPFA, the ratio of expenses other than, interest, brokerage commissions, taxes, extraordinary expenses and deferred organizational expenses, to average net assets of Class FI, Class I and Class IS
| | |
| 30 | | Western Asset Asian Opportunities Fund 2014 Annual Report |
shares did not exceed 1.25%, 0.90% and 0.80%, respectively. These expense limitation arrangements cannot be terminated prior to December 31, 2016 without the Board of Directors’ consent.
During the year ended October 31, 2014, fees waived and/or expenses reimbursed amounted to $146,981.
The investment manager is permitted to recapture amounts waived and/or reimbursed to a class within two years after the fiscal year in which the investment manager earned the fee or incurred the expense if the class’ total annual operating expenses have fallen to a level below the expense limitation (“expense cap”) in effect at the time the fees were earned or the expenses incurred. In no case will the investment manager recapture any amount that would result, on any particular business day of the Fund, in the class’ total annual operating expenses exceeding the expense cap or any other lower limit then in effect.
Pursuant to these arrangements, at October 31, 2014, the Fund had remaining fee waivers and/or expense reimbursements subject to recapture by LMPFA and respective dates of expiration as follows:
| | | | | | | | | | | | |
| | | Class FI | | | Class I | | | Class IS | |
| Expires October 31, 2015 | | $ | 174 | | | $ | 3,799 | | | $ | 330,436 | |
| Expires October 31, 2016 | | | 80 | | | | 2,432 | | | | 144,469 | |
| Total fee waivers/expense reimbursements subject to recapture | | $ | 254 | | | $ | 6,231 | | | $ | 474,905 | |
For the year ended October 31, 2014, LMPFA did not recapture any fees.
Legg Mason Investor Services, LLC (“LMIS”), a wholly-owned broker-dealer subsidiary of Legg Mason, serves as the Fund’s sole and exclusive distributor.
As of October 31, 2014, Legg Mason and its affiliates owned 99% of the Fund.
All officers of the Fund are employees of Legg Mason or its affiliates and do not receive compensation from the Fund.
3. Investments
During the year ended October 31, 2014, the aggregate cost of purchases and proceeds from sales of investments (excluding short-term investments) were as follows:
| | | | |
| Purchases | | $ | 8,530,294 | |
| Sales | | | 6,696,557 | |
At October 31, 2014, the aggregate gross unrealized appreciation and depreciation of investments for federal income tax purposes were as follows:
| | | | |
| Gross unrealized appreciation | | $ | 268,167 | |
| Gross unrealized depreciation | | | (1,164,565) | |
| Net unrealized depreciation | | $ | (896,398) | |
| | |
| Western Asset Asian Opportunities Fund 2014 Annual Report | | 31 |
Notes to financial statements (cont’d)
At October 31, 2014, the Fund had the following open futures contracts:
| | | | | | | | | | | | | | | | | | | | |
| | | Number of
Contracts | | | Expiration
Date | | | Basis
Value | | | Market
Value | | | Unrealized
Appreciation | |
| Contracts to Buy: | | | | | | | | | | | | | | | | | | | | |
| Korea 10-Year Bond | | | 3 | | | | 12/14 | | | $ | 333,497 | | | $ | 338,701 | | | $ | 5,204 | |
At October 31, 2014, the Fund had the following open forward foreign currency contracts:
| | | | | | | | | | | | | | | | | | | | | | |
Currency
Purchased | | | Currency
Sold | | | Counterparty | | Settlement
Date | | | Unrealized
Appreciation
(Depreciation) | |
| IDR | | | 2,300,000,000 | | | | USD | | | | 192,420 | | | BNP Paribas SA | | | 11/10/14 | | | $ | (2,289) | |
| SGD | | | 400,000 | | | | USD | | | | 314,460 | | | BNP Paribas SA | | | 11/17/14 | | | | (3,126) | |
| SGD | | | 240,000 | | | | USD | | | | 189,660 | | | Royal Bank of Canada | | | 11/17/14 | | | | (2,859) | |
| KRW | | | 700,000,000 | | | | USD | | | | 659,146 | | | BNP Paribas SA | | | 11/28/14 | | | | (4,800) | |
| SGD | | | 520,000 | | | | USD | | | | 408,622 | | | State Street Bank & Trust Co. | | | 11/28/14 | | | | (3,911) | |
| KRW | | | 380,000,000 | | | | USD | | | | 358,119 | | | BNP Paribas SA | | | 11/28/14 | | | | (2,902) | |
| USD | | | 78,678 | | | | SGD | | | | 100,000 | | | State Street Bank & Trust Co. | | | 11/28/14 | | | | 849 | |
| USD | | | 235,929 | | | | SGD | | | | 300,000 | | | State Street Bank & Trust Co. | | | 11/28/14 | | | | 2,442 | |
| USD | | | 629,416 | | | | SGD | | | | 800,000 | | | Bank of New York | | | 11/28/14 | | | | 6,784 | |
| PHP | | | 1,700,000 | | | | USD | | | | 39,009 | | | BNP Paribas SA | | | 12/3/14 | | | | (1,164) | |
| INR | | | 62,000,000 | | | | USD | | | | 994,331 | | | State Street Bank & Trust Co. | | | 12/8/14 | | | | 8,239 | |
| MYR | | | 1,840,000 | | | | USD | | | | 563,346 | | | BNP Paribas SA | | | 12/8/14 | | | | (5,380) | |
| THB | | | 2,700,000 | | | | USD | | | | 83,786 | | | BNP Paribas SA | | | 12/9/14 | | | | (1,019) | |
| USD | | | 214,002 | | | | THB | | | | 7,000,000 | | | ING Bank NV | | | 12/9/14 | | | | (579) | |
| USD | | | 266,622 | | | | TWD | | | | 8,000,000 | | | Royal Bank of Canada | | | 12/17/14 | | | | 3,485 | |
| CNY | | | 4,300,000 | | | | USD | | | | 693,548 | | | Royal Bank of Canada | | | 12/19/14 | | | | 7,165 | |
| USD | | | 79,991 | | | | PHP | | | | 3,500,000 | | | Royal Bank of Canada | | | 1/12/15 | | | | 2,170 | |
| CNY | | | 1,200,000 | | | | USD | | | | 194,194 | | | BNP Paribas SA | | | 1/22/15 | | | | 847 | |
| CNY | | | 1,200,000 | | | | USD | | | | 194,489 | | | Royal Bank of Canada | | | 1/22/15 | | | | 551 | |
| Total | | | | | | | | | | | | | | | | | | | | $ | 4,503 | |
At October 31, 2014, the Fund had the following open swap contracts:
| | | | | | | | | | | | | | | | | | | | | | |
| OTC INTEREST RATE SWAPS | |
| Swap Counterparty | | Notional
Amount | | | Termination
Date | | | Payments Made By The Fund† | | Payments
Received By
The Fund† | | | Upfront
Premiums
Paid
(Received) | | | Unrealized
Appreciation
(Depreciation) | |
| Deutsche Bank AG | | | 65,000,000 | INR | | | 11/5/17 | | | 7.195% semi-annually | | | INR-MIBOR‡-OIS-Compound | | | | — | | | $ | (6,302) | * |
| Deutsche Bank AG | | | 750,000 | SGD | | | 10/1/18 | | | SGD-SOR-Reuters | | | 1.570% semi-annually | | | | — | | | | 3,846 | |
| Deutsche Bank AG | | | 1,400,000 | SGD | | | 10/23/18 | | | SGD-SOR-Reuters | | | 1.450% semi-annually | | | | — | | | | 1,515 | |
| Deutsche Bank AG | | | 2,000,000 | SGD | | | 3/4/19 | | | SGD-SOR-Reuters | | | 1.555% semi-annually | | | | — | | | | 2,716 | |
| Total | | | | | | | | | | | | | | | | | — | | | $ | 1,775 | |
| † | Percentage shown is an annual percentage rate. |
| ‡ | MIBOR — Mumbai Inter-Bank Offer Rate |
| * | Swap contract is valued in good faith in accordance with procedures approved by the Board of Directors (See Note 1). |
| | |
| 32 | | Western Asset Asian Opportunities Fund 2014 Annual Report |
4. Derivative instruments and hedging activities
GAAP requires enhanced disclosure about an entity’s derivative and hedging activities.
Below is a table, grouped by derivative type, that provides information about the fair value and the location of derivatives within the Statement of Assets and Liabilities at October 31, 2014.
| | | | | | | | | | | | |
| ASSET DERIVATIVES1 | |
| | | Interest Rate
Risk | | | Foreign
Exchange Risk | | | Total | |
| Futures contracts2 | | $ | 5,204 | | | | — | | | $ | 5,204 | |
| Forward foreign currency contracts | | | — | | | $ | 32,532 | | | | 32,532 | |
| OTC swap contracts | | $ | 8,077 | | | | — | | | | 8,077 | |
| Total | | $ | 13,281 | | | $ | 32,532 | | | $ | 45,813 | |
|
| LIABILITY DERIVATIVES1 | |
| | | Interest Rate
Risk | | | Foreign
Exchange Risk | | | Total | |
| Forward foreign currency contracts | | | — | | | $ | 28,029 | | | $ | 28,029 | |
| OTC swap contracts | | $ | 6,302 | | | | — | | | | 6,302 | |
| Total | | $ | 6,302 | | | $ | 28,029 | | | $ | 34,331 | |
| 1 | Generally, the balance sheet location for asset derivatives is receivables/net unrealized appreciation (depreciation) and for liability derivatives is payables/net unrealized appreciation (depreciation). |
| 2 | Includes cumulative appreciation (depreciation) of futures contracts as reported in the footnotes. Only variation margin is reported within the receivables and/or payables on the Statement of Assets and Liabilities. |
The following tables provide information about the effect of derivatives and hedging activities on the Fund’s Statement of Operations for the year ended October 31, 2014. The first table provides additional detail about the amounts and sources of gains (losses) realized on derivatives during the period. The second table provides additional information about the change in unrealized appreciation (depreciation) resulting from the Fund’s derivatives and hedging activities during the period.
| | | | | | | | | | | | |
| AMOUNT OF REALIZED GAIN (LOSS) ON DERIVATIVES RECOGNIZED | |
| | | Interest
Rate Risk | | | Foreign
Exchange Risk | | | Total | |
| Forward foreign currency contracts1 | | | — | | | $ | 1,107 | | | $ | 1,107 | |
| OTC swap contracts | | $ | 22,996 | | | | — | | | | 22,996 | |
| Total | | $ | 22,996 | | | $ | 1,107 | | | $ | 24,103 | |
| 1 | Net realized gain (loss) from forward foreign currency contracts is reported in net realized gain (loss) from foreign currency transactions in the Statement of Operations. |
| | |
| Western Asset Asian Opportunities Fund 2014 Annual Report | | 33 |
Notes to financial statements (cont’d)
| | | | | | | | | | | | |
| CHANGE IN UNREALIZED APPRECIATION ON DERIVATIVES RECOGNIZED | |
| | | Interest
Rate Risk | | | Foreign
Exchange Risk | | | Total | |
| Futures contracts | | $ | 5,204 | | | | — | | | $ | 5,204 | |
| Forward foreign currency contracts1 | | | — | | | $ | 4,392 | | | | 4,392 | |
| OTC swap contracts | | | 30,284 | | | | — | | | | 30,284 | |
| Total | | $ | 35,488 | | | $ | 4,392 | | | $ | 39,880 | |
| 1 | The change in unrealized appreciation (depreciation) from forward foreign currency contracts is reported in the change in net unrealized appreciation (depreciation) from foreign currencies in the Statement of Operations. |
During the year ended October 31, 2014, the volume of derivative activity for the Fund was as follows:
| | | | |
| | | Average Market
Value | |
| Futures contracts (to buy) | | $ | 26,054 | |
| Forward foreign currency contracts (to buy) | | | 3,953,758 | |
| Forward foreign currency contracts (to sell) | | | 1,303,886 | |
| |
| | | Average Notional
Balance | |
| Interest rate swap contracts | | $ | 3,748,656 | |
The following table presents by financial instrument, the Fund’s derivative assets net of the related collateral received by the Fund at October 31, 2014:
| | | | | | | | | | | | |
| | | Gross Amount of Derivative
Assets in the Statement of
Assets and Liabilities1 | | | Collateral
Received | | | Net
Amount | |
| Futures contracts | | $ | 5,212 | | | | — | | | $ | 5,212 | |
| OTC swap contracts | | | 8,077 | | | | — | | | | 8,077 | |
| Forward foreign currency contracts | | | 32,532 | | | | — | | | | 32,532 | |
| Total | | $ | 45,821 | | | | — | | | $ | 45,821 | |
The following table presents by financial instrument, the Fund’s derivative liabilities net of the related collateral pledged by the Fund at October 31, 2014:
| | | | | | | | | | | | |
| | | Gross Amount of Derivative
Liabilities in the Statement of
Assets and Liabilities1 | | | Collateral
Pledged | | | Net
Amount | |
| OTC swap contracts | | $ | 6,302 | | | | — | | | $ | 6,302 | |
| Forward foreign currency contracts | | | 28,029 | | | | — | | | | 28,029 | |
| Total | | $ | 34,331 | | | | — | | | $ | 34,331 | |
| 1 | Absent an event of default or early termination, derivative assets and liabilities are presented gross and not offset in the Statement of Assets and Liabilities. |
5. Class specific expenses, waivers and/or expense reimbursements
The Fund has adopted a Rule 12b-1 distribution plan and under that plan the Fund pays a distribution fee with respect to its Class FI shares calculated at the annual rate of 0.25% of the average daily net assets of the class. Service and distribution fees are accrued daily and
| | |
| 34 | | Western Asset Asian Opportunities Fund 2014 Annual Report |
paid monthly. Class I and Class IS shares are not subject to distribution and/or service fees under the plans.
For the year ended October 31, 2014, class specific expenses were as follows:
| | | | | | | | |
| | | Service and/or
Distribution Fees | | | Transfer Agent
Fees | |
| Class FI | | $ | 24 | | | $ | 31 | |
| Class I | | | — | | | | 704 | |
| Class IS | | | — | | | | 936 | |
| Total | | $ | 24 | | | $ | 1,671 | |
For the year ended October 31, 2014, waivers and/or expense reimbursements by class were as follows:
| | | | |
| | | Waivers/Expense
Reimbursements | |
| Class FI | | $ | 80 | |
| Class I | | | 2,432 | |
| Class IS | | | 144,469 | |
| Total | | $ | 146,981 | |
6. Distributions to shareholders by class
| | | | | | | | |
| | | Year Ended
October 31, 2014 | | | Year Ended
October 31, 2013† | |
| Net Investment Income: | | | | | | | | |
| Class FI | | $ | 214 | | | $ | 122 | |
| Class I | | | 7,302 | | | | 3,716 | |
| Class IS | | | 549,540 | | | | 298,169 | |
| Total | | $ | 557,056 | | | $ | 302,007 | |
| | |
| Net Realized Gains: | | | | | | | | |
| Class FI | | $ | 2 | | | | — | |
| Class I | | | 68 | | | | — | |
| Class IS | | | 4,868 | | | | — | |
| Total | | $ | 4,938 | | | | — | |
| † | For the period October 31, 2012 (inception date) to October 31, 2013. |
7. Capital shares
At October 31, 2014, the Corporation had 42.7 billion shares of capital stock authorized with a par value of $0.001 per share.
Transactions in shares of each class were as follows:
| | | | | | | | | | | | | | | | |
| | | Year Ended
October 31, 2014 | | | Year Ended
October 31, 2013† | |
| | | Shares | | | Amount | | | Shares | | | Amount | |
| Class FI | | | | | | | | | | | | | | | | |
| Shares sold | | | — | | | | — | | | | 1,000 | | | $ | 10,000 | |
| Shares issued on reinvestment | | | 23 | | | $ | 217 | | | | 12 | | | | 122 | |
| Net increase | | | 23 | | | $ | 217 | | | | 1,012 | | | $ | 10,122 | |
| | |
| Western Asset Asian Opportunities Fund 2014 Annual Report | | 35 |
Notes to financial statements (cont’d)
| | | | | | | | | | | | | | | | |
| | | Year Ended
October 31, 2014 | | | Year Ended
October 31, 2013† | |
| | | Shares | | | Amount | | | Shares | | | Amount | |
| | | | |
| Class I | | | | | | | | | | | | | | | | |
| Shares sold | | | — | | | | — | | | | 27,864 | | | $ | 280,000 | |
| Shares issued on reinvestment | | | 781 | | | $ | 7,369 | | | | 376 | | | | 3,716 | |
| Shares repurchased | | | (54) | | | | (515) | | | | (12) | | | | (113) | |
| Net increase | | | 727 | | | $ | 6,854 | | | | 28,228 | | | $ | 283,603 | |
| | | | |
| Class IS | | | | | | | | | | | | | | | | |
| Shares sold | | | — | | | | — | | | | 1,998,000 | | | $ | 19,980,000 | |
| Shares issued on reinvestment | | | 58,904 | | | $ | 554,408 | | | | 30,230 | | | | 298,169 | |
| Shares repurchased | | | — | | | | — | | | | — | | | | — | |
| Net increase | | | 58,904 | | | $ | 554,408 | | | | 2,028,230 | | | $ | 20,278,169 | |
| † | For the period October 31, 2012 (inception date) to October 31, 2013. |
8. Income tax information and distributions to shareholders
The tax character of distributions paid during the fiscal years ended October 31, was as follows:
| | | | | | | | |
| | | 2014 | | | 2013 | |
| Distributions paid from: | | | | | | | | |
| Ordinary income | | $ | 557,069 | | | $ | 302,007 | |
| Net long-term capital gains | | | 4,925 | | | | — | |
| Total distributions paid | | $ | 561,994 | | | $ | 302,007 | |
As of October 31, 2014, the components of accumulated earnings on a tax basis were as follows:
| | | | |
| Undistributed ordinary income — net | | $ | 214,454 | |
| Other book/tax temporary differences(a) | | | (88,676) | |
| Unrealized appreciation (depreciation)(b) | | | (887,691) | |
| Total accumulated earnings (losses) — net | | $ | (761,913) | |
| (a) | Other book/tax temporary differences are attributable to the tax deferral of losses on straddles, the realization for tax purposes of unrealized gains (losses) on certain foreign currency contracts and book/tax differences in the timing of the deductibility of various expenses. |
| (b) | The difference between book-basis and tax-basis unrealized appreciation (depreciation) is attributable to the tax deferral of losses on wash sales. |
| | |
| 36 | | Western Asset Asian Opportunities Fund 2014 Annual Report |
Report of independent registered public accounting firm
To the Board of Directors of Western Asset Funds, Inc. and to the Shareholders of Western Asset Asian Opportunities Fund:
In our opinion, the accompanying statement of assets and liabilities, including the schedule of investments, and the related statements of operations and of changes in net assets and the financial highlights present fairly, in all material respects, the financial position of the Western Asset Asian Opportunities Fund (one of the funds comprising Western Asset Funds, Inc., the “Fund”) at October 31, 2014, the results of its operations, the changes in its net assets and the financial highlights for each of the periods presented, in conformity with accounting principles generally accepted in the United States of America. These financial statements and financial highlights (hereafter referred to as “financial statements”) are the responsibility of the Fund’s management. Our responsibility is to express an opinion on these financial statements based on our audits. We conducted our audits of these financial statements in accordance with the standards of the Public Company Accounting Oversight Board (United States). Those standards require that we plan and perform the audit to obtain reasonable assurance about whether the financial statements are free of material misstatement. An audit includes examining, on a test basis, evidence supporting the amounts and disclosures in the financial statements, assessing the accounting principles used and significant estimates made by management, and evaluating the overall financial statement presentation. We believe that our audits, which included confirmation of securities at October 31, 2014 by correspondence with the custodian and brokers, provide a reasonable basis for our opinion.
PricewaterhouseCoopers LLP
Baltimore, Maryland
December 17, 2014
| | |
| Western Asset Asian Opportunities Fund 2014 Annual Report | | 37 |
Additional information (unaudited)
Information about Directors and Officers
The business and affairs of Western Asset Asian Opportunities Fund (the “Fund”) are conducted by management under the supervision and subject to the direction of its Board of Directors. The business address of each Director is c/o Kenneth D. Fuller, Legg Mason, 100 International Drive, 11th Floor, Baltimore, Maryland 21202. Information pertaining to the Directors and officers of the Fund is set forth below.
The Statement of Additional Information includes additional information about Directors and is available, without charge, upon request by calling the Fund at 1-877-721-1926.
| | |
| Independent Directors† | | |
| Robert Abeles, Jr. | | |
| Year of birth | | 1945 |
| Position(s) held with Fund | | Director |
| Term of office1 and length of time served2 | | Since 2013 |
| Principal occupations during the past five years | | Senior Vice President, Finance and Chief Financial Officer (since 2009) of University of Southern California; Director, Hanmi Financial Corporation and Hanmi Bank (2008 to 2009). |
| Number of portfolios in fund complex overseen3 | | 12 |
| Other directorships held during the past five years | | None |
| |
| Ronald J. Arnault | | |
| Year of birth | | 1943 |
| Position(s) held with Fund | | Director |
| Term of office1 and length of time served2 | | Since 1997 |
| Principal occupations during the past five years | | Retired. |
| Number of portfolios in fund complex overseen3 | | 12 |
| Other directorships held during the past five years | | None |
| |
| Anita L. DeFrantz | | |
| Year of birth | | 1952 |
| Position(s) held with Fund | | Director |
| Term of office1 and length of time served2 | | Since 1998 |
| Principal occupations during the past five years | | President (since 1987) and Director (since 1990) of LA84 (formerly Amateur Athletic Foundation of Los Angeles); President and Director of Kids in Sports (since 1994); Vice President, International Rowing Federation (since 1986); Member of the International Olympic Committee (since 1986). |
| Number of portfolios in fund complex overseen3 | | 12 |
| Other directorships held during the past five years | | OBN Holdings, Inc. (film, television and media company) |
| | |
| 38 | | Western Asset Asian Opportunities Fund |
| | |
| Independent Directors cont’d | | |
| Avedick B. Poladian | | |
| Year of birth | | 1951 |
| Position(s) held with Fund | | Director |
| Term of office1 and length of time served2 | | Since 2007 |
| Principal occupations during the past five years | | Executive Vice President and Chief Operating Officer of Lowe Enterprises, Inc. (real estate and hospitality firm) (since 2002); Partner, Arthur Andersen, LLP (1974 to 2002). |
| Number of portfolios in fund complex overseen3 | | 12 |
| Other directorships held during the past five years | | Occidental Petroleum Corporation and Public Storage |
| |
| William E. B. Siart | | |
| Year of birth | | 1946 |
| Position(s) held with Fund | | Director and Chairman |
| Term of office1 and length of time served2 | | Since 1997 |
| Principal occupations during the past five years | | Trustee of The Getty Trust (since 2005); Chairman of Walt Disney Concert Hall, Inc. (1998 to 2006); Chairman of Excellent Education Development (since 2000). |
| Number of portfolios in fund complex overseen3 | | 12 |
| Other directorships held during the past five years | | None |
| |
| Jaynie Miller Studenmund | | |
| Year of birth | | 1954 |
| Position(s) held with Fund | | Director |
| Term of office1 and length of time served2 | | Since 2004 |
| Principal occupations during the past five years | | Director of Forest Lawn (since 2002) (memorial parks); Director of Pinnacle Entertainment, Inc. (since 2012) (gaming and hospitality company). Formerly: Director of Orbitz Worldwide, Inc. (2007 to 2014) (online travel company); Director of MarketTools, Inc. (2010 to 2012) (market research software provider); Director of eHarmony, Inc. (2005 to 2011) (online dating company). |
| Number of portfolios in fund complex overseen3 | | 12 |
| Other directorships held during the past five years | | None |
| | |
| Western Asset Asian Opportunities Fund | | 39 |
Additional information (unaudited) (cont’d)
Information about Directors and Officers
| | |
| Interested Director | | |
| Ronald L. Olson4 | | |
| Year of birth | | 1941 |
| Position(s) held with Fund | | Director |
| Term of office1 and length of time served2 | | Since 2005 |
| Principal occupations during the past five years | | Senior Partner of Munger, Tolles & Olson LLP (a law partnership) (1968 to present). |
| Number of portfolios in fund complex overseen3 | | 12 |
| Other directorships held during past five years | | Edison International, City National Corporation (financial services company), The Washington Post Company, and Berkshire Hathaway, Inc. |
| | |
| Officers5 | | |
| Kenneth D. Fuller | | |
| Year of birth | | 1958 |
| Position(s) with Fund | | President and Chief Executive Officer |
| Term of office1 and length of time served2 | | Since 2013 |
| Principal occupation(s) during past five years | | Managing Director of Legg Mason & Co., LLC (“Legg Mason & Co.”) (since 2013); Officer and/or Trustee/Director of 173 funds associated with Legg Mason Partners Fund Advisor, LLC (“LMPFA”) or its affiliates (since 2013); President and Chief Executive Officer of LM Asset Services, LLC (“LMAS”) and Legg Mason Fund Asset Management, Inc. (“LMFAM”) (formerly registered investment advisers) (since 2013); formerly, Senior Vice President of LMPFA (2012 to 2013); formerly, Director of Legg Mason & Co. (2012 to 2013); formerly, Vice President of Legg Mason & Co. (2009 to 2012); formerly, Vice President — Equity Division of T. Rowe Price Associates (1993 to 2009), as well as Investment Analyst and Portfolio Manager for certain asset allocation accounts (2004 to 2009). |
| |
Richard F. Sennett Legg Mason 100 International Drive, 7th Floor, Baltimore, MD 21202 | | |
| Year of birth | | 1970 |
| Position(s) with Fund | | Principal Financial Officer and Treasurer |
| Term of office1 and length of time served2 | | Since 2011 and since 2013 |
| Principal occupation(s) during past five years | | Principal Financial Officer and Treasurer of certain mutual funds associated with Legg Mason & Co. or its affiliates (since 2011 and since 2013); Managing Director of Legg Mason & Co. and Senior Manager of the Treasury Policy group for Legg Mason & Co.’s Global Fiduciary Platform (since 2011); formerly, Chief Accountant within the SEC’s Division of Investment Management (2007 to 2011); formerly, Assistant Chief Accountant within the SEC’s Division of Investment Management (2002 to 2007). |
| | |
| 40 | | Western Asset Asian Opportunities Fund |
| | |
| Officers5 cont’d | | |
Todd F. Kuehl Legg Mason 100 International Drive, 9th Floor, Baltimore, MD 21202 | | |
| Year of birth | | 1969 |
| Position(s) held with Fund | | Chief Compliance Officer |
| Term of office1 and length of time served2 | | Since 2007 |
| Principal occupations during the past five years | | Managing Director of Legg Mason & Co. (since 2011); Chief Compliance Officer of certain mutual funds associated with Legg Mason & Co. or its affiliates (since 2006); formerly, Chief Compliance Officer of Legg Mason Private Portfolio Group (prior to 2010); Branch Chief, Division of Investment Management, U.S. Securities and Exchange Commission (2002 to 2006). |
| |
Robert I. Frenkel Legg Mason 100 First Stamford Place, 6th Floor, Stamford, CT 06902 | | |
| Year of birth | | 1954 |
| Position(s) held with Fund | | Secretary and Chief Legal Officer |
| Term of office1 and length of time served2 | | Since 2007 |
| Principal occupations during the past five years | | Vice President and Deputy General Counsel of Legg Mason, Inc. (since 2006); Managing Director and General Counsel of Global Mutual Funds for Legg Mason & Co. (since 2006) and Legg Mason & Co. predecessors (since 1994); Secretary and Chief Legal Officer of certain mutual funds associated with Legg Mason & Co. or its affiliates (since 2006) and Legg Mason & Co. predecessors (prior to 2006). |
| |
Susan Kerr Legg Mason 620 Eighth Avenue, 49th Floor, New York, NY 10018 | | |
| Year of birth | | 1949 |
| Position(s) with Trust | | Chief Anti-Money Laundering Compliance Officer |
| Term of office1 and length of time served2 | | Since 2013 |
| Principal occupation(s) during past five years | | Assistant Vice President of Legg Mason & Co. and Legg Mason Investor Services, LLC (“LMIS”) (since 2010); Chief Anti-Money Laundering Compliance Officer of certain mutual funds associated with Legg Mason & Co. or its affiliates (since 2013) and Anti-Money Laundering Compliance Officer of LMIS (since 2012); Senior Compliance Officer of LMIS (since 2011); formerly, AML Consultant, DTCC (2010); formerly, AML Consultant, Rabobank Netherlands, (2009); formerly, First Vice President, Director of Marketing & Advertising Compliance and Manager of Communications Review Group at Citigroup Inc. (1996 to 2008). |
| | |
| Western Asset Asian Opportunities Fund | | 41 |
Additional information (unaudited) (cont’d)
Information about Directors and Officers
| | |
| Officers5 cont’d | | |
Vanessa A. Williams Legg Mason 100 First Stamford Place, 6th Floor, Stamford, CT 06902 | | |
| Year of birth | | 1979 |
| Position(s) with Trust | | Identity Theft Prevention Officer |
| Term of office1 and length of time served2 | | Since 2011 |
| Principal occupation(s) during past five years | | Vice President of Legg Mason & Co. (since 2012); Identity Theft Prevention Officer of certain mutual funds associated with Legg Mason & Co. or its affiliates (since 2011); formerly, Chief Anti-Money Laundering Compliance Officer of certain mutual funds associated with Legg Mason & Co. or its affiliates (2011 to 2013); formerly, Senior Compliance Officer of Legg Mason & Co. (2008 to 2011); formerly, Compliance Analyst of Legg Mason & Co. (2006 to 2008) and Legg Mason & Co. predecessors (prior to 2006). |
| † | Directors who are not “interested persons” of the Fund within the meaning of section 2(a)(19) of the Investment Company Act of 1940, as amended (the “1940 Act”). |
| 1 | Each Director and officer serves until his or her respective successor has been duly elected and qualified or until his or her earlier death, resignation, retirement or removal. |
| 2 | Indicates the earliest year in which the Director became a board member for a fund in the Legg Mason fund complex or the officer took such office. |
| 3 | In addition to overseeing the 10 funds of the Corporation, each Director also serves as a Director of Western Asset Income Fund and a Trustee of Western Asset Premier Bond Fund (closed-end investment companies), which are considered part of the same Fund Complex as the Corporation. |
| 4 | Mr. Olson is an “interested person” (as defined above) of the Fund because his law firm has provided legal services to WAM. |
| 5 | Each officer of the Fund is an “interested person” (as defined above) of the Fund. |
| | |
| 42 | | Western Asset Asian Opportunities Fund |
Western Asset
Asian Opportunities Fund
Directors
William E. B. Siart,
Chairman
Robert Abeles, Jr.
Ronald J. Arnault
Anita L. DeFrantz
Ronald L. Olson
Avedick B. Poladian
Jaynie M. Studenmund
Investment manager
Legg Mason Partners Fund Advisor, LLC
Investment advisers
Western Asset Management Company
Western Asset Management Company Limited
Western Asset Management Company Pte. Ltd.
Western Asset Management Company Ltd
Transfer agent
BNY Mellon Investment Servicing (US) Inc.
4400 Computer Drive
Westborough, MA 01581
Custodian
State Street Bank and Trust Company
Independent registered public accounting firm
PricewaterhouseCoopers LLP
Baltimore, MD
Legal counsel
Ropes & Gray LLP
1211 Avenue of the Americas
New York, NY 10036
Western Asset Asian Opportunities Fund
The Fund is a separate investment series of Western Asset Funds, Inc.
Western Asset Asian Opportunities Fund
Legg Mason Funds
620 Eighth Avenue, 49th Floor
New York, NY 10018
The Fund files its complete schedule of portfolio holdings with the Securities and Exchange Commission (“SEC”) for the first and third quarters of each fiscal year on Form N-Q. The Fund’s Forms N-Q are available on the SEC’s website at www.sec.gov. The Fund’s Forms N-Q may be reviewed and copied at the SEC’s Public Reference Room in Washington, D.C., and information on the operation of the Public Reference Room may be obtained by calling 1-800-SEC-0330. To obtain information on Form N-Q, shareholders can call the Fund at 1-877-721-1926.
Information on how the Fund voted proxies relating to portfolio securities during the prior 12-month period ended June 30th of each year and a description of the policies and procedures that the Fund uses to determine how to vote proxies related to portfolio transactions are available (1) without charge, upon request, by calling the Fund at 1-877-721-1926, (2) on the Fund’s website at www.leggmason.com/individualinvestors and (3) on the SEC’s website at www.sec.gov.
This report is submitted for the general information of the shareholders of Western Asset Asian Opportunities Fund. This report is not authorized for distribution to prospective investors in the Fund unless preceded or accompanied by a current prospectus.
Investors should consider the Fund’s investment objectives, risks, charges and expenses carefully before investing. The prospectus contains this and other important information about the Fund. Please read the prospectus carefully before investing.
www.leggmason.com/individualinvestors
© 2014 Legg Mason Investor Services, LLC
Member FINRA, SIPC
Legg Mason Funds Privacy and Security Notice
Your Privacy and the Security of Your Personal Information is Very Important to the Legg Mason Funds
This Privacy and Security Notice (the “Privacy Notice”) addresses the Legg Mason Funds’ privacy and data protection practices with respect to nonpublic personal information the Funds receive. The Legg Mason Funds include any funds sold by the Funds’ distributor, Legg Mason Investor Services, LLC, as well as Legg Mason-sponsored closed-end funds and certain closed-end funds managed or sub-advised by Legg Mason or its affiliates. The provisions of this Privacy Notice apply to your information both while you are a shareholder and after you are no longer invested with the Funds.
The Type of Nonpublic Personal Information the Funds Collect About You
The Funds collect and maintain nonpublic personal information about you in connection with your shareholder account. Such information may include, but is not limited to:
| Ÿ | | Personal information included on applications or other forms; |
| Ÿ | | Account balances, transactions, and mutual fund holdings and positions; |
| Ÿ | | Online account access user IDs, passwords, security challenge question responses; and |
| Ÿ | | Information received from consumer reporting agencies regarding credit history and creditworthiness (such as the amount of an individual’s total debt, payment history, etc.). |
How the Funds Use Nonpublic Personal Information About You
The Funds do not sell or share your nonpublic personal information with third parties or with affiliates for their marketing purposes, or with other financial institutions or affiliates for joint marketing purposes, unless you have authorized the Funds to do so. The Funds do not disclose any nonpublic personal information about you except as may be required to perform transactions or services you have authorized or as permitted or required by law. The Funds may disclose information about you to:
| Ÿ | | Employees, agents, and affiliates on a “need to know” basis to enable the Funds to conduct ordinary business or comply with obligations to government regulators; |
| Ÿ | | Service providers, including the Funds’ affiliates, who assist the Funds as part of the ordinary course of business (such as printing, mailing services, or processing or servicing your account with us) or otherwise perform services on the Funds’ behalf, including companies that may perform marketing services solely for the Funds; |
| Ÿ | | The Funds’ representatives such as legal counsel, accountants and auditors; and |
| Ÿ | | Fiduciaries or representatives acting on your behalf, such as an IRA custodian or trustee of a grantor trust. |
|
| NOT PART OF THE ANNUAL REPORT |
Legg Mason Funds Privacy and Security Notice (cont’d)
Except as otherwise permitted by applicable law, companies acting on the Funds’ behalf are contractually obligated to keep nonpublic personal information the Funds provide to them confidential and to use the information the Funds share only to provide the services the Funds ask them to perform.
The Funds may disclose nonpublic personal information about you when necessary to enforce their rights or protect against fraud, or as permitted or required by applicable law, such as in connection with a law enforcement or regulatory request, subpoena, or similar legal process. In the event of a corporate action or in the event a Fund service provider changes, the Funds may be required to disclose your nonpublic personal information to third parties. While it is the Funds’ practice to obtain protections for disclosed information in these types of transactions, the Funds cannot guarantee their privacy policy will remain unchanged.
Keeping You Informed of the Funds’ Privacy and Security Practices
The Funds will notify you annually of their privacy policy as required by federal law. While the Funds reserve the right to modify this policy at any time they will notify you promptly if this privacy policy changes.
The Funds’ Security Practices
The Funds maintain appropriate physical, electronic and procedural safeguards designed to guard your nonpublic personal information. The Funds’ internal data security policies restrict access to your nonpublic personal information to authorized employees, who may use your nonpublic personal information for Fund business purposes only.
Although the Funds strive to protect your nonpublic personal information, they cannot ensure or warrant the security of any information you provide or transmit to them, and you do so at your own risk. In the event of a breach of the confidentiality or security of your nonpublic personal information, the Funds will attempt to notify you as necessary so you can take appropriate protective steps. If you have consented to the Funds using electronic communications or electronic delivery of statements, they may notify you under such circumstances using the most current email address you have on record with them.
In order for the Funds to provide effective service to you, keeping your account information accurate is very important. If you believe that your account information is incomplete, not accurate or not current, or if you have questions about the Funds’ privacy practices, write the Funds using the contact information on your account statements, email the Funds by clicking on the Contact Us section of the Funds’ website at www.leggmason.com, or contact the Fund at 1-877-721-1926.
Revised April 2011
|
| NOT PART OF THE ANNUAL REPORT |
Western Asset Management Company
Legg Mason, Inc. Subsidiaries
www.leggmason.com/individualinvestors
© 2014 Legg Mason Investor Services, LLC Member FINRA, SIPC
WASX016049 12/14 SR14-2373
The registrant has adopted a code of ethics that applies to the registrant’s principal executive officer, principal financial officer, principal accounting officer or controller.
| ITEM 3. | AUDIT COMMITTEE FINANCIAL EXPERT. |
The Board of Directors of the registrant has determined that Mr. Ronald J. Arnault possesses the technical attributes identified in Instruction 2(b) of Item 3 to Form N-CSR to qualify as “audit committee financial expert,” and have designated Mr. Arnault as the Audit Committee’s financial expert. Mr. Arnault is “independent” Directors pursuant to paragraph (a) (2) of Item 3 to Form N-CSR.
| ITEM 4. | PRINCIPAL ACCOUNTANT FEES AND SERVICES |
a) Audit Fees. The aggregate fees billed in the last two fiscal years ending October 31, 2013 and October 31, 2014 (the “Reporting Periods”) for professional services rendered by the Registrant’s principal accountant (the “Auditor”) for the audit of the Registrant’s annual financial statements, or services that are normally provided by the Auditor in connection with the statutory and regulatory filings or engagements for the Reporting Periods, were $0 in October 31, 2013 and $109,288 in October 31, 2014.
b) Audit-Related Fees. The aggregate fees billed in the Reporting Period for assurance and related services by the Auditor that are reasonably related to the performance of the Registrant’s financial statements were $0 in October 31, 2013 and $0 in October 31, 2014.
(c) Tax Fees. The aggregate fees billed in the Reporting Periods for professional services rendered by the Auditor for tax compliance, tax advice and tax planning (“Tax Services”) were $0 in October 31, 2013 and $6,200 in October 31, 2014. These services consisted of (i) review or preparation of U.S. federal, state, local and excise tax returns; (ii) U.S. federal, state and local tax planning, advice and assistance regarding statutory, regulatory or administrative developments, and (iii) tax advice regarding tax qualification matters and/or treatment of various financial instruments held or proposed to be acquired or held.
There were no fees billed for tax services by the Auditors to service affiliates during the Reporting Periods that required pre-approval by the Audit Committee.
d) All Other Fees. The aggregate other fees billed in the Reporting Periods for products and services provided by the Auditor were $24 in October 31, 2013 and $49 in October 31, 2014, other than the services reported in paragraphs (a) through (c) for the Item for the Western Asset Funds, Inc.
All Other Fees. There were no other non-audit services rendered by the Auditor to Legg Mason Partners Fund Advisors, LLC (“LMPFA”), and any entity controlling, controlled by or under common control with LMPFA that provided ongoing services to Western Asset Funds, Inc. requiring pre-approval by the Audit Committee in the Reporting Period.
(e) Audit Committee’s pre–approval policies and procedures described in paragraph (c)(7) of Rule 2-01 of Regulation S-X.
(1) The Charter for the Audit Committee (the “Committee”) of the Board of each registered investment company (the “Fund”) advised by LMPFA or one of their affiliates (each, an “Adviser”) requires that the Committee shall approve (a) all audit and permissible non-audit services to be provided to the Fund and (b) all permissible non-audit services to be provided by the Fund’s independent auditors to the Adviser and any Covered Service Providers if the engagement relates directly to the operations and financial reporting of the Fund. The Committee may implement policies and procedures by which such services are approved other than by the full Committee.
The Committee shall not approve non-audit services that the Committee believes may impair the independence of the auditors. As of the date of the approval of this Audit Committee Charter, permissible non-audit services include any professional services (including tax services), that are not prohibited services as described below, provided to the Fund by the independent auditors, other than those provided to the Fund in connection with an audit or a review of the financial statements of the Fund. Permissible non-audit services may not include: (i) bookkeeping or other services related to the accounting records or financial statements of the Fund; (ii) financial information systems design and implementation; (iii) appraisal or valuation services, fairness opinions or contribution-in-kind reports; (iv) actuarial services; (v) internal audit outsourcing services; (vi) management functions or human resources; (vii) broker or dealer, investment adviser or investment banking services; (viii) legal services and expert services unrelated to the audit; and (ix) any other service the Public Company Accounting Oversight Board determines, by regulation, is impermissible.
Pre-approval by the Committee of any permissible non-audit services is not required so long as: (i) the aggregate amount of all such permissible non-audit services provided to the Fund, the Adviser and any service providers controlling, controlled by or under common control with the Adviser that provide ongoing services to the Fund (“Covered Service Providers”) constitutes not more than 5% of the total amount of revenues paid to the independent auditors during the fiscal year in which the permissible non-audit services are provided to (a) the Fund, (b) the Adviser and (c) any entity controlling, controlled by or under common control with the Adviser that provides ongoing services to the Fund during the fiscal year in which the services are provided that would have to be approved by the Committee; (ii) the permissible non-audit services were not recognized by the Fund at the time of the engagement to be non-audit services; and (iii) such services are promptly brought to the attention of the Committee and approved by the Committee (or its delegate(s)) prior to the completion of the audit.
(2) For the Western Asset Funds, Inc., the percentage of fees that were approved by the audit committee, with respect to: Audit-Related Fees were 100% and 100% for October 31, 2013 and October 31, 2014; Tax Fees were 100% and 100% for October 31, 2013 and October 31, 2014; and Other Fees were 100% and 100% for October 31, 2013 and October 31, 2014.
(f) N/A
(g) Non-audit fees billed by the Auditor for services rendered to Western Asset Funds, Inc., LMPFA and any entity controlling, controlled by, or under common control with LMPFA that provides ongoing services to Western Asset Funds, Inc. during the reporting period were $240,000 in 2013 and $257,238 in 2014.
(h) Yes. Western Asset Funds, Inc.’s Audit Committee has considered whether the provision of non-audit services that were rendered to Service Affiliates, which were not pre-approved (not requiring pre-approval), is compatible with maintaining the Accountant’s independence. All services provided by the Auditor to the Western Asset Funds, Inc. or to Service Affiliates, which were required to be pre-approved, were pre-approved as required.
| ITEM 5. | AUDIT COMMITTEE OF LISTED REGISTRANTS. |
| | a) | The independent board members are acting as the registrant’s audit committee as specified in Section 3(a)(58)(B) of the Exchange Act. The Audit Committee consists of the following Board members: |
Robert Abeles, Jr.
Ronald J. Arnault
Anita L. DeFrantz
Ronald L. Olson
Avedick B. Poladian
William E.B. Siart
Jaynie Miller Studenmund
| ITEM 6. | SCHEDULE OF INVESTMENTS. |
Included herein under Item 1.
| ITEM 7. | DISCLOSURE OF PROXY VOTING POLICIES AND PROCEDURES FOR CLOSED-END MANAGEMENT INVESTMENT COMPANIES. |
Not applicable.
| ITEM 8. | PORTFOLIO MANAGERS OF CLOSED-END MANAGEMENT INVESTMENT COMPANIES. |
Not applicable.
| ITEM 9. | PURCHASES OF EQUITY SECURITIES BY CLOSED-END MANAGEMENT INVESTMENT COMPANY AND AFFILIATED PURCHASERS. |
Not applicable.
| ITEM 10. | SUBMISSION OF MATTERS TO A VOTE OF SECURITY HOLDERS. |
Not applicable.
| ITEM 11. | CONTROLS AND PROCEDURES. |
| | (a) | The registrant’s principal executive officer and principal financial officer have concluded that the registrant’s disclosure controls and procedures (as defined in Rule 30a- 3(c) under the Investment Company Act of 1940, as amended (the “1940 Act”)) are effective as of a date within 90 days of the filing date of this report that includes the disclosure required by this paragraph, based on their evaluation of the disclosure controls and procedures required by Rule 30a-3(b) under the 1940 Act and 15d-15(b) under the Securities Exchange Act of 1934. |
| | (b) | There were no changes in the registrant’s internal control over financial reporting (as defined in Rule 30a-3(d) under the 1940 Act) that occurred during the second fiscal quarter of the period covered by this report that have materially affected, or are likely to materially affect the registrant’s internal control over financial reporting. |
(a) (1) Code of Ethics attached hereto.
Exhibit 99.CODE ETH
(a) (2) Certifications pursuant to section 302 of the Sarbanes-Oxley Act of 2002 attached hereto.
Exhibit 99.CERT
(b) Certifications pursuant to Section 906 of the Sarbanes-Oxley Act of 2002 attached hereto.
Exhibit 99.906CERT
SIGNATURES
Pursuant to the requirements of the Securities Exchange Act of 1934 and the Investment Company Act of 1940, the registrant has duly caused this Report to be signed on its behalf by the undersigned, there unto duly authorized.
Western Asset Funds, Inc.
| | |
| By: | | /s/ Kenneth D. Fuller |
| | Kenneth D. Fuller |
| | Chief Executive Officer |
| |
| Date: | | December 23, 2014 |
Pursuant to the requirements of the Securities Exchange Act of 1934 and the Investment Company Act of 1940, this report has been signed below by the following persons on behalf of the registrant and in the capacities and on the dates indicated.
| | |
| By: | | /s/ Kenneth D. Fuller |
| | Kenneth D. Fuller |
| | Chief Executive Officer |
| |
| Date: | | December 23, 2014 |
| |
| By: | | /s/ Richard F. Sennett |
| | Richard F. Sennett |
| | Principal Financial Officer |
| |
| Date: | | December 23, 2014 |