UNITED STATES
SECURITIES AND EXCHANGE COMMISSION
Washington, D.C. 20549
FORM N-CSR
CERTIFIED SHAREHOLDER REPORT OF REGISTERED
MANAGEMENT INVESTMENT COMPANIES
Investment Company Act file number 811-06110
Western Asset Funds, Inc.
(Exact name of registrant as specified in charter)
620 Eighth Avenue, 49th Floor, New York, NY 10018
(Address of principal executive offices) (Zip code)
Robert I. Frenkel, Esq.
Legg Mason & Co., LLC
100 First Stamford Place
Stamford, CT 06902
(Name and address of agent for service)
Registrant’s telephone number, including area code: 1-877-721-1926
Date of fiscal year end: May 31
Date of reporting period: May 31, 2016
| ITEM 1. | REPORT TO STOCKHOLDERS. |
The Annual Report to Stockholders is filed herewith.

| | |
| Annual Report | | May 31, 2016 |
WESTERN ASSET
HIGH YIELD FUND

|
| INVESTMENT PRODUCTS: NOT FDIC INSURED • NO BANK GUARANTEE • MAY LOSE VALUE |
Fund objective
The Fund seeks to maximize total return, consistent with prudent investment management.
Letter from the president

Dear Shareholder,
We are pleased to provide the annual report of Western Asset High Yield Fund for the twelve-month reporting period ended May 31, 2016. Please read on for a detailed look at prevailing economic and market conditions during the Fund’s reporting period and to learn how those conditions have affected Fund performance.
As always, we remain committed to providing you with excellent service and a full spectrum of investment choices. We also remain committed to supplementing the support you receive from your financial advisor. One way we accomplish this is through our website, www.leggmason.com. Here you can gain immediate access to market and investment information, including:
| • | | Fund prices and performance, |
| • | | Market insights and commentaries from our portfolio managers, and |
| • | | A host of educational resources. |
We look forward to helping you meet your financial goals.
Sincerely,

Jane Trust, CFA
President and Chief Executive Officer
June 30, 2016
| | |
| II | | Western Asset High Yield Fund |
Investment commentary
Economic review
The pace of U.S. economic activity moderated during the twelve months ended May 31, 2016 (the “reporting period”). Looking back, the U.S. Department of Commerce reported that second quarter 2015 U.S. gross domestic product (“GDP”)i growth was 3.9%. Third quarter 2015 GDP growth then moderated to 2.0%. Decelerating growth was primarily due to a downturn in private inventory investment and decelerations in exports, personal consumption expenditures (“PCE”), nonresidential fixed investment, state and local government spending, and residential fixed investment. The U.S. Department of Commerce then reported that fourth quarter 2015 GDP growth was 1.4%. Slower growth was attributed to downturns in nonresidential fixed investment and state and local government spending, along with a deceleration in PCE and less export activity. The U.S. Department of Commerce’s final reading for first quarter 2016 GDP growth — released after the reporting period ended — was 1.1%. This further slowdown was attributed to a number of factors, including a deceleration in PCE, a larger decrease in nonresidential fixed investment and a downturn in federal government spending.
Job growth in the U.S. was generally solid and was a tailwind for the economy during the reporting period. When the period began, unemployment was 5.3%, as reported by the U.S. Department of Labor. By May 2016, unemployment was 4.7%, its lowest level since December 2007.
Turning to the global economy, in its April 2016 World Economic Outlook Update, the International Monetary Fund (“IMF”) said “Global recovery continues, but at an ever-slowing and increasingly fragile pace. The months since the last World Economic Outlook Update have seen a renewed episode of global asset market volatility, some loss of growth momentum in the advanced economies, and continuing headwinds for emerging market economies and lower-income countries.” From a regional perspective, the IMF currently estimates 2016 growth in the Eurozone will be 1.5%, versus 1.6% in 2015. Japan’s economy is expected to expand 0.5% in 2016, the same as in 2015. Elsewhere, the IMF projects that overall growth in emerging market countries will tick up to 4.1% in 2016, versus 4.0% in 2015.
After an extended period of maintaining the federal funds rateii at a historically low range between zero and 0.25%, the Federal Reserve Board (“Fed”)iii increased the rate at its meeting on December 16, 2015. This marked the first rate hike since 2006. In particular, the U.S. central bank raised the federal funds rate to a range between 0.25% and 0.50%. In its official statement after the December 2015 meeting, the Fed said, “The stance of monetary policy remains accommodative after this increase, thereby supporting further improvement in labor market conditions and a return to 2 percent inflation….The Committee expects that economic conditions will evolve in a manner that will warrant only gradual increases in the federal funds rate; the federal funds rate is likely to remain, for some time, below levels that are expected to prevail in the longer run.” At its meetings that concluded on January 27, 2016, March 16, 2016, April 27, 2016, and June 15, 2016 (after the reporting period ended), the Fed kept rates on hold.
Given the economic challenges in the Eurozone, the European Central Bank (“ECB”)iv
| | |
| Western Asset High Yield Fund | | III |
Investment commentary (cont’d)
took a number of actions to stimulate growth and ward off deflation. In January 2015, before the beginning of the reporting period, the ECB announced that, beginning in March 2015, it would start a €60 billion-a-month bond buying program that is expected to run until September 2016. In December 2015, the ECB extended its monthly bond buying program until at least March 2017. Finally, in March 2016 the ECB announced that it would increase its bond purchasing program to €80 billion a month. It also cut its deposit rate to -0.4% and its main interest rate to 0%. In other developed countries, the Bank of England kept rates on hold at 0.50% during the reporting period, its lowest level since 2006. After holding rates steady at 0.10% for more than five years, in January 2016 the Bank of Japan announced that it cut the rate on current accounts that commercial banks hold with it to -0.10%. Elsewhere, after keeping rates steady at 6.0% since July 2012, the People’s Bank of China lowered rates six times from November 2014 through October 2015, with the last cut pushing rates down to 4.35%.
As always, thank you for your confidence in our stewardship of your assets.
Sincerely,
Jane Trust, CFA
President and Chief Executive Officer
June 30, 2016
All investments are subject to risk including the possible loss of principal. Past performance is no guarantee of future results. Forecasts and predictions are inherently limited and should not be relied upon as an indication of actual or future performance.
| i | Gross domestic product (“GDP”) is the market value of all final goods and services produced within a country in a given period of time. |
| ii | The federal funds rate is the rate charged by one depository institution on an overnight sale of immediately available funds (balances at the Fed) to another depository institution; the rate may vary from depository institution to depository institution and from day to day. |
| iii | The Federal Reserve Board (“Fed”) is responsible for the formulation of U.S. policies designed to promote economic growth, full employment, stable prices and a sustainable pattern of international trade and payments. |
| iv | The European Central Bank (“ECB”) is responsible for the monetary system of the European Union and the euro currency. |
| | |
| IV | | Western Asset High Yield Fund |
Fund overview
Q. What is the Fund’s investment strategy?
A. The Fund’s investment objective is to maximize total return, consistent with prudent investment management. Under normal market conditions, the Fund will invest at least 80% of its net assets in U.S. dollar denominated debt or fixed-income securities that are rated below investment grade at the time of purchase by one or more Nationally Recognized Statistical Rating Organizations (“NRSROs”) or securities we determine to be of comparable quality. The Fund considers securities that are rated below the Baa or BBB categories to be rated below investment grade. Securities rated below investment grade are commonly known as “junk bonds” or “high yield securities”. In deciding among the securities in which the Fund may invest, we take into account the credit quality, country of issue, interest rate, liquidity, maturity and yield of a security as well as other factors, including the Fund’s effective durationi and prevailing and anticipated market conditions. The Fund is permitted to invest up to 20% of its total assets in non-U.S. dollar denominated non- U.S. securities. The Fund may invest a substantial portion of its assets in mortgage-backed and asset-backed securities.
The Fund may also enter into various exchange-traded and over-the-counter derivative transactions for both hedging and non-hedging purposes, including for purposes of enhancing returns. These derivative transactions include, but are not limited to, bond and interest rate futures, options on bond and interest rate futures, futures, swaps, foreign currency futures, forwards and options.
In particular, the Fund may use interest rate swaps, credit default swaps (including buying and selling credit default swaps on individual securities and/or baskets of securities), options (including options on credit default swaps) and/or futures to a significant extent, although the amounts invested in these instruments may change from time to time. Other instruments may also be used to a significant extent from time to time.
At Western Asset Management Company (“Western Asset”), we utilize a fixed-income team approach, with decisions derived from interaction among various investment management sector specialists. The sector teams are comprised of Western Asset’s senior portfolio management personnel, research analysts and an in-house economist. Under this team approach, management of client fixed-income portfolios will reflect a consensus of interdisciplinary views within the Western Asset organization.
Q. What were the overall market conditions during the Fund’s reporting period?
A. Most spread sectors (non-Treasuries) posted positive returns, but generated mixed results versus equal-durationii Treasuries over the twelve months ended May 31, 2016. The fixed income market was volatile at times given signs of moderating economic growth, uncertainties regarding future Federal Reserve Board (“Fed”)iii monetary policy and a number of geopolitical issues.
Short-term Treasury yields moved higher, whereas long-term Treasury yields declined during the twelve months ended May 31, 2016. Two-year Treasury yields rose from 0.61% at the beginning of the period to 0.87% at the end of the period. Their peak of 1.09% occurred on December 29, 2015
| | |
| Western Asset High Yield Fund 2016 Annual Report | | 1 |
Fund overview (cont’d)
and they were as low as 0.55% on July 8, 2015. Ten-year Treasury yields were 2.12% at the beginning of the period and ended the period at 1.84%. Their peak of 2.50% occurred on June 10, 2015 and their low of 1.63% was on February 11, 2016.
All told, the Barclays U.S. Aggregate Indexiv returned 2.99% during the reporting period. Comparatively, riskier fixed-income securities, including high-yield bonds and emerging market debt, produced mixed results. Over the fiscal year, the Fund’s benchmark, the Barclays U.S. Corporate High Yield — 2% Issuer Cap Indexv, declined 0.77%. During this period, as measured by the benchmark, lower-quality CCC-rated bonds underperformed higher-quality BB-rated securities, returning -3.56% and 1.88%, respectively. Elsewhere, emerging market debt, as measured by the JPMorgan Emerging Markets Bond Index Global (“EMBI Global”)vi, returned 4.55% for the twelve months ended May 31, 2016.
Q. How did we respond to these changing market conditions?
A. A number of adjustments were made to the Fund’s portfolio during the reporting period. In terms of sector and industry positioning, we increased the Fund’s allocations to Telecommunication Services, Consumer Cyclicals1 and Financials, while reducing its exposures to Energy, Transportation2, Basic Industry3 and Consumer Non-Cyclicals4. From a credit quality perspective, we reduced the Fund’s exposure to B-rated securities and increased its allocation to BB-rated securities. The Fund’s cash position was also increased. Finally, we actively participated in the new issue markets and purchased securities that we felt were attractively valued.
The Fund employed U.S. Treasury futures to manage its yield curvevii positioning and duration. All told, our U.S. Treasury futures trades contributed to performance during the reporting period. Credit default swaps, which were used to managed the Fund’s allocations to individual high-yield corporate bonds, was a slight detractor from results. High yield index swaps (CDX) were also used to manage our high-yield corporate bond exposure. Overall, they were slightly positive for performance. Currency forwards and options were used to manage currency exposure. Overall, the use of these derivatives detracted from performance.
Performance review
For the twelve months ended May 31, 2016, Class I shares of Western Asset High Yield Fund returned -5.35%. The Fund’s unmanaged benchmark, the Barclays U.S. Corporate High Yield — 2% Issuer Cap Index, returned -0.77% for the same period. The Lipper High Yield Funds Category Average5 returned -2.21% over the same time frame.
| 1 | Consumer Cyclicals consists of the following industries: Automotive, Entertainment, Gaming, Home Construction, Lodging, Retailers, Restaurants, Textiles and other consumer services. |
| 2 | Transportation consists of the following industries: Airlines, Railroads and other transportation-related services. |
| 3 | Basic Industry consists of the following industries: Chemicals, Metals & Mining and Paper. |
| 4 | Consumer Non-Cyclicals consists of the following industries: Consumer Products, Food/Beverage, Health Care, Pharmaceuticals, Supermarkets and Tobacco. |
| 5 | Lipper, Inc., a wholly-owned subsidiary of Reuters, provides independent insight on global collective investments. Returns are based on the twelve-month period ended May 31, 2016, including the reinvestment of all distributions, including returns of capital, if any, calculated among the 662 funds in the Fund’s Lipper category, and excluding sales charges. |
| | |
| 2 | | Western Asset High Yield Fund 2016 Annual Report |
| | | | | | | | |
Performance Snapshot as of May 31, 2016
(unaudited) | |
| (excluding sales charges) | | 6 months | | | 12 months | |
| Western Asset High Yield Fund: | | | | | | | | |
Class A | | | 2.12 | % | | | -5.63 | % |
Class A2 | | | 2.11 | % | | | -5.70 | % |
Class C | | | 1.71 | % | | | -6.32 | % |
Class R | | | 2.08 | % | | | -6.01 | % |
Class I | | | 2.23 | % | | | -5.35 | % |
Class IS | | | 2.30 | % | | | -5.32 | % |
Barclays U.S. Corporate High
Yield — 2% Issuer Cap Index | | | 5.34 | % | | | -0.77 | % |
Lipper High Yield Funds
Category Average1 | | | 3.35 | % | | | -2.21 | % |
The performance shown represents past performance. Past performance is no guarantee of future results and current performance may be higher or lower than the performance shown above. Principal value, investment returns and yields will fluctuate and investors’ shares, when redeemed, may be worth more or less than their original cost. To obtain performance data current to the most recent month-end, please visit our website at www.leggmason.com/mutualfunds.
All share class returns assume the reinvestment of all distributions at net asset value and the deduction of all Fund expenses. Returns have not been adjusted to include sales charges that may apply or the deduction of taxes that a shareholder would pay on Fund distributions. If sales charges were reflected, the performance quoted would be lower. Performance figures for periods shorter than one year represent cumulative figures and are not annualized.
Fund performance figures reflect fee waivers and/or expense reimbursements, without which the performance would have been lower.
The 30-Day SEC Yields for the period ended May 31, 2016 for Class A, Class A2, Class C, Class R, Class I and Class IS shares were 6.37%, 6.27%, 5.58%, 6.31%, 6.75% and 6.98% respectively. Absent fee waivers and/or expense reimbursements, the 30-Day SEC Yield for Class R shares would have been 6.12%. The 30-Day SEC Yield is subject to change and is based on the yield to maturity of the Fund’s investments over a 30-day period and not on the dividends paid by the Fund, which may differ.
|
| Total Annual Operating Expenses (unaudited) |
As of the Fund’s current prospectus dated September 30, 2015, the gross total annual operating expense ratios for Class A, Class A2, Class C, Class R, Class I and Class IS shares were 0.93%, 0.92%, 1.77%, 1.54%, 0.68% and 0.63%, respectively.
Actual expenses may be higher. For example, expenses may be higher than those shown if average net assets decrease. Net assets are more likely to decrease and Fund expense ratios are more likely to increase when markets are volatile.
As a result of expense limitation arrangements, the ratio of expenses, other than interest, brokerage commissions, taxes, extraordinary expenses and deferred organizational expenses, to average net assets will not exceed 1.05% for Class A shares, 1.25% for Class A2 shares, 1.80% for Class C shares, 1.30% for Class R shares and 0.65% for Class IS shares. In addition, the ratio of total annual fund operating expenses for Class IS shares will not exceed the ratio of total annual fund operating expenses for Class I shares. These expense limitation
| 1 | Lipper, Inc., a wholly-owned subsidiary of Reuters, provides independent insight on global collective investments. Returns are based on the period ended May 31, 2016, including the reinvestment of all distributions, including returns of capital, if any, calculated among the 697 funds for the six-month period and among the 662 funds for the twelve-month period in the Fund’s Lipper category, and excluding sales charges. |
| | |
| Western Asset High Yield Fund 2016 Annual Report | | 3 |
Fund overview (cont’d)
arrangements cannot be terminated prior to December 31, 2017 without the Board of Directors’ consent.
The manager is permitted to recapture amounts waived and/or reimbursed to a class within two years after the fiscal year in which the manager earned the fee or incurred the expense if the class’ total annual operating expenses have fallen to a level below the expense limitation (“expense cap”) in effect at the time the fees were earned or the expenses incurred. In no case will the manager recapture any amount that would result, on any particular business day of the Fund, in the class’ total annual operating expenses exceeding the expense cap or any other lower limit then in effect.
Q. What were the leading contributors to performance?
A. The largest contributor to the Fund’s relative performance during the reporting period was its positioning in several sectors. In particular, an underweight to Basic Industry helped results, as did overweights to Consumer Cyclicals and Consumer Non-Cyclicals.
A number of individual Fund holdings also contributed to performance, including our overweights in Freeport-McMoRan and Williams Companies. Freeport-McMoRan is the world’s largest publicly traded copper producer and the world’s largest producer of molybdenum. Williams Companies is an energy company based in Oklahoma, which is focused mainly on natural gas processing and transportation. Both companies benefited primarily from technical factors. They are “fallen angels,” previously investment-grade bonds that entered the high-yield market in the latter half of the reporting period. Their bond prices ultimately advanced as high-yield managers bought the bonds to allow their portfolios to reflect their new weightings in the benchmark. At the same time, commodity prices appeared to have bottomed, which provided a further tailwind.
Q. What were the leading detractors from performance?
A. The largest detractor from the Fund’s relative performance during the reporting period was security selection. In particular, overweight positions in Murray Energy, Intelsat and Magnum Hunter Resources were negative for performance. Murray Energy is the largest coal company in the U.S. which operates thirteen active mines. Intelsat operates a global satellite network that provides broadband connectivity and video broadcasting to thousands of companies. Magnum Hunter Resources is an independent Texas-based exploration and production company of natural gas and crude oil. In general, Murray Energy and Magnum Hunter Resources suffered along with the precipitous decline in commodity prices over the first part of the reporting period. Intelsat bonds suffered mainly due to the weak pricing environment (current customers repricing) and a generally more competitive market with additional capacity.
Sector positioning, overall, was negative for performance. In particular, the Fund’s overweight to the Energy sector was by far the largest detractor to performance. Our ratings biases also detracted from results. Having an overweight to CCC-rated bonds and an underweight to BB-rated bonds was not rewarded as lower quality securities in general lagged their high quality counterparts during the reporting period.
| | |
| 4 | | Western Asset High Yield Fund 2016 Annual Report |
Thank you for your investment in Western Asset High Yield Fund. As always, we appreciate that you have chosen us to manage your assets and we remain focused on achieving the Fund’s investment goals.
Sincerely,
Western Asset Management Company
June 20, 2016
RISKS: Fixed-income securities involve interest rate, credit, inflation and reinvestment risks. As interest rates rise, the value of fixed- income securities falls. Derivatives, such as options, futures and swaps, can be illiquid, may disproportionately increase losses, and have a potentially large impact on Fund performance. International investments are subject to special risks including currency fluctuations and social, economic and political uncertainties, which could increase volatility. These risks are magnified in emerging markets. The use of leverage may increase volatility and possibility of loss. Securities rated below investment grade are commonly known as “junk bonds” or “high yield securities.” The risks of high yield securities include greater price volatility, illiquidity and possibility of default. Asset-backed, mortgage- backed or mortgage-related securities are subject to prepayment and extension risks. Please see the Fund’s prospectus for a more complete discussion of these and other risks, and the Fund’s investment strategies.
Portfolio holdings and breakdowns are as of May 31, 2016 and are subject to change and may not be representative of the portfolio managers’ current or future investments. Please refer to pages 14 through 32 for a list and percentage breakdown of the Fund’s holdings.
The mention of sector breakdowns is for informational purposes only and should not be construed as a recommendation to purchase or sell any securities. The information provided regarding such sectors is not a sufficient basis upon which to make an investment decision. Investors seeking financial advice regarding the appropriateness of investing in any securities or investment strategies discussed should consult their financial professional. The Fund’s top five sector holdings (as a percentage of net assets) as of May 31, 2016 were: Consumer Discretionary (20.4%), Energy (15.8%), Financials (13.3%), Industrials (10.7%) and Health Care (8.6%). The Fund’s portfolio composition is subject to change at any time.
All investments are subject to risk including the possible loss of principal. Past performance is no guarantee of future results. All index performance reflects no deduction for fees, expenses or taxes. Please note that an investor cannot invest directly in an index.
The information provided is not intended to be a forecast of future events, a guarantee of future results or investment advice. Views expressed may differ from those of the firm as a whole.
| | |
| Western Asset High Yield Fund 2016 Annual Report | | 5 |
Fund overview (cont’d)
| i | Effective duration is a duration calculation for bonds with embedded options. Effective duration takes into account that expected cash flows will fluctuate as interest rates change. Please note, duration measures the sensitivity of price (the value of principal) of a fixed-income investment to a change in interest rates. |
| ii | Duration is the measure of the price sensitivity of a fixed-income security to an interest rate change of 100 basis points. Calculation is based on the weighted average of the present values for all cash flows. |
| iii | The Federal Reserve Board (“Fed”) is responsible for the formulation of U.S. policies designed to promote economic growth, full employment, stable prices, and a sustainable pattern of international trade and payments. |
| iv | The Barclays U.S. Aggregate Index is a broad-based bond index comprised of government, corporate, mortgage- and asset-backed issues, rated investment grade or higher, and having at least one year to maturity. |
| v | The Barclays U.S. Corporate High Yield — 2% Issuer Cap Index is an index of the 2% Issuer Cap component of the Barclays U.S. Corporate High Yield Index, which covers the U.S. dollar-denominated, non-investment grade, fixed-rate, taxable corporate bond market. |
| vi | The JPMorgan Emerging Markets Bond Index Global (“EMBI Global”) tracks total returns for U.S. dollar-denominated debt instruments issued by emerging market sovereign and quasi-sovereign entities: Brady bonds, loans, Eurobonds and local market instruments. |
| vii | The yield curve is the graphical depiction of the relationship between the yield on bonds of the same credit quality but different maturities. |
| | |
| 6 | | Western Asset High Yield Fund 2016 Annual Report |
Fund at a glance† (unaudited)
Investment breakdown (%) as a percent of total investments
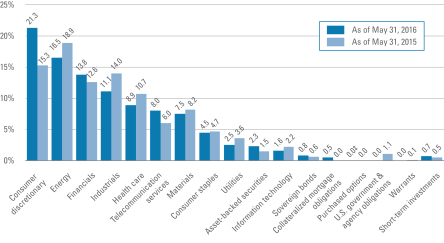
| † | The bar graph above represents the composition of the Fund’s investments as of May 31, 2016 and May 31, 2015 and does not include derivatives, such as futures contracts, forward foreign currency contracts and swap contracts. The Fund is actively managed. As a result, the composition of the Fund’s investments is subject to change at any time. |
| | |
| Western Asset High Yield Fund 2016 Annual Report | | 7 |
Fund expenses (unaudited)
Example
As a shareholder of the Fund, you may incur two types of costs: (1) transaction costs, including front-end and back-end sales charges (loads) on purchase payments; and (2) ongoing costs, including management fees; service and/or distribution (12b-1) fees; and other Fund expenses. This example is intended to help you understand your ongoing costs (in dollars) of investing in the Fund and to compare these costs with the ongoing costs of investing in other mutual funds.
This example is based on an investment of $1,000 invested on December 1, 2015 and held for the six months ended May 31, 2016.
Actual expenses
The table below titled “Based on Actual Total Return” provides information about actual account values and actual expenses. You may use the information provided in this table, together with the amount you invested, to estimate the expenses that you paid over the period. To estimate the expenses you paid on your account, divide your ending account value by $1,000 (for example, an $8,600 ending account value divided by $1,000 = 8.6), then multiply the result by the number under the heading entitled “Expenses Paid During the Period”.
Hypothetical example for comparison purposes
The table below titled “Based on Hypothetical Total Return” provides information about hypothetical account values and hypothetical expenses based on the actual expense ratio and an assumed rate of return of 5.00% per year before expenses, which is not the Fund’s actual return. The hypothetical account values and expenses may not be used to estimate the actual ending account balance or expenses you paid for the period. You may use the information provided in this table to compare the ongoing costs of investing in the Fund and other funds. To do so, compare the 5.00% hypothetical example relating to the Fund with the 5.00% hypothetical examples that appear in the shareholder reports of the other funds.
Please note that the expenses shown in the table below are meant to highlight your ongoing costs only and do not reflect any transactional costs, such as front-end or back-end sales charges (loads). Therefore, the table is useful in comparing ongoing costs only, and will not help you determine the relative total costs of owning different funds. In addition, if these transaction costs were included, your costs would have been higher.
| | | | | | | | | | | | | | | | | | | | | | | | | | | | | | | | | | | | | | | | | | | | |
| Based on actual total return1 | | | | | Based on hypothetical total return1 | |
| | | Actual
Total Return
Without
Sales
Charge2 | | | Beginning
Account
Value | | | Ending
Account
Value | | | Annualized
Expense
Ratio | | | Expenses
Paid
During
the
Period3 | | | | | | | Hypothetical
Annualized
Total Return | | | Beginning
Account
Value | | | Ending
Account
Value | | | Annualized
Expense
Ratio | | | Expenses
Paid
During
the
Period3 | |
Class A | | | 2.12 | % | | $ | 1,000.00 | | | $ | 1,021.20 | | | | 0.94 | % | | $ | 4.75 | | | | | Class A | | | 5.00 | % | | $ | 1,000.00 | | | $ | 1,020.30 | | | | 0.94 | % | | $ | 4.75 | |
Class A2 | | | 2.11 | | | | 1,000.00 | | | | 1,021.10 | | | | 1.01 | | | | 5.10 | | | | | Class A2 | | | 5.00 | | | | 1,000.00 | | | | 1,019.95 | | | | 1.01 | | | | 5.10 | |
Class C | | | 1.71 | | | | 1,000.00 | | | | 1,017.10 | | | | 1.81 | | | | 9.13 | | | | | Class C | | | 5.00 | | | | 1,000.00 | | | | 1,015.95 | | | | 1.81 | | | | 9.12 | |
Class R | | | 2.08 | | | | 1,000.00 | | | | 1,020.80 | | | | 1.30 | | | | 6.57 | | | | | Class R | | | 5.00 | | | | 1,000.00 | | | | 1,018.50 | | | | 1.30 | | | | 6.56 | |
Class I | | | 2.23 | | | | 1,000.00 | | | | 1,022.30 | | | | 0.73 | | | | 3.69 | | | | | Class I | | | 5.00 | | | | 1,000.00 | | | | 1,021.35 | | | | 0.73 | | | | 3.69 | |
Class IS | | | 2.30 | | | | 1,000.00 | | | | 1,023.00 | | | | 0.64 | | | | 3.24 | | | | | Class IS | | | 5.00 | | | | 1,000.00 | | | | 1,021.80 | | | | 0.64 | | | | 3.23 | |
| | |
| 8 | | Western Asset High Yield Fund 2016 Annual Report |
| 1 | For the six months ended May 31, 2016. |
| 2 | Assumes the reinvestment of all distributions, including returns of capital, if any, at net asset value and does not reflect the deduction of the applicable sales charge with respect to Class A and Class A2 shares or the applicable contingent deferred sales charge (“CDSC”) with respect to Class C shares. Total return is not annualized, as it may not be representative of the total return for the year. Performance figures may reflect compensating balance arrangements, fee waivers and/or expense reimbursements. In the absence of compensating balance arrangements, fee waivers and/or expense reimbursements, the total return would have been lower. Past performance is no guarantee of future results. |
| 3 | Expenses (net of compensating balance arrangements, fee waivers and/or expense reimbursements) are equal to each class’ respective annualized expense ratio multiplied by the average account value over the period, multiplied by the number of days in the most recent fiscal half-year (183), then divided by 366. |
| | |
| Western Asset High Yield Fund 2016 Annual Report | | 9 |
Fund performance (unaudited)
| | | | | | | | | | | | | | | | | | | | | | | | |
Average annual total returns | |
Without sales charges1 | | Class A | | | Class A2 | | | Class C | | | Class R | | | Class I | | | Class IS | |
Twelve Months Ended 5/31/16 | | | -5.63 | % | | | -5.70 | % | | | -6.32 | % | | | -6.01 | % | | | -5.35 | % | | | -5.32 | % |
Five Years Ended 5/31/16 | | | N/A | | | | N/A | | | | N/A | | | | N/A | | | | 3.64 | | | | 3.69 | |
Ten Years Ended 5/31/16 | | | N/A | | | | N/A | | | | N/A | | | | N/A | | | | 5.85 | | | | N/A | |
Inception* through 5/31/16 | | | 3.62 | | | | -3.13 | | | | 2.66 | | | | 3.12 | | | | — | | | | 6.97 | |
| | | | | | |
With sales charges2 | | Class A | | | Class A2 | | | Class C | | | Class R | | | Class I | | | Class IS | |
Twelve Months Ended 5/31/16 | | | -9.63 | % | | | -9.68 | % | | | -7.20 | % | | | -6.01 | % | | | -5.35 | % | | | -5.32 | % |
Five Years Ended 5/31/16 | | | N/A | | | | N/A | | | | N/A | | | | N/A | | | | 3.64 | | | | 3.69 | |
Ten Years Ended 5/31/16 | | | N/A | | | | N/A | | | | N/A | | | | N/A | | | | 5.85 | | | | N/A | |
Inception* through 5/31/16 | | | 2.53 | | | | -5.40 | | | | 2.66 | | | | 3.12 | | | | — | | | | 6.97 | |
| | | | |
Cumulative total returns | |
Without sales charges1 | | | |
Class A (Inception date of 4/30/12 through 5/31/16) | | | 15.64 | % |
Class A2 (Inception date of 8/1/14 through 5/31/16) | | | -5.64 | |
Class C (Inception date of 4/30/12 through 5/31/16) | | | 11.32 | |
Class R (Inception date of 4/30/12 through 5/31/16) | | | 13.39 | |
Class I (5/31/06 through 5/31/16) | | | 76.61 | |
Class IS (Inception date of 8/4/08 through 5/31/16) | | | 69.40 | |
All figures represent past performance and are not a guarantee of future results. Investment return and principal value of an investment will fluctuate so that an investor’s shares, when redeemed, may be worth more or less than their original cost. The returns shown do not reflect the deduction of taxes that a shareholder would pay on Fund distributions or the redemption of Fund shares. Performance figures may reflect compensating balance arrangements, fee waivers and/or expense reimbursements. In the absence of compensating balance arrangements, fee waivers and/or expense reimbursements, the total return would have been lower.
| 1 | Assumes the reinvestment of all distributions, including returns of capital, if any, at net asset value and does not reflect the deduction of the applicable sales charge with respect to Class A shares and Class A2 shares or the applicable contingent deferred sales charge (“CDSC”) with respect to Class C shares. |
| 2 | Assumes the reinvestment of all distributions, including returns of capital, if any, at net asset value. In addition, Class A shares and Class A2 shares reflect the deduction of the maximum initial sales charge of 4.25%. Class C shares reflect the deduction of a 1.00% CDSC, which applies if shares are redeemed within one year from purchase payment. |
| * | Inception dates for Class A, A2, C, R, I and IS shares are April 30, 2012, August 1, 2014, April 30, 2012, April 30, 2012, September 28, 2001 and August 4, 2008, respectively. |
| | |
| 10 | | Western Asset High Yield Fund 2016 Annual Report |
Historical performance
Value of $1,000,000 invested in
Class I Shares of Western Asset High Yield Fund vs. Barclays U.S. Corporate High Yield — 2% Issuer Cap Index† — May 2006 - May 2016
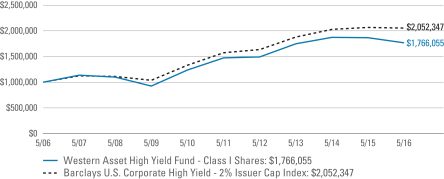
All figures represent past performance and are not a guarantee of future results. Investment return and principal value of an investment will fluctuate so that an investor’s shares, when redeemed, may be worth more or less than their original cost. The returns shown do not reflect the deduction of taxes that a shareholder would pay on Fund distributions or the redemption of Fund shares. Performance figures may reflect compensating balance arrangements, fee waivers and/or expense reimbursements. In the absence of compensating balance arrangements, fee waivers and/or expense reimbursements, the total return would have been lower.
| † | Hypothetical illustration of $1,000,000 invested in Class I shares of Western Asset High Yield Fund on May 31, 2006, assuming the reinvestment of all distributions, including returns of capital, if any, at net asset value through May 31, 2016. The hypothetical illustration also assumes a $1,000,000 investment in the Barclays U.S. Corporate High Yield — 2% Issuer Cap Index. The Barclays U.S. Corporate High Yield — 2% Issuer Cap Index is an index of the 2% Issuer Cap component of the Barclays U.S. Corporate High Yield Index, which covers the U.S. dollar-denominated, non-investment grade, fixed-rate, taxable corporate bond market. The Index is unmanaged and not subject to the same management and trading expenses as a mutual fund. Please note that an investor cannot invest directly in an index. The performance of the Fund’s other classes may be greater or less than the performance of Class I shares indicated on this chart, depending on whether greater or lesser sales charges and fees were incurred by shareholders investing in the other classes. |
| | |
| Western Asset High Yield Fund 2016 Annual Report | | 11 |
Spread duration (unaudited)
Economic exposure — May 31, 2016
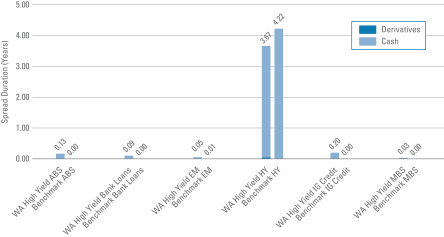
Spread duration measures the sensitivity to changes in spreads. The spread over Treasuries is the annual risk-premium demanded by investors to hold non-Treasury securities. Spread duration is quantified as the % change in price resulting from a 100 basis points change in spreads. For a security with positive spread duration, an increase in spreads would result in a price decline and a decline in spreads would result in a price increase. This chart highlights the market sector exposure of the Fund’s sectors relative to the selected benchmark sectors as of the end of the reporting period.
| | |
| ABS | | — Asset-Backed Securities |
| Benchmark | | — Barclays U.S. Corporate High Yield — 2% Issuer Cap Index |
| EM | | — Emerging Markets |
| HY | | — High Yield |
| IG Credit | | — Investment Grade Credit |
| MBS | | — Mortgage-Backed Securities |
| WA High Yield | | — Western Asset High Yield Fund |
| | |
| 12 | | Western Asset High Yield Fund 2016 Annual Report |
Effective duration (unaudited)
Interest rate exposure — May 31, 2016
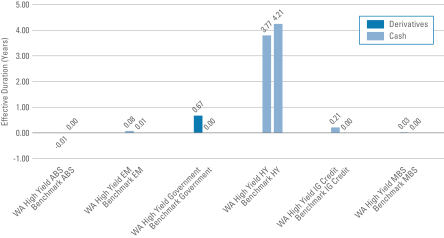
Effective duration measures the sensitivity to changes in relevant interest rates. Effective duration is quantified as the % change in price resulting from a 100 basis points change in interest rates. For a security with positive effective duration, an increase in interest rates would result in a price decline and a decline in interest rates would result in a price increase. This chart highlights the interest rate exposure of the Fund’s sectors relative to the selected benchmark sectors as of the end of the reporting period.
| | |
| ABS | | — Asset-Backed Securities |
| Benchmark | | — Barclays U.S. Corporate High Yield — 2% Issuer Cap Index |
| EM | | — Emerging Markets |
| HY | | — High Yield |
| IG Credit | | — Investment Grade Credit |
| MBS | | — Mortgage-Backed Securities |
| WA High Yield | | — Western Asset High Yield Fund |
| | |
| Western Asset High Yield Fund 2016 Annual Report | | 13 |
Schedule of investments
May 31, 2016
Western Asset High Yield Fund
| | | | | | | | | | | | | | | | |
| Security | | Rate | | | Maturity
Date | | | Face
Amount† | | | Value | |
| Corporate Bonds & Notes — 83.2% | | | | | | | | | | | | | | | | |
| Consumer Discretionary — 18.9% | | | | | | | | | | | | | | | | |
Auto Components — 0.7% | | | | | | | | | | | | | | | | |
American Axle & Manufacturing Inc., Senior Notes | | | 6.250 | % | | | 3/15/21 | | | | 200,000 | | | $ | 208,000 | |
Goodyear Tire & Rubber Co., Senior Bonds | | | 5.125 | % | | | 11/15/23 | | | | 750,000 | | | | 766,875 | |
Goodyear Tire & Rubber Co., Senior Notes | | | 5.000 | % | | | 5/31/26 | | | | 440,000 | | | | 444,950 | |
ZF North America Capital Inc., Senior Notes | | | 4.750 | % | | | 4/29/25 | | | | 740,000 | | | | 740,000 | (a) |
Total Auto Components | | | | | | | | | | | | | | | 2,159,825 | |
Automobiles — 0.1% | | | | | | | | | | | | | | | | |
General Motors Co., Senior Notes | | | 6.600 | % | | | 4/1/36 | | | | 160,000 | | | | 183,460 | |
General Motors Co., Senior Notes | | | 5.200 | % | | | 4/1/45 | | | | 220,000 | | | | 214,037 | |
General Motors Co., Senior Notes | | | 6.750 | % | | | 4/1/46 | | | | 30,000 | | | | 35,149 | |
Total Automobiles | | | | | | | | | | | | | | | 432,646 | |
Diversified Consumer Services — 1.2% | | | | | | | | | | | | | | | | |
Cengage Learning Inc., Senior Notes | | | 9.500 | % | | | 6/15/24 | | | | 650,000 | | | | 658,125 | (a) |
Prime Security Services Borrower LLC/Prime Finance Inc., Secured Notes | | | 9.250 | % | | | 5/15/23 | | | | 1,160,000 | | | | 1,209,300 | (a) |
Service Corp. International, Senior Notes | | | 5.375 | % | | | 5/15/24 | | | | 510,000 | | | | 527,850 | |
Service Corp. International, Senior Notes | | | 7.500 | % | | | 4/1/27 | | | | 337,000 | | | | 394,290 | |
StoneMor Partners LP/Cornerstone Family Services of WV, Senior Notes | | | 7.875 | % | | | 6/1/21 | | | | 870,000 | | | | 867,825 | |
Total Diversified Consumer Services | | | | | | | | | | | | | | | 3,657,390 | |
Hotels, Restaurants & Leisure — 3.6% | | | | | | | | | | | | | | | | |
1011778 BC ULC/New Red Finance Inc., Secured Notes | | | 6.000 | % | | | 4/1/22 | | | | 590,000 | | | | 611,387 | (a) |
1011778 BC ULC/New Red Finance Inc., Senior Secured Notes | | | 4.625 | % | | | 1/15/22 | | | | 1,280,000 | | | | 1,307,200 | (a) |
Bossier Casino Venture Holdco Inc., Senior Secured Bonds | | | 14.000 | % | | | 2/9/18 | | | | 1,253,806 | | | | 1,253,806 | (a)(b)(c)(d) |
Boyd Gaming Corp., Senior Notes | | | 6.375 | % | | | 4/1/26 | | | | 290,000 | | | | 298,700 | (a) |
Carrols Restaurant Group Inc., Secured Notes | | | 8.000 | % | | | 5/1/22 | | | | 855,000 | | | | 924,469 | |
CEC Entertainment Inc., Senior Notes | | | 8.000 | % | | | 2/15/22 | | | | 450,000 | | | | 424,125 | |
Downstream Development Authority of the Quapaw Tribe of Oklahoma, Senior Secured Notes | | | 10.500 | % | | | 7/1/19 | | | | 500,000 | | | | 467,500 | (a) |
Fontainebleau Las Vegas Holdings LLC, Senior Secured Notes | | | 10.250 | % | | | 6/15/15 | | | | 1,455,000 | | | | 145 | *(a)(e) |
GLP Capital LP/GLP Financing II Inc., Senior Notes | | | 5.375 | % | | | 4/15/26 | | | | 750,000 | | | | 781,875 | |
Greektown Holdings LLC/Greektown Mothership Corp., Senior Secured Notes | | | 8.875 | % | | | 3/15/19 | | | | 320,000 | | | | 335,200 | (a) |
Hilton Worldwide Finance LLC/Hilton Worldwide Finance Corp., Senior Notes | | | 5.625 | % | | | 10/15/21 | | | | 485,000 | | | | 502,270 | |
Landry’s Holdings II Inc., Senior Notes | | | 10.250 | % | | | 1/1/18 | | | | 170,000 | | | | 171,700 | (a) |
See Notes to Financial Statements.
| | |
| 14 | | Western Asset High Yield Fund 2016 Annual Report |
Western Asset High Yield Fund
| | | | | | | | | | | | | | | | |
| Security | | Rate | | | Maturity
Date | | | Face
Amount† | | | Value | |
Hotels, Restaurants & Leisure — continued | | | | | | | | | | | | | | | | |
Landry’s Inc., Senior Notes | | | 9.375 | % | | | 5/1/20 | | | | 729,000 | | | $ | 765,450 | (a) |
MCE Finance Ltd., Senior Notes | | | 5.000 | % | | | 2/15/21 | | | | 340,000 | | | | 333,693 | (a) |
MGM Growth Properties Operating Partnership LP/MGP Escrow Co.-Issuer Inc., Senior Notes | | | 5.625 | % | | | 5/1/24 | | | | 460,000 | | | | 483,000 | (a) |
MGM Resorts International, Senior Notes | | | 6.625 | % | | | 12/15/21 | | | | 360,000 | | | | 388,350 | |
NCL Corp. Ltd., Senior Bonds | | | 4.625 | % | | | 11/15/20 | | | | 380,000 | | | | 387,600 | (a) |
Pinnacle Entertainment Inc., Senior Bonds | | | 5.625 | % | | | 5/1/24 | | | | 10,000 | | | | 9,775 | (a) |
Speedway Motorsports Inc., Senior Notes | | | 5.125 | % | | | 2/1/23 | | | | 700,000 | | | | 714,000 | |
Viking Cruises Ltd., Senior Notes | | | 6.250 | % | | | 5/15/25 | | | | 1,080,000 | | | | 850,500 | (a) |
Total Hotels, Restaurants & Leisure | | | | | | | | | | | | | | | 11,010,745 | |
Household Durables — 2.7% | | | | | | | | | | | | | | | | |
CalAtlantic Group Inc., Senior Notes | | | 6.250 | % | | | 12/15/21 | | | | 720,000 | | | | 771,300 | |
CalAtlantic Group Inc., Senior Notes | | | 5.250 | % | | | 6/1/26 | | | | 270,000 | | | | 266,456 | |
Century Intermediate Holding Co. 2, Senior Notes | | | 9.750 | % | | | 2/15/19 | | | | 1,670,000 | | | | 1,695,050 | (a)(b) |
PulteGroup Inc., Senior Notes | | | 4.250 | % | | | 3/1/21 | | | | 80,000 | | | | 81,700 | |
PulteGroup Inc., Senior Notes | | | 5.500 | % | | | 3/1/26 | | | | 990,000 | | | | 1,009,186 | |
Shea Homes LP/Shea Homes Funding Corp., Senior Notes | | | 5.875 | % | | | 4/1/23 | | | | 260,000 | | | | 261,300 | (a) |
Shea Homes LP/Shea Homes Funding Corp., Senior Notes | | | 6.125 | % | | | 4/1/25 | | | | 1,330,000 | | | | 1,330,000 | (a) |
Toll Brothers Finance Corp., Senior Notes | | | 4.000 | % | | | 12/31/18 | | | | 110,000 | | | | 114,125 | |
Toll Brothers Finance Corp., Senior Notes | | | 6.750 | % | | | 11/1/19 | | | | 60,000 | | | | 67,500 | |
William Lyon Homes Inc., Senior Notes | | | 5.750 | % | | | 4/15/19 | | | | 320,000 | | | | 316,000 | |
William Lyon Homes Inc., Senior Notes | | | 8.500 | % | | | 11/15/20 | | | | 540,000 | | | | 561,600 | |
William Lyon Homes Inc., Senior Notes | | | 7.000 | % | | | 8/15/22 | | | | 70,000 | | | | 69,475 | |
Woodside Homes Co., LLC/Woodside Homes Finance Inc., Senior Notes | | | 6.750 | % | | | 12/15/21 | | | | 1,730,000 | | | | 1,608,900 | (a) |
Total Household Durables | | | | | | | | | | | | | | | 8,152,592 | |
Internet & Catalog Retail — 0.2% | | | | | | | | | | | | | | | | |
Netflix Inc., Senior Bonds | | | 5.875 | % | | | 2/15/25 | | | | 597,000 | | | | 625,358 | |
Leisure Products — 0.5% | | | | | | | | | | | | | | | | |
Gibson Brands Inc., Senior Secured Notes | | | 8.875 | % | | | 8/1/18 | | | | 1,530,000 | | | | 807,075 | (a) |
Vista Outdoor Inc., Senior Notes | | | 5.875 | % | | | 10/1/23 | | | | 680,000 | | | | 710,668 | (a) |
Total Leisure Products | | | | | | | | | | | | | | | 1,517,743 | |
Media — 6.4% | | | | | | | | | | | | | | | | |
Carmike Cinemas Inc., Secured Notes | | | 6.000 | % | | | 6/15/23 | | | | 420,000 | | | | 443,100 | (a) |
CCO Holdings LLC/CCO Holdings Capital Corp., Senior Notes | | | 5.125 | % | | | 2/15/23 | | | | 420,000 | | | | 427,350 | |
CCO Holdings LLC/CCO Holdings Capital Corp., Senior Notes | | | 5.875 | % | | | 4/1/24 | | | | 370,000 | | | | 385,725 | (a) |
CCO Holdings LLC/CCO Holdings Capital Corp., Senior Notes | | | 5.750 | % | | | 2/15/26 | | | | 1,020,000 | | | | 1,045,500 | (a) |
See Notes to Financial Statements.
| | |
| Western Asset High Yield Fund 2016 Annual Report | | 15 |
Schedule of investments (cont’d)
May 31, 2016
Western Asset High Yield Fund
| | | | | | | | | | | | | | | | |
| Security | | Rate | | | Maturity
Date | | | Face
Amount† | | | Value | |
Media — continued | | | | | | | | | | | | | | | | |
Charter Communications Operating LLC/Charter Communications Operating Capital Corp., Senior Secured Notes | | | 4.908 | % | | | 7/23/25 | | | | 1,260,000 | | | $ | 1,347,725 | (a) |
Charter Communications Operating LLC/Charter Communications Operating Capital Corp., Senior Secured Notes | | | 6.484 | % | | | 10/23/45 | | | | 510,000 | | | | 585,648 | (a) |
DISH DBS Corp., Senior Notes | | | 5.875 | % | | | 7/15/22 | | | | 400,000 | | | | 387,000 | |
DISH DBS Corp., Senior Notes | | | 5.875 | % | | | 11/15/24 | | | | 3,180,000 | | | | 2,943,122 | |
iHeartCommunications Inc., Senior Notes | | | 14.000 | % | | | 2/1/21 | | | | 1,302,900 | | | | 511,388 | (b) |
Lamar Media Corp., Senior Notes | | | 5.750 | % | | | 2/1/26 | | | | 200,000 | | | | 210,500 | (a) |
MDC Partners Inc., Senior Notes | | | 6.500 | % | | | 5/1/24 | | | | 1,190,000 | | | | 1,151,325 | (a) |
MediaNews Group Inc. | | | 12.000 | % | | | 12/31/18 | | | | 695,000 | | | | 695,000 | (d) |
New Cotai LLC/New Cotai Capital Corp., Senior Secured Notes | | | 10.625 | % | | | 5/1/19 | | | | 2,241,733 | | | | 1,479,544 | (a)(b) |
Numericable-SFR SA, Senior Secured Bonds | | | 6.000 | % | | | 5/15/22 | | | | 1,180,000 | | | | 1,174,690 | (a) |
Numericable-SFR SA, Senior Secured Notes | | | 7.375 | % | | | 5/1/26 | | | | 3,210,000 | | | | 3,238,087 | (a) |
Time Warner Cable Inc., Debentures | | | 7.300 | % | | | 7/1/38 | | | | 520,000 | | | | 626,108 | |
Viacom Inc., Senior Notes | | | 4.375 | % | | | 3/15/43 | | | | 720,000 | | | | 550,670 | |
Virgin Media Finance PLC, Senior Notes | | | 6.000 | % | | | 10/15/24 | | | | 1,680,000 | | | | 1,705,200 | (a) |
Virgin Media Secured Finance PLC, Senior Secured Notes | | | 5.500 | % | | | 8/15/26 | | | | 260,000 | | | | 262,600 | (a) |
Total Media | | | | | | | | | | | | | | | 19,170,282 | |
Multiline Retail — 0.9% | | | | | | | | | | | | | | | | |
Dollar Tree Inc., Senior Notes | | | 5.750 | % | | | 3/1/23 | | | | 1,430,000 | | | | 1,510,438 | (a) |
Neiman Marcus Group Ltd. LLC, Senior Notes | | | 8.000 | % | | | 10/15/21 | | | | 890,000 | | | | 671,950 | (a) |
Neiman Marcus Group Ltd. LLC, Senior Notes | | | 8.750 | % | | | 10/15/21 | | | | 660,000 | | | | 463,650 | (a)(b) |
Total Multiline Retail | | | | | | | | | | | | | | | 2,646,038 | |
Specialty Retail — 1.7% | | | | | | | | | | | | | | | | |
GameStop Corp., Senior Notes | | | 5.500 | % | | | 10/1/19 | | | | 700,000 | | | | 680,750 | (a) |
GameStop Corp., Senior Notes | | | 6.750 | % | | | 3/15/21 | | | | 540,000 | | | | 527,850 | (a) |
Guitar Center Inc., Senior Bonds | | | 9.625 | % | | | 4/15/20 | | | | 2,280,000 | | | | 1,653,000 | (a) |
Guitar Center Inc., Senior Secured Bonds | | | 6.500 | % | | | 4/15/19 | | | | 140,000 | | | | 124,250 | (a) |
L Brands Inc., Debentures | | | 6.950 | % | | | 3/1/33 | | | | 580,000 | | | | 584,350 | |
L Brands Inc., Senior Notes | | | 6.875 | % | | | 11/1/35 | | | | 880,000 | | | | 928,400 | |
Sally Holdings LLC/Sally Capital Inc., Senior Notes | | | 5.625 | % | | | 12/1/25 | | | | 630,000 | | | | 659,138 | |
Total Specialty Retail | | | | | | | | | | | | | | | 5,157,738 | |
Textiles, Apparel & Luxury Goods — 0.9% | | | | | | | | | | | | | | | | |
Empire Today LLC/Empire Today Finance Corp., Senior Secured Notes | | | 11.375 | % | | | 2/1/17 | | | | 370,000 | | | | 362,600 | (a) |
Hanesbrands Inc., Senior Notes | | | 4.625 | % | | | 5/15/24 | | | | 280,000 | | | | 280,000 | (a) |
See Notes to Financial Statements.
| | |
| 16 | | Western Asset High Yield Fund 2016 Annual Report |
Western Asset High Yield Fund
| | | | | | | | | | | | | | | | |
| Security | | Rate | | | Maturity
Date | | | Face
Amount† | | | Value | |
Textiles, Apparel & Luxury Goods — continued | | | | | | | | | | | | | | | | |
Hanesbrands Inc., Senior Notes | | | 4.875 | % | | | 5/15/26 | | | | 250,000 | | | $ | 250,313 | (a) |
Levi Strauss & Co., Senior Notes | | | 5.000 | % | | | 5/1/25 | | | | 930,000 | | | | 931,162 | |
William Carter Co., Senior Notes | | | 5.250 | % | | | 8/15/21 | | | | 775,000 | | | | 802,125 | |
Total Textiles, Apparel & Luxury Goods | | | | | | | | | | | | | | | 2,626,200 | |
Total Consumer Discretionary | | | | | | | | | | | | | | | 57,156,557 | |
| Consumer Staples — 4.1% | | | | | | | | | | | | | | | | |
Beverages — 1.0% | | | | | | | | | | | | | | | | |
Carolina Beverage Group LLC/Carolina Beverage Group Finance Inc., Secured Notes | | | 10.625 | % | | | 8/1/18 | | | | 820,000 | | | | 779,000 | (a) |
Constellation Brands Inc., Senior Notes | | | 4.250 | % | | | 5/1/23 | | | | 520,000 | | | | 535,600 | |
Constellation Brands Inc., Senior Notes | | | 4.750 | % | | | 11/15/24 | | | | 1,320,000 | | | | 1,387,650 | |
Constellation Brands Inc., Senior Notes | | | 4.750 | % | | | 12/1/25 | | | | 480,000 | | | | 502,200 | |
Total Beverages | | | | | | | | | | | | | | | 3,204,450 | |
Food & Staples Retailing — 0.5% | | | | | | | | | | | | | | | | |
Beverages & More Inc., Senior Secured Notes | | | 10.000 | % | | | 11/15/18 | | | | 1,360,000 | | | | 1,251,200 | (a) |
Performance Food Group Inc., Senior Notes | | | 5.500 | % | | | 6/1/24 | | | | 250,000 | | | | 253,125 | (a) |
Total Food & Staples Retailing | | | | | | | | | | | | | | | 1,504,325 | |
Food Products — 1.3% | | | | | | | | | | | | | | | | |
Dole Food Co. Inc., Senior Secured Notes | | | 7.250 | % | | | 5/1/19 | | | | 730,000 | | | | 722,700 | (a) |
Kraft Heinz Foods Co., Secured Notes | | | 4.875 | % | | | 2/15/25 | | | | 142,000 | | | | 155,112 | (a) |
Kraft Heinz Foods Co., Senior Notes | | | 7.125 | % | | | 8/1/39 | | | | 290,000 | | | | 383,196 | (a) |
Pilgrim’s Pride Corp., Senior Notes | | | 5.750 | % | | | 3/15/25 | | | | 960,000 | | | | 967,805 | (a) |
Simmons Foods Inc., Secured Notes | | | 7.875 | % | | | 10/1/21 | | | | 1,780,000 | | | | 1,619,800 | (a) |
Total Food Products | | | | | | | | | | | | | | | 3,848,613 | |
Household Products — 1.0% | | | | | | | | | | | | | | | | |
Central Garden & Pet Co., Senior Notes | | | 6.125 | % | | | 11/15/23 | | | | 480,000 | | | | 498,000 | |
Kronos Acquisition Holdings Inc., Senior Notes | | | 9.000 | % | | | 8/15/23 | | | | 290,000 | | | | 280,575 | (a) |
Spectrum Brands Inc., Senior Notes | | | 6.125 | % | | | 12/15/24 | | | | 700,000 | | | | 740,250 | |
Spectrum Brands Inc., Senior Notes | | | 5.750 | % | | | 7/15/25 | | | | 420,000 | | | | 438,900 | |
Sun Products Corp., Senior Notes | | | 7.750 | % | | | 3/15/21 | | | | 1,020,000 | | | | 986,850 | (a) |
Total Household Products | | | | | | | | | | | | | | | 2,944,575 | |
Tobacco — 0.3% | | | | | | | | | | | | | | | | |
Alliance One International Inc., Secured Notes | | | 9.875 | % | | | 7/15/21 | | | | 1,160,000 | | | | 1,017,900 | |
Total Consumer Staples | | | | | | | | | | | | | | | 12,519,863 | |
| Energy — 14.1% | | | | | | | | | | | | | | | | |
Energy Equipment & Services — 1.0% | | | | | | | | | | | | | | | | |
CGG, Senior Notes | | | 6.500 | % | | | 6/1/21 | | | | 1,870,000 | | | | 794,750 | |
Ensco PLC, Senior Notes | | | 4.700 | % | | | 3/15/21 | | | | 180,000 | | | | 141,300 | |
See Notes to Financial Statements.
| | |
| Western Asset High Yield Fund 2016 Annual Report | | 17 |
Schedule of investments (cont’d)
May 31, 2016
Western Asset High Yield Fund
| | | | | | | | | | | | | | | | |
| Security | | Rate | | | Maturity
Date | | | Face
Amount† | | | Value | |
Energy Equipment & Services — continued | | | | | | | | | | | | | | | | |
Ensco PLC, Senior Notes | | | 5.200 | % | | | 3/15/25 | | | | 190,000 | | | $ | 126,255 | |
Ensco PLC, Senior Notes | | | 5.750 | % | | | 10/1/44 | | | | 770,000 | | | | 448,525 | |
KCA Deutag UK Finance PLC, Senior Secured Notes | | | 7.250 | % | | | 5/15/21 | | | | 950,000 | | | | 688,750 | (a) |
Pride International Inc., Senior Notes | | | 7.875 | % | | | 8/15/40 | | | | 950,000 | | | | 650,275 | |
Total Energy Equipment & Services | | | | | | | | | | | | | | | 2,849,855 | |
Oil, Gas & Consumable Fuels — 13.1% | | | | | | | | | | | | | | | | |
Berry Petroleum Co., Senior Notes | | | 6.750 | % | | | 11/1/20 | | | | 1,580,000 | | | | 379,200 | *(f) |
Berry Petroleum Co., Senior Notes | | | 6.375 | % | | | 9/15/22 | | | | 1,520,000 | | | | 364,800 | *(f) |
Blue Racer Midstream LLC/Blue Racer Finance Corp., Senior Notes | | | 6.125 | % | | | 11/15/22 | | | | 750,000 | | | | 675,000 | (a) |
California Resources Corp., Senior Notes | | | 5.500 | % | | | 9/15/21 | | | | 820,000 | | | | 442,800 | |
California Resources Corp., Senior Notes | | | 6.000 | % | | | 11/15/24 | | | | 80,000 | | | | 43,300 | |
Calumet Specialty Products Partners LP/Calumet Finance Corp., Senior Notes | | | 7.625 | % | | | 1/15/22 | | | | 770,000 | | | | 510,125 | |
Calumet Specialty Products Partners LP/Calumet Finance Corp., Senior Secured Notes | | | 11.500 | % | | | 1/15/21 | | | | 820,000 | | | | 889,700 | (a) |
Carrizo Oil & Gas Inc., Senior Notes | | | 7.500 | % | | | 9/15/20 | | | | 260,000 | | | | 260,650 | |
Carrizo Oil & Gas Inc., Senior Notes | | | 6.250 | % | | | 4/15/23 | | | | 350,000 | | | | 342,125 | |
Chesapeake Energy Corp., Senior Notes | | | 6.875 | % | | | 11/15/20 | | | | 950,000 | | | | 622,250 | |
Chesapeake Energy Corp., Senior Notes | | | 5.375 | % | | | 6/15/21 | | | | 180,000 | | | | 112,050 | |
Chesapeake Energy Corp., Senior Notes | | | 4.875 | % | | | 4/15/22 | | | | 1,000,000 | | | | 600,000 | |
Chesapeake Energy Corp., Senior Notes | | | 5.750 | % | | | 3/15/23 | | | | 1,410,000 | | | | 860,100 | |
Cloud Peak Energy Resources LLC/Cloud Peak Energy Finance Corp., Senior Notes | | | 6.375 | % | | | 3/15/24 | | | | 260,000 | | | | 89,700 | |
Concho Resources Inc., Senior Notes | | | 5.500 | % | | | 4/1/23 | | | | 890,000 | | | | 890,000 | |
Continental Resources Inc., Senior Notes | | | 4.500 | % | | | 4/15/23 | | | | 160,000 | | | | 145,700 | |
Continental Resources Inc., Senior Notes | | | 4.900 | % | | | 6/1/44 | | | | 1,140,000 | | | | 937,650 | |
Crestwood Midstream Partners LP/Crestwood Midstream Finance Corp., Senior Notes | | | 6.125 | % | | | 3/1/22 | | | | 1,300,000 | | | | 1,228,110 | |
CrownRock LP/CrownRock Finance Inc., Senior Notes | | | 7.750 | % | | | 2/15/23 | | | | 660,000 | | | | 688,050 | (a) |
Ecopetrol SA, Senior Bonds | | | 4.125 | % | | | 1/16/25 | | | | 30,000 | | | | 26,288 | |
Ecopetrol SA, Senior Notes | | | 5.875 | % | | | 9/18/23 | | | | 148,000 | | | | 148,141 | |
Endeavor Energy Resources LP/EER Finance Inc., Senior Notes | | | 7.000 | % | | | 8/15/21 | | | | 580,000 | | | | 565,500 | (a) |
EP Energy LLC/Everest Acquisition Finance Inc., Senior Notes | | | 9.375 | % | | | 5/1/20 | | | | 1,090,000 | | | | 700,325 | |
EP Energy LLC/Everest Acquisition Finance Inc., Senior Notes | | | 6.375 | % | | | 6/15/23 | | | | 810,000 | | | | 413,100 | |
EV Energy Partners LP/EV Energy Finance Corp., Senior Notes | | | 8.000 | % | | | 4/15/19 | | | | 500,000 | | | | 265,000 | |
Freeport-McMoRan Oil & Gas LLC/FCX Oil & Gas Inc., Senior Notes | | | 6.125 | % | | | 6/15/19 | | | | 270,000 | | | | 265,950 | |
Freeport-McMoRan Oil & Gas LLC/FCX Oil & Gas Inc., Senior Notes | | | 6.750 | % | | | 2/1/22 | | | | 320,000 | | | | 300,000 | |
See Notes to Financial Statements.
| | |
| 18 | | Western Asset High Yield Fund 2016 Annual Report |
Western Asset High Yield Fund
| | | | | | | | | | | | | | | | |
| Security | | Rate | | | Maturity
Date | | | Face
Amount† | | | Value | |
Oil, Gas & Consumable Fuels — continued | | | | | | | | | | | | | | | | |
Freeport-McMoRan Oil & Gas LLC/FCX Oil & Gas Inc., Senior Notes | | | 6.875 | % | | | 2/15/23 | | | | 1,540,000 | | | $ | 1,432,200 | |
Genesis Energy LP/Genesis Energy Finance Corp., Senior Notes | | | 6.000 | % | | | 5/15/23 | | | | 590,000 | | | | 542,800 | |
Kinder Morgan Inc., Medium-Term Notes | | | 7.750 | % | | | 1/15/32 | | | | 320,000 | | | | 346,193 | |
Laredo Petroleum Inc., Senior Notes | | | 7.375 | % | | | 5/1/22 | | | | 350,000 | | | | 352,187 | |
LUKOIL International Finance BV, Senior Notes | | | 6.125 | % | | | 11/9/20 | | | | 280,000 | | | | 302,050 | (a) |
Magnum Hunter Resources Corp. Escrow | | | — | | | | — | | | | 2,560,000 | | | | 0 | *(c)(d)(g) |
MEG Energy Corp., Senior Notes | | | 6.500 | % | | | 3/15/21 | | | | 190,000 | | | | 149,625 | (a) |
MEG Energy Corp., Senior Notes | | | 6.375 | % | | | 1/30/23 | | | | 710,000 | | | | 543,150 | (a) |
MEG Energy Corp., Senior Notes | | | 7.000 | % | | | 3/31/24 | | | | 310,000 | | | | 238,700 | (a) |
Milagro Oil & Gas Inc., Secured Notes | | | 10.500 | % | | | 5/15/16 | | | | 1,910,000 | | | | 630,300 | *(c)(e) |
MPLX LP, Senior Notes | | | 4.875 | % | | | 6/1/25 | | | | 1,580,000 | | | | 1,497,898 | (a) |
Murphy Oil USA Inc., Senior Notes | | | 6.000 | % | | | 8/15/23 | | | | 481,000 | | | | 499,037 | |
Murray Energy Corp., Senior Secured Notes | | | 11.250 | % | | | 4/15/21 | | | | 2,300,000 | | | | 442,750 | (a) |
Natural Resource Partners LP/Natural Resource Partners Finance Corp., Senior Notes | | | 9.125 | % | | | 10/1/18 | | | | 780,000 | | | | 530,400 | |
NGL Energy Partners LP/NGL Energy Finance Corp., Senior Notes | | | 6.875 | % | | | 10/15/21 | | | | 610,000 | | | | 524,600 | |
NGPL PipeCo LLC, Senior Secured Notes | | | 7.768 | % | | | 12/15/37 | | | | 610,000 | | | | 599,325 | (a) |
Oasis Petroleum Inc., Senior Notes | | | 6.500 | % | | | 11/1/21 | | | | 480,000 | | | | 433,200 | |
Oasis Petroleum Inc., Senior Notes | | | 6.875 | % | | | 3/15/22 | | | | 870,000 | | | | 800,400 | |
Oasis Petroleum Inc., Senior Notes | | | 6.875 | % | | | 1/15/23 | | | | 570,000 | | | | 514,425 | |
Pacific Drilling V Ltd., Senior Secured Notes | | | 7.250 | % | | | 12/1/17 | | | | 810,000 | | | | 336,150 | (a) |
Parsley Energy LLC/Parsley Finance Corp., Senior Notes | | | 7.500 | % | | | 2/15/22 | | | | 60,000 | | | | 63,375 | (a) |
Parsley Energy LLC/Parsley Finance Corp., Senior Notes | | | 6.250 | % | | | 6/1/24 | | | | 330,000 | | | | 335,775 | (a) |
QEP Resources Inc., Senior Notes | | | 6.875 | % | | | 3/1/21 | | | | 373,000 | | | | 374,865 | |
QEP Resources Inc., Senior Notes | | | 5.250 | % | | | 5/1/23 | | | | 810,000 | | | | 745,200 | |
Range Resources Corp., Senior Notes | | | 4.875 | % | | | 5/15/25 | | | | 870,000 | | | | 822,150 | |
Rice Energy Inc., Senior Notes | | | 6.250 | % | | | 5/1/22 | | | | 630,000 | | | | 620,550 | |
Rice Energy Inc., Senior Notes | | | 7.250 | % | | | 5/1/23 | | | | 260,000 | | | | 262,600 | |
Rockies Express Pipeline LLC, Senior Notes | | | 7.500 | % | | | 7/15/38 | | | | 590,000 | | | | 604,750 | (a) |
Rockies Express Pipeline LLC, Senior Notes | | | 6.875 | % | | | 4/15/40 | | | | 1,490,000 | | | | 1,452,750 | (a) |
Rose Rock Midstream LP/Rose Rock Finance Corp., Senior Notes | | | 5.625 | % | | | 11/15/23 | | | | 680,000 | | | | 564,400 | |
RSP Permian Inc., Senior Notes | | | 6.625 | % | | | 10/1/22 | | | | 720,000 | | | | 743,400 | |
Sanchez Energy Corp., Senior Notes | | | 7.750 | % | | | 6/15/21 | | | | 1,390,000 | | | | 1,063,350 | |
Sanchez Energy Corp., Senior Notes | | | 6.125 | % | | | 1/15/23 | | | | 390,000 | | | | 280,800 | |
Shelf Drilling Holdings Ltd., Senior Secured Notes | | | 8.625 | % | | | 11/1/18 | | | | 1,020,000 | | | | 752,250 | (a) |
See Notes to Financial Statements.
| | |
| Western Asset High Yield Fund 2016 Annual Report | | 19 |
Schedule of investments (cont’d)
May 31, 2016
Western Asset High Yield Fund
| | | | | | | | | | | | | | | | |
| Security | | Rate | | | Maturity
Date | | | Face
Amount† | | | Value | |
Oil, Gas & Consumable Fuels — continued | | | | | | | | | | | | | | | | |
SM Energy Co., Senior Notes | | | 6.125 | % | | | 11/15/22 | | | | 190,000 | | | $ | 173,850 | |
SM Energy Co., Senior Notes | | | 5.000 | % | | | 1/15/24 | | | | 260,000 | | | | 222,329 | |
SM Energy Co., Senior Notes | | | 5.625 | % | | | 6/1/25 | | | | 520,000 | | | | 447,200 | |
Summit Midstream Holdings LLC/Summit Midstream Finance Corp., Senior Notes | | | 5.500 | % | | | 8/15/22 | | | | 1,170,000 | | | | 959,400 | |
Targa Resources Partners LP/Targa Resources Partners Finance Corp., Senior Notes | | | 6.375 | % | | | 8/1/22 | | | | 1,199,000 | | | | 1,190,007 | |
Teine Energy Ltd., Senior Notes | | | 6.875 | % | | | 9/30/22 | | | | 900,000 | | | | 868,500 | (a) |
Tesoro Logistics LP/Tesoro Logistics Finance Corp., Senior Notes | | | 5.500 | % | | | 10/15/19 | | | | 250,000 | | | | 260,000 | |
Tesoro Logistics LP/Tesoro Logistics Finance Corp., Senior Notes | | | 6.125 | % | | | 10/15/21 | | | | 100,000 | | | | 103,250 | |
Tesoro Logistics LP/Tesoro Logistics Finance Corp., Senior Notes | | | 6.375 | % | | | 5/1/24 | | | | 290,000 | | | | 298,700 | |
Whiting Petroleum Corp., Senior Notes | | | 5.750 | % | | | 3/15/21 | | | | 480,000 | | | | 406,800 | |
Whiting Petroleum Corp., Senior Notes | | | 6.250 | % | | | 4/1/23 | | | | 470,000 | | | | 387,750 | |
Williams Cos. Inc., Debentures | | | 7.500 | % | | | 1/15/31 | | | | 980,000 | | | | 962,850 | |
Williams Cos. Inc., Senior Notes | | | 3.700 | % | | | 1/15/23 | | | | 100,000 | | | | 84,250 | |
Williams Cos. Inc., Senior Notes | | | 5.750 | % | | | 6/24/44 | | | | 470,000 | | | | 383,050 | |
WPX Energy Inc., Senior Notes | | | 6.000 | % | | | 1/15/22 | | | | 350,000 | | | | 315,000 | |
WPX Energy Inc., Senior Notes | | | 8.250 | % | | | 8/1/23 | | | | 420,000 | | | | 410,550 | |
Total Oil, Gas & Consumable Fuels | | | | | | | | | | | | | | | 39,640,705 | |
Total Energy | | | | | | | | | | | | | | | 42,490,560 | |
| Financials — 10.5% | | | | | | | | | | | | | | | | |
Banks — 4.0% | | | | | | | | | | | | | | | | |
ABN AMRO Bank NV, Subordinated Notes | | | 4.750 | % | | | 7/28/25 | | | | 890,000 | | | | 916,669 | (a) |
Bank of America Corp., Junior Subordinated Notes | | | 5.200 | % | | | 6/1/23 | | | | 120,000 | | | | 112,350 | (h)(i) |
Bank of America Corp., Junior Subordinated Notes | | | 6.500 | % | | | 10/23/24 | | | | 720,000 | | | | 759,600 | (h)(i) |
Barclays Bank PLC, Subordinated Notes | | | 7.625 | % | | | 11/21/22 | | | | 760,000 | | | | 829,350 | |
Barclays PLC, Junior Subordinated Bonds | | | 8.250 | % | | | 12/15/18 | | | | 600,000 | | | | 611,269 | (h)(i) |
BNP Paribas SA, Junior Subordinated Notes | | | 7.375 | % | | | 8/19/25 | | | | 550,000 | | | | 548,625 | (a)(h)(i) |
CIT Group Inc., Senior Notes | | | 5.000 | % | | | 8/15/22 | | | | 1,410,000 | | | | 1,443,487 | |
CIT Group Inc., Senior Notes | | | 5.000 | % | | | 8/1/23 | | | | 1,380,000 | | | | 1,407,600 | |
Citigroup Inc., Junior Subordinated Bonds | | | 6.300 | % | | | 5/15/24 | | | | 500,000 | | | | 499,375 | (h)(i) |
Citigroup Inc., Junior Subordinated Bonds | | | 5.950 | % | | | 5/15/25 | | | | 760,000 | | | | 750,500 | (h)(i) |
Credit Agricole SA, Junior Subordinated Notes | | | 8.125 | % | | | 12/23/25 | | | | 700,000 | | | | 726,075 | (a)(h)(i) |
HSBC Holdings PLC, Junior Subordinated Bonds | | | 6.375 | % | | | 9/17/24 | | | | 950,000 | | | | 894,187 | (h)(i) |
HSBC Holdings PLC, Junior Subordinated Bonds | | | 6.375 | % | | | 3/30/25 | | | | 870,000 | | | | 833,025 | (h)(i) |
JPMorgan Chase & Co., Junior Subordinated Bonds | | | 5.150 | % | | | 5/1/23 | | | | 590,000 | | | | 580,413 | (h)(i) |
See Notes to Financial Statements.
| | |
| 20 | | Western Asset High Yield Fund 2016 Annual Report |
Western Asset High Yield Fund
| | | | | | | | | | | | | | | | |
| Security | | Rate | | | Maturity
Date | | | Face
Amount† | | | Value | |
Banks — continued | | | | | | | | | | | | | | | | |
M&T Bank Corp., Junior Subordinated Bonds | | | 6.875 | % | | | 6/27/16 | | | | 490,000 | | | $ | 490,613 | (i) |
Royal Bank of Scotland NV, Subordinated Bonds | | | 7.750 | % | | | 5/15/23 | | | | 450,000 | | | | 495,297 | |
Total Banks | | | | | | | | | | | | | | | 11,898,435 | |
Capital Markets — 0.3% | | | | | | | | | | | | | | | | |
Pershing Square Holdings Ltd., Senior Notes | | | 5.500 | % | | | 7/15/22 | | | | 1,000,000 | | | | 940,000 | (a) |
Consumer Finance — 1.3% | | | | | | | | | | | | | | | | |
Ally Financial Inc., Senior Notes | | | 8.000 | % | | | 11/1/31 | | | | 430,000 | | | | 505,250 | |
Navient Corp., Medium-Term Notes, Senior Notes | | | 8.000 | % | | | 3/25/20 | | | | 170,000 | | | | 174,675 | |
Navient Corp., Senior Notes | | | 5.875 | % | | | 3/25/21 | | | | 1,430,000 | | | | 1,344,200 | |
Navient Corp., Senior Notes | | | 5.875 | % | | | 10/25/24 | | | | 1,290,000 | | | | 1,102,950 | |
TMX Finance LLC/TitleMax Finance Corp., Senior Secured Notes | | | 8.500 | % | | | 9/15/18 | | | | 1,140,000 | | | | 877,800 | (a) |
Total Consumer Finance | | | | | | | | | | | | | | | 4,004,875 | |
Diversified Financial Services — 1.4% | | | | | | | | | | | | | | | | |
AerCap Ireland Capital Ltd./AerCap Global Aviation Trust, Senior Bonds | | | 4.625 | % | | | 7/1/22 | | | | 1,000,000 | | | | 1,025,000 | |
AerCap Ireland Capital Ltd./AerCap Global Aviation Trust, Senior Notes | | | 5.000 | % | | | 10/1/21 | | | | 150,000 | | | | 157,125 | |
ILFC E-Capital Trust I, Junior Subordinated Notes | | | 4.240 | % | | | 12/21/65 | | | | 1,000,000 | | | | 802,500 | (a)(h) |
International Lease Finance Corp., Senior Notes | | | 8.250 | % | | | 12/15/20 | | | | 1,780,000 | | | | 2,093,725 | |
International Lease Finance Corp., Senior Notes | | | 8.625 | % | | | 1/15/22 | | | | 60,000 | | | | 72,750 | |
Total Diversified Financial Services | | | | | | | | | | | | | | | 4,151,100 | |
Insurance — 1.1% | | | | | | | | | | | | | | | | |
CNO Financial Group Inc., Senior Notes | | | 4.500 | % | | | 5/30/20 | | | | 260,000 | | | | 268,450 | |
CNO Financial Group Inc., Senior Notes | | | 5.250 | % | | | 5/30/25 | | | | 1,170,000 | | | | 1,205,100 | |
Fidelity & Guaranty Life Holdings Inc., Senior Notes | | | 6.375 | % | | | 4/1/21 | | | | 870,000 | | | | 870,000 | (a) |
Genworth Holdings Inc., Senior Notes | | | 7.700 | % | | | 6/15/20 | | | | 680,000 | | | | 598,400 | |
Genworth Holdings Inc., Senior Notes | | | 4.900 | % | | | 8/15/23 | | | | 380,000 | | | | 278,350 | |
Total Insurance | | | | | | | | | | | | | | | 3,220,300 | |
Real Estate Investment Trusts (REITs) — 1.5% | | | | | | | | | | | | | | | | |
Communications Sales & Leasing Inc., Senior Notes | | | 8.250 | % | | | 10/15/23 | | | | 1,070,000 | | | | 1,008,475 | |
CTR Partnership LP/CareTrust Capital Corp., Senior Notes | | | 5.875 | % | | | 6/1/21 | | | | 1,130,000 | | | | 1,144,125 | |
Geo Group Inc., Senior Notes | | | 5.125 | % | | | 4/1/23 | | | | 1,010,000 | | | | 982,225 | |
Geo Group Inc., Senior Notes | | | 5.875 | % | | | 10/15/24 | | | | 20,000 | | | | 20,225 | |
Iron Mountain Inc., Senior Notes | | | 6.000 | % | | | 10/1/20 | | | | 1,020,000 | | | | 1,076,100 | (a) |
MPT Operating Partnership LP/MPT Finance Corp., Senior Notes | | | 6.375 | % | | | 3/1/24 | | | | 360,000 | | | | 385,200 | |
Total Real Estate Investment Trusts (REITs) | | | | | | | | | | | | | | | 4,616,350 | |
See Notes to Financial Statements.
| | |
| Western Asset High Yield Fund 2016 Annual Report | | 21 |
Schedule of investments (cont’d)
May 31, 2016
Western Asset High Yield Fund
| | | | | | | | | | | | | | | | |
| Security | | Rate | | | Maturity
Date | | | Face
Amount† | | | Value | |
Real Estate Management & Development — 0.4% | | | | | | | | | | | | | | | | |
Caesars Entertainment Resort Properties LLC, Secured Notes | | | 11.000 | % | | | 10/1/21 | | | | 230,000 | | | $ | 220,225 | |
Caesars Entertainment Resort Properties LLC, Senior Secured Notes | | | 8.000 | % | | | 10/1/20 | | | | 270,000 | | | | 272,025 | |
Greystar Real Estate Partners LLC, Senior Secured Notes | | | 8.250 | % | | | 12/1/22 | | | | 770,000 | | | | 800,800 | (a) |
Total Real Estate Management & Development | | | | | | | | | | | | | | | 1,293,050 | |
Thrifts & Mortgage Finance — 0.5% | | | | | | | | | | | | | | | | |
Quicken Loans Inc., Senior Notes | | | 5.750 | % | | | 5/1/25 | | | | 1,580,000 | | | | 1,497,050 | (a) |
Total Financials | | | | | | | | | | | | | | | 31,621,160 | |
| Health Care — 7.4% | | | | | | | | | | | | | | | | |
Biotechnology — 0.2% | | | | | | | | | | | | | | | | |
AMAG Pharmaceuticals Inc., Senior Notes | | | 7.875 | % | | | 9/1/23 | | | | 650,000 | | | | 572,000 | (a) |
Health Care Equipment & Supplies — 1.1% | | | | | | | | | | | | | | | | |
ConvaTec Finance International SA, Senior Notes | | | 8.250 | % | | | 1/15/19 | | | | 540,000 | | | | 538,650 | (a)(b) |
DJO Finance LLC/DJO Finance Corp., Secured Notes | | | 10.750 | % | | | 4/15/20 | | | | 490,000 | | | | 395,675 | (a) |
DJO Finco Inc./DJO Finance LLC/DJO Finance Corp., Secured Notes | | | 8.125 | % | | | 6/15/21 | | | | 1,610,000 | | | | 1,444,975 | (a) |
Greatbatch Ltd., Senior Notes | | | 9.125 | % | | | 11/1/23 | | | | 640,000 | | | | 644,800 | (a) |
Immucor Inc., Senior Notes | | | 11.125 | % | | | 8/15/19 | | | | 470,000 | | | | 427,700 | |
Total Health Care Equipment & Supplies | | | | | | | | | | | | | | | 3,451,800 | |
Health Care Providers & Services — 4.0% | | | | | | | | | | | | | | | | |
BioScrip Inc., Senior Notes | | | 8.875 | % | | | 2/15/21 | | | | 1,210,000 | | | | 1,022,450 | |
Centene Corp., Senior Notes | | | 5.625 | % | | | 2/15/21 | | | | 500,000 | | | | 520,000 | (a) |
Centene Corp., Senior Notes | | | 6.125 | % | | | 2/15/24 | | | | 240,000 | | | | 252,751 | (a) |
DaVita HealthCare Partners Inc., Senior Notes | | | 5.000 | % | | | 5/1/25 | | | | 610,000 | | | | 604,663 | |
Fresenius Medical Care U.S. Finance II Inc., Senior Notes | | | 5.875 | % | | | 1/31/22 | | | | 1,000,000 | | | | 1,100,000 | (a) |
HCA Inc., Notes | | | 7.690 | % | | | 6/15/25 | | | | 1,225,000 | | | | 1,326,062 | |
HCA Inc., Senior Bonds | | | 5.375 | % | | | 2/1/25 | | | | 270,000 | | | | 274,050 | |
HCA Inc., Senior Notes | | | 5.875 | % | | | 2/15/26 | | | | 1,380,000 | | | | 1,428,300 | |
HCA Inc., Senior Secured Notes | | | 5.250 | % | | | 4/15/25 | | | | 530,000 | | | | 545,900 | |
HCA Inc., Senior Secured Notes | | | 5.250 | % | | | 6/15/26 | | | | 450,000 | | | | 462,375 | |
IASIS Healthcare LLC/IASIS Capital Corp., Senior Notes | | | 8.375 | % | | | 5/15/19 | | | | 1,000,000 | | | | 960,000 | |
MPH Acquisition Holdings LLC, Senior Notes | | | 7.125 | % | | | 6/1/24 | | | | 1,110,000 | | | | 1,140,525 | (a) |
Tenet Healthcare Corp., Senior Notes | | | 8.125 | % | | | 4/1/22 | | | | 410,000 | | | | 412,563 | |
Tenet Healthcare Corp., Senior Notes | | | 6.750 | % | | | 6/15/23 | | | | 1,000,000 | | | | 940,000 | |
Universal Hospital Services Inc., Secured Notes | | | 7.625 | % | | | 8/15/20 | | | | 1,270,000 | | | | 1,185,862 | |
Total Health Care Providers & Services | | | | | | | | | | | | | | | 12,175,501 | |
Pharmaceuticals — 2.1% | | | | | | | | | | | | | | | | |
DPx Holdings BV, Senior Notes | | | 7.500 | % | | | 2/1/22 | | | | 1,370,000 | | | | 1,404,250 | (a) |
See Notes to Financial Statements.
| | |
| 22 | | Western Asset High Yield Fund 2016 Annual Report |
Western Asset High Yield Fund
| | | | | | | | | | | | | | | | |
| Security | | Rate | | | Maturity
Date | | | Face
Amount† | | | Value | |
Pharmaceuticals — continued | | | | | | | | | | | | | | | | |
JLL/Delta Dutch Pledgeco BV, Senior Notes | | | 8.750 | % | | | 5/1/20 | | | | 140,000 | | | $ | 139,650 | (a)(b) |
Mallinckrodt International Finance SA, Senior Notes | | | 3.500 | % | | | 4/15/18 | | | | 330,000 | | | | 320,925 | |
Mallinckrodt International Finance SA, Senior Notes | | | 5.750 | % | | | 8/1/22 | | | | 370,000 | | | | 349,650 | (a) |
Mallinckrodt International Finance SA, Senior Notes | | | 5.625 | % | | | 10/15/23 | | | | 310,000 | | | | 291,400 | (a) |
Valeant Pharmaceuticals International Inc., Senior Notes | | | 7.000 | % | | | 10/1/20 | | | | 690,000 | | | | 622,725 | (a) |
Valeant Pharmaceuticals International Inc., Senior Notes | | | 6.375 | % | | | 10/15/20 | | | | 90,000 | | | | 80,100 | (a) |
Valeant Pharmaceuticals International Inc., Senior Notes | | | 7.500 | % | | | 7/15/21 | | | | 350,000 | | | | 316,750 | (a) |
Valeant Pharmaceuticals International Inc., Senior Notes | | | 5.500 | % | | | 3/1/23 | | | | 2,280,000 | | | | 1,892,400 | (a) |
Valeant Pharmaceuticals International Inc., Senior Notes | | | 5.875 | % | | | 5/15/23 | | | | 460,000 | | | | 387,550 | (a) |
Valeant Pharmaceuticals International Inc., Senior Notes | | | 6.125 | % | | | 4/15/25 | | | | 440,000 | | | | 367,950 | (a) |
Total Pharmaceuticals | | | | | | | | | | | | | | | 6,173,350 | |
Total Health Care | | | | | | | | | | | | | | | 22,372,651 | |
| Industrials — 10.1% | | | | | | | | | | | | | | | | |
Aerospace & Defense — 0.8% | | | | | | | | | | | | | | | | |
CBC Ammo LLC/CBC FinCo Inc., Senior Notes | | | 7.250 | % | | | 11/15/21 | | | | 1,820,000 | | | | 1,537,900 | (a) |
LMI Aerospace Inc., Secured Notes | | | 7.375 | % | | | 7/15/19 | | | | 830,000 | | | | 846,600 | |
Total Aerospace & Defense | | | | | | | | | | | | | | | 2,384,500 | |
Air Freight & Logistics — 0.3% | | | | | | | | | | | | | | | | |
XPO Logistics Inc., Senior Notes | | | 6.500 | % | | | 6/15/22 | | | | 940,000 | | | | 902,400 | (a) |
Airlines — 1.5% | | | | | | | | | | | | | | | | |
American Airlines, Pass-Through Trust, Secured Bonds | | | 5.625 | % | | | 1/15/21 | | | | 282,508 | | | | 290,277 | (a) |
American Airlines, Pass-Through Trust, Senior Secured Bonds | | | 5.600 | % | | | 7/15/20 | | | | 693,024 | | | | 712,082 | (a) |
Continental Airlines Inc., Pass-Through Certificates, Secured Bonds | | | 8.388 | % | | | 11/1/20 | | | | 10,181 | | | | 10,289 | |
Continental Airlines Inc., Pass-Through Certificates, Secured Notes | | | 9.250 | % | | | 5/10/17 | | | | 248,741 | | | | 262,173 | |
Delta Air Lines Inc., Pass-Through Trust, Secured Notes | | | 6.875 | % | | | 5/7/19 | | | | 246,383 | | | | 266,094 | (a) |
United Airlines Inc., Pass-Through Certificates, Secured Bonds | | | 5.375 | % | | | 8/15/21 | | | | 259,065 | | | | 269,505 | |
United Airlines Inc., Pass-Through Certificates, Secured Notes | | | 4.750 | % | | | 4/11/22 | | | | 997,070 | | | | 1,005,794 | |
US Airways, Pass-Through Trust, Secured Bonds | | | 6.750 | % | | | 6/3/21 | | | | 1,535,875 | | | | 1,631,867 | |
Total Airlines | | | | | | | | | | | | | | | 4,448,081 | |
Building Products — 0.8% | | | | | | | | | | | | | | | | |
Ashton Woods USA LLC/Ashton Woods Finance Co., Senior Notes | | | 6.875 | % | | | 2/15/21 | | | | 1,220,000 | | | | 1,076,650 | (a) |
Standard Industries Inc., Senior Notes | | | 5.125 | % | | | 2/15/21 | | | | 290,000 | | | | 300,875 | (a) |
Standard Industries Inc., Senior Notes | | | 5.500 | % | | | 2/15/23 | | | | 520,000 | | | | 535,600 | (a) |
USG Corp., Senior Notes | | | 5.500 | % | | | 3/1/25 | | | | 380,000 | | | | 403,750 | (a) |
Total Building Products | | | | | | | | | | | | | | | 2,316,875 | |
See Notes to Financial Statements.
| | |
| Western Asset High Yield Fund 2016 Annual Report | | 23 |
Schedule of investments (cont’d)
May 31, 2016
Western Asset High Yield Fund
| | | | | | | | | | | | | | | | |
| Security | | Rate | | | Maturity
Date | | | Face
Amount† | | | Value | |
Commercial Services & Supplies — 2.3% | | | | | | | | | | | | | | | | |
GFL Environmental Inc., Senior Notes | | | 9.875 | % | | | 2/1/21 | | | | 1,110,000 | | | $ | 1,184,925 | (a) |
Monitronics International Inc., Senior Notes | | | 9.125 | % | | | 4/1/20 | | | | 1,060,000 | | | | 869,200 | |
Taylor Morrison Communities Inc./Monarch Communities Inc., Senior Notes | | | 5.250 | % | | | 4/15/21 | | | | 870,000 | | | | 872,175 | (a) |
Taylor Morrison Communities Inc./Monarch Communities Inc., Senior Notes | | | 5.875 | % | | | 4/15/23 | | | | 340,000 | | | | 342,550 | (a) |
United Rentals North America Inc., Senior Notes | | | 5.750 | % | | | 11/15/24 | | | | 1,640,000 | | | | 1,644,100 | |
United Rentals North America Inc., Senior Notes | | | 5.500 | % | | | 7/15/25 | | | | 830,000 | | | | 814,437 | |
West Corp., Senior Notes | | | 5.375 | % | | | 7/15/22 | | | | 1,570,000 | | | | 1,420,850 | (a) |
Total Commercial Services & Supplies | | | | | | | | | | | | | | | 7,148,237 | |
Construction & Engineering — 1.0% | | | | | | | | | | | | | | | | |
Ausdrill Finance Pty Ltd., Senior Notes | | | 6.875 | % | | | 11/1/19 | | | | 1,010,000 | | | | 886,275 | (a) |
Michael Baker Holdings LLC/Michael Baker Finance Corp., Senior Notes | | | 8.875 | % | | | 4/15/19 | | | | 1,547,641 | | | | 1,265,197 | (a)(b) |
Michael Baker International LLC/CDL Acquisition Co. Inc., Senior Secured Notes | | | 8.250 | % | | | 10/15/18 | | | | 330,000 | | | | 328,350 | (a) |
Modular Space Corp., Secured Notes | | | 10.250 | % | | | 1/31/19 | | | | 1,240,000 | | | | 629,300 | (a) |
Total Construction & Engineering | | | | | | | | | | | | | | | 3,109,122 | |
Electrical Equipment — 0.2% | | | | | | | | | | | | | | | | |
NES Rentals Holdings Inc., Senior Secured Notes | | | 7.875 | % | | | 5/1/18 | | | | 600,000 | | | | 582,000 | (a) |
Machinery — 1.0% | | | | | | | | | | | | | | | | |
CTP Transportation Products LLC/CTP Finance Inc., Senior Secured Notes | | | 8.250 | % | | | 12/15/19 | | | | 680,000 | | | | 656,200 | (a) |
DH Services Luxembourg Sarl, Senior Notes | | | 7.750 | % | | | 12/15/20 | | | | 1,495,000 | | | | 1,472,575 | (a) |
Global Brass and Copper Inc., Senior Secured Notes | | | 9.500 | % | | | 6/1/19 | | | | 710,000 | | | | 741,950 | |
SPL Logistics Escrow LLC/SPL Logistics Finance Corp., Senior Secured Notes | | | 8.875 | % | | | 8/1/20 | | | | 120,000 | | | | 93,900 | (a) |
Total Machinery | | | | | | | | | | | | | | | 2,964,625 | |
Marine — 0.4% | | | | | | | | | | | | | | | | |
Navios Maritime Acquisition Corp./Navios Acquisition Finance U.S. Inc., Senior Secured Notes | | | 8.125 | % | | | 11/15/21 | | | | 1,250,000 | | | | 1,022,750 | (a) |
Ultrapetrol Bahamas Ltd., Senior Secured Notes | | | 8.875 | % | | | 6/15/21 | | | | 1,140,000 | | | | 205,200 | *(c)(f) |
Total Marine | | | | | | | | | | | | | | | 1,227,950 | |
Road & Rail — 0.7% | | | | | | | | | | | | | | | | |
Flexi-Van Leasing Inc., Senior Notes | | | 7.875 | % | | | 8/15/18 | | | | 1,010,000 | | | | 989,800 | (a) |
Florida East Coast Holdings Corp., Senior Secured Notes | | | 6.750 | % | | | 5/1/19 | | | | 560,000 | | | | 557,200 | (a) |
Jack Cooper Holdings Corp., Senior Secured Notes | | | 10.250 | % | | | 6/1/20 | | | | 790,000 | | | | 521,400 | (a) |
Total Road & Rail | | | | | | | | | | | | | | | 2,068,400 | |
See Notes to Financial Statements.
| | |
| 24 | | Western Asset High Yield Fund 2016 Annual Report |
Western Asset High Yield Fund
| | | | | | | | | | | | | | | | |
| Security | | Rate | | | Maturity
Date | | | Face
Amount† | | | Value | |
Trading Companies & Distributors — 0.8% | | | | | | | | | | | | | | | | |
Ashtead Capital Inc., Secured Notes | | | 5.625 | % | | | 10/1/24 | | | | 440,000 | | | $ | 444,400 | (a) |
H&E Equipment Services Inc., Senior Notes | | | 7.000 | % | | | 9/1/22 | | | | 1,480,000 | | | | 1,524,400 | |
HD Supply Inc., Senior Notes | | | 5.750 | % | | | 4/15/24 | | | | 450,000 | | | | 468,000 | (a) |
Total Trading Companies & Distributors | | | | | | | | | | | | | | | 2,436,800 | |
Transportation — 0.3% | | | | | | | | | | | | | | | | |
Hapag-Lloyd AG, Senior Notes | | | 9.750 | % | | | 10/15/17 | | | | 445,000 | | | | 451,675 | (a) |
Neovia Logistics Intermediate Holdings LLC/Logistics Intermediate Finance Corp., Senior Notes | | | 10.000 | % | | | 2/15/18 | | | | 1,020,000 | | | | 510,000 | (a)(b) |
Total Transportation | | | | | | | | | | | | | | | 961,675 | |
Total Industrials | | | | | | | | | | | | | | | 30,550,665 | |
| Information Technology — 1.5% | | | | | | | | | | | | | | | | |
Electronic Equipment, Instruments & Components — 0.2% | | | | | | | | | | | | | | | | |
Interface Security Systems Holdings Inc./Interface Security Systems LLC, Senior Secured Notes | | | 9.250 | % | | | 1/15/18 | | | | 740,000 | | | | 723,350 | |
Internet Software & Services — 0.4% | | | | | | | | | | | | | | | | |
Ancestry.com Inc., Senior Notes | | | 11.000 | % | | | 12/15/20 | | | | 790,000 | | | | 853,200 | |
Match Group Inc., Senior Notes | | | 6.375 | % | | | 6/1/24 | | | | 410,000 | | | | 418,200 | (a) |
Total Internet Software & Services | | | | | | | | | | | | | | | 1,271,400 | |
IT Services — 0.6% | | | | | | | | | | | | | | | | |
Compiler Finance Subordinated Inc., Senior Notes | | | 7.000 | % | | | 5/1/21 | | | | 630,000 | | | | 289,800 | (a)(c) |
First Data Corp., Senior Notes | | | 7.000 | % | | | 12/1/23 | | | | 740,000 | | | | 750,175 | (a) |
First Data Corp., Senior Secured Notes | | | 5.000 | % | | | 1/15/24 | | | | 870,000 | | | | 869,452 | (a) |
Total IT Services | | | | | | | | | | | | | | | 1,909,427 | |
Semiconductors & Semiconductor Equipment — 0.2% | | | | | | | | | | | | | | | | |
Micron Technology Inc., Senior Notes | | | 5.500 | % | | | 2/1/25 | | | | 640,000 | | | | 536,000 | |
Technology Hardware, Storage & Peripherals — 0.1% | | | | | | | | | | | | | | | | |
Western Digital Corp., Senior Notes | | | 10.500 | % | | | 4/1/24 | | | | 120,000 | | | | 124,200 | (a) |
Total Information Technology | | | | | | | | | | | | | | | 4,564,377 | |
| Materials — 6.9% | | | | | | | | | | | | | | | | |
Chemicals — 0.5% | | | | | | | | | | | | | | | | |
Eco Services Operations LLC/Eco Finance Corp., Senior Notes | | | 8.500 | % | | | 11/1/22 | | | | 650,000 | | | | 637,000 | (a) |
HIG BBC Intermediate Holdings LLC/HIG BBC Holdings Corp., Senior Notes | | | 10.500 | % | | | 9/15/18 | | | | 736,687 | | | | 552,515 | (a)(b) |
PQ Corp., Senior Secured Notes | | | 6.750 | % | | | 11/15/22 | | | | 290,000 | | | | 302,325 | (a) |
Total Chemicals | | | | | | | | | | | | | | | 1,491,840 | |
Construction Materials — 1.1% | | | | | | | | | | | | | | | | |
American Builders & Contractors Supply Co. Inc., Senior Notes | | | 5.625 | % | | | 4/15/21 | | | | 850,000 | | | | 881,875 | (a) |
See Notes to Financial Statements.
| | |
| Western Asset High Yield Fund 2016 Annual Report | | 25 |
Schedule of investments (cont’d)
May 31, 2016
Western Asset High Yield Fund
| | | | | | | | | | | | | | | | |
| Security | | Rate | | | Maturity
Date | | | Face
Amount† | | | Value | |
Construction Materials — continued | | | | | | | | | | | | | | | | |
American Builders & Contractors Supply Co. Inc., Senior Notes | | | 5.750 | % | | | 12/15/23 | | | | 740,000 | | | $ | 769,600 | (a) |
Hardwoods Acquisition Inc., Senior Secured Notes | | | 7.500 | % | | | 8/1/21 | | | | 1,200,000 | | | | 882,000 | (a) |
NWH Escrow Corp., Senior Secured Notes | | | 7.500 | % | | | 8/1/21 | | | | 230,000 | | | | 164,450 | (a) |
U.S. Concrete Inc., Senior Notes | | | 6.375 | % | | | 6/1/24 | | | | 440,000 | | | | 440,000 | (a) |
Total Construction Materials | | | | | | | | | | | | | | | 3,137,925 | |
Containers & Packaging — 2.1% | | | | | | | | | | | | | | | | |
Ardagh Packaging Finance PLC, Senior Notes | | | 9.125 | % | | | 10/15/20 | | | | 630,000 | | | | 660,240 | (a) |
Ardagh Packaging Finance PLC/Ardagh MP Holdings USA Inc., Senior Notes | | | 6.750 | % | | | 1/31/21 | | | | 400,000 | | | | 403,000 | (a) |
Ardagh Packaging Finance PLC/Ardagh MP Holdings USA Inc., Senior Notes | | | 7.250 | % | | | 5/15/24 | | | | 1,120,000 | | | | 1,142,400 | (a) |
Ardagh Packaging Finance PLC/Ardagh MP Holdings USA Inc., Senior Secured Notes | | | 4.625 | % | | | 5/15/23 | | | | 1,290,000 | | | | 1,283,550 | (a) |
BWAY Holding Co., Senior Notes | | | 9.125 | % | | | 8/15/21 | | | | 690,000 | | | | 664,125 | (a) |
Coveris Holdings SA, Senior Notes | | | 7.875 | % | | | 11/1/19 | | | | 430,000 | | | | 421,400 | (a) |
Pactiv LLC, Senior Bonds | | | 8.375 | % | | | 4/15/27 | | | | 1,525,000 | | | | 1,555,500 | |
Reynolds Group Issuer Inc./Reynolds Group Issuer LLC/Reynolds Group Issuer (Luxembourg) SA, Senior Secured Notes | | | 5.750 | % | | | 10/15/20 | | | | 290,000 | | | | 299,062 | |
Total Containers & Packaging | | | | | | | | | | | | | | | 6,429,277 | |
Metals & Mining — 3.2% | | | | | | | | | | | | | | | | |
Alcoa Inc., Senior Notes | | | 5.125 | % | | | 10/1/24 | | | | 600,000 | | | | 578,814 | |
Anglo American Capital PLC, Senior Notes | | | 3.625 | % | | | 5/14/20 | | | | 470,000 | | | | 445,325 | (a) |
Anglo American Capital PLC, Senior Notes | | | 4.125 | % | | | 4/15/21 | | | | 410,000 | | | | 371,050 | (a) |
Anglo American Capital PLC, Senior Notes | | | 4.125 | % | | | 9/27/22 | | | | 210,000 | | | | 190,575 | (a) |
Anglo American Capital PLC, Senior Notes | | | 4.875 | % | | | 5/14/25 | | | | 560,000 | | | | 509,600 | (a) |
ArcelorMittal SA, Senior Bonds | | | 6.125 | % | | | 6/1/25 | | | | 730,000 | | | | 711,750 | |
ArcelorMittal SA, Senior Notes | | | 6.500 | % | | | 3/1/21 | | | | 400,000 | | | | 414,000 | |
Barminco Finance Pty Ltd., Senior Notes | | | 9.000 | % | | | 6/1/18 | | | | 970,000 | | | | 759,025 | (a)(c) |
BHP Billiton Finance USA Ltd., Subordinated Notes | | | 6.750 | % | | | 10/19/75 | | | | 460,000 | | | | 476,560 | (a)(h) |
Coeur Mining Inc., Senior Notes | | | 7.875 | % | | | 2/1/21 | | | | 640,000 | | | | 590,547 | |
FMG Resources (August 2006) Pty Ltd., Senior Secured Notes | | | 9.750 | % | | | 3/1/22 | | | | 710,000 | | | | 756,150 | (a) |
Freeport-McMoRan Inc., Senior Notes | | | 3.100 | % | | | 3/15/20 | | | | 570,000 | | | | 519,769 | |
Freeport-McMoRan Inc., Senior Notes | | | 3.550 | % | | | 3/1/22 | | | | 440,000 | | | | 368,500 | |
Freeport-McMoRan Inc., Senior Notes | | | 3.875 | % | | | 3/15/23 | | | | 370,000 | | | | 304,325 | |
Freeport-McMoRan Inc., Senior Notes | | | 5.450 | % | | | 3/15/43 | | | | 530,000 | | | | 399,986 | |
Midwest Vanadium Pty Ltd., Senior Secured Notes | | | 11.500 | % | | | 2/15/18 | | | | 1,215,000 | | | | 85,050 | *(a)(c)(f) |
Mirabela Nickel Ltd., Subordinated Notes | | | 1.000 | % | | | 9/10/44 | | | | 15,162 | | | | 0 | (a)(b)(c)(d)(g) |
See Notes to Financial Statements.
| | |
| 26 | | Western Asset High Yield Fund 2016 Annual Report |
Western Asset High Yield Fund
| | | | | | | | | | | | | | | | |
| Security | | Rate | | | Maturity
Date | | | Face
Amount† | | | Value | |
Metals & Mining — continued | | | | | | | | | | | | | | | | |
Teck Resources Ltd., Senior Notes | | | 3.000 | % | | | 3/1/19 | | | | 690,000 | | | $ | 660,675 | |
Teck Resources Ltd., Senior Notes | | | 8.000 | % | | | 6/1/21 | | | | 540,000 | | | | 550,800 | (a) |
Teck Resources Ltd., Senior Notes | | | 8.500 | % | | | 6/1/24 | | | | 640,000 | | | | 656,000 | (a) |
United States Steel Corp., Senior Secured Notes | | | 8.375 | % | | | 7/1/21 | | | | 390,000 | | | | 402,675 | (a) |
Total Metals & Mining | | | | | | | | | | | | | | | 9,751,176 | |
Paper & Forest Products — 0.0% | | | | | | | | | | | | | | | | |
Resolute Forest Products Inc., Senior Notes | | | 5.875 | % | | | 5/15/23 | | | | 120,000 | | | | 88,950 | |
Total Materials | | | | | | | | | | | | | | | 20,899,168 | |
| Telecommunication Services — 7.7% | | | | | | | | | | | | | | | | |
Diversified Telecommunication Services — 3.6% | | | | | | | | | | | | | | | | |
CenturyLink Inc., Senior Notes | | | 6.450 | % | | | 6/15/21 | | | | 330,000 | | | | 334,950 | |
CenturyLink Inc., Senior Notes | | | 5.625 | % | | | 4/1/25 | | | | 430,000 | | | | 380,550 | |
Cogent Communications Group Inc., Senior Secured Notes | | | 5.375 | % | | | 3/1/22 | | | | 1,860,000 | | | | 1,869,300 | (a) |
Frontier Communications Corp., Senior Notes | | | 10.500 | % | | | 9/15/22 | | | | 750,000 | | | | 780,938 | (a) |
Frontier Communications Corp., Senior Notes | | | 11.000 | % | | | 9/15/25 | | | | 1,040,000 | | | | 1,058,200 | (a) |
Intelsat Jackson Holdings SA, Senior Bonds | | | 5.500 | % | | | 8/1/23 | | | | 1,580,000 | | | | 1,015,150 | |
Intelsat Jackson Holdings SA, Senior Notes | | | 7.500 | % | | | 4/1/21 | | | | 10,000 | | | | 6,800 | |
Intelsat Jackson Holdings SA, Senior Secured Notes | | | 8.000 | % | | | 2/15/24 | | | | 1,330,000 | | | | 1,354,937 | (a) |
Level 3 Financing Inc., Senior Notes | | | 5.250 | % | | | 3/15/26 | | | | 1,090,000 | | | | 1,087,275 | (a) |
Oi Brasil Holdings Cooperatief U.A., Senior Notes | | | 5.750 | % | | | 2/10/22 | | | | 1,470,000 | | | | 289,590 | (a)(c) |
Telecom Italia SpA, Senior Notes | | | 5.303 | % | | | 5/30/24 | | | | 1,440,000 | | | | 1,449,907 | (a) |
Windstream Services LLC, Senior Notes | | | 7.750 | % | | | 10/15/20 | | | | 550,000 | | | | 514,250 | |
Windstream Services LLC, Senior Notes | | | 7.500 | % | | | 4/1/23 | | | | 628,000 | | | | 510,250 | |
Total Diversified Telecommunication Services | | | | | | | | | | | | | | | 10,652,097 | |
Wireless Telecommunication Services — 4.1% | | | | | | | | | | | | | | | | |
Altice Financing SA, Senior Secured Bonds | | | 7.500 | % | | | 5/15/26 | | | | 560,000 | | | | 558,600 | (a) |
Altice Financing SA, Senior Secured Notes | | | 6.625 | % | | | 2/15/23 | | | | 1,040,000 | | | | 1,040,000 | (a) |
Neptune Finco Corp., Senior Notes | | | 6.625 | % | | | 10/15/25 | | | | 970,000 | | | | 1,035,970 | (a) |
Neptune Finco Corp., Senior Notes | | | 10.875 | % | | | 10/15/25 | | | | 400,000 | | | | 455,000 | (a) |
Sprint Capital Corp., Senior Notes | | | 8.750 | % | | | 3/15/32 | | | | 2,230,000 | | | | 1,806,300 | |
Sprint Communications Inc., Senior Notes | | | 9.000 | % | | | 11/15/18 | | | | 460,000 | | | | 489,325 | (a) |
Sprint Communications Inc., Senior Notes | | | 7.000 | % | | | 8/15/20 | | | | 2,510,000 | | | | 2,147,355 | |
Sprint Communications Inc., Senior Notes | | | 11.500 | % | | | 11/15/21 | | | | 2,360,000 | | | | 2,171,200 | |
Sprint Corp., Senior Notes | | | 7.250 | % | | | 9/15/21 | | | | 950,000 | | | | 769,500 | |
T-Mobile USA Inc., Senior Notes | | | 6.500 | % | | | 1/15/26 | | | | 1,870,000 | | | | 1,977,525 | |
Total Wireless Telecommunication Services | | | | | | | | | | | | | | | 12,450,775 | |
Total Telecommunication Services | | | | | | | | | | | | | | | 23,102,872 | |
See Notes to Financial Statements.
| | |
| Western Asset High Yield Fund 2016 Annual Report | | 27 |
Schedule of investments (cont’d)
May 31, 2016
Western Asset High Yield Fund
| | | | | | | | | | | | | | | | |
| Security | | Rate | | | Maturity
Date | | | Face
Amount† | | | Value | |
| Utilities — 2.0% | | | | | | | | | | | | | | | | |
Electric Utilities — 1.3% | | | | | | | | | | | | | | | | |
NRG REMA LLC, Pass-Through Certificates, Senior Secured Bonds | | | 9.681 | % | | | 7/2/26 | | | | 2,745,000 | | | $ | 2,635,200 | (a) |
Red Oak Power LLC, Secured Notes | | | 9.200 | % | | | 11/30/29 | | | | 1,250,000 | | | | 1,293,750 | |
Total Electric Utilities | | | | | | | | | | | | | | | 3,928,950 | |
Independent Power and Renewable Electricity Producers — 0.7% | | | | | | | | | | | | | |
Mirant Mid Atlantic LLC, Pass-Through Certificates, Secured Bonds | | | 10.060 | % | | | 12/30/28 | | | | 1,666,043 | | | | 1,566,081 | |
NRG Energy Inc., Senior Notes | | | 7.250 | % | | | 5/15/26 | | | | 610,000 | | | | 608,475 | |
Total Independent Power and Renewable Electricity Producers | | | | | | | | | | | | 2,174,556 | |
Total Utilities | | | | | | | | | | | | | | | 6,103,506 | |
Total Corporate Bonds & Notes (Cost — $267,461,069) | | | | | | | | | | | | | | | 251,381,379 | |
| Asset-Backed Securities — 2.2% | | | | | | | | | | | | | | | | |
American Money Management Corp., 2015-16A E | | | 6.230 | % | | | 4/14/27 | | | | 650,000 | | | | 499,698 | (a)(h) |
Avery Point CLO Ltd., 2015-6A E1 | | | 6.133 | % | | | 8/5/27 | | | | 750,000 | | | | 589,079 | (a)(h) |
Babson CLO Ltd., 2015-2A E | | | 6.184 | % | | | 7/20/27 | | | | 500,000 | | | | 412,353 | (a)(h) |
Carlyle Global Market Strategies, 2015-2A D | | | 5.934 | % | | | 4/27/27 | | | | 500,000 | | | | 405,794 | (a)(h) |
Cent CLO LP, 2015-23A D | | | 6.033 | % | | | 4/17/26 | | | | 500,000 | | | | 419,828 | (a)(h) |
Cumberland Park CLO Ltd., 2015-2A E | | | 5.634 | % | | | 7/20/26 | | | | 500,000 | | | | 404,577 | (a)(h) |
Dryden Senior Loan Fund, 2015-40A E | | | 6.576 | % | | | 8/15/28 | | | | 1,030,000 | | | | 886,536 | (a)(h) |
Galaxy CLO Ltd., 2015-20A E | | | 6.134 | % | | | 7/20/27 | | | | 250,000 | | | | 205,921 | (a)(h) |
GoldenTree Loan Opportunities Ltd., 2015-10A E2 | | | 5.834 | % | | | 7/20/27 | | | | 750,000 | | | | 614,094 | (a)(h) |
Jamestown CLO Ltd., 2015-8A D2 | | | 7.114 | % | | | 1/15/28 | | | | 750,000 | | | | 644,906 | (a)(h) |
Neuberger Berman CLO Ltd., 2015-19A D | | | 5.878 | % | | | 7/15/27 | | | | 750,000 | | | | 597,548 | (a)(h) |
Oaktree CLO Ltd., 2015-1A D | | | 6.234 | % | | | 10/20/27 | | | | 500,000 | | | | 390,883 | (a)(h) |
Treman Park CLO Ltd, 2015-1A E | | | 6.834 | % | | | 4/20/27 | | | | 750,000 | | | | 641,245 | (a)(h) |
Total Asset-Backed Securities (Cost — $7,696,883) | | | | | | | | | | | | | | | 6,712,462 | |
| Collateralized Mortgage Obligations — 0.4% | | | | | | | | | | | | | | | | |
Commercial Mortgage Trust, 2015-LC21 E | | | 3.250 | % | | | 7/10/48 | | | | 900,000 | | | | 468,226 | (a) |
JPMBB Commercial Mortgage Securities Trust, 2015-C31 E | | | 4.618 | % | | | 8/15/48 | | | | 700,000 | | | | 450,844 | (a)(h) |
Wells Fargo Commercial Mortgage Trust, 2015-C28 E | | | 3.000 | % | | | 5/15/48 | | | | 800,000 | | | | 390,369 | (a) |
Total Collateralized Mortgage Obligations (Cost — $1,576,595) | | | | | | | | | | | | 1,309,439 | |
| Convertible Bonds & Notes — 0.2% | | | | | | | | | | | | | | | | |
| Materials — 0.2% | | | | | | | | | | | | | | | | |
Chemicals — 0.1% | | | | | | | | | | | | | | | | |
Hercules Inc., Junior Subordinated Bonds | | | 6.500 | % | | | 6/30/29 | | | | 440,000 | | | | 365,922 | |
See Notes to Financial Statements.
| | |
| 28 | | Western Asset High Yield Fund 2016 Annual Report |
Western Asset High Yield Fund
| | | | | | | | | | | | | | | | |
| Security | | Rate | | | Maturity
Date | | | Face
Amount† | | | Value | |
Metals & Mining — 0.1% | | | | | | | | | | | | | | | | |
Mirabela Nickel Ltd., Senior Secured Bonds | | | 9.500 | % | | | 6/24/19 | | | | 1,164,317 | | | $ | 349,295 | (a)(b)(c) |
Total Convertible Bonds & Notes (Cost — $1,570,685) | | | | | | | | | | | | | | | 715,217 | |
| Senior Loans — 3.6% | | | | | | | | | | | | | | | | |
| Consumer Discretionary — 1.2% | | | | | | | | | | | | | | | | |
Hotels, Restaurants & Leisure — 0.3% | | | | | | | | | | | | | | | | |
Equinox Holdings Inc., Second Lien Term Loan | | | 9.750 | % | | | 7/31/20 | | | | 910,000 | | | | 906,588 | (j)(k) |
Specialty Retail — 0.8% | | | | | | | | | | | | | | | | |
CWGS Group LLC, Term Loan | | | 5.750 | % | | | 2/20/20 | | | | 1,642,085 | | | | 1,641,059 | (j)(k) |
Spencer Gifts LLC, Second Lien Term Loan | | | 9.250 | % | | | 6/29/22 | | | | 830,000 | | | | 680,600 | (j)(k) |
Total Specialty Retail | | | | | | | | | | | | | | | 2,321,659 | |
Textiles, Apparel & Luxury Goods — 0.1% | | | | | | | | | | | | | | | | |
TOMS Shoes LLC, Term Loan B | | | 6.500 | % | | | 10/28/20 | | | | 633,600 | | | | 367,488 | (j)(k) |
Total Consumer Discretionary | | | | | | | | | | | | | | | 3,595,735 | |
| Consumer Staples — 0.2% | | | | | | | | | | | | | | | | |
Food Products — 0.2% | | | | | | | | | | | | | | | | |
AdvancePierre Foods Inc., Second Lien Term Loan | | | 9.500 | % | | | 10/10/17 | | | | 514,074 | | | | 514,717 | (j)(k) |
| Energy — 0.6% | | | | | | | | | | | | | | | | |
Energy Equipment & Services — 0.3% | | | | | | | | | | | | | | | | |
Hercules Offshore LLC, Exit Term Loan | | | 10.500 | % | | | 5/6/20 | | | | 850,000 | | | | 714,000 | (j)(k) |
Pacific Drilling SA, Term Loan B | | | 4.500 | % | | | 6/3/18 | | | | 149,233 | | | | 49,123 | (j)(k) |
Total Energy Equipment & Services | | | | | | | | | | | | | | | 763,123 | |
Oil, Gas & Consumable Fuels — 0.3% | | | | | | | | | | | | | | | | |
Magnum Hunter Resources Inc., Exit Term Loan | | | 8.000 | % | | | 5/6/19 | | | | 220,000 | | | | 217,800 | (c)(j)(k) |
Murray Energy Corp., Term Loan B2 | | | 7.500 | % | | | 4/16/20 | | | | 466,344 | | | | 318,863 | (j)(k) |
Westmoreland Coal Co., Term Loan B | | | 7.500 | % | | | 12/16/20 | | | | 675,735 | | | | 469,636 | (j)(k) |
Total Oil, Gas & Consumable Fuels | | | | | | | | | | | | | | | 1,006,299 | |
Total Energy | | | | | | | | | | | | | | | 1,769,422 | |
| Health Care — 0.8% | | | | | | | | | | | | | | | | |
Health Care Equipment & Supplies — 0.3% | | | | | | | | | | | | | | | | |
Immucor Inc., REFI Term Loan B2 | | | 5.000 | % | | | 8/17/18 | | | | 387,790 | | | | 366,138 | (j)(k) |
Lantheus Medical Imaging Inc., Term Loan | | | 7.000 | % | | | 6/30/22 | | | | 724,525 | | | | 637,582 | (j)(k) |
Total Health Care Equipment & Supplies | | | | | | | | | | | | | | | 1,003,720 | |
Health Care Providers & Services — 0.5% | | | | | | | | | | | | | | | | |
Radnet Management Inc., Second Lien Term Loan | | | 8.000 | % | | | 3/25/21 | | | | 1,480,000 | | | | 1,409,700 | (j)(k) |
Total Health Care | | | | | | | | | | | | | | | 2,413,420 | |
See Notes to Financial Statements.
| | |
| Western Asset High Yield Fund 2016 Annual Report | | 29 |
Schedule of investments (cont’d)
May 31, 2016
Western Asset High Yield Fund
| | | | | | | | | | | | | | | | |
| Security | | Rate | | | Maturity
Date | | | Face
Amount† | | | Value | |
| Industrials — 0.4% | | | | | | | | | | | | | | | | |
Commercial Services & Supplies — 0.3% | | | | | | | | | | | | | | | | |
Kronos Inc., Second Lien Term Loan | | | 9.750 | % | | | 4/30/20 | | | | 958,974 | | | $ | 974,157 | (j)(k) |
Machinery — 0.1% | | | | | | | | | | | | | | | | |
Intelligrated Inc., First Lien Term Loan | | | 4.500-6.000 | % | | | 7/30/18 | | | | 119,411 | | | | 118,888 | (j)(k) |
Total Industrials | | | | | | | | | | | | | | | 1,093,045 | |
| Materials — 0.0% | | | | | | | | | | | | | | | | |
Metals & Mining — 0.0% | | | | | | | | | | | | | | | | |
Essar Steel Algoma Inc., Term Loan | | | 7.500 | % | | | 8/9/19 | | | | 445,500 | | | | 104,692 | *(f)(j)(k) |
| Utilities — 0.4% | | | | | | | | | | | | | | | | |
Electric Utilities — 0.4% | | | | | | | | | | | | | | | | |
Panda Temple II Power LLC, New Term Loan B | | | 7.250 | % | | | 4/3/19 | | | | 380,000 | | | | 345,800 | (j)(k) |
Panda Temple Power LLC, 2015 Term Loan B | | | 7.250 | % | | | 3/4/22 | | | | 980,100 | | | | 852,687 | (j)(k) |
Total Utilities | | | | | | | | | | | | | | | 1,198,487 | |
Total Senior Loans (Cost — $12,121,660) | | | | | | | | | | | | | | | 10,689,518 | |
| Sovereign Bonds — 0.8% | | | | | | | | | | | | | | | | |
Argentina — 0.2% | | | | | | | | | | | | | | | | |
Republic of Argentina, Senior Notes | | | 6.875 | % | | | 4/22/21 | | | | 310,000 | | | | 324,725 | (a) |
Republic of Argentina, Senior Notes | | | 7.500 | % | | | 4/22/26 | | | | 250,000 | | | | 262,375 | (a) |
Total Argentina | | | | | | | | | | | | | | | 587,100 | |
Mexico — 0.6% | | | | | | | | | | | | | | | | |
United Mexican States, Senior Bonds | | | 6.500 | % | | | 6/9/22 | | | | 32,317,000 | MXN | | | 1,815,889 | |
Total Sovereign Bonds (Cost — $3,197,789) | | | | | | | | | | | | | | | 2,402,989 | |
| | | | |
| | | | | | | | | Shares | | | | |
| Common Stocks — 3.1% | | | | | | | | | | | | | | | | |
| Consumer Discretionary — 0.3% | | | | | | | | | | | | | | | | |
Hotels, Restaurants & Leisure — 0.2% | | | | | | | | | | | | | | | | |
Bossier Casino Venture Holdco Inc. | | | | | | | | | | | 81,754 | | | | 753,772 | *(c)(d) |
Media — 0.1% | | | | | | | | | | | | | | | | |
New Cotai LLC/New Cotai Capital Corp., Class B Shares | | | | | | | | | | | 6 | | | | 221,566 | *(c) |
Total Consumer Discretionary | | | | | | | | | | | | | | | 975,338 | |
| Energy — 1.1% | | | | | | | | | | | | | | | | |
Energy Equipment & Services — 0.6% | | | | | | | | | | | | | | | | |
Hercules Offshore Inc. | | | | | | | | | | | 54,577 | | | | 62,218 | * |
KCAD Holdings I Ltd. | | | | | | | | | | | 424,046,710 | | | | 1,767,851 | *(c)(d) |
Total Energy Equipment & Services | | | | | | | | | | | | | | | 1,830,069 | |
See Notes to Financial Statements.
| | |
| 30 | | Western Asset High Yield Fund 2016 Annual Report |
Western Asset High Yield Fund
| | | | | | | | | | | | | | | | |
| Security | | | | | | | | Shares | | | Value | |
Oil, Gas & Consumable Fuels — 0.5% | | | | | | | | | | | | | | | | |
Magnum Hunter Resources Corp. | | | | | | | | | | | 129,512 | | | $ | 1,631,854 | *(c) |
Total Energy | | | | | | | | | | | | | | | 3,461,923 | |
| Financials — 1.4% | | | | | | | | | | | | | | | | |
Banks — 1.4% | | | | | | | | | | | | | | | | |
Citigroup Inc. | | | | | | | | | | | 53,156 | | | | 2,475,475 | |
JPMorgan Chase & Co. | | | | | | | | | | | 24,911 | | | | 1,625,941 | |
Total Financials | | | | | | | | | | | | | | | 4,101,416 | |
| Health Care — 0.1% | | | | | | | | | | | | | | | | |
Health Care Providers & Services — 0.1% | | | | | | | | | | | | | | | | |
Physiotherapy Associates Holdings Inc. (Escrow) | | | | | | | | | | | 13,200 | | | | 154,572 | *(c)(d) |
| Industrials — 0.2% | | | | | | | | | | | | | | | | |
Marine — 0.2% | | | | | | | | | | | | | | | | |
DeepOcean Group Holding AS | | | | | | | | | | | 111,195 | | | | 618,689 | *(c)(d) |
Road & Rail — 0.0% | | | | | | | | | | | | | | | | |
Jack Cooper Enterprises Inc. | | | | | | | | | | | 3,456 | | | | 0 | *(c)(d)(g) |
Total Industrials | | | | | | | | | | | | | | | 618,689 | |
| Materials — 0.0% | | | | | | | | | | | | | | | | |
Metals & Mining — 0.0% | | | | | | | | | | | | | | | | |
Mirabela Nickel Ltd. | | | | | | | | | | | 3,069,757 | | | | 2 | *(c)(d) |
Total Common Stocks (Cost — $15,798,105) | | | | | | | | | | | | | | | 9,311,940 | |
| | | | |
| | | Rate | | | | | | | | | | |
| Convertible Preferred Stocks — 0.3% | | | | | | | | | | | | | | | | |
| Health Care — 0.3% | | | | | | | | | | | | | | | | |
Pharmaceuticals — 0.3% | | | | | | | | | | | | | | | | |
Allergan PLC (Cost — $783,083) | | | 5.500 | % | | | | | | | 931 | | | | 786,379 | |
| Preferred Stocks — 1.4% | | | | | | | | | | | | | | | | |
| Financials — 1.4% | | | | | | | | | | | | | | | | |
Consumer Finance — 1.1% | | | | | | | | | | | | | | | | |
GMAC Capital Trust I | | | 6.411 | % | | | | | | | 129,572 | | | | 3,245,131 | (h) |
Diversified Financial Services — 0.3% | | | | | | | | | | | | | | | | |
Citigroup Capital XIII | | | 7.008 | % | | | | | | | 31,950 | | | | 832,936 | (h) |
Total Preferred Stocks (Cost — $3,843,109) | | | | | | | | | | | | | | | 4,078,067 | |
| | | | |
| | | | | | Expiration
Date | | | Contracts | | | | |
| Purchased Options — 0.0% | | | | | | | | | | | | | | | | |
U.S. Dollar/Saudi Arabian Riyal, Call @ 3.84SAR
(Cost — $213,379) | | | | | | | 1/17/17 | | | | 9,971,000 | | | | 51,919 | |
Total Investments before Short-Term Investments (Cost — $314,262,357) | | | | | | | | 287,439,309 | |
See Notes to Financial Statements.
| | |
| Western Asset High Yield Fund 2016 Annual Report | | 31 |
Schedule of investments (cont’d)
May 31, 2016
Western Asset High Yield Fund
| | | | | | | | | | | | | | |
| Security | | Rate | | | | | Shares | | | Value | |
| Short-Term Investments — 0.6% | | | | | | | | | | | | | | |
State Street Institutional U.S. Government Money Market Fund, Premier Class (Cost — $1,994,540) | | | 0.239 | % | | | | | 1,994,540 | | | $ | 1,994,540 | |
Total Investments — 95.8% (Cost — $316,256,897#) | | | | | | | | | | | | | 289,433,849 | |
Other Assets in Excess of Liabilities — 4.2% | | | | | | | | | | | | | 12,616,790 | |
Total Net Assets — 100.0% | | | | | | | | | | | | $ | 302,050,639 | |
| † | Face amount denominated in U.S. dollars, unless otherwise noted. |
| * | Non-income producing security. |
| (a) | Security is exempt from registration under Rule 144A of the Securities Act of 1933. This security may be resold in transactions that are exempt from registration, normally to qualified institutional buyers. This security has been deemed liquid pursuant to guidelines approved by the Board of Directors, unless otherwise noted. |
| (b) | Payment-in-kind security for which the issuer has the option at each interest payment date of making interest payments in cash or additional debt securities. |
| (c) | Illiquid security (unaudited). |
| (d) | Security is valued in good faith in accordance with procedures approved by the Board of Directors (See Note 1). |
| (e) | The maturity principal is currently in default as of May 31, 2016. |
| (f) | The coupon payment on these securities is currently in default as of May 31, 2016. |
| (g) | Value is less than $1. |
| (h) | Variable rate security. Interest rate disclosed is as of the most recent information available. |
| (i) | Security has no maturity date. The date shown represents the next call date. |
| (j) | Senior loans may be considered restricted in that the Fund ordinarily is contractually obligated to receive approval from the agent bank and/or borrower prior to the disposition of a senior loan. |
| (k) | Interest rates disclosed represent the effective rates on senior loans. Ranges in interest rates are attributable to multiple contracts under the same loan. |
| # | Aggregate cost for federal income tax purposes is $317,534,853. |
| | |
Abbreviations used in this schedule: |
| CLO | | — Collateral Loan Obligation |
| MXN | | — Mexican Peso |
| REFI | | — Refinancing |
| SAR | | — Saudi Arabian Riyal |
See Notes to Financial Statements.
| | |
| 32 | | Western Asset High Yield Fund 2016 Annual Report |
Statement of assets and liabilities
May 31, 2016
| | | | |
| |
| Assets: | | | | |
Investments, at value (Cost — $316,256,897) | | $ | 289,433,849 | |
Foreign currency, at value (Cost — $53,968) | | | 48,964 | |
Cash | | | 732,542 | |
Receivable for securities sold | | | 9,523,300 | |
Interest and dividends receivable | | | 4,888,830 | |
Receivable for Fund shares sold | | | 2,764,607 | |
OTC swaps, at value (premiums paid — $356,108) | | | 331,770 | |
Deposits with brokers for open futures contracts | | | 321,306 | |
Receivable for open OTC swap contracts | | | 34,300 | |
Receivable from broker — variation margin on open futures contracts | | | 3,172 | |
Prepaid expenses | | | 53,734 | |
Total Assets | | | 308,136,374 | |
| |
| Liabilities: | | | | |
Payable for securities purchased | | | 5,093,995 | |
Payable for Fund shares repurchased | | | 657,600 | |
Investment management fee payable | | | 157,553 | |
Distributions payable | | | 29,031 | |
Service and/or distribution fees payable | | | 7,892 | |
Directors’ fees payable | | | 957 | |
Accrued expenses | | | 138,707 | |
Total Liabilities | | | 6,085,735 | |
| Total Net Assets | | $ | 302,050,639 | |
| |
| Net Assets: | | | | |
Par value (Note 7) | | $ | 39,641 | |
Paid-in capital in excess of par value | | | 449,408,969 | |
Overdistributed net investment income | | | (1,386,849) | |
Accumulated net realized loss on investments, futures contracts,
swap contracts and foreign currency transactions | | | (119,178,453) | |
Net unrealized depreciation on investments, futures contracts,
swap contracts and foreign currencies | | | (26,832,669) | |
| Total Net Assets | | $ | 302,050,639 | |
See Notes to Financial Statements.
| | |
| Western Asset High Yield Fund 2016 Annual Report | | 33 |
Statement of assets and liabilities (cont’d)
May 31, 2016
| | | | |
| |
| Net Assets: | | | | |
Class A | | | $10,895,629 | |
Class A2 | | | $14,974,453 | |
Class C | | | $2,827,537 | |
Class R | | | $273,054 | |
Class I | | | $105,119,187 | |
Class IS | | | $167,960,779 | |
| |
| Shares Outstanding: | | | | |
Class A | | | 1,434,003 | |
Class A2 | | | 1,966,074 | |
Class C | | | 375,226 | |
Class R | | | 36,155 | |
Class I | | | 13,927,882 | |
Class IS | | | 21,901,332 | |
| |
| Net Asset Value: | | | | |
Class A (and redemption price) | | | $7.60 | |
Class A2 (and redemption price) | | | $7.62 | |
Class C* | | | $7.54 | |
Class R (and redemption price) | | | $7.55 | |
Class I (and redemption price) | | | $7.55 | |
Class IS (and redemption price) | | | $7.67 | |
| Maximum Public Offering Price Per Share: | | | | |
Class A (based on maximum initial sales charge of 4.25%) | | | $7.94 | |
Class A2 (based on maximum initial sales charge of 4.25%) | | | $7.96 | |
| * | Redemption price per share is NAV of Class C shares reduced by a 1.00% CDSC, if shares are redeemed within one year from purchase payment (See Note 2). |
See Notes to Financial Statements.
| | |
| 34 | | Western Asset High Yield Fund 2016 Annual Report |
Statement of operations
For the Year Ended May 31, 2016
| | | | |
| |
| Investment Income: | | | | |
Interest | | $ | 25,653,570 | |
Dividends | | | 801,791 | |
Total Investment Income | | | 26,455,361 | |
| |
| Expenses: | | | | |
Investment management fee (Note 2) | | | 1,929,214 | |
Transfer agent fees (Note 5) | | | 168,926 | |
Registration fees | | | 128,608 | |
Service and/or distribution fees (Notes 2 and 5) | | | 66,048 | |
Audit and tax fees | | | 52,025 | |
Fund accounting fees | | | 49,627 | |
Shareholder reports | | | 29,045 | |
Legal fees | | | 17,067 | |
Directors’ fees | | | 11,441 | |
Insurance | | | 7,130 | |
Custody fees | | | 6,797 | |
Commitment fees (Note 8) | | | 2,161 | |
Fees recaptured by investment manager (Note 2) | | | 778 | |
Miscellaneous expenses | | | 11,427 | |
Total Expenses | | | 2,480,294 | |
Less: Fee waivers and/or expense reimbursements (Notes 2 and 5) | | | (535) | |
Net Expenses | | | 2,479,759 | |
| Net Investment Income | | | 23,975,602 | |
| |
Realized and Unrealized Gain (Loss) on Investments, Futures Contracts,
Swap Contracts and Foreign Currency Transactions (Notes 1, 3 and 4): | | | | |
Net Realized Gain (Loss) From: | | | | |
Investment transactions | | | (34,970,277) | |
Futures contracts | | | 592,345 | |
Swap contracts | | | 56,448 | |
Foreign currency transactions | | | 1,081 | |
Net Realized Loss | | | (34,320,403) | |
Change in Net Unrealized Appreciation (Depreciation) From: | | | | |
Investments | | | (12,099,966) | |
Futures contracts | | | 151,620 | |
Swap contracts | | | 62,385 | |
Foreign currencies | | | (69,421) | |
Change in Net Unrealized Appreciation (Depreciation) | | | (11,955,382) | |
| Net Loss on Investments, Futures Contracts, Swap Contracts and Foreign Currency Transactions | | | (46,275,785) | |
| Decrease in Net Assets From Operations | | $ | (22,300,183) | |
See Notes to Financial Statements.
| | |
| Western Asset High Yield Fund 2016 Annual Report | | 35 |
Statements of changes in net assets
| | | | | | | | |
| For the Years Ended May 31, | | 2016 | | | 2015 | |
| | |
| Operations: | | | | | | | | |
Net investment income | | $ | 23,975,602 | | | $ | 27,211,318 | |
Net realized gain (loss) | | | (34,320,403) | | | | 1,450,994 | |
Change in net unrealized appreciation (depreciation) | | | (11,955,382) | | | | (31,104,545) | |
Decrease in Net Assets From Operations | | | (22,300,183) | | | | (2,442,233) | |
| | |
| Distributions to Shareholders From (Notes 1 and 6): | | | | | | | | |
Net investment income | | | (23,893,904) | | | | (27,481,356) | |
Decrease in Net Assets From Distributions to Shareholders | | | (23,893,904) | | | | (27,481,356) | |
| | |
| Fund Share Transactions (Note 7): | | | | | | | | |
Net proceeds from sale of shares | | | 132,217,831 | | | | 230,646,465 | |
Reinvestment of distributions | | | 23,438,571 | | | | 26,994,189 | |
Cost of shares repurchased | | | (202,333,089) | | | | (410,809,222) | |
Decrease in Net Assets From Fund Share Transactions | | | (46,676,687) | | | | (153,168,568) | |
Decrease in Net Assets | | | (92,870,774) | | | | (183,092,157) | |
| | |
| Net Assets: | | | | | | | | |
Beginning of year | | | 394,921,413 | | | | 578,013,570 | |
End of year* | | $ | 302,050,639 | | | $ | 394,921,413 | |
*Includes (overdistributed) undistributed net investment income, respectively, of: | | | $(1,386,849) | | | | $42,338 | |
See Notes to Financial Statements.
| | |
| 36 | | Western Asset High Yield Fund 2016 Annual Report |
Financial highlights
| | | | | | | | | | | | | | | | | | | | |
For a share of each class of capital stock outstanding throughout each year ended May 31,
unless otherwise noted: | |
| Class A Shares1 | | 2016 | | | 2015 | | | 20142 | | | 20133 | | | 20124 | |
| | | | | |
| Net asset value, beginning of year | | | $8.60 | | | | $9.19 | | | | $9.04 | | | | $8.86 | | | | $8.61 | |
| | | | | |
| Income (loss) from operations: | | | | | | | | | | | | | | | | | | | | |
Net investment income | | | 0.50 | | | | 0.52 | | | | 0.23 | | | | 0.55 | | | | 0.40 | |
Net realized and unrealized gain (loss) | | | (1.00) | | | | (0.58) | | | | 0.14 | | | | 0.17 | | | | 0.37 | |
Total income (loss) from operations | | | (0.50) | | | | (0.06) | | | | 0.37 | | | | 0.72 | | | | 0.77 | |
| | | | | |
| Less distributions from: | | | | | | | | | | | | | | | | | | | | |
Net investment income | | | (0.50) | | | | (0.53) | | | | (0.22) | | | | (0.54) | | | | (0.52) | |
Total distributions | | | (0.50) | | | | (0.53) | | | | (0.22) | | | | (0.54) | | | | (0.52) | |
| | | | | |
| Net asset value, end of year | | | $7.60 | | | | $8.60 | | | | $9.19 | | | | $9.04 | | | | $8.86 | |
Total return5 | | | (5.63) | % | | | (0.62) | %6 | | | 4.25 | % | | | 8.26 | % | | | 9.25 | % |
| | | | | |
| Net assets, end of year (000s) | | | $10,896 | | | | $6,453 | | | | $9,579 | | | | $10,391 | | | | $406 | |
| | | | | |
| Ratios to average net assets: | | | | | | | | | | | | | | | | | | | | |
Gross expenses | | | 0.96 | % | | | 0.96 | %7 | | | 1.05 | %7,8 | | | 1.10 | %7 | | | 1.12 | %8 |
Net expenses9 | | | 0.96 | | | | 0.96 | 7 | | | 1.05 | 7,8 | | | 0.98 | 7,10 | | | 0.93 | 8,10 |
Net investment income | | | 6.58 | | | | 5.96 | | | | 5.96 | 8 | | | 6.09 | | | | 6.90 | 8 |
| | | | | |
| Portfolio turnover rate | | | 71 | % | | | 82 | % | | | 33 | % | | | 103 | % | | | 86 | % |
| 1 | Per share amounts have been calculated using the average shares method. |
| 2 | For the period January 1, 2014 through May 31, 2014. |
| 3 | For the year ended December 31. |
| 4 | For the period April 30, 2012 (inception date) to December 31, 2012. |
| 5 | Performance figures, exclusive of sales charges, may reflect compensating balance arrangements, fee waivers and/or expense reimbursements. In the absence of compensating balance arrangements, fee waivers and/or expense reimbursements, the total return would have been lower. Past performance is no guarantee of future results. Total returns for periods of less than one year are not annualized. |
| 6 | The total return includes gains from settlement of security litigations. Without these gains, the total return would have been -0.74% for the year ended May 31, 2015. |
| 7 | Reflects recapture of expenses waived/reimbursed from prior fiscal years. |
| 9 | As a result of an expense limitation arrangement, the ratio of expenses, other than interest, brokerage commissions, taxes, extraordinary expenses and deferred organizational expenses, to average net assets of Class A shares did not exceed 1.05%. This expense limitation arrangement cannot be terminated prior to December 31, 2017 without the Board of Directors’ consent. |
| 10 | Reflects fee waivers and/or expense reimbursements. |
See Notes to Financial Statements.
| | |
| Western Asset High Yield Fund 2016 Annual Report | | 37 |
Financial highlights (cont’d)
| | | | | | | | |
For a share of each class of capital stock outstanding throughout each year ended May 31,
unless otherwise noted: | |
| Class A2 Shares1 | | 2016 | | | 20152 | |
| | |
| Net asset value, beginning of year | | | $8.63 | | | | $9.06 | |
| | |
| Income (loss) from operations: | | | | | | | | |
Net investment income | | | 0.51 | | | | 0.43 | |
Net realized and unrealized loss | | | (1.01) | | | | (0.43) | |
Total income (loss) from operations | | | (0.50) | | | | — | |
| | |
| Less distributions from: | | | | | | | | |
Net investment income | | | (0.51) | | | | (0.43) | |
Total distributions | | | (0.51) | | | | (0.43) | |
| | |
| Net asset value, end of year | | | $7.62 | | | | $8.63 | |
Total return3 | | | (5.70) | % | | | 0.06 | %4 |
| | |
| Net assets, end of year (000s) | | | $14,974 | | | | $8,777 | |
| | |
| Ratios to average net assets: | | | | | | | | |
Gross expenses | | | 0.98 | % | | | 0.92 | %5 |
Net expenses6 | | | 0.98 | | | | 0.92 | 5 |
Net investment income | | | 6.62 | | | | 6.09 | 5 |
| | |
| Portfolio turnover rate | | | 71 | % | | | 82 | %7 |
| 1 | Per share amounts have been calculated using the average shares method. |
| 2 | For the period August 1, 2014 (inception date) to May 31, 2015. |
| 3 | Performance figures, exclusive of sales charges, may reflect compensating balance arrangements, fee waivers and/or expense reimbursements. In the absence of compensating balance arrangements, fee waivers and/or expense reimbursements, the total return would have been lower. Past performance is no guarantee of future results. Total returns for periods of less than one year are not annualized. |
| 4 | The total return includes gains from settlement of security litigations. Without these gains, the total return would have been -0.05% for the period ended May 31, 2015. |
| 6 | As a result of an expense limitation arrangement, the ratio of expenses, other than interest, brokerage commissions, taxes, extraordinary expenses and deferred organizational expenses, to average net assets of Class A2 shares did not exceed 1.25%. This expense limitation arrangement cannot be terminated prior to December 31, 2017 without the Board of Directors’ consent. |
| 7 | For the year ended May 31, 2015. |
See Notes to Financial Statements.
| | |
| 38 | | Western Asset High Yield Fund 2016 Annual Report |
| | | | | | | | | | | | | | | | | | | | |
For a share of each class of capital stock outstanding throughout each year ended May 31,
unless otherwise noted: | |
| Class C Shares1 | | 2016 | | | 2015 | | | 20142 | | | 20133 | | | 20124 | |
| | | | | |
| Net asset value, beginning of year | | | $8.53 | | | | $9.10 | | | | $8.95 | | | | $8.85 | | | | $8.61 | |
| | | | | |
| Income (loss) from operations: | | | | | | | | | | | | | | | | | | | | |
Net investment income | | | 0.44 | | | | 0.45 | | | | 0.19 | | | | 0.47 | | | | 0.35 | |
Net realized and unrealized gain (loss) | | | (0.99) | | | | (0.57) | | | | 0.15 | | | | 0.10 | | | | 0.38 | |
Total income (loss) from operations | | | (0.55) | | | | (0.12) | | | | 0.34 | | | | 0.57 | | | | 0.73 | |
| | | | | |
| Less distributions from: | | | | | | | | | | | | | | | | | | | | |
Net investment income | | | (0.44) | | | | (0.45) | | | | (0.19) | | | | (0.47) | | | | (0.49) | |
Total distributions | | | (0.44) | | | | (0.45) | | | | (0.19) | | | | (0.47) | | | | (0.49) | |
| | | | | |
| Net asset value, end of year | | | $7.54 | | | | $8.53 | | | | $9.10 | | | | $8.95 | | | | $8.85 | |
Total return5 | | | (6.32) | % | | | (1.25) | %6 | | | 3.83 | % | | | 6.59 | % | | | 8.73 | % |
| | | | | |
| Net assets, end of year (000s) | | | $2,828 | | | | $2,667 | | | | $1,724 | | | | $1,053 | | | | $159 | |
| | | | | |
| Ratios to average net assets: | | | | | | | | | | | | | | | | | | | | |
Gross expenses | | | 1.76 | %7 | | | 1.81 | %7 | | | 1.87 | %7,8 | | | 1.88 | %7 | | | 2.15 | %8 |
Net expenses9 | | | 1.76 | 7 | | | 1.77 | 7,10 | | | 1.80 | 7,8,10 | | | 1.80 | 7,10 | | | 1.69 | 8,10 |
Net investment income | | | 5.78 | | | | 5.17 | | | | 5.22 | 8 | | | 5.27 | | | | 6.07 | 8 |
| | | | | |
| Portfolio turnover rate | | | 71 | % | | | 82 | % | | | 33 | % | | | 103 | % | | | 86 | % |
| 1 | Per share amounts have been calculated using the average shares method. |
| 2 | For the period January 1, 2014 through May 31, 2014. |
| 3 | For the year ended December 31. |
| 4 | For the period April 30, 2012 (inception date) to December 31, 2012. |
| 5 | Performance figures, exclusive of CDSC, may reflect compensating balance arrangements, fee waivers and/or expense reimbursements. In the absence of compensating balance arrangements, fee waivers and/or expense reimbursements, the total return would have been lower. Past performance is no guarantee of future results. Total returns for periods of less than one year are not annualized. |
| 6 | The total return includes gains from settlement of security litigations. Without these gains, the total return would have been -1.25% for the year ended May 31, 2015. |
| 7 | Reflects recapture of expenses waived/reimbursed from prior fiscal years. |
| 9 | As a result of an expense limitation arrangement, the ratio of expenses, other than interest, brokerage commissions, taxes, extraordinary expenses and deferred organizational expenses, to average net assets of Class C shares did not exceed 1.80%. This expense limitation arrangement cannot be terminated prior to December 31, 2017 without the Board of Directors’ consent. |
| 10 | Reflects fee waivers and/or expense reimbursements. |
See Notes to Financial Statements.
| | |
| Western Asset High Yield Fund 2016 Annual Report | | 39 |
Financial highlights (cont’d)
| | | | | | | | | | | | | | | | | | | | |
For a share of each class of capital stock outstanding throughout each year ended May 31,
unless otherwise noted: | |
| Class R Shares1 | | 2016 | | | 2015 | | | 20142 | | | 20133 | | | 20124 | |
| | | | | |
| Net asset value, beginning of year | | | $8.54 | | | | $9.12 | | | | $8.96 | | | | $8.87 | | | | $8.61 | |
| | | | | |
| Income (loss) from operations: | | | | | | | | | | | | | | | | | | | | |
Net investment income | | | 0.48 | | | | 0.49 | | | | 0.21 | | | | 0.51 | | | | 0.38 | |
Net realized and unrealized gain (loss) | | | (0.99) | | | | (0.58) | | | | 0.16 | | | | 0.10 | | | | 0.37 | |
Total income (loss) from operations | | | (0.51) | | | | (0.09) | | | | 0.37 | | | | 0.61 | | | | 0.75 | |
| | | | | |
| Less distributions from: | | | | | | | | | | | | | | | | | | | | |
Net investment income | | | (0.48) | | | | (0.49) | | | | (0.21) | | | | (0.52) | | | | (0.49) | |
Total distributions | | | (0.48) | | | | (0.49) | | | | (0.21) | | | | (0.52) | | | | (0.49) | |
| | | | | |
| Net asset value, end of year | | | $7.55 | | | | $8.54 | | | | $9.12 | | | | $8.96 | | | | $8.87 | |
Total return5 | | | (6.01) | % | | | (0.77) | %6 | | | 4.16 | % | | | 7.03 | % | | | 9.05 | % |
| | | | | |
| Net assets, end of year (000s) | | | $273 | | | | $372 | | | | $372 | | | | $79 | | | | $11 | |
| | | | | |
| Ratios to average net assets: | | | | | | | | | | | | | | | | | | | | |
Gross expenses | | | 1.53 | %7 | | | 1.55 | %7 | | | 1.37 | %7,8 | | | 1.51 | %7 | | | 1.37 | %8 |
Net expenses9,10 | | | 1.30 | 7 | | | 1.30 | 7 | | | 1.30 | 7,8 | | | 1.26 | 7 | | | 1.30 | 8 |
Net investment income | | | 6.28 | | | | 5.62 | | | | 5.68 | 8 | | | 5.78 | | | | 6.59 | 8 |
| | | | | |
| Portfolio turnover rate | | | 71 | % | | | 82 | % | | | 33 | % | | | 103 | % | | | 86 | % |
| 1 | Per share amounts have been calculated using the average shares method. |
| 2 | For the period January 1, 2014 through May 31, 2014. |
| 3 | For the year ended December 31. |
| 4 | For the period April 30, 2012 (inception date) to December 31, 2012. |
| 5 | Performance figures may reflect compensating balance arrangements, fee waivers and/or expense reimbursements. In the absence of compensating balance arrangements, fee waivers and/or expense reimbursements, the total return would have been lower. Past performance is no guarantee of future results. Total returns for periods of less than one year are not annualized. |
| 6 | The total return includes gains from settlement of security litigations. Without these gains, the total return would have been -0.89% for the year ended May 31, 2015. |
| 7 | Reflects recapture of expenses waived/reimbursed from prior fiscal years. |
| 9 | As a result of an expense limitation arrangement, the ratio of expenses, other than interest, brokerage commissions, taxes, extraordinary expenses and deferred organizational expenses, to average net assets of Class R shares did not exceed 1.30%. This expense limitation arrangement cannot be terminated prior to December 31, 2017 without the Board of Directors’ consent. |
| 10 | Reflects fee waivers and/or expense reimbursements. |
See Notes to Financial Statements.
| | |
| 40 | | Western Asset High Yield Fund 2016 Annual Report |
| | | | | | | | | | | | | | | | | | | | | | | | |
For a share of each class of capital stock outstanding throughout each year ended May 31,
unless otherwise noted: | |
| Class I Shares1 | | 2016 | | | 2015 | | | 20142 | | | 20133 | | | 20123 | | | 20113 | |
| | | | | | |
| Net asset value, beginning of year | | | $8.54 | | | | $9.12 | | | | $8.96 | | | | $8.87 | | | | $8.10 | | | | $8.71 | |
| | | | | | |
| Income (loss) from operations: | | | | | | | | | | | | | | | | | | | | | | | | |
Net investment income | | | 0.52 | | | | 0.55 | | | | 0.24 | | | | 0.58 | | | | 0.63 | | | | 0.69 | |
Net realized and unrealized gain (loss) | | | (0.99) | | | | (0.58) | | | | 0.15 | | | | 0.08 | | | | 0.77 | | | | (0.52) | |
Total income (loss) from operations | | | (0.47) | | | | (0.03) | | | | 0.39 | | | | 0.66 | | | | 1.40 | | | | 0.17 | |
| | | | | | |
| Less distributions from: | | | | | | | | | | | | | | | | | | | | | | | | |
Net investment income | | | (0.52) | | | | (0.55) | | | | (0.23) | | | | (0.57) | | | | (0.63) | | | | (0.78) | |
Total distributions | | | (0.52) | | | | (0.55) | | | | (0.23) | | | | (0.57) | | | | (0.63) | | | | (0.78) | |
| | | | | | |
| Net asset value, end of year | | | $7.55 | | | | $8.54 | | | | $9.12 | | | | $8.96 | | | | $8.87 | | | | $8.10 | |
Total return4 | | | (5.35) | % | | | (0.28) | %5 | | | 4.42 | % | | | 7.64 | % | | | 17.76 | % | | | 1.87 | % |
| | | | | | |
| Net assets, end of year (000s) | | | $105,119 | | | | $221,201 | | | | $407,122 | | | | $409,166 | | | | $385,634 | | | | $345,686 | |
| | | | | | |
| Ratios to average net assets: | | | | | | | | | | | | | | | | | | | | | | | | |
Gross expenses | | | 0.72 | % | | | 0.68 | % | | | 0.69 | %6 | | | 0.70 | % | | | 0.66 | % | | | 0.68 | % |
Net expenses | | | 0.72 | | | | 0.68 | | | | 0.69 | 6 | | | 0.70 | | | | 0.66 | | | | 0.68 | |
Net investment income | | | 6.83 | | | | 6.20 | | | | 6.33 | 6 | | | 6.46 | | | | 7.37 | | | | 7.88 | |
| | | | | | |
| Portfolio turnover rate | | | 71 | % | | | 82 | % | | | 33 | % | | | 103 | % | | | 86 | % | | | 103 | % |
| 1 | Per share amounts have been calculated using the average shares method. |
| 2 | For the period January 1, 2014 through May 31, 2014. |
| 3 | For the year ended December 31. |
| 4 | Performance figures may reflect compensating balance arrangements, fee waivers and/or expense reimbursements. In the absence of compensating balance arrangements, fee waivers and/or expense reimbursements, the total return would have been lower. Past performance is no guarantee of future results. Total returns for periods of less than one year are not annualized. |
| 5 | The total return includes gains from settlement of security litigations. Without these gains, the total return would have been -0.40% for the year ended May 31, 2015. |
See Notes to Financial Statements.
| | |
| Western Asset High Yield Fund 2016 Annual Report | | 41 |
Financial highlights (cont’d)
| | | | | | | | | | | | | | | | | | | | | | | | |
For a share of each class of capital stock outstanding throughout each year ended May 31,
unless otherwise noted: | |
| Class IS Shares1 | | 2016 | | | 2015 | | | 20142 | | | 20133 | | | 20123 | | | 20113 | |
| | | | | | |
| Net asset value, beginning of year | | | $8.68 | | | | $9.27 | | | | $9.11 | | | | $9.01 | | | | $8.23 | | | | $8.84 | |
| | | | | | |
| Income (loss) from operations: | | | | | | | | | | | | | | | | | | | | | | | | |
Net investment income | | | 0.54 | | | | 0.55 | | | | 0.24 | | | | 0.60 | | | | 0.65 | | | | 0.70 | |
Net realized and unrealized gain (loss) | | | (1.01) | | | | (0.58) | | | | 0.16 | | | | 0.09 | | | | 0.76 | | | | (0.53) | |
Total income (loss) from operations | | | (0.47) | | | | (0.03) | | | | 0.40 | | | | 0.69 | | | | 1.41 | | | | 0.17 | |
| | | | | | |
| Less distributions from: | | | | | | | | | | | | | | | | | | | | | | | | |
Net investment income | | | (0.54) | | | | (0.56) | | | | (0.24) | | | | (0.59) | | | | (0.63) | | | | (0.78) | |
Total distributions | | | (0.54) | | | | (0.56) | | | | (0.24) | | | | (0.59) | | | | (0.63) | | | | (0.78) | |
| | | | | | |
| Net asset value, end of year | | | $7.67 | | | | $8.68 | | | | $9.27 | | | | $9.11 | | | | $9.01 | | | | $8.23 | |
Total return4 | | | (5.32) | % | | | (0.23) | %5 | | | 4.42 | % | | | 7.82 | % | | | 17.67 | % | | | 1.92 | % |
| | | | | | |
| Net assets, end of year (000s) | | | $167,961 | | | | $155,451 | | | | $159,217 | | | | $141,592 | | | | $140,665 | | | | $100,048 | |
| | | | | | |
| Ratios to average net assets: | | | | | | | | | | | | | | | | | | | | | | | | |
Gross expenses | | | 0.64 | % | | | 0.63 | %6 | | | 0.62 | %7 | | | 0.63 | %6 | | | 0.63 | % | | | 0.61 | % |
Net expenses8 | | | 0.64 | | | | 0.63 | 6 | | | 0.61 | 7,9 | | | 0.63 | 6 | | | 0.63 | 9 | | | 0.61 | |
Net investment income | | | 6.89 | | | | 6.29 | | | | 6.41 | 7 | | | 6.57 | | | | 7.41 | | | | 8.00 | |
| | | | | | |
| Portfolio turnover rate | | | 71 | % | | | 82 | % | | | 33 | % | | | 103 | % | | | 86 | % | | | 103 | % |
| 1 | Per share amounts have been calculated using the average shares method. |
| 2 | For the period January 1, 2014 through May 31, 2014. |
| 3 | For the year ended December 31. |
| 4 | Performance figures may reflect compensating balance arrangements, fee waivers and/or expense reimbursements. In the absence of compensating balance arrangements, fee waivers and/or expense reimbursements, the total return would have been lower. Past performance is no guarantee of future results. Total returns for periods of less than one year are not annualized. |
| 5 | The total return includes gains from settlement of security litigations. Without these gains, the total return would have been -0.23% for the year ended May 31, 2015. |
| 6 | Reflects recapture of expenses waived/reimbursed from prior fiscal years. |
| 8 | As a result of an expense limitation arrangement, the ratio of expenses, other than interest, brokerage commissions, taxes, extraordinary expenses and deferred organizational expenses, to average net assets of Class IS shares did not exceed 0.65%. In addition, the ratio of total annual fund operating expenses for Class IS shares did not exceed the ratio of total annual fund operating expenses for Class I shares. These expense limitation arrangements cannot be terminated prior to December 31, 2017 without the Board of Directors’ consent. |
| 9 | Reflects fee waivers and/or expense reimbursements. |
See Notes to Financial Statements.
| | |
| 42 | | Western Asset High Yield Fund 2016 Annual Report |
Notes to financial statements
1. Organization and significant accounting policies
Western Asset High Yield Fund (the “Fund”) is a separate diversified investment series of Western Asset Funds, Inc. (the “Corporation”). The Corporation, a Maryland corporation, is registered under the Investment Company Act of 1940, as amended (the “1940 Act”), as an open-end management investment company.
The following are significant accounting policies consistently followed by the Fund and are in conformity with U.S. generally accepted accounting principles (“GAAP”). Estimates and assumptions are required to be made regarding assets, liabilities and changes in net assets resulting from operations when financial statements are prepared. Changes in the economic environment, financial markets and any other parameters used in determining these estimates could cause actual results to differ. Subsequent events have been evaluated through the date the financial statements were issued.
(a) Investment valuation. The valuations for fixed income securities (which may include, but are not limited to, corporate, government, municipal, mortgage-backed, collateralized mortgage obligations and asset-backed securities) and certain derivative instruments are typically the prices supplied by independent third party pricing services, which may use market prices or broker/dealer quotations or a variety of valuation techniques and methodologies. The independent third party pricing services use inputs that are observable such as issuer details, interest rates, yield curves, prepayment speeds, credit risks/spreads, default rates and quoted prices for similar securities. Short-term fixed income securities that will mature in 60 days or less are valued at amortized cost, unless it is determined that using this method would not reflect an investment’s fair value. Investments in open-end funds are valued at the closing net asset value per share of each fund on the day of valuation. Futures contracts are valued daily at the settlement price established by the board of trade or exchange on which they are traded. Equity securities for which market quotations are available are valued at the last reported sales price or official closing price on the primary market or exchange on which they trade. When the Fund holds securities or other assets that are denominated in a foreign currency, the Fund will normally use the currency exchange rates as of 4:00 p.m. (Eastern Time). If independent third party pricing services are unable to supply prices for a portfolio investment, or if the prices supplied are deemed by the manager to be unreliable, the market price may be determined by the manager using quotations from one or more broker/dealers or at the transaction price if the security has recently been purchased and no value has yet been obtained from a pricing service or pricing broker. When reliable prices are not readily available, such as when the value of a security has been significantly affected by events after the close of the exchange or market on which the security is principally traded, but before the Fund calculates its net asset value, the Fund values these securities as determined in accordance with procedures approved by the Fund’s Board of Directors.
The Board of Directors is responsible for the valuation process and has delegated the supervision of the daily valuation process to the Legg Mason North Atlantic Fund Valuation Committee (the “Valuation Committee”). The Valuation Committee, pursuant to the policies
| | |
| Western Asset High Yield Fund 2016 Annual Report | | 43 |
Notes to financial statements (cont’d)
adopted by the Board of Directors, is responsible for making fair value determinations, evaluating the effectiveness of the Fund’s pricing policies, and reporting to the Board of Directors. When determining the reliability of third party pricing information for investments owned by the Fund, the Valuation Committee, among other things, conducts due diligence reviews of pricing vendors, monitors the daily change in prices and reviews transactions among market participants.
The Valuation Committee will consider pricing methodologies it deems relevant and appropriate when making fair value determinations. Examples of possible methodologies include, but are not limited to, multiple of earnings; discount from market of a similar freely traded security; discounted cash-flow analysis; book value or a multiple thereof; risk premium/yield analysis; yield to maturity; and/or fundamental investment analysis. The Valuation Committee will also consider factors it deems relevant and appropriate in light of the facts and circumstances. Examples of possible factors include, but are not limited to, the type of security; the issuer’s financial statements; the purchase price of the security; the discount from market value of unrestricted securities of the same class at the time of purchase; analysts’ research and observations from financial institutions; information regarding any transactions or offers with respect to the security; the existence of merger proposals or tender offers affecting the security; the price and extent of public trading in similar securities of the issuer or comparable companies; and the existence of a shelf registration for restricted securities.
For each portfolio security that has been fair valued pursuant to the policies adopted by the Board of Directors, the fair value price is compared against the last available and next available market quotations. The Valuation Committee reviews the results of such back testing monthly and fair valuation occurrences are reported to the Board of Directors quarterly.
The Fund uses valuation techniques to measure fair value that are consistent with the market approach and/or income approach, depending on the type of security and the particular circumstance. The market approach uses prices and other relevant information generated by market transactions involving identical or comparable securities. The income approach uses valuation techniques to discount estimated future cash flows to present value.
GAAP establishes a disclosure hierarchy that categorizes the inputs to valuation techniques used to value assets and liabilities at measurement date. These inputs are summarized in the three broad levels listed below:
| • | | Level 1 — quoted prices in active markets for identical investments |
| • | | Level 2 — other significant observable inputs (including quoted prices for similar investments, interest rates, prepayment speeds, credit risk, etc.) |
| • | | Level 3 — significant unobservable inputs (including the Fund’s own assumptions in determining the fair value of investments) |
| | |
| 44 | | Western Asset High Yield Fund 2016 Annual Report |
The inputs or methodologies used to value securities are not necessarily an indication of the risk associated with investing in those securities.
The following is a summary of the inputs used in valuing the Fund’s assets and liabilities carried at fair value:
| | | | | | | | | | | | | | | | |
ASSETS | |
| Description | | Quoted Prices
(Level 1) | | | Other Significant
Observable Inputs
(Level 2) | | | Significant
Unobservable
Inputs
(Level 3) | | | Total | |
| Long-term investments†: | | | | | | | | | | | | | | | | |
Corporate bonds & notes: | | | | | | | | | | | | | | | | |
Consumer discretionary | | | — | | | $ | 55,207,751 | | | $ | 1,948,806 | | | $ | 57,156,557 | |
Energy | | | — | | | | 42,490,560 | | | | 0 | * | | | 42,490,560 | |
Materials | | | — | | | | 20,899,168 | | | | 0 | * | | | 20,899,168 | |
Other corporate bonds & notes | | | — | | | | 130,835,094 | | | | — | | | | 130,835,094 | |
Asset-backed securities | | | — | | | | 6,712,462 | | | | — | | | | 6,712,462 | |
Collateralized mortgage obligations | | | — | | | | 1,309,439 | | | | — | | | | 1,309,439 | |
Convertible bonds & notes | | | — | | | | 715,217 | | | | — | | | | 715,217 | |
Senior loans: | | | | | | | | | | | | | | | | |
Consumer discretionary | | | — | | | | 2,547,647 | | | | 1,048,088 | | | | 3,595,735 | |
Energy | | | — | | | | 367,986 | | | | 1,401,436 | | | | 1,769,422 | |
Utilities | | | — | | | | — | | | | 1,198,487 | | | | 1,198,487 | |
Other senior loans | | | — | | | | 4,125,874 | | | | — | | | | 4,125,874 | |
Sovereign bonds | | | — | | | | 2,402,989 | | | | — | | | | 2,402,989 | |
Common stocks: | | | | | | | | | | | | | | | | |
Consumer discretionary | | | — | | | | — | | | | 975,338 | | | | 975,338 | |
Energy | | $ | 62,218 | | | | 1,631,854 | | | | 1,767,851 | | | | 3,461,923 | |
Financials | | | 4,101,416 | | | | — | | | | — | | | | 4,101,416 | |
Health care | | | — | | | | — | | | | 154,572 | | | | 154,572 | |
Industrials | | | — | | | | — | | | | 618,689 | | | | 618,689 | |
Materials | | | — | | | | — | | | | 2 | | | | 2 | |
Convertible preferred stocks | | | 786,379 | | | | — | | | | — | | | | 786,379 | |
Preferred stocks | | | 4,078,067 | | | | — | | | | — | | | | 4,078,067 | |
Purchased options | | | — | | | | 51,919 | | | | — | | | | 51,919 | |
| Total long-term investments | | $ | 9,028,080 | | | $ | 269,297,960 | | | $ | 9,113,269 | | | $ | 287,439,309 | |
| Short-term investments† | | | 1,994,540 | | | | — | | | | — | | | | 1,994,540 | |
| Total investments | | $ | 11,022,620 | | | $ | 269,297,960 | | | $ | 9,113,269 | | | $ | 289,433,849 | |
| Other financial instruments: | | | | | | | | | | | | | | | | |
Futures contracts | | $ | 23,526 | | | | — | | | | — | | | $ | 23,526 | |
OTC credit default swaps on corporate issues — sell protection‡ | | | — | | | $ | 331,770 | | | | — | | | | 331,770 | |
| Total other financial instruments | | $ | 23,526 | | | $ | 331,770 | | | | — | | | $ | 355,296 | |
| Total | | $ | 11,046,146 | | | $ | 269,629,730 | | | $ | 9,113,269 | | | $ | 289,789,145 | |
| | |
| Western Asset High Yield Fund 2016 Annual Report | | 45 |
Notes to financial statements (cont’d)
| | | | | | | | | | | | | | | | |
| LIABILITIES | |
| Description | | Quoted Prices
(Level 1) | | | Other Significant
Observable Inputs
(Level 2) | | | Significant
Unobservable
Inputs
(Level 3) | | | Total | |
| Other financial instruments: | | | | | | | | | | | | | | | | |
Futures contracts | | $ | 2,051 | | | | — | | | | — | | | $ | 2,051 | |
| † | See Schedule of Investments for additional detailed categorizations. |
| * | Amount represents less than $1. |
| ‡ | Value includes any premium paid or received with respect to swap contracts. |
The following is a reconciliation of investments in which significant unobservable inputs (Level 3) were used in determining fair value:
| | | | | | | | | | | | | | | | | | | | |
| | | Corporate Bonds & Notes | |
| Investments in Securities | | Consumer
Discretionary | | | Industrials | | | Energy | | | Materials | | | Utilities | |
| Balance as of May 31, 2015 | | $ | 2,477,462 | | | $ | 6,561,240 | | | | — | | | $ | 0 | * | | $ | 3,648,092 | |
| Accrued premiums/discounts | | | 30,071 | | | | (16,868) | | | | — | | | | — | | | | (8,391) | |
| Realized gain (loss)1 | | | — | | | | 28,774 | | | | — | | | | — | | | | (46,359) | |
| Change in unrealized appreciation (depreciation)2 | | | 1,137 | | | | (137,862) | | | | — | | | | (225) | | | | (334,375) | |
| Purchases | | | 183,543 | | | | — | | | $ | 0 | * | | | 225 | | | | — | |
| Sales | | | (743,407) | | | | (1,997,492) | | | | — | | | | — | | | | (623,767) | |
| Transfers into Level 33 | | | — | | | | — | | | | — | | | | — | | | | — | |
| Transfers out of Level 34 | | | — | | | | (4,437,792) | | | | — | | | | — | | | | (2,635,200) | |
| Balance as of May 31, 2016 | | $ | 1,948,806 | | | | — | | | $ | 0 | * | | $ | 0 | * | | | — | |
| Net change in unrealized appreciation (depreciation) for investments in securities still held at May 31, 20162 | | $ | 1,137 | | | | — | | | | — | | | $ | (225) | | | | — | |
| | | | | | | | | | | | | | | | |
| | | Senior Loans | |
| Investments in Securities (cont’d) | | Consumer
Discretionary | | | Consumer
Staples | | | Energy | | | Utilities | |
| Balance as of May 31, 2015 | | $ | 923,650 | | | $ | 1,467,813 | | | $ | 875,606 | | | | — | |
| Accrued premiums/discounts | | | 2,537 | | | | 5,205 | | | | 7,260 | | | $ | 160 | |
| Realized gain (loss)1 | | | — | | | | 8,512 | | | | 23,010 | | | | — | |
| Change in unrealized appreciation (depreciation)2 | | | (164,849) | | | | (18,153) | | | | (319,875) | | | | (13,460) | |
| Purchases | | | 825,850 | | | | — | | | | 1,697,500 | | | | 359,100 | |
| Sales | | | — | | | | (948,660) | | | | (882,065) | | | | — | |
| Transfers into Level 33 | | | 367,488 | | | | — | | | | — | | | | 852,687 | |
| Transfers out of Level 34 | | | (906,588) | | | | (514,717) | | | | — | | | | — | |
| Balance as of May 31, 2016 | | $ | 1,048,088 | | | | — | | | $ | 1,401,436 | | | $ | 1,198,487 | |
| Net change in unrealized appreciation (depreciation) for investments in securities still held at May 31, 20162 | | $ | (145,658) | | | | — | | | $ | (319,875) | | | $ | (13,460) | |
| | |
| 46 | | Western Asset High Yield Fund 2016 Annual Report |
| | | | | | | | | | | | | | | | | | | | | | | | |
| | | Common Stocks | | | | |
| Investments in Securities (cont’d) | | Consumer
Discretionary | | | Energy | | | Health Care | | | Industrials | | | Materials | | | Total | |
| Balance as of May 31, 2015 | | $ | 165,371 | | | $ | 4,649,248 | | | $ | 1,095,600 | | | $ | 1,047,123 | | | | — | | | $ | 22,911,205 | |
| Accrued premiums/discounts | | | — | | | | — | | | | — | | | | — | | | | — | | | | 19,974 | |
| Realized gain (loss)1 | | | — | | | | — | | | | 306,258 | | | | — | | | | — | | | | 320,195 | |
| Change in unrealized appreciation (depreciation)2 | | | 809,967 | | | | (2,881,397) | | | | 87,062 | | | | (491,834) | | | | — | | | | (3,463,864) | |
| Purchases | | | — | | | | — | | | | 115,375 | | | | 63,400 | | | | — | | | | 3,244,993 | |
| Sales | | | — | | | | — | | | | (1,449,723) | | | | — | | | | — | | | | (6,645,114) | |
| Transfers into Level 33 | | | — | | | | — | | | | — | | | | — | | | $ | 2 | | | | 1,220,177 | |
| Transfers out of Level 34 | | | — | | | | — | | | | — | | | | — | | | | — | | | | (8,494,297) | |
| Balance as of May 31, 2016 | | $ | 975,338 | | | $ | 1,767,851 | | | $ | 154,572 | | | $ | 618,689 | | | $ | 2 | | | $ | 9,113,269 | |
| Net change in unrealized appreciation (depreciation) for investments in securities still held at May 31, 20162 | | $ | 809,967 | | | $ | (2,881,397) | | | $ | 39,196 | | | $ | (491,834) | | | | — | | | $ | (3,002,149) | |
The Fund’s policy is to recognize transfers between levels as of the end of the reporting period.
| * | Amount represents less than $1. |
| 1 | This amount is included in net realized gain (loss) from investment transactions in the accompanying Statement of Operations. |
| 2 | This amount is included in the change in net unrealized appreciation (depreciation) in the accompanying Statement of Operations. Change in unrealized appreciation (depreciation) includes net unrealized appreciation (depreciation) resulting from changes in investment values during the reporting period and the reversal of previously recorded unrealized appreciation (depreciation) when gains or losses are realized. |
| 3 | Transferred into Level 3 as a result of the unavailability of a quoted price in an active market for an identical investment or the unavailability of other significant observable inputs. |
| 4 | Transferred out of Level 3 as a result of the availability of a quoted price in an active market for an identical investment or the availability of other significant observable inputs. |
(b) Repurchase agreements. The Fund may enter into repurchase agreements with institutions that its subadviser has determined are creditworthy. Each repurchase agreement is recorded at cost. Under the terms of a typical repurchase agreement, the Fund acquires a debt security subject to an obligation of the seller to repurchase, and of the Fund to resell, the security at an agreed-upon price and time, thereby determining the yield during the Fund’s holding period. When entering into repurchase agreements, it is the Fund’s policy that its custodian or a third party custodian, acting on the Fund’s behalf, take possession of the underlying collateral securities, the market value of which, at all times, at least equals the principal amount of the repurchase transaction, including accrued interest. To the extent that any repurchase transaction maturity exceeds one business day, the value of the collateral is marked-to-market and measured against the value of the agreement in an effort to ensure the adequacy of the collateral. If the counterparty defaults, the Fund generally has the right to use the collateral to satisfy the terms of the repurchase transaction. However, if the market value of the collateral declines during the period in which the Fund seeks to assert its rights or if bankruptcy proceedings are commenced with respect to the seller of the security, realization of the collateral by the Fund may be delayed or limited.
| | |
| Western Asset High Yield Fund 2016 Annual Report | | 47 |
Notes to financial statements (cont’d)
(c) Futures contracts. The Fund uses futures contracts generally to gain exposure to, or hedge against, changes in interest rates or gain exposure to, or hedge against, changes in certain asset classes. A futures contract represents a commitment for the future purchase or sale of an asset at a specified price on a specified date.
Upon entering into a futures contract, the Fund is required to deposit cash or cash equivalents with a broker in an amount equal to a certain percentage of the contract amount. This is known as the ‘‘initial margin’’ and subsequent payments (‘‘variation margin’’) are made or received by the Fund each day, depending on the daily fluctuation in the value of the contract. For certain futures, including foreign denominated futures, variation margin is not settled daily, but is recorded as a net variation margin payable or receivable. The daily changes in contract value are recorded as unrealized gains or losses in the Statement of Operations and the Fund recognizes a realized gain or loss when the contract is closed.
Futures contracts involve, to varying degrees, risk of loss in excess of the amounts reflected in the financial statements. In addition, there is the risk that the Fund may not be able to enter into a closing transaction because of an illiquid secondary market.
(d) Purchased options. When the Fund purchases an option, an amount equal to the premium paid by the Fund is recorded as an investment on the Statement of Assets and Liabilities, the value of which is marked-to-market to reflect the current market value of the option purchased. If the purchased option expires, the Fund realizes a loss equal to the amount of premium paid. When an instrument is purchased or sold through the exercise of an option, the related premium paid is added to the basis of the instrument acquired or deducted from the proceeds of the instrument sold. The risk associated with purchasing put and call options is limited to the premium paid.
(e) Forward foreign currency contracts. The Fund enters into a forward foreign currency contract to hedge against foreign currency exchange rate risk on its non-U.S. dollar denominated securities or to facilitate settlement of a foreign currency denominated portfolio transaction. A forward foreign currency contract is an agreement between two parties to buy and sell a currency at a set price with delivery and settlement at a future date. The contract is marked-to-market daily and the change in value is recorded by the Fund as an unrealized gain or loss. When a forward foreign currency contract is closed, through either delivery or offset by entering into another forward foreign currency contract, the Fund recognizes a realized gain or loss equal to the difference between the value of the contract at the time it was opened and the value of the contract at the time it is closed.
Forward foreign currency contracts involve elements of market risk in excess of the amounts reflected on the Statement of Assets and Liabilities. The Fund bears the risk of an unfavorable change in the foreign exchange rate underlying the forward foreign currency contract. Risks may also arise upon entering into these contracts from the potential inability of the counterparties to meet the terms of their contracts.
(f) Foreign currency translation. Investment securities and other assets and liabilities denominated in foreign currencies are translated into U.S. dollar amounts based upon
| | |
| 48 | | Western Asset High Yield Fund 2016 Annual Report |
prevailing exchange rates on the date of valuation. Purchases and sales of investment securities and income and expense items denominated in foreign currencies are translated into U.S. dollar amounts based upon prevailing exchange rates on the respective dates of such transactions.
The Fund does not isolate that portion of the results of operations resulting from fluctuations in foreign exchange rates on investments from the fluctuations arising from changes in market prices of securities held. Such fluctuations are included with the net realized and unrealized gain or loss on investments.
Net realized foreign exchange gains or losses arise from sales of foreign currencies, including gains and losses on forward foreign currency contracts, currency gains or losses realized between the trade and settlement dates on securities transactions, and the difference between the amounts of dividends, interest, and foreign withholding taxes recorded on the Fund’s books and the U.S. dollar equivalent of the amounts actually received or paid. Net unrealized foreign exchange gains and losses arise from changes in the values of assets and liabilities, other than investments in securities, on the date of valuation, resulting from changes in exchange rates.
Foreign security and currency transactions may involve certain considerations and risks not typically associated with those of U.S. dollar denominated transactions as a result of, among other factors, the possibility of lower levels of governmental supervision and regulation of foreign securities markets and the possibility of political or economic instability.
(g) Loan participations. The Fund may invest in loans arranged through private negotiation between one or more financial institutions. The Fund’s investment in any such loan may be in the form of a participation in or an assignment of the loan. In connection with purchasing participations, the Fund generally will have no right to enforce compliance by the borrower with the terms of the loan agreement related to the loan, or any rights of off-set against the borrower and the Fund may not benefit directly from any collateral supporting the loan in which it has purchased the participation.
The Fund assumes the credit risk of the borrower, the lender that is selling the participation and any other persons interpositioned between the Fund and the borrower. In the event of the insolvency of the lender selling the participation, the Fund may be treated as a general creditor of the lender and may not benefit from any off-set between the lender and the borrower.
(h) Swap agreements. The Fund invests in swaps for the purpose of managing its exposure to interest rate, credit or market risk, or for other purposes, including to increase the Fund’s return. The use of swaps involves risks that are different from those associated with other portfolio transactions. Swap agreements are privately negotiated in the over-the-counter market and may be entered into as a bilateral contract (“OTC Swaps”) or centrally cleared (“Centrally Cleared Swaps”). Unlike Centrally Cleared Swaps, the Fund has credit exposure to the counterparties of OTC Swaps.
| | |
| Western Asset High Yield Fund 2016 Annual Report | | 49 |
Notes to financial statements (cont’d)
In a Centrally Cleared Swap, immediately following execution of the swap, the swap agreement is submitted to a clearinghouse or central counterparty (the “CCP”) and the CCP becomes the ultimate counterparty of the swap agreement. The Fund is required to interface with the CCP through a broker, acting in an agency capacity. All payments are settled with the CCP through the broker. Upon entering into a Centrally Cleared Swap, the Fund is required to deposit initial margin with the broker in the form of cash or securities.
Swap contracts are marked-to-market daily and changes in value are recorded as unrealized appreciation (depreciation). The daily change in valuation of Centrally Cleared Swaps, if any, is recorded as a receivable or payable for variation margin on the Statement of Assets and Liabilities. Gains or losses are realized upon termination of the swap agreement. Collateral, in the form of restricted cash or securities, may be required to be held in segregated accounts with the Fund’s custodian in compliance with the terms of the swap contracts. Securities posted as collateral for swap contracts are identified in the Schedule of Investments and restricted cash, if any, is identified on the Statement of Assets and Liabilities. Risks may exceed amounts recorded in the Statement of Assets and Liabilities. These risks include changes in the returns of the underlying instruments, failure of the counterparties to perform under the contracts’ terms, and the possible lack of liquidity with respect to the swap agreements.
OTC swap payments received or made at the beginning of the measurement period are reflected as a premium or deposit, respectively, on the Statement of Assets and Liabilities. These upfront payments are amortized over the life of the swap and are recognized as realized gain or loss in the Statement of Operations. Net periodic payments received or paid by the Fund are recognized as a realized gain or loss in the Statement of Operations.
The Fund’s maximum exposure in the event of a defined credit event on a credit default swap to sell protection is the notional amount. As of May 31, 2016, the total notional value of all OTC credit default swaps to sell protection was $3,430,000. This amount would be offset by the value of the swap’s reference entity, upfront premiums received on the swap and any amounts received from the settlement of a credit default swap where the Fund bought protection for the same referenced security/entity.
For average notional amounts of swaps held during the year ended May 31, 2016, see Note 4.
Credit default swaps
The Fund enters into credit default swap (“CDS”) contracts for investment purposes, to manage its credit risk or to add leverage. CDS agreements involve one party making a stream of payments to another party in exchange for the right to receive a specified return in the event of a default by a third party, typically corporate or sovereign issuers, on a specified obligation, or in the event of a write-down, principal shortfall, interest shortfall or default of all or part of the referenced entities comprising a credit index. The Fund may use a CDS to provide protection against defaults of the issuers (i.e., to reduce risk where the Fund has exposure to an issuer) or to take an active long or short position with respect to
| | |
| 50 | | Western Asset High Yield Fund 2016 Annual Report |
the likelihood of a particular issuer’s default. As a seller of protection, the Fund generally receives an upfront payment or a stream of payments throughout the term of the swap provided that there is no credit event. If the Fund is a seller of protection and a credit event occurs, as defined under the terms of that particular swap agreement, the maximum potential amount of future payments (undiscounted) that the Fund could be required to make under a credit default swap agreement would be an amount equal to the notional amount of the agreement. These amounts of potential payments will be partially offset by any recovery of values from the respective referenced obligations. As a seller of protection, the Fund effectively adds leverage to its portfolio because, in addition to its total net assets, the Fund is subject to investment exposure on the notional amount of the swap. As a buyer of protection, the Fund generally receives an amount up to the notional value of the swap if a credit event occurs.
Implied spreads are the theoretical prices a lender receives for credit default protection. When spreads rise, market perceived credit risk rises and when spreads fall, market perceived credit risk falls. The implied credit spread of a particular referenced entity reflects the cost of buying/selling protection and may include upfront payments required to enter into the agreement. Wider credit spreads and decreasing market values, when compared to the notional amount of the swap, represent a deterioration of the referenced entity’s credit soundness and a greater likelihood or risk of default or other credit event occurring as defined under the terms of the agreement. Credit spreads utilized in determining the period end market value of credit default swap agreements on corporate or sovereign issues are disclosed in the Notes to Financial Statements and serve as an indicator of the current status of the payment/performance risk and represent the likelihood or risk of default for credit derivatives. For credit default swap agreements on asset-backed securities and credit indices, the quoted market prices and resulting values, particularly in relation to the notional amount of the contract as well as the annual payment rate, serve as an indication of the current status of the payment/performance risk.
The Fund’s maximum risk of loss from counterparty risk, as the protection buyer, is the fair value of the contract (this risk is mitigated by the posting of collateral by the counterparty to the Fund to cover the Fund’s exposure to the counterparty). As the protection seller, the Fund’s maximum risk is the notional amount of the contract. Credit default swaps are considered to have credit risk-related contingent features since they require payment by the protection seller to the protection buyer upon the occurrence of a defined credit event.
Entering into a CDS agreement involves, to varying degrees, elements of credit, market and documentation risk in excess of the related amounts recognized on the Statement of Assets and Liabilities. Such risks involve the possibility that there will be no liquid market for these agreements, that the counterparty to the agreement may default on its obligation to perform or disagree as to the meaning of the contractual terms in the agreement, and that there will be unfavorable changes in net interest rates.
(i) Credit and market risk. The Fund invests in high-yield and emerging market instruments that are subject to certain credit and market risks. The yields of high-yield and
| | |
| Western Asset High Yield Fund 2016 Annual Report | | 51 |
Notes to financial statements (cont’d)
emerging market debt obligations reflect, among other things, perceived credit and market risks. The Fund’s investments in securities rated below investment grade typically involve risks not associated with higher rated securities including, among others, greater risk related to timely and ultimate payment of interest and principal, greater market price volatility and less liquid secondary market trading. The consequences of political, social, economic or diplomatic changes may have disruptive effects on the market prices of investments held by the Fund. The Fund’s investments in non-U.S. dollar denominated securities may also result in foreign currency losses caused by devaluations and exchange rate fluctuations.
Investments in securities that are collateralized by real estate mortgages are subject to certain credit and liquidity risks. When market conditions result in an increase in default rates of the underlying mortgages and the foreclosure values of underlying real estate properties are materially below the outstanding amount of these underlying mortgages, collection of the full amount of accrued interest and principal on these investments may be doubtful. Such market conditions may significantly impair the value and liquidity of these investments and may result in a lack of correlation between their credit ratings and values.
(j) Foreign investment risks. The Fund’s investments in foreign securities may involve risks not present in domestic investments. Since securities may be denominated in foreign currencies, may require settlement in foreign currencies or pay interest or dividends in foreign currencies, changes in the relationship of these foreign currencies to the U.S. dollar can significantly affect the value of the investments and earnings of the Fund. Foreign investments may also subject the Fund to foreign government exchange restrictions, expropriation, taxation or other political, social or economic developments, all of which affect the market and/or credit risk of the investments.
(k) Counterparty risk and credit-risk-related contingent features of derivative instruments. The Fund may invest in certain securities or engage in other transactions, where the Fund is exposed to counterparty credit risk in addition to broader market risks. The Fund may invest in securities of issuers, which may also be considered counterparties as trading partners in other transactions. This may increase the risk of loss in the event of default or bankruptcy by the counterparty or if the counterparty otherwise fails to meet its contractual obligations. The Fund’s subadviser attempts to mitigate counterparty risk by (i) periodically assessing the creditworthiness of its trading partners, (ii) monitoring and/or limiting the amount of its net exposure to each individual counterparty based on its assessment and (iii) requiring collateral from the counterparty for certain transactions. Market events and changes in overall economic conditions may impact the assessment of such counterparty risk by the subadviser. In addition, declines in the values of underlying collateral received may expose the Fund to increased risk of loss.
The Fund has entered into master agreements with certain of its derivative counterparties that provide for general obligations, representations, agreements, collateral, events of default or termination and credit related contingent features. The credit related contingent features include, but are not limited to, a percentage decrease in the Fund’s net assets or
| | |
| 52 | | Western Asset High Yield Fund 2016 Annual Report |
NAV over a specified period of time. If these credit related contingent features were triggered, the derivatives counterparty could terminate the positions and demand payment or require additional collateral.
Collateral requirements differ by type of derivative. Collateral or margin requirements are set by the broker or exchange clearinghouse for exchange traded derivatives while collateral terms are contract specific for over-the-counter traded derivatives. Cash collateral that has been pledged to cover obligations of the Fund under derivative contracts, if any, will be reported separately in the Statement of Assets and Liabilities. Securities pledged as collateral, if any, for the same purpose are noted in the Schedule of Investments.
Absent an event of default by the counterparty or a termination of the agreement, the terms of the master agreements do not result in an offset of reported amounts of financial assets and financial liabilities in the Statement of Assets and Liabilities across transactions between the Fund and the applicable counterparty. The enforceability of the right to offset may vary by jurisdiction.
As of May 31, 2016, the Fund did not have any open derivative transactions with credit related contingent features in a net liability position.
(l) Security transactions and investment income. Security transactions are accounted for on a trade date basis. Interest income, adjusted for amortization of premium and accretion of discount, is recorded on the accrual basis. Paydown gains and losses on mortgage- and asset-backed securities are recorded as adjustments to interest income. Dividend income is recorded on the ex-dividend date. Foreign dividend income is recorded on the ex-dividend date or as soon as practicable after the Fund determines the existence of a dividend declaration after exercising reasonable due diligence. The cost of investments sold is determined by use of the specific identification method. To the extent any issuer defaults or a credit event occurs that impacts the issuer, the Fund may halt any additional interest income accruals and consider the realizability of interest accrued up to the date of default or credit event.
(m) Distributions to shareholders. Distributions from net investment income of the Fund are declared each business day to shareholders of record, and are paid monthly. Distributions of net realized gains, if any, are declared at least annually. Distributions to shareholders of the Fund are recorded on the ex-dividend date and are determined in accordance with income tax regulations, which may differ from GAAP.
(n) Share class accounting. Investment income, common expenses and realized/unrealized gains (losses) on investments are allocated to the various classes of the Fund on the basis of daily net assets of each class. Fees relating to a specific class are charged directly to that share class.
(o) Compensating balance arrangements. The Fund has an arrangement with its custodian bank whereby a portion of the custodian’s fees is paid indirectly by credits earned on the Fund’s cash on deposit with the bank.
| | |
| Western Asset High Yield Fund 2016 Annual Report | | 53 |
Notes to financial statements (cont’d)
(p) Federal and other taxes. It is the Fund’s policy to comply with the federal income and excise tax requirements of the Internal Revenue Code of 1986 (the “Code”), as amended, applicable to regulated investment companies. Accordingly, the Fund intends to distribute its taxable income and net realized gains, if any, to shareholders in accordance with timing requirements imposed by the Code. Therefore, no federal or state income tax provision is required in the Fund’s financial statements.
Management has analyzed the Fund’s tax positions taken on income tax returns for all open tax years and has concluded that as of May 31, 2016, no provision for income tax is required in the Fund’s financial statements. The Fund’s federal and state income and federal excise tax returns for tax years for which the applicable statutes of limitations have not expired are subject to examination by the Internal Revenue Service and state departments of revenue.
Under the applicable foreign tax laws, a withholding tax may be imposed on interest, dividends and capital gains at various rates.
(q) Reclassification. GAAP requires that certain components of net assets be reclassified to reflect permanent differences between financial and tax reporting. These reclassifications have no effect on net assets or net asset value per share. During the current year, the following reclassifications have been made:
| | | | | | | | | | | | |
| | | Overdistributed Net
Investment Income | | | Accumulated Net
Realized Loss | | | Paid-in
Capital | |
| (a) | | | — | | | $ | 12,024,797 | | | $ | (12,024,797) | |
| (b) | | $ | (1,510,885) | | | | 1,510,885 | | | | — | |
| (a) | Reclassifications are due to the expiration of a capital loss carryforward. |
| (b) | Reclassifications are due to foreign currency transactions treated as ordinary income for tax purposes, the sale of securities with a different book and tax basis and book/tax differences in the treatment of swap contracts. |
2. Investment management agreement and other transactions with affiliates
The Fund has an investment management agreement with Legg Mason Partners Fund Advisor, LLC (“LMPFA”). Western Asset Management Company (“Western Asset”) is the Fund’s subadviser. LMPFA and Western Asset are wholly-owned subsidiaries of Legg Mason, Inc. (“Legg Mason”).
LMPFA provides the Fund with management and administrative services for which the Fund pays a fee, calculated daily and paid monthly, at an annual rate of 0.55% of the Fund’s average daily net assets.
As a result of expense limitation arrangements between the Fund and LMPFA, the ratio of expenses, other than interest, brokerage commissions, taxes, extraordinary expenses and deferred organizational expenses, to average net assets of Class A, Class A2, Class C, Class R and Class IS shares did not exceed 1.05%, 1.25%, 1.80%, 1.30% and 0.65%, respectively. In addition, the ratio of total annual fund operating expenses for Class IS
| | |
| 54 | | Western Asset High Yield Fund 2016 Annual Report |
shares did not exceed the ratio of total annual fund operating expenses for Class I shares. These expense limitation arrangements cannot be terminated prior to December 31, 2017 without the Board of Directors’ consent.
During the year ended May 31, 2016, fees waived and/or expenses reimbursed amounted to $535.
LMPFA is permitted to recapture amounts waived and/or reimbursed to a class within two years after the fiscal year in which LMPFA earned the fee or incurred the expense if the class’ total annual operating expenses have fallen to a level below the expense limitation (“expense cap”) in effect at the time the fees were earned or the expenses incurred. In no case will LMPFA recapture any amount that would result, on any particular business day of the Fund, in the class’ total annual operating expenses exceeding the expense cap or any other lower limit then in effect.
Pursuant to these arrangements, at May 31, 2016, the Fund had remaining fee waivers and/or expense reimbursements subject to recapture by LMPFA and respective dates of expiration as follows:
| | | | | | | | | | | | | | | | | | | | |
| | | Class A | | | Class A2 | | | Class C | | | Class R | | | Class IS | |
| Expires May 31, 2017 | | | — | | | | — | | | | — | | | $ | 899 | | | | — | |
| Expires May 31, 2018 | | | — | | | | — | | | | — | | | | 535 | | | | — | |
| Total fee waivers/expense reimbursements subject to recapture | | | — | | | | — | | | | — | | | $ | 1,434 | | | | — | |
For the year ended May 31, 2016, LMPFA recaptured $745 and $33 for Class C and Class R shares, respectively.
Legg Mason Investor Services, LLC (“LMIS”), a wholly-owned broker-dealer subsidiary of Legg Mason, serves as the Fund’s sole and exclusive distributor.
There is a maximum initial sales charge of 4.25% for Class A and Class A2 shares. There is a contingent deferred sales charge (“CDSC”) of 1.00% on Class C shares, which applies if redemption occurs within 12 months from purchase payment. In certain cases, Class A and Class A2 shares have a 1.00% CDSC, which applies if redemption occurs within 18 months from purchase payment. This CDSC only applies to those purchases of Class A and Class A2 shares, which, when combined with current holdings of other shares of funds sold by LMIS, equal or exceed $1,000,000 in the aggregate. These purchases do not incur an initial sales charge.
For the year ended May 31, 2016, LMIS and its affiliates retained sales charges of $2,026 and $25,286 on sales of the Fund’s Class A and Class A2 shares, respectively. In addition, for the year ended May 31, 2016, CDSCs paid to LMIS and its affiliates were:
| | | | | | | | |
| | | Class A | | | Class C | |
| CDSCs | | $ | 2,655 | | | $ | 469 | |
As of May 31, 2016, Legg Mason and its affiliates owned 27% of the Fund.
| | |
| Western Asset High Yield Fund 2016 Annual Report | | 55 |
Notes to financial statements (cont’d)
All officers of the Corporation are employees of Legg Mason or its affiliates and do not receive compensation from the Corporation.
3. Investments
During the year ended May 31, 2016, the aggregate cost of purchases and proceeds from sales of investments (excluding short-term investments) and U.S. Government & Agency Obligations were as follows:
| | | | | | | | |
| | | Investments | | | U.S. Government &
Agency Obligations | |
| Purchases | | $ | 220,240,396 | | | $ | 20,979,805 | |
| Sales | | | 272,371,006 | | | | 25,579,415 | |
At May 31, 2016, the aggregate gross unrealized appreciation and depreciation of investments for federal income tax purposes were as follows:
| | | | |
| Gross unrealized appreciation | | $ | 9,046,766 | |
| Gross unrealized depreciation | | | (37,147,770) | |
| Net unrealized depreciation | | $ | (28,101,004) | |
At May 31, 2016, the Fund had the following open futures contracts:
| | | | | | | | | | | | | | | | | | | | |
| | | Number of
Contracts | | | Expiration
Date | | | Basis
Value | | | Market
Value | | | Unrealized
Appreciation
(Depreciation) | |
| Contracts to Buy: | |
| U.S. Treasury 2-Year Notes | | | 202 | | | | 9/16 | | | $ | 44,004,110 | | | $ | 44,017,063 | | | $ | 12,953 | |
| U.S. Treasury 5-Year Notes | | | 166 | | | | 9/16 | | | | 19,933,809 | | | | 19,939,453 | | | | 5,644 | |
| U.S. Treasury Ultra Long-Term Bonds | | | 12 | | | | 9/16 | | | | 2,096,571 | | | | 2,101,500 | | | | 4,929 | |
| | | | | | | | | | | | | | | | | | | | 23,526 | |
| Contracts to Sell: | |
| U.S. Treasury Long-Term Bonds | | | 6 | | | | 9/16 | | | | 977,824 | | | | 979,875 | | | | (2,051) | |
| Net unrealized appreciation on open futures contracts | | | $ | 21,475 | |
At May 31, 2016, the Fund had the following open swap contracts:
| | | | | | | | | | | | | | | | | | | | | | | | | | |
| OTC CREDIT DEFAULT SWAPS ON CORPORATE ISSUES — SELL PROTECTION1 | |
Swap Counterparty
(Reference Entity) | | Notional
Amount2 | | | Termination
Date | | | Implied
Credit
Spread at
May 31,
20163 | | Periodic
Payments
Received by
the Fund† | | | Market
Value | | | Upfront
Premiums
Paid
(Received) | | | Unrealized
Depreciation | |
| Deutsche Bank AG (Ally Financial Inc., 7.500% due 9/15/20) | | $ | 3,430,000 | | | | 6/20/20 | | | 2.42% | | | 5.000% quarterly | | | $ | 331,770 | | | $ | 356,108 | | | $ | (24,338) | |
| 1 | If the Fund is a seller of protection and a credit event occurs, as defined under the terms of that particular swap agreement, the Fund will either (i) pay to the buyer of protection an amount equal to the notional amount of the swap and take delivery of the referenced obligation or underlying securities comprising the referenced index or (ii) pay a net settlement amount in the form of cash or securities equal to the notional amount of the swap less the recovery value of the referenced obligation or underlying securities comprising the referenced index. |
| 2 | The maximum potential amount the Fund could be required to pay as a seller of credit protection or receive as a buyer of credit protection if a credit event occurs as defined under the terms of that particular swap agreement. |
| | |
| 56 | | Western Asset High Yield Fund 2016 Annual Report |
| 3 | Implied credit spreads, utilized in determining the market value of credit default swap agreements on corporate or sovereign issues as of period end, serve as an indicator of the current status of the payment/performance risk and represent the likelihood or risk of default for the credit derivative. The implied credit spread of a particular referenced entity reflects the cost of buying/selling protection and may include upfront payments required to be made to enter into the agreement. Wider credit spreads represent a deterioration of the referenced entity’s credit soundness and a greater likelihood or risk of default or other credit event occurring as defined under the terms of the agreement. A credit spread identified as “Defaulted” indicates a credit event has occurred for the referenced entity or obligation. |
| † | Percentage shown is an annual percentage rate. |
At May 31, 2016, the Fund held collateral received from Deutsche Bank AG in the amount of $354,443. This amount could be used to reduce the Fund’s exposure to the counterparty in the event of default.
4. Derivative instruments and hedging activities
Below is a table, grouped by derivative type, that provides information about the fair value and the location of derivatives within the Statement of Assets and Liabilities at May 31, 2016.
| | | | | | | | | | | | | | | | |
| ASSET DERIVATIVES1 | |
| | | Interest Rate
Risk | | | Foreign
Exchange Risk | | | Credit Risk | | | Total | |
| Purchased options2 | | | — | | | $ | 51,919 | | | | — | | | $ | 51,919 | |
| Futures contracts3 | | $ | 23,526 | | | | — | | | | — | | | | 23,526 | |
| OTC swap contracts4 | | | — | | | | — | | | $ | 331,770 | | | | 331,770 | |
| Total | | $ | 23,526 | | | $ | 51,919 | | | $ | 331,770 | | | $ | 407,215 | |
| | | | |
| LIABILITY DERIVATIVES1 | |
| | | Interest Rate
Risk | |
| Futures contracts3 | | $ | 2,051 | |
| 1 | Generally, the balance sheet location for asset derivatives is receivables/net unrealized appreciation (depreciation) and for liability derivatives is payables/net unrealized appreciation (depreciation). |
| 2 | Market value of purchased options is reported in Investments at value in the Statement of Assets and Liabilities. |
| 3 | Includes cumulative appreciation (depreciation) of futures contracts as reported in the footnotes. Only variation margin is reported within the receivables and/or payables on the Statement of Assets and Liabilities. |
| 4 | Values include premiums paid (received) on swap contracts which are shown separately in the Statement of Assets and Liabilities. |
The following tables provide information about the effect of derivatives and hedging activities on the Fund’s Statement of Operations for the year ended May 31, 2016. The first table provides additional detail about the amounts and sources of gains (losses) realized on
| | |
| Western Asset High Yield Fund 2016 Annual Report | | 57 |
Notes to financial statements (cont’d)
derivatives during the period. The second table provides additional information about the change in unrealized appreciation (depreciation) resulting from the Fund’s derivatives and hedging activities during the period.
| | | | | | | | | | | | | | | | |
| AMOUNT OF REALIZED GAIN (LOSS) ON DERIVATIVES RECOGNIZED | |
| | | Interest
Rate Risk | | | Foreign
Exchange Risk | | | Credit Risk | | | Total | |
| Futures contracts | | $ | 592,345 | | | | — | | | | — | | | $ | 592,345 | |
| Swap contracts | | | — | | | | — | | | $ | 56,448 | | | | 56,448 | |
| Forward foreign currency contracts1 | | | — | | | $ | 19,764 | | | | — | | | | 19,764 | |
| Total | | $ | 592,345 | | | $ | 19,764 | | | $ | 56,448 | | | $ | 668,557 | |
| 1 | Net realized gain (loss) from forward foreign currency contracts is reported in net realized gain (loss) from foreign currency transactions in the Statement of Operations. |
| | | | | | | | | | | | | | | | |
| CHANGE IN UNREALIZED APPRECIATION (DEPRECIATION) ON DERIVATIVES RECOGNIZED | |
| | | Interest
Rate Risk | | | Foreign
Exchange Risk | | | Credit Risk | | | Total | |
| Purchased options1 | | | — | | | $ | (161,460) | | | | — | | | $ | (161,460) | |
| Futures contracts | | $ | 151,620 | | | | — | | | | — | | | | 151,620 | |
| Swap contracts | | | — | | | | — | | | $ | 62,385 | | | | 62,385 | |
| Forward foreign currency contracts2 | | | — | | | | (66,889) | | | | — | | | | (66,889) | |
| Total | | $ | 151,620 | | | $ | (228,349) | | | $ | 62,385 | | | $ | (14,344) | |
| 1 | The change in unrealized appreciation (depreciation) from purchased options is reported in the change in net unrealized appreciation (depreciation) from investments in the Statement of Operations. |
| 2 | The change in unrealized appreciation (depreciation) from forward foreign currency contracts is reported in the change in net unrealized appreciation (depreciation) from foreign currencies in the Statement of Operations. |
During the year ended May 31, 2016, the volume of derivative activity for the Fund was as follows:
| | | | |
| | | Average Market
Value | |
| Purchased options | | $ | 34,477 | |
| Futures contracts (to buy) | | | 25,621,398 | |
| Futures contracts (to sell) | | | 11,480,352 | |
| Forward foreign currency contracts (to buy)† | | | 391,762 | |
| Forward foreign currency contracts (to sell)† | | | 2,160,533 | |
| |
| | | Average Notional
Balance | |
| Credit default swap contracts (to buy protection)† | | $ | 4,863,787 | |
| Credit default swap contracts (to sell protection) | | | 3,430,000 | |
| † | At May 31, 2016, there were no open positions held in this derivative. |
| | |
| 58 | | Western Asset High Yield Fund 2016 Annual Report |
The following table presents by financial instrument, the Fund’s derivative assets net of the related collateral received by the Fund at May 31, 2016:
| | | | | | | | | | | | |
| | | Gross Amount of Derivative
Assets in the Statement of
Assets and Liabilities1 | | | Collateral
Received2,3 | | | Net
Amount | |
| Purchased options4 | | $ | 51,919 | | | | — | | | $ | 51,919 | |
| Futures contracts5 | | | 3,172 | | | | — | | | | 3,172 | |
| OTC swap contracts | | | 331,770 | | | $ | (331,770) | | | | — | |
| Total | | $ | 386,861 | | | $ | (331,770) | | | $ | 55,091 | |
| 1 | Absent an event of default or early termination, derivative assets and liabilities are presented gross and not offset in the Statement of Assets and Liabilities. |
| 2 | Gross amounts are not offset in the Statement of Assets and Liabilities. |
| 3 | In some instances, the actual collateral received and/or pledged may be more than the amount shown here due to overcollateralization. |
| 4 | Market value of purchased options is shown in Investments at value in the Statement of Assets and Liabilities. |
| 5 | Amount represents the current day’s variation margin as reported in the Statement of Assets and Liabilities. It differs from the cumulative appreciation (depreciation) presented in the previous table. |
5. Class specific expenses, waivers and/or expense reimbursements
The Fund has adopted a Rule 12b-1 shareholder services and distribution plan and under that plan the Fund pays service and/or distribution fees with respect to its Class A, Class A2, Class C and Class R shares calculated at the annual rate of 0.25%, 0.25%, 1.00% and 0.50% of the average daily net assets of each class, respectively. Service and/or distribution fees are accrued daily and paid monthly.
For the year ended May 31, 2016, class specific expenses were as follows:
| | | | | | | | |
| | | Service and/or
Distribution Fees | | | Transfer Agent
Fees | |
| Class A | | $ | 14,938 | | | $ | 4,464 | |
| Class A2 | | | 27,639 | | | | 9,628 | |
| Class C | | | 22,292 | | | | 2,028 | |
| Class R | | | 1,179 | | | | 881 | |
| Class I | | | — | | | | 150,782 | |
| Class IS | | | — | | | | 1,143 | |
| Total | | $ | 66,048 | | | $ | 168,926 | |
For the year ended May 31, 2016, waivers and/or expense reimbursements by class were as follows:
| | | | |
| | | Waivers/Expense
Reimbursements | |
| Class A | | | — | |
| Class A2 | | | — | |
| Class C | | | — | |
| Class R | | $ | 535 | |
| Class I | | | — | |
| Class IS | | | — | |
| Total | | $ | 535 | |
| | |
| Western Asset High Yield Fund 2016 Annual Report | | 59 |
Notes to financial statements (cont’d)
6. Distributions to shareholders by class
| | | | | | | | |
| | | Year Ended May 31, 2016 | | | Year Ended May 31, 2015 | |
| Net Investment Income: | | | | | | | | |
| Class A | | $ | 389,460 | | | $ | 441,513 | |
| Class A2 | | | 727,977 | | | | 217,985 | † |
| Class C | | | 128,392 | | | | 122,482 | |
| Class R | | | 14,719 | | | | 20,628 | |
| Class I | | | 12,911,495 | | | | 14,676,427 | |
| Class IS | | | 9,721,861 | | | | 12,002,321 | |
| Total | | $ | 23,893,904 | | | $ | 27,481,356 | |
| † | For the period August 1, 2014 (inception date) to May 31, 2015. |
7. Capital shares
At May 31, 2016, the Corporation had 42.7 billion shares of capital stock authorized with a par value of $0.001 per share. Transactions in shares of each class were as follows:
| | | | | | | | | | | | | | | | |
| | | Year Ended
May 31, 2016 | | | Year Ended
May 31, 2015 | |
| | | Shares | | | Amount | | | Shares | | | Amount | |
| Class A | |
| Shares sold | | | 1,444,034 | | | $ | 10,383,356 | | | | 2,909,144 | | | $ | 26,196,907 | |
| Shares issued on reinvestment | | | 47,805 | | | | 364,121 | | | | 40,592 | | | | 356,809 | |
| Shares repurchased | | | (808,076) | | | | (6,353,449) | | | | (3,241,461) | | | | (29,249,701) | |
| Net increase (decrease) | | | 683,763 | | | $ | 4,394,028 | | | | (291,725) | | | $ | (2,695,985) | |
|
| Class A2 | |
| Shares sold | | | 994,478 | | | $ | 7,653,576 | | | | 1,011,788 | † | | $ | 8,811,082 | † |
| Shares issued on reinvestment | | | 95,359 | | | | 727,966 | | | | 25,308 | † | | | 217,965 | † |
| Shares repurchased | | | (141,353) | | | | (1,089,176) | | | | (19,506) | † | | | (167,494) | † |
| Net increase | | | 948,484 | | | $ | 7,292,366 | | | | 1,017,590 | † | | $ | 8,861,553 | † |
|
| Class C | |
| Shares sold | | | 210,995 | | | $ | 1,560,340 | | | | 228,310 | | | $ | 1,991,327 | |
| Shares issued on reinvestment | | | 13,101 | | | | 99,813 | | | | 11,661 | | | | 100,552 | |
| Shares repurchased | | | (161,506) | | | | (1,256,581) | | | | (116,688) | | | | (999,182) | |
| Net increase | | | 62,590 | | | $ | 403,572 | | | | 123,283 | | | $ | 1,092,697 | |
|
| Class R | |
| Shares sold | | | 24,806 | | | $ | 193,234 | | | | 9,814 | | | $ | 84,322 | |
| Shares issued on reinvestment | | | 1,188 | | | | 8,894 | | | | 355 | | | | 3,081 | |
| Shares repurchased | | | (33,416) | | | | (276,255) | | | | (7,389) | | | | (64,685) | |
| Net increase (decrease) | | | (7,422) | | | $ | (74,127) | | | | 2,780 | | | $ | 22,718 | |
| | |
| 60 | | Western Asset High Yield Fund 2016 Annual Report |
| | | | | | | | | | | | | | | | |
| | | Year Ended
May 31, 2016 | | | Year Ended
May 31, 2015 | |
| | | Shares | | | Amount | | | Shares | | | Amount | |
| Class I | |
| Shares sold | | | 6,160,811 | | | $ | 46,830,491 | | | | 8,516,997 | | | $ | 73,927,817 | |
| Shares issued on reinvestment | | | 1,641,920 | | | | 12,518,014 | | | | 1,655,908 | | | | 14,472,479 | |
| Shares repurchased | | | (19,770,185) | | | | (148,653,326) | | | | (28,932,798) | | | | (258,958,979) | |
| Net decrease | | | (11,967,454) | | | $ | (89,304,821) | | | | (18,759,893) | | | $ | (170,558,683) | |
|
| Class IS | |
| Shares sold | | | 8,293,365 | | | $ | 65,596,834 | | | | 13,305,916 | | | $ | 119,635,010 | |
| Shares issued on reinvestment | | | 1,256,925 | | | | 9,719,763 | | | | 1,346,232 | | | | 11,843,303 | |
| Shares repurchased | | | (5,548,680) | | | | (44,704,302) | | | | (13,929,993) | | | | (121,369,191) | |
| Net increase | | | 4,001,610 | | | $ | 30,612,295 | | | | 722,155 | | | $ | 10,109,132 | |
| † | For the period August 1, 2014 (inception date) to May 31, 2015. |
8. Redemption facility
Effective November 24, 2015, the Fund and certain other participating funds within the Corporation (the “Participating Funds”), have available an unsecured revolving credit facility (the “Redemption Facility”) from the lenders and The Bank of New York Mellon (“BNY Mellon”), as administrative agent for the lenders. The Redemption Facility is to be used for temporary or emergency purposes as an additional source of liquidity to fund redemptions of shares. Under the agreement, BNY Mellon provides a 364-day revolving credit facility, in the aggregate amount of $265 million. Unless renewed, the agreement will terminate on November 22, 2016. Any borrowings under the Redemption Facility will bear interest at current market rates as set forth in the credit agreement. The annual commitment fee to maintain the Redemption Facility is 0.10% and is incurred on the unused portion of the facility and is allocated to all Participating Funds pro rata based on net assets. For the period ended May 31, 2016, the Fund incurred a commitment fee in the amount of $2,161. The Fund did not utilize the Redemption Facility during the period ended May 31, 2016.
9. Income tax information and distributions to shareholders
The tax character of distributions paid during the fiscal years ended May 31, was as follows:
| | | | | | | | |
| | | 2016 | | | 2015 | |
| Distributions paid from: | | | | | | | | |
| Ordinary income | | $ | 23,893,904 | | | $ | 27,481,356 | |
| | |
| Western Asset High Yield Fund 2016 Annual Report | | 61 |
Notes to financial statements (cont’d)
As of May 31, 2016, the components of accumulated earnings (losses) on a tax basis were as follows:
| | | | |
| Undistributed ordinary income — net | | $ | 58,837 | |
| Deferred capital losses* | | | (34,460,754) | |
| Capital loss carryforward** | | | (83,418,268) | |
| Other book/tax temporary differences(a) | | | (1,467,161) | |
| Unrealized appreciation (depreciation)(b) | | | (28,110,625) | |
| Total accumulated earnings (losses) — net | | $ | (147,397,971) | |
| * | These capital losses have been deferred in the current year as either short-term or long-term losses. The losses will be deemed to occur on the first day of the next taxable year in the same character as they were originally deferred and will be available to offset future taxable capital gains. These losses must be utilized before any of the Fund’s capital loss carryforward may be utilized. |
| ** | As of May 31, 2016, the Fund had the following net capital loss carryforward remaining: |
| | | | |
| Year of Expiration | | Amount | |
| 5/31/2017 | | $ | (83,418,268 | ) |
This amount will be available to offset any future taxable capital gains.
| (a) | Other book/tax temporary differences are attributable to the realization for tax purposes of unrealized gains (losses) on certain futures contracts, the deferral of certain late year losses for tax purposes, book/tax differences in the accrual of interest income on securities in default and book/tax differences in the timing of the deductibility of various expenses. |
| (b) | The difference between book-basis and tax-basis unrealized appreciation (depreciation) is attributable to the tax deferral of losses on wash sales. |
| | |
| 62 | | Western Asset High Yield Fund 2016 Annual Report |
Report of independent registered public accounting firm
To the Board of Directors of Western Asset Funds, Inc. and to the Shareholders of Western Asset High Yield Fund:
In our opinion, the accompanying statement of assets and liabilities, including the schedule of investments, and the related statements of operations and of changes in net assets and the financial highlights present fairly, in all material respects, the financial position of the Western Asset High Yield Fund (one of the funds comprising Western Asset Funds, Inc., the “Fund”) at May 31, 2016, the results of its operations, the changes in its net assets and the financial highlights for each of the periods presented, in conformity with accounting principles generally accepted in the United States of America. These financial statements and financial highlights (hereafter referred to as “financial statements”) are the responsibility of the Fund’s management. Our responsibility is to express an opinion on these financial statements based on our audits. We conducted our audits of these financial statements in accordance with the standards of the Public Company Accounting Oversight Board (United States). Those standards require that we plan and perform the audit to obtain reasonable assurance about whether the financial statements are free of material misstatement. An audit includes examining, on a test basis, evidence supporting the amounts and disclosures in the financial statements, assessing the accounting principles used and significant estimates made by management, and evaluating the overall financial statement presentation. We believe that our audits, which included confirmation of securities at May 31, 2016 by correspondence with the custodian and brokers, provide a reasonable basis for our opinion.
PricewaterhouseCoopers LLP
Baltimore, Maryland
July 18, 2016
| | |
| Western Asset High Yield Fund 2016 Annual Report | | 63 |
Additional information (unaudited)
Information about Directors and Officers
The business and affairs of Western Asset High Yield Fund (the “Fund”) are conducted by management under the supervision and subject to the direction of its Board of Directors. The business address of each Director is c/o Jane Trust, Legg Mason, 100 International Drive, 11th Floor, Baltimore, Maryland 21202. Information pertaining to the Directors and officers of the Fund is set forth below.
The Statement of Additional Information includes additional information about Directors and is available, without charge, upon request by calling the Fund at 1-877-721-1926.
| | |
| Independent Directors† | | |
| Robert Abeles, Jr. | | |
| Year of birth | | 1945 |
| Position(s) held with Fund | | Director |
| Term of office1 and length of time served2 | | Since 2013 |
| Principal occupations during the past five years | | Senior Vice President, Finance and Chief Financial Officer (since 2009) of University of Southern California |
| Number of portfolios in fund complex overseen3 | | 9 |
| Other directorships held during the past five years | | None |
| |
| Anita L. DeFrantz | | |
| Year of birth | | 1952 |
| Position(s) held with Fund | | Director |
| Term of office1 and length of time served2 | | Since 1998 |
| Principal occupations during the past five years | | President (since 1987) and Director (since 1990) of LA84 Foundation (formerly Amateur Athletic Foundation of Los Angeles); Member of the International Olympic Committee (since 1986) and Member of Executive Board of International Olympic Committee (since 2013) |
| Number of portfolios in fund complex overseen3 | | 9 |
| Other directorships held during the past five years | | OBN Holdings, Inc. (film, television and media company) |
| |
| Avedick B. Poladian | | |
| Year of birth | | 1951 |
| Position(s) held with Fund | | Director |
| Term of office1 and length of time served2 | | Since 2007 |
| Principal occupations during the past five years | | Executive Vice President and Chief Operating Officer of Lowe Enterprises, Inc. (real estate and hospitality firm) (since 2002); formerly, Partner, Arthur Andersen, LLP (1974 to 2002) |
| Number of portfolios in fund complex overseen3 | | 9 |
| Other directorships held during the past five years | | Occidental Petroleum Corporation, California Resources Corporation and Public Storage |
| | |
| 64 | | Western Asset High Yield Fund |
| | |
| Independent Directors cont’d | | |
| William E. B. Siart | | |
| Year of birth | | 1946 |
| Position(s) held with Fund | | Director and Chairman |
| Term of office1 and length of time served2 | | Since 1997 |
| Principal occupations during the past five years | | Trustee of The Getty Trust (since 2005); formerly, Chairman of Excellent Education Development (since 2000); Chairman of Walt Disney Concert Hall, Inc. (1998 to 2006) |
| Number of portfolios in fund complex overseen3 | | 9 |
| Other directorships held during the past five years | | None |
| |
| Jaynie Miller Studenmund | | |
| Year of birth | | 1954 |
| Position(s) held with Fund | | Director |
| Term of office1 and length of time served2 | | Since 2004 |
| Principal occupations during the past five years | | Director of Pinnacle Entertainment, Inc. (since 2012) (gaming and hospitality company); Director of Core Logic, Inc. (since 2012) (information, analytics and business services company); formerly, Director of Orbitz Worldwide, Inc. (2007 to 2014) (online travel company); Director of MarketTools, Inc. (2010 to 2012) (market research software provider); Director of eHarmony, Inc. (2005 to 2011) (online dating company) |
| Number of portfolios in fund complex overseen3 | | 9 |
| Other directorships held during the past five years | | None |
| | |
| Interested Director | | |
| Ronald L. Olson4 | | |
| Year of birth | | 1941 |
| Position(s) held with Fund | | Director |
| Term of office1 and length of time served2 | | Since 2005 |
| Principal occupations during the past five years | | Senior Partner of Munger, Tolles & Olson LLP (a law partnership) (since 1968) |
| Number of portfolios in fund complex overseen3 | | 9 |
| Other directorships held during the past five years | | Edison International; City National Corporation (financial services company); The Washington Post Company; and Berkshire Hathaway, Inc. |
| | |
| Western Asset High Yield Fund | | 65 |
Additional information (unaudited) (cont’d)
Information about Directors and Officers
| | |
| Officers5 | | |
| Jane Trust, CFA | | |
| Year of birth | | 1962 |
| Position(s) with Fund | | President and Chief Executive Officer |
| Term of office1 and length of time served2 | | Since 2015 |
| Principal occupation(s) during past five years | | Managing Director of Legg Mason & Co., LLC (“Legg Mason & Co.”) (since 2015); Officer and/or Trustee/Director of 161 funds associated with Legg Mason Partners Fund Advisor, LLC (“LMPFA”) or its affiliates (since 2015); President and Chief Executive Officer of LMPFA (since 2015); formerly, Senior Vice President of LMPFA (2015); formerly, Director of ClearBridge, LLC (formerly, Legg Mason Capital Management, LLC) (2007 to 2014); formerly, Managing Director of Legg Mason Investment Counsel & Trust Co. (2000 to 2007) |
| |
Richard F. Sennett Legg Mason 100 International Drive, 7th Floor, Baltimore, MD 21202 | | |
| Year of birth | | 1970 |
| Position(s) with Fund | | Principal Financial Officer and Treasurer |
| Term of office1 and length of time served2 | | Since 2011 and since 2013 |
| Principal occupation(s) during past five years | | Principal Financial Officer and Treasurer of certain mutual funds associated with Legg Mason & Co. or its affiliates (since 2011 and since 2013); Managing Director of Legg Mason & Co. and Senior Manager of the Treasury Policy group for Legg Mason & Co.’s Global Fiduciary Platform (since 2011); formerly, Chief Accountant within the SEC’s Division of Investment Management (2007 to 2011); formerly, Assistant Chief Accountant within the SEC’s Division of Investment Management (2002 to 2007) |
| |
Todd F. Kuehl Legg Mason 100 International Drive, 9th Floor, Baltimore, MD 21202 | | |
| Year of birth | | 1969 |
| Position(s) held with Fund | | Chief Compliance Officer |
| Term of office1 and length of time served2 | | Since 2007 |
| Principal occupations during the past five years | | Managing Director of Legg Mason & Co. (since 2011); Chief Compliance Officer of certain mutual funds associated with Legg Mason & Co. or its affiliates (since 2006); formerly, Chief Compliance Officer of Legg Mason Private Portfolio Group (prior to 2010); formerly, Branch Chief, Division of Investment Management, U.S. Securities and Exchange Commission (2002 to 2006) |
| | |
| 66 | | Western Asset High Yield Fund |
| | |
| Officers5 cont’d | | |
Robert I. Frenkel Legg Mason 100 First Stamford Place, 6th Floor, Stamford, CT 06902 | | |
| Year of birth | | 1954 |
| Position(s) held with Fund | | Secretary and Chief Legal Officer |
| Term of office1 and length of time served2 | | Since 2007 |
| Principal occupations during the past five years | | Vice President and Deputy General Counsel of Legg Mason, Inc. (since 2006); Managing Director and General Counsel — U.S. Mutual Funds for Legg Mason & Co. (since 2006) and Legg Mason & Co. predecessors (since 1994); Secretary and Chief Legal Officer of certain mutual funds associated with Legg Mason & Co. or its affiliates (since 2006) and Legg Mason & Co. predecessors (prior to 2006) |
| |
Susan Kerr Legg Mason 620 Eighth Avenue, 49th Floor, New York, NY 10018 | | |
| Year of birth | | 1949 |
| Position(s) held with Fund | | Chief Anti-Money Laundering Compliance Officer |
| Term of office1 and length of time served2 | | Since 2013 |
| Principal occupation(s) during past five years | | Assistant Vice President of Legg Mason & Co. and Legg Mason Investor Services, LLC (“LMIS”) (since 2010); Chief Anti-Money Laundering Compliance Officer of certain mutual funds associated with Legg Mason & Co. or its affiliates (since 2013) and Anti-Money Laundering Compliance Officer of LMIS (since 2012); Senior Compliance Officer of LMIS (since 2011); formerly, AML Consultant, DTCC (2010); formerly, AML Consultant, Rabobank Netherlands, (2009); formerly, First Vice President, Director of Marketing & Advertising Compliance and Manager of Communications Review Group at Citigroup Inc. (1996 to 2008) |
| |
Jenna Bailey Legg Mason 100 First Stamford Place, 6th Floor, Stamford, CT 06902 | | |
| Year of birth | | 1978 |
| Position(s) held with Fund | | Identity Theft Prevention Officer |
| Term of office1 and length of time served2 | | Since 2015 |
| Principal occupation(s) during past five years | | Identity Theft Prevention Officer of certain mutual funds associated with Legg Mason & Co. or its affiliates (since 2015); Compliance Officer of Legg Mason & Co. (since 2013); Assistant Vice President of Legg Mason & Co. (since 2011); formerly, Associate Compliance Officer of Legg Mason & Co. (2011 to 2013); formerly, Risk Manager of U.S. Distribution of Legg Mason & Co. (2007 to 2011) |
| | |
| Western Asset High Yield Fund | | 67 |
Additional information (unaudited) (cont’d)
Information about Directors and Officers
| † | Directors who are not “interested persons” of the Fund within the meaning of section 2(a)(19) of the Investment Company Act of 1940, as amended (the “1940 Act”). |
| 1 | Each Director and officer serves until his or her respective successor has been duly elected and qualified or until his or her earlier death, resignation, retirement or removal. |
| 2 | Indicates the earliest year in which the Director became a board member for a fund in the Legg Mason fund complex or the officer took such office. |
| 3 | In addition to overseeing the 7 funds of the Corporation, each Director also serves as a Director of Western Asset Income Fund and a Trustee of Western Asset Premier Bond Fund (closed-end investment companies), which are considered part of the same Fund Complex as the Corporation. |
| 4 | Mr. Olson is an “interested person” (as defined above) of the Fund because his law firm has provided legal services to WAM. |
| 5 | Each officer of the Fund is an “interested person” (as defined above) of the Fund. |
| | |
| 68 | | Western Asset High Yield Fund |
Important tax information (unaudited)
The following information is provided with respect to the distributions paid during the taxable year ended May 31, 2016:
| | | | | | | | | | | | |
| Record date: | | | Daily | | | | Daily | | | | Daily | |
| Payable date: | | | June 2015 | | |
| July 2015 to
December 2015 |
| |
| January 2016 to
May 2016 |
|
| Ordinary income: | | | | | | | | | | | | |
Qualified dividend income for individuals | | | 1.46 | % | | | 1.47 | % | | | 1.42 | % |
Dividends qualifying for the dividends | | | | | | | | | | | | |
received deduction for corporations | | | 1.46 | % | | | 1.47 | % | | | 1.42 | % |
Please retain this information for your records.
| | |
| Western Asset High Yield Fund | | 69 |
Western Asset
High Yield Fund
Directors
Robert Abeles, Jr.
Anita L. DeFrantz
Ronald L. Olson
Avedick B. Poladian
William E. B. Siart,
Chairman
Jaynie M. Studenmund
Investment manager
Legg Mason Partners Fund Advisor, LLC
Subadviser
Western Asset Management Company
Transfer agent
BNY Mellon Investment Servicing (US) Inc.
4400 Computer Drive
Westborough, MA 01581
Custodian
State Street Bank and Trust Company
Independent registered public accounting firm
PricewaterhouseCoopers LLP
Baltimore, MD
Western Asset High Yield Fund
The Fund is a separate investment series of Western Asset Funds, Inc.
Western Asset High Yield Fund
Legg Mason Funds
620 Eighth Avenue, 49th Floor
New York, NY 10018
The Fund files its complete schedule of portfolio holdings with the Securities and Exchange Commission (“SEC”) for the first and third quarters of each fiscal year on Form N-Q. The Fund’s Forms N-Q are available on the SEC’s website at www.sec.gov. The Fund’s Forms N-Q may be reviewed and copied at the SEC’s Public Reference Room in Washington, D.C., and information on the operation of the Public Reference Room may be obtained by calling 1-800-SEC-0330. To obtain information on Form N-Q, shareholders can call the Fund at 1-877-721-1926.
Information on how the Fund voted proxies relating to portfolio securities during the prior 12-month period ended June 30th of each year and a description of the policies and procedures that the Fund uses to determine how to vote proxies related to portfolio transactions are available (1) without charge, upon request, by calling the Fund at 1-877-721-1926, (2) at www.leggmason.com/mutualfunds and (3) on the SEC’s website at www.sec.gov.
This report is submitted for the general information of the shareholders of Western Asset High Yield Fund. This report is not authorized for distribution to prospective investors in the Fund unless preceded or accompanied by a current prospectus.
Investors should consider the Fund’s investment objectives, risks, charges and expenses carefully before investing. The prospectus contains this and other important information about the Fund. Please read the prospectus carefully before investing.
www.leggmason.com
© 2016 Legg Mason Investor Services, LLC
Member FINRA, SIPC
Legg Mason Funds Privacy and Security Notice
Your Privacy and the Security of Your Personal Information is Very Important to the Legg Mason Funds
This Privacy and Security Notice (the “Privacy Notice”) addresses the Legg Mason Funds’ privacy and data protection practices with respect to nonpublic personal information the Funds receive. The Legg Mason Funds include any funds sold by the Funds’ distributor, Legg Mason Investor Services, LLC, as well as Legg Mason-sponsored closed-end funds and certain closed-end funds managed or sub-advised by Legg Mason or its affiliates. The provisions of this Privacy Notice apply to your information both while you are a shareholder and after you are no longer invested with the Funds.
The Type of Nonpublic Personal Information the Funds Collect About You
The Funds collect and maintain nonpublic personal information about you in connection with your shareholder account. Such information may include, but is not limited to:
| • | | Personal information included on applications or other forms; |
| • | | Account balances, transactions, and mutual fund holdings and positions; |
| • | | Online account access user IDs, passwords, security challenge question responses; and |
| • | | Information received from consumer reporting agencies regarding credit history and creditworthiness (such as the amount of an individual’s total debt, payment history, etc.). |
How the Funds Use Nonpublic Personal Information About You
The Funds do not sell or share your nonpublic personal information with third parties or with affiliates for their marketing purposes, or with other financial institutions or affiliates for joint marketing purposes, unless you have authorized the Funds to do so. The Funds do not disclose any nonpublic personal information about you except as may be required to perform transactions or services you have authorized or as permitted or required by law. The Funds may disclose information about you to:
| • | | Employees, agents, and affiliates on a “need to know” basis to enable the Funds to conduct ordinary business or comply with obligations to government regulators; |
| • | | Service providers, including the Funds’ affiliates, who assist the Funds as part of the ordinary course of business (such as printing, mailing services, or processing or servicing your account with us) or otherwise perform services on the Funds’ behalf, including companies that may perform marketing services solely for the Funds; |
| • | | The Funds’ representatives such as legal counsel, accountants and auditors; and |
| • | | Fiduciaries or representatives acting on your behalf, such as an IRA custodian or trustee of a grantor trust. |
|
| NOT PART OF THE ANNUAL REPORT |
Legg Mason Funds Privacy and Security Notice (cont’d)
Except as otherwise permitted by applicable law, companies acting on the Funds’ behalf are contractually obligated to keep nonpublic personal information the Funds provide to them confidential and to use the information the Funds share only to provide the services the Funds ask them to perform.
The Funds may disclose nonpublic personal information about you when necessary to enforce their rights or protect against fraud, or as permitted or required by applicable law, such as in connection with a law enforcement or regulatory request, subpoena, or similar legal process. In the event of a corporate action or in the event a Fund service provider changes, the Funds may be required to disclose your nonpublic personal information to third parties. While it is the Funds’ practice to obtain protections for disclosed information in these types of transactions, the Funds cannot guarantee their privacy policy will remain unchanged.
Keeping You Informed of the Funds’ Privacy and Security Practices
The Funds will notify you annually of their privacy policy as required by federal law. While the Funds reserve the right to modify this policy at any time they will notify you promptly if this privacy policy changes.
The Funds’ Security Practices
The Funds maintain appropriate physical, electronic and procedural safeguards designed to guard your nonpublic personal information. The Funds’ internal data security policies restrict access to your nonpublic personal information to authorized employees, who may use your nonpublic personal information for Fund business purposes only.
Although the Funds strive to protect your nonpublic personal information, they cannot ensure or warrant the security of any information you provide or transmit to them, and you do so at your own risk. In the event of a breach of the confidentiality or security of your nonpublic personal information, the Funds will attempt to notify you as necessary so you can take appropriate protective steps. If you have consented to the Funds using electronic communications or electronic delivery of statements, they may notify you under such circumstances using the most current email address you have on record with them.
In order for the Funds to provide effective service to you, keeping your account information accurate is very important. If you believe that your account information is incomplete, not accurate or not current, or if you have questions about the Funds’ privacy practices, write the Funds using the contact information on your account statements, email the Funds by clicking on the Contact Us section of the Funds’ website at www.leggmason.com, or contact the Fund at 1-877-721-1926.
|
| NOT PART OF THE ANNUAL REPORT |
Western Asset Management Company
Legg Mason, Inc. Subsidiaries
www.leggmason.com
© 2016 Legg Mason Investor Services, LLC Member FINRA, SIPC
WASX013141 7/16 SR16-2824
The registrant has adopted a code of ethics that applies to the registrant’s principal executive officer, principal financial officer, principal accounting officer or controller.
| ITEM 3. | AUDIT COMMITTEE FINANCIAL EXPERT. |
The Board of Directors of the registrant has determined that Mr. Robert Abeles, Jr., possesses the technical attributes identified in Instruction 2(b) of Item 3 to Form N-CSR to qualify as “audit committee financial expert,” and have designated Mr. Abeles as the Audit Committee’s financial expert. Mr. Abeles is “independent” Directors pursuant to paragraph (a) (2) of Item 3 to Form N-CSR.
| ITEM 4. | PRINCIPAL ACCOUNTANT FEES AND SERVICES |
a) Audit Fees. The aggregate fees billed in the last two fiscal years ending May 31, 2015 and May 31, 2016 (the “Reporting Periods”) for professional services rendered by the Registrant’s principal accountant (the “Auditor”) for the audit of the Registrant’s annual financial statements, or services that are normally provided by the Auditor in connection with the statutory and regulatory filings or engagements for the Reporting Periods, were $121,110 in May 31, 2015 and $137,485 in May 31, 2016.
b) Audit-Related Fees. The aggregate fees billed in the Reporting Period for assurance and related services by the Auditor that are reasonably related to the performance of the Registrant’s financial statements were $1,500 in May 31, 2015 and $0 in May 31, 2016.
In addition, there were no Audit-Related Fees billed in the Reporting Period for assurance and related services by the Auditor to the Registrant’s investment adviser (not including any sub-adviser whose role is primarily portfolio management and is subcontracted with or overseen by another investment adviser), and any entity controlling, controlled by or under common control with the investment adviser that provides ongoing services to the Western Asset Funds, Inc. (“service affiliates”), that were reasonably related to the performance of the annual audit of the service affiliates. Accordingly, there were no such fees that required pre-approval by the Audit Committee for the Reporting Periods.
(c) Tax Fees. The aggregate fees billed in the Reporting Periods for professional services rendered by the Auditor for tax compliance, tax advice and tax planning (“Tax Services”) were $48,684 in May 31, 2015 and $18,218 in May 31, 2016. These services consisted of (i) review or preparation of U.S. federal, state, local and excise tax returns; (ii) U.S. federal, state and local tax planning, advice and assistance regarding statutory, regulatory or administrative developments, and (iii) tax advice regarding tax qualification matters and/or treatment of various financial instruments held or proposed to be acquired or held.
There were no fees billed for tax services by the Auditors to service affiliates during the Reporting Periods that required pre-approval by the Audit Committee.
d) All Other Fees. The aggregate other fees billed in the Reporting Periods for products and services provided by the Auditor were $997 in May 31, 2015 and $1,986 in May 31, 2016, other than the services reported in paragraphs (a) through (c) for the Item for the Western Asset Funds, Inc.
All Other Fees. There were no other non-audit services rendered by the Auditor to Legg Mason Partners Fund Advisors, LLC (“LMPFA”), and any entity controlling, controlled by or under common control with LMPFA that provided ongoing services to Western Asset Funds, Inc. requiring pre-approval by the Audit Committee in the Reporting Period.
(e) Audit Committee’s pre–approval policies and procedures described in paragraph (c)(7) of Rule 2-01 of Regulation S-X.
(1) The Charter for the Audit Committee (the “Committee”) of the Board of each registered investment company (the “Fund”) advised by LMPFA or one of their affiliates (each, an “Adviser”) requires that the Committee shall approve (a) all audit and permissible non-audit services to be provided to the Fund and (b) all permissible non-audit services to be provided by the Fund’s independent auditors to the Adviser and any Covered Service Providers if the engagement relates directly to the operations and financial reporting of the Fund. The Committee may implement policies and procedures by which such services are approved other than by the full Committee.
The Committee shall not approve non-audit services that the Committee believes may impair the independence of the auditors. As of the date of the approval of this Audit Committee Charter, permissible non-audit services include any professional services (including tax services), that are not prohibited services as described below, provided to the Fund by the independent auditors, other than those provided to the Fund in connection with an audit or a review of the financial statements of the Fund. Permissible non-audit services may not include: (i) bookkeeping or other services related to the accounting records or financial statements of the Fund; (ii) financial information systems design and implementation; (iii) appraisal or valuation services, fairness opinions or contribution-in-kind reports; (iv) actuarial services; (v) internal audit outsourcing services; (vi) management functions or human resources; (vii) broker or dealer, investment adviser or investment banking services; (viii) legal services and expert services unrelated to the audit; and (ix) any other service the Public Company Accounting Oversight Board determines, by regulation, is impermissible.
Pre-approval by the Committee of any permissible non-audit services is not required so long as: (i) the aggregate amount of all such permissible non-audit services provided to the Fund, the Adviser and any service providers controlling, controlled by or under common control with the Adviser that provide ongoing services to the Fund (“Covered Service Providers”) constitutes not more than 5% of the total amount of revenues paid to the independent auditors during the fiscal year in which the permissible non-audit services are provided to (a) the Fund, (b) the Adviser and (c) any entity controlling, controlled by or under common control with the Adviser that provides ongoing services to the Fund during the fiscal year in which the services are provided that would have to be approved by the Committee; (ii) the permissible non-audit services were not recognized by the Fund at the time of the engagement to be non-audit services; and (iii) such services are promptly brought to the attention of the Committee and approved by the Committee (or its delegate(s)) prior to the completion of the audit.
(2) For the Western Asset Funds, Inc., the percentage of fees that were approved by the audit committee, with respect to: Audit-Related Fees were 100% and 100% for May 31, 2015 and May 31, 2016; Tax Fees were 100% and 100% for May 31, 2015 and May 31, 2016; and Other Fees were 100% and 100% for May 31, 2015 and May 31, 2016.
(f) N/A
(g) Non-audit fees billed by the Auditor for services rendered to Western Asset Funds, Inc., LMPFA and any entity controlling, controlled by, or under common control with LMPFA that provides ongoing services to Western Asset Funds, Inc. during the reporting period were $170,028 in May 31, 2015 and $226,336 in May 31, 2016.
(h) Yes. Western Asset Funds, Inc.’s Audit Committee has considered whether the provision of non-audit services that were rendered to Service Affiliates, which were not pre-approved (not requiring pre-approval), is compatible with maintaining the Accountant’s independence. All services provided by the Auditor to the Western Asset Funds, Inc. or to Service Affiliates, which were required to be pre-approved, were pre-approved as required.
| ITEM 5. | AUDIT COMMITTEE OF LISTED REGISTRANTS. |
| | a) | The independent board members are acting as the registrant’s audit committee as specified in Section 3(a)(58)(B) of the Exchange Act. The Audit Committee consists of the following Board members: |
Robert Abeles, Jr.
Anita L. DeFrantz
Ronald L. Olson
Avedick B. Poladian
William E.B. Siart
Jaynie Miller Studenmund
| ITEM 6. | SCHEDULE OF INVESTMENTS. |
Included herein under Item 1.
| ITEM 7. | DISCLOSURE OF PROXY VOTING POLICIES AND PROCEDURES FOR CLOSED-END MANAGEMENT INVESTMENT COMPANIES. |
Not applicable.
| ITEM 8. | PORTFOLIO MANAGERS OF CLOSED-END MANAGEMENT INVESTMENT COMPANIES. |
Not applicable.
| ITEM 9. | PURCHASES OF EQUITY SECURITIES BY CLOSED-END MANAGEMENT INVESTMENT COMPANY AND AFFILIATED PURCHASERS. |
Not applicable.
| ITEM 10. | SUBMISSION OF MATTERS TO A VOTE OF SECURITY HOLDERS. |
Not applicable.
| ITEM 11. | CONTROLS AND PROCEDURES. |
| | (a) | The registrant’s principal executive officer and principal financial officer have concluded that the registrant’s disclosure controls and procedures (as defined in Rule 30a- 3(c) under the Investment Company Act of 1940, as amended (the “1940 Act”)) are effective as of a date within 90 days of the filing date of this report that includes the disclosure required by this paragraph, based on their evaluation of the disclosure controls and procedures required by Rule 30a-3(b) under the 1940 Act and 15d-15(b) under the Securities Exchange Act of 1934. |
| | (b) | There were no changes in the registrant’s internal control over financial reporting (as defined in Rule 30a-3(d) under the 1940 Act) that occurred during the second fiscal quarter of the period covered by this report that have materially affected, or are likely to materially affect the registrant’s internal control over financial reporting. |
(a) (1) Code of Ethics attached hereto.
Exhibit 99.CODE ETH
(a) (2) Certifications pursuant to section 302 of the Sarbanes-Oxley Act of 2002 attached hereto.
Exhibit 99.CERT
(b) Certifications pursuant to Section 906 of the Sarbanes-Oxley Act of 2002 attached hereto.
Exhibit 99.906CERT
SIGNATURES
Pursuant to the requirements of the Securities Exchange Act of 1934 and the Investment Company Act of 1940, the registrant has duly caused this Report to be signed on its behalf by the undersigned, there unto duly authorized.
| | |
| Western Asset Funds, Inc. |
| |
| By: | | /s/ Jane Trust |
| | Jane Trust |
| | Chief Executive Officer |
| |
| Date: | | July 22, 2016 |
Pursuant to the requirements of the Securities Exchange Act of 1934 and the Investment Company Act of 1940, this report has been signed below by the following persons on behalf of the registrant and in the capacities and on the dates indicated.
| | |
| By: | | /s/ Jane Trust |
| | Jane Trust |
| | Chief Executive Officer |
| |
| Date: | | July 22, 2016 |
| |
| By: | | /s/ Richard F. Sennett |
| | Richard F. Sennett |
| | Principal Financial Officer |
| |
| Date: | | July 22, 2016 |