UNITED STATES
SECURITIES AND EXCHANGE COMMISSION
Washington, D.C. 20549
FORM N-CSR
CERTIFIED SHAREHOLDER REPORT OF REGISTERED
MANAGEMENT INVESTMENT COMPANIES
Investment Company Act file number 811-06110
Western Asset Funds, Inc.
(Exact name of registrant as specified in charter)
620 Eighth Avenue, 49th Floor, New York, NY 10018
(Address of principal executive offices) (Zip code)
Robert I. Frenkel, Esq.
Legg Mason & Co., LLC
100 First Stamford Place
Stamford, CT 06902
(Name and address of agent for service)
Registrant’s telephone number, including area code: 1-877-721-1926
Date of fiscal year end: December 31
Date of reporting period: June 30, 2016
| | |
| ITEM 1. | | REPORT TO STOCKHOLDERS. |
The Semi-Annual Report to Stockholders is filed herewith.

| | |
| Semi-Annual Report | | June 30, 2016 |
WESTERN ASSET
INFLATION INDEXED PLUS BOND FUND

|
| INVESTMENT PRODUCTS: NOT FDIC INSURED • NO BANK GUARANTEE • MAY LOSE VALUE |
Fund objective
The Fund seeks to maximize total return, consistent with preservation of capital.
Letter from the president

Dear Shareholder,
We are pleased to provide the semi-annual report of Western Asset Inflation Indexed Plus Bond Fund for the six-month reporting period ended June 30, 2016. Please read on for Fund performance information and a detailed look at prevailing economic and market conditions during the Fund’s reporting period.
Special shareholder notice
Effective August 1, 2016, the individuals responsible for day-to-day portfolio management, development of investment strategy, oversight and coordination of the Fund are S. Kenneth Leech and Frederick R. Marki. Mr. Leech has been a part of the portfolio management team for the Fund since 2014. Mr. Marki joined the Fund’s portfolio management team in August 2016. These investment professionals, both of whom are employed by Western Asset Management Company (“Western Asset”), work together with a broader investment management team. For additional information, please see the prospectus supplement dated July 19, 2016.
As always, we remain committed to providing you with excellent service and a full spectrum of investment choices. We also remain committed to supplementing the support you receive from your financial advisor. One way we accomplish this is through our website, www.leggmason.com. Here you can gain immediate access to market and investment information, including:
| • | | Fund prices and performance, |
| • | | Market insights and commentaries from our portfolio managers, and |
| • | | A host of educational resources. |
| | |
| II | | Western Asset Inflation Indexed Plus Bond Fund |
We look forward to helping you meet your financial goals.
Sincerely,

Jane Trust, CFA
President and Chief Executive Officer
July 29, 2016
| | |
| Western Asset Inflation Indexed Plus Bond Fund | | III |
Investment commentary
Economic review
The pace of U.S. economic activity fluctuated during the six months ended June 30, 2016 (the “reporting period”). Looking back, the U.S. Department of Commerce’s revised figures showed that fourth quarter 2015 U.S. gross domestic product (“GDP”)i growth was 0.9%. First quarter 2016 GDP growth then decelerated to 0.8%. The U.S. Department of Commerce’s initial reading for second quarter 2016 GDP growth — released after the reporting period ended — was 1.2%. The improvement in GDP growth in the second quarter reflected an acceleration in personal consumption expenditures (“PCE”), an upturn in exports and smaller decreases in nonresidential fixed investment and in federal government spending.
While there was a pocket of weakness in May 2016, job growth in the U.S. was solid overall and a tailwind for the economy during the reporting period. When the period ended in June 2016, unemployment was 4.9%, as reported by the U.S. Department of Labor. The percentage of longer-term unemployed also declined over the period. In June 2016, 25.8% of Americans looking for a job had been out of work for more than six months, versus 26.9% when the period began.
| | |
| IV | | Western Asset Inflation Indexed Plus Bond Fund |
Market review
Q. How did the Federal Reserve Board (the “Fed”)ii respond to the economic environment?
A. Looking back, after an extended period of maintaining the federal funds rateiii at a historically low range between zero and 0.25%, the Fed increased the rate at its meeting on December 16, 2015. This marked the first rate hike since 2006. In particular, the U.S. central bank raised the federal funds rate to a range between 0.25% and 0.50%. In its official statement after the December 2015 meeting, the Fed said, “The stance of monetary policy remains accommodative after this increase, thereby supporting further improvement in labor market conditions and a return to 2 percent inflation….The Committee expects that economic conditions will evolve in a manner that will warrant only gradual increases in the federal funds rate; the federal funds rate is likely to remain, for some time, below levels that are expected to prevail in the longer run.” At its meetings that concluded on January 27, 2016, March 16, 2016, April 27, 2016, June 15, 2016 and July 27, 2016 (after the reporting period ended), the Fed kept rates on hold.
Q. Did Treasury yields trend higher or lower during the six months ended June 30, 2016?
A. Both short- and long-term Treasury yields moved sharply lower during the six months ended June 30, 2016. Two-year Treasury yields fell from a peak of 1.06% at the beginning of the period to a low of 0.58% at the end of the period. Ten-year Treasury yields began the reporting period at a peak of 2.27% and ended the period at 1.49%. Their low of 1.46% occurred on June 27 and June 28, 2016.
Q. What factors impacted the spread sectors (non-Treasuries) during the reporting period?
A. The spread sectors generally posted positive results during the reporting period. Performance fluctuated with investor sentiment given signs of moderating global growth, shifting expectations for future Fed monetary policy, the U.K. referendum to leave the European Union (“Brexit”) and several geopolitical issues. The broad U.S. bond market, as measured by the Barclays U.S. Aggregate Indexiv, gained 5.31% during the six months ended June 30, 2016. Higher risk segments of the market generated the best returns during the reporting period.
Q. What was the inflationary environment during the reporting period?
A. Inflation remained relatively modest during the reporting period. For the six months ended June 30, 2016, the seasonally unadjusted rate of inflation, as measured by the Consumer Price Index for All Urban Consumers (“CPI-U”)v, was 1.91%. The CPI-U less food and energy was 1.66% over the same period. Inflation-protected securities generated strong results during the reporting period. During the six months ended June 30, 2016, the Barclays U.S. TIPS Indexvi gained 5.37%.
Q. How did the high-yield bond market perform over the six months ended June 30, 2016?
A. The U.S. high-yield bond market, as measured by the Barclays U.S. Corporate High Yield — 2% Issuer Cap Indexvii, gained 9.06% for the six months ended June 30, 2016. The high-yield market was weak during the first month of the reporting period, due to falling oil prices and poor investor
| | |
| Western Asset Inflation Indexed Plus Bond Fund | | V |
Investment commentary (cont’d)
demand. After stabilizing in February 2016, the high-yield market rallied sharply over the last four months of the reporting period. This turnaround occurred as oil prices rebounded and the Fed reduced its expectations for rate hikes in 2016.
Performance review
For the six months ended June 30, 2016, Class I shares of Western Asset Inflation Indexed Plus Bond Fund returned 4.59%. The Fund’s unmanaged benchmark, the Barclays U.S. TIPS Index, returned 6.24% for the same period. The Lipper Inflation Protected Bond Funds Category Average1 returned 5.23% over the same time frame.
| | | | |
Performance Snapshot as of June 30, 2016
(unaudited) | |
| (excluding sales charges) | | 6 months | |
Western Asset Inflation Indexed Plus Bond Fund: | | | | |
Class A | | | 4.43 | % |
Class C | | | 4.15 | % |
Class C1 | | | 4.11 | % |
Class FI | | | 4.37 | % |
Class R | | | 4.29 | % |
Class I | | | 4.59 | % |
Class IS | | | 4.66 | % |
| Barclays U.S. TIPS Index | | | 6.24 | % |
| Lipper Inflation Protected Bond Funds Category Average1 | | | 5.23 | % |
The performance shown represents past performance. Past performance is no guarantee of future results and current performance may be higher or lower than the performance shown above. Principal value, investment returns and yields will fluctuate and investors’ shares, when redeemed, may be worth more or less than their original cost. To obtain performance data current to the most recent month-end, please visit our website at www.leggmason.com/mutualfunds.
All share class returns assume the reinvestment of all distributions, including returns of capital, if any, at net asset value and the deduction of all Fund expenses. Returns have not been adjusted to include sales charges that may apply or the deduction of taxes that a shareholder would pay on Fund distributions. If sales charges were reflected, the performance quoted would be lower. Performance figures for periods shorter than one year represent cumulative figures and are not annualized.
The 30-Day SEC Yields for the period ended June 30, 2016 for Class A, Class C, Class C1, Class FI, Class R, Class I and Class IS shares were 3.92%, 3.44%, 3.66%, 4.00%, 3.76%, 4.42% and 4.53%, respectively. The 30-Day SEC Yield is subject to change and is based on the yield to maturity of the Fund’s investments over a 30-day period and not on the dividends paid by the Fund, which may differ. The 30-Day SEC Yield includes adjustments for inflation to both U.S. and foreign portfolio securities that are linked to inflation indices. Please note, inflation adjustments to U.S. securities often occur at different intervals than foreign securities. These adjustments can cause the SEC Yield to change substantially from month-to-month. Increases in the inflation rate may result in the Fund reporting an exceptionally high yield which may not be repeated.
| | | | |
| Total Annual Operating Expenses (unaudited) |
As of the Fund’s current prospectus dated May 1, 2016, the gross total annual operating expense ratios for Class A, Class C, Class C1, Class FI, Class R, Class I and Class IS shares were 0.65%, 1.30%, 1.10%, 0.64%, 0.99%, 0.38% and 0.25%, respectively.
| 1 | Lipper, Inc., a wholly-owned subsidiary of Reuters, provides independent insight on global collective investments. Returns are based on the six-month period ended June 30, 2016, including the reinvestment of all distributions, including returns of capital, if any, calculated among the 251 funds in the Fund’s Lipper category, and excluding sales charges. |
| | |
| VI | | Western Asset Inflation Indexed Plus Bond Fund |
Actual expenses may be higher. For example, expenses may be higher than those shown if average net assets decrease. Net assets are more likely to decrease and Fund expense ratios are more likely to increase when markets are volatile.
As always, thank you for your confidence in our stewardship of your assets.
Sincerely,
Jane Trust, CFA
President and Chief Executive Officer
July 29, 2016
RISKS: Fixed-income securities involve interest rate, credit, inflation and reinvestment risks. As interest rates rise, the value of fixed-income securities falls. Derivatives, such as options, futures and swaps, can be illiquid, may disproportionately increase losses, and have a potentially large impact on Fund performance. The use of leverage may increase volatility and possibility of loss. Risks of high-yield securities (commonly known as “junk” bonds) include greater price volatility, illiquidity and possibility of default. The Fund may be subject to interest rate, income and deflation risks. Changes in inflation will cause the Fund’s income to fluctuate, sometimes substantially. Periods of deflation may adversely affect the Fund’s net asset value. International investments are subject to special risks including currency fluctuations and social, economic and political uncertainties, which could increase volatility. These risks are magnified in emerging markets. Asset-backed, mortgage-backed or mortgage related securities are subject to prepayment and extension risks. Please see the Fund’s prospectus for a more complete discussion of these and other risks, and the Fund’s investment strategies.
All investments are subject to risk including the possible loss of principal. Past performance is no guarantee of future results. All index performance reflects no deduction for fees, expenses or taxes. Please note that an investor cannot invest directly in an index.
The information provided is not intended to be a forecast of future events, a guarantee of future results or investment advice. Views expressed may differ from those of the firm as a whole.
| i | Gross domestic product (“GDP”) is the market value of all final goods and services produced within a country in a given period of time. |
| ii | The Federal Reserve Board (the “Fed”) is responsible for the formulation of U.S. policies designed to promote economic growth, full employment, stable prices and a sustainable pattern of international trade and payments. |
| iii | The federal funds rate is the rate charged by one depository institution on an overnight sale of immediately available funds (balances at the Fed) to another depository institution; the rate may vary from depository institution to depository institution and from day to day. |
| iv | The Barclays U.S. Aggregate Index is a broad-based bond index comprised of government, corporate, mortgage- and asset-backed issues, rated investment grade or higher, and having at least one year to maturity. |
| v | The Consumer Price Index for All Urban Consumers (“CPI-U”) is a measure of the average change in prices over time of goods and services purchased by households, which covers approximately 87% of the total population and includes, in addition to wage earners and clerical worker households, groups such as professional, managerial and technical workers, the self-employed, short-term workers, the unemployed and retirees and others not in the labor force. |
| vi | The Barclays U.S. TIPS Index represents an unmanaged market index made up of U.S. Treasury Inflation-Linked Index securities. |
| vii | The Barclays U.S. Corporate High Yield — 2% Issuer Cap Index is an index of the 2% Issuer Cap component of the Barclays U.S. Corporate High Yield Index, which covers the U.S. dollar-denominated, non-investment grade, fixed-rate, taxable corporate bond market. |
| | |
| Western Asset Inflation Indexed Plus Bond Fund | | VII |
Fund at a glance† (unaudited)
Investment breakdown (%) as a percent of total investments
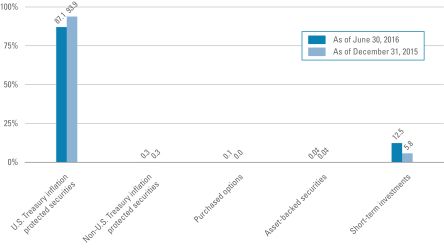
| † | The bar graph above represents the composition of the Fund’s investments as of June 30, 2016 and December 31, 2015 and does not include derivatives, such as futures contracts, written options and forward foreign currency contracts. The Fund is actively managed. As a result, the composition of the Fund’s investments is subject to change at any time. |
| ‡ | Represents less than 0.1%. |
| | |
| Western Asset Inflation Indexed Plus Bond Fund 2016 Semi-Annual Report | | 1 |
Fund expenses (unaudited)
Example
As a shareholder of the Fund, you may incur two types of costs: (1) transaction costs, including front-end and back-end sales charges (loads) on purchase payments; and (2) ongoing costs, including management fees; service and/or distribution (12b-1) fees; and other Fund expenses. This example is intended to help you understand your ongoing costs (in dollars) of investing in the Fund and to compare these costs with the ongoing costs of investing in other mutual funds.
This example is based on an investment of $1,000 invested on January 1, 2016 and held for the six months ended June 30, 2016.
Actual expenses
The table below titled “Based on Actual Total Return” provides information about actual account values and actual expenses. You may use the information provided in this table, together with the amount you invested, to estimate the expenses that you paid over the period. To estimate the expenses you paid on your account, divide your ending account value by $1,000 (for example, an $8,600 ending account value divided by $1,000 = 8.6), then multiply the result by the number under the heading entitled “Expenses Paid During the Period”.
Hypothetical example for comparison purposes
The table below titled “Based on Hypothetical Total Return” provides information about hypothetical account values and hypothetical expenses based on the actual expense ratio and an assumed rate of return of 5.00% per year before expenses, which is not the Fund’s actual return. The hypothetical account values and expenses may not be used to estimate the actual ending account balance or expenses you paid for the period. You may use the information provided in this table to compare the ongoing costs of investing in the Fund and other funds. To do so, compare the 5.00% hypothetical example relating to the Fund with the 5.00% hypothetical examples that appear in the shareholder reports of the other funds.
Please note that the expenses shown in the table below are meant to highlight your ongoing costs only and do not reflect any transactional costs, such as front-end or back-end sales charges (loads). Therefore, the table is useful in comparing ongoing costs only, and will not help you determine the relative total costs of owning different funds. In addition, if these transaction costs were included, your costs would have been higher.
| | | | | | | | | | | | | | | | | | | | | | | | | | | | | | | | | | | | | | | | | | | | | | |
| Based on actual total return1 | | | | | | Based on hypothetical total return1 | |
| | | Actual
Total Return
Without
Sales
Charge2 | | | Beginning
Account
Value | | | Ending
Account
Value | | | Annualized
Expense
Ratio | | | Expenses
Paid
During
the
Period3 | | | | | | | | Hypothetical
Annualized
Total Return | | | Beginning
Account
Value | | | Ending
Account
Value | | | Annualized
Expense
Ratio | | | Expenses
Paid
During
the
Period3 | |
| Class A | | | 4.43 | % | | $ | 1,000.00 | | | $ | 1,044.30 | | | | 0.68 | % | | $ | 3.46 | | | | | | | Class A | | | 5.00 | % | | $ | 1,000.00 | | | $ | 1,021.48 | | | | 0.68 | % | | $ | 3.42 | |
| Class C | | | 4.15 | | | | 1,000.00 | | | | 1,041.50 | | | | 1.30 | | | | 6.60 | | | | | | | Class C | | | 5.00 | | | | 1,000.00 | | | | 1,018.40 | | | | 1.30 | | | | 6.52 | |
| Class C1 | | | 4.11 | | | | 1,000.00 | | | | 1,041.10 | | | | 1.14 | | | | 5.79 | | | | | | | Class C1 | | | 5.00 | | | | 1,000.00 | | | | 1,019.19 | | | | 1.14 | | | | 5.72 | |
| Class FI | | | 4.37 | | | | 1,000.00 | | | | 1,043.70 | | | | 0.63 | | | | 3.20 | | | | | | | Class FI | | | 5.00 | | | | 1,000.00 | | | | 1,021.73 | | | | 0.63 | | | | 3.17 | |
| Class R | | | 4.29 | | | | 1,000.00 | | | | 1,042.90 | | | | 0.99 | | | | 5.03 | | | | | | | Class R | | | 5.00 | | | | 1,000.00 | | | | 1,019.94 | | | | 0.99 | | | | 4.97 | |
| Class I | | | 4.59 | | | | 1,000.00 | | | | 1,045.90 | | | | 0.37 | | | | 1.88 | | | | | | | Class I | | | 5.00 | | | | 1,000.00 | | | | 1,023.02 | | | | 0.37 | | | | 1.86 | |
| Class IS | | | 4.66 | | | | 1,000.00 | | | | 1,046.60 | | | | 0.26 | | | | 1.32 | | | | | | | Class IS | | | 5.00 | | | | 1,000.00 | | | | 1,023.57 | | | | 0.26 | | | | 1.31 | |
| | |
| 2 | | Western Asset Inflation Indexed Plus Bond Fund 2016 Semi-Annual Report |
| 1 | For the six months ended June 30, 2016. |
| 2 | Assumes the reinvestment of all distributions, including returns of capital, if any, at net asset value and does not reflect the deduction of the applicable sales charge with respect to Class A shares or the applicable contingent deferred sales charge (“CDSC”) with respect to Class C shares. Total return is not annualized, as it may not be representative of the total return for the year. Performance figures may reflect compensating balance arrangements, fee waivers and/or expense reimbursements. In the absence of compensating balance arrangements, fee waivers and/or expense reimbursements, the total return would have been lower. Past performance is no guarantee of future results. |
| 3 | Expenses (net of compensating balance arrangements, fee waivers and/or expense reimbursements) are equal to each class’ respective annualized expense ratio multiplied by the average account value over the period, multiplied by the number of days in the most recent fiscal half-year (182), then divided by 366. |
| | |
| Western Asset Inflation Indexed Plus Bond Fund 2016 Semi-Annual Report | | 3 |
Spread duration (unaudited)
Economic exposure — June 30, 2016
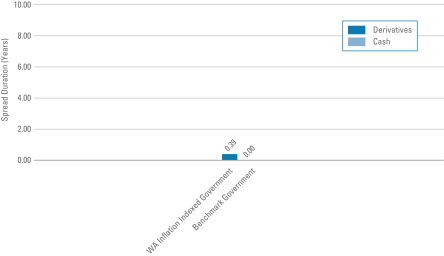
Spread duration measures the sensitivity to changes in spreads. The spread over Treasuries is the annual risk-premium demanded by investors to hold non-Treasury securities. Spread duration is quantified as the % change in price resulting from a 100 basis points change in spreads. For a security with positive spread duration, an increase in spreads would result in a price decline and a decline in spreads would result in a price increase. This chart highlights the market sector exposure of the Fund’s sectors relative to the selected benchmark sectors as of the end of the reporting period.
| | |
| Benchmark | | — Barclays U.S. TIPS Index |
| WA Inflation Indexed | | — Western Asset Inflation Indexed Plus Bond Fund |
| | |
| 4 | | Western Asset Inflation Indexed Plus Bond Fund 2016 Semi-Annual Report |
Effective duration (unaudited)
Interest rate exposure — June 30, 2016
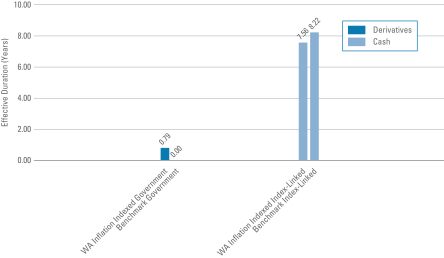
Effective duration measures the sensitivity to changes in relevant interest rates. Effective duration is quantified as the % change in price resulting from a 100 basis points change in interest rates. For a security with positive effective duration, an increase in interest rates would result in a price decline and a decline in interest rates would result in a price increase. This chart highlights the interest rate exposure of the Fund’s sectors relative to the selected benchmark sectors as of the end of the reporting period.
| | |
| Benchmark | | — Barclays U.S. TIPS Index |
| WA Inflation Indexed | | — Western Asset Inflation Indexed Plus Bond Fund |
| | |
| Western Asset Inflation Indexed Plus Bond Fund 2016 Semi-Annual Report | | 5 |
Schedule of investments (unaudited)
June 30, 2016
Western Asset Inflation Indexed Plus Bond Fund
| | | | | | | | | | | | | | | | |
| Security | | Rate | | | Maturity
Date | | | Face
Amount† | | | Value | |
| U.S. Treasury Inflation Protected Securities — 86.8% | | | | | | | | | | | | | | | | |
U.S. Treasury Bonds, Inflation Indexed | | | 2.375 | % | | | 1/15/25 | | | | 1,288,147 | | | $ | 1,538,043 | |
U.S. Treasury Bonds, Inflation Indexed | | | 1.750 | % | | | 1/15/28 | | | | 10,037,301 | | | | 11,734,368 | |
U.S. Treasury Bonds, Inflation Indexed | | | 3.625 | % | | | 4/15/28 | | | | 3,786,394 | | | | 5,238,635 | |
U.S. Treasury Bonds, Inflation Indexed | | | 2.500 | % | | | 1/15/29 | | | | 7,821,824 | | | | 9,910,494 | |
U.S. Treasury Bonds, Inflation Indexed | | | 3.875 | % | | | 4/15/29 | | | | 10,710,198 | | | | 15,426,027 | |
U.S. Treasury Bonds, Inflation Indexed | | | 3.375 | % | | | 4/15/32 | | | | 2,102,474 | | | | 3,079,030 | |
U.S. Treasury Bonds, Inflation Indexed | | | 2.125 | % | | | 2/15/40 | | | | 2,252,227 | | | | 2,944,407 | |
U.S. Treasury Bonds, Inflation Indexed | | | 2.125 | % | | | 2/15/41 | | | | 8,487,870 | | | | 11,196,808 | |
U.S. Treasury Bonds, Inflation Indexed | | | 0.750 | % | | | 2/15/42 | | | | 6,803,142 | | | | 6,816,517 | |
U.S. Treasury Bonds, Inflation Indexed | | | 0.625 | % | | | 2/15/43 | | | | 1,831,280 | | | | 1,782,421 | |
U.S. Treasury Bonds, Inflation Indexed | | | 1.375 | % | | | 2/15/44 | | | | 6,435,842 | | | | 7,439,852 | |
U.S. Treasury Bonds, Inflation Indexed | | | 0.750 | % | | | 2/15/45 | | | | 15,329,780 | | | | 15,395,054 | |
U.S. Treasury Bonds, Inflation Indexed | | | 1.000 | % | | | 2/15/46 | | | | 11,651,015 | | | | 12,578,238 | |
U.S. Treasury Notes, Inflation Indexed | | | 0.125 | % | | | 4/15/18 | | | | 13,308,557 | | | | 13,506,109 | |
U.S. Treasury Notes, Inflation Indexed | | | 2.125 | % | | | 1/15/19 | | | | 5,727,091 | | | | 6,143,943 | |
U.S. Treasury Notes, Inflation Indexed | | | 0.125 | % | | | 4/15/19 | | | | 29,065,877 | | | | 29,680,126 | |
U.S. Treasury Notes, Inflation Indexed | | | 1.875 | % | | | 7/15/19 | | | | 10,083,510 | | | | 10,910,146 | |
U.S. Treasury Notes, Inflation Indexed | | | 1.375 | % | | | 1/15/20 | | | | 5,531,300 | | | | 5,905,741 | |
U.S. Treasury Notes, Inflation Indexed | | | 0.125 | % | | | 4/15/20 | | | | 26,580,211 | | | | 27,190,040 | |
U.S. Treasury Notes, Inflation Indexed | | | 1.250 | % | | | 7/15/20 | | | | 11,109,707 | | | | 11,938,013 | |
U.S. Treasury Notes, Inflation Indexed | | | 1.125 | % | | | 1/15/21 | | | | 29,592,275 | | | | 31,650,625 | |
U.S. Treasury Notes, Inflation Indexed | | | 0.625 | % | | | 7/15/21 | | | | 17,672,310 | | | | 18,598,958 | |
U.S. Treasury Notes, Inflation Indexed | | | 0.125 | % | | | 1/15/22 | | | | 15,869,214 | | | | 16,173,379 | |
U.S. Treasury Notes, Inflation Indexed | | | 0.125 | % | | | 7/15/22 | | | | 8,956,725 | | | | 9,158,484 | |
U.S. Treasury Notes, Inflation Indexed | | | 0.125 | % | | | 1/15/23 | | | | 22,759,344 | | | | 23,061,019 | |
U.S. Treasury Notes, Inflation Indexed | | | 0.375 | % | | | 7/15/23 | | | | 18,215,274 | | | | 18,833,592 | |
U.S. Treasury Notes, Inflation Indexed | | | 0.625 | % | | | 1/15/24 | | | | 32,851,381 | | | | 34,392,571 | |
U.S. Treasury Notes, Inflation Indexed | | | 0.125 | % | | | 7/15/24 | | | | 19,041,561 | | | | 19,232,967 | |
U.S. Treasury Notes, Inflation Indexed | | | 0.250 | % | | | 1/15/25 | | | | 6,999,300 | | | | 7,105,927 | |
U.S. Treasury Notes, Inflation Indexed | | | 0.375 | % | | | 7/15/25 | | | | 9,906,121 | | | | 10,200,214 | |
U.S. Treasury Notes, Inflation Indexed | | | 0.625 | % | | | 1/15/26 | | | | 62,601,580 | | | | 65,921,593 | |
Total U.S. Treasury Inflation Protected Securities (Cost — $441,771,008) | | | | | | | | 464,683,341 | |
| Asset-Backed Securities — 0.0% | | | | | | | | | | | | | | | | |
Bear Stearns Asset-Backed Securities Trust, 2003-ABF1 A | | | 1.186 | % | | | 1/25/34 | | | | 43,040 | | | | 41,369 | (a) |
Chase Funding Mortgage Loan Asset-Backed Certificates, 2002-4 2A1 | | | 1.193 | % | | | 10/25/32 | | | | 51,766 | | | | 48,135 | (a) |
EMC Mortgage Loan Trust, 2003-B A1 | | | 0.996 | % | | | 11/25/41 | | | | 28,105 | | | | 26,586 | (a)(b) |
Total Asset-Backed Securities (Cost — $120,644) | | | | | | | | 116,090 | |
See Notes to Financial Statements.
| | |
| 6 | | Western Asset Inflation Indexed Plus Bond Fund 2016 Semi-Annual Report |
Western Asset Inflation Indexed Plus Bond Fund
| | | | | | | | | | | | | | | | |
| Security | | Rate | | | Maturity
Date | | | Face
Amount† | | | Value | |
| Non-U.S. Treasury Inflation Protected Securities — 0.3% | | | | | | | | | | | | | |
Canada — 0.3% | | | | | | | | | | | | | | | | |
Government of Canada, Bonds (Cost — $2,005,787) | | | 4.250 | % | | | 12/1/26 | | | | 1,446,093 | CAD | | $ | 1,632,481 | |
| | | | |
| | | | | | Expiration
Date | | | Contracts | | | | |
| Purchased Options — 0.1% | | | | | | | | | | | | | | | | |
U.S. Treasury 5-Year Notes Futures, Call @ $123.00 | | | | | | | 7/22/16 | | | | 556 | | | | 56,469 | |
U.S. Treasury 10-Year Notes Futures, Call @ $133.50 | | | | | | | 7/22/16 | | | | 370 | | | | 161,875 | |
U.S. Treasury 10-Year Notes Futures, Call @ $134.50 | | | | | | | 7/22/16 | | | | 186 | | | | 37,781 | |
Total Purchased Options (Cost — $273,685) | | | | | | | | | | | | | | | 256,125 | |
Total Investments before Short-Term Investments (Cost — $444,171,124) | | | | | | | | 466,688,037 | |
| | | | |
| | | | | | Maturity
Date | | | Face
Amount† | | | | |
| Short-Term Investments — 12.4% | | | | | | | | | | | | | | | | |
Repurchase Agreements — 5.6% | | | | | | | | | | | | | | | | |
Goldman Sachs & Co. repurchase agreement dated 6/30/16, Proceeds at maturity — $30,000,333; (Fully collateralized by U.S. government agency obligations, 1.985% due 9/29/21; Market Value — $30,621,034) (Cost — $30,000,000) | | | 0.400 | % | | | 7/1/16 | | | | 30,000,000 | | | | 30,000,000 | |
| | | | |
| | | | | | | | | Shares | | | | |
Money Market Funds — 6.8% | | | | | | | | | | | | | | | | |
State Street Institutional U.S. Government Money Market Fund, Premier Class (Cost — $36,598,092) | | | 0.238 | % | | | | | | | 36,598,092 | | | | 36,598,092 | |
Total Short-Term Investments (Cost — $66,598,092) | | | | | | | | | | | | | | | 66,598,092 | |
Total Investments — 99.6% (Cost — $510,769,216#) | | | | | | | | | | | | | | | 533,286,129 | |
Other Assets in Excess of Liabilities — 0.4% | | | | | | | | | | | | | | | 2,198,721 | |
Total Net Assets — 100.0% | | | | | | | | | | | | | | $ | 535,484,850 | |
| † | Face amount denominated in U.S. dollars, unless otherwise noted. |
| (a) | Variable rate security. Interest rate disclosed is as of the most recent information available. |
| (b) | Security is exempt from registration under Rule 144A of the Securities Act of 1933. This security may be resold in transactions that are exempt from registration, normally to qualified institutional buyers. This security has been deemed liquid pursuant to guidelines approved by the Board of Directors, unless otherwise noted. |
| # | Aggregate cost for federal income tax purposes is substantially the same. |
| | |
Abbreviation used in this schedule: |
| CAD | | — Canadian Dollar |
See Notes to Financial Statements.
| | |
| Western Asset Inflation Indexed Plus Bond Fund 2016 Semi-Annual Report | | 7 |
Statement of assets and liabilities (unaudited)
June 30, 2016
| | | | |
| |
| Assets: | | | | |
Investments, at value (Cost — $510,769,216) | | $ | 533,286,129 | |
Unrealized appreciation on forward foreign currency contracts | | | 2,053,490 | |
Interest receivable | | | 1,393,423 | |
Deposits with brokers for open futures contracts | | | 408,132 | |
Receivable for Fund shares sold | | | 234,025 | |
Receivable from broker — variation margin on open futures contracts | | | 76,890 | |
Prepaid expenses | | | 64,676 | |
Total Assets | | | 537,516,765 | |
| |
| Liabilities: | | | | |
Unrealized depreciation on forward foreign currency contracts | | | 1,483,728 | |
Payable for Fund shares repurchased | | | 342,647 | |
Investment management fee payable | | | 87,039 | |
Service and/or distribution fees payable | | | 7,465 | |
Directors’ fees payable | | | 4,721 | |
Accrued expenses | | | 106,315 | |
Total Liabilities | | | 2,031,915 | |
| Total Net Assets | | $ | 535,484,850 | |
| |
| Net Assets: | | | | |
Par value (Note 7) | | $ | 46,859 | |
Paid-in capital in excess of par value | | | 535,271,688 | |
Undistributed net investment income | | | 1,546,084 | |
Accumulated net realized loss on investments, futures contracts, written options and foreign currency transactions | | | (24,803,377) | |
Net unrealized appreciation on investments, futures contracts and foreign currencies | | | 23,423,596 | |
| Total Net Assets | | $ | 535,484,850 | |
See Notes to Financial Statements.
| | |
| 8 | | Western Asset Inflation Indexed Plus Bond Fund 2016 Semi-Annual Report |
| | | | |
| |
| Net Assets: | | | | |
Class A | | | $22,921,915 | |
Class C | | | $1,151,126 | |
Class C1 | | | $1,766,781 | |
Class FI | | | $1,480,967 | |
Class R | | | $1,305,499 | |
Class I | | | $98,782,402 | |
Class IS | | | $408,076,160 | |
| |
| Shares Outstanding: | | | | |
Class A | | | 2,027,560 | |
Class C | | | 104,193 | |
Class C1 | | | 158,442 | |
Class FI | | | 131,991 | |
Class R | | | 116,784 | |
Class I | | | 8,668,594 | |
Class IS | | | 35,651,066 | |
| |
| Net Asset Value: | | | | |
Class A (and redemption price) | | | $11.31 | |
Class C* | | | $11.05 | |
Class C1 (and redemption price) | | | $11.15 | |
Class FI (and redemption price) | | | $11.22 | |
Class R (and redemption price) | | | $11.18 | |
Class I (and redemption price) | | | $11.40 | |
Class IS (and redemption price) | | | $11.45 | |
| Maximum Public Offering Price Per Share: | | | | |
Class A (based on maximum initial sales charge of 4.25%) | | | $11.81 | |
| * | Redemption price per share is NAV of Class C shares reduced by a 1.00% CDSC, if shares are redeemed within one year from purchase payment (See Note 2). |
See Notes to Financial Statements.
| | |
| Western Asset Inflation Indexed Plus Bond Fund 2016 Semi-Annual Report | | 9 |
Statement of operations (unaudited)
For the Six Months Ended June 30, 2016
| | | | |
| |
| Investment Income: | | | | |
Interest | | $ | 2,986,894 | |
| |
| Expenses: | | | | |
Investment management fee (Note 2) | | | 553,757 | |
Transfer agent fees (Note 5) | | | 77,974 | |
Registration fees | | | 49,154 | |
Service and/or distribution fees (Notes 2 and 5) | | | 44,397 | |
Fund accounting fees | | | 29,905 | |
Audit and tax fees | | | 24,511 | |
Legal fees | | | 15,085 | |
Shareholder reports | | | 12,199 | |
Directors’ fees | | | 9,662 | |
Insurance | | | 4,517 | |
Commitment fees (Note 8) | | | 3,279 | |
Custody fees | | | 1,558 | |
Miscellaneous expenses | | | 8,572 | |
Total Expenses | | | 834,570 | |
| Net Investment Income | | | 2,152,324 | |
| |
Realized and Unrealized Gain (Loss) on Investments, Futures Contracts,
Written Options and Foreign Currency Transactions (Notes 1, 3 and 4): | | | | |
Net Realized Gain (Loss) From: | | | | |
Investment transactions | | | 1,117,342 | |
Futures contracts | | | (6,550,314) | |
Written options | | | 779,550 | |
Foreign currency transactions | | | (2,910,995) | |
Net Realized Loss | | | (7,564,417) | |
Change in Net Unrealized Appreciation (Depreciation) From: | | | | |
Investments | | | 29,185,262 | |
Futures contracts | | | 520,282 | |
Written options | | | 29,055 | |
Foreign currencies | | | 580,215 | |
Change in Net Unrealized Appreciation (Depreciation) | | | 30,314,814 | |
Net Gain on Investments, Futures Contracts, Written Options and Foreign
Currency Transactions | | | 22,750,397 | |
| Increase in Net Assets From Operations | | $ | 24,902,721 | |
See Notes to Financial Statements.
| | |
| 10 | | Western Asset Inflation Indexed Plus Bond Fund 2016 Semi-Annual Report |
Statements of changes in net assets
| | | | | | | | |
For the Six Months Ended June 30, 2016 (unaudited)
and the Year Ended December 31, 2015 | | 2016 | | | 2015 | |
| | |
| Operations: | | | | | | | | |
Net investment income | | $ | 2,152,324 | | | $ | 590,689 | |
Net realized loss | | | (7,564,417) | | | | (3,533,221) | |
Change in net unrealized appreciation (depreciation) | | | 30,314,814 | | | | (11,742,369) | |
Increase (Decrease) in Net Assets From Operations | | | 24,902,721 | | | | (14,684,901) | |
| | |
| Distributions to Shareholders From (Notes 1 and 6): | | | | | | | | |
Net investment income | | | — | | | | (1,090,466) | |
Return of capital | | | — | | | | (1,053,757) | |
Decrease in Net Assets From Distributions to Shareholders | | | — | | | | (2,144,223) | |
| | |
| Fund Share Transactions (Note 7): | | | | | | | | |
Net proceeds from sale of shares | | | 66,790,736 | | | | 296,980,533 | |
Reinvestment of distributions | | | — | | | | 2,065,400 | |
Cost of shares repurchased | | | (140,146,940) | | | | (267,007,137) | |
Increase (Decrease) in Net Assets From Fund Share Transactions | | | (73,356,204) | | | | 32,038,796 | |
Increase (Decrease) in Net Assets | | | (48,453,483) | | | | 15,209,672 | |
| | |
| Net Assets: | | | | | | | | |
Beginning of period | | | 583,938,333 | | | | 568,728,661 | |
End of period* | | $ | 535,484,850 | | | $ | 583,938,333 | |
*Includes undistributed (overdistributed) net investment income, respectively, of: | | | $1,546,084 | | | | $(606,240) | |
See Notes to Financial Statements.
| | |
| Western Asset Inflation Indexed Plus Bond Fund 2016 Semi-Annual Report | | 11 |
Financial highlights
| | | | | | | | | | | | | | | | | | | | |
For a share of each class of capital stock outstanding throughout each year ended December 31,
unless otherwise noted: | |
| Class A Shares1 | | 20162 | | | 2015 | | | 2014 | | | 2013 | | | 20123 | |
| | | | | |
| Net asset value, beginning of period | | | $10.83 | | | | $11.17 | | | | $11.08 | | | | $12.22 | | | | $12.10 | |
| | | | | |
| Income (loss) from operations: | | | | | | | | | | | | | | | | | | | | |
Net investment income (loss) | | | 0.04 | | | | (0.03) | | | | 0.10 | | | | 0.04 | | | | 0.20 | |
Net realized and unrealized gain (loss) | | | 0.44 | | | | (0.27) | | | | 0.18 | | | | (1.08) | | | | 0.23 | |
Total income (loss) from operations | | | 0.48 | | | | (0.30) | | | | 0.28 | | | | (1.04) | | | | 0.43 | |
| | | | | |
| Less distributions from: | | | | | | | | | | | | | | | | | | | | |
Net investment income | | | — | | | | (0.02) | | | | (0.19) | | | | (0.10) | | | | (0.16) | |
Net realized gains | | | — | | | | — | | | | (0.00) | 4 | | | — | | | | (0.15) | |
Return of capital | | | — | | | | (0.02) | | | | — | | | | — | | | | — | |
Total distributions | | | — | | | | (0.04) | | | | (0.19) | | | | (0.10) | | | | (0.31) | |
| | | | | |
| Net asset value, end of period | | | $11.31 | | | | $10.83 | | | | $11.17 | | | | $11.08 | | | | $12.22 | |
Total return5 | | | 4.43 | % | | | (2.72) | % | | | 2.53 | % | | | (8.52) | % | | | 3.56 | % |
| | | | | |
| Net assets, end of period (000s) | | | $22,922 | | | | $20,050 | | | | $16,401 | | | | $15,703 | | | | $26,958 | |
| | | | | |
| Ratios to average net assets: | | | | | | | | | | | | | | | | | | | | |
Gross expenses | | | 0.68 | %6 | | | 0.65 | % | | | 0.73 | % | | | 0.66 | % | | | 0.67 | %6 |
Net expenses7 | | | 0.68 | 6 | | | 0.65 | | | | 0.73 | | | | 0.66 | | | | 0.67 | 6 |
Net investment income (loss) | | | 0.67 | 6 | | | (0.27) | | | | 0.92 | | | | 0.33 | | | | 2.42 | 6 |
| | | | | |
| Portfolio turnover rate | | | 53 | % | | | 69 | % | | | 36 | % | | | 32 | % | | | 54 | % |
| 1 | Per share amounts have been calculated using the average shares method. |
| 2 | For the six months ended June 30, 2016 (unaudited). |
| 3 | For the period April 30, 2012 (inception date) to December 31, 2012. |
| 4 | Amount represents less than $0.005 per share. |
| 5 | Performance figures, exclusive of sales charges, may reflect compensating balance arrangements, fee waivers and/or expense reimbursements. In the absence of compensating balance arrangements, fee waivers and/or expense reimbursements, the total return would have been lower. Past performance is no guarantee of future results. Total returns for periods of less than one year are not annualized. |
| 7 | As a result of an expense limitation arrangement, the ratio of expenses, other than interest, brokerage commissions, taxes, extraordinary expenses and deferred organizational expenses, to average net assets of Class A shares did not exceed 0.90%. This expense limitation arrangement cannot be terminated prior to December 31, 2017 without the Board of Directors’ consent. |
See Notes to Financial Statements.
| | |
| 12 | | Western Asset Inflation Indexed Plus Bond Fund 2016 Semi-Annual Report |
| | | | | | | | | | | | | | | | | | | | |
For a share of each class of capital stock outstanding throughout each year ended December 31,
unless otherwise noted: | |
| Class C Shares1 | | 20162 | | | 2015 | | | 2014 | | | 2013 | | | 20123 | |
| | | | | |
| Net asset value, beginning of period | | | $10.61 | | | | $11.01 | | | | $10.98 | | | | $12.17 | | | | $12.10 | |
| | | | | |
| Income (loss) from operations: | | | | | | | | | | | | | | | | | | | | |
Net investment income (loss) | | | (0.00) | 4 | | | (0.10) | | | | 0.00 | 4 | | | (0.04) | | | | 0.09 | |
Net realized and unrealized gain (loss) | | | 0.44 | | | | (0.27) | | | | 0.18 | | | | (1.08) | | | | 0.27 | |
Total income (loss) from operations | | | 0.44 | | | | (0.37) | | | | 0.18 | | | | (1.12) | | | | 0.36 | |
| | | | | |
| Less distributions from: | | | | | | | | | | | | | | | | | | | | |
Net investment income | | | — | | | | (0.02) | | | | (0.15) | | | | (0.07) | | | | (0.14) | |
Net realized gains | | | — | | | | — | | | | (0.00) | 4 | | | — | | | | (0.15) | |
Return of capital | | | — | | | | (0.01) | | | | — | | | | — | | | | — | |
Total distributions | | | — | | | | (0.03) | | | | (0.15) | | | | (0.07) | | | | (0.29) | |
| | | | | |
| Net asset value, end of period | | | $11.05 | | | | $10.61 | | | | $11.01 | | | | $10.98 | | | | $12.17 | |
Total return5 | | | 4.15 | % | | | (3.36) | % | | | 1.62 | % | | | (9.23) | % | | | 2.97 | % |
| | | | | |
| Net assets, end of period (000s) | | | $1,151 | | | | $1,183 | | | | $1,334 | | | | $1,628 | | | | $1,987 | |
| | | | | |
| Ratios to average net assets: | | | | | | | | | | | | | | | | | | | | |
Gross expenses | | | 1.30 | %6 | | | 1.30 | %7 | | | 1.61 | %7 | | | 1.51 | % | | | 1.29 | %6 |
Net expenses8 | | | 1.30 | 6 | | | 1.30 | 7 | | | 1.61 | 7 | | | 1.40 | 9 | | | 1.29 | 6 |
Net investment income (loss) | | | (0.03) | 6 | | | (0.89) | | | | 0.04 | | | | (0.35) | | | | 1.15 | 6 |
| | | | | |
| Portfolio turnover rate | | | 53 | % | | | 69 | % | | | 36 | % | | | 32 | % | | | 54 | % |
| 1 | Per share amounts have been calculated using the average shares method. |
| 2 | For the six months ended June 30, 2016 (unaudited). |
| 3 | For the period April 30, 2012 (inception date) to December 31, 2012. |
| 4 | Amount represents less than $0.005 per share. |
| 5 | Performance figures, exclusive of CDSC, may reflect compensating balance arrangements, fee waivers and/or expense reimbursements. In the absence of compensating balance arrangements, fee waivers and/or expense reimbursements, the total return would have been lower. Past performance is no guarantee of future results. Total returns for periods of less than one year are not annualized. |
| 7 | Reflects recapture of expenses waived/reimbursed from prior fiscal years. |
| 8 | As a result of an expense limitation arrangement, the ratio of expenses, other than interest, brokerage commissions, taxes, extraordinary expenses and deferred organizational expenses, to average net assets of Class C shares did not exceed 1.65%. This expense limitation arrangement cannot be terminated prior to December 31, 2017 without the Board of Directors’ consent. |
| 9 | Reflects fee waivers and/or expense reimbursements. |
See Notes to Financial Statements.
| | |
| Western Asset Inflation Indexed Plus Bond Fund 2016 Semi-Annual Report | | 13 |
Financial highlights (cont’d)
| | | | | | | | | | | | | | | | | | | | |
For a share of each class of capital stock outstanding throughout each year ended December 31,
unless otherwise noted: | |
| Class C1 Shares1 | | 20162 | | | 2015 | | | 2014 | | | 2013 | | | 20123 | |
| | | | | |
| Net asset value, beginning of period | | | $10.71 | | | | $11.09 | | | | $11.03 | | | | $12.21 | | | | $12.35 | |
| | | | | |
| Income (loss) from operations: | | | | | | | | | | | | | | | | | | | | |
Net investment income (loss) | | | 0.00 | 4 | | | (0.08) | | | | 0.05 | | | | (0.03) | | | | 0.05 | |
Net realized and unrealized gain (loss) | | | 0.44 | | | | (0.27) | | | | 0.17 | | | | (1.07) | | | | (0.03) | |
Total income (loss) from operations | | | 0.44 | | | | (0.35) | | | | 0.22 | | | | (1.10) | | | | (0.02) | |
| | | | | |
| Less distributions from: | | | | | | | | | | | | | | | | | | | | |
Net investment income | | | — | | | | (0.02) | | | | (0.16) | | | | (0.08) | | | | (0.06) | |
Net realized gains | | | — | | | | — | | | | (0.00) | 4 | | | — | | | | (0.10) | |
Return of capital | | | — | | | | (0.01) | | | | — | | | | — | | | | — | |
Total distributions | | | — | | | | (0.03) | | | | (0.16) | | | | (0.08) | | | | (0.16) | |
| | | | | |
| Net asset value, end of period | | | $11.15 | | | | $10.71 | | | | $11.09 | | | | $11.03 | | | | $12.21 | |
Total return5 | | | 4.11 | % | | | (3.14) | % | | | 2.00 | % | | | (9.09) | % | | | 0.13 | % |
| | | | | |
| Net assets, end of period (000s) | | | $1,767 | | | | $1,808 | | | | $2,084 | | | | $3,078 | | | | $5,642 | |
| | | | | |
| Ratios to average net assets: | | | | | | | | | | | | | | | | | | | | |
Gross expenses | | | 1.14 | %6 | | | 1.10 | % | | | 1.30 | % | | | 1.26 | % | | | 1.22 | %6 |
Net expenses7 | | | 1.14 | 6 | | | 1.10 | | | | 1.30 | | | | 1.26 | | | | 1.22 | 6 |
Net investment income (loss) | | | 0.07 | 6 | | | (0.77) | | | | 0.41 | | | | (0.28) | | | | 1.84 | 6 |
| | | | | |
| Portfolio turnover rate | | | 53 | % | | | 69 | % | | | 36 | % | | | 32 | % | | | 54 | % |
| 1 | Per share amounts have been calculated using the average shares method. |
| 2 | For the six months ended June 30, 2016 (unaudited). |
| 3 | For the period October 5, 2012 (inception date) through December 31, 2012. |
| 4 | Amount represents less than $0.005 per share. |
| 5 | Performance figures may reflect compensating balance arrangements, fee waivers and/or expense reimbursements. In the absence of compensating balance arrangements, fee waivers and/or expense reimbursements, the total return would have been lower. Past performance is no guarantee of future results. Total returns for periods of less than one year are not annualized. |
| 7 | As a result of an expense limitation arrangement, the ratio of expenses, other than interest, brokerage commissions, taxes, extraordinary expenses and deferred organizational expenses, to average net assets of Class C1 shares did not exceed 1.40%. This expense limitation arrangement cannot be terminated prior to December 31, 2017 without the Board of Directors’ consent. |
See Notes to Financial Statements.
| | |
| 14 | | Western Asset Inflation Indexed Plus Bond Fund 2016 Semi-Annual Report |
| | | | | | | | | | | | | | | | | | | | | | | | |
For a share of each class of capital stock outstanding throughout each year ended December 31,
unless otherwise noted: | |
| Class FI Shares1 | | 20162 | | | 2015 | | | 2014 | | | 2013 | | | 2012 | | | 2011 | |
| | | | | | |
| Net asset value, beginning of period | | | $10.75 | | | | $11.09 | | | | $11.00 | | | | $12.14 | | | | $11.80 | | | | $10.87 | |
| | | | | | |
| Income (loss) from operations: | | | | | | | | | | | | | | | | | | | | | | | | |
Net investment income (loss) | | | (0.01) | | | | 0.06 | | | | 0.02 | | | | 0.02 | | | | 0.16 | | | | 0.32 | |
Net realized and unrealized gain (loss) | | | 0.48 | | | | (0.36) | | | | 0.25 | | | | (1.06) | | | | 0.57 | | | | 0.99 | |
Total income (loss) from operations | | | 0.47 | | | | (0.30) | | | | 0.27 | | | | (1.04) | | | | 0.73 | | | | 1.31 | |
| | | | | | |
| Less distributions from: | | | | | | | | | | | | | | | | | | | | | | | | |
Net investment income | | | — | | | | (0.02) | | | | (0.18) | | | | (0.10) | | | | (0.24) | | | | (0.38) | |
Net realized gains | | | — | | | | — | | | | (0.00) | 3 | | | — | | | | (0.15) | | | | — | |
Return of capital | | | — | | | | (0.02) | | | | — | | | | — | | | | — | | | | — | |
Total distributions | | | — | | | | (0.04) | | | | (0.18) | | | | (0.10) | | | | (0.39) | | | | (0.38) | |
| | | | | | |
| Net asset value, end of period | | | $11.22 | | | | $10.75 | | | | $11.09 | | | | $11.00 | | | | $12.14 | | | | $11.80 | |
Total return4 | | | 4.37 | % | | | (2.74) | % | | | 2.48 | % | | | (8.64) | % | | | 6.22 | % | | | 12.29 | % |
| | | | | | |
| Net assets, end of period (000s) | | | $1,481 | | | | $1,845 | | | | $3,189 | | | | $2,737 | | | | $1,577 | | | | $1,273 | |
| | | | | | |
| Ratios to average net assets: | | | | | | | | | | | | | | | | | | | | | | | | |
Gross expenses | | | 0.63 | %5 | | | 0.64 | %6 | | | 0.76 | %6 | | | 0.84 | %6 | | | 0.89 | %6 | | | 0.86 | %6 |
Net expenses8 | | | 0.63 | 5 | | | 0.64 | 6 | | | 0.76 | 6 | | | 0.83 | 6,7 | | | 0.80 | 6,7 | | | 0.75 | 6,7 |
Net investment income (loss) | | | (0.21) | 5 | | | 0.54 | | | | 0.18 | | | | 0.14 | | | | 1.30 | | | | 2.85 | |
| | | | | | |
| Portfolio turnover rate | | | 53 | % | | | 69 | % | | | 36 | % | | | 32 | % | | | 54 | % | | | 50 | % |
| 1 | Per share amounts have been calculated using the average shares method. |
| 2 | For the six months ended June 30, 2016 (unaudited). |
| 3 | Amount represents less than $0.005 per share. |
| 4 | Performance figures may reflect compensating balance arrangements, fee waivers and/or expense reimbursements. In the absence of compensating balance arrangements, fee waivers and/or expense reimbursements, the total return would have been lower. Past performance is no guarantee of future results. Total returns for periods of less than one year are not annualized. |
| 6 | Reflects recapture of expenses waived/reimbursed from prior fiscal years. |
| 7 | Reflects fee waivers and/or expense reimbursements. |
| 8 | As a result of an expense limitation arrangement, effective May 1, 2012, the ratio of expenses, other than interest, brokerage commissions, taxes, extraordinary expenses and deferred organizational expenses, to average net assets of Class FI shares did not exceed 0.85%. This expense limitation arrangement cannot be terminated prior to December 31, 2017 without the Board of Directors’ consent. Prior to May 1, 2012, as a result of an expense limitation arrangement, the ratio of expenses to average net assets of Class FI shares did not exceed 0.75%. |
See Notes to Financial Statements.
| | |
| Western Asset Inflation Indexed Plus Bond Fund 2016 Semi-Annual Report | | 15 |
Financial highlights (cont’d)
| | | | | | | | | | | | | | | | | | | | |
For a share of each class of capital stock outstanding throughout each year ended December 31,
unless otherwise noted: | |
| Class R Shares1 | | 20162 | | | 2015 | | | 2014 | | | 2013 | | | 20123 | |
| | | | | |
| Net asset value, beginning of period | | | $10.72 | | | | $11.11 | | | | $11.03 | | | | $12.20 | | | | $12.10 | |
| | | | | |
| Income (loss) from operations: | | | | | | | | | | | | | | | | | | | | |
Net investment income (loss) | | | 0.02 | | | | (0.02) | | | | (0.02) | | | | (0.05) | | | | 0.10 | |
Net realized and unrealized gain (loss) | | | 0.44 | | | | (0.34) | | | | 0.27 | | | | (1.03) | | | | 0.31 | |
Total income (loss) from operations | | | 0.46 | | | | (0.36) | | | | 0.25 | | | | (1.08) | | | | 0.41 | |
| | | | | |
| Less distributions from: | | | | | | | | | | | | | | | | | | | | |
Net investment income | | | — | | | | (0.02) | | | | (0.17) | | | | (0.09) | | | | (0.16) | |
Net realized gains | | | — | | | | — | | | | (0.00) | 4 | | | — | | | | (0.15) | |
Return of capital | | | — | | | | (0.01) | | | | — | | | | — | | | | — | |
Total distributions | | | — | | | | (0.03) | | | | (0.17) | | | | (0.09) | | | | (0.31) | |
| | | | | |
| Net asset value, end of period | | | $11.18 | | | | $10.72 | | | | $11.11 | | | | $11.03 | | | | $12.20 | |
Total return5 | | | 4.29 | % | | | (3.03) | % | | | 2.11 | % | | | (8.93) | % | | | 3.33 | % |
| | | | | |
| Net assets, end of period (000s) | | | $1,305 | | | | $921 | | | | $425 | | | | $51 | | | | $10 | |
| | | | | |
| Ratios to average net assets: | | | | | | | | | | | | | | | | | | | | |
Gross expenses | | | 0.99 | %6 | | | 0.99 | % | | | 1.10 | %7 | | | 1.17 | %7 | | | 0.99 | %6 |
Net expenses8 | | | 0.99 | 6 | | | 0.99 | | | | 1.10 | 7 | | | 1.07 | 7,9 | | | 0.98 | 6,9 |
Net investment income (loss) | | | 0.43 | 6 | | | (0.16) | | | | (0.15) | | | | (0.45) | | | | 1.19 | 6 |
| | | | | |
| Portfolio turnover rate | | | 53 | % | | | 69 | % | | | 36 | % | | | 32 | % | | | 54 | % |
| 1 | Per share amounts have been calculated using the average shares method. |
| 2 | For the six months ended June 30, 2016 (unaudited). |
| 3 | For the period April 30, 2012 (inception date) to December 31, 2012. |
| 4 | Amount represents less than $0.005 per share. |
| 5 | Performance figures may reflect compensating balance arrangements, fee waivers and/or expense reimbursements. In the absence of compensating balance arrangements, fee waivers and/or expense reimbursements, the total return would have been lower. Past performance is no guarantee of future results. Total returns for periods of less than one year are not annualized. |
| 7 | Reflects recapture of expenses waived/reimbursed from prior fiscal years. |
| 8 | As a result of an expense limitation arrangement, the ratio of expenses, other than interest, brokerage commissions, taxes, extraordinary expenses and deferred organizational expenses, to average net assets of Class R shares did not exceed 1.15%. This expense limitation arrangement cannot be terminated prior to December 31, 2017 without the Board of Directors’ consent. |
| 9 | Reflects fee waivers and/or expense reimbursements. |
See Notes to Financial Statements.
| | |
| 16 | | Western Asset Inflation Indexed Plus Bond Fund 2016 Semi-Annual Report |
| | | | | | | | | | | | | | | | | | | | | | | | |
For a share of each class of capital stock outstanding throughout each year ended December 31,
unless otherwise noted: | |
| Class I Shares1 | | 20162 | | | 2015 | | | 2014 | | | 2013 | | | 2012 | | | 2011 | |
| | | | | | |
| Net asset value, beginning of period | | | $10.90 | | | | $11.22 | | | | $11.11 | | | | $12.23 | | | | $11.85 | | | | $10.91 | |
| | | | | | |
| Income (loss) from operations: | | | | | | | | | | | | | | | | | | | | | | | | |
Net investment income | | | 0.04 | | | | 0.03 | | | | 0.14 | | | | 0.08 | | | | 0.21 | | | | 0.41 | |
Net realized and unrealized gain (loss) | | | 0.46 | | | | (0.31) | | | | 0.17 | | | | (1.08) | | | | 0.59 | | | | 0.96 | |
Total income (loss) from operations | | | 0.50 | | | | (0.28) | | | | 0.31 | | | | (1.00) | | | | 0.80 | | | | 1.37 | |
| | | | | | |
| Less distributions from: | | | | | | | | | | | | | | | | | | | | | | | | |
Net investment income | | | — | | | | (0.02) | | | | (0.20) | | | | (0.12) | | | | (0.27) | | | | (0.43) | |
Net realized gains | | | — | | | | — | | | | (0.00) | 3 | | | — | | | | (0.15) | | | | — | |
Return of capital | | | — | | | | (0.02) | | | | — | | | | — | | | | — | | | | — | |
Total distributions | | | — | | | | (0.04) | | | | (0.20) | | | | (0.12) | | | | (0.42) | | | | (0.43) | |
| | | | | | |
| Net asset value, end of period | | | $11.40 | | | | $10.90 | | | | $11.22 | | | | $11.11 | | | | $12.23 | | | | $11.85 | |
Total return4 | | | 4.59 | % | | | (2.50) | % | | | 2.83 | % | | | (8.19) | % | | | 6.75 | % | | | 12.81 | % |
| | | | | | |
| Net assets, end of period (000s) | | | $98,782 | | | | $103,290 | | | | $265,527 | | | | $291,664 | | | | $380,571 | | | | $355,538 | |
| | | | | | |
| Ratios to average net assets: | | | | | | | | | | | | | | | | | | | | | | | | |
Gross expenses | | | 0.37 | %5 | | | 0.38 | % | | | 0.41 | % | | | 0.31 | % | | | 0.31 | % | | | 0.33 | % |
Net expenses | | | 0.37 | 5 | | | 0.38 | | | | 0.41 | | | | 0.31 | 6 | | | 0.30 | 6,7 | | | 0.31 | 6,7 |
Net investment income | | | 0.80 | 5 | | | 0.25 | | | | 1.19 | | | | 0.67 | | | | 1.74 | | | | 3.58 | |
| | | | | | |
| Portfolio turnover rate | | | 53 | % | | | 69 | % | | | 36 | % | | | 32 | % | | | 54 | % | | | 50 | % |
| 1 | Per share amounts have been calculated using the average shares method. |
| 2 | For the six months ended June 30, 2016 (unaudited). |
| 3 | Amount represents less than $0.005 per share. |
| 4 | Performance figures may reflect compensating balance arrangements, fee waivers and/or expense reimbursements. In the absence of compensating balance arrangements, fee waivers and/or expense reimbursements, the total return would have been lower. Past performance is no guarantee of future results. Total returns for periods of less than one year are not annualized. |
| 6 | Reflects fee waivers and/or expense reimbursements. |
| 7 | Prior to May 1, 2012, the investment manager had contractually agreed to waive fees and/or reimburse operating expenses at an annual rate of 0.02%. |
See Notes to Financial Statements.
| | |
| Western Asset Inflation Indexed Plus Bond Fund 2016 Semi-Annual Report | | 17 |
Financial highlights (cont’d)
| | | | | | | | | | | | | | | | | | | | | | | | |
For a share of each class of capital stock outstanding throughout each year ended December 31,
unless otherwise noted: | |
| Class IS Shares1 | | 20162 | | | 2015 | | | 2014 | | | 2013 | | | 2012 | | | 2011 | |
| | | | | | |
| Net asset value, beginning of period | | | $10.94 | | | | $11.24 | | | | $11.12 | | | | $12.24 | | | | $11.85 | | | | $10.92 | |
| | | | | | |
| Income (loss) from operations: | | | | | | | | | | | | | | | | | | | | | | | | |
Net investment income | | | 0.04 | | | | 0.00 | 3 | | | 0.15 | | | | 0.08 | | | | 0.23 | | | | 0.40 | |
Net realized and unrealized gain (loss) | | | 0.47 | | | | (0.26) | | | | 0.18 | | | | (1.07) | | | | 0.58 | | | | 0.96 | |
Total income (loss) from operations | | | 0.51 | | | | (0.26) | | | | 0.33 | | | | (0.99) | | | | 0.81 | | | | 1.36 | |
| | | | | | |
| Less distributions from: | | | | | | | | | | | | | | | | | | | | | | | | |
Net investment income | | | — | | | | (0.02) | | | | (0.21) | | | | (0.13) | | | | (0.27) | | | | (0.43) | |
Net realized gains | | | — | | | | — | | | | (0.00) | 3 | | | — | | | | (0.15) | | | | — | |
Return of capital | | | — | | | | (0.02) | | | | — | | | | — | | | | — | | | | — | |
Total distributions | | | — | | | | (0.04) | | | | (0.21) | | | | (0.13) | | | | (0.42) | | | | (0.43) | |
| | | | | | |
| Net asset value, end of period | | | $11.45 | | | | $10.94 | | | | $11.24 | | | | $11.12 | | | | $12.24 | | | | $11.85 | |
Total return4 | | | 4.66 | % | | | (2.30) | % | | | 2.98 | % | | | (8.17) | % | | | 6.85 | % | | | 12.76 | % |
| | | | | | |
| Net assets, end of period (000s) | | | $408,076 | | | | $454,842 | | | | $279,769 | | | | $258,193 | | | | $248,235 | | | | $62,764 | |
| | | | | | |
| Ratios to average net assets: | | | | | | | | | | | | | | | | | | | | | | | | |
Gross expenses | | | 0.26 | %5 | | | 0.25 | % | | | 0.26 | % | | | 0.27 | %6 | | | 0.26 | %6 | | | 0.27 | %6 |
Net expenses | | | 0.26 | 5,7 | | | 0.25 | 7 | | | 0.26 | 7 | | | 0.27 | 6,8 | | | 0.26 | 6,8,9 | | | 0.25 | 6,8,9 |
Net investment income | | | 0.79 | 5 | | | 0.02 | | | | 1.36 | | | | 0.71 | | | | 1.93 | | | | 3.54 | |
| | | | | | |
| Portfolio turnover rate | | | 53 | % | | | 69 | % | | | 36 | % | | | 32 | % | | | 54 | % | | | 50 | % |
| 1 | Per share amounts have been calculated using the average shares method. |
| 2 | For the six months ended June 30, 2016 (unaudited). |
| 3 | Amount represents less than $0.005 per share. |
| 4 | Performance figures may reflect compensating balance arrangements, fee waivers and/or expense reimbursements. In the absence of compensating balance arrangements, fee waivers and/or expense reimbursements, the total return would have been lower. Past performance is no guarantee of future results. Total returns for periods of less than one year are not annualized. |
| 6 | Reflects recapture of expenses waived/reimbursed from prior fiscal years. |
| 7 | As a result of an expense limitation arrangement, the ratio of total annual fund operating expenses for Class IS did not exceed the ratio of total annual fund operating expenses for Class I shares. This expense limitation arrangement cannot be terminated prior to December 31, 2017 without the Board of Directors’ consent. |
| 8 | Reflects fee waivers and/or expense reimbursements. |
| 9 | Prior to May 1, 2012, as a result of an expense limitation arrangement, the ratio of expenses, other than interest, brokerage commissions, taxes, extraordinary expenses and deferred organizational expenses, to average net assets of Class IS shares did not exceed 0.25%. |
See Notes to Financial Statements.
| | |
| 18 | | Western Asset Inflation Indexed Plus Bond Fund 2016 Semi-Annual Report |
Notes to financial statements (unaudited)
1. Organization and significant accounting policies
Western Asset Inflation Indexed Plus Bond Fund (the “Fund”) is a separate diversified investment series of Western Asset Funds, Inc. (the “Corporation”). The Corporation, a Maryland corporation, is registered under the Investment Company Act of 1940, as amended (the “1940 Act”), as an open-end management investment company.
The following are significant accounting policies consistently followed by the Fund and are in conformity with U.S. generally accepted accounting principles (“GAAP”). Estimates and assumptions are required to be made regarding assets, liabilities and changes in net assets resulting from operations when financial statements are prepared. Changes in the economic environment, financial markets and any other parameters used in determining these estimates could cause actual results to differ. Subsequent events have been evaluated through the date the financial statements were issued.
(a) Investment valuation. The valuations for fixed income securities (which may include, but are not limited to, corporate, government, municipal, mortgage-backed, collateralized mortgage obligations and asset-backed securities) and certain derivative instruments are typically the prices supplied by independent third party pricing services, which may use market prices or broker/dealer quotations or a variety of valuation techniques and methodologies. The independent third party pricing services use inputs that are observable such as issuer details, interest rates, yield curves, prepayment speeds, credit risks/spreads, default rates and quoted prices for similar securities. Short-term fixed income securities that will mature in 60 days or less are valued at amortized cost, unless it is determined that using this method would not reflect an investment’s fair value. Investments in open-end funds are valued at the closing net asset value per share of each fund on the day of valuation. Futures contracts are valued daily at the settlement price established by the board of trade or exchange on which they are traded. Equity securities for which market quotations are available are valued at the last reported sales price or official closing price on the primary market or exchange on which they trade. When the Fund holds securities or other assets that are denominated in a foreign currency, the Fund will normally use the currency exchange rates as of 4:00 p.m. (Eastern Time). If independent third party pricing services are unable to supply prices for a portfolio investment, or if the prices supplied are deemed by the manager to be unreliable, the market price may be determined by the manager using quotations from one or more broker/dealers or at the transaction price if the security has recently been purchased and no value has yet been obtained from a pricing service or pricing broker. When reliable prices are not readily available, such as when the value of a security has been significantly affected by events after the close of the exchange or market on which the security is principally traded, but before the Fund calculates its net asset value, the Fund values these securities as determined in accordance with procedures approved by the Fund’s Board of Directors.
The Board of Directors is responsible for the valuation process and has delegated the supervision of the daily valuation process to the Legg Mason North Atlantic Fund Valuation Committee (the “Valuation Committee”). The Valuation Committee, pursuant to the policies
| | |
| Western Asset Inflation Indexed Plus Bond Fund 2016 Semi-Annual Report | | 19 |
Notes to financial statements (unaudited) (cont’d)
adopted by the Board of Directors, is responsible for making fair value determinations, evaluating the effectiveness of the Fund’s pricing policies, and reporting to the Board of Directors. When determining the reliability of third party pricing information for investments owned by the Fund, the Valuation Committee, among other things, conducts due diligence reviews of pricing vendors, monitors the daily change in prices and reviews transactions among market participants.
The Valuation Committee will consider pricing methodologies it deems relevant and appropriate when making fair value determinations. Examples of possible methodologies include, but are not limited to, multiple of earnings; discount from market of a similar freely traded security; discounted cash-flow analysis; book value or a multiple thereof; risk premium/yield analysis; yield to maturity; and/or fundamental investment analysis. The Valuation Committee will also consider factors it deems relevant and appropriate in light of the facts and circumstances. Examples of possible factors include, but are not limited to, the type of security; the issuer’s financial statements; the purchase price of the security; the discount from market value of unrestricted securities of the same class at the time of purchase; analysts’ research and observations from financial institutions; information regarding any transactions or offers with respect to the security; the existence of merger proposals or tender offers affecting the security; the price and extent of public trading in similar securities of the issuer or comparable companies; and the existence of a shelf registration for restricted securities.
For each portfolio security that has been fair valued pursuant to the policies adopted by the Board of Directors, the fair value price is compared against the last available and next available market quotations. The Valuation Committee reviews the results of such back testing monthly and fair valuation occurrences are reported to the Board of Directors quarterly.
The Fund uses valuation techniques to measure fair value that are consistent with the market approach and/or income approach, depending on the type of security and the particular circumstance. The market approach uses prices and other relevant information generated by market transactions involving identical or comparable securities. The income approach uses valuation techniques to discount estimated future cash flows to present value.
GAAP establishes a disclosure hierarchy that categorizes the inputs to valuation techniques used to value assets and liabilities at measurement date. These inputs are summarized in the three broad levels listed below:
| • | | Level 1—quoted prices in active markets for identical investments |
| • | | Level 2—other significant observable inputs (including quoted prices for similar investments, interest rates, prepayment speeds, credit risk, etc.) |
| • | | Level 3—significant unobservable inputs (including the Fund’s own assumptions in determining the fair value of investments) |
The inputs or methodologies used to value securities are not necessarily an indication of the risk associated with investing in those securities.
| | |
| 20 | | Western Asset Inflation Indexed Plus Bond Fund 2016 Semi-Annual Report |
The following is a summary of the inputs used in valuing the Fund’s assets and liabilities carried at fair value:
| | | | | | | | | | | | | | | | |
| ASSETS | |
| Description | | Quoted Prices
(Level 1) | | | Other Significant
Observable Inputs
(Level 2) | | | Significant
Unobservable
Inputs
(Level 3) | | | Total | |
| Long-term investments†: | | | | | | | | | | | | | | | | |
U.S. Treasury inflation protected securities | | | — | | | $ | 464,683,341 | | | | — | | | $ | 464,683,341 | |
Asset-backed securities | | | — | | | | 116,090 | | | | — | | | | 116,090 | |
Non-U.S. Treasury inflation protected securities | | | — | | | | 1,632,481 | | | | — | | | | 1,632,481 | |
Purchased options | | $ | 256,125 | | | | — | | | | — | | | | 256,125 | |
| Total long-term investments | | $ | 256,125 | | | $ | 466,431,912 | | | | — | | | $ | 466,688,037 | |
| Short-term investments†: | | | | | | | | | | | | | | | | |
Repurchase agreements | | | — | | | | 30,000,000 | | | | — | | | | 30,000,000 | |
Money market funds | | | 36,598,092 | | | | — | | | | — | | | | 36,598,092 | |
| Total short-term investments | | $ | 36,598,092 | | | $ | 30,000,000 | | | | — | | | $ | 66,598,092 | |
| Total investments | | $ | 36,854,217 | | | $ | 496,431,912 | | | | — | | | $ | 533,286,129 | |
| Other financial instruments: | | | | | | | | | | | | | | | | |
Futures contracts | | $ | 1,131,540 | | | | — | | | | — | | | $ | 1,131,540 | |
Forward foreign currency contracts | | | — | | | $ | 2,053,490 | | | | — | | | | 2,053,490 | |
| Total other financial instruments | | $ | 1,131,540 | | | $ | 2,053,490 | | | | — | | | $ | 3,185,030 | |
| Total | | $ | 37,985,757 | | | $ | 498,485,402 | | | | — | | | $ | 536,471,159 | |
|
| LIABILITIES | |
| Description | | Quoted Prices
(Level 1) | | | Other Significant
Observable Inputs
(Level 2) | | | Significant
Unobservable
Inputs
(Level 3) | | | Total | |
| Other financial instruments: | | | | | | | | | | | | | | | | |
Futures contracts | | $ | 794,614 | | | | — | | | | — | | | $ | 794,614 | |
Forward foreign currency contracts | | | — | | | $ | 1,483,728 | | | | — | | | | 1,483,728 | |
| Total | | $ | 794,614 | | | $ | 1,483,728 | | | | — | | | $ | 2,278,342 | |
| † | See Schedule of Investments for additional detailed categorizations. |
(b) Repurchase agreements. The Fund may enter into repurchase agreements with institutions that its subadviser has determined are creditworthy. Each repurchase agreement is recorded at cost. Under the terms of a typical repurchase agreement, the Fund acquires a debt security subject to an obligation of the seller to repurchase, and of the Fund to resell, the security at an agreed-upon price and time, thereby determining the yield during the Fund’s holding period. When entering into repurchase agreements, it is the Fund’s policy that its custodian or a third party custodian, acting on the Fund’s behalf, take possession of the underlying collateral securities, the market value of which, at all times, at least equals the principal amount of the repurchase transaction, including accrued interest. To the extent that any repurchase transaction maturity exceeds one business day, the value of the collateral is marked-to-market and measured against the value of the agreement in
| | |
| Western Asset Inflation Indexed Plus Bond Fund 2016 Semi-Annual Report | | 21 |
Notes to financial statements (unaudited) (cont’d)
an effort to ensure the adequacy of the collateral. If the counterparty defaults, the Fund generally has the right to use the collateral to satisfy the terms of the repurchase transaction. However, if the market value of the collateral declines during the period in which the Fund seeks to assert its rights or if bankruptcy proceedings are commenced with respect to the seller of the security, realization of the collateral by the Fund may be delayed or limited.
(c) Inflation-indexed bonds. Inflation-indexed bonds are fixed-income securities whose principal value or interest rate is periodically adjusted according to the rate of inflation. As the index measuring inflation changes, the principal value or interest rate of inflation-indexed bonds will be adjusted accordingly. Inflation adjustments to the principal amount of inflation-indexed bonds are reflected as an increase or decrease to investment income on the Statement of Operations. Repayment of the original bond principal upon maturity (as adjusted for inflation) is guaranteed in the case of U.S. Treasury inflation-indexed bonds. For bonds that do not provide a similar guarantee, the adjusted principal value of the bond repaid at maturity may be less than the original principal.
(d) Forward foreign currency contracts. The Fund enters into a forward foreign currency contract to hedge exposure of bond positions or in an attempt to increase the Fund’s return. A forward foreign currency contract is an agreement between two parties to buy and sell a currency at a set price with delivery and settlement at a future date. The contract is marked-to-market daily and the change in value is recorded by the Fund as an unrealized gain or loss. When a forward foreign currency contract is closed, through either delivery or offset by entering into another forward foreign currency contract, the Fund recognizes a realized gain or loss equal to the difference between the value of the contract at the time it was opened and the value of the contract at the time it is closed.
Forward foreign currency contracts involve elements of market risk in excess of the amounts reflected on the Statement of Assets and Liabilities. The Fund bears the risk of an unfavorable change in the foreign exchange rate underlying the forward foreign currency contract. Risks may also arise upon entering into these contracts from the potential inability of the counterparties to meet the terms of their contracts.
(e) Purchased options. When the Fund purchases an option, an amount equal to the premium paid by the Fund is recorded as an investment on the Statement of Assets and Liabilities, the value of which is marked-to-market to reflect the current market value of the option purchased. If the purchased option expires, the Fund realizes a loss equal to the amount of premium paid. When an instrument is purchased or sold through the exercise of an option, the related premium paid is added to the basis of the instrument acquired or deducted from the proceeds of the instrument sold. The risk associated with purchasing put and call options is limited to the premium paid.
(f) Written options. When the Fund writes an option, an amount equal to the premium received by the Fund is recorded as a liability, the value of which is marked-to-market daily to reflect the current market value of the option written. If the option expires, the premium
| | |
| 22 | | Western Asset Inflation Indexed Plus Bond Fund 2016 Semi-Annual Report |
received is recorded as a realized gain. When a written call option is exercised, the difference between the premium received plus the option exercise price and the Fund’s basis in the underlying security (in the case of a covered written call option), or the cost to purchase the underlying security (in the case of an uncovered written call option), including brokerage commission, is recognized as a realized gain or loss. When a written put option is exercised, the amount of the premium received is subtracted from the cost of the security purchased by the Fund from the exercise of the written put option to form the Fund’s basis in the underlying security purchased. The writer or buyer of an option traded on an exchange can liquidate the position before the exercise of the option by entering into a closing transaction. The cost of a closing transaction is deducted from the original premium received resulting in a realized gain or loss to the Fund.
The risk in writing a covered call option is that the Fund may forego the opportunity of profit if the market price of the underlying security increases and the option is exercised. The risk in writing a put option is that the Fund may incur a loss if the market price of the underlying security decreases and the option is exercised. The risk in writing an uncovered call option is that the Fund is exposed to the risk of loss if the market price of the underlying security increases. In addition, there is the risk that the Fund may not be able to enter into a closing transaction because of an illiquid secondary market.
(g) Futures contracts. The Fund uses futures contracts generally to gain exposure to, or hedge against, changes in interest rates or gain exposure to, or hedge against, changes in certain asset classes. A futures contract represents a commitment for the future purchase or sale of an asset at a specified price on a specified date.
Upon entering into a futures contract, the Fund is required to deposit cash or cash equivalents with a broker in an amount equal to a certain percentage of the contract amount. This is known as the ‘‘initial margin’’ and subsequent payments (‘‘variation margin’’) are made or received by the Fund each day, depending on the daily fluctuation in the value of the contract. For certain futures, including foreign denominated futures, variation margin is not settled daily, but is recorded as a net variation margin payable or receivable. The daily changes in contract value are recorded as unrealized gains or losses in the Statement of Operations and the Fund recognizes a realized gain or loss when the contract is closed.
Futures contracts involve, to varying degrees, risk of loss in excess of the amounts reflected in the financial statements. In addition, there is the risk that the Fund may not be able to enter into a closing transaction because of an illiquid secondary market.
(h) Options on futures contracts. An option on a futures contract gives the purchaser the right, in return for the premium paid, to assume a position in the underlying futures contract at the specified option exercise price at any time prior to the expiration date of the option. Upon exercise of an option, the delivery of the futures position by the writer of the option to the holder of the option will be accompanied by delivery of the accumulated balance in the writer’s futures margin account that represents the amount by which the market price of the futures contract exceeds (in the case of a call) or is less than (in the case of a
| | |
| Western Asset Inflation Indexed Plus Bond Fund 2016 Semi-Annual Report | | 23 |
Notes to financial statements (unaudited) (cont’d)
put) the exercise price of the option on the futures contract. The potential for loss related to the purchase of an option on a futures contract is limited to the premium paid for the option plus transaction costs. Because the value of the option is fixed at the point of purchase, there are no daily cash payments by the purchaser to reflect changes in the value of the underlying contract; however, the value of the option changes daily and that change would be reflected in the net asset value of the Fund. The potential for loss related to writing call options is unlimited. The potential for loss related to writing put options is limited only by the aggregate strike price of the put option less the premium received.
(i) Foreign currency translation. Investment securities and other assets and liabilities denominated in foreign currencies are translated into U.S. dollar amounts based upon prevailing exchange rates on the date of valuation. Purchases and sales of investment securities and income and expense items denominated in foreign currencies are translated into U.S. dollar amounts based upon prevailing exchange rates on the respective dates of such transactions.
The Fund does not isolate that portion of the results of operations resulting from fluctuations in foreign exchange rates on investments from the fluctuations arising from changes in market prices of securities held. Such fluctuations are included with the net realized and unrealized gain or loss on investments.
Net realized foreign exchange gains or losses arise from sales of foreign currencies, including gains and losses on forward foreign currency contracts, currency gains or losses realized between the trade and settlement dates on securities transactions, and the difference between the amounts of dividends, interest, and foreign withholding taxes recorded on the Fund’s books and the U.S. dollar equivalent of the amounts actually received or paid. Net unrealized foreign exchange gains and losses arise from changes in the values of assets and liabilities, other than investments in securities, on the date of valuation, resulting from changes in exchange rates.
Foreign security and currency transactions may involve certain considerations and risks not typically associated with those of U.S. dollar denominated transactions as a result of, among other factors, the possibility of lower levels of governmental supervision and regulation of foreign securities markets and the possibility of political or economic instability.
(j) Credit and market risk. Investments in securities that are collateralized by real estate mortgages are subject to certain credit and liquidity risks. When market conditions result in an increase in default rates of the underlying mortgages and the foreclosure values of underlying real estate properties are materially below the outstanding amount of these underlying mortgages, collection of the full amount of accrued interest and principal on these investments may be doubtful. Such market conditions may significantly impair the value and liquidity of these investments and may result in a lack of correlation between their credit ratings and values.
(k) Foreign investment risks. The Fund’s investments in foreign securities may involve risks not present in domestic investments. Since securities may be denominated in foreign
| | |
| 24 | | Western Asset Inflation Indexed Plus Bond Fund 2016 Semi-Annual Report |
currencies, may require settlement in foreign currencies or pay interest or dividends in foreign currencies, changes in the relationship of these foreign currencies to the U.S. dollar can significantly affect the value of the investments and earnings of the Fund. Foreign investments may also subject the Fund to foreign government exchange restrictions, expropriation, taxation or other political, social or economic developments, all of which affect the market and/or credit risk of the investments.
(l) Counterparty risk and credit-risk-related contingent features of derivative instruments. The Fund may invest in certain securities or engage in other transactions, where the Fund is exposed to counterparty credit risk in addition to broader market risks. The Fund may invest in securities of issuers, which may also be considered counterparties as trading partners in other transactions. This may increase the risk of loss in the event of default or bankruptcy by the counterparty or if the counterparty otherwise fails to meet its contractual obligations. The Fund’s subadviser attempts to mitigate counterparty risk by (i) periodically assessing the creditworthiness of its trading partners, (ii) monitoring and/or limiting the amount of its net exposure to each individual counterparty based on its assessment and (iii) requiring collateral from the counterparty for certain transactions. Market events and changes in overall economic conditions may impact the assessment of such counterparty risk by the subadviser. In addition, declines in the values of underlying collateral received may expose the Fund to increased risk of loss.
The Fund has entered into master agreements with certain of its derivative counterparties that provide for general obligations, representations, agreements, collateral, events of default or termination and credit related contingent features. The credit related contingent features include, but are not limited to, a percentage decrease in the Fund’s net assets or NAV over a specified period of time. If these credit related contingent features were triggered, the derivatives counterparty could terminate the positions and demand payment or require additional collateral.
Collateral requirements differ by type of derivative. Collateral or margin requirements are set by the broker or exchange clearinghouse for exchange traded derivatives while collateral terms are contract specific for over-the-counter traded derivatives. Cash collateral that has been pledged to cover obligations of the Fund under derivative contracts, if any, will be reported separately in the Statement of Assets and Liabilities. Securities pledged as collateral, if any, for the same purpose are noted in the Schedule of Investments.
Absent an event of default by the counterparty or a termination of the agreement, the terms of the master agreements do not result in an offset of reported amounts of financial assets and financial liabilities in the Statement of Assets and Liabilities across transactions between the Fund and the applicable counterparty. The enforceability of the right to offset may vary by jurisdiction.
As of June 30, 2016, the Fund held forward foreign currency contracts with credit related contingent features which had a liability position of $1,483,728. If a contingent feature in the master agreements would have been triggered, the Fund would have been required to pay this amount to its derivatives counterparties.
| | |
| Western Asset Inflation Indexed Plus Bond Fund 2016 Semi-Annual Report | | 25 |
Notes to financial statements (unaudited) (cont’d)
(m) Security transactions and investment income. Security transactions are accounted for on a trade date basis. Interest income, adjusted for amortization of premium and accretion of discount, is recorded on the accrual basis. Paydown gains and losses on mortgage- and asset-backed securities are recorded as adjustments to interest income. Dividend income is recorded on the ex-dividend date. The cost of investments sold is determined by use of the specific identification method. To the extent any issuer defaults or a credit event occurs that impacts the issuer, the Fund may halt any additional interest income accruals and consider the realizability of interest accrued up to the date of default or credit event.
(n) Share class accounting. Investment income, common expenses and realized/unrealized gains (losses) on investments are allocated to the various classes of the Fund on the basis of daily net assets of each class. Fees relating to a specific class are charged directly to that share class.
(o) Distributions to shareholders. Distributions from net investment income of the Fund are declared each business day to shareholders of record, and are paid monthly. Distributions of net realized gains, if any, are declared at least annually. Distributions to shareholders of the Fund are recorded on the ex-dividend date and are determined in accordance with income tax regulations, which may differ from GAAP.
(p) Compensating balance arrangements. The Fund has an arrangement with its custodian bank whereby a portion of the custodian’s fees is paid indirectly by credits earned on the Fund’s cash on deposit with the bank.
(q) Federal and other taxes. It is the Fund’s policy to comply with the federal income and excise tax requirements of the Internal Revenue Code of 1986 (the “Code”), as amended, applicable to regulated investment companies. Accordingly, the Fund intends to distribute its taxable income and net realized gains, if any, to shareholders in accordance with timing requirements imposed by the Code. Therefore, no federal or state income tax provision is required in the Fund’s financial statements.
Management has analyzed the Fund’s tax positions taken on income tax returns for all open tax years and has concluded that as of December 31, 2015, no provision for income tax is required in the Fund’s financial statements. The Fund’s federal and state income and federal excise tax returns for tax years for which the applicable statutes of limitations have not expired are subject to examination by the Internal Revenue Service and state departments of revenue.
Under the applicable foreign tax laws, a withholding tax may be imposed on interest, dividends and capital gains at various rates.
(r) Reclassification. GAAP requires that certain components of net assets be reclassified to reflect permanent differences between financial and tax reporting. These reclassifications have no effect on net assets or net asset value per share.
| | |
| 26 | | Western Asset Inflation Indexed Plus Bond Fund 2016 Semi-Annual Report |
2. Investment management agreement and other transactions with affiliates
Legg Mason Partners Fund Advisor, LLC (“LMPFA”) is the Fund’s investment manager. Western Asset Management Company (“Western Asset”), Western Asset Management Company Limited (“Western Asset Limited”), Western Asset Management Company Pte. Ltd. (“Western Singapore”) and Western Asset Management Company Ltd (“Western Japan”) are the Fund’s subadvisers. LMPFA, Western Asset, Western Asset Limited, Western Singapore and Western Japan are wholly owned subsidiaries of Legg Mason, Inc. (“Legg Mason”).
LMPFA provides the Fund with management and administrative services for which the Fund pays a fee calculated daily and paid monthly, at an annual rate of 0.20% of the Fund’s average daily net assets. For their services, LMFPA pays Western Asset, Western Limited, Western Singapore and Western Japan all of the management fee that it receives from the Fund.
LMPFA has agreed to waive fees and/or reimburse operating expenses, other than interest, brokerage commissions, taxes, extraordinary expenses and deferred organizational expenses, so that annual fund operating expenses did not exceed 0.90%, 1.65%, 1.40%, 0.85% and 1.15% for Class A, Class C, Class C1, Class FI and Class R shares, respectively. In addition, the ratio of total annual fund operating expenses for Class IS shares did not exceed the ratio of total annual fund operating expenses for Class I shares. These expense limitation arrangements cannot be terminated prior to December 31, 2017 without the Board of Directors’ consent.
LMPFA is permitted to recapture amounts waived and/or reimbursed to a class within two years after the fiscal year in which LMPFA earned the fee or incurred the expense if the class’ total annual operating expenses have fallen to a level below the expense limitation (“expense cap”) in effect at the time the fees were earned or the expenses incurred. In no case will LMPFA recapture any amount that would result, on any particular business day of the Fund, in the class’ total annual operating expenses exceeding the expense cap or any other lower limit then in effect.
Pursuant to these arrangements, at June 30, 2016, the Fund had no remaining fee waivers and/or expense reimbursements subject to recapture by LMPFA.
For the six months ended June 30, 2016, LMPFA did not recapture any fees.
Legg Mason Investor Services, LLC (“LMIS”), a wholly-owned broker-dealer subsidiary of Legg Mason, serves as the Fund’s sole and exclusive distributor.
There is a maximum initial sales charge of 4.25% for Class A shares. There is a contingent deferred sales charge (“CDSC”) of 1.00% on Class C shares, which applies if redemption occurs within 12 months from purchase payment. In certain cases, Class A shares have a 1.00% CDSC, which applies if redemption occurs within 18 months from purchase payment. This CDSC only applies to those purchases of Class A shares, which, when combined with current holdings of other shares of funds sold by LMIS, equal or exceed $1,000,000 in the aggregate. These purchases do not incur an initial sales charge.
| | |
| Western Asset Inflation Indexed Plus Bond Fund 2016 Semi-Annual Report | | 27 |
Notes to financial statements (unaudited) (cont’d)
For the six months ended June 30, 2016, LMIS and its affiliates retained sales charges of $289 on sales of the Fund’s Class A shares. In addition, there were no CDSCs paid to LMIS and its affiliates for the six months ended June 30, 2016.
All officers of the Corporation are employees of Legg Mason or its affiliates and do not receive compensation from the Corporation.
3. Investments
During the six months ended June 30, 2016, the aggregate cost of purchases and proceeds from sales of investments (excluding short-term investments) and U.S. Government & Agency Obligations were as follows:
| | | | | | | | |
| | | Investments | | | U.S. Government &
Agency Obligations | |
| Purchases | | $ | 33,160,821 | | | $ | 244,366,804 | |
| Sales | | | 35,143,749 | | | | 310,780,472 | |
At June 30, 2016, the aggregate gross unrealized appreciation and depreciation of investments for federal income tax purposes were substantially as follows:
| | | | |
| Gross unrealized appreciation | | $ | 23,600,131 | |
| Gross unrealized depreciation | | | (1,083,218) | |
| Net unrealized appreciation | | $ | 22,516,913 | |
During the six months ended June 30, 2016, written option transactions for the Fund were as follows:
| | | | | | | | |
| | | Number of Contracts | | | Premiums | |
| Written options, outstanding as of December 31, 2015 | | | 267 | | | $ | 96,101 | |
| Options written | | | 27,981 | | | | 4,987,817 | |
| Options closed | | | (24,680) | | | | (4,793,747) | |
| Options exercised | | | — | | | | — | |
| Options expired | | | (3,568) | | | | (290,171) | |
| Written options, outstanding as of June 30, 2016 | | | — | | | | — | |
At June 30, 2016, the Fund had the following open futures contracts:
| | | | | | | | | | | | | | | | | | | | |
| | | Number of
Contracts | | | Expiration
Date | | | Basis
Value | | | Market
Value | | | Unrealized
Appreciation
(Depreciation) | |
| Contracts to Buy: | | | | | | | | | | | | | | | | | | | | |
| 90-Day Eurodollar | | | 30 | | | | 12/16 | | | $ | 7,435,972 | | | $ | 7,449,375 | | | $ | 13,403 | |
| 90-Day Eurodollar | | | 1,750 | | | | 12/17 | | | | 432,772,488 | | | | 433,890,625 | | | | 1,118,137 | |
| | | | | | | | | | | | | | | | | | | | 1,131,540 | |
| Contracts to Sell: | | | | | | | | | | | | | | | | | | | | |
| 90-Day Eurodollar | | | 939 | | | | 12/18 | | | | 231,560,936 | | | | 232,355,550 | | | | (794,614) | |
| Net unrealized appreciation on open futures contracts | | | | | | | $ | 336,926 | |
| | |
| 28 | | Western Asset Inflation Indexed Plus Bond Fund 2016 Semi-Annual Report |
At June 30, 2016, the Fund had the following open forward foreign currency contracts:
| | | | | | | | | | | | | | | | | | | | |
Currency
Purchased | | | Currency
Sold | | | Counterparty | | Settlement
Date | | | Unrealized
Appreciation
(Depreciation) | |
| JPY | | | 626,080,000 | | | USD | | | 5,679,168 | | | Bank of America N.A. | | | 7/14/16 | | | $ | 385,286 | |
| USD | | | 4,989,250 | | | JPY | | | 550,000,000 | | | Barclays Bank PLC | | | 7/14/16 | | | | (338,263) | |
| JPY | | | 683,890,000 | | | USD | | | 6,168,340 | | | Citibank N.A. | | | 7/14/16 | | | | 456,084 | |
| USD | | | 18,819,799 | | | CAD | | | 24,570,000 | | | Citibank N.A. | | | 7/14/16 | | | | (198,701) | |
| USD | | | 1,335,478 | | | CAD | | | 1,710,000 | | | Citibank N.A. | | | 7/14/16 | | | | 11,847 | |
| USD | | | 1,625,359 | | | CAD | | | 2,085,263 | | | Bank of America N.A. | | | 8/12/16 | | | | 11,105 | |
| USD | | | 9,502,068 | | | JPY | | | 1,016,816,327 | | | Bank of America N.A. | | | 8/12/16 | | | | (356,013) | |
| EUR | | | 3,505,762 | | | USD | | | 4,004,309 | | | Citibank N.A. | | | 8/12/16 | | | | (108,454) | |
| EUR | | | 9,432,289 | | | USD | | | 10,703,186 | | | Citibank N.A. | | | 8/12/16 | | | | (221,347) | |
| EUR | | | 13,927,491 | | | USD | | | 15,673,204 | | | Citibank N.A. | | | 8/12/16 | | | | (195,972) | |
| EUR | | | 4,283,648 | | | USD | | | 4,825,277 | | | Citibank N.A. | | | 8/12/16 | | | | (64,978) | |
| USD | | | 86,417 | | | EUR | | | 75,001 | | | Citibank N.A. | | | 8/12/16 | | | | 3,070 | |
| USD | | | 35,628,111 | | | EUR | | | 31,074,189 | | | Citibank N.A. | | | 8/12/16 | | | | 1,096,232 | |
| JPY | | | 256,846,424 | | | USD | | | 2,400,272 | | | UBS AG | | | 8/12/16 | | | | 89,866 | |
| Total | | | | | | | | | | | | | | | $ | 569,762 | |
| | |
Abbreviations used in this table: |
| CAD | | — Canadian Dollar |
| EUR | | — Euro |
| JPY | | — Japanese Yen |
| USD | | — United States Dollar |
4. Derivative instruments and hedging activities
Below is a table, grouped by derivative type, that provides information about the fair value and the location of derivatives within the Statement of Assets and Liabilities at June 30, 2016.
| | | | | | | | | | | | |
| ASSET DERIVATIVES1 | |
| | | Interest
Rate Risk | | | Foreign
Exchange Risk | | | Total | |
| Futures contracts2 | | $ | 1,131,540 | | | | — | | | $ | 1,131,540 | |
| Forward foreign currency contracts | | | — | | | $ | 2,053,490 | | | | 2,053,490 | |
| Total | | $ | 1,131,540 | | | $ | 2,053,490 | | | $ | 3,185,030 | |
| | | | | | | | | | | | |
| LIABILITY DERIVATIVES1 | |
| | | Interest Rate Risk | | | Foreign
Exchange Risk | | | Total | |
| Futures contracts2 | | $ | 794,614 | | | | — | | | $ | 794,614 | |
| Forward foreign currency contracts | | | — | | | $ | 1,483,728 | | | | 1,483,728 | |
| Total | | $ | 794,614 | | | $ | 1,483,728 | | | $ | 2,278,342 | |
| 1 | Generally, the balance sheet location for asset derivatives is receivables/net unrealized appreciation (depreciation) and for liability derivatives is payables/net unrealized appreciation (depreciation). |
| 2 | Includes cumulative appreciation (depreciation) of futures contracts as reported in the footnotes. Only variation margin is reported within the receivables and/or payables on the Statement of Assets and Liabilities. |
| | |
| Western Asset Inflation Indexed Plus Bond Fund 2016 Semi-Annual Report | | 29 |
Notes to financial statements (unaudited) (cont’d)
The following tables provide information about the effect of derivatives and hedging activities on the Fund’s Statement of Operations for the six months ended June 30, 2016. The first table provides additional detail about the amounts and sources of gains (losses) realized on derivatives during the period. The second table provides additional information about the change in unrealized appreciation (depreciation) resulting from the Fund’s derivatives and hedging activities during the period.
| | | | | | | | | | | | |
| AMOUNT OF REALIZED GAIN (LOSS) ON DERIVATIVES RECOGNIZED | |
| | | Interest
Rate Risk | | | Foreign
Exchange Risk | | | Total | |
| Purchased options1 | | $ | (1,256,737) | | | | — | | | $ | (1,256,737) | |
| Written options | | | 779,550 | | | | — | | | | 779,550 | |
| Futures contracts | | | (6,550,314) | | | | — | | | | (6,550,314) | |
| Forward foreign currency contracts2 | | | — | | | $ | (2,970,397) | | | | (2,970,397) | |
| Total | | $ | (7,027,501) | | | $ | (2,970,397) | | | $ | (9,997,898) | |
| 1 | Net realized gain (loss) from purchased options is reported in net realized gain (loss) from investment transactions in the Statement of Operations. |
| 2 | Net realized gain (loss) from forward foreign currency contracts is reported in net realized gain (loss) from foreign currency transactions in the Statement of Operations. |
| | | | | | | | | | | | |
| CHANGE IN UNREALIZED APPRECIATION (DEPRECIATION) ON DERIVATIVES RECOGNIZED | |
| | | Interest
Rate Risk | | | Foreign
Exchange Risk | | | Total | |
| Purchased options1 | | $ | (17,559) | | | | — | | | $ | (17,559) | |
| Written options | | | 29,055 | | | | | | | | 29,055 | |
| Futures contracts | | | 520,282 | | | | — | | | | 520,282 | |
| Forward foreign currency contracts2 | | | — | | | $ | 579,237 | | | | 579,237 | |
| Total | | $ | 531,778 | | | $ | 579,237 | | | $ | 1,111,015 | |
| 1 | The change in unrealized appreciation (depreciation) from purchased options is reported in the change in net unrealized appreciation (depreciation) from investments in the Statement of Operations. |
| 2 | The change in unrealized appreciation (depreciation) from forward foreign currency contracts is reported in the change in net unrealized appreciation (depreciation) from foreign currencies in the Statement of Operations. |
During the six months ended June 30, 2016, the volume of derivative activity for the Fund was as follows:
| | | | |
| | | Average Market
Value | |
| Purchased options | | $ | 403,899 | |
| Written options† | | | 294,308 | |
| Futures contracts (to buy) | | | 763,900,469 | |
| Futures contracts (to sell) | | | 865,743,153 | |
| Forward foreign currency contracts (to buy) | | | 26,294,396 | |
| Forward foreign currency contracts (to sell) | | | 58,800,232 | |
| † | At June 30, 2016, there were no open positions held in this derivative. |
| | |
| 30 | | Western Asset Inflation Indexed Plus Bond Fund 2016 Semi-Annual Report |
The following table presents by financial instrument, the Fund’s derivative assets net of the related collateral received by the Fund at June 30, 2016:
| | | | | | | | | | | | |
| | | Gross Amount of Derivative
Assets in the Statement of
Assets and Liabilities1 | | | Collateral
Received | | | Net
Amount | |
| Purchased options2 | | $ | 256,126 | | | | — | | | $ | 256,126 | |
| Futures contracts3 | | | 76,890 | | | | — | | | | 76,890 | |
| Forward foreign currency contracts | | | 2,053,490 | | | | — | | | | 2,053,490 | |
| Total | | $ | 2,386,506 | | | | — | | | $ | 2,386,506 | |
The following table presents by financial instrument, the Fund’s derivative liabilities net of the related collateral pledged by the Fund at June 30, 2016:
| | | | | | | | | | | | |
| | | Gross Amount of Derivative
Liabilities in the Statement of
Assets and Liabilities1 | | | Collateral
Pledged | | | Net
Amount | |
| Forward foreign currency contracts | | $ | 1,483,728 | | | | — | | | $ | 1,483,728 | |
| 1 | Absent an event of default or early termination, derivative assets and liabilities are presented gross and not offset in the Statement of Assets and Liabilities. |
| 2 | Market value of purchased options is reported in Investments at value in the Statement of Assets and Liabilities. |
| 3 | Amount represents the current day’s variation margin as reported in the Statement of Assets and Liabilities. It differs from the cumulative appreciation (depreciation) presented in the previous table. |
5. Class specific expenses, waivers and/or expense reimbursements
The Fund has adopted a Rule 12b-1 shareholder services and distribution plan and under that plan the Fund pays service and/or distribution fees with respect to its Class A, Class C, Class C1, Class FI and Class R shares calculated at the annual rate of 0.25%, 1.00%, 0.75%, 0.25% and 0.50% of the average daily net assets of each class, respectively. Service and/or distribution fees are accrued daily and paid monthly.
For the six months ended June 30, 2016, class specific expenses were as follows:
| | | | | | | | |
| | | Service and/or
Distribution Fees | | | Transfer Agent
Fees | |
| Class A | | $ | 26,815 | | | $ | 18,557 | |
| Class C | | | 6,055 | | | | 267 | |
| Class C1 | | | 6,613 | | | | 1,139 | |
| Class FI | | | 2,050 | | | | 1,048 | |
| Class R | | | 2,864 | | | | 1,311 | |
| Class I | | | — | | | | 54,636 | |
| Class IS | | | — | | | | 1,016 | |
| Total | | $ | 44,397 | | | $ | 77,974 | |
| | |
| Western Asset Inflation Indexed Plus Bond Fund 2016 Semi-Annual Report | | 31 |
Notes to financial statements (unaudited) (cont’d)
6. Distributions to shareholders by class
| | | | | | | | |
| | | Six Months Ended
June 30, 2016 | | | Year Ended
December 31, 2015 | |
| Net Investment Income: | | | | | | | | |
| Class A | | | — | | | $ | 29,607 | |
| Class C | | | — | | | | 1,911 | |
| Class C1 | | | — | | | | 2,917 | |
| Class FI | | | — | | | | 3,214 | |
| Class R | | | — | | | | 1,382 | |
| Class I | | | — | | | | 509,240 | |
| Class IS | | | — | | | | 542,195 | |
| Total | | | — | | | $ | 1,090,466 | |
| | |
| Return of Capital: | | | | | | | | |
| Class A | | | — | | | $ | 28,645 | |
| Class C | | | — | | | | 1,818 | |
| Class C1 | | | — | | | | 2,791 | |
| Class FI | | | — | | | | 3,037 | |
| Class R | | | — | | | | 1,339 | |
| Class I | | | — | | | | 492,078 | |
| Class IS | | | — | | | | 524,049 | |
| Total | | | — | | | $ | 1,053,757 | |
7. Capital shares
At June 30, 2016, the Corporation had 42.7 billion shares of capital stock authorized with a par value of $0.001 per share.
Transactions in shares of each class were as follows:
| | | | | | | | | | | | | | | | |
| | | Six Months Ended
June 30, 2016 | | | Year Ended
December 31, 2015 | |
| | | Shares | | | Amount | | | Shares | | | Amount | |
| Class A | | | | | | | | | | | | | | | | |
| Shares sold | | | 397,705 | | | $ | 4,397,758 | | | | 790,759 | | | $ | 8,748,320 | |
| Shares issued on reinvestment | | | — | | | | — | | | | 3,276 | | | | 36,081 | |
| Shares repurchased | | | (221,648) | | | | (2,453,590) | | | | (411,145) | | | | (4,561,014) | |
| Net increase | | | 176,057 | | | $ | 1,944,168 | | | | 382,890 | | | $ | 4,223,387 | |
| | | | |
| Class C | | | | | | | | | | | | | | | | |
| Shares sold | | | 2,985 | | | $ | 31,953 | | | | 3,177 | | | $ | 35,090 | |
| Shares issued on reinvestment | | | — | | | | — | | | | 345 | | | | 3,729 | |
| Shares repurchased | | | (10,204) | | | | (112,033) | | | | (13,281) | | | | (141,985) | |
| Net decrease | | | (7,219) | | | $ | (80,080) | | | | (9,759) | | | $ | (103,166) | |
| | | | |
| Class C1 | | | | | | | | | | | | | | | | |
| Shares sold | | | 1,933 | | | $ | 21,087 | | | | 1,548 | | | $ | 17,041 | |
| Shares issued on reinvestment | | | — | | | | — | | | | 506 | | | | 5,519 | |
| Shares repurchased | | | (12,412) | | | | (134,825) | | | | (21,156) | | | | (233,953) | |
| Net decrease | | | (10,479) | | | $ | (113,738) | | | | (19,102) | | | $ | (211,393) | |
| | |
| 32 | | Western Asset Inflation Indexed Plus Bond Fund 2016 Semi-Annual Report |
| | | | | | | | | | | | | | | | |
| | | Six Months Ended
June 30, 2016 | | | Year Ended
December 31, 2015 | |
| | | Shares | | | Amount | | | Shares | | | Amount | |
| Class FI | | | | | | | | | | | | | | | | |
| Shares sold | | | 149,031 | | | $ | 1,618,548 | | | | 410,450 | | | $ | 4,581,677 | |
| Shares issued on reinvestment | | | — | | | | — | | | | 571 | | | | 6,248 | |
| Shares repurchased | | | (188,644) | | | | (2,046,371) | | | | (526,930) | | | | (5,833,546) | |
| Net decrease | | | (39,613) | | | $ | (427,823) | | | | (115,909) | | | $ | (1,245,621) | |
| | | | |
| Class R | | | | | | | | | | | | | | | | |
| Shares sold | | | 46,295 | | | $ | 504,024 | | | | 73,231 | | | $ | 808,546 | |
| Shares issued on reinvestment | | | — | | | | — | | | | 135 | | | | 1,471 | |
| Shares repurchased | | | (15,386) | | | | (168,149) | | | | (25,718) | | | | (285,860) | |
| Net increase | | | 30,909 | | | $ | 335,875 | | | | 47,648 | | | $ | 524,157 | |
| | | | |
| Class I | | | | | | | | | | | | | | | | |
| Shares sold | | | 1,329,013 | | | $ | 14,708,452 | | | | 3,692,644 | | | $ | 41,617,148 | |
| Shares issued on reinvestment | | | — | | | | — | | | | 88,861 | | | | 984,651 | |
| Shares repurchased | | | (2,137,959) | | | | (23,732,447) | | | | (17,967,855) | | | | (199,671,825) | |
| Net decrease | | | (808,946) | | | $ | (9,023,995) | | | | (14,186,350) | | | $ | (157,070,026) | |
| | | | |
| Class IS | | | | | | | | | | | | | | | | |
| Shares sold | | | 4,076,531 | | | $ | 45,508,914 | | | | 21,609,818 | | | $ | 241,172,711 | |
| Shares issued on reinvestment | | | — | | | | — | | | | 92,496 | | | | 1,027,701 | |
| Shares repurchased | | | (9,995,216) | | | | (111,499,525) | | | | (5,018,165) | | | | (56,278,954) | |
| Net increase (decrease) | | | (5,918,685) | | | $ | (65,990,611) | | | | 16,684,149 | | | $ | 185,921,458 | |
8. Redemption facility
Effective November 24, 2015, the Fund and certain other participating funds within the Corporation (the “Participating Funds”), have available an unsecured revolving credit facility (the “Redemption Facility”) from the lenders and The Bank of New York Mellon (“BNY Mellon”), as administrative agent for the lenders. The Redemption Facility is to be used for temporary or emergency purposes as an additional source of liquidity to fund redemptions of shares. Under the agreement, BNY Mellon provides a 364-day revolving credit facility, in the aggregate amount of $265 million. Unless renewed, the agreement will terminate on November 22, 2016. Any borrowings under the Redemption Facility will bear interest at current market rates as set forth in the credit agreement. The annual commitment fee to maintain the Redemption Facility is 0.10% and is incurred on the unused portion of the facility and is allocated to all Participating Funds pro rata based on net assets. For the six months ended June 30, 2016, the Fund incurred a commitment fee in the amount of $3,279. The Fund did not utilize the Redemption Facility during the six months ended June 30, 2016.
9. Deferred capital losses
As of December 31, 2015, the Fund had deferred capital losses of $7,883,261, which have no expiration date, that will be available to offset future taxable capital gains.
| | |
| Western Asset Inflation Indexed Plus Bond Fund 2016 Semi-Annual Report | | 33 |
Western Asset
Inflation Indexed Plus Bond Fund
Directors
Robert Abeles, Jr.
Anita L. DeFrantz
Ronald L. Olson
Avedick B. Poladian
William E. B. Siart
Chairman
Jaynie M. Studenmund
Investment manager
Legg Mason Partners Fund Advisor, LLC
Subadvisers
Western Asset Management Company
Western Asset Management Company Limited
Western Asset Management Company Ltd
Western Asset Management Company Pte. Ltd.
Transfer agent
BNY Mellon Investment Servicing (US) Inc.
4400 Computer Drive
Westborough, MA 01581
Custodian
State Street Bank and Trust Company
Independent registered public accounting firm
PricewaterhouseCoopers LLP
Baltimore, MD
Western Asset Inflation Indexed Plus Bond Fund
The Fund is a separate investment series of Western Asset Funds, Inc.
Western Asset Inflation Indexed Plus Bond Fund
Legg Mason Funds
620 Eighth Avenue, 49th Floor
New York, NY 10018
The Fund files its complete schedule of portfolio holdings with the Securities and Exchange Commission (“SEC”) for the first and third quarters of each fiscal year on Form N-Q. The Fund’s Forms N-Q are available on the SEC’s website at www.sec.gov. The Fund’s Forms N-Q may be reviewed and copied at the SEC’s Public Reference Room in Washington, D.C., and information on the operation of the Public Reference Room may be obtained by calling 1-800-SEC-0330. To obtain information on Form N-Q, shareholders can call the Fund at 1-877-721-1926.
Information on how the Fund voted proxies relating to portfolio securities during the prior 12-month period ended June 30th of each year and a description of the policies and procedures that the Fund uses to determine how to vote proxies related to portfolio transactions are available (1) without charge, upon request, by calling the Fund at 1-877-721-1926, (2) at www.leggmason.com/mutualfunds and (3) on the SEC’s website at www.sec.gov.
This report is submitted for the general information of the shareholders of Western Asset Inflation Indexed Plus Bond Fund. This report is not authorized for distribution to prospective investors in the Fund unless preceded or accompanied by a current prospectus.
Investors should consider the Fund’s investment objectives, risks, charges and expenses carefully before investing. The prospectus contains this and other important information about the Fund. Please read the prospectus carefully before investing.
www.leggmason.com
© 2016 Legg Mason Investor Services, LLC
Member FINRA, SIPC
Legg Mason Funds Privacy and Security Notice
Your Privacy and the Security of Your Personal Information is Very Important to the Legg Mason Funds
This Privacy and Security Notice (the “Privacy Notice”) addresses the Legg Mason Funds’ privacy and data protection practices with respect to nonpublic personal information the Funds receive. The Legg Mason Funds include any funds sold by the Funds’ distributor, Legg Mason Investor Services, LLC, as well as Legg Mason-sponsored closed-end funds and certain closed-end funds managed or sub-advised by Legg Mason or its affiliates. The provisions of this Privacy Notice apply to your information both while you are a shareholder and after you are no longer invested with the Funds.
The Type of Nonpublic Personal Information the Funds Collect About You
The Funds collect and maintain nonpublic personal information about you in connection with your shareholder account. Such information may include, but is not limited to:
| • | | Personal information included on applications or other forms; |
| • | | Account balances, transactions, and mutual fund holdings and positions; |
| • | | Online account access user IDs, passwords, security challenge question responses; and |
| • | | Information received from consumer reporting agencies regarding credit history and creditworthiness (such as the amount of an individual’s total debt, payment history, etc.). |
How the Funds Use Nonpublic Personal Information About You
The Funds do not sell or share your nonpublic personal information with third parties or with affiliates for their marketing purposes, or with other financial institutions or affiliates for joint marketing purposes, unless you have authorized the Funds to do so. The Funds do not disclose any nonpublic personal information about you except as may be required to perform transactions or services you have authorized or as permitted or required by law. The Funds may disclose information about you to:
| • | | Employees, agents, and affiliates on a “need to know” basis to enable the Funds to conduct ordinary business or comply with obligations to government regulators; |
| • | | Service providers, including the Funds’ affiliates, who assist the Funds as part of the ordinary course of business (such as printing, mailing services, or processing or servicing your account with us) or otherwise perform services on the Funds’ behalf, including companies that may perform marketing services solely for the Funds; |
| • | | The Funds’ representatives such as legal counsel, accountants and auditors; and |
| • | | Fiduciaries or representatives acting on your behalf, such as an IRA custodian or trustee of a grantor trust. |
|
| NOT PART OF THE SEMI-ANNUAL REPORT |
Legg Mason Funds Privacy and Security Notice (cont’d)
Except as otherwise permitted by applicable law, companies acting on the Funds’ behalf are contractually obligated to keep nonpublic personal information the Funds provide to them confidential and to use the information the Funds share only to provide the services the Funds ask them to perform.
The Funds may disclose nonpublic personal information about you when necessary to enforce their rights or protect against fraud, or as permitted or required by applicable law, such as in connection with a law enforcement or regulatory request, subpoena, or similar legal process. In the event of a corporate action or in the event a Fund service provider changes, the Funds may be required to disclose your nonpublic personal information to third parties. While it is the Funds’ practice to obtain protections for disclosed information in these types of transactions, the Funds cannot guarantee their privacy policy will remain unchanged.
Keeping You Informed of the Funds’ Privacy and Security Practices
The Funds will notify you annually of their privacy policy as required by federal law. While the Funds reserve the right to modify this policy at any time they will notify you promptly if this privacy policy changes.
The Funds’ Security Practices
The Funds maintain appropriate physical, electronic and procedural safeguards designed to guard your nonpublic personal information. The Funds’ internal data security policies restrict access to your nonpublic personal information to authorized employees, who may use your nonpublic personal information for Fund business purposes only.
Although the Funds strive to protect your nonpublic personal information, they cannot ensure or warrant the security of any information you provide or transmit to them, and you do so at your own risk. In the event of a breach of the confidentiality or security of your nonpublic personal information, the Funds will attempt to notify you as necessary so you can take appropriate protective steps. If you have consented to the Funds using electronic communications or electronic delivery of statements, they may notify you under such circumstances using the most current email address you have on record with them.
In order for the Funds to provide effective service to you, keeping your account information accurate is very important. If you believe that your account information is incomplete, not accurate or not current, or if you have questions about the Funds’ privacy practices, write the Funds using the contact information on your account statements, email the Funds by clicking on the Contact Us section of the Funds’ website at www.leggmason.com, or contact the Fund at 1-877-721-1926.
|
| NOT PART OF THE SEMI-ANNUAL REPORT |
Western Asset Management Company
Legg Mason, Inc. Subsidiaries
www.leggmason.com
© 2016 Legg Mason Investor Services, LLC Member FINRA, SIPC
WASX012829 8/16 SR16-2859
| | |
| ITEM 2. | | CODE OF ETHICS. |
| |
| | Not applicable. |
| |
| ITEM 3. | | AUDIT COMMITTEE FINANCIAL EXPERT. |
| |
| | Not applicable. |
| |
| ITEM 4. | | PRINCIPAL ACCOUNTANT FEES AND SERVICES. |
| |
| | Not applicable. |
| |
| ITEM 5. | | AUDIT COMMITTEE OF LISTED REGISTRANTS. |
| |
| | Not applicable. |
| |
| ITEM 6. | | SCHEDULE OF INVESTMENTS. |
| |
| | Included herein under Item 1. |
| |
| ITEM 7. | | DISCLOSURE OF PROXY VOTING POLICIES AND PROCEDURES FOR CLOSED-END MANAGEMENT INVESTMENT COMPANIES. |
| |
| | Not applicable. |
| |
| ITEM 8. | | PORTFOLIO MANAGERS OF CLOSED-END MANAGEMENT INVESTMENT COMPANIES. |
| |
| | Not applicable. |
| |
| ITEM 9. | | PURCHASES OF EQUITY SECURITIES BY CLOSED-END MANAGEMENT INVESTMENT COMPANY AND AFFILIATED PURCHASERS. |
| |
| | Not applicable. |
| |
| ITEM 10. | | SUBMISSION OF MATTERS TO A VOTE OF SECURITY HOLDERS. |
| |
| | Not applicable. |
| |
| ITEM 11. | | CONTROLS AND PROCEDURES. |
| |
| | (a) The registrant’s principal executive officer and principal financial officer have concluded that the registrant’s disclosure controls and procedures (as defined in Rule 30a- 3(c) under the Investment Company Act of 1940, as amended (the “1940 Act”)) are effective as of a date within 90 days of the filing date of this report that includes the disclosure required by this paragraph, based on their evaluation of the disclosure controls and procedures required by Rule 30a-3(b) under the 1940 Act and 15d-15(b) under the Securities Exchange Act of 1934. |
| |
| | (b) There were no changes in the registrant’s internal control over financial reporting (as defined in Rule 30a-3(d) under the 1940 Act) that occurred during the second fiscal quarter of the period covered by this report that have materially affected, or are likely to materially affect the registrant’s internal control over financial reporting |
| |
| ITEM 12. | | EXHIBITS. |
| |
| | (a) (1) Not applicable. |
| | Exhibit 99.CODE ETH |
| |
| | (a) (2) Certifications pursuant to section 302 of the Sarbanes-Oxley Act of 2002 attached hereto. |
| | Exhibit 99.CERT |
| |
| | (b) Certifications pursuant to Section 906 of the Sarbanes-Oxley Act of 2002 attached hereto. |
| | Exhibit 99.906CERT |
SIGNATURES
Pursuant to the requirements of the Securities Exchange Act of 1934 and the Investment Company Act of 1940, the registrant has duly caused this Report to be signed on its behalf by the undersigned, there unto duly authorized.
Western Asset Funds, Inc.
| | |
| By: | | /s/ Jane Trust |
| | Jane Trust |
| | Chief Executive Officer |
| |
| Date: | | August 22, 2016 |
Pursuant to the requirements of the Securities Exchange Act of 1934 and the Investment Company Act of 1940, this report has been signed below by the following persons on behalf of the registrant and in the capacities and on the dates indicated.
| | |
| By: | | /s/ Jane Trust |
| | Jane Trust |
| | Chief Executive Officer |
| |
| Date: | | August 22, 2016 |
| |
| By: | | /s/ Richard F. Sennett |
| | Richard F. Sennett |
| | Principal Financial Officer |
| |
| Date: | | August 22, 2016 |