UNITED STATES
SECURITIES AND EXCHANGE COMMISSION
Washington, D.C. 20549
FORM N-CSR
CERTIFIED SHAREHOLDER REPORT OF REGISTERED
MANAGEMENT INVESTMENT COMPANIES
Investment Company Act file number 811-06110
Western Asset Funds, Inc.
(Exact name of registrant as specified in charter)
620 Eighth Avenue, 49th Floor, New York, NY 10018
(Address of principal executive offices) (Zip code)
Robert I. Frenkel, Esq.
Legg Mason & Co., LLC
100 First Stamford Place
Stamford, CT 06902
(Name and address of agent for service)
Registrant’s telephone number, including area code: 1-877-721-1926
Date of fiscal year end: May 31
Date of reporting period: November 30, 2017
ITEM 1. REPORT TO STOCKHOLDERS.
The Semi-Annual Report to Stockholders is filed herewith.

| | |
| Semi-Annual Report | | November 30, 2017 |
WESTERN ASSET
HIGH YIELD FUND

|
| INVESTMENT PRODUCTS: NOT FDIC INSURED • NO BANK GUARANTEE • MAY LOSE VALUE |
Fund objective
The Fund seeks to maximize total return, consistent with prudent investment management.
Letter from the president

Dear Shareholder,
We are pleased to provide the semi-annual report of Western Asset High Yield Fund for the six-month reporting period ended November 30, 2017. Please read on for Fund performance information and a detailed look at prevailing economic and market conditions during the Fund’s reporting period.
As always, we remain committed to providing you with excellent service and a full spectrum of investment choices. We also remain committed to supplementing the support you receive from your financial advisor. One way we accomplish this is through our website, www.leggmason.com. Here you can gain immediate access to market and investment information, including:
| • | | Fund prices and performance, |
| • | | Market insights and commentaries from our portfolio managers, and |
| • | | A host of educational resources. |
We look forward to helping you meet your financial goals.
Sincerely,

Jane Trust, CFA
President and Chief Executive Officer
December 29, 2017
| | |
| II | | Western Asset High Yield Fund |
Investment commentary
Economic review
Economic activity in the U.S. improved during the six months ended November 30, 2017 (the “reporting period”). Looking back, the U.S. Department of Commerce reported that first quarter 2017 U.S. gross domestic product (“GDP”)i growth, as revised, was 1.2%. Second quarter 2017 GDP growth then accelerated to 3.1%. Finally, the U.S. Department of Commerce’s final reading for third quarter 2017 GDP growth — released after the reporting period ended — was 3.2%. Stronger growth was attributed to a number of factors, including positive contributions from private inventory investment and upturns in state and local government spending. These positive factors were partly offset by a decrease in personal consumption expenditures, nonresidential fixed investment and exports.
Job growth in the U.S. was solid overall and supported the economy during the reporting period. When the reporting period ended on November 30, 2017, the unemployment rate was 4.1%, as reported by the U.S. Department of Labor. This equaled the lowest unemployment rate since December 2000. The percentage of longer-term unemployed declined during the reporting period. In November 2017, 23.8% of Americans looking for a job had been out of work for more than six months, versus 24.3% when the period began.
Turning to the global economy, in its October 2017 World Economic Outlook Update, the International Monetary Fund (“IMF”)ii said, “The pickup in growth projected in the April 2017 World Economic Outlook is strengthening. The global growth forecast for 2017 and 2018 — 3.6 percent and 3.7 percent, respectively — is 0.1 percentage point higher in both years than in the April [2017] and July [2017] forecasts. Notable pickups in investment, trade, and industrial production, coupled with strengthening business and consumer confidence, are supporting the recovery.” From a regional perspective, the IMF estimates 2017 growth in the Eurozone will be 2.1%, versus 1.8% in 2016. Japan’s economy is expected to expand 1.5% in 2017, compared to 1.0% in 2016. Elsewhere, the IMF projects that overall growth in emerging market countries will accelerate to 4.6% in 2017, versus 4.3% in 2016.
| | |
| Western Asset High Yield Fund | | III |
Investment commentary (cont’d)
Market review
Q. How did the Federal Reserve Board (the “Fed”)iii respond to the economic environment?
A. Looking back, after an extended period of maintaining the federal funds rateiv at a historically low range between zero and 0.25%, the Fed increased the rate at its meeting on December 16, 2015. In particular, the U.S. central bank raised the federal funds rate to a range between 0.25% and 0.50%. The Fed then kept rates on hold at each meeting prior to its meeting on December 14, 2016, at which time, the Fed raised rates to a range between 0.50% and 0.75%.
The Fed’s next rate hike occurred at its meeting that ended on March 15, 2017, as it raised rates to a range between 0.75% and 1.00%. At its meeting that concluded on June 14, 2017, the Fed then raised rates to a range between 1.00% and 1.25%. During its meeting that concluded on September 20, 2017, the Fed kept rates on hold, but reiterated its intention to begin reducing its balance sheet, saying, “In October, the Committee will initiate the balance sheet normalization program….” Finally, at its meeting that ended on December 13, 2017, after the reporting period ended, the Fed raised rates to a range between 1.25% and 1.50%.
Q. What actions did international central banks take during the reporting period?
A. Central banks outside the U.S. largely maintained their accommodative monetary policy stances during the reporting period. In March 2016, the European Central Bank (“ECB”)v announced that it would increase its bond purchasing program to €80 billion-per-month. It also lowered its deposit rate to -0.4% and its main interest rate to 0%. In December 2016, the ECB again extended its bond buying program until December 2017. From April 2017 through December 2017, the ECB purchased €60 billion-per-month of bonds. Finally, in October 2017, the ECB announced that it would continue to buy bonds through September 2018, but after December 2017 it would pare its purchases to €30 billion-per-month. However, the ECB did not change its key interest rates. In other developed countries, in August 2016, the Bank of England (“BoE”)vi lowered interest rates from 0.50% to 0.25%, a new record low. However, on November 2, 2017, the BoE raised rates from 0.25% to 0.50% — the first increase since July 2007. After holding rates steady at 0.10% for more than five years, in January 2016, the Bank of Japanvii announced that it cut the rate on current accounts that commercial banks hold with it to -0.10% and kept rates on hold during the reporting period. Elsewhere, the People’s Bank of Chinaviii kept rates steady at 4.35% during the reporting period.
Q. Did Treasury yields trend higher or lower during the reporting period?
A. Both short-term and longer-term Treasury yields moved higher during the six-month reporting period ended November 30, 2017. The yield for the two-year Treasury note began the reporting period at 1.28%. The low for the period of 1.27% occurred on September 7 and September 8, 2017. The yield for the two-year Treasury note ended the reporting period at 1.78% — equaling its high for the period. The yield for the ten-year Treasury began the reporting period at 2.21% and ended the period at 2.42%. The low for the period of 2.05% occurred on September 7, 2017, and the peak of 2.46% took place on October 26, 2017.
| | |
| IV | | Western Asset High Yield Fund |
Q. What factors impacted the spread sectors (non-Treasuries) during the reporting period?
A. The spread sectors posted mixed results during the reporting period. Performance fluctuated given shifting expectations for global growth, questions regarding future central bank monetary policy, uncertainties pertaining to U.S. fiscal policy and several geopolitical issues. The broad U.S. bond market, as measured by the Bloomberg Barclays U.S. Aggregate Indexix, returned 0.68% during the six-month reporting period ended November 30, 2017.
Q. How did the high-yield bond market perform over the reporting period?
A. The U.S. high-yield bond market, as measured by the Bloomberg Barclays U.S. Corporate High Yield — 2% Issuer Cap Indexx, gained 2.29% for the six months ended November 30, 2017. The high-yield market rallied in June and July 2017. This was driven by overall robust demand from investors looking to generate incremental yield in the low interest rate environment. The high yield market was then relatively flat in August 2017, and again moved higher in September and October 2017. However, the high-yield market then experienced a modest setback in November 2017.
Q. How did the emerging markets debt asset class perform over the reporting period?
A. The JPMorgan Emerging Markets Bond Index Global (“EMBI Global”)xi returned 2.03% during the six months ended November 30, 2017. The asset class posted positive results during four of the six months of the reporting period. This was triggered by overall strong investor demand, less concern over a significant shift in U.S. trade policy and a weakening U.S. dollar.
Performance review
For the six months ended November 30, 2017, Class I shares of Western Asset High Yield Fund returned 2.61%. The Fund’s unmanaged benchmark, the Bloomberg Barclays U.S. Corporate High Yield — 2% Issuer Cap Index, returned 2.29% for the same period. The Lipper High Yield Funds Category Average1 returned 2.01% over the same time frame.
| | | | |
Performance Snapshot as of November 30, 2017
(unaudited) | |
| (excluding sales charges) | | 6 months | |
| Western Asset High Yield Fund2: | | | | |
Class A | | | 2.35 | % |
Class A2 | | | 2.48 | % |
Class C | | | 2.09 | % |
Class R | | | 2.31 | % |
Class I | | | 2.61 | % |
Class IS | | | 2.64 | % |
Bloomberg Barclays U.S. Corporate
High Yield — 2% Issuer Cap Index | | | 2.29 | % |
Lipper High Yield Funds
Category Average1 | | | 2.01 | % |
The performance shown represents past performance. Past performance is no guarantee of future results and current performance may be higher or lower than the performance shown above. Principal value, investment returns and yields will fluctuate and investors’ shares, when redeemed, may be worth more or less than their original cost. To obtain
| 1 | Lipper, Inc., a wholly-owned subsidiary of Reuters, provides independent insight on global collective investments. Returns are based on the six-month period ended November 30, 2017, including the reinvestment of all distributions, including returns of capital, if any, calculated among the 709 funds in the Fund’s Lipper category, and excluding sales charges, if any. |
| 2 | Effective June 1, 2017, the Fund changed its security pricing methodology to now use the mean value of the bid and ask prices (of underlying fund holdings) to calculate the NAV. The Fund had a one-time increase to the NAV, which was due to this change in pricing methodology. |
| | |
| Western Asset High Yield Fund | | V |
Investment commentary (cont’d)
performance data current to the most recent month-end, please visit our website at www.leggmason.com/mutualfunds.
All share class returns assume the reinvestment of all distributions, including returns of capital, if any, at net asset value and the deduction of all Fund expenses. Returns have not been adjusted to include sales charges that may apply or the deduction of taxes that a shareholder would pay on Fund distributions. If sales charges were reflected, the performance quoted would be lower. Performance figures for periods shorter than one year represent cumulative figures and are not annualized.
Fund performance figures reflect fee waivers and/or expense reimbursements, without which the performance would have been lower.
The 30-Day SEC Yields for the period ended November 30, 2017 for Class A, Class A2, Class C, Class R, Class I and Class IS shares were 4.55%, 4.59%, 4.02%, 4.46%, 5.01% and 5.11%, respectively. Absent fee waivers and/or expense reimbursements, the 30-Day SEC Yields for Class R and Class IS shares would have been 4.42% and 5.09%, respectively. The 30-Day SEC Yield, calculated pursuant to the standard SEC formula, is based on a Fund’s investments over an annualized trailing 30-day period, and not on the distributions paid by the Fund, which may differ.
|
| Total Annual Operating Expenses (unaudited) |
As of the Fund’s current prospectus dated September 30, 2017, the gross total annual fund operating expense ratios for Class A, Class A2, Class C, Class R, Class I and Class IS shares were 1.00%, 0.97%, 1.73%, 1.46%, 0.71% and 0.66%, respectively.
Actual expenses may be higher. For example, expenses may be higher than those shown if average net assets decrease. Net assets are more likely to decrease and Fund expense ratios are more likely to increase when markets are volatile.
As a result of expense limitation arrangements, the ratio of total annual fund operating expenses, other than interest, brokerage commissions, taxes, extraordinary expenses, deferred organizational expenses and acquired fund fees and expenses, to average net assets will not exceed 1.05% for Class A shares, 1.25% for Class A2 shares, 1.80% for Class C shares, 1.30% for Class R shares and 0.65% for Class IS shares. In addition, the ratio of total annual fund operating expenses for Class IS shares will not exceed the ratio of total annual fund operating expenses for Class I shares. These expense limitation arrangements cannot be terminated prior to December 31, 2019 without the Board of Directors’ consent.
The manager is permitted to recapture amounts waived and/or reimbursed to a class within two years after the fiscal year in which the manager earned the fee or incurred the expense if the class’ total annual operating expenses have fallen to a level below the expense limitation (“expense cap”) in effect at the time the fees were earned or the expenses incurred. In no case will the manager recapture any amount that would result, on any particular business day of the Fund, in the class’ total annual operating expenses exceeding the expense cap or any other lower limit then in effect.
As always, thank you for your confidence in our stewardship of your assets.
Sincerely,
Jane Trust, CFA
President and Chief Executive Officer
December 29, 2017
| | |
| VI | | Western Asset High Yield Fund |
RISKS: Fixed-income securities involve interest rate, credit, inflation and reinvestment risks. As interest rates rise, the value of fixed-income securities falls. Derivatives, such as options, futures and swaps, can be illiquid, may disproportionately increase losses, and have a potentially large impact on Fund performance. International investments are subject to special risks including currency fluctuations and social, economic and political uncertainties, which could increase volatility. These risks are magnified in emerging markets. The use of leverage may increase volatility and possibility of loss. Securities rated below investment grade are commonly known as “junk bonds” or “high yield securities.” The risks of high yield securities include greater price volatility, illiquidity and possibility of default. Asset-backed, mortgage-backed or mortgage-related securities are subject to prepayment and extension risks. Please see the Fund’s prospectus for a more complete discussion of these and other risks and the Fund’s investment strategies.
All investments are subject to risk including the possible loss of principal. Past performance is no guarantee of future results. All index performance reflects no deduction for fees, expenses or taxes. Please note that an investor cannot invest directly in an index.
The information provided is not intended to be a forecast of future events, a guarantee of future results or investment advice. Views expressed may differ from those of the firm as a whole. Forecasts and predictions are inherently limited and should not be relied upon as an indication of actual or future performance.
| i | Gross domestic product (“GDP”) is the market value of all final goods and services produced within a country in a given period of time. |
| ii | The International Monetary Fund (“IMF”) is an organization of 189 countries, working to foster global monetary cooperation, secure financial stability, facilitate international trade, promote high employment and sustainable economic growth, and reduce poverty around the world. |
| iii | The Federal Reserve Board (the “Fed”) is responsible for the formulation of U.S. policies designed to promote economic growth, full employment, stable prices and a sustainable pattern of international trade and payments. |
| iv | The federal funds rate is the rate charged by one depository institution on an overnight sale of immediately available funds (balances at the Federal Reserve) to another depository institution; the rate may vary from depository institution to depository institution and from day to day. |
| v | The European Central Bank (“ECB”) is responsible for the monetary system of the European Union and the euro currency. |
| vi | The Bank of England (“BoE”), formally the Governor and Company of the BoE, is the central bank of the United Kingdom. The BoE’s purpose is to maintain monetary and financial stability. |
| vii | The Bank of Japan is the central bank of Japan. The bank is responsible for issuing and handling currency and treasury securities, implementing monetary policy, maintaining the stability of the Japanese financial system and the yen currency. |
| viii | The People’s Bank of China is the central bank of the People’s Republic of China with the power to carry out monetary policy and regulate financial institutions in mainland China. |
| ix | The Bloomberg Barclays U.S. Aggregate Index is a broad-based bond index comprised of government, corporate, mortgage- and asset-backed issues, rated investment grade or higher, and having at least one year to maturity. |
| x | The Bloomberg Barclays U.S. Corporate High Yield — 2% Issuer Cap Index is an index of the 2% Issuer Cap component of the Bloomberg Barclays U.S. Corporate High Yield Index, which covers the U.S. dollar-denominated, non-investment grade, fixed-rate, taxable corporate bond market. |
| xi | The JPMorgan Emerging Markets Bond Index Global (“EMBI Global”) tracks total returns for U.S. dollar-denominated debt instruments issued by emerging market sovereign and quasi-sovereign entities: Brady bonds, loans, Eurobonds and local market instruments. |
| | |
| Western Asset High Yield Fund | | VII |
Fund at a glance† (unaudited)
Investment breakdown (%) as a percent of total investments
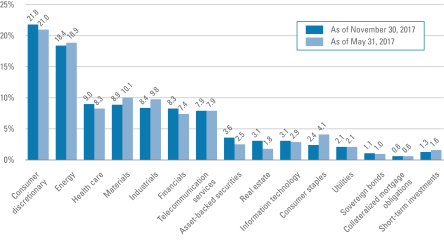
| † | The bar graph above represents the composition of the Fund’s investments as of November 30, 2017 and May 31, 2017 and does not include derivatives, such as futures contracts, forward foreign currency contracts and swap contracts. The Fund is actively managed. As a result, the composition of the Fund’s investments is subject to change at any time. |
| | |
| Western Asset High Yield Fund 2017 Semi-Annual Report | | 1 |
Fund expenses (unaudited)
Example
As a shareholder of the Fund, you may incur two types of costs: (1) transaction costs, including front-end and back-end sales charges (loads) on purchase payments; and (2) ongoing costs, including management fees; service and/or distribution (12b-1) fees; and other Fund expenses. This example is intended to help you understand your ongoing costs (in dollars) of investing in the Fund and to compare these costs with the ongoing costs of investing in other mutual funds.
This example is based on an investment of $1,000 invested on June 1, 2017 and held for the six months ended November 30, 2017.
Actual expenses
The table below titled “Based on Actual Total Return” provides information about actual account values and actual expenses. You may use the information provided in this table, together with the amount you invested, to estimate the expenses that you paid over the period. To estimate the expenses you paid on your account, divide your ending account value by $1,000 (for example, an $8,600 ending account value divided by $1,000 = 8.6), then multiply the result by the number under the heading entitled “Expenses Paid During the Period”.
Hypothetical example for comparison purposes
The table below titled “Based on Hypothetical Total Return” provides information about hypothetical account values and hypothetical expenses based on the actual expense ratio and an assumed rate of return of 5.00% per year before expenses, which is not the Fund’s actual return. The hypothetical account values and expenses may not be used to estimate the actual ending account balance or expenses you paid for the period. You may use the information provided in this table to compare the ongoing costs of investing in the Fund and other funds. To do so, compare the 5.00% hypothetical example relating to the Fund with the 5.00% hypothetical examples that appear in the shareholder reports of the other funds.
Please note that the expenses shown in the table below are meant to highlight your ongoing costs only and do not reflect any transactional costs, such as front-end or back-end sales charges (loads). Therefore, the table is useful in comparing ongoing costs only, and will not help you determine the relative total costs of owning different funds. In addition, if these transaction costs were included, your costs would have been higher.
| | | | | | | | | | | | | | | | | | | | | | | | | | | | | | | | | | | | | | | | | | | | | | |
| Based on actual total return1 | | | | | | Based on hypothetical total return1 | |
| | | Actual
Total Return
Without
Sales
Charge2 | | | Beginning
Account
Value | | | Ending
Account
Value | | | Annualized
Expense
Ratio | | | Expenses
Paid
During
the
Period3 | | | | | | | | Hypothetical
Annualized
Total Return | | | Beginning
Account
Value | | | Ending
Account
Value | | | Annualized
Expense
Ratio | | | Expenses
Paid
During
the
Period3 | |
| Class A | | | 2.35 | % | | $ | 1,000.00 | | | $ | 1,023.50 | | | | 0.99 | % | | $ | 5.02 | | | | | | | Class A | | | 5.00 | % | | $ | 1,000.00 | | | $ | 1,020.10 | | | | 0.99 | % | | $ | 5.01 | |
| Class A2 | | | 2.48 | | | | 1,000.00 | | | | 1,024.80 | | | | 0.97 | | | | 4.92 | | | | | | | Class A2 | | | 5.00 | | | | 1,000.00 | | | | 1,020.21 | | | | 0.97 | | | | 4.91 | |
| Class C | | | 2.09 | | | | 1,000.00 | | | | 1,020.90 | | | | 1.73 | | | | 8.76 | | | | | | | Class C | | | 5.00 | | | | 1,000.00 | | | | 1,016.39 | | | | 1.73 | | | | 8.74 | |
| Class R | | | 2.31 | | | | 1,000.00 | | | | 1,023.10 | | | | 1.31 | | | | 6.64 | | | | | | | Class R | | | 5.00 | | | | 1,000.00 | | | | 1,018.50 | | | | 1.31 | | | | 6.63 | |
| Class I | | | 2.61 | | | | 1,000.00 | | | | 1,026.10 | | | | 0.72 | | | | 3.66 | | | | | | | Class I | | | 5.00 | | | | 1,000.00 | | | | 1,021.46 | | | | 0.72 | | | | 3.65 | |
| Class IS | | | 2.64 | | | | 1,000.00 | | | | 1,026.40 | | | | 0.66 | | | | 3.35 | | | | | | | Class IS | | | 5.00 | | | | 1,000.00 | | | | 1,021.76 | | | | 0.66 | | | | 3.35 | |
| | |
| 2 | | Western Asset High Yield Fund 2017 Semi-Annual Report |
| 1 | For the six months ended November 30, 2017. |
| 2 | Assumes the reinvestment of all distributions, including returns of capital, if any, at net asset value and does not reflect the deduction of the applicable sales charge with respect to Class A and Class A2 shares or the applicable contingent deferred sales charge (“CDSC”) with respect to Class C shares. Total return is not annualized, as it may not be representative of the total return for the year. Performance figures may reflect compensating balance arrangements, fee waivers and/or expense reimbursements. In the absence of compensating balance arrangements, fee waivers and/or expense reimbursements, the total return would have been lower. Past performance is no guarantee of future results. |
| 3 | Expenses (net of compensating balance arrangements, fee waivers and/or expense reimbursements) are equal to each class’ respective annualized expense ratio multiplied by the average account value over the period, multiplied by the number of days in the most recent fiscal half-year (183), then divided by 365. |
| | |
| Western Asset High Yield Fund 2017 Semi-Annual Report | | 3 |
Spread duration (unaudited)
Economic exposure — November 30, 2017
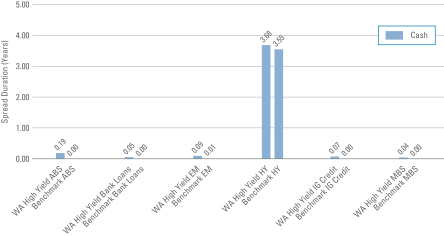
Spread duration measures the sensitivity to changes in spreads. The spread over Treasuries is the annual risk-premium demanded by investors to hold non-Treasury securities. Spread duration is quantified as the % change in price resulting from a 100 basis points change in spreads. For a security with positive spread duration, an increase in spreads would result in a price decline and a decline in spreads would result in a price increase. This chart highlights the market sector exposure of the Fund’s sectors relative to the selected benchmark sectors as of the end of the reporting period.
| | |
| ABS | | — Asset-Backed Securities |
| Benchmark | | — Bloomberg Barclays U.S. Corporate High Yield — 2% Issuer Cap Index |
| EM | | — Emerging Markets |
| HY | | — High Yield |
| IG Credit | | — Investment Grade Credit |
| MBS | | — Mortgage-Backed Securities |
| WA High Yield | | — Western Asset High Yield Fund |
| | |
| 4 | | Western Asset High Yield Fund 2017 Semi-Annual Report |
Effective duration (unaudited)
Interest rate exposure — November 30, 2017
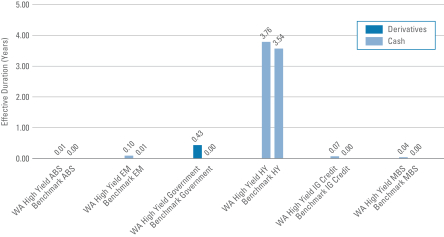
Effective duration measures the sensitivity to changes in relevant interest rates. Effective duration is quantified as the % change in price resulting from a 100 basis points change in interest rates. For a security with positive effective duration, an increase in interest rates would result in a price decline and a decline in interest rates would result in a price increase. This chart highlights the interest rate exposure of the Fund’s sectors relative to the selected benchmark sectors as of the end of the reporting period.
| | |
| ABS | | — Asset-Backed Securities |
| Benchmark | | — Bloomberg Barclays U.S. Corporate High Yield — 2% Issuer Cap Index |
| EM | | — Emerging Markets |
| HY | | — High Yield |
| IG Credit | | — Investment Grade Credit |
| MBS | | — Mortgage-Backed Securities |
| WA High Yield | | — Western Asset High Yield Fund |
| | |
| Western Asset High Yield Fund 2017 Semi-Annual Report | | 5 |
Schedule of investments (unaudited)
November 30, 2017
Western Asset High Yield Fund
| | | | | | | | | | | | | | | | |
| Security | | Rate | | | Maturity
Date | | | Face
Amount† | | | Value | |
| Corporate Bonds & Notes — 85.4% | | | | | | | | | | | | | | | | |
| Consumer Discretionary — 20.3% | | | | | | | | | | | | | | | | |
Auto Components — 1.4% | | | | | | | | | | | | | | | | |
Adient Global Holdings Ltd., Senior Notes | | | 4.875 | % | | | 8/15/26 | | | | 570,000 | | | $ | 587,453 | (a) |
Delphi Technologies PLC, Senior Notes | | | 5.000 | % | | | 10/1/25 | | | | 360,000 | | | | 366,527 | (a) |
Goodyear Tire & Rubber Co., Senior Bonds | | | 5.125 | % | | | 11/15/23 | | | | 360,000 | | | | 374,400 | |
Goodyear Tire & Rubber Co., Senior Notes | | | 5.000 | % | | | 5/31/26 | | | | 230,000 | | | | 238,982 | |
IHO Verwaltungs GmbH, Senior Secured Bonds (4.125% Cash or 4.875% PIK) | | | 4.125 | % | | | 9/15/21 | | | | 330,000 | | | | 336,108 | (a)(b) |
IHO Verwaltungs GmbH, Senior Secured Bonds (4.750% Cash or 5.500% PIK) | | | 4.750 | % | | | 9/15/26 | | | | 230,000 | | | | 233,450 | (a)(b) |
ZF North America Capital Inc., Senior Notes | | | 4.500 | % | | | 4/29/22 | | | | 490,000 | | | | 520,625 | (a) |
ZF North America Capital Inc., Senior Notes | | | 4.750 | % | | | 4/29/25 | | | | 590,000 | | | | 630,787 | (a) |
Total Auto Components | | | | | | | | | | | | | | | 3,288,332 | |
Diversified Consumer Services — 0.8% | | | | | | | | | | | | | | | | |
Prime Security Services Borrower LLC/Prime Finance Inc., Secured Notes | | | 9.250 | % | | | 5/15/23 | | | | 720,000 | | | | 796,500 | (a) |
Service Corp. International, Senior Notes | | | 5.375 | % | | | 5/15/24 | | | | 430,000 | | | | 454,187 | |
Service Corp. International, Senior Notes | | | 7.500 | % | | | 4/1/27 | | | | 147,000 | | | | 175,298 | |
Weight Watchers International Inc., Senior Notes | | | 8.625 | % | | | 12/1/25 | | | | 500,000 | | | | 511,250 | (a) |
Total Diversified Consumer Services | | | | | | | | | | | | | | | 1,937,235 | |
Hotels, Restaurants & Leisure — 5.8% | | | | | | | | | | | | | | | | |
1011778 BC ULC/New Red Finance Inc., Secured Notes | | | 5.000 | % | | | 10/15/25 | | | | 300,000 | | | | 308,812 | (a) |
1011778 BC ULC/New Red Finance Inc., Senior Secured Notes | | | 4.625 | % | | | 1/15/22 | | | | 380,000 | | | | 389,500 | (a) |
1011778 BC ULC/New Red Finance Inc., Senior Secured Notes | | | 4.250 | % | | | 5/15/24 | | | | 250,000 | | | | 251,000 | (a) |
Aramark Services Inc., Senior Notes | | | 5.000 | % | | | 4/1/25 | | | | 530,000 | | | | 565,112 | (a) |
Bossier Casino Venture Holdco Inc., Senior Secured Bonds (14.000% PIK) | | | 14.000 | % | | | 2/9/18 | | | | 1,213,734 | | | | 1,213,734 | (a)(b)(c)(d) |
Brinker International Inc., Senior Notes | | | 5.000 | % | | | 10/1/24 | | | | 460,000 | | | | 462,300 | (a) |
Carrols Restaurant Group Inc., Secured Notes | | | 8.000 | % | | | 5/1/22 | | | | 1,135,000 | | | | 1,204,519 | |
CCM Merger Inc., Senior Notes | | | 6.000 | % | | | 3/15/22 | | | | 68,000 | | | | 70,040 | (a) |
Fontainebleau Las Vegas Holdings LLC, Senior Secured Notes | | | 10.250 | % | | | 6/15/15 | | | | 1,455,000 | | | | 146 | *(a)(e) |
GLP Capital LP/GLP Financing II Inc., Senior Notes | | | 5.375 | % | | | 4/15/26 | | | | 610,000 | | | | 659,941 | |
Golden Nugget Inc., Senior Notes | | | 8.750 | % | | | 10/1/25 | | | | 690,000 | | | | 719,325 | (a) |
Hilton Worldwide Finance LLC/Hilton Worldwide Finance Corp., Senior Notes | | | 4.625 | % | | | 4/1/25 | | | | 120,000 | | | | 124,350 | |
Hilton Worldwide Finance LLC/Hilton Worldwide Finance Corp., Senior Notes | | | 4.875 | % | | | 4/1/27 | | | | 550,000 | | | | 581,130 | |
See Notes to Financial Statements.
| | |
| 6 | | Western Asset High Yield Fund 2017 Semi-Annual Report |
Western Asset High Yield Fund
| | | | | | | | | | | | | | | | |
| Security | | Rate | | | Maturity
Date | | | Face
Amount† | | | Value | |
Hotels, Restaurants & Leisure — continued | | | | | | | | | | | | | | | | |
International Game Technology PLC, Senior Secured Notes | | | 6.500 | % | | | 2/15/25 | | | | 400,000 | | | $ | 452,500 | (a) |
MGM Resorts International, Senior Notes | | | 7.750 | % | | | 3/15/22 | | | | 750,000 | | | | 872,100 | |
NCL Corp. Ltd., Senior Notes | | | 4.750 | % | | | 12/15/21 | | | | 920,000 | | | | 954,500 | (a) |
Scientific Games International Inc., Senior Notes | | | 10.000 | % | | | 12/1/22 | | | | 800,000 | | | | 884,000 | |
Scientific Games International Inc., Senior Secured Notes | | | 7.000 | % | | | 1/1/22 | | | | 700,000 | | | | 740,250 | (a) |
Scientific Games International Inc., Senior Secured Notes | | | 5.000 | % | | | 10/15/25 | | | | 160,000 | | | | 162,200 | (a) |
Silversea Cruise Finance Ltd., Senior Secured Notes | | | 7.250 | % | | | 2/1/25 | | | | 592,000 | | | | 640,840 | (a) |
Speedway Motorsports Inc., Senior Notes | | | 5.125 | % | | | 2/1/23 | | | | 590,000 | | | | 612,125 | |
Sugarhouse HSP Gaming Prop Mezz LP/Sugarhouse HSP Gaming Finance Corp., Senior Secured Notes | | | 5.875 | % | | | 5/15/25 | | | | 660,000 | | | | 628,650 | (a) |
Viking Cruises Ltd., Senior Notes | | | 5.875 | % | | | 9/15/27 | | | | 1,290,000 | | | | 1,307,737 | (a) |
Total Hotels, Restaurants & Leisure | | | | | | | | | | | | | | | 13,804,811 | |
Household Durables — 1.8% | | | | | | | | | | | | | | | | |
CalAtlantic Group Inc., Senior Notes | | | 6.250 | % | | | 12/15/21 | | | | 440,000 | | | | 485,650 | |
Century Communities Inc., Senior Notes | | | 5.875 | % | | | 7/15/25 | | | | 1,090,000 | | | | 1,102,262 | (a) |
Lennar Corp., Senior Notes | | | 4.500 | % | | | 4/30/24 | | | | 310,000 | | | | 320,463 | |
Lennar Corp., Senior Notes | | | 4.750 | % | | | 11/29/27 | | | | 770,000 | | | | 791,175 | (a) |
Shea Homes LP/Shea Homes Funding Corp., Senior Notes | | | 6.125 | % | | | 4/1/25 | | | | 700,000 | | | | 731,500 | (a) |
Weekley Homes LLC/Weekley Finance Corp., Senior Notes | | | 6.625 | % | | | 8/15/25 | | | | 870,000 | | | | 852,730 | (a) |
William Lyon Homes Inc., Senior Notes | | | 7.000 | % | | | 8/15/22 | | | | 60,000 | | | | 62,100 | |
Total Household Durables | | | | | | | | | | | | | | | 4,345,880 | |
Internet & Direct Marketing Retail — 0.2% | | | | | | | | | | | | | | | | |
Netflix Inc., Senior Bonds | | | 5.875 | % | | | 2/15/25 | | | | 507,000 | | | | 543,758 | |
Leisure Products — 0.5% | | | | | | | | | | | | | | | | |
Gibson Brands Inc., Senior Secured Notes | | | 8.875 | % | | | 8/1/18 | | | | 1,290,000 | | | | 1,080,375 | (a) |
Media — 6.6% | | | | | | | | | | | | | | | | |
AMC Entertainment Holdings Inc., Senior Subordinated Notes | | | 6.125 | % | | | 5/15/27 | | | | 440,000 | | | | 438,900 | |
Carmike Cinemas Inc., Secured Notes | | | 6.000 | % | | | 6/15/23 | | | | 580,000 | | | | 611,900 | (a) |
CCO Holdings LLC/CCO Holdings Capital Corp., Senior Notes | | | 5.125 | % | | | 5/1/23 | | | | 500,000 | | | | 518,750 | (a) |
CCO Holdings LLC/CCO Holdings Capital Corp., Senior Notes | | | 5.750 | % | | | 2/15/26 | | | | 770,000 | | | | 800,800 | (a) |
CCO Holdings LLC/CCO Holdings Capital Corp., Senior Notes | | | 5.125 | % | | | 5/1/27 | | | | 350,000 | | | | 347,594 | (a) |
Charter Communications Operating LLC/Charter Communications Operating Capital Corp., Senior Secured Notes | | | 4.908 | % | | | 7/23/25 | | | | 1,360,000 | | | | 1,438,968 | |
Charter Communications Operating LLC/Charter Communications Operating Capital Corp., Senior Secured Notes | | | 6.484 | % | | | 10/23/45 | | | | 430,000 | | | | 496,181 | |
DISH DBS Corp., Senior Notes | | | 5.875 | % | | | 7/15/22 | | | | 30,000 | | | | 30,975 | |
DISH DBS Corp., Senior Notes | | | 5.875 | % | | | 11/15/24 | | | | 2,480,000 | | | | 2,507,900 | |
DISH DBS Corp., Senior Notes | | | 7.750 | % | | | 7/1/26 | | | | 400,000 | | | | 433,000 | |
See Notes to Financial Statements.
| | |
| Western Asset High Yield Fund 2017 Semi-Annual Report | | 7 |
Schedule of investments (unaudited) (cont’d)
November 30, 2017
Western Asset High Yield Fund
| | | | | | | | | | | | | | | | |
| Security | | Rate | | | Maturity
Date | | | Face
Amount† | | | Value | |
Media — continued | | | | | | | | | | | | | | | | |
EW Scripps Co., Senior Notes | | | 5.125 | % | | | 5/15/25 | | | | 430,000 | | | $ | 430,000 | (a) |
Lions Gate Entertainment Corp., Senior Notes | | | 5.875 | % | | | 11/1/24 | | | | 490,000 | | | | 520,012 | (a) |
SFR Group SA, Senior Secured Bonds | | | 6.250 | % | | | 5/15/24 | | | | 480,000 | | | | 473,400 | (a) |
SFR Group SA, Senior Secured Notes | | | 7.375 | % | | | 5/1/26 | | | | 2,960,000 | | | | 2,992,945 | (a) |
Time Warner Cable LLC, Debentures | | | 7.300 | % | | | 7/1/38 | | | | 440,000 | | | | 543,923 | |
Univision Communications Inc., Senior Secured Notes | | | 5.125 | % | | | 2/15/25 | | | | 610,000 | | | | 595,512 | (a) |
UPC Holding BV, Senior Secured Notes | | | 5.500 | % | | | 1/15/28 | | | | 770,000 | | | | 768,075 | (a) |
Virgin Media Finance PLC, Senior Notes | | | 6.000 | % | | | 10/15/24 | | | | 410,000 | | | | 425,888 | (a) |
Virgin Media Secured Finance PLC, Senior Secured Bonds | | | 5.500 | % | | | 1/15/25 | | | | 300,000 | | | | 313,875 | (a) |
Virgin Media Secured Finance PLC, Senior Secured Notes | | | 5.500 | % | | | 8/15/26 | | | | 260,000 | | | | 272,142 | (a) |
Ziggo Secured Finance BV, Senior Secured Notes | | | 5.500 | % | | | 1/15/27 | | | | 860,000 | | | | 869,933 | (a) |
Total Media | | | | | | | | | | | | | | | 15,830,673 | |
Multiline Retail — 0.2% | | | | | | | | | | | | | | | | |
Dollar Tree Inc., Senior Notes | | | 5.750 | % | | | 3/1/23 | | | | 570,000 | | | | 599,213 | |
Specialty Retail — 2.4% | | | | | | | | | | | | | | | | |
American Greetings Corp., Senior Notes | | | 7.875 | % | | | 2/15/25 | | | | 700,000 | | | | 763,000 | (a) |
GameStop Corp., Senior Notes | | | 5.500 | % | | | 10/1/19 | | | | 170,000 | | | | 173,613 | (a) |
GameStop Corp., Senior Notes | | | 6.750 | % | | | 3/15/21 | | | | 460,000 | | | | 481,850 | (a) |
Guitar Center Inc., Senior Bonds | | | 9.625 | % | | | 4/15/20 | | | | 970,000 | | | | 591,700 | (a) |
Guitar Center Inc., Senior Secured Bonds | | | 6.500 | % | | | 4/15/19 | | | | 430,000 | | | | 405,812 | (a) |
Hertz Corp., Senior Notes | | | 5.875 | % | | | 10/15/20 | | | | 950,000 | | | | 951,615 | |
Lithia Motors Inc., Senior Notes | | | 5.250 | % | | | 8/1/25 | | | | 360,000 | | | | 378,900 | (a) |
PetSmart Inc., Senior Notes | | | 7.125 | % | | | 3/15/23 | | | | 250,000 | | | | 183,125 | (a) |
PetSmart Inc., Senior Notes | | | 8.875 | % | | | 6/1/25 | | | | 650,000 | | | | 490,750 | (a) |
PetSmart Inc., Senior Secured Notes | | | 5.875 | % | | | 6/1/25 | | | | 280,000 | | | | 242,200 | (a) |
Sally Holdings LLC/Sally Capital Inc., Senior Notes | | | 5.625 | % | | | 12/1/25 | | | | 530,000 | | | | 532,319 | |
ServiceMaster Co., LLC, Senior Notes | | | 5.125 | % | | | 11/15/24 | | | | 600,000 | | | | 610,500 | (a) |
Total Specialty Retail | | | | | | | | | | | | | | | 5,805,384 | |
Textiles, Apparel & Luxury Goods — 0.6% | | | | | | | | | | | | | | | | |
Hanesbrands Inc., Senior Notes | | | 4.625 | % | | | 5/15/24 | | | | 200,000 | | | | 204,750 | (a) |
Hanesbrands Inc., Senior Notes | | | 4.875 | % | | | 5/15/26 | | | | 510,000 | | | | 522,597 | (a) |
Levi Strauss & Co., Senior Notes | | | 5.000 | % | | | 5/1/25 | | | | 630,000 | | | | 659,534 | |
Total Textiles, Apparel & Luxury Goods | | | | | | | | | | | | | | | 1,386,881 | |
Total Consumer Discretionary | | | | | | | | | | | | | | | 48,622,542 | |
| Consumer Staples — 2.3% | | | | | | | | | | | | | | | | |
Beverages — 0.6% | | | | | | | | | | | | | | | | |
Carolina Beverage Group LLC/Carolina Beverage Group Finance Inc., Secured Notes | | | 10.625 | % | | | 8/1/18 | | | | 780,000 | | | | 791,212 | (a) |
See Notes to Financial Statements.
| | |
| 8 | | Western Asset High Yield Fund 2017 Semi-Annual Report |
Western Asset High Yield Fund
| | | | | | | | | | | | | | | | |
| Security | | Rate | | | Maturity
Date | | | Face
Amount† | | | Value | |
Beverages — continued | | | | | | | | | | | | | | | | |
Cott Holdings Inc., Senior Notes | | | 5.500 | % | | | 4/1/25 | | | | 630,000 | | | $ | 650,790 | (a) |
Total Beverages | | | | | | | | | | | | | | | 1,442,002 | |
Food & Staples Retailing — 0.2% | | | | | | | | | | | | | | | | |
Beverages & More Inc., Senior Secured Notes | | | 11.500 | % | | | 6/15/22 | | | | 690,000 | | | | 636,525 | (a) |
Food Products — 0.7% | | | | | | | | | | | | | | | | |
Lamb Weston Holdings Inc., Senior Notes | | | 4.625 | % | | | 11/1/24 | | | | 200,000 | | | | 207,750 | (a) |
Lamb Weston Holdings Inc., Senior Notes | | | 4.875 | % | | | 11/1/26 | | | | 1,050,000 | | | | 1,107,750 | (a) |
Pilgrim’s Pride Corp., Senior Notes | | | 5.875 | % | | | 9/30/27 | | | | 380,000 | | | | 397,575 | (a) |
Total Food Products | | | | | | | | | | | | | | | 1,713,075 | |
Household Products — 0.5% | | | | | | | | | | | | | | | | |
Central Garden & Pet Co., Senior Notes | | | 6.125 | % | | | 11/15/23 | | | | 410,000 | | | | 437,675 | |
Spectrum Brands Inc., Senior Notes | | | 6.125 | % | | | 12/15/24 | | | | 330,000 | | | | 350,213 | |
Spectrum Brands Inc., Senior Notes | | | 5.750 | % | | | 7/15/25 | | | | 350,000 | | | | 369,250 | |
Total Household Products | | | | | | | | | | | | | | | 1,157,138 | |
Tobacco — 0.3% | | | | | | | | | | | | | | | | |
Alliance One International Inc., Secured Notes | | | 9.875 | % | | | 7/15/21 | | | | 340,000 | | | | 311,525 | |
Alliance One International Inc., Senior Secured Notes | | | 8.500 | % | | | 4/15/21 | | | | 320,000 | | | | 336,000 | (a) |
Total Tobacco | | | | | | | | | | | | | | | 647,525 | |
Total Consumer Staples | | | | | | | | | | | | | | | 5,596,265 | |
| Energy — 15.0% | | | | | | | | | | | | | | | | |
Energy Equipment & Services — 1.6% | | | | | | | | | | | | | | | | |
KCA Deutag UK Finance PLC, Senior Secured Notes | | | 7.250 | % | | | 5/15/21 | | | | 950,000 | | | | 921,500 | (a) |
Precision Drilling Corp., Senior Notes | | | 7.125 | % | | | 1/15/26 | | | | 640,000 | | | | 646,406 | (a) |
Pride International Inc., Senior Notes | | | 7.875 | % | | | 8/15/40 | | | | 320,000 | | | | 258,400 | |
Transocean Inc., Senior Notes | | | 9.000 | % | | | 7/15/23 | | | | 300,000 | | | | 325,125 | (a) |
Transocean Inc., Senior Notes | | | 7.500 | % | | | 1/15/26 | | | | 430,000 | | | | 442,900 | (a) |
Transocean Inc., Senior Notes | | | 6.800 | % | | | 3/15/38 | | | | 400,000 | | | | 321,000 | |
Trinidad Drilling Ltd., Senior Notes | | | 6.625 | % | | | 2/15/25 | | | | 960,000 | | | | 921,600 | (a) |
Total Energy Equipment & Services | | | | | | | | | | | | | | | 3,836,931 | |
Oil, Gas & Consumable Fuels — 13.4% | | | | | | | | | | | | | | | | |
Andeavor Logistics LP/Tesoro Logistics Finance Corp., Senior Notes | | | 5.250 | % | | | 1/15/25 | | | | 590,000 | | | | 623,188 | |
Berry Petroleum Co. Escrow | | | — | | | | — | | | | 1,520,000 | | | | 0 | *(c)(d)(f) |
Berry Petroleum Co. Escrow | | | — | | | | — | | | | 1,580,000 | | | | 0 | *(c)(d)(f) |
Blue Racer Midstream LLC/Blue Racer Finance Corp., Senior Notes | | | 6.125 | % | | | 11/15/22 | | | | 790,000 | | | | 823,575 | (a) |
Calumet Specialty Products Partners LP/Calumet Finance Corp., Senior Secured Notes | | | 11.500 | % | | | 1/15/21 | | | | 600,000 | | | | 690,000 | (a) |
See Notes to Financial Statements.
| | |
| Western Asset High Yield Fund 2017 Semi-Annual Report | | 9 |
Schedule of investments (unaudited) (cont’d)
November 30, 2017
Western Asset High Yield Fund
| | | | | | | | | | | | | | | | |
| Security | | Rate | | | Maturity
Date | | | Face
Amount† | | | Value | |
Oil, Gas & Consumable Fuels — continued | | | | | | | | | | | | | | | | |
Carrizo Oil & Gas Inc., Senior Notes | | | 8.250 | % | | | 7/15/25 | | | | 560,000 | | | $ | 610,400 | |
Centennial Resource Production LLC, Senior Notes | | | 5.375 | % | | | 1/15/26 | | | | 360,000 | | | | 366,300 | (a) |
Cheniere Corpus Christi Holdings LLC, Senior Secured Notes | | | 5.875 | % | | | 3/31/25 | | | | 740,000 | | | | 804,750 | |
Chesapeake Energy Corp., Senior Notes | | | 5.375 | % | | | 6/15/21 | | | | 150,000 | | | | 145,500 | |
Chesapeake Energy Corp., Senior Notes | | | 5.750 | % | | | 3/15/23 | | | | 1,070,000 | | | | 989,750 | |
Chesapeake Energy Corp., Senior Notes | | | 8.000 | % | | | 1/15/25 | | | | 800,000 | | | | 798,000 | (a) |
Chesapeake Energy Corp., Senior Notes | | | 8.000 | % | | | 6/15/27 | | | | 580,000 | | | | 556,974 | (a) |
Continental Resources Inc., Senior Notes | | | 4.500 | % | | | 4/15/23 | | | | 140,000 | | | | 143,150 | |
Continental Resources Inc., Senior Notes | | | 4.900 | % | | | 6/1/44 | | | | 320,000 | | | | 305,600 | |
Covey Park Energy LLC/Covey Park Finance Corp., Senior Notes | | | 7.500 | % | | | 5/15/25 | | | | 520,000 | | | | 544,700 | (a) |
DCP Midstream Operating LP, Senior Notes | | | 6.450 | % | | | 11/3/36 | | | | 470,000 | | | | 505,250 | (a) |
DCP Midstream Operating LP, Senior Notes | | | 6.750 | % | | | 9/15/37 | | | | 140,000 | | | | 150,500 | (a) |
Ecopetrol SA, Senior Notes | | | 5.875 | % | | | 9/18/23 | | | | 128,000 | | | | 143,200 | |
Endeavor Energy Resources LP/EER Finance Inc., Senior Notes | | | 5.500 | % | | | 1/30/26 | | | | 180,000 | | | | 182,700 | (a)(g) |
Endeavor Energy Resources LP/EER Finance Inc., Senior Notes | | | 5.750 | % | | | 1/30/28 | | | | 290,000 | | | | 294,350 | (a)(g) |
EP Energy LLC/Everest Acquisition Finance Inc., Secured Notes | | | 8.000 | % | | | 2/15/25 | | | | 510,000 | | | | 337,875 | (a) |
EP Energy LLC/Everest Acquisition Finance Inc., Senior Notes | | | 7.750 | % | | | 9/1/22 | | | | 250,000 | | | | 143,750 | |
EP Energy LLC/Everest Acquisition Finance Inc., Senior Notes | | | 6.375 | % | | | 6/15/23 | | | | 900,000 | | | | 499,500 | |
Extraction Oil & Gas Inc., Senior Notes | | | 7.375 | % | | | 5/15/24 | | | | 480,000 | | | | 513,600 | (a) |
Extraction Oil & Gas Inc./Extraction Finance Corp., Senior Notes | | | 7.875 | % | | | 7/15/21 | | | | 1,030,000 | | | | 1,094,375 | (a) |
Genesis Energy LP/Genesis Energy Finance Corp., Senior Bonds | | | 5.625 | % | | | 6/15/24 | | | | 430,000 | | | | 428,925 | |
Genesis Energy LP/Genesis Energy Finance Corp., Senior Notes | | | 6.000 | % | | | 5/15/23 | | | | 370,000 | | | | 377,400 | |
Gulfport Energy Corp., Senior Notes | | | 6.375 | % | | | 5/15/25 | | | | 610,000 | | | | 616,863 | |
Magnum Hunter Resources Corp. Escrow | | | — | | | | — | | | | 2,560,000 | | | | 0 | *(c)(d)(f) |
MEG Energy Corp., Senior Notes | | | 6.375 | % | | | 1/30/23 | | | | 440,000 | | | | 405,350 | (a) |
MEG Energy Corp., Senior Notes | | | 7.000 | % | | | 3/31/24 | | | | 580,000 | | | | 524,900 | (a) |
Murphy Oil USA Inc., Senior Notes | | | 5.625 | % | | | 5/1/27 | | | | 500,000 | | | | 526,250 | |
NGL Energy Partners LP/NGL Energy Finance Corp., Senior Notes | | | 7.500 | % | | | 11/1/23 | | | | 1,140,000 | | | | 1,177,050 | |
NGPL PipeCo LLC, Senior Bonds | | | 4.875 | % | | | 8/15/27 | | | | 550,000 | | | | 573,056 | (a) |
NGPL PipeCo LLC, Senior Notes | | | 4.375 | % | | | 8/15/22 | | | | 380,000 | | | | 390,925 | (a) |
NGPL PipeCo LLC, Senior Secured Notes | | | 7.768 | % | | | 12/15/37 | | | | 180,000 | | | | 223,200 | (a) |
Oasis Petroleum Inc., Senior Notes | | | 6.875 | % | | | 3/15/22 | | | | 730,000 | | | | 745,512 | |
PDC Energy Inc., Senior Notes | | | 7.750 | % | | | 10/15/22 | | | | 230,000 | | | | 239,271 | |
Petrobras Global Finance BV, Senior Notes | | | 7.375 | % | | | 1/17/27 | | | | 820,000 | | | | 905,280 | |
QEP Resources Inc., Senior Notes | | | 6.875 | % | | | 3/1/21 | | | | 273,000 | | | | 296,546 | |
See Notes to Financial Statements.
| | |
| 10 | | Western Asset High Yield Fund 2017 Semi-Annual Report |
Western Asset High Yield Fund
| | | | | | | | | | | | | | | | |
| Security | | Rate | | | Maturity
Date | | | Face
Amount† | | | Value | |
Oil, Gas & Consumable Fuels — continued | | | | | | | | | | | | | | | | |
QEP Resources Inc., Senior Notes | | | 5.250 | % | | | 5/1/23 | | | | 510,000 | | | $ | 518,925 | |
QEP Resources Inc., Senior Notes | | | 5.625 | % | | | 3/1/26 | | | | 550,000 | | | | 560,247 | |
Range Resources Corp., Senior Notes | | | 5.875 | % | | | 7/1/22 | | | | 120,000 | | | | 123,900 | |
Range Resources Corp., Senior Notes | | | 5.000 | % | | | 3/15/23 | | | | 480,000 | | | | 477,600 | |
Range Resources Corp., Senior Notes | | | 4.875 | % | | | 5/15/25 | | | | 260,000 | | | | 254,800 | |
Rockies Express Pipeline LLC, Senior Notes | | | 6.875 | % | | | 4/15/40 | | | | 1,450,000 | | | | 1,640,312 | (a) |
Rose Rock Midstream LP/Rose Rock Finance Corp., Senior Notes | | | 5.625 | % | | | 11/15/23 | | | | 940,000 | | | | 918,850 | |
RSP Permian Inc., Senior Notes | | | 6.625 | % | | | 10/1/22 | | | | 1,030,000 | | | | 1,086,650 | |
RSP Permian Inc., Senior Notes | | | 5.250 | % | | | 1/15/25 | | | | 410,000 | | | | 420,250 | |
Sanchez Energy Corp., Senior Notes | | | 7.750 | % | | | 6/15/21 | | | | 600,000 | | | | 571,500 | |
Sanchez Energy Corp., Senior Notes | | | 6.125 | % | | | 1/15/23 | | | | 400,000 | | | | 339,500 | |
Shelf Drilling Holdings Ltd., Secured Notes | | | 9.500 | % | | | 11/2/20 | | | | 961,593 | | | | 980,825 | (a) |
Summit Midstream Holdings LLC/Summit Midstream Finance Corp., Senior Notes | | | 5.500 | % | | | 8/15/22 | | | | 160,000 | | | | 162,000 | |
Targa Resources Partners LP/Targa Resources Partners Finance Corp., Senior Bonds | | | 5.125 | % | | | 2/1/25 | | | | 30,000 | | | | 30,788 | |
Targa Resources Partners LP/Targa Resources Partners Finance Corp., Senior Bonds | | | 5.375 | % | | | 2/1/27 | | | | 30,000 | | | | 30,863 | |
Targa Resources Partners LP/Targa Resources Partners Finance Corp., Senior Notes | | | 4.250 | % | | | 11/15/23 | | | | 1,110,000 | | | | 1,097,512 | |
Teine Energy Ltd., Senior Notes | | | 6.875 | % | | | 9/30/22 | | | | 690,000 | | | | 714,150 | (a) |
Williams Cos. Inc., Debentures | | | 7.500 | % | | | 1/15/31 | | | | 830,000 | | | | 1,025,050 | |
Williams Cos. Inc., Senior Notes | | | 4.550 | % | | | 6/24/24 | | | | 520,000 | | | | 541,450 | |
Williams Cos. Inc., Senior Notes | | | 8.750 | % | | | 3/15/32 | | | | 440,000 | | | | 578,600 | |
WPX Energy Inc., Senior Notes | | | 6.000 | % | | | 1/15/22 | | | | 170,000 | | | | 175,950 | |
WPX Energy Inc., Senior Notes | | | 8.250 | % | | | 8/1/23 | | | | 770,000 | | | | 872,987 | |
WPX Energy Inc., Senior Notes | | | 5.250 | % | | | 9/15/24 | | | | 270,000 | | | | 266,625 | |
Total Oil, Gas & Consumable Fuels | | | | | | | | | | | | | | | 32,086,849 | |
Total Energy | | | | | | | | | | | | | | | 35,923,780 | |
| Financials — 8.0% | | | | | | | | | | | | | | | | |
Banks — 2.3% | | | | | | | | | | | | | | | | |
Bank of America Corp., Senior Notes (3.593% to 7/21/27 then 3 mo. USD LIBOR + 1.370%) | | | 3.593 | % | | | 7/21/28 | | | | 560,000 | | | | 568,338 | (h) |
Barclays Bank PLC, Subordinated Notes | | | 7.625 | % | | | 11/21/22 | | | | 360,000 | | | | 410,643 | |
Barclays PLC, Junior Bonds (8.000% to 12/15/20 then EUR 5 year Swap Annual + 6.750%) | | | 8.000 | % | | | 12/15/20 | | | | 520,000 | EUR | | | 715,775 | (h)(i) |
BNP Paribas SA, Junior Subordinated Notes (7.375% to 8/19/25 then USD 5 year Swap Rate + 5.150%) | | | 7.375 | % | | | 8/19/25 | | | | 340,000 | | | | 394,400 | (a)(h)(i) |
CIT Group Inc., Senior Notes | | | 5.000 | % | | | 8/15/22 | | | | 815,000 | | | | 873,069 | |
CIT Group Inc., Senior Notes | | | 5.000 | % | | | 8/1/23 | | | | 820,000 | | | | 884,534 | |
See Notes to Financial Statements.
| | |
| Western Asset High Yield Fund 2017 Semi-Annual Report | | 11 |
Schedule of investments (unaudited) (cont’d)
November 30, 2017
Western Asset High Yield Fund
| | | | | | | | | | | | | | | | |
| Security | | Rate | | | Maturity
Date | | | Face
Amount† | | | Value | |
Banks — continued | | | | | | | | | | | | | | | | |
Credit Agricole SA, Junior Subordinated Notes (8.125% to 12/23/25 then USD 5 year Swap Rate + 6.185%) | | | 8.125 | % | | | 12/23/25 | | | | 500,000 | | | $ | 601,662 | (a)(h)(i) |
Royal Bank of Scotland Group PLC, Junior Subordinated Notes (8.625% to 8/15/21 then USD 5 year Swap Rate + 7.598%) | | | 8.625 | % | | | 8/15/21 | | | | 530,000 | | | | 598,900 | (h)(i) |
Royal Bank of Scotland NV, Subordinated Bonds | | | 7.750 | % | | | 5/15/23 | | | | 450,000 | | | | 532,535 | |
Total Banks | | | | | | | | | | | | | | | 5,579,856 | |
Capital Markets — 0.3% | | | | | | | | | | | | | | | | |
Donnelley Financial Solutions Inc., Senior Notes | | | 8.250 | % | | | 10/15/24 | | | | 750,000 | | | | 805,313 | |
Consumer Finance — 1.8% | | | | | | | | | | | | | | | | |
Ally Financial Inc., Senior Notes | | | 8.000 | % | | | 11/1/31 | | | | 430,000 | | | | 571,362 | |
FirstCash Inc., Senior Notes | | | 5.375 | % | | | 6/1/24 | | | | 540,000 | | | | 564,300 | (a) |
Navient Corp., Senior Notes | | | 6.500 | % | | | 6/15/22 | | | | 190,000 | | | | 199,738 | |
Navient Corp., Senior Notes | | | 5.875 | % | | | 10/25/24 | | | | 770,000 | | | | 777,931 | |
Navient Corp., Senior Notes | | | 6.750 | % | | | 6/25/25 | | | | 1,350,000 | | | | 1,393,875 | |
TMX Finance LLC/TitleMax Finance Corp., Senior Secured Notes | | | 8.500 | % | | | 9/15/18 | | | | 760,000 | | | | 703,000 | (a) |
Total Consumer Finance | | | | | | | | | | | | | | | 4,210,206 | |
Diversified Financial Services — 2.7% | | | | | | | | | | | | | | | | |
ASP AMC Merger Subordinated Inc., Senior Notes | | | 8.000 | % | | | 5/15/25 | | | | 670,000 | | | | 658,275 | (a) |
DAE Funding LLC, Senior Notes | | | 4.500 | % | | | 8/1/22 | | | | 704,000 | | | | 702,240 | (a) |
DAE Funding LLC, Senior Notes | | | 5.000 | % | | | 8/1/24 | | | | 550,000 | | | | 551,375 | (a) |
Ladder Capital Finance Holdings LLLP/Ladder Capital Finance Corp., Senior Notes | | | 5.250 | % | | | 3/15/22 | | | | 400,000 | | | | 414,000 | (a) |
Ladder Capital Finance Holdings LLLP/Ladder Capital Finance Corp., Senior Notes | | | 5.250 | % | | | 10/1/25 | | | | 630,000 | | | | 630,000 | (a) |
Nielsen Co. (Luxembourg) Sarl, Senior Notes | | | 5.000 | % | | | 2/1/25 | | | | 380,000 | | | | 396,150 | (a) |
Park Aerospace Holdings Ltd., Senior Notes | | | 5.250 | % | | | 8/15/22 | | | | 310,000 | | | | 318,137 | (a) |
Park Aerospace Holdings Ltd., Senior Notes | | | 4.500 | % | | | 3/15/23 | | | | 260,000 | | | | 252,850 | (a) |
Park Aerospace Holdings Ltd., Senior Notes | | | 5.500 | % | | | 2/15/24 | | | | 2,340,000 | | | | 2,401,425 | (a) |
Total Diversified Financial Services | | | | | | | | | | | | | | | 6,324,452 | |
Insurance — 0.4% | | | | | | | | | | | | | | | | |
Genworth Holdings Inc., Senior Notes | | | 7.700 | % | | | 6/15/20 | | | | 570,000 | | | | 578,550 | |
Genworth Holdings Inc., Senior Notes | | | 4.900 | % | | | 8/15/23 | | | | 320,000 | | | | 277,600 | |
Total Insurance | | | | | | | | | | | | | | | 856,150 | |
Thrifts & Mortgage Finance — 0.5% | | | | | | | | | | | | | | | | |
Quicken Loans Inc., Senior Notes | | | 5.750 | % | | | 5/1/25 | | | | 1,000,000 | | | | 1,056,250 | (a) |
Radian Group Inc., Senior Notes | | | 4.500 | % | | | 10/1/24 | | | | 190,000 | | | | 195,757 | |
Total Thrifts & Mortgage Finance | | | | | | | | | | | | | | | 1,252,007 | |
Total Financials | | | | | | | | | | | | | | | 19,027,984 | |
See Notes to Financial Statements.
| | |
| 12 | | Western Asset High Yield Fund 2017 Semi-Annual Report |
Western Asset High Yield Fund
| | | | | | | | | | | | | | | | |
| Security | | Rate | | | Maturity
Date | | | Face
Amount† | | | Value | |
| Health Care — 8.0% | | | | | | | | | | | | | | | | |
Biotechnology — 0.3% | | | | | | | | | | | | | | | | |
AMAG Pharmaceuticals Inc., Senior Notes | | | 7.875 | % | | | 9/1/23 | | | | 690,000 | | | $ | 679,650 | (a) |
Health Care Equipment & Supplies — 0.4% | | | | | | | | | | | | | | | | |
DJO Finance LLC/DJO Finance Corp., Secured Notes | | | 10.750 | % | | | 4/15/20 | | | | 320,000 | | | | 289,600 | |
DJO Finco Inc./DJO Finance LLC/DJO Finance Corp., Secured Notes | | | 8.125 | % | | | 6/15/21 | | | | 700,000 | | | | 666,313 | (a) |
Immucor Inc., Senior Notes | | | 11.125 | % | | | 2/15/22 | | | | 100,000 | | | | 104,000 | (a) |
Total Health Care Equipment & Supplies | | | | | | | | | | | | | | | 1,059,913 | |
Health Care Providers & Services — 5.3% | | | | | | | | | | | | | | | | |
Air Medical Group Holdings Inc., Senior Notes | | | 6.375 | % | | | 5/15/23 | | | | 180,000 | | | | 175,950 | (a) |
BioScrip Inc., First Lien Notes (1 mo. USD LIBOR + 7.000%) | | | 8.224 | % | | | 6/30/22 | | | | 662,000 | | | | 663,523 | (c)(d)(h)(j) |
BioScrip Inc., Senior Notes | | | 8.875 | % | | | 2/15/21 | | | | 590,000 | | | | 531,000 | |
Centene Corp., Senior Notes | | | 4.750 | % | | | 1/15/25 | | | | 1,300,000 | | | | 1,336,790 | |
CHS/Community Health Systems Inc., Senior Notes | | | 8.000 | % | | | 11/15/19 | | | | 390,000 | | | | 350,512 | |
CHS/Community Health Systems Inc., Senior Secured Notes | | | 6.250 | % | | | 3/31/23 | | | | 200,000 | | | | 188,000 | |
DaVita Inc., Senior Notes | | | 5.125 | % | | | 7/15/24 | | | | 190,000 | | | | 193,681 | |
DaVita Inc., Senior Notes | | | 5.000 | % | | | 5/1/25 | | | | 580,000 | | | | 581,624 | |
Envision Healthcare Corp., Senior Notes | | | 6.250 | % | | | 12/1/24 | | | | 170,000 | | | | 179,988 | (a) |
HCA Inc., Notes | | | 7.690 | % | | | 6/15/25 | | | | 1,035,000 | | | | 1,164,375 | |
HCA Inc., Notes | | | 7.500 | % | | | 11/6/33 | | | | 250,000 | | | | 280,000 | |
HCA Inc., Senior Bonds | | | 5.375 | % | | | 2/1/25 | | | | 280,000 | | | | 291,200 | |
HCA Inc., Senior Notes | | | 7.500 | % | | | 2/15/22 | | | | 270,000 | | | | 305,100 | |
HCA Inc., Senior Secured Bonds | | | 4.500 | % | | | 2/15/27 | | | | 210,000 | | | | 213,465 | |
HCA Inc., Senior Secured Notes | | | 5.500 | % | | | 6/15/47 | | | | 1,580,000 | | | | 1,603,700 | |
MPH Acquisition Holdings LLC, Senior Notes | | | 7.125 | % | | | 6/1/24 | | | | 1,000,000 | | | | 1,076,250 | (a) |
Polaris Intermediate Corp., Senior Notes (8.500% PIK) | | | 8.500 | % | | | 12/1/22 | | | | 390,000 | | | | 406,731 | (a)(b) |
Tenet Healthcare Corp., Secured Notes | | | 7.500 | % | | | 1/1/22 | | | | 370,000 | | | | 391,737 | (a) |
Tenet Healthcare Corp., Senior Notes | | | 8.125 | % | | | 4/1/22 | | | | 1,960,000 | | | | 1,947,750 | |
Tenet Healthcare Corp., Senior Secured Bonds | | | 4.375 | % | | | 10/1/21 | | | | 190,000 | | | | 190,950 | |
Universal Hospital Services Inc., Secured Notes | | | 7.625 | % | | | 8/15/20 | | | | 110,000 | | | | 110,858 | |
West Street Merger Subordinated Inc., Senior Notes | | | 6.375 | % | | | 9/1/25 | | | | 590,000 | | | | 597,375 | (a) |
Total Health Care Providers & Services | | | | | | | | | | | | | | | 12,780,559 | |
Pharmaceuticals — 2.0% | | | | | | | | | | | | | | | | |
Mallinckrodt International Finance SA, Senior Notes | | | 3.500 | % | | | 4/15/18 | | | | 280,000 | | | | 279,650 | |
Mallinckrodt International Finance SA, Senior Notes | | | 5.750 | % | | | 8/1/22 | | | | 80,000 | | | | 74,200 | (a) |
Valeant Pharmaceuticals International Inc., Senior Notes | | | 7.000 | % | | | 10/1/20 | | | | 1,280,000 | | | | 1,297,600 | (a) |
Valeant Pharmaceuticals International Inc., Senior Notes | | | 6.375 | % | | | 10/15/20 | | | | 510,000 | | | | 510,638 | (a) |
See Notes to Financial Statements.
| | |
| Western Asset High Yield Fund 2017 Semi-Annual Report | | 13 |
Schedule of investments (unaudited) (cont’d)
November 30, 2017
Western Asset High Yield Fund
| | | | | | | | | | | | | | | | |
| Security | | Rate | | | Maturity
Date | | | Face
Amount† | | | Value | |
Pharmaceuticals — continued | | | | | | | | | | | | | | | | |
Valeant Pharmaceuticals International Inc., Senior Notes | | | 7.250 | % | | | 7/15/22 | | | | 60,000 | | | $ | 58,725 | (a) |
Valeant Pharmaceuticals International Inc., Senior Notes | | | 5.500 | % | | | 3/1/23 | | | | 1,630,000 | | | | 1,403,837 | (a) |
Valeant Pharmaceuticals International Inc., Senior Secured Notes | | | 7.000 | % | | | 3/15/24 | | | | 560,000 | | | | 601,300 | (a) |
Valeant Pharmaceuticals International Inc., Senior Secured Notes | | | 5.500 | % | | | 11/1/25 | | | | 450,000 | | | | 457,920 | (a) |
Total Pharmaceuticals | | | | | | | | | | | | | | | 4,683,870 | |
Total Health Care | | | | | | | | | | | | | | | 19,203,992 | |
| Industrials — 8.1% | | | | | | | | | | | | | | | | |
Aerospace & Defense — 0.6% | | | | | | | | | | | | | | | | |
CBC Ammo LLC/CBC FinCo Inc., Senior Notes | | | 7.250 | % | | | 11/15/21 | | | | 1,100,000 | | | | 1,146,750 | (a) |
RBS Global Inc./Rexnord LLC, Senior Notes | | | 4.875 | % | | | 12/15/25 | | | | 240,000 | | | | 240,000 | (a)(g) |
Total Aerospace & Defense | | | | | | | | | | | | | | | 1,386,750 | |
Air Freight & Logistics — 0.8% | | | | | | | | | | | | | | | | |
XPO CNW Inc., Senior Bonds | | | 6.700 | % | | | 5/1/34 | | | | 710,000 | | | | 711,775 | |
XPO Logistics Inc., Senior Notes | | | 6.500 | % | | | 6/15/22 | | | | 130,000 | | | | 136,338 | (a) |
XPO Logistics Inc., Senior Notes | | | 6.125 | % | | | 9/1/23 | | | | 920,000 | | | | 975,200 | (a) |
Total Air Freight & Logistics | | | | | | | | | | | | | | | 1,823,313 | |
Airlines — 0.8% | | | | | | | | | | | | | | | | |
American Airlines, Pass-Through Trust, Secured Bonds | | | 5.625 | % | | | 1/15/21 | | | | 258,745 | | | | 272,976 | (a) |
Continental Airlines Inc., Pass-Through Certificates, Secured Bonds | | | 8.388 | % | | | 11/1/20 | | | | 133 | | | | 149 | |
United Airlines Inc., Pass-Through Certificates, Secured Bonds | | | 5.375 | % | | | 8/15/21 | | | | 188,570 | | | | 198,706 | |
United Airlines Inc., Pass-Through Certificates, Secured Notes | | | 4.750 | % | | | 4/11/22 | | | | 731,528 | | | | 761,008 | |
US Airways, Pass-Through Trust, Secured Bonds | | | 6.750 | % | | | 6/3/21 | | | | 598,190 | | | | 654,449 | |
Total Airlines | | | | | | | | | | | | | | | 1,887,288 | |
Building Products — 0.1% | | | | | | | | | | | | | | | | |
Standard Industries Inc., Senior Notes | | | 5.125 | % | | | 2/15/21 | | | | 240,000 | | | | 247,769 | (a) |
Commercial Services & Supplies — 2.5% | | | | | | | | | | | | | | | | |
ACCO Brands Corp., Senior Notes | | | 5.250 | % | | | 12/15/24 | | | | 450,000 | | | | 469,688 | (a) |
ADT Corp., Senior Secured Notes | | | 6.250 | % | | | 10/15/21 | | | | 20,000 | | | | 22,100 | |
ADT Corp., Senior Secured Notes | | | 4.125 | % | | | 6/15/23 | | | | 620,000 | | | | 628,134 | |
Brink’s Co., Senior Notes | | | 4.625 | % | | | 10/15/27 | | | | 600,000 | | | | 596,700 | (a) |
CD&R Waterworks Merger Subordinated LLC, Senior Notes | | | 6.125 | % | | | 8/15/25 | | | | 310,000 | | | | 317,068 | (a) |
Covanta Holding Corp., Senior Notes | | | 5.875 | % | | | 7/1/25 | | | | 580,000 | | | | 581,450 | |
GFL Environmental Inc., Senior Notes | | | 9.875 | % | | | 2/1/21 | | | | 570,000 | | | | 606,337 | (a) |
Monitronics International Inc., Senior Notes | | | 9.125 | % | | | 4/1/20 | | | | 480,000 | | | | 406,800 | |
Taylor Morrison Communities Inc./Taylor Morrison Holdings II Inc., Senior Notes | | | 5.875 | % | | | 4/15/23 | | | | 290,000 | | | | 309,030 | (a) |
See Notes to Financial Statements.
| | |
| 14 | | Western Asset High Yield Fund 2017 Semi-Annual Report |
Western Asset High Yield Fund
| | | | | | | | | | | | | | | | |
| Security | | Rate | | | Maturity
Date | | | Face
Amount† | | | Value | |
Commercial Services & Supplies — continued | | | | | | | | | | | | | | | | |
United Rentals North America Inc., Senior Notes | | | 5.500 | % | | | 7/15/25 | | | | 290,000 | | | $ | 309,575 | |
United Rentals North America Inc., Senior Notes | | | 4.625 | % | | | 10/15/25 | | | | 190,000 | | | | 194,085 | |
United Rentals North America Inc., Senior Notes | | | 5.500 | % | | | 5/15/27 | | | | 480,000 | | | | 510,000 | |
United Rentals North America Inc., Senior Notes | | | 4.875 | % | | | 1/15/28 | | | | 860,000 | | | | 871,825 | |
West Corp., Senior Secured Notes | | | 4.750 | % | | | 7/15/21 | | | | 250,000 | | | | 253,750 | (a) |
Total Commercial Services & Supplies | | | | | | | | | | | | | | | 6,076,542 | |
Construction & Engineering — 0.1% | | | | | | | | | | | | | | | | |
Ausdrill Finance Pty Ltd., Senior Notes | | | 6.875 | % | | | 11/1/19 | | | | 200,000 | | | | 203,500 | (a) |
Machinery — 1.3% | | | | | | | | | | | | | | | | |
Allison Transmission Inc., Senior Bonds | | | 5.000 | % | | | 10/1/24 | | | | 880,000 | | | | 918,764 | (a) |
Allison Transmission Inc., Senior Notes | | | 4.750 | % | | | 10/1/27 | | | | 510,000 | | | | 515,737 | (a) |
BlueLine Rental Finance Corp./BlueLine Rental LLC, Senior Secured Notes | | | 9.250 | % | | | 3/15/24 | | | | 1,050,000 | | | | 1,139,250 | (a) |
Park-Ohio Industries Inc., Senior Notes | | | 6.625 | % | | | 4/15/27 | | | | 449,000 | | | | 484,359 | |
Total Machinery | | | | | | | | | | | | | | | 3,058,110 | |
Marine — 0.4% | | | | | | | | | | | | | | | | |
Navios Maritime Acquisition Corp./Navios Acquisition Finance U.S. Inc., Senior Secured Notes | | | 8.125 | % | | | 11/15/21 | | | | 1,250,000 | | | | 1,065,625 | (a) |
Road & Rail — 0.5% | | | | | | | | | | | | | | | | |
Flexi-Van Leasing Inc., Senior Notes | | | 7.875 | % | | | 8/15/18 | | | | 1,130,000 | | | | 1,135,650 | (a) |
Trading Companies & Distributors — 0.9% | | | | | | | | | | | | | | | | |
Ahern Rentals Inc., Secured Notes | | | 7.375 | % | | | 5/15/23 | | | | 400,000 | | | | 380,500 | (a) |
Ashtead Capital Inc., Secured Notes | | | 5.625 | % | | | 10/1/24 | | | | 440,000 | | | | 468,600 | (a) |
Ashtead Capital Inc., Secured Notes | | | 4.125 | % | | | 8/15/25 | | | | 200,000 | | | | 201,750 | (a) |
Ashtead Capital Inc., Secured Notes | | | 4.375 | % | | | 8/15/27 | | | | 440,000 | | | | 449,073 | (a) |
Beacon Escrow Corp., Senior Notes | | | 4.875 | % | | | 11/1/25 | | | | 620,000 | | | | 635,500 | (a) |
Total Trading Companies & Distributors | | | | | | | | | | | | | | | 2,135,423 | |
Transportation — 0.1% | | | | | | | | | | | | | | | | |
Neovia Logistics Services LLC/Logistics Intermediate Finance Corp., Senior Notes (10.000% Cash or 10.750% PIK) | | | 10.000 | % | | | 4/1/20 | | | | 494,881 | | | | 230,120 | (a)(b) |
Neovia Logistics Services LLC/SPL Logistics Finance Corp., Senior Secured Notes | | | 8.875 | % | | | 8/1/20 | | | | 120,000 | | | | 100,200 | (a) |
Total Transportation | | | | | | | | | | | | | | | 330,320 | |
Total Industrials | | | | | | | | | | | | | | | 19,350,290 | |
| Information Technology — 2.3% | | | | | | | | | | | | | | | | |
Communications Equipment — 0.2% | | | | | | | | | | | | | | | | |
CommScope Technologies LLC, Senior Notes | | | 5.000 | % | | | 3/15/27 | | | | 430,000 | | | | 431,075 | (a) |
Internet Software & Services — 0.3% | | | | | | | | | | | | | | | | |
Match Group Inc., Senior Notes | | | 6.375 | % | | | 6/1/24 | | | | 350,000 | | | | 378,875 | |
See Notes to Financial Statements.
| | |
| Western Asset High Yield Fund 2017 Semi-Annual Report | | 15 |
Schedule of investments (unaudited) (cont’d)
November 30, 2017
Western Asset High Yield Fund
| | | | | | | | | | | | | | | | |
| Security | | Rate | | | Maturity
Date | | | Face
Amount† | | | Value | |
Internet Software & Services — continued | | | | | | | | | | | | | | | | |
Match Group Inc., Senior Notes | | | 5.000 | % | | | 12/15/27 | | | | 310,000 | | | $ | 313,100 | (a)(g) |
Total Internet Software & Services | | | | | | | | | | | | | | | 691,975 | |
IT Services — 1.0% | | | | | | | | | | | | | | | | |
Alliance Data Systems Corp., Senior Notes | | | 5.375 | % | | | 8/1/22 | | | | 850,000 | | | | 867,000 | (a) |
First Data Corp., Senior Notes | | | 7.000 | % | | | 12/1/23 | | | | 360,000 | | | | 382,500 | (a) |
First Data Corp., Senior Secured Notes | | | 5.000 | % | | | 1/15/24 | | | | 1,040,000 | | | | 1,080,300 | (a) |
Total IT Services | | | | | | | | | | | | | | | 2,329,800 | |
Semiconductors & Semiconductor Equipment — 0.2% | | | | | | | | | | | | | | | | |
Entegris Inc., Senior Notes | | | 4.625 | % | | | 2/10/26 | | | | 360,000 | | | | 368,550 | (a) |
Micron Technology Inc., Senior Notes | | | 5.500 | % | | | 2/1/25 | | | | 95,000 | | | | 100,937 | |
Total Semiconductors & Semiconductor Equipment | | | | | | | | | | | | | | | 469,487 | |
Software — 0.3% | | | | | | | | | | | | | | | | |
CDK Global Inc., Senior Notes | | | 4.875 | % | | | 6/1/27 | | | | 250,000 | | | | 258,125 | (a) |
j2 Cloud Services LLC/j2 Global Co.-Obligor Inc., Senior Notes | | | 6.000 | % | | | 7/15/25 | | | | 580,000 | | | | 606,100 | (a) |
Total Software | | | | | | | | | | | | | | | 864,225 | |
Technology Hardware, Storage & Peripherals — 0.3% | | | | | | | | | | | | | | | | |
Dell International LLC/EMC Corp., Senior Notes | | | 5.875 | % | | | 6/15/21 | | | | 360,000 | | | | 375,302 | (a) |
Dell International LLC/EMC Corp., Senior Notes | | | 7.125 | % | | | 6/15/24 | | | | 370,000 | | | | 402,354 | (a) |
Total Technology Hardware, Storage & Peripherals | | | | | | | | | | | | | | | 777,656 | |
Total Information Technology | | | | | | | | | | | | | | | 5,564,218 | |
| Materials — 8.7% | | | | | | | | | | | | | | | | |
Chemicals — 0.9% | | | | | | | | | | | | | | | | |
FXI Holdings Inc., Senior Secured Notes | | | 7.875 | % | | | 11/1/24 | | | | 570,000 | | | | 572,308 | (a) |
Valvoline Inc., Senior Notes | | | 5.500 | % | | | 7/15/24 | | | | 680,000 | | | | 722,500 | (a) |
Valvoline Inc., Senior Notes | | | 4.375 | % | | | 8/15/25 | | | | 450,000 | | | | 452,813 | (a) |
Venator Finance Sarl/Venator Materials Corp., Senior Notes | | | 5.750 | % | | | 7/15/25 | | | | 460,000 | | | | 486,450 | (a) |
Total Chemicals | | | | | | | | | | | | | | | 2,234,071 | |
Construction Materials — 0.5% | | | | | | | | | | | | | | | | |
American Builders & Contractors Supply Co. Inc., Senior Notes | | | 5.750 | % | | | 12/15/23 | | | | 740,000 | | | | 784,622 | (a) |
Summit Materials LLC/Summit Materials Finance Corp., Senior Notes | | | 5.125 | % | | | 6/1/25 | | | | 260,000 | | | | 265,850 | (a) |
Total Construction Materials | | | | | | | | | | | | | | | 1,050,472 | |
Containers & Packaging — 1.5% | | | | | | | | | | | | | | | | |
Ardagh Packaging Finance PLC/Ardagh MP Holdings USA Inc., Senior Notes | | | 6.000 | % | | | 2/15/25 | | | | 1,380,000 | | | | 1,469,838 | (a) |
Ardagh Packaging Finance PLC/Ardagh MP Holdings USA Inc., Senior Secured Notes | | | 4.625 | % | | | 5/15/23 | | | | 300,000 | | | | 309,000 | (a) |
Pactiv LLC, Senior Bonds | | | 8.375 | % | | | 4/15/27 | | | | 1,285,000 | | | | 1,471,325 | |
See Notes to Financial Statements.
| | |
| 16 | | Western Asset High Yield Fund 2017 Semi-Annual Report |
Western Asset High Yield Fund
| | | | | | | | | | | | | | | | |
| Security | | Rate | | | Maturity
Date | | | Face
Amount† | | | Value | |
Containers & Packaging — continued | | | | | | | | | | | | | | | | |
Plastipak Holdings Inc., Senior Notes | | | 6.250 | % | | | 10/15/25 | | | | 280,000 | | | $ | 286,300 | (a) |
Total Containers & Packaging | | | | | | | | | | | | | | | 3,536,463 | |
Metals & Mining — 5.5% | | | | | | | | | | | | | | | | |
Alcoa Nederland Holding BV, Senior Notes | | | 6.750 | % | | | 9/30/24 | | | | 410,000 | | | | 453,173 | (a) |
Alcoa Nederland Holding BV, Senior Notes | | | 7.000 | % | | | 9/30/26 | | | | 780,000 | | | | 885,300 | (a) |
Anglo American Capital PLC, Senior Notes | | | 4.125 | % | | | 4/15/21 | | | | 410,000 | | | | 424,537 | (a) |
Anglo American Capital PLC, Senior Notes | | | 4.125 | % | | | 9/27/22 | | | | 470,000 | | | | 486,369 | (a) |
Anglo American Capital PLC, Senior Notes | | | 3.625 | % | | | 9/11/24 | | | | 200,000 | | | | 198,749 | (a) |
Anglo American Capital PLC, Senior Notes | | | 4.875 | % | | | 5/14/25 | | | | 260,000 | | | | 273,875 | (a) |
Anglo American Capital PLC, Senior Notes | | | 4.750 | % | | | 4/10/27 | | | | 400,000 | | | | 416,204 | (a) |
ArcelorMittal SA, Senior Bonds | | | 6.125 | % | | | 6/1/25 | | | | 410,000 | | | | 473,550 | |
ArcelorMittal SA, Senior Notes | | | 7.250 | % | | | 3/1/41 | | | | 300,000 | | | | 375,375 | |
Arconic Inc., Senior Notes | | | 5.125 | % | | | 10/1/24 | | | | 510,000 | | | | 545,381 | |
Coeur Mining Inc., Senior Notes | | | 5.875 | % | | | 6/1/24 | | | | 370,000 | | | | 368,613 | |
First Quantum Minerals Ltd., Senior Notes | | | 7.250 | % | | | 4/1/23 | | | | 520,000 | | | | 551,200 | (a) |
First Quantum Minerals Ltd., Senior Notes | | | 7.500 | % | | | 4/1/25 | | | | 1,520,000 | | | | 1,622,600 | (a) |
Freeport-McMoRan Inc., Senior Notes | | | 6.750 | % | | | 2/1/22 | | | | 270,000 | | | | 280,800 | |
Freeport-McMoRan Inc., Senior Notes | | | 3.550 | % | | | 3/1/22 | | | | 850,000 | | | | 840,437 | |
Freeport-McMoRan Inc., Senior Notes | | | 6.875 | % | | | 2/15/23 | | | | 140,000 | | | | 153,482 | |
Freeport-McMoRan Inc., Senior Notes | | | 3.875 | % | | | 3/15/23 | | | | 310,000 | | | | 308,016 | |
Freeport-McMoRan Inc., Senior Notes | | | 5.450 | % | | | 3/15/43 | | | | 380,000 | | | | 361,836 | |
HudBay Minerals Inc., Senior Notes | | | 7.250 | % | | | 1/15/23 | | | | 560,000 | | | | 601,300 | (a) |
HudBay Minerals Inc., Senior Notes | | | 7.625 | % | | | 1/15/25 | | | | 900,000 | | | | 997,875 | (a) |
Midwest Vanadium Pty Ltd., Senior Secured Notes | | | 11.500 | % | | | 2/15/18 | | | | 1,132,733 | | | | 36,814 | *(a)(k) |
Mirabela Nickel Ltd., Subordinated Notes (1.000% PIK) | | | 1.000 | % | | | 9/10/44 | | | | 15,237 | | | | 0 | (a)(b)(c)(d)(f) |
Murray Energy Corp., Senior Secured Notes | | | 11.250 | % | | | 4/15/21 | | | | 830,000 | | | | 464,800 | (a) |
Northwest Acquisitions ULC/Dominion Finco Inc., Secured Notes | | | 7.125 | % | | | 11/1/22 | | | | 360,000 | | | | 372,600 | (a) |
Steel Dynamics Inc., Senior Notes | | | 5.000 | % | | | 12/15/26 | | | | 300,000 | | | | 317,814 | |
Teck Resources Ltd., Senior Notes | | | 4.750 | % | | | 1/15/22 | | | | 340,000 | | | | 358,700 | |
Teck Resources Ltd., Senior Notes | | | 6.250 | % | | | 7/15/41 | | | | 860,000 | | | | 984,700 | |
Total Metals & Mining | | | | | | | | | | | | | | | 13,154,100 | |
Paper & Forest Products — 0.3% | | | | | | | | | | | | | | | | |
Mercer International Inc., Senior Notes | | | 6.500 | % | | | 2/1/24 | | | | 710,000 | | | | 751,713 | |
Total Materials | | | | | | | | | | | | | | | 20,726,819 | |
| Real Estate — 3.1% | | | | | | | | | | | | | | | | |
Equity Real Estate Investment Trusts (REITs) — 2.6% | | | | | | | | | | | | | | | | |
CoreCivic Inc., Senior Notes | | | 4.125 | % | | | 4/1/20 | | | | 90,000 | | | | 92,349 | |
See Notes to Financial Statements.
| | |
| Western Asset High Yield Fund 2017 Semi-Annual Report | | 17 |
Schedule of investments (unaudited) (cont’d)
November 30, 2017
Western Asset High Yield Fund
| | | | | | | | | | | | | | | | |
| Security | | Rate | | | Maturity
Date | | | Face
Amount† | | | Value | |
Equity Real Estate Investment Trusts (REITs) — continued | | | | | | | | | | | | | | | | |
CoreCivic Inc., Senior Notes | | | 5.000 | % | | | 10/15/22 | | | | 440,000 | | | $ | 462,000 | |
CoreCivic Inc., Senior Notes | | | 4.625 | % | | | 5/1/23 | | | | 140,000 | | | | 143,500 | |
CoreCivic Inc., Senior Notes | | | 4.750 | % | | | 10/15/27 | | | | 620,000 | | | | 612,250 | |
CTR Partnership LP/CareTrust Capital Corp., Senior Notes | | | 5.250 | % | | | 6/1/25 | | | | 1,210,000 | | | | 1,240,250 | |
GEO Group Inc., Senior Notes | | | 5.125 | % | | | 4/1/23 | | | | 620,000 | | | | 626,200 | |
iStar Inc., Senior Bonds | | | 5.250 | % | | | 9/15/22 | | | | 470,000 | | | | 476,462 | |
MGM Growth Properties Operating Partnership LP/MGP Finance Co.-Issuer Inc., Senior Notes | | | 4.500 | % | | | 9/1/26 | | | | 550,000 | | | | 556,875 | |
MPT Operating Partnership LP/MPT Finance Corp., Senior Notes | | | 6.375 | % | | | 3/1/24 | | | | 300,000 | | | | 325,500 | |
MPT Operating Partnership LP/MPT Finance Corp., Senior Notes | | | 5.250 | % | | | 8/1/26 | | | | 250,000 | | | | 264,688 | |
MPT Operating Partnership LP/MPT Finance Corp., Senior Notes | | | 5.000 | % | | | 10/15/27 | | | | 470,000 | | | | 491,150 | |
Uniti Group Inc./CSL Capital LLC, Senior Notes | | | 8.250 | % | | | 10/15/23 | | | | 590,000 | | | | 567,875 | |
VICI Properties 1 LLC/VICI FC Inc., Senior Secured Notes (3 mo. USD LIBOR + 3.500%) | | | 4.847 | % | | | 10/15/22 | | | | 330,000 | | | | 332,888 | (h) |
Total Equity Real Estate Investment Trusts (REITs) | | | | | | | | | | | | | | | 6,191,987 | |
Real Estate Management & Development — 0.5% | | | | | | | | | | | | | | | | |
Caesars Entertainment Resort Properties LLC, Secured Notes | | | 11.000 | % | | | 10/1/21 | | | | 100,000 | | | | 106,500 | |
Five Point Operating Co. LP/Five Point Capital Corp., Senior Notes | | | 7.875 | % | | | 11/15/25 | | | | 1,000,000 | | | | 1,022,500 | (a) |
Total Real Estate Management & Development | | | | | | | | | | | | | | | 1,129,000 | |
Total Real Estate | | | | | | | | | | | | | | | 7,320,987 | |
| Telecommunication Services — 7.8% | | | | | | | | | | | | | | | | |
Diversified Telecommunication Services — 3.5% | | | | | | | | | | | | | | | | |
CenturyLink Inc., Senior Notes | | | 6.450 | % | | | 6/15/21 | | | | 330,000 | | | | 330,000 | |
CenturyLink Inc., Senior Notes | | | 5.625 | % | | | 4/1/25 | | | | 430,000 | | | | 381,948 | |
Cogent Communications Group Inc., Senior Secured Notes | | | 5.375 | % | | | 3/1/22 | | | | 1,070,000 | | | | 1,134,200 | (a) |
Frontier Communications Corp., Senior Notes | | | 11.000 | % | | | 9/15/25 | | | | 550,000 | | | | 424,875 | |
Intelsat Jackson Holdings SA, Senior Bonds | | | 5.500 | % | | | 8/1/23 | | | | 850,000 | | | | 698,062 | |
Intelsat Jackson Holdings SA, Senior Notes | | | 7.250 | % | | | 10/15/20 | | | | 400,000 | | | | 380,000 | |
Intelsat Jackson Holdings SA, Senior Secured Notes | | | 8.000 | % | | | 2/15/24 | | | | 850,000 | | | | 901,000 | (a) |
Level 3 Financing Inc., Senior Notes | | | 5.250 | % | | | 3/15/26 | | | | 770,000 | | | | 757,006 | |
Oi Brasil Holdings Cooperatief U.A., Senior Notes | | | 5.750 | % | | | 2/10/22 | | | | 1,240,000 | | | | 468,100 | *(a)(k) |
Telecom Italia SpA, Senior Notes | | | 5.303 | % | | | 5/30/24 | | | | 1,430,000 | | | | 1,530,529 | (a) |
Wind Tre SpA, Senior Secured Notes | | | 5.000 | % | | | 1/20/26 | | | | 370,000 | | | | 355,796 | (a) |
Windstream Services LLC, Senior Notes | | | 7.750 | % | | | 10/15/20 | | | | 690,000 | | | | 600,300 | |
See Notes to Financial Statements.
| | |
| 18 | | Western Asset High Yield Fund 2017 Semi-Annual Report |
Western Asset High Yield Fund
| | | | | | | | | | | | | | | | |
| Security | | Rate | | | Maturity
Date | | | Face
Amount† | | | Value | |
Diversified Telecommunication Services — continued | | | | | | | | | | | | | | | | |
Windstream Services LLC/Windstream Finance Corp., Senior Notes | | | 6.375 | % | | | 8/1/23 | | | | 567,000 | | | $ | 371,385 | (a) |
Total Diversified Telecommunication Services | | | | | | | | | | | | | | | 8,333,201 | |
Wireless Telecommunication Services — 4.3% | | | | | | | | | | | | | | | | |
Altice Financing SA, Senior Secured Bonds | | | 7.500 | % | | | 5/15/26 | | | | 560,000 | | | | 586,600 | (a) |
CSC Holdings LLC, Senior Notes | | | 6.625 | % | | | 10/15/25 | | | | 720,000 | | | | 777,600 | (a) |
CSC Holdings LLC, Senior Notes | | | 10.875 | % | | | 10/15/25 | | | | 504,000 | | | | 596,925 | (a) |
Sprint Capital Corp., Senior Notes | | | 8.750 | % | | | 3/15/32 | | | | 2,160,000 | | | | 2,505,600 | |
Sprint Communications Inc., Senior Notes | | | 9.000 | % | | | 11/15/18 | | | | 100,000 | | | | 105,750 | (a) |
Sprint Communications Inc., Senior Notes | | | 11.500 | % | | | 11/15/21 | | | | 715,000 | | | | 872,300 | |
Sprint Corp., Senior Notes | | | 7.250 | % | | | 9/15/21 | | | | 130,000 | | | | 138,775 | |
Sprint Corp., Senior Notes | | | 7.875 | % | | | 9/15/23 | | | | 2,190,000 | | | | 2,365,200 | |
Sprint Corp., Senior Notes | | | 7.625 | % | | | 2/15/25 | | | | 420,000 | | | | 447,090 | |
T-Mobile USA Inc., Senior Notes | | | 6.500 | % | | | 1/15/26 | | | | 1,730,000 | | | | 1,896,512 | |
Total Wireless Telecommunication Services | | | | | | | | | | | | | | | 10,292,352 | |
Total Telecommunication Services | | | | | | | | | | | | | | | 18,625,553 | |
| Utilities — 1.8% | | | | | | | | | | | | | | | | |
Electric Utilities — 0.9% | | | | | | | | | | | | | | | | |
NRG REMA LLC, Pass-Through Certificates, Senior Secured Bonds | | | 9.681 | % | | | 7/2/26 | | | | 2,115,000 | | | | 1,448,140 | |
Red Oak Power LLC, Secured Notes | | | 9.200 | % | | | 11/30/29 | | | | 500,000 | | | | 567,500 | |
Total Electric Utilities | | | | | | | | | | | | | | | 2,015,640 | |
Gas Utilities — 0.2% | | | | | | | | | | | | | | | | |
Suburban Propane Partners LP/Suburban Energy Finance Corp., Senior Notes | | | 5.875 | % | | | 3/1/27 | | | | 480,000 | | | | 471,600 | |
Independent Power and Renewable Electricity Producers — 0.7% | | | | | | | | | |
AES Corp., Senior Notes | | | 5.500 | % | | | 4/15/25 | | | | 820,000 | | | | 868,175 | |
Mirant Mid Atlantic LLC, Pass-Through Certificates, Secured Bonds | | | 10.060 | % | | | 12/30/28 | | | | 837,893 | | | | 816,946 | |
NRG Energy Inc., Senior Notes | | | 7.250 | % | | | 5/15/26 | | | | 30,000 | | | | 33,075 | |
Total Independent Power and Renewable Electricity Producers | | | | | | | | | | | | 1,718,196 | |
Total Utilities | | | | | | | | | | | | | | | 4,205,436 | |
Total Corporate Bonds & Notes (Cost — $201,554,095) | | | | | | | | | | | | | | | 204,167,866 | |
| Asset-Backed Securities — 3.6% | | | | | | | | | | | | | | | | |
Ares CLO Ltd., 2017-44A D (3 mo. USD LIBOR + 6.550%) | | | 7.864 | % | | | 10/15/29 | | | | 700,000 | | | | 725,666 | (a)(h) |
Avery Point CLO Ltd., 2015-6A E1 (3 mo. USD LIBOR + 5.500%) | | | 6.891 | % | | | 8/5/27 | | | | 750,000 | | | | 757,627 | (a)(h) |
Carlyle Global Market Strategies, 2015-2A D (3 mo. USD LIBOR + 5.300%) | | | 6.675 | % | | | 4/27/27 | | | | 500,000 | | | | 502,261 | (a)(h) |
See Notes to Financial Statements.
| | |
| Western Asset High Yield Fund 2017 Semi-Annual Report | | 19 |
Schedule of investments (unaudited) (cont’d)
November 30, 2017
Western Asset High Yield Fund
| | | | | | | | | | | | | | | | |
| Security | | Rate | | | Maturity
Date | | | Face
Amount† | | | Value | |
| Asset-Backed Securities — continued | | | | | | | | | | | | | | | | |
Carlyle Global Market Strategies, 2017-2A C (3 mo. USD LIBOR + 3.700%) | | | 5.032 | % | | | 7/20/31 | | | | 500,000 | | | $ | 513,021 | (a)(h) |
Catskill Park CLO Ltd., 2017-1A D (3 mo. USD LIBOR + 6.000%) | | | 7.363 | % | | | 4/20/29 | | | | 500,000 | | | | 509,004 | (a)(h) |
Cumberland Park CLO Ltd., 2015-2A E (3 mo. USD LIBOR + 5.000%) | | | 6.363 | % | | | 7/20/26 | | | | 500,000 | | | | 500,749 | (a)(h) |
Dryden Senior Loan Fund, 2015-40A E (3 mo. USD LIBOR + 5.950%) | | | 7.366 | % | | | 8/15/28 | | | | 750,000 | | | | 752,932 | (a)(h) |
Galaxy CLO Ltd., 2015-20A E (3 mo. USD LIBOR + 5.500%) | | | 6.863 | % | | | 7/20/27 | | | | 250,000 | | | | 250,713 | (a)(h) |
GoldenTree Loan Opportunities Ltd., 2015-10A E2 (3 mo. USD LIBOR + 5.200%) | | | 6.563 | % | | | 7/20/27 | | | | 500,000 | | | | 506,494 | (a)(h) |
Jamestown CLO Ltd., 2015-8A D2 (3 mo. USD LIBOR + 6.750%) | | | 8.109 | % | | | 1/15/28 | | | | 500,000 | | | | 501,989 | (a)(h) |
MidOcean Credit CLO, 2017-7A D (3 mo. USD LIBOR + 3.880%) | | | 5.199 | % | | | 7/15/29 | | | | 500,000 | | | | 509,193 | (a)(h) |
Neuberger Berman CLO Ltd., 2015-19A D (3 mo. USD LIBOR + 5.250%) | | | 6.609 | % | | | 7/15/27 | | | | 500,000 | | | | 501,103 | (a)(h) |
Oaktree CLO Ltd., 2015-1A D (3 mo. USD LIBOR + 5.600%) | | | 6.963 | % | | | 10/20/27 | | | | 500,000 | | | | 501,912 | (a)(h)�� |
Oaktree CLO Ltd., 2015-1A DR | | | 0.000 | % | | | 10/20/27 | | | | 250,000 | | | | 250,000 | (a)(g)(h) |
OZLM Ltd., 2017-19A C (3 mo. USD LIBOR + 3.100%) | | | 4.470 | % | | | 11/22/30 | | | | 800,000 | | | | 804,000 | (a)(h) |
Treman Park CLO Ltd., 2015-1A E (3 mo. USD LIBOR + 6.200%) | | | 7.563 | % | | | 4/20/27 | | | | 500,000 | | | | 502,604 | (a)(h) |
Total Asset-Backed Securities (Cost — $8,187,309) | | | | | | | | | | | | | | | 8,589,268 | |
| Collateralized Mortgage Obligations (l) — 0.6% | | | | | | | | | | | | | | | | |
Commercial Mortgage Trust, 2015-LC21 E | | | 3.250 | % | | | 7/10/48 | | | | 900,000 | | | | 531,395 | (a) |
JPMBB Commercial Mortgage Securities Trust, 2015-C31 E | | | 4.772 | % | | | 8/15/48 | | | | 700,000 | | | | 445,214 | (a)(h) |
Wells Fargo Commercial Mortgage Trust, 2015-C28 E | | | 3.000 | % | | | 5/15/48 | | | | 800,000 | | | | 450,312 | (a) |
Total Collateralized Mortgage Obligations (Cost — $1,615,113) | | | | | | | | | | | | 1,426,921 | |
| Convertible Bonds & Notes — 1.2% | | | | | | | | | | | | | | | | |
| Consumer Discretionary — 0.2% | | | | | | | | | | | | | | | | |
Media — 0.2% | | | | | | | | | | | | | | | | |
DISH Network Corp., Senior Bonds | | | 3.375 | % | | | 8/15/26 | | | | 110,000 | | | | 123,131 | |
DISH Network Corp., Senior Notes | | | 2.375 | % | | | 3/15/24 | | | | 410,000 | | | | 401,031 | (a) |
Total Consumer Discretionary | | | | | | | | | | | | | | | 524,162 | |
| Energy — 0.3% | | | | | | | | | | | | | | | | |
Oil, Gas & Consumable Fuels — 0.3% | | | | | | | | | | | | | | | | |
Chesapeake Energy Corp., Senior Notes | | | 5.500 | % | | | 9/15/26 | | | | 280,000 | | | | 258,125 | (a) |
Whiting Petroleum Corp., Senior Notes | | | 1.250 | % | | | 4/1/20 | | | | 570,000 | | | | 515,850 | |
Total Energy | | | | | | | | | | | | | | | 773,975 | |
| Health Care — 0.2% | | | | | | | | | | | | | | | | |
Pharmaceuticals — 0.2% | | | | | | | | | | | | | | | | |
Jazz Investments I Ltd., Senior Notes | | | 1.500 | % | | | 8/15/24 | | | | 410,000 | | | | 390,269 | (a) |
See Notes to Financial Statements.
| | |
| 20 | | Western Asset High Yield Fund 2017 Semi-Annual Report |
Western Asset High Yield Fund
| | | | | | | | | | | | | | | | |
| Security | | Rate | | | Maturity
Date | | | Face
Amount† | | | Value | |
| Information Technology — 0.5% | | | | | | | | | | | | | | | | |
Communications Equipment — 0.0% | | | | | | | | | | | | | | | | |
Finisar Corp., Senior Bonds | | | 0.500 | % | | | 12/15/33 | | | | 90,000 | | | $ | 91,013 | |
Semiconductors & Semiconductor Equipment — 0.1% | | | | | | | | | | | | | | | | |
ON Semiconductor Corp., Senior Notes | | | 1.625 | % | | | 10/15/23 | | | | 210,000 | | | | 253,313 | (a) |
Software — 0.3% | | | | | | | | | | | | | | | | |
Verint Systems Inc., Senior Notes | | | 1.500 | % | | | 6/1/21 | | | | 80,000 | | | | 79,250 | |
Workday Inc., Senior Notes | | | 0.250 | % | | | 10/1/22 | | | | 570,000 | | | | 563,587 | (a) |
Total Software | | | | | | | | | | | | | | | 642,837 | |
Technology Hardware, Storage & Peripherals — 0.1% | | | | | | | | | | | | | | | | |
Electronics For Imaging Inc., Senior Bonds | | | 0.750 | % | | | 9/1/19 | | | | 260,000 | | | | 253,987 | |
Total Information Technology | | | | | | | | | | | | | | | 1,241,150 | |
Total Convertible Bonds & Notes (Cost — $2,898,821) | | | | | | | | | | | | | | | 2,929,556 | |
| Senior Loans — 2.3% | | | | | | | | | | | | | | | | |
| Consumer Discretionary — 0.6% | | | | | | | | | | | | | | | | |
Diversified Consumer Services — 0.2% | | | | | | | | | | | | | | | | |
Laureate Education Inc., 2017 Term Loan B (1 mo. LIBOR + 4.500%) | | | 5.850 | % | | | 4/26/24 | | | | 507,450 | | | | 510,939 | (h)(m)(n) |
Specialty Retail — 0.3% | | | | | | | | | | | | | | | | |
PetSmart Inc., Term Loan B2 (1 mo. LIBOR + 3.000%) | | | 4.340 | % | | | 3/11/22 | | | | 179,540 | | | | 154,591 | (h)(m)(n) |
Spencer Gifts LLC, Second Lien Term Loan (2 mo. LIBOR + 8.250%) | | | 9.530 | % | | | 6/29/22 | | | | 830,000 | | | | 456,500 | (c)(h)(m)(n) |
Total Specialty Retail | | | | | | | | | | | | | | | 611,091 | |
Textiles, Apparel & Luxury Goods — 0.1% | | | | | | | | | | | | | | | | |
TOMS Shoes LLC, Term Loan B (3 mo. LIBOR + 5.500%) | | | 6.980 | % | | | 10/28/20 | | | | 624,000 | | | | 310,960 | (h)(m)(n) |
Total Consumer Discretionary | | | | | | | | | | | | | | | 1,432,990 | |
| Energy — 0.3% | | | | | | | | | | | | | | | | |
Energy Equipment & Services — 0.1% | | | | | | | | | | | | | | | | |
Hercules Offshore Inc. (wind-down lender claim) | | | — | | | | — | | | | 215,310 | | | | 183,014 | *(c) |
Pacific Drilling SA, Term Loan B (3 mo. LIBOR + 3.500%) | | | 4.875 | % | | | 6/3/18 | | | | 146,931 | | | | 49,222 | (c)(h)(m)(n) |
Total Energy Equipment & Services | | | | | | | | | | | | | | | 232,236 | |
Oil, Gas & Consumable Fuels — 0.2% | | | | | | | | | | | | | | | | |
Chesapeake Energy Corp., Term Loan (3 mo. LIBOR + 7.500%) | | | 8.954 | % | | | 8/23/21 | | | | 510,000 | | | | 544,425 | (c)(h)(m)(n) |
Total Energy | | | | | | | | | | | | | | | 776,661 | |
| Health Care — 0.7% | | | | | | | | | | | | | | | | |
Health Care Equipment & Supplies — 0.4% | | | | | | | | | | | | | | | | |
Immucor Inc., Extended Term Loan B (2 mo. LIBOR + 5.000%) | | | 6.314 | % | | | 6/15/21 | | | | 381,823 | | | | 388,345 | (h)(m)(n) |
Lantheus Medical Imaging Inc., 2017 Term Loan (1 mo. LIBOR + 4.500%) | | | 5.742 | % | | | 6/30/22 | | | | 567,150 | | | | 572,822 | (c)(h)(m)(n) |
Total Health Care Equipment & Supplies | | | | | | | | | | | | | | | 961,167 | |
See Notes to Financial Statements.
| | |
| Western Asset High Yield Fund 2017 Semi-Annual Report | | 21 |
Schedule of investments (unaudited) (cont’d)
November 30, 2017
Western Asset High Yield Fund
| | | | | | | | | | | | | | | | |
| Security | | Rate | | | Maturity
Date | | | Face
Amount† | | | Value | |
Health Care Providers & Services — 0.3% | | | | | | | | | | | | | |
RadNet Inc., Reprice Term Loan (3 mo. LIBOR + 3.750%) | | | 5.110-7.000 | % | | | 6/30/23 | | | | 848,831 | | | $ | 855,197 | (h)(m)(n) |
Total Health Care | | | | | | | | | | | | | | | 1,816,364 | |
| Information Technology — 0.2% | | | | | | | | | | | | | | | | |
Internet Software & Services — 0.2% | | | | | | | | | | | | | | | | |
Ancestry.com Operations Inc., 2017 First Lien Term Loan | | | — | | | | 10/19/23 | | | | 470,000 | | | | 473,378 | (o) |
| Materials — 0.2% | | | | | | | | | | | | | | | | |
Metals & Mining — 0.2% | | | | | | | | | | | | | | | | |
Murray Energy Corp., Term Loan B2 (3 mo. LIBOR + 7.250%) | | | 8.583 | % | | | 4/16/20 | | | | 476,964 | | | | 424,413 | (h)(m)(n) |
| Utilities — 0.3% | | | | | | | | | | | | | | | | |
Electric Utilities — 0.3% | | | | | | | | | | | | | | | | |
Panda Temple Power LLC, 2015 Term Loan B (3 mo. ICE LIBOR + 6.250% PIK) | | | 7.397 | % | | | 3/4/22 | | | | 982,402 | | | | 687,681 | *(b)(h)(k)(m)(n) |
Total Senior Loans (Cost — $6,633,898) | | | | | | | | | | | | 5,611,487 | |
| Sovereign Bonds — 1.0% | | | | | | | | | | | | | | | | |
Argentina — 0.4% | | | | | | | | | | | | | | | | |
Republic of Argentina, Senior Bonds | | | 6.875 | % | | | 4/22/21 | | | | 160,000 | | | | 173,980 | |
Republic of Argentina, Senior Bonds | | | 5.625 | % | | | 1/26/22 | | | | 240,000 | | | | 252,480 | |
Republic of Argentina, Senior Bonds | | | 7.500 | % | | | 4/22/26 | | | | 250,000 | | | | 283,250 | |
Republic of Argentina, Senior Notes | | | 6.875 | % | | | 1/26/27 | | | | 330,000 | | | | 361,185 | |
Total Argentina | | | | | | | | | | | | | | | 1,070,895 | |
Mexico — 0.6% | | | | | | | | | | | | | | | | |
United Mexican States, Senior Bonds | | | 6.500 | % | | | 6/9/22 | | | | 27,277,000 | MXN | | | 1,428,654 | |
Total Sovereign Bonds (Cost — $3,187,233) | | | | | | | | | | | | 2,499,549 | |
| | | | |
| | | | | | | | | Shares | | | | |
| Common Stocks — 2.4% | | | | | | | | | | | | | | | | |
| Consumer Discretionary — 0.5% | | | | | | | | | | | | | | | | |
Hotels, Restaurants & Leisure — 0.4% | | | | | | | | | | | | | | | | |
Bossier Casino Venture Holdco Inc. | | | | | | | | | | | 81,754 | | | | 865,775 | *(c)(d) |
Media — 0.1% | | | | | | | | | | | | | | | | |
New Cotai LLC/New Cotai Capital Corp., Class B Shares | | | | | | | | | | | 6 | | | | 199,296 | *(c)(d) |
Total Consumer Discretionary | | | | | | | | | | | | | | | 1,065,071 | |
| Energy — 1.8% | | | | | | | | | | | | | | | | |
Energy Equipment & Services — 0.8% | | | | | | | | | | | | | | | | |
KCAD Holdings I Ltd. | | | | | | | | | | | 424,046,710 | | | | 1,908,210 | * (c)(d) |
See Notes to Financial Statements.
| | |
| 22 | | Western Asset High Yield Fund 2017 Semi-Annual Report |
Western Asset High Yield Fund
| | | | | | | | | | | | | | | | |
| Security | | | | | | | | Shares | | | Value | |
Oil, Gas & Consumable Fuels — 1.0% | | | | | | | | | | | | | | | | |
Berry Petroleum Co. | | | | | | | | | | | 123,003 | | | $ | 1,178,775 | * |
Blue Ridge Mountain Resources Inc. | | | | | | | | | | | 130,264 | | | | 1,302,640 | * |
MWO Holdings LLC | | | | | | | | | | | 621 | | | | 0 | *(c)(d)(f) |
Total Oil, Gas & Consumable Fuels | | | | | | | | | | | | | | | 2,481,415 | |
Total Energy | | | | | | | | | | | | | | | 4,389,625 | |
| Industrials — 0.1% | | | | | | | | | | | | | | | | |
Marine — 0.1% | | | | | | | | | | | | | | | | |
Tricer HoldCo, S.C.A. | | | | | | | | | | | 58,411 | | | | 160,630 | *(c)(d) |
Road & Rail — 0.0% | | | | | | | | | | | | | | | | |
Jack Cooper Enterprises Inc. | | | | | | | | | | | 3,456 | | | | 0 | *(a)(c)(d)(f) |
Total Industrials | | | | | | | | | | | | | | | 160,630 | |
Total Common Stocks (Cost — $9,268,608) | | | | | | | | | | | | | | | 5,615,326 | |
| | | | |
| | | Rate | | | | | | | | | | |
| Convertible Preferred Stocks — 0.8% | | | | | | | | | | | | | | | | |
| Energy — 0.8% | | | | | | | | | | | | | | | | |
Oil, Gas & Consumable Fuels — 0.8% | | | | | | | | | | | | | | | | |
Berry Petroleum Co., (6.000% Cash or 6.000% PIK) | | | 6.000 | % | | | | | | | 133,672 | | | | 1,420,265 | (b) |
Berry Petroleum Co., (6.000% Cash or 6.000% PIK) | | | 6.000 | % | | | | | | | 2,002 | | | | 21,271 | (b)(j) |
Sanchez Energy Corp. | | | 6.500 | % | | | | | | | 17,300 | | | | 351,882 | |
Total Convertible Preferred Stocks (Cost — $2,012,069) | | | | | | | | | | | | 1,793,418 | |
| Preferred Stocks — 0.4% | | | | | | | | | | | | | | | | |
| Financials — 0.3% | | | | | | | | | | | | | | | | |
Diversified Financial Services — 0.3% | | | | | | | | | | | | | | | | |
Citigroup Capital XIII (3 mo. USD LIBOR + 6.370%) | | | 7.750 | % | | | | | | | 26,950 | | | | 738,969 | (h) |
| Industrials — 0.1% | | | | | | | | | | | | | | | | |
Marine — 0.1% | | | | | | | | | | | | | | | | |
Tricer Tracking Preferred Equity Certificates | | | 8.000 | % | | | | | | | 25,960,600 | | | | 259,606 | *(c)(d) |
Total Preferred Stocks (Cost — $2,825,132) | | | | | | | | | | | | | | | 998,575 | |
Total Investments before Short-Term Investments (Cost — $238,182,278) | | | | 233,631,966 | |
| Short-Term Investments — 1.3% | | | | | | | | | | | | | | | | |
Western Asset Government Cash Management Portfolio LLC
(Cost — $3,005,690) | | | 1.130 | % | | | | | | | 3,005,690 | | | | 3,005,690 | (p) |
Total Investments — 99.0% (Cost — $241,187,968) | | | | | | | | | | | | | | | 236,637,656 | |
Other Assets in Excess of Liabilities — 1.0% | | | | | | | | | | | | | | | 2,396,751 | |
Total Net Assets — 100.0% | | | | | | | | | | | | | | $ | 239,034,407 | |
| † | Face amount denominated in U.S. dollars, unless otherwise noted. |
| * | Non-income producing security. |
See Notes to Financial Statements.
| | |
| Western Asset High Yield Fund 2017 Semi-Annual Report | | 23 |
Schedule of investments (unaudited) (cont’d)
November 30, 2017
Western Asset High Yield Fund
| (a) | Security is exempt from registration under Rule 144A of the Securities Act of 1933. This security may be resold in transactions that are exempt from registration, normally to qualified institutional buyers. This security has been deemed liquid pursuant to guidelines approved by the Board of Directors. |
| (b) | Payment-in-kind security for which the issuer has the option at each interest payment date of making interest payments in cash or additional debt securities. |
| (c) | Security is valued using significant unobservable inputs (See Note 1). |
| (d) | Security is valued in good faith in accordance with procedures approved by the Board of Directors (See Note 1). |
| (e) | The maturity principal is currently in default as of November 30, 2017. |
| (f) | Value is less than $1. |
| (g) | Securities traded on a when-issued or delayed delivery basis. |
| (h) | Variable rate security. Interest rate disclosed is as of the most recent information available. Certain variable rate securities are not based on a published reference rate and spread but are determined by the issuer or agent and are based on current market conditions. These securities do not indicate a reference rate and spread in their description above. |
| (i) | Security has no maturity date. The date shown represents the next call date. |
| (j) | Restricted security (See Note 9). |
| (k) | The coupon payment on these securities is currently in default as of November 30, 2017. |
| (l) | Collateralized mortgage obligations are secured by an underlying pool of mortgages or mortgage pass-through certificates that are structured to direct payments on underlying collateral to different series or classes of the obligations. The interest rate may change positively or inversely in relation to one or more interest rates, financial indices or other financial indicators and may be subject to an upper and/or lower limit. |
| (m) | Senior loans may be considered restricted in that the Fund ordinarily is contractually obligated to receive approval from the agent bank and/or borrower prior to the disposition of a senior loan. |
| (n) | Interest rates disclosed represent the effective rates on senior loans. Ranges in interest rates are attributable to multiple contracts under the same loan. |
| (o) | All or a portion of this loan is unfunded as of November 30, 2017. The interest rate for fully unfunded term loans is to be determined. |
| (p) | In this instance, as defined in the Investment Company Act of 1940, an “Affiliated Company” represents Fund ownership of at least 5% of the outstanding voting securities of an issuer or a company which is under common ownership or control. At November 30, 2017, the total market value of investments in Affiliated Companies was $3,005,690 and the cost was $3,005,690 (See Note 10). |
| | |
Abbreviations used in this schedule: |
| CLO | | — Collateral Loan Obligation |
| EUR | | — Euro |
| LIBOR | | — London Interbank Offered Rate |
| MXN | | — Mexican Peso |
See Notes to Financial Statements.
| | |
| 24 | | Western Asset High Yield Fund 2017 Semi-Annual Report |
Western Asset High Yield Fund
At November 30, 2017, the Fund had the following open futures contracts:
| | | | | | | | | | | | | | | | | | | | |
| | | Number of
Contracts | | | Expiration
Date | | | Notional
Amount | | | Market
Value | | | Unrealized
Appreciation
(Depreciation) | |
| Contracts to Buy: | | | | | | | | | | | | | | | | | | | | |
| U.S. Treasury 5-Year Notes | | | 205 | | | | 3/18 | | | $ | 23,927,314 | | | $ | 23,850,469 | | | $ | (76,845) | |
| U.S. Treasury Ultra Long-Term Bonds | | | 12 | | | | 3/18 | | | | 1,990,883 | | | | 1,978,500 | | | | (12,383) | |
| | | | | | | | | | | | | | | | | | | | (89,228) | |
| Contracts to Sell: | | | | | | | | | | | | | | | | | | | | |
| U.S. Treasury Long-Term Bonds | | | 14 | | | | 3/18 | | | | 2,144,194 | | | | 2,124,063 | | | | 20,131 | |
| Net unrealized depreciation on open futures contracts | | | | | | | $ | (69,097) | |
At November 30, 2017, the Fund had the following open forward foreign currency contracts:
| | | | | | | | | | | | | | | | | | | | |
Currency
Purchased | | | Currency
Sold | | | Counterparty | | Settlement
Date | | | Unrealized
Depreciation | |
| USD | | | 688,669 | | | EUR | | | 580,000 | | | Citibank N.A. | | | 1/19/18 | | | $ | (3,850) | |
| | |
Abbreviations used in this table: |
| EUR | | — EURO |
| USD | | — United States Dollar |
See Notes to Financial Statements.
| | |
| Western Asset High Yield Fund 2017 Semi-Annual Report | | 25 |
Statement of assets and liabilities (unaudited)
November 30, 2017
| | | | |
| |
| Assets: | | | | |
Investments in unaffiliated securities, at value (Cost — $238,182,278) | | $ | 233,631,966 | |
Investments in affiliated securities, at value (Cost — $3,005,690) | | | 3,005,690 | |
Foreign currency, at value (Cost — $229,847) | | | 227,669 | |
Cash | | | 318,327 | |
Interest receivable | | | 3,391,665 | |
Receivable for securities sold | | | 265,986 | |
Deposits with brokers for centrally cleared swap contracts | | | 211,185 | |
Deposits with brokers for open futures contracts | | | 144,294 | |
Receivable for Fund shares sold | | | 138,792 | |
Prepaid expenses | | | 74,727 | |
Total Assets | | | 241,410,301 | |
| |
| Liabilities: | | | | |
Payable for securities purchased | | | 1,998,524 | |
Investment management fee payable | | | 106,193 | |
Payable for Fund shares repurchased | | | 76,338 | |
Payable to broker — variation margin on open futures contracts | | | 56,344 | |
Distributions payable | | | 34,633 | |
Service and/or distribution fees payable | | | 10,336 | |
Payable to broker — variation margin on centrally cleared swaps | | | 9,065 | |
Unrealized depreciation on forward foreign currency contracts | | | 3,850 | |
Directors’ fees payable | | | 1,085 | |
Accrued expenses | | | 79,526 | |
Total Liabilities | | | 2,375,894 | |
| Total Net Assets | | $ | 239,034,407 | |
| |
| Net Assets: | | | | |
Par value (Note 7) | | $ | 29,439 | |
Paid-in capital in excess of par value | | | 283,562,365 | |
Overdistributed net investment income | | | (217,662) | |
Accumulated net realized loss on investments, futures contracts, written options, swap contracts, forward foreign currency contracts and foreign currency transactions | | | (39,713,345) | |
Net unrealized depreciation on investments, futures contracts, forward foreign currency contracts and foreign currencies | | | (4,626,390) | |
| Total Net Assets | | $ | 239,034,407 | |
See Notes to Financial Statements.
| | |
| 26 | | Western Asset High Yield Fund 2017 Semi-Annual Report |
| | | | |
| |
| Net Assets: | | | | |
Class A | | | $4,060,959 | |
Class A2 | | | $30,991,153 | |
Class C | | | $3,728,106 | |
Class R | | | $227,253 | |
Class I | | | $89,770,693 | |
Class IS | | | $110,256,243 | |
| |
| Shares Outstanding: | | | | |
Class A | | | 501,172 | |
Class A2 | | | 3,814,965 | |
Class C | | | 463,721 | |
Class R | | | 28,195 | |
Class I | | | 11,152,230 | |
Class IS | | | 13,479,016 | |
| |
| Net Asset Value: | | | | |
Class A (and redemption price) | | | $8.10 | |
Class A2 (and redemption price) | | | $8.12 | |
Class C* | | | $8.04 | |
Class R (and redemption price) | | | $8.06 | |
Class I (and redemption price) | | | $8.05 | |
Class IS (and redemption price) | | | $8.18 | |
| Maximum Public Offering Price Per Share: | | | | |
Class A (based on maximum initial sales charge of 4.25%) | | | $8.46 | |
Class A2 (based on maximum initial sales charge of 4.25%) | | | $8.48 | |
| * | Redemption price per share is NAV of Class C shares reduced by a 1.00% CDSC if shares are redeemed within one year from purchase payment (See Note 2). |
See Notes to Financial Statements.
| | |
| Western Asset High Yield Fund 2017 Semi-Annual Report | | 27 |
Statement of operations (unaudited)
For the Six Months Ended November 30, 2017
| | | | |
| |
| Investment Income: | | | | |
Interest from unaffiliated investments | | $ | 7,849,273 | |
Interest from affiliated investments | | | 21,964 | |
Dividends | | | 113,135 | |
Total Investment Income | | | 7,984,372 | |
| |
| Expenses: | | | | |
Investment management fee (Note 2) | | | 687,902 | |
Service and/or distribution fees (Notes 2 and 5) | | | 63,069 | |
Registration fees | | | 50,056 | |
Transfer agent fees (Note 5) | | | 37,803 | |
Audit and tax fees | | | 30,052 | |
Fund accounting fees | | | 20,751 | |
Shareholder reports | | | 14,179 | |
Interest expense | | | 12,048 | |
Custody fees | | | 4,676 | |
Legal fees | | | 4,452 | |
Directors’ fees | | | 3,496 | |
Insurance | | | 2,358 | |
Commitment fees (Note 8) | | | 1,140 | |
Fees recaptured by investment manager (Note 2) | | | 38 | |
Miscellaneous expenses | | | 5,162 | |
Total Expenses | | | 937,182 | |
Less: Fee waivers and/or expense reimbursements (Notes 2 and 5) | | | (6,129) | |
Net Expenses | | | 931,053 | |
| Net Investment Income | | | 7,053,319 | |
| |
Realized and Unrealized Gain (Loss) on Investments, Futures Contracts, Written Options,
Swap Contracts, Forward Foreign Currency Contracts and Foreign Currency Transactions
(Notes 1, 3 and 4): | | | | |
Net Realized Gain (Loss) From: | | | | |
Investment transactions in unaffiliated securities | | | (2,460,733) | |
Futures contracts | | | (147,577) | |
Written options | | | 40,443 | |
Swap contracts | | | 7,394 | |
Forward foreign currency contracts | | | (10,129) | |
Foreign currency transactions | | | (1,268) | |
Net Realized Loss | | | (2,571,870) | |
Change in Net Unrealized Appreciation (Depreciation) From: | | | | |
Investments in unaffiliated securities | | | 2,128,846 | |
Futures contracts | | | (138,713) | |
Swap contracts | | | (133,761) | |
Forward foreign currency contracts | | | (3,850) | |
Foreign currencies | | | (4,728) | |
Change in Net Unrealized Appreciation (Depreciation) | | | 1,847,794 | |
| Net Loss on Investments, Futures Contracts, Written Options, Swap Contracts, Forward Foreign Currency Contracts and Foreign Currency Transactions | | | (724,076) | |
| Increase in Net Assets From Operations | | $ | 6,329,243 | |
See Notes to Financial Statements.
| | |
| 28 | | Western Asset High Yield Fund 2017 Semi-Annual Report |
Statements of changes in net assets
| | | | | | | | |
For the Six Months Ended November 30, 2017 (unaudited)
and the Year Ended May 31, 2017 | | November 30 | | | May 31 | |
| | |
| Operations: | | | | | | | | |
Net investment income | | $ | 7,053,319 | | | $ | 17,642,386 | |
Net realized loss | | | (2,571,870) | | | | (1,895,183) | |
Change in net unrealized appreciation (depreciation) | | | 1,847,794 | | | | 20,358,485 | |
Increase in Net Assets From Operations | | | 6,329,243 | | | | 36,105,688 | |
| | |
| Distributions to Shareholders From (Notes 1 and 6): | | | | | | | | |
Net investment income | | | (7,023,155) | | | | (15,989,470) | |
Return of capital | | | — | | | | (685,247) | |
Decrease in Net Assets From Distributions to Shareholders | | | (7,023,155) | | | | (16,674,717) | |
| | |
| Fund Share Transactions (Note 7): | | | | | | | | |
Net proceeds from sale of shares | | | 23,170,884 | | | | 140,354,973 | |
Reinvestment of distributions | | | 6,814,874 | | | | 16,360,121 | |
Cost of shares repurchased | | | (45,597,268) | | | | (222,856,875) | |
Decrease in Net Assets From Fund Share Transactions | | | (15,611,510) | | | | (66,141,781) | |
Decrease in Net Assets | | | (16,305,422) | | | | (46,710,810) | |
| | |
| Net Assets: | | | | | | | | |
Beginning of period | | | 255,339,829 | | | | 302,050,639 | |
End of period* | | $ | 239,034,407 | | | $ | 255,339,829 | |
*Includes overdistributed net investment income of: | | | $(217,662) | | | | $(247,826) | |
See Notes to Financial Statements.
| | |
| Western Asset High Yield Fund 2017 Semi-Annual Report | | 29 |
Financial highlights
| | | | | | | | | | | | | | | | | | | | | | | | | | | | |
For a share of each class of capital stock outstanding throughout each year ended May 31,
unless otherwise noted: | |
| Class A Shares1 | | 20172 | | | 2017 | | | 2016 | | | 2015 | | | 20143 | | | 20134 | | | 20125 | |
| | | | | | | |
| Net asset value, beginning of period | | | $8.13 | | | | $7.60 | | | | $8.60 | | | | $9.19 | | | | $9.04 | | | | $8.86 | | | | $8.61 | |
| | | | | | | |
| Income (loss) from operations: | | | | | | | | | | | | | | | | | | | | | | | | | | | | |
Net investment income | | | 0.22 | | | | 0.47 | | | | 0.50 | | | | 0.52 | | | | 0.23 | | | | 0.55 | | | | 0.40 | |
Net realized and unrealized gain (loss) | | | (0.03) | | | | 0.50 | | | | (1.00) | | | | (0.58) | | | | 0.14 | | | | 0.17 | | | | 0.37 | |
Total income (loss) from operations | | | 0.19 | | | | 0.97 | | | | (0.50) | | | | (0.06) | | | | 0.37 | | | | 0.72 | | | | 0.77 | |
| | | | | | | |
| Less distributions from: | | | | | | | | | | | | | | | | | | | | | | | | | | | | |
Net investment income | | | (0.22) | | | | (0.42) | | | | (0.50) | | | | (0.53) | | | | (0.22) | | | | (0.54) | | | | (0.52) | |
Return of capital | | | — | | | | (0.02) | | | | — | | | | — | | | | — | | | | — | | | | — | |
Total distributions | | | (0.22) | | | | (0.44) | | | | (0.50) | | | | (0.53) | | | | (0.22) | | | | (0.54) | | | | (0.52) | |
| | | | | | | |
| Net asset value, end of period | | | $8.10 | | | | $8.13 | | | | $7.60 | | | | $8.60 | | | | $9.19 | | | | $9.04 | | | | $8.86 | |
Total return6 | | | 2.35 | % | | | 13.07 | % | | | (5.63) | % | | | (0.62) | %7 | | | 4.25 | % | | | 8.26 | % | | | 9.25 | % |
| | | | | | | |
| Net assets, end of period (000s) | | | $4,061 | | | | $6,137 | | | | $10,896 | | | | $6,453 | | | | $9,579 | | | | $10,391 | | | | $406 | |
| | | | | | | |
| Ratios to average net assets: | | | | | | | | | | | | | | | | | | | | | | | | | | | | |
Gross expenses | | | 0.99 | %8 | | | 0.99 | % | | | 0.96 | % | | | 0.96 | %9 | | | 1.05 | %8,9 | | | 1.10 | %9 | | | 1.12 | %8 |
Net expenses10 | | | 0.99 | 8 | | | 0.99 | 11 | | | 0.96 | | | | 0.96 | 9 | | | 1.05 | 8,9 | | | 0.98 | 9,11 | | | 0.93 | 8,11 |
Net investment income | | | 5.39 | 8 | | | 5.96 | | | | 6.58 | | | | 5.96 | | | | 5.96 | 8 | | | 6.09 | | | | 6.90 | 8 |
| | | | | | | |
| Portfolio turnover rate | | | 31 | % | | | 74 | % | | | 71 | % | | | 82 | % | | | 33 | % | | | 103 | % | | | 86 | % |
| 1 | Per share amounts have been calculated using the average shares method. |
| 2 | For the six months ended November 30, 2017 (unaudited). |
| 3 | For the period January 1, 2014 through May 31, 2014. |
| 4 | For the year ended December 31. |
| 5 | For the period April 30, 2012 (inception date) to December 31, 2012. |
| 6 | Performance figures, exclusive of sales charges, may reflect compensating balance arrangements, fee waivers and/or expense reimbursements. In the absence of compensating balance arrangements, fee waivers and/or expense reimbursements, the total return would have been lower. Past performance is no guarantee of future results. Total returns for periods of less than one year are not annualized. |
| 7 | The total return includes gains from settlement of security litigations. Without these gains, the total return would have been -0.74% for the year ended May 31, 2015. |
| 9 | Reflects recapture of expenses waived/reimbursed from prior fiscal years. |
| 10 | As a result of an expense limitation arrangement, the ratio of total annual fund operating expenses, other than interest, brokerage commissions, taxes, extraordinary expenses, deferred organizational expenses and acquired fund fees and expenses, to average net assets of Class A shares did not exceed 1.05%. This expense limitation arrangement cannot be terminated prior to December 31, 2019 without the Board of Directors’ consent. |
| 11 | Reflects fee waivers and/or expense reimbursements. |
See Notes to Financial Statements.
| | |
| 30 | | Western Asset High Yield Fund 2017 Semi-Annual Report |
| | | | | | | | | | | | | | | | |
For a share of each class of capital stock outstanding throughout each year ended May 31,
unless otherwise noted: | |
| Class A2 Shares1 | | 20172 | | | 2017 | | | 2016 | | | 20153 | |
| | | | |
| Net asset value, beginning of period | | | $8.14 | | | | $7.62 | | | | $8.63 | | | | $9.06 | |
| | | | |
| Income (loss) from operations: | | | | | | | | | | | | | | | | |
Net investment income | | | 0.22 | | | | 0.47 | | | | 0.51 | | | | 0.43 | |
Net realized and unrealized gain (loss) | | | (0.02) | | | | 0.50 | | | | (1.01) | | | | (0.43) | |
Total income (loss) from operations | | | 0.20 | | | | 0.97 | | | | (0.50) | | | | 0.00 | 4 |
| | | | |
| Less distributions from: | | | | | | | | | | | | | | | | |
Net investment income | | | (0.22) | | | | (0.43) | | | | (0.51) | | | | (0.43) | |
Return of capital | | | — | | | | (0.02) | | | | — | | | | — | |
Total distributions | | | (0.22) | | | | (0.45) | | | | (0.51) | | | | (0.43) | |
| | | | |
| Net asset value, end of period | | | $8.12 | | | | $8.14 | | | | $7.62 | | | | $8.63 | |
Total return5 | | | 2.48 | % | | | 12.97 | % | | | (5.70) | % | | | 0.06 | %6 |
| | | | |
| Net assets, end of period (000s) | | | $30,991 | | | | $27,875 | | | | $14,974 | | | | $8,777 | |
| | | | |
| Ratios to average net assets: | | | | | | | | | | | | | | | | |
Gross expenses | | | 0.97 | %7 | | | 0.96 | % | | | 0.98 | % | | | 0.92 | %7 |
Net expenses8 | | | 0.97 | 7 | | | 0.96 | | | | 0.98 | | | | 0.92 | 7 |
Net investment income | | | 5.43 | 7 | | | 5.90 | | | | 6.62 | | | | 6.09 | 7 |
| | | | |
| Portfolio turnover rate | | | 31 | % | | | 74 | % | | | 71 | % | | | 82 | %9 |
| 1 | Per share amounts have been calculated using the average shares method. |
| 2 | For the six months ended November 30, 2017 (unaudited). |
| 3 | For the period August 1, 2014 (inception date) to May 31, 2015. |
| 4 | Amount represents less than $0.005 per share. |
| 5 | Performance figures, exclusive of sales charges, may reflect compensating balance arrangements, fee waivers and/or expense reimbursements. In the absence of compensating balance arrangements, fee waivers and/or expense reimbursements, the total return would have been lower. Past performance is no guarantee of future results. Total returns for periods of less than one year are not annualized. |
| 6 | The total return includes gains from settlement of security litigations. Without these gains, the total return would have been -0.05% for the period ended May 31, 2015. |
| 8 | As a result of an expense limitation arrangement, the ratio of total annual fund operating expenses, other than interest, brokerage commissions, taxes, extraordinary expenses, deferred organizational expenses and acquired fund fees and expenses, to average net assets of Class A2 shares did not exceed 1.25%. This expense limitation arrangement cannot be terminated prior to December 31, 2019 without the Board of Directors’ consent. |
| 9 | For the year ended May 31, 2015. |
See Notes to Financial Statements.
| | |
| Western Asset High Yield Fund 2017 Semi-Annual Report | | 31 |
Financial highlights (cont’d)
| | | | | | | | | | | | | | | | | | | | | | | | | | | | |
For a share of each class of capital stock outstanding throughout each year ended May 31,
unless otherwise noted: | |
| Class C Shares1 | | 20172 | | | 2017 | | | 2016 | | | 2015 | | | 20143 | | | 20134 | | | 20125 | |
| | | | | | | |
| Net asset value, beginning of period | | | $8.06 | | | | $7.54 | | | | $8.53 | | | | $9.10 | | | | $8.95 | | | | $8.85 | | | | $8.61 | |
| | | | | | | |
| Income (loss) from operations: | | | | | | | | | | | | | | | | | | | | | | | | | | | | |
Net investment income | | | 0.19 | | | | 0.41 | | | | 0.44 | | | | 0.45 | | | | 0.19 | | | | 0.47 | | | | 0.35 | |
Net realized and unrealized gain (loss) | | | (0.02) | | | | 0.49 | | | | (0.99) | | | | (0.57) | | | | 0.15 | | | | 0.10 | | | | 0.38 | |
Total income (loss) from operations | | | 0.17 | | | | 0.90 | | | | (0.55) | | | | (0.12) | | | | 0.34 | | | | 0.57 | | | | 0.73 | |
| | | | | | | |
| Less distributions from: | | | | | | | | | | | | | | | | | | | | | | | | | | | | |
Net investment income | | | (0.19) | | | | (0.36) | | | | (0.44) | | | | (0.45) | | | | (0.19) | | | | (0.47) | | | | (0.49) | |
Return of capital | | | — | | | | (0.02) | | | | — | | | | — | | | | — | | | | — | | | | — | |
Total distributions | | | (0.19) | | | | (0.38) | | | | (0.44) | | | | (0.45) | | | | (0.19) | | | | (0.47) | | | | (0.49) | |
| | | | | | | |
| Net asset value, end of period | | | $8.04 | | | | $8.06 | | | | $7.54 | | | | $8.53 | | | | $9.10 | | | | $8.95 | | | | $8.85 | |
Total return6 | | | 2.09 | % | | | 12.18 | % | | | (6.32) | % | | | (1.25) | %7 | | | 3.83 | % | | | 6.59 | % | | | 8.73 | % |
| | | | | | | |
| Net assets, end of period (000s) | | | $3,728 | | | | $3,791 | | | | $2,828 | | | | $2,667 | | | | $1,724 | | | | $1,053 | | | | $159 | |
| | | | | | | |
| Ratios to average net assets: | | | | | | | | | | | | | | | | | | | | | | | | | | | | |
Gross expenses | | | 1.73 | %8 | | | 1.72 | % | | | 1.76 | %9 | | | 1.81 | %9 | | | 1.87 | %8,9 | | | 1.88 | %9 | | | 2.15 | %8 |
Net expenses10 | | | 1.73 | 8 | | | 1.72 | | | | 1.76 | 9 | | | 1.77 | 9,11 | | | 1.80 | 8,9,11 | | | 1.80 | 9,11 | | | 1.69 | 8,11 |
Net investment income | | | 4.66 | 8 | | | 5.17 | | | | 5.78 | | | | 5.17 | | | | 5.22 | 8 | | | 5.27 | | | | 6.07 | 8 |
| | | | | | | |
| Portfolio turnover rate | | | 31 | % | | | 74 | % | | | 71 | % | | | 82 | % | | | 33 | % | | | 103 | % | | | 86 | % |
| 1 | Per share amounts have been calculated using the average shares method. |
| 2 | For the six months ended November 30, 2017 (unaudited). |
| 3 | For the period January 1, 2014 through May 31, 2014. |
| 4 | For the year ended December 31. |
| 5 | For the period April 30, 2012 (inception date) to December 31, 2012. |
| 6 | Performance figures, exclusive of CDSC, may reflect compensating balance arrangements, fee waivers and/or expense reimbursements. In the absence of compensating balance arrangements, fee waivers and/or expense reimbursements, the total return would have been lower. Past performance is no guarantee of future results. Total returns for periods of less than one year are not annualized. |
| 7 | The total return includes gains from settlement of security litigations. Without these gains, the total return would have been -1.25% for the year ended May 31, 2015. |
| 9 | Reflects recapture of expenses waived/reimbursed from prior fiscal years. |
| 10 | As a result of an expense limitation arrangement, the ratio of total annual fund operating expenses, other than interest, brokerage commissions, taxes, extraordinary expenses, deferred organizational expenses and acquired fund fees and expenses, to average net assets of Class C shares did not exceed 1.80%. This expense limitation arrangement cannot be terminated prior to December 31, 2019 without the Board of Directors’ consent. |
| 11 | Reflects fee waivers and/or expense reimbursements. |
See Notes to Financial Statements.
| | |
| 32 | | Western Asset High Yield Fund 2017 Semi-Annual Report |
| | | | | | | | | | | | | | | | | | | | | | | | | | | | |
For a share of each class of capital stock outstanding throughout each year ended May 31,
unless otherwise noted: | |
| Class R Shares1 | | 20172 | | | 2017 | | | 2016 | | | 2015 | | | 20143 | | | 20134 | | | 20125 | |
| | | | | | | |
| Net asset value, beginning of period | | | $8.08 | | | | $7.55 | | | | $8.54 | | | | $9.12 | | | | $8.96 | | | | $8.87 | | | | $8.61 | |
| | | | | | | |
| Income (loss) from operations: | | | | | | | | | | | | | | | | | | | | | | | | | | | | |
Net investment income | | | 0.21 | | | | 0.45 | | | | 0.48 | | | | 0.49 | | | | 0.21 | | | | 0.51 | | | | 0.38 | |
Net realized and unrealized gain (loss) | | | (0.03) | | | | 0.50 | | | | (0.99) | | | | (0.58) | | | | 0.16 | | | | 0.10 | | | | 0.37 | |
Total income (loss) from operations | | | 0.18 | | | | 0.95 | | | | (0.51) | | | | (0.09) | | | | 0.37 | | | | 0.61 | | | | 0.75 | |
| | | | | | | |
| Less distributions from: | | | | | | | | | | | | | | | | | | | | | | | | | | | | |
Net investment income | | | (0.20) | | | | (0.40) | | | | (0.48) | | | | (0.49) | | | | (0.21) | | | | (0.52) | | | | (0.49) | |
Return of capital | | | — | | | | (0.02) | | | | — | | | | — | | | | — | | | | — | | | | — | |
Total distributions | | | (0.20) | | | | (0.42) | | | | (0.48) | | | | (0.49) | | | | (0.21) | | | | (0.52) | | | | (0.49) | |
| | | | | | | |
| Net asset value, end of period | | | $8.06 | | | | $8.08 | | | | $7.55 | | | | $8.54 | | | | $9.12 | | | | $8.96 | | | | $8.87 | |
Total return6 | | | 2.31 | % | | | 12.80 | % | | | (6.01) | % | | | (0.77) | %7 | | | 4.16 | % | | | 7.03 | % | | | 9.05 | % |
| | | | | | | |
| Net assets, end of period (000s) | | | $227 | | | | $187 | | | | $273 | | | | $372 | | | | $372 | | | | $79 | | | | $11 | |
| | | | | | | |
| Ratios to average net assets: | | | | | | | | | | | | | | | | | | | | | | | | | | | | |
Gross expenses | | | 1.56 | %8,9 | | | 1.83 | %9 | | | 1.53 | %9 | | | 1.55 | %9 | | | 1.37 | %8,9 | | | 1.51 | %9 | | | 1.37 | %8 |
Net expenses10,11 | | | 1.31 | 8,9 | | | 1.30 | 9 | | | 1.30 | 9 | | | 1.30 | 9 | | | 1.30 | 8,9 | | | 1.26 | 9 | | | 1.30 | 8 |
Net investment income | | | 5.08 | 8 | | | 5.65 | | | | 6.28 | | | | 5.62 | | | | 5.68 | 8 | | | 5.78 | | | | 6.59 | 8 |
| | | | | | | |
| Portfolio turnover rate | | | 31 | % | | | 74 | % | | | 71 | % | | | 82 | % | | | 33 | % | | | 103 | % | | | 86 | % |
| 1 | Per share amounts have been calculated using the average shares method. |
| 2 | For the six months ended November 30, 2017 (unaudited). |
| 3 | For the period January 1, 2014 through May 31, 2014. |
| 4 | For the year ended December 31. |
| 5 | For the period April 30, 2012 (inception date) to December 31, 2012. |
| 6 | Performance figures may reflect compensating balance arrangements, fee waivers and/or expense reimbursements. In the absence of compensating balance arrangements, fee waivers and/or expense reimbursements, the total return would have been lower. Past performance is no guarantee of future results. Total returns for periods of less than one year are not annualized. |
| 7 | The total return includes gains from settlement of security litigations. Without these gains, the total return would have been -0.89% for the year ended May 31, 2015. |
| 9 | Reflects recapture of expenses waived/reimbursed from prior fiscal years. |
| 10 | As a result of an expense limitation arrangement, the ratio of total annual fund operating expenses, other than interest, brokerage commissions, taxes, extraordinary expenses, deferred organizational expenses and acquired fund fees and expenses, to average net assets of Class R shares did not exceed 1.30%. This expense limitation arrangement cannot be terminated prior to December 31, 2019 without the Board of Directors’ consent. |
| 11 | Reflects fee waivers and/or expense reimbursements. |
See Notes to Financial Statements.
| | |
| Western Asset High Yield Fund 2017 Semi-Annual Report | | 33 |
Financial highlights (cont’d)
| | | | | | | | | | | | | | | | | | | | | | | | | | | | |
For a share of each class of capital stock outstanding throughout each year ended May 31,
unless otherwise noted: | |
| Class I Shares1 | | 20172 | | | 2017 | | | 2016 | | | 2015 | | | 20143 | | | 20134 | | | 20124 | |
| | | | | | | |
| Net asset value, beginning of period | | | $8.07 | | | | $7.55 | | | | $8.54 | | | | $9.12 | | | | $8.96 | | | | $8.87 | | | | $8.10 | |
| | | | | | | |
| Income (loss) from operations: | | | | | | | | | | | | | | | | | | | | | | | | | | | | |
Net investment income | | | 0.23 | | | | 0.50 | | | | 0.52 | | | | 0.55 | | | | 0.24 | | | | 0.58 | | | | 0.63 | |
Net realized and unrealized gain (loss) | | | (0.02) | | | | 0.49 | | | | (0.99) | | | | (0.58) | | | | 0.15 | | | | 0.08 | | | | 0.77 | |
Total income (loss) from operations | | | 0.21 | | | | 0.99 | | | | (0.47) | | | | (0.03) | | | | 0.39 | | | | 0.66 | | | | 1.40 | |
| | | | | | | |
| Less distributions from: | | | | | | | | | | | | | | | | | | | | | | | | | | | | |
Net investment income | | | (0.23) | | | | (0.45) | | | | (0.52) | | | | (0.55) | | | | (0.23) | | | | (0.57) | | | | (0.63) | |
Return of capital | | | — | | | | (0.02) | | | | — | | | | — | | | | — | | | | — | | | | — | |
Total distributions | | | (0.23) | | | | (0.47) | | | | (0.52) | | | | (0.55) | | | | (0.23) | | | | (0.57) | | | | (0.63) | |
| | | | | | | |
| Net asset value, end of period | | | $8.05 | | | | $8.07 | | | | $7.55 | | | | $8.54 | | | | $9.12 | | | | $8.96 | | | | $8.87 | |
Total return5 | | | 2.61 | % | | | 13.33 | % | | | (5.35) | % | | | (0.28) | %6 | | | 4.42 | % | | | 7.64 | % | | | 17.76 | % |
| | | | | | | |
| Net assets, end of period (000s) | | | $89,771 | | | | $102,389 | | | | $105,119 | | | | $221,201 | | | | $407,122 | | | | $409,166 | | | | $385,634 | |
| | | | | | | |
| Ratios to average net assets: | | | | | | | | | | | | | | | | | | | | | | | | | | | | |
Gross expenses | | | 0.72 | %7 | | | 0.70 | % | | | 0.72 | % | | | 0.68 | % | | | 0.69 | %7 | | | 0.70 | % | | | 0.66 | % |
Net expenses | | | 0.72 | 7 | | | 0.70 | | | | 0.72 | | | | 0.68 | | | | 0.69 | 7 | | | 0.70 | | | | 0.66 | |
Net investment income | | | 5.66 | 7 | | | 6.26 | | | | 6.83 | | | | 6.20 | | | | 6.33 | 7 | | | 6.46 | | | | 7.37 | |
| | | | | | | |
| Portfolio turnover rate | | | 31 | % | | | 74 | % | | | 71 | % | | | 82 | % | | | 33 | % | | | 103 | % | | | 86 | % |
| 1 | Per share amounts have been calculated using the average shares method. |
| 2 | For the six months ended November 30, 2017 (unaudited). |
| 3 | For the period January 1, 2014 through May 31, 2014. |
| 4 | For the year ended December 31. |
| 5 | Performance figures may reflect compensating balance arrangements, fee waivers and/or expense reimbursements. In the absence of compensating balance arrangements, fee waivers and/or expense reimbursements, the total return would have been lower. Past performance is no guarantee of future results. Total returns for periods of less than one year are not annualized. |
| 6 | The total return includes gains from settlement of security litigations. Without these gains, the total return would have been -0.40% for the year ended May 31, 2015. |
See Notes to Financial Statements.
| | |
| 34 | | Western Asset High Yield Fund 2017 Semi-Annual Report |
| | | | | | | | | | | | | | | | | | | | | | | | | | | | |
For a share of each class of capital stock outstanding throughout each year ended May 31,
unless otherwise noted: | |
| Class IS Shares1 | | 20172 | | | 2017 | | | 2016 | | | 2015 | | | 20143 | | | 20134 | | | 20124 | |
| | | | | | | |
| Net asset value, beginning of period | | | $8.20 | | | | $7.67 | | | | $8.68 | | | | $9.27 | | | | $9.11 | | | | $9.01 | | | | $8.23 | |
| | | | | | | |
| Income (loss) from operations: | | | | | | | | | | | | | | | | | | | | | | | | | | | | |
Net investment income | | | 0.24 | | | | 0.51 | | | | 0.54 | | | | 0.55 | | | | 0.24 | | | | 0.60 | | | | 0.65 | |
Net realized and unrealized gain (loss) | | | (0.03) | | | | 0.50 | | | | (1.01) | | | | (0.58) | | | | 0.16 | | | | 0.09 | | | | 0.76 | |
Total income (loss) from operations | | | 0.21 | | | | 1.01 | | | | (0.47) | | | | (0.03) | | | | 0.40 | | | | 0.69 | | | | 1.41 | |
| | | | | | | |
| Less distributions from: | | | | | | | | | | | | | | | | | | | | | | | | | | | | |
Net investment income | | | (0.23) | | | | (0.46) | | | | (0.54) | | | | (0.56) | | | | (0.24) | | | | (0.59) | | | | (0.63) | |
Return of capital | | | — | | | | (0.02) | | | | — | | | | — | | | | — | | | | — | | | | — | |
Total distributions | | | (0.23) | | | | (0.48) | | | | (0.54) | | | | (0.56) | | | | (0.24) | | | | (0.59) | | | | (0.63) | |
| | | | | | | |
| Net asset value, end of period | | | $8.18 | | | | $8.20 | | | | $7.67 | | | | $8.68 | | | | $9.27 | | | | $9.11 | | | | $9.01 | |
Total return5 | | | 2.64 | % | | | 13.41 | % | | | (5.32) | % | | | (0.23) | %6 | | | 4.42 | % | | | 7.82 | % | | | 17.67 | % |
| | | | | | | |
| Net assets, end of period (000s) | | | $110,256 | | | | $114,960 | | | | $167,961 | | | | $155,451 | | | | $159,217 | | | | $141,592 | | | | $140,665 | |
| | | | | | | |
| Ratios to average net assets: | | | | | | | | | | | | | | | | | | | | | | | | | | | | |
Gross expenses | | | 0.67 | %7 | | | 0.65 | % | | | 0.64 | % | | | 0.63 | %8 | | | 0.62 | %7 | | | 0.63 | %8 | | | 0.63 | % |
Net expenses9 | | | 0.66 | 7,10 | | | 0.65 | | | | 0.64 | | | | 0.63 | 8 | | | 0.61 | 7,10 | | | 0.63 | 8 | | | 0.63 | 10 |
Net investment income | | | 5.73 | 7 | | | 6.32 | | | | 6.89 | | | | 6.29 | | | | 6.41 | 7 | | | 6.57 | | | | 7.41 | |
| | | | | | | |
| Portfolio turnover rate | | | 31 | % | | | 74 | % | | | 71 | % | | | 82 | % | | | 33 | % | | | 103 | % | | | 86 | % |
| 1 | Per share amounts have been calculated using the average shares method. |
| 2 | For the six months ended November 30, 2017 (unaudited). |
| 3 | For the period January 1, 2014 through May 31, 2014. |
| 4 | For the year ended December 31. |
| 5 | Performance figures may reflect compensating balance arrangements, fee waivers and/or expense reimbursements. In the absence of compensating balance arrangements, fee waivers and/or expense reimbursements, the total return would have been lower. Past performance is no guarantee of future results. Total returns for periods of less than one year are not annualized. |
| 6 | The total return includes gains from settlement of security litigations. Without these gains, the total return would have been -0.23% for the year ended May 31, 2015. |
| 8 | Reflects recapture of expenses waived/reimbursed from prior fiscal years. |
| 9 | As a result of an expense limitation arrangement, the ratio of total annual fund operating expenses, other than interest, brokerage commissions, taxes, extraordinary expenses, deferred organizational expenses and acquired fund fees and expenses, to average net assets of Class IS shares did not exceed 0.65%. In addition, the ratio of total annual fund operating expenses for Class IS shares did not exceed the ratio of total annual fund operating expenses for Class I shares. These expense limitation arrangements cannot be terminated prior to December 31, 2019 without the Board of Directors’ consent. |
| 10 | Reflects fee waivers and/or expense reimbursements. |
See Notes to Financial Statements.
| | |
| Western Asset High Yield Fund 2017 Semi-Annual Report | | 35 |
Notes to financial statements (unaudited)
1. Organization and significant accounting policies
Western Asset High Yield Fund (the “Fund”) is a separate diversified investment series of Western Asset Funds, Inc. (the “Corporation”). The Corporation, a Maryland corporation, is registered under the Investment Company Act of 1940, as amended (the “1940 Act”), as an open-end management investment company.
The following are significant accounting policies consistently followed by the Funds and are in conformity with U.S. generally accepted accounting principles (“GAAP”). Estimates and assumptions are required to be made regarding assets, liabilities and changes in net assets resulting from operations when financial statements are prepared. Changes in the economic environment, financial markets and any other parameters used in determining these estimates could cause actual results to differ. Subsequent events have been evaluated through the date the financial statements were issued.
(a) Investment valuation. The valuations for fixed income securities (which may include, but are not limited to, corporate, government, municipal, mortgage-backed, collateralized mortgage obligations and asset-backed securities) and certain derivative instruments are typically the prices supplied by independent third party pricing services, which may use market prices or broker/dealer quotations or a variety of valuation techniques and methodologies. The independent third party pricing services use inputs that are observable such as issuer details, interest rates, yield curves, prepayment speeds, credit risks/spreads, default rates and quoted prices for similar securities. Short-term fixed income securities that will mature in 60 days or less are valued at amortized cost, unless it is determined that using this method would not reflect an investment’s fair value. Investments in open-end funds are valued at the closing net asset value per share of each fund on the day of valuation. Futures contracts are valued daily at the settlement price established by the board of trade or exchange on which they are traded. Equity securities for which market quotations are available are valued at the last reported sales price or official closing price on the primary market or exchange on which they trade. When the Fund holds securities or other assets that are denominated in a foreign currency, the Fund will normally use the currency exchange rates as of 4:00 p.m. (Eastern Time). If independent third party pricing services are unable to supply prices for a portfolio investment, or if the prices supplied are deemed by the manager to be unreliable, the market price may be determined by the manager using quotations from one or more broker/dealers or at the transaction price if the security has recently been purchased and no value has yet been obtained from a pricing service or pricing broker. When reliable prices are not readily available, such as when the value of a security has been significantly affected by events after the close of the exchange or market on which the security is principally traded, but before the Fund calculates its net asset value, the Fund values these securities as determined in accordance with procedures approved by the Fund’s Board of Directors.
The Board of Directors is responsible for the valuation process and has delegated the supervision of the daily valuation process to the Legg Mason North Atlantic Fund Valuation Committee (the “Valuation Committee”). The Valuation Committee, pursuant to the policies
| | |
| 36 | | Western Asset High Yield Fund 2017 Semi-Annual Report |
adopted by the Board of Directors, is responsible for making fair value determinations, evaluating the effectiveness of the Fund’s pricing policies, and reporting to the Board of Directors. When determining the reliability of third party pricing information for investments owned by the Fund, the Valuation Committee, among other things, conducts due diligence reviews of pricing vendors, monitors the daily change in prices and reviews transactions among market participants.
The Valuation Committee will consider pricing methodologies it deems relevant and appropriate when making fair value determinations. Examples of possible methodologies include, but are not limited to, multiple of earnings; discount from market of a similar freely traded security; discounted cash-flow analysis; book value or a multiple thereof; risk premium/yield analysis; yield to maturity; and/or fundamental investment analysis. The Valuation Committee will also consider factors it deems relevant and appropriate in light of the facts and circumstances. Examples of possible factors include, but are not limited to, the type of security; the issuer’s financial statements; the purchase price of the security; the discount from market value of unrestricted securities of the same class at the time of purchase; analysts’ research and observations from financial institutions; information regarding any transactions or offers with respect to the security; the existence of merger proposals or tender offers affecting the security; the price and extent of public trading in similar securities of the issuer or comparable companies; and the existence of a shelf registration for restricted securities.
For each portfolio security that has been fair valued pursuant to the policies adopted by the Board of Directors, the fair value price is compared against the last available and next available market quotations. The Valuation Committee reviews the results of such back testing monthly and fair valuation occurrences are reported to the Board of Directors quarterly.
The Fund uses valuation techniques to measure fair value that are consistent with the market approach and/or income approach, depending on the type of security and the particular circumstance. The market approach uses prices and other relevant information generated by market transactions involving identical or comparable securities. The income approach uses valuation techniques to discount estimated future cash flows to present value.
GAAP establishes a disclosure hierarchy that categorizes the inputs to valuation techniques used to value assets and liabilities at measurement date. These inputs are summarized in the three broad levels listed below:
| • | | Level 1 — quoted prices in active markets for identical investments |
| • | | Level 2 — other significant observable inputs (including quoted prices for similar investments, interest rates, prepayment speeds, credit risk, etc.) |
| • | | Level 3 — significant unobservable inputs (including the Fund’s own assumptions in determining the fair value of investments) |
| | |
| Western Asset High Yield Fund 2017 Semi-Annual Report | | 37 |
Notes to financial statements (unaudited) (cont’d)
The inputs or methodologies used to value securities are not necessarily an indication of the risk associated with investing in those securities.
The following is a summary of the inputs used in valuing the Fund’s assets and liabilities carried at fair value:
| | | | | | | | | | | | | | | | |
| ASSETS | |
| Description | | Quoted Prices
(Level 1) | | | Other Significant
Observable Inputs
(Level 2) | | | Significant
Unobservable
Inputs
(Level 3) | | | Total | |
| Long-term investments†: | | | | | | | | | | | | | | | | |
Corporate bonds & notes: | | | | | | | | | | | | | | | | |
Consumer discretionary | | | — | | | $ | 47,408,808 | | | $ | 1,213,734 | | | $ | 48,622,542 | |
Energy | | | — | | | | 35,923,780 | | | | 0 | * | | | 35,923,780 | |
Health care | | | — | | | | 18,540,469 | | | | 663,523 | | | | 19,203,992 | |
Materials | | | — | | | | 20,726,819 | | | | 0 | * | | | 20,726,819 | |
Other corporate bonds & notes | | | — | | | | 79,690,733 | | | | — | | | | 79,690,733 | |
Asset-backed securities | | | — | | | | 8,589,268 | | | | — | | | | 8,589,268 | |
Collateralized mortgage obligations | | | — | | | | 1,426,921 | | | | — | | | | 1,426,921 | |
Convertible bonds & notes | | | — | | | | 2,929,556 | | | | — | | | | 2,929,556 | |
Senior loans: | | | | | | | | | | | | | | | | |
Consumer discretionary | | | — | | | | 976,490 | | | | 456,500 | | | | 1,432,990 | |
Energy | | | — | | | | — | | | | 776,661 | | | | 776,661 | |
Health care | | | — | | | | 1,243,542 | | | | 572,822 | | | | 1,816,364 | |
Other senior loans | | | — | | | | 1,585,472 | | | | — | | | | 1,585,472 | |
Sovereign bonds | | | — | | | | 2,499,549 | | | | — | | | | 2,499,549 | |
Common stocks: | | | | | | | | | | | | | | | | |
Consumer discretionary | | | — | | | | — | | | | 1,065,071 | | | | 1,065,071 | |
Energy | | $ | 1,302,640 | | | | 1,178,775 | | | | 1,908,210 | | | | 4,389,625 | |
Industrials | | | — | | | | — | | | | 160,630 | | | | 160,630 | |
Convertible preferred stocks | | | — | | | | 1,793,418 | | | | — | | | | 1,793,418 | |
Preferred stocks: | | | | | | | | | | | | | | | | |
Financials | | | 738,969 | | | | — | | | | — | | | | 738,969 | |
Industrials | | | — | | | | — | | | | 259,606 | | | | 259,606 | |
| Total long-term investments | | | 2,041,609 | | | | 224,513,600 | | | | 7,076,757 | | | | 233,631,966 | |
| Short-term investments† | | | — | | | | 3,005,690 | | | | — | | | | 3,005,690 | |
| Total investments | | $ | 2,041,609 | | | $ | 227,519,290 | | | $ | 7,076,757 | | | $ | 236,637,656 | |
| Other financial instruments: | | | | | | | | | | | | | | | | |
Futures contracts | | | 20,131 | | | | — | | | | — | | | | 20,131 | |
| Total | | $ | 2,061,740 | | | $ | 227,519,290 | | | $ | 7,076,757 | | | $ | 236,657,787 | |
| | |
| 38 | | Western Asset High Yield Fund 2017 Semi-Annual Report |
| | | | | | | | | | | | | | | | |
| LIABILITIES | |
| Description | | Quoted Prices
(Level 1) | | | Other Significant
Observable Inputs
(Level 2) | | | Significant
Unobservable
Inputs
(Level 3) | | | Total | |
| Other financial instruments: | | | | | | | | | | | | | | | | |
Futures contracts | | $ | 89,228 | | | | — | | | | — | | | $ | 89,228 | |
Forward foreign currency contracts | | | — | | | $ | 3,850 | | | | — | | | | 3,850 | |
| Total | | $ | 89,228 | | | $ | 3,850 | | | | — | | | $ | 93,078 | |
| † | See Schedule of Investments for additional detailed categorizations. |
| * | Amount represents less than $1. |
The following is a reconciliation of investments in which significant unobservable inputs (Level 3) were used in determining fair value:
| | | | | | | | | | | | | | | | |
| | | Corporate Bonds & Notes | |
| Investments in Securities | | Consumer
Discretionary | | | Energy | | | Health Care | | | Materials | |
| Balance as of May 31, 2017 | | $ | 1,441,473 | | | $ | 0 | * | | | — | | | $ | 0 | * |
| Accrued premiums/discounts | | | 20,293 | | | | — | | | $ | 452 | | | | — | |
| Realized gain (loss)1 | | | — | | | | — | | | | — | | | | — | |
| Change in unrealized appreciation (depreciation)2 | | | (20,293) | | | | — | | | | 7,691 | | | | — | |
| Purchases | | | 92,936 | | | | — | | | | 655,380 | | | | — | |
| Sales | | | (320,675) | | | | — | | | | — | | | | — | |
| Transfers into Level 33 | | | — | | | | — | | | | — | | | | — | |
| Transfers out of Level 34 | | | — | | | | — | | | | — | | | | — | |
| Balance as of November 30, 2017 | | $ | 1,213,734 | | | $ | 0 | * | | $ | 663,523 | | | $ | 0 | * |
| Net change in unrealized appreciation (depreciation) for investments in securities still held at November 30, 20172 | | $ | (20,293) | | | | — | | | $ | 7,691 | | | | — | |
| | | | | | | | | | | | |
| | | Senior Loans | |
| Investments in Securities (cont’d) | | Consumer
Discretionary | | | Energy | | | Health Care | |
| Balance as of May 31, 2017 | | $ | 907,144 | | | $ | 236,113 | | | $ | 1,391,693 | |
| Accrued premiums/discounts | | | 5,388 | | | | 863 | | | | 426 | |
| Realized gain (loss)1 | | | 192 | | | | 3,580 | | | | 8,054 | |
| Change in unrealized appreciation (depreciation)2 | | | (142,064) | | | | (2,058) | | | | (18,840) | |
| Purchases | | | — | | | | 5,008 | | | | — | |
| Sales | | | (3,200) | | | | (243,506) | | | | (1,381,333) | |
| Transfers into Level 33 | | | — | | | | 776,661 | | | | 572,822 | |
| Transfers out of Level 34 | | | (310,960) | | | | — | | | | — | |
| Balance as of November 30, 2017 | | $ | 456,500 | | | $ | 776,661 | | | $ | 572,822 | |
| Net change in unrealized appreciation (depreciation) for investments in securities still held at November 30, 20172 | | $ | (124,758) | | | | — | | | | — | |
| | |
| Western Asset High Yield Fund 2017 Semi-Annual Report | | 39 |
Notes to financial statements (unaudited) (cont’d)
| | | | | | | | | | | | | | | | | | | | |
| | | Common Stocks | |
| Investments in Securities (cont’d) | | Consumer
Discretionary | | | Energy | | | Health Care | | | Industrials | | | Materials | |
| Balance as of May 31, 2017 | | $ | 700,989 | | | $ | 3,681,633 | | | $ | 168,300 | | | $ | 172,897 | | | $ | 0 | * |
| Accrued premiums/discounts | | | — | | | | — | | | | — | | | | — | | | | — | |
| Realized gain (loss)1 | | | — | | | | (3,162,736) | | | | 53,317 | | | | — | | | | (251,383) | |
| Change in unrealized appreciation (depreciation)2 | | | 364,082 | | | | 2,581,732 | | | | (52,925) | | | | (12,267) | | | | 251,383 | |
| Purchases | | | — | | | | — | | | | — | | | | — | | | | — | |
| Sales | | | — | | | | (13,644) | | | | (168,692) | | | | — | | | | (0) | * |
| Transfers into Level 33 | | | — | | | | — | | | | — | | | | — | | | | — | |
| Transfers out of Level 34 | | | — | | | | (1,178,775) | | | | — | | | | — | | | | — | |
| Balance as of November 30, 2017 | | $ | 1,065,071 | | | $ | 1,908,210 | | | | — | | | $ | 160,630 | | | | — | |
| Net change in unrealized appreciation (depreciation) for investments in securities still held at November 30, 20172 | | $ | 364,082 | | | $ | (528,002) | | | | — | | | $ | (12,267) | | | | — | |
| | | | | | | | | | | | |
| | | Convertible
Preferred
Stocks | | | Preferred
Stocks | | | | |
| Investments in Securities (cont’d) | | Energy | | | Industrials | | | Total | |
| Balance as of May 31, 2017 | | $ | 1,729,844 | | | $ | 259,606 | | | $ | 10,689,692 | |
| Accrued premiums/discounts | | | — | | | | — | | | | 27,422 | |
| Realized gain (loss)1 | | | — | | | | — | | | | (3,348,976) | |
| Change in unrealized appreciation (depreciation)2 | | | (288,308) | | | | — | | | | 2,668,133 | |
| Purchases | | | — | | | | — | | | | 753,324 | |
| Sales | | | — | | | | — | | | | (2,131,050) | |
| Transfers into Level 33 | | | — | | | | — | | | | 1,349,483 | |
| Transfers out of Level 34 | | | (1,441,536) | | | | — | | | | (2,931,271) | |
| Balance as of November 30, 2017 | | | — | | | $ | 259,606 | | | $ | 7,076,757 | |
| Net change in unrealized appreciation (depreciation) for investments in securities still held at November 30, 20172 | | | — | | | | — | | | $ | (313,547) | |
The Fund’s policy is to recognize transfers between levels as of the end of the reporting period.
| * | Amount represents less than $1. |
| 1 | This amount is included in net realized gain (loss) from investment transactions in unaffiliated securities in the accompanying Statement of Operations. |
| 2 | This amount is included in the change in net unrealized appreciation (depreciation) in the accompanying Statement of Operations. Change in unrealized appreciation (depreciation) includes net unrealized appreciation (depreciation) resulting from changes in investment values during the reporting period and the reversal of previously recorded unrealized appreciation (depreciation) when gains or losses are realized. |
| 3 | Transferred into Level 3 as a result of the unavailability of a quoted price in an active market for an identical investment or the unavailability of other significant observable inputs. |
| 4 | Transferred out of Level 3 as a result of the availability of a quoted price in an active market for an identical investment or the availability of other significant observable inputs. |
(b) Repurchase agreements. The Fund may enter into repurchase agreements with institutions that its subadviser has determined are creditworthy. Each repurchase agreement is recorded at cost. Under the terms of a typical repurchase agreement, the Fund
| | |
| 40 | | Western Asset High Yield Fund 2017 Semi-Annual Report |
acquires a debt security subject to an obligation of the seller to repurchase, and of the Fund to resell, the security at an agreed-upon price and time, thereby determining the yield during the Fund’s holding period. When entering into repurchase agreements, it is the Fund’s policy that its custodian or a third party custodian, acting on the Fund’s behalf, take possession of the underlying collateral securities, the market value of which, at all times, at least equals the principal amount of the repurchase transaction, including accrued interest. To the extent that any repurchase transaction maturity exceeds one business day, the value of the collateral is marked-to-market and measured against the value of the agreement in an effort to ensure the adequacy of the collateral. If the counterparty defaults, the Fund generally has the right to use the collateral to satisfy the terms of the repurchase transaction. However, if the market value of the collateral declines during the period in which the Fund seeks to assert its rights or if bankruptcy proceedings are commenced with respect to the seller of the security, realization of the collateral by the Fund may be delayed or limited.
(c) Futures contracts. The Fund uses futures contracts generally to gain exposure to, or hedge against, changes in interest rates or gain exposure to, or hedge against, changes in certain asset classes. A futures contract represents a commitment for the future purchase or sale of an asset at a specified price on a specified date.
Upon entering into a futures contract, the Fund is required to deposit cash or cash equivalents with a broker in an amount equal to a certain percentage of the contract amount. This is known as the ‘‘initial margin’’ and subsequent payments (‘‘variation margin’’) are made or received by the Fund each day, depending on the daily fluctuation in the value of the contract. For certain futures, including foreign denominated futures, variation margin is not settled daily, but is recorded as a net variation margin payable or receivable. The daily changes in contract value are recorded as unrealized gains or losses in the Statement of Operations and the Fund recognizes a realized gain or loss when the contract is closed.
Futures contracts involve, to varying degrees, risk of loss in excess of the amounts reflected in the financial statements. In addition, there is the risk that the Fund may not be able to enter into a closing transaction because of an illiquid secondary market.
(d) Written options. When the Fund writes an option, an amount equal to the premium received by the Fund is recorded as a liability, the value of which is marked-to-market daily to reflect the current market value of the option written. If the option expires, the premium received is recorded as a realized gain. When a written call option is exercised, the difference between the premium received plus the option exercise price and the Fund’s basis in the underlying security (in the case of a covered written call option), or the cost to purchase the underlying security (in the case of an uncovered written call option), including brokerage commission, is recognized as a realized gain or loss. When a written put option is exercised, the amount of the premium received is subtracted from the cost of the security purchased by the Fund from the exercise of the written put option to form the Fund’s basis in the underlying security purchased. The writer or buyer of an option traded on an exchange can liquidate the position before the exercise of the option by entering into a
| | |
| Western Asset High Yield Fund 2017 Semi-Annual Report | | 41 |
Notes to financial statements (unaudited) (cont’d)
closing transaction. The cost of a closing transaction is deducted from the original premium received resulting in a realized gain or loss to the Fund.
The risk in writing a covered call option is that the Fund may forego the opportunity of profit if the market price of the underlying security increases and the option is exercised. The risk in writing a put option is that the Fund may incur a loss if the market price of the underlying security decreases and the option is exercised. The risk in writing an uncovered call option is that the Fund is exposed to the risk of loss if the market price of the underlying security increases. In addition, there is the risk that the Fund may not be able to enter into a closing transaction because of an illiquid secondary market.
(e) Swaptions. The Fund may purchase or write swaption contracts to manage exposure to fluctuations in interest rates or to enhance yield. The Fund may also purchase and write swaption contracts to manage exposure to an underlying instrument. Swaption contracts written by the Fund represent an option that gives the purchaser the right, but not the obligation, to enter into a previously agreed upon swap contract at a future date. Swaption contracts purchased by the Fund represent an option that gives the Fund the right, but not the obligation, to enter into a previously agreed upon swap contract at a future date.
When the Fund writes a swaption, an amount equal to the premium received by the Fund is recorded as a liability, the value of which is marked-to-market daily to reflect the current market value of the swaption written. If the swaption expires, the Fund realizes a gain equal to the amount of the premium received.
When the Fund purchases a swaption, an amount equal to the premium paid by the Fund is recorded as an investment on the Statement of Assets and Liabilities, the value of which is marked-to-market daily to reflect the current market value of the swaption purchased. If the swaption expires, the Fund realizes a loss equal to the amount of the premium paid.
Swaptions are marked-to-market daily based upon quotations from market makers. Changes in the value of the swaption are reported as unrealized gains or losses in the Statement of Operations.
(f) Forward foreign currency contracts. The Fund enters into a forward foreign currency contract to hedge against foreign currency exchange rate risk on its non-U.S. dollar denominated securities or to facilitate settlement of a foreign currency denominated portfolio transaction. A forward foreign currency contract is an agreement between two parties to buy and sell a currency at a set price with delivery and settlement at a future date. The contract is marked-to-market daily and the change in value is recorded by the Fund as an unrealized gain or loss. When a forward foreign currency contract is closed, through either delivery or offset by entering into another forward foreign currency contract, the Fund recognizes a realized gain or loss equal to the difference between the value of the contract at the time it was opened and the value of the contract at the time it is closed.
Forward foreign currency contracts involve elements of market risk in excess of the amounts reflected on the Statement of Assets and Liabilities. The Fund bears the risk of an
| | |
| 42 | | Western Asset High Yield Fund 2017 Semi-Annual Report |
unfavorable change in the foreign exchange rate underlying the forward foreign currency contract. Risks may also arise upon entering into these contracts from the potential inability of the counterparties to meet the terms of their contracts.
(g) Foreign currency translation. Investment securities and other assets and liabilities denominated in foreign currencies are translated into U.S. dollar amounts based upon prevailing exchange rates on the date of valuation. Purchases and sales of investment securities and income and expense items denominated in foreign currencies are translated into U.S. dollar amounts based upon prevailing exchange rates on the respective dates of such transactions.
The Fund does not isolate that portion of the results of operations resulting from fluctuations in foreign exchange rates on investments from the fluctuations arising from changes in market prices of securities held. Such fluctuations are included with the net realized and unrealized gain or loss on investments.
Net realized foreign exchange gains or losses arise from sales of foreign currencies, including gains and losses on forward foreign currency contracts, currency gains or losses realized between the trade and settlement dates on securities transactions, and the difference between the amounts of dividends, interest, and foreign withholding taxes recorded on the Fund’s books and the U.S. dollar equivalent of the amounts actually received or paid. Net unrealized foreign exchange gains and losses arise from changes in the values of assets and liabilities, other than investments in securities, on the date of valuation, resulting from changes in exchange rates.
Foreign security and currency transactions may involve certain considerations and risks not typically associated with those of U.S. dollar denominated transactions as a result of, among other factors, the possibility of lower levels of governmental supervision and regulation of foreign securities markets and the possibility of political or economic instability.
(h) Swap agreements. The Fund invests in swaps for the purpose of managing its exposure to interest rate, credit or market risk, or for other purposes, including to increase the Fund’s return. The use of swaps involves risks that are different from those associated with other portfolio transactions. Swap agreements are privately negotiated in the over-the-counter market and may be entered into as a bilateral contract (“OTC Swaps”) or centrally cleared (“Centrally Cleared Swaps”). Unlike Centrally Cleared Swaps, the Fund has credit exposure to the counterparties of OTC Swaps.
In a Centrally Cleared Swap, immediately following execution of the swap, the swap agreement is submitted to a clearinghouse or central counterparty (the “CCP”) and the CCP becomes the ultimate counterparty of the swap agreement. The Fund is required to interface with the CCP through a broker, acting in an agency capacity. All payments are settled with the CCP through the broker. Upon entering into a Centrally Cleared Swap, the Fund is required to deposit initial margin with the broker in the form of cash or securities.
| | |
| Western Asset High Yield Fund 2017 Semi-Annual Report | | 43 |
Notes to financial statements (unaudited) (cont’d)
Swap contracts are marked-to-market daily and changes in value are recorded as unrealized appreciation (depreciation). The daily change in valuation of Centrally Cleared Swaps, if any, is recorded as a receivable or payable for variation margin on the Statement of Assets and Liabilities. Gains or losses are realized upon termination of the swap agreement. Collateral, in the form of restricted cash or securities, may be required to be held in segregated accounts with the Fund’s custodian in compliance with the terms of the swap contracts. Securities posted as collateral for swap contracts are identified in the Schedule of Investments and restricted cash, if any, is identified on the Statement of Assets and Liabilities. Risks may exceed amounts recorded in the Statement of Assets and Liabilities. These risks include changes in the returns of the underlying instruments, failure of the counterparties to perform under the contracts’ terms, and the possible lack of liquidity with respect to the swap agreements.
OTC swap payments received or made at the beginning of the measurement period are reflected as a premium or deposit, respectively, on the Statement of Assets and Liabilities. These upfront payments are amortized over the life of the swap and are recognized as realized gain or loss in the Statement of Operations. Net periodic payments received or paid by the Fund are recognized as a realized gain or loss in the Statement of Operations.
The Fund’s maximum exposure in the event of a defined credit event on a credit default swap to sell protection is the notional amount. As of November 30, 2017, the Fund did not hold any credit default swaps to sell protection.
For average notional amounts of swaps held during the six months ended November 30, 2017, see Note 4.
Credit default swaps
The Fund enters into credit default swap (“CDS”) contracts for investment purposes, to manage its credit risk or to add leverage. CDS agreements involve one party making a stream of payments to another party in exchange for the right to receive a specified return in the event of a default by a third party, typically corporate or sovereign issuers, on a specified obligation, or in the event of a write-down, principal shortfall, interest shortfall or default of all or part of the referenced entities comprising a credit index. The Fund may use a CDS to provide protection against defaults of the issuers (i.e., to reduce risk where the Fund has exposure to an issuer) or to take an active long or short position with respect to the likelihood of a particular issuer’s default. As a seller of protection, the Fund generally receives an upfront payment or a stream of payments throughout the term of the swap provided that there is no credit event. If the Fund is a seller of protection and a credit event occurs, as defined under the terms of that particular swap agreement, the maximum potential amount of future payments (undiscounted) that the Fund could be required to make under a credit default swap agreement would be an amount equal to the notional amount of the agreement. These amounts of potential payments will be partially offset by any recovery of values from the respective referenced obligations. As a seller of protection, the Fund effectively adds leverage to its portfolio because, in addition to its total net assets, the Fund is subject to investment exposure on the notional amount of the swap. As a buyer of
| | |
| 44 | | Western Asset High Yield Fund 2017 Semi-Annual Report |
protection, the Fund generally receives an amount up to the notional value of the swap if a credit event occurs.
Implied spreads are the theoretical prices a lender receives for credit default protection. When spreads rise, market perceived credit risk rises and when spreads fall, market perceived credit risk falls. The implied credit spread of a particular referenced entity reflects the cost of buying/selling protection and may include upfront payments required to enter into the agreement. Wider credit spreads and decreasing market values, when compared to the notional amount of the swap, represent a deterioration of the referenced entity’s credit soundness and a greater likelihood or risk of default or other credit event occurring as defined under the terms of the agreement. Credit spreads utilized in determining the period end market value of credit default swap agreements on corporate or sovereign issues are disclosed in the Schedule of Investments and serve as an indicator of the current status of the payment/performance risk and represent the likelihood or risk of default for credit derivatives. For credit default swap agreements on asset-backed securities and credit indices, the quoted market prices and resulting values, particularly in relation to the notional amount of the contract as well as the annual payment rate, serve as an indication of the current status of the payment/performance risk.
The Fund’s maximum risk of loss from counterparty risk, as the protection buyer, is the fair value of the contract (this risk is mitigated by the posting of collateral by the counterparty to the Fund to cover the Fund’s exposure to the counterparty). As the protection seller, the Fund’s maximum risk is the notional amount of the contract. Credit default swaps are considered to have credit risk-related contingent features since they require payment by the protection seller to the protection buyer upon the occurrence of a defined credit event.
Entering into a CDS agreement involves, to varying degrees, elements of credit, market and documentation risk in excess of the related amounts recognized on the Statement of Assets and Liabilities. Such risks involve the possibility that there will be no liquid market for these agreements, that the counterparty to the agreement may default on its obligation to perform or disagree as to the meaning of the contractual terms in the agreement, and that there will be unfavorable changes in net interest rates.
Total return swaps
The Fund enters into total return swaps for investment purposes. Total return swaps are agreements to exchange the return generated by one instrument for the return generated by another instrument. For example, the agreement to pay a predetermined or fixed interest rate in exchange for a market-linked return based on a notional amount. To the extent the total return of a referenced index or instrument exceeds the offsetting interest obligation, the Fund will receive a payment from the counterparty. To the extent it is less, the Fund will make a payment to the counterparty.
(i) Loan participations. The Fund may invest in loans arranged through private negotiation between one or more financial institutions. The Fund’s investment in any such loan may be in the form of a participation in or an assignment of the loan. In connection with
| | |
| Western Asset High Yield Fund 2017 Semi-Annual Report | | 45 |
Notes to financial statements (unaudited) (cont’d)
purchasing participations, the Fund generally will have no right to enforce compliance by the borrower with the terms of the loan agreement related to the loan, or any rights of off-set against the borrower and the Fund may not benefit directly from any collateral supporting the loan in which it has purchased the participation.
The Fund assumes the credit risk of the borrower, the lender that is selling the participation and any other persons interpositioned between the Fund and the borrower. In the event of the insolvency of the lender selling the participation, the Fund may be treated as a general creditor of the lender and may not benefit from any off-set between the lender and the borrower.
(j) Unfunded loan commitments. The Fund may enter into certain credit agreements where all or a portion of which may be unfunded. The Fund is obligated to fund these commitments at the borrower’s discretion. The commitments are disclosed in the accompanying Schedule of Investments. At November 30, 2017, the Fund had sufficient cash and/or securities to cover these commitments.
(k) Securities traded on a when-issued and delayed delivery basis. The Fund may trade securities on a when-issued or delayed delivery basis. In when-issued and delayed delivery transactions, the securities are purchased or sold by the Fund with payment and delivery taking place in the future in order to secure what is considered to be an advantageous price and yield to the Fund at the time of entering into the transaction.
Purchasing such securities involves risk of loss if the value of the securities declines prior to settlement. These securities are subject to market fluctuations and their current value is determined in the same manner as for other securities.
(l) Credit and market risk. The Fund invests in high-yield and emerging market instruments that are subject to certain credit and market risks. The yields of high-yield and emerging market debt obligations reflect, among other things, perceived credit and market risks. The Fund’s investments in securities rated below investment grade typically involve risks not associated with higher rated securities including, among others, greater risk related to timely and ultimate payment of interest and principal, greater market price volatility and less liquid secondary market trading. The consequences of political, social, economic or diplomatic changes may have disruptive effects on the market prices of investments held by the Fund. The Fund’s investments in non-U.S. dollar denominated securities may also result in foreign currency losses caused by devaluations and exchange rate fluctuations.
Investments in securities that are collateralized by real estate mortgages are subject to certain credit and liquidity risks. When market conditions result in an increase in default rates of the underlying mortgages and the foreclosure values of underlying real estate properties are materially below the outstanding amount of these underlying mortgages, collection of the full amount of accrued interest and principal on these investments may be doubtful. Such market conditions may significantly impair the value and liquidity of these investments and may result in a lack of correlation between their credit ratings and values.
| | |
| 46 | | Western Asset High Yield Fund 2017 Semi-Annual Report |
(m) Foreign investment risks. The Fund’s investments in foreign securities may involve risks not present in domestic investments. Since securities may be denominated in foreign currencies, may require settlement in foreign currencies or pay interest or dividends in foreign currencies, changes in the relationship of these foreign currencies to the U.S. dollar can significantly affect the value of the investments and earnings of the Fund. Foreign investments may also subject the Fund to foreign government exchange restrictions, expropriation, taxation or other political, social or economic developments, all of which affect the market and/or credit risk of the investments.
(n) Counterparty risk and credit-risk-related contingent features of derivative instruments. The Fund may invest in certain securities or engage in other transactions, where the Fund is exposed to counterparty credit risk in addition to broader market risks. The Fund may invest in securities of issuers, which may also be considered counterparties as trading partners in other transactions. This may increase the risk of loss in the event of default or bankruptcy by the counterparty or if the counterparty otherwise fails to meet its contractual obligations. The Fund’s subadviser attempts to mitigate counterparty risk by (i) periodically assessing the creditworthiness of its trading partners, (ii) monitoring and/or limiting the amount of its net exposure to each individual counterparty based on its assessment and (iii) requiring collateral from the counterparty for certain transactions. Market events and changes in overall economic conditions may impact the assessment of such counterparty risk by the subadviser. In addition, declines in the values of underlying collateral received may expose the Fund to increased risk of loss.
With exchange traded and centrally cleared derivatives, there is less counterparty risk to the Fund since the exchange or clearinghouse, as counterparty to such instruments, guarantees against a possible default. The clearinghouse stands between the buyer and the seller of the contract; therefore, the credit risk is limited to failure of the clearinghouse. While offset rights may exist under applicable law, the Fund does not have a contractual right of offset against a clearing broker or clearinghouse in the event of a default of the clearing broker or clearinghouse.
The Fund has entered into master agreements, such as an International Swaps and Derivatives Association, Inc. Master Agreement (“ISDA Master Agreement”) or similar agreement, with certain of its derivative counterparties that govern over-the-counter derivatives and provide for general obligations, representations, agreements, collateral posting terms, netting provisions in the event of default or termination and credit related contingent features. The credit related contingent features include, but are not limited to, a percentage decrease in the Fund’s net assets or NAV over a specified period of time. If these credit related contingent features were triggered, the derivatives counterparty could terminate the positions and demand payment or require additional collateral.
Under an ISDA Master Agreement, the Fund may, under certain circumstances, offset with the counterparty certain derivative financial instruments’ payables and/or receivables with collateral held and/or posted and create one single net payment. However, absent an event of default by the counterparty or a termination of the agreement, the terms of the ISDA
| | |
| Western Asset High Yield Fund 2017 Semi-Annual Report | | 47 |
Notes to financial statements (unaudited) (cont’d)
Master Agreements do not result in an offset of reported amounts of financial assets and financial liabilities in the Statement of Assets and Liabilities across transactions between the Fund and the applicable counterparty. The enforceability of the right to offset may vary by jurisdiction.
Collateral requirements differ by type of derivative. Collateral or margin requirements are set by the broker or exchange clearinghouse for exchange traded derivatives while collateral terms are contract specific for over-the-counter traded derivatives. Cash collateral that has been pledged to cover obligations of the Fund under derivative contracts, if any, will be reported separately in the Statement of Assets and Liabilities. Securities pledged as collateral, if any, for the same purpose are noted in the Schedule of Investments.
As of November 30, 2017, the Fund held forward foreign currency contracts with credit related contingent features which had a liability position of $3,850. If a contingent feature in the master agreements would have been triggered, the Fund would have been required to pay this amount to its derivatives counterparties.
(o) Security transactions and investment income. Security transactions are accounted for on a trade date basis. Interest income (including interest income from payment-in-kind securities), adjusted for amortization of premium and accretion of discount, is recorded on the accrual basis. Paydown gain and losses on mortgage- and asset-backed securities are recorded as adjustments to interest income. Dividend income is recorded on the ex-dividend date for dividends received in cash and/or securities. Foreign dividend income is recorded on the ex-dividend date or as soon as practicable after the Fund determines the existence of a dividend declaration after exercising reasonable due diligence. The cost of investments sold is determined by use of the specific identification method. To the extent any issuer defaults or a credit event occurs that impacts the issuer, the Fund may halt any additional interest income accruals and consider the realizability of interest accrued up to the date of default or credit event.
(p) Distributions to shareholders. Distributions from net investment income of the Fund are declared each business day to shareholders of record and are paid monthly. Distributions of net realized gains, if any, are declared at least annually. Distributions to shareholders of the Fund are recorded on the ex-dividend date and are determined in accordance with income tax regulations, which may differ from GAAP.
(q) Share class accounting. Investment income, common expenses and realized/unrealized gains (losses) on investments are allocated to the various classes of the Fund on the basis of daily net assets of each class. Fees relating to a specific class are charged directly to that share class.
(r) Compensating balance arrangements. The Fund has an arrangement with its custodian bank whereby a portion of the custodian’s fees is paid indirectly by credits earned on the Fund’s cash on deposit with the bank.
| | |
| 48 | | Western Asset High Yield Fund 2017 Semi-Annual Report |
(s) Federal and other taxes. It is the Fund’s policy to comply with the federal income and excise tax requirements of the Internal Revenue Code of 1986 (the “Code”), as amended, applicable to regulated investment companies. Accordingly, the Fund intends to distribute its taxable income and net realized gains, if any, to shareholders in accordance with timing requirements imposed by the Code. Therefore, no federal or state income tax provision is required in the Fund’s financial statements.
Management has analyzed the Fund’s tax positions taken on income tax returns for all open tax years and has concluded that as of May 31, 2017, no provision for income tax is required in the Fund’s financial statements. The Fund’s federal and state income and federal excise tax returns for tax years for which the applicable statutes of limitations have not expired are subject to examination by the Internal Revenue Service and state departments of revenue.
Under the applicable foreign tax laws, a withholding tax may be imposed on interest, dividends and capital gains at various rates.
(t) Reclassification. GAAP requires that certain components of net assets be reclassified to reflect permanent differences between financial and tax reporting. These reclassifications have no effect on net assets or net asset value per share.
2. Investment management agreement and other transactions with affiliates
Legg Mason Partners Fund Advisor, LLC (“LMPFA”) is the Fund’s investment manager. Western Asset Management Company (“Western Asset”) and Western Asset Management Company Limited (“Western Asset Limited”) are the Fund’s subadvisers. LMPFA, Western Asset and Western Asset Limited are wholly-owned subsidiaries of Legg Mason, Inc. (“Legg Mason”).
LMPFA provides the Fund with management and administrative services for which the Fund pays a fee, calculated daily and paid monthly, at an annual rate of 0.55% of the Fund’s average daily net assets. For their services, LMPFA pays Western Asset and Western Asset Limited monthly all of the management fee that it receives from the Fund.
As a result of expense limitation arrangements between the Fund and LMPFA, the ratio of total annual fund operating expenses, other than interest, brokerage commissions, taxes, extraordinary expenses, deferred organizational expenses and acquired fund fees and expenses, to average net assets of Class A, Class A2, Class C, Class R and Class IS shares did not exceed 1.05%, 1.25%, 1.80%, 1.30% and 0.65%, respectively. In addition, the ratio of total annual fund operating expenses for Class IS shares did not exceed the ratio of total annual fund operating expenses for Class I shares. These expense limitation arrangements cannot be terminated prior to December 31, 2019 without the Board of Directors’ consent.
During the six months ended November 30, 2017, fees waived and/or expenses reimbursed amounted to $6,129.
LMPFA is permitted to recapture amounts waived and/or reimbursed to a class within two years after the fiscal year in which LMPFA earned the fee or incurred the expense if the
| | |
| Western Asset High Yield Fund 2017 Semi-Annual Report | | 49 |
Notes to financial statements (unaudited) (cont’d)
class’ total annual operating expenses have fallen to a level below the expense limitation (“expense cap”) in effect at the time the fees were earned or the expenses incurred. In no case will LMPFA recapture any amount that would result, on any particular business day of the Fund, in the class’ total annual operating expenses exceeding the expense cap or any other lower limit then in effect.
Pursuant to these arrangements, at November 30, 2017, the Fund had remaining fee waivers and/or expense reimbursements subject to recapture by LMPFA and respective dates of expiration as follows:
| | | | | | | | | | | | | | | | | | | | |
| | | Class A | | | Class A2 | | | Class C | | | Class R | | | Class IS | |
| Expires May 31, 2018 | | | — | | | | — | | | | — | | | $ | 268 | | | | — | |
| Expires May 31, 2019 | | | — | | | | — | | | | — | | | | 444 | | | | — | |
| Expires May 31, 2020 | | | — | | | | — | | | | — | | | | 213 | | | $ | 5,874 | |
| Total fee waivers/expense reimbursements subject to recapture | | | — | | | | — | | | | — | | | $ | 925 | | | $ | 5,874 | |
For the six months ended November 30, 2017, LMPFA recaptured $38 for Class R shares.
Legg Mason Investor Services, LLC (‘‘LMIS’’), a wholly-owned broker-dealer subsidiary of Legg Mason, serves as the Fund’s sole and exclusive distributor.
There is a maximum initial sales charge of 4.25% for Class A and Class A2 shares. There is a contingent deferred sales charge (“CDSC”) of 1.00% on Class C shares, which applies if redemption occurs within 12 months from purchase payment. In certain cases, Class A and Class A2 shares have a 1.00% CDSC, which applies if redemption occurs within 18 months from purchase payment. This CDSC only applies to those purchases of Class A and Class A2 shares, which, when combined with current holdings of other shares of funds sold by LMIS, equal or exceed $1,000,000 in the aggregate. These purchases do not incur an initial sales charge.
For the six months ended November 30, 2017, LMIS and its affiliates retained sales charges of $1,645 and $7,352 on sales of the Fund’s Class A and Class A2 shares, respectively. In addition, for the six months ended November 30, 2017, there were no CDSCs paid to LMIS and its affiliates.
All officers of the Corporation are employees of Legg Mason or its affiliates and do not receive compensation from the Corporation.
3. Investments
During the six months ended November 30, 2017, the aggregate cost of purchases and proceeds from sales of investments (excluding short-term investments) were as follows:
| | | | |
| Purchases | | $ | 74,167,977 | |
| Sales | | | 82,181,388 | |
| | |
| 50 | | Western Asset High Yield Fund 2017 Semi-Annual Report |
At November 30, 2017, the aggregate cost of investments and the aggregate gross unrealized appreciation and depreciation of investments for federal income tax purposes were substantially as follows:
| | | | | | | | | | | | | | | | |
| | | Cost | | | Gross
Unrealized
Appreciation | | | Gross
Unrealized
Depreciation | | | Net
Unrealized
Depreciation | |
| Securities | | $ | 241,187,968 | | | $ | 10,863,044 | | | $ | (15,413,356) | | | $ | (4,550,312) | |
| Futures contracts | | | — | | | | 20,131 | | | | (89,228) | | | | (69,097) | |
| Forward foreign currency contracts | | | — | | | | — | | | | (3,850) | | | | (3,850) | |
4. Derivative instruments and hedging activities
Below is a table, grouped by derivative type, that provides information about the fair value and the location of derivatives within the Statement of Assets and Liabilities at November 30, 2017.
| | | | | | | | | | | | |
| ASSET DERIVATIVES1 | |
| | | | | | | | | Interest
Rate Risk | |
| Futures contracts2 | | | | | | | | | | $ | 20,131 | |
|
| LIABILITY DERIVATIVES1 | |
| | | Interest
Rate Risk | | | Foreign
Exchange Risk | | | Total | |
| Futures contracts2 | | $ | 89,228 | | | | — | | | $ | 89,228 | |
| Forward foreign currency contracts | | | — | | | $ | 3,850 | | | | 3,850 | |
| Total | | $ | 89,228 | | | $ | 3,850 | | | $ | 93,078 | |
| 1 | Generally, the balance sheet location for asset derivatives is receivables/net unrealized appreciation (depreciation) and for liability derivatives is payables/net unrealized appreciation (depreciation). |
| 2 | Includes cumulative appreciation (depreciation) of futures contracts as reported in the Schedule of Investments. Only variation margin is reported within the receivables and/or payables on the Statement of Assets and Liabilities. |
The following tables provide information about the effect of derivatives and hedging activities on the Fund’s Statement of Operations for the six months ended November 30, 2017. The first table provides additional detail about the amounts and sources of gains (losses) realized on derivatives during the period. The second table provides additional information about the change in unrealized appreciation (depreciation) resulting from the Fund’s derivatives and hedging activities during the period.
| | | | | | | | | | | | | | | | | | | | |
| AMOUNT OF REALIZED GAIN (LOSS) ON DERIVATIVES RECOGNIZED | |
| | | Interest
Rate Risk | | | Foreign
Exchange Risk | | | Credit Risk | | | Equity Risk | | | Total | |
| Written options | | | — | | | | — | | | $ | 40,443 | | | | — | | | $ | 40,443 | |
| Futures contracts | | $ | (147,577) | | | | — | | | | — | | | | — | | | | (147,577) | |
| Swap contracts | | | — | | | | — | | | | (113,071) | | | $ | 120,465 | | | | 7,394 | |
| Forward foreign currency contracts | | | — | | | $ | (10,129) | | | | — | | | | — | | | | (10,129) | |
| Total | | $ | (147,577) | | | $ | (10,129) | | | $ | (72,628) | | | $ | 120,465 | | | $ | (109,869) | |
| | |
| Western Asset High Yield Fund 2017 Semi-Annual Report | | 51 |
Notes to financial statements (unaudited) (cont’d)
| | | | | | | | | | | | | | | | |
| CHANGE IN UNREALIZED APPRECIATION (DEPRECIATION) ON DERIVATIVES RECOGNIZED | |
| | | Interest
Rate Risk | | | Foreign
Exchange Risk | | | Equity Risk | | | Total | |
| Futures contracts | | $ | (138,713) | | | | — | | | | — | | | $ | (138,713) | |
| Swap contracts | | | — | | | | — | | | $ | (133,761) | | | | (133,761) | |
| Forward foreign currency contracts | | | — | | | $ | (3,850) | | | | — | | | | (3,850) | |
| Total | | $ | (138,713) | | | $ | (3,850) | | | $ | (133,761) | | | $ | (276,324) | |
During the six months ended November 30, 2017, the volume of derivative activity for the Fund was as follows:
| | | | |
| | | Average Market
Value | |
| Written options† | | $ | 5,474 | |
| Futures contracts (to buy) | | | 26,113,842 | |
| Futures contracts (to sell) | | | 1,971,339 | |
| Forward foreign currency contracts (to sell) | | | 491,274 | |
| | | | |
| | | Average Notional
Balance | |
| Credit default swap contracts (to buy protection)† | | $ | 2,134,286 | |
| Total return swap contracts† | | | 405,978 | |
| † | At November 30, 2017, there were no open positions held in this derivative. |
The following table presents the Fund’s OTC derivative assets and liabilities by counterparty net of amounts available for offset under an ISDA Master Agreement and net of the related collateral pledged (received) by the Fund as of November 30, 2017.
| | | | | | | | | | | | | | | | | | | | |
| Counterparty | | Gross Assets Subject
to Master
Agreements1 | | | Gross Liabilities
Subject to Master
Agreements1 | | | Net Assets (Liabilities)
Subject to Master
Agreements | | | Collateral Pledged
(Received) | | | Net Amount2 | |
| Citibank N. A. | | | — | | | $ | (3,850) | | | $ | (3,850) | | | | — | | | $ | (3,850) | |
| 1 | Absent an event of default or early termination, derivative assets and liabilities are presented gross and not offset in the Statement of Assets and Liabilities. |
| 2 | Represents the net amount receivable (payable) from (to) the counterparty in the event of default. |
5. Class specific expenses, waivers and/or expense reimbursements
The Fund has adopted a Rule 12b-1 shareholder services and distribution plan and under that plan the Fund pays service and/or distribution fees with respect to its Class A, Class A2, Class C and Class R shares calculated at the annual rate of 0.25%, 0.25%, 1.00% and 0.50% of the average daily net assets of each class, respectively. Service and/or distribution fees are accrued daily and paid monthly.
For the six months ended November 30, 2017, class specific expenses were as follows:
| | | | | | | | |
| | | Service and/or
Distribution Fees | | | Transfer Agent
Fees | |
| Class A | | $ | 6,213 | | | $ | 1,652 | |
| Class A2 | | | 37,343 | | | | 7,137 | |
| Class C | | | 19,004 | | | | 1,232 | |
| | |
| 52 | | Western Asset High Yield Fund 2017 Semi-Annual Report |
| | | | | | | | |
| | | Service and/or
Distribution Fees | | | Transfer Agent
Fees | |
| Class R | | $ | 509 | 1 | | $ | 359 | |
| Class I | | | — | | | | 26,808 | |
| Class IS | | | — | | | | 615 | |
| Total | | $ | 63,069 | | | $ | 37,803 | |
| 1 | Amount shown is exclusive of expense reimbursements. For the six months ended November 30, 2017, the service and/or distribution fees reimbursed amounted to $42 for Class R shares. |
For the six months ended November 30, 2017, waivers and/or expense reimbursements by class were as follows:
| | | | |
| | | Waivers/Expense
Reimbursements | |
| Class A | | | — | |
| Class A2 | | | — | |
| Class C | | | — | |
| Class R | | $ | 255 | |
| Class I | | | — | |
| Class IS | | | 5,874 | |
| Total | | $ | 6,129 | |
6. Distributions to shareholders by class
| | | | | | | | |
| | | Six Months Ended
November 30, 2017 | | | Year Ended
May 31, 2017 | |
| Net Investment Income: | | | | | | | | |
| Class A | | $ | 133,494 | | | $ | 357,550 | |
| Class A2 | | | 806,581 | | | | 1,087,628 | |
| Class C | | | 88,004 | | | | 161,906 | |
| Class R | | | 5,145 | | | | 15,451 | |
| Class I | | | 2,755,170 | | | | 5,685,314 | |
| Class IS | | | 3,234,761 | | | | 8,681,621 | |
| Total | | $ | 7,023,155 | | | $ | 15,989,470 | |
| | |
| Return of Capital: | | | | | | | | |
| Class A | | | — | | | $ | 12,264 | |
| Class A2 | | | — | | | | 61,077 | |
| Class C | | | — | | | | 8,255 | |
| Class R | | | — | | | | 611 | |
| Class I | | | — | | | | 242,811 | |
| Class IS | | | — | | | | 360,229 | |
| Total | | | — | | | $ | 685,247 | |
| | |
| Western Asset High Yield Fund 2017 Semi-Annual Report | | 53 |
Notes to financial statements (unaudited) (cont’d)
7. Capital shares
At November 30, 2017, the Corporation had 42.7 billion shares of capital stock authorized with a par value of $0.001 per share.
Transactions in shares of each class were as follows:
| | | | | | | | | | | | | | | | |
| | | Six Months Ended
November 30, 2017 | | | Year Ended
May 31, 2017 | |
| | | Shares | | | Amount | | | Shares | | | Amount | |
| Class A | | | | | | | | | | | | | | | | |
| Shares sold | | | 221,597 | | | $ | 1,797,859 | | | | 2,210,236 | | | $ | 17,527,178 | |
| Shares issued on reinvestment | | | 14,544 | | | | 118,405 | | | | 41,288 | | | | 328,982 | |
| Shares repurchased | | | (490,204) | | | | (3,976,854) | | | | (2,930,292) | | | | (22,989,727) | |
| Net decrease | | | (254,063) | | | $ | (2,060,590) | | | | (678,768) | | | $ | (5,133,567) | |
| | | | |
| Class A2 | | | | | | | | | | | | | | | | |
| Shares sold | | | 470,862 | | | $ | 3,843,240 | | | | 1,492,279 | | | $ | 11,995,279 | |
| Shares issued on reinvestment | | | 98,877 | | | | 806,581 | | | | 143,189 | | | | 1,148,705 | |
| Shares repurchased | | | (177,435) | | | | (1,449,188) | | | | (178,881) | | | | (1,432,496) | |
| Net increase | | | 392,304 | | | $ | 3,200,633 | | | | 1,456,587 | | | $ | 11,711,488 | |
| | | | |
| Class C | | | | | | | | | | | | | | | | |
| Shares sold | | | 31,317 | | | $ | 252,532 | | | | 225,798 | | | $ | 1,778,581 | |
| Shares issued on reinvestment | | | 9,182 | | | | 74,106 | | | | 16,958 | | | | 134,577 | |
| Shares repurchased | | | (47,191) | | | | (379,622) | | | | (147,569) | | | | (1,176,066) | |
| Net increase (decrease) | | | (6,692) | | | $ | (52,984) | | | | 95,187 | | | $ | 737,092 | |
| | | | |
| Class R | | | | | | | | | | | | | | | | |
| Shares sold | | | 7,289 | | | $ | 59,009 | | | | 12,445 | | | $ | 98,502 | |
| Shares issued on reinvestment | | | 296 | | | | 2,396 | | | | 1,264 | | | | 10,012 | |
| Shares repurchased | | | (2,540) | | | | (20,547) | | | | (26,714) | | | | (213,256) | |
| Net increase (decrease) | | | 5,045 | | | $ | 40,858 | | | | (13,005) | | | $ | (104,742) | |
| | | | |
| Class I | | | | | | | | | | | | | | | | |
| Shares sold | | | 1,967,450 | | | $ | 15,905,790 | | | | 8,379,170 | | | $ | 66,506,537 | |
| Shares issued on reinvestment | | | 319,062 | | | | 2,578,625 | | | | 720,421 | | | | 5,710,692 | |
| Shares repurchased | | | (3,821,653) | | | | (30,817,559) | | | | (10,340,102) | | | | (81,849,403) | |
| Net decrease | | | (1,535,141) | | | $ | (12,333,144) | | | | (1,240,511) | | | $ | (9,632,174) | |
| | | | |
| Class IS | | | | | | | | | | | | | | | | |
| Shares sold | | | 159,660 | | | $ | 1,312,454 | | | | 5,237,767 | | | $ | 42,448,896 | |
| Shares issued on reinvestment | | | 393,876 | | | | 3,234,761 | | | | 1,121,185 | | | | 9,027,153 | |
| Shares repurchased | | | (1,093,214) | | | | (8,953,498) | | | | (14,241,590) | | | | (115,195,927) | |
| Net decrease | | | (539,678) | | | $ | (4,406,283) | | | | (7,882,638) | | | $ | (63,719,878) | |
8. Redemption facility
The Fund and certain other participating funds within the Corporation (the “Participating Funds”) have available an unsecured revolving credit facility (the “Redemption Facility”), from the lenders and The Bank of New York Mellon (“BNY Mellon”), as administrative agent for the lenders. The Redemption Facility is to be used for temporary or emergency
| | |
| 54 | | Western Asset High Yield Fund 2017 Semi-Annual Report |
purposes as an additional source of liquidity to fund redemptions of shares. Under the agreement, BNY Mellon provides a 364-day revolving credit facility, in the aggregate amount of $265 million. Unless renewed, the agreement will terminate on November 19, 2018. Any borrowings under the Redemption Facility will bear interest at current market rates as set forth in the credit agreement. The annual commitment fee to maintain the Redemption Facility is 0.10% and is incurred on the unused portion of the facility and is allocated to all Participating Funds pro rata based on net assets. For the six months ended November 30, 2017, the Fund incurred a commitment fee in the amount of $1,140. The Fund did not utilize the Redemption Facility during the six months ended November 30, 2017.
9. Restricted securities
The following Fund investments are restricted as to resale.
| | | | | | | | | | | | | | | | | | | | | | | | |
| Security | | Number of
Shares/Face
Amount | | | Acquisition
Date | | | Cost | | | Value at
11/30/2017 | | | Value Per
Share/Unit | | | Percent of
Net Assets | |
| Berry Petroleum Co., Convertible Preferred Stock | | | 2,002 | | | | 2/17 | | | $ | 20,020 | | | $ | 21,271 | | | $ | 10.63 | | | | 0.01 | % |
| BioScript Inc., First Lien Notes, 8.224%, due 6/30/22 | | $ | 662,000 | | | | 6/17 | | | | 655,832 | | | | 663,523 | (a) | | | 100.23 | | | | 0.28 | % |
| (a) | Security is valued in good faith in accordance with procedures approved by the Board of Directors. |
10. Transactions with affiliated companies
As defined by the 1940 Act, an affiliated company is one in which the Fund owns 5% or more of the outstanding voting securities, or a company which is under common ownership or control. The Fund may invest in Western Asset Government Cash Management Portfolio, LLC (“Cash Management Portfolio”), an affiliated private money market fund managed by Western Asset, the Fund’s subadviser. Cash Management Portfolio is available as a cash management vehicle for certain proprietary investment companies affiliated with Legg Mason. While Cash Management Portfolio is not a registered money market fund, it conducts all of its investment activities in accordance with the requirements of Rule 2a-7 under the 1940 Act. Based on the Fund’s relative ownership, the following companies were considered affiliated companies for all or some portion of the six months ended November 30, 2017. The following transactions were effected in shares of such companies for the six months ended November 30, 2017.
| | | | | | | | | | | | | | | | | | | | | | | | | | | | | | |
| | | Affiliate
Value at
May 31,
2017 | | Purchased | | | Sold | | | Realized
Gain
(Loss) | | Interest
Income | | | Net Increase
(Decrease) in
Unrealized
Appreciation
(Depreciation) | | Affiliate
Value at
November 30,
2017 | |
| | | | Cost | | | Shares | | | Cost | | | Shares | | | | | |
| Western Asset Government Cash Management Portfolio LLC | | — | | $ | 48,621,964 | | | | 48,621,964 | | | $ | 45,616,274 | | | | 45,616,274 | | | — | | $ | 21,964 | | | — | | $ | 3,005,690 | |
11. Deferred capital losses
As of May 31, 2017, the Fund had deferred capital losses of $36,405,651, which have no expiration date, that will be available to offset future taxable capital gains.
| | |
| Western Asset High Yield Fund 2017 Semi-Annual Report | | 55 |
Notes to financial statements (unaudited) (cont’d)
12. Recent accounting pronouncement
In October 2016, the U.S. Securities and Exchange Commission adopted new rules and amended existing rules (together, the “final rules”) intended to modernize the reporting and disclosure of information by registered investment companies. In part, the final rules amend Regulation S-X and require standardized, enhanced disclosure about derivatives in investment company financial statements, as well as other amendments. The compliance date for the amendments to Regulation S-X was August 1, 2017. The Fund has adopted the amendments to Regulation S-X and, upon evaluation, has concluded that the amendments do not materially impact the financial statement amounts; however, as required, additional or enhanced disclosure has been included.
| | |
| 56 | | Western Asset High Yield Fund 2017 Semi-Annual Report |
Board approval of management and subadvisory agreements (unaudited)
The Executive and Contracts Committee of the Board of Directors considered the Investment Management Agreement between the Corporation and LMPFA with respect to the Fund and the Investment Advisory Agreement between LMPFA and Western Asset Management Company (“Western Asset”) and Western Asset Management Company Limited in London (“WAML” and together with Western Asset, the “Subadvisers”) (collectively, the “Agreements”) with respect to the Fund at meetings held on September 12, 2017 and October 17, 2017. At a meeting held on November 14, 2017, the Executive and Contracts Committee reported to the full Board of Directors its considerations and recommendation with respect to the Agreements, and the Board of Directors, including a majority of the Independent Directors, considered and approved renewal of the Agreements.
The Directors noted that although Western Asset’s business is operated through separate legal entities, such as WAML, its business is highly integrated and senior investment personnel at Western Asset have supervisory oversight responsibility over the investment decisions made by WAML. Therefore, in connection with their deliberations noted below, the Directors primarily focused on the information provided by Western Asset when considering the approval of the Investment Advisory Agreement between LMPFA and WAML with respect to the Fund. The Directors also noted that the Fund does not pay any management fees directly to Western Asset or to WAML because LMPFA pays the Subadvisers for services provided to the Fund out of the management fee LMPFA receives from the Fund.
In arriving at their decision to approve and renew the Agreements, the Directors met with representatives of Western Asset, including relevant investment advisory personnel, as well as representatives of LMPFA; reviewed a variety of information prepared by LMPFA and Western Asset and materials provided by Broadridge and counsel to the Independent Directors; reviewed performance and expense information for the Fund’s peer group of comparable funds selected and prepared by Broadridge and for certain other comparable products available from Western Asset, including separate accounts managed by Western Asset; and requested and reviewed additional information as necessary. These reviews were in addition to information obtained by the Directors at their regular quarterly meetings with respect to the Fund’s performance and other relevant matters, and related discussions with Western Asset’s personnel.
As part of their review, the Directors examined LMPFA’s ability to provide high quality oversight and administrative and shareholder support services to the Fund, and the Subadvisers’ ability to provide high quality investment management services to the Fund. The Directors considered the experience of LMPFA’s personnel in providing the types of services that LMPFA is responsible for providing to the Fund; the ability of LMPFA to attract and retain capable personnel; the capability and integrity of LMPFA’s senior management and staff; and the level of skill required to provide such services to the Fund. The Directors considered the investment philosophy and research and decision-making processes of the Subadvisers; the experience of their key advisory personnel responsible for management of the Fund; the ability of the Subadvisers to attract and retain capable research and advisory personnel; the
| | |
| Western Asset High Yield Fund | | 57 |
Board approval of management and subadvisory agreements (unaudited) (cont’d)
capability and integrity of the Subadvisers’ senior management and staff; and the level of skill required to manage the Fund. In addition, the Directors reviewed the quality of LMPFA’s and the Subadvisers’ services with respect to regulatory compliance and compliance with the investment policies of the Fund and conditions that might affect LMPFA’s or a Subadviser’s ability to provide high quality services to the Fund in the future under the Agreements, including its business reputation, financial condition and operational stability. Based on the foregoing, the Directors concluded that the Subadvisers’ investment process, research capabilities and philosophy were well suited to the Fund given the Fund’s investment objectives and policies, and that LMPFA and each Subadviser would be able to meet any reasonably foreseeable obligations under the Agreements.
In reviewing the quality of the services provided to the Fund, the Directors also reviewed comparisons of the performance of the Fund to the performance of certain comparable funds in its peer group and to its investment benchmark over the one-, three- and five-year periods ended August 31, 2017. In that connection, the Directors noted that the performance of the Fund exceeded the peer average performance for the one-year period, but was lower than its peer group’s average performance for the three-year and five-year periods. With respect to the Fund, the Directors considered the factors involved in its performance relative to the performance of its investment benchmark and peer group.
The Directors also considered the management fee payable by the Fund to LMPFA, the total expenses payable by the Fund and the fact that LMPFA pays to the Subadvisers the entire management fee it receives from the Fund. They reviewed information concerning management fees paid to investment advisers of similarly managed funds, as well as fees paid by the Subadvisers’ other clients, including separate accounts managed by either Subadviser. The Directors observed that the management fee paid by the Fund to LMPFA was lower than the average of the fees paid by funds in its peer group, and that total expenses for the Fund were lower than the average of the funds in its peer group. The Directors noted that the management fee paid by the Fund was generally higher than the fees paid by other clients of the Subadvisers for accounts with similar investment strategies, but that the administrative and operational responsibilities for the Subadvisers with respect to the Fund were also relatively higher. In light of this difference, the Directors concluded that the management fee paid by the Fund relative to the fees paid by the Subadvisers’ other clients was reasonable.
The Directors further evaluated the benefits of the advisory relationship to LMPFA and the Subadvisers, including, among others, the profitability of the relationship to LMPFA and the Subadvisers; the direct and indirect benefits that LMPFA and the Subadvisers may receive from their relationship with the Fund, including any “fallout benefits,” such as reputational value derived from serving as investment manager or adviser to the Fund; and the affiliations between LMPFA, the Subadvisers and certain service providers for the Fund. In that connection, the Directors concluded that LMPFA and each Subadviser’s profitability was
| | |
| 58 | | Western Asset High Yield Fund |
consistent with levels of profitability that had been determined by courts not to be excessive. The Directors noted that Western Asset does not have soft dollar arrangements.
Finally, the Directors considered, in light of the profitability information provided by LMPFA and Western Asset, the extent to which economies of scale would be realized by the Subadvisers as the assets of the Fund grow. The Directors determined that the lack of breakpoints was appropriate and that the management fee structure for the Fund is reasonable.
In their deliberations with respect to these matters, the Independent Directors were advised by their independent counsel, who is independent, within the meaning of Securities and Exchange Commission rules regarding the independence of counsel, of LMPFA and the Subadvisers. The Independent Directors weighed each of the foregoing matters in light of the advice given to them by their independent counsel as to the law applicable to the review of investment advisory contracts. In arriving at a decision, the Directors, including the Independent Directors, did not identify any single matter as all-important or controlling, and the foregoing summary does not detail all the matters considered. The Directors judged the terms and conditions of the Agreements, including the investment advisory fees, in light of all of the surrounding circumstances.
Based upon their review, the Directors, including all of the Independent Directors, determined, in the exercise of their business judgment, that they were generally satisfied with the quality of services being provided by LMPFA and the Subadvisers, but they would continue to closely monitor the performance of LMPFA and the Subadvisers; that the fees to be paid to the Subadvisers and LMPFA under the relevant Agreements were fair and reasonable, given the scope and quality of the services rendered by the Subadvisers and LMPFA; and that approval of the Agreements was in the best interest of the Fund and its shareholders.
| | |
| Western Asset High Yield Fund | | 59 |
Western Asset
High Yield Fund
Directors
Robert Abeles, Jr.
Anita L. DeFrantz
Ronald L. Olson
Avedick B. Poladian
William E. B. Siart,
Chairman
Jaynie M. Studenmund
Investment manager
Legg Mason Partners Fund Advisor, LLC
Subadvisers
Western Asset Management Company
Western Asset Management Company Limited
Transfer agent
BNY Mellon Investment Servicing (US) Inc.
4400 Computer Drive
Westborough, MA 01581
Custodian
State Street Bank and Trust Company
Independent registered public accounting firm
PricewaterhouseCoopers LLP
Baltimore, MD
Western Asset High Yield Fund
The Fund is a separate investment series of Western Asset Funds, Inc.
Western Asset High Yield Fund
Legg Mason Funds
620 Eighth Avenue, 49th Floor
New York, NY 10018
The Fund files its complete schedule of portfolio holdings with the Securities and Exchange Commission (“SEC”) for the first and third quarters of each fiscal year on Form N-Q. The Fund’s Forms N-Q are available on the SEC’s website at www.sec.gov. The Fund’s Forms N-Q may be reviewed and copied at the SEC’s Public Reference Room in Washington, D.C., and information on the operation of the Public Reference Room may be obtained by calling 1-800-SEC-0330. To obtain information on Form N-Q, shareholders can call the Fund at 1-877-721-1926.
Information on how the Fund voted proxies relating to portfolio securities during the prior 12-month period ended June 30th of each year and a description of the policies and procedures that the Fund uses to determine how to vote proxies related to portfolio transactions are available (1) without charge, upon request, by calling the Fund at 1-877-721-1926, (2) at www.leggmason.com/mutualfunds and (3) on the SEC’s website at www.sec.gov.
This report is submitted for the general information of the shareholders of Western Asset High Yield Fund. This report is not authorized for distribution to prospective investors in the Fund unless preceded or accompanied by a current prospectus.
Investors should consider the Fund’s investment objectives, risks, charges and expenses carefully before investing. The prospectus contains this and other important information about the Fund. Please read the prospectus carefully before investing.
www.leggmason.com
© 2018 Legg Mason Investor Services, LLC
Member FINRA, SIPC
Legg Mason Funds Privacy and Security Notice
Your Privacy and the Security of Your Personal Information is Very Important to the Legg Mason Funds
This Privacy and Security Notice (the “Privacy Notice”) addresses the Legg Mason Funds’ privacy and data protection practices with respect to nonpublic personal information the Funds receive. The Legg Mason Funds include any funds sold by the Funds’ distributor, Legg Mason Investor Services, LLC, as well as Legg Mason-sponsored closed-end funds and certain closed-end funds managed or sub-advised by Legg Mason or its affiliates. The provisions of this Privacy Notice apply to your information both while you are a shareholder and after you are no longer invested with the Funds.
The Type of Nonpublic Personal Information the Funds Collect About You
The Funds collect and maintain nonpublic personal information about you in connection with your shareholder account. Such information may include, but is not limited to:
| • | | Personal information included on applications or other forms; |
| • | | Account balances, transactions, and mutual fund holdings and positions; |
| • | | Online account access user IDs, passwords, security challenge question responses; and |
| • | | Information received from consumer reporting agencies regarding credit history and creditworthiness (such as the amount of an individual’s total debt, payment history, etc.). |
How the Funds Use Nonpublic Personal Information About You
The Funds do not sell or share your nonpublic personal information with third parties or with affiliates for their marketing purposes, or with other financial institutions or affiliates for joint marketing purposes, unless you have authorized the Funds to do so. The Funds do not disclose any nonpublic personal information about you except as may be required to perform transactions or services you have authorized or as permitted or required by law. The Funds may disclose information about you to:
| • | | Employees, agents, and affiliates on a “need to know” basis to enable the Funds to conduct ordinary business or comply with obligations to government regulators; |
| • | | Service providers, including the Funds’ affiliates, who assist the Funds as part of the ordinary course of business (such as printing, mailing services, or processing or servicing your account with us) or otherwise perform services on the Funds’ behalf, including companies that may perform marketing services solely for the Funds; |
| • | | The Funds’ representatives such as legal counsel, accountants and auditors; and |
| • | | Fiduciaries or representatives acting on your behalf, such as an IRA custodian or trustee of a grantor trust. |
|
| NOT PART OF THE SEMI-ANNUAL REPORT |
Legg Mason Funds Privacy and Security Notice (cont’d)
Except as otherwise permitted by applicable law, companies acting on the Funds’ behalf are contractually obligated to keep nonpublic personal information the Funds provide to them confidential and to use the information the Funds share only to provide the services the Funds ask them to perform.
The Funds may disclose nonpublic personal information about you when necessary to enforce their rights or protect against fraud, or as permitted or required by applicable law, such as in connection with a law enforcement or regulatory request, subpoena, or similar legal process. In the event of a corporate action or in the event a Fund service provider changes, the Funds may be required to disclose your nonpublic personal information to third parties. While it is the Funds’ practice to obtain protections for disclosed information in these types of transactions, the Funds cannot guarantee their privacy policy will remain unchanged.
Keeping You Informed of the Funds’ Privacy and Security Practices
The Funds will notify you annually of their privacy policy as required by federal law. While the Funds reserve the right to modify this policy at any time they will notify you promptly if this privacy policy changes.
The Funds’ Security Practices
The Funds maintain appropriate physical, electronic and procedural safeguards designed to guard your nonpublic personal information. The Funds’ internal data security policies restrict access to your nonpublic personal information to authorized employees, who may use your nonpublic personal information for Fund business purposes only.
Although the Funds strive to protect your nonpublic personal information, they cannot ensure or warrant the security of any information you provide or transmit to them, and you do so at your own risk. In the event of a breach of the confidentiality or security of your nonpublic personal information, the Funds will attempt to notify you as necessary so you can take appropriate protective steps. If you have consented to the Funds using electronic communications or electronic delivery of statements, they may notify you under such circumstances using the most current email address you have on record with them.
In order for the Funds to provide effective service to you, keeping your account information accurate is very important. If you believe that your account information is incomplete, not accurate or not current, or if you have questions about the Funds’ privacy practices, write the Funds using the contact information on your account statements, email the Funds by clicking on the Contact Us section of the Funds’ website at www.leggmason.com, or contact the Fund at 1-877-721-1926.
|
| NOT PART OF THE SEMI-ANNUAL REPORT |
Western Asset Management Company
Legg Mason, Inc. Subsidiaries
www.leggmason.com
© 2018 Legg Mason Investor Services, LLC Member FINRA, SIPC
WASX012828 1/18 SR17-3255
ITEM 2. CODE OF ETHICS.
Not applicable.
ITEM 3. AUDIT COMMITTEE FINANCIAL EXPERT.
Not applicable.
ITEM 4. PRINCIPAL ACCOUNTANT FEES AND SERVICES.
Not applicable.
ITEM 5. AUDIT COMMITTEE OF LISTED REGISTRANTS.
Not applicable.
ITEM 6. SCHEDULE OF INVESTMENTS.
Included herein under Item 1.
ITEM 7. DISCLOSURE OF PROXY VOTING POLICIES AND PROCEDURES FOR CLOSED-END MANAGEMENT INVESTMENT COMPANIES.
Not applicable.
ITEM 8. PORTFOLIO MANAGERS OF CLOSED-END MANAGEMENT INVESTMENT COMPANIES.
Not applicable.
ITEM 9. PURCHASES OF SECURITIES BY CLOSED-END MANAGEMENT INVESTMENT COMPANY AND AFFILIATED PURCHASERS.
Not applicable.
ITEM 10. SUBMISSION OF MATTERS TO A VOTE OF SECURITY HOLDERS.
Not applicable.
ITEM 11. CONTROLS AND PROCEDURES.
| | (a) | The registrant’s principal executive officer and principal financial officer have concluded that the registrant’s disclosure controls and procedures (as defined in Rule 30a- 3(c) under the Investment Company Act of 1940, as amended (the “1940 Act”)) are effective as of a date within 90 days of the filing date of this report that includes the disclosure required by this paragraph, based on their evaluation of the disclosure controls and procedures required by Rule 30a-3(b) under the 1940 Act and 15d-15(b) under the Securities Exchange Act of 1934. |
| | (b) | There were no changes in the registrant’s internal control over financial reporting (as defined in Rule 30a-3(d) under the 1940 Act) that occurred during the second fiscal quarter of the period covered by this report that have materially affected, or are likely to materially affect the registrant’s internal control over financial reporting. |
ITEM 12. EXHIBITS.
(a) (1) Not applicable.
Exhibit 99.CODE ETH
(a) (2) Certifications pursuant to section 302 of the Sarbanes-Oxley Act of 2002 attached hereto.
Exhibit 99.CERT
(b) Certifications pursuant to Section 906 of the Sarbanes-Oxley Act of 2002 attached hereto.
Exhibit 99.906CERT
SIGNATURES
Pursuant to the requirements of the Securities Exchange Act of 1934 and the Investment Company Act of 1940, the registrant has duly caused this Report to be signed on its behalf by the undersigned, there unto duly authorized.
| | |
| Western Asset Funds, Inc. |
| |
| By: | | /s/ Jane Trust |
| | Jane Trust Chief Executive Officer |
| |
| Date: | | January 25, 2018 |
Pursuant to the requirements of the Securities Exchange Act of 1934 and the Investment Company Act of 1940, this report has been signed below by the following persons on behalf of the registrant and in the capacities and on the dates indicated.
| | |
| |
| By: | | /s/ Jane Trust |
| | Jane Trust Chief Executive Officer |
| |
| Date: | | January 25, 2018 |
| |
| By: | | /s/ Richard F. Sennett |
| | Richard F. Sennett Principal Financial Officer |
| |
| Date: | | January 25, 2018 |