UNITED STATES
SECURITIES AND EXCHANGE COMMISSION
Washington, D.C. 20549
FORMN-CSR
CERTIFIED SHAREHOLDER REPORT OF REGISTERED
MANAGEMENT INVESTMENT COMPANIES
Investment Company Act file number811-06110
Western Asset Funds, Inc.
(Exact name of registrant as specified in charter)
620 Eighth Avenue, 49th Floor, New York, NY 10018
(Address of principal executive offices) (Zip code)
Robert I. Frenkel, Esq.
Legg Mason & Co., LLC
100 First Stamford Place
Stamford, CT 06902
(Name and address of agent for service)
Registrant’s telephone number, including area code:1-877-721-1926
Date of fiscal year end: December 31
Date of reporting period: June 30, 2019
| | |
| ITEM 1. | | REPORT TO STOCKHOLDERS. |
| |
| | TheSemi-Annual Report to Stockholders is filed herewith. |

| | |
| Semi-Annual Report | | June 30, 2019 |
WESTERN ASSET
CORE PLUS BOND FUND
Beginning in January 2021, as permitted by regulations adopted by the Securities and Exchange Commission, the Fund intends to no longer mail paper copies of the Fund’s shareholder reports like this one, unless you specifically request paper copies of the reports from the Fund or from your Service Agent or financial intermediary (such as a broker-dealer or bank). Instead, the reports will be made available on a website, and you will be notified by mail each time a report is posted and provided with a website link to access the report.
If you already elected to receive shareholder reports electronically(“e-delivery”), you will not be affected by this change and you need not take any action. If you have not already electede-delivery, you may elect to receive shareholder reports and other communications from the Fund electronically by contacting your Service Agent or, if you are a direct shareholder with the Fund, by calling1-877-721-1926.
You may elect to receive all future reports in paper free of charge. If you invest through a Service Agent, you can contact your Service Agent to request that you continue to receive paper copies of your shareholder reports. That election will apply to all Legg Mason Funds held in your account at that Service Agent. If you are a direct shareholder with the Fund, you can call the Fund at1-877-721-1926, or write to the Fund by regular mail at Legg Mason Funds, P.O. Box 9699, Providence, RI 02940-9699 or by express, certified or registered mail to Legg Mason Funds, 4400 Computer Drive, Westborough, MA 01581 to let the Fund know you wish to continue receiving paper copies of your shareholder reports. That election will apply to all Legg Mason Funds held in your account held directly with the fund complex.

|
| INVESTMENT PRODUCTS: NOT FDIC INSURED • NO BANK GUARANTEE • MAY LOSE VALUE |
Fund objective
The Fund seeks to maximize total return, consistent with prudent investment management and liquidity needs, by investing to obtain an average effective duration which is expected to range within 30% of the average duration of the domestic bond market as a whole as estimated by the Fund’s subadviser.
Letter from the president

Dear Shareholder,
We are pleased to provide the semi-annual report of Western Asset Core Plus Bond Fund for thesix-month reporting period ended June 30, 2019. Please read on for Fund performance information during the Fund’s reporting period.
As always, we remain committed to providing you with excellent service and a full spectrum of investment choices. We also remain committed to supplementing the support you receive from your financial advisor. One way we accomplish this is through our website, www.leggmason.com. Here you can gain immediate access to market and investment information, including:
| • | | Fund prices and performance, |
| • | | Market insights and commentaries from our portfolio managers, and |
| • | | A host of educational resources. |
We look forward to helping you meet your financial goals.
Sincerely,

Jane Trust, CFA
President and Chief Executive Officer
July 26, 2019
| | |
| | |
| II | | Western Asset Core Plus Bond Fund |
Performance review
For the six months ended June 30, 2019, Class I shares of Western Asset Core Plus Bond Fund returned 8.22%. The Fund’s unmanaged benchmark, the Bloomberg Barclays U.S. Aggregate Index1, returned 6.11% for the same period. The Lipper Core Plus Bond Funds Category Average2 returned 6.76% over the same time frame.
| | | | |
Performance Snapshotas of June 30, 2019
(unaudited) | |
| (excluding sales charges) | | 6 months | |
| Western Asset Core Plus Bond Fund: | | | | |
Class A | | | 8.03 | % |
Class C | | | 7.65 | % |
Class C1 | | | 7.81 | % |
Class FI | | | 8.01 | % |
Class R | | | 7.87 | % |
Class I | | | 8.22 | % |
Class IS | | | 8.24 | % |
| Bloomberg Barclays U.S. Aggregate Index | | | 6.11 | % |
Lipper Core Plus Bond Funds
Category Average | | | 6.76 | % |
The performance shown represents past performance. Past performance is no guarantee of future results and current performance may be higher or lower than the performance shown above. Principal value, investment returns and yields will fluctuate and investors’ shares, when redeemed, may be worth more or less than their original cost. To obtain performance data current to the most recentmonth-end, please visit our website at www.leggmason.com/mutualfunds.
All share class returns assume the reinvestment of all distributions, including returns of capital, if any, at net asset value and the deduction of all Fund expenses. Returns have not been adjusted to include sales charges that may apply or the deduction of taxes that a shareholder would pay on Fund distributions. If sales charges were reflected, the performance quoted would be lower. Performance figures for periods shorter than one year represent cumulative figures and are not annualized.
Fund performance figures reflect fee waivers and/or expense reimbursements, without which the performance would have been lower.
The30-Day SEC Yields for the period ended June 30, 2019 for Class A, Class C, Class C1, Class FI, Class R, Class I and Class IS shares were 2.74%, 2.18%, 2.43%, 2.87%, 2.60%, 3.23% and 3.26%, respectively. Absent fee waivers and/or expense reimbursements, the30-Day SEC Yield for Class I shares would have been 3.16%. The30-Day SEC Yield, calculated pursuant to the standard SEC formula, is based on a Fund’s investments over an annualized trailing30-day period, and not on the distributions paid by the Fund, which may differ.
|
| Total Annual Operating Expenses(unaudited) |
As of the Fund’s current prospectus dated April 29, 2019, the gross total annual fund operating expense ratios for Class A, Class C, Class C1, Class FI, Class R, Class I and Class IS shares were 0.84%, 1.52%, 1.19%, 0.83%, 1.12%, 0.52% and 0.42%, respectively.
Actual expenses may be higher. For example, expenses may be higher than those shown if average net assets decrease. Net assets are more likely to decrease and Fund expense ratios are more likely to increase when markets are volatile.
| 1 | The Bloomberg Barclays U.S. Aggregate Index is a broad-based bond index comprised of government, corporate, mortgage- and asset-backed issues, rated investment grade or higher, and having at least one year to maturity. |
| 2 | Lipper, Inc., a wholly-owned subsidiary of Reuters, provides independent insight on global collective investments. Returns are based on thesix-month period ended June 30, 2019, including the reinvestment of all distributions, including returns of capital, if any, calculated among the 312 funds in the Fund’s Lipper category, and excluding sales charges, if any. |
| | |
| | |
| Western Asset Core Plus Bond Fund | | III |
Performance review (cont’d)
As a result of expense limitation arrangements, the ratio of total annual fund operating expenses, other than interest, brokerage commissions, taxes, extraordinary expenses, deferred organizational expenses and acquired fund fees and expenses, to average net assets will not exceed 0.82% for Class A shares, 1.65% for Class C shares, 1.51% for Class C1 shares, 0.85% for Class FI shares, 1.15% for Class R shares, 0.45% for Class I shares and 0.45% for Class IS shares. In addition, the ratio of total annual fund operating expenses for Class IS shares will not exceed the ratio of total annual fund operating expenses for Class I shares. These expense limitation arrangements cannot be terminated prior to December 31, 2020 without the Board of Directors’ consent.
The manager is permitted to recapture amounts waived and/or reimbursed to a class within two years after the fiscal year in which the manager earned the fee or incurred the expense if the class’ total annual operating expenses have fallen to a level below the expense limitation (“expense cap”) in effect at the time the fees were earned or the expenses incurred. In no case will the manager recapture any amount that would result, on any particular business day of the Fund, in the class’ total annual operating expenses exceeding the expense cap or any other lower limit then in effect.
As always, thank you for your confidence in our stewardship of your assets.
Sincerely,
Jane Trust, CFA
President and Chief Executive Officer
July 26, 2019
RISKS: Bonds are subject to a variety of risks, including interest rate, credit and inflation risks. As interest rates rise, bond prices fall, reducing the value of the Fund’s share price. The Fund may invest in high-yield bonds (commonly known as “junk bonds”), which are rated below investment grade and carry more risk than higher rated securities. Investments in asset-backed and mortgage-backed securities involve additional risks, including prepayment and extension risks.Non-U.S. investments are subject to currency fluctuations and social, economic and political uncertainties, which could increase volatility. These risks are magnified in emerging markets. The Fund may use derivatives, such as options, futures and swaps, which can be illiquid, may disproportionately increase losses, and have a potentially large impact on Fund performance. Please see the Fund’s prospectus for a more complete discussion of these and other risks and the Fund’s investment strategies.
All investments are subject to risk including the possible loss of principal. Past performance is no guarantee of future results. All index performance reflects no deduction for fees, expenses or taxes. Please note that an investor cannot invest directly in an index.
| | |
| | |
| IV | | Western Asset Core Plus Bond Fund |
Fund at a glance†(unaudited)
Investment breakdown(%) as a percent of total investments
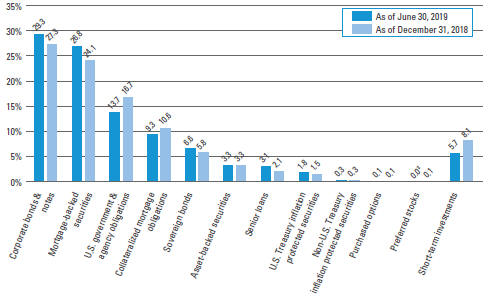
| † | The bar graph above represents the composition of the Fund’s investments as of June 30, 2019 and December 31, 2018 and does not include derivatives such as written options, futures contracts, forward foreign currency contracts and swap contracts. The Fund is actively managed. As a result, the composition of the Fund’s investments is subject to change at any time. |
| | |
| | |
| Western Asset Core Plus Bond Fund 2019 Semi-Annual Report | | 1 |
Fund expenses(unaudited)
Example
As a shareholder of the Fund, you may incur two types of costs: (1) transaction costs, includingfront-end andback-end sales charges (loads) on purchase payments; and (2) ongoing costs, including management fees; service and/or distribution(12b-1) fees; and other Fund expenses. This example is intended to help you understand your ongoing costs (in dollars) of investing in the Fund and to compare these costs with the ongoing costs of investing in other mutual funds.
This example is based on an investment of $1,000 invested on January 1, 2019 and held for the six months ended June 30, 2019.
Actual expenses
The table below titled “Based on Actual Total Return” provides information about actual account values and actual expenses. You may use the information provided in this table, together with the amount you invested, to estimate the expenses that you paid over the period. To estimate the expenses you paid on your account, divide your ending account value by $1,000 (for example, an $8,600 ending account value divided by $1,000 = 8.6), then multiply the result by the number under the heading entitled “Expenses Paid During the Period”.
Hypothetical example for comparison purposes
The table below titled “Based on Hypothetical Total Return” provides information about hypothetical account values and hypothetical expenses based on the actual expense ratio and an assumed rate of return of 5.00% per year before expenses, which is not the Fund’s actual return. The hypothetical account values and expenses may not be used to estimate the actual ending account balance or expenses you paid for the period. You may use the information provided in this table to compare the ongoing costs of investing in the Fund and other funds. To do so, compare the 5.00% hypothetical example relating to the Fund with the 5.00% hypothetical examples that appear in the shareholder reports of the other funds.
Please note that the expenses shown in the table below are meant to highlight your ongoing costs only and do not reflect any transactional costs, such asfront-end orback-end sales charges (loads). Therefore, the table is useful in comparing ongoing costs only, and will not help you determine the relative total costs of owning different funds. In addition, if these transaction costs were included, your costs would have been higher.
| | | | | | | | | | | | | | | | | | | | | | | | | | | | | | | | | | | | | | | | | | | | | | |
| | |
| Based on actual total return1 | | | | | | Based on hypothetical total return1 | |
| | | Actual
Total Return
Without
Sales
Charge2 | | | Beginning
Account
Value | | | Ending
Account
Value | | | Annualized
Expense
Ratio | | | Expenses
Paid
During
the
Period3 | | | | | | | | Hypothetical
Annualized
Total Return | | | Beginning
Account
Value | | | Ending
Account
Value | | | Annualized
Expense
Ratio | | | Expenses
Paid
During
the
Period3 | |
| Class A | | | 8.03 | % | | $ | 1,000.00 | | | $ | 1,080.30 | | | | 0.82 | % | | $ | 4.23 | | | | | | | Class A | | | 5.00 | % | | $ | 1,000.00 | | | $ | 1,020.73 | | | | 0.82 | % | | $ | 4.11 | |
| Class C | | | 7.65 | | | | 1,000.00 | | | | 1,076.50 | | | | 1.52 | | | | 7.83 | | | | | | | Class C | | | 5.00 | | | | 1,000.00 | | | | 1,017.26 | | | | 1.52 | | | | 7.60 | |
| Class C1 | | | 7.81 | | | | 1,000.00 | | | | 1,078.10 | | | | 1.23 | | | | 6.34 | | | | | | | Class C1 | | | 5.00 | | | | 1,000.00 | | | | 1,018.70 | | | | 1.23 | | | | 6.16 | |
| Class FI | | | 8.01 | | | | 1,000.00 | | | | 1,080.10 | | | | 0.83 | | | | 4.28 | | | | | | | Class FI | | | 5.00 | | | | 1,000.00 | | | | 1,020.68 | | | | 0.83 | | | | 4.16 | |
| Class R | | | 7.87 | | | | 1,000.00 | | | | 1,078.70 | | | | 1.11 | | | | 5.72 | | | | | | | Class R | | | 5.00 | | | | 1,000.00 | | | | 1,019.29 | | | | 1.11 | | | | 5.56 | |
| Class I | | | 8.22 | | | | 1,000.00 | | | | 1,082.20 | | | | 0.45 | | | | 2.32 | | | | | | | Class I | | | 5.00 | | | | 1,000.00 | | | | 1,022.56 | | | | 0.45 | | | | 2.26 | |
| Class IS | | | 8.24 | | | | 1,000.00 | | | | 1,082.40 | | | | 0.42 | | | | 2.17 | | | | | | | Class IS | | | 5.00 | | | | 1,000.00 | | | | 1,022.71 | | | | 0.42 | | | | 2.11 | |
| | |
| | |
| 2 | | Western Asset Core Plus Bond Fund 2019 Semi-Annual Report |
| 1 | For the six months ended June 30, 2019. |
| 2 | Assumes the reinvestment of all distributions, including returns of capital, if any, at net asset value and does not reflect the deduction of the applicable sales charge with respect to Class A shares or the applicable contingent deferred sales charge (“CDSC”) with respect to Class C and Class C1 shares. Total return is not annualized, as it may not be representative of the total return for the year. Performance figures may reflect compensating balance arrangements, fee waivers and/or expense reimbursements. In the absence of compensating balance arrangements, fee waivers and/or expense reimbursements, the total return would have been lower. Past performance is no guarantee of future results. |
| 3 | Expenses (net of compensating balance arrangements, fee waivers and/or expense reimbursements) are equal to each class’ respective annualized expense ratio multiplied by the average account value over the period, multiplied by the number of days in the most recent fiscal half-year (181), then divided by 365. |
| | |
| | |
| Western Asset Core Plus Bond Fund 2019 Semi-Annual Report | | 3 |
Spread duration(unaudited)
Economic exposure —June 30, 2019
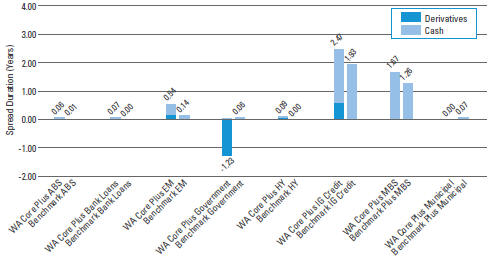
Spread duration measures the sensitivity to changes in spreads. The spread over Treasuries is the annual risk-premium demanded by investors to holdnon-Treasury securities. Spread duration is quantified as the % change in price resulting from a 100 basis points change in spreads. For a security with positive spread duration, an increase in spreads would result in a price decline and a decline in spreads would result in a price increase. This chart highlights the market sector exposure of the Fund’s sectors relative to the selected benchmark sectors as of the end of the reporting period.
| | |
| |
| ABS | | — Asset-Backed Securities |
| |
| Benchmark | | — Bloomberg Barclays U.S. Aggregate Index |
| |
| EM | | — Emerging Markets |
| |
| HY | | — High Yield |
| |
| IG Credit | | — Investment Grade Credit |
| |
| MBS | | — Mortgage-Backed Securities |
| |
| WA Core Plus | | — Western Asset Core Plus Bond Fund |
| | |
| | |
| 4 | | Western Asset Core Plus Bond Fund 2019 Semi-Annual Report |
Effective duration(unaudited)
Interest rate exposure —June 30, 2019
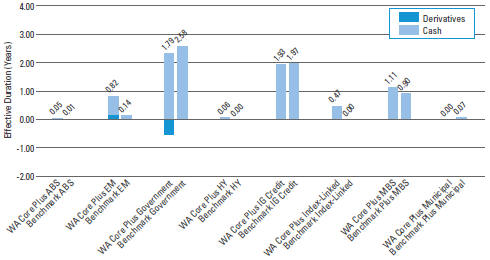
Effective duration measures the sensitivity to changes in relevant interest rates. Effective duration is quantified as the % change in price resulting from a 100 basis points change in interest rates. For a security with positive effective duration, an increase in interest rates would result in a price decline and a decline in interest rates would result in a price increase. This chart highlights the interest rate exposure of the Fund’s sectors relative to the selected benchmark sectors as of the end of the reporting period.
| | |
| |
| ABS | | — Asset-Backed Securities |
| |
| Benchmark | | — Bloomberg Barclays U.S. Aggregate Index |
| |
| EM | | — Emerging Markets |
| |
| HY | | — High Yield |
| |
| IG Credit | | — Investment Grade Credit |
| |
| MBS | | — Mortgage-Backed Securities |
| |
| WA Core Plus | | — Western Asset Core Plus Bond Fund |
| | |
| | |
| Western Asset Core Plus Bond Fund 2019 Semi-Annual Report | | 5 |
Schedule of investments(unaudited)
June 30, 2019
Western Asset Core Plus Bond Fund
| | | | | | | | | | | | | | | | |
| Security | | Rate | | | Maturity
Date | | | Face
Amount† | | | Value | |
| Corporate Bonds & Notes — 30.7% | |
| Communication Services — 3.0% | |
Diversified Telecommunication Services — 0.9% | |
AT&T Inc., Senior Notes | | | 4.450 | % | | | 5/15/21 | | | | 1,460,000 | | | $ | 1,515,892 | |
AT&T Inc., Senior Notes | | | 3.000 | % | | | 2/15/22 | | | | 2,516,000 | | | | 2,557,214 | |
AT&T Inc., Senior Notes | | | 3.400 | % | | | 5/15/25 | | | | 31,645,000 | | | | 32,557,772 | |
AT&T Inc., Senior Notes | | | 6.250 | % | | | 3/29/41 | | | | 970,000 | | | | 1,189,598 | |
AT&T Inc., Senior Notes | | | 4.350 | % | | | 6/15/45 | | | | 25,026,000 | | | | 25,060,483 | |
AT&T Inc., Senior Notes | | | 4.500 | % | | | 3/9/48 | | | | 13,290,000 | | | | 13,609,687 | |
British Telecommunications PLC, Senior Notes | | | 9.625 | % | | | 12/15/30 | | | | 5,310,000 | | | | 8,013,688 | |
Qwest Corp., Debentures | | | 6.875 | % | | | 9/15/33 | | | | 4,760,000 | | | | 4,762,059 | |
Telecom Italia SpA, Senior Notes | | | 5.303 | % | | | 5/30/24 | | | | 5,794,000 | | | | 6,018,517 | (a) |
Telefonica Emisiones SA, Senior Notes | | | 5.134 | % | | | 4/27/20 | | | | 4,485,000 | | | | 4,577,398 | |
Telefonica Emisiones SA, Senior Notes | | | 4.103 | % | | | 3/8/27 | | | | 170,000 | | | | 180,755 | |
Telefonica Emisiones SA, Senior Notes | | | 5.213 | % | | | 3/8/47 | | | | 6,160,000 | | | | 6,801,558 | |
Telefonica Emisiones SA, Senior Notes | | | 4.895 | % | | | 3/6/48 | | | | 11,960,000 | | | | 12,651,355 | |
Telefonica Emisiones SAU, Senior Notes | | | 5.877 | % | | | 7/15/19 | | | | 1,465,000 | | | | 1,466,718 | |
UPCB Finance IV Ltd., Senior Secured Notes | | | 5.375 | % | | | 1/15/25 | | | | 910,000 | | | | 937,582 | (a) |
Verizon Communications Inc., Senior Notes | | | 3.500 | % | | | 11/1/24 | | | | 6,660,000 | | | | 7,003,077 | |
Verizon Communications Inc., Senior Notes | | | 3.376 | % | | | 2/15/25 | | | | 27,705,000 | | | | 28,937,994 | |
Verizon Communications Inc., Senior Notes | | | 2.625 | % | | | 8/15/26 | | | | 5,622,000 | | | | 5,590,378 | |
Verizon Communications Inc., Senior Notes | | | 4.125 | % | | | 3/16/27 | | | | 5,755,000 | | | | 6,264,459 | |
Verizon Communications Inc., Senior Notes | | | 4.329 | % | | | 9/21/28 | | | | 27,937,000 | | | | 30,985,837 | |
Verizon Communications Inc., Senior Notes | | | 3.875 | % | | | 2/8/29 | | | | 4,900,000 | | | | 5,260,408 | |
Verizon Communications Inc., Senior Notes | | | 4.500 | % | | | 8/10/33 | | | | 15,185,000 | | | | 17,121,501 | |
Verizon Communications Inc., Senior Notes | | | 4.400 | % | | | 11/1/34 | | | | 2,200,000 | | | | 2,442,617 | |
See Notes to Financial Statements.
| | |
| | |
| 6 | | Western Asset Core Plus Bond Fund 2019 Semi-Annual Report |
Western Asset Core Plus Bond Fund
| | | | | | | | | | | | | | | | |
| Security | | Rate | | | Maturity
Date | | | Face
Amount† | | | Value | |
Diversified Telecommunication Services — continued | |
Verizon Communications Inc., Senior Notes | | | 4.272 | % | | | 1/15/36 | | | | 1,140,000 | | | $ | 1,236,667 | |
Verizon Communications Inc., Senior Notes | | | 5.250 | % | | | 3/16/37 | | | | 11,010,000 | | | | 13,187,719 | |
Verizon Communications Inc., Senior Notes | | | 3.850 | % | | | 11/1/42 | | | | 3,010,000 | | | | 3,081,773 | |
Verizon Communications Inc., Senior Notes | | | 4.125 | % | | | 8/15/46 | | | | 1,390,000 | | | | 1,453,279 | |
Verizon Communications Inc., Senior Notes | | | 4.862 | % | | | 8/21/46 | | | | 7,218,000 | | | | 8,415,907 | |
Verizon Communications Inc., Senior Notes | | | 5.500 | % | | | 3/16/47 | | | | 1,455,000 | | | | 1,829,273 | |
Verizon Communications Inc., Senior Notes | | | 4.522 | % | | | 9/15/48 | | | | 5,339,000 | | | | 5,991,038 | |
Total Diversified Telecommunication Services | | | | 260,702,203 | |
Entertainment — 0.1% | |
Netflix Inc., Senior Notes | | | 5.375 | % | | | 2/1/21 | | | | 2,675,000 | | | | 2,771,969 | |
Viacom Inc., Senior Notes | | | 4.250 | % | | | 9/1/23 | | | | 2,512,000 | | | | 2,659,144 | |
Viacom Inc., Senior Notes | | | 3.875 | % | | | 4/1/24 | | | | 1,720,000 | | | | 1,793,331 | |
Walt Disney Co., Senior Notes | | | 4.500 | % | | | 2/15/21 | | | | 8,000 | | | | 8,305 | (a) |
Walt Disney Co., Senior Notes | | | 6.200 | % | | | 12/15/34 | | | | 260,000 | | | | 352,960 | (a) |
Walt Disney Co., Senior Notes | | | 6.650 | % | | | 11/15/37 | | | | 5,240,000 | | | | 7,538,349 | (a) |
Walt Disney Co., Senior Notes | | | 6.750 | % | | | 1/9/38 | | | | 200,000 | | | | 283,869 | (a) |
Walt Disney Co., Senior Notes | | | 6.900 | % | | | 8/15/39 | | | | 120,000 | | | | 177,090 | (a) |
Total Entertainment | | | | 15,585,017 | |
Media — 1.7% | |
Altice France SA, Senior Secured Notes | | | 7.375 | % | | | 5/1/26 | | | | 29,345,000 | | | | 30,151,987 | (a) |
CCO Holdings LLC/CCO Holdings Capital Corp., Senior Notes | | | 5.250 | % | | | 9/30/22 | | | | 880,000 | | | | 894,938 | |
CCO Holdings LLC/CCO Holdings Capital Corp., Senior Notes | | | 5.125 | % | | | 5/1/27 | | | | 8,337,000 | | | | 8,652,639 | (a) |
CCO Holdings LLC/CCO Holdings Capital Corp., Senior Notes | | | 5.000 | % | | | 2/1/28 | | | | 5,450,000 | | | | 5,579,165 | (a) |
Charter Communications Operating LLC/Charter Communications Operating Capital Corp., Senior Secured Notes | | | 3.579 | % | | | 7/23/20 | | | | 9,780,000 | | | | 9,869,560 | |
See Notes to Financial Statements.
| | |
| | |
| Western Asset Core Plus Bond Fund 2019 Semi-Annual Report | | 7 |
Schedule of investments(unaudited) (cont’d)
June 30, 2019
Western Asset Core Plus Bond Fund
| | | | | | | | | | | | | | | | |
| Security | | Rate | | | Maturity
Date | | | Face
Amount† | | | Value | |
Media — continued | |
Charter Communications Operating LLC/Charter Communications Operating Capital Corp., Senior Secured Notes | | | 4.908 | % | | | 7/23/25 | | | | 10,537,000 | | | $ | 11,448,424 | |
Charter Communications Operating LLC/Charter Communications Operating Capital Corp., Senior Secured Notes | | | 4.200 | % | | | 3/15/28 | | | | 44,250,000 | | | | 46,006,554 | |
Charter Communications Operating LLC/Charter Communications Operating Capital Corp., Senior Secured Notes | | | 5.050 | % | | | 3/30/29 | | | | 19,860,000 | | | | 21,956,600 | |
Charter Communications Operating LLC/Charter Communications Operating Capital Corp., Senior Secured Notes | | | 5.375 | % | | | 4/1/38 | | | | 15,910,000 | | | | 17,064,615 | |
Charter Communications Operating LLC/Charter Communications Operating Capital Corp., Senior Secured Notes | | | 6.484 | % | | | 10/23/45 | | | | 6,620,000 | | | | 7,811,466 | |
Charter Communications Operating LLC/Charter Communications Operating Capital Corp., Senior Secured Notes | | | 5.750 | % | | | 4/1/48 | | | | 450,000 | | | | 498,473 | |
Charter Communications Operating LLC/Charter Communications Operating Capital Corp., Senior Secured Notes | | | 6.834 | % | | | 10/23/55 | | | | 2,608,000 | | | | 3,102,210 | |
Comcast Cable Communications Holdings Inc., Senior Notes | | | 9.455 | % | | | 11/15/22 | | | | 3,150,000 | | | | 3,882,470 | |
Comcast Corp., Senior Notes | | | 3.375 | % | | | 8/15/25 | | | | 3,940,000 | | | | 4,124,121 | |
Comcast Corp., Senior Notes | | | 3.950 | % | | | 10/15/25 | | | | 23,330,000 | | | | 25,190,188 | |
Comcast Corp., Senior Notes | | | 3.150 | % | | | 3/1/26 | | | | 2,900,000 | | | | 3,003,886 | |
Comcast Corp., Senior Notes | | | 4.150 | % | | | 10/15/28 | | | | 55,830,000 | | | | 61,584,516 | |
Comcast Corp., Senior Notes | | | 4.250 | % | | | 10/15/30 | | | | 14,475,000 | | | | 16,168,046 | |
Comcast Corp., Senior Notes | | | 4.250 | % | | | 1/15/33 | | | | 1,710,000 | | | | 1,919,867 | |
Comcast Corp., Senior Notes | | | 4.200 | % | | | 8/15/34 | | | | 244,000 | | | | 270,927 | |
Comcast Corp., Senior Notes | | | 5.650 | % | | | 6/15/35 | | | | 60,000 | | | | 74,956 | |
Comcast Corp., Senior Notes | | | 6.500 | % | | | 11/15/35 | | | | 2,250,000 | | | | 3,053,022 | |
Comcast Corp., Senior Notes | | | 3.900 | % | | | 3/1/38 | | | | 17,500,000 | | | | 18,456,671 | |
Comcast Corp., Senior Notes | | | 3.969 | % | | | 11/1/47 | | | | 221,000 | | | | 231,838 | |
See Notes to Financial Statements.
| | |
| | |
| 8 | | Western Asset Core Plus Bond Fund 2019 Semi-Annual Report |
Western Asset Core Plus Bond Fund
| | | | | | | | | | | | | | | | |
| Security | | Rate | | | Maturity
Date | | | Face
Amount† | | | Value | |
Media — continued | |
Comcast Corp., Senior Notes | | | 4.700 | % | | | 10/15/48 | | | | 3,410,000 | | | $ | 3,999,527 | |
Comcast Corp., Senior Notes | | | 3.999 | % | | | 11/1/49 | | | | 2,626,000 | | | | 2,773,584 | |
DISH DBS Corp., Senior Notes | | | 5.875 | % | | | 11/15/24 | | | | 21,394,000 | | | | 20,324,300 | |
DISH DBS Corp., Senior Notes | | | 7.750 | % | | | 7/1/26 | | | | 3,240,000 | | | | 3,150,900 | |
Fox Corp., Senior Notes | | | 4.030 | % | | | 1/25/24 | | | | 8,000,000 | | | | 8,514,780 | (a) |
Fox Corp., Senior Notes | | | 4.709 | % | | | 1/25/29 | | | | 14,660,000 | | | | 16,413,983 | (a) |
Fox Corp., Senior Notes | | | 5.476 | % | | | 1/25/39 | | | | 11,820,000 | | | | 13,971,706 | (a) |
Fox Corp., Senior Notes | | | 5.576 | % | | | 1/25/49 | | | | 4,120,000 | | | | 5,047,799 | (a) |
NBCUniversal Media LLC, Senior Notes | | | 4.375 | % | | | 4/1/21 | | | | 11,230,000 | | | | 11,649,416 | |
NBCUniversal Media LLC, Senior Notes | | | 5.950 | % | | | 4/1/41 | | | | 2,273,000 | | | | 2,989,625 | |
Prosus NV, Senior Notes | | | 4.850 | % | | | 7/6/27 | | | | 18,070,000 | | | | 19,350,169 | (a) |
Time Warner Cable LLC, Senior Secured Notes | | | 5.000 | % | | | 2/1/20 | | | | 2,460,000 | | | | 2,492,702 | |
Time Warner Cable LLC, Senior Secured Notes | | | 4.125 | % | | | 2/15/21 | | | | 8,351,000 | | | | 8,508,660 | |
Time Warner Cable LLC, Senior Secured Notes | | | 7.300 | % | | | 7/1/38 | | | | 8,925,000 | | | | 10,846,747 | |
Time Warner Cable LLC, Senior Secured Notes | | | 6.750 | % | | | 6/15/39 | | | | 3,295,000 | | | | 3,828,741 | |
Time Warner Cable LLC, Senior Secured Notes | | | 5.875 | % | | | 11/15/40 | | | | 8,447,000 | | | | 9,154,116 | |
Time Warner Entertainment Co. LP, Senior Secured Notes | | | 8.375 | % | | | 7/15/33 | | | | 2,060,000 | | | | 2,778,011 | |
UBM PLC, Senior Notes | | | 5.750 | % | | | 11/3/20 | | | | 6,060,000 | | | | 6,277,501 | (a) |
Virgin Media Secured Finance PLC, Senior Secured Notes | | | 5.250 | % | | | 1/15/26 | | | | 1,540,000 | | | | 1,583,828 | (a) |
Virgin Media Secured Finance PLC, Senior Secured Notes | | | 5.500 | % | | | 8/15/26 | | | | 200,000 | | | | 207,750 | (a) |
Virgin Media Secured Finance PLC, Senior Secured Notes | | | 5.500 | % | | | 5/15/29 | | | | 2,820,000 | | | | 2,868,504 | (a) |
Total Media | | | | 457,729,488 | |
Wireless Telecommunication Services — 0.3% | |
America Movil SAB de CV, Senior Notes | | | 5.000 | % | | | 3/30/20 | | | | 1,064,000 | | | | 1,084,422 | |
CSC Holdings LLC, Secured Notes | | | 5.375 | % | | | 7/15/23 | | | | 400,000 | | | | 412,000 | (a) |
Deutsche Telekom International Finance BV, Senior Notes | | | 2.820 | % | | | 1/19/22 | | | | 3,050,000 | | | | 3,078,759 | (a) |
Sprint Corp., Senior Notes | | | 7.250 | % | | | 9/15/21 | | | | 9,155,000 | | | | 9,750,075 | |
See Notes to Financial Statements.
| | |
| | |
| Western Asset Core Plus Bond Fund 2019 Semi-Annual Report | | 9 |
Schedule of investments(unaudited) (cont’d)
June 30, 2019
Western Asset Core Plus Bond Fund
| | | | | | | | | | | | | | | | |
| Security | | Rate | | | Maturity
Date | | | Face
Amount† | | | Value | |
Wireless Telecommunication Services — continued | |
Sprint Corp., Senior Notes | | | 7.875 | % | | | 9/15/23 | | | | 2,900,000 | | | $ | 3,157,375 | |
Sprint Corp., Senior Notes | | | 7.625 | % | | | 2/15/25 | | | | 5,365,000 | | | | 5,727,137 | |
Sprint Spectrum Co. LLC/Sprint Spectrum Co. II LLC/Sprint Spectrum Co. III LLC, Senior Secured Notes | | | 3.360 | % | | | 9/20/21 | | | | 2,587,500 | | | | 2,594,642 | (a) |
Sprint Spectrum Co. LLC/Sprint Spectrum Co. II LLC/Sprint Spectrum Co. III LLC, Senior Secured Notes | | | 4.738 | % | | | 3/20/25 | | | | 1,690,000 | | | | 1,757,600 | (a) |
Vodafone Group PLC, Senior Notes | | | 4.375 | % | | | 5/30/28 | | | | 34,820,000 | | | | 37,672,135 | |
Vodafone Group PLC, Senior Notes | | | 5.250 | % | | | 5/30/48 | | | | 11,260,000 | | | | 12,449,072 | |
Total Wireless Telecommunication Services | | | | 77,683,217 | |
Total Communication Services | | | | 811,699,925 | |
| Consumer Discretionary — 0.9% | |
Auto Components — 0.0% | |
American Axle & Manufacturing Inc., Senior Notes | | | 6.625 | % | | | 10/15/22 | | | | 315,000 | | | | 321,300 | |
Automobiles — 0.2% | |
BMW US Capital LLC, Senior Notes | | | 1.850 | % | | | 9/15/21 | | | | 1,590,000 | | | | 1,574,300 | (a) |
Daimler Finance North America LLC, Senior Notes | | | 2.450 | % | | | 5/18/20 | | | | 2,260,000 | | | | 2,259,459 | (a) |
Ford Motor Co., Senior Notes | | | 4.750 | % | | | 1/15/43 | | | | 4,330,000 | | | | 3,787,558 | |
Ford Motor Credit Co. LLC, Senior Notes | | | 8.125 | % | | | 1/15/20 | | | | 1,020,000 | | | | 1,049,016 | |
Ford Motor Credit Co. LLC, Senior Notes | | | 3.200 | % | | | 1/15/21 | | | | 3,750,000 | | | | 3,762,829 | |
Ford Motor Credit Co. LLC, Senior Notes | | | 5.750 | % | | | 2/1/21 | | | | 2,940,000 | | | | 3,061,450 | |
Ford Motor Credit Co. LLC, Senior Notes | | | 5.875 | % | | | 8/2/21 | | | | 12,560,000 | | | | 13,248,295 | |
Ford Motor Credit Co. LLC, Senior Notes | | | 3.664 | % | | | 9/8/24 | | | | 1,190,000 | | | | 1,177,526 | |
General Motors Co., Senior Notes | | | 5.150 | % | | | 4/1/38 | | | | 2,050,000 | | | | 2,024,152 | |
General Motors Co., Senior Notes | | | 6.250 | % | | | 10/2/43 | | | | 3,640,000 | | | | 3,880,518 | |
General Motors Co., Senior Notes | | | 5.950 | % | | | 4/1/49 | | | | 8,120,000 | | | | 8,520,580 | |
General Motors Financial Co. Inc., Senior Notes | | | 2.450 | % | | | 11/6/20 | | | | 3,110,000 | | | | 3,100,419 | |
General Motors Financial Co. Inc., Senior Notes | | | 4.375 | % | | | 9/25/21 | | | | 3,650,000 | | | | 3,768,772 | |
General Motors Financial Co. Inc., Senior Notes | | | 3.450 | % | | | 4/10/22 | | | | 7,930,000 | | | | 8,045,264 | |
See Notes to Financial Statements.
| | |
| | |
| 10 | | Western Asset Core Plus Bond Fund 2019 Semi-Annual Report |
Western Asset Core Plus Bond Fund
| | | | | | | | | | | | | | | | |
| Security | | Rate | | | Maturity
Date | | | Face
Amount† | | | Value | |
Automobiles — continued | |
General Motors Financial Co. Inc., Senior Notes | | | 4.250 | % | | | 5/15/23 | | | | 920,000 | | | $ | 951,456 | |
General Motors Financial Co. Inc., Senior Notes | | | 4.350 | % | | | 1/17/27 | | | | 2,340,000 | | | | 2,385,672 | |
Total Automobiles | | | | 62,597,266 | |
Diversified Consumer Services — 0.0% | |
Service Corp. International, Senior Notes | | | 7.500 | % | | | 4/1/27 | | | | 3,592,000 | | | | 4,310,400 | |
Hotels, Restaurants & Leisure — 0.4% | | | | | | | | | | | | | | | | |
1011778 BC ULC/New Red Finance Inc., Senior Secured Notes | | | 4.250 | % | | | 5/15/24 | | | | 6,388,000 | | | | 6,475,835 | (a) |
GLP Capital LP/GLP Financing II Inc., Senior Notes | | | 5.250 | % | | | 6/1/25 | | | | 320,000 | | | | 343,648 | |
GLP Capital LP/GLP Financing II Inc., Senior Notes | | | 5.375 | % | | | 4/15/26 | | | | 4,009,000 | | | | 4,345,556 | |
Hilton Domestic Operating Co. Inc., Senior Notes | | | 5.125 | % | | | 5/1/26 | | | | 3,130,000 | | | | 3,274,763 | |
Hilton Worldwide Finance LLC/Hilton Worldwide Finance Corp., Senior Notes | | | 4.625 | % | | | 4/1/25 | | | | 605,000 | | | | 620,881 | |
Hilton Worldwide Finance LLC/Hilton Worldwide Finance Corp., Senior Notes | | | 4.875 | % | | | 4/1/27 | | | | 4,930,000 | | | | 5,113,396 | |
McDonald’s Corp., Senior Notes | | | 3.700 | % | | | 1/30/26 | | | | 10,820,000 | | | | 11,511,445 | |
McDonald’s Corp., Senior Notes | | | 3.500 | % | | | 3/1/27 | | | | 9,650,000 | | | | 10,143,002 | |
McDonald’s Corp., Senior Notes | | | 3.800 | % | | | 4/1/28 | | | | 4,300,000 | | | | 4,620,987 | |
NCL Corp. Ltd., Senior Notes | | | 4.750 | % | | | 12/15/21 | | | | 1,881,000 | | | | 1,911,566 | (a) |
Sands China Ltd., Senior Notes | | | 4.600 | % | | | 8/8/23 | | | | 18,048,000 | | | | 19,005,213 | |
Sands China Ltd., Senior Notes | | | 5.125 | % | | | 8/8/25 | | | | 17,040,000 | | | | 18,308,117 | |
Sands China Ltd., Senior Notes | | | 5.400 | % | | | 8/8/28 | | | | 6,900,000 | | | | 7,511,058 | |
VOC Escrow Ltd., Senior Secured Notes | | | 5.000 | % | | | 2/15/28 | | | | 9,225,000 | | | | 9,397,969 | (a) |
Total Hotels, Restaurants & Leisure | | | | | | | | | | | | 102,583,436 | |
Household Durables — 0.1% | | | | | | | | | | | | | | | | |
Lennar Corp., Senior Notes | | | 4.500 | % | | | 4/30/24 | | | | 5,640,000 | | | | 5,943,150 | |
Lennar Corp., Senior Notes | | | 4.750 | % | | | 5/30/25 | | | | 1,350,000 | | | | 1,436,063 | |
Lennar Corp., Senior Notes | | | 5.000 | % | | | 6/15/27 | | | | 820,000 | | | | 865,100 | |
Lennar Corp., Senior Notes | | | 4.750 | % | | | 11/29/27 | | | | 8,000,000 | | | | 8,460,000 | |
Newell Brands Inc., Senior Notes | | | 3.850 | % | | | 4/1/23 | | | | 3,320,000 | | | | 3,370,990 | |
See Notes to Financial Statements.
| | |
| | |
| Western Asset Core Plus Bond Fund 2019 Semi-Annual Report | | 11 |
Schedule of investments(unaudited) (cont’d)
June 30, 2019
Western Asset Core Plus Bond Fund
| | | | | | | | | | | | | | | | |
| Security | | Rate | | | Maturity
Date | | | Face
Amount† | | | Value | |
Household Durables — continued | | | | | | | | | | | | | | | | |
Newell Brands Inc., Senior Notes | | | 4.200 | % | | | 4/1/26 | | | | 5,000,000 | | | $ | 4,973,498 | |
Toll Brothers Finance Corp., Senior Notes | | | 4.375 | % | | | 4/15/23 | | | | 4,740,000 | | | | 4,923,675 | |
Total Household Durables | | | | 29,972,476 | |
Internet & Direct Marketing Retail — 0.2% | |
Amazon.com Inc., Senior Notes | | | 3.150 | % | | | 8/22/27 | | | | 15,280,000 | | | | 16,075,873 | |
Amazon.com Inc., Senior Notes | | | 3.875 | % | | | 8/22/37 | | | | 6,800,000 | | | | 7,509,038 | |
Amazon.com Inc., Senior Notes | | | 4.950 | % | | | 12/5/44 | | | | 10,095,000 | | | | 12,743,073 | |
Amazon.com Inc., Senior Notes | | | 4.050 | % | | | 8/22/47 | | | | 8,290,000 | | | | 9,426,562 | |
QVC Inc., Senior Secured Notes | | | 5.950 | % | | | 3/15/43 | | | | 500,000 | | | | 480,408 | |
Total Internet & Direct Marketing Retail | | | | 46,234,954 | |
Specialty Retail — 0.0% | |
TJX Cos. Inc., Senior Notes | | | 2.250 | % | | | 9/15/26 | | | | 1,520,000 | | | | 1,492,852 | |
Textiles, Apparel & Luxury Goods — 0.0% | |
Hanesbrands Inc., Senior Notes | | | 4.625 | % | | | 5/15/24 | | | | 1,177,000 | | | | 1,227,846 | (a) |
Hanesbrands Inc., Senior Notes | | | 4.875 | % | | | 5/15/26 | | | | 4,810,000 | | | | 5,013,896 | (a) |
Total Textiles, Apparel & Luxury Goods | | | | 6,241,742 | |
Total Consumer Discretionary | | | | 253,754,426 | |
| Consumer Staples — 2.6% | |
Beverages — 1.0% | |
Anheuser-Busch Cos. LLC/Anheuser-Busch InBev Worldwide Inc., Senior Notes | | | 3.650 | % | | | 2/1/26 | | | | 37,240,000 | | | | 39,188,250 | |
Anheuser-Busch Cos. LLC/Anheuser-Busch InBev Worldwide Inc., Senior Notes | | | 4.900 | % | | | 2/1/46 | | | | 22,020,000 | | | | 24,555,263 | |
Anheuser-Busch InBev Finance Inc., Senior Notes | | | 2.650 | % | | | 2/1/21 | | | | 5,177,000 | | | | 5,205,607 | |
Anheuser-Busch InBev Finance Inc., Senior Notes | | | 3.300 | % | | | 2/1/23 | | | | 17,698,000 | | | | 18,279,284 | |
Anheuser-Busch InBev Worldwide Inc., Senior Notes | | | 2.500 | % | | | 7/15/22 | | | | 18,900,000 | | | | 19,059,954 | |
Anheuser-Busch InBev Worldwide Inc., Senior Notes | | | 3.500 | % | | | 1/12/24 | | | | 15,450,000 | | | | 16,148,231 | |
Anheuser-Busch InBev Worldwide Inc., Senior Notes | | | 4.150 | % | | | 1/23/25 | | | | 13,410,000 | | | | 14,535,670 | |
Anheuser-Busch InBev Worldwide Inc., Senior Notes | | | 4.000 | % | | | 4/13/28 | | | | 9,240,000 | | | | 9,988,007 | |
Anheuser-Busch InBev Worldwide Inc., Senior Notes | | | 4.750 | % | | | 1/23/29 | | | | 52,920,000 | | | | 60,123,293 | |
See Notes to Financial Statements.
| | |
| | |
| 12 | | Western Asset Core Plus Bond Fund 2019 Semi-Annual Report |
Western Asset Core Plus Bond Fund
| | | | | | | | | | | | | | | | |
| Security | | Rate | | | Maturity
Date | | | Face
Amount† | | | Value | |
Beverages — continued | |
Anheuser-Busch InBev Worldwide Inc., Senior Notes | | | 5.550 | % | | | 1/23/49 | | | | 1,500,000 | | | $ | 1,840,874 | |
Constellation Brands Inc., Senior Notes | | | 4.250 | % | | | 5/1/23 | | | | 1,395,000 | | | | 1,485,316 | |
Cott Holdings Inc., Senior Notes | | | 5.500 | % | | | 4/1/25 | | | | 6,830,000 | | | | 6,983,675 | (a) |
Diageo Capital PLC, Senior Notes | | | 4.828 | % | | | 7/15/20 | | | | 620,000 | | | | 635,895 | |
Diageo Investment Corp., Senior Notes | | | 2.875 | % | | | 5/11/22 | | | | 15,570,000 | | | | 15,857,481 | |
Molson Coors Brewing Co., Senior Notes | | | 3.500 | % | | | 5/1/22 | | | | 1,370,000 | | | | 1,407,010 | |
Molson Coors Brewing Co., Senior Notes | | | 3.000 | % | | | 7/15/26 | | | | 3,245,000 | | | | 3,208,842 | |
Molson Coors Brewing Co., Senior Notes | | | 4.200 | % | | | 7/15/46 | | | | 3,390,000 | | | | 3,241,876 | |
PepsiCo Inc., Senior Notes | | | 4.000 | % | | | 3/5/42 | | | | 4,980,000 | | | | 5,424,403 | |
Pernod Ricard SA, Senior Notes | | | 4.450 | % | | | 1/15/22 | | | | 10,485,000 | | | | 10,975,512 | (a) |
Pernod Ricard SA, Senior Notes | | | 5.500 | % | | | 1/15/42 | | | | 4,170,000 | | | | 4,897,759 | (a) |
Total Beverages | | | | | | | | | | | | | | | 263,042,202 | |
Food & Staples Retailing — 0.2% | | | | | | | | | | | | | | | | |
CVS Pass-Through Trust, Secured Trust | | | 5.880 | % | | | 1/10/28 | | | | 3,329,691 | | | | 3,684,178 | |
CVS Pass-Through Trust, Secured Trust | | | 6.943 | % | | | 1/10/30 | | | | 2,145,219 | | | | 2,525,680 | |
CVS Pass-Through Trust, Senior Secured Trust | | | 5.298 | % | | | 1/11/27 | | | | 273,149 | | | | 285,021 | (a) |
CVS Pass-Through Trust, Senior Secured Trust | | | 6.036 | % | | | 12/10/28 | | | | 8,978,886 | | | | 10,059,755 | |
Kroger Co. (The), Senior Notes | | | 5.150 | % | | | 8/1/43 | | | | 780,000 | | | | 828,872 | |
Walgreens Boots Alliance Inc., Senior Notes | | | 3.450 | % | | | 6/1/26 | | | | 12,000,000 | | | | 12,124,421 | |
Walmart Inc., Senior Notes | | | 3.700 | % | | | 6/26/28 | | | | 25,130,000 | | | | 27,446,062 | |
Total Food & Staples Retailing | | | | | | | | | | | | | | | 56,953,989 | |
Food Products — 0.4% | | | | | | | | | | | | | | | | |
Danone SA, Senior Notes | | | 2.077 | % | | | 11/2/21 | | | | 15,860,000 | | | | 15,762,314 | (a) |
Danone SA, Senior Notes | | | 2.589 | % | | | 11/2/23 | | | | 20,650,000 | | | | 20,765,568 | (a) |
Danone SA, Senior Notes | | | 2.947 | % | | | 11/2/26 | | | | 6,540,000 | | | | 6,533,523 | (a) |
Kraft Heinz Foods Co., Secured Notes | | | 4.875 | % | | | 2/15/25 | | | | 2,963,000 | | | | 3,056,526 | (a) |
Kraft Heinz Foods Co., Senior Notes | | | 5.375 | % | | | 2/10/20 | | | | 9,526,000 | | | | 9,684,524 | |
Kraft Heinz Foods Co., Senior Notes | | | 3.500 | % | | | 6/6/22 | | | | 190,000 | | | | 195,127 | |
See Notes to Financial Statements.
| | |
| | |
| Western Asset Core Plus Bond Fund 2019 Semi-Annual Report | | 13 |
Schedule of investments(unaudited) (cont’d)
June 30, 2019
Western Asset Core Plus Bond Fund
| | | | | | | | | | | | | | | | |
| Security | | Rate | | | Maturity
Date | | | Face
Amount† | | | Value | |
Food Products — continued | | | | | | | | | | | | | | | | |
Kraft Heinz Foods Co., Senior Notes | | | 3.500 | % | | | 7/15/22 | | | | 2,310,000 | | | $ | 2,365,258 | |
Kraft Heinz Foods Co., Senior Notes | | | 4.000 | % | | | 6/15/23 | | | | 690,000 | | | | 723,416 | |
Kraft Heinz Foods Co., Senior Notes | | | 3.950 | % | | | 7/15/25 | | | | 4,916,000 | | | | 5,120,764 | |
Kraft Heinz Foods Co., Senior Notes | | | 3.000 | % | | | 6/1/26 | | | | 4,593,000 | | | | 4,473,396 | |
Kraft Heinz Foods Co., Senior Notes | | | 5.000 | % | | | 7/15/35 | | | | 4,610,000 | | | | 4,843,330 | |
Lamb Weston Holdings Inc., Senior Notes | | | 4.625 | % | | | 11/1/24 | | | | 30,000 | | | | 31,238 | (a) |
Lamb Weston Holdings Inc., Senior Notes | | | 4.875 | % | | | 11/1/26 | | | | 6,470,000 | | | | 6,761,150 | (a) |
Mars Inc., Senior Notes | | | 2.700 | % | | | 4/1/25 | | | | 9,380,000 | | | | 9,577,570 | (a) |
Mars Inc., Senior Notes | | | 3.200 | % | | | 4/1/30 | | | | 4,880,000 | | | | 5,075,156 | (a) |
WM Wrigley Jr. Co., Senior Notes | | | 2.900 | % | | | 10/21/19 | | | | 7,490,000 | | | | 7,496,625 | (a) |
WM Wrigley Jr. Co., Senior Notes | | | 3.375 | % | | | 10/21/20 | | | | 690,000 | | | | 699,572 | (a) |
Total Food Products | | | | | | | | | | | | | | | 103,165,057 | |
Household Products — 0.0% | | | | | | | | | | | | | | | | |
Spectrum Brands Inc., Senior Notes | | | 5.750 | % | | | 7/15/25 | | | | 7,400,000 | | | | 7,723,750 | |
Tobacco — 1.0% | | | | | | | | | | | | | | | | |
Altria Group Inc., Senior Notes | | | 9.250 | % | | | 8/6/19 | | | | 11,710,000 | | | | 11,783,710 | |
Altria Group Inc., Senior Notes | | | 4.750 | % | | | 5/5/21 | | | | 11,110,000 | | | | 11,578,860 | |
Altria Group Inc., Senior Notes | | | 3.490 | % | | | 2/14/22 | | | | 5,980,000 | | | | 6,152,181 | |
Altria Group Inc., Senior Notes | | | 2.850 | % | | | 8/9/22 | | | | 5,100,000 | | | | 5,155,853 | |
Altria Group Inc., Senior Notes | | | 3.800 | % | | | 2/14/24 | | | | 8,880,000 | | | | 9,263,034 | |
Altria Group Inc., Senior Notes | | | 4.400 | % | | | 2/14/26 | | | | 32,230,000 | | | | 34,514,896 | |
Altria Group Inc., Senior Notes | | | 4.800 | % | | | 2/14/29 | | | | 26,770,000 | | | | 28,822,963 | |
Altria Group Inc., Senior Notes | | | 5.800 | % | | | 2/14/39 | | | | 15,190,000 | | | | 17,097,659 | |
Altria Group Inc., Senior Notes | | | 5.950 | % | | | 2/14/49 | | | | 12,010,000 | | | | 13,727,354 | |
Altria Group Inc., Senior Notes | | | 6.200 | % | | | 2/14/59 | | | | 4,650,000 | | | | 5,307,306 | |
BAT Capital Corp., Senior Notes | | | 3.557 | % | | | 8/15/27 | | | | 15,851,000 | | | | 15,782,506 | |
BAT Capital Corp., Senior Notes | | | 4.540 | % | | | 8/15/47 | | | | 43,950,000 | | | | 40,834,984 | |
Philip Morris International Inc., Senior Notes | | | 1.875 | % | | | 11/1/19 | | | | 23,600,000 | | | | 23,557,537 | |
Philip Morris International Inc., Senior Notes | | | 2.900 | % | | | 11/15/21 | | | | 12,470,000 | | | | 12,657,418 | |
Philip Morris International Inc., Senior Notes | | | 2.500 | % | | | 8/22/22 | | | | 4,200,000 | | | | 4,217,891 | |
Philip Morris International Inc., Senior Notes | | | 2.500 | % | | | 11/2/22 | | | | 14,810,000 | | | | 14,875,933 | |
Philip Morris International Inc., Senior Notes | | | 4.500 | % | | | 3/20/42 | | | | 3,085,000 | | | | 3,328,461 | |
See Notes to Financial Statements.
| | |
| | |
| 14 | | Western Asset Core Plus Bond Fund 2019 Semi-Annual Report |
Western Asset Core Plus Bond Fund
| | | | | | | | | | | | | | | | |
| Security | | Rate | | | Maturity
Date | | | Face
Amount† | | | Value | |
Tobacco — continued | | | | | | | | | | | | | | | | |
Reynolds American Inc., Senior Notes | | | 3.250 | % | | | 6/12/20 | | | | 3,842,000 | | | $ | 3,868,747 | |
Reynolds American Inc., Senior Notes | | | 5.850 | % | | | 8/15/45 | | | | 7,579,000 | | | | 8,174,935 | |
Total Tobacco | | | | | | | | | | | | | | | 270,702,228 | |
Total Consumer Staples | | | | | | | | | | | | | | | 701,587,226 | |
| Energy — 4.5% | | | | | | | | | | | | | | | | |
Energy Equipment & Services — 0.1% | | | | | | | | | | | | | | | | |
Baker Hughes a GE Co. LLC, Senior Notes | | | 3.200 | % | | | 8/15/21 | | | | 2,487,000 | | | | 2,521,091 | |
Halliburton Co., Senior Notes | | | 3.800 | % | | | 11/15/25 | | | | 13,610,000 | | | | 14,281,802 | |
Halliburton Co., Senior Notes | | | 4.850 | % | | | 11/15/35 | | | | 5,440,000 | | | | 5,810,104 | |
Halliburton Co., Senior Notes | | | 5.000 | % | | | 11/15/45 | | | | 8,510,000 | | | | 9,298,648 | |
Schlumberger Norge AS, Senior Notes | | | 4.200 | % | | | 1/15/21 | | | | 720,000 | | | | 736,361 | (a) |
Total Energy Equipment & Services | | | | | | | | | | | | 32,648,006 | |
Oil, Gas & Consumable Fuels — 4.4% | | | | | | | | | | | | | | | | |
Anadarko Finance Co., Senior Notes | | | 7.500 | % | | | 5/1/31 | | | | 6,470,000 | | | | 8,586,665 | |
Anadarko Petroleum Corp., Senior Notes | | | 4.850 | % | | | 3/15/21 | | | | 12,852,000 | | | | 13,308,118 | |
Anadarko Petroleum Corp., Senior Notes | | | 5.550 | % | | | 3/15/26 | | | | 2,360,000 | | | | 2,654,319 | |
Anadarko Petroleum Corp., Senior Notes | | | 6.450 | % | | | 9/15/36 | | | | 20,822,000 | | | | 25,633,484 | |
Anadarko Petroleum Corp., Senior Notes | | | 4.500 | % | | | 7/15/44 | | | | 1,880,000 | | | | 1,928,547 | |
Anadarko Petroleum Corp., Senior Notes | | | 6.600 | % | | | 3/15/46 | | | | 13,540,000 | | | | 17,653,442 | |
Antero Resources Corp., Senior Notes | | | 5.375 | % | | | 11/1/21 | | | | 6,584,000 | | | | 6,526,390 | |
Apache Corp., Senior Notes | | | 3.250 | % | | | 4/15/22 | | | | 2,526,000 | | | | 2,564,400 | |
Apache Corp., Senior Notes | | | 4.375 | % | | | 10/15/28 | | | | 2,060,000 | | | | 2,154,580 | |
Apache Corp., Senior Notes | | | 6.000 | % | | | 1/15/37 | | | | 1,006,000 | | | | 1,143,669 | |
Apache Corp., Senior Notes | | | 5.100 | % | | | 9/1/40 | | | | 15,199,000 | | | | 15,390,183 | |
Apache Corp., Senior Notes | | | 4.750 | % | | | 4/15/43 | | | | 5,980,000 | | | | 5,843,423 | |
Apache Corp., Senior Notes | | | 4.250 | % | | | 1/15/44 | | | | 18,548,000 | | | | 16,808,713 | |
Blue Racer Midstream LLC/Blue Racer Finance Corp., Senior Notes | | | 6.125 | % | | | 11/15/22 | | | | 5,520,000 | | | | 5,623,500 | (a) |
BP Capital Markets America Inc., Senior Notes | | | 3.216 | % | | | 11/28/23 | | | | 16,310,000 | | | | 16,835,332 | |
See Notes to Financial Statements.
| | |
| | |
| Western Asset Core Plus Bond Fund 2019 Semi-Annual Report | | 15 |
Schedule of investments(unaudited) (cont’d)
June 30, 2019
Western Asset Core Plus Bond Fund
| | | | | | | | | | | | | | | | |
| Security | | Rate | | | Maturity
Date | | | Face
Amount† | | | Value | |
Oil, Gas & Consumable Fuels — continued | | | | | | | | | | | | | | | | |
BP Capital Markets America Inc., Senior Notes | | | 3.119 | % | | | 5/4/26 | | | | 4,790,000 | | | $ | 4,885,293 | |
BP Capital Markets America Inc., Senior Notes | | | 3.588 | % | | | 4/14/27 | | | | 7,160,000 | | | | 7,521,837 | |
BP Capital Markets America Inc., Senior Notes | | | 3.410 | % | | | 2/11/26 | | | | 17,380,000 | | | | 18,229,280 | |
BP Capital Markets PLC, Senior Notes | | | 3.561 | % | | | 11/1/21 | | | | 510,000 | | | | 526,575 | |
BP Capital Markets PLC, Senior Notes | | | 3.245 | % | | | 5/6/22 | | | | 1,650,000 | | | | 1,699,491 | |
BP Capital Markets PLC, Senior Notes | | | 3.535 | % | | | 11/4/24 | | | | 2,390,000 | | | | 2,522,826 | |
BP Capital Markets PLC, Senior Notes | | | 3.506 | % | | | 3/17/25 | | | | 21,110,000 | | | | 22,222,533 | |
Cheniere Corpus Christi Holdings LLC, Senior Secured Notes | | | 5.125 | % | | | 6/30/27 | | | | 3,080,000 | | | | 3,353,350 | |
Chesapeake Energy Corp., Senior Notes | | | 6.625 | % | | | 8/15/20 | | | | 1,091,000 | | | | 1,104,638 | |
Chesapeake Energy Corp., Senior Notes | | | 6.875 | % | | | 11/15/20 | | | | 5,000 | | | | 5,075 | |
Chesapeake Energy Corp., Senior Notes | | | 6.125 | % | | | 2/15/21 | | | | 7,301,000 | | | | 7,447,020 | |
Chesapeake Energy Corp., Senior Notes | | | 8.000 | % | | | 6/15/27 | | | | 2,510,000 | | | | 2,224,488 | |
Chevron Corp., Senior Notes | | | 2.954 | % | | | 5/16/26 | | | | 12,640,000 | | | | 13,056,270 | |
Cimarex Energy Co., Senior Notes | | | 3.900 | % | | | 5/15/27 | | | | 17,516,000 | | | | 18,015,493 | |
CNOOC Finance 2015 USA LLC, Senior Notes | | | 3.500 | % | | | 5/5/25 | | | | 35,600,000 | | | | 36,733,711 | |
Concho Resources Inc., Senior Notes | | | 4.375 | % | | | 1/15/25 | | | | 6,173,000 | | | | 6,417,852 | |
Concho Resources Inc., Senior Notes | | | 4.300 | % | | | 8/15/28 | | | | 14,428,000 | | | | 15,548,839 | |
Conoco Funding Co., Senior Notes | | | 7.250 | % | | | 10/15/31 | | | | 810,000 | | | | 1,140,912 | |
ConocoPhillips, Senior Notes | | | 5.900 | % | | | 10/15/32 | | | | 10,000 | | | | 13,049 | |
ConocoPhillips, Senior Notes | | | 6.500 | % | | | 2/1/39 | | | | 40,000 | | | | 56,244 | |
ConocoPhillips Holding Co., Senior Notes | | | 6.950 | % | | | 4/15/29 | | | | 693,000 | | | | 932,454 | |
Continental Resources Inc., Senior Notes | | | 4.500 | % | | | 4/15/23 | | | | 7,040,000 | | | | 7,402,842 | |
Continental Resources Inc., Senior Notes | | | 3.800 | % | | | 6/1/24 | | | | 4,270,000 | | | | 4,395,040 | |
See Notes to Financial Statements.
| | |
| | |
| 16 | | Western Asset Core Plus Bond Fund 2019 Semi-Annual Report |
Western Asset Core Plus Bond Fund
| | | | | | | | | | | | | | | | |
| Security | | Rate | | | Maturity
Date | | | Face
Amount† | | | Value | |
Oil, Gas & Consumable Fuels — continued | | | | | | | | | | | | | | | | |
Continental Resources Inc., Senior Notes | | | 4.375 | % | | | 1/15/28 | | | | 7,940,000 | | | $ | 8,363,188 | |
Devon Energy Corp., Senior Notes | | | 3.250 | % | | | 5/15/22 | | | | 5,750,000 | | | | 5,860,670 | |
Devon Energy Corp., Senior Notes | | | 5.850 | % | | | 12/15/25 | | | | 13,826,000 | | | | 16,391,820 | |
Devon Energy Corp., Senior Notes | | | 5.600 | % | | | 7/15/41 | | | | 9,920,000 | | | | 11,795,011 | |
Devon Energy Corp., Senior Notes | | | 4.750 | % | | | 5/15/42 | | | | 410,000 | | | | 449,799 | |
Devon Energy Corp., Senior Notes | | | 5.000 | % | | | 6/15/45 | | | | 24,090,000 | | | | 27,676,875 | |
Diamondback Energy Inc., Senior Notes | | | 5.375 | % | | | 5/31/25 | | | | 4,420,000 | | | | 4,657,575 | |
Ecopetrol SA, Senior Notes | | | 5.875 | % | | | 5/28/45 | | | | 27,530,000 | | | | 30,548,664 | |
Energy Transfer Operating LP, Senior Notes | | | 4.500 | % | | | 4/15/24 | | | | 16,930,000 | | | | 18,027,431 | |
Energy Transfer Operating LP, Senior Notes | | | 4.950 | % | | | 6/15/28 | | | | 3,015,000 | | | | 3,299,175 | |
Energy Transfer Operating LP, Senior Notes | | | 5.250 | % | | | 4/15/29 | | | | 6,950,000 | | | | 7,772,045 | |
Energy Transfer Operating LP, Senior Notes | | | 6.250 | % | | | 4/15/49 | | | | 1,330,000 | | | | 1,578,035 | |
Energy Transfer Partners LP/Regency Energy Finance Corp., Senior Notes | | | 5.875 | % | | | 3/1/22 | | | | 5,781,000 | | | | 6,203,345 | |
Energy Transfer Partners LP/Regency Energy Finance Corp., Senior Notes | | | 4.500 | % | | | 11/1/23 | | | | 510,000 | | | | 539,097 | |
Enterprise Products Operating LLC, Senior Notes | | | 4.150 | % | | | 10/16/28 | | | | 19,083,000 | | | | 20,788,659 | |
EOG Resources Inc., Senior Notes | | | 4.150 | % | | | 1/15/26 | | | | 5,682,000 | | | | 6,192,129 | |
Exxon Mobil Corp., Senior Notes | | | 3.043 | % | | | 3/1/26 | | | | 11,540,000 | | | | 11,969,802 | |
Exxon Mobil Corp., Senior Notes | | | 4.114 | % | | | 3/1/46 | | | | 22,720,000 | | | | 26,179,722 | |
KazMunayGas National Co. JSC, Senior Notes | | | 5.375 | % | | | 4/24/30 | | | | 2,050,000 | | | | 2,276,170 | (a) |
KazMunayGas National Co. JSC, Senior Notes | | | 6.375 | % | | | 10/24/48 | | | | 7,310,000 | | | | 8,731,795 | (a) |
Kerr-McGee Corp., Senior Notes | | | 6.950 | % | | | 7/1/24 | | | | 3,151,000 | | | | 3,695,053 | |
Kerr-McGee Corp., Senior Notes | | | 7.875 | % | | | 9/15/31 | | | | 2,087,000 | | | | 2,858,629 | |
Kinder Morgan Energy Partners LP, Senior Notes | | | 3.500 | % | | | 3/1/21 | | | | 4,510,000 | | | | 4,581,500 | |
Kinder Morgan Energy Partners LP, Senior Notes | | | 3.950 | % | | | 9/1/22 | | | | 12,600,000 | | | | 13,121,779 | |
Kinder Morgan Inc., Senior Notes | | | 4.300 | % | | | 3/1/28 | | | | 16,590,000 | | | | 17,796,517 | |
See Notes to Financial Statements.
| | |
| | |
| Western Asset Core Plus Bond Fund 2019 Semi-Annual Report | | 17 |
Schedule of investments(unaudited) (cont’d)
June 30, 2019
Western Asset Core Plus Bond Fund
| | | | | | | | | | | | | | | | |
| Security | | Rate | | | Maturity
Date | | | Face
Amount† | | | Value | |
Oil, Gas & Consumable Fuels — continued | | | | | | | | | | | | | | | | |
Kinder Morgan Inc., Senior Notes | | | 7.800 | % | | | 8/1/31 | | | | 3,276,000 | | | $ | 4,408,949 | |
MEG Energy Corp., Secured Notes | | | 6.500 | % | | | 1/15/25 | | | | 680,000 | | | | 685,950 | (a) |
MEG Energy Corp., Senior Notes | | | 6.375 | % | | | 1/30/23 | | | | 350,000 | | | | 334,688 | (a) |
MEG Energy Corp., Senior Notes | | | 7.000 | % | | | 3/31/24 | | | | 960,000 | | | | 916,800 | (a) |
MPLX LP, Senior Notes | | | 4.875 | % | | | 12/1/24 | | | | 9,800,000 | | | | 10,667,612 | |
MPLX LP, Senior Notes | | | 4.875 | % | | | 6/1/25 | | | | 7,870,000 | | | | 8,559,879 | |
MPLX LP, Senior Notes | | | 4.800 | % | | | 2/15/29 | | | | 8,850,000 | | | | 9,755,568 | |
MPLX LP, Senior Notes | | | 4.500 | % | | | 4/15/38 | | | | 11,800,000 | | | | 11,933,353 | |
MPLX LP, Senior Notes | | | 4.700 | % | | | 4/15/48 | | | | 22,620,000 | | | | 23,202,080 | |
MPLX LP, Senior Notes | | | 5.500 | % | | | 2/15/49 | | | | 9,296,000 | | | | 10,573,543 | |
Noble Energy Inc., Senior Notes | | | 4.150 | % | | | 12/15/21 | | | | 10,000 | | | | 10,323 | |
Noble Energy Inc., Senior Notes | | | 3.850 | % | | | 1/15/28 | | | | 12,560,000 | | | | 12,818,709 | |
Noble Energy Inc., Senior Notes | | | 5.250 | % | | | 11/15/43 | | | | 6,205,000 | | | | 6,695,810 | |
Noble Energy Inc., Senior Notes | | | 5.050 | % | | | 11/15/44 | | | | 1,741,000 | | | | 1,854,733 | |
Noble Energy Inc., Senior Notes | | | 4.950 | % | | | 8/15/47 | | | | 4,490,000 | | | | 4,771,728 | |
Oasis Petroleum Inc., Senior Notes | | | 6.875 | % | | | 3/15/22 | | | | 4,227,000 | | | | 4,227,000 | |
Oasis Petroleum Inc., Senior Notes | | | 6.875 | % | | | 1/15/23 | | | | 1,860,000 | | | | 1,864,650 | |
Occidental Petroleum Corp., Senior Notes | | | 3.125 | % | | | 2/15/22 | | | | 5,170,000 | | | | 5,251,802 | |
Occidental Petroleum Corp., Senior Notes | | | 3.400 | % | | | 4/15/26 | | | | 9,455,000 | | | | 9,640,495 | |
Occidental Petroleum Corp., Senior Notes | | | 3.000 | % | | | 2/15/27 | | | | 7,460,000 | | | | 7,381,129 | |
Occidental Petroleum Corp., Senior Notes | | | 4.625 | % | | | 6/15/45 | | | | 5,705,000 | | | | 6,094,143 | |
Occidental Petroleum Corp., Senior Notes | | | 4.400 | % | | | 4/15/46 | | | | 2,710,000 | | | | 2,807,705 | |
Occidental Petroleum Corp., Senior Notes | | | 4.100 | % | | | 2/15/47 | | | | 12,890,000 | | | | 12,749,321 | |
Occidental Petroleum Corp., Senior Notes | | | 4.200 | % | | | 3/15/48 | | | | 7,630,000 | | | | 7,723,463 | |
Petrobras Global Finance BV, Senior Notes | | | 6.125 | % | | | 1/17/22 | | | | 3,125,000 | | | | 3,355,125 | |
Petrobras Global Finance BV, Senior Notes | | | 6.250 | % | | | 3/17/24 | | | | 14,259,000 | | | | 15,649,965 | |
Petrobras Global Finance BV, Senior Notes | | | 5.299 | % | | | 1/27/25 | | | | 92,550,000 | | | | 98,426,925 | |
Petrobras Global Finance BV, Senior Notes | | | 7.375 | % | | | 1/17/27 | | | | 7,710,000 | | | | 8,835,660 | |
See Notes to Financial Statements.
| | |
| | |
| 18 | | Western Asset Core Plus Bond Fund 2019 Semi-Annual Report |
Western Asset Core Plus Bond Fund
| | | | | | | | | | | | | | | | |
| Security | | Rate | | | Maturity
Date | | | Face
Amount† | | | Value | |
Oil, Gas & Consumable Fuels — continued | | | | | | | | | | | | | | | | |
Petrobras Global Finance BV, Senior Notes | | | 5.750 | % | | | 2/1/29 | | | | 16,560,000 | | | $ | 17,303,544 | |
Petrobras Global Finance BV, Senior Notes | | | 7.250 | % | | | 3/17/44 | | | | 23,200,000 | | | | 26,007,432 | |
Petroleos Mexicanos, Senior Notes | | | 6.875 | % | | | 8/4/26 | | | | 4,350,000 | | | | 4,414,815 | |
Petroleos Mexicanos, Senior Notes | | | 6.625 | % | | | 6/15/35 | | | | 14,490,000 | | | | 13,457,587 | |
Petroleos Mexicanos, Senior Notes | | | 5.500 | % | | | 6/27/44 | | | | 3,860,000 | | | | 3,100,545 | |
Petroleos Mexicanos, Senior Notes | | | 6.375 | % | | | 1/23/45 | | | | 14,210,000 | | | | 12,273,888 | |
QEP Resources Inc., Senior Notes | | | 6.875 | % | | | 3/1/21 | | | | 2,920,000 | | | | 3,014,900 | |
Range Resources Corp., Senior Notes | | | 5.875 | % | | | 7/1/22 | | | | 1,440,000 | | | | 1,432,800 | |
Range Resources Corp., Senior Notes | | | 5.000 | % | | | 3/15/23 | | | | 8,140,000 | | | | 7,702,475 | |
Range Resources Corp., Senior Notes | | | 4.875 | % | | | 5/15/25 | | | | 4,010,000 | | | | 3,538,825 | |
Sabine Pass Liquefaction LLC, Senior Secured Notes | | | 5.750 | % | | | 5/15/24 | | | | 2,870,000 | | | | 3,193,663 | |
Schlumberger Holdings Corp., Senior Notes | | | 4.000 | % | | | 12/21/25 | | | | 7,580,000 | | | | 8,029,849 | (a) |
Schlumberger Holdings Corp., Senior Notes | | | 3.900 | % | | | 5/17/28 | | | | 10,996,000 | | | | 11,453,068 | (a) |
Shell International Finance BV, Senior Notes | | | 4.375 | % | | | 3/25/20 | | | | 1,980,000 | | | | 2,010,244 | |
Shell International Finance BV, Senior Notes | | | 2.875 | % | | | 5/10/26 | | | | 5,450,000 | | | | 5,577,883 | |
Shell International Finance BV, Senior Notes | | | 6.375 | % | | | 12/15/38 | | | | 4,655,000 | | | | 6,559,808 | |
Shell International Finance BV, Senior Notes | | | 4.550 | % | | | 8/12/43 | | | | 6,360,000 | | | | 7,459,897 | |
Shell International Finance BV, Senior Notes | | | 4.375 | % | | | 5/11/45 | | | | 13,770,000 | | | | 15,873,821 | |
Shell International Finance BV, Senior Notes | | | 4.000 | % | | | 5/10/46 | | | | 20,780,000 | | | | 22,905,207 | |
Shell International Finance BV, Senior Notes | | | 3.750 | % | | | 9/12/46 | | | | 690,000 | | | | 731,663 | |
Sinopec Group Overseas Development 2014 Ltd., Senior Notes | | | 4.375 | % | | | 4/10/24 | | | | 17,660,000 | | | | 18,903,608 | (a) |
Southern Natural Gas Co. LLC, Senior Notes | | | 8.000 | % | | | 3/1/32 | | | | 9,413,000 | | | | 13,177,531 | |
See Notes to Financial Statements.
| | |
| | |
| Western Asset Core Plus Bond Fund 2019 Semi-Annual Report | | 19 |
Schedule of investments(unaudited) (cont’d)
June 30, 2019
Western Asset Core Plus Bond Fund
| | | | | | | | | | | | | | | | |
| Security | | Rate | | | Maturity
Date | | | Face
Amount† | | | Value | |
Oil, Gas & Consumable Fuels — continued | | | | | | | | | | | | | | | | |
Targa Resources Partners LP/Targa Resources Partners Finance Corp., Senior Notes | | | 4.250 | % | | | 11/15/23 | | | | 3,510,000 | | | $ | 3,523,163 | |
Targa Resources Partners LP/Targa Resources Partners Finance Corp., Senior Notes | | | 5.875 | % | | | 4/15/26 | | | | 3,145,000 | | | | 3,345,494 | |
Targa Resources Partners LP/Targa Resources Partners Finance Corp., Senior Notes | | | 6.500 | % | | | 7/15/27 | | | | 4,230,000 | | | | 4,626,563 | (a) |
Targa Resources Partners LP/Targa Resources Partners Finance Corp., Senior Notes | | | 6.875 | % | | | 1/15/29 | | | | 5,300,000 | | | | 5,889,307 | (a) |
Transcontinental Gas Pipe Line Co. LLC, Senior Notes | | | 7.850 | % | | | 2/1/26 | | | | 35,460,000 | | | | 45,304,796 | |
Whiting Petroleum Corp., Senior Notes | | | 5.750 | % | | | 3/15/21 | | | | 5,450,000 | | | | 5,511,313 | |
Williams Cos. Inc., Senior Notes | | | 5.250 | % | | | 3/15/20 | | | | 4,750,000 | | | | 4,838,781 | |
Williams Cos. Inc., Senior Notes | | | 7.875 | % | | | 9/1/21 | | | | 7,903,000 | | | | 8,769,887 | |
Williams Cos. Inc., Senior Notes | | | 3.700 | % | | | 1/15/23 | | | | 3,960,000 | | | | 4,095,392 | |
Williams Cos. Inc., Senior Notes | | | 4.550 | % | | | 6/24/24 | | | | 1,790,000 | | | | 1,930,036 | |
Williams Cos. Inc., Senior Notes | | | 7.500 | % | | | 1/15/31 | | | | 4,249,000 | | | | 5,501,547 | |
Williams Cos. Inc., Senior Notes | | | 7.750 | % | | | 6/15/31 | | | | 6,418,000 | | | | 8,467,858 | |
Williams Cos. Inc., Senior Notes | | | 8.750 | % | | | 3/15/32 | | | | 3,035,000 | | | | 4,322,646 | |
Williams Cos. Inc., Senior Notes | | | 5.750 | % | | | 6/24/44 | | | | 900,000 | | | | 1,051,840 | |
WPX Energy Inc., Senior Notes | | | 6.000 | % | | | 1/15/22 | | | | 270,000 | | | | 282,825 | |
WPX Energy Inc., Senior Notes | | | 8.250 | % | | | 8/1/23 | | | | 1,440,000 | | | | 1,648,800 | |
Total Oil, Gas & Consumable Fuels | | | | 1,187,894,771 | |
Total Energy | | | | 1,220,542,777 | |
| Financials — 11.4% | | | | | | | | | | | | | | | | |
Banks — 8.3% | | | | | | | | | | | | | | | | |
ABN AMRO Bank NV, Senior Notes | | | 2.450 | % | | | 6/4/20 | | | | 4,912,000 | | | | 4,916,208 | (a) |
ABN AMRO Bank NV, Subordinated Notes | | | 4.750 | % | | | 7/28/25 | | | | 8,210,000 | | | | 8,817,885 | (a) |
BAC Capital Trust XIV, Junior Subordinated Notes (the greater of 3 mo. USD LIBOR + 0.400% or 4.000%) | | | 4.000 | % | | | 7/15/19 | | | | 12,050,000 | | | | 10,019,816 | (b)(c) |
Banco Santander SA, Senior Notes | | | 3.848 | % | | | 4/12/23 | | | | 8,600,000 | | | | 8,933,769 | |
Banco Santander SA, Senior Notes | | | 4.379 | % | | | 4/12/28 | | | | 32,000,000 | | | | 34,084,707 | |
Banco Santander SA, Senior Notes (3 mo. USD LIBOR + 1.120%) | | | 3.724 | % | | | 4/12/23 | | | | 6,200,000 | | | | 6,178,280 | (c) |
See Notes to Financial Statements.
| | |
| | |
| 20 | | Western Asset Core Plus Bond Fund 2019 Semi-Annual Report |
Western Asset Core Plus Bond Fund
| | | | | | | | | | | | | | | | |
| Security | | Rate | | | Maturity
Date | | | Face
Amount† | | | Value | |
Banks — continued | | | | | | | | | | | | | | | | |
Bank of America Corp., Junior Subordinated Notes (6.100% to 3/17/25 then 3 mo. USD LIBOR + 3.898%) | | | 6.100 | % | | | 3/17/25 | | | | 7,780,000 | | | $ | 8,407,963 | (b)(c) |
Bank of America Corp., Junior Subordinated Notes (6.250% to 9/5/24 then 3 mo. USD LIBOR + 3.705%) | | | 6.250 | % | | | 9/5/24 | | | | 4,090,000 | | | | 4,458,857 | (b)(c) |
Bank of America Corp., Senior Notes | | | 3.300 | % | | | 1/11/23 | | | | 28,960,000 | | | | 29,871,618 | |
Bank of America Corp., Senior Notes | | | 4.125 | % | | | 1/22/24 | | | | 230,000 | | | | 246,156 | |
Bank of America Corp., Senior Notes | | | 4.000 | % | | | 4/1/24 | | | | 13,890,000 | | | | 14,811,328 | |
Bank of America Corp., Senior Notes | | | 3.500 | % | | | 4/19/26 | | | | 16,160,000 | | | | 16,936,792 | |
Bank of America Corp., Senior Notes | | | 5.000 | % | | | 1/21/44 | | | | 39,300,000 | | | | 47,968,263 | |
Bank of America Corp., Senior Notes (3.004% to 12/20/22 then 3 mo. USD LIBOR + 0.790%) | | | 3.004 | % | | | 12/20/23 | | | | 39,972,000 | | | | 40,728,006 | (c) |
Bank of America Corp., Senior Notes (3.419% to 12/20/27 then 3 mo. USD LIBOR + 1.040%) | | | 3.419 | % | | | 12/20/28 | | | | 27,181,000 | | | | 27,992,728 | (c) |
Bank of America Corp., Senior Notes (3.550% to 3/5/23 then 3 mo. USD LIBOR + 0.780%) | | | 3.550 | % | | | 3/5/24 | | | | 20,980,000 | | | | 21,761,501 | (c) |
Bank of America Corp., Senior Notes (3.593% to 7/21/27 then 3 mo. USD LIBOR + 1.370%) | | | 3.593 | % | | | 7/21/28 | | | | 7,230,000 | | | | 7,544,420 | (c) |
Bank of America Corp., Senior Notes (3.970% to 3/5/28 then 3 mo. USD LIBOR + 1.070%) | | | 3.970 | % | | | 3/5/29 | | | | 85,750,000 | | | | 91,724,717 | (c) |
Bank of America Corp., Senior Notes (3.974% to 2/7/29 then 3 mo. USD LIBOR + 1.210%) | | | 3.974 | % | | | 2/7/30 | | | | 8,130,000 | | | | 8,721,547 | (c) |
Bank of America Corp., Senior Notes (4.330% to 3/15/49 then 3 mo. USD LIBOR + 1.520%) | | | 4.330 | % | | | 3/15/50 | | | | 9,040,000 | | | | 10,093,106 | (c) |
Bank of America Corp., Subordinated Notes | | | 4.200 | % | | | 8/26/24 | | | | 14,080,000 | | | | 14,977,123 | |
Bank of America Corp., Subordinated Notes | | | 4.000 | % | | | 1/22/25 | | | | 4,300,000 | | | | 4,525,923 | |
See Notes to Financial Statements.
| | |
| | |
| Western Asset Core Plus Bond Fund 2019 Semi-Annual Report | | 21 |
Schedule of investments(unaudited) (cont’d)
June 30, 2019
Western Asset Core Plus Bond Fund
| | | | | | | | | | | | | | | | |
| Security | | Rate | | | Maturity
Date | | | Face
Amount† | | | Value | |
Banks — continued | | | | | | | | | | | | | | | | |
Bank of America Corp., Subordinated Notes | | | 4.450 | % | | | 3/3/26 | | | | 3,050,000 | | | $ | 3,292,530 | |
Bank of America Corp., Subordinated Notes | | | 4.250 | % | | | 10/22/26 | | | | 12,000,000 | | | | 12,831,473 | |
Bank of Montreal, Subordinated Notes (3.803% to 12/15/27 then USD 5 year ICE Swap Rate + 1.432%) | | | 3.803 | % | | | 12/15/32 | | | | 3,780,000 | | | | 3,836,738 | (c) |
Banque Federative du Credit Mutuel SA, Senior Notes | | | 2.200 | % | | | 7/20/20 | | | | 5,000,000 | | | | 4,994,867 | (a) |
Barclays PLC, Senior Notes (4.972% to 5/16/28 then 3 mo. USD LIBOR + 1.902%) | | | 4.972 | % | | | 5/16/29 | | | | 10,900,000 | | | | 11,634,950 | (c) |
Barclays PLC, Subordinated Notes (5.088% to 6/20/29 then 3 mo. USD LIBOR + 3.054%) | | | 5.088 | % | | | 6/20/30 | | | | 42,220,000 | | | | 43,230,984 | (c) |
BNP Paribas SA, Senior Notes | | | 3.375 | % | | | 1/9/25 | | | | 6,895,000 | | | | 7,020,384 | (a) |
BNP Paribas SA, Senior Notes | | | 4.400 | % | | | 8/14/28 | | | | 46,530,000 | | | | 50,455,638 | (a) |
BNP Paribas SA, Senior Notes (4.705% to 1/10/24 then 3 mo. USD LIBOR + 2.235%) | | | 4.705 | % | | | 1/10/25 | | | | 52,040,000 | | | | 55,867,206 | (a)(c) |
BNP Paribas SA, Senior Notes (5.198% to 1/10/29 then 3 mo. USD LIBOR + 2.567%) | | | 5.198 | % | | | 1/10/30 | | | | 16,350,000 | | | | 18,739,633 | (a)(c) |
BNP Paribas SA, Subordinated Notes | | | 4.625 | % | | | 3/13/27 | | | | 9,790,000 | | | | 10,461,789 | (a) |
BNP Paribas SA, Subordinated Notes (4.375% to 3/1/28 then USD 5 year ICE Swap Rate + 1.483%) | | | 4.375 | % | | | 3/1/33 | | | | 10,910,000 | | | | 11,248,937 | (a)(c) |
BPCE SA, Subordinated Notes | | | 5.150 | % | | | 7/21/24 | | | | 3,300,000 | | | | 3,572,266 | (a) |
CIT Group Inc., Senior Notes | | | 4.750 | % | | | 2/16/24 | | | | 7,040,000 | | | | 7,488,307 | |
CIT Group Inc., Senior Notes | | | 5.250 | % | | | 3/7/25 | | | | 5,730,000 | | | | 6,295,837 | |
Citigroup Inc., Junior Subordinated Notes (5.350% to 5/15/23 then 3 mo. USD LIBOR + 3.466%) | | | 5.350 | % | | | 5/15/23 | | | | 6,200,000 | | | | 6,248,174 | (b)(c) |
Citigroup Inc., Junior Subordinated Notes (5.900% to 2/15/23 then 3 mo. USD LIBOR + 4.230%) | | | 5.900 | % | | | 2/15/23 | | | | 2,140,000 | | | | 2,219,510 | (b)(c) |
Citigroup Inc., Junior Subordinated Notes (5.950% to 1/30/23 then 3 mo. USD LIBOR + 4.068%) | | | 5.950 | % | | | 1/30/23 | | | | 6,050,000 | | | | 6,280,112 | (b)(c) |
See Notes to Financial Statements.
| | |
| | |
| 22 | | Western Asset Core Plus Bond Fund 2019 Semi-Annual Report |
Western Asset Core Plus Bond Fund
| | | | | | | | | | | | | | | | |
| Security | | Rate | | | Maturity
Date | | | Face
Amount† | | | Value | |
Banks — continued | | | | | | | | | | | | | | | | |
Citigroup Inc., Junior Subordinated Notes (5.950% to 5/15/25 then 3 mo. USD LIBOR + 3.905%) | | | 5.950 | % | | | 5/15/25 | | | | 28,020,000 | | | $ | 29,304,857 | (b)(c) |
Citigroup Inc., Junior Subordinated Notes (6.300% to 5/15/24 then 3 mo. USD LIBOR + 3.423%) | | | 6.300 | % | | | 5/15/24 | | | | 8,170,000 | | | | 8,492,429 | (b)(c) |
Citigroup Inc., Senior Notes | | | 8.125 | % | | | 7/15/39 | | | | 2,195,000 | | | | 3,515,590 | |
Citigroup Inc., Senior Notes | | | 4.650 | % | | | 7/30/45 | | | | 24,812,000 | | | | 28,620,349 | |
Citigroup Inc., Senior Notes | | | 4.650 | % | | | 7/23/48 | | | | 3,000,000 | | | | 3,495,540 | |
Citigroup Inc., Senior Notes (3.520% to 10/27/27 then 3 mo. USD LIBOR + 1.151%) | | | 3.520 | % | | | 10/27/28 | | | | 65,050,000 | | | | 67,145,756 | (c) |
Citigroup Inc., Senior Notes (3.980% to 3/20/29 then 3 mo. USD LIBOR + 1.338%) | | | 3.980 | % | | | 3/20/30 | | | | 7,640,000 | | | | 8,166,726 | (c) |
Citigroup Inc., Senior Notes (4.075% to 4/23/28 then 3 mo. USD LIBOR + 1.192%) | | | 4.075 | % | | | 4/23/29 | | | | 16,280,000 | | | | 17,502,568 | (c) |
Citigroup Inc., Subordinated Notes | | | 4.050 | % | | | 7/30/22 | | | | 704,000 | | | | 734,857 | |
Citigroup Inc., Subordinated Notes | | | 4.400 | % | | | 6/10/25 | | | | 19,090,000 | | | | 20,390,252 | |
Citigroup Inc., Subordinated Notes | | | 5.500 | % | | | 9/13/25 | | | | 25,260,000 | | | | 28,633,862 | |
Citigroup Inc., Subordinated Notes | | | 4.300 | % | | | 11/20/26 | | | | 11,500,000 | | | | 12,223,261 | |
Citigroup Inc., Subordinated Notes | | | 4.450 | % | | | 9/29/27 | | | | 38,920,000 | | | | 41,968,927 | |
Citigroup Inc., Subordinated Notes | | | 6.625 | % | | | 6/15/32 | | | | 1,660,000 | | | | 2,146,560 | |
Citigroup Inc., Subordinated Notes | | | 6.125 | % | | | 8/25/36 | | | | 133,000 | | | | 162,870 | |
Citigroup Inc., Subordinated Notes | | | 6.675 | % | | | 9/13/43 | | | | 2,824,000 | | | | 3,923,236 | |
Citigroup Inc., Subordinated Notes | | | 5.300 | % | | | 5/6/44 | | | | 1,789,000 | | | | 2,131,597 | |
Citigroup Inc., Subordinated Notes | | | 4.750 | % | | | 5/18/46 | | | | 2,080,000 | | | | 2,356,157 | |
Commonwealth Bank of Australia, Senior Notes | | | 5.000 | % | | | 10/15/19 | | | | 4,160,000 | | | | 4,191,744 | (a) |
Commonwealth Bank of Australia, Senior Notes | | | 3.900 | % | | | 7/12/47 | | | | 5,050,000 | | | | 5,469,124 | (a) |
Cooperatieve Rabobank UA, Senior Notes | | | 2.250 | % | | | 1/14/20 | | | | 8,520,000 | | | | 8,513,149 | |
Cooperatieve Rabobank UA, Senior Notes | | | 4.750 | % | | | 1/15/20 | | | | 10,434,000 | | | | 10,567,153 | (a) |
Cooperatieve Rabobank UA, Senior Notes | | | 4.625 | % | | | 12/1/23 | | | | 24,060,000 | | | | 25,791,020 | |
Cooperatieve Rabobank UA, Senior Notes | | | 4.375 | % | | | 8/4/25 | | | | 32,450,000 | | | | 34,479,516 | |
See Notes to Financial Statements.
| | |
| | |
| Western Asset Core Plus Bond Fund 2019 Semi-Annual Report | | 23 |
Schedule of investments(unaudited) (cont’d)
June 30, 2019
Western Asset Core Plus Bond Fund
| | | | | | | | | | | | | | | | |
| Security | | Rate | | | Maturity
Date | | | Face
Amount† | | | Value | |
Banks — continued | | | | | | | | | | | | | | | | |
Cooperatieve Rabobank UA, Senior Notes | | | 5.250 | % | | | 8/4/45 | | | | 8,420,000 | | | $ | 10,192,380 | |
Credit Agricole SA, Subordinated Notes (4.000% to 1/10/28 then USD 5 year ICE Swap Rate + 1.644%) | | | 4.000 | % | | | 1/10/33 | | | | 11,180,000 | | | | 11,312,790 | (a)(c) |
Credit Agricole SA, Junior Subordinated Notes (8.375% to 10/13/19 then 3 mo. USD LIBOR + 6.982%) | | | 8.375 | % | | | 10/13/19 | | | | 16,980,000 | | | | 17,115,840 | (a)(b)(c) |
Danske Bank A/S, Senior Notes | | | 5.000 | % | | | 1/12/22 | | | | 31,300,000 | | | | 32,753,326 | (a) |
Danske Bank A/S, Senior Notes | | | 5.375 | % | | | 1/12/24 | | | | 18,650,000 | | | | 20,171,596 | (a) |
Fifth Third Bancorp, Senior Notes | | | 3.650 | % | | | 1/25/24 | | | | 10,710,000 | | | | 11,261,620 | |
HSBC Bank USA NA, Subordinated Notes | | | 4.875 | % | | | 8/24/20 | | | | 17,967,000 | | | | 18,467,461 | |
HSBC Holdings PLC, Junior Subordinated Notes (6.250% to 3/23/23 then USD 5 year ICE Swap Rate + 3.453%) | | | 6.250 | % | | | 3/23/23 | | | | 21,490,000 | | | | 22,150,065 | (b)(c) |
HSBC Holdings PLC, Junior Subordinated Notes (6.375% to 9/17/24 then USD 5 year ICE Swap Rate + 3.705%) | | | 6.375 | % | | | 9/17/24 | | | | 10,440,000 | | | | 10,812,865 | (b)(c) |
HSBC Holdings PLC, Junior Subordinated Notes (6.500% to 3/23/28 then USD 5 year ICE Swap Rate + 3.606%) | | | 6.500 | % | | | 3/23/28 | | | | 24,390,000 | | | | 25,589,500 | (b)(c) |
HSBC Holdings PLC, Senior Notes | | | 3.400 | % | | | 3/8/21 | | | | 26,610,000 | | | | 27,028,024 | |
HSBC Holdings PLC, Senior Notes | | | 4.300 | % | | | 3/8/26 | | | | 1,750,000 | | | | 1,881,178 | |
HSBC Holdings PLC, Senior Notes | | | 3.900 | % | | | 5/25/26 | | | | 19,275,000 | | | | 20,150,804 | |
HSBC Holdings PLC, Senior Notes (3.973% to 5/22/29 then 3 mo. USD LIBOR + 1.610%) | | | 3.973 | % | | | 5/22/30 | | | | 28,460,000 | | | | 29,752,385 | (c) |
HSBC Holdings PLC, Senior Notes (4.583% to 6/19/28 then 3 mo. USD LIBOR + 1.535%) | | | 4.583 | % | | | 6/19/29 | | | | 47,560,000 | | | | 52,055,029 | (c) |
HSBC Holdings PLC, Subordinated Notes | | | 4.250 | % | | | 3/14/24 | | | | 8,270,000 | | | | 8,736,583 | |
HSBC Holdings PLC, Subordinated Notes | | | 4.250 | % | | | 8/18/25 | | | | 17,750,000 | | | | 18,704,145 | |
ING Bank NV, Senior Notes | | | 2.500 | % | | | 10/1/19 | | | | 6,050,000 | | | | 6,051,409 | (a) |
ING Bank NV, Subordinated Notes | | | 5.800 | % | | | 9/25/23 | | | | 13,820,000 | | | | 15,297,933 | (a) |
Intesa Sanpaolo SpA, Senior Notes | | | 3.125 | % | | | 7/14/22 | | | | 9,160,000 | | | | 9,070,477 | (a) |
See Notes to Financial Statements.
| | |
| | |
| 24 | | Western Asset Core Plus Bond Fund 2019 Semi-Annual Report |
Western Asset Core Plus Bond Fund
| | | | | | | | | | | | | | | | |
| Security | | Rate | | | Maturity
Date | | | Face
Amount† | | | Value | |
Banks — continued | | | | | | | | | | | | | | | | |
Intesa Sanpaolo SpA, Senior Notes | | | 3.375 | % | | | 1/12/23 | | | | 7,160,000 | | | $ | 7,139,365 | (a) |
Intesa Sanpaolo SpA, Subordinated Notes | | | 5.017 | % | | | 6/26/24 | | | | 36,780,000 | | | | 36,907,308 | (a) |
Intesa Sanpaolo SpA, Subordinated Notes | | | 5.710 | % | | | 1/15/26 | | | | 13,320,000 | | | | 13,492,424 | (a) |
JPMorgan Chase & Co., Senior Notes | | | 4.400 | % | | | 7/22/20 | | | | 10,770,000 | | | | 11,011,313 | |
JPMorgan Chase & Co., Senior Notes | | | 2.550 | % | | | 3/1/21 | | | | 4,220,000 | | | | 4,236,072 | |
JPMorgan Chase & Co., Senior Notes | | | 4.350 | % | | | 8/15/21 | | | | 1,780,000 | | | | 1,852,099 | |
JPMorgan Chase & Co., Senior Notes | | | 4.500 | % | | | 1/24/22 | | | | 9,480,000 | | | | 9,993,026 | |
JPMorgan Chase & Co., Senior Notes | | | 3.625 | % | | | 5/13/24 | | | | 20,000 | | | | 21,083 | |
JPMorgan Chase & Co., Senior Notes (3.509% to 1/23/28 then 3 mo. USD LIBOR + 0.945%) | | | 3.509 | % | | | 1/23/29 | | | | 29,830,000 | | | | 31,037,525 | (c) |
JPMorgan Chase & Co., Senior Notes (4.023% to 12/5/23 then 3 mo. USD LIBOR + 1.000%) | | | 4.023 | % | | | 12/5/24 | | | | 35,640,000 | | | | 37,899,416 | (c) |
JPMorgan Chase & Co., Senior Notes (4.203% to 7/23/28 then 3 mo. USD LIBOR + 1.260%) | | | 4.203 | % | | | 7/23/29 | | | | 18,900,000 | | | | 20,681,014 | (c) |
JPMorgan Chase & Co., Senior Notes (4.452% to 12/5/28 then 3 mo. USD LIBOR + 1.330%) | | | 4.452 | % | | | 12/5/29 | | | | 7,130,000 | | | | 7,956,410 | (c) |
JPMorgan Chase & Co., Subordinated Notes | | | 3.875 | % | | | 9/10/24 | | | | 3,195,000 | | | | 3,361,301 | |
JPMorgan Chase & Co., Subordinated Notes | | | 4.125 | % | | | 12/15/26 | | | | 20,000,000 | | | | 21,409,820 | |
JPMorgan Chase & Co., Subordinated Notes | | | 4.250 | % | | | 10/1/27 | | | | 4,050,000 | | | | 4,390,212 | |
JPMorgan Chase & Co., Subordinated Notes | | | 4.950 | % | | | 6/1/45 | | | | 20,670,000 | | | | 24,578,131 | |
Lloyds Bank PLC, Senior Notes | | | 2.700 | % | | | 8/17/20 | | | | 2,110,000 | | | | 2,118,474 | |
Lloyds Bank PLC, Senior Notes | | | 6.500 | % | | | 9/14/20 | | | | 100,000 | | | | 104,389 | (a) |
Lloyds Banking Group PLC, Junior Subordinated Notes (7.500% to 9/27/25 then USD 5 year ICE Swap Rate + 4.496%) | | | 7.500 | % | | | 9/27/25 | | | | 1,000,000 | | | | 1,052,105 | (b)(c) |
See Notes to Financial Statements.
| | |
| | |
| Western Asset Core Plus Bond Fund 2019 Semi-Annual Report | | 25 |
Schedule of investments(unaudited) (cont’d)
June 30, 2019
Western Asset Core Plus Bond Fund
| | | | | | | | | | | | | | | | |
| Security | | Rate | | | Maturity
Date | | | Face
Amount† | | | Value | |
Banks — continued | | | | | | | | | | | | | | | | |
Lloyds Banking Group PLC, Senior Notes | | | 3.900 | % | | | 3/12/24 | | | | 10,560,000 | | | $ | 11,003,443 | |
Lloyds Banking Group PLC, Senior Notes | | | 4.375 | % | | | 3/22/28 | | | | 18,830,000 | | | | 20,023,283 | |
Lloyds Banking Group PLC, Senior Notes | | | 4.550 | % | | | 8/16/28 | | | | 200,000 | | | | 215,641 | |
Lloyds Banking Group PLC, Senior Notes (3.574% to 11/7/27 then 3 mo. USD LIBOR + 1.205%) | | | 3.574 | % | | | 11/7/28 | | | | 3,000,000 | | | | 3,005,666 | (c) |
Lloyds Banking Group PLC, Subordinated Notes | | | 4.500 | % | | | 11/4/24 | | | | 15,350,000 | | | | 16,068,949 | |
Mitsubishi UFJ Financial Group Inc., Senior Notes | | | 2.998 | % | | | 2/22/22 | | | | 7,240,000 | | | | 7,356,274 | |
Nordea Bank ABP, Subordinated Notes | | | 4.875 | % | | | 5/13/21 | | | | 14,640,000 | | | | 15,197,625 | (a) |
Royal Bank of Canada, Senior Notes | | | 2.150 | % | | | 10/26/20 | | | | 9,960,000 | | | | 9,962,650 | |
Royal Bank of Canada, Senior Notes | | | 3.200 | % | | | 4/30/21 | | | | 11,940,000 | | | | 12,156,007 | |
Royal Bank of Scotland Group PLC, Senior Notes (3 mo. USD LIBOR + 1.905%) | | | 5.076 | % | | | 1/27/30 | | | | 3,000,000 | | | | 3,257,417 | (c) |
Royal Bank of Scotland Group PLC, Senior Notes (4.269% to 3/22/24 then 3 mo. USD LIBOR + 1.762%) | | | 4.269 | % | | | 3/22/25 | | | | 15,990,000 | | | | 16,546,586 | (c) |
Royal Bank of Scotland Group PLC, Senior Notes (4.519% to 6/25/23 then 3 mo. USD LIBOR + 1.550%) | | | 4.519 | % | | | 6/25/24 | | | | 10,000,000 | | | | 10,421,219 | (c) |
Royal Bank of Scotland Group PLC, Senior Notes (4.892% to 5/18/28 then 3 mo. USD LIBOR + 1.754%) | | | 4.892 | % | | | 5/18/29 | | | | 5,450,000 | | | | 5,824,416 | (c) |
Royal Bank of Scotland Group PLC, Subordinated Notes | | | 6.125 | % | | | 12/15/22 | | | | 6,229,000 | | | | 6,724,746 | |
Royal Bank of Scotland Group PLC, Subordinated Notes | | | 6.100 | % | | | 6/10/23 | | | | 12,920,000 | | | | 14,035,503 | |
Royal Bank of Scotland Group PLC, Subordinated Notes | | | 6.000 | % | | | 12/19/23 | | | | 15,075,000 | | | | 16,428,077 | |
Royal Bank of Scotland Group PLC, Subordinated Notes | | | 5.125 | % | | | 5/28/24 | | | | 24,180,000 | | | | 25,678,955 | |
Santander UK Group Holdings PLC, Subordinated Notes | | | 5.625 | % | | | 9/15/45 | | | | 3,560,000 | | | | 3,957,366 | (a) |
Santander UK PLC, Senior Notes | | | 2.375 | % | | | 3/16/20 | | | | 6,130,000 | | | | 6,130,541 | |
See Notes to Financial Statements.
| | |
| | |
| 26 | | Western Asset Core Plus Bond Fund 2019 Semi-Annual Report |
Western Asset Core Plus Bond Fund
| | | | | | | | | | | | | | | | |
| Security | | Rate | | | Maturity
Date | | | Face
Amount† | | | Value | |
Banks — continued | | | | | | | | | | | | | | | | |
Santander UK PLC, Subordinated Notes | | | 5.000 | % | | | 11/7/23 | | | | 750,000 | | | $ | 792,574 | (a) |
Standard Chartered PLC, Subordinated Notes | | | 3.950 | % | | | 1/11/23 | | | | 2,130,000 | | | | 2,179,691 | (a) |
Standard Chartered PLC, Subordinated Notes | | | 5.700 | % | | | 3/26/44 | | | | 11,965,000 | | | | 13,952,914 | (a) |
Sumitomo Mitsui Financial Group Inc., Senior Notes | | | 2.058 | % | | | 7/14/21 | | | | 10,680,000 | | | | 10,639,471 | |
Svenska Handelsbanken AB, Senior Notes | | | 3.350 | % | | | 5/24/21 | | | | 13,040,000 | | | | 13,287,080 | |
Toronto-Dominion Bank, Senior Notes | | | 3.250 | % | | | 6/11/21 | | | | 14,710,000 | | | | 15,006,351 | |
UniCredit SpA, Senior Notes | | | 6.572 | % | | | 1/14/22 | | | | 23,840,000 | | | | 25,352,464 | (a) |
US Bank NA, Senior Notes | | | 3.150 | % | | | 4/26/21 | | | | 11,950,000 | | | | 12,170,576 | |
Wachovia Capital Trust III, Junior Subordinated Bonds (the greater of 3 mo. USD LIBOR + 0.930% or 5.570%) | | | 5.570 | % | | | 7/29/19 | | | | 38,301,000 | | | | 38,376,836 | (b)(c) |
Wells Fargo & Co., Junior Subordinated Notes (5.875% to 6/15/25 then 3 mo. USD LIBOR + 3.990%) | | | 5.875 | % | | | 6/15/25 | | | | 3,480,000 | | | | 3,785,875 | (b)(c) |
Wells Fargo & Co., Senior Notes | | | 4.600 | % | | | 4/1/21 | | | | 13,950,000 | | | | 14,484,418 | |
Wells Fargo & Co., Senior Notes | | | 3.750 | % | | | 1/24/24 | | | | 11,840,000 | | | | 12,456,312 | |
Wells Fargo & Co., Senior Notes | | | 3.000 | % | | | 10/23/26 | | | | 29,510,000 | | | | 29,842,456 | |
Wells Fargo & Co., Senior Notes | | | 4.150 | % | | | 1/24/29 | | | | 23,420,000 | | | | 25,535,204 | |
Wells Fargo & Co., Senior Notes (3.584% to 5/22/27 then 3 mo. USD LIBOR + 1.310%) | | | 3.584 | % | | | 5/22/28 | | | | 23,440,000 | | | | 24,492,411 | (c) |
Wells Fargo & Co., Subordinated Notes | | | 3.450 | % | | | 2/13/23 | | | | 6,860,000 | | | | 7,055,041 | |
Wells Fargo & Co., Subordinated Notes | | | 4.480 | % | | | 1/16/24 | | | | 1,802,000 | | | | 1,932,860 | |
Wells Fargo & Co., Subordinated Notes | | | 4.300 | % | | | 7/22/27 | | | | 36,290,000 | | | | 39,239,049 | |
Wells Fargo & Co., Subordinated Notes | | | 5.375 | % | | | 11/2/43 | | | | 8,140,000 | | | | 9,927,564 | |
Wells Fargo & Co., Subordinated Notes | | | 5.606 | % | | | 1/15/44 | | | | 1,840,000 | | | | 2,302,419 | |
Wells Fargo & Co., Subordinated Notes | | | 4.650 | % | | | 11/4/44 | | | | 20,450,000 | | | | 22,791,743 | |
See Notes to Financial Statements.
| | |
| | |
| Western Asset Core Plus Bond Fund 2019 Semi-Annual Report | | 27 |
Schedule of investments(unaudited) (cont’d)
June 30, 2019
Western Asset Core Plus Bond Fund
| | | | | | | | | | | | | | | | |
| Security | | Rate | | | Maturity
Date | | | Face
Amount† | | | Value | |
Banks — continued | | | | | | | | | | | | | | | | |
Wells Fargo & Co., Subordinated Notes | | | 4.900 | % | | | 11/17/45 | | | | 16,404,000 | | | $ | 19,078,353 | |
Wells Fargo & Co., Subordinated Notes | | | 4.400 | % | | | 6/14/46 | | | | 3,070,000 | | | | 3,319,552 | |
Wells Fargo & Co., Subordinated Notes | | | 4.750 | % | | | 12/7/46 | | | | 22,515,000 | | | | 25,701,483 | |
Wells Fargo Capital X, Ltd. Gtd. | | | 5.950 | % | | | 12/15/36 | | | | 5,612,000 | | | | 6,622,919 | |
Westpac Banking Corp., Senior Notes | | | 2.300 | % | | | 5/26/20 | | | | 1,525,000 | | | | 1,525,613 | |
Westpac Banking Corp., Senior Notes | | | 2.600 | % | | | 11/23/20 | | | | 12,004,000 | | | | 12,064,419 | |
Total Banks | | | | | | | | | | | | | | | 2,265,074,057 | |
Capital Markets — 2.1% | | | | | | | | | | | | | | | | |
CME Group Inc., Senior Notes | | | 5.300 | % | | | 9/15/43 | | | | 4,500,000 | | | | 5,767,548 | |
Credit Suisse Group AG, Junior Subordinated Notes (7.500% to 7/17/23 then USD 5 year ICE Swap Rate + 4.600%) | | | 7.500 | % | | | 7/17/23 | | | | 2,000,000 | | | | 2,137,570 | (a)(b)(c) |
Credit Suisse Group AG, Senior Notes (3.869% to 1/12/28 then 3 mo. USD LIBOR + 1.410%) | | | 3.869 | % | | | 1/12/29 | | | | 19,940,000 | | | | 20,573,348 | (a)(c) |
Credit Suisse Group Funding Guernsey Ltd., Senior Notes | | | 4.550 | % | | | 4/17/26 | | | | 6,730,000 | | | | 7,326,317 | |
Credit Suisse Group Funding Guernsey Ltd., Senior Notes | | | 4.875 | % | | | 5/15/45 | | | | 13,745,000 | | | | 16,065,130 | |
Goldman Sachs Capital II, Junior Subordinated Bonds (3 mo. USD LIBOR + 0.768%, 4.000% floor) | | | 4.000 | % | | | 7/29/19 | | | | 413,000 | | | | 335,158 | (b)(c) |
Goldman Sachs Group Inc., Senior Notes | | | 5.375 | % | | | 3/15/20 | | | | 25,760,000 | | | | 26,295,794 | |
Goldman Sachs Group Inc., Senior Notes | | | 6.000 | % | | | 6/15/20 | | | | 3,946,000 | | | | 4,077,959 | |
Goldman Sachs Group Inc., Senior Notes | | | 5.250 | % | | | 7/27/21 | | | | 5,320,000 | | | | 5,624,818 | |
Goldman Sachs Group Inc., Senior Notes | | | 3.200 | % | | | 2/23/23 | | | | 12,610,000 | | | | 12,913,867 | |
Goldman Sachs Group Inc., Senior Notes | | | 4.000 | % | | | 3/3/24 | | | | 5,100,000 | | | | 5,415,200 | |
Goldman Sachs Group Inc., Senior Notes | | | 3.850 | % | | | 7/8/24 | | | | 5,410,000 | | | | 5,679,419 | |
See Notes to Financial Statements.
| | |
| | |
| 28 | | Western Asset Core Plus Bond Fund 2019 Semi-Annual Report |
Western Asset Core Plus Bond Fund
| | | | | | | | | | | | | | | | |
| Security | | Rate | | | Maturity
Date | | | Face
Amount† | | | Value | |
Capital Markets — continued | | | | | | | | | | | | | | | | |
Goldman Sachs Group Inc., Senior Notes | | | 3.500 | % | | | 1/23/25 | | | | 10,000,000 | | | $ | 10,352,613 | |
Goldman Sachs Group Inc., Senior Notes | | | 3.500 | % | | | 11/16/26 | | | | 10,633,000 | | | | 10,904,024 | |
Goldman Sachs Group Inc., Senior Notes | | | 6.250 | % | | | 2/1/41 | | | | 29,580,000 | | | | 39,719,437 | |
Goldman Sachs Group Inc., Senior Notes | | | 4.750 | % | | | 10/21/45 | | | | 20,030,000 | | | | 23,073,563 | |
Goldman Sachs Group Inc., Senior Notes (2.876% to 10/31/21 then 3 mo. USD LIBOR + 0.821%) | | | 2.876 | %�� | | | 10/31/22 | | | | 34,600,000 | | | | 34,895,654 | (c) |
Goldman Sachs Group Inc., Senior Notes (3.691% to 6/5/27 then 3 mo. USD LIBOR + 1.510%) | | | 3.691 | % | | | 6/5/28 | | | | 5,760,000 | | | | 5,953,631 | (c) |
Goldman Sachs Group Inc., Senior Notes (3.814% to 4/23/28 then 3 mo. USD LIBOR + 1.158%) | | | 3.814 | % | | | 4/23/29 | | | | 78,315,000 | | | | 81,919,441 | (c) |
Goldman Sachs Group Inc., Senior Notes (4.223% to 5/1/28 then 3 mo. USD LIBOR + 1.301%) | | | 4.223 | % | | | 5/1/29 | | | | 21,650,000 | | | | 23,238,713 | (c) |
Goldman Sachs Group Inc., Subordinated Notes | | | 4.250 | % | | | 10/21/25 | | | | 24,160,000 | | | | 25,639,983 | |
Goldman Sachs Group Inc., Subordinated Notes | | | 6.750 | % | | | 10/1/37 | | | | 8,640,000 | | | | 11,314,989 | |
Goldman Sachs Group Inc., Subordinated Notes | | | 5.150 | % | | | 5/22/45 | | | | 21,841,000 | | | | 25,033,997 | |
KKR Group Finance Co. II LLC, Senior Notes | | | 5.500 | % | | | 2/1/43 | | | | 1,398,000 | | | | 1,619,640 | (a) |
Lehman Brothers Holdings Capital Trust VII, Junior Subordinated Notes | | | 5.857 | % | | | 8/16/19 | | | | 5,550,000 | | | | 0 | *(b)(d)(e)(f)(g) |
Lehman Brothers HoldingsE-Capital Trust I, Junior Subordinated Notes | | | 3.091 | % | | | 8/19/65 | | | | 190,000 | | | | 0 | *(d)(e)(f)(g) |
Lehman Brothers Holdings Inc., Junior Subordinated Notes | | | 6.500 | % | | | 7/19/17 | | | | 5,280,000 | | | | 0 | *(e)(f)(g)(h) |
Lehman Brothers Holdings Inc., Subordinated Notes | | | 6.750 | % | | | 12/28/17 | | | | 1,070,000 | | | | 0 | *(e)(f)(g)(h) |
Morgan Stanley, Senior Notes | | | 5.500 | % | | | 7/24/20 | | | | 1,710,000 | | | | 1,765,483 | |
Morgan Stanley, Senior Notes (3.772% to 1/24/28 then 3 mo. USD LIBOR + 1.140%) | | | 3.772 | % | | | 1/24/29 | | | | 43,070,000 | | | | 45,222,879 | (c) |
See Notes to Financial Statements.
| | |
| | |
| Western Asset Core Plus Bond Fund 2019 Semi-Annual Report | | 29 |
Schedule of investments(unaudited) (cont’d)
June 30, 2019
Western Asset Core Plus Bond Fund
| | | | | | | | | | | | | | | | |
| Security | | Rate | | | Maturity
Date | | | Face
Amount† | | | Value | |
Capital Markets — continued | | | | | | | | | | | | | | | | |
Morgan Stanley, Senior Notes (4.431% to 1/23/29 then 3 mo. USD LIBOR + 1.628%) | | | 4.431 | % | | | 1/23/30 | | | | 11,760,000 | | | $ | 13,019,857 | (c) |
UBS AG, Senior Notes | | | 4.500 | % | | | 6/26/48 | | | | 3,490,000 | | | | 4,127,052 | (a) |
UBS Group Funding Switzerland AG, Junior Subordinated Notes (7.000% to 1/31/24 then USD 5 year ICE Swap Rate + 4.344%) | | | 7.000 | % | | | 1/31/24 | | | | 40,650,000 | | | | 43,212,373 | (a)(b)(c) |
UBS Group Funding Switzerland AG, Senior Notes | | | 3.491 | % | | | 5/23/23 | | | | 32,680,000 | | | | 33,520,244 | (a) |
UBS Group Funding Switzerland AG, Senior Notes | | | 4.125 | % | | | 9/24/25 | | | | 4,880,000 | | | | 5,212,421 | (a) |
UBS Group Funding Switzerland AG, Senior Notes | | | 4.253 | % | | | 3/23/28 | | | | 29,370,000 | | | | 31,681,772 | (a) |
Total Capital Markets | | | | | | | | | | | | | | | 583,639,894 | |
Consumer Finance — 0.1% | | | | | | | | | | | | | | | | |
Ally Financial Inc., Senior Notes | | | 7.500 | % | | | 9/15/20 | | | | 2,699,000 | | | | 2,847,445 | |
Ally Financial Inc., Senior Notes | | | 8.000 | % | | | 11/1/31 | | | | 3,690,000 | | | | 4,895,560 | |
American Express Credit Corp., Senior Notes | | | 2.375 | % | | | 5/26/20 | | | | 12,230,000 | | | | 12,237,013 | |
Navient Corp., Senior Notes | | | 8.000 | % | | | 3/25/20 | | | | 60,000 | | | | 62,250 | |
Total Consumer Finance | | | | | | | | | | | | | | | 20,042,268 | |
Diversified Financial Services — 0.6% | | | | | | | | | | | | | | | | |
AerCap Ireland Capital DAC/AerCap Global Aviation Trust, Senior Notes | | | 4.500 | % | | | 5/15/21 | | | | 2,590,000 | | | | 2,671,682 | |
AerCap Ireland Capital DAC/AerCap Global Aviation Trust, Senior Notes | | | 5.000 | % | | | 10/1/21 | | | | 1,180,000 | | | | 1,238,022 | |
Ahold Lease USA Inc. Pass-Through-Trust | | | 8.620 | % | | | 1/2/25 | | | | 6,003,498 | | | | 6,870,405 | |
Boeing Capital Corp., Senior Notes | | | 4.700 | % | | | 10/27/19 | | | | 5,890,000 | | | | 5,930,979 | |
DAE Funding LLC, Senior Notes | | | 5.750 | % | | | 11/15/23 | | | | 4,480,000 | | | | 4,715,200 | (a) |
GE Capital International Funding Co. Unlimited Co., Senior Notes | | | 2.342 | % | | | 11/15/20 | | | | 17,167,000 | | | | 17,091,100 | |
GE Capital International Funding Co. Unlimited Co., Senior Notes | | | 4.418 | % | | | 11/15/35 | | | | 5,171,000 | | | | 5,126,602 | |
ILFCE-Capital Trust II, Ltd. GTD ((Highest of 3 mo. USD LIBOR, 10 year U.S. Treasury Constant Maturity Rate and 30 year U.S. Treasury Constant Maturity Rate) + 1.800%) | | | 4.340 | % | | | 12/21/65 | | | | 2,870,000 | | | | 2,095,100 | (a)(c) |
See Notes to Financial Statements.
| | |
| | |
| 30 | | Western Asset Core Plus Bond Fund 2019 Semi-Annual Report |
Western Asset Core Plus Bond Fund
| | | | | | | | | | | | | | | | |
| Security | | Rate | | | Maturity
Date | | | Face
Amount† | | | Value | |
Diversified Financial Services — continued | | | | | | | | | | | | | | | | |
International Lease Finance Corp., Senior Notes | | | 8.625 | % | | | 1/15/22 | | | | 8,880,000 | | | $ | 10,131,450 | |
International Lease Finance Corp., Senior Notes | | | 5.875 | % | | | 8/15/22 | | | | 3,540,000 | | | | 3,857,648 | |
Magnolia Finance X Ltd., 2015-3GNA A1 (3 mo. GBP LIBOR + 2.483%) | | | 3.408 | % | | | 3/12/20 | | | | 43,541,344 | GBP | | | 53,636,470 | (a)(c)(f) |
Magnolia Finance X Ltd., 2015-3GNA A2 (3 mo. GBP LIBOR + 3.750%) | | | 4.675 | % | | | 3/12/20 | | | | 14,366,433 | GBP | | | 17,697,312 | (a)(c)(f) |
Park Aerospace Holdings Ltd., Senior Notes | | | 5.250 | % | | | 8/15/22 | | | | 9,280,000 | | | | 9,821,024 | (a) |
Park Aerospace Holdings Ltd., Senior Notes | | | 4.500 | % | | | 3/15/23 | | | | 1,170,000 | | | | 1,210,552 | (a) |
Park Aerospace Holdings Ltd., Senior Notes | | | 5.500 | % | | | 2/15/24 | | | | 2,790,000 | | | | 3,011,052 | (a) |
Syngenta Finance NV, Senior Notes | | | 3.933 | % | | | 4/23/21 | | | | 22,950,000 | | | | 23,374,191 | (a) |
Total Diversified Financial Services | | | | 168,478,789 | |
Insurance — 0.3% | |
Ambac Assurance Corp., Subordinated Notes | | | 5.100 | % | | | 6/7/20 | | | | 298,643 | | | | 422,954 | (a) |
Ambac LSNI LLC, Senior Secured Notes (3 mo. USD LIBOR + 5.000%) | | | 7.319 | % | | | 2/12/23 | | | | 1,284,292 | | | | 1,308,373 | (a)(c) |
American International Group Inc., Junior Subordinated Notes (6.250% to 3/15/37 then 3 mo. USD LIBOR + 2.056%) | | | 6.250 | % | | | 3/15/37 | | | | 446,000 | | | | 457,861 | (b)(c) |
American International Group Inc., Senior Notes | | | 3.750 | % | | | 7/10/25 | | | | 12,460,000 | | | | 13,055,388 | |
Berkshire Hathaway Finance Corp., Senior Notes | | | 4.250 | % | | | 1/15/49 | | | | 19,600,000 | | | | 22,094,284 | |
Brighthouse Financial Inc., Senior Notes | | | 4.700 | % | | | 6/22/47 | | | | 2,900,000 | | | | 2,427,724 | |
Chubb INA Holdings Inc., Senior Notes | | | 2.300 | % | | | 11/3/20 | | | | 4,100,000 | | | | 4,102,585 | |
Chubb INA Holdings Inc., Senior Notes | | | 3.350 | % | | | 5/3/26 | | | | 5,420,000 | | | | 5,688,850 | |
MetLife Capital Trust IV, Junior Subordinated Notes | | | 7.875 | % | | | 12/15/37 | | | | 8,900,000 | | | | 11,228,195 | (a) |
See Notes to Financial Statements.
| | |
| | |
| Western Asset Core Plus Bond Fund 2019 Semi-Annual Report | | 31 |
Schedule of investments(unaudited) (cont’d)
June 30, 2019
Western Asset Core Plus Bond Fund
| | | | | | | | | | | | | | | | |
| Security | | Rate | | | Maturity
Date | | | Face
Amount† | | | Value | |
Insurance — continued | |
MetLife Inc., Junior Subordinated Notes (6.400% to 12/15/36 then 3 mo. USD LIBOR + 2.205%) | | | 6.400 | % | | | 12/15/36 | | | | 5,493,000 | | | $ | 6,289,403 | (b)(c) |
Prudential Financial Inc., Senior Notes | | | 4.500 | % | | | 11/16/21 | | | | 300,000 | | | | 315,517 | |
Reliance Standard Life Global Funding II, Senior Secured Notes | | | 2.500 | % | | | 1/15/20 | | | | 3,726,000 | | | | 3,724,580 | (a) |
Teachers Insurance & Annuity Association of America, Subordinated Notes | | | 4.900 | % | | | 9/15/44 | | | | 7,755,000 | | | | 9,087,232 | (a) |
Total Insurance | | | | 80,202,946 | |
Total Financials | | | | 3,117,437,954 | |
| Health Care — 3.1% | | | | | | | | | | | | | | | | |
Biotechnology — 0.3% | | | | | | | | | | | | | | | | |
AbbVie Inc., Senior Notes | | | 3.600 | % | | | 5/14/25 | | | | 9,430,000 | | | | 9,750,771 | |
Amgen Inc., Senior Notes | | | 2.125 | % | | | 5/1/20 | | | | 3,318,000 | | | | 3,310,360 | |
Amgen Inc., Senior Notes | | | 3.625 | % | | | 5/22/24 | | | | 1,480,000 | | | | 1,555,581 | |
Amgen Inc., Senior Notes | | | 4.663 | % | | | 6/15/51 | | | | 1,933,000 | | | | 2,114,256 | |
Celgene Corp., Senior Notes | | | 2.250 | % | | | 8/15/21 | | | | 10,330,000 | | | | 10,299,532 | |
Celgene Corp., Senior Notes | | | 3.550 | % | | | 8/15/22 | | | | 4,650,000 | | | | 4,816,917 | |
Celgene Corp., Senior Notes | | | 3.625 | % | | | 5/15/24 | | | | 2,200,000 | | | | 2,311,041 | |
Celgene Corp., Senior Notes | | | 3.875 | % | | | 8/15/25 | | | | 9,750,000 | | | | 10,454,844 | |
Celgene Corp., Senior Notes | | | 5.250 | % | | | 8/15/43 | | | | 3,712,000 | | | | 4,460,235 | |
Celgene Corp., Senior Notes | | | 5.000 | % | | | 8/15/45 | | | | 15,520,000 | | | | 18,444,320 | |
Gilead Sciences Inc., Senior Notes | | | 2.550 | % | | | 9/1/20 | | | | 2,500,000 | | | | 2,507,886 | |
Gilead Sciences Inc., Senior Notes | | | 3.700 | % | | | 4/1/24 | | | | 399,000 | | | | 423,599 | |
Gilead Sciences Inc., Senior Notes | | | 3.500 | % | | | 2/1/25 | | | | 5,000,000 | | | | 5,249,945 | |
Gilead Sciences Inc., Senior Notes | | | 3.650 | % | | | 3/1/26 | | | | 1,560,000 | | | | 1,648,282 | |
Gilead Sciences Inc., Senior Notes | | | 4.750 | % | | | 3/1/46 | | | | 6,165,000 | | | | 7,024,564 | |
Gilead Sciences Inc., Senior Notes | | | 4.150 | % | | | 3/1/47 | | | | 7,660,000 | | | | 8,021,986 | |
Total Biotechnology | | | | 92,394,119 | |
Health Care Equipment & Supplies — 0.3% | |
Abbott Laboratories, Senior Notes | | | 3.750 | % | | | 11/30/26 | | | | 6,580,000 | | | | 7,120,107 | |
Abbott Laboratories, Senior Notes | | | 4.750 | % | | | 11/30/36 | | | | 6,660,000 | | | | 7,879,504 | |
Abbott Laboratories, Senior Notes | | | 4.900 | % | | | 11/30/46 | | | | 10,150,000 | | | | 12,560,196 | |
Becton Dickinson and Co., Senior Notes | | | 3.363 | % | | | 6/6/24 | | | | 19,160,000 | | | | 19,746,920 | |
Becton Dickinson and Co., Senior Notes | | | 3.734 | % | | | 12/15/24 | | | | 3,922,000 | | | | 4,116,670 | |
See Notes to Financial Statements.
| | |
| | |
| 32 | | Western Asset Core Plus Bond Fund 2019 Semi-Annual Report |
Western Asset Core Plus Bond Fund
| | | | | | | | | | | | | | | | |
| Security | | Rate | | | Maturity
Date | | | Face
Amount† | | | Value | |
Health Care Equipment & Supplies — continued | | | | | | | | | | | | | | | | |
Becton Dickinson and Co., Senior Notes | | | 4.685 | % | | | 12/15/44 | | | | 2,251,000 | | | $ | 2,500,647 | |
Medtronic Inc., Senior Notes | | | 3.125 | % | | | 3/15/22 | | | | 1,010,000 | | | | 1,038,436 | |
Medtronic Inc., Senior Notes | | | 3.500 | % | | | 3/15/25 | | | | 26,870,000 | | | | 28,518,441 | |
Total Health Care Equipment & Supplies | | | | | | | | | | | | 83,480,921 | |
Health Care Providers & Services — 1.7% | | | | | | | | | | | | | | | | |
Aetna Inc., Senior Notes | | | 2.800 | % | | | 6/15/23 | | | | 2,610,000 | | | | 2,627,470 | |
Anthem Inc., Senior Notes | | | 3.700 | % | | | 8/15/21 | | | | 2,130,000 | | | | 2,179,703 | |
Anthem Inc., Senior Notes | | | 3.125 | % | | | 5/15/22 | | | | 5,280,000 | | | | 5,378,532 | |
Anthem Inc., Senior Notes | | | 2.950 | % | | | 12/1/22 | | | | 9,320,000 | | | | 9,459,364 | |
Anthem Inc., Senior Notes | | | 3.350 | % | | | 12/1/24 | | | | 4,140,000 | | | | 4,285,764 | |
Anthem Inc., Senior Notes | | | 3.650 | % | | | 12/1/27 | | | | 12,660,000 | | | | 13,172,097 | |
Anthem Inc., Senior Notes | | | 4.375 | % | | | 12/1/47 | | | | 4,000,000 | | | | 4,277,831 | |
Cardinal Health Inc., Senior Notes | | | 2.616 | % | | | 6/15/22 | | | | 5,440,000 | | | | 5,474,776 | |
Cardinal Health Inc., Senior Notes | | | 3.079 | % | | | 6/15/24 | | | | 7,100,000 | | | | 7,152,775 | |
Centene Corp., Senior Notes | | | 5.625 | % | | | 2/15/21 | | | | 2,660,000 | | | | 2,713,200 | |
Centene Corp., Senior Notes | | | 4.750 | % | | | 5/15/22 | | | | 5,032,000 | | | | 5,157,800 | |
Centene Corp., Senior Notes | | | 6.125 | % | | | 2/15/24 | | | | 7,362,000 | | | | 7,720,897 | |
Centene Corp., Senior Notes | | | 4.750 | % | | | 1/15/25 | | | | 3,120,000 | | | | 3,228,295 | |
Centene Corp., Senior Notes | | | 5.375 | % | | | 6/1/26 | | | | 5,030,000 | | | | 5,300,362 | (a) |
Cigna Corp., Senior Notes | | | 3.400 | % | | | 9/17/21 | | | | 9,330,000 | | | | 9,515,038 | (a) |
Cigna Corp., Senior Notes | | | 3.750 | % | | | 7/15/23 | | | | 24,540,000 | | | | 25,566,750 | (a) |
Cigna Corp., Senior Notes | | | 4.125 | % | | | 11/15/25 | | | | 8,050,000 | | | | 8,579,593 | (a) |
Cigna Corp., Senior Notes | | | 4.375 | % | | | 10/15/28 | | | | 22,000,000 | | | | 23,755,520 | (a) |
CommonSpirit Health, Secured Notes | | | 4.350 | % | | | 11/1/42 | | | | 1,410,000 | | | | 1,420,229 | |
CVS Health Corp., Senior Notes | | | 3.350 | % | | | 3/9/21 | | | | 8,290,000 | | | | 8,407,907 | |
CVS Health Corp., Senior Notes | | | 2.750 | % | | | 12/1/22 | | | | 16,440,000 | | | | 16,504,574 | |
CVS Health Corp., Senior Notes | | | 3.700 | % | | | 3/9/23 | | | | 28,650,000 | | | | 29,648,242 | |
CVS Health Corp., Senior Notes | | | 4.100 | % | | | 3/25/25 | | | | 13,250,000 | | | | 13,984,031 | |
CVS Health Corp., Senior Notes | | | 3.875 | % | | | 7/20/25 | | | | 4,447,000 | | | | 4,647,196 | |
CVS Health Corp., Senior Notes | | | 4.300 | % | | | 3/25/28 | | | | 89,790,000 | | | | 94,762,403 | |
CVS Health Corp., Senior Notes | | | 5.125 | % | | | 7/20/45 | | | | 12,410,000 | | | | 13,254,437 | |
CVS Health Corp., Senior Notes | | | 5.050 | % | | | 3/25/48 | | | | 10,960,000 | | | | 11,691,687 | |
Fresenius Medical Care U.S. Finance II Inc., Senior Notes | | | 5.875 | % | | | 1/31/22 | | | | 5,140,000 | | | | 5,492,010 | (a) |
Fresenius Medical Care U.S. Finance II Inc., Senior Notes | | | 4.750 | % | | | 10/15/24 | | | | 780,000 | | | | 831,241 | (a) |
Fresenius Medical Care U.S. Finance Inc., Senior Notes | | | 5.750 | % | | | 2/15/21 | | | | 2,045,000 | | | | 2,133,612 | (a) |
See Notes to Financial Statements.
| | |
| | |
| Western Asset Core Plus Bond Fund 2019 Semi-Annual Report | | 33 |
Schedule of investments(unaudited) (cont’d)
June 30, 2019
Western Asset Core Plus Bond Fund
| | | | | | | | | | | | | | | | |
| Security | | Rate | | | Maturity
Date | | | Face
Amount† | | | Value | |
Health Care Providers & Services — continued | | | | | | | | | | | | | | | | |
HCA Inc., Senior Notes | | | 7.690 | % | | | 6/15/25 | | | | 723,000 | | | $ | 851,333 | |
HCA Inc., Senior Notes | | | 5.875 | % | | | 2/15/26 | | | | 240,000 | | | | 265,800 | |
HCA Inc., Senior Notes | | | 5.375 | % | | | 9/1/26 | | | | 498,000 | | | | 537,840 | |
HCA Inc., Senior Notes | | | 5.625 | % | | | 9/1/28 | | | | 140,000 | | | | 151,900 | |
HCA Inc., Senior Notes | | | 7.500 | % | | | 11/15/95 | | | | 15,410,000 | | | | 16,334,600 | |
HCA Inc., Senior Secured Notes | | | 4.750 | % | | | 5/1/23 | | | | 4,150,000 | | | | 4,446,067 | |
HCA Inc., Senior Secured Notes | | | 5.000 | % | | | 3/15/24 | | | | 330,000 | | | | 359,893 | |
HCA Inc., Senior Secured Notes | | | 5.250 | % | | | 6/15/26 | | | | 2,960,000 | | | | 3,281,861 | |
HCA Inc., Senior Secured Notes | | | 4.500 | % | | | 2/15/27 | | | | 1,780,000 | | | | 1,901,913 | |
HCA Inc., Senior Secured Notes | | | 5.500 | % | | | 6/15/47 | | | | 5,920,000 | | | | 6,334,138 | |
Humana Inc., Senior Notes | | | 3.150 | % | | | 12/1/22 | | | | 2,470,000 | | | | 2,523,151 | |
Humana Inc., Senior Notes | | | 3.950 | % | | | 3/15/27 | | | | 8,340,000 | | | | 8,702,882 | |
Humana Inc., Senior Notes | | | 4.625 | % | | | 12/1/42 | | | | 3,460,000 | | | | 3,677,087 | |
Humana Inc., Senior Notes | | | 4.950 | % | | | 10/1/44 | | | | 2,476,000 | | | | 2,736,928 | |
Humana Inc., Senior Notes | | | 4.800 | % | | | 3/15/47 | | | | 600,000 | | | | 652,147 | |
Medtronic Global Holdings SCA, Senior Notes | | | 3.350 | % | | | 4/1/27 | | | | 10,300,000 | | | | 10,954,760 | |
UnitedHealth Group Inc., Senior Notes | | | 2.700 | % | | | 7/15/20 | | | | 10,392,000 | | | | 10,436,459 | |
UnitedHealth Group Inc., Senior Notes | | | 3.875 | % | | | 10/15/20 | | | | 3,000,000 | | | | 3,048,856 | |
UnitedHealth Group Inc., Senior Notes | | | 2.875 | % | | | 12/15/21 | | | | 6,088,000 | | | | 6,180,277 | |
UnitedHealth Group Inc., Senior Notes | | | 3.875 | % | | | 12/15/28 | | | | 2,622,000 | | | | 2,862,716 | |
UnitedHealth Group Inc., Senior Notes | | | 5.700 | % | | | 10/15/40 | | | | 10,000,000 | | | | 12,866,950 | |
Total Health Care Providers & Services | | | | | | | | | | | | 447,430,894 | |
Pharmaceuticals — 0.8% | | | | | | | | | | | | | | | | |
Allergan Funding SCS, Senior Notes | | | 3.450 | % | | | 3/15/22 | | | | 7,230,000 | | | | 7,384,617 | |
Allergan Funding SCS, Senior Notes | | | 3.800 | % | | | 3/15/25 | | | | 10,140,000 | | | | 10,530,255 | |
Allergan Funding SCS, Senior Notes | | | 4.550 | % | | | 3/15/35 | | | | 140,000 | | | | 141,579 | |
Allergan Funding SCS, Senior Notes | | | 4.750 | % | | | 3/15/45 | | | | 472,000 | | | | 485,616 | |
Bausch Health Americas Inc., Senior Notes | | | 9.250 | % | | | 4/1/26 | | | | 4,631,000 | | | | 5,192,740 | (a) |
Bausch Health Americas Inc., Senior Notes | | | 8.500 | % | | | 1/31/27 | | | | 36,000 | | | | 39,673 | (a) |
Bausch Health Cos. Inc., Senior Notes | | | 6.125 | % | | | 4/15/25 | | | | 100,000 | | | | 102,372 | (a) |
See Notes to Financial Statements.
| | |
| | |
| 34 | | Western Asset Core Plus Bond Fund 2019 Semi-Annual Report |
Western Asset Core Plus Bond Fund
| | | | | | | | | | | | | | | | |
| Security | | Rate | | | Maturity
Date | | | Face
Amount† | | | Value | |
Pharmaceuticals — continued | | | | | | | | | | | | | | | | |
Bausch Health Cos. Inc., Senior Notes | | | 9.000 | % | | | 12/15/25 | | | | 5,150,000 | | | $ | 5,773,408 | (a) |
Bausch Health Cos. Inc., Senior Notes | | | 7.250 | % | | | 5/30/29 | | | | 160,000 | | | | 166,800 | (a) |
Bristol-Myers Squibb Co., Senior Notes | | | 2.600 | % | | | 5/16/22 | | | | 14,560,000 | | | | 14,750,488 | (a) |
Bristol-Myers Squibb Co., Senior Notes | | | 2.900 | % | | | 7/26/24 | | | | 27,420,000 | | | | 28,081,667 | (a) |
Bristol-Myers Squibb Co., Senior Notes | | | 3.200 | % | | | 6/15/26 | | | | 18,350,000 | | | | 19,081,532 | (a) |
Bristol-Myers Squibb Co., Senior Notes | | | 3.400 | % | | | 7/26/29 | | | | 8,710,000 | | | | 9,126,859 | (a) |
Eli Lilly & Co., Senior Notes | | | 3.100 | % | | | 5/15/27 | | | | 3,560,000 | | | | 3,721,735 | |
GlaxoSmithKline Capital PLC, Senior Notes | | | 2.850 | % | | | 5/8/22 | | | | 10,240,000 | | | | 10,416,047 | |
Johnson & Johnson, Senior Notes | | | 3.625 | % | | | 3/3/37 | | | | 29,750,000 | | | | 31,861,900 | |
Merck & Co. Inc., Senior Notes | | | 2.750 | % | | | 2/10/25 | | | | 6,700,000 | | | | 6,905,233 | |
Pfizer Inc., Senior Notes | | | 7.200 | % | | | 3/15/39 | | | | 5,000 | | | | 7,621 | |
Teva Pharmaceutical Finance Co. BV, Senior Notes | | | 3.650 | % | | | 11/10/21 | | | | 3,190,000 | | | | 3,082,338 | |
Teva Pharmaceutical Finance IV BV, Senior Notes | | | 3.650 | % | | | 11/10/21 | | | | 3,873,000 | | | | 3,753,905 | |
Teva Pharmaceutical Finance Netherlands III BV, Senior Notes | | | 1.700 | % | | | 7/19/19 | | | | 4,849,000 | | | | 4,835,665 | |
Teva Pharmaceutical Finance Netherlands III BV, Senior Notes | | | 2.200 | % | | | 7/21/21 | | | | 34,239,000 | | | | 32,612,647 | |
Teva Pharmaceutical Finance Netherlands III BV, Senior Notes | | | 2.800 | % | | | 7/21/23 | | | | 14,430,000 | | | | 12,518,025 | |
Wyeth LLC, Senior Notes | | | 5.950 | % | | | 4/1/37 | | | | 5,098,000 | | | | 6,766,608 | |
Total Pharmaceuticals | | | | | | | | | | | | | | | 217,339,330 | |
Total Health Care | | | | | | | | | | | | | | | 840,645,264 | |
| Industrials — 1.6% | | | | | | | | | | | | | | | | |
Aerospace & Defense — 0.5% | | | | | | | | | | | | | | | | |
Boeing Co., Senior Notes | | | 4.875 | % | | | 2/15/20 | | | | 3,180,000 | | | | 3,227,486 | |
Boeing Co., Senior Notes | | | 3.100 | % | | | 5/1/26 | | | | 3,720,000 | | | | 3,831,458 | |
Boeing Co., Senior Notes | | | 2.800 | % | | | 3/1/27 | | | | 4,740,000 | | | | 4,772,596 | |
Boeing Co., Senior Notes | | | 3.200 | % | | | 3/1/29 | | | | 16,620,000 | | | | 17,223,854 | |
Lockheed Martin Corp., Senior Notes | | | 3.100 | % | | | 1/15/23 | | | | 2,269,000 | | | | 2,329,423 | |
See Notes to Financial Statements.
| | |
| | |
| Western Asset Core Plus Bond Fund 2019 Semi-Annual Report | | 35 |
Schedule of investments(unaudited) (cont’d)
June 30, 2019
Western Asset Core Plus Bond Fund
| | | | | | | | | | | | | | | | |
| Security | | Rate | | | Maturity
Date | | | Face
Amount† | | | Value | |
Aerospace & Defense — continued | | | | | | | | | | | | | | | | |
Lockheed Martin Corp., Senior Notes | | | 3.550 | % | | | 1/15/26 | | | | 13,115,000 | | | $ | 13,949,729 | |
Lockheed Martin Corp., Senior Notes | | | 4.500 | % | | | 5/15/36 | | | | 2,420,000 | | | | 2,780,702 | |
Northrop Grumman Corp., Senior Notes | | | 2.930 | % | | | 1/15/25 | | | | 16,925,000 | | | | 17,249,999 | |
Northrop Grumman Corp., Senior Notes | | | 3.250 | % | | | 1/15/28 | | | | 29,720,000 | | | | 30,535,637 | |
Raytheon Co., Senior Notes | | | 3.125 | % | | | 10/15/20 | | | | 4,520,000 | | | | 4,572,082 | |
United Technologies Corp., Senior Notes | | | 3.950 | % | | | 8/16/25 | | | | 14,150,000 | | | | 15,271,165 | |
United Technologies Corp., Senior Notes | | | 4.125 | % | | | 11/16/28 | | | | 11,520,000 | | | | 12,666,563 | |
United Technologies Corp., Senior Notes | | | 4.500 | % | | | 6/1/42 | | | | 4,109,000 | | | | 4,656,976 | |
Total Aerospace & Defense | | | | | | | | | | | | | | | 133,067,670 | |
Air Freight & Logistics — 0.0% | | | | | | | | | | | | | | | | |
XPO Logistics Inc., Senior Notes | | | 6.500 | % | | | 6/15/22 | | | | 4,080,000 | | | | 4,171,800 | (a) |
Airlines — 0.1% | | | | | | | | | | | | | | | | |
Air 2 U.S. Pass-Through Certificates | | | 8.027 | % | | | 10/1/19 | | | | 57,442 | | | | 57,621 | (a) |
Continental Airlines Pass-Through Trust | | | 6.703 | % | | | 6/15/21 | | | | 19,016 | | | | 19,952 | |
Continental Airlines Pass-Through Trust | | | 5.983 | % | | | 4/19/22 | | | | 7,804,669 | | | | 8,286,607 | |
Delta Air Lines Pass-Through Trust | | | 6.821 | % | | | 8/10/22 | | | | 6,148,797 | | | | 6,774,744 | |
Total Airlines | | | | | | | | | | | | | | | 15,138,924 | |
Commercial Services & Supplies — 0.2% | | | | | | | | | | | | | |
Cintas Corp. No 2, Senior Notes | | | 2.900 | % | | | 4/1/22 | | | | 7,980,000 | | | | 8,118,698 | |
Cintas Corp. No 2, Senior Notes | | | 3.700 | % | | | 4/1/27 | | | | 7,500,000 | | | | 7,992,602 | |
United Rentals North America Inc., Senior Notes | | | 5.500 | % | | | 7/15/25 | | | | 2,505,000 | | | | 2,614,594 | |
United Rentals North America Inc., Senior Notes | | | 5.875 | % | | | 9/15/26 | | | | 3,060,000 | | | | 3,270,375 | |
United Rentals North America Inc., Senior Notes | | | 6.500 | % | | | 12/15/26 | | | | 3,620,000 | | | | 3,927,700 | |
United Rentals North America Inc., Senior Notes | | | 5.500 | % | | | 5/15/27 | | | | 490,000 | | | | 516,950 | |
United Rentals North America Inc., Senior Notes | | | 4.875 | % | | | 1/15/28 | | | | 5,413,000 | | | | 5,534,793 | |
See Notes to Financial Statements.
| | |
| | |
| 36 | | Western Asset Core Plus Bond Fund 2019 Semi-Annual Report |
Western Asset Core Plus Bond Fund
| | | | | | | | | | | | | | | | |
| Security | | Rate | | | Maturity
Date | | | Face
Amount† | | | Value | |
Commercial Services & Supplies — continued | | | | | | | | | | | | | |
United Rentals North America Inc., Senior Notes | | | 5.250 | % | | | 1/15/30 | | | | 2,110,000 | | | $ | 2,173,300 | |
Waste Management Inc., Senior Notes | | | 4.600 | % | | | 3/1/21 | | | | 2,370,000 | | | | 2,449,241 | |
Waste Management Inc., Senior Notes | | | 3.500 | % | | | 5/15/24 | | | | 4,440,000 | | | | 4,661,585 | |
Waste Management Inc., Senior Notes | | | 3.200 | % | | | 6/15/26 | | | | 4,980,000 | | | | 5,184,777 | |
Waste Management Inc., Senior Notes | | | 3.450 | % | | | 6/15/29 | | | | 5,990,000 | | | | 6,319,365 | |
Waste Management Inc., Senior Notes | | | 4.000 | % | | | 7/15/39 | | | | 5,470,000 | | | | 5,871,447 | |
Waste Management Inc., Senior Notes | | | 4.150 | % | | | 7/15/49 | | | | 7,460,000 | | | | 8,160,303 | |
Total Commercial Services & Supplies | | | | | | | | | | | | 66,795,730 | |
Electrical Equipment — 0.1% | | | | | | | | | | | | | | | | |
ABB Finance USA Inc., Senior Notes | | | 4.375 | % | | | 5/8/42 | | | | 1,373,000 | | | | 1,554,281 | |
Eaton Corp., Senior Notes | | | 2.750 | % | | | 11/2/22 | | | | 25,195,000 | | | | 25,537,027 | |
Eaton Corp., Senior Notes | | | 4.150 | % | | | 11/2/42 | | | | 6,590,000 | | | | 6,981,889 | |
Total Electrical Equipment | | | | | | | | | | | | | | | 34,073,197 | |
Industrial Conglomerates — 0.3% | | | | | | | | | | | | | | | | |
General Electric Co., Senior Notes | | | 5.500 | % | | | 1/8/20 | | | | 1,640,000 | | | | 1,663,512 | |
General Electric Co., Senior Notes | | | 4.375 | % | | | 9/16/20 | | | | 4,836,000 | | | | 4,935,699 | |
General Electric Co., Senior Notes | | | 4.650 | % | | | 10/17/21 | | | | 410,000 | | | | 427,318 | |
General Electric Co., Senior Notes | | | 6.750 | % | | | 3/15/32 | | | | 8,010,000 | | | | 9,876,454 | |
General Electric Co., Senior Notes | | | 6.150 | % | | | 8/7/37 | | | | 2,100,000 | | | | 2,443,624 | |
General Electric Co., Senior Notes | | | 5.875 | % | | | 1/14/38 | | | | 10,903,000 | | | | 12,327,189 | |
General Electric Co., Senior Notes | | | 6.875 | % | | | 1/10/39 | | | | 35,494,000 | | | | 44,574,384 | |
General Electric Co., Senior Notes | | | 4.500 | % | | | 3/11/44 | | | | 8,660,000 | | | | 8,415,685 | |
General Electric Co., Subordinated Notes | | | 5.300 | % | | | 2/11/21 | | | | 4,382,000 | | | | 4,541,487 | |
Total Industrial Conglomerates | | | | | | | | | | | | | | | 89,205,352 | |
Machinery — 0.0% | | | | | | | | | | | | | | | | |
John Deere Capital Corp., Senior Notes | | | 1.700 | % | | | 1/15/20 | | | | 2,490,000 | | | | 2,481,505 | |
Road & Rail — 0.3% | | | | | | | | | | | | | | | | |
Union Pacific Corp., Senior Notes | | | 3.750 | % | | | 7/15/25 | | | | 8,730,000 | | | | 9,337,934 | |
Union Pacific Corp., Senior Notes | | | 3.950 | % | | | 9/10/28 | | | | 28,460,000 | | | | 31,166,500 | |
Union Pacific Corp., Senior Notes | | | 4.500 | % | | | 9/10/48 | | | | 23,430,000 | | | | 26,697,596 | |
Total Road & Rail | | | | | | | | | | | | | | | 67,202,030 | |
See Notes to Financial Statements.
| | |
| | |
| Western Asset Core Plus Bond Fund 2019 Semi-Annual Report | | 37 |
Schedule of investments(unaudited) (cont’d)
June 30, 2019
Western Asset Core Plus Bond Fund
| | | | | | | | | | | | | | | | |
| Security | | Rate | | | Maturity
Date | | | Face
Amount† | | | Value | |
Trading Companies & Distributors — 0.0% | | | | | | | | | | | | | |
Ashtead Capital Inc., Secured Notes | | | 4.125 | % | | | 8/15/25 | | | | 3,066,000 | | | $ | 3,119,655 | (a) |
Beacon Roofing Supply Inc., Senior Notes | | | 4.875 | % | | | 11/1/25 | | | | 3,790,000 | | | | 3,766,313 | (a) |
Total Trading Companies & Distributors | | | | | | | | | | | | 6,885,968 | |
Transportation Infrastructure — 0.1% | | | | | | | | | | | | | | | | |
DP World PLC, Senior Notes | | | 5.625 | % | | | 9/25/48 | | | | 24,030,000 | | | | 26,700,910 | (a) |
Total Industrials | | | | | | | | | | | | | | | 445,723,086 | |
| Information Technology — 1.6% | | | | | | | | | | | | | | | | |
Communications Equipment — 0.1% | | | | | | | | | | | | | | | | |
CommScope Technologies LLC, Senior Notes | | | 5.000 | % | | | 3/15/27 | | | | 3,720,000 | | | | 3,255,000 | (a) |
Harris Corp., Senior Notes | | | 4.854 | % | | | 4/27/35 | | | | 2,988,000 | | | | 3,323,915 | |
Harris Corp., Senior Notes | | | 5.054 | % | | | 4/27/45 | | | | 6,087,000 | | | | 7,147,733 | |
Total Communications Equipment | | | | | | | | | | | | | | | 13,726,648 | |
IT Services — 0.4% | | | | | | | | | | | | | | | | |
First Data Corp., Senior Secured Notes | | | 5.000 | % | | | 1/15/24 | | | | 18,509,000 | | | | 18,974,039 | (a) |
International Business Machines Corp., Senior Notes | | | 3.000 | % | | | 5/15/24 | | | | 45,360,000 | | | | 46,616,141 | |
Visa Inc., Senior Notes | | | 3.150 | % | | | 12/14/25 | | | | 26,130,000 | | | | 27,434,019 | |
Visa Inc., Senior Notes | | | 4.300 | % | | | 12/14/45 | | | | 16,470,000 | | | | 19,536,513 | |
Total IT Services | | | | | | | | | | | | | | | 112,560,712 | |
Semiconductors & Semiconductor Equipment — 0.1% | | | | | | | | | |
Broadcom Corp./Broadcom Cayman Finance Ltd., Senior Notes | | | 3.125 | % | | | 1/15/25 | | | | 9,800,000 | | | | 9,584,837 | |
Intel Corp., Senior Notes | | | 3.700 | % | | | 7/29/25 | | | | 4,050,000 | | | | 4,345,778 | |
Intel Corp., Senior Notes | | | 3.734 | % | | | 12/8/47 | | | | 3,104,000 | | | | 3,251,036 | |
Total Semiconductors & Semiconductor Equipment | | | | | | | | 17,181,651 | |
Software — 0.7% | | | | | | | | | | | | | | | | |
Microsoft Corp., Senior Notes | | | 1.550 | % | | | 8/8/21 | | | | 18,543,000 | | | | 18,391,349 | |
Microsoft Corp., Senior Notes | | | 2.400 | % | | | 2/6/22 | | | | 14,850,000 | | | | 15,011,396 | |
Microsoft Corp., Senior Notes | | | 2.875 | % | | | 2/6/24 | | | | 19,298,000 | | | | 20,008,765 | |
Microsoft Corp., Senior Notes | | | 2.700 | % | | | 2/12/25 | | | | 4,322,000 | | | | 4,440,521 | |
Microsoft Corp., Senior Notes | | | 2.400 | % | | | 8/8/26 | | | | 74,200,000 | | | | 74,638,482 | |
Microsoft Corp., Senior Notes | | | 3.300 | % | | | 2/6/27 | | | | 40,450,000 | | | | 43,017,838 | |
Microsoft Corp., Senior Notes | | | 3.450 | % | | | 8/8/36 | | | | 770,000 | | | | 816,025 | |
Microsoft Corp., Senior Notes | | | 4.100 | % | | | 2/6/37 | | | | 4,530,000 | | | | 5,176,053 | |
Microsoft Corp., Senior Notes | | | 3.950 | % | | | 8/8/56 | | | | 3,840,000 | | | | 4,279,574 | |
See Notes to Financial Statements.
| | |
| | |
| 38 | | Western Asset Core Plus Bond Fund 2019 Semi-Annual Report |
Western Asset Core Plus Bond Fund
| | | | | | | | | | | | | | | | |
| Security | | Rate | | | Maturity
Date | | | Face
Amount† | | | Value | |
Software — continued | | | | | | | | | | | | | | | | |
salesforce.com Inc., Senior Notes | | | 3.250 | % | | | 4/11/23 | | | | 11,370,000 | | | $ | 11,808,524 | |
salesforce.com Inc., Senior Notes | | | 3.700 | % | | | 4/11/28 | | | | 3,480,000 | | | | 3,755,083 | |
Total Software | | | | | | | | | | | | | | | 201,343,610 | |
Technology Hardware, Storage & Peripherals — 0.3% | | | | | | | | | |
Apple Inc., Senior Notes | | | 2.000 | % | | | 11/13/20 | | | | 11,350,000 | | | | 11,346,370 | |
Apple Inc., Senior Notes | | | 1.550 | % | | | 8/4/21 | | | | 5,190,000 | | | | 5,141,510 | |
Apple Inc., Senior Notes | | | 2.450 | % | | | 8/4/26 | | | | 32,030,000 | | | | 31,948,805 | |
Dell International LLC/EMC Corp., Senior Secured Notes | | | 4.420 | % | | | 6/15/21 | | | | 37,507,000 | | | | 38,660,845 | (a) |
Total Technology Hardware, Storage & Peripherals | | | | | | | | 87,097,530 | |
Total Information Technology | | | | | | | | | | | | | | | 431,910,151 | |
| Materials — 1.3% | | | | | | | | | | | | | | | | |
Chemicals — 0.1% | | | | | | | | | | | | | | | | |
Equate Petrochemical BV, Senior Notes | | | 4.250 | % | | | 11/3/26 | | | | 12,930,000 | | | | 13,578,440 | (a) |
LyondellBasell Industries NV, Senior Notes | | | 6.000 | % | | | 11/15/21 | | | | 2,360,000 | | | | 2,531,257 | |
LyondellBasell Industries NV, Senior Notes | | | 5.750 | % | | | 4/15/24 | | | | 2,690,000 | | | | 3,026,803 | |
Nutrien Ltd., Senior Notes | | | 4.875 | % | | | 3/30/20 | | | | 330,000 | | | | 335,713 | |
OCP SA, Senior Notes | | | 4.500 | % | | | 10/22/25 | | | | 10,510,000 | | | | 10,796,187 | (a) |
Total Chemicals | | | | | | | | | | | | | | | 30,268,400 | |
Containers & Packaging — 0.0% | | | | | | | | | | | | | | | | |
Ardagh Packaging Finance PLC/ Ardagh Holdings USA Inc., Senior Notes | | | 6.000 | % | | | 2/15/25 | | | | 940,000 | | | | 976,425 | (a) |
Reynolds Group Issuer Inc./Reynolds Group Issuer LLC/Reynolds Group Issuer (Luxembourg) SA, Senior Secured Notes | | | 6.875 | % | | | 2/15/21 | | | | 1,789,865 | | | | 1,796,577 | |
Reynolds Group Issuer Inc./Reynolds Group Issuer LLC/Reynolds Group Issuer (Luxembourg) SA, Senior Secured Notes | | | 5.125 | % | | | 7/15/23 | | | | 5,190,000 | | | | 5,300,288 | (a) |
WestRock RKT Co., Senior Notes | | | 4.000 | % | | | 3/1/23 | | | | 2,250,000 | | | | 2,338,877 | |
Total Containers & Packaging | | | | | | | | | | | | | | | 10,412,167 | |
Metals & Mining — 1.1% | | | | | | | | | | | | | | | | |
Alcoa Nederland Holding BV, Senior Notes | | | 6.750 | % | | | 9/30/24 | | | | 7,835,000 | | | | 8,314,894 | (a) |
See Notes to Financial Statements.
| | |
| | |
| Western Asset Core Plus Bond Fund 2019 Semi-Annual Report | | 39 |
Schedule of investments(unaudited) (cont’d)
June 30, 2019
Western Asset Core Plus Bond Fund
| | | | | | | | | | | | | | | | |
| Security | | Rate | | | Maturity
Date | | | Face
Amount† | | | Value | |
Metals & Mining — continued | | | | | | | | | | | | | | | | |
Alcoa Nederland Holding BV, Senior Notes | | | 7.000 | % | | | 9/30/26 | | | | 5,150,000 | | | $ | 5,536,250 | (a) |
Alcoa Nederland Holding BV, Senior Notes | | | 6.125 | % | | | 5/15/28 | | | | 435,000 | | | | 455,662 | (a) |
Anglo American Capital PLC, Senior Notes | | | 3.750 | % | | | 4/10/22 | | | | 12,605,000 | | | | 12,888,472 | (a) |
Anglo American Capital PLC, Senior Notes | | | 3.625 | % | | | 9/11/24 | | | | 3,400,000 | | | | 3,475,451 | (a) |
Anglo American Capital PLC, Senior Notes | | | 4.750 | % | | | 4/10/27 | | | | 9,785,000 | | | | 10,373,342 | (a) |
Anglo American Capital PLC, Senior Notes | | | 4.000 | % | | | 9/11/27 | | | | 13,125,000 | | | | 13,187,539 | (a) |
ArcelorMittal, Senior Notes | | | 6.250 | % | | | 2/25/22 | | | | 3,510,000 | | | | 3,809,381 | |
ArcelorMittal, Senior Notes | | | 6.125 | % | | | 6/1/25 | | | | 630,000 | | | | 716,728 | |
ArcelorMittal, Senior Notes | | | 4.550 | % | | | 3/11/26 | | | | 8,835,000 | | | | 9,346,405 | |
ArcelorMittal, Senior Notes | | | 7.000 | % | | | 10/15/39 | | | | 3,490,000 | | | | 4,147,832 | |
Barrick Gold Corp., Senior Notes | | | 5.250 | % | | | 4/1/42 | | | | 1,590,000 | | | | 1,868,041 | |
Barrick North America Finance LLC, Senior Notes | | | 5.700 | % | | | 5/30/41 | | | | 8,454,000 | | | | 10,128,751 | |
Barrick North America Finance LLC, Senior Notes | | | 5.750 | % | | | 5/1/43 | | | | 8,260,000 | | | | 10,338,500 | |
BHP Billiton Finance USA Ltd., Senior Notes | | | 2.875 | % | | | 2/24/22 | | | | 983,000 | | | | 1,000,835 | |
BHP Billiton Finance USA Ltd., Senior Notes | | | 5.000 | % | | | 9/30/43 | | | | 7,630,000 | | | | 9,571,213 | |
BHP Billiton Finance USA Ltd., Senior Notes (6.750% to 10/19/25 then USD 5 year ICE Swap Rate + 5.093%) | | | 6.750 | % | | | 10/19/75 | | | | 28,735,000 | | | | 32,830,312 | (a)(c) |
Freeport-McMoRan Inc., Senior Notes | | | 4.000 | % | | | 11/14/21 | | | | 4,080,000 | | | | 4,171,800 | |
Freeport-McMoRan Inc., Senior Notes | | | 3.550 | % | | | 3/1/22 | | | | 4,160,000 | | | | 4,186,000 | |
Freeport-McMoRan Inc., Senior Notes | | | 6.875 | % | | | 2/15/23 | | | | 2,091,000 | | | | 2,208,619 | |
Freeport-McMoRan Inc., Senior Notes | | | 3.875 | % | | | 3/15/23 | | | | 40,000 | | | | 40,100 | |
Freeport-McMoRan Inc., Senior Notes | | | 4.550 | % | | | 11/14/24 | | | | 130,000 | | | | 133,218 | |
Freeport-McMoRan Inc., Senior Notes | | | 5.450 | % | | | 3/15/43 | | | | 8,032,000 | | | | 7,389,440 | |
See Notes to Financial Statements.
| | |
| | |
| 40 | | Western Asset Core Plus Bond Fund 2019 Semi-Annual Report |
Western Asset Core Plus Bond Fund
| | | | | | | | | | | | | | | | |
| Security | | Rate | | | Maturity
Date | | | Face
Amount† | | | Value | |
Metals & Mining — continued | | | | | | | | | | | | | | | | |
Glencore Finance Canada Ltd., Senior Notes | | | 6.000 | % | | | 11/15/41 | | | | 2,120,000 | | | $ | 2,272,545 | (a) |
Glencore Funding LLC, Senior Notes | | | 2.875 | % | | | 4/16/20 | | | | 2,010,000 | | | | 2,020,959 | (a) |
Glencore Funding LLC, Senior Notes | | | 3.000 | % | | | 10/27/22 | | | | 21,610,000 | | | | 21,785,905 | (a) |
Glencore Funding LLC, Senior Notes | | | 4.125 | % | | | 5/30/23 | | | | 3,200,000 | | | | 3,329,223 | (a) |
Glencore Funding LLC, Senior Notes | | | 4.125 | % | | | 3/12/24 | | | | 36,668,000 | | | | 38,095,759 | (a) |
Glencore Funding LLC, Senior Notes | | | 4.000 | % | | | 3/27/27 | | | | 18,190,000 | | | | 18,384,342 | (a) |
Southern Copper Corp., Senior Notes | | | 5.250 | % | | | 11/8/42 | | | | 24,800,000 | | | | 27,290,665 | |
Teck Resources Ltd., Senior Notes | | | 6.000 | % | | | 8/15/40 | | | | 641,000 | | | | 698,686 | |
Vale Overseas Ltd., Senior Notes | | | 6.875 | % | | | 11/21/36 | | | | 6,581,000 | | | | 7,938,331 | |
Yamana Gold Inc., Senior Notes | | | 4.625 | % | | | 12/15/27 | | | | 10,350,000 | | | | 10,589,752 | |
Total Metals & Mining | | | | | | | | | | | | | | | 288,524,952 | |
Paper & Forest Products — 0.1% | | | | | | | | | | | | | | | | |
Resolute Forest Products Inc., Senior Notes | | | 5.875 | % | | | 5/15/23 | | | | 16,220,000 | | | | 16,382,200 | |
Total Materials | | | | | | | | | | | | | | | 345,587,719 | |
| Real Estate — 0.1% | | | | | | | | | | | | | | | | |
Equity Real Estate Investment Trusts (REITs) — 0.1% | | | | | | | | | |
CoreCivic Inc., Senior Notes | | | 4.750 | % | | | 10/15/27 | | | | 634,000 | | | | 572,977 | |
MGM Growth Properties Operating Partnership LP/MGP FinanceCo-Issuer Inc., Senior Notes | | | 4.500 | % | | | 1/15/28 | | | | 400,000 | | | | 399,000 | |
WEA Finance LLC/Westfield UK & Europe Finance PLC, Senior Notes | | | 3.750 | % | | | 9/17/24 | | | | 23,980,000 | | | | 25,044,480 | (a) |
WEA Finance LLC/Westfield UK & Europe Finance PLC, Senior Notes | | | 4.750 | % | | | 9/17/44 | | | | 600,000 | | | | 663,402 | (a) |
Total Real Estate | | | | | | | | | | | | | | | 26,679,859 | |
| Utilities — 0.6% | | | | | | | | | | | | | | | | |
Electric Utilities — 0.6% | | | | | | | | | | | | | | | | |
Berkshire Hathaway Energy Co., Senior Notes | | | 6.125 | % | | | 4/1/36 | | | | 156,000 | | | | 209,002 | |
Duke Energy Carolinas LLC | | | 5.300 | % | | | 2/15/40 | | | | 3,000,000 | | | | 3,744,384 | |
Duke Energy Ohio Inc. | | | 3.650 | % | | | 2/1/29 | | | | 7,740,000 | | | | 8,315,841 | |
Duke Energy Progress LLC, Secured Bonds | | | 2.800 | % | | | 5/15/22 | | | | 400,000 | | | | 406,999 | |
Exelon Corp., Senior Notes | | | 5.625 | % | | | 6/15/35 | | | | 5,126,000 | | | | 6,213,300 | |
FirstEnergy Corp., Senior Notes | | | 4.250 | % | | | 3/15/23 | | | | 18,500,000 | | | | 19,447,458 | |
FirstEnergy Corp., Senior Notes | | | 3.900 | % | | | 7/15/27 | | | | 15,802,000 | | | | 16,610,608 | |
FirstEnergy Corp., Senior Notes | | | 7.375 | % | | | 11/15/31 | | | | 56,186,000 | | | | 76,873,931 | |
See Notes to Financial Statements.
| | |
| | |
| Western Asset Core Plus Bond Fund 2019 Semi-Annual Report | | 41 |
Schedule of investments(unaudited) (cont’d)
June 30, 2019
Western Asset Core Plus Bond Fund
| | | | | | | | | | | | | | | | |
| Security | | Rate | | | Maturity
Date | | | Face
Amount† | | | Value | |
Electric Utilities — continued | | | | | | | | | | | | | | | | |
FirstEnergy Corp., Senior Notes | | | 4.850 | % | | | 7/15/47 | | | | 10,344,000 | | | $ | 11,775,527 | |
Progress Energy Inc., Senior Notes | | | 4.400 | % | | | 1/15/21 | | | | 5,200,000 | | | | 5,336,343 | |
Progress Energy Inc., Senior Notes | | | 6.000 | % | | | 12/1/39 | | | | 4,800,000 | | | | 6,003,228 | |
Total Electric Utilities | | | | | | | | | | | | | | | 154,936,621 | |
Multi-Utilities — 0.0% | | | | | | | | | | | | | | | | |
Dominion Energy Inc., Senior Notes | | | 7.000 | % | | | 6/15/38 | | | | 3,600,000 | | | | 4,874,442 | |
Total Utilities | | | | | | | | | | | | | | | 159,811,063 | |
Total Corporate Bonds & Notes (Cost — $7,879,852,675) | | | | | | | | 8,355,379,450 | |
| Mortgage-Backed Securities — 28.0% | | | | | | | | | | | | | |
FHLMC — 7.8% | | | | | | | | | | | | | | | | |
Federal Home Loan Mortgage Corp. (FHLMC) | | | 5.000 | % | | | 3/1/38-1/1/49 | | | | 46,171,065 | | | | 48,997,827 | |
Federal Home Loan Mortgage Corp. (FHLMC) | | | 5.500 | % | | | 12/1/38 | | | | 3,605,360 | | | | 3,918,100 | |
Federal Home Loan Mortgage Corp. (FHLMC) | | | 3.500 | % | | | 3/1/43-3/1/49 | | | | 342,185,737 | | | | 351,686,540 | |
Federal Home Loan Mortgage Corp. (FHLMC) | | | 4.000 | % | | | 7/1/47-5/1/49 | | | | 537,876,202 | | | | 557,600,616 | |
Federal Home Loan Mortgage Corp. (FHLMC) | | | 3.000 | % | | | 1/1/48-4/1/49 | | | | 28,834,174 | | | | 29,107,729 | |
Federal Home Loan Mortgage Corp. (FHLMC) Gold | | | 6.000 | % | | | 8/1/19-11/1/36 | | | | 20,071 | | | | 22,509 | |
Federal Home Loan Mortgage Corp. (FHLMC) Gold | | | 5.500 | % | | | 7/1/20-11/1/35 | | | | 12,703 | | | | 13,824 | |
Federal Home Loan Mortgage Corp. (FHLMC) Gold | | | 5.000 | % | | | 6/1/23-11/1/48 | | | | 43,170,721 | | | | 46,057,882 | |
Federal Home Loan Mortgage Corp. (FHLMC) Gold | | | 4.500 | % | | | 7/1/23-9/1/47 | | | | 44,510,976 | | | | 47,075,088 | |
Federal Home Loan Mortgage Corp. (FHLMC) Gold | | | 4.000 | % | | | 10/1/25-6/1/49 | �� | | | 169,318,916 | | | | 176,935,010 | |
Federal Home Loan Mortgage Corp. (FHLMC) Gold | | | 2.500 | % | | | 6/1/27 | | | | 2,239,101 | | | | 2,261,033 | |
Federal Home Loan Mortgage Corp. (FHLMC) Gold | | | 6.500 | % | | | 7/1/29-9/1/39 | | | | 2,645,322 | | | | 3,055,831 | |
Federal Home Loan Mortgage Corp. (FHLMC) Gold | | | 7.000 | % | | | 4/1/32-3/1/39 | | | | 741,017 | | | | 861,942 | |
Federal Home Loan Mortgage Corp. (FHLMC) Gold | | | 3.500 | % | | | 8/1/33-3/1/49 | | | | 406,191,612 | | | | 417,992,758 | |
Federal Home Loan Mortgage Corp. (FHLMC) Gold | | | 3.000 | % | | | 2/1/38-3/1/49 | | | | 442,839,831 | | | | 449,017,944 | |
Total FHLMC | | | | | | | | | | | | | | | 2,134,604,633 | |
See Notes to Financial Statements.
| | |
| | |
| 42 | | Western Asset Core Plus Bond Fund 2019 Semi-Annual Report |
Western Asset Core Plus Bond Fund
| | | | | | | | | | | | | | | | |
| Security | | Rate | | | Maturity
Date | | | Face
Amount† | | | Value | |
FNMA — 12.6% | | | | | | | | | | | | | | | | |
Federal National Mortgage Association (FNMA) | | | 9.500 | % | | | 11/1/21 | | | | 4 | | | $ | 4 | |
Federal National Mortgage Association (FNMA) | | | 4.500 | % | | | 7/1/23-9/1/57 | | | | 215,955,164 | | | | 231,405,202 | |
Federal National Mortgage Association (FNMA) | | | 6.000 | % | | | 4/1/24-2/1/41 | | | | 24,887,220 | | | | 28,224,200 | |
Federal National Mortgage Association (FNMA) | | | 2.810 | % | | | 4/1/25 | | | | 3,140,000 | | | | 3,235,841 | |
Federal National Mortgage Association (FNMA) | | | 2.950 | % | | | 7/1/27 | | | | 21,420,000 | | | | 22,289,445 | |
Federal National Mortgage Association (FNMA) | | | 2.500 | % | | | 1/1/28-10/1/42 | | | | 10,949,071 | | | | 10,984,906 | |
Federal National Mortgage Association (FNMA) | | | 3.740 | % | | | 11/1/28 | | | | 17,720,000 | | | | 19,269,267 | |
Federal National Mortgage Association (FNMA) | | | 3.070 | % | | | 1/1/29 | | | | 4,760,000 | | | | 4,967,726 | |
Federal National Mortgage Association (FNMA) | | | 3.530 | % | | | 1/1/29 | | | | 7,300,000 | | | | 7,890,446 | |
Federal National Mortgage Association (FNMA) | | | 3.600 | % | | | 1/1/29 | | | | 516,789 | | | | 559,701 | |
Federal National Mortgage Association (FNMA) | | | 3.770 | % | | | 1/1/29 | | | | 12,138,000 | | | | 13,333,664 | |
Federal National Mortgage Association (FNMA) | | | 3.790 | % | | | 1/1/29 | | | | 4,775,000 | | | | 5,244,037 | |
Federal National Mortgage Association (FNMA) | | | 3.800 | % | | | 1/1/29 | | | | 3,705,000 | | | | 4,079,164 | |
Federal National Mortgage Association (FNMA) | | | 3.820 | % | | | 1/1/29 | | | | 14,898,000 | | | | 16,430,604 | |
Federal National Mortgage Association (FNMA) | | | 3.830 | % | | | 1/1/29 | | | | 4,880,000 | | | | 5,374,187 | |
Federal National Mortgage Association (FNMA) | | | 3.660 | % | | | 2/1/29 | | | | 18,650,000 | | | | 20,295,459 | |
Federal National Mortgage Association (FNMA) | | | 6.500 | % | | | 2/1/29-5/1/40 | | | | 11,649,761 | | | | 13,714,295 | |
Federal National Mortgage Association (FNMA) | | | 3.300 | % | | | 4/1/29 | | | | 3,575,000 | | | | 3,821,194 | |
Federal National Mortgage Association (FNMA) | | | 3.090 | % | | | 5/1/29 | | | | 9,820,000 | | | | 10,305,537 | |
See Notes to Financial Statements.
| | |
| | |
| Western Asset Core Plus Bond Fund 2019 Semi-Annual Report | | 43 |
Schedule of investments(unaudited) (cont’d)
June 30, 2019
Western Asset Core Plus Bond Fund
| | | | | | | | | | | | | | | | |
| Security | | Rate | | | Maturity
Date | | | Face
Amount† | | | Value | |
FNMA — continued | | | | | | | | | | | | | | | | |
Federal National Mortgage Association (FNMA) | | | 3.160 | % | | | 5/1/29 | | | | 7,136,051 | | | $ | 7,510,714 | |
Federal National Mortgage Association (FNMA) | | | 3.190 | % | | | 5/1/29 | | | | 3,595,544 | | | | 3,791,474 | |
Federal National Mortgage Association (FNMA) | | | 3.240 | % | | | 5/1/29 | | | | 17,183,000 | | | | 18,183,930 | |
Federal National Mortgage Association (FNMA) | | | 3.260 | % | | | 5/1/29 | | | | 12,130,177 | | | | 12,864,790 | |
Federal National Mortgage Association (FNMA) | | | 3.350 | % | | | 5/1/29 | | | | 2,630,000 | | | | 2,798,650 | |
Federal National Mortgage Association (FNMA) | | | 3.040 | % | | | 6/1/29 | | | | 5,250,000 | | | | 5,487,018 | |
Federal National Mortgage Association (FNMA) | | | 7.000 | % | | | 8/1/29-2/1/39 | | | | 3,674,218 | | | | 4,326,822 | |
Federal National Mortgage Association (FNMA) | | | 7.500 | % | | | 11/1/29 | | | | 2,347 | | | | 2,765 | |
Federal National Mortgage Association (FNMA) | | | 3.310 | % | | | 5/1/31 | | | | 3,799,000 | | | | 4,032,518 | |
Federal National Mortgage Association (FNMA) | | | 5.000 | % | | | 7/1/33-5/1/48 | | | | 96,954,159 | | | | 104,475,430 | |
Federal National Mortgage Association (FNMA) | | | 3.500 | % | | | 9/1/33-3/1/57 | | | | 1,094,693,032 | | | | 1,126,523,923 | |
Federal National Mortgage Association (FNMA) | | | 3.000 | % | | | 7/15/34-7/1/49 | | | | 110,000,000 | | | | 111,424,630 | (i) |
Federal National Mortgage Association (FNMA) | | | 3.500 | % | | | 7/15/34 | | | | 234,100,000 | | | | 241,654,601 | (i) |
Federal National Mortgage Association (FNMA) | | | 5.500 | % | | | 11/1/36-9/1/56 | | | | 34,216,571 | | | | 37,093,866 | |
Federal National Mortgage Association (FNMA) | | | 3.000 | % | | | 12/1/37-11/1/48 | | | | 455,538,666 | | | | 462,279,035 | |
Federal National Mortgage Association (FNMA) | | | 4.000 | % | | | 4/1/42-6/1/57 | | | | 468,646,082 | | | | 492,747,248 | |
Federal National Mortgage Association (FNMA) | | | 4.500 | % | | | 7/1/49 | | | | 175,800,000 | | | | 183,729,890 | (i) |
Federal National Mortgage Association (FNMA) | | | 5.000 | % | | | 7/1/49 | | | | 48,300,000 | | | | 51,063,100 | (i) |
See Notes to Financial Statements.
| | |
| | |
| 44 | | Western Asset Core Plus Bond Fund 2019 Semi-Annual Report |
Western Asset Core Plus Bond Fund
| | | | | | | | | | | | | | | | |
| Security | | Rate | | | Maturity
Date | | | Face
Amount† | | | Value | |
FNMA — continued | | | | | | | | | | | | | | | | |
Federal National Mortgage Association (FNMA) | | | 4.000 | % | | | 7/15/49 | | | | 129,400,000 | | | $ | 133,749,557 | (i) |
Federal National Mortgage Association (FNMA) (Federal Reserve US 12 mo. Cumulative Average 1 Year CMT + 1.944%) | | | 4.409 | % | | | 11/1/35 | | | | 31,265 | | | | 32,411 | (c) |
Total FNMA | | | | | | | | | | | | | | | 3,425,197,251 | |
GNMA — 7.6% | | | | | | | | | | | | | | | | |
Government National Mortgage Association (GNMA) | | | 7.500 | % | | | 3/15/23-9/15/31 | | | | 27,988 | | | | 30,175 | |
Government National Mortgage Association (GNMA) | | | 7.000 | % | | | 9/15/23-7/15/31 | | | | 67,930 | | | | 74,376 | |
Government National Mortgage Association (GNMA) | | | 6.500 | % | | | 4/15/28-1/15/39 | | | | 2,712,237 | | | | 3,101,276 | |
Government National Mortgage Association (GNMA) | | | 6.000 | % | | | 1/15/29-2/15/37 | | | | 6,983,900 | | | | 7,819,586 | |
Government National Mortgage Association (GNMA) | | | 8.000 | % | | | 12/15/30-1/15/31 | | | | 10,422 | | | | 10,623 | |
Government National Mortgage Association (GNMA) | | | 5.500 | % | | | 7/15/33-6/15/36 | | | | 5,910,935 | | | | 6,637,055 | |
Government National Mortgage Association (GNMA) | | | 3.000 | % | | | 9/15/42-11/15/42 | | | | 37,414,223 | | | | 38,309,586 | |
Government National Mortgage Association (GNMA) | | | 4.000 | % | | | 4/15/47-4/15/48 | | | | 28,515,117 | | | | 30,654,039 | |
Government National Mortgage Association (GNMA) | | | 3.500 | % | | | 6/15/48 | | | | 8,367,307 | | | | 8,682,175 | |
Government National Mortgage Association (GNMA) II | | | 5.000 | % | | | 4/20/35-1/20/49 | | | | 196,068,951 | | | | 205,697,897 | |
Government National Mortgage Association (GNMA) II | | | 6.500 | % | | | 10/20/37 | | | | 1,659,361 | | | | 1,968,754 | |
Government National Mortgage Association (GNMA) II | | | 6.000 | % | | | 9/20/38-11/20/41 | | | | 4,182,043 | | | | 4,762,354 | |
Government National Mortgage Association (GNMA) II | | | 4.500 | % | | | 1/20/40-3/20/49 | | | | 375,154,331 | | | | 392,905,190 | |
Government National Mortgage Association (GNMA) II | | | 3.500 | % | | | 6/20/44-11/20/47 | | | | 58,689,286 | | | | 60,777,298 | |
Government National Mortgage Association (GNMA) II | | | 4.000 | % | | | 3/20/45-1/20/49 | | | | 190,181,383 | | | | 198,135,820 | |
Government National Mortgage Association (GNMA) II | | | 3.000 | % | | | 1/20/47-3/20/48 | | | | 267,468,185 | | | | 273,808,205 | |
See Notes to Financial Statements.
| | |
| | |
| Western Asset Core Plus Bond Fund 2019 Semi-Annual Report | | 45 |
Schedule of investments(unaudited) (cont’d)
June 30, 2019
Western Asset Core Plus Bond Fund
| | | | | | | | | | | | | | | | |
| Security | | Rate | | | Maturity
Date | | | Face
Amount† | | | Value | |
GNMA — continued | | | | | | | | | | | | | | | | |
Government National Mortgage Association (GNMA) II | | | 4.000 | % | | | 7/15/49 | | | | 164,600,000 | | | $ | 170,643,908 | (i) |
Government National Mortgage Association (GNMA) II | | | 3.000 | % | | | 7/20/49 | | | | 80,000,000 | | | | 81,759,374 | (i) |
Government National Mortgage Association (GNMA) II | | | 3.500 | % | | | 7/20/49-8/20/49 | | | | 547,100,000 | | | | 565,179,903 | (i) |
Government National Mortgage Association (GNMA) II | | | 4.500 | % | | | 7/20/49 | | | | 23,800,000 | | | | 24,811,268 | (i) |
Total GNMA | | | | | | | | | | | | | | | 2,075,768,862 | |
Total Mortgage-Backed Securities (Cost — $7,519,904,979) | | | | | | | | 7,635,570,746 | |
| U.S. Government & Agency Obligations — 14.4% | |
U.S. Government Agencies — 0.6% | | | | | | | | | | | | | | | | |
Federal Home Loan Bank (FHLB), Global Bonds | | | 5.500 | % | | | 7/15/36 | | | | 2,585,000 | | | | 3,612,370 | |
Federal National Mortgage Association (FNMA), Notes | | | 6.625 | % | | | 11/15/30 | | | | 45,010,000 | | | | 64,405,061 | |
Federal National Mortgage Association (FNMA), Subordinated Notes | | | 0.000 | % | | | 10/9/19 | | | | 83,870,000 | | | | 83,348,642 | |
Total U.S. Government Agencies | | | | 151,366,073 | |
U.S. Government Obligations — 13.8% | |
Department of Housing and Urban Development, Notes | | | 2.850 | % | | | 8/1/24 | | | | 4,537,000 | | | | 4,735,054 | |
Department of Housing and Urban Development, Senior Notes | | | 2.450 | % | | | 8/1/22 | | | | 9,000,000 | | | | 9,164,846 | |
U.S. Treasury Bonds | | | 3.750 | % | | | 11/15/43 | | | | 409,880,000 | | | | 504,656,745 | |
U.S. Treasury Bonds | | | 2.500 | % | | | 2/15/45 | | | | 266,460,000 | | | | 265,518,021 | |
U.S. Treasury Bonds | | | 3.000 | % | | | 5/15/45 | | | | 484,294,000 | | | | 529,715,479 | |
U.S. Treasury Bonds | | | 2.875 | % | | | 8/15/45 | | | | 529,920,000 | | | | 566,496,901 | |
U.S. Treasury Bonds | | | 2.750 | % | | | 8/15/47 | | | | 379,513,000 | | | | 396,161,169 | |
U.S. Treasury Bonds | | | 2.750 | % | | | 11/15/47 | | | | 206,740,000 | | | | 215,833,331 | |
U.S. Treasury Bonds | | | 3.000 | % | | | 2/15/48 | | | | 19,420,000 | | | | 21,278,934 | |
U.S. Treasury Bonds | | | 3.125 | % | | | 5/15/48 | | | | 150,460,000 | | | | 168,864,902 | |
U.S. Treasury Bonds | | | 3.000 | % | | | 8/15/48 | | | | 108,599,000 | | | | 119,123,770 | |
U.S. Treasury Bonds | | | 3.000 | % | | | 2/15/49 | | | | 18,625,000 | | | | 20,459,126 | |
U.S. Treasury Bonds | | | 2.875 | % | | | 5/15/49 | | | | 229,390,000 | | | | 246,128,302 | |
U.S. Treasury Notes | | | 2.750 | % | | | 9/30/20 | | | | 93,520,000 | | | | 94,511,824 | |
U.S. Treasury Notes | | | 2.000 | % | | | 12/31/21 | | | | 13,510,000 | | | | 13,603,145 | |
U.S. Treasury Notes | | | 1.875 | % | | | 2/28/22 | | | | 43,670,000 | | | | 43,838,880 | |
U.S. Treasury Notes | | | 1.875 | % | | | 4/30/22 | | | | 71,400,000 | | | | 71,699,824 | |
U.S. Treasury Notes | | | 2.125 | % | | | 5/15/22 | | | | 1,410,000 | | | | 1,426,000 | |
See Notes to Financial Statements.
| | |
| | |
| 46 | | Western Asset Core Plus Bond Fund 2019 Semi-Annual Report |
Western Asset Core Plus Bond Fund
| | | | | | | | | | | | | | | | |
| Security | | Rate | | | Maturity
Date | | | Face
Amount† | | | Value | |
U.S. Government Obligations — continued | |
U.S. Treasury Notes | | | 2.875 | % | | | 9/30/23 | | | | 560,000 | | | $ | 585,911 | |
U.S. Treasury Notes | | | 1.750 | % | | | 6/30/24 | | | | 190,440,000 | | | | 190,376,768 | |
U.S. Treasury Notes | | | 3.000 | % | | | 9/30/25 | | | | 69,500,000 | | | | 74,260,478 | |
U.S. Treasury Notes | | | 1.875 | % | | | 6/30/26 | | | | 207,400,000 | | | | 207,501,269 | |
U.S. Treasury Notes | | | 3.125 | % | | | 11/15/28 | | | | 5,000 | | | | 5,485 | |
U.S. Treasury Strip Principal (STRIPS) | | | 0.000 | % | | | 11/15/24 | | | | 6,080,000 | | | | 5,524,962 | |
Total U.S. Government Obligations | | | | | | | | | | | | 3,771,471,126 | |
Total U.S. Government & Agency Obligations (Cost — $3,650,340,702) | | | | 3,922,837,199 | |
| Collateralized Mortgage Obligations (j) — 9.7% | |
Alternative Loan Trust,2006-6CB 1A4 | | | 5.500 | % | | | 5/25/36 | | | | 5,476,641 | | | | 5,174,443 | |
Alternative Loan Trust, 2006-18CB A6(-4.000 x 1 mo. USD LIBOR + 28.600%) | | | 18.982 | % | | | 7/25/36 | | | | 7,682,154 | | | | 12,013,749 | (c) |
Alternative Loan Trust, 2006-23CB 2A6, PAC(-4.000 x 1 mo. USD LIBOR + 28.400%) | | | 18.782 | % | | | 8/25/36 | | | | 3,064,904 | | | | 4,430,209 | (c) |
Alternative Loan Trust, 2006-43CB 1A10 | | | 6.000 | % | | | 2/25/37 | | | | 5,520,058 | | | | 4,652,800 | |
Alternative Loan Trust, 2006-43CB 3A3(-1.000 x 1 mo. USD LIBOR + 6.630%) | | | 4.226 | % | | | 2/25/37 | | | | 14,859,842 | | | | 4,120,905 | (c) |
Alternative Loan Trust,2006-OA9 2A1B (1 mo. USD LIBOR + 0.200%) | | | 2.583 | % | | | 7/20/46 | | | | 439,938 | | | | 348,117 | (c) |
Banc of America Funding Trust,2015-R2 3A1 (1 mo. USD LIBOR + 0.260%) | | | 2.664 | % | | | 4/29/37 | | | | 7,130,891 | | | | 7,140,023 | (a)(c) |
Banc of America Funding Trust,2015-R2 3A2 (1 mo. USD LIBOR + 0.260%) | | | 2.664 | % | | | 4/29/37 | | | | 25,428,000 | | | | 25,069,796 | (a)(c) |
Banc of America Funding Trust,2015-R2 10A1 (1 mo. USD LIBOR + 0.190%) | | | 2.594 | % | | | 6/29/37 | | | | 7,882,387 | | | | 7,898,848 | (a)(c) |
BBCCRE Trust,2015-GTP E | | | 4.715 | % | | | 8/10/33 | | | | 33,260,000 | | | | 30,573,280 | (a)(c) |
BBCMS Trust,2018-CBM D (1 mo. USD LIBOR + 2.391%) | | | 4.785 | % | | | 7/15/37 | | | | 16,390,000 | | | | 16,482,063 | (a)(c) |
BCAP LLC Trust,2010-RR9 6A2 | | | 6.000 | % | | | 10/26/35 | | | | 14,564,841 | | | | 13,290,490 | (a)(c) |
Bear Stearns Asset Backed Securities I Trust,2004-AC6 A1 | | | 5.750 | % | | | 11/25/34 | | | | 3,178,448 | | | | 3,210,049 | |
See Notes to Financial Statements.
| | |
| | |
| Western Asset Core Plus Bond Fund 2019 Semi-Annual Report | | 47 |
Schedule of investments(unaudited) (cont’d)
June 30, 2019
Western Asset Core Plus Bond Fund
| | | | | | | | | | | | | | | | |
| Security | | Rate | | | Maturity
Date | | | Face
Amount† | | | Value | |
| Collateralized Mortgage Obligations (j) — continued | |
Bear Stearns Asset Backed Securities I Trust,2006-AC4 A2(-4.33% x 1 mo. USD LIBOR + 33.583%) | | | 23.165 | % | | | 7/25/36 | | | | 3,060,921 | | | $ | 5,103,128 | (c) |
Bear Stearns Mortgage Funding Trust,2007-AR2 A1 (1 mo. USD LIBOR + 0.170%) | | | 2.574 | % | | | 3/25/37 | | | | 19,084,338 | | | | 17,857,402 | (c) |
BHMS Mortgage Trust,2018-MZB (1 mo. USD LIBOR + 6.637%) | | | 9.031 | % | | | 7/15/20 | | | | 93,060,000 | | | | 94,037,242 | (a)(c) |
BMO Capital Markets II, 3945 A30 | | | 3.000 | % | | | 7/1/49 | | | | 14,000,000 | | | | 14,131,250 | (e)(k) |
Chevy Chase Funding LLC Mortgage-Backed Certificates Series,2005-4A A1 (1 mo. USD LIBOR + 0.200%) | | | 2.604 | % | | | 10/25/36 | | | | 392,323 | | | | 380,271 | (a)(c) |
CHT Mortgage Trust, 2017-CSMO A (1 mo. USD LIBOR + 0.930%) | | | 3.324 | % | | | 11/15/36 | | | | 17,095,000 | | | | 17,130,168 | (a)(c) |
Citigroup Commercial Mortgage Trust, 2014-GC25 AS | | | 4.017 | % | | | 10/10/47 | | | | 2,800,000 | | | | 2,961,437 | |
Citigroup Commercial Mortgage Trust,2017-P7 B | | | 4.137 | % | | | 4/14/50 | | | | 9,194,000 | | | | 9,734,925 | (c) |
Citigroup Mortgage Loan Trust,2006-AR9 1A4 (1 mo. USD LIBOR + 0.240%) | | | 2.644 | % | | | 11/25/36 | | | | 1,504,916 | | | | 1,515,509 | (c) |
Citigroup Mortgage Loan Trust Inc.,2005-5 1A5 | | | 2.978 | % | | | 8/25/35 | | | | 62,778 | | | | 55,004 | (c) |
Commercial Mortgage Pass-Through Certificates,2014-CR21 A3 | | | 3.528 | % | | | 12/10/47 | | | | 587,459 | | | | 615,795 | |
Commercial Mortgage Pass-Through Certificates,2015-DC1 C | | | 4.490 | % | | | 2/10/48 | | | | 3,070,000 | | | | 3,150,343 | (c) |
Commercial Mortgage Trust, 2013- CR12 AM | | | 4.300 | % | | | 10/10/46 | | | | 1,723,000 | | | | 1,836,105 | |
Commercial Mortgage Trust, 2013- CR12 B | | | 4.762 | % | | | 10/10/46 | | | | 1,470,000 | | | | 1,537,288 | (c) |
Commercial Mortgage Trust, 2013- CR12 C | | | 5.254 | % | | | 10/10/46 | | | | 730,000 | | | | 764,925 | (c) |
Commercial Mortgage Trust, 2014- CR19 B | | | 4.703 | % | | | 8/10/47 | | | | 8,410,000 | | | | 9,132,879 | (c) |
Commercial Mortgage Trust, 2014- CR21 C | | | 4.580 | % | | | 12/10/47 | | | | 11,948,000 | | | | 12,567,515 | (c) |
Commercial Mortgage Trust, 2015- DC1 B | | | 4.035 | % | | | 2/10/48 | | | | 7,160,000 | | | | 7,431,224 | (c) |
See Notes to Financial Statements.
| | |
| | |
| 48 | | Western Asset Core Plus Bond Fund 2019 Semi-Annual Report |
Western Asset Core Plus Bond Fund
| | | | | | | | | | | | | | | | |
| Security | | Rate | | | Maturity
Date | | | Face
Amount† | | | Value | |
| Collateralized Mortgage Obligations (j) — continued | |
Credit Suisse Commercial Mortgage Trust,2006-C3 AJ | | | 6.701 | % | | | 6/15/38 | | | | 1,518,342 | | | $ | 859,903 | (c) |
Credit Suisse Commercial Mortgage Trust,2006-C5 AJ | | | 5.373 | % | | | 12/15/39 | | | | 5,899,773 | | | | 4,009,521 | |
Credit Suisse Commercial Mortgage Trust,2007-C5 AM | | | 5.869 | % | | | 9/15/40 | | | | 4,694,670 | | | | 3,574,946 | (c) |
Credit Suisse Mortgage Trust, 2014- USA A2 | | | 3.953 | % | | | 9/15/37 | | | | 12,520,000 | | | | 13,303,872 | (a) |
Credit Suisse Mortgage Trust, 2014- USA E | | | 4.373 | % | | | 9/15/37 | | | | 1,970,000 | | | | 1,860,485 | (a) |
Credit Suisse Mortgage Trust,2015-2R 7A1 | | | 4.399 | % | | | 8/27/36 | | | | 17,226,761 | | | | 17,480,956 | (a)(c) |
Credit Suisse Mortgage Trust, 2017- CHOP G (1 mo. USD LIBOR + 5.620%) | | | 8.014 | % | | | 7/15/32 | | | | 23,400,000 | | | | 23,127,133 | (a)(c) |
CSMC Trust,2014-USA D | | | 4.373 | % | | | 9/15/37 | | | | 10,950,000 | | | | 10,834,770 | (a) |
CSMC Trust,2015-4R 3A3 (1 mo. USD LIBOR + 0.310%) | | | 3.050 | % | | | 10/27/36 | | | | 48,456,954 | | | | 27,887,370 | (a)(c) |
CSMC Trust, 2015-GLPA A | | | 3.881 | % | | | 11/15/37 | | | | 4,004,378 | | | | 4,331,984 | (a) |
CSMC Trust, 2017-TIME A | �� | | 3.646 | % | | | 11/13/39 | | | | 21,200,000 | | | | 22,076,690 | (a) |
CSMC Trust,2018-J1 A2 | | | 3.500 | % | | | 2/25/48 | | | | 204,692,003 | | | | 205,283,727 | (a)(c) |
CSMC Trust, 2018-PLUM A (1 mo. USD LIBOR + 3.231%) | | | 5.626 | % | | | 8/15/20 | | | | 27,975,000 | | | | 28,010,248 | (a)(c) |
Federal Home Loan Mortgage Corp. (FHLMC) Multifamily Structured Pass-Through Certificates, K007 X1, IO | | | 1.202 | % | | | 4/25/20 | | | | 59,740,935 | | | | 302,564 | (c) |
Federal Home Loan Mortgage Corp. (FHLMC) Multifamily Structured Pass-Through Certificates, K015 X1, IO | | | 1.730 | % | | | 7/25/21 | | | | 19,326,250 | | | | 523,600 | (c) |
Federal Home Loan Mortgage Corp. (FHLMC) Multifamily Structured Pass-Through Certificates, K016 X1, IO | | | 1.638 | % | | | 10/25/21 | | | | 7,329,371 | | | | 217,704 | (c) |
Federal Home Loan Mortgage Corp. (FHLMC) Multifamily Structured Pass-Through Certificates, K091 A2 | | | 3.505 | % | | | 3/25/29 | | | | 28,490,000 | | | | 30,959,177 | |
See Notes to Financial Statements.
| | |
| | |
| Western Asset Core Plus Bond Fund 2019 Semi-Annual Report | | 49 |
Schedule of investments(unaudited) (cont’d)
June 30, 2019
Western Asset Core Plus Bond Fund
| | | | | | | | | | | | | | | | |
| Security | | Rate | | | Maturity
Date | | | Face
Amount† | | | Value | |
| Collateralized Mortgage Obligations (j) — continued | |
Federal Home Loan Mortgage Corp. (FHLMC) Multifamily Structured Pass-Through Certificates, K092 X1, IO | | | 0.852 | % | | | 4/25/29 | | | | 41,779,322 | | | $ | 2,536,502 | (c) |
Federal Home Loan Mortgage Corp. (FHLMC) Reference REMIC, R007 ZA | | | 6.000 | % | | | 5/15/36 | | | | 7,552,552 | | | | 8,663,949 | |
Federal Home Loan Mortgage Corp. (FHLMC) REMIC, 2957 ZA, PAC | | | 5.000 | % | | | 3/15/35 | | | | 11,855,233 | | | | 13,005,013 | |
Federal Home Loan Mortgage Corp. (FHLMC) REMIC, 3242 SC, IO(-1.000 x 1 mo. USD LIBOR + 6.290%) | | | 3.896 | % | | | 11/15/36 | | | | 1,309,509 | | | | 215,015 | (c) |
Federal Home Loan Mortgage Corp. (FHLMC) REMIC, 3281 AI, IO(-1.000 x 1 mo. USD LIBOR + 6.430%) | | | 4.036 | % | | | 2/15/37 | | | | 7,119,460 | | | | 1,224,282 | (c) |
Federal Home Loan Mortgage Corp. (FHLMC) REMIC, 3368 AI, IO(-1.000 x 1 mo. USD LIBOR + 6.030%) | | | 3.636 | % | | | 9/15/37 | | | | 1,919,847 | | | | 279,232 | (c) |
Federal Home Loan Mortgage Corp. (FHLMC) REMIC, 3422 AI, IO | | | 0.250 | % | | | 1/15/38 | | | | 811,498 | | | | 4,771 | |
Federal Home Loan Mortgage Corp. (FHLMC) REMIC, 3621 SB, IO(-1.000 x 1 mo. USD LIBOR + 6.230%) | | | 3.836 | % | | | 1/15/40 | | | | 2,886,097 | | | | 450,200 | (c) |
Federal Home Loan Mortgage Corp. (FHLMC) REMIC, 3639 EY | | | 5.000 | % | | | 2/15/30 | | | | 5,183,602 | | | | 5,544,945 | |
Federal Home Loan Mortgage Corp. (FHLMC) REMIC,3768 MB, PAC-1 | | | 4.000 | % | | | 12/15/39 | | | | 16,829,328 | | | | 17,600,959 | |
Federal Home Loan Mortgage Corp. (FHLMC) REMIC, 3947 SG, IO(-1.000 x 1 mo. USD LIBOR + 5.950%) | | | 3.556 | % | | | 10/15/41 | | | | 8,573,208 | | | | 1,322,799 | (c) |
Federal Home Loan Mortgage Corp. (FHLMC) REMIC, 3973 SA, IO(-1.000 x 1 mo. USD LIBOR + 6.490%) | | | 4.096 | % | | | 12/15/41 | | | | 5,439,360 | | | | 1,131,707 | (c) |
Federal Home Loan Mortgage Corp. (FHLMC) REMIC, 4054 SA, IO(-1.000 x 1 mo. USD LIBOR + 6.050%) | | | 3.656 | % | | | 8/15/39 | | | | 3,273,138 | | | | 523,872 | (c) |
Federal Home Loan Mortgage Corp. (FHLMC) REMIC, 4099 ST, IO(-1.000 x 1 mo. USD LIBOR + 6.000%) | | | 3.606 | % | | | 8/15/42 | | | | 1,817,832 | | | | 318,681 | (c) |
Federal Home Loan Mortgage Corp. (FHLMC) REMIC, 4119 IN, IO | | | 3.500 | % | | | 10/15/32 | | | | 4,605,695 | | | | 570,045 | |
Federal Home Loan Mortgage Corp. (FHLMC) REMIC, 4146 DI, IO | | | 3.000 | % | | | 12/15/31 | | | | 3,445,912 | | | | 299,132 | |
See Notes to Financial Statements.
| | |
| | |
| 50 | | Western Asset Core Plus Bond Fund 2019 Semi-Annual Report |
Western Asset Core Plus Bond Fund
| | | | | | | | | | | | | | | | |
| Security | | Rate | | | Maturity
Date | | | Face
Amount† | | | Value | |
| Collateralized Mortgage Obligations (j) — continued | |
Federal Home Loan Mortgage Corp. (FHLMC) REMIC, 4174 SA, IO(-1.000 x 1 mo. USD LIBOR + 6.200%) | | | 3.806 | % | | | 5/15/39 | | | | 3,099,619 | | | $ | 265,841 | (c) |
Federal Home Loan Mortgage Corp. (FHLMC) REMIC, 4203 PS, IO, PAC(-1.000 x 1 mo. USD LIBOR + 6.250%) | | | 3.856 | % | | | 9/15/42 | | | | 3,264,394 | | | | 490,747 | (c) |
Federal Home Loan Mortgage Corp. (FHLMC) REMIC, 4239 IO, IO | | | 3.500 | % | | | 6/15/27 | | | | 3,630,400 | | | | 295,981 | |
Federal Home Loan Mortgage Corp. (FHLMC) REMIC, 4298 PI, IO, PAC | | | 4.000 | % | | | 4/15/43 | | | | 2,595,466 | | | | 278,460 | |
Federal Home Loan Mortgage Corp. (FHLMC) REMIC, 4415 IO, IO | | | 1.753 | % | | | 4/15/41 | | | | 7,006,326 | | | | 393,074 | (c) |
Federal Home Loan Mortgage Corp. (FHLMC) REMIC, 4793 CB | | | 3.000 | % | | | 5/15/48 | | | | 47,514,118 | | | | 48,208,128 | |
Federal Home Loan Mortgage Corp. (FHLMC) REMIC, 4793 CD | | | 3.000 | % | | | 6/15/48 | | | | 35,980,530 | | | | 36,508,591 | |
Federal Home Loan Mortgage Corp. (FHLMC) REMIC, 4813 CJ | | | 3.000 | % | | | 8/15/48 | | | | 50,677,768 | | | | 51,463,820 | |
Federal Home Loan Mortgage Corp. (FHLMC) STRIPS, 283 IO, IO | | | 3.500 | % | | | 10/15/27 | | | | 885,659 | | | | 78,032 | |
Federal Home Loan Mortgage Corp. (FHLMC) STRIPS, 328 S4, IO | | | 1.817 | % | | | 2/15/38 | | | | 1,309,095 | | | | 91,905 | |
Federal Home Loan Mortgage Corp. (FHLMC) STRIPS, 334 S7, IO(-1.000 x 1 mo. USD LIBOR + 6.100%) | | | 3.706 | % | | | 8/15/44 | | | | 10,683,210 | | | | 2,163,943 | (c) |
Federal Home Loan Mortgage Corp. (FHLMC) STRIPS, 353 S1, IO(-1.000 x 1 mo. USD LIBOR + 6.000%) | | | 3.606 | % | | | 12/15/46 | | | | 23,635,928 | | | | 3,913,871 | (c) |
Federal Home Loan Mortgage Corp. (FHLMC) Structured Agency Credit Risk Debt Notes, 2018-DNA1 M2 (1 mo. USD LIBOR + 1.800%) | | | 4.204 | % | | | 7/25/30 | | | | 55,580,000 | | | | 55,353,411 | (a)(c) |
Federal National Mortgage Association (FNMA) — CAS,2014-C03 1M1 (1 mo. USD LIBOR + 3.000%) | | | 5.404 | % | | | 7/25/24 | | | | 68,581,371 | | | | 71,968,989 | (c) |
Federal National Mortgage Association (FNMA) — CAS,2015-C01 2M2 (1 mo. USD LIBOR + 4.550%) | | | 6.954 | % | | | 2/25/25 | | | | 4,600,324 | | | | 4,844,054 | (c) |
Federal National Mortgage Association (FNMA) — CAS,2015-C03 1M2 (1 mo. USD LIBOR + 5.000%) | | | 7.404 | % | | | 7/25/25 | | | | 26,089,023 | | | | 28,572,014 | (a)(c) |
See Notes to Financial Statements.
| | |
| | |
| Western Asset Core Plus Bond Fund 2019 Semi-Annual Report | | 51 |
Schedule of investments(unaudited) (cont’d)
June 30, 2019
Western Asset Core Plus Bond Fund
| | | | | | | | | | | | | | | | |
| Security | | Rate | | | Maturity
Date | | | Face
Amount† | | | Value | |
| Collateralized Mortgage Obligations (j) — continued | |
Federal National Mortgage Association (FNMA) — CAS,2017-C03 1M1 (1 mo. USD LIBOR + 0.950%) | | | 3.354 | % | | | 10/25/29 | | | | 21,761,032 | | | $ | 21,825,349 | (a)(c) |
Federal National Mortgage Association (FNMA) — CAS,2018-C05 1B1 (1 mo. USD LIBOR + 4.250%) | | | 6.654 | % | | | 1/25/31 | | | | 19,130,000 | | | | 20,244,564 | (a)(c) |
Federal National Mortgage Association (FNMA) ACES,2019-M1 A2 | | | 3.673 | % | | | 9/25/28 | | | | 65,930,000 | | | | 71,620,629 | (c) |
Federal National Mortgage Association (FNMA) ACES,2019-M4 A2 | | | 3.610 | % | | | 2/25/31 | | | | 12,170,000 | | | | 13,248,688 | |
Federal National Mortgage Association (FNMA) ACES,2019-M5 A2 | | | 3.273 | % | | | 1/25/29 | | | | 22,830,000 | | | | 24,147,359 | |
Federal National Mortgage Association (FNMA) ACES,2019-M6 A2 | | | 3.450 | % | | | 1/1/29 | | | | 25,350,000 | | | | 27,158,943 | |
Federal National Mortgage Association (FNMA) ACES,2019-M10 A2 | | | 3.300 | % | | | 12/1/37 | | | | 3,180,000 | | | | 3,372,630 | |
Federal National Mortgage Association (FNMA) REMIC,2005-88 IP, IO | | | 1.625 | % | | | 10/25/35 | | | | 2,912,213 | | | | 280,751 | (c) |
Federal National Mortgage Association (FNMA) REMIC,2006-28 IP, IO | | | 1.767 | % | | | 4/25/36 | | | | 1,817,978 | | | | 141,161 | |
Federal National Mortgage Association (FNMA) REMIC,2006-59 IP, IO | | | 2.676 | % | | | 7/25/36 | | | | 3,826,641 | | | | 436,876 | (c) |
Federal National Mortgage Association (FNMA) REMIC,2006-118 IP1, IO | | | 2.537 | % | | | 12/25/36 | | | | 4,765,937 | | | | 465,123 | (c) |
Federal National Mortgage Association (FNMA) REMIC,2006-118 IP2, IO | | | 2.656 | % | | | 12/25/36 | | | | 5,670,643 | | | | 547,798 | (c) |
Federal National Mortgage Association (FNMA) REMIC,2010-27 AS, IO(-1.000 x 1 mo. USD LIBOR + 6.480%) | | | 4.076 | % | | | 4/25/40 | | | | 2,290,833 | | | | 443,067 | (c) |
Federal National Mortgage Association (FNMA) REMIC,2010-123 PM, PAC | | | 4.000 | % | | | 7/25/40 | | | | 18,489,638 | | | | 19,242,000 | |
Federal National Mortgage Association (FNMA) REMIC,2011-59 NZ | | | 5.500 | % | | | 7/25/41 | | | | 1,081,187 | | | | 1,221,247 | |
Federal National Mortgage Association (FNMA) REMIC,2011-99 KS, IO(-1.000 x 1 mo. USD LIBOR + 6.700%) | | | 4.296 | % | | | 10/25/26 | | | | 1,153,214 | | | | 109,102 | (c) |
See Notes to Financial Statements.
| | |
| | |
| 52 | | Western Asset Core Plus Bond Fund 2019 Semi-Annual Report |
Western Asset Core Plus Bond Fund
| | | | | | | | | | | | | | | | |
| Security | | Rate | | | Maturity
Date | | | Face
Amount† | | | Value | |
| Collateralized Mortgage Obligations (j) — continued | |
Federal National Mortgage Association (FNMA) REMIC,2012-28 B | | | 6.500 | % | | | 6/25/39 | | | | 1,378,064 | | | $ | 1,489,182 | |
Federal National Mortgage Association (FNMA) REMIC,2012-035 SC, IO(-1.000% x 1 mo. USD LIBOR + 6.500%) | | | 4.096 | % | | | 4/25/42 | | | | 2,953,808 | | | | 513,381 | (c) |
Federal National Mortgage Association (FNMA) REMIC,2012-046 BA | | | 6.000 | % | | | 5/25/42 | | | | 4,383,532 | | | | 4,840,535 | |
Federal National Mortgage Association (FNMA) REMIC,2012-51 B | | | 7.000 | % | | | 5/25/42 | | | | 6,549,961 | | | | 7,833,496 | |
Federal National Mortgage Association (FNMA) REMIC,2012-070 YS, IO(-1.000 x 1 mo. USD LIBOR + 6.650%) | | | 4.246 | % | | | 2/25/41 | | | | 1,310,327 | | | | 126,795 | (c) |
Federal National Mortgage Association (FNMA) REMIC,2012-074 OA, PO | | | 0.000 | % | | | 3/25/42 | | | | 434,189 | | | | 392,734 | |
Federal National Mortgage Association (FNMA) REMIC,2012-074 SA, IO(-1.000 x 1 mo. USD LIBOR + 6.650%) | | | 4.246 | % | | | 3/25/42 | | | | 4,921,995 | | | | 705,230 | (c) |
Federal National Mortgage Association (FNMA) REMIC,2012-075 AO, PO | | | 0.000 | % | | | 3/25/42 | | | | 259,802 | | | | 234,997 | |
Federal National Mortgage Association (FNMA) REMIC,2012-75 NS, IO(-1.000 x 1 mo. USD LIBOR + 6.600%) | | | 4.196 | % | | | 7/25/42 | | | | 687,247 | | | | 127,338 | (c) |
Federal National Mortgage Association (FNMA) REMIC,2012-93 UI, IO | | | 3.000 | % | | | 9/25/27 | | | | 1,516,202 | | | | 109,369 | |
Federal National Mortgage Association (FNMA) REMIC,2012-101 BI, IO | | | 4.000 | % | | | 9/25/27 | | | | 2,244,663 | | | | 173,691 | |
Federal National Mortgage Association (FNMA) REMIC,2012-133 CS, IO(-1.000 x 1 mo. USD LIBOR + 6.150%) | | | 3.746 | % | | | 12/25/42 | | | | 4,103,488 | | | | 739,450 | (c) |
Federal National Mortgage Association (FNMA) REMIC,2012-134 MS, IO(-1.000 x 1 mo. USD LIBOR + 6.150%) | | | 3.746 | % | | | 12/25/42 | | | | 3,077,079 | | | | 608,740 | (c) |
See Notes to Financial Statements.
| | |
| | |
| Western Asset Core Plus Bond Fund 2019 Semi-Annual Report | | 53 |
Schedule of investments(unaudited) (cont’d)
June 30, 2019
Western Asset Core Plus Bond Fund
| | | | | | | | | | | | | | | | |
| Security | | Rate | | | Maturity
Date | | | Face
Amount† | | | Value | |
| Collateralized Mortgage Obligations (j) — continued | |
Federal National Mortgage Association (FNMA) REMIC,2012-134 SK, IO(-1.000 x 1 mo. LIBOR + 6.150%) | | | 3.746 | % | | | 12/25/42 | | | | 10,546,622 | | | $ | 1,848,041 | (c) |
Federal National Mortgage Association (FNMA) REMIC,2013-9 BC | | | 6.500 | % | | | 7/25/42 | | | | 5,845,192 | | | | 6,820,256 | |
Federal National Mortgage Association (FNMA) REMIC,2013-9 CB | | | 5.500 | % | | | 4/25/42 | | | | 16,464,661 | | | | 18,447,608 | |
Federal National Mortgage Association (FNMA) REMIC,2013-9 SA, IO(-1.000 x 1 mo. LIBOR + 6.150%) | | | 3.746 | % | | | 3/25/42 | | | | 5,354,348 | | | | 721,210 | (c) |
Federal National Mortgage Association (FNMA) REMIC,2013-014 IG, IO | | | 4.000 | % | | | 3/25/43 | | | | 8,237,584 | | | | 1,197,825 | |
Federal National Mortgage Association (FNMA) REMIC,2013-026 HI, IO | | | 3.000 | % | | | 4/25/32 | | | | 4,665,278 | | | | 303,727 | |
Federal National Mortgage Association (FNMA) REMIC,2013-029 QI, IO | | | 4.000 | % | | | 4/25/43 | | | | 8,067,156 | | | | 1,127,420 | |
Federal National Mortgage Association (FNMA) REMIC,2013-54 BS, IO(-1.000 x 1 mo. USD LIBOR + 6.150%) | | | 3.746 | % | | | 6/25/43 | | | | 7,917,591 | | | | 1,642,729 | (c) |
Federal National Mortgage Association (FNMA) REMIC,2013-124 SB, IO(-1.000 x 1 mo. USD LIBOR + 5.950%) | | | 3.546 | % | | | 12/25/43 | | | | 16,194,076 | | | | 2,973,621 | (c) |
Federal National Mortgage Association (FNMA) REMIC,2014-47 AI, IO | | | 1.835 | % | | | 8/25/44 | | | | 6,764,190 | | | | 387,878 | (c) |
Federal National Mortgage Association (FNMA) REMIC,2015-55 IO, IO | | | 1.604 | % | | | 8/25/55 | | | | 13,516,601 | | | | 736,026 | (c) |
Federal National Mortgage Association (FNMA) REMIC,2015-56 AS, IO(-1.000 x 1 mo. USD LIBOR + 6.150%) | | | 3.746 | % | | | 8/25/45 | | | | 3,563,359 | | | | 798,381 | (c) |
Federal National Mortgage Association (FNMA) REMIC,2016-23 ST, IO(-1.000 x 1 mo. LIBOR + 6.000%) | | | 3.596 | % | | | 11/25/45 | | | | 20,730,511 | | | | 4,290,432 | (c) |
Federal National Mortgage Association (FNMA) REMIC,2016-60 QS, IO(-1.000 x 1 mo. USD LIBOR + 6.100%) | | | 3.696 | % | | | 9/25/46 | | | | 22,297,765 | | | | 3,578,091 | (c) |
Federal National Mortgage Association (FNMA) REMIC,2016-61 BS, IO(-1.000 x 1 mo. LIBOR + 6.100%) | | | 3.696 | % | | | 9/25/46 | | | | 10,143,018 | | | | 1,549,480 | (c) |
See Notes to Financial Statements.
| | |
| | |
| 54 | | Western Asset Core Plus Bond Fund 2019 Semi-Annual Report |
Western Asset Core Plus Bond Fund
| | | | | | | | | | | | | | | | |
| Security | | Rate | | | Maturity
Date | | | Face
Amount† | | | Value | |
| Collateralized Mortgage Obligations (j) — continued | |
Federal National Mortgage Association (FNMA) REMIC,2017-76 SB, IO(-1.000 x 1 mo. USD LIBOR + 6.100%) | | | 3.696 | % | | | 10/25/57 | | | | 42,092,480 | | | $ | 7,759,635 | (c) |
Federal National Mortgage Association (FNMA) REMIC,2017-85 SC, IO(-1.000 x 1 mo. USD LIBOR + 6.200%) | | | 3.796 | % | | | 11/25/47 | | | | 14,039,396 | | | | 2,244,037 | (c) |
Federal National Mortgage Association (FNMA) STRIPS, 390 C3, IO | | | 6.000 | % | | | 7/25/38 | | | | 1,209,861 | | | | 245,506 | |
Federal National Mortgage Association (FNMA) STRIPS, 407 22, IO | | | 5.000 | % | | | 1/25/39 | | | | 546,280 | | | | 91,087 | |
Federal National Mortgage Association (FNMA) STRIPS, 407 23, IO | | | 5.000 | % | | | 1/25/39 | | | | 291,949 | | | | 52,776 | (c) |
Federal National Mortgage Association (FNMA) STRIPS, 407 27, IO | | | 5.500 | % | | | 1/25/39 | | | | 245,587 | | | | 43,636 | (c) |
Federal National Mortgage Association (FNMA) STRIPS, 407 34, IO | | | 5.000 | % | | | 1/25/38 | | | | 341,470 | | | | 55,478 | |
Federal National Mortgage Association (FNMA) STRIPS, 407 41, IO | | | 6.000 | % | | | 1/25/38 | | | | 1,498,087 | | | | 330,082 | |
Federal National Mortgage Association (FNMA) STRIPS, 409 C1, IO | | | 3.000 | % | | | 11/25/26 | | | | 4,640,819 | | | | 320,395 | |
Federal National Mortgage Association (FNMA) STRIPS, 409 C13, IO | | | 3.500 | % | | | 11/25/41 | | | | 5,595,523 | | | | 910,049 | |
Federal National Mortgage Association (FNMA) STRIPS, 409 C18, IO | | | 4.000 | % | | | 4/25/42 | | | | 3,825,233 | | | | 627,880 | |
Federal National Mortgage Association (FNMA) STRIPS, 409 C2, IO | | | 3.000 | % | | | 4/25/27 | | | | 233,264 | | | | 16,700 | |
Federal National Mortgage Association (FNMA) STRIPS, 409 C22, IO | | | 4.500 | % | | | 11/25/39 | | | | 1,640,487 | | | | 303,194 | |
Federal National Mortgage Association (FNMA) STRIPS, 20384 14, IO | | | 5.500 | % | | | 1/25/40 | | | | 632,720 | | | | 131,024 | |
First Horizon Alternative Mortgage Securities Trust,2007-FA3 A1 (1 mo. USD LIBOR + 0.330%) | | | 2.734 | % | | | 6/25/37 | | | | 10,414,245 | | | | 5,588,927 | (c) |
Flagstar Mortgage Trust,2018-2 A4 | | | 3.500 | % | | | 4/25/48 | | | | 82,632,492 | | | | 83,609,373 | (a)(c) |
FREMF Mortgage Trust,2012-K20 X2A, IO | | | 0.200 | % | | | 5/25/45 | | | | 184,329,206 | | | | 887,435 | (a) |
GE Business Loan Trust,2007-1A A (1 mo. USD LIBOR + 0.170%) | | | 2.564 | % | | | 4/15/35 | | | | 3,368,904 | | | | 3,307,440 | (a)(c) |
See Notes to Financial Statements.
| | |
| | |
| Western Asset Core Plus Bond Fund 2019 Semi-Annual Report | | 55 |
Schedule of investments(unaudited) (cont’d)
June 30, 2019
Western Asset Core Plus Bond Fund
| | | | | | | | | | | | | | | | |
| Security | | Rate | | | Maturity
Date | | | Face
Amount† | | | Value | |
| Collateralized Mortgage Obligations (j) — continued | |
GE Capital Commercial Mortgage Corp.,2007-C1 AJ | | | 5.677 | % | | | 12/10/49 | | | | 34,897,000 | | | $ | 8,459,623 | (c) |
Government National Mortgage Association (GNMA),2006-16 GS, IO(-1.000 x 1 mo. LIBOR + 6.990%) | | | 4.607 | % | | | 4/20/36 | | | | 713,502 | | | | 96,822 | (c) |
Government National Mortgage Association (GNMA),2007-51 SG, IO(-1.000 x 1 mo. LIBOR + 6.580%) | | | 4.197 | % | | | 8/20/37 | | | | 2,736,354 | | | | 455,121 | (c) |
Government National Mortgage Association (GNMA),2010-31 GS, IO,PAC-1(-1.000 x 1 mo. USD LIBOR + 6.500%) | | | 4.117 | % | | | 3/20/39 | | | | 380,920 | | | | 12,787 | (c) |
Government National Mortgage Association (GNMA),2010-42 BS, IO(-1.000 x 1 mo. USD LIBOR + 6.480%) | | | 4.097 | % | | | 4/20/40 | | | | 522,803 | | | | 86,927 | (c) |
Government National Mortgage Association (GNMA),2010-42 PC,PAC-1 | | | 5.000 | % | | | 7/20/39 | | | | 6,919,556 | | | | 7,276,684 | |
Government National Mortgage Association (GNMA),2010-85 HS, IO, PAC(-1.000 x 1 mo. USD LIBOR + 6.650%) | | | 4.267 | % | | | 1/20/40 | | | | 287,952 | | | | 23,207 | (c) |
Government National Mortgage Association (GNMA),2010-86 PB,PAC-1 | | | 4.500 | % | | | 10/20/39 | | | | 15,685,161 | | | | 16,311,919 | |
Government National Mortgage Association (GNMA),2010-116 MH | | | 5.000 | % | | | 7/20/40 | | | | 27,867,162 | | | | 31,443,578 | |
Government National Mortgage Association (GNMA),2010-118 IO | | | 0.086 | % | | | 4/16/53 | | | | 2,171,399 | | | | 4,866 | (c) |
Government National Mortgage Association (GNMA),2010-H10 FC (1 mo. USD LIBOR + 1.000%) | | | 3.428 | % | | | 5/20/60 | | | | 593,419 | | | | 600,303 | (c) |
Government National Mortgage Association (GNMA),2010-H26 LF (1 mo. USD LIBOR + 0.350%) | | | 2.817 | % | | | 8/20/58 | | | | 1,512,267 | | | | 1,508,674 | (c) |
Government National Mortgage Association (GNMA),2010-H27 FA (1 mo. USD LIBOR + 0.380%) | | | 2.847 | % | | | 12/20/60 | | | | 341,473 | | | | 340,638 | (c) |
Government National Mortgage Association (GNMA),2010-H28 FE (1 mo. USD LIBOR + 0.400%) | | | 2.867 | % | | | 12/20/60 | | | | 7,030,043 | | | | 7,018,840 | (c) |
See Notes to Financial Statements.
| | |
| | |
| 56 | | Western Asset Core Plus Bond Fund 2019 Semi-Annual Report |
Western Asset Core Plus Bond Fund
| | | | | | | | | | | | | | | | |
| Security | | Rate | | | Maturity
Date | | | Face
Amount† | | | Value | |
| Collateralized Mortgage Obligations (j) — continued | |
Government National Mortgage Association (GNMA),2011-140 AI, IO | | | 4.000 | % | | | 10/16/26 | | | | 256,258 | | | $ | 20,822 | |
Government National Mortgage Association (GNMA),2011-H06 FA (1 mo. USD LIBOR + 0.450%) | | | 2.917 | % | | | 2/20/61 | | | | 2,086,617 | | | | 2,085,590 | (c) |
Government National Mortgage Association (GNMA),2011-H08 FG (1 mo. USD LIBOR + 0.480%) | | | 2.947 | % | | | 3/20/61 | | | | 7,170,651 | | | | 7,172,627 | (c) |
Government National Mortgage Association (GNMA),2011-H09 AF (1 mo. USD LIBOR + 0.500%) | | | 2.967 | % | | | 3/20/61 | | | | 6,449,065 | | | | 6,453,736 | (c) |
Government National Mortgage Association (GNMA),2012-034 SA, IO(-1.000 x 1 mo. USD LIBOR + 6.050%) | | | 3.667 | % | | | 3/20/42 | | | | 1,889,989 | | | | 359,350 | (c) |
Government National Mortgage Association (GNMA),2012-066 CI, IO | | | 3.500 | % | | | 2/20/38 | | | | 4,587,511 | | | | 252,997 | |
Government National Mortgage Association (GNMA),2012-081 AI, IO | | | 3.500 | % | | | 4/20/27 | | | | 1,899,084 | | | | 137,605 | |
Government National Mortgage Association (GNMA),2012-098 SA, IO(-1.000 x 1 mo. USD LIBOR + 6.100%) | | | 3.706 | % | | | 8/16/42 | | | | 3,526,583 | | | | 589,465 | (c) |
Government National Mortgage Association (GNMA),2012-152 IO, IO | | | 0.790 | % | | | 1/16/54 | | | | 72,957,269 | | | | 3,800,957 | (c) |
Government National Mortgage Association (GNMA),2013-150 IA, IO | | | 1.112 | % | | | 11/20/42 | | | | 2,378,711 | | | | 99,440 | (c) |
Government National Mortgage Association (GNMA),2014-117 SJ, IO, PAC(-1.000 x 1 mo. LIBOR + 5.600%) | | | 3.217 | % | | | 8/20/44 | | | | 724,060 | | | | 101,039 | (c) |
Government National Mortgage Association (GNMA),2014-160 EI, IO | | | 4.000 | % | | | 7/16/26 | | | | 5,466,864 | | | | 438,837 | |
Government National Mortgage Association (GNMA),2014-176 IA, IO, PAC | | | 4.000 | % | | | 11/20/44 | | | | 937,780 | | | | 143,103 | |
See Notes to Financial Statements.
| | |
| | |
| Western Asset Core Plus Bond Fund 2019 Semi-Annual Report | | 57 |
Schedule of investments(unaudited) (cont’d)
June 30, 2019
Western Asset Core Plus Bond Fund
| | | | | | | | | | | | | | | | |
| Security | | Rate | | | Maturity
Date | | | Face
Amount† | | | Value | |
| Collateralized Mortgage Obligations (j) — continued | |
Government National Mortgage Association (GNMA),2016-21 ST, IO(-1.000 x 1 mo. LIBOR + 6.150%) | | | 3.767 | % | | | 2/20/46 | | | | 27,018,139 | | | $ | 4,688,963 | (c) |
Government National Mortgage Association (GNMA),2016-84 IG, IO, PAC | | | 4.500 | % | | | 11/16/45 | | | | 5,828,956 | | | | 1,118,511 | |
Government National Mortgage Association (GNMA),2016-135 SB, IO(-1.000 x 1 mo. USD LIBOR + 6.100%) | | | 3.706 | % | | | 10/16/46 | | | | 7,794,737 | | | | 1,683,245 | (c) |
Government National Mortgage Association (GNMA),2017-41 IO, IO | | | 0.793 | % | | | 7/16/58 | | | | 26,811,685 | | | | 1,836,646 | (c) |
Government National Mortgage Association (GNMA),2017-H15 KI, IO | | | 2.233 | % | | | 7/20/67 | | | | 37,289,177 | | | | 5,052,124 | (c) |
Government National Mortgage Association (GNMA),2017-H18 BI, IO | | | 1.579 | % | | | 9/20/67 | | | | 29,916,907 | | | | 2,954,561 | (c) |
Government National Mortgage Association (GNMA),2017-H20 IB, IO | | | 2.002 | % | | | 10/20/67 | | | | 15,112,461 | | | | 1,716,927 | (c) |
Government National Mortgage Association (GNMA),2017-H22 IC, IO | | | 2.253 | % | | | 11/20/67 | | | | 4,571,721 | | | | 532,615 | (c) |
Government National Mortgage Association (GNMA),2018-37 QA | | | 2.750 | % | | | 3/20/48 | | | | 10,558,131 | | | | 10,697,339 | |
Government National Mortgage Association (GNMA),2018-H06 PF (1 mo. USD LIBOR + 0.300%) | | | 2.767 | % | | | 2/20/68 | | | | 20,095,542 | | | | 20,005,813 | (c) |
Government National Mortgage Association (GNMA),2018-H07 FD (1 mo. USD LIBOR + 0.300%) | | | 2.767 | % | | | 5/20/68 | | | | 34,520,573 | | | | 34,358,416 | (c) |
Government National Mortgage Association (GNMA),2018-H08 KF (1 mo. USD LIBOR + 0.300%) | | | 2.767 | % | | | 5/20/68 | | | | 16,488,598 | | | | 16,395,767 | (c) |
Government National Mortgage Association (GNMA),2018-H13 FC (1 mo. USD LIBOR + 0.300%) | | | 2.767 | % | | | 7/20/68 | | | | 10,568,116 | | | | 10,504,485 | (c) |
Government National Mortgage Association (GNMA),2018-H17 FG (12 mo. USD LIBOR + 0.250%) | | | 3.250 | % | | | 10/20/68 | | | | 7,273,782 | | | | 7,215,897 | (c) |
See Notes to Financial Statements.
| | |
| | |
| 58 | | Western Asset Core Plus Bond Fund 2019 Semi-Annual Report |
Western Asset Core Plus Bond Fund
| | | | | | | | | | | | | | | | |
| Security | | Rate | | | Maturity
Date | | | Face
Amount† | | | Value | |
| Collateralized Mortgage Obligations (j) — continued | |
GreenPoint Mortgage Funding Trust,2005-AR4 1A2A (1 mo. USD LIBOR + 0.640%) | | | 3.044 | % | | | 10/25/45 | | | | 2,465,553 | | | $ | 2,511,033 | (c) |
GreenPoint Mortgage Funding Trust,2005-AR5 2A1 (1 mo. USD LIBOR + 0.560%) | | | 2.964 | % | | | 11/25/45 | | | | 15,897,726 | | | | 11,268,245 | (c) |
GreenPoint Mortgage Funding Trust,2006-AR3 3A1 (1 mo. USD LIBOR + 0.230%) | | | 2.634 | % | | | 4/25/36 | | | | 802,549 | | | | 1,045,919 | (c) |
GS Mortgage Securities Corp. II, 2018-SRP5 A (1 mo. USD LIBOR + 1.300%) | | | 3.694 | % | | | 9/15/31 | | | | 139,880,000 | | | | 138,236,270 | (a)(c) |
GS Mortgage Securities Trust, 2013- GC16 B | | | 5.161 | % | | | 11/10/46 | | | | 4,302,000 | | | | 4,727,786 | (c) |
GS Mortgage Securities Trust, 2015- GC30 B | | | 4.148 | % | | | 5/10/50 | | | | 16,340,000 | | | | 17,158,900 | (c) |
GS Mortgage Securities Trust, 2017- GS8 A4 | | | 3.469 | % | | | 11/10/50 | | | | 5,490,000 | | | | 5,781,046 | |
GSR Mortgage Loan Trust, 2005- AR7 1A1 | | | 4.576 | % | | | 11/25/35 | | | | 828,715 | | | | 671,299 | (c) |
HarborView Mortgage Loan Trust,2005-3 2A1A (1 mo. USD LIBOR + 0.480%) | | | 2.870 | % | | | 6/19/35 | | | | 4,204,118 | | | | 4,236,308 | (c) |
HarborView Mortgage Loan Trust,2005-7 1A1 (11th District Cost of Funds + 1.850%) | | | 2.945 | % | | | 6/19/45 | | | | 2,369,785 | | | | 1,553,964 | (c) |
HarborView Mortgage Loan Trust,2006-2 1A | | | 5.004 | % | | | 2/25/36 | | | | 812,113 | | | | 536,812 | (c) |
HarborView Mortgage Loan Trust,2006-13 A (1 mo. USD LIBOR + 0.180%) | | | 2.570 | % | | | 11/19/46 | | | | 209,520 | | | | 180,269 | (c) |
Impac CMB Trust,2005-7 A1 (1 mo. USD LIBOR + 0.520%) | | | 2.924 | % | | | 11/25/35 | | | | 3,400,947 | | | | 3,159,087 | (c) |
Impac CMB Trust,2007-A A (1 mo. USD LIBOR + 0.500%) | | | 2.904 | % | | | 5/25/37 | | | | 7,942,349 | | | | 8,022,109 | (a)(c) |
IndyMac INDX Mortgage Loan Trust, 2005-AR13 1A1 | | | 4.127 | % | | | 8/25/35 | | | | 174,118 | | | | 145,739 | (c) |
IndyMac INDX Mortgage Loan Trust,2006-AR2 1A1B (1 mo. USD LIBOR + 0.210%) | | | 2.614 | % | | | 4/25/46 | | | | 5,606,390 | | | | 5,289,172 | (c) |
See Notes to Financial Statements.
| | |
| | |
| Western Asset Core Plus Bond Fund 2019 Semi-Annual Report | | 59 |
Schedule of investments(unaudited) (cont’d)
June 30, 2019
Western Asset Core Plus Bond Fund
| | | | | | | | | | | | | | | | |
| Security | | Rate | | | Maturity
Date | | | Face
Amount† | | | Value | |
| Collateralized Mortgage Obligations (j) — continued | |
Jefferies Resecuritization Trust,2015-R1 A2 (1 mo. USD LIBOR + 0.140%) | | | 2.326 | % | | | 12/26/36 | | | | 18,386,177 | | | $ | 11,821,705 | (a)(c) |
JPMBB Commercial Mortgage Securities Trust,2013-C17 B | | | 5.054 | % | | | 1/15/47 | | | | 1,602,000 | | | | 1,737,843 | (c) |
JPMBB Commercial Mortgage Securities Trust,2014-C25 AS | | | 4.065 | % | | | 11/15/47 | | | | 5,930,000 | | | | 6,278,781 | |
JPMBB Commercial Mortgage Securities Trust,2015-C30 B | | | 4.411 | % | | | 7/15/48 | | | | 19,921,000 | | | | 21,151,703 | (c) |
JPMBB Commercial Mortgage Securities Trust,2015-C31 B | | | 4.771 | % | | | 8/15/48 | | | | 10,543,000 | | | | 11,410,624 | (c) |
JPMDB Commercial Mortgage Securities Trust,2017-C5 A5 | | | 3.694 | % | | | 3/15/50 | | | | 620,000 | | | | 665,628 | |
JPMorgan Chase Commercial Mortgage Securities Trust, 2006-LDP7 AJ | | | 6.278 | % | | | 4/17/45 | | | | 5,123,628 | | | | 2,254,397 | (c) |
JPMorgan Chase Commercial Mortgage Securities Trust, 2007-CB19 AJ | | | 6.004 | % | | | 2/12/49 | | | | 15,431,165 | | | | 11,186,205 | (c) |
JPMorgan Chase Commercial Mortgage Securities Trust, 2007-LD12 AJ | | | 6.583 | % | | | 2/15/51 | | | | 1,249,868 | | | | 1,198,318 | (c) |
JPMorgan Chase Commercial Mortgage Securities Trust, 2007-LDPX AJFX | | | 5.438 | % | | | 1/15/49 | | | | 47,100,000 | | | | 9,464,062 | (a) |
JPMorgan Chase Commercial Mortgage Securities Trust,2015-FL7 D (1 mo. USD LIBOR + 3.750%) | | | 6.144 | % | | | 5/15/28 | | | | 17,273,394 | | | | 17,183,942 | (a)(c) |
JPMorgan Mortgage Trust,2018-3 A1 | | | 3.500 | % | | | 9/25/48 | | | | 103,812,986 | | | | 105,706,120 | (a)(c) |
JPMorgan Mortgage Trust,2018-4 A1 | | | 3.500 | % | | | 10/25/48 | | | | 41,174,972 | | | | 41,772,898 | (a)(c) |
JPMorgan Mortgage Trust,2018-5 A1 | | | 3.500 | % | | | 10/25/48 | | | | 141,714,162 | | | | 143,664,460 | (a)(c) |
JPMorgan Resecuritization Trust,2015-1 4A1 (1 mo. USD LIBOR + 0.300%) | | | 2.690 | % | | | 9/27/36 | | | | 9,723,286 | | | | 9,529,587 | (a)(c) |
JPMorgan Resecuritization Trust,2015-1 4A2 | | | 2.568 | % | | | 9/27/36 | | | | 14,035,595 | | | | 10,748,748 | (a)(c) |
Lehman Mortgage Trust,2006-7 3A4(-1.000 x 1 mo. USD LIBOR + 7.150%) | | | 4.746 | % | | | 11/25/36 | | | | 7,998,959 | | | | 2,632,379 | (c) |
See Notes to Financial Statements.
| | |
| | |
| 60 | | Western Asset Core Plus Bond Fund 2019 Semi-Annual Report |
Western Asset Core Plus Bond Fund
| | | | | | | | | | | | | | | | |
| Security | | Rate | | | Maturity
Date | | | Face
Amount† | | | Value | |
| Collateralized Mortgage Obligations (j) — continued | |
Lone Star Portfolio Trust, 2015- LSMZ M (1 mo. USD LIBOR + 7.218%) | | | 9.612 | % | | | 9/15/20 | | | | 6,067,451 | | | $ | 6,040,402 | (a)(c) |
Lone Star Portfolio Trust,2015-LSP E (1 mo. USD LIBOR + 5.600%) | | | 8.244 | % | | | 9/15/28 | | | | 38,778,969 | | | | 39,273,536 | (a)(c) |
Lone Star Portfolio Trust,2015-LSP F (1 mo. USD LIBOR + 7.400%) | | | 9.544 | % | | | 9/15/28 | | | | 13,844,281 | | | | 13,926,235 | (a)(c) |
MASTR Adjustable Rate Mortgages Trust,2004-6 5A1 | | | 4.738 | % | | | 7/25/34 | | | | 310,870 | | | | 299,721 | (c) |
MASTR Adjustable Rate Mortgages Trust,2006-OA1 1A1 (1 mo. USD LIBOR + 0.210%) | | | 2.614 | % | | | 4/25/46 | | | | 180,498 | | | | 166,779 | (c) |
MASTR Reperforming Loan Trust,2005-1 1A1 | | | 6.000 | % | | | 8/25/34 | | | | 1,637,476 | | | | 1,572,495 | (a) |
MASTR Reperforming Loan Trust,2005-2 1A1F (1 mo. USD LIBOR + 0.350%) | | | 2.754 | % | | | 5/25/35 | | | | 2,414,004 | | | | 1,761,599 | (a)(c) |
MASTR Reperforming Loan Trust,2005-1 1A3 | | | 7.000 | % | | | 8/25/34 | | | | 2,344,959 | | | | 2,425,632 | (a) |
ML-CFC Commercial Mortgage Trust,2007-5 AJ | | | 5.450 | % | | | 8/12/48 | | | | 5,001,411 | | | | 3,277,930 | (c) |
ML-CFC Commercial Mortgage Trust,2007-5 AJFL | | | 5.450 | % | | | 8/12/48 | | | | 789,772 | | | | 517,617 | (a)(c) |
ML-CFC Commercial Mortgage Trust,2007-9 AJ | | | 6.193 | % | | | 9/12/49 | | | | 2,004,749 | | | | 873,669 | (c) |
Morgan Stanley Capital I Trust, 2007-IQ13 AJ | | | 5.438 | % | | | 3/15/44 | | | | 357,225 | | | | 360,047 | |
Morgan Stanley Mortgage Loan Trust,2004-5AR 2A | | | 4.415 | % | | | 7/25/34 | | | | 18,706 | | | | 18,644 | (c) |
Morgan Stanley Mortgage Loan Trust,2005-3AR 2A2 | | | 3.682 | % | | | 7/25/35 | | | | 1,212,277 | | | | 1,139,619 | (c) |
Morgan Stanley Resecuritization Trust,2015-R3 7A1 (Federal Reserve U.S. 12 mo. Cumulative Avg 1 Year CMT + 0.770%) | | | 3.251 | % | | | 4/26/47 | | | | 14,659,762 | | | | 14,539,735 | (a)(c) |
Mortgage Loan Resecuritization Trust,2009-RS1 A85 (1 mo. USD LIBOR + 0.340%) | | | 2.780 | % | | | 4/16/36 | | | | 53,728,232 | | | | 47,326,277 | (a)(c) |
Multifamily Trust,2016-1 B | | | 14.743 | % | | | 4/25/46 | | | | 4,454,290 | | | | 4,512,490 | (a)(c) |
See Notes to Financial Statements.
| | |
| | |
| Western Asset Core Plus Bond Fund 2019 Semi-Annual Report | | 61 |
Schedule of investments(unaudited) (cont’d)
June 30, 2019
Western Asset Core Plus Bond Fund
| | | | | | | | | | | | | | | | |
| Security | | Rate | | | Maturity
Date | | | Face
Amount† | | | Value | |
| Collateralized Mortgage Obligations (j) — continued | |
Nomura Asset Acceptance Corp. Alternative Loan Trust Series, 2005- AP2 A5 | | | 5.476 | % | | | 5/25/35 | | | | 78,046 | | | $ | 58,537 | |
Nomura Resecuritization Trust,2015-5R 3A5 (1 mo. USD LIBOR + 0.260%) | | | 2.950 | % | | | 2/26/46 | | | | 10,003,605 | | | | 9,058,987 | (a)(c) |
Prime Mortgage Trust,2006-1 3A2, IO(-1.000 x 1 mo. USD LIBOR + 7.150%) | | | 4.746 | % | | | 6/25/36 | | | | 13,279,678 | | | | 2,574,349 | (c) |
Prime Mortgage Trust,2006-DR1 2A2 | | | 6.000 | % | | | 5/25/35 | | | | 31,004,778 | | | | 25,624,252 | (a) |
RALI Series Trust,2007-QS4 3A9 | | | 6.000 | % | | | 3/25/37 | | | | 2,619,699 | | | | 2,468,123 | |
RAMP Series Trust,2004-SL4 A5 | | | 7.500 | % | | | 7/25/32 | | | | 547,927 | | | | 391,654 | |
RAMP Series Trust,2005-SL1 A7 | | | 8.000 | % | | | 5/25/32 | | | | 274,564 | | | | 220,835 | |
RBSGC Mortgage Loan Trust,2007-B 1A4 (1 mo. USD LIBOR + 0.450%) | | | 2.854 | % | | | 1/25/37 | | | | 8,556,958 | | | | 5,264,093 | (c) |
RBSSP Resecuritization Trust,2009-12 9A2 | | | 4.328 | % | | | 3/25/36 | | | | 9,626,839 | | | | 8,839,375 | (a)(c) |
Reperforming Loan REMIC Trust,2006-R2 AS, IO | | | 3.297 | % | | | 7/25/36 | | | | 15,544,180 | | | | 1,862,581 | (a)(c) |
Residential Asset Securitization Trust,2003-A14 A1 | | | 4.750 | % | | | 2/25/19 | | | | 7,160 | | | | 5,856 | (h) |
Residential Asset Securitization Trust, 2004-A2 1A3, PAC (1 mo. USD LIBOR + 0.400%) | | | 2.804 | % | | | 5/25/34 | | | | 12,165 | | | | 11,822 | (c) |
Rosslyn Portfolio Trust, 2017-ROSS A (1 mo. USD LIBOR + 0.950%) | | | 3.344 | % | | | 6/15/33 | | | | 31,270,000 | | | | 31,261,423 | (a)(c) |
Shops at Crystals Trust, 2016-CSTL A | | | 3.126 | % | | | 7/5/36 | | | | 11,160,000 | | | | 11,337,875 | (a) |
Structured Adjustable Rate Mortgage Loan Trust,2004-8 1A1 | | | 4.489 | % | | | 7/25/34 | | | | 1,079 | | | | 1,105 | (c) |
Structured Asset Mortgage Investments II Trust,2006-AR6 1A1 (1 mo. USD LIBOR + 0.180%) | | | 2.584 | % | | | 7/25/46 | | | | 141,001 | | | | 132,435 | (c) |
Structured Asset Mortgage Investments Trust,2003-AR1 A1 (1 mo. USD LIBOR + 0.740%) | | | 3.130 | % | | | 10/19/33 | | | | 91,292 | | | | 88,615 | (c) |
Structured Asset Securities Corp. Mortgage Loan Trust,2002-9 A2 (1 mo. USD LIBOR + 0.600%) | | | 3.004 | % | | | 10/25/27 | | | | 15,759 | | | | 15,725 | (c) |
See Notes to Financial Statements.
| | |
| | |
| 62 | | Western Asset Core Plus Bond Fund 2019 Semi-Annual Report |
Western Asset Core Plus Bond Fund
| | | | | | | | | | | | | | | | |
| Security | | Rate | | | Maturity
Date | | | Face
Amount† | | | Value | |
| Collateralized Mortgage Obligations (j) — continued | |
SunTrust Alternative Loan Trust,2006-1F 3A (1 mo. USD LIBOR + 0.350%) | | | 2.754 | % | | | 4/25/36 | | | | 18,500,606 | | | $ | 5,187,265 | (c) |
UBS Commercial Mortgage Trust,2017-C1 A4 | | | 3.460 | % | | | 6/15/50 | | | | 5,440,000 | | | | 5,742,220 | |
UBS Commercial Mortgage Trust,2017-C3 A4 | | | 3.426 | % | | | 8/15/50 | | | | 6,000,000 | | | | 6,311,118 | |
Wachovia Bank Commercial Mortgage Trust,2007-C33 AJ | | | 5.844 | % | | | 2/15/51 | | | | 13,275,176 | | | | 11,572,634 | (c) |
WaMu Mortgage Pass-Through Certificates Series Trust,2003-AR9 1A7 | | | 4.347 | % | | | 9/25/33 | | | | 9,215 | | | | 9,659 | (c) |
WaMu Mortgage Pass-Through Certificates Trust, 2005-AR15 A1C3 (1 mo. USD LIBOR + 0.480%) | | | 2.884 | % | | | 11/25/45 | | | | 33,434,964 | | | | 24,820,917 | (c) |
Waterfall Commercial Mortgage Trust, 2015-SBC5 A | | | 4.104 | % | | | 9/14/22 | | | | 10,393,811 | | | | 10,700,309 | (a)(c) |
Wells Fargo Alternative Loan Trust,2007-PA1 A12, IO(-1.000 x 1 mo. USD LIBOR + 5.460%) | | | 3.056 | % | | | 3/25/37 | | | | 14,677,320 | | | | 1,441,686 | (c) |
Wells Fargo Alternative Loan Trust,2007-PA2 2A1 (1 mo. USD LIBOR + 0.430%) | | | 2.834 | % | | | 6/25/37 | | | | 5,628,260 | | | | 4,638,482 | (c) |
Wells Fargo Commercial Mortgage Trust, 2013-LC12 B | | | 4.421 | % | | | 7/15/46 | | | | 450,000 | | | | 467,268 | (c) |
Wells Fargo Commercial Mortgage Trust, 2014-LC18 AS | | | 3.808 | % | | | 12/15/47 | | | | 5,630,000 | | | | 5,856,892 | |
Wells Fargo Commercial Mortgage Trust,2017-C41 XA, IO | | | 1.378 | % | | | 11/15/50 | | | | 32,036,183 | | | | 2,574,553 | (c) |
Wells Fargo Commercial Mortgage Trust,2018-C44 A5 | | | 4.212 | % | | | 5/15/51 | | | | 7,530,000 | | | | 8,395,881 | |
Wells Fargo Mortgage Backed Securities Trust,2004-Y 1A2 (1 year Treasury Constant Maturity Rate + 2.490%) | | | 4.904 | % | | | 11/25/34 | | | | 26,233 | | | | 27,380 | (c) |
Wells Fargo Mortgage Backed Securities Trust,2006-AR2 1A1 | | | 4.949 | % | | | 3/25/36 | | | | 35,775,112 | | | | 36,752,713 | (c) |
WFRBS Commercial Mortgage Trust,2012-C7 XA, IO | | | 1.518 | % | | | 6/15/45 | | | | 178,561 | | | | 5,500 | (a)(c) |
WFRBS Commercial Mortgage Trust,2013-C14 D | | | 4.110 | % | | | 6/15/46 | | | | 3,030,000 | | | | 2,883,771 | (a)(c) |
See Notes to Financial Statements.
| | |
| | |
| Western Asset Core Plus Bond Fund 2019 Semi-Annual Report | | 63 |
Schedule of investments(unaudited) (cont’d)
June 30, 2019
Western Asset Core Plus Bond Fund
| | | | | | | | | | | | | | | | |
| Security | | Rate | | | Maturity
Date | | | Face
Amount† | | | Value | |
| Collateralized Mortgage Obligations (j) — continued | |
WFRBS Commercial Mortgage Trust,2014-C19 B | | | 4.723 | % | | | 3/15/47 | | | | 270,000 | | | $ | 289,606 | (c) |
WFRBS Commercial Mortgage Trust,2014-C19 XA, IO | | | 1.211 | % | | | 3/15/47 | | | | 45,796,169 | | | | 1,684,397 | (c) |
Total Collateralized Mortgage Obligations (Cost — $2,667,422,915) | | | | 2,656,521,945 | |
| Sovereign Bonds — 6.9% | | | | | | | | | | | | | | | | |
Argentina — 0.5% | | | | | | | | | | | | | | | | |
Argentina POM Politica Monetaria, Bonds (Argentina Central Bank 7 Day Repo Reference Rate) | | | 63.705 | % | | | 6/21/20 | | | | 67,940,000 | ARS | | | 1,563,411 | (c) |
Argentine Bonos del Tesoro, Bonds | | | 18.200 | % | | | 10/3/21 | | | | 626,050,000 | ARS | | | 10,116,208 | |
Argentine Republic Government International Bond, Senior Notes | | | 6.875 | % | | | 4/22/21 | | | | 5,430,000 | | | | 4,781,115 | |
Argentine Republic Government International Bond, Senior Notes | | | 5.625 | % | | | 1/26/22 | | | | 50,540,000 | | | | 42,706,805 | |
Argentine Republic Government International Bond, Senior Notes | | | 7.500 | % | | | 4/22/26 | | | | 11,600,000 | | | | 9,825,200 | |
Argentine Republic Government International Bond, Senior Notes | | | 5.875 | % | | | 1/11/28 | | | | 1,390,000 | | | | 1,060,744 | |
Argentine Republic Government International Bond, Senior Notes | | | 7.125 | % | | | 7/6/36 | | | | 3,600,000 | | | | 2,794,086 | |
Argentine Republic Government International Bond, Senior Notes | | | 3.750 | % | | | 12/31/38 | | | | 22,200,000 | | | | 13,042,722 | |
Argentine Republic Government International Bond, Senior Notes | | | 7.625 | % | | | 4/22/46 | | | | 5,450,000 | | | | 4,334,112 | |
Argentine Republic Government International Bond, Senior Notes | | | 6.875 | % | | | 1/11/48 | | | | 32,960,000 | | | | 24,514,330 | |
Provincia de Buenos Aires, Senior Notes | | | 6.500 | % | | | 2/15/23 | | | | 9,210,000 | | | | 7,745,702 | (a) |
Provincia de Buenos Aires, Senior Notes | | | 9.125 | % | | | 3/16/24 | | | | 1,550,000 | | | | 1,302,016 | (a) |
Provincia de Buenos Aires, Senior Notes | | | 7.875 | % | | | 6/15/27 | | | | 7,890,000 | | | | 5,897,854 | (a) |
Total Argentina | | | | | | | | | | | | | | | 129,684,305 | |
Brazil — 1.3% | | | | | | | | | | | | | | | | |
Brazil Notas do Tesouro Nacional Serie F, Notes | | | 10.000 | % | | | 1/1/21 | | | | 497,723,000 | BRL | | | 136,868,931 | |
Brazil Notas do Tesouro Nacional Serie F, Notes | | | 10.000 | % | | | 1/1/23 | | | | 270,145,000 | BRL | | | 77,294,264 | |
Brazil Notas do Tesouro Nacional Serie F, Notes | | | 10.000 | % | | | 1/1/27 | | | | 34,396,000 | BRL | | | 10,228,694 | |
See Notes to Financial Statements.
| | |
| | |
| 64 | | Western Asset Core Plus Bond Fund 2019 Semi-Annual Report |
Western Asset Core Plus Bond Fund
| | | | | | | | | | | | | | | | |
| Security | | Rate | | | Maturity
Date | | | Face
Amount† | | | Value | |
Brazil — continued | | | | | | | | | | | | | | | | |
Brazilian Government International Bond, Senior Notes | | | 2.625 | % | | | 1/5/23 | | | | 4,490,000 | | | $ | 4,459,692 | |
Brazilian Government International Bond, Senior Notes | | | 4.625 | % | | | 1/13/28 | | | | 18,440,000 | | | | 19,375,830 | |
Brazilian Government International Bond, Senior Notes | | | 5.625 | % | | | 1/7/41 | | | | 25,970,000 | | | | 27,898,532 | |
Brazilian Government International Bond, Senior Notes | | | 5.000 | % | | | 1/27/45 | | | | 34,140,000 | | | | 33,854,419 | |
Brazilian Government International Bond, Senior Notes | | | 5.625 | % | | | 2/21/47 | | | | 50,990,000 | | | | 54,476,441 | |
Total Brazil | | | | | | | | | | | | | | | 364,456,803 | |
China — 0.2% | | | | | | | | | | | | | | | | |
China Government Bond, Senior Notes | | | 3.380 | % | | | 11/21/24 | | | | 115,500,000 | CNH | | | 17,084,190 | (l) |
China Government Bond, Senior Notes | | | 3.390 | % | | | 5/21/25 | | | | 59,000,000 | CNH | | | 8,696,976 | (l) |
China Government Bond, Senior Notes | | | 3.310 | % | | | 11/30/25 | | | | 273,500,000 | CNH | | | 40,058,294 | (l) |
Total China | | | | | | | | | | | | | | | 65,839,460 | |
Colombia — 0.1% | | | | | | | | | | | | | | | | |
Colombia Government International Bond, Senior Notes | | | 5.625 | % | | | 2/26/44 | | | | 19,220,000 | | | | 22,787,713 | |
Ecuador — 0.0% | | | | | | | | | | | | | | | | |
Ecuador Government International Bond, Senior Notes | | | 7.875 | % | | | 1/23/28 | | | | 14,140,000 | | | | 14,034,091 | (a) |
Egypt — 0.1% | | | | | | | | | | | | | | | | |
Egypt Government International Bond, Senior Notes | | | 5.577 | % | | | 2/21/23 | | | | 15,630,000 | | | | 15,915,904 | (a) |
Indonesia — 0.5% | | | | | | | | | | | | | | | | |
Indonesia Government International Bond, Senior Notes | | | 5.875 | % | | | 3/13/20 | | | | 310,000 | | | | 317,641 | (l) |
Indonesia Government International Bond, Senior Notes | | | 4.875 | % | | | 5/5/21 | | | | 510,000 | | | | 530,384 | (l) |
Indonesia Government International Bond, Senior Notes | | | 3.750 | % | | | 4/25/22 | | | | 24,750,000 | | | | 25,424,726 | (l) |
Indonesia Government International Bond, Senior Notes | | | 3.750 | % | | | 4/25/22 | | | | 370,000 | | | | 380,087 | (a) |
Indonesia Government International Bond, Senior Notes | | | 5.375 | % | | | 10/17/23 | | | | 7,620,000 | | | | 8,372,913 | (l) |
Indonesia Government International Bond, Senior Notes | | | 3.850 | % | | | 7/18/27 | | | | 10,410,000 | | | | 10,779,386 | (a) |
See Notes to Financial Statements.
| | |
| | |
| Western Asset Core Plus Bond Fund 2019 Semi-Annual Report | | 65 |
Schedule of investments(unaudited) (cont’d)
June 30, 2019
Western Asset Core Plus Bond Fund
| | | | | | | | | | | | | | | | |
| Security | | Rate | | | Maturity
Date | | | Face
Amount† | | | Value | |
Indonesia — continued | | | | | | | | | | | | | | | | |
Indonesia Government International Bond, Senior Notes | | | 3.500 | % | | | 1/11/28 | | | | 3,010,000 | | | $ | 3,026,556 | |
Indonesia Government International Bond, Senior Notes | | | 4.625 | % | | | 4/15/43 | | | | 5,050,000 | | | | 5,351,092 | (l) |
Indonesia Government International Bond, Senior Notes | | | 5.125 | % | | | 1/15/45 | | | | 22,340,000 | | | | 25,211,004 | (a) |
Indonesia Government International Bond, Senior Notes | | | 5.125 | % | | | 1/15/45 | | | | 3,610,000 | | | | 4,073,936 | (l) |
Indonesia Government International Bond, Senior Notes | | | 5.250 | % | | | 1/8/47 | | | | 23,930,000 | | | | 27,673,041 | (a) |
Indonesia Government International Bond, Senior Notes | | | 4.750 | % | | | 7/18/47 | | | | 3,900,000 | | | | 4,223,117 | (a) |
Indonesia Government International Bond, Senior Notes | | | 4.350 | % | | | 1/11/48 | | | | 28,860,000 | | | | 29,864,616 | |
Total Indonesia | | | | | | | | | | | | | | | 145,228,499 | |
Kenya — 0.1% | | | | | | | | | | | | | | | | |
Kenya Government International Bond, Senior Notes | | | 6.875 | % | | | 6/24/24 | | | | 7,780,000 | | | | 8,299,385 | (l) |
Kenya Government International Bond, Senior Notes | | | 7.250 | % | | | 2/28/28 | | | | 8,110,000 | | | | 8,426,144 | (a) |
Total Kenya | | | | | | | | | | | | | | | 16,725,529 | |
Kuwait — 0.1% | | | | | | | | | | | | | | | | |
Kuwait International Government Bond, Senior Notes | | | 3.500 | % | | | 3/20/27 | | | | 24,270,000 | | | | 25,875,703 | (a) |
Mexico — 2.0% | | | | | | | | | | | | | | | | |
Mexican Bonos, Bonds | | | 6.500 | % | | | 6/9/22 | | | | 2,253,009,800 | MXN | | | 114,467,864 | |
Mexican Bonos, Bonds | | | 10.000 | % | | | 12/5/24 | | | | 324,780,000 | MXN | | | 18,890,448 | |
Mexican Bonos, Bonds | | | 8.000 | % | | | 11/7/47 | | | | 4,039,060,000 | MXN | | | 214,148,515 | |
Mexican Bonos, Senior Notes | | | 7.750 | % | | | 11/23/34 | | | | 381,940,000 | MXN | | | 20,003,060 | |
Mexican Bonos, Senior Notes | | | 7.750 | % | | | 11/13/42 | | | | 2,668,886,200 | MXN | | | 138,027,737 | |
Mexico Government International Bond, Senior Notes | | | 4.350 | % | | | 1/15/47 | | | | 11,650,000 | | | | 11,577,304 | |
Mexico Government International Bond, Senior Notes | | | 4.600 | % | | | 2/10/48 | | | | 28,480,000 | | | | 29,405,885 | |
Mexico Government International Bond, Senior Notes | | | 5.750 | % | | | 10/12/2110 | | | | 9,190,000 | | | | 10,063,142 | |
Total Mexico | | | | | | | | | | | | | | | 556,583,955 | |
See Notes to Financial Statements.
| | |
| | |
| 66 | | Western Asset Core Plus Bond Fund 2019 Semi-Annual Report |
Western Asset Core Plus Bond Fund
| | | | | | | | | | | | | | | | |
| Security | | Rate | | | Maturity
Date | | | Face
Amount† | | | Value | |
Nigeria — 0.1% | | | | | | | | | | | | | | | | |
Nigeria Government International Bond, Senior Notes | | | 6.500 | % | | | 11/28/27 | | | | 8,130,000 | | | $ | 8,160,341 | (a) |
Nigeria Government International Bond, Senior Notes | | | 7.143 | % | | | 2/23/30 | | | | 9,270,000 | | | | 9,397,435 | (a) |
Total Nigeria | | | | | | | | | | | | | | | 17,557,776 | |
Peru — 0.1% | | | | | | | | | | | | | | | | |
Peruvian Government International Bond, Senior Notes | | | 6.550 | % | | | 3/14/37 | | | | 2,330,000 | | | | 3,296,973 | |
Peruvian Government International Bond, Senior Notes | | | 5.625 | % | | | 11/18/50 | | | | 14,180,000 | | | | 19,568,542 | |
Total Peru | | | | | | | | | | | | | | | 22,865,515 | |
Poland — 0.1% | | | | | | | | | | | | | | | | |
Republic of Poland Government International Bond, Senior Notes | | | 4.000 | % | | | 1/22/24 | | | | 34,880,000 | | | | 37,600,361 | |
Qatar — 0.3% | | | | | | | | | | | | | | | | |
Qatar Government International Bond, Senior Notes | | | 4.000 | % | | | 3/14/29 | | | | 22,950,000 | | | | 24,772,161 | (a) |
Qatar Government International Bond, Senior Notes | | | 4.817 | % | | | 3/14/49 | | | | 50,690,000 | | | | 58,222,281 | (a) |
Total Qatar | | | | | | | | | | | | | | | 82,994,442 | |
Russia — 1.3% | | | | | | | | | | | | | | | | |
Russian Federal Bond — OFZ | | | 7.000 | % | | | 1/25/23 | | | | 1,326,230,000 | RUB | | | 20,865,872 | |
Russian Federal Bond — OFZ | | | 7.000 | % | | | 8/16/23 | | | | 3,299,070,000 | RUB | | | 51,783,967 | |
Russian Federal Bond — OFZ | | | 7.750 | % | | | 9/16/26 | | | | 256,110,000 | RUB | | | 4,163,533 | |
Russian Federal Bond — OFZ | | | 8.150 | % | | | 2/3/27 | | | | 2,696,040,000 | RUB | | | 44,883,158 | |
Russian Federal Bond — OFZ | | | 7.050 | % | | | 1/19/28 | | | | 6,370,818,000 | RUB | | | 99,457,751 | |
Russian Federal Bond — OFZ | | | 6.900 | % | | | 5/23/29 | | | | 2,745,190,000 | RUB | | | 42,282,731 | |
Russian Federal Bond — OFZ | | | 7.650 | % | | | 4/10/30 | | | | 5,213,630,000 | RUB | | | 84,591,299 | |
Total Russia | | | | | | | | | | | | | | | 348,028,311 | |
United Arab Emirates — 0.1% | | | | | | | | | | | | | | | | |
Abu Dhabi Government International Bond, Senior Notes | | | 2.500 | % | | | 10/11/22 | | | | 26,930,000 | | | | 27,167,119 | (a) |
Uruguay — 0.0% | | | | | | | | | | | | | | | | |
Uruguay Government International Bond, Senior Notes | | | 7.875 | % | | | 1/15/33 | | | | 1 | | | | 1 | |
Total Sovereign Bonds (Cost — $1,995,687,602) | | | | | | | | | | | | | | | 1,893,345,487 | |
See Notes to Financial Statements.
| | |
| | |
| Western Asset Core Plus Bond Fund 2019 Semi-Annual Report | | 67 |
Schedule of investments(unaudited) (cont’d)
June 30, 2019
Western Asset Core Plus Bond Fund
| | | | | | | | | | | | | | | | |
| Security | | Rate | | | Maturity
Date | | | Face
Amount†/
Units | | | Value | |
| Asset-Backed Securities — 3.5% | |
Applebee’s Funding LLC,2019-1A A2I | | | 4.194 | % | | | 6/7/49 | | | | 20,030,000 | | | $ | 20,290,406 | (a) |
Avis Budget Rental Car Funding AESOP LLC,2019-2A A | | | 3.350 | % | | | 9/22/25 | | | | 34,800,000 | | | | 35,911,721 | (a) |
Bear Stearns Asset Backed Securities I Trust,2005-CL1 A1 (1 mo. USD LIBOR + 0.500%) | | | 2.252 | % | | | 9/25/34 | | | | 1,553,069 | | | | 1,518,374 | (c) |
Brazos Student Finance Corp.,2009-1 AS (3 mo. USD LIBOR + 2.500%) | | | 4.849 | % | | | 12/27/39 | | | | 6,616,033 | | | | 6,794,813 | (c) |
CIT Mortgage Loan Trust,2007-1 1M1 (1 mo. USD LIBOR + 1.500%) | | | 3.930 | % | | | 10/25/37 | | | | 47,370,000 | | | | 48,155,972 | (a)(c) |
CIT Mortgage Loan Trust,2007-1 1M2 (1 mo. USD LIBOR + 1.750%) | | | 4.180 | % | | | 10/25/37 | | | | 108,930,000 | | | | 101,297,754 | (a)(c) |
Community Funding CLO,2015-1A A | | | 5.750 | % | | | 11/1/27 | | | | 36,638,237 | | | | 37,964,394 | (a) |
Conseco Finance Corp.,201999-3 A9 | | | 6.530 | % | | | 2/1/31 | | | | 13,834,564 | | | | 13,488,647 | (c) |
ContiMortgage Home Equity Loan Trust,201997-4 B1F | | | 7.330 | % | | | 10/15/28 | | | | 51,193 | | | | 164,786 | (c) |
Countrywide Asset-Backed Certificates,2003-BC3 A2 (1 mo. USD LIBOR + 0.620%) | | | 3.024 | % | | | 9/25/33 | | | | 400,434 | | | | 396,105 | (c) |
Countrywide Asset-Backed Certificates,2006-SD4 A1 (1 mo. USD LIBOR + 0.340%) | | | 2.744 | % | | | 12/25/36 | | | | 58,934 | | | | 38,892 | (a)(c) |
Countrywide Home Equity Loan Trust,2006-E 2A (1 mo. USD LIBOR + 0.140%) | | | 2.534 | % | | | 7/15/36 | | | | 41,870 | | | | 40,393 | (c) |
Countrywide Home Equity Loan Trust,2006-HW 2A1B (1 mo. USD LIBOR + 0.150%) | | | 2.544 | % | | | 11/15/36 | | | | 515,987 | | | | 455,708 | (c) |
Countrywide Home Equity Loan Trust,2007-B A (1 mo. USD LIBOR + 0.150%) | | | 2.544 | % | | | 2/15/37 | | | | 6,551,029 | | | | 6,350,887 | (c) |
CWHEQ Revolving Home Equity Loan Trust Series,2006-I 2A (1 mo. USD LIBOR + 0.140%) | | | 2.534 | % | | | 1/15/37 | | | | 5,125,553 | | | | 4,944,601 | (c) |
Ford Credit Floorplan Master Owner Trust,2018-4 A | | | 4.060 | % | | | 11/15/30 | | | | 49,520,000 | | | | 53,220,684 | |
See Notes to Financial Statements.
| | |
| | |
| 68 | | Western Asset Core Plus Bond Fund 2019 Semi-Annual Report |
Western Asset Core Plus Bond Fund
| | | | | | | | | | | | | | | | |
| Security | | Rate | | | Maturity
Date | | | Face
Amount†/
Units | | | Value | |
| Asset-Backed Securities — continued | |
GMAC Mortgage Corp. Loan Trust,2004-HE3 A2VN (1 mo. USD LIBOR + 0.500%) | | | 2.904 | % | | | 10/25/34 | | | | 3,209,555 | | | $ | 3,171,224 | (a)(c) |
Goal Capital Funding Trust,2005-2 A4 (3 mo. USD LIBOR + 0.200%) | | | 2.721 | % | | | 8/25/44 | | | | 37,050,000 | | | | 36,156,550 | (c) |
Green Tree Home Improvement Loan Trust,201996-A B2 | | | 7.400 | % | | | 2/15/26 | | | | 2,628 | | | | 2,738 | |
Greenpoint Manufactured Housing Contract Pass-Through Certificates Trust,2001-2 IA2 (Auction Rate Security) | | | 5.777 | % | | | 2/20/32 | | | | 1,400,000 | | | | 1,409,220 | (c) |
GSRPM Mortgage Loan Trust,2007-1 A (1 mo. USD LIBOR + 0.400%) | | | 2.804 | % | | | 10/25/46 | | | | 6,581,744 | | | | 6,383,074 | (a)(c) |
Hertz Vehicle Financing II LP,2015-1A C | | | 4.350 | % | | | 3/25/21 | | | | 14,481,000 | | | | 14,548,739 | (a) |
Hertz Vehicle Financing II LP,2016-2A D | | | 5.970 | % | | | 3/25/22 | | | | 10,226,000 | | | | 10,439,778 | (a) |
Hertz Vehicle Financing II LP,2017-1A D | | | 6.490 | % | | | 10/25/21 | | | | 24,750,000 | | | | 25,266,359 | (a) |
HSI Asset Securitization Corp. Trust, 2007-OPT1 1A (1 mo. USD LIBOR + 0.140%) | | | 2.544 | % | | | 12/25/36 | | | | 92,432,462 | | | | 78,598,742 | (c) |
Long Beach Mortgage Loan Trust,2006-9 2A3 (1 mo. USD LIBOR + 0.160%) | | | 2.564 | % | | | 10/25/36 | | | | 3,800,197 | | | | 1,664,912 | (c) |
Morgan Stanley ABS Capital I Inc. Trust,2003-HE3 M1 (1 mo. USD LIBOR + 1.020%) | | | 3.424 | % | | | 10/25/33 | | | | 297,243 | | | | 298,506 | (c) |
Morgan Stanley Resecuritization Trust,2015-R7 1BXA | | | 8.791 | % | | | 2/26/29 | | | | 18,137,842 | | | | 19,792,993 | (a)(c) |
Option One Mortgage Loan Trust, 2007-FXD2 1A1 | | | 5.820 | % | | | 3/25/37 | | | | 35,104,632 | | | | 35,848,327 | |
Origen Manufactured Housing Contract Trust,2006-A A2 | | | 4.335 | % | | | 10/15/37 | | | | 11,796,662 | | | | 11,355,219 | (c) |
Origen Manufactured Housing Contract Trust,2007-A A2 | | | 4.946 | % | | | 4/15/37 | | | | 15,882,437 | | | | 15,264,226 | (c) |
Ownit Mortgage Loan Asset-Backed Certificates,2004-1 M2 (1 mo. USD LIBOR + 1.800%) | | | 4.204 | % | | | 7/25/35 | | | | 3,361,744 | | | | 3,404,575 | (c) |
See Notes to Financial Statements.
| | |
| | |
| Western Asset Core Plus Bond Fund 2019 Semi-Annual Report | | 69 |
Schedule of investments(unaudited) (cont’d)
June 30, 2019
Western Asset Core Plus Bond Fund
| | | | | | | | | | | | | | | | |
| Security | | Rate | | | Maturity
Date | | | Face
Amount†/
Units | | | Value | |
| Asset-Backed Securities — continued | |
RAMP Series Trust,2006-RZ4 M1 (1 mo. USD LIBOR + 0.350%) | | | 2.754 | % | | | 10/25/36 | | | | 17,250,000 | | | $ | 16,491,100 | (c) |
RAMP Trust,2003-RS7 MII1 (1 mo. USD LIBOR + 1.125%) | | | 3.529 | % | | | 8/25/33 | | | | 1,449,222 | | | | 1,437,956 | (c) |
Ratchet Trading Ltd.,2018-1 A | | | 15.190 | % | | | 1/26/27 | | | | 5,421,262 | | | | 5,414,816 | (a)(c) |
Renaissance Home Equity Loan Trust,2003-4 A3 (1 mo. USD LIBOR + 0.620%) | | | 3.024 | % | | | 3/25/34 | | | | 5,795,112 | | | | 5,828,442 | (c) |
Renaissance Home Equity Loan Trust,2006-1 AF5 | | | 6.166 | % | | | 5/25/36 | | | | 14,324,560 | | | | 10,360,598 | |
Residential Funding Securities Corp.,2002-RP2 A1 (1 mo. USD LIBOR + 1.500%) | | | 3.904 | % | | | 10/25/32 | | | | 1,412,418 | | | | 1,361,253 | (a)(c) |
SACO I Trust,2006-3 A3 (1 mo. USD LIBOR + 0.460%) | | | 2.864 | % | | | 4/25/36 | | | | 283,065 | | | | 280,061 | (c) |
SBA Small Business Investment Cos.,2018-10B 1 | | | 3.548 | % | | | 9/10/28 | | | | 9,569,288 | | | | 10,208,861 | |
SBA Small Business Investment Cos.,2019-10A 1 | | | 3.113 | % | | | 3/10/29 | | | | 16,950,000 | | | | 17,689,269 | |
Securitized Asset Backed Receivables LLC Trust,2006-WM3 A1 (1 mo. USD LIBOR + 0.050%) | | | 2.454 | % | | | 10/25/36 | | | | 29,063,622 | | | | 12,560,280 | (c) |
Securitized Asset Backed Receivables LLC Trust,2006-WM3 A2 (1 mo. USD LIBOR + 0.160%) | | | 2.564 | % | | | 10/25/36 | | | | 79,218,958 | | | | 34,839,214 | (c) |
Securitized Asset Backed Receivables LLC Trust,2006-WM3 A3 (1 mo. USD LIBOR + 0.220%) | | | 2.624 | % | | | 10/25/36 | | | | 40,157,144 | | | | 17,826,861 | (c) |
SLM Student Loan EDC Repackaging Trust,2013-M1 M1 | | | 3.500 | % | | | 10/28/29 | | | | 1,707,337 | | | | 1,693,082 | (a) |
SMB Private Education Loan Trust,2015-C R | | | 0.000 | % | | | 9/18/46 | | | | 49,649 | | | | 49,162,273 | (a) |
SoFi Professional Loan Program LLC,2015-C R | | | 0.000 | % | | | 8/25/36 | | | | 4,200 | | | | 6,232,822 | (a) |
Structured Asset Securities Corp. Mortgage Loan Trust,2006-ARS1 A1 (1 mo. USD LIBOR + 0.220%) | | | 2.624 | % | | | 2/25/36 | | | | 1,100,959 | | | | 54,013 | (a)(c) |
Structured Asset Securities Corp. Mortgage Loan Trust,2007-BC2 A4 (1 mo. USD LIBOR + 0.150%) | | | 2.554 | % | | | 3/25/37 | | | | 27,754,072 | | | | 22,419,237 | (c) |
See Notes to Financial Statements.
| | |
| | |
| 70 | | Western Asset Core Plus Bond Fund 2019 Semi-Annual Report |
Western Asset Core Plus Bond Fund
| | | | | | | | | | | | | | | | |
| Security | | Rate | | | Maturity
Date | | | Face
Amount†/
Units | | | Value | |
| Asset-Backed Securities — continued | |
Structured Asset Securities Corp. Trust,2005-SC1, 1A2 | | | 7.083 | % | | | 5/25/31 | | | | 5,863,822 | | | $ | 5,289,816 | (a)(c) |
Towd Point Mortgage Trust, 2019- HY2 A1 (1 mo. USD LIBOR + 1.000%) | | | 3.404 | % | | | 5/25/58 | | | | 58,776,025 | | | | 59,468,877 | (a)(c) |
United States Small Business Administration,2019-20D 1 | | | 2.980 | % | | | 4/1/39 | | | | 10,540,000 | | | | 10,823,294 | |
Upgrade Pass-Through Trust,2018-3 A | | | 15.498 | % | | | 6/15/24 | | | | 10,381,205 | | | | 10,410,314 | (a) |
Upgrade Pass-Through Trust I,2017-1 CERT | | | 14.960 | % | | | 12/27/27 | | | | 5,956,856 | | | | 5,938,432 | (a)(c) |
Upgrade Pass-Through Trust I,2018-2 A | | | 16.537 | % | | | 5/15/24 | | | | 8,808,288 | | | | 8,828,564 | (a) |
Upgrade Pass-Through Trust I,2018-5 A | | | 12.075 | % | | | 9/15/24 | | | | 11,034,533 | | | | 11,065,474 | (a) |
Upgrade Pass-Through Trust I,2018-6 A | | | 5.339 | % | | | 10/15/24 | | | | 9,872,801 | | | | 9,936,086 | (a) |
Upgrade Pass-Through Trust IV,2018-4 A | | | 15.308 | % | | | 8/15/24 | | | | 11,029,058 | | | | 11,059,984 | (a) |
Total Asset-Backed Securities (Cost — $925,706,203) | | | | 941,320,298 | |
| | | | |
| | | | | | | | | Face
Amount† | | | | |
| Senior Loans — 3.2% | |
| Communication Services — 0.5% | |
Diversified Telecommunication Services — 0.2% | |
Level 3 Financing Inc., 2024 Term Loan B (1 mo. USD LIBOR + 2.250%) | | | 4.652 | % | | | 2/22/24 | | | | 30,782,000 | | | | 30,567,173 | (c)(m)(n) |
Unitymedia Finance LLC, First Lien Term Loan D (1 mo. USD LIBOR + 2.250%) | | | 4.644 | % | | | 1/15/26 | | | | 210,000 | | | | 209,646 | (c)(m)(n) |
UnityMedia Hessen GmbH & Co. KG, Term Loan Senior Facility B (1 mo. USD LIBOR + 2.250%) | | | 4.644 | % | | | 9/30/25 | | | | 4,305,296 | | | | 4,297,762 | (c)(m)(n) |
Virgin Media Bristol LLC, Term Loan Facility K (1 mo. USD LIBOR + 2.500%) | | | 4.894 | % | | | 1/15/26 | | | | 13,330,528 | | | | 13,299,054 | (c)(m)(n) |
Total Diversified Telecommunication Services | | | | 48,373,635 | |
See Notes to Financial Statements.
| | |
| | |
| Western Asset Core Plus Bond Fund 2019 Semi-Annual Report | | 71 |
Schedule of investments(unaudited) (cont’d)
June 30, 2019
Western Asset Core Plus Bond Fund
| | | | | | | | | | | | | | | | |
| Security | | Rate | | | Maturity
Date | | | Face
Amount† | | | Value | |
Media — 0.3% | |
CBS Radio Inc., Term Loan B1 (1 mo. USD LIBOR + 2.750%) | | | 5.152 | % | | | 11/18/24 | | | | 4,518,443 | | | $ | 4,524,091 | (c)(m)(n) |
Charter Communications Operating LLC, Term Loan B (3 mo. USD LIBOR + 2.000%) | | | 4.330 | % | | | 4/30/25 | | | | 13,192,769 | | | | 13,190,936 | (c)(m)(n) |
iHeartCommunications Inc., Term Loan | | | — | | | | 5/4/26 | | | | 15,830,000 | | | | 15,869,575 | (o) |
Nexstar Broadcasting Inc., Term Loan B4 | | | — | | | | 7/15/26 | | | | 16,750,000 | | | | 16,711,609 | (o) |
Numericable U.S. LLC, USD Term Loan B12 (1 mo. USD LIBOR + 3.688%) | | | 6.082 | % | | | 1/31/26 | | | | 11,935,782 | | | | 11,607,548 | (c)(m)(n) |
Univision Communications Inc., 2017 Replacement Term Loan (1 mo. USD LIBOR + 2.750%) | | | 5.152 | % | | | 3/15/24 | | | | 15,253,267 | | | | 14,549,161 | (c)(m)(n) |
UPC Financing Partnership, Term Loan Facility AR (1 mo. USD LIBOR + 2.500%) | | | 4.894 | % | | | 1/15/26 | | | | 9,651,651 | | | | 9,649,594 | (c)(m)(n)(o) |
Ziggo Secured Finance Partnership, Term Loan E (1 mo. USD LIBOR + 2.500%) | | | 4.894 | % | | | 4/15/25 | | | | 8,238,250 | | | | 8,084,351 | (c)(m)(n) |
Total Media | | | | 94,186,865 | |
Wireless Telecommunication Services — 0.0% | |
Sprint Communications Inc., Initial Term Loan (1 mo. USD LIBOR + 2.500%) | | | 4.938 | % | | | 2/2/24 | | | | 3,403,915 | | | | 3,420,935 | (c)(e)(f)(m)(n) |
Total Communication Services | | | | 145,981,435 | |
| Consumer Discretionary — 0.8% | |
Auto Components — 0.1% | |
American Axle & Manufacturing Inc., Term Loan B | | | 4.660-4.840 | % | | | 4/6/24 | | | | 3,302,961 | | | | 3,238,141 | (c)(m)(n) |
Panther BF Aggregator 2 LP, First Lien Initial Term Loan (1 mo. USD LIBOR + 3.500%) | | | 5.902 | % | | | 4/30/26 | | | | 24,490,000 | | | | 24,318,570 | (c)(m)(n) |
Total Auto Components | | | | 27,556,711 | |
Commercial Services & Supplies — 0.0% | |
Atlantic Aviation FBO Inc., Term Loan (1 mo. USD LIBOR + 3.750%) | | | 6.160 | % | | | 12/6/25 | | | | 3,731,250 | | | | 3,763,805 | (c)(f)(m)(n) |
See Notes to Financial Statements.
| | |
| | |
| 72 | | Western Asset Core Plus Bond Fund 2019 Semi-Annual Report |
Western Asset Core Plus Bond Fund
| | | | | | | | | | | | | | | | |
| Security | | Rate | | | Maturity
Date | | | Face
Amount† | | | Value | |
Diversified Consumer Services — 0.1% | |
Prime Security Services Borrower LLC, Term Loan B1 (1 mo. USD LIBOR + 2.750%) | | | 5.152 | % | | | 5/2/22 | | | | 26,638,135 | | | $ | 26,492,823 | (c)(m)(n)(o) |
Hotels, Restaurants & Leisure — 0.5% | |
1011778 BC Unlimited Liability Co., Term Loan B3 (1 mo. USD LIBOR + 2.250%) | | | 4.652 | % | | | 2/16/24 | | | | 7,225,241 | | | | 7,185,726 | (c)(m)(n) |
Alterra Mountain Co., Initial Term Loan (1 mo. USD LIBOR + 3.000%) | | | 5.402 | % | | | 7/31/24 | | | | 14,955,098 | | | | 14,915,378 | (c)(m)(n) |
Aramark Services Inc., Term Loan B3 (3 mo. USD LIBOR + 1.750%) | | | 4.080 | % | | | 3/11/25 | | | | 14,934,742 | | | | 14,911,339 | (c)(m)(n) |
Boyd Gaming Corp., Refinancing Term Loan B (1 week USD LIBOR + 2.250%) | | | 4.622 | % | | | 9/15/23 | | | | 2,283,442 | | | | 2,275,164 | (c)(m)(n) |
Caesars Resort Collection LLC, Term Loan B (1 mo. USD LIBOR + 2.750%) | | | 5.152 | % | | | 12/23/24 | | | | 19,932,579 | | | | 19,590,875 | (c)(m)(n) |
Four Seasons Hotels Ltd., Restated Term Loan (1 mo. USD LIBOR + 2.000%) | | | 4.402 | % | | | 11/30/23 | | | | 5,732,475 | | | | 5,727,551 | (c)(m)(n) |
Golden Nugget Inc., Term Loan B (1 mo. USD LIBOR + 2.750%) | | | 5.144-5.152 | % | | | 10/4/23 | | | | 4,324,930 | | | | 4,294,859 | (c)(m)(n) |
Hilton Worldwide Finance LLC, Refinance Term Loan B2 (1 mo. USD LIBOR + 1.750%) | | | 4.154 | % | | | 6/22/26 | | | | 11,876,278 | | | | 11,898,546 | (c)(m)(n) |
PCI Gaming Authority, Term Loan Facility B (1 mo. USD LIBOR + 3.000%) | | | 5.402 | % | | | 5/15/26 | | | | 12,900,000 | | | | 12,932,250 | (c)(m)(n) |
Scientific Games International Inc., Initial Term Loan B5 (1 mo. USD LIBOR + 2.750%) | | | 5.152-5.231 | % | | | 8/14/24 | | | | 27,660,516 | | | | 27,280,184 | (c)(m)(n) |
Station Casinos LLC, Term Loan Facility B (1 mo. USD LIBOR + 2.500%) | | | 4.910 | % | | | 6/8/23 | | | | 11,426,135 | | | | 11,386,852 | (c)(m)(n) |
Total Hotels, Restaurants & Leisure | | | | | | | | | | | | | | | 132,398,724 | |
Specialty Retail — 0.1% | | | | | | | | | | | | | | | | |
Academy Ltd., Initial Term Loan | | | 6.439-6.440 | % | | | 7/1/22 | | | | 11,724,383 | | | | 8,470,867 | (c)(m)(n) |
CWGS Group LLC, Term Loan (1 mo. USD LIBOR + 2.750%) | | | 5.152-5.190 | % | | | 11/8/23 | | | | 2,902,551 | | | | 2,684,860 | (c)(m)(n) |
See Notes to Financial Statements.
| | |
| | |
| Western Asset Core Plus Bond Fund 2019 Semi-Annual Report | | 73 |
Schedule of investments(unaudited) (cont’d)
June 30, 2019
Western Asset Core Plus Bond Fund
| | | | | | | | | | | | | | | | |
| Security | | Rate | | | Maturity
Date | | | Face
Amount† | | | Value | |
Specialty Retail — continued | | | | | | | | | | | | | | | | |
Michaels Stores Inc., 2018 New Replacement Term Loan B (1 mo. USD LIBOR + 2.500%) | | | 4.902-4.904 | % | | | 1/30/23 | | | | 6,063,441 | | | $ | 5,873,958 | (c)(m)(n) |
Party City Holdings Inc., 2018 Replacement Term Loan (1 mo. USD LIBOR + 2.500%) | | | 4.910 | % | | | 8/19/22 | | | | 10,180,128 | | | | 10,133,472 | (c)(m)(n) |
PetSmart Inc., Term Loan B2 (1 mo. USD LIBOR + 4.250%) | | | 6.670 | % | | | 3/11/22 | | | | 1,926,164 | | | | 1,873,676 | (c)(m)(n) |
Total Specialty Retail | | | | | | | | | | | | | | | 29,036,833 | |
Total Consumer Discretionary | | | | | | | | | | | | | | | 219,248,896 | |
| Consumer Staples — 0.1% | | | | | | | | | | | | | | | | |
Food & Staples Retailing — 0.1% | | | | | | | | | | | | | | | | |
Albertson’s LLC, 2017 Replacement Term Loan B6 (1 mo. USD LIBOR + 3.000%) | | | 5.402 | % | | | 6/22/23 | | | | 12,502,211 | | | | 12,509,162 | (c)(m)(n) |
Albertson’s LLC, 2018 Term Loan B7 (1 mo. USD LIBOR + 3.000%) | | | 5.402 | % | | | 11/17/25 | | | | 4,881,321 | | | | 4,864,325 | (c)(m)(n) |
Total Food & Staples Retailing | | | | | | | | | | | | | | | 17,373,487 | |
Food Products — 0.0% | | | | | | | | | | | | | | | | |
Post Holdings Inc., Replacement Incremental Term Loan A (1 mo. USD LIBOR + 2.000%) | | | 4.404 | % | | | 5/24/24 | | | | 5,359,179 | | | | 5,341,472 | (c)(m)(n) |
Total Consumer Staples | | | | | | | | | | | | | | | 22,714,959 | |
| Financials — 0.4% | |
Capital Markets — 0.1% | |
Blackstone CQP Holdco LP, Initial Term Loan (3 mo. USD LIBOR + 3.500%) | | | 5.887 | % | | | 6/7/24 | | | | 4,970,000 | | | | 4,982,425 | (c)(m)(n) |
Edelman Financial Center LLC, First Lien Initial Term Loan (1 mo. USD LIBOR + 3.250%) | | | 5.644 | % | | | 7/21/25 | | | | 11,096,533 | | | | 11,087,866 | (c)(m)(n)(o) |
First Eagle Holdings Inc., Initial Term Loan (3 mo. USD LIBOR + 2.750%) | | | 5.080 | % | | | 12/2/24 | | | | 11,047,721 | | | | 11,050,019 | (c)(m)(n) |
Focus Financial Partners LLC, Term Loan B2 (1 mo. USD LIBOR + 2.500%) | | | 4.902 | % | | | 7/3/24 | | | | 1,164,847 | | | | 1,165,029 | (c)(m)(n) |
LPL Holdings Inc., Term Loan B (1 mo. USD LIBOR + 2.250%) | | | 4.654 | % | | | 9/23/24 | | | | 2,841,691 | | | | 2,839,025 | (c)(m)(n) |
RPI Finance Trust, Initial Term Loan B6 (1 mo. USD LIBOR + 2.000%) | | | 4.402 | % | | | 3/27/23 | | | | 5,629,039 | | | | 5,641,102 | (c)(m)(n) |
Total Capital Markets | | | | 36,765,466 | |
See Notes to Financial Statements.
| | |
| | |
| 74 | | Western Asset Core Plus Bond Fund 2019 Semi-Annual Report |
Western Asset Core Plus Bond Fund
| | | | | | | | | | | | | | | | |
| Security | | Rate | | | Maturity
Date | | | Face
Amount† | | | Value | |
Diversified Financial Services — 0.2% | |
Citadel Securities LP, Term Loan B | | | — | | | | 2/27/26 | | | | 2,064,825 | | | $ | 2,069,987 | (o) |
Citadel Securities LP, Term Loan B | | | — | | | | 2/27/26 | | | | 2,064,825 | | | | 2,062,244 | (e)(f)(o) |
Finco I LLC, 2018 Replacement Term Loan (1 mo. USD LIBOR + 2.000%) | | | 4.402 | % | | | 12/27/22 | | | | 755,386 | | | | 755,741 | (c)(m)(n) |
Guggenheim Partners Investment Management Holdings LLC, Term Loan B (1 mo. USD LIBOR + 2.750%) | | | 5.152 | % | | | 7/21/23 | | | | 2,971,348 | | | | 2,978,776 | (c)(m)(n) |
Intelsat Jackson Holdings SA, Term Loan B3 (1 mo. USD LIBOR + 3.750%) | | | 6.154 | % | | | 11/27/23 | | | | 8,148,754 | | | | 8,069,809 | (c)(m)(n) |
Jane Street Group LLC, New Term Loan (1 mo. USD LIBOR + 3.000%) | | | 5.402 | % | | | 8/25/22 | | | | 14,423,668 | | | | 14,363,565 | (c)(m)(n) |
Stars Group Holdings BV, USD Term Loan (3 mo. USD LIBOR + 3.500%) | | | 5.830 | % | | | 7/10/25 | | | | 1,035,895 | | | | 1,037,190 | (c)(m)(n) |
TKC Holdings Inc., First Lien Initial Term Loan (1 mo. USD LIBOR + 3.750%) | | | 6.160 | % | | | 2/1/23 | | | | 4,709,474 | | | | 4,615,284 | (c)(m)(n) |
UFC Holdings LLC, Term Loan B (1 mo. USD LIBOR + 3.250%) | | | 5.660 | % | | | 4/29/26 | | | | 16,233,167 | | | | 16,240,407 | (c)(m)(n) |
Total Diversified Financial Services | | | | 52,193,003 | |
Insurance — 0.1% | | | | | | | | | | | | | | | | |
Asurion LLC, Fourteenth Amendment Replacement Term Loan B4 (1 mo. USD LIBOR + 3.000%) | | | 5.402 | % | | | 8/4/22 | | | | 19,184,796 | | | | 19,163,213 | (c)(m)(n) |
Asurion LLC, New Term Loan B7 (1 mo. USD LIBOR + 3.000%) | | | 5.402 | % | | | 11/3/24 | | | | 13,050,787 | | | | 13,038,546 | (c)(m)(n) |
Total Insurance | | | | | | | | | | | | | | | 32,201,759 | |
Total Financials | | | | | | | | | | | | | | | 121,160,228 | |
| Health Care — 0.7% | | | | | | | | | | | | | | | | |
Health Care Providers & Services — 0.4% | | | | | | | | | | | | | | | | |
Air Medical Group Holdings Inc., 2018 Term Loan (1 mo. USD LIBOR + 3.250%) | | | 5.644 | % | | | 4/28/22 | | | | 7,480,487 | | | | 7,065,051 | (c)(m)(n) |
HCA Inc., Term Loan B10 (3 mo. USD LIBOR + 2.000%) | | | 4.330 | % | | | 3/13/25 | | | | 7,199,782 | | | | 7,214,282 | (c)(m)(n) |
Jaguar Holding Co. II, 2018 Term Loan (1 mo. USD LIBOR + 2.500%) | | | 4.902 | % | | | 8/18/22 | | | | 6,243,956 | | | | 6,213,854 | (c)(m)(n) |
LifePoint Health Inc., First Lien Term Loan B (1 mo. USD LIBOR + 4.500%) | | | 6.904-6.930 | % | | | 11/16/25 | | | | 30,088,102 | | | | 29,990,315 | (c)(m)(n) |
See Notes to Financial Statements.
| | |
| | |
| Western Asset Core Plus Bond Fund 2019 Semi-Annual Report | | 75 |
Schedule of investments(unaudited) (cont’d)
June 30, 2019
Western Asset Core Plus Bond Fund
| | | | | | | | | | | | | | | | |
| Security | | Rate | | | Maturity
Date | | | Face
Amount† | | | Value | |
Health Care Providers & Services — continued | | | | | | | | | | | | | | | | |
MPH Acquisition Holdings LLC, Initial Term Loan (3 mo. USD LIBOR + 2.750%) | | | 5.351 | % | | | 6/7/23 | | | | 29,477,273 | | | $ | 28,255,205 | (c)(m)(n) |
Phoenix Guarantor Inc., First Lien Initial Term Loan (1 mo. USD LIBOR + 4.500%) | | | 6.921 | % | | | 3/5/26 | | | | 18,388,182 | | | | 18,323,051 | (c)(m)(n) |
Total Health Care Providers & Services | | | | | | | | | | | | | | | 97,061,758 | |
Health Care Technology — 0.2% | | | | | | | | | | | | | | | | |
AthenaHealth Inc., First Lien Term Loan B (3 mo. USD LIBOR + 4.500%) | | | 7.045 | % | | | 2/11/26 | | | | 24,578,400 | | | | 24,570,731 | (c)(m)(n) |
Change Healthcare Holdings LLC, Closing Date Term Loan (1 mo. USD LIBOR + 2.750%) | | | 5.152 | % | | | 3/1/24 | | | | 30,414,206 | | | | 30,217,791 | (c)(m)(n) |
Total Health Care Technology | | | | | | | | | | | | | | | 54,788,522 | |
Pharmaceuticals — 0.1% | | | | | | | | | | | | | | | | |
Akorn Inc., Term Loan (1 mo. USD LIBOR + 7.000% PIK) | | | 9.438 | % | | | 4/16/21 | | | | 1,605 | | | | 1,513 | (c)(m)(n)(p) |
Bausch Health Cos. Inc., Initial Term Loan (1 mo. USD LIBOR + 3.000%) | | | 5.412 | % | | | 6/2/25 | | | | 15,325,981 | | | | 15,335,559 | (c)(m)(n) |
Beta Sub LLC, Term Loan | | | — | | | | 5/22/26 | | | | 11,760,000 | | | | 11,745,300 | (f)(o) |
Total Pharmaceuticals | | | | | | | | | | | | | | | 27,082,372 | |
Total Health Care | | | | | | | | | | | | | | | 178,932,652 | |
| Industrials — 0.2% | | | | | | | | | | | | | | | | |
Air Freight & Logistics — 0.1% | | | | | | | | | | | | | | | | |
Avolon TLB Borrower 1 (US) LLC, Term Loan B3 (1 mo. USD LIBOR + 1.750%) | | | 4.133 | % | | | 1/15/25 | | | | 17,834,950 | | | | 17,828,761 | (c)(m)(n) |
Commercial Services & Supplies — 0.0% | | | | | | | | | | | | | | | | |
ServiceMaster Co. LLC, Term Loan C (1 mo. USD LIBOR + 2.500%) | | | 4.902 | % | | | 11/8/23 | | | | 1,269,176 | | | | 1,272,349 | (c)(m)(n) |
Electrical Equipment — 0.0% | |
Brookfield WEC Holdings Inc., First Lien Initial Term Loan (1 mo. USD LIBOR + 3.500%) | | | 5.902 | % | | | 8/1/25 | | | | 2,035,915 | | | | 2,037,188 | (c)(m)(n) |
Professional Services — 0.1% | |
Trans Union LLC, 2017 Replacement Term Loan B3 (1 mo. USD LIBOR + 2.000%) | | | 4.402 | % | | | 4/10/23 | | | | 11,220,645 | | | | 11,219,646 | (c)(m)(n) |
See Notes to Financial Statements.
| | |
| | |
| 76 | | Western Asset Core Plus Bond Fund 2019 Semi-Annual Report |
Western Asset Core Plus Bond Fund
| | | | | | | | | | | | | | | | |
| Security | | Rate | | | Maturity
Date | | | Face
Amount† | | | Value | |
Trading Companies & Distributors — 0.0% | |
BrightView Landscapes LLC, Initial Term Loan (1 mo. USD LIBOR + 2.500%) | | | 4.938 | % | | | 8/15/25 | | | | 9,474,300 | | | $ | 9,480,221 | (c)(m)(n) |
Delos Finance SARL, 2018 Term Loan (3 mo. USD LIBOR + 1.750%) | | | 4.080 | % | | | 10/6/23 | | | | 1,433,333 | | | | 1,433,931 | (c)(m)(n) |
Total Trading Companies & Distributors | | | | 10,914,152 | |
Transportation Infrastructure — 0.0% | |
Flying Fortress Holdings LLC, Refinancing Term Loan (3 mo. USD LIBOR + 1.750%) | | | 4.080 | % | | | 10/31/22 | | | | 5,333,140 | | | | 5,335,999 | (c)(m)(n) |
Total Industrials | | | | | | | | | | | | | | | 48,608,095 | |
| Information Technology — 0.3% | |
IT Services — 0.1% | |
First Data Corp., 2022 New Dollar Term Loan D (1 mo. USD LIBOR + 2.000%) | | | 4.404 | % | | | 7/8/22 | | | | 2,420,265 | | | | 2,420,267 | (c)(m)(n) |
First Data Corp., 2024 New Dollar Term Loan A (1 mo. USD LIBOR + 2.000%) | | | 4.404 | % | | | 4/26/24 | | | | 7,887,149 | | | | 7,887,157 | (c)(m)(n) |
McAfee LLC, Term Loan B (1 mo. USD LIBOR + 3.750%) | | | 6.152 | % | | | 9/30/24 | | | | 8,218,773 | | | | 8,214,918 | (c)(m)(n)(o) |
Total IT Services | | | | | | | | | | | | | | | 18,522,342 | |
Semiconductors & Semiconductor Equipment — 0.0% | |
Micron Technology Inc., Term Loan B (1 mo. USD LIBOR + 1.750%) | | | 4.160 | % | | | 4/26/22 | | | | 1,964,936 | | | | 1,961,252 | (c)(m)(n) |
ON Semiconductor Corp., 2018 New Replacement Term Loan B3 (1 mo. USD LIBOR + 1.750%) | | | 4.152 | % | | | 3/31/23 | | | | 5,488,465 | | | | 5,424,816 | (c)(m)(n) |
Total Semiconductors & Semiconductor Equipment | | | | 7,386,068 | |
Software — 0.2% | | | | | | | | | | | | | | | | |
Dell International LLC, Refinancing Term Loan B (1 mo. USD LIBOR + 2.000%) | | | 4.410 | % | | | 9/7/23 | | | | 7,559,256 | | | | 7,528,391 | (c)(m)(n) |
DigiCert Holdings Inc., First Lien Term Loan (1 mo. USD LIBOR + 4.000%) | | | 6.402 | % | | | 10/31/24 | | | | 32,519,662 | | | | 32,458,688 | (c)(m)(n)(o) |
See Notes to Financial Statements.
| | |
| | |
| Western Asset Core Plus Bond Fund 2019 Semi-Annual Report | | 77 |
Schedule of investments(unaudited) (cont’d)
June 30, 2019
Western Asset Core Plus Bond Fund
| | | | | | | | | | | | | | | | |
| Security | | Rate | | | Maturity
Date | | | Face
Amount† | | | Value | |
Software — continued | | | | | | | | | | | | | | | | |
MA Financeco LLC, Term Loan B3 (1 mo. USD LIBOR + 2.500%) | | | 4.902 | % | | | 6/21/24 | | | | 349,861 | | | $ | 343,738 | (c)(m)(n) |
Seattle Escrow Borrower LLC, Initial Term Loan (1 mo. USD LIBOR + 2.500%) | | | 4.902 | % | | | 6/21/24 | | | | 2,362,694 | | | | 2,321,347 | (c)(m)(n) |
Total Software | | | | | | | | | | | | | | | 42,652,164 | |
Technology Hardware, Storage & Peripherals — 0.0% | |
Western Digital Corp., New Term Loan B4 (1 mo. USD LIBOR + 1.750%) | | | 4.152 | % | | | 4/29/23 | | | | 15,118,952 | | | | 14,820,353 | (c)(m)(n) |
Total Information Technology | | | | 83,380,927 | |
| Materials — 0.1% | |
Containers & Packaging — 0.1% | |
Berry Global Inc., Term Loan Q (1 mo. USD LIBOR + 2.000%) | | | 4.412 | % | | | 10/3/22 | | | | 5,321,845 | | | | 5,292,420 | (c)(m)(n) |
Reynolds Group Holdings Inc., Incremental Term Loan (1 mo. USD LIBOR + 2.750%) | | | 5.152 | % | | | 2/6/23 | | | | 22,598,548 | | | | 22,461,149 | (c)(m)(n) |
Total Materials | | | | 27,753,569 | |
| Real Estate — 0.1% | |
Equity Real Estate Investment Trusts (REITs) — 0.1% | |
MGM Growth Properties Operating Partnership LP, Term Loan B (1 mo. USD LIBOR + 2.000%) | | | 4.402 | % | | | 3/21/25 | | | | 17,147,081 | | | | 17,072,063 | (c)(m)(n) |
VICI Properties 1 LLC, Term Loan B (1 mo. USD LIBOR + 2.000%) | | | 4.404 | % | | | 12/20/24 | | | | 2,068,182 | | | | 2,048,577 | (c)(m)(n) |
Total Equity Real Estate Investment Trusts (REITs) | | | | 19,120,640 | |
Real Estate Management & Development — 0.0% | |
CityCenter Holdings LLC, Refinancing Term Loan (1 mo. USD LIBOR + 2.250%) | | | 4.652 | % | | | 4/18/24 | | | | 8,824,563 | | | | 8,805,652 | (c)(m)(n) |
Total Real Estate | | | | 27,926,292 | |
Total Senior Loans (Cost — $883,927,993) | | | | 875,707,053 | |
| U.S. Treasury Inflation Protected Securities — 1.9% | |
U.S. Treasury Bonds, Inflation Indexed | | | 2.125 | % | | | 2/15/40 | | | | 12,095,236 | | | | 15,491,747 | |
U.S. Treasury Bonds, Inflation Indexed | | | 2.125 | % | | | 2/15/41 | | | | 19,160,991 | | | | 24,706,993 | |
U.S. Treasury Bonds, Inflation Indexed | | | 0.750 | % | | | 2/15/42 | | | | 75,490,245 | | | | 75,861,050 | |
See Notes to Financial Statements.
| | |
| | |
| 78 | | Western Asset Core Plus Bond Fund 2019 Semi-Annual Report |
Western Asset Core Plus Bond Fund
| | | | | | | | | | | | | | | | |
| Security | | Rate | | | Maturity
Date | | | Face
Amount† | | | Value | |
| U.S. Treasury Inflation Protected Securities — continued | |
U.S. Treasury Bonds, Inflation Indexed | | | 1.375 | % | | | 2/15/44 | | | | 67,828,871 | | | $ | 77,057,076 | |
U.S. Treasury Bonds, Inflation Indexed | | | 1.000 | % | | | 2/15/46 | | | | 65,832,250 | | | | 69,056,892 | |
U.S. Treasury Bonds, Inflation Indexed | | | 0.875 | % | | | 2/15/47 | | | | 3,747,586 | | | | 3,822,727 | |
U.S. Treasury Bonds, Inflation Indexed | | | 1.000 | % | | | 2/15/49 | | | | 231,545,400 | | | | 245,143,999 | |
Total U.S. Treasury Inflation Protected Securities (Cost — $484,221,393) | | | | 511,140,484 | |
| Non-U.S. Treasury Inflation Protected Securities — 0.3% | |
Japan — 0.3% | |
Japanese Government CPI Linked Bond, Senior Notes (Cost — $94,119,469) | | | 0.100 | % | | | 3/10/26 | | | | 9,453,014,450 | JPY | | | 91,038,547 | |
| | | | | | | | | | | | | | | | | | |
| | | | | |
| | | | | Expiration
Date | | | Contracts | | | Notional
Amount† | | | | |
| Purchased Options — 0.1% | |
| Exchange-Traded Purchased Options — 0.0% | |
Australian Dollar Futures, Call @ $69.00 | | | 8/9/19 | | | | 266 | | | | 266,000 | | | | 428,260 | |
Canadian Dollar, Call @ $75.00 | | | 7/5/19 | | | | 429 | | | | 429,000 | | | | 669,240 | |
Euro Currency, Call @ $1.13 | | | 7/5/19 | | | | 288 | | | | 36,000,000 | | | | 712,800 | |
Euro Currency, Call @ $1.13 | | | 7/5/19 | | | | 690 | | | | 86,250,000 | | | | 1,293,750 | |
Euro Currency, Call @ $1.14 | | | 7/5/19 | | | | 349 | | | | 43,625,000 | | | | 287,925 | |
U.S. Treasury2-Year Notes Futures, Put @ $105.50 | | | 7/26/19 | | | | 20,009 | | | | 40,018,000 | | | | 0 | (g) |
U.S. Treasury5-Year Notes Futures, Put @ $111.75 | | | 7/26/19 | | | | 6,205 | | | | 6,205,000 | | | | 0 | (g) |
U.S. Treasury5-Year Notes Futures, Put @ $113.25 | | | 7/26/19 | | | | 39,412 | | | | 39,412,000 | | | | 307,926 | |
U.S. Treasury5-Year Notes Futures, Put @ $114.25 | | | 7/26/19 | | | | 3,105 | | | | 3,105,000 | | | | 24,259 | |
U.S. Treasury5-Year Notes Futures, Put @ $114.50 | | | 7/26/19 | | | | 3,105 | | | | 3,105,000 | | | | 24,259 | |
U.S. Treasury5-Year Notes Futures, Put @ $113.75 | | | 8/23/19 | | | | 70 | | | | 70,000 | | | | 1,641 | |
U.S. Treasury10-Year Notes Futures, Call @ $133.00 | | | 7/26/19 | | | | 23,000 | | | | 23,000,000 | | | | 359,375 | |
U.S. Treasury10-Year Notes Futures, Call @ $127.75 | | | 7/26/19 | | | | 782 | | | | 782,000 | | | | 586,500 | |
See Notes to Financial Statements.
| | |
| | |
| Western Asset Core Plus Bond Fund 2019 Semi-Annual Report | | 79 |
Schedule of investments(unaudited) (cont’d)
June 30, 2019
Western Asset Core Plus Bond Fund
| | | | | | | | | | | | | | | | | | | | |
| Security | | | | | Expiration
Date | | | Contracts | | | Notional
Amount† | | | Value | |
| Exchange-Traded Purchased Options — continued | |
U.S. Treasury10-Year Notes Futures, Call @ $128.00 | | | | 7/26/19 | | | | 399 | | | | 399,000 | | | $ | 243,141 | |
U.S. Treasury10-Year Notes Futures, Put @ $128.00 | | | | 7/26/19 | | | | 195 | | | | 195,000 | | | | 124,922 | |
U.S. Treasury Long-Term Bonds Futures, Call @ $155.50 | | | | 7/26/19 | | | | 97 | | | | 97,000 | | | | 122,766 | |
U.S. Treasury Long-Term Bonds Futures, Put @ $137.00 | | | | 7/26/19 | | | | 374 | | | | 374,000 | | | | 0 | (g) |
U.S. Treasury Long-Term Bonds Futures, Put @ $155.50 | | | | 7/26/19 | | | | 196 | | | | 196,000 | | | | 229,688 | |
Total Exchange-Traded Purchased Options | | | | 5,416,452 | |
| | | | | |
| | | Counterparty | | | | | | | | | | | | | |
| OTC Purchased Options — 0.1% | |
U.S. Dollar/Brazilian Real, Put @ 4.05 BRL | |
| Goldman Sachs
Group Inc. |
| | | 8/22/19 | | | | 379,260,000 | | | | 379,260,000 | | | | 21,215,120 | |
U.S. Dollar/Chinese Offshore Yuan, Call @ 6.94 CNH | | | BNP Paribas SA | | | | 8/30/19 | | | | 130,870,000 | | | | 130,870,000 | | | | 765,205 | |
U.S. Dollar/Euro, Call @ $1.14 | | | Citibank N.A. | | | | 11/4/19 | | | | 539,176,464 | | | | 539,176,464 | | | | 5,367,241 | |
U.S. Dollar/Euro, Put @ $1.12 | | | Barclays Bank PLC | | | | 7/24/19 | | | | 162,450,000 | | | | 162,450,000 | | | | 2,085,096 | |
U.S. Dollar/Euro, Put @ $1.13 | | | BNP Paribas SA | | | | 7/24/19 | | | | 335,560,000 | | | | 335,560,000 | | | | 4,307,017 | |
Total OTC Purchased Options | | | | 33,739,679 | |
Total Purchased Options (Cost — $32,891,045) | | | | 39,156,131 | |
| | | | | |
| | | | | | Rate | | | | | | Shares | | | | |
| Preferred Stocks — 0.1% | |
| Financials — 0.1% | |
Banks — 0.1% | |
GMAC Capital Trust I (3 mo. USD LIBOR + 5.785%) | | | | | | | 8.303% | | | | | | | | 431,316 | | | | 11,270,287 | (c) |
Diversified Financial Services — 0.0% | | | | | | | | | | | | | | | | | | | | |
Citigroup Capital XIII (3 mo. USD LIBOR + 6.370%) | | | | | | | 8.953 | % | | | | | | | 63,425 | | | | 1,749,896 | (c) |
Total Preferred Stocks (Cost — $12,150,259) | | | | 13,020,183 | |
Total Investments before Short-Term Investments (Cost — $26,146,225,235) | | | | 26,935,037,523 | |
See Notes to Financial Statements.
| | |
| | |
| 80 | | Western Asset Core Plus Bond Fund 2019 Semi-Annual Report |
Western Asset Core Plus Bond Fund
| | | | | | | | | | | | | | | | |
| | | | |
| Security | | Rate | | | Maturity
Date | | | Face
Amount† | | | Value | |
| Short-Term Investments — 5.9% | |
| Commercial Paper — 2.3% | |
BNG Bank NV | | | 2.720 | % | | | 7/16/19 | | | | 162,120,000 | | | $ | 161,929,428 | (q)(r) |
Standard Chartered Bank | | | 2.634 | % | | | 7/24/19 | | | | 251,460,000 | | | | 251,030,491 | (q)(r) |
Toronto-Dominion Bank | | | 2.668 | % | | | 7/25/19 | | | | 211,000,000 | | | | 210,619,884 | (q)(r) |
Total Commercial Paper (Cost — $623,642,073) | | | | 623,579,803 | |
| Certificates of Deposit — 0.5% | |
Sumitomo Mitsui Trust NY (Cost — $135,300,000) | | | 2.540 | % | | | 7/29/19 | | | | 135,300,000 | | | | 135,320,703 | |
| | | | |
| | | | | | | | | Shares | | | | |
| Money Market Funds — 3.1% | | | | | | | | | | | | | | | | |
Western Asset Government Cash Management Portfolio LLC (Cost — $847,657,870) | | | 2.320 | % | | | | | | | 847,657,870 | | | | 847,657,870 | (s) |
Total Short-Term Investments (Cost — $1,606,599,943) | | | | 1,606,558,376 | |
Total Investments — 104.7% (Cost — $27,752,825,178) | | | | 28,541,595,899 | |
Liabilities in Excess of Other Assets — (4.7)% | | | | (1,283,106,601 | ) |
Total Net Assets — 100.0% | | | $ | 27,258,489,298 | |
See Notes to Financial Statements.
| | |
| | |
| Western Asset Core Plus Bond Fund 2019 Semi-Annual Report | | 81 |
Schedule of investments(unaudited) (cont’d)
June 30, 2019
Western Asset Core Plus Bond Fund
| † | Face amount/notional amount denominated in U.S. dollars, unless otherwise noted. |
| * | Non-income producing security. |
| (a) | Security is exempt from registration under Rule 144A of the Securities Act of 1933. This security may be resold in transactions that are exempt from registration, normally to qualified institutional buyers. This security has been deemed liquid pursuant to guidelines approved by the Board of Directors. |
| (b) | Security has no maturity date. The date shown represents the next call date. |
| (c) | Variable rate security. Interest rate disclosed is as of the most recent information available. Certain variable rate securities are not based on a published reference rate and spread but are determined by the issuer or agent and are based on current market conditions. These securities do not indicate a reference rate and spread in their description above. |
| (d) | The coupon payment on these securities is currently in default as of June 30, 2019. |
| (e) | Security is valued in good faith in accordance with procedures approved by the Board of Directors (Note 1). |
| (f) | Security is valued using significant unobservable inputs (Note 1). |
| (g) | Value is less than $1. |
| (h) | The maturity principal is currently in default as of June 30, 2019. |
| (i) | This security is traded on ato-be-announced (“TBA”) basis. At June 30, 2019, the Fund held TBA securities with a total cost of $1,558,643,008. |
| (j) | Collateralized mortgage obligations are secured by an underlying pool of mortgages or mortgage pass-through certificates that are structured to direct payments on underlying collateral to different series or classes of the obligations. The interest rate may change positively or inversely in relation to one or more interest rates, financial indices or other financial indicators and may be subject to an upper and/or lower limit. |
| (k) | Securities traded on a when-issued or delayed delivery basis. |
| (l) | Security is exempt from registration under Regulation S of the Securities Act of 1933. Regulation S applies to securities offerings that are made outside of the United States and do not involve direct selling efforts in the United States. This security has been deemed liquid pursuant to guidelines approved by the Board of Directors. |
| (m) | Interest rates disclosed represent the effective rates on senior loans. Ranges in interest rates are attributable to multiple contracts under the same loan. |
| (n) | Senior loans may be considered restricted in that the Fund ordinarily is contractually obligated to receive approval from the agent bank and/or borrower prior to the disposition of a senior loan. |
| (o) | All or a portion of this loan is unfunded as of June 30, 2019. The interest rate for fully unfunded term loans is to be determined. |
| (p) | Payment-in-kind security for which the issuer has the option at each interest payment date of making interest payments in cash or additional securities. |
| (q) | Commercial paper exempt from registration under Section 4(2) of the Securities Act of 1933. This security may be resold in transactions that are exempt from registration, normally to qualified institutional buyers. This security has been deemed liquid pursuant to guidelines approved by the Board of Directors. |
| (r) | Rate shown representsyield-to-maturity. |
| (s) | In this instance, as defined in the Investment Company Act of 1940, an “Affiliated Company” represents Fund ownership of at least 5% of the outstanding voting securities of an issuer, or a company which is under common ownership or control. At June 30, 2019, the total market value of investments in Affiliated Companies was $847,657,870 and the cost was $847,657,870 (Note 8). |
See Notes to Financial Statements.
| | |
| | |
| 82 | | Western Asset Core Plus Bond Fund 2019 Semi-Annual Report |
Western Asset Core Plus Bond Fund
| | |
Abbreviations used in this schedule: |
| |
| ACES | | — Alternative Credit Enhancement Securities |
| |
| ARS | | — Argentine Peso |
| |
| BRL | | — Brazilian Real |
| |
| CAS | | — Connecticut Avenue Securities |
| |
| CMT | | — Constant Maturity Treasury |
| |
| CNH | | — Chinese Offshore Yuan |
| |
| CPI | | — Consumer Price Index |
| |
| GBP | | — British Pound |
| |
| GTD | | — Guaranteed |
| |
| ICE | | — Intercontinental Exchange |
| |
| IO | | — Interest Only |
| |
| JPY | | — Japanese Yen |
| |
| JSC | | — Joint Stock Company |
| |
| LIBOR | | — London Interbank Offered Rate |
| |
| MXN | | — Mexican Peso |
| |
| PAC | | — Planned Amortization Class |
| |
| PIK | | — Payment-In-Kind |
| |
| PO | | — Principal Only |
| |
| REMIC | | — Real Estate Mortgage Investment Conduit |
| |
| RUB | | — Russian Ruble |
| |
| STRIPS | | — Separate Trading of Registered Interest and Principal Securities |
| |
| USD | | — United States Dollar |
| | | | | | | | | | | | | | | | | | | | |
| Schedule of Written Options | |
| Exchange-Traded Written Options | |
| Security | | Expiration
Date | | | Strike
Price | | | Contracts | | | Notional
Amount† | | | Value | |
| Canadian Dollar, Call | | | 7/5/19 | | | $ | 75.50 | | | | 918 | | | | 918,000 | | | $ | (991,440) | |
| Canadian Dollar, Call | | | 9/6/19 | | | | 76.00 | | | | 132 | | | | 132,000 | | | | (137,280) | |
| Euro Futures, Call | | | 8/9/19 | | | | 1.15 | | | | 269 | | | | 33,625,000 | | | | (221,925) | |
| Euro-Bund Futures, Call | | | 8/23/19 | | | | 172.50 | EUR | | | 302 | | | | 30,200,000 | | | | (429,255) | |
| Euro-Bund Futures, Put | | | 8/23/19 | | | | 170.00 | EUR | | | 740 | | | | 74,000,000 | | | | (244,022) | |
| Euro-Bund Futures, Put | | | 8/23/19 | | | | 170.50 | EUR | | | 741 | | | | 74,100,000 | | | | (320,185) | |
| U.S. Dollar/Euro, Call | | | 7/5/19 | | | | 70.00 | | | | 132 | | | | 132,000 | | | | (71,280) | |
| U.S. Treasury5-Year Notes Futures, Call | | | 7/26/19 | | | | 118.00 | | | | 1,107 | | | | 1,107,000 | | | | (536,203) | |
| U.S. Treasury5-Year Notes Futures, Call | | | 7/26/19 | | | | 118.25 | | | | 1,214 | | | | 1,214,000 | | | | (445,766) | |
| U.S. Treasury5-Year Notes Futures, Call | | | 7/26/19 | | | | 118.50 | | | | 1,211 | | | | 1,211,000 | | | | (321,672) | |
| U.S. Treasury5-Year Notes Futures, Call | | | 7/26/19 | | | | 118.75 | | | | 1,423 | | | | 1,423,000 | | | | (266,812) | |
| U.S. Treasury5-Year Notes Futures, Call | | | 8/23/19 | | | | 119.00 | | | | 1,012 | | | | 1,012,000 | | | | (260,907) | |
| U.S. Treasury5-Year Notes Futures, Put | | | 7/26/19 | | | | 117.00 | | | | 2,417 | | | | 2,417,000 | | | | (151,063) | |
| U.S. Treasury5-Year Notes Futures, Put | | | 7/26/19 | | | | 117.25 | | | | 3,031 | | | | 3,031,000 | | | | (284,156) | |
| U.S. Treasury5-Year Notes Futures, Put | | | 7/26/19 | | | | 117.50 | | | | 1,207 | | | | 1,207,000 | | | | (179,165) | |
See Notes to Financial Statements.
| | |
| | |
| Western Asset Core Plus Bond Fund 2019 Semi-Annual Report | | 83 |
Schedule of investments(unaudited) (cont’d)
June 30, 2019
Western Asset Core Plus Bond Fund
| | | | | | | | | | | | | | | | | | | | | | |
| Schedule of Written Options(cont’d) | |
| Security | | | | Expiration
Date | | | Strike
Price | | | Contracts | | | Notional
Amount† | | | Value | |
| U.S. Treasury5-Year Notes Futures, Put | | | 7/26/19 | | | $ | 117.75 | | | | 605 | | | | 605,000 | | | $ | (137,071) | |
| U.S. Treasury5-Year Notes Futures, Put | | | 8/23/19 | | | | 116.00 | | | | 1,609 | | | | 1,609,000 | | | | (87,993) | |
| U.S. Treasury5-Year Notes Futures, Put | | | 8/23/19 | | | | 117.25 | | | | 3,213 | | | | 3,213,000 | | | | (652,641) | |
| U.S. Treasury10-Year Notes Futures, Call | | | 7/5/19 | | | | 128.25 | | | | 196 | | | | 196,000 | | | | (52,063) | |
| U.S. Treasury10-Year Notes Futures, Call | | | 7/26/19 | | | | 127.50 | | | | 49 | | | | 49,000 | | | | (43,641) | |
| U.S. Treasury10-Year Notes Futures, Call | | | 7/26/19 | | | | 128.50 | | | | 292 | | | | 292,000 | | | | (118,625) | |
| U.S. Treasury10-Year Notes Futures, Call | | | 7/26/19 | | | | 128.75 | | | | 586 | | | | 586,000 | | | | (192,281) | |
| U.S. Treasury10-Year Notes Futures, Call | | | 7/26/19 | | | | 129.00 | | | | 2,340 | | | | 2,340,000 | | | | (621,562) | |
| U.S. Treasury10-Year Notes Futures, Call | | | 7/26/19 | | | | 129.50 | | | | 345 | | | | 345,000 | | | | (53,906) | |
| U.S. Treasury10-Year Notes Futures, Call | | | 8/23/19 | | | | 126.00 | | | | 969 | | | | 969,000 | | | | (2,119,687) | |
| U.S. Treasury10-Year Notes Futures, Call | | | 8/23/19 | | | | 127.00 | | | | 776 | | | | 776,000 | | | | (1,103,375) | |
| U.S. Treasury10-Year Notes Futures, Call | | | 8/23/19 | | | | 127.50 | | | | 778 | | | | 778,000 | | | | (875,250) | |
| U.S. Treasury10-Year Notes Futures, Call | | | 8/23/19 | | | | 129.00 | | | | 1,409 | | | | 1,409,000 | | | | (682,484) | |
| U.S. Treasury10-Year Notes Futures, Call | | | 8/23/19 | | | | 131.00 | | | | 974 | | | | 974,000 | | | | (152,187) | |
| U.S. Treasury10-Year Notes Futures, Put | | | 7/26/19 | | | | 125.00 | | | | 391 | | | | 391,000 | | | | (12,219) | |
| U.S. Treasury10-Year Notes Futures, Put | | | 7/26/19 | | | | 126.00 | | | | 1,461 | | | | 1,461,000 | | | | (114,141) | |
| U.S. Treasury10-Year Notes Futures, Put | | | 7/26/19 | | | | 126.50 | | | | 1,263 | | | | 1,263,000 | | | | (177,609) | |
| U.S. Treasury10-Year Notes Futures, Put | | | 7/26/19 | | | | 127.00 | | | | 1,660 | | | | 1,660,000 | | | | (415,000) | |
| U.S. Treasury10-Year Notes Futures, Put | | | 7/26/19 | | | | 127.25 | | | | 391 | | | | 391,000 | | | | (128,297) | |
| U.S. Treasury10-Year Notes Futures, Put | | | 7/26/19 | | | | 127.50 | | | | 69 | | | | 69,000 | | | | (29,109) | |
| U.S. Treasury10-Year Notes Futures, Put | | | 8/23/19 | | | | 123.50 | | | | 829 | | | | 829,000 | | | | (51,813) | |
| U.S. Treasury10-Year Notes Futures, Put | | | 8/23/19 | | | | 124.00 | | | | 146 | | | | 146,000 | | | | (9,125) | |
| U.S. Treasury10-Year Notes Futures, Put | | | 8/23/19 | | | | 125.00 | | | | 1,121 | | | | 1,121,000 | | | | (122,609) | |
| U.S. Treasury10-Year Notes Futures, Put | | | 8/23/19 | | | | 125.50 | | | | 436 | | | | 436,000 | | | | (61,313) | |
| U.S. Treasury10-Year Notes Futures, Put | | | 8/23/19 | | | | 126.00 | | | | 1,362 | | | | 1,362,000 | | | | (297,937) | |
| U.S. Treasury10-Year Notes Futures, Put | | | 8/23/19 | | | | 126.50 | | | | 10,457 | | | | 10,457,000 | | | | (3,267,812) | |
| U.S. Treasury10-Year Notes Futures, Put | | | 8/23/19 | | | | 127.00 | | | | 10,378 | | | | 10,378,000 | | | | (4,702,531) | |
| U.S. Treasury10-Year Notes Futures, Put | | | 8/23/19 | | | | 127.50 | | | | 585 | | | | 585,000 | | | | (383,906) | |
| U.S. Treasury Long-Term Bonds Futures, Call | | | 7/26/19 | | | | 154.00 | | | | 583 | | | | 583,000 | | | | (1,257,094) | |
| U.S. Treasury Long-Term Bonds Futures, Call | | | 7/26/19 | | | | 155.00 | | | | 193 | | | | 193,000 | | | | (295,531) | |
| U.S. Treasury Long-Term Bonds Futures, Call | | | 7/26/19 | | | | 156.00 | | | | 1,259 | | | | 1,259,000 | | | | (1,298,344) | |
| U.S. Treasury Long-Term Bonds Futures, Call | | | 7/26/19 | | | | 158.00 | | | | 197 | | | | 197,000 | | | | (80,031) | |
| U.S. Treasury Long-Term Bonds Futures, Call | | | 8/23/19 | | | | 153.00 | | | | 291 | | | | 291,000 | | | | (968,484) | |
See Notes to Financial Statements.
| | |
| | |
| 84 | | Western Asset Core Plus Bond Fund 2019 Semi-Annual Report |
Western Asset Core Plus Bond Fund
| | | | | | | | | | | | | | | | | | | | | | |
| Schedule of Written Options(cont’d) | |
| Security | | | | Expiration
Date | | | Strike
Price | | | Contracts | | | Notional
Amount† | | | Value | |
| U.S. Treasury Long-Term Bonds Futures, Call | | | 8/23/19 | | | $ | 156.00 | | | | 586 | | | | 586,000 | | | $ | (924,781) | |
| U.S. Treasury Long-Term Bonds Futures, Put | | | 7/26/19 | | | | 150.00 | | | | 197 | | | | 197,000 | | | | (15,391) | |
| U.S. Treasury Long-Term Bonds Futures, Put | | | 7/26/19 | | | | 152.00 | | | | 391 | | | | 391,000 | | | | (73,313) | |
| U.S. Treasury Long-Term Bonds Futures, Put | | | 7/26/19 | | | | 153.00 | | | | 390 | | | | 390,000 | | | | (127,969) | |
| U.S. Treasury Long-Term Bonds Futures, Put | | | 7/26/19 | | | | 154.00 | | | | 490 | | | | 490,000 | | | | (275,625) | |
| U.S. Treasury Long-Term Bonds Futures, Put | | | 7/26/19 | | | | 155.00 | | | | 292 | | | | 292,000 | | | | (273,750) | |
| U.S. Treasury Long-Term Bonds Futures, Put | | | 8/23/19 | | | | 151.00 | | | | 295 | | | | 295,000 | | | | (106,016) | |
| U.S. Treasury Long-Term Bonds Futures, Put | | | 8/23/19 | | | | 153.00 | | | | 292 | | | | 292,000 | | | | (214,437) | |
| Total Exchange-Traded Written Options (Premiums received — $30,559,165) | | | $ | (27,438,084) | |
| OTC Written Options | |
| | | Counterparty | | | | | | | | | | | | | | | |
| U.S. Dollar/Brazilian Real, Put | | Goldman Sachs
Group Inc. | | | 8/22/19 | | | | 3.88 | BRL | | | 758,520,000 | | | | 758,520,000 | | | $ | (17,861,982) | |
| U.S. Dollar/Brazilian Real, Put | | Citibank N.A. | | | 8/28/19 | | | | 3.95 | BRL | | | 370,790,000 | | | | 370,790,000 | | | | (13,711,380) | |
| U.S. Dollar/Chinese Offshore Yuan, Call | | BNP Paribas
SA | | | 8/30/19 | | | | 7.13 | CNH | | | 261,740,000 | | | | 261,740,000 | | | | (487,613) | |
| Total OTC Written Options (Premiums received — $13,668,156) | | | $ | (32,060,975) | |
| Total Written Options (Premiums received — $44,227,321) | | | $ | (59,499,059) | |
| † | Notional amount denominated in U.S. dollars, unless otherwise noted. |
| | |
Abbreviations used in this schedule: |
| |
| BRL | | — Brazilian Real |
| |
| CNH | | — Chinese Offshore Yuan |
| |
| EUR | | — Euro |
At June 30, 2019, the Fund had the following open futures contracts:
| | | | | | | | | | | | | | | | | | | | |
| | | Number of
Contracts | | | Expiration
Date | | | Notional
Amount | | | Market
Value | | | Unrealized
Appreciation
(Depreciation) | |
| Contracts to Buy: | | | | | | | | | | | | | | | | | | | | |
| 90-Day Eurodollar | | | 14,173 | | | | 12/19 | | | $ | 3,449,689,039 | | | $ | 3,475,573,925 | | | $ | 25,884,886 | |
See Notes to Financial Statements.
| | |
| | |
| Western Asset Core Plus Bond Fund 2019 Semi-Annual Report | | 85 |
Schedule of investments(unaudited) (cont’d)
June 30, 2019
Western Asset Core Plus Bond Fund
| | | | | | | | | | | | | | | | | | | | |
| | | Number of
Contracts | | | Expiration
Date | | | Notional
Amount | | | Market
Value | | | Unrealized
Appreciation
(Depreciation) | |
| Contracts to Buy-continued | | | | | | | | | | | | | | | | | | | | |
| 90-Day Eurodollar | | | 402 | | | | 3/20 | | | $ | 98,184,199 | | | $ | 98,781,450 | | | $ | 597,251 | |
| 90-Day Eurodollar | | | 8,888 | | | | 6/20 | | | | 2,164,573,811 | | | | 2,186,003,600 | | | | 21,429,789 | |
| 90-Day Eurodollar | | | 3,783 | | | | 3/21 | | | | 922,748,234 | | | | 931,280,025 | | | | 8,531,791 | |
| Australian Dollar | | | 2,734 | | | | 9/19 | | | | 190,690,475 | | | | 192,364,240 | | | | 1,673,765 | |
| British Pound | | | 3,914 | | | | 9/19 | | | | 312,564,572 | | | | 311,872,412 | | | | (692,160) | |
| Canadian Dollar | | | 5,647 | | | | 9/19 | | | | 425,952,523 | | | | 432,306,085 | | | | 6,353,562 | |
| Euro | | | 5,979 | | | | 9/19 | | | | 852,578,835 | | | | 855,482,794 | | | | 2,903,959 | |
| Euro-Bobl | | | 240 | | | | 9/19 | | | | 36,536,715 | | | | 36,689,214 | | | | 152,499 | |
| Euro-BTP | | | 4,245 | | | | 9/19 | | | | 622,704,028 | | | | 648,264,690 | | | | 25,560,662 | |
| Japanese Yen | | | 1,890 | | | | 9/19 | | | | 219,344,771 | | | | 220,444,875 | | | | 1,100,104 | |
| Mexican Peso | | | 10,397 | | | | 9/19 | | | | 264,417,160 | | | | 267,514,810 | | | | 3,097,650 | |
| Russian Ruble | | | 3,999 | | | | 9/19 | | | | 154,495,698 | | | | 156,560,850 | | | | 2,065,152 | |
| Swiss Franc | | | 344 | | | | 9/19 | | | | 43,712,510 | | | | 44,384,600 | | | | 672,090 | |
| U.S. Treasury2-Year Notes | | | 17,871 | | | | 9/19 | | | | 3,823,579,385 | | | | 3,845,476,195 | | | | 21,896,810 | |
| U.S. Treasury5-Year Notes | | | 60,829 | | | | 9/19 | | | | 7,090,700,233 | | | | 7,187,326,531 | | | | 96,626,298 | |
| U.S. Treasury Ultra Long-Term Bonds | | | 17,335 | | | | 9/19 | | | | 2,961,741,521 | | | | 3,078,045,938 | | | | 116,304,417 | |
| | | | | | | | | | | | | | | | | | | | 334,158,525 | |
| Contracts to Sell: | | | | | | | | | | | | | | | | | | | | |
| 30-Day Federal Funds | | | 4,317 | | | | 7/19 | | | | 1,756,341,962 | | | | 1,756,350,060 | | | | (8,098) | |
| 30-Day Federal Funds | | | 1,943 | | | | 8/19 | | | | 792,741,077 | | | | 793,090,796 | | | | (349,719) | |
| 30-Day Federal Funds | | | 5,376 | | | | 1/20 | | | | 2,193,341,781 | | | | 2,203,104,234 | | | | (9,762,453) | |
| 90-Day Eurodollar | | | 967 | | | | 7/19 | | | | 236,181,669 | | | | 236,358,975 | | | | (177,306) | |
| 90-Day Eurodollar | | | 7,388 | | | | 6/21 | | | | 1,810,477,598 | | | | 1,818,186,800 | | | | (7,709,202) | |
| Australian10-Year Bonds | | | 295 | | | | 9/19 | | | | 29,529,413 | | | | 29,750,624 | | | | (221,211) | |
| Euro-Bund | | | 19,385 | | | | 9/19 | | | | 3,767,542,978 | | | | 3,807,653,148 | | | | (40,110,170) | |
| Euro-Buxl | | | 653 | | | | 9/19 | | | | 146,102,040 | | | | 150,658,586 | | | | (4,556,546) | |
| Euro-Oat | | | 122 | | | | 9/19 | | | | 22,524,102 | | | | 22,871,789 | | | | (347,687) | |
| Japanese10-Year Bonds | | | 316 | | | | 9/19 | | | | 449,838,772 | | | | 450,926,123 | | | | (1,087,351) | |
| United Kingdom Long Gilt Bonds | | | 1,452 | | | | 9/19 | | | | 238,176,120 | | | | 240,268,952 | | | | (2,092,832) | |
| U.S. Treasury10-Year Notes | | | 21,272 | | | | 9/19 | | | | 2,682,929,015 | | | | 2,722,151,250 | | | | (39,222,235) | |
See Notes to Financial Statements.
| | |
| | |
| 86 | | Western Asset Core Plus Bond Fund 2019 Semi-Annual Report |
Western Asset Core Plus Bond Fund
| | | | | | | | | | | | | | | | | | | | |
| | | Number of
Contracts | | | Expiration
Date | | | Notional
Amount | | | Market
Value | | | Unrealized
Appreciation
(Depreciation) | |
| Contracts to Sell-continued | | | | | | | | | | | | | | | | | | | | |
| U.S. Treasury Long- Term Bonds | | | 1,526 | | | | 9/19 | | | $ | 234,207,239 | | | $ | 237,436,062 | | | $ | (3,228,823) | |
| U.S. Treasury Ultra10-Year Notes | | | 5,437 | | | | 9/19 | | | | 738,195,094 | | | | 750,985,625 | | | | (12,790,531) | |
| | | | | | | | | | | | | | | | | | | | (121,664,164) | |
| Net unrealized appreciation on open futures contracts | | | $ | 212,494,361 | |
At June 30, 2019, the Fund had the following open forward foreign currency contracts:
| | | | | | | | | | | | | | | | | | | | |
Currency
Purchased | | | Currency
Sold | | | Counterparty | | Settlement
Date | | | Unrealized
Appreciation
(Depreciation) | |
| BRL | | | 274,859,400 | | | USD | | | 71,170,223 | | | Citibank N.A. | | | 7/5/19 | | | $ | 363,038 | |
| USD | | | 69,379,155 | | | BRL | | | 274,859,400 | | | Citibank N.A. | | | 7/5/19 | | | | (2,154,105) | |
| BRL | | | 890,205,000 | | | USD | | | 225,648,272 | | | Barclays Bank PLC | | | 7/17/19 | | | | 5,764,057 | |
| CAD | | | 826,621,234 | | | USD | | | 622,390,135 | | | Barclays Bank PLC | | | 7/17/19 | | | | 9,127,553 | |
| CNH | | | 657,980,221 | | | USD | | | 95,557,492 | | | Barclays Bank PLC | | | 7/17/19 | | | | 208,771 | |
| CNY | | | 1,574,197,056 | | | USD | | | 229,124,089 | | | Barclays Bank PLC | | | 7/17/19 | | | | 82,677 | |
| EUR | | | 22,000,000 | | | USD | | | 24,998,732 | | | Barclays Bank PLC | | | 7/17/19 | | | | 58,115 | |
| INR | | | 17,338,937,000 | | | USD | | | 245,900,513 | | | Barclays Bank PLC | | | 7/17/19 | | | | 4,678,297 | |
| JPY | | | 500,000,000 | | | USD | | | 4,567,113 | | | Barclays Bank PLC | | | 7/17/19 | | | | 77,544 | |
| RUB | | | 4,395,900,000 | | | USD | | | 66,139,067 | | | Barclays Bank PLC | | | 7/17/19 | | | | 3,182,871 | |
| USD | | | 126,377,514 | | | BRL | | | 483,741,529 | | | Barclays Bank PLC | | | 7/17/19 | | | | 626,980 | |
| USD | | | 234,126,605 | | | CNY | | | 1,574,197,056 | | | Barclays Bank PLC | | | 7/17/19 | | | | 4,919,839 | |
| USD | | | 6,757,643 | | | EUR | | | 6,000,000 | | | Barclays Bank PLC | | | 7/17/19 | | | | (76,043) | |
| USD | | | 7,833,049 | | | EUR | | | 7,000,000 | | | Barclays Bank PLC | | | 7/17/19 | | | | (139,584) | |
| USD | | | 933,683,061 | | | EUR | | | 823,021,630 | | | Barclays Bank PLC | | | 7/17/19 | | | | (3,695,446) | |
| USD | | | 76,515,410 | | | GBP | | | 58,203,000 | | | Barclays Bank PLC | | | 7/17/19 | | | | 2,527,606 | |
| USD | | | 396,408,801 | | | IDR | | | 5,623,851,660,000 | | | Barclays Bank PLC | | | 7/17/19 | | | | (816,848) | |
| USD | | | 249,711,058 | | | INR | | | 17,338,937,000 | | | Barclays Bank PLC | | | 7/17/19 | | | | (867,753) | |
| USD | | | 1,382,656 | | | JPY | | | 150,000,000 | | | Barclays Bank PLC | | | 7/17/19 | | | | (10,741) | |
| USD | | | 64,455,688 | | | PHP | | | 3,362,459,850 | | | Barclays Bank PLC | | | 7/17/19 | | | | (1,124,021) | |
| USD | | | 14,652,586 | | | EUR | | | 13,000,000 | | | BNP Paribas SA | | | 7/17/19 | | | | (153,733) | |
| USD | | | 1,855,942 | | | JPY | | | 200,000,000 | | | BNP Paribas SA | | | 7/17/19 | | | | (1,921) | �� |
| BRL | | | 7,120,000 | | | USD | | | 1,824,518 | | | Citibank N.A. | | | 7/17/19 | | | | 26,354 | |
| BRL | | | 552,892,950 | | | USD | | | 141,680,235 | | | Citibank N.A. | | | 7/17/19 | | | | 2,046,486 | |
| BRL | | | 1,438,233,750 | | | USD | | | 368,664,449 | | | Citibank N.A. | | | 7/17/19 | | | | 5,210,134 | |
| EUR | | | 8,000,000 | | | USD | | | 9,042,696 | | | Citibank N.A. | | | 7/17/19 | | | | 68,885 | |
| EUR | | | 8,000,000 | | | USD | | | 8,993,320 | | | Citibank N.A. | | | 7/17/19 | | | | 118,261 | |
See Notes to Financial Statements.
| | |
| | |
| Western Asset Core Plus Bond Fund 2019 Semi-Annual Report | | 87 |
Schedule of investments(unaudited) (cont’d)
June 30, 2019
Western Asset Core Plus Bond Fund
| | | | | | | | | | | | | | | | | | | | |
Currency
Purchased | | | Currency
Sold | | | Counterparty | | Settlement
Date | | | Unrealized
Appreciation
(Depreciation) | |
| EUR | | | 23,000,000 | | | USD | | | 26,059,046 | | | Citibank N.A. | | | 7/17/19 | | | $ | 136,749 | |
| IDR | | | 5,623,851,660,000 | | | USD | | | 389,140,026 | | | Citibank N.A. | | | 7/17/19 | | | | 8,085,623 | |
| MXN | | | 1,756,911,856 | | | USD | | | 91,850,264 | | | Citibank N.A. | | | 7/17/19 | | | | (605,167) | |
| MXN | | | 1,960,182,392 | | | USD | | | 100,524,752 | | | Citibank N.A. | | | 7/17/19 | | | | 1,277,187 | |
| RUB | | | 3,606,474,774 | | | USD | | | 54,639,335 | | | Citibank N.A. | | | 7/17/19 | | | | 2,233,619 | |
| USD | | | 85,438 | | | AUD | | | 122,750 | | | Citibank N.A. | | | 7/17/19 | | | | (797) | |
| USD | | | 113,666,073 | | | AUD | | | 159,496,521 | | | Citibank N.A. | | | 7/17/19 | | | | 1,614,517 | |
| USD | | | 71,105,782 | | | BRL | | | 274,859,400 | | | Citibank N.A. | | | 7/17/19 | | | | (345,012) | |
| USD | | | 3,152,758 | | | COP | | | 9,970,598,300 | | | Citibank N.A. | | | 7/17/19 | | | | 54,363 | |
| USD | | | 11,180,650 | | | EUR | | | 10,000,000 | | | Citibank N.A. | | | 7/17/19 | | | | (208,826) | |
| USD | | | 11,222,548 | | | EUR | | | 10,000,000 | | | Citibank N.A. | | | 7/17/19 | | | | (166,928) | |
| USD | | | 13,531,124 | | | EUR | | | 12,000,000 | | | Citibank N.A. | | | 7/17/19 | | | | (136,247) | |
| USD | | | 14,602,978 | | | EUR | | | 13,000,000 | | | Citibank N.A. | | | 7/17/19 | | | | (203,341) | |
| USD | | | 19,177,714 | | | EUR | | | 17,000,000 | | | Citibank N.A. | | | 7/17/19 | | | | (184,396) | |
| USD | | | 20,379,863 | | | EUR | | | 18,000,000 | | | Citibank N.A. | | | 7/17/19 | | | | (121,194) | |
| USD | | | 2,798,476 | | | JPY | | | 300,000,000 | | | Citibank N.A. | | | 7/17/19 | | | | 11,682 | |
| USD | | | 4,131,701 | | | JPY | | | 450,000,000 | | | Citibank N.A. | | | 7/17/19 | | | | (48,489) | |
| USD | | | 302,519,043 | | | JPY | | | 33,482,807,688 | | | Citibank N.A. | | | 7/17/19 | | | | (8,513,239) | |
| USD | | | 18,452,965 | | | MXN | | | 351,047,362 | | | Citibank N.A. | | | 7/17/19 | | | | 221,344 | |
| USD | | | 115,073,425 | | | MXN | | | 2,189,410,000 | | | Citibank N.A. | | | 7/17/19 | | | | 1,366,566 | |
| USD | | | 137,061,026 | | | MXN | | | 2,660,998,700 | | | Citibank N.A. | | | 7/17/19 | | | | (1,137,760) | |
| USD | | | 78,589,355 | | | PHP | | | 4,109,673,150 | | | Deutsche Bank AG | | | 7/17/19 | | | | (1,563,622) | |
| BRL | | | 459,000,000 | | | USD | | | 114,463,840 | | | Goldman Sachs Group Inc. | | | 7/17/19 | | | | 4,855,035 | |
| EUR | | | 32,077,000 | | | USD | | | 36,072,832 | | | Goldman Sachs Group Inc. | | | 7/17/19 | | | | 461,190 | |
| USD | | | 42,397,113 | | | CHF | | | 43,000,000 | | | Goldman Sachs Group Inc. | | | 7/17/19 | | | | (1,732,056) | |
| USD | | | 7,940,940 | | | EUR | | | 7,000,000 | | | Goldman Sachs Group Inc. | | | 7/17/19 | | | | (31,693) | |
| USD | | | 12,304,220 | | | RUB | | | 777,817,404 | | | Goldman Sachs Group Inc. | | | 7/17/19 | | | | 38,288 | |
| USD | | | 16,313,349 | | | RUB | | | 1,029,951,440 | | | Goldman Sachs Group Inc. | | | 7/17/19 | | | | 71,344 | |
| USD | | | 26,160,438 | | | RUB | | | 1,655,340,967 | | | Goldman Sachs Group Inc. | | | 7/17/19 | | | | 56,240 | |
| USD | | | 55,769,132 | | | RUB | | | 3,601,905,150 | | | Goldman Sachs Group Inc. | | | 7/17/19 | | | | (1,031,761) | |
| ZAR | | | 728,620,000 | | | USD | | | 50,864,235 | | | Goldman Sachs Group Inc. | | | 7/17/19 | | | | 741,059 | |
See Notes to Financial Statements.
| | |
| | |
| 88 | | Western Asset Core Plus Bond Fund 2019 Semi-Annual Report |
Western Asset Core Plus Bond Fund
| | | | | | | | | | | | | | | | | | | | |
Currency
Purchased | | | Currency
Sold | | | Counterparty | | Settlement
Date | | | Unrealized
Appreciation
(Depreciation) | |
| BRL | | | 283,500,000 | | | USD | | | 72,652,256 | | | JPMorgan Chase & Co. | | | 7/17/19 | | | $ | 1,044,697 | |
| PHP | | | 7,476,042,000 | | | USD | | | 145,845,533 | | | JPMorgan Chase & Co. | | | 7/17/19 | | | | (36,607) | |
| TWD | | | 52,474,000 | | | USD | | | 1,706,361 | | | JPMorgan Chase & Co. | | | 7/17/19 | | | | (14,928) | |
| USD | | | 208,591 | | | AUD | | | 300,000 | | | JPMorgan Chase & Co. | | | 7/17/19 | | | | (2,169) | |
| USD | | | 97,640,562 | | | CNH | | | 657,980,221 | | | JPMorgan Chase & Co. | | | 7/17/19 | | | | 1,874,299 | |
| USD | | | 1,390,658 | | | JPY | | | 150,000,000 | | | JPMorgan Chase & Co. | | | 7/17/19 | | | | (2,739) | |
| USD | | | 1,849,041 | | | JPY | | | 200,000,000 | | | JPMorgan Chase & Co. | | | 7/17/19 | | | | (8,822) | |
| USD | | | 73,326 | | | PHP | | | 3,909,000 | | | JPMorgan Chase & Co. | | | 7/17/19 | | | | (2,913) | |
| USD | | | 73,365,366 | | | RUB | | | 4,632,215,826 | | | JPMorgan Chase & Co. | | | 7/17/19 | | | | 316,803 | |
| USD | | | 1,695,444 | | | TWD | | | 52,474,000 | | | JPMorgan Chase & Co. | | | 7/17/19 | | | | 4,011 | |
| USD | | | 84,789,562 | | | EUR | | | 75,400,000 | | | Barclays Bank PLC | | | 7/26/19 | | | | (1,153,233) | |
| USD | | | 169,548,942 | | | EUR | | | 150,340,000 | | | BNP Paribas SA | | | 7/26/19 | | | | (1,812,329) | |
| USD | | | 57,246,505 | | | PHP | | | 2,988,840,000 | | | Barclays Bank PLC | | | 8/15/19 | | | | (970,548) | |
| USD | | | 8,428,000 | | | BRL | | | 34,091,260 | | | Goldman Sachs Group Inc. | | | 8/26/19 | | | | (400,675) | |
| BRL | | | 562,000,700 | | | USD | | | 138,680,000 | | | Citibank N.A. | | | 8/30/19 | | | | 6,805,822 | |
| CNH | | | 134,164,509 | | | USD | | | 19,346,000 | | | BNP Paribas SA | | | 9/3/19 | | | | 174,448 | |
| USD | | | 19,349,348 | | | CNH | | | 134,164,509 | | | Citibank N.A. | | | 9/3/19 | | | | (171,100) | |
| ARS | | | 1,109,880,000 | | | USD | | | 22,574,596 | | | JPMorgan Chase & Co. | | | 9/23/19 | | | | 385,604 | |
| IDR | | | 5,623,851,660,000 | | | USD | | | 391,605,853 | | | Barclays Bank PLC | | | 10/17/19 | | | | 1,565,494 | |
| INR | | | 17,338,937,000 | | | USD | | | 246,694,700 | | | Barclays Bank PLC | | | 10/17/19 | | | | 1,008,969 | |
| USD | | | 95,490,925 | | | CNH | | | 657,980,221 | | | Barclays Bank PLC | | | 10/17/19 | | | | (190,008) | |
| USD | | | 228,485,573 | | | CNY | | | 1,574,197,056 | | | Barclays Bank PLC | | | 10/17/19 | | | | (705,472) | |
| TWD | | | 52,474,000 | | | USD | | | 1,702,099 | | | JPMorgan Chase & Co. | | | 10/17/19 | | | | (2,410) | |
| USD | | | 145,165,864 | | | PHP | | | 7,476,042,000 | | | JPMorgan Chase & Co. | | | 10/17/19 | | | | 3,872 | |
| Total | | | | | | | | | | | | | | | | | | $ | 42,951,617 | |
See Notes to Financial Statements.
| | |
| | |
| Western Asset Core Plus Bond Fund 2019 Semi-Annual Report | | 89 |
Schedule of investments(unaudited) (cont’d)
June 30, 2019
Western Asset Core Plus Bond Fund
| | |
Abbreviations used in this table: |
| |
| ARS | | — Argentine Peso |
| |
| AUD | | — Australian Dollar |
| |
| BRL | | — Brazilian Real |
| |
| CAD | | — Canadian Dollar |
| |
| CHF | | — Swiss Franc |
| |
| CNH | | — Chinese Offshore Yuan |
| |
| CNY | | — Chinese Yuan Renminbi |
| |
| COP | | — Colombian Peso |
| |
| EUR | | — Euro |
| |
| GBP | | — British Pound |
| |
| IDR | | — Indonesian Rupiah |
| |
| INR | | — Indian Rupee |
| |
| JPY | | — Japanese Yen |
| |
| MXN | | — Mexican Peso |
| |
| PHP | | — Philippine Peso |
| |
| RUB | | — Russian Ruble |
| |
| TWD | | — Taiwan Dollar |
| |
| USD | | — United States Dollar |
| |
| ZAR | | — South African Rand |
At June 30, 2019, the Fund had the following open swap contracts:
| | | | | | | | | | | | | | | | | | | | | | | | |
| OTC CREDIT DEFAULT SWAPS ON CORPORATE ISSUES — SELL PROTECTION1 | |
Swap
Counterparty
(Reference Entity) | | Notional
Amount2 | | | Termination
Date | | | Implied
Credit
Spread at
June 30,
20193 | | Periodic
Payments
Received by
the Fund† | | Market
Value | | | Upfront
Premiums
Paid
(Received) | | | Unrealized
Appreciation | |
| JPMorgan Chase & Co. (Berkshire Hathaway Inc., 2.750%, due 3/15/ 23) | | $ | 21,430,000 | | | | 3/20/24 | | | 0.405% | | 1.000% quarterly | | $ | 579,173 | | | $ | (216,398) | | | $ | 795,571 | |
| | | | | | | | | | | | | | | | | | |
| CENTRALLY CLEARED INTEREST RATE SWAPS | | | | |
| | | Notional
Amount* | | Termination
Date | | | Payments
Made by
the Fund† | | Payments
Received by
the Fund† | | Upfront
Premiums
Paid
(Received) | | | Unrealized
Appreciation
(Depreciation) | |
| | | 195,170,000 | | | 9/28/19 | | | 3-Month LIBOR quarterly | | 1.705% semi-annually | | | — | | | $ | (336,399) | |
| | | 404,740,000 | | | 10/17/19 | | | 3-Month LIBOR quarterly | | 1.138% semi-annually | | | — | | | | (1,479,427) | |
| | | 483,220,000 | | | 6/14/20 | | | 3-Month LIBOR quarterly | | 1.671% semi-annually | | $ | (44,346) | | | | (1,652,722) | |
See Notes to Financial Statements.
| | |
| | |
| 90 | | Western Asset Core Plus Bond Fund 2019 Semi-Annual Report |
Western Asset Core Plus Bond Fund
| | | | | | | | | | | | | | | | | | | | |
| CENTRALLY CLEARED INTEREST RATE SWAPS (cont’d) | |
| | | Notional
Amount* | | | Termination
Date | | | Payments
Made by
the Fund† | | Payments
Received by
the Fund† | | Upfront
Premiums
Paid
(Received) | | | Unrealized
Appreciation
(Depreciation) | |
| | | | 17,816,530,000 | MXN | | | 4/5/21 | | | 28-Day MXN TIIE - Banxico every 28 days | | 7.351% every 28 days | | $ | (94,816) | | | $ | (3,784,182) | |
| | | | 839,220,000 | | | | 6/15/21 | | | Daily U.S. Federal Funds Intraday Effective Rate annually | | 1.800% annually | | | 86,716 | | | | 4,568,469 | |
| | | | 248,962,000 | GBP | | | 10/26/21 | | | 1.271% semi-annually | | 6-Month GBP LIBOR
semi-annually | | | 120,857 | | | | (2,875,145) | |
| | | | 1,218,648,000 | GBP | | | 10/30/21 | | | 1.385% annually | | 3-Month GBP LIBOR
annually | | | (437,018) | | | | (9,020,595) | |
| | | | 11,722,600,000 | MXN | | | 4/6/22 | | | 28-Day MXNTIIE - Banxico every 28 days | | 7.330% every 28 days | | | (193,354) | | | | (175,348) | |
| | | | 1,440,395,000 | | | | 4/26/22 | | | 3-Month LIBOR quarterly | | 2.250% semi-annually | | | 312,748 | | | | 8,662,812 | |
| | | | 914,310,000 | | | | 6/15/22 | | | 3-Month LIBOR quarterly | | 1.850% semi-annually | | | (294,009) | | | | 3,062,387 | |
| | | | 1,467,402,000 | | | | 4/26/23 | | | 2.300% semi-annually | | 3-Month LIBOR quarterly | | | 99,020 | | | | (8,426,225) | |
| | | | 297,600,000 | | | | 12/31/25 | | | 2.250% semi-annually | | 3-Month LIBOR quarterly | | | 2,790,083 | | | | (10,731,902) | |
| | | | 1,737,224,000 | | | | 1/31/26 | | | 2.500% semi-annually | | 3-Month LIBOR quarterly | | | (27,769,833) | | | | (45,946,115) | |
| | | | 267,999,000 | | | | 4/30/26 | | | 1.850% semi-annually | | 3-Month LIBOR quarterly | | | 429,894 | | | | (1,126,073) | |
| | | | 894,704,000 | | | | 4/30/26 | | | 1.550% annually | | Daily U.S. Federal Funds
Intraday Effective
Rate annually | | | 1,099,165 | | | | (112,836) | |
| | | | 434,265,000 | | | | 2/15/36 | | | 3-Month LIBOR quarterly | | 3.000% semi-annually | | | 243,323 | | | | 52,603,226 | |
| | | | 335,439,000 | | | | 2/15/44 | | | 3.330% semi-annually | | 3-Month LIBOR quarterly | | | (14,508) | | | | (73,096,667) | |
| | | | 266,992,000 | | | | 5/15/44 | | | 2.875% semi-annually | | 3-Month LIBOR quarterly | | | 1,140,355 | | | | (35,713,805) | |
| | | | 322,196,000 | | | | 5/15/44 | | | 3.000% semi-annually | | 3-Month LIBOR quarterly | | | 251,183 | | | | (49,940,769) | |
| | | | 338,283,000 | | | | 8/15/44 | | | 2.750% semi-annually | | 3-Month LIBOR quarterly | | | (1,462,688) | | | | (34,231,245) | |
See Notes to Financial Statements.
| | |
| | |
| Western Asset Core Plus Bond Fund 2019 Semi-Annual Report | | 91 |
Schedule of investments(unaudited) (cont’d)
June 30, 2019
Western Asset Core Plus Bond Fund
| | | | | | | | | | | | | | | | | | | | |
| CENTRALLY CLEARED INTEREST RATE SWAPS (cont’d) | |
| | | Notional
Amount* | | | Termination
Date | | | Payments
Made by
the Fund† | | Payments
Received by
the Fund† | | Upfront
Premiums
Paid
(Received) | | | Unrealized
Appreciation
(Depreciation) | |
| | | | 12,221,800,000 | JPY | | | 5/9/46 | | | 0.641% semi-annually | | 6-Month JPY LIBOR
semi-annually | | $ | 1 | | | $ | (8,053,837) | |
| | | | 25,980,000 | EUR | | | 8/23/47 | | | 1.498% annually | | 6-Month EURIBOR
semi-annually | | | (28,595) | | | | (6,135,822) | |
| Total | | $ | (23,765,822) | | | $ | (223,942,220) | |
| | | | | | | | | | | | | | | | | | | | | | |
| OTC INTEREST RATE SWAPS | |
| Swap Counterparty | | Notional
Amount* | | | Termination
Date | | | Payments
Made by
the Fund† | | Payments
Received by
the Fund† | | | Upfront
Premiums
Paid
(Received) | | | Unrealized
Appreciation | |
| Citibank N.A. | | | 1,838,341,000 | BRL | | | 1/2/20 | | | BRL-CDI ** | | | 8.410 | % ** | | | — | | | $ | 13,748,135 | |
| Citibank N.A. | | | 374,400,000 | BRL | | | 1/2/20 | | | BRL-CDI ** | | | 8.410 | % ** | | $ | 30,628 | | | | 2,772,286 | |
| Citibank N.A. | | | 637,200,000 | BRL | | | 1/2/20 | | | BRL-CDI ** | | | 8.410 | % ** | | | 195,758 | | | | 4,787,986 | |
| Citibank N.A. | | | 359,599,996 | BRL | | | 1/2/20 | | | BRL-CDI ** | | | 8.410 | % ** | | | 68,722 | | | | 2,732,739 | |
| Citibank N.A. | | | 241,219,004 | BRL | | | 1/2/20 | | | BRL-CDI ** | | | 8.410 | % ** | | | 88,295 | | | | 1,790,920 | |
| Total | | | | | | | | | | | | | | | | $ | 383,403 | | | $ | 25,832,066 | |
| | | | | | | | | | | | | | | | | | | | | | |
| CENTRALLY CLEARED CREDIT DEFAULT SWAPS ON CREDIT INDICES — SELL PROTECTION1 | |
| Reference Entity | | Notional
Amount2 | | | Termination
Date | | | Periodic
Payments
Received by
the Fund† | | Market
Value4 | | | Upfront
Premiums
Paid
(Received) | | | Unrealized
Appreciation
(Depreciation) | |
| Markit CDX.NA.HY.32 Index | | $ | 149,915,000 | | | | 6/20/24 | | | 5.000% quarterly | | $ | 11,383,046 | | | $ | 7,327,790 | | | $ | 4,055,256 | |
| Markit CDX.NA.IG.23 Index | | | 193,240,000 | | | | 12/20/19 | | | 1.000% quarterly | | | 94,687 | | | | 658,007 | | | | (563,320) | |
| Markit CDX.NA.IG.25 Index | | | 138,520,000 | | | | 12/20/20 | | | 1.000% quarterly | | | 1,159,551 | | | | 1,331,548 | | | | (171,997) | |
| Markit CDX.NA.IG.32 Index | | | 2,931,479,876 | | | | 6/20/24 | | | 1.000% quarterly | | | 63,311,171 | | | | 44,540,903 | | | | 18,770,268 | |
| Markit CDX.NA.IG.32 Index | | | 106,010,000 | | | | 6/20/29 | | | 1.000% quarterly | | | (215,518) | | | | (1,170,121) | | | | 954,603 | |
| Total | | $ | 3,519,164,876 | | | | | | | | | $ | 75,732,937 | | | $ | 52,688,127 | | | $ | 23,044,810 | |
See Notes to Financial Statements.
| | |
| | |
| 92 | | Western Asset Core Plus Bond Fund 2019 Semi-Annual Report |
Western Asset Core Plus Bond Fund
| 1 | If the Fund is a seller of protection and a credit event occurs, as defined under the terms of that particular swap agreement, the Fund will either (i) pay to the buyer of protection an amount equal to the notional amount of the swap and take delivery of the referenced obligation or underlying securities comprising the referenced index or (ii) pay a net settlement amount in the form of cash or securities equal to the notional amount of the swap less the recovery value of the referenced obligation or underlying securities comprising the referenced index. |
| 2 | The maximum potential amount the Fund could be required to pay as a seller of credit protection or receive as a buyer of credit protection if a credit event occurs as defined under the terms of that particular swap agreement. |
| 3 | Implied credit spreads, utilized in determining the market value of credit default swap agreements on corporate or sovereign issues as of period end, serve as an indicator of the current status of the payment/performance risk and represent the likelihood or risk of default for the credit derivative. The implied credit spread of a particular referenced entity reflects the cost of buying/selling protection and may include upfront payments required to be made to enter into the agreement. Wider credit spreads represent a deterioration of the referenced entity’s credit soundness and a greater likelihood or risk of default or other credit event occurring as defined under the terms of the agreement. A credit spread identified as “Defaulted” indicates a credit event has occurred for the referenced entity or obligation. |
| 4 | The quoted market prices and resulting values for credit default swap agreements on asset-backed securities and credit indices serve as an indicator of the current status of the payment/performance risk and represent the likelihood of an expected loss (or profit) for the credit derivative had the notional amount of the swap agreement been closed/sold as of the period end. Decreasing market values (sell protection) or increasing market values (buy protection) when compared to the notional amount of the swap, represent a deterioration of the referenced entity’s credit soundness and a greater likelihood or risk of default or other credit event occurring as defined under the terms of the agreement. |
| † | Percentage shown is an annual percentage rate. |
| * | Notional amount denominated in U.S. dollars, unless otherwise noted. |
| ** | One time payment made at termination date. |
| | |
Abbreviations used in this table: |
| |
| BRL | | — Brazilian Real |
| |
| BRL-CDI | | — Brazil Cetip InterBank Deposit Rate |
| |
| EUR | | — Euro |
| |
| EURIBOR | | — Euro Interbank Offered Rate |
| |
| GBP | | — British Pound |
| |
| JPY | | — Japanese Yen |
| |
| LIBOR | | — London Interbank Offered Rate |
| |
| MXN | | — Mexican Peso |
| |
| TIIE | | — Equilibrium Interbanking Interest Rate (Tasa de Intere’s Interbancaria de Equilibrio) |
See Notes to Financial Statements.
| | |
| | |
| Western Asset Core Plus Bond Fund 2019 Semi-Annual Report | | 93 |
Statement of assets and liabilities(unaudited)
June 30, 2019
| | | | |
| |
| Assets: | | | | |
Investments in unaffiliated securities, at value (Cost — $26,905,167,308) | | $ | 27,693,938,029 | |
Investments in affiliated securities, at value (Cost — $847,657,870) | | | 847,657,870 | |
Cash | | | 27,143,079 | |
Foreign currency, at value (Cost — $192,769,139) | | | 192,740,240 | |
Deposits with brokers for centrally cleared swap contracts | | | 285,961,728 | |
Interest receivable | | | 185,482,806 | |
Deposits with brokers for open futures contracts and exchange-traded options | | | 121,135,065 | |
Receivable for securities sold | | | 112,415,730 | |
Foreign currency collateral for open futures contracts and exchange traded options, at value (Cost — $96,195,365) | | | 97,666,370 | |
Unrealized appreciation on forward foreign currency contracts | | | 73,496,293 | |
Receivable for Fund shares sold | | | 58,145,389 | |
OTC swaps, at value (premiums paid — $167,005) | | | 26,794,642 | |
Principal paydown receivable | | | 9,500,097 | |
Deposits with brokers for OTC derivatives | | | 1,490,000 | |
Receivable for open OTC swap contracts | | | 6,548 | |
Prepaid expenses | | | 316,103 | |
Total Assets | | | 29,733,889,989 | |
| |
| Liabilities: | | | | |
Payable for securities purchased | | | 2,182,400,453 | |
Payable to broker — variation margin on centrally cleared swap contracts | | | 141,214,219 | |
Written options, at value (premiums received — $44,227,321) | | | 59,499,059 | |
Payable for Fund shares repurchased | | | 34,679,046 | |
Unrealized depreciation on forward foreign currency contracts | | | 30,544,676 | |
Distributions payable | | | 10,917,333 | |
Investment management fee payable | | | 7,894,541 | |
Payable to broker — variation margin on open futures contracts | | | 3,652,172 | |
Service and/or distribution fees payable | | | 602,007 | |
Directors’ fees payable | | | 130,726 | |
Accrued expenses | | | 3,866,459 | |
Total Liabilities | | | 2,475,400,691 | |
| Total Net Assets | | $ | 27,258,489,298 | |
| |
| Net Assets: | | | | |
Par value (Note 7) | | $ | 2,289,506 | |
Paid-in capital in excess of par value | | | 26,758,853,364 | |
Total distributable earnings (loss) | | | 497,346,428 | |
| Total Net Assets | | $ | 27,258,489,298 | |
See Notes to Financial Statements.
| | |
| | |
| 94 | | Western Asset Core Plus Bond Fund 2019 Semi-Annual Report |
| | | | |
| |
| Net Assets: | | | | |
Class A | | | $1,170,977,178 | |
Class C | | | $215,730,843 | |
Class C1 | | | $7,298,980 | |
Class FI | | | $381,956,696 | |
Class R | | | $268,685,329 | |
Class I | | | $17,686,830,481 | |
Class IS | | | $7,527,009,791 | |
| |
| Shares Outstanding: | | | | |
Class A | | | 98,439,186 | |
Class C | | | 18,110,302 | |
Class C1 | | | 613,379 | |
Class FI | | | 32,080,635 | |
Class R | | | 22,600,387 | |
Class I | | | 1,485,357,357 | |
Class IS | | | 632,304,452 | |
| |
| Net Asset Value: | | | | |
Class A (and redemption price) | | | $11.90 | |
Class C* | | | $11.91 | |
Class C1* | | | $11.90 | |
Class FI (and redemption price) | | | $11.91 | |
Class R (and redemption price) | | | $11.89 | |
Class I (and redemption price) | | | $11.91 | |
Class IS (and redemption price) | | | $11.90 | |
| Maximum Public Offering Price Per Share: | | | | |
Class A (based on maximum initial sales charge of 4.25%) | | | $12.43 | |
| * | Redemption price per share is NAV of Class C and Class C1 shares reduced by a 1.00% CDSC if shares are redeemed within one year from purchase payment (Note 2). |
See Notes to Financial Statements.
| | |
| | |
| Western Asset Core Plus Bond Fund 2019 Semi-Annual Report | | 95 |
Statement of operations(unaudited)
For the Six Months Ended June 30, 2019
| | | | |
| |
| Investment Income: | | | | |
Dividends | | $ | 13,761,288 | |
Interest from unaffiliated investments | | | 485,130,264 | |
Interest from affiliated investments | | | 10,759,326 | |
Total Investment Income | | | 509,650,878 | |
| |
| Expenses: | | | | |
Investment management fee (Note 2) | | | 49,846,108 | |
Transfer agent fees (Note 5) | | | 9,720,008 | |
Service and/or distribution fees (Notes 2 and 5) | | | 3,488,537 | |
Directors’ fees | | | 389,707 | |
Legal fees | | | 385,103 | |
Registration fees | | | 324,962 | |
Fund accounting fees | | | 208,341 | |
Insurance | | | 126,348 | |
Commitment fees (Note 9) | | | 83,843 | |
Shareholder reports | | | 81,218 | |
Interest expense | | | 79,787 | |
Custody fees | | | 78,205 | |
Audit and tax fees | | | 45,077 | |
Miscellaneous expenses | | | 145,902 | |
Total Expenses | | | 65,003,146 | |
Less: Fee waivers and/or expense reimbursements (Notes 2 and 5) | | | (5,481,764) | |
Net Expenses | | | 59,521,382 | |
| Net Investment Income | | | 450,129,496 | |
| |
Realized and Unrealized Gain (Loss) on Investments, Futures Contracts,
Written Options, Swap Contracts, Forward Foreign Currency Contracts and Foreign
Currency Transactions (Notes 1, 3 and 4): | | | | |
Net Realized Gain (Loss) From: | | | | |
Investment transactions in unaffiliated securities | | | (10,769,477) | |
Futures contracts | | | (35,119,051) | |
Written options | | | 71,134,342 | |
Swap contracts | | | 43,543,060 | |
Forward foreign currency contracts | | | 29,959,384 | |
Foreign currency transactions | | | 4,774,672 | |
Net Realized Gain | | | 103,522,930 | |
Change in Net Unrealized Appreciation (Depreciation) From: | | | | |
Investments in unaffiliated securities | | | 1,350,890,645 | |
Futures contracts | | | 126,510,496 | |
Written options | | | (4,105,973) | |
Swap contracts | | | (103,597,202) | |
See Notes to Financial Statements.
| | |
| | |
| 96 | | Western Asset Core Plus Bond Fund 2019 Semi-Annual Report |
| | | | |
Forward foreign currency contracts | | | 71,451,408 | |
Foreign currencies | | | (1,100,899) | |
Change in Net Unrealized Appreciation (Depreciation) | | | 1,440,048,475 | |
| Net Gain on Investments, Futures Contracts, Written Options, Swap Contracts, Forward Foreign Currency Contracts and Foreign Currency Transactions | | | 1,543,571,405 | |
| Increase in Net Assets From Operations | | $ | 1,993,700,901 | |
See Notes to Financial Statements.
| | |
| | |
| Western Asset Core Plus Bond Fund 2019 Semi-Annual Report | | 97 |
Statements of changes in net assets
| | | | | | | | |
For the Six Months Ended June 30, 2019 (unaudited)
and the Year Ended December 31, 2018 | | 2019 | | | 2018 | |
| | |
| Operations: | | | | | | | | |
Net investment income | | $ | 450,129,496 | | | $ | 818,661,501 | |
Net realized gain (loss) | | | 103,522,930 | | | | (303,534,347) | |
Change in net unrealized appreciation (depreciation) | | | 1,440,048,475 | | | | (862,659,326) | |
Increase (Decrease) in Net Assets From Operations | | | 1,993,700,901 | | | | (347,532,172) | |
| | |
| Distributions to Shareholders From (Notes 1 and 6): | | | | | | | | |
Total distributable earnings | | | (458,719,683) | | | | (923,585,439) | |
Decrease in Net Assets From Distributions to Shareholders | | | (458,719,683) | | | | (923,585,439) | |
| | |
| Fund Share Transactions (Note 7): | | | | | | | | |
Net proceeds from sale of shares | | | 4,758,013,021 | | | | 9,782,620,710 | |
Reinvestment of distributions | | | 395,788,459 | | | | 799,750,505 | |
Cost of shares repurchased | | | (2,966,445,858) | | | | (7,870,220,490) | |
Increase in Net Assets From Fund Share Transactions | | | 2,187,355,622 | | | | 2,712,150,725 | |
Increase in Net Assets | | | 3,722,336,840 | | | | 1,441,033,114 | |
| | |
| Net Assets: | | | | | | | | |
Beginning of period | | | 23,536,152,458 | | | | 22,095,119,344 | |
End of period | | $ | 27,258,489,298 | | | $ | 23,536,152,458 | |
See Notes to Financial Statements.
| | |
| | |
| 98 | | Western Asset Core Plus Bond Fund 2019 Semi-Annual Report |
Financial highlights
| | | | | | | | | | | | | | | | | | | | | | | | |
For a share of each class of capital stock outstanding throughout each year ended December 31,
unless otherwise noted: | |
| Class A Shares1 | | 20192 | | | 2018 | | | 2017 | | | 2016 | | | 2015 | | | 2014 | |
| | | | | | |
| Net asset value, beginning of period | | | $11.19 | | | | $11.83 | | | | $11.42 | | | | $11.42 | | | | $11.63 | | | | $11.19 | |
| | | | | | |
| Income (loss) from operations: | | | | | | | | | | | | | | | | | | | | | | | | |
Net investment income | | | 0.19 | | | | 0.36 | | | | 0.31 | | | | 0.33 | | | | 0.30 | | | | 0.35 | |
Net realized and unrealized gain (loss) | | | 0.71 | | | | (0.60) | | | | 0.44 | | | | 0.18 | | | | (0.20) | | | | 0.46 | |
Total income (loss) from operations | | | 0.90 | | | | (0.24) | | | | 0.75 | | | | 0.51 | | | | 0.10 | | | | 0.81 | |
| | | | | | |
| Less distributions from: | | | | | | | | | | | | | | | | | | | | | | | | |
Net investment income | | | (0.19) | | | | (0.35) | | | | (0.32) | | | | (0.40) | | | | (0.31) | | | | (0.37) | |
Net realized gains | | | — | | | | (0.05) | | | | (0.02) | | | | (0.11) | | | | — | | | | — | |
Total distributions | | | (0.19) | | | | (0.40) | | | | (0.34) | | | | (0.51) | | | | (0.31) | | | | (0.37) | |
| | | | | | |
| Net asset value, end of period | | | $11.90 | | | | $11.19 | | | | $11.83 | | | | $11.42 | | | | $11.42 | | | | $11.63 | |
Total return3 | | | 8.03 | % | | | (1.86) | % | | | 6.57 | % | | | 4.42 | % | | | 0.76 | % | | | 7.36 | % |
| | | | | | |
| Net assets, end of period (millions) | | | $1,171 | | | | $1,032 | | | | $992 | | | | $825 | | | | $492 | | | | $277 | |
| | | | | | |
| Ratios to average net assets: | | | | | | | | | | | | | | | | | | | | | | | | |
Gross expenses | | | 0.83 | %4 | | | 0.84 | % | | | 0.85 | %5 | | | 0.82 | % | | | 0.89 | % | | | 0.78 | % |
Net expenses6 | | | 0.82 | 4,7 | | | 0.82 | 7 | | | 0.82 | 5,7 | | | 0.81 | 7 | | | 0.89 | | | | 0.78 | |
Net investment income | | | 3.29 | 4 | | | 3.16 | | | | 2.66 | | | | 2.85 | | | | 2.58 | | | | 2.99 | |
| | | | | | |
| Portfolio turnover rate8 | | | 89 | % | | | 105 | % | | | 94 | % | | | 97 | % | | | 93 | % | | | 78 | % |
| 1 | Per share amounts have been calculated using the average shares method. |
| 2 | For the six months ended June 30, 2019 (unaudited). |
| 3 | Performance figures, exclusive of sales charges, may reflect compensating balance arrangements, fee waivers and/or expense reimbursements. In the absence of compensating balance arrangements, fee waivers and/or expense reimbursements, the total return would have been lower. Past performance is no guarantee of future results. Total returns for periods of less than one year are not annualized. |
| 5 | Reflects recapture of expenses waived/reimbursed from prior fiscal years. |
| 6 | As a result of an expense limitation arrangement, the ratio of total annual fund operating expenses, other than interest, brokerage commissions, taxes, extraordinary expenses, deferred organizational expenses and acquired fund fees and expenses, to average net assets of Class A shares did not exceed 0.82%. This expense limitation arrangement cannot be terminated prior to December 31, 2020 without the Board of Directors’ consent. Prior to May 1, 2016, the expense limitation was 0.90%. |
| 7 | Reflects fee waivers and/or expense reimbursements. |
| 8 | Excluding mortgage dollar roll transactions. If mortgage dollar roll transactions had been included, the portfolio turnover rate would have been 132% for the six months ended June 30, 2019 and 274%, 264%, 201%, 244% and 229% for the years ended December 31, 2018, 2017, 2016, 2015 and 2014, respectively. |
See Notes to Financial Statements.
| | |
| | |
| Western Asset Core Plus Bond Fund 2019 Semi-Annual Report | | 99 |
Financial highlights (cont’d)
| | | | | | | | | | | | | | | | | | | | | | | | |
For a share of each class of capital stock outstanding throughout each year ended December 31,
unless otherwise noted: | |
| Class C Shares1 | | 20192 | | | 2018 | | | 2017 | | | 2016 | | | 2015 | | | 2014 | |
| | | | | | |
| Net asset value, beginning of period | | | $11.21 | | | | $11.84 | | | | $11.43 | | | | $11.44 | | | | $11.65 | | | | $11.20 | |
| | | | | | |
| Income (loss) from operations: | | | | | | | | | | | | | | | | | | | | | | | | |
Net investment income | | | 0.15 | | | | 0.28 | | | | 0.23 | | | | 0.25 | | | | 0.23 | | | | 0.26 | |
Net realized and unrealized gain (loss) | | | 0.70 | | | | (0.58) | | | | 0.43 | | | | 0.16 | | | | (0.20) | | | | 0.47 | |
Total income (loss) from operations | | | 0.85 | | | | (0.30) | | | | 0.66 | | | | 0.41 | | | | 0.03 | | | | 0.73 | |
| | | | | | |
| Less distributions from: | | | | | | | | | | | | | | | | | | | | | | | | |
Net investment income | | | (0.15) | | | | (0.28) | | | | (0.23) | | | | (0.31) | | | | (0.24) | | | | (0.28) | |
Net realized gains | | | — | | | | (0.05) | | | | (0.02) | | | | (0.11) | | | | — | | | | — | |
Total distributions | | | (0.15) | | | | (0.33) | | | | (0.25) | | | | (0.42) | | | | (0.24) | | | | (0.28) | |
| | | | | | |
| Net asset value, end of period | | | $11.91 | | | | $11.21 | | | | $11.84 | | | | $11.43 | | | | $11.44 | | | | $11.65 | |
Total return3 | | | 7.65 | % | | | (2.53) | % | | | 5.82 | % | | | 3.59 | % | | | 0.22 | % | | | 6.53 | % |
| | | | | | |
| Net assets, end of period (millions) | | | $216 | | | | $199 | | | | $219 | | | | $186 | | | | $121 | | | | $53 | |
| | | | | | |
| Ratios to average net assets: | | | | | | | | | | | | | | | | | | | | | | | | |
Gross expenses | | | 1.52 | %4 | | | 1.52 | % | | | 1.52 | % | | | 1.52 | % | | | 1.52 | % | | | 1.53 | %5 |
Net expenses6 | | | 1.52 | 4 | | | 1.52 | 7 | | | 1.52 | 7 | | | 1.52 | | | | 1.52 | | | | 1.53 | 5,7 |
Net investment income | | | 2.59 | 4 | | | 2.45 | | | | 1.95 | | | | 2.13 | | | | 1.99 | | | | 2.26 | |
| | | | | | |
| Portfolio turnover rate8 | | | 89 | % | | | 105 | % | | | 94 | % | | | 97 | % | | | 93 | % | | | 78 | % |
| 1 | Per share amounts have been calculated using the average shares method. |
| 2 | For the six months ended June 30, 2019 (unaudited). |
| 3 | Performance figures, exclusive of CDSC, may reflect compensating balance arrangements, fee waivers and/or expense reimbursements. In the absence of compensating balance arrangements, fee waivers and/or expense reimbursements, the total return would have been lower. Past performance is no guarantee of future results. Total returns for periods of less than one year are not annualized. |
| 5 | Reflects recapture of expenses waived/reimbursed from prior fiscal years. |
| 6 | As a result of an expense limitation arrangement, the ratio of total annual fund operating expenses, other than interest, brokerage commissions, taxes, extraordinary expenses, deferred organizational expenses and acquired fund fees and expenses, to average net assets of Class C shares did not exceed 1.65%. This expense limitation arrangement cannot be terminated prior to December 31, 2020 without the Board of Directors’ consent. |
| 7 | Reflects fee waivers and/or expense reimbursements. |
| 8 | Excluding mortgage dollar roll transactions. If mortgage dollar roll transactions had been included, the portfolio turnover rate would have been 132% for the six months ended June 30, 2019 and 274%, 264%, 201%, 244% and 229% for the years ended December 31, 2018, 2017, 2016, 2015 and 2014, respectively. |
See Notes to Financial Statements.
| | |
| | |
| 100 | | Western Asset Core Plus Bond Fund 2019 Semi-Annual Report |
| | | | | | | | | | | | | | | | | | | | | | | | |
For a share of each class of capital stock outstanding throughout each year ended December 31,
unless otherwise noted: | |
| Class C1 Shares1 | | 20192 | | | 2018 | | | 2017 | | | 2016 | | | 2015 | | | 2014 | |
| | | | | | |
| Net asset value, beginning of period | | | $11.20 | | | | $11.83 | | | | $11.42 | | | | $11.43 | | | | $11.63 | | | | $11.18 | |
| | | | | | |
| Income (loss) from operations: | | | | | | | | | | | | | | | | | | | | | | | | |
Net investment income | | | 0.16 | | | | 0.31 | | | | 0.27 | | | | 0.29 | | | | 0.27 | | | | 0.31 | |
Net realized and unrealized gain (loss) | | | 0.71 | | | | (0.58) | | | | 0.43 | | | | 0.16 | | | | (0.20) | | | | 0.45 | |
Total income (loss) from operations | | | 0.87 | | | | (0.27) | | | | 0.70 | | | | 0.45 | | | | 0.07 | | | | 0.76 | |
| | | | | | |
| Less distributions from: | | | | | | | | | | | | | | | | | | | | | | | | |
Net investment income | | | (0.17) | | | | (0.31) | | | | (0.27) | | | | (0.35) | | | | (0.27) | | | | (0.31) | |
Net realized gains | | | — | | | | (0.05) | | | | (0.02) | | | | (0.11) | | | | — | | | | — | |
Total distributions | | | (0.17) | | | | (0.36) | | | | (0.29) | | | | (0.46) | | | | (0.27) | | | | (0.31) | |
| | | | | | |
| Net asset value, end of period | | | $11.90 | | | | $11.20 | | | | $11.83 | | | | $11.42 | | | | $11.43 | | | | $11.63 | |
Total return3 | | | 7.81 | % | | | (2.22) | % | | | 6.16 | % | | | 3.92 | % | | | 0.63 | % | | | 6.89 | % |
| | | | | | |
| Net assets, end of period (000s) | | | $7,299 | | | | $14,202 | | | | $22,192 | | | | $25,069 | | | | $27,662 | | | | $30,785 | |
| | | | | | |
| Ratios to average net assets: | | | | | | | | | | | | | | | | | | | | | | | | |
Gross expenses | | | 1.23 | %4 | | | 1.19 | % | | | 1.21 | % | | | 1.21 | % | | | 1.20 | % | | | 1.24 | % |
Net expenses5 | | | 1.23 | 4 | | | 1.19 | 6 | | | 1.21 | 6 | | | 1.21 | | | | 1.20 | | | | 1.24 | |
Net investment income | | | 2.86 | 4 | | | 2.75 | | | | 2.27 | | | | 2.46 | | | | 2.29 | | | | 2.65 | |
| | | | | | |
| Portfolio turnover rate7 | | | 89 | % | | | 105 | % | | | 94 | % | | | 97 | % | | | 93 | % | | | 78 | % |
| 1 | Per share amounts have been calculated using the average shares method. |
| 2 | For the six months ended June 30, 2019 (unaudited). |
| 3 | Performance figures, exclusive of CDSC, may reflect compensating balance arrangements, fee waivers and/or expense reimbursements. In the absence of compensating balance arrangements, fee waivers and/or expense reimbursements, the total return would have been lower. Past performance is no guarantee of future results. Total returns for periods of less than one year are not annualized. |
| 5 | As a result of an expense limitation arrangement, the ratio of total annual fund operating expenses, other than interest, brokerage commissions, taxes, extraordinary expenses, deferred organizational expenses and acquired fund fees and expenses, to average net assets of Class C1 shares did not exceed 1.51%. This expense limitation arrangement cannot be terminated prior to December 31, 2020 without the Board of Directors’ consent. |
| 6 | Reflects fee waivers and/or expense reimbursements. |
| 7 | Excluding mortgage dollar roll transactions. If mortgage dollar roll transactions had been included, the portfolio turnover rate would have been 132% for the six months ended June 30, 2019 and 274%, 264%, 201%, 244% and 229% for the years ended December 31, 2018, 2017, 2016, 2015 and 2014, respectively. |
See Notes to Financial Statements.
| | |
| | |
| Western Asset Core Plus Bond Fund 2019 Semi-Annual Report | | 101 |
Financial highlights (cont’d)
| | | | | | | | | | | | | | | | | | | | | | | | |
For a share of each class of capital stock outstanding throughout each year ended December 31,
unless otherwise noted: | |
| Class FI Shares1 | | 20192 | | | 2018 | | | 2017 | | | 2016 | | | 2015 | | | 2014 | |
| | | | | | |
| Net asset value, beginning of period | | | $11.20 | | | | $11.84 | | | | $11.43 | | | | $11.44 | | | | $11.64 | | | | $11.19 | |
| | | | | | |
| Income (loss) from operations: | | | | | | | | | | | | | | | | | | | | | | | | |
Net investment income | | | 0.19 | | | | 0.36 | | | | 0.31 | | | | 0.34 | | | | 0.31 | | | | 0.36 | |
Net realized and unrealized gain (loss) | | | 0.71 | | | | (0.60) | | | | 0.44 | | | | 0.15 | | | | (0.19) | | | | 0.45 | |
Total income (loss) from operations | | | 0.90 | | | | (0.24) | | | | 0.75 | | | | 0.49 | | | | 0.12 | | | | 0.81 | |
| | | | | | |
| Less distributions from: | | | | | | | | | | | | | | | | | | | | | | | | |
Net investment income | | | (0.19) | | | | (0.35) | | | | (0.32) | | | | (0.39) | | | | (0.32) | | | | (0.36) | |
Net realized gains | | | — | | | | (0.05) | | | | (0.02) | | | | (0.11) | | | | — | | | | — | |
Total distributions | | | (0.19) | | | | (0.40) | | | | (0.34) | | | | (0.50) | | | | (0.32) | | | | (0.36) | |
| | | | | | |
| Net asset value, end of period | | | $11.91 | | | | $11.20 | | | | $11.84 | | | | $11.43 | | | | $11.44 | | | | $11.64 | |
Total return3 | | | 8.01 | % | | | (1.87) | % | | | 6.65 | % | | | 4.21 | % | | | 0.99 | % | | | 7.35 | % |
| | | | | | |
| Net assets, end of period (millions) | | | $382 | | | | $359 | | | | $444 | | | | $406 | | | | $1,542 | | | | $1,853 | |
| | | | | | |
| Ratios to average net assets: | | | | | | | | | | | | | | | | | | | | | | | | |
Gross expenses | | | 0.83 | %4 | | | 0.83 | % | | | 0.83 | % | | | 0.83 | % | | | 0.84 | % | | | 0.81 | % |
Net expenses5 | | | 0.83 | 4,6 | | | 0.83 | 6 | | | 0.83 | 6 | | | 0.83 | | | | 0.84 | | | | 0.80 | 6 |
Net investment income | | | 3.27 | 4 | | | 3.13 | | | | 2.65 | | | | 2.88 | | | | 2.64 | | | | 3.12 | |
| | | | | | |
| Portfolio turnover rate7 | | | 89 | % | | | 105 | % | | | 94 | % | | | 97 | % | | | 93 | % | | | 78 | % |
| 1 | Per share amounts have been calculated using the average shares method. |
| 2 | For the six months ended June 30, 2019 (unaudited). |
| 3 | Performance figures may reflect compensating balance arrangements, fee waivers and/or expense reimbursements. In the absence of compensating balance arrangements, fee waivers and/or expense reimbursements, the total return would have been lower. Past performance is no guarantee of future results. Total returns for periods of less than one year are not annualized. |
| 5 | As a result of an expense limitation arrangement, the ratio of total annual fund operating expenses, other than interest, brokerage commissions, taxes, extraordinary expenses, deferred organizational expenses and acquired fund fees and expenses, to average net assets of Class FI shares did not exceed 0.85%. This expense limitation arrangement cannot be terminated prior to December 31, 2020 without the Board of Directors’ consent. Prior to May 1, 2014, the manager voluntarily waived fees and/or reimbursed operating expenses so that total annual operating expenses did not exceed 0.78%. These expense limitations did not include interest, brokerage commissions, taxes, extraordinary expenses and deferred organizational expenses. |
| 6 | Reflects fee waivers and/or expense reimbursements. |
| 7 | Excluding mortgage dollar roll transactions. If mortgage dollar roll transactions had been included, the portfolio turnover rate would have been 132% for the six months ended June 30, 2019 and 274%, 264%, 201%, 244% and 229% for the years ended December 31, 2018, 2017, 2016, 2015 and 2014, respectively. |
See Notes to Financial Statements.
| | |
| | |
| 102 | | Western Asset Core Plus Bond Fund 2019 Semi-Annual Report |
| | | | | | | | | | | | | | | | | | | | | | | | |
For a share of each class of capital stock outstanding throughout each year ended December 31,
unless otherwise noted: | |
| Class R Shares1 | | 20192 | | | 2018 | | | 2017 | | | 2016 | | | 2015 | | | 2014 | |
| | | | | | |
| Net asset value, beginning of period | | | $11.19 | | | | $11.82 | | | | $11.41 | | | | $11.41 | | | | $11.62 | | | | $11.18 | |
| | | | | | |
| Income (loss) from operations: | | | | | | | | | | | | | | | | | | | | | | | | |
Net investment income | | | 0.17 | | | | 0.32 | | | | 0.28 | | | | 0.29 | | | | 0.28 | | | | 0.31 | |
Net realized and unrealized gain (loss) | | | 0.71 | | | | (0.58) | | | | 0.43 | | | | 0.18 | | | | (0.21) | | | | 0.45 | |
Total income (loss) from operations | | | 0.88 | | | | (0.26) | | | | 0.71 | | | | 0.47 | | | | 0.07 | | | | 0.76 | |
| | | | | | |
| Less distributions from: | | | | | | | | | | | | | | | | | | | | | | | | |
Net investment income | | | (0.18) | | | | (0.32) | | | | (0.28) | | | | (0.36) | | | | (0.28) | | | | (0.32) | |
Net realized gains | | | — | | | | (0.05) | | | | (0.02) | | | | (0.11) | | | | — | | | | — | |
Total distributions | | | (0.18) | | | | (0.37) | | | | (0.30) | | | | (0.47) | | | | (0.28) | | | | (0.32) | |
| | | | | | |
| Net asset value, end of period | | | $11.89 | | | | $11.19 | | | | $11.82 | | | | $11.41 | | | | $11.41 | | | | $11.62 | |
Total return3 | | | 7.87 | % | | | (2.16) | % | | | 6.25 | % | | | 4.11 | % | | | 0.62 | % | | | 6.89 | % |
| | | | | | |
| Net assets, end of period (millions) | | | $269 | | | | $245 | | | | $215 | | | | $130 | | | | $53 | | | | $11 | |
| | | | | | |
| Ratios to average net assets: | | | | | | | | | | | | | | | | | | | | | | | | |
Gross expenses | | | 1.11 | %4 | | | 1.12 | % | | | 1.13 | % | | | 1.12 | % | | | 1.14 | %5 | | | 1.27 | %5 |
Net expenses6 | | | 1.11 | 4 | | | 1.12 | | | | 1.13 | 7 | | | 1.12 | | | | 1.14 | 5 | | | 1.15 | 5,7 |
Net investment income | | | 2.99 | 4 | | | 2.87 | | | | 2.35 | | | | 2.53 | | | | 2.42 | | | | 2.71 | |
| | | | | | |
| Portfolio turnover rate8 | | | 89 | % | | | 105 | % | | | 94 | % | | | 97 | % | | | 93 | % | | | 78 | % |
| 1 | Per share amounts have been calculated using the average shares method. |
| 2 | For the six months ended June 30, 2019 (unaudited). |
| 3 | Performance figures may reflect compensating balance arrangements, fee waivers and/or expense reimbursements. In the absence of compensating balance arrangements, fee waivers and/or expense reimbursements, the total return would have been lower. Past performance is no guarantee of future results. Total returns for periods of less than one year are not annualized. |
| 5 | Reflects recapture of expenses waived/reimbursed from prior fiscal years. |
| 6 | As a result of an expense limitation arrangement, the ratio of total annual fund operating expenses, other than interest, brokerage commissions, taxes, extraordinary expenses, deferred organizational expenses and acquired fund fees and expenses, to average net assets of Class R shares did not exceed 1.15%. This expense limitation arrangement cannot be terminated prior to December 31, 2020 without the Board of Directors’ consent. |
| 7 | Reflects fee waivers and/or expense reimbursements. |
| 8 | Excluding mortgage dollar roll transactions. If mortgage dollar roll transactions had been included, the portfolio turnover rate would have been 132% for the six months ended June 30, 2019 and 274%, 264%, 201%, 244% and 229% for the years ended December 31, 2018, 2017, 2016, 2015 and 2014, respectively. |
See Notes to Financial Statements.
| | |
| | |
| Western Asset Core Plus Bond Fund 2019 Semi-Annual Report | | 103 |
Financial highlights (cont’d)
| | | | | | | | | | | | | | | | | | | | | | | | |
For a share of each class of capital stock outstanding throughout each year ended December 31,
unless otherwise noted: | |
| Class I Shares1 | | 20192 | | | 2018 | | | 2017 | | | 2016 | | | 2015 | | | 2014 | |
| | | | | | |
| Net asset value, beginning of period | | | $11.20 | | | | $11.84 | | | | $11.43 | | | | $11.43 | | | | $11.64 | | | | $11.19 | |
| | | | | | |
| Income (loss) from operations: | | | | | | | | | | | | | | | | | | | | | | | | |
Net investment income | | | 0.21 | | | | 0.40 | | | | 0.35 | | | | 0.38 | | | | 0.35 | | | | 0.39 | |
Net realized and unrealized gain (loss) | | | 0.71 | | | | (0.59) | | | | 0.44 | | | | 0.17 | | | | (0.20) | | | | 0.46 | |
Total income (loss) from operations | | | 0.92 | | | | (0.19) | | | | 0.79 | | | | 0.55 | | | | 0.15 | | | | 0.85 | |
| | | | | | |
| Less distributions from: | | | | | | | | | | | | | | | | | | | | | | | | |
Net investment income | | | (0.21) | | | | (0.40) | | | | (0.36) | | | | (0.44) | | | | (0.36) | | | | (0.40) | |
Net realized gains | | | — | | | | (0.05) | | | | (0.02) | | | | (0.11) | | | | — | | | | — | |
Total distributions | | | (0.21) | | | | (0.45) | | | | (0.38) | | | | (0.55) | | | | (0.36) | | | | (0.40) | |
| | | | | | |
| Net asset value, end of period | | | $11.91 | | | | $11.20 | | | | $11.84 | | | | $11.43 | | | | $11.43 | | | | $11.64 | |
Total return3 | | | 8.22 | % | | | (1.49) | % | | | 6.96 | % | | | 4.79 | % | | | 1.29 | % | | | 7.68 | % |
| | | | | | |
| Net assets, end of period (millions) | | | $17,687 | | | | $15,351 | | | | $14,721 | | | | $12,191 | | | | $9,649 | | | | $7,499 | |
| | | | | | |
| Ratios to average net assets: | | | | | | | | | | | | | | | | | | | | | | | | |
Gross expenses | | | 0.52 | %4 | | | 0.52 | % | | | 0.52 | % | | | 0.52 | % | | | 0.52 | % | | | 0.49 | % |
Net expenses5,6 | | | 0.45 | 4 | | | 0.45 | | | | 0.45 | | | | 0.45 | | | | 0.45 | | | | 0.49 | |
Net investment income | | | 3.65 | 4 | | | 3.53 | | | | 3.03 | | | | 3.21 | | | | 3.05 | | | | 3.39 | |
| | | | | | |
| Portfolio turnover rate7 | | | 89 | % | | | 105 | % | | | 94 | % | | | 97 | % | | | 93 | % | | | 78 | % |
| 1 | Per share amounts have been calculated using the average shares method. |
| 2 | For the six months ended June 30, 2019 (unaudited). |
| 3 | Performance figures may reflect compensating balance arrangements, fee waivers and/or expense reimbursements. In the absence of compensating balance arrangements, fee waivers and/or expense reimbursements, the total return would have been lower. Past performance is no guarantee of future results. Total returns for periods of less than one year are not annualized. |
| 5 | Reflects fee waivers and/or expense reimbursements. |
| 6 | As a result of an expense limitation arrangement, effective November 7, 2014, the ratio of total annual fund operating expenses, other than interest, brokerage commissions, taxes, extraordinary expenses, deferred organizational expenses and acquired fund fees and expenses, to average net assets of Class I shares did not exceed 0.45%. This expense limitation arrangement cannot be terminated prior to December 31, 2020 without the Board of Directors’ consent. |
| 7 | Excluding mortgage dollar roll transactions. If mortgage dollar roll transactions had been included, the portfolio turnover rate would have been 132% for the six months ended June 30, 2019 and 274%, 264%, 201%, 244% and 229% for the years ended December 31, 2018, 2017, 2016, 2015 and 2014, respectively. |
See Notes to Financial Statements.
| | |
| | |
| 104 | | Western Asset Core Plus Bond Fund 2019 Semi-Annual Report |
| | | | | | | | | | | | | | | | | | | | | | | | |
For a share of each class of capital stock outstanding throughout each year ended December 31,
unless otherwise noted: | |
| Class IS Shares1 | | 20192 | | | 2018 | | | 2017 | | | 2016 | | | 2015 | | | 2014 | |
| | | | | | |
| Net asset value, beginning of period | | | $11.20 | | | | $11.83 | | | | $11.42 | | | | $11.43 | | | | $11.64 | | | | $11.19 | |
| | | | | | |
| Income (loss) from operations: | | | | | | | | | | | | | | | | | | | | | | | | |
Net investment income | | | 0.21 | | | | 0.40 | | | | 0.36 | | | | 0.38 | | | | 0.36 | | | | 0.40 | |
Net realized and unrealized gain (loss) | | | 0.71 | | | | (0.58) | | | | 0.43 | | | | 0.16 | | | | (0.21) | | | | 0.46 | |
Total income (loss) from operations | | | 0.92 | | | | (0.18) | | | | 0.79 | | | | 0.54 | | | | 0.15 | | | | 0.86 | |
| | | | | | |
| Less distributions from: | | | | | | | | | | | | | | | | | | | | | | | | |
Net investment income | | | (0.22) | | | | (0.40) | | | | (0.36) | | | | (0.44) | | | | (0.36) | | | | (0.41) | |
Net realized gains | | | — | | | | (0.05) | | | | (0.02) | | | | (0.11) | | | | — | | | | — | |
Total distributions | | | (0.22) | | | | (0.45) | | | | (0.38) | | | | (0.55) | | | | (0.36) | | | | (0.41) | |
| | | | | | |
| Net asset value, end of period | | | $11.90 | | | | $11.20 | | | | $11.83 | | | | $11.42 | | | | $11.43 | | | | $11.64 | |
Total return3 | | | 8.24 | % | | | (1.47) | % | | | 6.99 | % | | | 4.73 | % | | | 1.32 | % | | | 7.75 | % |
| | | | | | |
| Net assets, end of period (millions) | | | $7,527 | | | | $6,336 | | | | $5,482 | | | | $3,955 | | | | $3,330 | | | | $3,170 | |
| | | | | | |
| Ratios to average net assets: | | | | | | | | | | | | | | | | | | | | | | | | |
Gross expenses | | | 0.42 | %4 | | | 0.42 | % | | | 0.43 | % | | | 0.42 | % | | | 0.42 | %5 | | | 0.43 | % |
Net expenses6 | | | 0.42 | 4 | | | 0.42 | | | | 0.43 | | | | 0.42 | | | | 0.42 | 5 | | | 0.43 | 7 |
Net investment income | | | 3.69 | 4 | | | 3.57 | | | | 3.05 | | | | 3.24 | | | | 3.07 | | | | 3.45 | |
| | | | | | |
| Portfolio turnover rate8 | | | 89 | % | | | 105 | % | | | 94 | % | | | 97 | % | | | 93 | % | | | 78 | % |
| 1 | Per share amounts have been calculated using the average shares method. |
| 2 | For the six months ended June 30, 2019 (unaudited). |
| 3 | Performance figures may reflect compensating balance arrangements, fee waivers and/or expense reimbursements. In the absence of compensating balance arrangements, fee waivers and/or expense reimbursements, the total return would have been lower. Past performance is no guarantee of future results. Total returns for periods of less than one year are not annualized. |
| 5 | Reflects recapture of expenses waived/reimbursed from prior fiscal years. |
| 6 | As a result of an expense limitation arrangement, the ratio of total annual fund operating expenses, other than interest, brokerage commissions, taxes, extraordinary expenses, deferred organizational expenses and acquired fund fees and expenses, to average net assets of Class IS shares did not exceed 0.45%. In addition, the ratio of total annual fund operating expenses for Class IS shares did not exceed the ratio of total annual fund operating expenses for Class I shares. These expense limitation arrangements cannot be terminated prior to December 31, 2020 without the Board of Directors’ consent. |
| 7 | Reflects fee waivers and/or expense reimbursements. |
| 8 | Excluding mortgage dollar roll transactions. If mortgage dollar roll transactions had been included, the portfolio turnover rate would have been 132% for the six months ended June 30, 2019 and 274%, 264%, 201%, 244% and 229% for the years ended December 31, 2018, 2017, 2016, 2015 and 2014, respectively. |
See Notes to Financial Statements.
| | |
| | |
| Western Asset Core Plus Bond Fund 2019 Semi-Annual Report | | 105 |
Notes to financial statements(unaudited)
1. Organization and significant accounting policies
Western Asset Core Plus Bond Fund (the “Fund”) is a separate diversified investment series of Western Asset Funds, Inc. (the “Corporation”). The Corporation, a Maryland corporation, is registered under the Investment Company Act of 1940, as amended (the “1940 Act”), as anopen-end management investment company.
The following are significant accounting policies consistently followed by the Fund and are in conformity with U.S. generally accepted accounting principles (“GAAP”). Estimates and assumptions are required to be made regarding assets, liabilities and changes in net assets resulting from operations when financial statements are prepared. Changes in the economic environment, financial markets and any other parameters used in determining these estimates could cause actual results to differ. Subsequent events have been evaluated through the date the financial statements were issued.
(a) Investment valuation. The valuations for fixed income securities (which may include, but are not limited to, corporate, government, municipal, mortgage-backed, collateralized mortgage obligations and asset-backed securities) and certain derivative instruments are typically the prices supplied by independent third party pricing services, which may use market prices or broker/dealer quotations or a variety of valuation techniques and methodologies. The independent third party pricing services use inputs that are observable such as issuer details, interest rates, yield curves, prepayment speeds, credit risks/spreads, default rates and quoted prices for similar securities. Investments inopen-end funds are valued at the closing net asset value per share of each fund on the day of valuation. Futures contracts are valued daily at the settlement price established by the board of trade or exchange on which they are traded. Equity securities for which market quotations are available are valued at the last reported sales price or official closing price on the primary market or exchange on which they trade. When the Fund holds securities or other assets that are denominated in a foreign currency, the Fund will normally use the currency exchange rates as of 4:00 p.m. (Eastern Time). If independent third party pricing services are unable to supply prices for a portfolio investment, or if the prices supplied are deemed by the manager to be unreliable, the market price may be determined by the manager using quotations from one or more broker/dealers or at the transaction price if the security has recently been purchased and no value has yet been obtained from a pricing service or pricing broker. When reliable prices are not readily available, such as when the value of a security has been significantly affected by events after the close of the exchange or market on which the security is principally traded, but before the Fund calculates its net asset value, the Fund values these securities as determined in accordance with procedures approved by the Fund’s Board of Directors.
The Board of Directors is responsible for the valuation process and has delegated the supervision of the daily valuation process to the Legg Mason North Atlantic Fund Valuation Committee (the “Valuation Committee”). The Valuation Committee, pursuant to the policies
| | |
| | |
| 106 | | Western Asset Core Plus Bond Fund 2019 Semi-Annual Report |
adopted by the Board of Directors, is responsible for making fair value determinations, evaluating the effectiveness of the Fund’s pricing policies, and reporting to the Board of Directors. When determining the reliability of third party pricing information for investments owned by the Fund, the Valuation Committee, among other things, conducts due diligence reviews of pricing vendors, monitors the daily change in prices and reviews transactions among market participants.
The Valuation Committee will consider pricing methodologies it deems relevant and appropriate when making fair value determinations. Examples of possible methodologies include, but are not limited to, multiple of earnings; discount from market of a similar freely traded security; discounted cash-flow analysis; book value or a multiple thereof; risk premium/yield analysis; yield to maturity; and/or fundamental investment analysis. The Valuation Committee will also consider factors it deems relevant and appropriate in light of the facts and circumstances. Examples of possible factors include, but are not limited to, the type of security; the issuer’s financial statements; the purchase price of the security; the discount from market value of unrestricted securities of the same class at the time of purchase; analysts’ research and observations from financial institutions; information regarding any transactions or offers with respect to the security; the existence of merger proposals or tender offers affecting the security; the price and extent of public trading in similar securities of the issuer or comparable companies; and the existence of a shelf registration for restricted securities.
For each portfolio security that has been fair valued pursuant to the policies adopted by the Board of Directors, the fair value price is compared against the last available and next available market quotations. The Valuation Committee reviews the results of such back testing monthly and fair valuation occurrences are reported to the Board of Directors quarterly.
The Fund uses valuation techniques to measure fair value that are consistent with the market approach and/or income approach, depending on the type of security and the particular circumstance. The market approach uses prices and other relevant information generated by market transactions involving identical or comparable securities. The income approach uses valuation techniques to discount estimated future cash flows to present value.
GAAP establishes a disclosure hierarchy that categorizes the inputs to valuation techniques used to value assets and liabilities at measurement date. These inputs are summarized in the three broad levels listed below:
| • | | Level 1 — quoted prices in active markets for identical investments |
| • | | Level 2 — other significant observable inputs (including quoted prices for similar investments, interest rates, prepayment speeds, credit risk, etc.) |
| • | | Level 3 — significant unobservable inputs (including the Fund’s own assumptions in determining the fair value of investments) |
| | |
| | |
| Western Asset Core Plus Bond Fund 2019 Semi-Annual Report | | 107 |
Notes to financial statements(unaudited) (cont’d)
The inputs or methodologies used to value securities are not necessarily an indication of the risk associated with investing in those securities.
The following is a summary of the inputs used in valuing the Fund’s assets and liabilities carried at fair value:
| | | | | | | | | | | | | | | | |
| ASSETS | |
| Description | | Quoted Prices
(Level 1) | | | Other Significant
Observable Inputs
(Level 2) | | | Significant
Unobservable
Inputs
(Level 3) | | | Total | |
| Long-term investments†: | | | | | | | | | | | | | | | | |
Corporate bonds & notes: | | | | | | | | | | | | | | | | |
Financials | | | — | | | $ | 3,046,104,172 | | | $ | 71,333,782 | | | $ | 3,117,437,954 | |
Other corporate bonds & notes | | | — | | | | 5,237,941,496 | | | | — | | | | 5,237,941,496 | |
Mortgage-backed securities | | | — | | | | 7,635,570,746 | | | | — | | | | 7,635,570,746 | |
U.S. government & agency obligations | | | — | | | | 3,922,837,199 | | | | — | | | | 3,922,837,199 | |
Collateralized mortgage obligations | | | — | | | | 2,656,521,945 | | | | — | | | | 2,656,521,945 | |
Sovereign bonds | | | — | | | | 1,893,345,487 | | | | — | | | | 1,893,345,487 | |
Asset-backed securities | | | — | | | | 941,320,298 | | | | — | | | | 941,320,298 | |
Senior loans: | | | | | | | | | | | | | | | | |
Communication services | | | — | | | | 142,560,500 | | | | 3,420,935 | | | | 145,981,435 | |
Consumer discretionary | | | — | | | | 215,485,091 | | | | 3,763,805 | | | | 219,248,896 | |
Financials | | | — | | | | 119,097,984 | | | | 2,062,244 | | | | 121,160,228 | |
Health care | | | — | | | | 167,187,352 | | | | 11,745,300 | | | | 178,932,652 | |
Other senior loans | | | — | | | | 210,383,842 | | | | — | | | | 210,383,842 | |
U.S. treasury inflation protected securities | | | — | | | | 511,140,484 | | | | — | | | | 511,140,484 | |
Non-U.S. treasury inflation protected securities | | | — | | | | 91,038,547 | | | | — | | | | 91,038,547 | |
Purchased options: | | | | | | | | | | | | | | | | |
Exchange-traded purchased options | | $ | 5,416,452 | | | | — | | | | — | | | | 5,416,452 | |
OTC purchased options | | | — | | | | 33,739,679 | | | | — | | | | 33,739,679 | |
Preferred stocks | | | 13,020,183 | | | | — | | | | — | | | | 13,020,183 | |
| Total long-term investments | | | 18,436,635 | | | | 26,824,274,822 | | | | 92,326,066 | | | | 26,935,037,523 | |
| Short-term investments†: | | | | | | | | | | | | | | | �� | |
Commercial paper | | | — | | | | 623,579,803 | | | | — | | | | 623,579,803 | |
Certificates of deposit | | | — | | | | 135,320,703 | | | | — | | | | 135,320,703 | |
Money market funds | | | — | | | | 847,657,870 | | | | — | | | | 847,657,870 | |
| Total short-term investments | | | — | | | | 1,606,558,376 | | | | — | | | | 1,606,558,376 | |
| Total investments | | $ | 18,436,635 | | | $ | 28,430,833,198 | | | $ | 92,326,066 | | | $ | 28,541,595,899 | |
| | |
| | |
| 108 | | Western Asset Core Plus Bond Fund 2019 Semi-Annual Report |
| | | | | | | | | | | | | | | | |
| ASSETS | |
| Description | | Quoted Prices
(Level 1) | | | Other Significant
Observable Inputs
(Level 2) | | | Significant
Unobservable
Inputs
(Level 3) | | | Total | |
| Other financial instruments: | | | | | | | | | | | | | | | | |
Futures contracts | | $ | 334,850,685 | | | | — | | | | — | | | $ | 334,850,685 | |
Forward foreign currency contracts | | | — | | | $ | 73,496,293 | | | | — | | | | 73,496,293 | |
OTC credit default swaps on corporate issues — sell protection‡ | | | — | | | | 579,173 | | | | — | | | | 579,173 | |
Centrally cleared interest rate swaps | | | — | | | | 68,896,894 | | | | — | | | | 68,896,894 | |
OTC interest rate swaps‡ | | | — | | | | 26,215,469 | | | | — | | | | 26,215,469 | |
Centrally cleared credit default swaps on credit indices — sell protection | | | — | | | | 23,780,127 | | | | — | | | | 23,780,127 | |
| Total other financial instruments | | $ | 334,850,685 | | | $ | 192,967,956 | | | | — | | | $ | 527,818,641 | |
| Total | | $ | 353,287,320 | | | $ | 28,623,801,154 | | | $ | 92,326,066 | | | $ | 29,069,414,540 | |
|
| LIABILITIES | |
| Description | | Quoted Prices
(Level 1) | | | Other Significant
Observable Inputs
(Level 2) | | | Significant
Unobservable
Inputs
(Level 3) | | | Total | |
| Other financial instruments: | | | | | | | | | | | | | | | | |
Written options: | | | | | | | | | | | | | | | | |
Exchange-traded written options | | $ | 27,438,084 | | | | — | | | | — | | | $ | 27,438,084 | |
OTC written options | | | — | | | $ | 32,060,975 | | | | — | | | | 32,060,975 | |
Futures contracts | | | 122,356,324 | | | | — | | | | — | | | | 122,356,324 | |
Forward foreign currency contracts | | | — | | | | 30,544,676 | | | | — | | | | 30,544,676 | |
Centrally cleared interest rate swaps | | | — | | | | 292,839,114 | | | | — | | | | 292,839,114 | |
Centrally cleared credit default swaps on credit indices — sell protection | | | — | | | | 735,317 | | | | — | | | | 735,317 | |
| Total | | $ | 149,794,408 | | | $ | 356,180,082 | | | | — | | | $ | 505,974,490 | |
| † | See Schedule of Investments for additional detailed categorizations. |
| ‡ | Value includes any premium paid or received with respect to swap contracts. |
(b) Purchased options.When the Fund purchases an option, an amount equal to the premium paid by the Fund is recorded as an investment on the Statement of Assets and Liabilities, the value of which ismarked-to-market to reflect the current market value of the
| | |
| | |
| Western Asset Core Plus Bond Fund 2019 Semi-Annual Report | | 109 |
Notes to financial statements(unaudited) (cont’d)
option purchased. If the purchased option expires, the Fund realizes a loss equal to the amount of premium paid. When an instrument is purchased or sold through the exercise of an option, the related premium paid is added to the basis of the instrument acquired or deducted from the proceeds of the instrument sold. The risk associated with purchasing put and call options is limited to the premium paid.
(c) Written options.When the Fund writes an option, an amount equal to the premium received by the Fund is recorded as a liability, the value of which ismarked-to-market daily to reflect the current market value of the option written. If the option expires, the premium received is recorded as a realized gain. When a written call option is exercised, the difference between the premium received plus the option exercise price and the Fund’s basis in the underlying security (in the case of a covered written call option), or the cost to purchase the underlying security (in the case of an uncovered written call option), including brokerage commission, is recognized as a realized gain or loss. When a written put option is exercised, the amount of the premium received is subtracted from the cost of the security purchased by the Fund from the exercise of the written put option to form the Fund’s basis in the underlying security purchased. The writer or buyer of an option traded on an exchange can liquidate the position before the exercise of the option by entering into a closing transaction. The cost of a closing transaction is deducted from the original premium received resulting in a realized gain or loss to the Fund.
The risk in writing a covered call option is that the Fund may forego the opportunity of profit if the market price of the underlying security increases and the option is exercised. The risk in writing a put option is that the Fund may incur a loss if the market price of the underlying security decreases and the option is exercised. The risk in writing an uncovered call option is that the Fund is exposed to the risk of loss if the market price of the underlying security increases. In addition, there is the risk that the Fund may not be able to enter into a closing transaction because of an illiquid secondary market.
(d) Options on futures contracts.An option on a futures contract gives the purchaser the right, in return for the premium paid, to assume a position in the underlying futures contract at the specified option exercise price at any time prior to the expiration date of the option. Upon exercise of an option, the delivery of the futures position by the writer of the option to the holder of the option will be accompanied by delivery of the accumulated balance in the writer’s futures margin account that represents the amount by which the market price of the futures contract exceeds (in the case of a call) or is less than (in the case of a put) the exercise price of the option on the futures contract. The potential for loss related to the purchase of an option on a futures contract is limited to the premium paid for the option plus transaction costs. Because the value of the option is fixed at the point of purchase, there are no daily cash payments by the purchaser to reflect changes in the value of the underlying contract; however, the value of the option changes daily and that change would be reflected in the net asset value of the Fund. The potential for loss related to writing call
| | |
| | |
| 110 | | Western Asset Core Plus Bond Fund 2019 Semi-Annual Report |
options is unlimited. The potential for loss related to writing put options is limited only by the aggregate strike price of the put option less the premium received.
(e) Futures contracts.The Fund uses futures contracts generally to gain exposure to, or hedge against, changes in interest rates or gain exposure to, or hedge against, changes in certain asset classes. A futures contract represents a commitment for the future purchase or sale of an asset at a specified price on a specified date.
Upon entering into a futures contract, the Fund is required to deposit cash or securities with a broker in an amount equal to a certain percentage of the contract amount. This is known as the ‘‘initial margin’’ and subsequent payments (‘‘variation margin’’) are made or received by the Fund each day, depending on the daily fluctuation in the value of the contract. For certain futures, including foreign denominated futures, variation margin is not settled daily, but is recorded as a net variation margin payable or receivable. The daily changes in contract value are recorded as unrealized gains or losses in the Statement of Operations and the Fund recognizes a realized gain or loss when the contract is closed.
Futures contracts involve, to varying degrees, risk of loss in excess of the amounts reflected in the financial statements. In addition, there is the risk that the Fund may not be able to enter into a closing transaction because of an illiquid secondary market.
(f) Forward foreign currency contracts.The Fund enters into a forward foreign currency contract to hedge against foreign currency exchange rate risk on itsnon-U.S. dollar denominated securities or to facilitate settlement of a foreign currency denominated portfolio transaction. A forward foreign currency contract is an agreement between two parties to buy and sell a currency at a set price with delivery and settlement at a future date. The contract ismarked-to-market daily and the change in value is recorded by the Fund as an unrealized gain or loss. When a forward foreign currency contract is closed, through either delivery or offset by entering into another forward foreign currency contract, the Fund recognizes a realized gain or loss equal to the difference between the value of the contract at the time it was opened and the value of the contract at the time it is closed.
Non-deliverable forward foreign currency exchange contracts are settled with the counterparty in cash without the delivery of foreign currency.
Forward foreign currency contracts involve elements of market risk in excess of the amounts reflected on the Statement of Assets and Liabilities. The Fund bears the risk of an unfavorable change in the foreign exchange rate underlying the forward foreign currency contract. Risks may also arise upon entering into these contracts from the potential inability of the counterparties to meet the terms of their contracts.
(g) Swap agreements. The Fund invests in swaps for the purpose of managing its exposure to interest rate, credit or market risk, or for other purposes. The use of swaps involves
| | |
| | |
| Western Asset Core Plus Bond Fund 2019 Semi-Annual Report | | 111 |
Notes to financial statements(unaudited) (cont’d)
risks that are different from those associated with other portfolio transactions. Swap agreements are privately negotiated in theover-the-counter market and may be entered into as a bilateral contract (“OTC Swaps”) or centrally cleared (“Centrally Cleared Swaps”). Unlike Centrally Cleared Swaps, the Fund has credit exposure to the counterparties of OTC Swaps.
In a Centrally Cleared Swap, immediately following execution of the swap, the swap agreement is submitted to a clearinghouse or central counterparty (the “CCP”) and the CCP becomes the ultimate counterparty of the swap agreement. The Fund is required to interface with the CCP through a broker, acting in an agency capacity. All payments are settled with the CCP through the broker. Upon entering into a Centrally Cleared Swap, the Fund is required to deposit initial margin with the broker in the form of cash or securities.
Swap contracts aremarked-to-market daily and changes in value are recorded as unrealized appreciation (depreciation). The daily change in valuation of Centrally Cleared Swaps, if any, is recorded as a receivable or payable for variation margin on the Statement of Assets and Liabilities. Gains or losses are realized upon termination of the swap agreement. Collateral, in the form of restricted cash or securities, may be required to be held in segregated accounts with the Fund’s custodian in compliance with the terms of the swap contracts. Securities posted as collateral for swap contracts are identified in the Schedule of Investments and restricted cash, if any, is identified on the Statement of Assets and Liabilities. Risks may exceed amounts recorded in the Statement of Assets and Liabilities. These risks include changes in the returns of the underlying instruments, failure of the counterparties to perform under the contracts’ terms, and the possible lack of liquidity with respect to the swap agreements.
OTC swap payments received or made at the beginning of the measurement period are reflected as a premium or deposit, respectively, on the Statement of Assets and Liabilities. These upfront payments are amortized over the life of the swap and are recognized as realized gain or loss in the Statement of Operations. Net periodic payments received or paid by the Fund are recognized as a realized gain or loss in the Statement of Operations.
The Fund’s maximum exposure in the event of a defined credit event on a credit default swap to sell protection is the notional amount. As of June 30, 2019, the total notional value of all credit default swaps to sell protection was $3,540,594,876. This amount would be offset by the value of the swap’s reference entity, upfront premiums received on the swap and any amounts received from the settlement of a credit default swap where the Fund bought protection for the same referenced security/entity.
For average notional amounts of swaps held during the six months ended June 30, 2019, see Note 4.
Credit default swaps
The Fund enters into credit default swap (“CDS”) contracts for investment purposes, to manage its credit risk or to add leverage. CDS agreements involve one party making a
| | |
| | |
| 112 | | Western Asset Core Plus Bond Fund 2019 Semi-Annual Report |
stream of payments to another party in exchange for the right to receive a specified return in the event of a default by a third party, typically corporate or sovereign issuers, on a specified obligation, or in the event of a write-down, principal shortfall, interest shortfall or default of all or part of the referenced entities comprising a credit index. The Fund may use a CDS to provide protection against defaults of the issuers (i.e., to reduce risk where the Fund has exposure to an issuer) or to take an active long or short position with respect to the likelihood of a particular issuer’s default. As a seller of protection, the Fund generally receives an upfront payment or a stream of payments throughout the term of the swap provided that there is no credit event. If the Fund is a seller of protection and a credit event occurs, as defined under the terms of that particular swap agreement, the maximum potential amount of future payments (undiscounted) that the Fund could be required to make under a credit default swap agreement would be an amount equal to the notional amount of the agreement. These amounts of potential payments will be partially offset by any recovery of values from the respective referenced obligations. As a seller of protection, the Fund effectively adds leverage to its portfolio because, in addition to its total net assets, the Fund is subject to investment exposure on the notional amount of the swap. As a buyer of protection, the Fund generally receives an amount up to the notional value of the swap if a credit event occurs.
Implied spreads are the theoretical prices a lender receives for credit default protection. When spreads rise, market perceived credit risk rises and when spreads fall, market perceived credit risk falls. The implied credit spread of a particular referenced entity reflects the cost of buying/selling protection and may include upfront payments required to enter into the agreement. Wider credit spreads and decreasing market values, when compared to the notional amount of the swap, represent a deterioration of the referenced entity’s credit soundness and a greater likelihood or risk of default or other credit event occurring as defined under the terms of the agreement. Credit spreads utilized in determining the period end market value of credit default swap agreements on corporate or sovereign issues are disclosed in the Schedule of Investments and serve as an indicator of the current status of the payment/performance risk and represent the likelihood or risk of default for credit derivatives. For credit default swap agreements on asset-backed securities and credit indices, the quoted market prices and resulting values, particularly in relation to the notional amount of the contract as well as the annual payment rate, serve as an indication of the current status of the payment/performance risk.
The Fund’s maximum risk of loss from counterparty risk, as the protection buyer, is the fair value of the contract (this risk is mitigated by the posting of collateral by the counterparty to the Fund to cover the Fund’s exposure to the counterparty). As the protection seller, the Fund’s maximum risk is the notional amount of the contract. Credit default swaps are considered to have credit risk-related contingent features since they require payment by the protection seller to the protection buyer upon the occurrence of a defined credit event.
| | |
| | |
| Western Asset Core Plus Bond Fund 2019 Semi-Annual Report | | 113 |
Notes to financial statements(unaudited) (cont’d)
Entering into a CDS agreement involves, to varying degrees, elements of credit, market and documentation risk in excess of the related amounts recognized on the Statement of Assets and Liabilities. Such risks involve the possibility that there will be no liquid market for these agreements, that the counterparty to the agreement may default on its obligation to perform or disagree as to the meaning of the contractual terms in the agreement, and that there will be unfavorable changes in net interest rates.
Interest rate swaps
The Fund enters into interest rate swap contracts to manage its exposure to interest rate risk. Interest rate swaps are agreements between two parties to exchange cash flows based on a notional principal amount. The Fund may elect to pay a fixed rate and receive a floating rate, receive a fixed rate and pay a floating rate, or pay and receive a floating rate, on a notional principal amount. Interest rate swaps aremarked-to-market daily based upon quotations from market makers and the change, if any, is recorded as an unrealized gain or loss in the Statement of Operations. When a swap contract is terminated early, the Fund records a realized gain or loss equal to the difference between the original cost and the settlement amount of the closing transaction.
The risks of interest rate swaps include changes in market conditions that will affect the value of the contract or changes in the present value of the future cash flow streams and the possible inability of the counterparty to fulfill its obligations under the agreement. The Fund’s maximum risk of loss from counterparty credit risk is the discounted net value of the cash flows to be received from the counterparty over the contract’s remaining life, to the extent that amount is positive. This risk is mitigated by the posting of collateral by the counterparty to the Fund to cover the Fund’s exposure to the counterparty.
(h) Swaptions. The Fund may purchase or write swaption contracts to manage exposure to fluctuations in interest rates or to enhance yield. The Fund may also purchase and write swaption contracts to manage exposure to an underlying instrument. Swaption contracts written by the Fund represent an option that gives the purchaser the right, but not the obligation, to enter into a previously agreed upon swap contract at a future date. Swaption contracts purchased by the Fund represent an option that gives the Fund the right, but not the obligation, to enter into a previously agreed upon swap contract at a future date.
When the Fund writes a swaption, an amount equal to the premium received by the Fund is recorded as a liability, the value of which ismarked-to-market daily to reflect the current market value of the swaption written. If the swaption expires, the Fund realizes a gain equal to the amount of the premium received.
When the Fund purchases a swaption, an amount equal to the premium paid by the Fund is recorded as an investment on the Statement of Assets and Liabilities, the value of which ismarked-to-market daily to reflect the current market value of the swaption purchased. If the swaption expires, the Fund realizes a loss equal to the amount of the premium paid.
| | |
| | |
| 114 | | Western Asset Core Plus Bond Fund 2019 Semi-Annual Report |
Swaptions aremarked-to-market daily based upon quotations from market makers. Changes in the value of the swaption are reported as unrealized gains or losses in the Statement of Operations.
(i) Loan participations. The Fund may invest in loans arranged through private negotiation between one or more financial institutions. The Fund’s investment in any such loan may be in the form of a participation in or an assignment of the loan. In connection with purchasing participations, the Fund generally will have no right to enforce compliance by the borrower with the terms of the loan agreement related to the loan, or any rights ofoff-set against the borrower and the Fund may not benefit directly from any collateral supporting the loan in which it has purchased the participation.
The Fund assumes the credit risk of the borrower, the lender that is selling the participation and any other persons interpositioned between the Fund and the borrower. In the event of the insolvency of the lender selling the participation, the Fund may be treated as a general creditor of the lender and may not benefit from anyoff-set between the lender and the borrower.
(j) Unfunded loan commitments. The Fund may enter into certain credit agreements where all or a portion of the total amount committed may be unfunded. The Fund is obligated to fund these commitments at the borrower’s discretion. The commitments are disclosed in the accompanying Schedule of Investments. At June 30, 2019, the Fund had sufficient cash and/or securities to cover these commitments.
(k) Stripped securities. The Fund may invest in ‘‘Stripped Securities,’’ a term used collectively for components, or strips, of fixed income securities. Stripped Securities can be principal only securities (“PO”), which are debt obligations that have been stripped of unmatured interest coupons, or interest only securities (“IO”), which are unmatured interest coupons that have been stripped from debt obligations. The market value of Stripped Securities will fluctuate in response to changes in economic conditions, rates ofpre-payment, interest rates and the market’s perception of the securities. However, fluctuations in response to interest rates may be greater in Stripped Securities than for debt obligations of comparable maturities that pay interest currently. The amount of fluctuation may increase with a longer period of maturity.
The yield to maturity on IO’s is sensitive to the rate of principal repayments (including prepayments) on the related underlying debt obligation and principal payments may have a material effect on yield to maturity. If the underlying debt obligation experiences greater than anticipated prepayments of principal, the Fund may not fully recoup its initial investment in IO’s.
(l) Securities traded on a when-issued and delayed delivery basis. The Fund may trade securities on a when-issued or delayed delivery basis. In when-issued and delayed delivery transactions, the securities are purchased or sold by the Fund with payment and
| | |
| | |
| Western Asset Core Plus Bond Fund 2019 Semi-Annual Report | | 115 |
Notes to financial statements(unaudited) (cont’d)
delivery taking place in the future in order to secure what is considered to be an advantageous price and yield to the Fund at the time of entering into the transaction.
Purchasing such securities involves risk of loss if the value of the securities declines prior to settlement. These securities are subject to market fluctuations and their current value is determined in the same manner as for other securities.
(m) Securities traded on ato-be-announced basis. The Fund may trade securities on ato-be-announced (“TBA”) basis. In a TBA transaction, the Fund commits to purchasing or selling securities which have not yet been issued by the issuer and for which specific information, such as the face amount, maturity date and underlying pool of investments in U.S. government agency mortgage pass-through securities, is not announced. Securities purchased on a TBA basis are not settled until they are delivered to the Fund. Beginning on the date the Fund enters into a TBA transaction, cash, U.S. government securities or other liquid high-grade debt obligations are segregated in an amount equal in value to the purchase price of the TBA security. These securities are subject to market fluctuations and their current value is determined in the same manner as for other securities. At June 30, 2019, the Fund heldnon-cash collateral for TBA securities from Bank of America N.A., Goldman Sachs Group Inc. and Morgan Stanley & Co. Inc. in the amounts of $253,460, $131,227 and $431,385, respectively.
(n) Mortgage dollar rolls. The Fund may enter into mortgage dollar rolls in which the Fund sells mortgage-backed securities for delivery in the current month, realizing a gain or loss, and simultaneously contracts to repurchase substantially similar (same type, coupon and maturity) securities to settle on a specified future date.
The Fund executes its mortgage dollar rolls entirely in the TBA market, whereby the Fund makes a forward commitment to purchase a security and, instead of accepting delivery, the position is offset by a sale of the security with a simultaneous agreement to repurchase at a future date. The Fund accounts for mortgage dollar rolls as purchases and sales.
The risk of entering into mortgage dollar rolls is that the market value of the securities the Fund is obligated to repurchase under the agreement may decline below the repurchase price. In the event the buyer of securities under a mortgage dollar roll files for bankruptcy or becomes insolvent, the Fund’s use of the proceeds of the mortgage dollar roll may be restricted pending a determination by the counterparty, or its trustee or receiver, whether to enforce the Fund’s obligation to repurchase the securities.
(o) Inflation-indexed bonds. Inflation-indexed bonds are fixed-income securities whose principal value or interest rate is periodically adjusted according to the rate of inflation. As the index measuring inflation changes, the principal value or interest rate of inflation-indexed bonds will be adjusted accordingly. Inflation adjustments to the principal amount of inflation-indexed bonds are reflected as an increase or decrease to investment income on the Statement of Operations. Repayment of the original bond principal upon maturity (as
| | |
| | |
| 116 | | Western Asset Core Plus Bond Fund 2019 Semi-Annual Report |
adjusted for inflation) is guaranteed in the case of U.S. Treasury inflation-indexed bonds. For bonds that do not provide a similar guarantee, the adjusted principal value of the bond repaid at maturity may be less than the original principal.
(p) Foreign currency translation. Investment securities and other assets and liabilities denominated in foreign currencies are translated into U.S. dollar amounts based upon prevailing exchange rates on the date of valuation. Purchases and sales of investment securities and income and expense items denominated in foreign currencies are translated into U.S. dollar amounts based upon prevailing exchange rates on the respective dates of such transactions.
The Fund does not isolate that portion of the results of operations resulting from fluctuations in foreign exchange rates on investments from the fluctuations arising from changes in market prices of securities held. Such fluctuations are included with the net realized and unrealized gain or loss on investments.
Net realized foreign exchange gains or losses arise from sales of foreign currencies, including gains and losses on forward foreign currency contracts, currency gains or losses realized between the trade and settlement dates on securities transactions, and the difference between the amounts of dividends, interest, and foreign withholding taxes recorded on the Fund’s books and the U.S. dollar equivalent of the amounts actually received or paid. Net unrealized foreign exchange gains and losses arise from changes in the values of assets and liabilities, other than investments in securities, on the date of valuation, resulting from changes in exchange rates.
Foreign security and currency transactions may involve certain considerations and risks not typically associated with those of U.S. dollar denominated transactions as a result of, among other factors, the possibility of lower levels of governmental supervision and regulation of foreign securities markets and the possibility of political or economic instability.
(q) Credit and market risk. The Fund invests in high-yield and emerging market instruments that are subject to certain credit and market risks. The yields of high-yield and emerging market debt obligations reflect, among other things, perceived credit and market risks. The Fund’s investments in securities rated below investment grade typically involve risks not associated with higher rated securities including, among others, greater risk related to timely and ultimate payment of interest and principal, greater market price volatility and less liquid secondary market trading. The consequences of political, social, economic or diplomatic changes may have disruptive effects on the market prices of investments held by the Fund. The Fund’s investments innon-U.S. dollar denominated securities may also result in foreign currency losses caused by devaluations and exchange rate fluctuations.
Investments in securities that are collateralized by real estate mortgages are subject to certain credit and liquidity risks. When market conditions result in an increase in default
| | |
| | |
| Western Asset Core Plus Bond Fund 2019 Semi-Annual Report | | 117 |
Notes to financial statements(unaudited) (cont’d)
rates of the underlying mortgages and the foreclosure values of underlying real estate properties are materially below the outstanding amount of these underlying mortgages, collection of the full amount of accrued interest and principal on these investments may be doubtful. Such market conditions may significantly impair the value and liquidity of these investments and may result in a lack of correlation between their credit ratings and values.
(r) Foreign investment risks. The Fund’s investments in foreign securities may involve risks not present in domestic investments. Since securities may be denominated in foreign currencies, may require settlement in foreign currencies or pay interest or dividends in foreign currencies, changes in the relationship of these foreign currencies to the U.S. dollar can significantly affect the value of the investments and earnings of the Fund. Foreign investments may also subject the Fund to foreign government exchange restrictions, expropriation, taxation or other political, social or economic developments, all of which affect the market and/or credit risk of the investments.
(s) Counterparty risk and credit-risk-related contingent features of derivative instruments. The Fund may invest in certain securities or engage in other transactions, where the Fund is exposed to counterparty credit risk in addition to broader market risks. The Fund may invest in securities of issuers, which may also be considered counterparties as trading partners in other transactions. This may increase the risk of loss in the event of default or bankruptcy by the counterparty or if the counterparty otherwise fails to meet its contractual obligations. The Fund’s subadviser attempts to mitigate counterparty risk by (i) periodically assessing the creditworthiness of its trading partners, (ii) monitoring and/or limiting the amount of its net exposure to each individual counterparty based on its assessment and (iii) requiring collateral from the counterparty for certain transactions. Market events and changes in overall economic conditions may impact the assessment of such counterparty risk by the subadviser. In addition, declines in the values of underlying collateral received may expose the Fund to increased risk of loss.
With exchange traded and centrally cleared derivatives, there is less counterparty risk to the Fund since the exchange or clearinghouse, as counterparty to such instruments, guarantees against a possible default. The clearinghouse stands between the buyer and the seller of the contract; therefore, the credit risk is limited to failure of the clearinghouse. While offset rights may exist under applicable law, the Fund does not have a contractual right of offset against a clearing broker or clearinghouse in the event of a default of the clearing broker or clearinghouse.
The Fund has entered into master agreements, such as an International Swaps and Derivatives Association, Inc. Master Agreement (“ISDA Master Agreement”) or similar agreement, with certain of its derivative counterparties that governover-the-counter derivatives and provide for general obligations, representations, agreements, collateral posting terms, netting provisions in the event of default or termination and credit related contingent features. The credit related contingent features include, but are not limited to, a percentage decrease
| | |
| | |
| 118 | | Western Asset Core Plus Bond Fund 2019 Semi-Annual Report |
in the Fund’s net assets or NAV over a specified period of time. If these credit related contingent features were triggered, the derivatives counterparty could terminate the positions and demand payment or require additional collateral.
Under an ISDA Master Agreement, the Fund may, under certain circumstances, offset with the counterparty certain derivative financial instruments’ payables and/or receivables with collateral held and/or posted and create one single net payment. However, absent an event of default by the counterparty or a termination of the agreement, the terms of the ISDA Master Agreements do not result in an offset of reported amounts of financial assets and financial liabilities in the Statement of Assets and Liabilities across transactions between the Fund and the applicable counterparty. The enforceability of the right to offset may vary by jurisdiction.
Collateral requirements differ by type of derivative. Collateral or margin requirements are set by the broker or exchange clearinghouse for exchange traded derivatives while collateral terms are contract specific forover-the-counter traded derivatives. Cash collateral that has been pledged to cover obligations of the Fund under derivative contracts, if any, will be reported separately in the Statement of Assets and Liabilities. Securities pledged as collateral, if any, for the same purpose are noted in the Schedule of Investments.
As of June 30, 2019, the Fund held OTC written options and forward foreign currency contracts with credit related contingent features which had a liability position of $62,605,651. If a contingent feature in the master agreements would have been triggered, the Fund would have been required to pay this amount to its derivatives counterparties.
At June 30, 2019, the Fund held collateral from Barclays Bank PLC, BNP Paribas SA, Citibank N.A., Goldman Sachs Group Inc. and JPMorgan Chase & Co. in the amounts of $19,801,024, $4,525,155, $38,534,883, $6,788,350 and $2,072,984, respectively. These amounts could be used to reduce the Fund’s exposure to the counterparty in the event of default.
(t) Security transactions and investment income. Security transactions are accounted for on a trade date basis. Interest income (including interest income frompayment-in-kind securities), adjusted for amortization of premium and accretion of discount, is recorded on the accrual basis. Paydown gains and losses on mortgage- and asset-backed securities are recorded as adjustments to interest income. Dividend income is recorded on theex-dividend date for dividends received in cash and/or securities. Foreign dividend income is recorded on theex-dividend date or as soon as practicable after the Fund determines the existence of a dividend declaration after exercising reasonable due diligence. The cost of investments sold is determined by use of the specific identification method. To the extent any issuer defaults or a credit event occurs that impacts the issuer, the Fund may halt any additional interest income accruals and consider the realizability of interest accrued up to the date of default or credit event.
| | |
| | |
| Western Asset Core Plus Bond Fund 2019 Semi-Annual Report | | 119 |
Notes to financial statements(unaudited) (cont’d)
(u) Distributions to shareholders. Distributions from net investment income of the Fund are declared each business day to shareholders of record and are paid monthly. Distributions of net realized gains, if any, are declared at least annually. Distributions to shareholders of the Fund are recorded on theex-dividend date and are determined in accordance with income tax regulations, which may differ from GAAP.
(v) Share class accounting. Investment income, common expenses and realized/ unrealized gains (losses) on investments are allocated to the various classes of the Fund on the basis of daily net assets of each class. Fees relating to a specific class are charged directly to that share class.
(w) Compensating balance arrangements. The Fund has an arrangement with its custodian bank whereby a portion of the custodian’s fees is paid indirectly by credits earned on the Fund’s cash on deposit with the bank.
(x) Federal and other taxes. It is the Fund’s policy to comply with the federal income and excise tax requirements of the Internal Revenue Code of 1986 (the “Code”), as amended, applicable to regulated investment companies. Accordingly, the Fund intends to distribute its taxable income and net realized gains, if any, to shareholders in accordance with timing requirements imposed by the Code. Therefore, no federal or state income tax provision is required in the Fund’s financial statements.
Management has analyzed the Fund’s tax positions taken on income tax returns for all open tax years and has concluded that as of December 31, 2018, no provision for income tax is required in the Fund’s financial statements. The Fund’s federal and state income and federal excise tax returns for tax years for which the applicable statutes of limitations have not expired are subject to examination by the Internal Revenue Service and state departments of revenue.
(y) Reclassification. GAAP requires that certain components of net assets be reclassified to reflect permanent differences between financial and tax reporting. These reclassifications have no effect on net assets or net asset value per share.
2. Investment management agreement and other transactions with affiliates
Legg Mason Partners Fund Advisor, LLC (“LMPFA”) is the Fund’s investment manager. Western Asset Management Company, LLC (“Western Asset”), Western Asset Management Company Limited in London (“Western Asset London”), Western Asset Management Company Pte. Ltd. in Singapore (“Western Asset Singapore”) and Western Asset Management Company Ltd in Japan (“Western Asset Japan”) are the Fund’s subadvisers. LMPFA, Western Asset, Western Asset London, Western Asset Singapore and Western Asset Japan are wholly-owned subsidiaries of Legg Mason, Inc. (“Legg Mason”).
LMPFA provides the Fund with management and administrative services for which the Fund pays a fee, calculated daily and paid monthly, at an annual rate of 0.450% of the Fund’s
| | |
| | |
| 120 | | Western Asset Core Plus Bond Fund 2019 Semi-Annual Report |
average daily net assets up to $500 million, 0.425% of the average daily net assets of the next $500 million and 0.400% of the Fund’s average daily net assets in excess of $1 billion. For their services, LMPFA pays Western Asset, Western Asset London, Western Asset Singapore and Western Asset Japan monthly all of the management fee that it receives from the Fund.
LMPFA has agreed to waive fees and/or reimburse operating expenses, other than interest, brokerage commissions, taxes, extraordinary expenses, deferred organizational expenses and acquired fund fees and expenses, so that the ratio of total annual fund operating expenses did not exceed 0.82%, 1.65%, 1.51%, 0.85%, 1.15%, 0.45% and 0.45% for Class A, Class C, Class C1, Class FI, Class R, Class I and Class IS shares, respectively. In addition, the ratio of total annual fund operating expenses for Class IS shares did not exceed the ratio of total annual fund operating expenses for Class I shares. These arrangements cannot be terminated prior to December 31, 2020 without the Board of Directors’ consent.
During the six months ended June 30, 2019, fees waived and/or expenses reimbursed amounted to $5,481,764.
LMPFA is permitted to recapture amounts waived and/or reimbursed to a class within two years after the fiscal year in which LMPFA earned the fee or incurred the expense if the class’ total annual operating expenses have fallen to a level below the expense limitation (“expense cap”) in effect at the time the fees were earned or the expenses incurred. In no case will LMPFA recapture any amount that would result, on any particular business day of the Fund, in the class’ total annual operating expenses exceeding the expense cap or any other lower limit then in effect.
Pursuant to these arrangements, at June 30, 2019, the Fund had remaining fee waivers and/or expense reimbursements subject to recapture by LMPFA and respective dates of expiration as follows:
| | | | | | | | |
| | | Class A | | | Class I | |
| Expires December 31, 2019 | | $ | 240,090 | | | $ | 9,227,382 | |
| Expires December 31, 2020 | | | 171,998 | | | | 10,730,006 | |
| Expires December 31, 2021 | | | 50,165 | | | | 5,431,573 | |
| Total fee waivers/expense reimbursements subject to recapture | | $ | 462,253 | | | $ | 25,388,961 | |
For the six months ended June 30, 2019, LMPFA did not recapture any fees.
Legg Mason Investor Services, LLC (“LMIS”), a wholly-owned broker-dealer subsidiary of Legg Mason, serves as the Fund’s sole and exclusive distributor.
There is a maximum initial sales charge of 4.25% for Class A shares. There is a contingent deferred sales charge (“CDSC”) of 1.00% on Class C and Class C1 shares which applies if redemption occurs within 12 months from purchase payment. In certain cases, Class A
| | |
| | |
| Western Asset Core Plus Bond Fund 2019 Semi-Annual Report | | 121 |
Notes to financial statements(unaudited) (cont’d)
shares have a 1.00% CDSC, which applies if redemption occurs within 18 months from purchase payment. This CDSC only applies to those purchases of Class A shares, which, when combined with current holdings of other shares of funds sold by LMIS, equal or exceed $1,000,000 in the aggregate. These purchases do not incur an initial sales charge.
For the six months ended June 30, 2019, sales charges retained by and CDSCs paid to LMIS and its affiliates, if any, were as follows:
| | | | | | | | |
| | | Class A | | | Class C | |
| Sales charges | | $ | 79,999 | | | | — | |
| CDSCs | | | 5,185 | | | $ | 8,919 | |
All officers of the Corporation are employees of Legg Mason or its affiliates and do not receive compensation from the Corporation.
3. Investments
During the six months ended June 30, 2019, the aggregate cost of purchases and proceeds from sales of investments (excluding short-term investments) and U.S. Government & Agency Obligations were as follows:
| | | | | | | | |
| | | Investments | | | U.S. Government &
Agency Obligations | |
| Purchases | | $ | 2,154,611,982 | | | $ | 32,514,018,266 | |
| Sales | | | 1,259,247,986 | | | | 31,907,182,009 | |
At June 30, 2019, the aggregate cost of investments and the aggregate gross unrealized appreciation and depreciation of investments for federal income tax purposes were substantially as follows:
| | | | | | | | | | | | | | | | |
| | | Cost/Premiums
Paid (Received) | | | Gross
Unrealized
Appreciation | | | Gross
Unrealized
Depreciation | | | Net
Unrealized
Appreciation
(Depreciation) | |
| Securities | | $ | 27,752,825,178 | | | $ | 1,189,603,302 | | | $ | (400,832,581) | | | $ | 788,770,721 | |
| Swap contracts | | | 29,089,310 | | | | 119,304,658 | | | | (293,574,431) | | | | (174,269,773) | |
| Written options | | | (44,227,321) | | | | 9,473,634 | | | | (24,745,372) | | | | (15,271,738) | |
| Futures contracts | | | — | | | | 334,850,685 | | | | (122,356,324) | | | | 212,494,361 | |
| Forward foreign currency contracts | | | — | | | | 73,496,293 | | | | (30,544,676) | | | | 42,951,617 | |
| | |
| | |
| 122 | | Western Asset Core Plus Bond Fund 2019 Semi-Annual Report |
4. Derivative instruments and hedging activities
Below is a table, grouped by derivative type, that provides information about the fair value and the location of derivatives within the Statement of Assets and Liabilities at June 30, 2019.
| | | | | | | | | | | | | | | | |
| ASSET DERIVATIVES1 | |
| | | Interest
Rate Risk | | | Foreign
Exchange Risk | | | Credit
Risk | | | Total | |
| Purchased options2 | | $ | 2,024,477 | | | $ | 37,131,654 | | | | — | | | $ | 39,156,131 | |
| Futures contracts3 | | | 316,984,403 | | | | 17,866,282 | | | | — | | | | 334,850,685 | |
| OTC swap contracts4 | | | 26,215,469 | | | | — | | | $ | 579,173 | | | | 26,794,642 | |
| Centrally cleared swap contracts5 | | | 68,896,894 | | | | — | | | | 23,780,127 | | | | 92,677,021 | |
| Forward foreign currency contracts | | | — | | | | 73,496,293 | | | | — | | | | 73,496,293 | |
| Total | | $ | 414,121,243 | | | $ | 128,494,229 | | | $ | 24,359,300 | | | $ | 566,974,772 | |
| | | | | | | | | | | | | | | | |
| LIABILITY DERIVATIVES1 | |
| | | Interest
Rate Risk | | | Foreign
Exchange Risk | | | Credit
Risk | | | Total | |
| Written options | | $ | 26,016,159 | | | $ | 33,482,900 | | | | — | | | $ | 59,499,059 | |
| Futures contracts3 | | | 121,664,164 | | | | 692,160 | | | | — | | | | 122,356,324 | |
| Centrally cleared swap contracts5 | | | 292,839,114 | | | | — | | | $ | 735,317 | | | | 293,574,431 | |
| Forward foreign currency contracts | | | — | | | | 30,544,676 | | | | — | | | | 30,544,676 | |
| Total | | $ | 440,519,437 | | | $ | 64,719,736 | | | $ | 735,317 | | | $ | 505,974,490 | |
| 1 | Generally, the balance sheet location for asset derivatives is receivables/net unrealized appreciation (depreciation) and for liability derivatives is payables/net unrealized appreciation (depreciation). |
| 2 | Market value of purchased options is reported in Investments in unaffiliated securities at value in the Statement of Assets and Liabilities. |
| 3 | Includes cumulative appreciation (depreciation) of futures contracts as reported in the Schedule of Investments. Only variation margin is reported within the receivables and/or payables on the Statement of Assets and Liabilities. |
| 4 | Values include premiums paid (received) on swap contracts which are shown separately in the Statement of Assets and Liabilities. |
| 5 | Includes cumulative appreciation (depreciation) of centrally cleared swap contracts as reported in the Schedule of Investments. Only variation margin is reported within the receivables and/or payables on the Statement of Assets and Liabilities. |
| | |
| | |
| Western Asset Core Plus Bond Fund 2019 Semi-Annual Report | | 123 |
Notes to financial statements(unaudited) (cont’d)
The following tables provide information about the effect of derivatives and hedging activities on the Fund’s Statement of Operations for the six months ended June 30, 2019. The first table provides additional detail about the amounts and sources of gains (losses) realized on derivatives during the period. The second table provides additional information about the change in unrealized appreciation (depreciation) resulting from the Fund’s derivatives and hedging activities during the period.
| | | | | | | | | | | | | | | | |
| AMOUNT OF REALIZED GAIN (LOSS) ON DERIVATIVES RECOGNIZED | |
| | | Interest
Rate Risk | | | Foreign
Exchange Risk | | | Credit
Risk | | | Total | |
| Purchased options1 | | $ | (33,352,843) | | | $ | (34,548,161) | | | $ | (1,384,290) | | | $ | (69,285,294) | |
| Written options | | | 57,159,486 | | | | 12,545,707 | | | | 1,429,149 | | | | 71,134,342 | |
| Futures contracts | | | (45,646,958) | | | | 10,527,907 | | | | — | | | | (35,119,051) | |
| Swap contracts | | | (22,414,407) | | | | — | | | | 65,957,467 | | | | 43,543,060 | |
| Forward foreign currency contracts | | | — | | | | 29,959,384 | | | | — | | | | 29,959,384 | |
| Total | | $ | (44,254,722) | | | $ | 18,484,837 | | | $ | 66,002,326 | | | $ | 40,232,441 | |
| 1 | Net realized gain (loss) from purchased options is reported in net realized gain (loss) from investment transactions in unaffiliated securities in the Statement of Operations. |
| | | | | | | | | | | | | | | | |
| CHANGE IN UNREALIZED APPRECIATION (DEPRECIATION) ON DERIVATIVES RECOGNIZED | |
| | | Interest
Rate Risk | | | Foreign
Exchange Risk | | | Credit
Risk | | | Total | |
| Purchased options1 | | $ | (539,392) | | | $ | 6,292,518 | | | $ | (50,411) | | | $ | 5,702,715 | |
| Written options | | | 15,729,021 | | | | (19,638,086) | | | | (196,908) | | | | (4,105,973) | |
| Futures contracts | | | 118,755,809 | | | | 7,754,687 | | | | — | | | | 126,510,496 | |
| Swap contracts | | | (153,865,321) | | | | — | | | | 50,268,119 | | | | (103,597,202) | |
| Forward foreign currency contracts | | | — | | | | 71,451,408 | | | | — | | | | 71,451,408 | |
| Total | | $ | (19,919,883) | | | $ | 65,860,527 | | | $ | 50,020,800 | | | $ | 95,961,444 | |
| 1 | The change in unrealized appreciation (depreciation) from purchased options is reported in the change in net unrealized appreciation (depreciation) from investments in unaffiliated securities in the Statement of Operations. |
During the six months ended June 30, 2019, the volume of derivative activity for the Fund was as follows:
| | | | |
| | | Average Market
Value | |
| Purchased options | | $ | 32,942,404 | |
| Written options | | | 25,112,518 | |
| Futures contracts (to buy) | | | 29,230,320,385 | |
| Futures contracts (to sell) | | | 13,345,475,352 | |
| Forward foreign currency contracts (to buy) | | | 3,114,913,005 | |
| Forward foreign currency contracts (to sell) | | | 3,198,506,871 | |
| | |
| | |
| 124 | | Western Asset Core Plus Bond Fund 2019 Semi-Annual Report |
| | | | |
| |
| | | Average Notional
Balance | |
| Interest rate swap contracts | | $ | 13,420,013,783 | |
| Credit default swap contracts (to buy protection)† | | | 21,011,429 | |
| Credit default swap contracts (to sell protection) | | | 4,489,880,105 | |
| † | At June 30, 2019, there were no open positions held in this derivative. |
The following table presents the Fund’s OTC derivative assets and liabilities by counterparty net of amounts available for offset under an ISDA Master Agreement and net of the related collateral pledged (received) by the Fund as of June 30, 2019.
| | | | | | | | | | | | | | | | | | | | |
| Counterparty | | Gross Assets
Subject to
Master
Agreements1 | | | Gross
Liabilities
Subject to
Master
Agreements1 | | | Net Assets
(Liabilities)
Subject to
Master
Agreements | | | Collateral
Pledged
(Received)2,3 | | | Net
Amount4,5 | |
| Barclays Bank PLC | | $ | 35,913,869 | | | $ | (9,749,697) | | | $ | 26,164,172 | | | $ | (19,801,024) | | | $ | 6,363,148 | |
| BNP Paribas SA | | | 5,246,670 | | | | (2,455,596) | | | | 2,791,074 | | | | (4,525,155) | | | | (1,734,081) | |
| Citibank N.A. | | | 61,223,340 | | | | (27,707,981) | | | | 33,515,359 | | | | (38,534,883) | | | | (5,019,524) | |
| Deutsche Bank AG | | | — | | | | (1,563,622) | | | | (1,563,622) | | | | 1,490,000 | | | | (73,622) | |
| Goldman Sachs Group Inc. | | | 27,438,276 | | | | (21,058,167) | | | | 6,380,109 | | | | (6,788,350) | | | | (408,241) | |
| JPMorgan Chase & Co. | | | 4,208,459 | | | | (70,588) | | | | 4,137,871 | | | | (2,072,984) | | | | 2,064,887 | |
| Total | | $ | 134,030,614 | | | $ | (62,605,651) | | | $ | 71,424,963 | | | $ | (70,232,396) | | | $ | 1,192,567 | |
| 1 | Absent an event of default or early termination, derivative assets and liabilities are presented gross and not offset in the Statement of Assets and Liabilities. |
| 2 | Gross amounts are not offset in the Statement of Assets and Liabilities. |
| 3 | In some instances, the actual collateral received and/or pledged may be more than the amount shown here due to overcollateralization. |
| 4 | Net amount may also include forward foreign currency exchange contracts that are not required to be collateralized. |
| 5 | Represents the net amount receivable (payable) from (to) the counterparty in the event of default. |
5. Class specific expenses, waivers and/or expense reimbursements
The Fund has adopted a Rule12b-1 shareholder services and distribution plan and under that plan the Fund pays service and/or distribution fees with respect to its Class A, Class C, Class C1, Class FI and Class R shares calculated at the annual rate of 0.25%, 1.00%, 0.70%, 0.25% and 0.50% of the average daily net assets of each class, respectively. Service and/or distribution fees are accrued daily and paid monthly.
| | |
| | |
| Western Asset Core Plus Bond Fund 2019 Semi-Annual Report | | 125 |
Notes to financial statements(unaudited) (cont’d)
For the six months ended June 30, 2019, class specific expenses were as follows:
| | | | | | | | |
| | | Service and/or
Distribution Fees | | | Transfer Agent
Fees | |
| Class A | | $ | 1,354,601 | † | | $ | 874,579 | |
| Class C | | | 1,013,914 | | | | 99,544 | |
| Class C1 | | | 36,347 | | | | 5,839 | |
| Class FI | | | 456,826 | † | | | 303,179 | |
| Class R | | | 626,849 | | | | 245,453 | |
| Class I | | | — | | | | 8,140,733 | |
| Class IS | | | — | | | | 50,681 | |
| Total | | $ | 3,488,537 | | | $ | 9,720,008 | |
| † | Amount shown is exclusive of expense reimbursements. For the six months ended June 30, 2019, the service and/or distribution fees reimbursed amounted to $22 and $4 for Class A and Class FI shares, respectively. |
For the six months ended June 30, 2019, waivers and/or expense reimbursements by class were as follows:
| | | | |
| | | Waivers/Expense
Reimbursements | |
| Class A | | $ | 50,187 | |
| Class C | | | — | |
| Class C1 | | | — | |
| Class FI | | | 4 | |
| Class R | | | — | |
| Class I | | | 5,431,573 | |
| Class IS | | | — | |
| Total | | $ | 5,481,764 | |
6. Distributions to shareholders by class
| | | | | | | | |
| | | Six Months Ended
June 30, 2019 | | | Year Ended
December 31, 2018 | |
| Net Investment Income: | | | | | | | | |
| Class A | | $ | 18,187,707 | | | $ | 32,594,313 | |
| Class C | | | 2,698,189 | | | | 5,278,842 | |
| Class C1 | | | 151,443 | | | | 486,386 | |
| Class FI | | | 6,099,344 | | | | 13,233,645 | |
| Class R | | | 3,839,560 | | | | 6,556,069 | |
| Class I | | | 301,010,635 | | | | 543,699,756 | |
| Class IS | | | 126,732,805 | | | | 212,788,415 | |
| Total | | $ | 458,719,683 | | | $ | 814,637,426 | |
| | |
| | |
| 126 | | Western Asset Core Plus Bond Fund 2019 Semi-Annual Report |
| | | | | | | | |
| | | Six Months Ended
June 30, 2019 | | | Year Ended
December 31, 2018 | |
| | |
| Net Realized Gains: | | | | | | | | |
| Class A | | | — | | | $ | 4,960,005 | |
| Class C | | | — | | | | 1,028,494 | |
| Class C1 | | | — | | | | 84,696 | |
| Class FI | | | — | | | | 2,034,129 | |
| Class R | | | — | | | | 1,064,801 | |
| Class I | | | — | | | | 72,533,084 | |
| Class IS | | | — | | | | 27,242,804 | |
| Total | | | — | | | $ | 108,948,013 | |
7. Capital Shares
At June 30, 2019, the Corporation had 42.7 billion shares of capital stock authorized with a par value of $0.001 per share. Transactions in shares of each class were as follows:
| | | | | | | | | | | | | | | | |
| | | Six Months Ended
June 30, 2019 | | | Year Ended
December 31, 2018 | |
| | | Shares | | | Amount | | | Shares | | | Amount | |
| Class A | | | | | | | | | | | | | | | | |
| Shares sold | | | 19,887,174 | | | $ | 229,069,167 | | | | 38,615,336 | | | $ | 439,567,825 | |
| Shares issued on reinvestment | | | 1,162,598 | | | | 13,480,000 | | | | 2,457,480 | | | | 27,772,857 | |
| Shares repurchased | | | (14,783,808) | | | | (170,184,662) | | | | (32,773,031) | | | | (370,658,684) | |
| Net increase | | | 6,265,964 | | | $ | 72,364,505 | | | | 8,299,785 | | | $ | 96,681,998 | |
| | | | |
| Class C | | | | | | | | | | | | | | | | |
| Shares sold | | | 2,711,558 | | | $ | 31,335,228 | | | | 5,085,468 | | | $ | 58,147,327 | |
| Shares issued on reinvestment | | | 174,741 | | | | 2,028,586 | | | | 425,468 | | | | 4,816,139 | |
| Shares repurchased | | | (2,495,995) | | | | (28,767,511) | | | | (6,253,809) | | | | (70,658,444) | |
| Net increase (decrease) | | | 390,304 | | | $ | 4,596,303 | | | | (742,873) | | | $ | (7,694,978) | |
| | | | |
| Class C1 | | | | | | | | | | | | | | | | |
| Shares sold | | | 5,843 | | | $ | 66,809 | | | | 80,212 | | | $ | 897,928 | |
| Shares issued on reinvestment | | | 12,571 | | | | 145,349 | | | | 49,222 | | | �� | 557,714 | |
| Shares repurchased | | | (673,211) | | | | (7,737,773) | | | | (737,049) | | | | (8,338,247) | |
| Net decrease | | | (654,797) | | | $ | (7,525,615) | | | | (607,615) | | | $ | (6,882,605) | |
| | | | |
| Class FI | | | | | | | | | | | | | | | | |
| Shares sold | | | 4,759,245 | | | $ | 54,833,751 | | | | 11,413,961 | | | $ | 130,365,716 | |
| Shares issued on reinvestment | | | 521,099 | | | | 6,046,199 | | | | 1,337,820 | | | | 15,149,672 | |
| Shares repurchased | | | (5,268,882) | | | | (60,640,239) | | | | (18,219,797) | | | | (205,651,254) | |
| Net increase (decrease) | | | 11,462 | | | $ | 239,711 | | | | (5,468,016) | | | $ | (60,135,866) | |
| | |
| | |
| Western Asset Core Plus Bond Fund 2019 Semi-Annual Report | | 127 |
Notes to financial statements(unaudited) (cont’d)
| | | | | | | | | | | | | | | | |
| | | Six Months Ended
June 30, 2019 | | | Year Ended
December 31, 2018 | |
| | | Shares | | | Amount | | | Shares | | | Amount | |
| | | | |
| Class R | | | | | | | | | | | | | | | | |
| Shares sold | | | 2,129,463 | | | $ | 24,516,973 | | | | 6,575,693 | | | $ | 74,707,665 | |
| Shares issued on reinvestment | | | 321,042 | | | | 3,720,447 | | | | 637,538 | | | | 7,196,264 | |
| Shares repurchased | | | (1,724,262) | | | | (19,752,714) | | | | (3,528,335) | | | | (39,898,014) | |
| Net increase | | | 726,243 | | | $ | 8,484,706 | | | | 3,684,896 | | | $ | 42,005,915 | |
| | | | |
| Class I | | | | | | | | | | | | | | | | |
| Shares sold | | | 277,580,792 | | | $ | 3,204,359,971 | | | | 592,864,725 | | | $ | 6,740,991,507 | |
| Shares issued on reinvestment | | | 22,449,404 | | | | 260,525,757 | | | | 46,980,763 | | | | 531,525,916 | |
| Shares repurchased | | | (184,707,853) | | | | (2,126,844,107) | | | | (513,386,605) | | | | (5,797,832,906) | |
| Net increase | | | 115,322,343 | | | $ | 1,338,041,621 | | | | 126,458,883 | | | $ | 1,474,684,517 | |
| | | | |
| Class IS | | | | | | | | | | | | | | | | |
| Shares sold | | | 105,209,193 | | | $ | 1,213,831,122 | | | | 205,891,595 | | | $ | 2,337,942,742 | |
| Shares issued on reinvestment | | | 9,464,515 | | | | 109,842,121 | | | | 18,814,668 | | | | 212,731,943 | |
| Shares repurchased | | | (48,042,455) | | | | (552,518,852) | | | | (122,278,177) | | | | (1,377,182,941) | |
| Net increase | | | 66,631,253 | | | $ | 771,154,391 | | | | 102,428,086 | | | $ | 1,173,491,744 | |
8. Transactions with affiliated companies
As defined by the 1940 Act, an affiliated company is one in which the Fund owns 5% or more of the outstanding voting securities, or a company which is under common ownership or control. The Fund may invest in Western Asset Government Cash Management Portfolio, LLC (“Cash Management Portfolio”), an affiliated private money market fund managed by Western Asset, the Fund’s subadviser. Cash Management Portfolio is available as a cash management vehicle for certain proprietary investment companies affiliated with Legg Mason. While Cash Management Portfolio is not a registered money market fund, it conducts all of its investment activities in accordance with the requirements of Rule2a-7 under the 1940 Act. Based on the Fund’s relative ownership, the following companies were considered affiliated companies for all or some portion of the six months ended June 30, 2019. The following transactions were effected in shares of such companies for the six months ended June 30, 2019.
| | | | | | | | | | | | | | | | | | | | | | | | | | | | | | | | |
| | | Affiliate
Value at
December 31,
2018 | | | | | | | | | Realized
Gain (Loss) | | Interest
Income | | | Net Increase
(Decrease) in
Unrealized
Appreciation
(Depreciation) | | Affiliate
Value at
June 30,
2019 | |
| | | Purchased | | | Sold | |
| | | Cost | | | Shares | | | Cost | | | Shares | |
| Western Asset Government Cash Management Portfolio LLC | | $ | 845,554,311 | | | $ | 4,772,803,559 | | | | 4,772,803,559 | | | $ | 4,770,700,000 | | | | 4,770,700,000 | | | — | | $ | 10,759,326 | | | — | | $ | 847,657,870 | |
| | |
| | |
| 128 | | Western Asset Core Plus Bond Fund 2019 Semi-Annual Report |
9. Redemption facility
The Fund and certain other participating funds within the Corporation (the “Participating Funds”) have available an unsecured revolving credit facility (the “Redemption Facility”) from the lenders and The Bank of New York Mellon (“BNY Mellon”), as administrative agent for the lenders. The Redemption Facility is to be used for temporary or emergency purposes as an additional source of liquidity to fund redemptions of shares. Under the agreement, BNY Mellon provides a364-day revolving credit facility, in the aggregate amount of $265 million. Unless renewed, the agreement will terminate on November 18, 2019. Any borrowings under the Redemption Facility will bear interest at current market rates as set forth in the credit agreement. The annual commitment fee to maintain the Redemption Facility is 0.10% and is incurred on the unused portion of the facility and is allocated to all Participating Funds pro rata based on net assets. For the six months ended June 30, 2019, the Fund incurred a commitment fee in the amount of $83,843. The Fund did not utilize the Redemption Facility during the six months ended June 30, 2019.
10. Deferred capital losses
As of December 31, 2018, the Fund had deferred capital losses of $318,659,766, which have no expiration date, that will be available to offset future taxable capital gains.
11. Recent accounting pronouncement
The Fund has adopted the disclosure provisions of the Financial Accounting Standards Board Accounting Standards UpdateNo. 2018-13,Fair Value Measurement (Topic 820)— Disclosure Framework—Changes to the Disclosure Requirements for Fair Value Measurement(“ASU2018-13”) which introduces new fair value disclosure requirements as well as eliminates and modifies certain existing fair value disclosure requirements.ASU 2018-13 would be effective for fiscal years beginning after December 15, 2019, and interim periods within those fiscal years; however, management has elected to early adopt ASU2018-13. The impact of the Fund’s adoption was limited to changes in the Fund’s financial statement disclosures regarding fair value, primarily those disclosures related to transfers between levels of the fair value hierarchy.
| | |
| | |
| Western Asset Core Plus Bond Fund 2019 Semi-Annual Report | | 129 |
Western Asset
Core Plus Bond Fund
Directors
Robert Abeles, Jr
Anita L. DeFrantz
Ronald L. Olson
Avedick B. Poladian
William E.B. Siart
Chairman
Jaynie M. Studenmund
Investment manager
Legg Mason Partners Fund Advisor, LLC
Subadvisers
Western Asset Management Company, LLC
Western Asset Management Company Limited
Western Asset Management Company Ltd
Western Asset Management Company Pte. Ltd.
Distributor
Legg Mason Investor Services, LLC
Transfer Agent
BNY Mellon Investment Servicing (US) Inc.
4400 Computer Drive
Westborough, MA 01581
Custodian
The Bank of New York Mellon
Independent registered public accounting firm
Pricewaterhouse Coopers LLP Baltimore, MD
Western Asset Core Plus Bond Fund
The Fund is a separate investment series of Western Asset Funds, Inc.
Western Asset Core Plus Bond Fund
Legg Mason Funds
620 Eighth Avenue, 49th Floor
New York, NY 10018
The Fund files its complete schedule of portfolio holdings with the Securities and Exchange Commission (“SEC”) for the first and third quarters of each fiscal year as an exhibit to its reports on FormN-PORT. Previously, the Fund filed a complete schedule of portfolio holdings with the SEC for the first and third quarters of each fiscal year onForm N-Q. The Fund’sForms N-PORT andN-Q are available on the SEC’s website at www.sec.gov. To obtain information on FormsN-PORT andN-Q, shareholders can call the Fund at1-877-721-1926.
Information on how the Fund voted proxies relating to portfolio securities during the prior12-month period ended June 30th of each year and a description of the policies and procedures that the Fund uses to determine how to vote proxies related to portfolio transactions are available (1) without charge, upon request, by calling the Fund at1-877-721-1926, (2) at www.leggmason.com/mutualfunds and (3) on the SEC’s website at www.sec.gov.
This report is submitted for the general information of the shareholders of Western Asset Core Plus Bond Fund. This report is not authorized for distribution to prospective investors in the Fund unless preceded or accompanied by a current prospectus.
Investors should consider the Fund’s investment objectives, risks, charges and expenses carefully before investing. The prospectus contains this and other important information about the Fund. Please read the prospectus carefully before investing.
www.leggmason.com
© 2019 Legg Mason Investor Services, LLC
Member FINRA, SIPC
Legg Mason Funds Privacy and Security Notice
Your Privacy and the Security of Your Personal Information is Very Important to the Legg Mason Funds
This Privacy and Security Notice (the “Privacy Notice”) addresses the Legg Mason Funds’ privacy and data protection practices with respect to nonpublic personal information the Funds receive. The Legg Mason Funds include any funds sold by the Funds’ distributor, Legg Mason Investor Services, LLC, as well as Legg Mason-sponsoredclosed-end funds. The provisions of this Privacy Notice apply to your information both while you are a shareholder and after you are no longer invested with the Funds.
The Type of Nonpublic Personal Information the Funds Collect About You
The Funds collect and maintain nonpublic personal information about you in connection with your shareholder account. Such information may include, but is not limited to:
| • | | Personal information included on applications or other forms; |
| • | | Account balances, transactions, and mutual fund holdings and positions; |
| • | | Bank account information, legal documents, and identity verification documentation; |
| • | | Online account access user IDs, passwords, security challenge question responses; and |
| • | | Information received from consumer reporting agencies regarding credit history and creditworthiness (such as the amount of an individual’s total debt, payment history, etc.). |
How the Funds Use Nonpublic Personal Information About You
The Funds do not sell or share your nonpublic personal information with third parties or with affiliates for their marketing purposes, or with other financial institutions or affiliates for joint marketing purposes, unless you have authorized the Funds to do so. The Funds do not disclose any nonpublic personal information about you except as may be required to perform transactions or services you have authorized or as permitted or required by law. The Funds may disclose information about you to:
| • | | Employees, agents, and affiliates on a “need to know” basis to enable the Funds to conduct ordinary business or to comply with obligations to government regulators; |
| • | | Service providers, including the Funds’ affiliates, who assist the Funds as part of the ordinary course of business (such as printing, mailing services, or processing or servicing your account with us) or otherwise perform services on the Funds’ behalf, including companies that may perform statistical analysis, market research and marketing services solely for the Funds; |
| • | | Permit access to transfer, whether in the United States or countries outside of the United States to such Funds’ employees, agents and affiliates and service providers as required to enable the Funds to conduct ordinary business, or to comply with obligations to government regulators; |
| • | | The Funds’ representatives such as legal counsel, accountants and auditors to enable the Funds to conduct ordinary business, or to comply with obligations to government regulators; |
| • | | Fiduciaries or representatives acting on your behalf, such as an IRA custodian or trustee of a grantor trust. |
|
| NOT PART OF THE SEMI-ANNUAL REPORT |
Legg Mason Funds Privacy and Security Notice (cont’d)
Except as otherwise permitted by applicable law, companies acting on the Funds’ behalf, including those outside the United States, are contractually obligated to keep nonpublic personal information the Funds provide to them confidential and to use the information the Funds share only to provide the services the Funds ask them to perform.
The Funds may disclose nonpublic personal information about you when necessary to enforce their rights or protect against fraud, or as permitted or required by applicable law, such as in connection with a law enforcement or regulatory request, subpoena, or similar legal process. In the event of a corporate action or in the event a Fund service provider changes, the Funds may be required to disclose your nonpublic personal information to third parties. While it is the Funds’ practice to obtain protections for disclosed information in these types of transactions, the Funds cannot guarantee their privacy policy will remain unchanged.
Keeping You Informed of the Funds’ Privacy and Security Practices
The Funds will notify you annually of their privacy policy as required by federal law. While the Funds reserve the right to modify this policy at any time they will notify you promptly if this privacy policy changes.
The Funds’ Security Practices
The Funds maintain appropriate physical, electronic and procedural safeguards designed to guard your nonpublic personal information. The Funds’ internal data security policies restrict access to your nonpublic personal information to authorized employees, who may use your nonpublic personal information for Fund business purposes only.
Although the Funds strive to protect your nonpublic personal information, they cannot ensure or warrant the security of any information you provide or transmit to them, and you do so at your own risk. In the event of a breach of the confidentiality or security of your nonpublic personal information, the Funds will attempt to notify you as necessary so you can take appropriate protective steps. If you have consented to the Funds using electronic communications or electronic delivery of statements, they may notify you under such circumstances using the most current email address you have on record with them.
In order for the Funds to provide effective service to you, keeping your account information accurate is very important. If you believe that your account information is incomplete, not accurate or not current, if you have questions about the Funds’ privacy practices, or our use of your nonpublic personal information, write the Funds using the contact information on your account statements, email the Funds by clicking on the Contact Us section of the Funds’ website at www.leggmason.com, or contact the Funds at1-877-721-1926.
Revised April 2018
|
| NOT PART OF THE SEMI-ANNUAL REPORT |
Western Asset Management Company, LLC
Legg Mason, Inc. Subsidiaries
www.leggmason.com
© 2019 Legg Mason Investor Services, LLC Member FINRA, SIPC
WASX012826 8/19 SR19-3692
| | |
| ITEM 2. | | CODE OF ETHICS. |
| |
| | Not applicable. |
| |
| ITEM 3. | | AUDIT COMMITTEE FINANCIAL EXPERT. |
| |
| | Not applicable. |
| |
| ITEM 4. | | PRINCIPAL ACCOUNTANT FEES AND SERVICES. |
| |
| | Not applicable. |
| |
| ITEM 5. | | AUDIT COMMITTEE OF LISTED REGISTRANTS. |
| |
| | Not applicable. |
| |
| ITEM 6. | | SCHEDULE OF INVESTMENTS. |
| |
| | Included herein under Item 1. |
| |
| ITEM 7. | | DISCLOSURE OF PROXY VOTING POLICIES AND PROCEDURES FORCLOSED-END MANAGEMENT INVESTMENT COMPANIES. |
| |
| | Not applicable. |
| |
| ITEM 8. | | PORTFOLIO MANAGERS OFCLOSED-END MANAGEMENT INVESTMENT COMPANIES. |
| |
| | Not applicable. |
| |
| ITEM 9. | | PURCHASES OF EQUITY SECURITIES BYCLOSED-END MANAGEMENT INVESTMENT COMPANY AND AFFILIATED PURCHASERS. |
| |
| | Not applicable. |
| |
| ITEM 10. | | SUBMISSION OF MATTERS TO A VOTE OF SECURITY HOLDERS. |
| |
| | Not applicable. |
| |
| ITEM 11. | | CONTROLS AND PROCEDURES. |
| |
| | (a) The registrant’s principal executive officer and principal financial officer have concluded that the registrant’s disclosure controls and procedures (as defined in Rule30a- 3(c) under the Investment Company Act of 1940, as amended (the “1940 Act”)) are effective as of a date within 90 days of the filing date of this report that includes the disclosure required by this paragraph, based on their evaluation of the disclosure controls and procedures required by Rule30a-3(b) under the 1940 Act and15d-15(b) under the Securities Exchange Act of 1934. |
| |
| | (b) There were no changes in the registrant’s internal control over financial reporting (as defined in Rule30a-3(d) under the 1940 Act) that occurred during the second fiscal quarter of the period covered by this report that have materially affected, or are likely to materially affect the registrant’s internal control over financial reporting. |
| | |
| ITEM 12. | | DISCLOSURE OF SECURITIES LENDING ACTIVITIES FORCLOSED-END MANAGEMENT INVESTMENT COMPANIES. |
| |
| | Not applicable |
| |
| ITEM 13. | | EXHIBITS. |
| |
| | (a) (1) Not applicable. |
| |
| | Exhibit 99.CODE ETH |
| |
| | (a) (2) Certifications pursuant to section 302 of the Sarbanes-Oxley Act of 2002 attached hereto. |
| | Exhibit 99.CERT |
| |
| | (b) Certifications pursuant to Section 906 of the Sarbanes-Oxley Act of 2002 attached hereto. |
| | Exhibit 99.906CERT |
SIGNATURES
Pursuant to the requirements of the Securities Exchange Act of 1934 and the Investment Company Act of 1940, the registrant has duly caused this Report to be signed on its behalf by the undersigned, there unto duly authorized.
| | |
| Western Asset Funds, Inc. |
| |
| By: | | /s/ Jane Trust |
| | Jane Trust |
| | Chief Executive Officer |
| |
| Date: | | August 27, 2019 |
Pursuant to the requirements of the Securities Exchange Act of 1934 and the Investment Company Act of 1940, this report has been signed below by the following persons on behalf of the registrant and in the capacities and on the dates indicated.
| | |
| By: | | /s/ Jane Trust |
| | Jane Trust |
| | Chief Executive Officer |
| |
| Date: | | August 27, 2019 |
| |
| By: | | /s/ Richard F. Sennett |
| | Richard F. Sennett |
| | Principal Financial Officer |
| |
| Date: | | August 27, 2019 |