UNITED STATES
SECURITIES AND EXCHANGE COMMISSION
Washington, D.C. 20549
FORMN-CSR
CERTIFIED SHAREHOLDER REPORT OF REGISTERED
MANAGEMENT INVESTMENT COMPANIES
Investment Company Act file number811-06110
Western Asset Funds, Inc.
(Exact name of registrant as specified in charter)
620 Eighth Avenue, 49th Floor, New York, NY 10018
(Address of principal executive offices) (Zip code)
Robert I. Frenkel, Esq.
Legg Mason & Co., LLC
100 First Stamford Place
Stamford, CT 06902
(Name and address of agent for service)
Registrant’s telephone number, including area code:1-877-721-1926
Date of fiscal year end: December 31
Date of reporting period: December 31, 2019
| ITEM 1. | REPORT TO STOCKHOLDERS. |
TheAnnual Report to Stockholders is filed herewith.

| | |
| Annual Report | | December 31, 2019 |
WESTERN ASSET
INFLATION INDEXED PLUS
BOND FUND
Beginning in January 2021, as permitted by regulations adopted by the Securities and Exchange Commission, the Fund intends to no longer mail paper copies of the Fund’s shareholder reports like this one, unless you specifically request paper copies of the reports from the Fund or from your Service Agent or financial intermediary (such as a broker-dealer or bank). Instead, the reports will be made available on a website, and you will be notified by mail each time a report is posted and provided with a website link to access the report.
If you already elected to receive shareholder reports electronically(“e-delivery”), you will not be affected by this change and you need not take any action. If you have not already electede-delivery, you may elect to receive shareholder reports and other communications from the Fund electronically by contacting your Service Agent or, if you are a direct shareholder with the Fund, by calling1-877-721-1926.
You may elect to receive all future reports in paper free of charge. If you invest through a Service Agent, you can contact your Service Agent to request that you continue to receive paper copies of your shareholder reports. That election will apply to all Legg Mason Funds held in your account at that Service Agent. If you are a direct shareholder with the Fund, you can call the Fund at1-877-721-1926, or write to the Fund by regular mail at Legg Mason Funds, P.O. Box 9699, Providence, RI 02940-9699 or by express, certified or registered mail to Legg Mason Funds, 4400 Computer Drive, Westborough, MA 01581 to let the Fund know you wish to continue receiving paper copies of your shareholder reports. That election will apply to all Legg Mason Funds held in your account held directly with the fund complex.

|
| INVESTMENT PRODUCTS: NOT FDIC INSURED • NO BANK GUARANTEE • MAY LOSE VALUE |
Fund objective
The Fund seeks to maximize total return, consistent with preservation of capital.
Letter from the president

Dear Shareholder,
We are pleased to provide the annual report of Western Asset Inflation Indexed Plus Bond Fund for the twelve-month reporting period ended December 31, 2019. Please read on for a detailed look at prevailing economic and market conditions during the Fund’s reporting period and to learn how those conditions have affected Fund performance.
As always, we remain committed to providing you with excellent service and a full spectrum of investment choices. We also remain committed to supplementing the support you receive from your financial advisor. One way we accomplish this is through our website, www.leggmason.com. Here you can gain immediate access to market and investment information, including:
| • | | Fund prices and performance, |
| • | | Market insights and commentaries from our portfolio managers, and |
| • | | A host of educational resources. |
We look forward to helping you meet your financial goals.
Sincerely,

Jane Trust, CFA
President and Chief Executive Officer
January 31, 2020
| | |
II | | Western Asset Inflation Indexed Plus Bond Fund |
Fund overview
Q. What is the Fund’s investment strategy?
A.The Fund’s investment objective is to maximize total return, consistent with preservation of capital. Under normal market conditions, the Fund invests at least 80% of its net assets in inflation-indexed fixed income securities and at least 70% of its net assets in U.S. Treasury Inflation Protected Securities (“TIPS”)i. Fundamental investment techniques are used to select issues. Although the Fund may invest in securities of any maturity, the Fund will normally maintain a dollar-weighted average effective durationii, as estimated by the Fund’s subadvisers, within three years of that of its benchmark, the Bloomberg Barclays U.S. Treasury Inflation-Linked Bond Indexiii. The Fund is expected to maintain a dollar-weighted average credit quality of at least A/A.
The Fund may sell protection in connection with credit default swaps relating to corporate debt securities. It is currently expected that the notional amount of the credit default swaps will not exceed 40% of the Fund’s net assets, although such exposure may exceed 40% from time to time.
The Fund may also enter into various exchange-traded andover-the-counter derivative transactions for both hedging andnon-hedging purposes, including for purposes of enhancing returns. These derivative transactions include, but are not limited to, futures, options, swaps, foreign currency futures and forwards.
In particular, the Fund may use interest rate swaps, credit default swaps (including buying and selling credit default swaps on individual securities and/or baskets of securities), options (including options on credit default swaps) and futures contracts to a significant extent, although the amounts invested in these instruments may change from time to time. Other instruments may also be used to a significant extent from time to time.
At Western Asset Management Company, LLC (“Western Asset”), the Fund’s subadviser, we utilize a fixed income team approach, with decisions derived from interaction among various investment management sector specialists. The sector teams are comprised of Western Asset’s senior portfolio management personnel, research analysts and anin-house economist. Under this team approach, management of client fixed income portfolios will reflect a consensus of interdisciplinary views within the Western Asset organization.
Q. What were the overall market conditions during the Fund’s reporting period?
A.Fixed income markets generally posted strong results over the twelve-month reporting period ended December 31, 2019. Spread sectors(non-Treasuries) largely outperformed Treasuries, but experienced periods of volatility. This was due to a number of factors, including moderating global growth, a “dovish pivot” by the Federal Reserve Board (the “Fed”)iv, the trade conflict between the U.S. and China, uncertainties surrounding Brexit and numerous other geopolitical issues.
Both short- and long-term U.S. Treasury yields declined during the reporting period. The yield for thetwo-year Treasury note began the reporting period at 2.48% and ended the period at 1.58%. The low for the period was 1.39% on October 3, 2019 and the high for the
| | |
| Western Asset Inflation Indexed Plus Bond Fund 2019 Annual Report | | 1 |
Fund overview (cont’d)
period of 2.62% occurred on January 18, 2019. The yield for theten-year Treasury began the reporting period at 2.69% and ended the period at 1.92%. The low for the period was 1.47% on August 28, September 3 and September 4, 2019, and the high for the period of 2.79% occurred on January 18, 2019. All told, the Bloomberg Barclays U.S. Aggregate Indexv, returned 8.72% for the twelve months ended December 31, 2019.
Inflation was generally well contained during the reporting period. For the twelve months ended December 31, 2019, the seasonally unadjusted rate of inflation, as measured by the Consumer Price Index for All Urban Consumers(“CPI-U”)vi, was 2.3%. TheCPI-U less food and energy was also 2.3% over the same time frame. U.S. TIPS generated strong results for the reporting period, as the Bloomberg Barclays U.S. Treasury Inflation-Linked Bond Index returned 8.43%.
Q. How did we respond to these changing market conditions?
A.A number of adjustments were made to the Fund during the reporting period. We increased the Fund’s allocations to emerging market sovereigns, as well as the Fund’s cash position. In contrast, we pared the Fund’s TIPS exposure.
The Fund used U.S. Treasury and Eurobond futures to manage its durationvii and yield curveviii exposure. Overall, the use of derivatives detracted based on realized/unrealized accounting gains. To a much lesser extent, the Fund also used currency forwards, which did not meaningfully impact performance.
Performance review
For the twelve months ended December 31, 2019, Class I shares of Western Asset Inflation Indexed Plus Bond Fund returned 9.79%. The Fund’s unmanaged benchmark, the Bloomberg Barclays U.S. Treasury Inflation-Linked Bond Index, returned 8.43% for the same period. The Lipper Inflation Protected Bond Funds Category Averageix returned 7.39% over the same time frame.
| | | | | | | | |
Performance Snapshotas of December 31, 2019
(unaudited) | |
| (excluding sales charges) | | 6 months | | | 12 months | |
| Western Asset Inflation Indexed Plus Bond Fund: | | | | | | | | |
Class A | | | 2.49 | % | | | 9.37 | % |
Class C | | | 2.16 | % | | | 8.63 | % |
Class C1 | | | 2.46 | % | | | 8.95 | % |
Class FI | | | 2.57 | % | | | 9.48 | % |
Class R | | | 2.31 | % | | | 8.99 | % |
Class I | | | 2.75 | % | | | 9.79 | % |
Class IS | | | 2.77 | % | | | 9.93 | % |
| Bloomberg Barclays U.S. Treasury Inflation-Linked Bond Index | | | 2.15 | % | | | 8.43 | % |
| Lipper Inflation Protected Bond Funds Category Average | | | 1.81 | % | | | 7.39 | % |
| | |
2 | | Western Asset Inflation Indexed Plus Bond Fund 2019 Annual Report |
The performance shown represents past performance. Past performance is no guarantee of future results and current performance may be higher or lower than the performance shown above. Principal value, investment returns and yields will fluctuate and investors’ shares, when redeemed, may be worth more or less than their original cost. To obtain performance data current to the most recentmonth-end, please visit our website at www.leggmason.com/mutualfunds.
All share class returns assume the reinvestment of all distributions at net asset value and the deduction of all Fund expenses. Returns have not been adjusted to include sales charges that may apply or the deduction of taxes that a shareholder would pay on Fund distributions. If sales charges were reflected, the performance quoted would be lower. Performance figures for periods shorter than one year represent cumulative figures and are not annualized.
Fund performance figures reflect fee waivers and/or expense reimbursements, without which the performance would have been lower.
The30-Day SEC Yields for the period ended December 31, 2019 for Class A, Class C, Class C1, Class FI, Class R, Class I and Class IS shares were 1.76%, 1.17%, 2.21%, 1.85%, 1.41%, 2.16% and 2.31%, respectively. The30-Day SEC Yield, calculated pursuant to the standard SEC formula, is based on a Fund’s investments over an annualized trailing30-day period, and not on the distributions paid by the Fund, which may differ. The30-Day SEC Yield includes adjustments for inflation to both U.S. and foreign portfolio securities that are linked to inflation indices. Please note, inflation adjustments to U.S. securities often occur at different intervals than foreign securities. These adjustments can cause the SEC Yield to change substantially frommonth-to-month. Increases in the inflation rate may result in the Fund reporting an exceptionally high yield which may not be repeated.
|
| Total Annual Operating Expenses (unaudited) |
As of the Fund’s current prospectus dated April 29, 2019, the gross total annual fund operating expense ratios for Class A, Class C, Class C1, Class FI, Class R, Class I and Class IS shares were 0.70%, 1.36%, 1.17%, 0.68%, 1.06%, 0.38% and 0.28%, respectively.
Actual expenses may be higher. For example, expenses may be higher than those shown if average net assets decrease. Net assets are more likely to decrease and Fund expense ratios are more likely to increase when markets are volatile.
Q. What were the leading contributors to performance?
A.The largest contributor to the Fund’s relative performance during the reporting period was its U.S. duration positioning. Having a duration that was longer than that of the benchmark was beneficial as rates moved lower across the yield curve. We tactically managed the Fund’s exposure to both nominal and real Treasury duration, which also contributed to returns.
The Fund’s allocation to corporate sectors that are relevant to future inflation were made in anticipation of actual inflation remaining stable over the reporting period. In particular, allocations to investment-grade corporate bonds and high-yield corporate bonds were beneficial. Their spreads narrowed given generally strong demand, as investors looked to generate incremental yield in the low interest rate environment.
| | |
| Western Asset Inflation Indexed Plus Bond Fund 2019 Annual Report | | 3 |
Fund overview (cont’d)
In addition, the Fund’s emerging markets exposures were rewarded. In particular, allocations to U.S. dollar-denominated emerging market sovereigns and corporates were beneficial for returns, as their spreads narrowed during the reporting period.
Q. What were the leading detractors from performance?
A.The Fund outperformed its benchmark during the reporting period. That said, yield curve positioning was the largest detractor from relative results, as the curve steepened during the period as a whole. Elsewhere, the Fund’snon-U.S. duration positioning modestly detracted from performance.
Thank you for your investment in Western Asset Inflation Indexed Plus Bond Fund. As always, we appreciate that you have chosen us to manage your assets and we remain focused on achieving the Fund’s investment goals.
Sincerely,
Western Asset Management Company, LLC
January 21, 2020
RISKS: Fixed income securities involve interest rate, credit, inflation and reinvestment risks. As interest rates rise, the value of fixed income securities falls. Derivatives, such as options, futures and swaps, can be illiquid, may disproportionately increase losses, and have a potentially large impact on Fund performance. The use of leverage may increase volatility and possibility of loss. Risks of high-yield securities (commonly known as “junk” bonds) include greater price volatility, illiquidity and possibility of default. The Fund may be subject to interest rate, income and deflation risks. Changes in inflation will cause the Fund’s income to fluctuate, sometimes substantially. Periods of deflation may adversely affect the Fund’s net asset value. International investments are subject to special risks including currency fluctuations and social, economic and political uncertainties, which could increase volatility. These risks are magnified in emerging markets. Asset-backed, mortgage-backed and mortgage related securities are subject to prepayment and extension risks. Please see the Fund’s prospectus for a more complete discussion of these and other risks and the Fund’s investment strategies.
Portfolio holdings and breakdowns are as of December 31, 2019 and are subject to change and may not be representative of the portfolio managers’ current or future investments. Please refer to pages 11 through 14 for a list and percentage breakdown of the Fund’s holdings.
The mention of sector breakdowns is for informational purposes only and should not be construed as a recommendation to purchase or sell any securities. The information provided regarding such sectors is not a sufficient basis upon which to make an investment decision. Investors seeking financial advice regarding the appropriateness of investing in any securities or investment strategies discussed should consult their financial professional. Portfolio holdings are subject to change at any time and may not be representative of the portfolio managers’ current or future investments. The Fund’s top four sector holdings (as a percentage of net assets) as of December 31, 2019 were: U.S. Treasury Inflation Protected Securities (90.7%), Corporate Bonds & Notes (5.2%), Sovereign Bonds (1.4%) andNon-U.S. Treasury Inflation Protected Securities (1.1%). The Fund’s portfolio composition is subject to change at any time.
| | |
4 | | Western Asset Inflation Indexed Plus Bond Fund 2019 Annual Report |
All investments are subject to risk including the possible loss of principal. Past performance is no guarantee of future results. All index performance reflects no deduction for fees, expenses or taxes. Please note that an investor cannot invest directly in an index.
The information provided is not intended to be a forecast of future events, a guarantee of future results or investment advice. Views expressed may differ from those of the firm as a whole.
| i | U.S. Treasury Inflation-Protected Securities (“TIPS”) are inflation-indexed securities issued by the U.S. Treasury in five-year,ten-year and thirty-year maturities. The principal is adjusted to the Consumer Price Index, the commonly used measure of inflation. The coupon rate is constant, but generates a different amount of interest when multiplied by the inflation-adjusted principal. |
| ii | Effective duration is a duration calculation for bonds with embedded options. Effective duration takes into account that expected cash flows will fluctuate as interest rates change. Please note, duration measures the sensitivity of price (the value of principal) of a fixed income investment to a change in interest rates. |
| iii | The Bloomberg Barclays U.S. Treasury Inflation-Linked Bond Index represents an unmanaged market index made up of U.S. Treasury Inflation-Linked Index securities. |
| iv | The Federal Reserve Board (the “Fed”) is responsible for the formulation of U.S. policies designed to promote economic growth, full employment, stable prices, and a sustainable pattern of international trade and payments. |
| v | The Bloomberg Barclays U.S. Aggregate Index is a broad-based bond index comprised of government, corporate, mortgage- and asset-backed issues, rated investment grade or higher, and having at least one year to maturity. |
| vi | The Consumer Price Index for All Urban Consumers(“CPI-U”) is a measure of the average change in prices over time of goods and services purchased by households, which covers approximately 87% of the total population and includes, in addition to wage earners and clerical worker households, groups such as professional, managerial and technical workers, the self-employed, short-term workers, the unemployed and retirees and others not in the labor force. |
| vii | Duration is the measure of the price sensitivity of a fixed-income security to an interest rate change of 100 basis points. Calculation is based on the weighted average of the present values for all cash flows. |
| viii | The yield curve is the graphical depiction of the relationship between the yield on bonds of the same credit quality but different maturities. |
| ix | Lipper, Inc., a wholly-owned subsidiary of Reuters, provides independent insight on global collective investments. Returns are based on the period ended December 31, 2019, including the reinvestment of all distributions, including returns of capital, if any, calculated among the 217 funds for thesix-month period and among the 216 funds for the twelve-month period in the Fund’s Lipper category, excluding sales charges, if any. |
| | |
| Western Asset Inflation Indexed Plus Bond Fund 2019 Annual Report | | 5 |
Fund at a glance†(unaudited)
Investment breakdown(%) as a percent of total investments
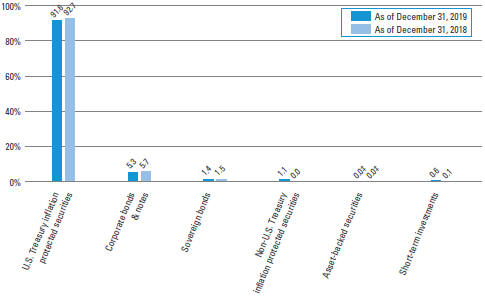
| † | The bar graph above represents the Fund’s portfolio as of December 31, 2019 and December 31, 2018, and does not include derivatives such as futures contracts and forward foreign currency contracts. The Fund’s portfolio is actively managed. As a result, the composition of its portfolio holdings and sectors is subject to change at any time. |
| ‡ | Represents less than 0.1%. |
| | |
6 | | Western Asset Inflation Indexed Plus Bond Fund 2019 Annual Report |
Fund expenses(unaudited)
Example
As a shareholder of the Fund, you may incur two types of costs: (1) transaction costs, includingfront-end andback-end sales charges (loads) on purchase payments; and (2) ongoing costs, including management fees; service and/or distribution(12b-1) fees; and other Fund expenses. This example is intended to help you understand your ongoing costs (in dollars) of investing in the Fund and to compare these costs with the ongoing costs of investing in other mutual funds.
This example is based on an investment of $1,000 invested on July 1, 2019 and held for the six months ended December 31, 2019.
Actual expenses
The table below titled “Based on Actual Total Return” provides information about actual account values and actual expenses. You may use the information provided in this table, together with the amount you invested, to estimate the expenses that you paid over the period. To estimate the expenses you paid on your account, divide your ending account value by $1,000 (for example, an $8,600 ending account value divided by $1,000 = 8.6), then multiply the result by the number under the heading entitled “Expenses Paid During the Period”.
Hypothetical example for comparison purposes
The table below titled “Based on Hypothetical Total Return” provides information about hypothetical account values and hypothetical expenses based on the actual expense ratio and an assumed rate of return of 5.00% per year before expenses, which is not the Fund’s actual return. The hypothetical account values and expenses may not be used to estimate the actual ending account balance or expenses you paid for the period. You may use the information provided in this table to compare the ongoing costs of investing in the Fund and other funds. To do so, compare the 5.00% hypothetical example relating to the Fund with the 5.00% hypothetical examples that appear in the shareholder reports of the other funds.
Please note that the expenses shown in the table below are meant to highlight your ongoing costs only and do not reflect any transactional costs, such asfront-end orback-end sales charges (loads). Therefore, the table is useful in comparing ongoing costs only, and will not help you determine the relative total costs of owning different funds. In addition, if these transaction costs were included, your costs would have been higher.
| | | | | | | | | | | | | | | | | | | | | | | | | | | | | | | | | | | | | | | | | | | | | | |
| | | |
| Based on actual total return1 | | | | | | | | | Based on hypothetical total return1 | |
| | | Actual
Total Return
Without
Sales
Charge2 | | | Beginning
Account
Value | | | Ending
Account
Value | | | Annualized
Expense
Ratio | | | Expenses
Paid
During
the
Period3 | | | | | | | | Hypothetical
Annualized
Total Return | | | Beginning
Account
Value | | | Ending
Account
Value | | | Annualized
Expense
Ratio | | | Expenses
Paid
During
the
Period3 | |
| Class A | | | 2.49 | % | | $ | 1,000.00 | | | $ | 1,024.90 | | | | 0.69 | % | | $ | 3.52 | | | | | | | Class A | | | 5.00 | % | | $ | 1,000.00 | | | $ | 1,021.73 | | | | 0.69 | % | | $ | 3.52 | |
| Class C | | | 2.16 | | | | 1,000.00 | | | | 1,021.60 | | | | 1.38 | | | | 7.03 | | | | | | | Class C | | | 5.00 | | | | 1,000.00 | | | | 1,018.25 | | | | 1.38 | | | | 7.02 | |
| Class C1 | | | 2.46 | | | | 1,000.00 | | | | 1,024.60 | | | | 0.90 | | | | 4.59 | | | | | | | Class C1 | | | 5.00 | | | | 1,000.00 | | | | 1,020.67 | | | | 0.90 | | | | 4.58 | |
| Class FI | | | 2.57 | | | | 1,000.00 | | | | 1,025.70 | | | | 0.63 | | | | 3.22 | | | | | | | Class FI | | | 5.00 | | | | 1,000.00 | | | | 1,022.03 | | | | 0.63 | | | | 3.21 | |
| Class R | | | 2.31 | | | | 1,000.00 | | | | 1,023.10 | | | | 1.03 | | | | 5.25 | | | | | | | Class R | | | 5.00 | | | | 1,000.00 | | | | 1,020.01 | | | | 1.03 | | | | 5.24 | |
| Class I | | | 2.75 | | | | 1,000.00 | | | | 1,027.50 | | | | 0.35 | | | | 1.79 | | | | | | | Class I | | | 5.00 | | | | 1,000.00 | | | | 1,023.44 | | | | 0.35 | | | | 1.79 | |
| Class IS | | | 2.77 | | | | 1,000.00 | | | | 1,027.70 | | | | 0.27 | | | | 1.38 | | | | | | | Class IS | | | 5.00 | | | | 1,000.00 | | | | 1,023.84 | | | | 0.27 | | | | 1.38 | |
| | |
| Western Asset Inflation Indexed Plus Bond Fund 2019 Annual Report | | 7 |
Fund expenses(unaudited) (cont’d)
| 1 | For the six months ended December 31, 2019. |
| 2 | Assumes the reinvestment of all distributions, including returns of capital, if any, at net asset value and does not reflect the deduction of the applicable sales charge with respect to Class A shares or the applicable contingent deferred sales charge (“CDSC”) with respect to Class C shares. Total return is not annualized, as it may not be representative of the total return for the year. Performance figures may reflect compensating balance arrangements, fee waivers and/or expense reimbursements. In the absence of compensating balance arrangements, fee waivers and/or expense reimbursements, the total return would have been lower. Past performance is no guarantee of future results. |
| 3 | Expenses (net of compensating balance arrangements, fee waivers and/or expense reimbursements) are equal to each class’ respective annualized expense ratio multiplied by the average account value over the period, multiplied by the number of days in the most recent fiscal half-year (184), then divided by 365. |
| | |
8 | | Western Asset Inflation Indexed Plus Bond Fund 2019 Annual Report |
Fund performance (unaudited)
| | | | | | | | | | | | | | | | | | | | | | | | | | | | |
| Average annual total returns | |
| Without sales charges1 | | Class A | | | Class C | | | Class C1 | | | Class FI | | | Class R | | | Class I | | | Class IS | |
| Twelve Months Ended 12/31/19 | | | 9.37 | % | | | 8.63 | % | | | 8.95 | % | | | 9.48 | % | | | 8.99 | % | | | 9.79 | % | | | 9.93 | % |
| Five Years Ended 12/31/19 | | | 1.83 | | | | 1.18 | | | | 1.40 | | | | 1.85 | | | | 1.50 | | | | 2.15 | | | | 2.29 | |
| Ten Years Ended 12/31/19 | | | N/A | | | | N/A | | | | N/A | | | | 2.56 | | | | N/A | | | | 2.94 | | | | 3.04 | |
| Inception* through 12/31/19 | | | 0.81 | | | | 0.09 | | | | -0.07 | | | | — | | | | 0.45 | | | | — | | | | — | |
| | | | | | | |
| With sales charges2 | | Class A | | | Class C | | | Class C1 | | | Class FI | | | Class R | | | Class I | | | Class IS | |
| Twelve Months Ended 12/31/19 | | | 4.71 | % | | | 7.63 | % | | | 8.95 | % | | | 9.48 | % | | | 8.99 | % | | | 9.79 | % | | | 9.93 | % |
| Five Years Ended 12/31/19 | | | 0.94 | | | | 1.18 | | | | 1.40 | | | | 1.85 | | | | 1.50 | | | | 2.15 | | | | 2.29 | |
| Ten Years Ended 12/31/19 | | | N/A | | | | N/A | | | | N/A | | | | 2.56 | | | | N/A | | | | 2.94 | | | | 3.04 | |
| Inception* through 12/31/19 | | | 0.23 | | | | 0.09 | | | | -0.07 | | | | — | | | | 0.45 | | | | — | | | | — | |
| | | | |
| Cumulative total returns | |
| Without sales charges1 | | | |
| Class A (Inception date of 4/30/12 through 12/31/19) | | | 6.35 | % |
| Class C (Inception date of 4/30/12 through 12/31/19) | | | 0.73 | |
| Class C1 (Inception date of 10/5/12 through 12/31/19) | | | -0.49 | |
| Class FI (12/31/09 through 12/31/19) | | | 28.78 | |
| Class R (Inception date of 4/30/12 through 12/31/19) | | | 3.49 | |
| Class I (12/31/09 through 12/31/19) | | | 33.63 | |
| Class IS (12/31/09 through 12/31/19) | | | 34.88 | |
All figures represent past performance and are not a guarantee of future results. Investment return and principal value of an investment will fluctuate so that an investor’s shares, when redeemed, may be worth more or less than their original cost. The returns shown do not reflect the deduction of taxes that a shareholder would pay on Fund distributions or the redemption of Fund shares. Performance figures may reflect compensating balance arrangements, fee waivers and/or expense reimbursements. In the absence of compensating balance arrangements, fee waivers and/or expense reimbursements, the total return would have been lower.
| 1 | Assumes the reinvestment of all distributions, including returns of capital, if any, at net asset value and does not reflect the deduction of the applicable sales charge with respect to Class A shares or the applicable contingent deferred sales charge (“CDSC”) with respect to Class C shares. |
| 2 | Assumes the reinvestment of all distributions, including returns of capital, if any, at net asset value. In addition, Class A shares reflect the deduction of the maximum initial sales charge of 4.25%. Class C shares reflect the deduction of a 1.00% CDSC, which applies if shares are redeemed within one year from purchase payment. |
| * | Inception dates for Class A, C, C1, FI, R, I and IS shares are April 30, 2012, April 30, 2012, October 5, 2012, June 28, 2007, April 30, 2012, March 1, 2001 and December 18, 2008, respectively. |
| | |
| Western Asset Inflation Indexed Plus Bond Fund 2019 Annual Report | | 9 |
Fund performance(unaudited) (cont’d)
Historical performance
Value of $1,000,000 invested in
Class I Shares of Western Asset Inflation Indexed Plus Bond Fund vs. Bloomberg Barclays U.S. Treasury Inflation-Linked Bond Index† — December 2009 - December 2019
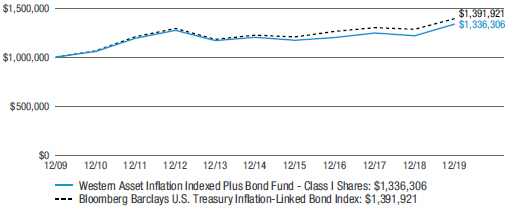
All figures represent past performance and are not a guarantee of future results. Investment return and principal value of an investment will fluctuate so that an investor’s shares, when redeemed, may be worth more or less than their original cost. The returns shown do not reflect the deduction of taxes that a shareholder would pay on Fund distributions or the redemption of Fund shares. Performance figures may reflect compensating balance arrangements, fee waivers and/or expense reimbursements. In the absence of compensating balance arrangements, fee waivers and/or expense reimbursements, the total return would have been lower.
| † | Hypothetical illustration of $1,000,000 invested in Class I shares of Western Asset Inflation Indexed Plus Bond Fund on December 31, 2009, assuming the reinvestment of all distributions, including returns of capital, if any, at net asset value through December 31, 2019. The hypothetical illustration also assumes a $1,000,000 investment in the Bloomberg Barclays U.S. Treasury Inflation-Linked Bond Index. The Bloomberg Barclays U.S. Treasury Inflation-Linked Bond Index represents an unmanaged market index made up of U.S. Treasury Inflation-Linked Index securities. The index is unmanaged and not subject to the same management and trading expenses as a mutual fund. Please note that an investor cannot invest directly in an index. The performance of the Fund’s other classes may be greater or less than Class I shares’ performance indicated on this chart, depending on whether greater or lesser sales charges and fees were incurred by shareholders investing in the other classes. |
| | |
10 | | Western Asset Inflation Indexed Plus Bond Fund 2019 Annual Report |
Schedule of investments
December 31, 2019
Western Asset Inflation Indexed Plus Bond Fund
| | | | | | | | | | | | | | | | |
| Security | | Rate | | | Maturity Date | | | Face Amount† | | | Value | |
| U.S. Treasury Inflation Protected Securities — 90.7% | | | | | | | | | | | | | | | | |
U.S. Treasury Bonds, Inflation Indexed | | | 2.000 | % | | | 1/15/26 | | | | 60,162,240 | | | $ | 66,887,498 | |
U.S. Treasury Bonds, Inflation Indexed | | | 2.375 | % | | | 1/15/27 | | | | 8,932,770 | | | | 10,312,836 | |
U.S. Treasury Bonds, Inflation Indexed | | | 2.500 | % | | | 1/15/29 | | | | 11,986,300 | | | | 14,449,845 | |
U.S. Treasury Bonds, Inflation Indexed | | | 3.875 | % | | | 4/15/29 | | | | 26,330,532 | | | | 35,142,732 | |
U.S. Treasury Bonds, Inflation Indexed | | | 2.125 | % | | | 2/15/40 | | | | 3,691,015 | | | | 4,827,200 | |
U.S. Treasury Bonds, Inflation Indexed | | | 2.125 | % | | | 2/15/41 | | | | 26,875,452 | | | | 35,420,891 | |
U.S. Treasury Bonds, Inflation Indexed | | | 1.375 | % | | | 2/15/44 | | | | 65,479,653 | | | | 77,276,143 | |
U.S. Treasury Bonds, Inflation Indexed | | | 0.750 | % | | | 2/15/45 | | | | 14,534,905 | | | | 15,085,821 | |
U.S. Treasury Notes, Inflation Indexed | | | 0.125 | % | | | 4/15/21 | | | | 2,171,640 | | | | 2,167,259 | |
U.S. Treasury Notes, Inflation Indexed | | | 0.125 | % | | | 1/15/22 | | | | 21,830,784 | | | | 21,820,760 | |
U.S. Treasury Notes, Inflation Indexed | | | 0.125 | % | | | 4/15/22 | | | | 113,861,244 | | | | 113,702,876 | |
U.S. Treasury Notes, Inflation Indexed | | | 0.125 | % | | | 1/15/23 | | | | 17,169,614 | | | | 17,169,853 | |
U.S. Treasury Notes, Inflation Indexed | | | 0.625 | % | | | 4/15/23 | | | | 5,180,250 | | | | 5,261,062 | |
Total U.S. Treasury Inflation Protected Securities (Cost — $401,980,131) | | | | | | | | 419,524,776 | |
| Corporate Bonds & Notes — 5.2% | | | | | | | | | | | | | | | | |
| Energy — 2.8% | | | | | | | | | | | | | | | | |
Energy Equipment & Services — 0.1% | | | | | | | | | | | | | | | | |
Halliburton Co., Senior Notes | | | 3.800 | % | | | 11/15/25 | | | | 500,000 | | | | 533,787 | |
Oil, Gas & Consumable Fuels — 2.7% | | | | | | | | | | | | | | | | |
Apache Corp., Senior Notes | | | 2.625 | % | | | 1/15/23 | | | | 288,000 | | | | 289,084 | |
Apache Corp., Senior Notes | | | 5.100 | % | | | 9/1/40 | | | | 300,000 | | | | 306,007 | |
Apache Corp., Senior Notes | | | 4.750 | % | | | 4/15/43 | | | | 2,020,000 | | | | 1,955,562 | |
BP Capital Markets America Inc., Senior Notes | | | 3.588 | % | | | 4/14/27 | | | | 2,100,000 | | | | 2,250,283 | |
Devon Energy Corp., Senior Notes | | | 5.850 | % | | | 12/15/25 | | | | 2,500,000 | | | | 2,966,625 | |
Enterprise Products Operating LLC, Senior Notes | | | 3.125 | % | | | 7/31/29 | | | | 1,390,000 | | | | 1,433,204 | |
Exxon Mobil Corp., Senior Notes | | | 3.043 | % | | | 3/1/26 | | | | 500,000 | | | | 524,975 | |
Noble Energy Inc., Senior Notes | | | 3.900 | % | | | 11/15/24 | | | | 500,000 | | | | 528,894 | |
Occidental Petroleum Corp., Senior Notes | | | 5.550 | % | | | 3/15/26 | | | | 390,000 | | | | 442,610 | |
Occidental Petroleum Corp., Senior Notes | | | 3.000 | % | | | 2/15/27 | | | | 1,000,000 | | | | 1,002,740 | |
Targa Resources Partners LP/Targa Resources Partners Finance Corp., Senior Notes | | | 5.375 | % | | | 2/1/27 | | | | 800,000 | | | | 831,480 | |
Total Oil, Gas & Consumable Fuels | | | | | | | | | | | | | | | 12,531,464 | |
Total Energy | | | | | | | | 13,065,251 | |
| Materials — 2.4% | | | | | | | | | | | | | | | | |
Metals & Mining — 2.2% | | | | | | | | | | | | | | | | |
Alcoa Nederland Holding BV, Senior Notes | | | 6.125 | % | | | 5/15/28 | | | | 890,000 | | | | 965,071 | (a) |
Anglo American Capital PLC, Senior Notes | | | 4.000 | % | | | 9/11/27 | | | | 980,000 | | | | 1,027,872 | (a) |
ArcelorMittal SA, Senior Notes | | | 6.125 | % | | | 6/1/25 | | | | 430,000 | | | | 494,411 | |
ArcelorMittal SA, Senior Notes | | | 7.000 | % | | | 10/15/39 | | | | 580,000 | | | | 708,121 | |
See Notes to Financial Statements.
| | |
| Western Asset Inflation Indexed Plus Bond Fund 2019 Annual Report | | 11 |
Schedule of investments (cont’d)
December 31, 2019
Western Asset Inflation Indexed Plus Bond Fund
| | | | | | | | | | | | | | | | |
| Security | | Rate | | | Maturity Date | | | Face Amount† | | | Value | |
Metals & Mining — continued | | | | | | | | | | | | | | | | |
Glencore Funding LLC, Senior Notes | | | 4.125 | % | | | 3/12/24 | | | | 440,000 | | | $ | 461,141 | (a) |
Glencore Funding LLC, Senior Notes | | | 4.000 | % | | | 3/27/27 | | | | 500,000 | | | | 520,143 | (a) |
Glencore Funding LLC, Senior Notes | | | 3.875 | % | | | 10/27/27 | | | | 980,000 | | | | 1,020,494 | (a) |
Southern Copper Corp., Senior Notes | | | 5.250 | % | | | 11/8/42 | | | | 2,380,000 | | | | 2,747,540 | |
Teck Resources Ltd., Senior Notes | | | 3.750 | % | | | 2/1/23 | | | | 430,000 | | | | 438,014 | |
Vale Overseas Ltd., Senior Notes | | | 6.250 | % | | | 8/10/26 | | | | 790,000 | | | | 928,764 | |
Yamana Gold Inc., Senior Notes | | | 4.625 | % | | | 12/15/27 | | | | 820,000 | | | | 858,626 | |
Total Metals & Mining | | | | | | | | | | | | | | | 10,170,197 | |
Paper & Forest Products — 0.2% | | | | | | | | | | | | | | | | |
Inversiones CMPC SA, Senior Notes | | | 4.375 | % | | | 4/4/27 | | | | 850,000 | | | | 895,845 | (b) |
Total Materials | | | | | | | | | | | | | | | 11,066,042 | |
Total Corporate Bonds & Notes (Cost — $22,534,957) | | | | | | | | | | | | 24,131,293 | |
| Sovereign Bonds — 1.4% | | | | | | | | | | | | | | | | |
Indonesia — 0.5% | | | | | | | | | | | | | | | | |
Indonesia Government International Bond, Senior Notes | | | 3.500 | % | | | 1/11/28 | | | | 210,000 | | | | 219,522 | |
Indonesia Government International Bond, Senior Notes | | | 4.750 | % | | | 2/11/29 | | | | 1,900,000 | | | | 2,177,774 | |
Total Indonesia | | | | | | | | | | | | | | | 2,397,296 | |
Kuwait — 0.3% | | | | | | | | | | | | | | | | |
Kuwait International Government Bond, Senior Notes | | | 3.500 | % | | | 3/20/27 | | | | 1,240,000 | | | | 1,334,823 | (b) |
Panama — 0.3% | | | | | | | | | | | | | | | | |
Panama Government International Bond, Senior Notes | | | 3.160 | % | | | 1/23/30 | | | | 1,400,000 | | | | 1,444,100 | |
Saudi Arabia — 0.3% | | | | | | | | | | | | | | | | |
Abu Dhabi Government International Bond, Senior Notes | | | 2.500 | % | | | 9/30/29 | | | | 1,200,000 | | | | 1,197,750 | (a) |
Total Sovereign Bonds (Cost — $6,353,073) | | | | | | | | | | | | | | | 6,373,969 | |
| Non-U.S. Treasury Inflation Protected Securities — 1.1% | | | | | | | | | | | | | |
Brazil — 1.1% | | | | | | | | | | | | | | | | |
Brazil Notas do Tesouro Nacional Serie B, Notes (Cost — $4,646,308) | | | 6.000 | % | | | 8/15/30 | | | | 16,214,666 | BRL | | | 5,111,482 | |
| Asset-Backed Securities — 0.0% | | | | | | | | | | | | | | | | |
Bear Stearns Asset Backed Securities Trust, 2003-ABF1, A (1 mo. USD LIBOR + 0.740%) (Cost — $20,284) | | | 2.532 | % | | | 1/25/34 | | | | 20,923 | | | | 20,138 | (c) |
Total Investments before Short-Term Investments (Cost — $435,534,753) | | | | 455,161,658 | |
See Notes to Financial Statements.
| | |
12 | | Western Asset Inflation Indexed Plus Bond Fund 2019 Annual Report |
Western Asset Inflation Indexed Plus Bond Fund
| | | | | | | | | | | | | | | | |
| Security | | Rate | | | | | | Shares | | | Value | |
| Short-Term Investments — 0.6% | | | | | | | | | | | | | | | | |
Western Asset Premier Institutional Government Reserves, Premium Shares
(Cost — $2,602,433) | | | 1.496 | % | | | | | | | 2,602,433 | | | $ | 2,602,433 | (d) |
Total Investments — 99.0% (Cost — $438,137,186) | | | | | | | | | | | | | | | 457,764,091 | |
Other Assets in Excess of Liabilities — 1.0% | | | | | | | | | | | | | | | 4,615,187 | |
Total Net Assets — 100.0% | | | | | | | | | | | | | | $ | 462,379,278 | |
| † | Face amount denominated in U.S. dollars, unless otherwise noted. |
| (a) | Security is exempt from registration under Rule 144A of the Securities Act of 1933. This security may be resold in transactions that are exempt from registration, normally to qualified institutional buyers. This security has been deemed liquid pursuant to guidelines approved by the Board of Directors. |
| (b) | Security is exempt from registration under Regulation S of the Securities Act of 1933. Regulation S applies to securities offerings that are made outside of the United States and do not involve direct selling efforts in the United States. This security has been deemed liquid pursuant to guidelines approved by the Board of Directors. |
| (c) | Variable rate security. Interest rate disclosed is as of the most recent information available. Certain variable rate securities are not based on a published reference rate and spread but are determined by the issuer or agent and are based on current market conditions. These securities do not indicate a reference rate and spread in their description above. |
| (d) | In this instance, as defined in the Investment Company Act of 1940, an “Affiliated Company” represents Fund ownership of at least 5% of the outstanding voting securities of an issuer, or a company which is under common ownership or control. At December 31, 2019, the total market value of investments in Affiliated Companies was $2,602,433 and the cost was $2,602,433 (Note 8). |
| | |
Abbreviations used in this schedule: |
| |
| BRL | | — Brazilian Real |
| |
| LIBOR | | — London Interbank Offered Rate |
| |
| USD | | — United States Dollar |
At December 31, 2019, the Fund had the following open futures contracts:
| | | | | | | | | | | | | | | | | | | | |
| | | Number of
Contracts | | | Expiration
Date | | | Notional Amount | | | Market Value | | | Unrealized
Appreciation | |
| Contracts to Sell: | | | | | | | | | | | | | | | | | | | | |
| U.S. Treasury Long-Term Bonds | | | 251 | | | | 3/20 | | | $ | 40,002,792 | | | $ | 39,132,469 | | | $ | 870,323 | |
At December 31, 2019, the Fund had the following open forward foreign currency contracts:
| | | | | | | | | | | | | | | | | | | | |
Currency Purchased | | | Currency Sold | | | Counterparty | | Settlement Date | | | Unrealized Appreciation (Depreciation) | |
| USD | | | 376,624 | | | EUR | | | 340,000 | | | Barclays Bank PLC | | | 1/17/20 | | | $ | (5,157) | |
| EUR | | | 670,000 | | | USD | | | 745,924 | | | BNP Paribas SA | | | 1/17/20 | | | | 6,409 | |
| USD | | | 187,881 | | | EUR | | | 170,000 | | | BNP Paribas SA | | | 1/17/20 | | | | (3,009) | |
See Notes to Financial Statements.
| | |
| Western Asset Inflation Indexed Plus Bond Fund 2019 Annual Report | | 13 |
Schedule of investments (cont’d)
December 31, 2019
Western Asset Inflation Indexed Plus Bond Fund
| | | | | | | | | | | | | | | | | | | | |
Currency Purchased | | | Currency Sold | | | Counterparty | | Settlement Date | | | Unrealized Appreciation (Depreciation) | |
| EUR | | | 200,000 | | | USD | | | 223,763 | | | Citibank N.A. | | | 1/17/20 | | | $ | 814 | |
| USD | | | 397,264 | | | EUR | | | 360,000 | | | Citibank N.A. | | | 1/17/20 | | | | (6,975) | |
| Total | | | | | | | | | | | | | | | | | | $ | (7,918) | |
| | |
Abbreviations used in this table: |
| |
| EUR | | — Euro |
| |
| USD | | — United States Dollar |
See Notes to Financial Statements.
| | |
14 | | Western Asset Inflation Indexed Plus Bond Fund 2019 Annual Report |
Statement of assets and liabilities
December 31, 2019
| | | | |
| |
| Assets: | | | | |
Investments in unaffiliated securities, at value (Cost — $435,534,753) | | $ | 455,161,658 | |
Investments in affiliated securities, at value (Cost — $2,602,433) | | | 2,602,433 | |
Foreign currency, at value (Cost — $361,206) | | | 346,894 | |
Cash | | | 1,164,719 | |
Interest receivable | | | 2,084,974 | |
Deposits with brokers for open futures contracts | | | 691,954 | |
Receivable for Fund shares sold | | | 595,923 | |
Receivable from broker — variation margin on open futures contracts | | | 86,281 | |
Unrealized appreciation on forward foreign currency contracts | | | 7,223 | |
Prepaid expenses | | | 44,836 | |
Total Assets | | | 462,786,895 | |
| |
| Liabilities: | | | | |
Payable for Fund shares repurchased | | | 244,166 | |
Investment management fee payable | | | 78,190 | |
Unrealized depreciation on forward foreign currency contracts | | | 15,141 | |
Service and/or distribution fees payable | | | 3,231 | |
Directors’ fees payable | | | 2,673 | |
Accrued expenses | | | 64,216 | |
Total Liabilities | | | 407,617 | |
| Total Net Assets | | $ | 462,379,278 | |
| |
| Net Assets: | | | | |
Par value (Note 7) | | $ | 40,227 | |
Paid-in capital in excess of par value | | | 459,219,817 | |
Total distributable earnings (loss) | | | 3,119,234 | |
| Total Net Assets | | $ | 462,379,278 | |
See Notes to Financial Statements.
| | |
| Western Asset Inflation Indexed Plus Bond Fund 2019 Annual Report | | 15 |
Statement of assets and liabilities (cont’d)
December 31, 2019
| | | | |
| |
| Net Assets: | | | | |
Class A | | | $10,140,417 | |
Class C | | | $866,946 | |
Class C1 | | | $90,854 | |
Class FI | | | $482,925 | |
Class R | | | $457,609 | |
Class I | | | $51,902,431 | |
Class IS | | | $398,438,096 | |
| |
| Shares Outstanding: | | | | |
Class A | | | 894,097 | |
Class C | | | 78,435 | |
Class C1 | | | 8,085 | |
Class FI | | | 42,863 | |
Class R | | | 40,859 | |
Class I | | | 4,534,630 | |
Class IS | | | 34,628,518 | |
| |
| Net Asset Value: | | | | |
Class A (and redemption price) | | | $11.34 | |
Class C* | | | $11.05 | |
Class C1 (and redemption price) | | | $11.24 | |
Class FI (and redemption price) | | | $11.27 | |
Class R (and redemption price) | | | $11.20 | |
Class I (and redemption price) | | | $11.45 | |
Class IS (and redemption price) | | | $11.51 | |
| Maximum Public Offering Price Per Share: | | | | |
Class A (based on maximum initial sales charge of 4.25%) | | | $11.84 | |
| * | Redemption price per share is NAV of Class C shares reduced by a 1.00% CDSC if shares are redeemed within one year from purchase payment (Note 2). |
See Notes to Financial Statements.
| | |
16 | | Western Asset Inflation Indexed Plus Bond Fund 2019 Annual Report |
Statement of operations
For the Year Ended December 31, 2019
| | | | |
| |
| Investment Income: | | | | |
Interest from unaffiliated investments | | $ | 11,552,464 | |
Interest from affiliated investments | | | 57,086 | |
Less: Foreign taxes withheld | | | (8,123) | |
Total Investment Income | | | 11,601,427 | |
| |
| Expenses: | | | | |
Investment management fee (Note 2) | | | 903,647 | |
Registration fees | | | 122,069 | |
Transfer agent fees (Note 5) | | | 84,970 | |
Fund accounting fees | | | 71,657 | |
Audit and tax fees | | | 56,135 | |
Service and/or distribution fees (Notes 2 and 5) | | | 48,947 | |
Legal fees | | | 16,098 | |
Directors’ fees | | | 13,934 | |
Shareholder reports | | | 12,158 | |
Custody fees | | | 9,389 | |
Insurance | | | 6,456 | |
Commitment fees (Note 9) | | | 2,854 | |
Interest expense | | | 935 | |
Miscellaneous expenses | | | 10,412 | |
Total Expenses | | | 1,359,661 | |
Less: Fee waivers and/or expense reimbursements (Notes 2 and 5) | | | (410) | |
Net Expenses | | | 1,359,251 | |
| Net Investment Income | | | 10,242,176 | |
| |
Realized and Unrealized Gain (Loss) on Investments, Futures Contracts, Forward Foreign Currency Contracts and Foreign Currency Transactions (Notes 1, 3 and 4): | | | | |
Net Realized Gain (Loss) From: | | | | |
Investment transactions in unaffiliated securities | | | 7,125,519 | |
Futures contracts | | | (3,982,738) | |
Forward foreign currency contracts | | | 40,564 | |
Foreign currency transactions | | | (21,396) | |
Net Realized Gain | | | 3,161,949 | |
Change in Net Unrealized Appreciation (Depreciation) From: | | | | |
Investments in unaffiliated securities | | | 26,759,921 | |
Futures contracts | | | 1,810,771 | |
Forward foreign currency contracts | | | (7,159) | |
Foreign currencies | | | (17,052) | |
Change in Net Unrealized Appreciation (Depreciation) | | | 28,546,481 | |
| Net Gain on Investments, Futures Contracts, Forward Foreign Currency Contracts and Foreign Currency Transactions | | | 31,708,430 | |
| Increase in Net Assets From Operations | | $ | 41,950,606 | |
See Notes to Financial Statements.
| | |
| Western Asset Inflation Indexed Plus Bond Fund 2019 Annual Report | | 17 |
Statements of changes in net assets
| | | | | | | | |
| For the Years Ended December 31, | | 2019 | | | 2018 | |
| | |
| Operations: | | | | | | | | |
Net investment income | | $ | 10,242,176 | | | $ | 12,654,387 | |
Net realized gain (loss) | | | 3,161,949 | | | | (2,510,204) | |
Change in net unrealized appreciation (depreciation) | | | 28,546,481 | | | | (19,710,840) | |
Increase (Decrease) in Net Assets From Operations | | | 41,950,606 | | | | (9,566,657) | |
| | |
| Distributions to Shareholders From (Notes 1 and 6): | | | | | | | | |
Total distributable earnings | | | (10,258,968) | | | | (12,600,105) | |
Decrease in Net Assets From Distributions to Shareholders | | | (10,258,968) | | | | (12,600,105) | |
| | |
| Fund Share Transactions (Note 7): | | | | | | | | |
Net proceeds from sale of shares | | | 98,589,826 | | | | 127,109,285 | |
Reinvestment of distributions | | | 9,726,635 | | | | 11,626,142 | |
Cost of shares repurchased | | | (106,463,492) | | | | (130,403,789) | |
Increase in Net Assets From Fund Share Transactions | | | 1,852,969 | | | | 8,331,638 | |
Increase (Decrease) in Net Assets | | | 33,544,607 | | | | (13,835,124) | |
| | |
| Net Assets: | | | | | | | | |
Beginning of year | | | 428,834,671 | | | | 442,669,795 | |
End of year | | $ | 462,379,278 | | | $ | 428,834,671 | |
See Notes to Financial Statements.
| | |
18 | | Western Asset Inflation Indexed Plus Bond Fund 2019 Annual Report |
Financial highlights
| | | | | | | | | | | | | | | | | | | | |
| For a share of capital stock outstanding throughout each year ended December 31: | |
| Class A Shares1 | | 2019 | | | 2018 | | | 2017 | | | 2016 | | | 2015 | |
| | | | | |
| Net asset value, beginning of year | | | $10.56 | | | | $11.11 | | | | $10.93 | | | | $10.83 | | | | $11.17 | |
| | | | | |
| Income (loss) from operations: | | | | | | | | | | | | | | | | | | | | |
Net investment income (loss) | | | 0.19 | | | | 0.27 | | | | 0.19 | | | | 0.13 | | | | (0.03) | |
Net realized and unrealized gain (loss) | | | 0.80 | | | | (0.56) | | | | 0.18 | | | | 0.10 | | | | (0.27) | |
Total income (loss) from operations | | | 0.99 | | | | (0.29) | | | | 0.37 | | | | 0.23 | | | | (0.30) | |
| | | | | |
| Less distributions from: | | | | | | | | | | | | | | | | | | | | |
Net investment income | | | (0.21) | | | | (0.26) | | | | (0.19) | | | | (0.11) | | | | (0.02) | |
Net realized gains | | | — | | | | — | | | | — | | | | (0.02) | | | | — | |
Return of capital | | | — | | | | — | | | | — | | | | — | | | | (0.02) | |
Total distributions | | | (0.21) | | | | (0.26) | | | | (0.19) | | | | (0.13) | | | | (0.04) | |
| | | | | |
| Net asset value, end of year | | | $11.34 | | | | $10.56 | | | | $11.11 | | | | $10.93 | | | | $10.83 | |
Total return2 | | | 9.37 | % | | | (2.60) | % | | | 3.44 | % | | | 2.13 | % | | | (2.72) | % |
| | | | | |
| Net assets, end of year (000s) | | | $10,140 | | | | $16,984 | | | | $21,848 | | | | $23,071 | | | | $20,050 | |
| | | | | |
| Ratios to average net assets: | | | | | | | | | | | | | | | | | | | | |
Gross expenses | | | 0.71 | % | | | 0.70 | % | | | 0.71 | % | | | 0.70 | % | | | 0.65 | % |
Net expenses3 | | | 0.71 | 4 | | | 0.70 | 4 | | | 0.71 | 4 | | | 0.70 | | | | 0.65 | |
Net investment income (loss) | | | 1.75 | | | | 2.45 | | | | 1.73 | | | | 1.15 | | | | (0.27) | |
| | | | | |
| Portfolio turnover rate | | | 60 | % | | | 85 | % | | | 43 | % | | | 81 | % | | | 69 | % |
| 1 | Per share amounts have been calculated using the average shares method. |
| 2 | Performance figures, exclusive of sales charges, may reflect compensating balance arrangements, fee waivers and/or expense reimbursements. In the absence of compensating balance arrangements, fee waivers and/or expense reimbursements, the total return would have been lower. Past performance is no guarantee of future results. |
| 3 | As a result of an expense limitation arrangement, the ratio of total annual fund operating expenses, other than interest, brokerage commissions, taxes, extraordinary expenses, deferred organizational expenses and acquired fund fees and expenses, to average net assets of Class A shares did not exceed 0.90%. This expense limitation arrangement cannot be terminated prior to December 31, 2021 without the Board of Directors’ consent. In addition, the manager has agreed to waive the Fund’s management fee to an extent sufficient to offset the net management fee payable in connection with any investment in an affiliated money market fund. |
| 4 | Reflects fee waivers and/or expense reimbursements. |
See Notes to Financial Statements.
| | |
| Western Asset Inflation Indexed Plus Bond Fund 2019 Annual Report | | 19 |
Financial highlights (cont’d)
| | | | | | | | | | | | | | | | | | | | |
| For a share of capital stock outstanding throughout each year ended December 31: | |
| Class C Shares1 | | 2019 | | | 2018 | | | 2017 | | | 2016 | | | 2015 | |
| | | | | |
| Net asset value, beginning of year | | | $10.30 | | | | $10.83 | | | | $10.66 | | | | $10.61 | | | | $11.01 | |
| | | | | |
| Income (loss) from operations: | | | | | | | | | | | | | | | | | | | | |
Net investment income (loss) | | | 0.12 | | | | 0.17 | | | | 0.12 | | | | 0.05 | | | | (0.10) | |
Net realized and unrealized gain (loss) | | | 0.77 | | | | (0.52) | | | | 0.19 | | | | 0.11 | | | | (0.27) | |
Total income (loss) from operations | | | 0.89 | | | | (0.35) | | | | 0.31 | | | | 0.16 | | | | (0.37) | |
| | | | | |
| Less distributions from: | | | | | | | | | | | | | | | | | | | | |
Net investment income | | | (0.14) | | | | (0.18) | | | | (0.14) | | | | (0.09) | | | | (0.02) | |
Net realized gains | | | — | | | | — | | | | — | | | | (0.02) | | | | — | |
Return of capital | | | — | | | | — | | | | — | | | | — | | | | (0.01) | |
Total distributions | | | (0.14) | | | | (0.18) | | | | (0.14) | | | | (0.11) | | | | (0.03) | |
| | | | | |
| Net asset value, end of year | | | $11.05 | | | | $10.30 | | | | $10.83 | | | | $10.66 | | | | $10.61 | |
Total return2 | | | 8.63 | % | | | (3.28) | % | | | 2.89 | % | | | 1.53 | % | | | (3.36) | % |
| | | | | |
| Net assets, end of year (000s) | | | $867 | | | | $857 | | | | $1,790 | | | | $1,618 | | | | $1,183 | |
| | | | | |
| Ratios to average net assets: | | | | | | | | | | | | | | | | | | | | |
Gross expenses | | | 1.38 | % | | | 1.36 | % | | | 1.32 | % | | | 1.31 | % | | | 1.30 | %3 |
Net expenses4 | | | 1.38 | 5 | | | 1.36 | | | | 1.32 | | | | 1.31 | | | | 1.30 | 3 |
Net investment income (loss) | | | 1.12 | | | | 1.60 | | | | 1.14 | | | | 0.49 | | | | (0.89) | |
| | | | | |
| Portfolio turnover rate | | | 60 | % | | | 85 | % | | | 43 | % | | | 81 | % | | | 69 | % |
| 1 | Per share amounts have been calculated using the average shares method. |
| 2 | Performance figures, exclusive of CDSC, may reflect compensating balance arrangements, fee waivers and/or expense reimbursements. In the absence of compensating balance arrangements, fee waivers and/or expense reimbursements, the total return would have been lower. Past performance is no guarantee of future results. |
| 3 | Reflects recapture of fees waived and/or expenses reimbursed from prior fiscal years. |
| 4 | As a result of an expense limitation arrangement, the ratio of total annual fund operating expenses, other than interest, brokerage commissions, taxes, extraordinary expenses, deferred organizational expenses and acquired fund fees and expenses, to average net assets of Class C shares did not exceed 1.65%. This expense limitation arrangement cannot be terminated prior to December 31, 2021 without the Board of Directors’ consent. In addition, the manager has agreed to waive the Fund’s management fee to an extent sufficient to offset the net management fee payable in connection with any investment in an affiliated money market fund. |
| 5 | Reflects fee waivers and/or expense reimbursements. |
See Notes to Financial Statements.
| | |
20 | | Western Asset Inflation Indexed Plus Bond Fund 2019 Annual Report |
| | | | | | | | | | | | | | | | | | | | |
| For a share of capital stock outstanding throughout each year ended December 31: | |
| Class C1 Shares1 | | 2019 | | | 2018 | | | 2017 | | | 2016 | | | 2015 | |
| | | | | |
| Net asset value, beginning of year | | | $10.41 | | | | $10.95 | | | | $10.76 | | | | $10.71 | | | | $11.09 | |
| | | | | |
| Income (loss) from operations: | | | | | | | | | | | | | | | | | | | | |
Net investment income (loss) | | | 0.04 | | | | 0.21 | | | | 0.14 | | | | 0.07 | | | | (0.08) | |
Net realized and unrealized gain (loss) | | | 0.89 | | | | (0.54) | | | | 0.19 | | | | 0.10 | | | | (0.27) | |
Total income (loss) from operations | | | 0.93 | | | | (0.33) | | | | 0.33 | | | | 0.17 | | | | (0.35) | |
| | | | | |
| Less distributions from: | | | | | | | | | | | | | | | | | | | | |
Net investment income | | | (0.10) | | | | (0.21) | | | | (0.14) | | | | (0.10) | | | | (0.02) | |
Net realized gains | | | — | | | | — | | | | — | | | | (0.02) | | | | — | |
Return of capital | | | — | | | | — | | | | — | | | | — | | | | (0.01) | |
Total distributions | | | (0.10) | | | | (0.21) | | | | (0.14) | | | | (0.12) | | | | (0.03) | |
| | | | | |
| Net asset value, end of year | | | $11.24 | | | | $10.41 | | | | $10.95 | | | | $10.76 | | | | $10.71 | |
Total return2 | | | 8.95 | % | | | (3.03) | % | | | 3.11 | % | | | 1.57 | % | | | (3.14) | % |
| | | | | |
| Net assets, end of year (000s) | | | $91 | | | | $702 | | | | $1,003 | | | | $1,410 | | | | $1,808 | |
| | | | | |
| Ratios to average net assets: | | | | | | | | | | | | | | | | | | | | |
Gross expenses | | | 1.21 | % | | | 1.17 | % | | | 1.14 | % | | | 1.13 | % | | | 1.10 | % |
Net expenses3 | | | 1.21 | 4 | | | 1.17 | | | | 1.14 | | | | 1.13 | | | | 1.10 | |
Net investment income (loss) | | | 0.35 | | | | 1.94 | | | | 1.32 | | | | 0.61 | | | | (0.77) | |
| | | | | |
| Portfolio turnover rate | | | 60 | % | | | 85 | % | | | 43 | % | | | 81 | % | | | 69 | % |
| 1 | Per share amounts have been calculated using the average shares method. |
| 2 | Performance figures may reflect compensating balance arrangements, fee waivers and/or expense reimbursements. In the absence of compensating balance arrangements, fee waivers and/or expense reimbursements, the total return would have been lower. Past performance is no guarantee of future results. |
| 3 | As a result of an expense limitation arrangement, the ratio of total annual fund operating expenses, other than interest, brokerage commissions, taxes, extraordinary expenses, deferred organizational expenses and acquired fund fees and expenses, to average net assets of Class C1 shares did not exceed 1.40%. This expense limitation arrangement cannot be terminated prior to December 31, 2021 without the Board of Directors’ consent. In addition, the manager has agreed to waive the Fund’s management fee to an extent sufficient to offset the net management fee payable in connection with any investment in an affiliated money market fund. |
| 4 | Reflects fee waivers and/or expense reimbursements. |
See Notes to Financial Statements.
| | |
| Western Asset Inflation Indexed Plus Bond Fund 2019 Annual Report | | 21 |
Financial highlights (cont’d)
| | | | | | | | | | | | | | | | | | | | |
| For a share of capital stock outstanding throughout each year ended December 31: | |
| Class FI Shares1 | | 2019 | | | 2018 | | | 2017 | | | 2016 | | | 2015 | |
| | | | | |
| Net asset value, beginning of year | | | $10.49 | | | | $11.03 | | | | $10.85 | | | | $10.75 | | | | $11.09 | |
| | | | | |
| Income (loss) from operations: | | | | | | | | | | | | | | | | | | | | |
Net investment income | | | 0.22 | | | | 0.23 | | | | 0.22 | | | | 0.07 | | | | 0.06 | |
Net realized and unrealized gain (loss) | | | 0.77 | | | | (0.51) | | | | 0.15 | | | | 0.16 | | | | (0.36) | |
Total income (loss) from operations | | | 0.99 | | | | (0.28) | | | | 0.37 | | | | 0.23 | | | | (0.30) | |
| | | | | |
| Less distributions from: | | | | | | | | | | | | | | | | | | | | |
Net investment income | | | (0.21) | | | | (0.26) | | | | (0.19) | | | | (0.11) | | | | (0.02) | |
Net realized gains | | | — | | | | — | | | | — | | | | (0.02) | | | | — | |
Return of capital | | | — | | | | — | | | | — | | | | — | | | | (0.02) | |
Total distributions | | | (0.21) | | | | (0.26) | | | | (0.19) | | | | (0.13) | | | | (0.04) | |
| | | | | |
| Net asset value, end of year | | | $11.27 | | | | $10.49 | | | | $11.03 | | | | $10.85 | | | | $10.75 | |
Total return2 | | | 9.48 | % | | | (2.58) | % | | | 3.45 | % | | | 2.14 | % | | | (2.74) | % |
| | | | | |
| Net assets, end of year (000s) | | | $483 | | | | $804 | | | | $1,889 | | | | $1,438 | | | | $1,845 | |
| | | | | |
| Ratios to average net assets: | | | | | | | | | | | | | | | | | | | | |
Gross expenses | | | 0.64 | % | | | 0.68 | % | | | 0.67 | % | | | 0.65 | % | | | 0.64 | %3 |
Net expenses4 | | | 0.64 | 5 | | | 0.68 | | | | 0.67 | | | | 0.65 | | | | 0.64 | 3 |
Net investment income | | | 2.03 | | | | 2.16 | | | | 1.97 | | | | 0.67 | | | | 0.54 | |
| | | | | |
| Portfolio turnover rate | | | 60 | % | | | 85 | % | | | 43 | % | | | 81 | % | | | 69 | % |
| 1 | Per share amounts have been calculated using the average shares method. |
| 2 | Performance figures may reflect compensating balance arrangements, fee waivers and/or expense reimbursements. In the absence of compensating balance arrangements, fee waivers and/or expense reimbursements, the total return would have been lower. Past performance is no guarantee of future results. |
| 3 | Reflects recapture of fees waived and/or expenses reimbursed from prior fiscal years. |
| 4 | As a result of an expense limitation arrangement, the ratio of total annual fund operating expenses, other than interest, brokerage commissions, taxes, extraordinary expenses, deferred organizational expenses and acquired fund fees and expenses, to average net assets of Class FI shares did not exceed 0.85%. This expense limitation arrangement cannot be terminated prior to December 31, 2021 without the Board of Directors’ consent. In addition, the manager has agreed to waive the Fund’s management fee to an extent sufficient to offset the net management fee payable in connection with any investment in an affiliated money market fund. |
| 5 | Reflects fee waivers and/or expense reimbursements. |
See Notes to Financial Statements.
| | |
22 | | Western Asset Inflation Indexed Plus Bond Fund 2019 Annual Report |
| | | | | | | | | | | | | | | | | | | | |
| For a share of capital stock outstanding throughout each year ended December 31: | |
| Class R Shares1 | | 2019 | | | 2018 | | | 2017 | | | 2016 | | | 2015 | |
| | | | | |
| Net asset value, beginning of year | | | $10.43 | | | | $10.97 | | | | $10.79 | | | | $10.72 | | | | $11.11 | |
| | | | | |
| Income (loss) from operations: | | | | | | | | | | | | | | | | | | | | |
Net investment income (loss) | | | 0.16 | | | | 0.23 | | | | 0.16 | | | | 0.09 | | | | (0.02) | |
Net realized and unrealized gain (loss) | | | 0.78 | | | | (0.55) | | | | 0.18 | | | | 0.10 | | | | (0.34) | |
Total income (loss) from operations | | | 0.94 | | | | (0.32) | | | | 0.34 | | | | 0.19 | | | | (0.36) | |
| | | | | |
| Less distributions from: | | | | | | | | | | | | | | | | | | | | |
Net investment income | | | (0.17) | | | | (0.22) | | | | (0.16) | | | | (0.10) | | | | (0.02) | |
Net realized gains | | | — | | | | — | | | | — | | | | (0.02) | | | | — | |
Return of capital | | | — | | | | — | | | | — | | | | — | | | | (0.01) | |
Total distributions | | | (0.17) | | | | (0.22) | | | | (0.16) | | | | (0.12) | | | | (0.03) | |
| | | | | |
| Net asset value, end of year | | | $11.20 | | | | $10.43 | | | | $10.97 | | | | $10.79 | | | | $10.72 | |
Total return2 | | | 8.99 | % | | | (2.93) | % | | | 3.18 | % | | | 1.75 | % | | | (3.03) | % |
| | | | | |
| Net assets, end of year (000s) | | | $458 | | | | $607 | | | | $1,022 | | | | $934 | | | | $921 | |
| | | | | |
| Ratios to average net assets: | | | | | | | | | | | | | | | | | | | | |
Gross expenses | | | 1.05 | % | | | 1.06 | % | | | 1.01 | % | | | 1.07 | % | | | 0.99 | % |
Net expenses3 | | | 1.05 | 4 | | | 1.06 | | | | 1.01 | | | | 1.07 | | | | 0.99 | |
Net investment income (loss) | | | 1.49 | | | | 2.11 | | | | 1.47 | | | | 0.79 | | | | (0.16) | |
| | | | | |
| Portfolio turnover rate | | | 60 | % | | | 85 | % | | | 43 | % | | | 81 | % | | | 69 | % |
| 1 | Per share amounts have been calculated using the average shares method. |
| 2 | Performance figures may reflect compensating balance arrangements, fee waivers and/or expense reimbursements. In the absence of compensating balance arrangements, fee waivers and/or expense reimbursements, the total return would have been lower. Past performance is no guarantee of future results. |
| 3 | As a result of an expense limitation arrangement, the ratio of total annual fund operating expenses, other than interest, brokerage commissions, taxes, extraordinary expenses, deferred organizational expenses and acquired fund fees and expenses, to average net assets of Class R shares did not exceed 1.15%. This expense limitation arrangement cannot be terminated prior to December 31, 2021 without the Board of Directors’ consent. In addition, the manager has agreed to waive the Fund’s management fee to an extent sufficient to offset the net management fee payable in connection with any investment in an affiliated money market fund. |
| 4 | Reflects fee waivers and/or expense reimbursements. |
See Notes to Financial Statements.
| | |
| Western Asset Inflation Indexed Plus Bond Fund 2019 Annual Report | | 23 |
Financial highlights (cont’d)
| | | | | | | | | | | | | | | | | | | | |
| For a share of capital stock outstanding throughout each year ended December 31: | |
| Class I Shares1 | | 2019 | | | 2018 | | | 2017 | | | 2016 | | | 2015 | |
| | | | | |
| Net asset value, beginning of year | | | $10.66 | | | | $11.21 | | | | $11.02 | | | | $10.90 | | | | $11.22 | |
| | | | | |
| Income (loss) from operations: | | | | | | | | | | | | | | | | | | | | |
Net investment income | | | 0.24 | | | | 0.30 | | | | 0.23 | | | | 0.15 | | | | 0.03 | |
Net realized and unrealized gain (loss) | | | 0.80 | | | | (0.55) | | | | 0.19 | | | | 0.11 | | | | (0.31) | |
Total income (loss) from operations | | | 1.04 | | | | (0.25) | | | | 0.42 | | | | 0.26 | | | | (0.28) | |
| | | | | |
| Less distributions from: | | | | | | | | | | | | | | | | | | | | |
Net investment income | | | (0.25) | | | | (0.30) | | | | (0.23) | | | | (0.12) | | | | (0.02) | |
Net realized gains | | | — | | | | — | | | | — | | | | (0.02) | | | | — | |
Return of capital | | | — | | | | — | | | | — | | | | — | | | | (0.02) | |
Total distributions | | | (0.25) | | | | (0.30) | | | | (0.23) | | | | (0.14) | | | | (0.04) | |
| | | | | |
| Net asset value, end of year | | | $11.45 | | | | $10.66 | | | | $11.21 | | | | $11.02 | | | | $10.90 | |
Total return2 | | | 9.79 | % | | | (2.25) | % | | | 3.82 | % | | | 2.40 | % | | | (2.50) | % |
| | | | | |
| Net assets, end of year (000s) | | | $51,902 | | | | $59,639 | | | | $90,372 | | | | $70,677 | | | | $103,290 | |
| | | | | |
| Ratios to average net assets: | | | | | | | | | | | | | | | | | | | | |
Gross expenses | | | 0.36 | % | | | 0.38 | % | | | 0.39 | % | | | 0.37 | % | | | 0.38 | % |
Net expenses3 | | | 0.36 | 4 | | | 0.38 | | | | 0.39 | | | | 0.37 | | | | 0.38 | |
Net investment income | | | 2.17 | | | | 2.77 | | | | 2.08 | | | | 1.33 | | | | 0.25 | |
| | | | | |
| Portfolio turnover rate | | | 60 | % | | | 85 | % | | | 43 | % | | | 81 | % | | | 69 | % |
| 1 | Per share amounts have been calculated using the average shares method. |
| 2 | Performance figures may reflect compensating balance arrangements, fee waivers and/or expense reimbursements. In the absence of compensating balance arrangements, fee waivers and/or expense reimbursements, the total return would have been lower. Past performance is no guarantee of future results. |
| 3 | The manager has agreed to waive the Fund’s management fee to an extent sufficient to offset the net management fee payable in connection with any investment in an affiliated money market fund. |
| 4 | Reflects fee waivers and/or expense reimbursements. |
See Notes to Financial Statements.
| | |
24 | | Western Asset Inflation Indexed Plus Bond Fund 2019 Annual Report |
| | | | | | | | | | | | | | | | | | | | |
| For a share of capital stock outstanding throughout each year ended December 31: | |
| Class IS Shares1 | | 2019 | | | 2018 | | | 2017 | | | 2016 | | | 2015 | |
| | | | | |
| Net asset value, beginning of year | | | $10.71 | | | | $11.27 | | | | $11.08 | | | | $10.94 | | | | $11.24 | |
| | | | | |
| Income (loss) from operations: | | | | | | | | | | | | | | | | | | | | |
Net investment income | | | 0.26 | | | | 0.32 | | | | 0.25 | | | | 0.15 | | | | 0.00 | 2 |
Net realized and unrealized gain (loss) | | | 0.80 | | | | (0.57) | | | | 0.18 | | | | 0.14 | | | | (0.26) | |
Total income (loss) from operations | | | 1.06 | | | | (0.25) | | | | 0.43 | | | | 0.29 | | | | (0.26) | |
| | | | | |
| Less distributions from: | | | | | | | | | | | | | | | | | | | | |
Net investment income | | | (0.26) | | | | (0.31) | | | | (0.24) | | | | (0.13) | | | | (0.02) | |
Net realized gains | | | — | | | | — | | | | — | | | | (0.02) | | | | — | |
Return of capital | | | — | | | | — | | | | — | | | | — | | | | (0.02) | |
Total distributions | | | (0.26) | | | | (0.31) | | | | (0.24) | | | | (0.15) | | | | (0.04) | |
| | | | | |
| Net asset value, end of year | | | $11.51 | | | | $10.71 | | | | $11.27 | | | | $11.08 | | | | $10.94 | |
Total return3 | | | 9.93 | % | | | (2.23) | % | | | 3.93 | % | | | 2.61 | % | | | (2.30) | % |
| | | | | |
| Net assets, end of year (millions) | | | $398 | | | | $349 | | | | $325 | | | | $307 | | | | $455 | |
| | | | | |
| Ratios to average net assets: | | | | | | | | | | | | | | | | | | | | |
Gross expenses | | | 0.27 | % | | | 0.28 | % | | | 0.27 | % | | | 0.26 | % | | | 0.25 | % |
Net expenses4 | | | 0.27 | 5 | | | 0.28 | | | | 0.27 | | | | 0.26 | | | | 0.25 | |
Net investment income | | | 2.31 | | | | 2.87 | | | | 2.19 | | | | 1.37 | | | | 0.02 | |
| | | | | |
| Portfolio turnover rate | | | 60 | % | | | 85 | % | | | 43 | % | | | 81 | % | | | 69 | % |
| 1 | Per share amounts have been calculated using the average shares method. |
| 2 | Amount represents less than $0.005 per share. |
| 3 | Performance figures may reflect compensating balance arrangements, fee waivers and/or expense reimbursements. In the absence of compensating balance arrangements, fee waivers and/or expense reimbursements, the total return would have been lower. Past performance is no guarantee of future results. |
| 4 | As a result of an expense limitation arrangement, the ratio of total annual fund operating expenses for Class IS did not exceed the ratio of total annual fund operating expenses for Class I shares. This expense limitation arrangement cannot be terminated prior to December 31, 2021 without the Board of Directors’ consent. In addition, the manager has agreed to waive the Fund’s management fee to an extent sufficient to offset the net management fee payable in connection with any investment in an affiliated money market fund. |
| 5 | Reflects fee waivers and/or expense reimbursements. |
See Notes to Financial Statements.
| | |
| Western Asset Inflation Indexed Plus Bond Fund 2019 Annual Report | | 25 |
Notes to financial statements
1. Organization and significant accounting policies
Western Asset Inflation Indexed Plus Bond Fund (the “Fund”) is a separate diversified investment series of Western Asset Funds, Inc. (the “Corporation”). The Corporation, a Maryland Statutory Corporation, is registered under the Investment Company Act of 1940, as amended (the “1940 Act”), as anopen-end management investment company.
The following are significant accounting policies consistently followed by the Fund and are in conformity with U.S. generally accepted accounting principles (“GAAP”). Estimates and assumptions are required to be made regarding assets, liabilities and changes in net assets resulting from operations when financial statements are prepared. Changes in the economic environment, financial markets and any other parameters used in determining these estimates could cause actual results to differ. Subsequent events have been evaluated through the date the financial statements were issued.
(a) Investment valuation.The valuations for fixed income securities (which may include, but are not limited to, corporate, government, municipal, mortgage-backed, collateralized mortgage obligations and asset-backed securities) and certain derivative instruments are typically the prices supplied by independent third party pricing services, which may use market prices or broker/dealer quotations or a variety of valuation techniques and methodologies. The independent third party pricing services use inputs that are observable such as issuer details, interest rates, yield curves, prepayment speeds, credit risks/spreads, default rates and quoted prices for similar securities. Investments inopen-end funds are valued at the closing net asset value per share of each fund on the day of valuation. Futures contracts are valued daily at the settlement price established by the board of trade or exchange on which they are traded. Equity securities for which market quotations are available are valued at the last reported sales price or official closing price on the primary market or exchange on which they trade. When the Fund holds securities or other assets that are denominated in a foreign currency, the Fund will normally use the currency exchange rates as of 4:00 p.m. (Eastern Time). If independent third party pricing services are unable to supply prices for a portfolio investment, or if the prices supplied are deemed by the manager to be unreliable, the market price may be determined by the manager using quotations from one or more broker/dealers or at the transaction price if the security has recently been purchased and no value has yet been obtained from a pricing service or pricing broker. When reliable prices are not readily available, such as when the value of a security has been significantly affected by events after the close of the exchange or market on which the security is principally traded, but before the Fund calculates its net asset value, the Fund values these securities as determined in accordance with procedures approved by the Fund’s Board of Directors.
The Board of Directors is responsible for the valuation process and has delegated the supervision of the daily valuation process to the Legg Mason North Atlantic Fund Valuation Committee (the “Valuation Committee”). The Valuation Committee, pursuant to the policies adopted by the Board of Directors, is responsible for making fair value determinations,
| | |
26 | | Western Asset Inflation Indexed Plus Bond Fund 2019 Annual Report |
evaluating the effectiveness of the Fund’s pricing policies, and reporting to the Board of Directors. When determining the reliability of third party pricing information for investments owned by the Fund, the Valuation Committee, among other things, conducts due diligence reviews of pricing vendors, monitors the daily change in prices and reviews transactions among market participants.
The Valuation Committee will consider pricing methodologies it deems relevant and appropriate when making fair value determinations. Examples of possible methodologies include, but are not limited to, multiple of earnings; discount from market of a similar freely traded security; discounted cash-flow analysis; book value or a multiple thereof; risk premium/yield analysis; yield to maturity; and/or fundamental investment analysis. The Valuation Committee will also consider factors it deems relevant and appropriate in light of the facts and circumstances. Examples of possible factors include, but are not limited to, the type of security; the issuer’s financial statements; the purchase price of the security; the discount from market value of unrestricted securities of the same class at the time of purchase; analysts’ research and observations from financial institutions; information regarding any transactions or offers with respect to the security; the existence of merger proposals or tender offers affecting the security; the price and extent of public trading in similar securities of the issuer or comparable companies; and the existence of a shelf registration for restricted securities.
For each portfolio security that has been fair valued pursuant to the policies adopted by the Board of Directors, the fair value price is compared against the last available and next available market quotations. The Valuation Committee reviews the results of such back testing monthly and fair valuation occurrences are reported to the Board of Directors quarterly.
The Fund uses valuation techniques to measure fair value that are consistent with the market approach and/or income approach, depending on the type of security and the particular circumstance. The market approach uses prices and other relevant information generated by market transactions involving identical or comparable securities. The income approach uses valuation techniques to discount estimated future cash flows to present value.
GAAP establishes a disclosure hierarchy that categorizes the inputs to valuation techniques used to value assets and liabilities at measurement date. These inputs are summarized in the three broad levels listed below:
| • | | Level 1 — quoted prices in active markets for identical investments |
| • | | Level 2 — other significant observable inputs (including quoted prices for similar investments, interest rates, prepayment speeds, credit risk, etc.) |
| • | | Level 3 — significant unobservable inputs (including the Fund’s own assumptions in determining the fair value of investments) |
The inputs or methodologies used to value securities are not necessarily an indication of the risk associated with investing in those securities.
| | |
| Western Asset Inflation Indexed Plus Bond Fund 2019 Annual Report | | 27 |
Notes to financial statements (cont’d)
The following is a summary of the inputs used in valuing the Fund’s assets and liabilities carried at fair value:
| | | | | | | | | | | | | | | | |
| ASSETS | |
| Description | | Quoted Prices
(Level 1) | | | Other Significant
Observable Inputs
(Level 2) | | | Significant
Unobservable
Inputs
(Level 3) | | | Total | |
| Long-term investments†: | | | | | | | | | | | | | | | | |
U.S. treasury inflation protected securities | | | — | | | $ | 419,524,776 | | | | — | | | $ | 419,524,776 | |
Corporate bonds & notes | | | — | | | | 24,131,293 | | | | — | | | | 24,131,293 | |
Sovereign bonds | | | — | | | | 6,373,969 | | | | — | | | | 6,373,969 | |
Non-U.S. treasury inflation protected securities | | | — | | | | 5,111,482 | | | | — | | | | 5,111,482 | |
Asset-backed securities | | | — | | | | 20,138 | | | | — | | | | 20,138 | |
| Total long-term investments | | | — | | | | 455,161,658 | | | | — | | | | 455,161,658 | |
| Short-term investments† | | $ | 2,602,433 | | | | — | | | | — | | | | 2,602,433 | |
| Total investments | | $ | 2,602,433 | | | $ | 455,161,658 | | | | — | | | $ | 457,764,091 | |
| Other financial instruments: | | | | | | | | | | | | | | | | |
Futures contracts | | $ | 870,323 | | | | — | | | | — | | | $ | 870,323 | |
Forward foreign currency contracts | | | — | | | $ | 7,223 | | | | — | | | | 7,223 | |
| Total other financial instruments | | $ | 870,323 | | | $ | 7,223 | | | | — | | | $ | 877,546 | |
| Total | | $ | 3,472,756 | | | $ | 455,168,881 | | | | — | | | $ | 458,641,637 | |
|
| LIABILITIES | |
| Description | | Quoted Prices
(Level 1) | | | Other Significant
Observable Inputs
(Level 2) | | | Significant
Unobservable
Inputs
(Level 3) | | | Total | |
| Other financial instruments: | | | | | | | | | | | | | | | | |
Forward foreign currency contracts | | | — | | | $ | 15,141 | | | | — | | | $ | 15,141 | |
| † | See Schedule of Investments for additional detailed categorizations. |
(b) Futures contracts. The Fund uses futures contracts generally to gain exposure to, or hedge against, changes in interest rates or gain exposure to, or hedge against, changes in certain asset classes. A futures contract represents a commitment for the future purchase or sale of an asset at a specified price on a specified date.
Upon entering into a futures contract, the Fund is required to deposit cash or cash equivalents with a broker in an amount equal to a certain percentage of the contract amount. This is known as the ‘‘initial margin’’ and subsequent payments (‘‘variation margin’’) are made or received by the Fund each day, depending on the daily fluctuation in the value of the contract. For certain futures, including foreign denominated futures, variation margin is not settled daily, but is recorded as a net variation margin payable or receivable. The daily
| | |
28 | | Western Asset Inflation Indexed Plus Bond Fund 2019 Annual Report |
changes in contract value are recorded as unrealized gains or losses in the Statement of Operations and the Fund recognizes a realized gain or loss when the contract is closed.
Futures contracts involve, to varying degrees, risk of loss in excess of the amounts reflected in the financial statements. In addition, there is the risk that the Fund may not be able to enter into a closing transaction because of an illiquid secondary market.
(c) Forward foreign currency contracts. The Fund enters into a forward foreign currency contract to hedge exposure of bond positions or in an attempt to increase the Fund’s return. A forward foreign currency contract is an agreement between two parties to buy and sell a currency at a set price with delivery and settlement at a future date. The contract ismarked-to-market daily and the change in value is recorded by the Fund as an unrealized gain or loss. When a forward foreign currency contract is closed, through either delivery or offset by entering into another forward foreign currency contract, the Fund recognizes a realized gain or loss equal to the difference between the value of the contract at the time it was opened and the value of the contract at the time it is closed.
Non-deliverable forward foreign currency exchange contracts are settled with the counterparty in cash without the delivery of foreign currency.
Forward foreign currency contracts involve elements of market risk in excess of the amounts reflected on the Statement of Assets and Liabilities. The Fund bears the risk of an unfavorable change in the foreign exchange rate underlying the forward foreign currency contract. Risks may also arise upon entering into these contracts from the potential inability of the counterparties to meet the terms of their contracts.
(d) Inflation-indexed bonds. Inflation-indexed bonds are fixed income securities whose principal value or interest rate is periodically adjusted according to the rate of inflation. As the index measuring inflation changes, the principal value or interest rate ofinflation-indexed bonds will be adjusted accordingly. Inflation adjustments to the principal amount of inflation-indexed bonds are reflected as an increase or decrease to investment income on the Statement of Operations. Repayment of the original bond principal upon maturity (as adjusted for inflation) is guaranteed in the case of U.S. Treasury inflation-indexed bonds. For bonds that do not provide a similar guarantee, the adjusted principal value of the bond repaid at maturity may be less than the original principal.
(e) Foreign currency translation. Investment securities and other assets and liabilities denominated in foreign currencies are translated into U.S. dollar amounts based upon prevailing exchange rates on the date of valuation. Purchases and sales of investment securities and income and expense items denominated in foreign currencies are translated into U.S. dollar amounts based upon prevailing exchange rates on the respective dates of such transactions.
The Fund does not isolate that portion of the results of operations resulting from fluctuations in foreign exchange rates on investments from the fluctuations arising from changes
| | |
| Western Asset Inflation Indexed Plus Bond Fund 2019 Annual Report | | 29 |
Notes to financial statements (cont’d)
in market prices of securities held. Such fluctuations are included with the net realized and unrealized gain or loss on investments.
Net realized foreign exchange gains or losses arise from sales of foreign currencies, including gains and losses on forward foreign currency contracts, currency gains or losses realized between the trade and settlement dates on securities transactions, and the difference between the amounts of dividends, interest, and foreign withholding taxes recorded on the Fund’s books and the U.S. dollar equivalent of the amounts actually received or paid. Net unrealized foreign exchange gains and losses arise from changes in the values of assets and liabilities, other than investments in securities, on the date of valuation, resulting from changes in exchange rates.
Foreign security and currency transactions may involve certain considerations and risks not typically associated with those of U.S. dollar denominated transactions as a result of, among other factors, the possibility of lower levels of governmental supervision and regulation of foreign securities markets and the possibility of political or economic instability.
(f) Credit and market risk. Investments in securities that are collateralized by real estate mortgages are subject to certain credit and liquidity risks. When market conditions result in an increase in default rates of the underlying mortgages and the foreclosure values of underlying real estate properties are materially below the outstanding amount of these underlying mortgages, collection of the full amount of accrued interest and principal on these investments may be doubtful. Such market conditions may significantly impair the value and liquidity of these investments and may result in a lack of correlation between their credit ratings and values.
(g) Foreign investment risks. The Fund’s investments in foreign securities may involve risks not present in domestic investments. Since securities may be denominated in foreign currencies, may require settlement in foreign currencies or pay interest or dividends in foreign currencies, changes in the relationship of these foreign currencies to the U.S. dollar can significantly affect the value of the investments and earnings of the Fund. Foreign investments may also subject the Fund to foreign government exchange restrictions, expropriation, taxation or other political, social or economic developments, all of which affect the market and/or credit risk of the investments.
(h) Counterparty risk and credit-risk-related contingent features of derivative instruments. The Fund may invest in certain securities or engage in other transactions, where the Fund is exposed to counterparty credit risk in addition to broader market risks. The Fund may invest in securities of issuers, which may also be considered counterparties as trading partners in other transactions. This may increase the risk of loss in the event of default or bankruptcy by the counterparty or if the counterparty otherwise fails to meet its contractual obligations. The Fund’s subadviser attempts to mitigate counterparty risk by (i) periodically assessing the creditworthiness of its trading partners, (ii) monitoring and/or
| | |
30 | | Western Asset Inflation Indexed Plus Bond Fund 2019 Annual Report |
limiting the amount of its net exposure to each individual counterparty based on its assessment and (iii) requiring collateral from the counterparty for certain transactions. Market events and changes in overall economic conditions may impact the assessment of such counterparty risk by the subadviser. In addition, declines in the values of underlying collateral received may expose the Fund to increased risk of loss.
With exchange traded and centrally cleared derivatives, there is less counterparty risk to the Fund since the exchange or clearinghouse, as counterparty to such instruments, guarantees against a possible default. The clearinghouse stands between the buyer and the seller of the contract; therefore, the credit risk is limited to failure of the clearinghouse. While offset rights may exist under applicable law, the Fund does not have a contractual right of offset against a clearing broker or clearinghouse in the event of a default of the clearing broker or clearinghouse.
The Fund has entered into master agreements, such as an International Swaps and Derivatives Association, Inc. Master Agreement (“ISDA Master Agreement”) or similar agreement, with certain of its derivative counterparties that governover-the-counter derivatives and provide for general obligations, representations, agreements, collateral posting terms, netting provisions in the event of default or termination and credit related contingent features. The credit related contingent features include, but are not limited to, a percentage decrease in the Fund’s net assets or NAV over a specified period of time. If these credit related contingent features were triggered, the derivatives counterparty could terminate the positions and demand payment or require additional collateral.
Under an ISDA Master Agreement, the Fund may, under certain circumstances, offset with the counterparty certain derivative financial instruments’ payables and/or receivables with collateral held and/or posted and create one single net payment. However, absent an event of default by the counterparty or a termination of the agreement, the terms of the ISDA Master Agreements do not result in an offset of reported amounts of financial assets and financial liabilities in the Statement of Assets and Liabilities across transactions between the Fund and the applicable counterparty. The enforceability of the right to offset may vary by jurisdiction.
Collateral requirements differ by type of derivative. Collateral or margin requirements are set by the broker or exchange clearinghouse for exchange traded derivatives while collateral terms are contract specific forover-the-counter traded derivatives. Cash collateral that has been pledged to cover obligations of the Fund under derivative contracts, if any, will be reported separately in the Statement of Assets and Liabilities. Securities pledged as collateral, if any, for the same purpose are noted in the Schedule of Investments.
As of December 31, 2019, the Fund held forward foreign currency contracts with credit related contingent features which had a liability position of $15,141. If a contingent feature in the master agreements would have been triggered, the Fund would have been required to pay this amount to its derivatives counterparties.
| | |
| Western Asset Inflation Indexed Plus Bond Fund 2019 Annual Report | | 31 |
Notes to financial statements (cont’d)
(i) Security transactions and investment income. Security transactions are accounted for on a trade date basis. Interest income (including interest income frompayment-in-kind securities), adjusted for amortization of premium and accretion of discount, is recorded on the accrual basis. Paydown gains and losses on mortgage- and asset-backed securities are recorded as adjustments to interest income. Dividend income is recorded on theex-dividend date for dividends received in cash and/or securities. The cost of investments sold is determined by use of the specific identification method. To the extent any issuer defaults or a credit event occurs that impacts the issuer, the Fund may halt any additional interest income accruals and consider the realizability of interest accrued up to the date of default or credit event.
(j) Distributions to shareholders. Distributions from net investment income of the Fund, if any, are declared and paid on a quarterly basis. Distributions of net realized gains, if any, are declared at least annually. Distributions to shareholders of the Fund are recorded on theex-dividend date and are determined in accordance with income tax regulations, which may differ from GAAP.
(k) Share class accounting. Investment income, common expenses and realized/ unrealized gains (losses) on investments are allocated to the various classes of the Fund on the basis of daily net assets of each class. Fees relating to a specific class are charged directly to that share class.
(l) Compensating balance arrangements. The Fund has an arrangement with its custodian bank whereby a portion of the custodian’s fees is paid indirectly by credits earned on the Fund’s cash on deposit with the bank.
(m) Federal and other taxes. It is the Fund’s policy to comply with the federal income and excise tax requirements of the Internal Revenue Code of 1986 (the “Code”), as amended, applicable to regulated investment companies. Accordingly, the Fund intends to distribute its taxable income and net realized gains, if any, to shareholders in accordance with timing requirements imposed by the Code. Therefore, no federal or state income tax provision is required in the Fund’s financial statements.
Management has analyzed the Fund’s tax positions taken on income tax returns for all open tax years and has concluded that as of December 31, 2019, no provision for income tax is required in the Fund’s financial statements. The Fund’s federal and state income and federal excise tax returns for tax years for which the applicable statutes of limitations have not expired are subject to examination by the Internal Revenue Service and state departments of revenue.
Under the applicable foreign tax laws, a withholding tax may be imposed on interest, dividends and capital gains at various rates.
| | |
32 | | Western Asset Inflation Indexed Plus Bond Fund 2019 Annual Report |
(n) Reclassification. GAAP requires that certain components of net assets be reclassified to reflect permanent differences between financial and tax reporting. These reclassifications have no effect on net assets or net asset value per share. During the current year, the Fund had no reclassifications.
2. Investment management agreement and other transactions with affiliates
Legg Mason Partners Fund Advisor, LLC (“LMPFA”) is the Fund’s investment manager. Western Asset Management Company, LLC (“Western Asset”), Western Asset Management Company Limited in London (“Western Asset London”), Western Asset Management Company Pte. Ltd. in Singapore (“Western Asset Singapore”) and Western Asset Management Company Ltd in Japan (“Western Asset Japan”) are the Fund’s subadvisers. LMPFA, Western Asset, Western Asset London, Western Asset Singapore and Western Asset Japan are wholly-owned subsidiaries of Legg Mason, Inc. (“Legg Mason”).
LMPFA provides the Fund with management and administrative services for which the Fund pays a fee, calculated daily and paid monthly, at an annual rate of 0.20% of the Fund’s average daily net assets. For their services, LMPFA pays Western Asset, Western Asset London, Western Asset Singapore and Western Asset Japan monthly all of the management fee that it receives from the Fund.
As a result of expense limitation arrangements between the Fund and LMPFA, the ratio of total annual fund operating expenses, other than interest, brokerage commissions, taxes, extraordinary expenses, deferred organizational expenses and acquired fund fees and expenses, to average net assets of Class A, Class C, Class C1, Class FI and Class R shares did not exceed 0.90%, 1.65%, 1.40%, 0.85% and 1.15%, respectively. In addition, the ratio of total annual fund operating expenses for Class IS shares did not exceed the ratio of total annual fund operating expenses for Class I shares. These expense limitation arrangements cannot be terminated prior to December 31, 2021 without the Board of Directors’ consent. In addition, LMPFA has agreed to waive the Fund’s management fee to an extent sufficient to offset the net management fee payable in connection with any investment in an affiliated money market fund (the “affiliated money market fund waiver”). The affiliated money market fund waiver is not subject to the recapture provision discussed below.
During the year ended December 31, 2019, fees waived and/or expenses reimbursed amounted to $410, all of which was an affiliated money market fund waiver.
LMPFA is permitted to recapture amounts waived and/or reimbursed to a class within two years after the fiscal year in which LMPFA earned the fee or incurred the expense if the class’ total annual operating expenses have fallen to a level below the expense limitation (“expense cap”) in effect at the time the fees were earned or the expenses incurred. In no case will LMPFA recapture any amount that would result, on any particular business day of the Fund, in the class’ total annual operating expenses exceeding the expense cap or any other lower limit then in effect.
| | |
| Western Asset Inflation Indexed Plus Bond Fund 2019 Annual Report | | 33 |
Notes to financial statements (cont’d)
Pursuant to these arrangements, at December 31, 2019, the Fund had no remaining fee waivers and/or expense reimbursements subject to recapture by LMPFA. For the year ended December 31, 2019, LMPFA did not recapture any fees.
Legg Mason Investor Services, LLC (“LMIS”), a wholly-owned broker-dealer subsidiary of Legg Mason, serves as the Fund’s sole and exclusive distributor.
There is a maximum initial sales charge of 4.25% for Class A shares. There is a contingent deferred sales charge (“CDSC”) of 1.00% on Class C shares, which applies if redemption occurs within 12 months from purchase payment. In certain cases, Class A shares have a 1.00% CDSC, which applies if redemption occurs within 18 months from purchase payment. This CDSC only applies to those purchases of Class A shares, which, when combined with current holdings of other shares of funds sold by LMIS, equal or exceed $1,000,000 in the aggregate. These purchases do not incur an initial sales charge.
For the year ended December 31, 2019, sales charges retained by and CDSCs paid to LMIS and its affiliates, if any, were as follows:
| | | | |
| | | Class A | |
| Sales charges | | $ | 117 | |
| CDSCs | | | — | |
All officers of the Corporation are employees of Legg Mason or its affiliates and do not receive compensation from the Corporation.
3. Investments
During the year ended December 31, 2019, the aggregate cost of purchases and proceeds from sales of investments (excluding short-term investments) and U.S. Government & Agency Obligations were as follows:
| | | | | | | | |
| | | Investments | | | U.S. Government &
Agency Obligations | |
| Purchases | | $ | 10,233,484 | | | $ | 255,871,628 | |
| Sales | | | 9,901,911 | | | | 265,173,474 | |
At December 31, 2019, the aggregate cost of investments and the aggregate gross unrealized appreciation and depreciation of investments for federal income tax purposes were as follows:
| | | | | | | | | | | | | | | | |
| | | Cost | | | Gross
Unrealized
Appreciation | | | Gross
Unrealized
Depreciation | | | Net
Unrealized
Appreciation
(Depreciation) | |
| Securities | | $ | 438,504,359 | | | $ | 19,802,577 | | | $ | (542,845) | | | $ | 19,259,732 | |
| Futures contracts | | | — | | | | 870,323 | | | | — | | | | 870,323 | |
| Forward foreign currency contracts | | | — | | | | 7,223 | | | | (15,141) | | | | (7,918) | |
| | |
34 | | Western Asset Inflation Indexed Plus Bond Fund 2019 Annual Report |
4. Derivative instruments and hedging activities
Below is a table, grouped by derivative type, that provides information about the fair value and the location of derivatives within the Statement of Assets and Liabilities at December 31, 2019.
| | | | | | | | | | | | |
| ASSET DERIVATIVES1 | |
| | | Interest
Rate Risk | | | Foreign
Exchange Risk | | | Total | |
| Futures contracts2 | | $ | 870,323 | | | | — | | | $ | 870,323 | |
| Forward foreign currency contracts | | | — | | | $ | 7,223 | | | | 7,223 | |
| Total | | $ | 870,323 | | | $ | 7,223 | | | $ | 877,546 | |
| | | | |
| LIABILITY DERIVATIVES1 | |
| | | Foreign
Exchange Risk | |
| Forward foreign currency contracts | | $ | 15,141 | |
| 1 | Generally, the balance sheet location for asset derivatives is receivables/net unrealized appreciation (depreciation) and for liability derivatives is payables/net unrealized appreciation (depreciation). |
| 2 | Includes cumulative appreciation (depreciation) of futures contracts as reported in the Schedule of Investments. Only variation margin is reported within the receivables and/or payables on the Statement of Assets and Liabilities. |
The following tables provide information about the effect of derivatives and hedging activities on the Fund’s Statement of Operations for the year ended December 31, 2019. The table provides additional detail about the amounts and sources of gains (losses) realized on derivatives during the period. The second table provides additional information about the change in unrealized appreciation (depreciation) resulting from the Fund’s derivatives and hedging activities during the period.
| | | | | | | | | | | | |
| AMOUNT OF REALIZED GAIN (LOSS) ON DERIVATIVES RECOGNIZED | |
| | | Interest
Rate Risk | | | Foreign
Exchange Risk | | | Total | |
| Futures contracts | | $ | (3,982,738) | | | | — | | | $ | (3,982,738) | |
| Forward foreign currency contracts | | | — | | | $ | 40,564 | | | | 40,564 | |
| Total | | $ | (3,982,738) | | | $ | 40,564 | | | $ | (3,942,174) | |
| | | | | | | | | | | | |
| CHANGE IN UNREALIZED APPRECIATION (DEPRECIATION) ON DERIVATIVES RECOGNIZED | |
| | | Interest
Rate Risk | | | Foreign
Exchange Risk | | | Total | |
| Futures contracts | | $ | 1,810,771 | | | | — | | | $ | 1,810,771 | |
| Forward foreign currency contracts | | | — | | | $ | (7,159) | | | | (7,159) | |
| Total | | $ | 1,810,771 | | | $ | (7,159) | | | $ | 1,803,612 | |
| | |
| Western Asset Inflation Indexed Plus Bond Fund 2019 Annual Report | | 35 |
Notes to financial statements (cont’d)
During the year ended December 31, 2019, the volume of derivative activity for the Fund was as follows:
| | | | |
| | | Average Market
Value | |
| Futures contracts (to buy)† | | $ | 550,168 | |
| Futures contracts (to sell) | | | 54,280,841 | |
| Forward foreign currency contracts (to buy) | | | 303,842 | |
| Forward foreign currency contracts (to sell) | | | 825,738 | |
| † | At December 31, 2019, there were no open positions held in this derivative. |
The following table presents the Fund’s OTC derivative assets and liabilities by counterparty net of amounts available for offset under an ISDA Master Agreement and net of the related collateral pledged (received) by the Fund as of December 31, 2019.
| | | | | | | | | | | | | | | | | | | | |
| Counterparty | | Gross Assets
Subject to
Master
Agreements1
| | | Gross Liabilities
Subject to
Master
Agreements1 | | | Net Assets
(Liabilities)
Subject to
Master
Agreements | | | Collateral
Pledged
(Received) | | | Net
Amount2
| |
| Barclays Bank PLC | | | — | | | $ | (5,157) | | | $ | (5,157) | | | | — | | | $ | (5,157) | |
| BNP Paribas SA | | $ | 6,409 | | | | (3,009) | | | | 3,400 | | | | — | | | | 3,400 | |
| Citibank N.A. | | | 814 | | | | (6,975) | | | | (6,161) | | | | — | | | | (6,161) | |
| Total | | $ | 7,223 | | | $ | (15,141) | | | $ | (7,918) | | | | — | | | $ | (7,918) | |
| 1 | Absent an event of default or early termination, derivative assets and liabilities are presented gross and not offset in the Statement of Assets and Liabilities. |
| 2 | Represents the net amount receivable (payable) from (to) the counterparty in the event of default. |
5. Class specific expenses, waivers and/or expense reimbursements
The Fund has adopted a Rule12b-1 shareholder services and distribution plan and under that plan the Fund pays service and/or distribution fees with respect to its Class A, Class C, Class C1, Class FI and Class R shares calculated at the annual rate of 0.25%, 1.00%, 0.75%, 0.25% and 0.50% of the average daily net assets of each class, respectively. Service and/or distribution fees are accrued daily and paid monthly.
For the year ended December 31, 2019, class specific expenses were as follows:
| | | | | | | | |
| | | Service and/or
Distribution Fees | | | Transfer Agent
Fees | |
| Class A | | $ | 34,089 | | | $ | 25,439 | |
| Class C | | | 8,056 | | | | 903 | |
| Class C1 | | | 1,729 | | | | 450 | |
| Class FI | | | 2,110 | | | | 1,033 | |
| Class R | | | 2,963 | | | | 1,657 | |
| Class I | | | — | | | | 51,873 | |
| Class IS | | | — | | | | 3,615 | |
| Total | | $ | 48,947 | | | $ | 84,970 | |
| | |
36 | | Western Asset Inflation Indexed Plus Bond Fund 2019 Annual Report |
For the year ended December 31, 2019, waivers and/or expense reimbursements by class were as follows:
| | | | |
| | | Waivers/Expense
Reimbursements | |
| Class A | | $ | 9 | |
| Class C | | | 1 | |
| Class C1 | | | 0 | * |
| Class FI | | | 1 | |
| Class R | | | 0 | * |
| Class I | | | 46 | |
| Class IS | | | 353 | |
| Total | | $ | 410 | |
* Amount represents less than $1.
6. Distributions to shareholders by class
| | | | | | | | |
| | | Year Ended
December 31, 2019 | | | Year Ended
December 31, 2018 | |
| Net Investment Income: | | | | | | | | |
| Class A | | $ | 226,561 | | | $ | 479,886 | |
| Class C | | | 10,206 | | | | 19,746 | |
| Class C1 | | | 831 | | | | 15,156 | |
| Class FI | | | 14,889 | | | | 22,490 | |
| Class R | | | 8,208 | | | | 19,119 | |
| Class I | | | 1,217,629 | | | | 2,126,094 | |
| Class IS | | | 8,780,644 | | | | 9,917,614 | |
| Total | | $ | 10,258,968 | | | $ | 12,600,105 | |
7. Capital shares
At December 31, 2019, the Corporation had 42.7 billion shares of capital stock authorized with a par value of $0.001 per share. Transactions in shares of each class were as follows:
| | | | | | | | | | | | | | | | |
| | | Year Ended
December 31, 2019 | | | Year Ended
December 31, 2018 | |
| | | Shares | | | Amount | | | Shares | | | Amount | |
| Class A | | | | | | | | | | | | | | | | |
| Shares sold | | | 305,001 | | | $ | 3,392,795 | | | | 521,386 | | | $ | 5,661,556 | |
| Shares issued on reinvestment | | | 9,909 | | | | 111,659 | | | | 14,737 | | | | 158,964 | |
| Shares repurchased | | | (1,028,639) | | | | (11,398,327) | | | | (895,024) | | | | (9,691,697) | |
| Net decrease | | | (713,729) | | | $ | (7,893,873) | | | | (358,901) | | | $ | (3,871,177) | |
| | | | |
| Class C | | | | | | | | | | | | | | | | |
| Shares sold | | | 11,014 | | | $ | 122,944 | | | | 4,247 | | | $ | 43,833 | |
| Shares issued on reinvestment | | | 774 | | | | 8,511 | | | | 1,713 | | | | 18,051 | |
| Shares repurchased | | | (16,495) | | | | (174,776) | | | | (88,194) | | | | (924,664) | |
| Net decrease | | | (4,707) | | | $ | (43,321) | | | | (82,234) | | | $ | (862,780) | |
| | |
| Western Asset Inflation Indexed Plus Bond Fund 2019 Annual Report | | 37 |
Notes to financial statements (cont’d)
| | | | | | | | | | | | | | | | |
| | | Year Ended
December 31, 2019 | | | Year Ended
December 31, 2018 | |
| | | Shares | | | Amount | | | Shares | | | Amount | |
| Class C1 | | | | | | | | | | | | | | | | |
| Shares sold | | | 689 | | | $ | 7,473 | | | | 951 | | | $ | 10,110 | |
| Shares issued on reinvestment | | | 73 | | | | 814 | | | | 1,410 | | | | 15,006 | |
| Shares repurchased | | | (60,146) | | | | (642,977) | | | | (26,506) | | | | (285,961) | |
| Net decrease | | | (59,384) | | | $ | (634,690) | | | | (24,145) | | | $ | (260,845) | |
| Class FI | | | | | | | | | | | | | | | | |
| Shares sold | | | 14,150 | | | $ | 153,767 | | | | 25,798 | | | $ | 280,118 | |
| Shares issued on reinvestment | | | 1,334 | | | | 14,889 | | | | 2,098 | | | | 22,490 | |
| Shares repurchased | | | (49,272) | | | | (554,466) | | | | (122,494) | | | | (1,321,768) | |
| Net decrease | | | (33,788) | | | $ | (385,810) | | | | (94,598) | | | $ | (1,019,160) | |
| Class R | | | | | | | | | | | | | | | | |
| Shares sold | | | 20,303 | | | $ | 222,661 | | | | 28,032 | | | $ | 301,417 | |
| Shares issued on reinvestment | | | 117 | | | | 1,301 | | | | 138 | | | | 1,472 | |
| Shares repurchased | | | (37,715) | | | | (417,877) | | | | (63,166) | | | | (668,384) | |
| Net decrease | | | (17,295) | | | $ | (193,915) | | | | (34,996) | | | $ | (365,495) | |
| Class I | | | | | | | | | | | | | | | | |
| Shares sold | | | 1,696,940 | | | $ | 19,031,646 | | | | 1,801,103 | | | $ | 19,730,203 | |
| Shares issued on reinvestment | | | 106,733 | | | | 1,212,625 | | | | 189,810 | | | | 2,067,617 | |
| Shares repurchased | | | (2,863,776) | | | | (32,056,987) | | | | (4,458,717) | | | | (48,635,044) | |
| Net decrease | | | (1,060,103) | | | $ | (11,812,716) | | | | (2,467,804) | | | $ | (26,837,224) | |
| Class IS | | | | | | | | | | | | | | | | |
| Shares sold | | | 6,718,264 | | | $ | 75,658,540 | | | | 9,168,999 | | | $ | 101,082,048 | |
| Shares issued on reinvestment | | | 733,292 | | | | 8,376,836 | | | | 853,737 | | | | 9,342,542 | |
| Shares repurchased | | | (5,418,133) | | | | (61,218,082) | | | | (6,254,105) | | | | (68,876,271) | |
| Net increase | | | 2,033,423 | | | $ | 22,817,294 | | | | 3,768,631 | | | $ | 41,548,319 | |
8. Transactions with affiliated companies
As defined by the 1940 Act, an affiliated company is one in which the Fund owns 5% or more of the outstanding voting securities, or a company which is under common ownership or control. The Fund invested in Western Asset Premier Institutional Government Reserves, Premium Shares, an affiliated registered money market fund and Western Asset Government Cash Management Portfolio, LLC (“Cash Management Portfolio”), an affiliated private money market fund, both managed by Western Asset, the Fund’s subadviser. Cash Management Portfolio was available as a cash management vehicle for certain proprietary investment companies affiliated with Legg Mason. While Cash Management Portfolio was not a registered money market fund, it conducted all of its investment activities in accordance with the requirements of Rule2a-7 under the 1940 Act. Based on the Fund’s relative ownership, the following companies were considered affiliated companies for all or some portion
| | |
38 | | Western Asset Inflation Indexed Plus Bond Fund 2019 Annual Report |
of the year ended December 31, 2019. The following transactions were effected in shares of such companies for the year ended December 31, 2019.
| | | | | | | | | | | | | | | | | | | | |
| | | Affiliate
Value at
December 31, 2018 | | | Purchased | | | Sold | |
| | | Cost | | | Shares | | | Cost | | | Shares | |
| Western Asset Government Cash Management Portfolio, LLC | | $ | 233,602 | | | $ | 101,861,562 | | | | 101,861,562 | | | $ | 102,095,164 | | | | 102,095,164 | |
| Western Asset Premier Institutional Government Reserves, Premium Shares | | | — | | | | 16,985,132 | | | | 16,985,132 | | | | 14,382,699 | | | | 14,382,699 | |
| | | $ | 233,602 | | | $ | 118,846,694 | | | | | | | $ | 116,477,863 | | | | | |
| | | | | | | | | | | | | | | | |
| (cont’d) | | Realized
Gain (Loss) | | | Interest
Income | | | Net Increase
(Decrease) in
Unrealized
Appreciation
(Depreciation) | | | Affiliate
Value at
December 31,
2019 | |
| Western Asset Government Cash Management Portfolio, LLC | | | — | | | $ | 49,869 | | | | — | | | | — | |
| Western Asset Premier Institutional Government Reserves, Premium Shares | | | — | | | | 7,217 | | | | — | | | $ | 2,602,433 | |
| | | | — | | | $ | 57,086 | | | | — | | | $ | 2,602,433 | |
9. Redemption facility
The Fund and certain other participating funds within the Corporation (the “Participating Funds”), have available an unsecured revolving credit facility (the “Redemption Facility”) from the lenders and The Bank of New York Mellon (“BNY Mellon”), as administrative agent for the lenders. The Redemption Facility is to be used for temporary or emergency purposes as an additional source of liquidity to fund redemptions of shares. Under the agreement, BNY Mellon provides a364-day revolving credit facility, in the aggregate amount of $265 million. Unless renewed, the agreement will terminate on November 16, 2020. Any borrowings under the Redemption Facility will bear interest at current market rates as set forth in the credit agreement. The annual commitment fee to maintain the Redemption Facility is 0.15% and is incurred on the unused portion of the facility and is allocated to all Participating Funds pro rata based on net assets; there is no upfront fee. Prior to November 18, 2019, the Fund paid a commitment fee of 0.10% and an upfront fee of 0.05%. For
| | |
| Western Asset Inflation Indexed Plus Bond Fund 2019 Annual Report | | 39 |
Notes to financial statements (cont’d)
the year ended December 31, 2019, the Fund incurred a commitment fee in the amount of $2,854. The Fund did not utilize the Redemption Facility during the year ended December 31, 2019.
10. Income tax information and distributions to shareholders
The tax character of distributions paid during the fiscal years ended December 31, was as follows:
| | | | | | | | |
| | | 2019 | | | 2018 | |
| Distributions paid from: | | | | | | | | |
| Ordinary income | | $ | 10,258,968 | | | $ | 12,600,105 | |
As of December 31, 2019, the components of distributable earnings (loss) on a tax basis were as follows:
| | | | |
| Undistributed ordinary income — net | | $ | 55,825 | |
| Deferred capital losses* | | | (8,704,229) | |
| Other book/tax temporary differences(a) | | | (8,342,074) | |
| Unrealized appreciation (depreciation)(b) | | | 20,109,712 | |
| Total distributable earnings (loss) — net | | $ | 3,119,234 | |
| * | These capital losses have been deferred in the current year as either short-term or long-term losses. The losses will be deemed to occur on the first day of the next taxable year in the same character as they were originally deferred and will be available to offset future taxable capital gains. |
| (a) | Other book/tax temporary differences are attributable to the tax deferral of losses on straddles, the realization for tax purposes of unrealized gains (losses) on certain futures and foreign currency contracts and book/tax differences in the timing of the deductibility of various expenses. |
| (b) | The difference between book-basis andtax-basis unrealized appreciation (depreciation) is attributable to the tax deferral of losses on wash sales, the difference between book and tax amortization methods for premiums on fixed income securities and the difference between the book and tax cost basis of investments in partnerships. |
11. Recent accounting pronouncement
The Fund has adopted the disclosure provisions of the Financial Accounting Standards Board Accounting Standards UpdateNo. 2018-13,Fair Value Measurement (Topic 820)—Disclosure Framework—Changes to the Disclosure Requirements for Fair Value Measurement(“ASU2018-13”) which introduces new fair value disclosure requirements as well as eliminates and modifies certain existing fair value disclosure requirements. ASU2018-13 would be effective for fiscal years beginning after December 15, 2019, and interim periods within those fiscal years; however, management has elected to early adopt ASU2018-13. The impact of the Fund’s adoption was limited to changes in the Fund’s financial statement disclosures regarding fair value, primarily those disclosures related to transfers between levels of the fair value hierarchy.
12. Subsequent event
On February 18, 2020, Franklin Resources, Inc. (“Franklin Resources”) and Legg Mason, Inc. (“Legg Mason”) announced that they have entered into a definitive agreement for Franklin Resources to acquire Legg Mason in anall-cash transaction. As part of this transaction, the
| | |
40 | | Western Asset Inflation Indexed Plus Bond Fund 2019 Annual Report |
Fund’s investment adviser (the “Manager”), currently an indirect wholly owned subsidiary of Legg Mason, would become an indirect wholly owned subsidiary of Franklin Resources. The transaction is subject to approval by Legg Mason’s shareholders and customary closing conditions, including receipt of applicable regulatory approvals. Subject to such approvals and the satisfaction of the other conditions, the transaction is expected to be consummated later this year.
Under the Investment Company Act of 1940, consummation of the transaction will result in the automatic termination of the Fund’s investment management contract with the Manager, and any relatedsub-advisory contract(s), where applicable. Therefore, the Fund’s Board is expected to be asked to approve a new investment management contract between the Fund and the Manager (and a newsub-advisory contract(s), if applicable). If approved by the Board, the new investment management contract (and the newsub-advisory contract(s), if applicable) is expected to be presented to the shareholders of the Fund for their approval.
| | |
| Western Asset Inflation Indexed Plus Bond Fund 2019 Annual Report | | 41 |
Report of independent registered public accounting firm
To the Board of Directors of Western Asset Funds, Inc. and Shareholders of Western Asset Inflation Indexed Plus Bond Fund
Opinion on the Financial Statements
We have audited the accompanying statement of assets and liabilities, including the schedule of investments, of Western Asset Inflation Indexed Plus Bond Fund (one of the funds constituting Western Asset Funds, Inc., referred to hereafter as the “Fund”) as of December 31, 2019, the related statement of operations for the year ended December 31, 2019, the statement of changes in net assets for each of the two years in the period ended December 31, 2019, including the related notes, and the financial highlights for each of the five years in the period ended December 31, 2019 (collectively referred to as the “financial statements”). In our opinion, the financial statements present fairly, in all material respects, the financial position of the Fund as of December 31, 2019, the results of its operations for the year then ended, the changes in its net assets for each of the two years in the period ended December 31, 2019 and the financial highlights for each of the five years in the period ended December 31, 2019 in conformity with accounting principles generally accepted in the United States of America.
Basis for Opinion
These financial statements are the responsibility of the Fund’s management. Our responsibility is to express an opinion on the Fund’s financial statements based on our audits. We are a public accounting firm registered with the Public Company Accounting Oversight Board (United States) (PCAOB) and are required to be independent with respect to the Fund in accordance with the U.S. federal securities laws and the applicable rules and regulations of the Securities and Exchange Commission and the PCAOB.
We conducted our audits of these financial statements in accordance with the standards of the PCAOB. Those standards require that we plan and perform the audit to obtain reasonable assurance about whether the financial statements are free of material misstatement, whether due to error or fraud.
Our audits included performing procedures to assess the risks of material misstatement of the financial statements, whether due to error or fraud, and performing procedures that respond to those risks. Such procedures included examining, on a test basis, evidence regarding the amounts and disclosures in the financial statements. Our audits also included evaluating the accounting principles used and significant estimates made by management, as well as evaluating the overall presentation of the financial statements. Our procedures included confirmation of securities owned as of December 31, 2019 by correspondence with the custodian and brokers; when replies were not received from brokers, we performed other auditing procedures. We believe that our audits provide a reasonable basis for our opinion.
/s/PricewaterhouseCoopers LLP
Baltimore, Maryland
February 21, 2020
We have served as the auditor of one or more investment companies in Legg Mason investment company group since at least 1973. We have not been able to determine the specific year we began serving as auditor.
| | |
42 | | Western Asset Inflation Indexed Plus Bond Fund 2019 Annual Report |
Board approval of management and subadvisory agreements(unaudited)
The Executive and Contracts Committee of the Board of Directors considered the Investment Management Agreement between the Corporation and LMPFA with respect to the Fund and the Investment Advisory Agreements between LMPFA and Western Asset Management Company, LLC (“Western Asset”), Western Asset Management Company Limited in London (“WAML”), Western Asset Management Company Pte. Ltd. in Singapore (“Western Singapore”) and Western Asset Management Company Ltd in Japan (“Western Japan,” and together with Western Singapore and WAML, the“Non-U.S. Subadvisers,” and together with Western Asset, the “Subadvisers”) (collectively, the “Agreements”) with respect to the Fund at meetings held on September 10, 2019 and October 29, 2019. At a meeting held on November 18, 2019, the Executive and Contracts Committee reported to the full Board of Directors its considerations and recommendation with respect to the Agreements, and the Board of Directors, including a majority of the Independent Directors, considered and approved renewal of the Agreements.
The Directors noted that although Western Asset’s business is operated through separate legal entities, such as theNon-U.S. Subadvisers, its business is highly integrated and senior investment personnel at Western Asset have supervisory oversight responsibility over the investment decisions made by theNon-U.S. Subadvisers. Therefore, in connection with their deliberations noted below, the Directors primarily focused on the information provided by Western Asset when considering the approval of the Investment Advisory Agreements between LMPFA and theNon-U.S. Subadvisers with respect to the Fund. The Directors also noted that the Fund does not pay any management fees directly to Western Asset or to any of theNon-U.S. Subadvisers because LMPFA pays the Subadvisers for services provided to the Fund out of the management fee LMPFA receives from the Fund.
In arriving at their decision to approve the renewal of the Agreements, the Directors met with representatives of Western Asset, including relevant investment advisory personnel, as well as representatives of LMPFA; reviewed a variety of information prepared by LMPFA and Western Asset and materials provided by Broadridge and counsel to the Independent Directors; reviewed performance and expense information for the Fund’s peer group of comparable funds selected and prepared by Broadridge and for certain other comparable products available from Western Asset, including separate accounts managed by Western Asset; and requested and reviewed additional information as necessary. These reviews were in addition to information obtained by the Directors at their regular quarterly meetings with respect to the Fund’s performance and other relevant matters, and related discussions with Western Asset’s personnel.
As part of their review, the Directors examined LMPFA’s ability to provide high quality oversight and administrative and shareholder support services to the Fund, and the Subadvisers’ ability to provide high quality investment management services to the Fund. The Directors considered the experience of LMPFA’s personnel in providing the types of services that
| | |
| Western Asset Inflation Indexed Plus Bond Fund | | 43 |
Board approval of management and subadvisory agreements(unaudited) (cont’d)
LMPFA is responsible for providing to the Fund; the ability of LMPFA to attract and retain capable personnel; the capability and integrity of LMPFA’s senior management and staff; and the level of skill required to provide such services to the Fund. The Directors considered the investment philosophy and research and decision-making processes of the Subadvisers; the experience of their key advisory personnel responsible for management of the Fund; the ability of the Subadvisers to attract and retain capable research and advisory personnel; the capability and integrity of the Subadvisers’ senior management and staff; and the level of skill required to manage the Fund. In addition, the Directors reviewed the quality of LMPFA’s and the Subadvisers’ services with respect to regulatory compliance and compliance with the investment policies of the Fund and conditions that might affect LMPFA’s or a Subadviser’s ability to provide high quality services to the Fund in the future under the Agreements, including its business reputation, financial condition and operational stability. Based on the foregoing, the Directors concluded that the Subadvisers’ investment process, research capabilities and philosophy were well suited to the Fund given the Fund’s investment objectives and policies, and that LMPFA and each of the Subadvisers would be able to meet any reasonably foreseeable obligations under the Agreements.
In reviewing the quality of the services provided to the Fund, the Directors also reviewed comparisons of the performance of the Fund to the performance of certain comparable funds in its peer group and to its investment benchmark over theone-, three-, five-, andten-year periods ended June 30, 2019. In that connection, the Directors noted that the performance of the Fund exceeded its peer group’s average performance for theone-year period and was lower than its peer group’s average performance for the three-, five- andten-year periods. The Directors also noted that the Fund’s performance was approximately the same as the benchmark for theone- and three-year periods and was lower than the benchmark for the five- andten-year periods. The Directors considered the factors involved in the Fund’s performance relative to the performance of its investment benchmark and peer group.
The Directors also considered the management fee payable by the Fund to LMPFA, the total expenses payable by the Fund and the fact that LMPFA pays to the Subadvisers the entire management fee it receives from the Fund. They reviewed information concerning management fees paid to investment advisers of similarly managed funds, as well as fees paid by the Subadvisers’ other clients, including separate accounts managed by the Subadvisers. The Directors observed that the management fee paid by the Fund to LMPFA was lower than the average combined advisory and administration fees paid by funds in its peer group. The Directors also observed that total expenses for the Fund were lower than the average of the funds in its peer group. The Directors noted that the management fee paid by the Fund was lower than the management fees paid by the other client of the Subadvisers for accounts with a similar investment strategy and higher than others, and that the administrative and operational responsibilities for the Subadvisers with respect to the Fund were
| | |
44 | | Western Asset Inflation Indexed Plus Bond Fund |
relatively higher as compared with the accounts that had lower fees. In light of the foregoing, the Directors concluded that the management fee paid by the Fund relative to the fees paid by the Subadvisers’ other clients was reasonable.
The Directors further evaluated the benefits of the advisory relationship to LMPFA and the Subadvisers, including, among others, the profitability of the relationship to LMPFA and the Subadvisers; the direct and indirect benefits that LMPFA and each Subadviser may receive from its relationship with the Fund, including any “fallout benefits,” such as reputational value derived from serving as investment manager or adviser to the Fund; and the affiliations between LMPFA, the Subadvisers and certain service providers for the Fund. In that connection, the Directors concluded that LMPFA and each Subadviser’s profitability was consistent with levels of profitability that had been determined by courts not to be excessive. The Directors noted that Western Asset does not have soft dollar arrangements.
Finally, the Directors considered, in light of the profitability information provided by LMPFA and Western Asset, the extent to which economies of scale would be realized by the Subadvisers as the assets of the Fund grow. The Directors determined that the lack of breakpoints was appropriate and that the management fee structure for the Fund is reasonable.
In their deliberations with respect to these matters, the Independent Directors were advised by their independent counsel, who is independent, within the meaning of Securities and Exchange Commission rules regarding the independence of counsel, of LMPFA and the Subadvisers. The Independent Directors weighed each of the foregoing matters in light of the advice given to them by their independent counsel as to the law applicable to the review of investment advisory contracts. In arriving at a decision, the Directors, including the Independent Directors, did not identify any single matter asall-important or controlling, and the foregoing summary does not detail all the matters considered. The Directors judged the terms and conditions of the Agreements, including the investment advisory fees, in light of all of the surrounding circumstances.
Based upon their review, the Directors, including all of the Independent Directors, determined, in the exercise of their business judgment, that they were generally satisfied with the quality of services being provided by LMPFA and the Subadvisers, but they would continue to closely monitor the performance of LMPFA and the Subadvisers; that the fees to be paid to the Subadvisers and LMPFA under the relevant Agreements were fair and reasonable, given the scope and quality of the services rendered by the Subadvisers and LMPFA; and that approval of the Agreements was in the best interest of the Fund and its shareholders.
| | |
| Western Asset Inflation Indexed Plus Bond Fund | | 45 |
Additional shareholder information(unaudited)
Results of special meeting of shareholders
A special meeting of shareholders was held on December 3, 2019 for shareholders of record as of September 13, 2019 (the “Record Date”) to elect the Board of Directors of the Corporation. Shareholders of the Fund and each other series of the Corporation voted together as a single class to elect the Board.
Shareholders of the Corporation voted as indicated below (vote totals are rounded to the nearest whole number). Effective January 1, 2020, the Board is composed of the following Directors:
| | | | | | | | |
| Director | | For | | | Withheld | |
| Robert Abeles, Jr. | | | 2,791,652,617 | | | | 30,297,354 | |
| Jane F. Dasher | | | 2,792,912,395 | | | | 29,037,576 | |
| Anita L. DeFrantz | | | 2,792,511,958 | | | | 29,438,013 | |
| Avedick B. Poladian | | | 2,792,320,211 | | | | 29,629,760 | |
| Susan B. Kerley | | | 2,788,394,406 | | | | 33,555,565 | |
| William E.B. Siart | | | 2,791,341,381 | | | | 30,608,590 | |
| Jaynie Miller Studenmund | | | 2,792,832,592 | | | | 29,117,379 | |
| Ronald L. Olson | | | 2,782,642,169 | | | | 39,307,802 | |
| Peter J. Taylor | | | 2,792,774,253 | | | | 29,175,718 | |
| Jane E. Trust | | | 2,783,998,172 | | | | 37,951,799 | |
The above Directors have also been elected to serve as board members of other Western Asset-advised mutual funds within the Legg Mason fund complex.
| | |
46 | | Western Asset Inflation Indexed Plus Bond Fund |
Additional information(unaudited)
Information about Directors and Officers
The business and affairs of Western Asset Inflation Indexed Plus Bond Fund (the “Fund”) are conducted by management under the supervision and subject to the direction of its Board of Directors. The business address of each Director is c/o Jane Trust, Legg Mason, 100 International Drive, 11th Floor, Baltimore, Maryland 21202.
Previously, two different boards, the Legg Mason Partners Fixed Income Funds Board and the Western Asset Funds Board, oversaw substantially all the mutual funds within the Legg Mason fund complex that are advised by Western Asset Management Company, LLC†. A joint proxy statement was mailed to solicit shareholder approval for the election of a unified board. On December 3, 2019, a joint special meeting of shareholders of the funds was held to elect the unified board members. During this meeting, shareholders approved these nominees for Board membership — resulting in one Board overseeing these funds effective January 1, 2020.
Information pertaining to the Directors and officers of the Board is set forth below. The Statement of Additional Information includes additional information about Directors and is available, without charge, upon request by calling the Fund at1-877-721-1926.
| | |
| Independent Directors†† |
|
| Robert Abeles, Jr. |
| Year of birth | | 1945 |
| Position(s) with Fund | | Director |
| Term of office1and length of time served2 | | Since 2013 |
| Principal occupation(s) during the past five years | | Board Member, Great Public Schools Now (since 2018); Senior Vice President Emeritus (since 2016) and formerly, Senior Vice President, Finance and Chief Financial Officer (2009 to 2016) at University of Southern California; Board Member, Excellent Education Development (since 2012) |
| Number of funds in fund complex overseen by Director3 | | 55 |
| Other Directorships held by Director during the past five years | | None |
|
| Jane F. Dasher |
| Year of birth | | 1949 |
| Position(s) with Fund | | Director |
| Term of office1and length of time served2 | | Since 1999 |
| Principal occupation(s) during the past five years | | Chief Financial Officer, Long Light Capital, LLC, formerly known as Korsant Partners, LLC (a family investment company) (since 1997) |
| Number of funds in fund complex overseen by Director3 | | 55 |
| Other Directorships held by Director during the past five years | | Director, Visual Kinematics, Inc. (since 2018) |
| | |
| Western Asset Inflation Indexed Plus Bond Fund | | 47 |
Additional information(unaudited) (cont’d)
Information about Directors and Officers
| | |
| Independent Directors††(cont’d) |
| Anita L. DeFrantz |
| Year of birth | | 1952 |
| Position(s) with Fund | | Director |
| Term of office1and length of time served2 | | Since 1998 |
| Principal occupation(s) during the past five years | | President of Tubman Truth Corp. (since 2015); President Emeritus (since 2015) and formerly, President (1987 to 2015) and Director (1990 to 2015) of LA84 (formerly Amateur Athletic Foundation of Los Angeles); Member (since 1986), Member of the Executive Board (since 2013) and Vice President (since 2017) of the International Olympic Committee |
| Number of funds in fund complex overseen by Director3 | | 55 |
| Other Directorships held by Director during the past five years | | None |
|
| Susan B. Kerley |
| Year of birth | | 1951 |
| Position(s) with Fund | | Director |
| Term of office1and length of time served2 | | Since 1992 |
| Principal occupation(s) during the past five years | | Investment Consulting Partner, Strategic Management Advisors, LLC (investment consulting) (since 1990) |
| Number of funds in fund complex overseen by Director3 | | 55 |
| Other Directorships held by Director during the past five years | | Director and Trustee (since 1990) and Chairman (since 2017 and 2005 to 2012) of various series of MainStay Family of Funds (66 funds); formerly, Investment Company Institute (ICI) Board of Governors (2006 to 2014); ICI Executive Committee (2011 to 2014); Chairman of the Independent Directors Council (2012 to 2014) |
|
| Avedick B. Poladian |
| Year of birth | | 1951 |
| Position(s) with Fund | | Director |
| Term of office1and length of time served2 | | Since 2007 |
| Principal occupation(s) during the past five years | | Director and Advisor (since 2017) and former Executive Vice President and Chief Operating Officer (2002 to 2016) of Lowe Enterprises, Inc. (privately held real estate and hospitality firm); formerly, Partner, Arthur Andersen, LLP (1974 to 2002) |
| Number of funds in fund complex overseen by Director3 | | 55 |
| Other Directorships held by Director during the past five years | | Occidental Petroleum Corporation (since 2008); California Resources Corporation (since 2014); and Public Storage (since 2010) |
| | |
48 | | Western Asset Inflation Indexed Plus Bond Fund |
| | |
| Independent Directors††(cont’d) |
| William E.B. Siart |
| Year of birth | | 1946 |
| Position(s) with Fund | | Director and Chairman of the Board |
| Term of office1and length of time served2 | | Since 1997 |
| Principal occupation(s) during the past five years | | Chairman of Great Public Schools Now (since 2015); Chairman of Excellent Education Development (since 2000); formerly, Trustee of The Getty Trust (since 2005 to 2017); Chairman of Walt Disney Concert Hall, Inc. (1998 to 2006) |
| Number of funds in fund complex overseen by Director3 | | 55 |
| Other Directorships held by Director during the past five years | | Member of Board of United States Golf Association, Executive Committee Member (since 2018) |
|
| Jaynie Miller Studenmund |
| Year of birth | | 1954 |
| Position(s) with Fund | | Director |
| Term of office1and length of time served2 | | Since 2004 |
| Principal occupation(s) during the past five years | | Corporate Board Member and Advisor (since 2004); formerly, Chief Operating Officer of Overture Services, Inc. (publicly traded internet company that created search engine marketing) (2001 to 2004); President and Chief Operating Officer, PayMyBills (internet innovator in bill presentment/payment space) (1999 to 2001); Executive vice president for consumer and business banking for three national financial institutions (1984 to 1997) |
| Number of funds in fund complex overseen by Director3 | | 55 |
| Other Directorships held by Director during the past five years | | Director of Pacific Premier Bancorp Inc. and Pacific Premier Bank (since 2019); Director of EXL (operations management and analytics company) (since 2018); Director of CoreLogic, Inc. (information, analytics and business services company) (since 2012); formerly, Director of Pinnacle Entertainment, Inc. (gaming and hospitality company) (2012 to 2018); Director of LifeLock, Inc. (identity theft protection company) (2015 to 2017); Director of Orbitz Worldwide, Inc. (online travel company) (2007 to 2014) |
|
| Peter J. Taylor |
| Year of birth | | 1958 |
| Position(s) with Fund | | Director |
| Term of office1and length of time served2 | | Since 2019 |
| Principal occupation(s) during the past five years | | President, ECMC Foundation (nonprofit organization) (since 2014); formerly, Executive Vice President and Chief Financial Officer for University of California system (2009 to 2014) |
| Number of funds in fund complex overseen by Director3 | | 55 |
| Other Directorships held by Director during the past five years | | Director of Pacific Mutual Holding Company4(since 2016); Member of the Board of Trustees of California State University system (since 2015); Ralph M. Parson Foundation (since 2015), Kaiser Family Foundation (since 2012), and Edison International (since 2011) |
| | |
| Western Asset Inflation Indexed Plus Bond Fund | | 49 |
Additional information(unaudited) (cont’d)
Information about Directors and Officers
| | |
| Interested Director |
| Ronald L. Olson5 |
| Year of birth | | 1941 |
| Position(s) with Fund | | Director |
| Term of office1and length of time served2 | | Since 2005 |
| Principal occupation(s) during the past five years | | Partner of Munger, Tolles & Olson LLP (law partnership) (since 1968) |
| Number of funds in fund complex overseen by Director3 | | 55 |
| Other Directorships held by Director during the past five years | | Berkshire Hathaway, Inc. (since 1997) |
| | |
| Interested Director and Officer | | |
|
| Jane Trust, CFA6 |
| Year of birth | | 1962 |
| Position(s) with Fund | | Director, President and Chief Executive Officer |
| Term of office1and length of time served2 | | Since 2015 |
| Principal occupation(s) during the past five years | | Senior Managing Director of Legg Mason & Co., LLC (“Legg Mason & Co.”) (since 2018); Managing Director of Legg Mason & Co. (2016 to 2018); Officer and/or Trustee/Director of 145 funds associated with Legg Mason Partners Fund Advisor, LLC (“LMPFA”) or its affiliates (since 2015); President and Chief Executive Officer of LMPFA (since 2015); formerly, Senior Vice President of LMPFA (2015); Director of ClearBridge, LLC (formerly, Legg Mason Capital Management, LLC) (2007 to 2014); Managing Director of Legg Mason Investment Counsel & Trust Co. (2000 to 2007) |
| Number of funds in fund complex overseen by Director3 | | 142 |
| Other Directorships held by Director during the past five years | | None |
| | |
| Additional Officers | | |
|
Ted P. Becker
Legg Mason 620 Eighth Avenue, 49th Floor, New York, NY 10018 |
| Year of birth | | 1951 |
| Position(s) with Fund | | Chief Compliance Officer |
| Term of office1and length of time served2 | | Since 2007 |
| Principal occupation(s) during the past five years | | Director of Global Compliance at Legg Mason, Inc. (since 2006); Chief Compliance Officer of LMPFA (since 2006); Managing Director of Compliance of Legg Mason & Co. (since 2005); Chief Compliance Officer of certain mutual funds associated with Legg Mason & Co. or its affiliates (since 2006) |
| | |
50 | | Western Asset Inflation Indexed Plus Bond Fund |
| | |
| Additional Officers (cont’d) | | |
Susan Kerr
Legg Mason 620 Eighth Avenue, 49th Floor, New York, NY 10018 |
| Year of birth | | 1949 |
| Position(s) with Fund | | Chief Anti-Money Laundering Compliance Officer |
| Term of office1and length of time served2 | | Since 2013 |
| Principal occupation(s) during the past five years | | Assistant Vice President of Legg Mason & Co. and Legg Mason Investor Services, LLC (“LMIS”) (since 2010); Chief Anti-Money Laundering Compliance Officer of certain mutual funds associated with Legg Mason & Co. or its affiliates (since 2013) and Anti-Money Laundering Compliance Officer of LMIS (since 2012); Senior Compliance Officer of LMIS (since 2011); formerly, AML Consultant, DTCC (2010); AML Consultant, Rabobank Netherlands, (2009); First Vice President, Director of Marketing & Advertising Compliance and Manager of Communications Review Group at Citigroup Inc. (1996 to 2008) |
|
Jenna Bailey
Legg Mason 100 First Stamford Place, 5th Floor, Stamford, CT 06902 |
| Year of birth | | 1978 |
| Position(s) with Fund | | Identity Theft Prevention Officer |
| Term of office1and length of time served2 | | Since 2015 |
| Principal occupation(s) during the past five years | | Identity Theft Prevention Officer of certain mutual funds associated with Legg Mason & Co. or its affiliates (since 2015); Compliance Officer of Legg Mason & Co. (since 2013); Assistant Vice President of Legg Mason & Co. (since 2011); formerly, Associate Compliance Officer of Legg Mason & Co. (2011 to 2013) |
|
Robert I. Frenkel
Legg Mason 100 First Stamford Place, 6th Floor, Stamford, CT 06902 |
| Year of birth | | 1954 |
| Position(s) with Fund | | Secretary and Chief Legal Officer |
| Term of office1and length of time served2 | | Since 2007 |
| Principal occupation(s) during the past five years | | Vice President and Deputy General Counsel of Legg Mason, Inc. (since 2006); Managing Director and General Counsel — U.S. Mutual Funds for Legg Mason & Co. (since 2006) and Legg Mason & Co. predecessors (since 1994); Secretary and Chief Legal Officer of certain mutual funds associated with Legg Mason & Co. or its affiliates (since 2006) and Legg Mason & Co. predecessors (prior to 2006) |
| | |
| Western Asset Inflation Indexed Plus Bond Fund | | 51 |
Additional information(unaudited) (cont’d)
Information about Directors and Officers
| | |
| Additional Officers (cont’d) | | |
|
Thomas C. Mandia
Legg Mason 100 First Stamford Place, 6th Floor, Stamford, CT 06902 |
| Year of birth | | 1962 |
| Position(s) with Fund | | Assistant Secretary |
| Term of office1and length of time served2 | | Since 2007 |
| Principal occupation(s) during the past five years | | Managing Director and Deputy General Counsel of Legg Mason & Co. (since 2005) and Legg Mason & Co. predecessors (prior to 2005); Secretary of LMPFA (since 2006); Assistant Secretary of certain mutual funds associated with Legg Mason & Co. or its affiliates (since 2006) and Legg Mason & Co. predecessors (prior to 2006); Secretary of LM Asset Services, LLC (“LMAS”) (since 2002) and Legg Mason Fund Asset Management, Inc. (“LMFAM”) (since 2013) (formerly registered investment advisers) |
|
Christopher Berarducci*
Legg Mason 620 Eighth Avenue, 49th Floor, New York, NY 10018 |
| Year of birth | | 1974 |
| Position(s) with Fund | | Treasurer and Principal Financial Officer |
| Term of office1and length of time served2 | | Since 2019 |
| Principal occupation(s) during the past five years | | Treasurer (since 2010) and Principal Financial Officer (since 2019) of certain mutual funds associated with Legg Mason & Co. or its affiliates; Director of Legg Mason & Co. (since 2015); formerly, Vice President of Legg Mason & Co. (2011 to 2015); Assistant Controller of certain mutual funds associated with Legg Mason & Co. or its affiliates (prior to 2010) |
|
Jeanne M. Kelly
Legg Mason 620 Eighth Avenue, 49th Floor, New York, NY 10018 |
| Year of birth | | 1951 |
| Position(s) with Fund | | Senior Vice President |
| Term of office1and length of time served2 | | Since 2007 |
| Principal occupation(s) during the past five years | | Senior Vice President of certain mutual funds associated with Legg Mason & Co. or its affiliates (since 2007); Senior Vice President of LMPFA (since 2006); President and Chief Executive Officer of LMAS and LMFAM (since 2015); Managing Director of Legg Mason & Co. (since 2005) and Legg Mason & Co. predecessors (prior to 2005); formerly, Senior Vice President of LMFAM (2013 to 2015) |
| † | Western Asset Management Company, LLC (“Western Asset”) is a subadviser to LMPFA with respect to the funds. Western Asset Management Company Limited (“Western Asset London”), Western Asset Management Company Ltd (“Western Asset Japan”) and Western Asset Management Company Pte. Ltd. (“Western Asset Singapore” and, collectively with Western Asset, Western Asset London and Western Asset Japan, the “subadvisers”), also serve as subadvisers to certain of the funds. |
| | |
52 | | Western Asset Inflation Indexed Plus Bond Fund |
| †† | Directors who are not “interested persons” of the Fund within the meaning of Section 2(a)(19) of the Investment Company Act of 1940, as amended (the “1940 Act”). |
| * | Effective September 23, 2019, Mr. Berarducci became Treasurer and Principal Financial Officer. |
| 1 | Each Director and officer serves until his or her respective successor has been duly elected and qualified or until his or her earlier death, resignation, retirement or removal. |
| 2 | Indicates the earliest year in which the Director became a board member for a fund in the Legg Mason fund complex or the officer took such office. |
| 3 | Each board member also serves as a Director of Western Asset Investment Grade Income Fund Inc. and a Trustee of Western Asset Premier Bond Fund(closed-end investment companies), which are considered part of the same fund complex. |
| 4 | Western Asset and its affiliates provide investment advisory services with respect to registered investment companies sponsored by an affiliate of Pacific Mutual Holding Company (“Pacific Holdings”). Affiliates of Pacific Holdings receive compensation from LMPFA or its affiliates for shareholder or distribution services provided with respect to registered investment companies for which Western Asset or its affiliates serve as investment adviser. |
| 5 | Mr. Olson is an “interested person” of the Fund, as defined in the 1940 Act, because his law firm has provided legal services to Western Asset. |
| 6 | Ms. Trust is an “interested person” of the Fund, as defined in the 1940 Act, because of her position with LMPFA and/or certain of its affiliates. |
| | |
| Western Asset Inflation Indexed Plus Bond Fund | | 53 |
Important tax information(unaudited)
The following information is provided with respect to the distributions paid during the taxable year ended December 31, 2019:
| | | | | | | | | | | | | | | | |
| Record date: | | | 3/28/2019 | | | | 6/27/2019 | | | | 9/27/2019 | | | | 12/18/2019 | |
| Payable date: | | | 3/29/2019 | | | | 6/28/2019 | | | | 9/30/2019 | | | | 12/19/2019 | |
| Interest from federal obligations | | | 80.55 | % | | | 80.55 | % | | | 80.55 | % | | | 80.55 | % |
The law varies in each state as to whether and what percentage of dividend income attributable to Federal obligations is exempt from state income tax. We recommend that you consult with your tax adviser to determine if any portion of the dividends you received is exempt from state income taxes.
Additionally, the Fund met the quarterly asset requirement for California, Connecticut and New York resident shareholders.
| | |
54 | | Western Asset Inflation Indexed Plus Bond Fund |
Western Asset
Inflation Indexed Plus Bond Fund
Directors*
Robert Abeles, Jr.
Jane F. Dasher
Anita L. DeFrantz
Susan B. Kerley
Ronald L. Olson
Avedick B. Poladian
William E.B. Siart
Chairman
Jaynie M. Studenmund
Peter J. Taylor
Jane Trust
| * | During a December 3, 2019 special meeting of shareholders, a new group of board members were elected to oversee substantially all the mutual funds within the Legg Mason fund complex that are advised by Western Asset Management Company, LLC, effective January 1, 2020. |
Investment manager
Legg Mason Partners Fund Advisor, LLC
Subadvisers
Western Asset Management Company, LLC
Western Asset Management Company Limited
Western Asset Management Company Ltd
Western Asset Management Company Pte. Ltd.
Distributor
Legg Mason Investor Services, LLC
Transfer agent
BNY Mellon Investment Servicing (US) Inc.
4400 Computer Drive
Westborough, MA 01581
Custodian
The Bank of New York Mellon
Independent registered public accounting firm
PricewaterhouseCoopers LLP
100 East Pratt Street
Baltimore, MD
Western Asset Inflation Indexed Plus Bond Fund
The Fund is a separate investment series of Western Asset Funds, Inc.
Western Asset Inflation Indexed Plus Bond Fund
Legg Mason Funds
620 Eighth Avenue, 49th Floor
New York, NY 10018
The Fund files its complete schedule of portfolio holdings with the Securities and Exchange Commission (“SEC”) for the first and third quarters of each fiscal year as an exhibit to its reports on FormN-PORT. The Fund’s FormsN-PORT are available on the SEC’s website at www.sec.gov. To obtain information on FormN-PORT, shareholders can call the Fund at1-877-721-1926.
Information on how the Fund voted proxies relating to portfolio securities during the prior12-month period ended June 30th of each year and a description of the policies and procedures that the Fund uses to determine how to vote proxies related to portfolio transactions are available (1) without charge, upon request, by calling the Fund at1-877-721-1926, (2) at www.leggmason.com/mutualfunds and (3) on the SEC’s website at www.sec.gov.
This report is submitted for the general information of the shareholders of Western Asset Inflation Indexed Plus Bond Fund. This report is not authorized for distribution to prospective investors in the Fund unless preceded or accompanied by a current prospectus.
Investors should consider the Fund’s investment objectives, risks, charges and expenses carefully before investing. The prospectus contains this and other important information about the Fund. Please read the prospectus carefully before investing.
www.leggmason.com
© 2020 Legg Mason Investor Services, LLC
Member FINRA, SIPC
Legg Mason Funds Privacy and Security Notice
Your Privacy and the Security of Your Personal Information is Very Important to the Legg Mason Funds
This Privacy and Security Notice (the “Privacy Notice”) addresses the Legg Mason Funds’ privacy and data protection practices with respect to nonpublic personal information the Funds receive. The Legg Mason Funds include any funds sold by the Funds’ distributor, Legg Mason Investor Services, LLC, as well as Legg Mason-sponsoredclosed-end funds. The provisions of this Privacy Notice apply to your information both while you are a shareholder and after you are no longer invested with the Funds.
The Type of Nonpublic Personal Information the Funds Collect About You
The Funds collect and maintain nonpublic personal information about you in connection with your shareholder account. Such information may include, but is not limited to:
| • | | Personal information included on applications or other forms; |
| • | | Account balances, transactions, and mutual fund holdings and positions; |
| • | | Bank account information, legal documents, and identity verification documentation; |
| • | | Online account access user IDs, passwords, security challenge question responses; and |
| • | | Information received from consumer reporting agencies regarding credit history and creditworthiness (such as the amount of an individual’s total debt, payment history, etc.). |
How the Funds Use Nonpublic Personal Information About You
The Funds do not sell or share your nonpublic personal information with third parties or with affiliates for their marketing purposes, or with other financial institutions or affiliates for joint marketing purposes, unless you have authorized the Funds to do so. The Funds do not disclose any nonpublic personal information about you except as may be required to perform transactions or services you have authorized or as permitted or required by law. The Funds may disclose information about you to:
| • | | Employees, agents, and affiliates on a “need to know” basis to enable the Funds to conduct ordinary business or to comply with obligations to government regulators; |
| • | | Service providers, including the Funds’ affiliates, who assist the Funds as part of the ordinary course of business (such as printing, mailing services, or processing or servicing your account with us) or otherwise perform services on the Funds’ behalf, including companies that may perform statistical analysis, market research and marketing services solely for the Funds; |
| • | | Permit access to transfer, whether in the United States or countries outside of the United States to such Funds’ employees, agents and affiliates and service providers as required to enable the Funds to conduct ordinary business, or to comply with obligations to government regulators; |
| • | | The Funds’ representatives such as legal counsel, accountants and auditors to enable the Funds to conduct ordinary business, or to comply with obligations to government regulators; |
| • | | Fiduciaries or representatives acting on your behalf, such as an IRA custodian or trustee of a grantor trust. |
|
| NOT PART OF THE ANNUAL REPORT |
Legg Mason Funds Privacy and Security Notice (cont’d)
Except as otherwise permitted by applicable law, companies acting on the Funds’ behalf, including those outside the United States, are contractually obligated to keep nonpublic personal information the Funds provide to them confidential and to use the information the Funds share only to provide the services the Funds ask them to perform.
The Funds may disclose nonpublic personal information about you when necessary to enforce their rights or protect against fraud, or as permitted or required by applicable law, such as in connection with a law enforcement or regulatory request, subpoena, or similar legal process. In the event of a corporate action or in the event a Fund service provider changes, the Funds may be required to disclose your nonpublic personal information to third parties. While it is the Funds’ practice to obtain protections for disclosed information in these types of transactions, the Funds cannot guarantee their privacy policy will remain unchanged.
Keeping You Informed of the Funds’ Privacy and Security Practices
The Funds will notify you annually of their privacy policy as required by federal law. While the Funds reserve the right to modify this policy at any time they will notify you promptly if this privacy policy changes.
The Funds’ Security Practices
The Funds maintain appropriate physical, electronic and procedural safeguards designed to guard your nonpublic personal information. The Funds’ internal data security policies restrict access to your nonpublic personal information to authorized employees, who may use your nonpublic personal information for Fund business purposes only.
Although the Funds strive to protect your nonpublic personal information, they cannot ensure or warrant the security of any information you provide or transmit to them, and you do so at your own risk. In the event of a breach of the confidentiality or security of your nonpublic personal information, the Funds will attempt to notify you as necessary so you can take appropriate protective steps. If you have consented to the Funds using electronic communications or electronic delivery of statements, they may notify you under such circumstances using the most current email address you have on record with them.
In order for the Funds to provide effective service to you, keeping your account information accurate is very important. If you believe that your account information is incomplete, not accurate or not current, if you have questions about the Funds’ privacy practices, or our use of your nonpublic personal information, write the Funds using the contact information on your account statements, email the Funds by clicking on the Contact Us section of the Funds’ website at www.leggmason.com, or contact the Funds at1-877-721-1926.
Revised April 2018
|
| NOT PART OF THE ANNUAL REPORT |
Western Asset Management Company, LLC
Legg Mason, Inc. Subsidiaries
www.leggmason.com
© 2020 Legg Mason Investor Services, LLC Member FINRA, SIPC
WASX013142 2/20 SR20-3823
| | |
| ITEM 2. | | CODE OF ETHICS. |
| |
| | The registrant has adopted a code of ethics that applies to the registrant’s principal executive officer, principal financial officer, principal accounting officer or controller. |
| |
| ITEM 3. | | AUDIT COMMITTEE FINANCIAL EXPERT. |
| |
| | The Board of Directors of the registrant has determined that Mr. Robert Abeles, Jr., possesses the technical attributes identified in Instruction 2(b) of Item 3 to FormN-CSR to qualify as “audit committee financial expert,” and have designated Mr. Abeles as the Audit Committee’s financial expert. Mr. Abeles is an “independent” Director pursuant to paragraph (a) (2) of Item 3 to FormN-CSR. |
| |
| ITEM 4. | | PRINCIPAL ACCOUNTANT FEES AND SERVICES |
| |
| | a)Audit Fees. The aggregate fees billed in the last two fiscal years ending December 31, 2018 and December 31, 2019 (the “Reporting Periods”) for professional services rendered by the Registrant’s principal accountant (the “Auditor”) for the audit of the Registrant’s annual financial statements, or services that are normally provided by the Auditor in connection with the statutory and regulatory filings or engagements for the Reporting Periods, were $383,790 in December 31, 2018 and in $203,233 in December 31, 2019. |
| |
| | b)Audit-Related Fees. The aggregate fees billed in the Reporting Period for assurance and related services by the Auditor that are reasonably related to the performance of the Registrant’s financial statements were $0 in December 31, 2018 and $0 in December 31, 2019. |
| |
| | (c)Tax Fees. The aggregate fees billed in the Reporting Periods for professional services rendered by the Auditor for tax compliance, tax advice and tax planning (“Tax Services”) were $0 in December 31, 2018 and $0 in December 31, 2019. These services consisted of (i) review or preparation of U.S. federal, state, local and excise tax returns; (ii) U.S. federal, state and local tax planning, advice and assistance regarding statutory, regulatory or administrative developments, and (iii) tax advice regarding tax qualification matters and/or treatment of various financial instruments held or proposed to be acquired or held. |
| |
| | There were no fees billed for tax services by the Auditors to service affiliates during the Reporting Periods that requiredpre-approval by the Audit Committee. |
| |
| | d)All Other Fees. The aggregate other fees billed in the Reporting Periods for products and services provided by the Auditor were $9,000 in December 31, 2018 and $0 in December 31, 2019, other than the services reported in paragraphs (a) through (c) for the Item for the Western Asset Funds, Inc. |
| |
| | All Other Fees. There were no othernon-audit services rendered by the Auditor to Legg Mason Partners Fund Advisors, LLC (“LMPFA”), and any entity controlling, controlled by or under common control with LMPFA that provided ongoing services to Western Asset Funds, Inc. requiringpre-approval by the Audit Committee in the Reporting Period. |
| |
| | (e) Audit Committee’s pre–approval policies and procedures described in paragraph (c)(7) of Rule2-01 of RegulationS-X. |
| |
| | (1) The Charter for the Audit Committee (the “Committee”) of the Board of each registered investment company (the “Fund”) advised by LMPFA or one of their affiliates (each, an “Adviser”) requires that the Committee shall approve (a) all audit and permissiblenon-audit services to be provided to the Fund and (b) all permissiblenon-audit services to be provided by the Fund’s independent auditors to the Adviser and any Covered Service Providers if the engagement relates directly to the operations and financial reporting of the Fund. The Committee December implement policies and procedures by which such services are approved other than by the full Committee. |
| |
| | The Committee shall not approvenon-audit services that the Committee believes December impair the independence of the auditors. As of the date of the approval of this Audit Committee Charter, permissiblenon-audit services include any professional services (including tax services), that are not prohibited services as described below, provided to the Fund by the independent auditors, other than |
| | |
| |
| | those provided to the Fund in connection with an audit or a review of the financial statements of the Fund. Permissiblenon-audit services December not include: (i) bookkeeping or other services related to the accounting records or financial statements of the Fund; (ii) financial information systems design and implementation; (iii) appraisal or valuation services, fairness opinions orcontribution-in-kind reports; (iv) actuarial services; (v) internal audit outsourcing services; (vi) management functions or human resources; (vii) broker or dealer, investment adviser or investment banking services; (viii) legal services and expert services unrelated to the audit; and (ix) any other service the Public Company Accounting Oversight Board determines, by regulation, is impermissible. |
| |
| | Pre-approval by the Committee of any permissiblenon-audit services is not required so long as: (i) the aggregate amount of all such permissiblenon-audit services provided to the Fund, the Adviser and any service providers controlling, controlled by or under common control with the Adviser that provide ongoing services to the Fund (“Covered Service Providers”) constitutes not more than 5% of the total amount of revenues paid to the independent auditors during the fiscal year in which the permissiblenon-audit services are provided to (a) the Fund, (b) the Adviser and (c) any entity controlling, controlled by or under common control with the Adviser that provides ongoing services to the Fund during the fiscal year in which the services are provided that would have to be approved by the Committee; (ii) the permissiblenon-audit services were not recognized by the Fund at the time of the engagement to benon-audit services; and (iii) such services are promptly brought to the attention of the Committee and approved by the Committee (or its delegate(s)) prior to the completion of the audit. |
| |
| | (2) For the Western Asset Funds, Inc., the percentage of fees that were approved by the audit committee, with respect to: Audit-Related Fees were 100% and 100% for December 31, 2018 and December 31, 2019; Tax Fees were 100% and 100% for December 31, 2018 and December 31, 2019; and Other Fees were 100% and 100% for December 31, 2018 and December 31, 2019. |
| |
| | (f) N/A |
| |
| | (g)Non-audit fees billed by the Auditor for services rendered to Western Asset Funds, Inc., LMPFA and any entity controlling, controlled by, or under common control with LMPFA that provides ongoing services to Western Asset Funds, Inc. during the reporting period were $678,000 in December 31, 2018 and $938,841in December 31, 2019. |
| |
| | (h) Yes. Western Asset Funds, Inc.’s Audit Committee has considered whether the provision ofnon-audit services that were rendered to Service Affiliates, which were notpre-approved (not requiringpre-approval), is compatible with maintaining the Accountant’s independence. All services provided by the Auditor to the Western Asset Funds, Inc. or to Service Affiliates, which were required to bepre-approved, werepre-approved as required. |
| | |
| |
| ITEM 5. | | AUDIT COMMITTEE OF LISTED REGISTRANTS. |
| |
| | a) The independent board members are acting as the registrant’s audit committee as specified in Section 3(a)(58)(B) of the Exchange Act.The Audit Committee consists of the following Board members: |
| |
| | Robert Abeles, Jr. * |
| | Jane F. Dasher * |
| | Anita L. DeFrantz * |
| | Susan B. Kerley * |
| | Ronald L. Olson * |
| | Avedick B. Poladian * |
| | William E.B. Siart * |
| | Jaynie M. Studenmund * |
| | Peter J. Taylor * |
| |
| | * During a December 3, 2019 special meeting of shareholders, a new group of board members were elected to oversee substantially all the mutual funds within the Legg Mason fund complex that are advised by Western Asset Management Company, LLC, effective January 1, 2020. |
| |
| | b) Not applicable. |
| |
| ITEM 6. | | SCHEDULE OF INVESTMENTS. |
| |
| | Included herein under Item 1. |
| |
| ITEM 7. | | DISCLOSURE OF PROXY VOTING POLICIES AND PROCEDURES FORCLOSED-END MANAGEMENT INVESTMENT COMPANIES. |
| |
| | Not applicable. |
| |
| ITEM 8. | | PORTFOLIO MANAGERS OFCLOSED-END MANAGEMENT INVESTMENT COMPANIES. |
| |
| | Not applicable. |
| |
| ITEM 9. | | PURCHASES OF EQUITY SECURITIES BYCLOSED-END MANAGEMENT INVESTMENT COMPANY AND AFFILIATED PURCHASERS. |
| |
| | Not applicable. |
| |
| ITEM 10. | | SUBMISSION OF MATTERS TO A VOTE OF SECURITY HOLDERS. |
| |
| | Not applicable. |
| |
| ITEM 11. | | CONTROLS AND PROCEDURES. |
| |
| | (a) The registrant’s principal executive officer and principal financial officer have concluded that the registrant’s disclosure controls and procedures (as defined in Rule30a- 3(c) under the Investment Company Act of 1940, as amended (the “1940 Act”)) are effective as of a date within 90 days of the filing date of this report that includes the disclosure required by this paragraph, based on their evaluation of the disclosure controls and procedures required by Rule30a-3(b) under the 1940 Act and15d-15(b) under the Securities Exchange Act of 1934. |
| |
| | (b) There were no changes in the registrant’s internal control over financial reporting (as defined in Rule30a-3(d) under the 1940 Act) that occurred during the second fiscal quarter of the period covered by this report that have materially affected, or are likely to materially affect the registrant’s internal control over financial reporting. |
| | |
| ITEM 12. | | DISCLOSURE OF SECURITIES LENDING ACTIVITIES FORCLOSED-END MANAGEMENT INVESTMENT COMPANIES. |
| |
| | Not applicable. |
| |
| ITEM 13. | | EXHIBITS. |
| |
| | (a) (1) Code of Ethics attached hereto. |
| | Exhibit 99.CODE ETH |
| |
| | (a) (2) Certifications pursuant to section 302 of the Sarbanes-Oxley Act of 2002 attached hereto. |
| | Exhibit 99.CERT |
| |
| | (b) Certifications pursuant to Section 906 of the Sarbanes-Oxley Act of 2002 attached hereto. |
| | Exhibit 99.906CERT |
SIGNATURES
Pursuant to the requirements of the Securities Exchange Act of 1934 and the Investment Company Act of 1940, the registrant has duly caused this Report to be signed on its behalf by the undersigned, there unto duly authorized.
| | |
| Western Asset Funds, Inc. |
| |
| By: | | /s/ Jane Trust |
| | Jane Trust |
| | Chief Executive Officer |
|
| Date: March 2, 2020 |
Pursuant to the requirements of the Securities Exchange Act of 1934 and the Investment Company Act of 1940, this report has been signed below by the following persons on behalf of the registrant and in the capacities and on the dates indicated.
| | |
| By: | | /s/ Jane Trust |
| | Jane Trust |
| | Chief Executive Officer |
|
| Date: March 2, 2020 |
| |
| By: | | /s/ Christopher Berarducci |
| | Christopher Berarducci |
| | Principal Financial Officer |
|
| Date: March 2, 2020 |