UNITED STATES
SECURITIES AND EXCHANGE COMMISSION
Washington, D.C. 20549
FORM N-CSR
CERTIFIED SHAREHOLDER REPORT OF REGISTERED
MANAGEMENT INVESTMENT COMPANIES
Investment Company Act file number 811-06110
Western Asset Funds, Inc.
(Exact name of registrant as specified in charter)
620 Eighth Avenue, 47th Floor, New York, NY 10018
(Address of principal executive offices) (Zip code)
Marc A. De Oliveira
Franklin Templeton
100 First Stamford Place
Stamford, CT 06902
(Name and address of agent for service)
Registrant’s telephone number, including area code: 1-877-721-1926
Date of fiscal year end: May 31
Date of reporting period: May 31, 2021
| ITEM 1. | REPORT TO STOCKHOLDERS. |
The Annual Report to Stockholders is filed herewith.

| | |
| Annual Report | | May 31, 2021 |
WESTERN ASSET
HIGH YIELD FUND
The Fund intends to no longer mail paper copies of the Fund’s shareholder reports like this one, unless you specifically request paper copies of the reports from the Fund or from your Service Agent or financial intermediary (such as a broker-dealer or bank). Instead, the reports will be made available on a website, and you will be notified by mail each time a report is posted and provided with a website link to access the report.
If you already elected to receive shareholder reports electronically (“e-delivery”), you will not be affected by this change and you need not take any action. If you have not already elected e-delivery, you may elect to receive shareholder reports and other communications from the Fund electronically by contacting your Service Agent or, if you are a direct shareholder with the Fund, by calling 1-877-721-1926.
You may elect to receive all future reports in paper free of charge. If you invest through a Service Agent, you can contact your Service Agent to request that you continue to receive paper copies of your shareholder reports. That election will apply to all Legg Mason Funds held in your account at that Service Agent. If you are a direct shareholder with the Fund, you can call the Fund at 1-877-721-1926, or write to the Fund by regular mail at Legg Mason Funds, P.O. Box 9699, Providence, RI 02940-9699 or by express, certified or registered mail to Legg Mason Funds, 4400 Computer Drive, Westborough, MA 01581 to let the Fund know you wish to continue receiving paper copies of your shareholder reports. That election will apply to all Legg Mason Funds held in your account held directly with the fund complex.

|
| INVESTMENT PRODUCTS: NOT FDIC INSURED • NO BANK GUARANTEE • MAY LOSE VALUE |
Fund objective
The Fund seeks to maximize total return, consistent with prudent investment management.
Letter from the president

Dear Shareholder,
We are pleased to provide the annual report of Western Asset High Yield Fund for the twelve-month reporting period ended May 31, 2021. Please read on for a detailed look at prevailing economic and market conditions during the Fund’s reporting period and to learn how those conditions have affected Fund performance.
As always, we remain committed to providing you with excellent service and a full spectrum of investment choices. We also remain committed to supplementing the support you receive from your financial advisor. One way we accomplish this is through our website, www.leggmason.com. Here you can gain immediate access to market and investment information, including:
| • | | Fund prices and performance, |
| • | | Market insights and commentaries from our portfolio managers, and |
| • | | A host of educational resources. |
We look forward to helping you meet your financial goals.
Sincerely,

Jane Trust, CFA
President and Chief Executive Officer
June 30, 2021
| | |
II | | Western Asset High Yield Fund |
Fund overview
Q. What is the Fund’s investment strategy?
A. The Fund’s investment objective is to maximize total return, consistent with prudent investment management. Under normal market conditions, the Fund will invest at least 80% of its net assets in U.S. dollar denominated debt or fixed income securities that are rated below investment grade at the time of purchase by one or more Nationally Recognized Statistical Rating Organizations (“NRSROs”) or securities we determined to be of comparable quality. The Fund considers securities that are rated below the Baa or BBB categories to be rated below investment grade. Securities rated below investment grade are commonly known as “junk bonds” or “high yield securities”.
In deciding among the securities in which the Fund may invest, we take into account the credit quality, country of issue, interest rate, liquidity, maturity and yield of a security as well as other factors, including the Fund’s effective durationi and prevailing and anticipated market conditions. The Fund is permitted to invest up to 20% of its total assets in non-U.S. dollar denominated non-U.S. securities.
The Fund may also enter into various exchange-traded and over-the-counter derivative transactions for both hedging and non-hedging purposes, including for purposes of enhancing returns. These derivative transactions include, but are not limited to, bond and interest rate futures, options on bond and interest rate futures, futures, swaps, foreign currency futures, forwards and options.
In particular, the Fund may use interest rate swaps, credit default swaps (including buying and selling credit default swaps on individual securities and/or baskets of securities), options (including options on credit default swaps) and/or futures contracts to a significant extent, although the amounts invested in these instruments may change from time to time. Other instruments may also be used to a significant extent from time to time.
The Fund may use currency related transactions involving futures contracts, options on futures contracts, indexed securities and other derivative instruments (collectively, “Financial Instruments”). These Financial Instruments may be used without limit, for either hedging purposes, or to implement a currency investment strategy.
At Western Asset Management Company, LLC (“Western Asset”), we utilize a fixed income team approach, with decisions derived from interaction among various investment management sector specialists. The sector teams are comprised of Western Asset’s senior portfolio management personnel, research analysts and an in-house economist. Under this team approach, management of client fixed income portfolios will reflect a consensus of interdisciplinary views within the Western Asset organization.
Q. What were the overall market conditions during the Fund’s reporting period?
A. Fixed income markets experienced periods of elevated volatility and, overall, modestly declined over the twelve-month reporting period ended May 31, 2021. Volatility was driven by a number of factors, including risk aversion as the COVID-19 pandemic escalated, sharply falling and then rising global growth, trade conflicts, inflation concerns, and a number of
| | |
| Western Asset High Yield Fund 2021 Annual Report | | 1 |
Fund overview (cont’d)
geopolitical events. Most spread sectors (non-Treasuries) outperformed similar duration Treasuries, especially as the reporting period progressed. This was driven by continued monetary policy accommodation from the Federal Reserve Board (the “Fed”)ii and the rollout of several COVID-19 vaccines which triggered increased investor risk appetite.
Short-term U.S. Treasury yields edged lower, as the Fed held the federal funds rateiii in a range between 0.00% and 0.25%. The yield for the two-year Treasury note began the reporting period at 0.16% and ended the period at 0.14%. The low of 0.09% occurred on February 5, 2021 and the high of 0.22% took place on June 5 and June 8, 2020. In contrast, long-term U.S. Treasury yields moved sharply higher, as positive economic data triggered inflationary concerns and fears that the Fed may remove its monetary policy accommodations sooner than previously anticipated. The yield for the ten-year Treasury note began the reporting period at 0.65%. The low of 0.52% occurred on August 4, 2020, and the high of 1.74% took place on March 19 and March 31, 2021. The ten-year Treasury yield then ended the period at 1.58%.
All told, the Bloomberg Barclays U.S. Aggregate Indexiv returned -0.40% for the twelve months ended May 31, 2021. Comparatively, riskier fixed income securities, including high-yield bonds, produced stronger results. Over the fiscal year, the Bloomberg Barclays U.S. Corporate High Yield — 2% Issuer Cap Indexv returned 14.90%. Elsewhere, the JPMorgan Emerging Markets Bond Index Global (“EMBI Global”)vi returned 8.96% for the twelve months ended May 31, 2021.
Q. How did we respond to these changing market conditions?
A. A number of adjustments were made to the Fund’s portfolio during the reporting period. We reduced the overall quality of the portfolio by increasing the Fund’s allocations to securities rated CCC and B. We also reduced the Fund’s opportunistic exposure to investment-grade corporate bonds, as well as pared its exposure to securities rated BB. From a sector perspective, we increased the Fund’s allocations to the Energy and Industrials sectors. In contrast, we reduced the Fund’s exposure to the Consumer Non-Cyclicals sector1. Finally, we increased the Fund’s duration during the reporting period.
The Fund employed U.S. Treasury futures to manage its duration positioning. All told, they modestly detracted from performance during the reporting period. Index credit default swaps, which were used to manage the Fund’s exposure to credit index spread levels, were additive for returns. Finally, currency derivatives, which were utilized to adjust the Fund’s currency exposure, slightly detracted from performance.
Performance review
For the twelve months ended May 31, 2021, Class I shares of Western Asset High Yield Fund returned 16.65%. The Fund’s unmanaged benchmark, the Bloomberg Barclays U.S.
| 1 | Consumer Non-Cyclicals consists of the following industries: Consumer Products, Food/Beverage, Health Care, Pharmaceuticals, Supermarkets and Tobacco. |
| | |
2 | | Western Asset High Yield Fund 2021 Annual Report |
Corporate High Yield — 2% Issuer Cap Index, returned 14.90% for the same period. The Lipper High Yield Funds Category Averagevii returned 14.85% over the same time frame.
| | | | | | | | |
| Performance Snapshot as of May 31, 2021 (unaudited) | | | | | | |
| (excluding sales charges) | | 6 months | | | 12 months | |
| Western Asset High Yield Fund: | | | | | | | | |
Class A | | | 4.50 | % | | | 16.41 | % |
Class A2 | | | 4.52 | % | | | 16.47 | % |
Class C | | | 4.11 | % | | | 15.66 | % |
Class R | | | 4.35 | % | | | 16.16 | % |
Class I | | | 4.63 | % | | | 16.65 | % |
Class IS | | | 4.65 | % | | | 16.88 | % |
| Bloomberg Barclays U.S. Corporate High Yield — 2% Issuer Cap Index | | | 4.18 | % | | | 14.90 | % |
| Lipper High Yield Funds Category Average | | | 4.39 | % | | | 14.85 | % |
The performance shown represents past performance. Past performance is no guarantee of future results and current performance may be higher or lower than the performance shown above. Principal value, investment returns and yields will fluctuate and investors’ shares, when redeemed, may be worth more or less than their original cost. To obtain performance data current to the most recent month-end, please visit our website at www.leggmason.com/mutualfunds.
All share class returns assume the reinvestment of all distributions, including returns of capital, if any, at net asset value and the deduction of all Fund expenses. Returns have not been adjusted to include sales charges that may apply or the deduction of taxes that a shareholder would pay on Fund distributions. If sales charges were reflected, the performance quoted would be lower. Performance figures for periods shorter than one year represent cumulative figures and are not annualized.
Fund performance figures reflect fee waivers and/or expense reimbursements, without which the performance would have been lower.
The 30-Day SEC Yields for the period ended May 31, 2021 for Class A, Class A2, Class C, Class R, Class I and Class IS shares were 3.44%, 3.50%, 2.83%, 3.27%, 3.85% and 3.92%, respectively. Absent fee waivers and/or expense reimbursements, the 30-Day SEC Yields for Class A, Class A2, Class C, Class R, Class I and Class IS shares would have been 3.39%, 3.45%, 2.78%, 2.88%, 3.80% and 3.88%, respectively. The 30-Day SEC Yield, calculated pursuant to the standard SEC formula, is based on a Fund’s investments over an annualized trailing 30-day period, and not on the distributions paid by the Fund, which may differ.
|
| Total Annual Operating Expenses (unaudited) |
As of the Fund’s current prospectus dated September 30, 2020, as supplemented May 21, 2021, the gross total annual fund operating expense ratios for Class A, Class A2, Class C, Class R, Class I and Class IS shares were 1.04%, 1.00%, 1.80%, 1.70%, 0.76% and 0.69%, respectively.
Actual expenses may be higher. For example, expenses may be higher than those shown if average net assets decrease. Net assets are more likely to decrease and Fund expense ratios are more likely to increase when markets are volatile.
| | |
| Western Asset High Yield Fund 2021 Annual Report | | 3 |
Fund overview (cont’d)
As a result of expense limitation arrangements, the ratio of total annual fund operating expenses, other than interest, brokerage commissions, taxes, extraordinary expenses, deferred organizational expenses and acquired fund fees and expenses, to average net assets will not exceed 1.01% for Class A shares, 1.25% for Class A2 shares, 1.80% for Class C shares, 1.30% for Class R shares and 0.65% for Class IS shares. In addition, the ratio of total annual fund operating expenses for Class IS shares will not exceed the ratio of total annual fund operating expenses for Class I shares. Total annual fund operating expenses after waiving fees and/or reimbursing expenses exceed the expense cap for Class R and Class IS shares as a result of acquired fund fees and expenses. These expense limitation (“expense cap”) arrangements cannot be terminated prior to December 31, 2022 without the Board of Directors’ consent. In addition, the manager has agreed to waive the Fund’s management fee to an extent sufficient to offset the net management fee payable in connection with any investment in an affiliated money market fund. This management fee waiver is not subject to the recapture provision discussed below.
The manager is permitted to recapture amounts waived and/or reimbursed to a class within two years after the fiscal year in which the manager earned the fee or incurred the expense if the class’ total annual fund operating expenses have fallen to a level below the expense limitation cap in effect at the time the fees were earned or the expenses incurred. In no case will the manager recapture any amount that would result, on any particular business day of the Fund, in the class’ total annual fund operating expenses exceeding the expense cap or any other lower limit then in effect.
Q. What were the leading contributors to performance?
A. The largest contributor to the Fund’s relative performance during the reporting period was its security selection. Within the Financials sector, overweight to aircraft leasing company Global Aircraft Leasing Co. Ltd. was beneficial for results. Winning holdings in the Industrials sector included overweights in Delta Air Lines Inc. and United Airlines Inc. All four companies benefited from a rebound in economic actively and expectations for a sustainable recovery.
From a sector perspective, overweights to Consumer Cyclicals2 and Industrials sectors, along with an underweight to Technology sector, were additive for returns. The Fund’s quality biases also modestly contributed to performance. This was driven by an underweight to securities rated BB, as higher quality corporate securities underperformed their lower rated counterparts.
Q. What were the leading detractors from performance?
A. The largest detractor from the Fund’s relative performance during the reporting period was its underweight to the Energy sector, as it rebounded sharply along with the price of oil.
Looking at security selection, within the Financials sector, underweights to Deutsche Bank and Commerzbank were drags on results as they benefited from improving fundamentals.
| 2 | Consumer Cyclicals consists of the following industries: Automotive, Entertainment, Gaming, Home Construction, Lodging, Retailers, Restaurants, Textiles, and other consumer services. |
| | |
4 | | Western Asset High Yield Fund 2021 Annual Report |
Within the Industrials sector, an underweight to Bombardier Inc., a Canadian manufacturer of business jets, was not rewarded as it performed well given the economic rebound.
Thank you for your investment in Western Asset High Yield Fund. As always, we appreciate that you have chosen us to manage your assets and we remain focused on achieving the Fund’s investment goals.
Sincerely,
Western Asset Management Company, LLC
June 16, 2021
RISKS: Fixed income securities involve interest rate, credit, inflation and reinvestment risks. As interest rates rise, the value of fixed income securities falls. Derivatives, such as options, futures and swaps, can be illiquid, may disproportionately increase losses, and have a potentially large impact on Fund performance. International investments are subject to special risks including currency fluctuations and social, economic and political uncertainties, which could increase volatility. These risks are magnified in emerging markets. Emerging market countries tend to have economic, political and legal systems that are less developed and are less stable than those of more developed countries. The use of leverage may increase volatility and possibility of loss. Securities rated below investment grade are commonly known as “junk bonds” or “high yield securities.” The risks of high yield securities include greater price volatility, illiquidity and possibility of default. Asset-backed, mortgage-backed or mortgage-related securities are subject to prepayment and extension risks. Please see the Fund’s prospectus for a more complete discussion of these and other risks and the Fund’s investment strategies.
Portfolio holdings and breakdowns are as of May 31, 2021 and are subject to change and may not be representative of the portfolio managers’ current or future investments. Please refer to pages 12 through 38 for a list and percentage breakdown of the Fund’s holdings.
The mention of sector breakdowns is for informational purposes only and should not be construed as a recommendation to purchase or sell any securities. The information provided regarding such sectors is not a sufficient basis upon which to make an investment decision. Investors seeking financial advice regarding the appropriateness of investing in any securities or investment strategies discussed should consult their financial professional. The Fund’s top five sector holdings (as a percentage of net assets) as of May 31, 2021 were: Consumer Discretionary (19.2%), Communication Services (13.6%), Energy (11.4%), Industrials (10.8%) and Health Care (10.4%). The Fund’s portfolio composition is subject to change at any time.
All investments are subject to risk including the possible loss of principal. Past performance is no guarantee of future results. All index performance reflects no deduction for fees, expenses or taxes. Please note that an investor cannot invest directly in an index.
The information provided is not intended to be a forecast of future events, a guarantee of future results or investment advice. Views expressed may differ from those of the firm as a whole.
| | |
| Western Asset High Yield Fund 2021 Annual Report | | 5 |
Fund overview (cont’d)
| i | Effective duration is a duration calculation for bonds with embedded options. Effective duration takes into account that expected cash flows will fluctuate as interest rates change. Please note, duration measures the sensitivity of price (the value of principal) of a fixed income investment to a change in interest rates. |
| ii | The Federal Reserve Board (the “Fed”) is responsible for the formulation of policies designed to promote economic growth, full employment, stable prices, and a sustainable pattern of international trade and payments. |
| iii | The federal funds rate is the target interest rate set by the Federal Open Market Committee at which commercial banks borrow and lend their excess reserves to each other overnight. |
| iv | The Bloomberg Barclays U.S. Aggregate Index is a broad-based bond index comprised of government, corporate, mortgage- and asset-backed issues, rated investment grade or higher, and having at least one year to maturity. |
| v | The Bloomberg Barclays U.S. Corporate High Yield — 2% Issuer Cap Index is an index of the 2% Issuer Cap component of the Bloomberg Barclays U.S. Corporate High Yield Index, which covers the U.S. dollar-denominated, non-investment grade, fixed-rate, taxable corporate bond market. |
| vi | The JPMorgan Emerging Markets Bond Index Global (“EMBI Global”) tracks total returns for U.S. dollar-denominated debt instruments issued by emerging market sovereign and quasi-sovereign entities: Brady bonds, loans, Eurobonds and local market instruments. |
| vii | Lipper, Inc., a wholly-owned subsidiary of Refinitiv, provides independent insight on global collective investments. Returns are based on the period ended May 31, 2021, including the reinvestment of all distributions, including returns of capital, if any, calculated among the 520 funds for the six-month period and among the 510 funds for the twelve-month period in the Fund’s Lipper category, and excluding sales charge, if any. |
| | |
6 | | Western Asset High Yield Fund 2021 Annual Report |
Fund at a glance† (unaudited)
Investment breakdown (%) as a percent of total investments
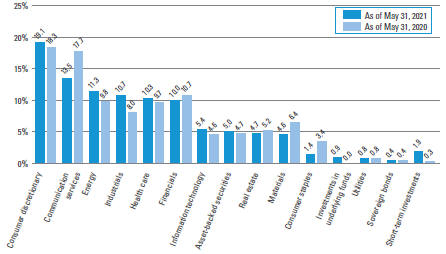
| † | The bar graph above represents the composition of the Fund’s investments as of May 31, 2021 and May 31, 2020 and does not include derivatives, such as futures contracts, forward foreign currency contracts and swap contracts. The Fund is actively managed. As a result, the composition of the Fund’s investments is subject to change at any time. |
| | |
| Western Asset High Yield Fund 2021 Annual Report | | 7 |
Fund expenses (unaudited)
Example
As a shareholder of the Fund, you may incur two types of costs: (1) transaction costs, including front-end and back-end sales charges (loads) on purchase payments; and (2) ongoing costs, including management fees; service and/or distribution (12b-1) fees; and other Fund expenses. This example is intended to help you understand your ongoing costs (in dollars) of investing in the Fund and to compare these costs with the ongoing costs of investing in other mutual funds.
This example is based on an investment of $1,000 invested on December 1, 2020 and held for the six months ended May 31, 2021.
Actual expenses
The table below titled “Based on Actual Total Return” provides information about actual account values and actual expenses. You may use the information provided in this table, together with the amount you invested, to estimate the expenses that you paid over the period. To estimate the expenses you paid on your account, divide your ending account value by $1,000 (for example, an $8,600 ending account value divided by $1,000 = 8.6), then multiply the result by the number under the heading entitled “Expenses Paid During the Period”.
Hypothetical example for comparison purposes
The table below titled “Based on Hypothetical Total Return” provides information about hypothetical account values and hypothetical expenses based on the actual expense ratio and an assumed rate of return of 5.00% per year before expenses, which is not the Fund’s actual return. The hypothetical account values and expenses may not be used to estimate the actual ending account balance or expenses you paid for the period. You may use the information provided in this table to compare the ongoing costs of investing in the Fund and other funds. To do so, compare the 5.00% hypothetical example relating to the Fund with the 5.00% hypothetical examples that appear in the shareholder reports of the other funds.
Please note that the expenses shown in the table below are meant to highlight your ongoing costs only and do not reflect any transactional costs, such as front-end or back-end sales charges (loads). Therefore, the table is useful in comparing ongoing costs only, and will not help you determine the relative total costs of owning different funds. In addition, if these transaction costs were included, your costs would have been higher.
| | | | | | | | | | | | | | | | | | | | | | | | | | | | | | | | | | | | | | | | | | | | | | |
| | |
| Based on actual total return1 | | | | | | Based on hypothetical total return1 | |
| | | Actual
Total Return
Without
Sales
Charge2 | | | Beginning Account
Value | | | Ending Account Value | | | Annualized
Expense
Ratio | | | Expenses
Paid During the Period3 | | | | | | | | Hypothetical
Annualized
Total Return | | | Beginning
Account Value | | | Ending
Account
Value | | | Annualized
Expense
Ratio | | | Expenses
Paid
During
the
Period3 | |
| Class A | | | 4.50 | % | | $ | 1,000.00 | | | $ | 1,045.00 | | | | 0.97 | % | | $ | 4.95 | | | | | | | Class A | | | 5.00 | % | | $ | 1,000.00 | | | $ | 1,020.10 | | | | 0.97 | % | | $ | 4.89 | |
| Class A2 | | | 4.52 | | | | 1,000.00 | | | | 1,045.20 | | | | 0.94 | | | | 4.79 | | | | | | | Class A2 | | | 5.00 | | | | 1,000.00 | | | | 1,020.24 | | | | 0.94 | | | | 4.73 | |
| Class C | | | 4.11 | | | | 1,000.00 | | | | 1,041.10 | | | | 1.76 | | | | 8.96 | | | | | | | Class C | | | 5.00 | | | | 1,000.00 | | | | 1,016.16 | | | | 1.76 | | | | 8.85 | |
| Class R | | | 4.35 | | | | 1,000.00 | | | | 1,043.50 | | | | 1.30 | | | | 6.62 | | | | | | | Class R | | | 5.00 | | | | 1,000.00 | | | | 1,018.45 | | | | 1.30 | | | | 6.54 | |
| Class I | | | 4.63 | | | | 1,000.00 | | | | 1,046.30 | | | | 0.77 | | | | 3.93 | | | | | | | Class I | | | 5.00 | | | | 1,000.00 | | | | 1,021.09 | | | | 0.77 | | | | 3.88 | |
| Class IS | | | 4.65 | | | | 1,000.00 | | | | 1,046.50 | | | | 0.65 | | | | 3.32 | | | | | | | Class IS | | | 5.00 | | | | 1,000.00 | | | | 1,021.69 | | | | 0.65 | | | | 3.28 | |
| | |
8 | | Western Asset High Yield Fund 2021 Annual Report |
| 1 | For the six months ended May 31, 2021. |
| 2 | Assumes the reinvestment of all distributions, including returns of capital, if any, at net asset value and does not reflect the deduction of the applicable sales charge with respect to Class A and Class A2 shares or the applicable contingent deferred sales charge (“CDSC”) with respect to Class C shares. Total return is not annualized, as it may not be representative of the total return for the year. Performance figures may reflect compensating balance arrangements, fee waivers and/or expense reimbursements. In the absence of compensating balance arrangements, fee waivers and/or expense reimbursements, the total return would have been lower. Past performance is no guarantee of future results. |
| 3 | Expenses (net of compensating balance arrangements, fee waivers and/or expense reimbursements) are equal to each class’ respective annualized expense ratio multiplied by the average account value over the period, multiplied by the number of days in the most recent fiscal half-year (182), then divided by 365. |
| | |
| Western Asset High Yield Fund 2021 Annual Report | | 9 |
Fund performance (unaudited)
| | | | | | | | | | | | | | | | | | | | | | | | |
| Average annual total returns | | | | | | | | | | | | | | | | | | |
Without sales charges1
| | Class A | | | Class A2 | | | Class C | | | Class R | | | Class I | | | Class IS | |
| Twelve Months Ended 5/31/21 | | | 16.41 | % | | | 16.47 | % | | | 15.66 | % | | | 16.16 | % | | | 16.65 | % | | | 16.88 | % |
| Five Years Ended 5/31/21 | | | 7.11 | | | | 7.10 | | | | 6.27 | | | | 6.77 | | | | 7.37 | | | | 7.44 | |
| Ten Years Ended 5/31/21 | | | N/A | | | | N/A | | | | N/A | | | | N/A | | | | 5.49 | | | | 5.55 | |
| Inception* through 5/31/21 | | | 5.53 | | | | 4.26 | | | | 4.63 | | | | 5.12 | | | | — | | | | — | |
| | | | | | |
With sales charges2
| | Class A | | | Class A2 | | | Class C | | | Class R | | | Class I | | | Class IS | |
| Twelve Months Ended 5/31/21 | | | 11.44 | % | | | 11.51 | % | | | 14.66 | % | | | 16.16 | % | | | 16.65 | % | | | 16.88 | % |
| Five Years Ended 5/31/21 | | | 6.17 | | | | 6.17 | | | | 6.27 | | | | 6.77 | | | | 7.37 | | | | 7.44 | |
| Ten Years Ended 5/31/21 | | | N/A | | | | N/A | | | | N/A | | | | N/A | | | | 5.49 | | | | 5.55 | |
| Inception* through 5/31/21 | | | 5.03 | | | | 3.60 | | | | 4.63 | | | | 5.12 | | | | — | | | | — | |
| | | | |
| Cumulative total returns | |
| Without sales charges1 | | | |
| Class A (Inception date of 4/30/12 through 5/31/21) | | | 63.02 | % |
| Class A2 (Inception date of 8/1/14 through 5/31/21) | | | 32.96 | |
| Class C (Inception date of 4/30/12 through 5/31/21) | | | 50.91 | |
| Class R (Inception date of 4/30/12 through 5/31/21) | | | 57.35 | |
| Class I (5/31/11 through 5/31/21) | | | 70.62 | |
| Class IS (5/31/11 through 5/31/21) | | | 71.59 | |
All figures represent past performance and are not a guarantee of future results. Investment return and principal value of an investment will fluctuate so that an investor’s shares, when redeemed, may be worth more or less than their original cost. The returns shown do not reflect the deduction of taxes that a shareholder would pay on Fund distributions or the redemption of Fund shares. Performance figures may reflect compensating balance arrangements, fee waivers and/or expense reimbursements. In the absence of compensating balance arrangements, fee waivers and/or expense reimbursements, the total return would have been lower.
| 1 | Assumes the reinvestment of all distributions, including returns of capital, if any, at net asset value and does not reflect the deduction of the applicable sales charge with respect to Class A shares and Class A2 shares or the applicable contingent deferred sales charge (“CDSC”) with respect to Class C shares. |
| 2 | Assumes the reinvestment of all distributions, including returns of capital, if any, at net asset value. In addition, Class A shares and Class A2 shares reflect the deduction of the maximum initial sales charge of 4.25%. Class C shares reflect the deduction of a 1.00% CDSC, which applies if shares are redeemed within one year from purchase payment. |
| * | Inception dates for Class A, A2, C, R, I and IS shares are April 30, 2012, August 1, 2014, April 30, 2012, April 30, 2012, September 28, 2001 and August 4, 2008, respectively. |
| | |
10 | | Western Asset High Yield Fund 2021 Annual Report |
Historical performance
Value of $1,000,000 invested in
Class I Shares of Western Asset High Yield Fund vs. Bloomberg Barclays U.S. Corporate High Yield — 2% Issuer Cap Index† — May 2011 - May 2021
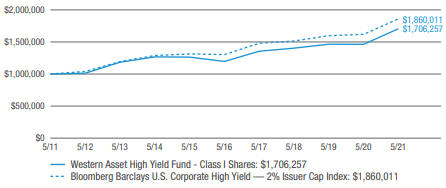
All figures represent past performance and are not a guarantee of future results. Investment return and principal value of an investment will fluctuate so that an investor’s shares, when redeemed, may be worth more or less than their original cost. The returns shown do not reflect the deduction of taxes that a shareholder would pay on Fund distributions or the redemption of Fund shares. Performance figures may reflect compensating balance arrangements, fee waivers and/or expense reimbursements. In the absence of compensating balance arrangements, fee waivers and/or expense reimbursements, the total return would have been lower.
| † | Hypothetical illustration of $1,000,000 invested in Class I shares of Western Asset High Yield Fund on May 31, 2011, assuming the reinvestment of all distributions, including returns of capital, if any, at net asset value through May 31, 2021. The hypothetical illustration also assumes a $1,000,000 investment in the Bloomberg Barclays U.S. Corporate High Yield — 2% Issuer Cap Index. The Bloomberg Barclays U.S. Corporate High Yield — 2% Issuer Cap Index (the “Index”) is an index of the 2% Issuer Cap component of the Bloomberg Barclays U.S. Corporate High Yield Index, which covers the U.S. dollar-denominated, non-investment grade, fixed-rate, taxable corporate bond market. The Index is unmanaged and not subject to the same management and trading expenses as a mutual fund. Please note that an investor cannot invest directly in an index. The performance of the Fund’s other classes may be greater or less than the performance of Class I shares indicated on this chart, depending on whether greater or lesser sales charges and fees were incurred by shareholders investing in the other classes. |
| | |
| Western Asset High Yield Fund 2021 Annual Report | | 11 |
Schedule of investments
May 31, 2021
Western Asset High Yield Fund
| | | | | | | | | | | | | | | | |
| Security | | Rate | | | Maturity
Date | | | Face
Amount | | | Value | |
| Corporate Bonds & Notes — 79.2% | | | | | | | | | | | | | | | | |
| Communication Services — 12.5% | | | | | | | | | | | | | | | | |
Diversified Telecommunication Services — 1.7% | | | | | | | | | | | | | |
Altice France Holding SA, Senior Secured Notes | | | 10.500 | % | | | 5/15/27 | | | $ | 320,000 | | | $ | 358,160 | (a) |
Altice France SA, Senior Secured Notes | | | 7.375 | % | | | 5/1/26 | | | | 400,000 | | | | 416,468 | (a) |
Altice France SA, Senior Secured Notes | | | 8.125 | % | | | 2/1/27 | | | | 200,000 | | | | 218,250 | (a) |
Altice France SA, Senior Secured Notes | | | 5.125 | % | | | 7/15/29 | | | | 880,000 | | | | 873,624 | (a) |
Frontier Communications Holdings LLC, Secured Notes | | | 6.750 | % | | | 5/1/29 | | | | 220,000 | | | | 230,303 | (a) |
Frontier Communications Holdings LLC, Senior Secured Notes | | | 5.000 | % | | | 5/1/28 | | | | 260,000 | | | | 266,825 | (a) |
Intelsat Jackson Holdings SA, Senior Secured Notes | | | 8.000 | % | | | 2/15/24 | | | | 850,000 | | | | 880,464 | (a) |
Lumen Technologies Inc., Senior Notes | | | 5.625 | % | | | 4/1/25 | | | | 520,000 | | | | 559,068 | |
Total Diversified Telecommunication Services | | | | | | | | | | | | 3,803,162 | |
Entertainment — 1.6% | | | | | | | | | | | | | | | | |
Allen Media LLC/Allen Media | | | | | | | | | | | | | | | | |
Co-Issuer Inc., Senior Notes | | | 10.500 | % | | | 2/15/28 | | | | 760,000 | | | | 807,382 | (a) |
Cinemark USA Inc., Senior Notes | | | 5.875 | % | | | 3/15/26 | | | | 590,000 | | | | 612,137 | (a) |
Netflix Inc., Senior Notes | | | 6.375 | % | | | 5/15/29 | | | | 380,000 | | | | 475,424 | |
Netflix Inc., Senior Notes | | | 5.375 | % | | | 11/15/29 | | | | 330,000 | | | | 390,631 | (a) |
Netflix Inc., Senior Notes | | | 4.875 | % | | | 6/15/30 | | | | 350,000 | | | | 403,812 | (a) |
Playtika Holding Corp., Senior Notes | | | 4.250 | % | | | 3/15/29 | | | | 580,000 | | | | 572,556 | (a) |
Speedway Motorsports LLC/Speedway Funding II Inc., Senior Notes | | | 4.875 | % | | | 11/1/27 | | | | 210,000 | | | | 209,763 | (a) |
Total Entertainment | | | | | | | | | | | | | | | 3,471,705 | |
Interactive Media & Services — 0.6% | | | | | | | | | | | | | | | | |
Match Group Holdings II LLC, Senior Notes | | | 4.625 | % | | | 6/1/28 | | | | 580,000 | | | | 595,225 | (a) |
Rackspace Technology Global Inc., Senior Secured Notes | | | 3.500 | % | | | 2/15/28 | | | | 780,000 | | | | 752,181 | (a) |
Total Interactive Media & Services | | | | | | | | | | | | | | | 1,347,406 | |
Media — 5.7% | | | | | | | | | | | | | | | | |
CCO Holdings LLC/CCO Holdings Capital Corp., Senior Notes | | | 5.750 | % | | | 2/15/26 | | | | 132,000 | | | | 136,653 | (a) |
CCO Holdings LLC/CCO Holdings Capital Corp., Senior Notes | | | 5.125 | % | | | 5/1/27 | | | | 770,000 | | | | 805,612 | (a) |
CCO Holdings LLC/CCO Holdings Capital Corp., Senior Notes | | | 4.500 | % | | | 8/15/30 | | | | 1,070,000 | | | | 1,091,716 | (a) |
See Notes to Financial Statements.
| | |
12 | | Western Asset High Yield Fund 2021 Annual Report |
Western Asset High Yield Fund
| | | | | | | | | | | | | | | | |
| Security | | Rate | | | Maturity
Date | | | Face
Amount | | | Value | |
Media — continued | | | | | | | | | | | | | | | | |
CCO Holdings LLC/CCO Holdings Capital Corp., Senior Notes | | | 4.500 | % | | | 5/1/32 | | | $ | 1,010,000 | | | $ | 1,022,479 | |
Charter Communications Operating LLC/ Charter Communications Operating Capital Corp., Senior Secured Notes | | | 6.484 | % | | | 10/23/45 | | | | 180,000 | | | | 237,256 | |
Clear Channel Outdoor Holdings Inc., Senior Notes | | | 7.500 | % | | | 6/1/29 | | | | 830,000 | | | | 828,879 | (a)(b) |
DISH DBS Corp., Senior Notes | | | 5.875 | % | | | 11/15/24 | | | | 680,000 | | | | 724,669 | |
DISH DBS Corp., Senior Notes | | | 7.750 | % | | | 7/1/26 | | | | 1,700,000 | | | | 1,933,240 | |
DISH DBS Corp., Senior Notes | | | 5.125 | % | | | 6/1/29 | | | | 810,000 | | | | 804,613 | (a) |
iHeartCommunications Inc., Senior Secured Notes | | | 5.250 | % | | | 8/15/27 | | | | 90,000 | | | | 93,369 | (a) |
iHeartCommunications Inc., Senior Secured Notes | | | 4.750 | % | | | 1/15/28 | | | | 680,000 | | | | 695,603 | (a) |
News Corp., Senior Notes | | | 3.875 | % | | | 5/15/29 | | | | 650,000 | | | | 656,500 | (a) |
Time Warner Cable LLC, Senior Secured Notes | | | 7.300 | % | | | 7/1/38 | | | | 340,000 | | | | 481,971 | |
Univision Communications Inc., Senior Secured Notes | | | 9.500 | % | | | 5/1/25 | | | | 570,000 | | | | 629,226 | (a) |
UPC Holding BV, Senior Secured Notes | | | 5.500 | % | | | 1/15/28 | | | | 410,000 | | | | 429,465 | (a) |
Urban One Inc., Senior Secured Notes | | | 7.375 | % | | | 2/1/28 | | | | 310,000 | | | | 328,690 | (a) |
Virgin Media Secured Finance PLC, Senior Secured Notes | | | 5.500 | % | | | 8/15/26 | | | | 130,000 | | | | 134,973 | (a) |
Virgin Media Secured Finance PLC, Senior Secured Notes | | | 5.500 | % | | | 5/15/29 | | | | 1,290,000 | | | | 1,380,300 | (a) |
Virgin Media Vendor Financing Notes IV DAC, Senior Notes | | | 5.000 | % | | | 7/15/28 | | | | 350,000 | | | | 354,807 | (a) |
Total Media | | | | | | | | | | | | | | | 12,770,021 | |
Wireless Telecommunication Services — 2.9% | | | | | | | | | | | | | | | | |
CSC Holdings LLC, Senior Notes | | | 6.500 | % | | | 2/1/29 | | | | 920,000 | | | | 1,007,662 | (a) |
CSC Holdings LLC, Senior Notes | | | 4.500 | % | | | 11/15/31 | | | | 480,000 | | | | 478,586 | (a) |
Sprint Capital Corp., Senior Notes | | | 8.750 | % | | | 3/15/32 | | | | 1,375,000 | | | | 2,040,459 | |
Sprint Communications Inc., Senior Notes | | | 11.500 | % | | | 11/15/21 | | | | 5,000 | | | | 5,247 | |
Sprint Corp., Senior Notes | | | 7.875 | % | | | 9/15/23 | | | | 430,000 | | | | 487,775 | |
Sprint Corp., Senior Notes | | | 7.625 | % | | | 2/15/25 | | | | 420,000 | | | | 497,120 | |
Switch Ltd., Senior Notes | | | 3.750 | % | | | 9/15/28 | | | | 550,000 | | | | 547,313 | (a) |
T-Mobile USA Inc., Senior Notes | | | 3.500 | % | | | 4/15/31 | | | | 570,000 | | | | 580,425 | |
T-Mobile USA Inc., Senior Notes | | | 3.500 | % | | | 4/15/31 | | | | 840,000 | | | | 855,364 | (a) |
Total Wireless Telecommunication Services | | | | | | | | | | | | 6,499,951 | |
Total Communication Services | | | | | | | | | | | | | | | 27,892,245 | |
See Notes to Financial Statements.
| | |
| Western Asset High Yield Fund 2021 Annual Report | | 13 |
Schedule of investments (cont’d)
May 31, 2021
Western Asset High Yield Fund
| | | | | | | | | | | | | | | | |
| Security | | Rate | | | Maturity
Date | | | Face
Amount | | | Value | |
| Consumer Discretionary — 15.7% | | | | | | | | | | | | | | | | |
Auto Components — 0.4% | | | | | | | | | | | | | | | | |
American Axle & Manufacturing Inc., Senior Notes | | | 6.250 | % | | | 3/15/26 | | | $ | 149,000 | | | $ | 153,944 | |
American Axle & Manufacturing Inc., Senior Notes | | | 6.500 | % | | | 4/1/27 | | | | 621,000 | | | | 660,006 | |
Total Auto Components | | | | | | | | | | | | | | | 813,950 | |
Automobiles — 1.7% | | | | | | | | | | | | | | | | |
Ford Motor Co., Senior Notes | | | 9.000 | % | | | 4/22/25 | | | | 750,000 | | | | 917,287 | |
Ford Motor Credit Co. LLC, Senior Notes | | | 5.113 | % | | | 5/3/29 | | | | 1,110,000 | | | | 1,218,469 | |
Ford Motor Credit Co. LLC, Senior Notes | | | 4.000 | % | | | 11/13/30 | | | | 940,000 | | | | 959,947 | |
PM General Purchaser LLC, Senior Secured Notes | | | 9.500 | % | | | 10/1/28 | | | | 590,000 | | | | 645,313 | (a) |
Total Automobiles | | | | | | | | | | | | | | | 3,741,016 | |
Distributors — 0.6% | | | | | | | | | | | | | | | | |
American News Co. LLC, Secured Notes (8.500% Cash or 10.000% PIK) | | | 8.500 | % | | | 9/1/26 | | | | 1,189,756 | | | | 1,331,974 | (a)(c) |
Diversified Consumer Services — 2.5% | | | | | | | | | | | | | | | | |
Adtalem Global Education Inc., Senior Secured Notes | | | 5.500 | % | | | 3/1/28 | | | | 930,000 | | | | 931,251 | (a) |
Carriage Services Inc., Senior Notes | | | 4.250 | % | | | 5/15/29 | | | | 710,000 | | | | 710,000 | (a) |
Prime Security Services Borrower LLC/ Prime Finance Inc., Secured Notes | | | 6.250 | % | | | 1/15/28 | | | | 1,560,000 | | | | 1,615,793 | (a) |
Prime Security Services Borrower LLC/ Prime Finance Inc., Senior Secured Notes | | | 3.375 | % | | | 8/31/27 | | | | 390,000 | | | | 375,083 | (a) |
Service Corp. International, Senior Notes | | | 7.500 | % | | | 4/1/27 | | | | 167,000 | | | | 202,459 | |
StoneMor Inc., Senior Secured Notes | | | 8.500 | % | | | 5/15/29 | | | | 810,000 | | | | 801,240 | (a) |
WW International Inc., Senior Secured Notes | | | 4.500 | % | | | 4/15/29 | | | | 840,000 | | | | 840,949 | (a) |
Total Diversified Consumer Services | | | | | | | | | | | | | | | 5,476,775 | |
Hotels, Restaurants & Leisure — 7.1% | | | | | | | | | | | | | | | | |
Boyne USA Inc., Senior Notes | | | 4.750 | % | | | 5/15/29 | | | | 420,000 | | | | 434,742 | (a) |
Caesars Entertainment Inc., Senior Secured Notes | | | 6.250 | % | | | 7/1/25 | | | | 370,000 | | | | 390,413 | (a) |
Carnival Corp., Senior Notes | | | 5.750 | % | | | 3/1/27 | | | | 660,000 | | | | 702,075 | (a) |
Full House Resorts Inc., Senior Secured Notes | | | 8.250 | % | | | 2/15/28 | | | | 480,000 | | | | 522,223 | (a) |
Hilton Domestic Operating Co. Inc., Senior Notes | | | 3.625 | % | | | 2/15/32 | | | | 550,000 | | | | 539,000 | (a) |
International Game Technology PLC, Senior Secured Notes | | | 4.125 | % | | | 4/15/26 | | | | 480,000 | | | | 496,231 | (a) |
See Notes to Financial Statements.
| | |
14 | | Western Asset High Yield Fund 2021 Annual Report |
Western Asset High Yield Fund
| | | | | | | | | | | | | | | | |
| Security | | Rate | | | Maturity
Date | | | Face
Amount | | | Value | |
Hotels, Restaurants & Leisure — continued | | | | | | | | | | | | | | | | |
Melco Resorts Finance Ltd., Senior Notes | | | 5.375 | % | | | 12/4/29 | | | $ | 500,000 | | | $ | 534,250 | (a) |
Mohegan Gaming & Entertainment, Senior Notes | | | 7.875 | % | | | 10/15/24 | | | | 340,000 | | | | 355,637 | (a) |
NCL Corp. Ltd., Senior Notes | | | 3.625 | % | | | 12/15/24 | | | | 640,000 | | | | 612,461 | (a) |
NCL Corp. Ltd., Senior Notes | | | 5.875 | % | | | 3/15/26 | | | | 320,000 | | | | 334,002 | (a) |
NCL Corp. Ltd., Senior Secured Notes | | | 12.250 | % | | | 5/15/24 | | | | 900,000 | | | | 1,091,200 | (a) |
NCL Corp. Ltd., Senior Secured Notes | | | 10.250 | % | | | 2/1/26 | | | | 310,000 | | | | 362,336 | (a) |
Royal Caribbean Cruises Ltd., Senior Notes | | | 5.500 | % | | | 4/1/28 | | | | 690,000 | | | | 727,087 | (a) |
Sands China Ltd., Senior Notes | | | 3.800 | % | | | 1/8/26 | | | | 320,000 | | | | 347,200 | |
Scientific Games International Inc., Senior Notes | | | 7.000 | % | | | 5/15/28 | | | | 410,000 | | | | 444,227 | (a) |
Silversea Cruise Finance Ltd., Senior Secured Notes | | | 7.250 | % | | | 2/1/25 | | | | 812,000 | | | | 842,588 | (a) |
Sizzling Platter LLC/Sizzling Platter Finance Corp., Senior Secured Notes | | | 8.500 | % | | | 11/28/25 | | | | 450,000 | | | | 454,180 | (a) |
Sugarhouse HSP Gaming Prop Mezz LP/ Sugarhouse HSP Gaming Finance Corp., Senior Secured Notes | | | 5.875 | % | | | 5/15/25 | | | | 280,000 | | | | 275,421 | (a) |
Viking Cruises Ltd., Senior Notes | | | 5.875 | % | | | 9/15/27 | | | | 290,000 | | | | 280,213 | (a) |
Viking Cruises Ltd., Senior Notes | | | 7.000 | % | | | 2/15/29 | | | | 860,000 | | | | 883,078 | (a) |
Viking Cruises Ltd., Senior Secured Notes | | | 13.000 | % | | | 5/15/25 | | | | 880,000 | | | | 1,029,547 | (a) |
VOC Escrow Ltd., Senior Secured Notes | | | 5.000 | % | | | 2/15/28 | | | | 1,500,000 | | | | 1,511,415 | (a) |
Wynn Macau Ltd., Senior Notes | | | 5.625 | % | | | 8/26/28 | | | | 2,030,000 | | | | 2,141,721 | (a) |
Wynn Resorts Finance LLC/Wynn Resorts Capital Corp., Senior Notes | | | 7.750 | % | | | 4/15/25 | | | | 450,000 | | | | 484,875 | (a) |
Total Hotels, Restaurants & Leisure | | | | | | | | | | | | | | | 15,796,122 | |
Household Durables — 0.4% | | | | | | | | | | | | | | | | |
Installed Building Products Inc., Senior Notes | | | 5.750 | % | | | 2/1/28 | | | | 480,000 | | | | 506,909 | (a) |
TopBuild Corp., Senior Notes | | | 3.625 | % | | | 3/15/29 | | | | 520,000 | | | | 512,912 | (a) |
Total Household Durables | | | | | | | | | | | | | | | 1,019,821 | |
Specialty Retail — 3.0% | | | | | | | | | | | | | | | | |
Academy Ltd., Senior Secured Notes | | | 6.000 | % | | | 11/15/27 | | | | 500,000 | | | | 532,125 | (a) |
L Brands Inc., Senior Notes | | | 9.375 | % | | | 7/1/25 | | | | 400,000 | | | | 510,222 | (a) |
L Brands Inc., Senior Notes | | | 6.694 | % | | | 1/15/27 | | | | 500,000 | | | | 577,052 | |
L Brands Inc., Senior Notes | | | 5.250 | % | | | 2/1/28 | | | | 740,000 | | | | 803,866 | |
L Brands Inc., Senior Notes | | | 7.500 | % | | | 6/15/29 | | | | 140,000 | | | | 161,384 | |
L Brands Inc., Senior Notes | | | 6.625 | % | | | 10/1/30 | | | | 530,000 | | | | 606,519 | (a) |
Magic Mergeco Inc., Senior Notes | | | 7.875 | % | | | 5/1/29 | | | | 810,000 | | | | 828,622 | (a) |
See Notes to Financial Statements.
| | |
| Western Asset High Yield Fund 2021 Annual Report | | 15 |
Schedule of investments (cont’d)
May 31, 2021
Western Asset High Yield Fund
| | | | | | | | | | | | | | | | |
| Security | | Rate | | | Maturity
Date | | | Face
Amount | | | Value | |
Specialty Retail — continued | | | | | | | | | | | | | | | | |
Magic Mergeco Inc., Senior Secured Notes | | | 5.250 | % | | | 5/1/28 | | | $ | 300,000 | | | $ | 304,126 | (a) |
NMG Holding Co. Inc./Neiman Marcus Group LLC, Senior Secured Notes | | | 7.125 | % | | | 4/1/26 | | | | 290,000 | | | | 306,494 | (a) |
Party City Holdings Inc., Senior Secured Notes | | | 8.750 | % | | | 2/15/26 | | | | 670,000 | | | | 710,200 | (a) |
PetSmart Inc./PetSmart Finance Corp., | | | | | | | | | | | | | | | | |
Senior Notes | | | 7.750 | % | | | 2/15/29 | | | | 250,000 | | | | 275,547 | (a) |
PetSmart Inc./PetSmart Finance Corp., Senior Secured Notes | | | 4.750 | % | | | 2/15/28 | | | | 250,000 | | | | 259,238 | (a) |
Rent-A-Center Inc., Senior Notes | | | 6.375 | % | | | 2/15/29 | | | | 690,000 | | | | 740,325 | (a) |
Terminix Co. LLC, Senior Notes | | | 7.450 | % | | | 8/15/27 | | | | 165,000 | | | | 193,006 | |
Total Specialty Retail | | | | | | | | | | | | | | | 6,808,726 | |
Total Consumer Discretionary | | | | | | | | | | | | | | | 34,988,384 | |
| Consumer Staples — 1.4% | | | | | | | | | | | | | | | | |
Beverages — 0.3% | | | | | | | | | | | | | | | | |
Triton Water Holdings Inc., Senior Notes | | | 6.250 | % | | | 4/1/29 | | | | 590,000 | | | | 592,330 | (a) |
Food Products — 0.9% | | | | | | | | | | | | | | | | |
Kraft Heinz Foods Co., Senior Notes | | | 5.200 | % | | | 7/15/45 | | | | 400,000 | | | | 473,209 | |
Kraft Heinz Foods Co., Senior Notes | | | 5.500 | % | | | 6/1/50 | | | | 850,000 | | | | 1,058,207 | |
Simmons Foods Inc./Simmons Prepared Foods Inc./Simmons Pet Food Inc./ Simmons Feed Ingredients Inc., Secured Notes | | | 4.625 | % | | | 3/1/29 | | | | 560,000 | | | | 568,112 | (a) |
Total Food Products | | | | | | | | | | | | | | | 2,099,528 | |
Personal Products — 0.2% | | | | | | | | | | | | | | | | |
Edgewell Personal Care Co., Senior Notes | | | 4.125 | % | | | 4/1/29 | | | | 330,000 | | | | 331,178 | (a) |
Total Consumer Staples | | | | | | | | | | | | | | | 3,023,036 | |
| Energy — 9.7% | | | | | | | | | | | | | | | | |
Oil, Gas & Consumable Fuels — 9.7% | | | | | | | | | | | | | | | | |
Antero Midstream Partners LP/Antero Midstream Finance Corp., Senior Notes | | | 5.375 | % | | | 9/15/24 | | | | 130,000 | | | | 133,900 | |
Antero Resources Corp., Senior Notes | | | 5.375 | % | | | 3/1/30 | | | | 460,000 | | | | 462,330 | (a)(b) |
Apache Corp., Senior Notes | | | 7.750 | % | | | 12/15/29 | | | | 400,000 | | | | 469,750 | |
Apache Corp., Senior Notes | | | 5.100 | % | | | 9/1/40 | | | | 260,000 | | | | 268,659 | |
Berry Petroleum Co. LLC, Senior Notes | | | 7.000 | % | | | 2/15/26 | | | | 1,430,000 | | | | 1,417,502 | (a) |
Blue Racer Midstream LLC/Blue Racer Finance Corp., Senior Notes | | | 7.625 | % | | | 12/15/25 | | | | 190,000 | | | | 205,698 | (a) |
Blue Racer Midstream LLC/Blue Racer Finance Corp., Senior Notes | | | 6.625 | % | | | 7/15/26 | | | | 1,000,000 | | | | 1,046,825 | (a) |
See Notes to Financial Statements.
| | |
16 | | Western Asset High Yield Fund 2021 Annual Report |
Western Asset High Yield Fund
| | | | | | | | | | | | | | | | |
| Security | | Rate | | | Maturity
Date | | | Face
Amount | | | Value | |
Oil, Gas & Consumable Fuels — continued | | | | | | | | | | | | | | | | |
Cheniere Energy Partners LP, Senior Notes | | | 4.500 | % | | | 10/1/29 | | | $ | 250,000 | | | $ | 264,687 | |
Cheniere Energy Partners LP, Senior Notes | | | 4.000 | % | | | 3/1/31 | | | | 450,000 | | | | 465,082 | (a) |
Chesapeake Energy Corp., Senior Notes | | | 5.500 | % | | | 2/1/26 | | | | 90,000 | | | | 95,068 | (a) |
CNX Midstream Partners LP/CNX Midstream Finance Corp., Senior Notes | | | 6.500 | % | | | 3/15/26 | | | | 10,000 | | | | 10,471 | (a) |
Comstock Resources Inc., Senior Notes | | | 7.500 | % | | | 5/15/25 | | | | 127,000 | | | | 131,890 | (a) |
Continental Resources Inc., Senior Notes | | | 5.750 | % | | | 1/15/31 | | | | 490,000 | | | | 575,696 | (a) |
CrownRock LP/CrownRock Finance Inc., Senior Notes | | | 5.000 | % | | | 5/1/29 | | | | 740,000 | | | | 762,133 | (a) |
DCP Midstream Operating LP, Senior Notes | | | 6.450 | % | | | 11/3/36 | | | | 210,000 | | | | 240,526 | (a) |
DCP Midstream Operating LP, Senior Notes | | | 6.750 | % | | | 9/15/37 | | | | 670,000 | | | | 788,925 | (a) |
Endeavor Energy Resources LP/EER Finance Inc., Senior Notes | | | 6.625 | % | | | 7/15/25 | | | | 290,000 | | | | 308,147 | (a) |
Endeavor Energy Resources LP/EER Finance Inc., Senior Notes | | | 5.500 | % | | | 1/30/26 | | | | 220,000 | | | | 227,698 | (a) |
EQM Midstream Partners LP, Senior Notes | | | 6.000 | % | | | 7/1/25 | | | | 180,000 | | | | 195,298 | (a) |
EQM Midstream Partners LP, Senior Notes | | | 6.500 | % | | | 7/1/27 | | | | 260,000 | | | | 286,396 | (a) |
EQM Midstream Partners LP, Senior Notes | | | 5.500 | % | | | 7/15/28 | | | | 560,000 | | | | 599,217 | |
EQM Midstream Partners LP, Senior Notes | | | 6.500 | % | | | 7/15/48 | | | | 400,000 | | | | 425,266 | |
EQT Corp., Senior Notes | | | 7.625 | % | | | 2/1/25 | | | | 180,000 | | | | 210,455 | |
EQT Corp., Senior Notes | | | 3.125 | % | | | 5/15/26 | | | | 210,000 | | | | 214,405 | (a) |
EQT Corp., Senior Notes | | | 3.900 | % | | | 10/1/27 | | | | 230,000 | | | | 245,904 | |
EQT Corp., Senior Notes | | | 5.000 | % | | | 1/15/29 | | | | 740,000 | | | | 822,321 | |
EQT Corp., Senior Notes | | | 3.625 | % | | | 5/15/31 | | | | 200,000 | | | | 206,237 | (a) |
MEG Energy Corp., Senior Notes | | | 7.125 | % | | | 2/1/27 | | | | 1,190,000 | | | | 1,277,774 | (a) |
MEG Energy Corp., Senior Notes | | | 5.875 | % | | | 2/1/29 | | | | 400,000 | | | | 417,078 | (a) |
Murphy Oil Corp., Senior Notes | | | 5.750 | % | | | 8/15/25 | | | | 190,000 | | | | 195,398 | |
NGPL PipeCo LLC, Senior Notes | | | 7.768 | % | | | 12/15/37 | | | | 180,000 | | | | 248,422 | (a) |
Northern Oil and Gas Inc., Senior Notes | | | 8.125 | % | | | 3/1/28 | | | | 730,000 | | | | 765,679 | (a) |
Oasis Petroleum Inc., Senior Notes | | | 6.375 | % | | | 6/1/26 | | | | 1,090,000 | | | | 1,109,075 | (a)(b) |
Occidental Petroleum Corp., Senior Notes | | | 2.700 | % | | | 2/15/23 | | | | 222,000 | | | | 223,613 | |
Occidental Petroleum Corp., Senior Notes | | | 2.900 | % | | | 8/15/24 | | | | 870,000 | | | | 868,912 | |
Occidental Petroleum Corp., Senior Notes | | | 8.875 | % | | | 7/15/30 | | | | 220,000 | | | | 282,610 | |
Occidental Petroleum Corp., Senior Notes | | | 6.125 | % | | | 1/1/31 | | | | 220,000 | | | | 244,306 | |
Occidental Petroleum Corp., Senior Notes (3 mo. USD LIBOR + 1.450%) | | | 1.606 | % | | | 8/15/22 | | | | 90,000 | | | | 89,353 | (d) |
PBF Holding Co. LLC/PBF Finance Corp., Senior Secured Notes | | | 9.250 | % | | | 5/15/25 | | | | 180,000 | | | | 185,602 | (a) |
See Notes to Financial Statements.
| | |
| Western Asset High Yield Fund 2021 Annual Report | | 17 |
Schedule of investments (cont’d)
May 31, 2021
Western Asset High Yield Fund
| | | | | | | | | | | | | | | | |
| Security | | Rate | | | Maturity
Date | | | Face
Amount | | | Value | |
Oil, Gas & Consumable Fuels — continued | | | | | | | | | | | | | | | | |
Petrobras Global Finance BV, Senior Notes | | | 7.375 | % | | | 1/17/27 | | | $ | 470,000 | | | $ | 574,110 | |
Petrobras Global Finance BV, Senior Notes | | | 5.750 | % | | | 2/1/29 | | | | 150,000 | | | | 169,238 | |
Range Resources Corp., Senior Notes | | | 9.250 | % | | | 2/1/26 | | | | 620,000 | | | | 684,635 | |
Range Resources Corp., Senior Notes | | | 8.250 | % | | | 1/15/29 | | | | 530,000 | | | | 591,700 | (a) |
Tallgrass Energy Partners LP/Tallgrass Energy Finance Corp., Senior Notes | | | 6.000 | % | | | 12/31/30 | | | | 760,000 | | | | 777,054 | (a) |
Targa Resources Partners LP/Targa Resources Partners Finance Corp., Senior Notes | | | 4.875 | % | | | 2/1/31 | | | | 490,000 | | | | 513,601 | (a) |
Western Midstream Operating LP, Senior Notes | | | 4.350 | % | | | 2/1/25 | | | | 450,000 | | | | 469,687 | |
Western Midstream Operating LP, Senior Notes | | | 5.500 | % | | | 8/15/48 | | | | 710,000 | | | | 737,438 | |
Total Energy | | | | | | | | | | | | | | | 21,505,771 | |
| Financials — 8.6% | | | | | | | | | | | | | | | | |
Banks — 2.1% | | | | | | | | | | | | | | | | |
Bank of America Corp., Junior Subordinated Notes (5.875% to 3/15/28 then 3 mo. USD LIBOR + 2.931%) | | | 5.875 | % | | | 3/15/28 | | | | 200,000 | | | | 224,750 | (d)(e) |
Barclays PLC, Junior Subordinated Notes (8.000% to 6/15/24 then 5 year Treasury Constant Maturity Rate + 5.672%) | | | 8.000 | % | | | 6/15/24 | | | | 460,000 | | | | 522,962 | (d)(e) |
Barclays PLC, Subordinated Notes (5.088% to 6/20/29 then 3 mo. USD LIBOR + 3.054%) | | | 5.088 | % | | | 6/20/30 | | | | 200,000 | | | | 230,727 | (d) |
BNP Paribas SA, Junior Subordinated Notes (7.375% to 8/19/25 then USD 5 year ICE Swap Rate + 5.150%) | | | 7.375 | % | | | 8/19/25 | | | | 340,000 | | | | 395,276 | (a)(d)(e) |
Credit Agricole SA, Junior Subordinated Notes (8.125% to 12/23/25 then USD 5 year ICE Swap Rate + 6.185%) | | | 8.125 | % | | | 12/23/25 | | | | 360,000 | | | | 437,509 | (a)(d)(e) |
Intesa Sanpaolo SpA, Subordinated Notes | | | 4.198 | % | | | 6/1/32 | | | | 510,000 | | | | 517,496 | (a)(b) |
Lloyds Banking Group PLC, Junior Subordinated Notes (6.750% to 6/27/26 then 5 year Treasury Constant Maturity Rate + 4.815%) | | | 6.750 | % | | | 6/27/26 | | | | 290,000 | | | | 330,480 | (d)(e) |
Natwest Group PLC, Junior Subordinated Notes (8.625% to 8/15/21 then USD 5 year ICE Swap Rate + 7.598%) | | | 8.625 | % | | | 8/15/21 | | | | 680,000 | | | | 688,507 | (d)(e) |
See Notes to Financial Statements.
| | |
18 | | Western Asset High Yield Fund 2021 Annual Report |
Western Asset High Yield Fund
| | | | | | | | | | | | | | | | |
| Security | | Rate | | | Maturity
Date | | | Face
Amount | | | Value | |
Banks — continued | | | | | | | | | | | | | | | | |
UniCredit SpA, Subordinated Notes (5.459% to 6/30/30 then USD 5 year ICE Swap Rate + 4.750%) | | | 5.459 | % | | | 6/30/35 | | | $ | 840,000 | | | $ | 909,332 | (a)(d) |
UniCredit SpA, Subordinated Notes (7.296% to 4/2/29 then USD 5 year ICE Swap Rate + 4.914%) | | | 7.296 | % | | | 4/2/34 | | | | 390,000 | | | | 466,038 | (a)(d) |
Total Banks | | | | | | | | | | | | | | | 4,723,077 | |
Capital Markets — 1.2% | | | | | | | | | | | | | | | | |
Compass Group Diversified Holdings LLC, Senior Notes | | | 5.250 | % | | | 4/15/29 | | | | 500,000 | | | | 516,743 | (a) |
Credit Suisse Group AG, Junior Subordinated Notes (6.375% to 8/21/26 then 5 year Treasury Constant Maturity Rate + 4.822%) | | | 6.375 | % | | | 8/21/26 | | | | 600,000 | | | | 656,001 | (a)(d)(e) |
Credit Suisse Group AG, Junior Subordinated Notes (7.250% to 9/12/25 then USD 5 year ICE Swap Rate + 4.332%) | | | 7.250 | % | | | 9/12/25 | | | | 200,000 | | | | 223,199 | (a)(d)(e) |
Credit Suisse Group AG, Junior Subordinated Notes (7.500% to 7/17/23 then USD 5 year ICE Swap Rate + 4.600%) | | | 7.500 | % | | | 7/17/23 | | | | 210,000 | | | | 227,115 | (a)(d)(e) |
StoneX Group Inc., Senior Secured Notes | | | 8.625 | % | | | 6/15/25 | | | | 310,000 | | | | 332,436 | (a) |
UBS Group AG, Junior Subordinated Notes (7.000% to 1/31/24 then USD 5 year ICE Swap Rate + 4.344%) | | | 7.000 | % | | | 1/31/24 | | | | 660,000 | | | | 727,699 | (a)(d)(e) |
Total Capital Markets | | | | | | | | | | | | | | | 2,683,193 | |
Consumer Finance — 0.8% | | | | | | | | | | | | | | | | |
FirstCash Inc., Senior Notes | | | 4.625 | % | | | 9/1/28 | | | | 500,000 | | | | 518,767 | (a) |
Midcap Financial Issuer Trust, Senior Notes | | | 6.500 | % | | | 5/1/28 | | | | 700,000 | | | | 733,159 | (a) |
Navient Corp., Senior Notes | | | 5.875 | % | | | 10/25/24 | | | | 320,000 | | | | 340,808 | |
Navient Corp., Senior Notes | | | 5.000 | % | | | 3/15/27 | | | | 50,000 | | | | 50,938 | |
Total Consumer Finance | | | | | | | | | | | | | | | 1,643,672 | |
Diversified Financial Services — 2.5% | | | | | | | | | | | | | | | | |
Alliance Data Systems Corp., Senior Notes | | | 4.750 | % | | | 12/15/24 | | | | 520,000 | | | | 536,250 | (a) |
Allied Universal Holdco LLC/Allied Universal Finance Corp., Senior Notes | | | 6.000 | % | | | 6/1/29 | | | | 500,000 | | | | 507,685 | (a) |
Allied Universal Holdco LLC/Allied Universal Finance Corp., Senior Secured Notes | | | 6.625 | % | | | 7/15/26 | | | | 630,000 | | | | 669,000 | (a) |
See Notes to Financial Statements.
| | |
| Western Asset High Yield Fund 2021 Annual Report | | 19 |
Schedule of investments (cont’d)
May 31, 2021
Western Asset High Yield Fund
| | | | | | | | | | | | | | | | |
| Security | | Rate | | | Maturity
Date | | | Face
Amount | | | Value | |
Diversified Financial Services — continued | | | | | | | | | | | | | | | | |
Allied Universal Holdco LLC/Allied Universal Finance Corp./Atlas Luxco 4 Sarl, Senior Secured Notes | | | 4.625 | % | | | 6/1/28 | | | $ | 330,000 | | | $ | 328,499 | (a) |
Global Aircraft Leasing Co. Ltd., Senior Notes (6.500% Cash or 7.250% PIK) | | | 6.500 | % | | | 9/15/24 | | | | 2,480,509 | | | | 2,485,495 | (a)(c) |
LD Holdings Group LLC, Senior Notes | | | 6.500 | % | | | 11/1/25 | | | | 630,000 | | | | 652,560 | (a) |
LD Holdings Group LLC, Senior Notes | | | 6.125 | % | | | 4/1/28 | | | | 370,000 | | | | 365,886 | (a) |
Total Diversified Financial Services | | | | | | | | | | | | | | | 5,545,375 | |
Insurance — 0.3% | | | | | | | | | | | | | | | | |
Highlands Holdings Bond Issuer Ltd./ Highlands Holdings Bond Co-Issuer Inc., Senior Secured Notes (7.625% Cash or 8.375% PIK) | | | 7.625 | % | | | 10/15/25 | | | | 660,000 | | | | 704,580 | (a)(c) |
Mortgage Real Estate Investment Trusts (REITs) — 0.8% | | | | | | | | | | | | | |
Apollo Commercial Real Estate Finance Inc., Senior Notes | | | 5.375 | % | | | 10/15/23 | | | | 250,000 | | | | 252,344 | |
Burford Capital Global Finance LLC, Senior Notes | | | 6.250 | % | | | 4/15/28 | | | | 620,000 | | | | 648,786 | (a) |
Ladder Capital Finance Holdings LLLP/ Ladder Capital Finance Corp., Senior Notes | | | 4.250 | % | | | 2/1/27 | | | | 550,000 | | | | 539,498 | (a) |
Starwood Property Trust Inc., Senior Notes | | | 5.500 | % | | | 11/1/23 | | | | 330,000 | | | | 345,675 | (a) |
Total Mortgage Real Estate Investment Trusts (REITs) | | | | | | | | 1,786,303 | |
Thrifts & Mortgage Finance — 0.9% | | | | | | | | | | | | | | | | |
NMI Holdings Inc., Senior Secured Notes | | | 7.375 | % | | | 6/1/25 | | | | 760,000 | | | | 872,404 | (a) |
Quicken Loans Inc., Senior Notes | | | 5.250 | % | | | 1/15/28 | | | | 590,000 | | | | 617,662 | (a) |
Quicken Loans LLC/Quicken Loans Co-Issuer Inc., Senior Notes | | | 3.875 | % | | | 3/1/31 | | | | 520,000 | | | | 509,278 | (a) |
Total Thrifts & Mortgage Finance | | | | | | | | | | | | | | | 1,999,344 | |
Total Financials | | | | | | | | | | | | | | | 19,085,544 | |
| Health Care — 8.4% | | | | | | | | | | | | | | | | |
Health Care Providers & Services — 4.6% | | | | | | | | | | | | | | | | |
Akumin Inc., Senior Secured Notes | | | 7.000 | % | | | 11/1/25 | | | | 720,000 | | | | 746,050 | (a) |
Centene Corp., Senior Notes | | | 5.375 | % | | | 6/1/26 | | | | 450,000 | | | | 469,327 | (a) |
Centene Corp., Senior Notes | | | 5.375 | % | | | 8/15/26 | | | | 450,000 | | | | 471,388 | (a) |
Centene Corp., Senior Notes | | | 4.625 | % | | | 12/15/29 | | | | 260,000 | | | | 281,025 | |
CHS/Community Health Systems Inc., Secured Notes | | | 6.875 | % | | | 4/15/29 | | | | 1,150,000 | | | | 1,175,311 | (a) |
See Notes to Financial Statements.
| | |
20 | | Western Asset High Yield Fund 2021 Annual Report |
Western Asset High Yield Fund
| | | | | | | | | | | | | | | | |
| Security | | Rate | | | Maturity
Date | | | Face
Amount | | | Value | |
Health Care Providers & Services — continued | | | | | | | | | | | | | |
CHS/Community Health Systems Inc., Secured Notes | | | 6.125 | % | | | 4/1/30 | | | $ | 960,000 | | | $ | 957,269 | (a) |
Global Medical Response Inc., Senior Secured Notes | | | 6.500 | % | | | 10/1/25 | | | | 400,000 | | | | 411,512 | (a) |
HCA Inc., Senior Notes | | | 7.690 | % | | | 6/15/25 | | | | 700,000 | | | | 856,341 | |
HCA Inc., Senior Notes | | | 5.625 | % | | | 9/1/28 | | | | 300,000 | | | | 349,125 | |
HCA Inc., Senior Notes | | | 7.500 | % | | | 11/15/95 | | | | 220,000 | | | | 302,387 | |
Legacy LifePoint Health LLC, Senior Secured Notes | | | 4.375 | % | | | 2/15/27 | | | | 440,000 | | | | 438,933 | (a) |
MPH Acquisition Holdings LLC, Senior Notes | | | 5.750 | % | | | 11/1/28 | | | | 640,000 | | | | 637,744 | (a) |
Radiology Partners Inc., Senior Notes | | | 9.250 | % | | | 2/1/28 | | | | 520,000 | | | | 571,571 | (a) |
RegionalCare Hospital Partners Holdings Inc./LifePoint Health Inc., Senior Notes | | | 9.750 | % | | | 12/1/26 | | | | 330,000 | | | | 355,988 | (a) |
Surgery Center Holdings Inc., Senior Notes | | | 10.000 | % | | | 4/15/27 | | | | 90,000 | | | | 98,583 | (a) |
Tenet Healthcare Corp., Senior Secured | | | | | | | | | | | | | | | | |
Notes | | | 7.500 | % | | | 4/1/25 | | | | 560,000 | | | | 601,125 | (a) |
Tenet Healthcare Corp., Senior Secured Notes | | | 4.625 | % | | | 6/15/28 | | | | 900,000 | | | | 919,197 | (a) |
US Renal Care Inc., Senior Notes | | | 10.625 | % | | | 7/15/27 | | | | 580,000 | | | | 605,717 | (a) |
Total Health Care Providers & Services | | | | | | | | | | | | | | | 10,248,593 | |
Life Sciences Tools & Services — 0.3% | | | | | | | | | | | | | | | | |
Syneos Health Inc., Senior Notes | | | 3.625 | % | | | 1/15/29 | | | | 590,000 | | | | 576,852 | (a) |
Pharmaceuticals — 3.5% | | | | | | | | | | | | | | | | |
AdaptHealth LLC, Senior Notes | | | 4.625 | % | | | 8/1/29 | | | | 510,000 | | | | 501,075 | (a) |
Bausch Health Americas Inc., Senior Notes | | | 9.250 | % | | | 4/1/26 | | | | 1,190,000 | | | | 1,286,687 | (a) |
Bausch Health Americas Inc., Senior Notes | | | 8.500 | % | | | 1/31/27 | | | | 480,000 | | | | 514,800 | (a) |
Bausch Health Cos. Inc., Senior Notes | | | 5.000 | % | | | 2/15/29 | | | | 1,130,000 | | | | 1,038,323 | (a) |
Bausch Health Cos. Inc., Senior Notes | | | 6.250 | % | | | 2/15/29 | | | | 780,000 | | | | 763,425 | (a) |
Cheplapharm Arzneimittel GmbH, Senior Secured Notes | | | 5.500 | % | | | 1/15/28 | | | | 930,000 | | | | 957,082 | (a) |
Endo Dac/Endo Finance LLC/Endo Finco Inc., Secured Notes | | | 9.500 | % | | | 7/31/27 | | | | 310,000 | | | | 315,813 | (a) |
Endo Luxembourg Finance Co. I Sarl/Endo US Inc., Senior Secured Notes | | | 6.125 | % | | | 4/1/29 | | | | 600,000 | | | | 592,500 | (a) |
See Notes to Financial Statements.
| | |
| Western Asset High Yield Fund 2021 Annual Report | | 21 |
Schedule of investments (cont’d)
May 31, 2021
Western Asset High Yield Fund
| | | | | | | | | | | | | | | | | | | | |
| Security | | Rate | | | Maturity
Date | | | Face
Amount | | | | | | Value | |
Pharmaceuticals — continued | | | | | | | | | | | | | | | | | | | | |
Jazz Securities DAC, Senior Secured Notes | | | 4.375 | % | | | 1/15/29 | | | $ | 530,000 | | | $ | | | | | 545,762 | (a) |
Par Pharmaceutical Inc., Senior Secured Notes | | | 7.500 | % | | | 4/1/27 | | | | 600,000 | | | | | | | | 612,750 | (a) |
Teva Pharmaceutical Finance Netherlands III BV, Senior Notes | | | 2.800 | % | | | 7/21/23 | | | | 250,000 | | | | | | | | 247,969 | |
Teva Pharmaceutical Finance Netherlands III BV, Senior Notes | | | 7.125 | % | | | 1/31/25 | | | | 400,000 | | | | | | | | 437,428 | |
Total Pharmaceuticals | | | | | | | | | | | | | | | | | | | 7,813,614 | |
Total Health Care | | | | | | | | | | | | | | | | | | | 18,639,059 | |
| Industrials — 9.5% | | | | | | | | | | | | | | | | | | | | |
Aerospace & Defense — 1.1% | | | | | | | | | | | | | | | | | | | | |
Boeing Co., Senior Notes | | | 5.150 | % | | | 5/1/30 | | | | 360,000 | | | | | | | | 421,737 | |
TransDigm Inc., Senior Notes | | | 4.625 | % | | | 1/15/29 | | | | 1,470,000 | | | | | | | | 1,454,727 | (a) |
TransDigm Inc., Senior Secured Notes | | | 8.000 | % | | | 12/15/25 | | | | 240,000 | | | | | | | | 259,886 | (a) |
TransDigm Inc., Senior Secured Notes | | | 6.250 | % | | | 3/15/26 | | | | 320,000 | | | | | | | | 337,714 | (a) |
Total Aerospace & Defense | | | | | | | | | | | | | | | | | | | 2,474,064 | |
Air Freight & Logistics — 0.5% | | | | | | | | | | | | | | | | | | | | |
XPO CNW Inc., Senior Notes | | | 6.700 | % | | | 5/1/34 | | | | 630,000 | | | | | | | | 752,236 | |
XPO Logistics Inc., Senior Notes | | | 6.250 | % | | | 5/1/25 | | | | 330,000 | | | | | | | | 353,288 | (a) |
Total Air Freight & Logistics | | | | | | | | | | | | | | | | | | | 1,105,524 | |
Airlines — 2.5% | | | | | | | | | | | | | | | | | | | | |
American Airlines Inc./AAdvantage Loyalty IP Ltd., Senior Secured Notes | | | 5.500 | % | | | 4/20/26 | | | | 360,000 | | | | | | | | 379,361 | (a) |
American Airlines Inc./AAdvantage Loyalty IP Ltd., Senior Secured Notes | | | 5.750 | % | | | 4/20/29 | | | | 590,000 | | | | | | | | 633,663 | (a) |
Delta Air Lines Inc./SkyMiles IP Ltd., Senior Secured Notes | | | 4.750 | % | | | 10/20/28 | | | | 460,000 | | | | | | | | 502,491 | (a) |
Hawaiian Brand Intellectual Property Ltd./ HawaiianMiles Loyalty Ltd., Senior Secured Notes | | | 5.750 | % | | | 1/20/26 | | | | 960,000 | | | | | | | | 1,021,200 | (a) |
Mileage Plus Holdings LLC/Mileage Plus Intellectual Property Assets Ltd., Senior Secured Notes | | | 6.500 | % | | | 6/20/27 | | | | 545,000 | | | | | | | | 598,985 | (a) |
Spirit Loyalty Cayman Ltd./Spirit IP Cayman Ltd., Senior Secured Notes | | | 8.000 | % | | | 9/20/25 | | | | 612,000 | | | | | | | | 694,620 | (a) |
United Airlines Inc., Senior Secured Notes | | | 4.375 | % | | | 4/15/26 | | | | 620,000 | | | | | | | | 643,259 | (a) |
United Airlines Inc., Senior Secured Notes | | | 4.625 | % | | | 4/15/29 | | | | 260,000 | | | | | | | | 268,944 | (a) |
United Airlines Pass-Through Trust | | | 5.375 | % | | | 8/15/21 | | | | 20,127 | | | | | | | | 20,254 | |
See Notes to Financial Statements.
| | |
22 | | Western Asset High Yield Fund 2021 Annual Report |
Western Asset High Yield Fund
| | | | | | | | | | | | | | | | |
| Security | | Rate | | | Maturity
Date | | | Face
Amount | | | Value | |
Airlines — continued | | | | | | | | | | | | | | | | |
United Airlines Pass-Through Trust | | | 4.750 | % | | | 4/11/22 | | | $ | 433,188 | | | $ | 442,076 | |
United Airlines Pass-Through Trust | | | 4.875 | % | | | 1/15/26 | | | | 310,560 | | | | 331,181 | |
Total Airlines | | | | | | | | | | | | | | | 5,536,034 | |
Building Products — 0.4% | | | | | | | | | | | | | | | | |
Cornerstone Building Brands Inc., Senior Notes | | | 6.125 | % | | | 1/15/29 | | | | 450,000 | | | | 481,421 | (a) |
CP Atlas Buyer Inc., Senior Notes | | | 7.000 | % | | | 12/1/28 | | | | 380,000 | | | | 393,505 | (a) |
Total Building Products | | | | | | | | | | | | | | | 874,926 | |
Commercial Services & Supplies — 1.1% | | | | | | | | | | | | | | | | |
CoreCivic Inc., Senior Notes | | | 8.250 | % | | | 4/15/26 | | | | 660,000 | | | | 645,470 | |
GFL Environmental Inc., Senior Notes | | | 8.500 | % | | | 5/1/27 | | | | 482,000 | | | | 529,655 | (a) |
GFL Environmental Inc., Senior Secured Notes | | | 3.750 | % | | | 8/1/25 | | | | 450,000 | | | | 461,592 | (a) |
Legends Hospitality Holding Co. LLC/ | | | | | | | | | | | | | | | | |
Legends Hospitality Co-Issuer Inc., Senior Secured Notes | | | 5.000 | % | | | 2/1/26 | | | | 750,000 | | | | 777,188 | (a) |
Total Commercial Services & Supplies | | | | | | | | | | | | | | | 2,413,905 | |
Construction & Engineering — 0.6% | | | | | | | | | | | | | | | | |
Brundage-Bone Concrete Pumping Holdings Inc., Secured Notes | | | 6.000 | % | | | 2/1/26 | | | | 590,000 | | | | 611,408 | (a) |
Empire Communities Corp., Senior Notes | | | 7.000 | % | | | 12/15/25 | | | | 700,000 | | | | 741,573 | (a) |
Total Construction & Engineering | | | | | | | | | | | | | | | 1,352,981 | |
Containers & Packaging — 0.6% | | | | | | | | | | | | | | | | |
Ardagh Metal Packaging Finance USA LLC/Ardagh Metal Packaging Finance PLC, Senior Notes | | | 4.000 | % | | | 9/1/29 | | | | 780,000 | | | | 769,318 | (a) |
Ardagh Metal Packaging Finance USA LLC/Ardagh Metal Packaging Finance PLC, Senior Secured Notes | | | 3.250 | % | | | 9/1/28 | | | | 460,000 | | | | 460,037 | (a) |
Total Containers & Packaging | | | | | | | | | | | | | | | 1,229,355 | |
Electrical Equipment — 0.4% | | | | | | | | | | | | | | | | |
Sensata Technologies BV, Senior Notes | | | 4.000 | % | | | 4/15/29 | | | | 600,000 | | | | 601,830 | (a) |
Sensata Technologies Inc., Senior Notes | | | 4.375 | % | | | 2/15/30 | | | | 320,000 | | | | 330,960 | (a) |
Total Electrical Equipment | | | | | | | | | | | | | | | 932,790 | |
Machinery — 0.8% | | | | | | | | | | | | | | | | |
ATS Automation Tooling Systems Inc., Senior Notes | | | 4.125 | % | | | 12/15/28 | | | | 500,000 | | | | 503,490 | (a) |
See Notes to Financial Statements.
| | |
| Western Asset High Yield Fund 2021 Annual Report | | 23 |
Schedule of investments (cont’d)
May 31, 2021
Western Asset High Yield Fund
| | | | | | | | | | | | | | | | |
| Security | | Rate | | | Maturity
Date | | | Face
Amount | | | Value | |
Machinery — continued | | | | | | | | | | | | | | | | |
Titan International Inc., Senior Secured Notes | | | 7.000 | % | | | 4/30/28 | | | $ | 710,000 | | | $ | 740,850 | (a) |
Vertical US Newco Inc., Senior Secured Notes | | | 5.250 | % | | | 7/15/27 | | | | 600,000 | | | | 624,750 | (a) |
Total Machinery | | | | | | | | | | | | | | | 1,869,090 | |
Trading Companies & Distributors — 1.5% | | | | | | | | | | | | | | | | |
Alta Equipment Group Inc., Secured Notes | | | 5.625 | % | | | 4/15/26 | | | | 640,000 | | | | 658,406 | (a) |
BCPE Empire Holdings Inc., Senior Notes | | | 7.625 | % | | | 5/1/27 | | | | 340,000 | | | | 345,688 | (a) |
Foundation Building Materials Inc., Senior Notes | | | 6.000 | % | | | 3/1/29 | | | | 330,000 | | | | 323,954 | (a) |
H&E Equipment Services Inc., Senior Notes | | | 3.875 | % | | | 12/15/28 | | | | 800,000 | | | | 774,872 | (a) |
United Rentals North America Inc., Senior Notes | | | 4.875 | % | | | 1/15/28 | | | | 410,000 | | | | 433,596 | |
United Rentals North America Inc., Senior Notes | | | 5.250 | % | | | 1/15/30 | | | | 740,000 | | | | 809,331 | |
Total Trading Companies & Distributors | | | | | | | | | | | | | | | 3,345,847 | |
Total Industrials | | | | | | | | | | | | | | | 21,134,516 | |
| Information Technology — 3.8% | | | | | | | | | | | | | | | | |
Communications Equipment — 0.6% | | | | | | | | | | | | | | | | |
CommScope Inc., Senior Notes | | | 8.250 | % | | | 3/1/27 | | | | 1,060,000 | | | | 1,132,875 | (a) |
CommScope Technologies LLC, Senior Notes | | | 5.000 | % | | | 3/15/27 | | | | 209,000 | | | | 210,927 | (a) |
Total Communications Equipment | | | | | | | | | | | | | | | 1,343,802 | |
IT Services — 1.6% | | | | | | | | | | | | | | | | |
Acuris Finance Us Inc./Acuris Finance SARL, Senior Secured Notes | | | 5.000 | % | | | 5/1/28 | | | | 440,000 | | | | 440,550 | (a) |
CDW LLC/CDW Finance Corp., Senior Notes | | | 4.250 | % | | | 4/1/28 | | | | 362,000 | | | | 379,153 | |
Gartner Inc., Senior Notes | | | 3.750 | % | | | 10/1/30 | | | | 750,000 | | | | 754,286 | (a) |
Shift4 Payments LLC/Shift4 Payments Finance Sub Inc., Senior Notes | | | 4.625 | % | | | 11/1/26 | | | | 840,000 | | | | 880,664 | (a) |
Square Inc., Senior Notes | | | 3.500 | % | | | 6/1/31 | | | | 640,000 | | | | 640,762 | (a) |
Unisys Corp., Senior Secured Notes | | | 6.875 | % | | | 11/1/27 | | | | 480,000 | | | | 524,494 | (a) |
Total IT Services | | | | | | | | | | | | | | | 3,619,909 | |
Semiconductors & Semiconductor Equipment — 0.4% | | | | | | | | | | | | | |
Amkor Technology Inc., Senior Notes | | | 6.625 | % | | | 9/15/27 | | | | 500,000 | | | | 540,243 | (a) |
Entegris Inc., Senior Notes | | | 3.625 | % | | | 5/1/29 | | | | 230,000 | | | | 230,868 | (a) |
Total Semiconductors & Semiconductor Equipment | | | | | | | | | | | | 771,111 | |
See Notes to Financial Statements.
| | |
24 | | Western Asset High Yield Fund 2021 Annual Report |
Western Asset High Yield Fund
| | | | | | | | | | | | | | | | |
| Security | | Rate | | | Maturity
Date | | | Face
Amount | | | Value | |
Software — 1.0% | | | | | | | | | | | | | | | | |
ACI Worldwide Inc., Senior Notes | | | 5.750 | % | | | 8/15/26 | | | $ | 100,000 | | | $ | 105,262 | (a) |
Black Knight InfoServ LLC, Senior Notes | | | 3.625 | % | | | 9/1/28 | | | | 430,000 | | | | 423,589 | (a) |
Helios Software Holdings Inc./ION Corporate Solutions Finance Sarl, Senior Secured Notes | | | 4.625 | % | | | 5/1/28 | | | | 820,000 | | | | 800,402 | (a) |
Open Text Corp., Senior Notes | | | 3.875 | % | | | 2/15/28 | | | | 220,000 | | | | 220,216 | (a) |
Open Text Holdings Inc., Senior Notes | | | 4.125 | % | | | 2/15/30 | | | | 260,000 | | | | 261,620 | (a) |
ZoomInfo Technologies LLC/ZoomInfo | | | | | | | | | | | | | | | | |
Finance Corp., Senior Notes | | | 3.875 | % | | | 2/1/29 | | | | 390,000 | | | | 381,716 | (a) |
Total Software | | | | | | | | | | | | | | | 2,192,805 | |
Technology Hardware, Storage & Peripherals — 0.2% | | | | | | | | | | | | | |
NCR Corp., Senior Notes | | | 5.125 | % | | | 4/15/29 | | | | 440,000 | | | | 452,078 | (a) |
Total Information Technology | | | | | | | | | | | | | | | 8,379,705 | |
| Materials — 4.4% | | | | | | | | | | | | | | | | |
Chemicals — 0.5% | | | | | | | | | | | | | | | | |
Anagram International Inc./Anagram Holdings LLC, Secured Notes (5.000% Cash and 5.000% PIK or 10.000% Cash) | | | 10.000 | % | | | 8/15/26 | | | | 94,252 | | | | 95,194 | (a)(c) |
Kraton Polymers LLC/Kraton Polymers Capital Corp., Senior Notes | | | 4.250 | % | | | 12/15/25 | | | | 410,000 | | | | 416,265 | (a) |
Olin Corp., Senior Notes | | | 5.000 | % | | | 2/1/30 | | | | 520,000 | | | | 552,604 | |
Total Chemicals | | | | | | | | | | | | | | | 1,064,063 | |
Construction Materials — 0.9% | | | | | | | | | | | | | | | | |
SRM Escrow Issuer LLC, Senior Secured Notes | | | 6.000 | % | | | 11/1/28 | | | | 980,000 | | | | 1,022,517 | (a) |
Summit Materials LLC/Summit Materials Finance Corp., Senior Notes | | | 5.250 | % | | | 1/15/29 | | | | 990,000 | | | | 1,046,549 | (a) |
Total Construction Materials | | | | | | | | | | | | | | | 2,069,066 | |
Containers & Packaging — 1.0% | | | | | | | | | | | | | | | | |
ARD Finance SA, Senior Secured Notes (6.500% Cash or 7.250% PIK) | | | 6.500 | % | | | 6/30/27 | | | | 450,000 | | | | 470,273 | (a)(c) |
Ardagh Packaging Finance PLC/Ardagh | | | | | | | | | | | | | | | | |
Holdings USA Inc., Senior Notes | | | 5.250 | % | | | 8/15/27 | | | | 700,000 | | | | 707,000 | (a) |
Cascades Inc./Cascades USA Inc., Senior Notes | | | 5.375 | % | | | 1/15/28 | | | | 520,000 | | | | 540,150 | (a) |
Greif Inc., Senior Notes | | | 6.500 | % | | | 3/1/27 | | | | 590,000 | | | | 620,237 | (a) |
Total Containers & Packaging | | | | | | | | | | | | | | | 2,337,660 | |
Metals & Mining — 1.9% | | | | | | | | | | | | | | | | |
First Quantum Minerals Ltd., Senior Notes | | | 7.500 | % | | | 4/1/25 | | | | 370,000 | | | | 384,637 | (a) |
First Quantum Minerals Ltd., Senior Notes | | | 6.875 | % | | | 3/1/26 | | | | 740,000 | | | | 777,000 | (a) |
See Notes to Financial Statements.
| | |
| Western Asset High Yield Fund 2021 Annual Report | | 25 |
Schedule of investments (cont’d)
May 31, 2021
Western Asset High Yield Fund
| | | | | | | | | | | | | | | | |
| Security | | Rate | | | Maturity Date | | | Face Amount | | | Value | |
Metals & Mining — continued | | | | | | | | | | | | | | | | |
First Quantum Minerals Ltd., Senior Notes | | | 6.875 | % | | | 10/15/27 | | | $ | 830,000 | | | $ | 906,775 | (a) |
Freeport-McMoRan Inc., Senior Notes | | | 5.450 | % | | | 3/15/43 | | | | 1,300,000 | | | | 1,571,375 | |
Hudbay Minerals Inc., Senior Notes | | | 4.500 | % | | | 4/1/26 | | | | 230,000 | | | | 228,546 | (a) |
Hudbay Minerals Inc., Senior Notes | | | 6.125 | % | | | 4/1/29 | | | | 300,000 | | | | 314,624 | (a) |
Northwest Acquisitions ULC/Dominion Finco Inc., Secured Notes | | | 7.125 | % | | | 11/1/22 | | | | 1,150,000 | | | | 0 | *(a)(f)(g)(h)(i) |
Total Metals & Mining | | | | | | | | | | | | | | | 4,182,957 | |
Paper & Forest Products — 0.1% | | | | | | | | | | | | | | | | |
Mercer International Inc., Senior Notes | | | 5.125 | % | | | 2/1/29 | | | | 230,000 | | | | 237,218 | (a) |
Total Materials | | | | | | | | | | | | | | | 9,890,964 | |
| Real Estate — 4.4% | | | | | | | | | | | | | | | | |
Equity Real Estate Investment Trusts (REITs) — 2.7% | | | | | | | | | | | | | | | | |
CoreCivic Inc., Senior Notes | | | 4.625 | % | | | 5/1/23 | | | | 180,000 | | | | 178,658 | |
Diversified Healthcare Trust, Senior Notes | | | 9.750 | % | | | 6/15/25 | | | | 470,000 | | | | 523,387 | |
Diversified Healthcare Trust, Senior Notes | | | 4.750 | % | | | 2/15/28 | | | | 670,000 | | | | 647,521 | |
Diversified Healthcare Trust, Senior Notes | | | 4.375 | % | | | 3/1/31 | | | | 400,000 | | | | 376,844 | |
ESH Hospitality Inc., Senior Notes | | | 4.625 | % | | | 10/1/27 | | | | 330,000 | | | | 349,693 | (a) |
GEO Group Inc., Senior Notes | | | 5.875 | % | | | 10/15/24 | | | | 250,000 | | | | 182,774 | |
GEO Group Inc., Senior Notes | | | 6.000 | % | | | 4/15/26 | | | | 1,830,000 | | | | 1,102,575 | |
IIP Operating Partnership LP, Senior Notes | | | 5.500 | % | | | 5/25/26 | | | | 310,000 | | | | 320,683 | (a) |
MPT Operating Partnership LP/MPT Finance Corp., Senior Notes | | | 4.625 | % | | | 8/1/29 | | | | 600,000 | | | | 637,353 | |
Park Intermediate Holdings LLC/PK Domestic Property LLC/PK Finance Co-Issuer, Senior Secured Notes | | | 5.875 | % | | | 10/1/28 | | | | 410,000 | | | | 438,188 | (a) |
Service Properties Trust, Senior Notes | | | 5.500 | % | | | 12/15/27 | | | | 690,000 | | | | 711,199 | |
VICI Properties LP/VICI Note Co. Inc., Senior Notes | | | 4.125 | % | | | 8/15/30 | | | | 500,000 | | | | 508,325 | (a) |
Total Equity Real Estate Investment Trusts (REITs) | | | | | | | | | | | | | | | 5,977,200 | |
Real Estate Management & Development — 1.7% | | | | | | | | | | | | | | | | |
Five Point Operating Co. LP/Five Point Capital Corp., Senior Notes | | | 7.875 | % | | | 11/15/25 | | | | 820,000 | | | | 866,773 | (a) |
Forestar Group Inc., Senior Notes | | | 3.850 | % | | | 5/15/26 | | | | 590,000 | | | | 595,077 | (a) |
Forestar Group Inc., Senior Notes | | | 5.000 | % | | | 3/1/28 | | | | 540,000 | | | | 561,516 | (a) |
Kennedy-Wilson Inc., Senior Notes | | | 5.000 | % | | | 3/1/31 | | | | 670,000 | | | | 686,180 | |
See Notes to Financial Statements.
| | |
26 | | Western Asset High Yield Fund 2021 Annual Report |
Western Asset High Yield Fund
| | | | | | | | | | | | | | | | |
| Security | | Rate | | | Maturity Date | | | Face Amount | | | Value | |
Real Estate Management & Development — continued | | | | | | | | | | | | | |
Realogy Group LLC/Realogy Co-Issuer Corp., Secured Notes | | | 7.625 | % | | | 6/15/25 | | | $ | 510,000 | | | $ | 554,013 | (a) |
Realogy Group LLC/Realogy Co-Issuer Corp., Senior Notes | | | 5.750 | % | | | 1/15/29 | | | | 530,000 | | | | 554,436 | (a) |
Total Real Estate Management & Development | | | | | | | | | | | | 3,817,995 | |
Total Real Estate | | | | | | | | | | | | | | | 9,795,195 | |
| Utilities — 0.8% | | | | | | | | | | | | | | | | |
Electric Utilities — 0.5% | | | | | | | | | | | | | | | | |
Calpine Corp., Senior Notes | | | 5.000 | % | | | 2/1/31 | | | | 540,000 | | | | 524,448 | (a) |
Talen Energy Supply LLC, Senior Notes | | | 10.500 | % | | | 1/15/26 | | | | 330,000 | | | | 300,712 | (a) |
Talen Energy Supply LLC, Senior Secured Notes | | | 6.625 | % | | | 1/15/28 | | | | 330,000 | | | | 329,319 | (a) |
Total Electric Utilities | | | | | | | | | | | | 1,154,479 | |
Gas Utilities — 0.3% | | | | | | | | | | | | | | | | |
Suburban Propane Partners LP/Suburban Energy Finance Corp., Senior Notes | | | 5.000 | % | | | 6/1/31 | | | | 370,000 | | | | 374,333 | (a) |
Superior Plus LP/Superior General Partner Inc., Senior Notes | | | 4.500 | % | | | 3/15/29 | | | | 290,000 | | | | 295,343 | (a) |
Total Gas Utilities | | | | | | | | | | | | 669,676 | |
Total Utilities | | | | | | | | | | | | | | | 1,824,155 | |
Total Corporate Bonds & Notes (Cost — $167,475,751) | | | | | | | | | | | | 176,158,574 | |
| Senior Loans — 9.8% | | | | | | | | | | | | | | | | |
| Communication Services — 0.7% | | | | | | | | | | | | | | | | |
Entertainment — 0.3% | | | | | | | | | | | | | | | | |
Allen Media LLC, Initial Term Loan (3 mo. USD LIBOR + 5.500%) | | | 5.703 | % | | | 2/10/27 | | | | 614,520 | | | | 614,616 | (d)(j)(k) |
Media — 0.4% | | | | | | | | | | | | | | | | |
Applovin Corp., Initial Term Loan | | | — | | | | 8/15/25 | | | | 800,000 | | | | 800,071 | (l) |
Total Communication Services | | | | | | | | | | | | 1,414,687 | |
| Consumer Discretionary — 3.2% | | | | | | | | | | | | | | | | |
Auto Components — 0.6% | | | | | | | | | | | | | | | | |
Clarios Global LP, First Lien Amendment No. 1 Dollar Term Loan (1 mo. USD LIBOR + 3.250%) | | | 3.343 | % | | | 4/30/26 | | | | 553,908 | | | | 552,091 | (d)(j)(k) |
See Notes to Financial Statements.
| | |
| Western Asset High Yield Fund 2021 Annual Report | | 27 |
Schedule of investments (cont’d)
May 31, 2021
Western Asset High Yield Fund
| | | | | | | | | | | | | | | | |
| Security | | Rate | | | Maturity Date | | | Face Amount | | | Value | |
Auto Components — continued | | | | | | | | | | | | | |
First Brands Group LLC, First Lien 2021 Term Loan (the greater of 3 mo. USD LIBOR or 1.000% + 5.000%) | | | 6.000 | % | | | 3/30/27 | | | $ | 340,000 | | | $ | 345,100 | (d)(j)(k) |
Truck Hero Inc., Initial Term Loan (the greater of 1 mo. USD LIBOR or 0.750% + 3.750%) | | | 4.500 | % | | | 1/29/28 | | | | 370,000 | | | | 370,848 | (d)(j)(k) |
Total Auto Components | | | | | | | | | | | | 1,268,039 | |
Diversified Consumer Services — 0.3% | | | | | | | | | | | | | |
Adtalem Global Education Inc., First Lien Term Loan B | | | — | | | | 2/14/28 | | | | 790,000 | | | | 785,852 | (l) |
Hotels, Restaurants & Leisure — 0.2% | | | | | | | | | | | | | |
Equinox Holdings Inc., Term Loan B2 (the greater of 3 mo. USD LIBOR or 1.000% + 9.000%) | | | 10.000 | % | | | 3/8/24 | | | | 446,625 | | | | 451,091 | (d)(h)(j)(k) |
Specialty Retail — 2.1% | | | | | | | | | | | | | |
Gannett Holdings LLC, First Lien Term Loan (the greater of 3 mo. USD LIBOR or 0.750% + 7.000%) | | | 7.750 | % | | | 1/29/26 | | | | 659,818 | | | | 665,592 | (d)(h)(j)(k) |
Great Outdoors Group LLC, Term Loan B1 (the greater of 6 mo. LIBOR or 0.750% + 4.250%) | | | 5.000 | % | | | 3/6/28 | | | | 319,200 | | | | 322,073 | (d)(j)(k) |
Michaels Cos. Inc., Term Loan B (the greater of 3 mo. USD LIBOR or 0.750% + 4.250%) | | | 5.000 | % | | | 4/15/28 | | | | 560,000 | | | | 562,187 | (d)(j)(k) |
Petco Health and Wellness Co. Inc., First Lien Initial Term Loan (the greater of 3 mo. USD LIBOR or 0.750% + 3.250%) | | | 4.000 | % | | | 3/3/28 | | | | 1,260,000 | | | | 1,261,463 | (d)(j)(k) |
PetSmart LLC, Initial Term Loan (the greater of 3 mo. USD LIBOR or 0.750% + 3.500%) | | | 4.250 | % | | | 2/11/28 | | | | 560,000 | | | | 562,660 | (d)(j)(k) |
Rent-A-Center Inc., Initial Term Loan (the greater of 3 mo. USD LIBOR or 0.750% + 4.000%) | | | 4.750 | % | | | 2/17/28 | | | | 570,000 | | | | 574,631 | (d)(j)(k) |
Spencer Spirit IH LLC, Initial Term Loan (1 mo. USD LIBOR + 6.000%) | | | 6.091 | % | | | 6/19/26 | | | | 724,654 | | | | 724,201 | (d)(j)(k) |
Total Specialty Retail | | | | | | | | | | | | 4,672,807 | |
Total Consumer Discretionary | | | | | | | | | | | | | | | 7,177,789 | |
See Notes to Financial Statements.
| | |
28 | | Western Asset High Yield Fund 2021 Annual Report |
Western Asset High Yield Fund
| | | | | | | | | | | | | | | | |
| Security | | Rate | | | Maturity Date | | | Face Amount | | | Value | |
| Energy — 0.0%†† | | | | | | | | | | | | | | | | |
Oil, Gas & Consumable Fuels — 0.0%†† | | | | | | | | | | | | | | | | |
Permian Production Partners LLC, First Lien Initial Term Loan (the greater of 1 mo. USD LIBOR or 1.000% + 8.000% PIK) | | | 9.000 | % | | | 11/24/25 | | | $ | 94,284 | | | $ | 14,143 | (c)(d)(h)(j)(k) |
| Financials — 0.8% | | | | | | | | | | | | | | | | |
Diversified Financial Services — 0.5% | | | | | | | | | | | | | | | | |
Deerfield Dakota Holding LLC, 2021 Replacement Term Loan (the greater of 1 mo. USD LIBOR or 0.750% + 6.750%) | | | 7.500 | % | | | 4/14/28 | | | | 600,000 | | | | 616,500 | (d)(h)(j)(k) |
Jane Street Group LLC, Dollar Term Loan (1 mo. USD LIBOR + 2.750%) | | | 2.843 | % | | | 1/26/28 | | | | 393,020 | | | | 390,891 | (d)(j)(k) |
Total Diversified Financial Services | | | | | | | | | | | | | | | 1,007,391 | |
Insurance — 0.3% | | | | | | | | | | | | | | | | |
Acrisure LLC, 2020 Term Loan B (3 mo. USD LIBOR + 3.500%) | | | 3.703 | % | | | 2/15/27 | | | | 554,400 | | | | 550,588 | (d)(j)(k) |
AmeriLife Holdings LLC, First Lien Term Loan (1 mo. USD LIBOR + 4.000%) | | | 4.110 | % | | | 3/18/27 | | | | 168,750 | | | | 168,750 | (d)(h)(j)(k) |
Total Insurance | | | | | | | | | | | | | | | 719,338 | |
Total Financials | | | | | | | | | | | | | | | 1,726,729 | |
| Health Care — 2.0% | | | | | | | | | | | | | | | | |
Health Care Providers & Services — 1.5% | | | | | | | | | | | | | | | | |
Bioscrip Inc., First Lien Term Loan B (1 mo. USD LIBOR + 3.750%) | | | 3.843 | % | | | 8/6/26 | | | | 740,625 | | | | 742,476 | (d)(j)(k) |
EyeCare Partners LLC, First Lien Initial Term Loan (1 mo. USD LIBOR + 3.750%) | | | 3.843 | % | | | 2/18/27 | | | | 565,117 | | | | 560,565 | (d)(j)(k) |
EyeCare Partners LLC, Second Lien Initial | | | | | | | | | | | | | | | | |
Term Loan (1 mo. USD LIBOR + 8.250%) | | | 8.359 | % | | | 2/4/28 | | | | 410,000 | | | | 406,697 | (d)(j)(k) |
One Call Corp., First Lien Term Loan B (the greater of 3 mo. USD LIBOR or 0.750% + 5.500%) | | | 6.250 | % | | | 4/22/27 | | | | 780,000 | | | | 783,900 | (d)(j)(k) |
U.S. Renal Care Inc., First Lien Term Loan B (1 mo. USD LIBOR + 5.000%) | | | 5.125 | % | | | 6/26/26 | | | | 966,775 | | | | 963,029 | (d)(j)(k) |
Total Health Care Providers & Services | | | | | | | | | | | | | | | 3,456,667 | |
See Notes to Financial Statements.
| | |
| Western Asset High Yield Fund 2021 Annual Report | | 29 |
Schedule of investments (cont’d)
May 31, 2021
Western Asset High Yield Fund
| | | | | | | | | | | | | | | | |
| Security | | Rate | | | Maturity Date | | | Face Amount | | | Value | |
Pharmaceuticals — 0.5% | | | | | | | | | | | | | | | | |
Gainwell Acquisition Corp., Term Loan B (the greater of 3 mo. USD LIBOR or 0.750% + 4.000%) | | | 4.750 | % | | | 10/1/27 | | | $ | 800,000 | | | $ | 802,500 | (d)(j)(k) |
Jazz Financing Lux Sarl, Initial Dollar Term Loan (the greater of 1 mo. USD LIBOR or 0.500% + 3.500%) | | | 4.000 | % | | | 5/5/28 | | | | 220,000 | | | | 221,218 | (d)(j)(k) |
Total Pharmaceuticals | | | | | | | | | | | | | | | 1,023,718 | |
Total Health Care | | | | | | | | | | | | | | | 4,480,385 | |
| Industrials — 1.3% | | | | | | | | | | | | | | | | |
Airlines — 1.3% | | | | | | | | | | | | | | | | |
Delta Air Lines Inc., Initial Term Loan (the greater of 3 mo. USD LIBOR or 1.000% + 3.750%) | | | 4.750 | % | | | 10/20/27 | | | | 670,000 | | | | 703,268 | (d)(j)(k) |
JetBlue Airways Corp., Term Loan (the greater of 3 mo. USD LIBOR or 1.000% + 5.250%) | | | 6.250 | % | | | 6/17/24 | | | | 445,870 | | | | 456,676 | (d)(j)(k) |
Mileage Plus Holdings LLC, Initial Term Loan (the greater of 3 mo. USD LIBOR or 1.000% + 5.250%) | | | 6.250 | % | | | 6/21/27 | | | | 490,000 | | | | 523,626 | (d)(j)(k) |
United Airlines Inc., Term Loan B (the greater of 3 mo. USD LIBOR or 0.750% + 3.750%) | | | 4.500 | % | | | 4/21/28 | | | | 1,130,000 | | | | 1,141,089 | (d)(j)(k) |
Total Industrials | | | | | | | | | | | | | | | 2,824,659 | |
| Information Technology — 1.4% | | | | | | | | | | | | | | | | |
Communications Equipment — 0.3% | | | | | | | | | | | | | | | | |
Global Tel Link Corp., First Lien Term Loan (1 mo. USD LIBOR + 4.250%) | | | 4.343 | % | | | 11/29/25 | | | | 768,518 | | | | 707,516 | (d)(j)(k) |
IT Services — 0.6% | | | | | | | | | | | | | | | | |
Harland Clarke Holdings Corp., Initial Term Loan (the greater of 3 mo. USD LIBOR or 1.000% + 4.750%) | | | 5.750 | % | | | 11/3/23 | | | | 176,926 | | | | 158,460 | (d)(j)(k) |
Redstone Holdco 2 LP, First Lien Delayed Draw Term Loan (3 mo. USD LIBOR + 0.500%) | | | 0.500 | % | | | 4/27/28 | | | | 149,084 | | | | 148,152 | (d)(j)(k) |
Redstone Holdco 2 LP, First Lien Initial Term Loan (the greater of 3 mo. USD LIBOR or 0.750% + 4.750%) | | | 5.500 | % | | | 4/27/28 | | | | 380,916 | | | | 378,535 | (d)(j)(k) |
See Notes to Financial Statements.
| | |
30 | | Western Asset High Yield Fund 2021 Annual Report |
Western Asset High Yield Fund
| | | | | | | | | | | | | | | | |
| Security | | Rate | | | Maturity
Date | | | Face
Amount | | | Value | |
IT Services — continued | | | | | | | | | | | | | | | | |
Redstone Holdco 2 LP, Second Lien Initial Loan (the greater of 3 mo. USD LIBOR or 0.750% + 7.750%) | | | 8.500 | % | | | 4/16/29 | | | $ | 368,622 | | | $ | 363,093 | (d)(j)(k) |
RSA Security Inc., Second Lien Delayed Draw Term Loan | | | — | | | | 4/16/29 | | | | 211,378 | | | | 208,207 | (l) |
Total IT Services | | | | | | | | | | | | | | | 1,256,447 | |
Software — 0.5% | | | | | | | | | | | | | | | | |
DCert Buyer Inc., Second Lien Initial Loan (1 mo. USD LIBOR + 7.000%) | | | 7.093 | % | | | 2/16/29 | | | | 790,000 | | | | 798,888 | (d)(j)(k) |
Peraton Corp., First Lien Term Loan (the greater of 1 mo. USD LIBOR or 0.750% + 3.750%) | | | 4.500 | % | | | 2/1/28 | | | | 410,000 | | | | 411,501 | (d)(j)(k)(l) |
Total Software | | | | | | | | | | | | | | | 1,210,389 | |
Total Information Technology | | | | | | | | | | | | | | | 3,174,352 | |
| Materials — 0.2% | | | | | | | | | | | | | | | | |
Metals & Mining — 0.2% | | | | | | | | | | | | | | | | |
Arctic Canadian Diamond Co. Ltd., Second Lien Term Loan (3 mo. USD LIBOR + 5.000%) | | | 17.500 | % | | | 12/31/24 | | | | 468,945 | | | | 464,302 | (d)(g)(h)(j)(k) |
| Real Estate — 0.2% | | | | | | | | | | | | | | | | |
Equity Real Estate Investment Trusts (REITs) — 0.2% | | | | | | | | | | | | | | | | |
Corecivic Inc., Term Loan (the greater of 1 mo. USD LIBOR or 1.000% + 4.500%) | | | 5.500 | % | | | 12/18/24 | | | | 502,875 | | | | 490,303 | (d)(h)(j)(k) |
Total Senior Loans (Cost — $21,598,678) | | | | | | | | | | | | | | | 21,767,349 | |
| Asset-Backed Securities — 5.0% | | | | | | | | | | | | | | | | |
Ares XLII CLO Ltd., 2017-42A D (3 mo. USD LIBOR + 3.450%) | | | 3.634 | % | | | 1/22/28 | | | | 640,000 | | | | 642,784 | (a)(d) |
Battalion CLO XI Ltd., 2017-11A DR (3 mo. USD LIBOR + 3.650%) | | | 3.826 | % | | | 4/24/34 | | | | 250,000 | | | | 249,994 | (a)(d) |
Benefit Street Partners CLO XII Ltd., 2017-12A C (3 mo. USD LIBOR + 3.050%) | | | 3.234 | % | | | 10/15/30 | | | | 250,000 | | | | 243,332 | (a)(d)(m) |
BlueMountain CLO Ltd., 2012-2A ER2 (3 mo. USD LIBOR + 5.750%) | | | 5.905 | % | | | 11/20/28 | | | | 350,000 | | | | 346,500 | (a)(d) |
BlueMountain CLO Ltd., 2015-2A ER (3 mo. USD LIBOR + 5.200%) | | | 5.390 | % | | | 7/18/27 | | | | 250,000 | | | | 241,909 | (a)(d) |
BlueMountain CLO Ltd., 2016-2A DR (3 mo. USD LIBOR + 7.790%) | | | 7.945 | % | | | 8/20/32 | | | | 600,000 | | | | 599,971 | (a)(d) |
BlueMountain CLO XXXI Ltd., 2021-31A E (3 mo. USD LIBOR + 6.530%) | | | 6.661 | % | | | 4/19/34 | | | | 160,000 | | | | 160,000 | (a)(b)(d) |
See Notes to Financial Statements.
| | |
| Western Asset High Yield Fund 2021 Annual Report | | 31 |
Schedule of investments (cont’d)
May 31, 2021
Western Asset High Yield Fund
| | | | | | | | | | | | | | | | |
| Security | | Rate | | | Maturity
Date | | | Face
Amount | | | Value | |
| Asset-Backed Securities — continued | | | | | | | | | | | | | | | | |
Carlyle US CLO Ltd., 2017-2A C (3 mo. USD LIBOR + 3.700%) | | | 3.888 | % | | | 7/20/31 | | | $ | 250,000 | | | $ | 247,313 | (a)(d) |
Cathedral Lake VI Ltd., 2021-6A E (3 mo. USD LIBOR + 7.210%) | | | 7.329 | % | | | 4/25/34 | | | | 125,000 | | | | 121,875 | (a)(d) |
Catskill Park CLO Ltd., 2017-1A D (3 mo. USD LIBOR + 6.000%) | | | 6.188 | % | | | 4/20/29 | | | | 600,000 | | | | 600,000 | (a)(d) |
Cook Park CLO Ltd., 2018-1A E (3 mo. USD LIBOR + 5.400%) | | | 5.590 | % | | | 4/17/30 | | | | 500,000 | | | | 491,391 | (a)(d) |
Cumberland Park CLO Ltd., 2015-2A ER (3 mo. USD LIBOR + 5.650%) | | | 5.838 | % | | | 7/20/28 | | | | 750,000 | | | | 750,246 | (a)(d) |
Greenwood Park CLO Ltd., 2018-1A D (3 mo. USD LIBOR + 2.500%) | | | 2.684 | % | | | 4/15/31 | | | | 350,000 | | | | 345,791 | (a)(d) |
Greenwood Park CLO Ltd., 2018-1A E (3 mo. USD LIBOR + 4.950%) | | | 5.134 | % | | | 4/15/31 | | | | 250,000 | | | | 240,637 | (a)(d) |
Greywolf CLO IV Ltd., 2019-1RA CR (3 mo. USD LIBOR + 3.650%) | | | 3.840 | % | | | 4/17/34 | | | | 340,000 | | | | 339,992 | (a)(d) |
Grippen Park CLO Ltd., 2017-1A E (3 mo. USD LIBOR + 5.700%) | | | 5.888 | % | | | 1/20/30 | | | | 460,000 | | | | 456,550 | (a)(d) |
Halsey Point CLO I Ltd., 2019-1A E (3 mo. USD LIBOR + 7.700%) | | | 7.888 | % | | | 1/20/33 | | | | 350,000 | | | | 353,419 | (a)(d) |
LCM XXII Ltd., 22A DR (3 mo. USD LIBOR + 5.500%) | | | 5.688 | % | | | 10/20/28 | | | | 350,000 | | | | 338,141 | (a)(d) |
Marble Point CLO XIV Ltd., 2018-2A D (3 mo. USD LIBOR + 3.530%) | | | 3.718 | % | | | 1/20/32 | | | | 500,000 | | | | 489,928 | (a)(d) |
MKS CLO Ltd., 2017-2A D (3 mo. USD LIBOR + 2.650%) | | | 2.838 | % | | | 1/20/31 | | | | 250,000 | | | | 243,844 | (a)(d) |
Mountain View CLO IX Ltd., 2015-9A CR (3 mo. USD LIBOR + 3.120%) | | | 3.304 | % | | | 7/15/31 | | | | 250,000 | | | | 241,284 | (a)(d) |
Oaktree CLO Ltd., 2015-1A DR (3 mo. USD LIBOR + 5.200%) | | | 5.388 | % | | | 10/20/27 | | | | 250,000 | | | | 242,003 | (a)(d) |
Ocean Trails CLO V, 2014-5A DRR (3 mo. USD LIBOR + 3.450%) | | | 3.638 | % | | | 10/13/31 | | | | 300,000 | | | | 285,238 | (a)(d) |
OZLM XIX Ltd., 2017-19A C (3 mo. USD LIBOR + 3.100%) | | | 3.284 | % | | | 11/22/30 | | | | 800,000 | | | | 783,722 | (a)(d) |
Saranac CLO III Ltd., 2014-3A DR (3 mo. USD LIBOR + 3.250%) | | | 3.437 | % | | | 6/22/30 | | | | 590,000 | | | | 568,579 | (a)(d) |
Sculptor CLO XXVI Ltd., 26A E (3 mo. USD LIBOR + 7.250%) | | | 7.381 | % | | | 7/20/34 | | | | 310,000 | | | | 310,000 | (a)(b)(d) |
THL Credit Wind River CLO Ltd., 2017-3A ER (3 mo. USD LIBOR + 7.050%) | | | 7.181 | % | | | 4/15/35 | | | | 250,000 | | | | 250,153 | (a)(d) |
See Notes to Financial Statements.
| | |
32 | | Western Asset High Yield Fund 2021 Annual Report |
Western Asset High Yield Fund
| | | | | | | | | | | | | | | | |
| Security | | Rate | | | Maturity
Date | | | Face
Amount | | | Value | |
| Asset-Backed Securities — continued | | | | | | | | | | | | | | | | |
Venture XVII CLO Ltd., 2014-17A DRR (3 mo. USD LIBOR + 2.820%) | | | 3.004 | % | | | 4/15/27 | | | $ | 350,000 | | | $ | 336,988 | (a)(d) |
Venture XVII CLO Ltd., 2014-17A ERR (3 mo. USD LIBOR + 5.740%) | | | 5.924 | % | | | 4/15/27 | | | | 350,000 | | | | 313,754 | (a)(d) |
Zais CLO 16 Ltd., 2020-16A D1 (3 mo. USD LIBOR + 5.480%) | | | 5.668 | % | | | 10/20/31 | | | | 250,000 | | | | 251,787 | (a)(d) |
Total Asset-Backed Securities (Cost — $11,055,549) | | | | | | | | 11,087,125 | |
| Convertible Bonds & Notes — 1.7% | | | | | | | | | | | | | | | | |
| Communication Services — 0.4% | | | | | | | | | | | | | | | | |
Diversified Telecommunication Services — 0.1% | | | | | | | | | | | | | | | | |
Liberty Latin America Ltd., Senior Notes | | | 2.000 | % | | | 7/15/24 | | | | 160,000 | | | | 165,544 | |
Interactive Media & Services — 0.1% | | | | | | | | | | | | | | | | |
Twitter Inc., Senior Notes | | | 0.000 | % | | | 3/15/26 | | | | 190,000 | | | | 175,513 | (a) |
Media — 0.2% | | | | | | | | | | | | | | | | |
DISH Network Corp., Senior Notes | | | 2.375 | % | | | 3/15/24 | | | | 410,000 | | | | 398,212 | |
DISH Network Corp., Senior Notes | | | 3.375 | % | | | 8/15/26 | | | | 110,000 | | | | 113,795 | |
Total Media | | | | | | | | | | | | | | | 512,007 | |
Total Communication Services | | | | | | | | | | | | | | | 853,064 | |
| Consumer Discretionary — 0.2% | | | | | | | | | | | | | | | | |
Hotels, Restaurants & Leisure — 0.2% | | | | | | | | | | | | | | | | |
Airbnb Inc., Senior Notes | | | 0.000 | % | | | 3/15/26 | | | | 260,000 | | | | 242,970 | (a) |
DraftKings Inc., Senior Notes | | | 0.000 | % | | | 3/15/28 | | | | 200,000 | | | | 183,000 | (a) |
Total Consumer Discretionary | | | | | | | | | | | | | | | 425,970 | |
| Energy — 0.4% | | | | | | | | | | | | | | | | |
Oil, Gas & Consumable Fuels — 0.4% | | | | | | | | | | | | | | | | |
Cheniere Energy Inc., Senior Notes | | | 4.250 | % | | | 3/15/45 | | | | 1,200,000 | | | | 1,009,064 | |
| Financials — 0.4% | | | | | | | | | | | | | | | | |
Mortgage Real Estate Investment Trusts (REITs) — 0.4% | | | | | | | | | | | | | | | | |
Apollo Commercial Real Estate Finance Inc., Senior Notes | | | 4.750 | % | | | 8/23/22 | | | | 540,000 | | | | 551,502 | |
Blackstone Mortgage Trust Inc., Senior Notes | | | 4.375 | % | | | 5/5/22 | | | | 360,000 | | | | 369,468 | |
Total Financials | | | | | | | | | | | | | | | 920,970 | |
| Industrials — 0.0%†† | | | | | | | | | | | | | | | | |
Airlines — 0.0%†† | | | | | | | | | | | | | | | | |
Spirit Airlines Inc., Senior Notes | | | 1.000 | % | | | 5/15/26 | | | | 90,000 | | | | 92,367 | |
See Notes to Financial Statements.
| | |
| Western Asset High Yield Fund 2021 Annual Report | | 33 |
Schedule of investments (cont’d)
May 31, 2021
Western Asset High Yield Fund
| | | | | | | | | | | | | | | | |
| Security | | Rate | | | Maturity
Date | | | Face
Amount | | | Value | |
| Information Technology — 0.2% | | | | | | | | | | | | | | | | |
Semiconductors & Semiconductor Equipment — 0.1% | | | | | | | | | | | | | | | | |
Enphase Energy Inc., Senior Notes | | | 0.000 | % | | | 3/1/26 | | | $ | 290,000 | | | $ | 265,640 | (a) |
Enphase Energy Inc., Senior Notes | | | 0.000 | % | | | 3/1/28 | | | | 80,000 | | | | 69,682 | (a) |
Total Semiconductors & Semiconductor Equipment | | | | | | | | | | | | | | | 335,322 | |
Software — 0.1% | | | | | | | | | | | | | | | | |
Dropbox Inc., Senior Notes | | | 0.000 | % | | | 3/1/26 | | | | 140,000 | | | | 143,220 | (a) |
Total Information Technology | | | | | | | | | | | | | | | 478,542 | |
| Real Estate — 0.1% | | | | | | | | | | | | | | | | |
Real Estate Management & Development — 0.1% | | | | | | | | | | | | | | | | |
Realogy Group LLC/Realogy Co-Issuer Corp., Senior Notes | | | 0.250 | % | | | 6/15/26 | | | | 150,000 | | | | 153,075 | (a)(b) |
Total Convertible Bonds & Notes (Cost — $3,813,831) | | | | | | | | 3,933,052 | |
| | | | |
| | | | | | | | | Shares/Units | | | | |
| Common Stocks — 1.0% | | | | | | | | | | | | | | | | |
| Consumer Discretionary — 0.1% | | | | | | | | | | | | | | | | |
Specialty Retail — 0.1% | | | | | | | | | | | | | | | | |
Party City Holdco Inc. | | | | | | | | | | | 17,275 | | | | 159,453 | * |
| Energy — 0.8% | | | | | | | | | | | | | | | | |
Energy Equipment & Services — 0.0%†† | | | | | | | | | | | | | | | | |
Hercules Offshore Inc. (Escrow) | | | | | | | | | | | 54,577 | | | | 33,013 | *(g)(h) |
KCAD Holdings I Ltd. | | | | | | | | | | | 424,046,710 | | | | 0 | *(g)(h)(i) |
Total Energy Equipment & Services | | | | | | | | | | | | | | | 33,013 | |
Oil, Gas & Consumable Fuels — 0.8% | | | | | | | | | | | | | | | | |
Berry Corp. | | | | | | | | | | | 88,678 | | | | 563,992 | |
Oasis Petroleum Inc. | | | | | | | | | | | 8,586 | | | | 760,806 | |
Permian Production Partners LLC | | | | | | | | | | | 21,667 | | | | 1,083 | *(h) |
Southwestern Energy Co. | | | | | | | | | | | 71,704 | | | | 370,710 | * |
Total Oil, Gas & Consumable Fuels | | | | | | | | | | | | | | | 1,696,591 | |
Total Energy | | | | | | | | | | | | | | | 1,729,604 | |
| Financials — 0.1% | | | | | | | | | | | | | | | | |
Capital Markets — 0.1% | | | | | | | | | | | | | | | | |
EG Acquisition Corp. | | | | | | | | | | | 27,500 | | | | 273,900 | * |
| Materials — 0.0%†† | | | | | | | | | | | | | | | | |
Metals & Mining — 0.0%†† | | | | | | | | | | | | | | | | |
Arctic Canadian Diamond Holding LLC | | | | | | | | | | | 541 | | | | 0 | *(g)(h)(i) |
Total Common Stocks (Cost — $11,102,429) | | | | | | | | 2,162,957 | |
See Notes to Financial Statements.
| | |
34 | | Western Asset High Yield Fund 2021 Annual Report |
Western Asset High Yield Fund
| | | | | | | | | | | | | | | | |
| Security | | | | | | | | Shares | | | Value | |
| Investments in Underlying Funds — 0.9% | | | | | | | | | | | | | | | | |
SPDR Bloomberg Barclays Short Term High Yield Bond ETF
(Cost — $2,099,405) | | | | | | | | | | | 77,000 | | | $ | 2,109,800 | |
| | | | |
| | | Rate | | | | | | | | | | |
| Convertible Preferred Stocks — 0.5% | | | | | | | | | | | | | | | | |
| Energy — 0.5% | | | | | | | | | | | | | | | | |
Oil, Gas & Consumable Fuels — 0.5% | | | | | | | | | | | | | | | | |
MPLX LP | | | 8.462 | % | | | | | | | 17,875 | | | | 594,344 | (g)(h) |
Targa Resources Corp. | | | 9.500 | % | | | | | | | 450 | | | | 479,423 | |
Total Convertible Preferred Stocks (Cost — $1,053,438) | | | | | | | | 1,073,767 | |
| | | | |
| | | | | | Maturity
Date | | | Face
Amount | | | | |
| Sovereign Bonds — 0.4% | | | | | | | | | | | | | | | | |
Argentina — 0.4% | | | | | | | | | | | | | | | | |
Argentine Republic Government International Bond, Senior Notes | | | 1.000 | % | | | 7/9/29 | | | $ | 47,191 | | | | 18,403 | |
Argentine Republic Government International Bond, Senior Notes, Step bond (0.125% to 7/9/21 then 0.500%) | | | 0.125 | % | | | 7/9/30 | | | | 586,653 | | | | 217,525 | |
Argentine Republic Government International Bond, Senior Notes, Step bond (0.125% to 7/9/21 then 1.125%) | | | 0.125 | % | | | 7/9/35 | | | | 363,946 | | | | 120,834 | |
Provincia de Buenos Aires, Senior Notes | | | 9.950 | % | | | 6/9/21 | | | | 450,000 | | | | 200,254 | *(f)(n) |
Provincia de Buenos Aires, Senior Notes | | | 7.875 | % | | | 6/15/27 | | | | 680,000 | | | | 288,252 | *(f)(n) |
Total Sovereign Bonds (Cost — $1,555,550) | | | | | | | | 845,268 | |
| | | | |
| | | | | | | | | Shares | | | | |
| Preferred Stocks — 0.2% | | | | | | | | | | | | | | | | |
| Financials — 0.2% | | | | | | | | | | | | | | | | |
Capital Markets — 0.2% | | | | | | | | | | | | | | | | |
B Riley Financial Inc. | | | 6.000 | % | | | | | | | 14,400 | | | | 374,544 | |
B Riley Financial Inc. | | | 6.875 | % | | | | | | | 4,325 | | | | 111,628 | |
Total Preferred Stocks (Cost — $468,125) | | | | | | | | 486,172 | |
Total Investments before Short-Term Investments (Cost — $220,222,756) | | | | | | | | 219,624,064 | |
See Notes to Financial Statements.
| | |
| Western Asset High Yield Fund 2021 Annual Report | | 35 |
Schedule of investments (cont’d)
May 31, 2021
Western Asset High Yield Fund
| | | | | | | | | | | | | | | | |
| Security | | Rate | | | | | | Shares | | | Value | |
| Short-Term Investments — 1.9% | | | | | | | | | | | | | | | | |
Western Asset Premier Institutional Government Reserves, Premium Shares (Cost — $4,297,370) | | | 0.010 | % | | | | | | | 4,297,370 | | | $ | 4,297,370 | (m) |
Total Investments — 100.6% (Cost — $224,520,126) | | | | | | | | | | | | | | | 223,921,434 | |
Liabilities in Excess of Other Assets — (0.6)% | | | | | | | | | | | | | | | (1,439,713 | ) |
Total Net Assets — 100.0% | | | | | | | | | | | | | | $ | 222,481,721 | |
| †† | Represents less than 0.1%. |
| * | Non-income producing security. |
| (a) | Security is exempt from registration under Rule 144A of the Securities Act of 1933. This security may be resold in transactions that are exempt from registration, normally to qualified institutional buyers. This security has been deemed liquid pursuant to guidelines approved by the Board of Directors. |
| (b) | Securities traded on a when-issued or delayed delivery basis. |
| (c) | Payment-in-kind security for which the issuer has the option at each interest payment date of making interest payments in cash or additional securities. |
| (d) | Variable rate security. Interest rate disclosed is as of the most recent information available. Certain variable rate securities are not based on a published reference rate and spread but are determined by the issuer or agent and are based on current market conditions. These securities do not indicate a reference rate and spread in their description above. |
| (e) | Security has no maturity date. The date shown represents the next call date. |
| (f) | The coupon payment on this security is currently in default as of May 31, 2021. |
| (g) | Security is valued in good faith in accordance with procedures approved by the Board of Directors (Note 1). |
| (h) | Security is valued using significant unobservable inputs (Note 1). |
| (i) | Value is less than $1. |
| (j) | Interest rates disclosed represent the effective rates on senior loans. Ranges in interest rates are attributable to multiple contracts under the same loan. |
| (k) | Senior loans may be considered restricted in that the Fund ordinarily is contractually obligated to receive approval from the agent bank and/or borrower prior to the disposition of a senior loan. |
| (l) | All or a portion of this loan is unfunded as of May 31, 2021. The interest rate for fully unfunded term loans is to be determined. |
| (m) | In this instance, as defined in the Investment Company Act of 1940, an “Affiliated Company” represents Fund ownership of at least 5% of the outstanding voting securities of an issuer, or a company which is under common ownership or control with the Fund. At May 31, 2021, the total market value of investments in Affiliated Companies was $4,540,702 and the cost was $4,501,997 (Note 8). |
| (n) | Security is exempt from registration under Regulation S of the Securities Act of 1933. Regulation S applies to securities offerings that are made outside of the United States and do not involve direct selling efforts in the United States. This security has been deemed liquid pursuant to guidelines approved by the Board of Directors. |
See Notes to Financial Statements.
| | |
36 | | Western Asset High Yield Fund 2021 Annual Report |
Western Asset High Yield Fund
| | |
Abbreviation(s) used in this schedule: |
| |
| CLO | | —Collateralized Loan Obligation |
| |
| ETF | | —Exchange-Traded Fund |
| |
| ICE | | —Intercontinental Exchange |
| |
| LIBOR | | —London Interbank Offered Rate |
| |
| PIK | | —Payment-In-Kind |
| |
| SPDR | | —Standard & Poor’s Depositary Receipts |
| |
| USD | | —United States Dollar |
At May 31, 2021, the Fund had the following open futures contracts:
| | | | | | | | | | | | | | | | | | | | |
| | | Number of
Contracts | | | Expiration
Date | | | Notional
Amount | | | Market
Value | | | Unrealized
Appreciation | |
| Contracts to Buy: | | | | | | | | | | | | | | | | | | | | |
| U.S. Treasury 5-Year Notes | | | 128 | | | | 9/21 | | | $ | 15,820,085 | | | $ | 15,853,000 | | | $ | 32,915 | |
At May 31, 2021, the Fund had the following open forward foreign currency contracts:
| | | | | | | | | | | | | | | | | | | | |
Currency Purchased | | | Currency Sold | | | Counterparty | | Settlement
Date | | | Unrealized
Depreciation | |
| USD | | | 59,718 | | | EUR | | | 50,000 | | | BNP Paribas SA | | | 7/19/21 | | | $ | (1,316) | |
| USD | | | 7,313 | | | CAD | | | 9,153 | | | Citibank N.A. | | | 7/19/21 | | | | (264) | |
| Total | | | | | | | | | | | | | | | $ | (1,580) | |
| | |
Abbreviation(s) used in this table: |
| |
| CAD | | —Canadian Dollar |
| |
| EUR | | —Euro |
| |
| USD | | —United States Dollar |
At May 31, 2021, the Fund had the following open swap contracts:
| | | | | | | | | | | | | | | | | | | | | | | | |
| OTC CREDIT DEFAULT SWAPS ON CORPORATE ISSUES — SELL PROTECTION1 | |
Swap Counterparty
(Reference Entity) | | Notional
Amount2 | | | Termination
Date | | | Implied
Credit
Spread at
May 31,
20213 | | Periodic
Payments
Received by
the Fund† | | Market
Value | | | Upfront
Premiums
Paid
(Received) | | | Unrealized
Appreciation | |
| JPMorgan Chase & Co. (Occidental Petroleum Corp., 5.550%, due 3/15/26) | | $ | 800,000 | | | | 12/20/23 | | | 1.919% | | 1.000% quarterly | | $ | (18,185) | | | $ | (74,379) | | | $ | 56,194 | |
See Notes to Financial Statements.
| | |
| Western Asset High Yield Fund 2021 Annual Report | | 37 |
Schedule of investments (cont’d)
May 31, 2021
Western Asset High Yield Fund
| | | | | | | | | | | | | | | | | | | | | | | | |
| CENTRALLY CLEARED CREDIT DEFAULT SWAPS ON CORPORATE ISSUES — SELL PROTECTION1 | |
| Reference Entity | | Notional
Amount2
| | | Termination
Date | | | Implied
Credit
Spread at
May 31,
20213 | | Periodic
Payments
Received by
the Fund† | | Market
Value | | | Upfront
Premiums
Paid
(Received) | | | Unrealized Appreciation | |
| Ford Motor Credit Co. LLC, 3.810%, due 1/9/24 | | $ | 400,000 | | | | 6/20/23 | | | 1.195% | | 5.000% quarterly | | $ | 31,100 | | | $ | (17,879) | | | $ | 48,979 | |
| 1 | If the Fund is a seller of protection and a credit event occurs, as defined under the terms of that particular swap agreement, the Fund will either (i) pay to the buyer of protection an amount equal to the notional amount of the swap and take delivery of the referenced obligation or underlying securities comprising the referenced index or (ii) pay a net settlement amount in the form of cash or securities equal to the notional amount of the swap less the recovery value of the referenced obligation or underlying securities comprising the referenced index. |
| 2 | The maximum potential amount the Fund could be required to pay as a seller of credit protection or receive as a buyer of credit protection if a credit event occurs as defined under the terms of that particular swap agreement. |
| 3 | Implied credit spreads, utilized in determining the market value of credit default swap agreements on corporate or sovereign issues as of period end, serve as an indicator of the current status of the payment/performance risk and represent the likelihood or risk of default for the credit derivative. The implied credit spread of a particular referenced entity reflects the cost of buying/selling protection and may include upfront payments required to be made to enter into the agreement. Wider credit spreads represent a deterioration of the referenced entity’s credit soundness and a greater likelihood or risk of default or other credit event occurring as defined under the terms of the agreement. A credit spread identified as “Defaulted” indicates a credit event has occurred for the referenced entity or obligation. |
| † | Percentage shown is an annual percentage rate. |
See Notes to Financial Statements.
| | |
38 | | Western Asset High Yield Fund 2021 Annual Report |
Statement of assets and liabilities
May 31, 2021
| | | | |
| Assets: | | | | |
Investments in unaffiliated securities, at value (Cost — $220,018,129) | | $ | 219,380,732 | |
Investments in affiliated securities, at value (Cost — $4,501,997) | | | 4,540,702 | |
Foreign currency, at value (Cost — $37,410) | | | 38,081 | |
Cash | | | 1,032,634 | |
Interest and dividends receivable | | | 2,676,724 | |
Receivable for securities sold | | | 925,974 | |
Deposits with brokers for centrally cleared swap contracts | | | 341,000 | |
Deposits with brokers for open futures contracts | | | 113,321 | |
Receivable for Fund shares sold | | | 81,717 | |
Foreign currency collateral for centrally cleared swap contracts, at value (Cost — $50,873) | | | 56,220 | |
Deposits with brokers for OTC derivatives | | | 50,000 | |
Receivable from broker — net variation margin on open futures contracts | | | 8,000 | |
Receivable for open OTC swap contracts | | | 1,578 | |
Receivable from broker — net variation margin on centrally cleared swap contracts | | | 235 | |
Prepaid expenses | | | 69,643 | |
Total Assets | | | 229,316,561 | |
| |
| Liabilities: | | | | |
Payable for securities purchased | | | 6,345,351 | |
Payable for Fund shares repurchased | | | 299,204 | |
Investment management fee payable | | | 92,868 | |
Distributions payable | | | 27,984 | |
OTC swaps, at value (premiums received — $74,379) | | | 18,185 | |
Service and/or distribution fees payable | | | 15,206 | |
Unrealized depreciation on forward foreign currency contracts | | | 1,580 | |
Directors’ fees payable | | | 859 | |
Accrued expenses | | | 33,603 | |
Total Liabilities | | | 6,834,840 | |
| Total Net Assets | | $ | 222,481,721 | |
| |
| Net Assets: | | | | |
Par value (Note 7) | | $ | 27,147 | |
Paid-in capital in excess of par value | | | 264,361,349 | |
Total distributable earnings (loss) | | | (41,906,775) | |
| Total Net Assets | | $ | 222,481,721 | |
See Notes to Financial Statements.
| | |
| Western Asset High Yield Fund 2021 Annual Report | | 39 |
Statement of assets and liabilities (cont’d)
May 31, 2021
| | | | |
| |
| Net Assets: | | | | |
Class A | | | $3,952,751 | |
Class A2 | | | $61,154,746 | |
Class C | | | $1,960,321 | |
Class R | | | $128,548 | |
Class I | | | $97,099,278 | |
Class IS | | | $58,186,077 | |
| |
| Shares Outstanding: | | | | |
Class A | | | 481,635 | |
Class A2 | | | 7,445,682 | |
Class C | | | 241,126 | |
Class R | | | 15,771 | |
Class I | | | 11,925,979 | |
Class IS | | | 7,036,623 | |
| |
| Net Asset Value: | | | | |
Class A (and redemption price) | | | $8.21 | |
Class A2 (and redemption price) | | | $8.21 | |
Class C* | | | $8.13 | |
Class R (and redemption price) | | | $8.15 | |
Class I (and redemption price) | | | $8.14 | |
Class IS (and redemption price) | | | $8.27 | |
| Maximum Public Offering Price Per Share: | | | | |
Class A (based on maximum initial sales charge of 4.25%) | | | $8.57 | |
Class A2 (based on maximum initial sales charge of 4.25%) | | | $8.57 | |
| * | Redemption price per share is NAV of Class C shares reduced by a 1.00% CDSC if shares are redeemed within one year from purchase payment (Note 2). |
See Notes to Financial Statements.
| | |
40 | | Western Asset High Yield Fund 2021 Annual Report |
Statement of operations
For the Year Ended May 31, 2021
| | | | |
| |
| Investment Income: | | | | |
Interest from unaffiliated investments | | $ | 11,825,264 | |
Interest from affiliated investments | | | 17,423 | |
Dividends | | | 59,348 | |
Less: Foreign taxes withheld | | | (14,054) | |
Total Investment Income | | | 11,887,981 | |
| |
| Expenses: | | | | |
Investment management fee (Note 2) | | | 1,122,025 | |
Service and/or distribution fees (Notes 2 and 5) | | | 152,858 | |
Registration fees | | | 135,736 | |
Transfer agent fees (Note 5) | | | 100,897 | |
Fund accounting fees | | | 72,233 | |
Audit and tax fees | | | 64,091 | |
Shareholder reports | | | 15,132 | |
Legal fees | | | 13,144 | |
Custody fees | | | 10,130 | |
Insurance | | | 3,407 | |
Directors’ fees | | | 2,821 | |
Commitment fees (Note 9) | | | 1,258 | |
Interest expense | | | 221 | |
Miscellaneous expenses | | | 8,632 | |
Total Expenses | | | 1,702,585 | |
Less: Fee waivers and/or expense reimbursements (Notes 2 and 5) | | | (124,558) | |
Net Expenses | | | 1,578,027 | |
| Net Investment Income | | | 10,309,954 | |
| |
| Realized and Unrealized Gain (Loss) on Investments, Futures Contracts, Swap Contracts, Forward Foreign Currency Contracts and Foreign Currency Transactions (Notes 1, 3 and 4): | | | | |
Net Realized Gain (Loss) From: | | | | |
Investment transactions in unaffiliated securities | | | 5,382,587 | |
Futures contracts | | | (109,996) | |
Swap contracts | | | 138,857 | |
Forward foreign currency contracts | | | (203,854) | |
Foreign currency transactions | | | 3,071 | |
Net Realized Gain | | | 5,210,665 | |
Change in Net Unrealized Appreciation (Depreciation) From: | | | | |
Investments in unaffiliated securities | | | 16,113,177 | |
Investments in affiliated securities | | | 22,765 | |
Futures contracts | | | 44,501 | |
Swap contracts | | | 49,826 | |
Forward foreign currency contracts | | | 59,526 | |
Foreign currencies | | | 5,272 | |
Change in Net Unrealized Appreciation (Depreciation) | | | 16,295,067 | |
| Net Gain on Investments, Futures Contracts, Swap Contracts, Forward Foreign Currency Contracts and Foreign Currency Transactions | | | 21,505,732 | |
| Increase in Net Assets From Operations | | $ | 31,815,686 | |
See Notes to Financial Statements.
| | |
| Western Asset High Yield Fund 2021 Annual Report | | 41 |
Statements of changes in net assets
| | | | | | | | |
| For the Years Ended May 31, | | 2021 | | | 2020 | |
| | |
| Operations: | | | | | | | | |
Net investment income | | $ | 10,309,954 | | | $ | 13,022,003 | |
Net realized gain (loss) | | | 5,210,665 | | | | (6,554,852) | |
Change in net unrealized appreciation (depreciation) | | | 16,295,067 | | | | (5,609,358) | |
Increase in Net Assets From Operations | | | 31,815,686 | | | | 857,793 | |
| | |
| Distributions to Shareholders From (Notes 1 and 6): | | | | | | | | |
Total distributable earnings | | | (10,236,114) | | | | (12,246,394) | |
Return of capital | | | (49,996) | | | | (690,785) | |
Decrease in Net Assets From Distributions to Shareholders | | | (10,286,110) | | | | (12,937,179) | |
| | |
| Fund Share Transactions (Note 7): | | | | | | | | |
Net proceeds from sale of shares | | | 66,641,027 | | | | 58,132,846 | |
Reinvestment of distributions | | | 9,927,780 | | | | 12,459,138 | |
Cost of shares repurchased | | | (87,651,429) | | | | (88,416,239) | |
Decrease in Net Assets From Fund Share Transactions | | | (11,082,622) | | | | (17,824,255) | |
Increase (Decrease) in Net Assets | | | 10,446,954 | | | | (29,903,641) | |
| | |
| Net Assets: | | | | | | | | |
Beginning of year | | | 212,034,767 | | | | 241,938,408 | |
End of year | | $ | 222,481,721 | | | $ | 212,034,767 | |
See Notes to Financial Statements.
| | |
42 | | Western Asset High Yield Fund 2021 Annual Report |
Financial highlights
| | | | | | | | | | | | | | | | | | | | |
| For a share of each class of capital stock outstanding throughout each year ended May 31: | | | | |
| Class A Shares1 | | 2021 | | | 2020 | | | 2019 | | | 2018 | | | 2017 | |
| | | | | |
| Net asset value, beginning of year | | | $7.40 | | | | $7.85 | | | | $7.96 | | | | $8.13 | | | | $7.60 | |
| | | | | |
| Income (loss) from operations: | | | | | | | | | | | | | | | | | | | | |
Net investment income | | | 0.38 | | | | 0.41 | | | | 0.43 | | | | 0.44 | | | | 0.47 | |
Net realized and unrealized gain (loss) | | | 0.81 | | | | (0.44) | | | | (0.10) | | | | (0.18) | | | | 0.50 | |
Total income (loss) from operations | | | 1.19 | | | | (0.03) | | | | 0.33 | | | | 0.26 | | | | 0.97 | |
| | | | | |
| Less distributions from: | | | | | | | | | | | | | | | | | | | | |
Net investment income | | | (0.38) | | | | (0.40) | | | | (0.44) | | | | (0.43) | | | | (0.42) | |
Return of capital | | | (0.00) | 2 | | | (0.02) | | | | (0.00) | 2 | | | — | | | | (0.02) | |
Total distributions | | | (0.38) | | | | (0.42) | | | | (0.44) | | | | (0.43) | | | | (0.44) | |
| | | | | |
| Net asset value, end of year | | | $8.21 | | | | $7.40 | | | | $7.85 | | | | $7.96 | | | | $8.13 | |
Total return3 | | | 16.41 | % | | | (0.52) | %4 | | | 4.25 | % | | | 3.27 | % | | | 13.07 | % |
| | | | | |
| Net assets, end of year (000s) | | | $3,953 | | | | $2,677 | | | | $2,386 | | | | $4,728 | | | | $6,137 | |
| | | | | |
| Ratios to average net assets: | | | | | | | | | | | | | | | | | | | | |
Gross expenses | | | 1.06 | % | | | 1.05 | %5 | | | 1.06 | %5 | | | 1.00 | % | | | 0.99 | % |
Net expenses6,7 | | | 1.00 | | | | 1.02 | 5 | | | 0.99 | 5 | | | 0.99 | | | | 0.99 | |
Net investment income | | | 4.80 | | | | 5.30 | | | | 5.43 | | | | 5.43 | | | | 5.96 | |
| | | | | |
| Portfolio turnover rate | | | 101 | % | | | 83 | % | | | 71 | % | | | 68 | % | | | 74 | % |
| 1 | Per share amounts have been calculated using the average shares method. |
| 2 | Amount represents less than $0.005 per share. |
| 3 | Performance figures, exclusive of sales charges, may reflect compensating balance arrangements, fee waivers and/or expense reimbursements. In the absence of compensating balance arrangements, fee waivers and/or expense reimbursements, the total return would have been lower. Past performance is no guarantee of future results. |
| 4 | The total return includes gains from settlement of security litigations. Without these gains, the total return would have been (0.92)% for the year ended May 31, 2020. |
| 5 | Reflects recapture of expenses waived/reimbursed from prior fiscal years. |
| 6 | Reflects fee waivers and/or expense reimbursements. |
| 7 | As a result of an expense limitation arrangement, effective May 21, 2021, the ratio of total annual fund operating expenses, other than interest, brokerage commissions, taxes, extraordinary expenses, deferred organizational expenses and acquired fund fees and expenses, to average net assets of Class A shares did not exceed 1.01%. This expense limitation arrangement cannot be terminated prior to December 31, 2022 without the Board of Directors’ consent. In addition, the manager has agreed to waive the Fund’s management fee to an extent sufficient to offset the net management fee payable in connection with any investment in an affiliated money market fund. Prior to May 21, 2021, as a result of an expense limitation arrangement, the ratio of total annual fund operating expenses to average net assets of Class A shares did not exceed 1.05%. |
See Notes to Financial Statements.
| | |
| Western Asset High Yield Fund 2021 Annual Report | | 43 |
Financial highlights (cont’d)
| | | | | | | | | | | | | | | | | | | | |
| For a share of each class of capital stock outstanding throughout each year ended May 31: | | | | |
| Class A2 Shares1 | | 2021 | | | 2020 | | | 2019 | | | 2018 | | | 2017 | |
| | | | | |
| Net asset value, beginning of year | | | $7.40 | | | | $7.85 | | | | $7.97 | | | | $8.14 | | | | $7.62 | |
| | | | | |
| Income (loss) from operations: | | | | | | | | | | | | | | | | | | | | |
Net investment income | | | 0.39 | | | | 0.42 | | | | 0.43 | | | | 0.44 | | | | 0.47 | |
Net realized and unrealized gain (loss) | | | 0.81 | | | | (0.45) | | | | (0.11) | | | | (0.18) | | | | 0.50 | |
Total income (loss) from operations | | | 1.20 | | | | (0.03) | | | | 0.32 | | | | 0.26 | | | | 0.97 | |
| | | | | |
| Less distributions from: | | | | | | | | | | | | | | | | | | | | |
Net investment income | | | (0.39) | | | | (0.40) | | | | (0.44) | | | | (0.43) | | | | (0.43) | |
Return of capital | | | (0.00) | 2 | | | (0.02) | | | | (0.00) | 2 | | | — | | | | (0.02) | |
Total distributions | | | (0.39) | | | | (0.42) | | | | (0.44) | | | | (0.43) | | | | (0.45) | |
| | | | | |
| Net asset value, end of year | | | $8.21 | | | | $7.40 | | | | $7.85 | | | | $7.97 | | | | $8.14 | |
Total return3 | | | 16.47 | % | | | (0.47) | %4 | | | 4.16 | % | | | 3.30 | % | | | 12.97 | % |
| | | | | |
| Net assets, end of year (000s) | | | $61,155 | | | | $40,223 | | | | $35,053 | | | | $31,070 | | | | $27,875 | |
| | | | | |
| Ratios to average net assets: | | | | | | | | | | | | | | | | | | | | |
Gross expenses | | | 1.00 | % | | | 1.00 | %5 | | | 1.00 | % | | | 0.98 | % | | | 0.96 | % |
Net expenses6 | | | 0.94 | 7 | | | 0.96 | 5,7 | | | 0.95 | 7 | | | 0.96 | 7 | | | 0.96 | |
Net investment income | | | 4.87 | | | | 5.44 | | | | 5.52 | | | | 5.47 | | | | 5.90 | |
| | | | | |
| Portfolio turnover rate | | | 101 | % | | | 83 | % | | | 71 | % | | | 68 | % | | | 74 | % |
| 1 | Per share amounts have been calculated using the average shares method. |
| 2 | Amount represents less than $0.005 per share. |
| 3 | Performance figures, exclusive of sales charges, may reflect compensating balance arrangements, fee waivers and/or expense reimbursements. In the absence of compensating balance arrangements, fee waivers and/or expense reimbursements, the total return would have been lower. Past performance is no guarantee of future results. |
| 4 | The total return includes gains from settlement of security litigations. Without these gains, the total return would have been (0.61)% for the year ended May 31, 2020. |
| 5 | Reflects recapture of expenses waived/reimbursed from prior fiscal years. |
| 6 | As a result of an expense limitation arrangement, the ratio of total annual fund operating expenses, other than interest, brokerage commissions, taxes, extraordinary expenses, deferred organizational expenses and acquired fund fees and expenses, to average net assets of Class A2 shares did not exceed 1.25%. This expense limitation arrangement cannot be terminated prior to December 31, 2022 without the Board of Directors’ consent. In addition, the manager has agreed to waive the Fund’s management fee to an extent sufficient to offset the net management fee payable in connection with any investment in an affiliated money market fund. |
| 7 | Reflects fee waivers and/or expense reimbursements. |
See Notes to Financial Statements.
| | |
44 | | Western Asset High Yield Fund 2021 Annual Report |
| | | | | | | | | | | | | | | | | | | | |
| For a share of each class of capital stock outstanding throughout each year ended May 31: | | | | |
| Class C Shares1 | | 2021 | | | 2020 | | | 2019 | | | 2018 | | | 2017 | |
| | | | | |
| Net asset value, beginning of year | | | $7.33 | | | | $7.77 | | | | $7.89 | | | | $8.06 | | | | $7.54 | |
| | | | | |
| Income (loss) from operations: | | | | | | | | | | | | | | | | | | | | |
Net investment income | | | 0.32 | | | | 0.35 | | | | 0.37 | | | | 0.38 | | | | 0.41 | |
Net realized and unrealized gain (loss) | | | 0.80 | | | | (0.43) | | | | (0.12) | | | | (0.18) | | | | 0.49 | |
Total income (loss) from operations | | | 1.12 | | | | (0.08) | | | | 0.25 | | | | 0.20 | | | | 0.90 | |
| | | | | |
| Less distributions from: | | | | | | | | | | | | | | | | | | | | |
Net investment income | | | (0.32) | | | | (0.34) | | | | (0.37) | | | | (0.37) | | | | (0.36) | |
Return of capital | | | (0.00) | 2 | | | (0.02) | | | | (0.00) | 2 | | | — | | | | (0.02) | |
Total distributions | | | (0.32) | | | | (0.36) | | | | (0.37) | | | | (0.37) | | | | (0.38) | |
| | | | | |
| Net asset value, end of year | | | $8.13 | | | | $7.33 | | | | $7.77 | | | | $7.89 | | | | $8.06 | |
Total return3 | | | 15.66 | % | | | (1.32) | %4 | | | 3.33 | % | | | 2.48 | % | | | 12.18 | % |
| | | | | |
| Net assets, end of year (000s) | | | $1,960 | | | | $1,964 | | | | $2,320 | | | | $2,779 | | | | $3,791 | |
| | | | | |
| Ratios to average net assets: | | | | | | | | | | | | | | | | | | | | |
Gross expenses | | | 1.82 | % | | | 1.82 | %5 | | | 1.80 | %5 | | | 1.75 | % | | | 1.72 | % |
Net expenses6 | | | 1.76 | 7 | | | 1.78 | 5,7 | | | 1.73 | 5,7 | | | 1.74 | 7 | | | 1.72 | |
Net investment income | | | 4.08 | | | | 4.61 | | | | 4.74 | | | | 4.70 | | | | 5.17 | |
| | | | | |
| Portfolio turnover rate | | | 101 | % | | | 83 | % | | | 71 | % | | | 68 | % | | | 74 | % |
| 1 | Per share amounts have been calculated using the average shares method. |
| 2 | Amount represents less than $0.005 per share. |
| 3 | Performance figures, exclusive of CDSC, may reflect compensating balance arrangements, fee waivers and/or expense reimbursements. In the absence of compensating balance arrangements, fee waivers and/or expense reimbursements, the total return would have been lower. Past performance is no guarantee of future results. |
| 4 | The total return includes gains from settlement of security litigations. Without these gains, the total return would have been (1.46)% for the year ended May 31, 2020. |
| 5 | Reflects recapture of expenses waived/reimbursed from prior fiscal years. |
| 6 | As a result of an expense limitation arrangement, the ratio of total annual fund operating expenses, other than interest, brokerage commissions, taxes, extraordinary expenses, deferred organizational expenses and acquired fund fees and expenses, to average net assets of Class C shares did not exceed 1.80%. This expense limitation arrangement cannot be terminated prior to December 31, 2022 without the Board of Directors’ consent. In addition, the manager has agreed to waive the Fund’s management fee to an extent sufficient to offset the net management fee payable in connection with any investment in an affiliated money market fund. |
| 7 | Reflects fee waivers and/or expense reimbursements. |
See Notes to Financial Statements.
| | |
| Western Asset High Yield Fund 2021 Annual Report | | 45 |
Financial highlights (cont’d)
| | | | | | | | | | | | | | | | | | | | |
| For a share of each class of capital stock outstanding throughout each year ended May 31: | | | | |
| Class R Shares1 | | 2021 | | | 2020 | | | 2019 | | | 2018 | | | 2017 | |
| | | | | |
| Net asset value, beginning of year | | | $7.35 | | | | $7.78 | | | | $7.91 | | | | $8.08 | | | | $7.55 | |
| | | | | |
| Income (loss) from operations: | | | | | | | | | | | | | | | | | | | | |
Net investment income | | | 0.36 | | | | 0.39 | | | | 0.40 | | | | 0.41 | | | | 0.45 | |
Net realized and unrealized gain (loss) | | | 0.80 | | | | (0.43) | | | | (0.12) | | | | (0.18) | | | | 0.50 | |
Total income (loss) from operations | | | 1.16 | | | | (0.04) | | | | 0.28 | | | | 0.23 | | | | 0.95 | |
| | | | | |
| Less distributions from: | | | | | | | | | | | | | | | | | | | | |
Net investment income | | | (0.36) | | | | (0.37) | | | | (0.41) | | | | (0.40) | | | | (0.40) | |
Return of capital | | | (0.00) | 2 | | | (0.02) | | | | (0.00) | 2 | | | — | | | | (0.02) | |
Total distributions | | | (0.36) | | | | (0.39) | | | | (0.41) | | | | (0.40) | | | | (0.42) | |
| | | | | |
| Net asset value, end of year | | | $8.15 | | | | $7.35 | | | | $7.78 | | | | $7.91 | | | | $8.08 | |
Total return3 | | | 16.16 | % | | | (0.73) | %4 | | | 3.64 | % | | | 2.95 | % | | | 12.80 | % |
| | | | | |
| Net assets, end of year (000s) | | | $129 | | | | $158 | | | | $282 | | | | $223 | | | | $187 | |
| | | | | |
| Ratios to average net assets: | | | | | | | | | | | | | | | | | | | | |
Gross expenses | | | 1.64 | % | | | 1.69 | %5 | | | 1.53 | %5 | | | 1.50 | %5 | | | 1.83 | %5 |
Net expenses6,7 | | | 1.30 | | | | 1.30 | 5 | | | 1.30 | 5 | | | 1.30 | 5 | | | 1.30 | 5 |
Net investment income | | | 4.53 | | | | 5.07 | | | | 5.14 | | | | 5.14 | | | | 5.65 | |
| | | | | |
| Portfolio turnover rate | | | 101 | % | | | 83 | % | | | 71 | % | | | 68 | % | | | 74 | % |
| 1 | Per share amounts have been calculated using the average shares method. |
| 2 | Amount represents less than $0.005 per share. |
| 3 | Performance figures may reflect compensating balance arrangements, fee waivers and/or expense reimbursements. In the absence of compensating balance arrangements, fee waivers and/or expense reimbursements, the total return would have been lower. Past performance is no guarantee of future results. |
| 4 | The total return includes gains from settlement of security litigations. Without these gains, the total return would have been (0.86)% for the year ended May 31, 2020. |
| 5 | Reflects recapture of expenses waived/reimbursed from prior fiscal years. |
| 6 | As a result of an expense limitation arrangement, the ratio of total annual fund operating expenses, other than interest, brokerage commissions, taxes, extraordinary expenses, deferred organizational expenses and acquired fund fees and expenses, to average net assets of Class R shares did not exceed 1.30%. This expense limitation arrangement cannot be terminated prior to December 31, 2022 without the Board of Directors’ consent. In addition, the manager has agreed to waive the Fund’s management fee to an extent sufficient to offset the net management fee payable in connection with any investment in an affiliated money market fund. |
| 7 | Reflects fee waivers and/or expense reimbursements. |
See Notes to Financial Statements.
| | |
46 | | Western Asset High Yield Fund 2021 Annual Report |
| | | | | | | | | | | | | | | | | | | | |
| For a share of each class of capital stock outstanding throughout each year ended May 31: | | | | |
| Class I Shares1 | | 2021 | | | 2020 | | | 2019 | | | 2018 | | | 2017 | |
| | | | | |
| Net asset value, beginning of year | | | $7.34 | | | | $7.78 | | | | $7.90 | | | | $8.07 | | | | $7.55 | |
| | | | | |
| Income (loss) from operations: | | | | | | | | | | | | | | | | | | | | |
Net investment income | | | 0.40 | | | | 0.44 | | | | 0.45 | | | | 0.46 | | | | 0.50 | |
Net realized and unrealized gain (loss) | | | 0.80 | | | | (0.44) | | | | (0.11) | | | | (0.18) | | | | 0.49 | |
Total income from operations | | | 1.20 | | | | 0.00 | | | | 0.34 | | | | 0.28 | | | | 0.99 | |
| | | | | |
| Less distributions from: | | | | | | | | | | | | | | | | | | | | |
Net investment income | | | (0.40) | | | | (0.42) | | | | (0.46) | | | | (0.45) | | | | (0.45) | |
Return of capital | | | (0.00) | 2 | | | (0.02) | | | | (0.00) | 2 | | | — | | | | (0.02) | |
Total distributions | | | (0.40) | | | | (0.44) | | | | (0.46) | | | | (0.45) | | | | (0.47) | |
| | | | | |
| Net asset value, end of year | | | $8.14 | | | | $7.34 | | | | $7.78 | | | | $7.90 | | | | $8.07 | |
Total return3 | | | 16.65 | % | | | (0.14) | %4 | | | 4.40 | % | | | 3.53 | % | | | 13.33 | % |
| | | | | |
| Net assets, end of year (000s) | | | $97,099 | | | | $64,507 | | | | $84,953 | | | | $106,298 | | | | $102,389 | |
| | | | | |
| Ratios to average net assets: | | | | | | | | | | | | | | | | | | | | |
Gross expenses | | | 0.81 | % | | | 0.75 | % | | | 0.75 | % | | | 0.74 | % | | | 0.70 | % |
Net expenses5 | | | 0.75 | 6 | | | 0.71 | 6 | | | 0.70 | 6 | | | 0.72 | 6 | | | 0.70 | |
Net investment income | | | 5.06 | | | | 5.66 | | | | 5.74 | | | | 5.70 | | | | 6.26 | |
| | | | | |
| Portfolio turnover rate | | | 101 | % | | | 83 | % | | | 71 | % | | | 68 | % | | | 74 | % |
| 1 | Per share amounts have been calculated using the average shares method. |
| 2 | Amount represents less than $0.005 per share. |
| 3 | Performance figures may reflect compensating balance arrangements, fee waivers and/or expense reimbursements. In the absence of compensating balance arrangements, fee waivers and/or expense reimbursements, the total return would have been lower. Past performance is no guarantee of future results. |
| 4 | The total return includes gains from settlement of security litigations. Without these gains, the total return would have been (0.42)% for the year ended May 31, 2020. |
| 5 | The manager has agreed to waive the fund’s management fee to an extent sufficient to offset the net management fee payable in connection with any investment in an affiliated money market fund. |
| 6 | Reflects fee waivers and/or expense reimbursements. |
See Notes to Financial Statements.
| | |
| Western Asset High Yield Fund 2021 Annual Report | | 47 |
Financial highlights (cont’d)
| | | | | | | | | | | | | | | | | | | | |
| For a share of each class of capital stock outstanding throughout each year ended May 31: | | | | |
| Class IS Shares1 | | 2021 | | | 2020 | | | 2019 | | | 2018 | | | 2017 | |
| | | | | |
| Net asset value, beginning of year | | | $7.45 | | | | $7.90 | | | | $8.03 | | | | $8.20 | | | | $7.67 | |
| | | | | |
| Income (loss) from operations: | | | | | | | | | | | | | | | | | | | | |
Net investment income | | | 0.42 | | | | 0.45 | | | | 0.46 | | | | 0.47 | | | | 0.51 | |
Net realized and unrealized gain (loss) | | | 0.81 | | | | (0.45) | | | | (0.12) | | | | (0.18) | | | | 0.50 | |
Total income from operations | | | 1.23 | | | | 0.00 | | | | 0.34 | | | | 0.29 | | | | 1.01 | |
| | | | | |
| Less distributions from: | | | | | | | | | | | | | | | | | | | | |
Net investment income | | | (0.41) | | | | (0.43) | | | | (0.47) | | | | (0.46) | | | | (0.46) | |
Return of capital | | | (0.00) | 2 | | | (0.02) | | | | (0.00) | 2 | | | — | | | | (0.02) | |
Total distributions | | | (0.41) | | | | (0.45) | | | | (0.47) | | | | (0.46) | | | | (0.48) | |
| | | | | |
| Net asset value, end of year | | | $8.27 | | | | $7.45 | | | | $7.90 | | | | $8.03 | | | | $8.20 | |
Total return3 | | | 16.88 | % | | | (0.12) | %4 | | | 4.35 | % | | | 3.65 | % | | | 13.41 | % |
| | | | | |
| Net assets, end of year (000s) | | | $58,186 | | | | $102,505 | | | | $116,945 | | | | $105,176 | | | | $114,960 | |
| | | | | |
| Ratios to average net assets: | | | | | | | | | | | | | | | | | | | | |
Gross expenses | | | 0.71 | % | | | 0.69 | %5 | | | 0.70 | %5 | | | 0.68 | % | | | 0.65 | % |
Net expenses6 | | | 0.65 | 7 | | | 0.65 | 5,7 | | | 0.65 | 5,7 | | | 0.66 | 7 | | | 0.65 | |
Net investment income | | | 5.20 | | | | 5.72 | | | | 5.79 | | | | 5.77 | | | | 6.32 | |
| | | | | |
| Portfolio turnover rate | | | 101 | % | | | 83 | % | | | 71 | % | | | 68 | % | | | 74 | % |
| 1 | Per share amounts have been calculated using the average shares method. |
| 2 | Amount represents less than $0.005 per share. |
| 3 | Performance figures may reflect compensating balance arrangements, fee waivers and/or expense reimbursements. In the absence of compensating balance arrangements, fee waivers and/or expense reimbursements, the total return would have been lower. Past performance is no guarantee of future results. |
| 4 | The total return includes gains from settlement of security litigations. Without these gains, the total return would have been (0.26)% for the year ended May 31, 2020. |
| 5 | Reflects recapture of expenses waived/reimbursed from prior fiscal years. |
| 6 | As a result of an expense limitation arrangement, the ratio of total annual fund operating expenses, other than interest, brokerage commissions, taxes, extraordinary expenses, deferred organizational expenses and acquired fund fees and expenses, to average net assets of Class IS shares did not exceed 0.65%. In addition, the ratio of total annual fund operating expenses for Class IS shares did not exceed the ratio of total annual fund operating expenses for Class I shares. These expense limitation arrangements cannot be terminated prior to December 31, 2022 without the Board of Directors’ consent. In addition, the manager has agreed to waive the Fund’s management fee to an extent sufficient to offset the net management fee payable in connection with any investment in an affiliated money market fund. |
| 7 | Reflects fee waivers and/or expense reimbursements. |
See Notes to Financial Statements.
| | |
48 | | Western Asset High Yield Fund 2021 Annual Report |
Notes to financial statements
1. Organization and significant accounting policies
Western Asset High Yield Fund (the “Fund”) is a separate diversified investment series of Western Asset Funds, Inc. (the “Corporation”). The Corporation, a Maryland corporation, is registered under the Investment Company Act of 1940, as amended (the “1940 Act”), as an open-end management investment company.
The following are significant accounting policies consistently followed by the Fund and are in conformity with U.S. generally accepted accounting principles (“GAAP”). Estimates and assumptions are required to be made regarding assets, liabilities and changes in net assets resulting from operations when financial statements are prepared. Changes in the economic environment, financial markets and any other parameters used in determining these estimates could cause actual results to differ. Subsequent events have been evaluated through the date the financial statements were issued.
(a) Investment valuation. The valuations for fixed income securities (which may include, but are not limited to, corporate, government, municipal, mortgage-backed, collateralized mortgage obligations and asset-backed securities) and certain derivative instruments are typically the prices supplied by independent third party pricing services, which may use market prices or broker/dealer quotations or a variety of valuation techniques and methodologies. The independent third party pricing services typically use inputs that are observable such as issuer details, interest rates, yield curves, prepayment speeds, credit risks/spreads, default rates and quoted prices for similar securities. Investments in open-end funds are valued at the closing net asset value per share of each fund on the day of valuation. Futures contracts are valued daily at the settlement price established by the board of trade or exchange on which they are traded. Equity securities for which market quotations are available are valued at the last reported sales price or official closing price on the primary market or exchange on which they trade. When the Fund holds securities or other assets that are denominated in a foreign currency, the Fund will normally use the currency exchange rates as of 4:00 p.m. (Eastern Time). If independent third party pricing services are unable to supply prices for a portfolio investment, or if the prices supplied are deemed by the manager to be unreliable, the market price may be determined by the manager using quotations from one or more broker/dealers or at the transaction price if the security has recently been purchased and no value has yet been obtained from a pricing service or pricing broker. When reliable prices are not readily available, such as when the value of a security has been significantly affected by events after the close of the exchange or market on which the security is principally traded, but before the Fund calculates its net asset value, the Fund values these securities as determined in accordance with procedures approved by the Fund’s Board of Directors.
The Board of Directors is responsible for the valuation process and has delegated the supervision of the daily valuation process to the Global Fund Valuation Committee (formerly known as Legg Mason North Atlantic Fund Valuation Committee prior to March 1, 2021) (the “Valuation Committee”). The Valuation Committee, pursuant to the policies adopted by the Board of Directors, is responsible for making fair value determinations, evaluating the effectiveness of the Fund’s pricing policies, and reporting to the Board of Directors. When determining the reliability of third party pricing information for investments owned by the Fund, the Valuation Committee, among other things, conducts due diligence reviews of pricing vendors, monitors the daily change in prices and reviews transactions among market participants.
| | |
| Western Asset High Yield Fund 2021 Annual Report | | 49 |
Notes to financial statements (cont’d)
The Valuation Committee will consider pricing methodologies it deems relevant and appropriate when making fair value determinations. Examples of possible methodologies include, but are not limited to, multiple of earnings; discount from market of a similar freely traded security; discounted cash-flow analysis; book value or a multiple thereof; risk premium/yield analysis; yield to maturity; and/or fundamental investment analysis. The Valuation Committee will also consider factors it deems relevant and appropriate in light of the facts and circumstances. Examples of possible factors include, but are not limited to, the type of security; the issuer’s financial statements; the purchase price of the security; the discount from market value of unrestricted securities of the same class at the time of purchase; analysts’ research and observations from financial institutions; information regarding any transactions or offers with respect to the security; the existence of merger proposals or tender offers affecting the security; the price and extent of public trading in similar securities of the issuer or comparable companies; and the existence of a shelf registration for restricted securities.
For each portfolio security that has been fair valued pursuant to the policies adopted by the Board of Directors, the fair value price is compared against the last available and next available market quotations. The Valuation Committee reviews the results of such back testing monthly and fair valuation occurrences are reported to the Board of Directors quarterly.
The Fund uses valuation techniques to measure fair value that are consistent with the market approach and/or income approach, depending on the type of security and the particular circumstance. The market approach uses prices and other relevant information generated by market transactions involving identical or comparable securities. The income approach uses valuation techniques to discount estimated future cash flows to present value.
GAAP establishes a disclosure hierarchy that categorizes the inputs to valuation techniques used to value assets and liabilities at measurement date. These inputs are summarized in the three broad levels listed below:
| • | | Level 1 — quoted prices in active markets for identical investments |
| • | | Level 2 — other significant observable inputs (including quoted prices for similar investments, interest rates, prepayment speeds, credit risk, etc.) |
| • | | Level 3 — significant unobservable inputs (including the Fund’s own assumptions in determining the fair value of investments) |
The inputs or methodologies used to value securities are not necessarily an indication of the risk associated with investing in those securities.
| | |
50 | | Western Asset High Yield Fund 2021 Annual Report |
The following is a summary of the inputs used in valuing the Fund’s assets and liabilities carried at fair value:
| | | | | | | | | | | | | | | | |
| ASSETS | |
| Description | | Quoted Prices (Level 1) | | | Other Significant Observable Inputs
(Level 2) | | | Significant Unobservable Inputs (Level 3) | | | Total | |
| Long-Term Investments†: | | | | | | | | | | | | | | | | |
Corporate Bonds & Notes: | | | | | | | | | | | | | | | | |
Materials | | | — | | | $ | 9,890,964 | | | $ | 0 | * | | $ | 9,890,964 | |
Other Corporate Bonds & Notes | | | — | | | | 166,267,610 | | | | — | | | | 166,267,610 | |
Senior Loans: | | | | | | | | | | | | | | | | |
Consumer Discretionary | | | — | | | | 6,061,106 | | | | 1,116,683 | | | | 7,177,789 | |
Energy | | | — | | | | — | | | | 14,143 | | | | 14,143 | |
Financials | | | — | | | | 941,479 | | | | 785,250 | | | | 1,726,729 | |
Materials | | | — | | | | — | | | | 464,302 | | | | 464,302 | |
Real Estate | | | — | | | | — | | | | 490,303 | | | | 490,303 | |
Other Senior Loans | | | — | | | | 11,894,083 | | | | — | | | | 11,894,083 | |
Asset-Backed Securities | | | — | | | | 11,087,125 | | | | — | | | | 11,087,125 | |
Convertible Bonds & Notes | | | — | | | | 3,933,052 | | | | — | | | | 3,933,052 | |
Common Stocks: | | | | | | | | | | | | | | | | |
Energy | | $ | 1,695,508 | | | | — | | | | 34,096 | | | | 1,729,604 | |
Materials | | | — | | | | — | | | | 0 | * | | | 0 | * |
Other Common Stocks | | | 433,353 | | | | — | | | | 0 | * | | | 433,353 | * |
Investments in Underlying Funds | | | 2,109,800 | | | | — | | | | — | | | | 2,109,800 | |
Convertible Preferred Stocks: | | | | | | | | | | | | | | | | |
Energy | | | — | | | | 479,423 | | | | 594,344 | | | | 1,073,767 | |
Sovereign Bonds | | | — | | | | 845,268 | | | | — | | | | 845,268 | |
Preferred Stocks | | | 486,172 | | | | — | | | | — | | | | 486,172 | |
| Total Long-Term Investments | | | 4,724,833 | | | | 211,400,110 | | | | 3,499,121 | | | | 219,624,064 | |
| Short-Term Investments† | | | 4,297,370 | | | | — | | | | — | | | | 4,297,370 | |
| Total Investments | | $ | 9,022,203 | | | $ | 211,400,110 | | | $ | 3,499,121 | | | $ | 223,921,434 | |
| Other Financial Instruments: | | | | | | | | | | | | | | | | |
Futures Contracts†† | | $ | 32,915 | | | | — | | | | — | | | $ | 32,915 | |
Centrally Cleared Credit Default Swaps on Corporate Issues — Sell Protection†† | | | — | | | $ | 48,979 | | | | — | | | | 48,979 | |
| Total Other Financial Instruments | | $ | 32,915 | | | $ | 48,979 | | | | — | | | $ | 81,894 | |
| Total | | $ | 9,055,118 | | | $ | 211,449,089 | | | $ | 3,499,121 | | | $ | 224,003,328 | |
| | |
| Western Asset High Yield Fund 2021 Annual Report | | 51 |
Notes to financial statements (cont’d)
| | | | | | | | | | | | | | | | |
| LIABILITIES | |
| Description | | Quoted Prices
(Level 1) | | | Other Significant
Observable Inputs
(Level 2) | | | Significant
Unobservable
Inputs
(Level 3) | | | Total | |
| Other Financial Instruments: | | | | | | | | | | | | | | | | |
Forward Foreign Currency Contracts†† | | | — | | | $ | 1,580 | | | | — | | | $ | 1,580 | |
OTC Credit Default Swaps on Corporate Issues — Sell Protection | | | — | | | | 18,185 | | | | — | | | | 18,185 | |
| Total | | | — | | | $ | 19,765 | | | | — | | | $ | 19,765 | |
| † | See Schedule of Investments for additional detailed categorizations. |
| * | Amount represents less than $1. |
| †† | Reflects the unrealized appreciation (depreciation) of the instruments. |
The following is a reconciliation of investments in which significant unobservable inputs (Level 3) were used in determining fair value:
| | | | | | | | | | | | | | | | | | | | |
| Investments in Securities | | Balance as of May 31, 2020 | | | Accrued
premiums/
discounts | | | Realized gain (loss)1 | | | Change in
unrealized
appreciation
(depreciation)2 | | | Purchases | |
| Corporate Bonds & Notes: | | | | | | | | | | | | | | | | | | | | |
Materials | | | — | | | | — | | | | — | | | | — | | | | — | |
| Senior Loans: | | | | | | | | | | | | | | | | | | | | |
Communication Services | | $ | 297,600 | | | $ | 1,883 | | | $ | 25 | | | $ | 26,088 | | | $ | 294,500 | |
Consumer Discretionary | | | — | | | | 3,683 | | | | 287 | | | | 33,170 | | | | 1,093,100 | |
Energy | | | 37,050 | | | | 726 | | | | (331,688) | | | | 369,771 | | | | 157,551 | |
Financials | | | 718,250 | | | | 953 | | | | (973) | | | | 68,270 | | | | 610,293 | |
Materials | | | — | | | | — | | | | — | | | | (4,643) | | | | 468,945 | |
Real Estate | | | 506,588 | | | | 4,768 | | | | 1,299 | | | | 8,023 | | | | — | |
| Common Stocks: | | | | | | | | | | | | | | | | | | | | |
Communication Services | | | 0 | * | | | — | | | | 0 | * | | | — | | | �� | — | |
Energy | | | 95,887 | | | | — | | | | (562,065) | | | | 558,959 | | | | — | |
Materials | | | — | | | | — | | | | — | | | | 0 | * | | | 0 | * |
| Convertible Preferred Stocks: | | | | | | | | | | | | | | | | | | | | |
Energy | | | — | | | | — | | | | — | | | | 13,406 | | | | 580,938 | |
| Total | | $ | 1,655,375 | | | $ | 12,013 | | | $ | (893,115) | | | $ | 1,073,044 | | | $ | 3,205,327 | |
| | |
52 | | Western Asset High Yield Fund 2021 Annual Report |
| | | | | | | | | | | | | | | | | | | | |
Investments in Securities
(cont’d) | | Sales | | | Transfers
into
Level 33 | | | Transfers out of Level 34 | | | Balance as of May 31, 2021 | | | Net change in
unrealized appreciation (depreciation) for investments in securities still held at May 31, 20212 | |
| Corporate Bonds & Notes: | | | | | | | | | | | | | | | | | | | | |
Materials | | | — | | | $ | 0 | * | | | — | | | $ | 0 | * | | | — | |
| Senior Loans: | | | | | | | | | | | | | | | | | | | | |
Communication Services | | $ | (5,480) | | | | — | | | $ | (614,616) | | | | — | | | | — | |
Consumer Discretionary | | | (13,557) | | | | — | | | | — | | | | 1,116,683 | | | $ | 33,170 | |
Energy | | | (219,267) | | | | — | | | | — | | | | 14,143 | | | | (80,142) | |
Financials | | | (611,543) | | | | — | | | | — | | | | 785,250 | | | | 36,738 | |
Materials | | | — | | | | — | | | | — | | | | 464,302 | | | | (4,643) | |
Real Estate | | | (30,375) | | | | — | | | | — | | | | 490,303 | | | | 8,023 | |
| Common Stocks: | | | | | | | | | | | | | | | | | | | | |
Communication Services | | | (0) | * | | | — | | | | — | | | | — | | | | — | |
Energy | | | (58,685) | | | | — | | | | — | | | | 34,096 | | | | (14,190) | |
Materials | | | — | | | | — | | | | — | | | | 0 | * | | | 0 | * |
| Convertible Preferred Stocks: | | | | | | | | | | | | | | | | | | | | |
Energy | | | — | | | | — | | | | — | | | | 594,344 | | | | 13,406 | |
| Total | | $ | (938,907) | | | | — | | | $ | (614,616) | | | $ | 3,499,121 | | | $ | (7,638) | |
| * | Amount represents less than $1. |
| 1 | This amount is included in net realized gain (loss) from investment transactions in unaffiliated securities in the accompanying Statement of Operations. |
| 2 | This amount is included in the change in net unrealized appreciation (depreciation) in the accompanying Statement of Operations. Change in unrealized appreciation (depreciation) includes net unrealized appreciation (depreciation) resulting from changes in investment values during the reporting period and the reversal of previously recorded unrealized appreciation (depreciation) when gains or losses are realized. |
| 3 | Transferred into Level 3 as a result of the unavailability of a quoted price in an active market for an identical investment or the unavailability of other significant observable input in the valuation obtained from independent third party pricing services or broker/dealer quotations. |
| 4 | Transferred out of Level 3 as a result of the availability of a quoted price in an active market for an identical investment or the availability of other significant observable inputs. |
(b) Futures contracts. The Fund uses futures contracts generally to gain exposure to, or hedge against, changes in interest rates or gain exposure to, or hedge against, changes in certain asset classes. A futures contract represents a commitment for the future purchase or sale of an asset at a specified price on a specified date.
| | |
| Western Asset High Yield Fund 2021 Annual Report | | 53 |
Notes to financial statements (cont’d)
Upon entering into a futures contract, the Fund is required to deposit cash or securities with a broker in an amount equal to a certain percentage of the contract amount. This is known as the ‘‘initial margin’’ and subsequent payments (‘‘variation margin’’) are made or received by the Fund each day, depending on the daily fluctuation in the value of the contract. For certain futures, including foreign denominated futures, variation margin is not settled daily, but is recorded as a net variation margin payable or receivable. The daily changes in contract value are recorded as unrealized gains or losses in the Statement of Operations and the Fund recognizes a realized gain or loss when the contract is closed.
Futures contracts involve, to varying degrees, risk of loss in excess of the amounts reflected in the financial statements. In addition, there is the risk that the Fund may not be able to enter into a closing transaction because of an illiquid secondary market.
(c) Forward foreign currency contracts. The Fund enters into a forward foreign currency contract to hedge against foreign currency exchange rate risk on its non-U.S. dollar denominated securities or to facilitate settlement of a foreign currency denominated portfolio transaction. A forward foreign currency contract is an agreement between two parties to buy and sell a currency at a set price with delivery and settlement at a future date. The contract is marked-to-market daily and the change in value is recorded by the Fund as an unrealized gain or loss. When a forward foreign currency contract is closed, through either delivery or offset by entering into another forward foreign currency contract, the Fund recognizes a realized gain or loss equal to the difference between the value of the contract at the time it was opened and the value of the contract at the time it is closed.
Forward foreign currency contracts involve elements of market risk in excess of the amounts reflected on the Statement of Assets and Liabilities. The Fund bears the risk of an unfavorable change in the foreign exchange rate underlying the forward foreign currency contract. Risks may also arise upon entering into these contracts from the potential inability of the counterparties to meet the terms of their contracts.
(d) Swap agreements. The Fund invests in swaps for the purpose of managing its exposure to interest rate, credit or market risk, or for other purposes, including to increase the Fund’s return. The use of swaps involves risks that are different from those associated with other portfolio transactions. Swap agreements are privately negotiated in the over-the-counter market and may be entered into as a bilateral contract (“OTC Swaps”) or centrally cleared (“Centrally Cleared Swaps”). Unlike Centrally Cleared Swaps, the Fund has credit exposure to the counterparties of OTC Swaps.
In a Centrally Cleared Swap, immediately following execution of the swap, the swap agreement is submitted to a clearinghouse or central counterparty (the “CCP”) and the CCP becomes the ultimate counterparty of the swap agreement. The Fund is required to interface with the CCP through a broker, acting in an agency capacity. All payments are settled with the CCP through the broker. Upon entering into a Centrally Cleared Swap, the Fund is required to deposit initial margin with the broker in the form of cash or securities.
Swap contracts are marked-to-market daily and changes in value are recorded as unrealized appreciation (depreciation). The daily change in valuation of Centrally Cleared Swaps, if any, is recorded as a net receivable or payable for variation margin on the Statement of
| | |
54 | | Western Asset High Yield Fund 2021 Annual Report |
Assets and Liabilities. Gains or losses are realized upon termination of the swap agreement. Collateral, in the form of restricted cash or securities, may be required to be held in segregated accounts with the Fund’s custodian in compliance with the terms of the swap contracts. Securities posted as collateral for swap contracts are identified in the Schedule of Investments and restricted cash, if any, is identified on the Statement of Assets and Liabilities. Risks may exceed amounts recorded in the Statement of Assets and Liabilities. These risks include changes in the returns of the underlying instruments, failure of the counterparties to perform under the contracts’ terms, and the possible lack of liquidity with respect to the swap agreements.
OTC swap payments received or made at the beginning of the measurement period are reflected as a premium or deposit, respectively, on the Statement of Assets and Liabilities. These upfront payments are amortized over the life of the swap and are recognized as realized gain or loss in the Statement of Operations. Net periodic payments received or paid by the Fund are recognized as a realized gain or loss in the Statement of Operations.
The Fund’s maximum exposure in the event of a defined credit event on a credit default swap to sell protection is the notional amount. As of May 31, 2021, the total notional value of all credit default swaps to sell protection was $1,200,000. This amount would be offset by the value of the swap’s reference entity, upfront premiums received on the swap and any amounts received from the settlement of a credit default swap where the Fund bought protection for the same referenced security/entity.
For average notional amounts of swaps held during the year ended May 31, 2021, see Note 4.
Credit default swaps
The Fund enters into credit default swap (“CDS”) contracts for investment purposes, to manage its credit risk or to add leverage. CDS agreements involve one party making a stream of payments to another party in exchange for the right to receive a specified return in the event of a default by a third party, typically corporate or sovereign issuers, on a specified obligation, or in the event of a write-down, principal shortfall, interest shortfall or default of all or part of the referenced entities comprising a credit index. The Fund may use a CDS to provide protection against defaults of the issuers (i.e., to reduce risk where the Fund has exposure to an issuer) or to take an active long or short position with respect to the likelihood of a particular issuer’s default. As a seller of protection, the Fund generally receives an upfront payment or a stream of payments throughout the term of the swap provided that there is no credit event. If the Fund is a seller of protection and a credit event occurs, as defined under the terms of that particular swap agreement, the maximum potential amount of future payments (undiscounted) that the Fund could be required to make under a credit default swap agreement would be an amount equal to the notional amount of the agreement. These amounts of potential payments will be partially offset by any recovery of values from the respective referenced obligations. As a seller of protection, the Fund effectively adds leverage to its portfolio because, in addition to its total net assets, the Fund is subject to investment exposure on the notional amount of the swap. As a buyer of protection, the Fund generally receives an amount up to the notional value of the swap if a credit event occurs.
| | |
| Western Asset High Yield Fund 2021 Annual Report | | 55 |
Notes to financial statements (cont’d)
Implied spreads are the theoretical prices a lender receives for credit default protection. When spreads rise, market perceived credit risk rises and when spreads fall, market perceived credit risk falls. The implied credit spread of a particular referenced entity reflects the cost of buying/selling protection and may include upfront payments required to enter into the agreement. Wider credit spreads and decreasing market values, when compared to the notional amount of the swap, represent a deterioration of the referenced entity’s credit soundness and a greater likelihood or risk of default or other credit event occurring as defined under the terms of the agreement. Credit spreads utilized in determining the period end market value of credit default swap agreements on corporate or sovereign issues are disclosed in the Schedule of Investments and serve as an indicator of the current status of the payment/performance risk and represent the likelihood or risk of default for credit derivatives. For credit default swap agreements on asset-backed securities and credit indices, the quoted market prices and resulting values, particularly in relation to the notional amount of the contract as well as the annual payment rate, serve as an indication of the current status of the payment/performance risk.
The Fund’s maximum risk of loss from counterparty risk, as the protection buyer, is the fair value of the contract (this risk is mitigated by the posting of collateral by the counterparty to the Fund to cover the Fund’s exposure to the counterparty). As the protection seller, the Fund’s maximum risk is the notional amount of the contract. Credit default swaps are considered to have credit risk-related contingent features since they require payment by the protection seller to the protection buyer upon the occurrence of a defined credit event.
Entering into a CDS agreement involves, to varying degrees, elements of credit, market and documentation risk in excess of the related amounts recognized on the Statement of Assets and Liabilities. Such risks involve the possibility that there will be no liquid market for these agreements, that the counterparty to the agreement may default on its obligation to perform or disagree as to the meaning of the contractual terms in the agreement, and that there will be unfavorable changes in net interest rates.
(e) Loan participations. The Fund may invest in loans arranged through private negotiation between one or more financial institutions. The Fund’s investment in any such loan may be in the form of a participation in or an assignment of the loan. In connection with purchasing participations, the Fund generally will have no right to enforce compliance by the borrower with the terms of the loan agreement related to the loan, or any rights of off-set against the borrower and the Fund may not benefit directly from any collateral supporting the loan in which it has purchased the participation.
The Fund assumes the credit risk of the borrower, the lender that is selling the participation and any other persons interpositioned between the Fund and the borrower. In the event of the insolvency of the lender selling the participation, the Fund may be treated as a general creditor of the lender and may not benefit from any off-set between the lender and the borrower.
(f) Unfunded loan commitments. The Fund may enter into certain credit agreements where all or a portion of the total amount committed may be unfunded. The Fund is obligated to fund these commitments at the borrower’s discretion. The commitments are disclosed in the accompanying Schedule of Investments. At May 31, 2021, the Fund had sufficient cash and/or securities to cover these commitments.
| | |
56 | | Western Asset High Yield Fund 2021 Annual Report |
(g) Securities traded on a when-issued and delayed delivery basis. The Fund may trade securities on a when-issued or delayed delivery basis. In when-issued and delayed delivery transactions, the securities are purchased or sold by the Fund with payment and delivery taking place in the future in order to secure what is considered to be an advantageous price and yield to the Fund at the time of entering into the transaction.
Purchasing such securities involves risk of loss if the value of the securities declines prior to settlement. These securities are subject to market fluctuations and their current value is determined in the same manner as for other securities.
(h) Foreign currency translation. Investment securities and other assets and liabilities denominated in foreign currencies are translated into U.S. dollar amounts based upon prevailing exchange rates on the date of valuation. Purchases and sales of investment securities and income and expense items denominated in foreign currencies are translated into U.S. dollar amounts based upon prevailing exchange rates on the respective dates of such transactions.
The Fund does not isolate that portion of the results of operations resulting from fluctuations in foreign exchange rates on investments from the fluctuations arising from changes in market prices of securities held. Such fluctuations are included with the net realized and unrealized gain or loss on investments.
Net realized foreign exchange gains or losses arise from sales of foreign currencies, including gains and losses on forward foreign currency contracts, currency gains or losses realized between the trade and settlement dates on securities transactions, and the difference between the amounts of dividends, interest, and foreign withholding taxes recorded on the Fund’s books and the U.S. dollar equivalent of the amounts actually received or paid. Net unrealized foreign exchange gains and losses arise from changes in the values of assets and liabilities, other than investments in securities, on the date of valuation, resulting from changes in exchange rates.
Foreign security and currency transactions may involve certain considerations and risks not typically associated with those of U.S. dollar denominated transactions as a result of, among other factors, the possibility of lower levels of governmental supervision and regulation of foreign securities markets and the possibility of political or economic instability.
(i) Credit and market risk. The Fund invests in high-yield and emerging market instruments that are subject to certain credit and market risks. The yields of high-yield and emerging market debt obligations reflect, among other things, perceived credit and market risks. The Fund’s investments in securities rated below investment grade typically involve risks not associated with higher rated securities including, among others, greater risk related to timely and ultimate payment of interest and principal, greater market price volatility and less liquid secondary market trading. The consequences of political, social, economic or diplomatic changes may have disruptive effects on the market prices of investments held by the Fund. The Fund’s investments in non-U.S. dollar denominated securities may also result in foreign currency losses caused by devaluations and exchange rate fluctuations.
| | |
| Western Asset High Yield Fund 2021 Annual Report | | 57 |
Notes to financial statements (cont’d)
Investments in securities that are collateralized by real estate mortgages are subject to certain credit and liquidity risks. When market conditions result in an increase in default rates of the underlying mortgages and the foreclosure values of underlying real estate properties are materially below the outstanding amount of these underlying mortgages, collection of the full amount of accrued interest and principal on these investments may be doubtful. Such market conditions may significantly impair the value and liquidity of these investments and may result in a lack of correlation between their credit ratings and values.
(j) Foreign investment risks. The Fund’s investments in foreign securities may involve risks not present in domestic investments. Since securities may be denominated in foreign currencies, may require settlement in foreign currencies or pay interest or dividends in foreign currencies, changes in the relationship of these foreign currencies to the U.S. dollar can significantly affect the value of the investments and earnings of the Fund. Foreign investments may also subject the Fund to foreign government exchange restrictions, expropriation, taxation or other political, social or economic developments, all of which affect the market and/or credit risk of the investments.
(k) Counterparty risk and credit-risk-related contingent features of derivative instruments. The Fund may invest in certain securities or engage in other transactions where the Fund is exposed to counterparty credit risk in addition to broader market risks. The Fund may invest in securities of issuers, which may also be considered counterparties as trading partners in other transactions. This may increase the risk of loss in the event of default or bankruptcy by the counterparty or if the counterparty otherwise fails to meet its contractual obligations. The Fund’s subadviser attempts to mitigate counterparty risk by (i) periodically assessing the creditworthiness of its trading partners, (ii) monitoring and/or limiting the amount of its net exposure to each individual counterparty based on its assessment and (iii) requiring collateral from the counterparty for certain transactions. Market events and changes in overall economic conditions may impact the assessment of such counterparty risk by the subadviser. In addition, declines in the values of underlying collateral received may expose the Fund to increased risk of loss.
With exchange traded and centrally cleared derivatives, there is less counterparty risk to the Fund since the exchange or clearinghouse, as counterparty to such instruments, guarantees against a possible default. The clearinghouse stands between the buyer and the seller of the contract; therefore, the credit risk is limited to failure of the clearinghouse. While offset rights may exist under applicable law, the Fund does not have a contractual right of offset against a clearing broker or clearinghouse in the event of a default of the clearing broker or clearinghouse.
The Fund has entered into master agreements, such as an International Swaps and Derivatives Association, Inc. Master Agreement (“ISDA Master Agreement”) or similar agreement, with certain of its derivative counterparties that govern over-the-counter (“OTC”) derivatives and provide for general obligations, representations, agreements, collateral posting terms, netting provisions in the event of default or termination and credit related contingent features. The credit related contingent features include, but are not
| | |
58 | | Western Asset High Yield Fund 2021 Annual Report |
limited to, a percentage decrease in the Fund’s net assets or net asset value per share over a specified period of time. If these credit related contingent features were triggered, the derivatives counterparty could terminate the positions and demand payment or require additional collateral.
Under an ISDA Master Agreement, the Fund may, under certain circumstances, offset with the counterparty certain derivative financial instruments’ payables and/or receivables with collateral held and/or posted and create one single net payment. However, absent an event of default by the counterparty or a termination of the agreement, the terms of the ISDA Master Agreements do not result in an offset of reported amounts of financial assets and financial liabilities in the Statement of Assets and Liabilities across transactions between the Fund and the applicable counterparty. The enforceability of the right to offset may vary by jurisdiction.
Collateral requirements differ by type of derivative. Collateral or margin requirements are set by the broker or exchange clearinghouse for exchange traded derivatives while collateral terms are contract specific for OTC traded derivatives. Cash collateral that has been pledged to cover obligations of the Fund under derivative contracts, if any, will be reported separately in the Statement of Assets and Liabilities. Securities pledged as collateral, if any, for the same purpose are noted in the Schedule of Investments.
As of May 31, 2021, the Fund held forward foreign currency contracts and OTC Swaps with credit related contingent features which had a liability position of $19,765. If a contingent feature in the master agreements would have been triggered, the Fund would have been required to pay this amount to its derivatives counterparties.
As of May 31, 2021, the Fund has posted with its counterparties cash and/or securities as collateral to cover the net liability of these derivatives amounting to $50,000 which could be used to reduce the required payment.
(l) Security transactions and investment income. Security transactions are accounted for on a trade date basis. Interest income (including interest income from payment-in-kind securities), adjusted for amortization of premium and accretion of discount, is recorded on the accrual basis. Paydown gains and losses on mortgage- and asset-backed securities are recorded as adjustments to interest income. Dividend income is recorded on the ex-dividend date for dividends received in cash and/or securities. Foreign dividend income is recorded on the ex-dividend date or as soon as practicable after the Fund determines the existence of a dividend declaration after exercising reasonable due diligence. The cost of investments sold is determined by use of the specific identification method. To the extent any issuer defaults or a credit event occurs that impacts the issuer, the Fund may halt any additional interest income accruals and consider the realizability of interest accrued up to the date of default or credit event.
(m) Distributions to shareholders. Distributions from net investment income of the Fund are declared each business day to shareholders of record and are paid monthly. Distributions of net realized gains, if any, are declared at least annually. Distributions to shareholders of the Fund are recorded on the ex-dividend date and are determined in accordance with income tax regulations, which may differ from GAAP.
| | |
| Western Asset High Yield Fund 2021 Annual Report | | 59 |
Notes to financial statements (cont’d)
(n) Share class accounting. Investment income, common expenses and realized/ unrealized gains (losses) on investments are allocated to the various classes of the Fund on the basis of daily net assets of each class. Fees relating to a specific class are charged directly to that share class.
(o) Compensating balance arrangements. The Fund has an arrangement with its custodian bank whereby a portion of the custodian’s fees is paid indirectly by credits earned on the Fund’s cash on deposit with the bank.
(p) Federal and other taxes. It is the Fund’s policy to comply with the federal income and excise tax requirements of the Internal Revenue Code of 1986 (the “Code”), as amended, applicable to regulated investment companies. Accordingly, the Fund intends to distribute its taxable income and net realized gains, if any, to shareholders in accordance with timing requirements imposed by the Code. Therefore, no federal or state income tax provision is required in the Fund’s financial statements.
Management has analyzed the Fund’s tax positions taken on income tax returns for all open tax years and has concluded that as of May 31, 2021, no provision for income tax is required in the Fund’s financial statements. The Fund’s federal and state income and federal excise tax returns for tax years for which the applicable statutes of limitations have not expired are subject to examination by the Internal Revenue Service and state departments of revenue.
Under the applicable foreign tax laws, a withholding tax may be imposed on interest, dividends and capital gains at various rates.
(q) Reclassification. GAAP requires that certain components of net assets be reclassified to reflect permanent differences between financial and tax reporting. These reclassifications have no effect on net assets or net asset value per share. During the current year, the following reclassifications have been made:
| | | | | | | | |
| | | Total Distributable Earnings (Loss) | | | Paid-in
Capital | |
| (a) | | $ | (200,588) | | | $ | 200,588 | |
| (a) | Reclassifications are due to differences between actual and estimated information which adjusted the prior year return of capital. |
2. Investment management agreement and other transactions with affiliates
Legg Mason Partners Fund Advisor, LLC (“LMPFA”) is the Fund’s investment manager. Western Asset Management Company, LLC (“Western Asset”) and Western Asset Management Company Limited (“Western Asset London”) are the Fund’s subadvisers. As of July 31, 2020, LMPFA, Western Asset and Western Asset London are indirect, wholly-owned subsidiaries of Franklin Resources, Inc. (“Franklin Resources”). Prior to July 31, 2020, LMPFA, Western Asset and Western Asset London were wholly-owned subsidiaries of Legg Mason, Inc. (“Legg Mason”). As of July, 31, 2020, Legg Mason is a subsidiary of Franklin Resources.
LMPFA provides administrative and certain oversight services to the Fund. The Fund pays LMPFA an investment management fee, calculated daily and paid monthly, at an annual rate of 0.55% of the Fund’s average daily net assets. For their services, LMPFA pays Western Asset and Western Asset London monthly all of the management fee that it receives from the Fund.
| | |
60 | | Western Asset High Yield Fund 2021 Annual Report |
As a result of expense limitation arrangements between the Fund and LMPFA, the ratio of total annual fund operating expenses, other than interest, brokerage commissions, taxes, extraordinary expenses, deferred organizational expenses and acquired fund fees and expenses, to average net assets of Class A2, Class C, Class R and Class IS shares did not exceed 1.25%, 1.80%, 1.30% and 0.65%, respectively. As a result of expense limitation arrangements between the Fund and LMPFA, effective May 21, 2021, the ratio of total annual fund operating expenses, other than interest, brokerage commissions, taxes, extraordinary expenses, deferred organizational expenses and acquired fund fees and expenses, to average net assets of Class A shares did not exceed 1.01%. In addition, the ratio of total annual fund operating expenses for Class IS shares did not exceed the ratio of total annual fund operating expenses for Class I shares. These expense limitation arrangements cannot be terminated prior to December 31, 2022 without the Board of Directors’ consent. In addition, the manager has agreed to waive the Fund’s management fee to an extent sufficient to offset the net management fee payable in connection with any investment in an affiliated money market fund (the “affiliated money market fund waiver”). The affiliated money market fund waiver is not subject to the recapture provision discussed below.
During the year ended May 31, 2021, fees waived and/or expenses reimbursed amounted to $124,558, which included an affiliated money market fund waiver of $1,966.
LMPFA is permitted to recapture amounts waived and/or reimbursed to a class within two years after the fiscal year in which LMPFA earned the fee or incurred the expense if the class’ total annual fund operating expenses have fallen to a level below the expense limitation (“expense cap”) in effect at the time the fees were earned or the expenses incurred. In no case will LMPFA recapture any amount that would result, on any particular business day of the Fund, in the class’ total annual fund operating expenses exceeding the expense cap or any other lower limit then in effect.
Pursuant to these arrangements, at May 31, 2021, the Fund had remaining fee waivers and/or expense reimbursements subject to recapture by LMPFA and respective dates of expiration as follows:
| | | | | | | | | | | | | | | | | | | | | | | | |
| | | Class A | | | Class A2 | | | Class C | | | Class R | | | Class I | | | Class IS | |
| Expires May 31, 2022 | | $ | 1,608 | | | $ | 12,994 | | | $ | 758 | | | $ | 1,068 | | | $ | 24,643 | | | $ | 49,398 | |
| Expires May 31, 2023 | | | 1,855 | | | | 29,454 | | | | 1,232 | | | | 442 | | | | 42,329 | | | | 47,280 | |
| Total fee waivers/expense reimbursements subject to recapture | | $ | 3,463 | | | $ | 42,448 | | | $ | 1,990 | | | $ | 1,510 | | | $ | 66,972 | | | $ | 96,678 | |
For the year ended May 31, 2021, LMPFA did not recapture any fees.
Legg Mason Investor Services, LLC (“LMIS”) serves as the Fund’s sole and exclusive distributor. As of July 31, 2020, LMIS is an indirect, wholly-owned broker-dealer subsidiary of Franklin Resources. Prior to July 31, 2020, LMIS was a wholly-owned broker-dealer subsidiary of Legg Mason. As of July 7, 2021, LMIS is renamed Franklin Distributors, LLC.
| | |
| Western Asset High Yield Fund 2021 Annual Report | | 61 |
Notes to financial statements (cont’d)
There is a maximum initial sales charge of 4.25% for Class A and Class A2 shares. There is a contingent deferred sales charge (“CDSC”) of 1.00% on Class C shares, which applies if redemption occurs within 12 months from purchase payment. In certain cases, Class A and Class A2 shares have a 1.00% CDSC, which applies if redemption occurs within 18 months from purchase payment. This CDSC only applies to those purchases of Class A and Class A2 shares, which, when combined with current holdings of other shares of funds sold by LMIS, equal or exceed $1,000,000 in the aggregate. These purchases do not incur an initial sales charge.
For the year ended May 31, 2021, sales charges retained by and CDSCs paid to LMIS and its affiliates, if any, were as follows:
| | | | | | | | | | | | |
| | | Class A | | | Class A2 | | | Class C | |
| Sales charges | | $ | 2,495 | | | $ | 89,603 | | | | — | |
| CDSCs | | | — | | | | — | | | $ | 122 | |
As of July 31, 2020, all officers and one Director of the Corporation are employees of Franklin Resources or its affiliates and do not receive compensation from the Corporation. Prior to July 31, 2020, all officers and one Director of the Corporation were employees of Legg Mason and did not receive compensation from the Trust.
3. Investments
During the year ended May 31, 2021, the aggregate cost of purchases and proceeds from sales of investments (excluding short-term investments) were as follows:
| | | | |
| Purchases | | $ | 201,935,771 | |
| Sales | | | 212,725,454 | |
At May 31, 2021, the aggregate cost of investments and the aggregate gross unrealized appreciation and depreciation of investments for federal income tax purposes were as follows:
| | | | | | | | | | | | | | | | |
| | | Cost/Premiums
Paid (Received) | | | Gross
Unrealized
Appreciation | | | Gross
Unrealized
Depreciation | | | Net
Unrealized
Appreciation
(Depreciation) | |
| Securities | | $ | 224,608,748 | | | $ | 11,581,339 | | | $ | (12,268,653) | | | $ | (687,314) | |
| Futures contracts | | | — | | | | 32,915 | | | | — | | | | 32,915 | |
| Forward foreign currency contracts | | | — | | | | — | | | | (1,580) | | | | (1,580) | |
| Swap contracts | | | (92,258) | | | | 105,173 | | | | — | | | | 105,173 | |
| | |
62 | | Western Asset High Yield Fund 2021 Annual Report |
4. Derivative instruments and hedging activities
Below is a table, grouped by derivative type, that provides information about the fair value and the location of derivatives within the Statement of Assets and Liabilities at May 31, 2021.
| | | | | | | | | | | | |
| ASSET DERIVATIVES1 | |
| | | Interest
Rate Risk | | | Credit
Risk | | | Total | |
| Futures contracts2 | | $ | 32,915 | | | | — | | | $ | 32,915 | |
| Centrally cleared swap contracts3 | | | — | | | $ | 48,979 | | | | 48,979 | |
| Total | | $ | 32,915 | | | $ | 48,979 | | | $ | 81,894 | |
| | | | | | | | | | | | |
| LIABILITY DERIVATIVES1 | |
| | | Foreign
Exchange Risk | | | Credit
Risk | | | Total | |
| Forward foreign currency contracts | | $ | 1,580 | | | | — | | | $ | 1,580 | |
| OTC swap contracts4 | | | — | | | $ | 18,185 | | | | 18,185 | |
| Total | | $ | 1,580 | | | $ | 18,185 | | | $ | 19,765 | |
| 1 | Generally, the balance sheet location for asset derivatives is receivables/net unrealized appreciation and for liability derivatives is payables/net unrealized depreciation. |
| 2 | Includes cumulative unrealized appreciation (depreciation) of futures contracts as reported in the Schedule of Investments. Only net variation margin is reported within the receivables and/or payables on the Statement of Assets and Liabilities. |
| 3 | Includes cumulative unrealized appreciation (depreciation) of centrally cleared swap contracts as reported in the Schedule of Investments. Only net variation margin is reported within the receivables and/or payables on the Statement of Assets and Liabilities. |
| 4 | Values include premiums paid (received) on swap contracts which are shown separately in the Statement of Assets and Liabilities. |
The following tables provide information about the effect of derivatives and hedging activities on the Fund’s Statement of Operations for the year ended May 31, 2021. The first table provides additional detail about the amounts and sources of gains (losses) realized on derivatives during the period. The second table provides additional information about the change in unrealized appreciation (depreciation) resulting from the Fund’s derivatives and hedging activities during the period.
| | | | | | | | | | | | | | | | |
| AMOUNT OF REALIZED GAIN (LOSS) ON DERIVATIVES RECOGNIZED | | | | |
| | | Interest
Rate Risk | | | Foreign
Exchange Risk | | | Credit
Risk | | | Total | |
| Futures contracts | | $ | (109,996) | | | | — | | | | — | | | $ | (109,996) | |
| Swap contracts | | | — | | | | — | | | $ | 138,857 | | | | 138,857 | |
| Forward foreign currency contracts | | | — | | | $ | (203,854) | | | | — | | | | (203,854) | |
| Total | | $ | (109,996) | | | $ | (203,854) | | | $ | 138,857 | | | $ | (174,993) | |
| | |
| Western Asset High Yield Fund 2021 Annual Report | | 63 |
Notes to financial statements (cont’d)
| | | | | | | | | | | | | | | | |
| CHANGE IN UNREALIZED APPRECIATION (DEPRECIATION) ON DERIVATIVES RECOGNIZED | |
| | | Interest
Rate Risk | | | Foreign
Exchange Risk | | | Credit
Risk | | | Total | |
| Futures contracts | | $ | 44,501 | | | | — | | | | — | | | $ | 44,501 | |
| Swap contracts | | | — | | | | — | | | $ | 49,826 | | | | 49,826 | |
| Forward foreign currency contracts | | | — | | | $ | 59,526 | | | | — | | | | 59,526 | |
| Total | | $ | 44,501 | | | $ | 59,526 | | | $ | 49,826 | | | $ | 153,853 | |
During the year ended May 31, 2021, the volume of derivative activity for the Fund was as follows:
| | | | |
| | | Average Market
Value | |
| Futures contracts (to buy) | | $ | 16,777,394 | |
| Futures contracts (to sell)† | | | 3,210,651 | |
| Forward foreign currency contracts (to buy)† | | | 684,305 | |
| Forward foreign currency contracts (to sell) | | | 1,491,339 | |
| |
| | | Average Notional
Balance | |
| Credit default swap contracts (to sell protection) | | $ | 1,058,769 | |
| † | At May 31, 2021, there were no open positions held in this derivative. |
The following table presents the Fund’s OTC derivative assets and liabilities by counterparty net of amounts available for offset under an ISDA Master Agreement and net of the related collateral pledged (received) by the Fund as of May 31, 2021.
| | | | | | | | | | | | | | | | | | | | |
| Counterparty | | Gross Assets
Subject to
Master
Agreements | | | Gross
Liabilities
Subject to
Master
Agreements1 | | | Net Assets
(Liabilities)
Subject to
Master
Agreements | | | Collateral
Pledged
(Received)2,3 | | | Net
Amount4 | |
| BNP Paribas SA | | | — | | | $ | (1,316) | | | $ | (1,316) | | | | — | | | $ | (1,316) | |
| Citibank N.A. | | | — | | | | (264) | | | | (264) | | | | — | | | | (264) | |
| JPMorgan Chase & Co. | | | — | | | | (18,185) | | | | (18,185) | | | $ | 18,185 | | | | — | |
| Total | | | — | | | $ | (19,765) | | | $ | (19,765) | | | $ | 18,185 | | | $ | (1,580) | |
| 1 | Absent an event of default or early termination, derivative assets and liabilities are presented gross and not offset in the Statement of Assets and Liabilities. |
| 2 | Gross amounts are not offset in the Statement of Assets and Liabilities. |
| 3 | In some instances, the actual collateral received and/or pledged may be more than the amount shown here due to overcollateralization. |
| 4 | Represents the net amount receivable (payable) from (to) the counterparty in the event of default. |
5. Class specific expenses, waivers and/or expense reimbursements
The Fund has adopted a Rule 12b-1 shareholder services and distribution plan and under that plan the Fund pays service and/or distribution fees with respect to its Class A, Class A2, Class C and Class R shares calculated at the annual rate of 0.25%, 0.25%, 1.00% and 0.50% of the average daily net assets of each class, respectively. Service and/or distribution fees are accrued daily and paid monthly.
| | |
64 | | Western Asset High Yield Fund 2021 Annual Report |
For the year ended May 31, 2021, class specific expenses were as follows:
| | | | | | | | |
| | | Service and/or
Distribution Fees | | | Transfer Agent
Fees | |
| Class A | | $ | 7,791 | | | $ | 3,046 | |
| Class A2 | | | 123,721 | | | | 21,131 | |
| Class C | | | 20,695 | | | | 2,213 | |
| Class R | | | 651 | | | | 563 | |
| Class I | | | — | | | | 73,135 | |
| Class IS | | | — | | | | 809 | |
| Total | | $ | 152,858 | | | $ | 100,897 | |
For the year ended May 31, 2021, waivers and/or expense reimbursements by class were as follows:
| | | | |
| | | Waivers/Expense
Reimbursements | |
| Class A | | $ | 1,885 | |
| Class A2 | | | 29,934 | |
| Class C | | | 1,252 | |
| Class R | | | 443 | |
| Class I | | | 43,000 | |
| Class IS | | | 48,044 | |
| Total | | $ | 124,558 | |
6. Distributions to shareholders by class
| | | | | | | | |
| | | Year Ended
May 31, 2021 | | | Year Ended
May 31, 2020 | |
| Net Investment Income: | | | | | | | | |
| Class A | | $ | 148,622 | | | $ | 235,701 | |
| Class A2 | | | 2,391,995 | | | | 1,939,346 | |
| Class C | | | 83,813 | | | | 95,893 | |
| Class R | | | 5,858 | | | | 13,091 | |
| Class I | | | 3,574,686 | | | | 3,818,101 | |
| Class IS | | | 4,031,140 | | | | 6,144,262 | |
| Total | | $ | 10,236,114 | | | $ | 12,246,394 | |
| | |
| Return of Capital: | | | | | | | | |
| Class A | | $ | 726 | | | $ | 13,295 | |
| Class A2 | | | 11,683 | | | | 109,393 | |
| Class C | | | 409 | | | | 5,409 | |
| Class R | | | 29 | | | | 739 | |
| Class I | | | 17,460 | | | | 215,368 | |
| Class IS | | | 19,689 | | | | 346,581 | |
| Total | | $ | 49,996 | | | $ | 690,785 | |
| | |
| Western Asset High Yield Fund 2021 Annual Report | | 65 |
Notes to financial statements (cont’d)
7. Capital shares
At May 31, 2021, the Corporation had 42.7 billion shares of capital stock authorized with a par value of $0.001 per share. Transactions in shares of each class were as follows:
| | | | | | | | | | | | | | | | |
| | | Year Ended
May 31, 2021 | | | Year Ended
May 31, 2020 | |
| | | Shares | | | Amount | | | Shares | | | Amount | |
| Class A | | | | | | | | | | | | | | | | |
| Shares sold | | | 364,101 | | | $ | 2,896,692 | | | | 2,153,685 | | | $ | 16,728,746 | |
| Shares issued on reinvestment | | | 17,668 | | | | 140,919 | | | | 27,227 | | | | 213,473 | |
| Shares repurchased | | | (262,147) | | | | (2,052,284) | | | | (2,122,991) | | | | (16,474,784) | |
| Net increase | | | 119,622 | | | $ | 985,327 | | | | 57,921 | | | $ | 467,435 | |
| | | | |
| Class A2 | | | | | | | | | | | | | | | | |
| Shares sold | | | 2,372,603 | | | $ | 19,021,727 | | | | 1,226,049 | | | $ | 9,520,439 | |
| Shares issued on reinvestment | | | 301,550 | | | | 2,403,678 | | | | 265,492 | | | | 2,048,739 | |
| Shares repurchased | | | (662,981) | | | | (5,278,879) | | | | (524,390) | | | | (3,994,126) | |
| Net increase | | | 2,011,172 | | | $ | 16,146,526 | | | | 967,151 | | | $ | 7,575,052 | |
| | | | |
| Class C | | | | | | | | | | | | | | | | |
| Shares sold | | | 46,660 | | | $ | 361,955 | | | | 79,801 | | | $ | 623,284 | |
| Shares issued on reinvestment | | | 8,770 | | | | 68,933 | | | | 10,675 | | | | 81,914 | |
| Shares repurchased | | | (82,442) | | | | (652,776) | | | | (120,976) | | | | (890,115) | |
| Net decrease | | | (27,012) | | | $ | (221,888) | | | | (30,500) | | | $ | (184,917) | |
| | | | |
| Class R | | | | | | | | | | | | | | | | |
| Shares sold | | | 7,835 | | | $ | 62,057 | | | | 21,256 | | | $ | 162,623 | |
| Shares issued on reinvestment | | | 627 | | | | 4,946 | | | | 1,108 | | | | 8,550 | |
| Shares repurchased | | | (14,260) | | | | (110,482) | | | | (36,977) | | | | (267,038) | |
| Net decrease | | | (5,798) | | | $ | (43,479) | | | | (14,613) | | | $ | (95,865) | |
| | | | |
| Class I | | | | | | | | | | | | | | | | |
| Shares sold | | | 4,734,195 | | | $ | 38,018,882 | | | | 1,966,182 | | | $ | 14,801,216 | |
| Shares issued on reinvestment | | | 412,680 | | | | 3,258,482 | | | | 473,528 | | | | 3,640,134 | |
| Shares repurchased | | | (2,013,324) | | | | (15,663,588) | | | | (4,572,024) | | | | (35,428,405) | |
| Net increase (decrease) | | | 3,133,551 | | | $ | 25,613,776 | | | | (2,132,314) | | | $ | (16,987,055) | |
| | | | |
| Class IS | | | | | | | | | | | | | | | | |
| Shares sold | | | 775,520 | | | $ | 6,279,714 | | | | 2,059,953 | | | $ | 16,296,538 | |
| Shares issued on reinvestment | | | 508,404 | | | | 4,050,822 | | | | 828,501 | | | | 6,466,328 | |
| Shares repurchased | | | (8,001,622) | | | | (63,893,420) | | | | (3,935,245) | | | | (31,361,771) | |
| Net decrease | | | (6,717,698) | | | $ | (53,562,884) | | | | (1,046,791) | | | $ | (8,598,905) | |
8. Transactions with affiliated companies
As defined by the 1940 Act, an affiliated company is one in which the Fund owns 5% or more of the outstanding voting securities, or a company which is under common ownership or control with the Fund. The Fund invested in Western Asset Premier Institutional Government Reserves, Premium Shares, an affiliated registered money market fund managed by Western Asset. Benefit Street Partners is a wholly-owned subsidiary of Franklin Resources. The following companies were considered affiliated companies for all
| | |
66 | | Western Asset High Yield Fund 2021 Annual Report |
or some portion of the year ended May 31, 2021. The following transactions were effected in such companies for the year ended May 31, 2021.
| | | | | | | | | | | | | | | | | | | | |
| | | Affiliate Value at May 31, 2020 | | | | | | | | | | | | | |
| | | Purchased | | | Sold | |
| | | Cost | | | Shares/
Face amount | | | Cost | | | Shares/
Face amount | |
| Benefit Street Partners CLO XII Ltd., 2017-12A C* | | $ | 220,567 | | | | — | | | | — | | | | — | | | | — | |
| Western Asset Premier Institutional Government Reserves, Premium Shares | | | 745,581 | | | $ | 107,319,493 | | | | 107,319,493 | | | $ | 103,767,704 | | | | 103,767,704 | |
| | | $ | 966,148 | | | $ | 107,319,493 | | | | | | | $ | 103,767,704 | | | | | |
| | | | | | | | | | | | | | | | |
| (cont’d) | | Realized
Gain (Loss) | | | Interest Income and
Accrued
Premiums/
Discounts | | | Net Increase
(Decrease) in
Unrealized
Appreciation (Depreciation)** | | | Affiliate Value at May 31, 2021 | |
| Benefit Street Partners CLO XII Ltd., 2017-12A C* | | | — | | | $ | 16,659 | | | $ | 22,765 | | | $ | 243,332 | |
| Western Asset Premier Institutional Government Reserves, Premium Shares | | | — | | | | 764 | | | | — | | | | 4,297,370 | |
| | | | — | | | $ | 17,423 | | | $ | 22,765 | | | $ | 4,540,702 | |
| * | This security was not an affiliated company at May 31, 2020. |
| ** | Reflects the impact of amortization of premium/accretion of discount, which is reported as a component of Interest from affiliated investments on the Statement of Operations. |
9. Redemption facility
Effective February 5, 2021, the Fund’s redemption facility (the “Redemption Facility”) was terminated and the Fund and certain other participating funds within the Trust, together with other U.S. registered and foreign investment funds (collectively, the “Borrowers”) managed by LMPFA or Franklin Resources, became borrowers in a joint syndicated senior unsecured credit facility totaling $2.675 billion (the “Global Credit Facility”). The Global Credit Facility provides a source of funds to the Borrowers for temporary and emergency purposes, including the ability to meet future unanticipated or unusually large redemption requests. Unless renewed, the Global Credit Facility will terminate on February 4, 2022.
Under the terms of the Global Credit Facility, the Fund shall, in addition to interest charged on any borrowings made by the Fund and other costs incurred by the Fund, pay its share of fees and expenses incurred in connection with the implementation and maintenance of the Global Credit Facility, based upon its relative share of the aggregate net assets of all the Borrowers, including an annual commitment fee of 0.15% based upon the unused portion of
| | |
| Western Asset High Yield Fund 2021 Annual Report | | 67 |
Notes to financial statements (cont’d)
the Global Credit Facility; there is no upfront fee. Under the Redemption Facility, the Fund had access to the aggregate amount of $485 million for the period November 16, 2020 to February 5, 2021 and $265 million prior to November 16, 2020, and the following terms were in effect: the annual commitment fee to maintain the Redemption Facility was 0.15% incurred on the unused portion of the facility and there was an annual upfront fee of 0.06% of the $485 million Redemption Facility; prior to November 16, 2020, there was no upfront fee. The aggregate commitment fees under the Global Credit Facility and Redemption Facility are reflected in the Statement of Operations. The Fund did not utilize the Global Credit Facility nor the Redemption Facility during the year ended May 31, 2021.
10. Income tax information and distributions to shareholders
The tax character of distributions paid during the fiscal years ended May 31, was as follows:
| | | | | | | | |
| | | 2021 | | | 2020 | |
| Distributions paid from: | | | | | | | | |
| Ordinary income | | $ | 10,236,114 | | | $ | 12,246,394 | |
| Tax return of capital | | | 49,996 | | | | 690,785 | |
| Total distributions paid | | $ | 10,286,110 | | | $ | 12,937,179 | |
As of May 31, 2021, the components of distributable earnings (loss) on a tax basis were as follows:
| | | | |
| Deferred capital losses* | | $ | (41,248,543) | |
| Other book/tax temporary differences(a) | | | (113,444) | |
| Unrealized appreciation (depreciation)(b) | | | (544,788) | |
| Total distributable earnings (loss) — net | | $ | (41,906,775) | |
| * | These capital losses have been deferred in the current year as either short-term or long-term losses. The losses will be deemed to occur on the first day of the next taxable year in the same character as they were originally deferred and will be available to offset future taxable capital gains. |
| (a) | Other book/tax temporary differences are attributable to the realization for tax purposes of unrealized gains (losses) on certain futures and foreign currency contracts, book/tax differences in the accrual of interest income on securities in default, the difference between cash and accrual basis distributions paid and book/tax differences in the timing of the deductibility of various expenses of various expenses. |
| (b) | The difference between book-basis and tax-basis unrealized appreciation (depreciation) is attributable to the tax deferral of losses on wash sales and other book/tax basis adjustments. |
11. Recent accounting pronouncement
In March 2020, the Financial Accounting Standards Board issued Accounting Standards Update No. 2020-04, Reference Rate Reform (Topic 848) – Facilitation of the Effects of Reference Rate Reform on Financial Reporting (the “ASU”). The amendments in the ASU provide optional temporary financial reporting relief from the effect of certain types of contract modifications due to the planned discontinuation of the London Interbank Offered Rate and other interbank-offered based reference rates as of the end of 2021. The ASU is effective for certain reference rate-related contract modifications that occur during the period March 12, 2020 through December 31, 2022. Management has reviewed the requirements and believes the adoption of this ASU will not have a material impact on the financial statements.
| | |
68 | | Western Asset High Yield Fund 2021 Annual Report |
12. Other matters
The outbreak of the respiratory illness COVID-19 (commonly referred to as “coronavirus”) has continued to rapidly spread around the world, causing considerable uncertainty for the global economy and financial markets. The ultimate economic fallout from the pandemic, and the long-term impact on economies, markets, industries and individual issuers, are not known. The COVID-19 pandemic could adversely affect the value and liquidity of the Fund’s investments, impair the Fund’s ability to satisfy redemption requests, and negatively impact the Fund’s performance. In addition, the outbreak of COVID-19, and measures taken to mitigate its effects, could result in disruptions to the services provided to the Fund by its service providers.
* * *
The Fund’s investments, payment obligations, and financing terms may be based on floating rates, such as the London Interbank Offered Rate, or “LIBOR,” which is the offered rate for short-term Eurodollar deposits between major international banks. On March 5, 2021, the ICE Benchmark Administration, the administrator of LIBOR, stated that it will cease the publication of (i) the overnight and one-, three-, six- and twelve-month USD LIBOR settings immediately following the LIBOR publication on Friday, June 30, 2023 and (ii) all other LIBOR settings, including the one-week and two-month USD LIBOR settings, immediately following the LIBOR publication on Friday, December 31, 2021. There remains uncertainty regarding the nature of any replacement rate and the impact of the transition from LIBOR on the Fund’s transactions and the financial markets generally. As such, the potential effect of a transition away from LIBOR on the Fund or the Fund’s investments cannot yet be determined.
13. Subsequent event
Effective June 16, 2021, the Fund no longer sells Class A2 shares. Following the close of business on June 24, 2021, all outstanding Class A2 shares automatically converted into Class A shares of the Fund. Shareholders holding Class A2 shares at the time of conversion received Class A shares having an aggregate net asset value equal to the aggregate net asset value of their Class A2 shares immediately prior to the conversion. No sales load or other charges were imposed in connection with the conversion. The conversion was not a taxable event for federal income tax purposes.
| | |
| Western Asset High Yield Fund 2021 Annual Report | | 69 |
Report of independent registered public accounting firm
To the Board of Trustees of Western Asset Funds, Inc. and Shareholders of Western Asset High Yield Fund
Opinion on the Financial Statements
We have audited the accompanying statement of assets and liabilities, including the schedule of investments, of Western Asset High Yield Fund (one of the funds constituting Western Asset Funds, Inc., referred to hereafter as the “Fund”) as of May 31, 2021, the related statement of operations for the year ended May 31, 2021, the statement of changes in net assets for each of the two years in the period ended May 31, 2021, including the related notes, and the financial highlights for each of the five years in the period ended May 31, 2021 (collectively referred to as the “financial statements”). In our opinion, the financial statements present fairly, in all material respects, the financial position of the Fund as of May 31, 2021, the results of its operations for the year then ended, the changes in its net assets for each of the two years in the period ended May 31, 2021 and the financial highlights for each of the five years in the period ended May 31, 2021 in conformity with accounting principles generally accepted in the United States of America.
Basis for Opinion
These financial statements are the responsibility of the Fund’s management. Our responsibility is to express an opinion on the Fund’s financial statements based on our audits. We are a public accounting firm registered with the Public Company Accounting Oversight Board (United States) (PCAOB) and are required to be independent with respect to the Fund in accordance with the U.S. federal securities laws and the applicable rules and regulations of the Securities and Exchange Commission and the PCAOB.
We conducted our audits of these financial statements in accordance with the standards of the PCAOB. Those standards require that we plan and perform the audit to obtain reasonable assurance about whether the financial statements are free of material misstatement, whether due to error or fraud.
Our audits included performing procedures to assess the risks of material misstatement of the financial statements, whether due to error or fraud, and performing procedures that respond to those risks. Such procedures included examining, on a test basis, evidence regarding the amounts and disclosures in the financial statements. Our audits also included evaluating the accounting principles used and significant estimates made by management, as well as evaluating the overall presentation of the financial statements. Our procedures included confirmation of securities owned as of May 31, 2021 by correspondence with the custodian, agent banks and brokers; when replies were not received, we performed other auditing procedures. We believe that our audits provide a reasonable basis for our opinion.
/s/PricewaterhouseCoopers LLP
Baltimore, Maryland
July 19, 2021
We have served as the auditor of one or more investment companies in the Franklin Templeton Group of Funds since 1948.
| | |
70 | | Western Asset High Yield Fund 2021 Annual Report |
Additional information (unaudited)
Information about Directors and Officers
The business and affairs of Western Asset High Yield Fund (the “Fund”) are conducted by management under the supervision and subject to the direction of its Board of Directors. The business address of each Director is c/o Jane Trust, Legg Mason, 100 International Drive, 11th Floor, Baltimore, Maryland 21202.
Information pertaining to the Directors and officers of the Board is set forth below. The Statement of Additional Information includes additional information about Directors and is available, without charge, upon request by calling the Fund at 1-877-721-1926.
| | |
| Independent Directors† | | |
| |
| Robert Abeles, Jr. | | |
| Year of birth | | 1945 |
| Position(s) with Fund | | Director |
| Term of office1 and length of time served2 | | Since 2013 |
| Principal occupation(s) during the past five years | | Board Member, Great Public Schools Now (since 2018); Senior Vice President Emeritus (since 2016) and formerly, Senior Vice President, Finance and Chief Financial Officer (2009 to 2016) at University of Southern California; Board Member, Excellent Education Development (since 2012) |
| Number of funds in fund complex overseen by Director3 | | 57 |
| Other Directorships held by Director during the past five years | | None |
| |
| Jane F. Dasher | | |
| Year of birth | | 1949 |
| Position(s) with Fund | | Director |
| Term of office1 and length of time served2 | | Since 1999 |
| Principal occupation(s) during the past five years | | Chief Financial Officer, Long Light Capital, LLC, formerly known as Korsant Partners, LLC (a family investment company) (since 1997) |
| Number of funds in fund complex overseen by Director3 | | 57 |
| Other Directorships held by Director during the past five years | | Director, Visual Kinematics, Inc. (since 2018) |
| |
| Anita L. DeFrantz | | |
| Year of birth | | 1952 |
| Position(s) with Fund | | Director |
| Term of office1 and length of time served2 | | Since 1998 |
| Principal occupation(s) during the past five years | | President of Tubman Truth Corp. (since 2015); President Emeritus (since 2015) and formerly, President (1987 to 2015) and Director (1990 to 2015) of LA84 (formerly Amateur Athletic Foundation of Los Angeles); Member (since 1986), Member of the Executive Board (since 2013) and Vice President (since 2017) of the International Olympic Committee |
| Number of funds in fund complex overseen by Director3 | | 57 |
| Other Directorships held by Director during the past five years | | None |
| | |
| Western Asset High Yield Fund | | 71 |
Additional information (unaudited) (cont’d)
Information about Directors and Officers
| | |
| Independent Directors† (cont’d) | | |
| |
| Susan B. Kerley | | |
| Year of birth | | 1951 |
| Position(s) with Fund | | Director |
| Term of office1 and length of time served2 | | Since 1992 |
| Principal occupation(s) during the past five years | | Investment Consulting Partner, Strategic Management Advisors, LLC (investment consulting) (since 1990) |
| Number of funds in fund complex overseen by Director3 | | 57 |
| Other Directorships held by Director during the past five years | | Director and Trustee (since 1990) and Chairman (since 2017 and 2005 to 2012) of various series of MainStay Family of Funds (66 funds); formerly, Investment Company Institute (ICI) Board of Governors (2006 to 2014); ICI Executive Committee (2011 to 2014); Chairman of the Independent Directors Council (2012 to 2014) |
| |
| Michael Larson | | |
| Year of birth | | 1959 |
| Position(s) with Fund | | Director |
| Term of office1 and length of time served2 | | Since 2004 |
| Principal occupation(s) during the past five years | | Chief Investment Officer for William H. Gates III (since 1994)4 |
| Number of funds in fund complex overseen by Director3 | | 57 |
| Other Directorships held by Director during the past five years | | Republic Services, Inc. (since 2009); Fomento Economico Mexicano, SAB (since 2011); Ecolab Inc. (since 2012); formerly, AutoNation, Inc. (2010 to 2018) |
| |
| Avedick B. Poladian | | |
| Year of birth | | 1951 |
| Position(s) with Fund | | Director |
| Term of office1 and length of time served2 | | Since 2007 |
| Principal occupation(s) during the past five years | | Director and Advisor (since 2017) and former Executive Vice President and Chief Operating Officer (2002 to 2016) of Lowe Enterprises, Inc. (privately held real estate and hospitality firm); formerly, Partner, Arthur Andersen, LLP (1974 to 2002) |
| Number of funds in fund complex overseen by Director3 | | 57 |
| Other Directorships held by Director during the past five years | | Occidental Petroleum Corporation (since 2008); California Resources Corporation (since 2014); and Public Storage (since 2010) |
| | |
72 | | Western Asset High Yield Fund |
| | |
| Independent Directors† (cont’d) | | |
| |
| William E.B. Siart | | |
| |
| Year of birth | | 1946 |
| Position(s) with Fund | | Director and Chairman of the Board |
| Term of office1 and length of time served2 | | Since 1997 |
| Principal occupation(s) during the past five years | | Chairman of Great Public Schools Now (since 2015); Chairman of Excellent Education Development (since 2000); formerly, Trustee of The Getty Trust (since 2005 to 2017); Chairman of Walt Disney Concert Hall, Inc. (1998 to 2006) |
| Number of funds in fund complex overseen by Director3 | | 57 |
| Other Directorships held by Director during the past five years | | Member of Board of United States Golf Association, Executive Committee Member (since 2017); Trustee, University of Southern California (since 1994) |
| |
| Jaynie Miller Studenmund | | |
| |
| Year of birth | | 1954 |
| Position(s) with Fund | | Director |
| Term of office1 and length of time served2 | | Since 2004 |
| Principal occupation(s) during the past five years | | Corporate Board Member and Advisor (since 2004); formerly, Chief Operating Officer of Overture Services, Inc. (publicly traded internet company that created search engine marketing) (2001 to 2004); President and Chief Operating Officer, PayMyBills (internet innovator in bill presentment/payment space) (1999 to 2001); Executive vice president for consumer and business banking for three national financial institutions (1984 to 1997) |
| Number of funds in fund complex overseen by Director3 | | 57 |
| Other Directorships held by Director during the past five years | | Director of Pacific Premier Bancorp Inc. and Pacific Premier Bank (since 2019); Director of EXL (operations management and analytics company) (since 2018); Director of CoreLogic, Inc. (information, analytics and business services company) (since 2012); formerly, Director of Pinnacle Entertainment, Inc. (gaming and hospitality company) (2012 to 2018); Director of LifeLock, Inc. (identity theft protection company) (2015 to 2017); Director of Orbitz Worldwide, Inc. (online travel company) (2007 to 2014) |
| |
| Peter J. Taylor | | |
| |
| Year of birth | | 1958 |
| Position(s) with Fund | | Director |
| Term of office1 and length of time served2 | | Since 2019 |
| Principal occupation(s) during the past five years | | President, ECMC Foundation (nonprofit organization) (since 2014); formerly, Executive Vice President and Chief Financial Officer for University of California system (2009 to 2014) |
| Number of funds in fund complex overseen by Director3 | | 57 |
| Other Directorships held by Director during the past five years | | Director of Pacific Mutual Holding Company5 (since 2016); Member of the Board of Trustees of California State University system (since 2015); Ralph M. Parson Foundation (since 2015), Kaiser Family Foundation (since 2012), and Edison International (since 2011) |
| | |
| Western Asset High Yield Fund | | 73 |
Additional information (unaudited) (cont’d)
Information about Directors and Officers
| | |
| Interested Director | | |
| |
| Ronald L. Olson6 | | |
| |
| Year of birth | | 1941 |
| Position(s) with Fund | | Director |
| Term of office1 and length of time served2 | | Since 2005 |
| Principal occupation(s) during the past five years | | Partner of Munger, Tolles & Olson LLP (law partnership) (since 1968) |
| Number of funds in fund complex overseen by Director3 | | 57 |
| Other Directorships held by Director during the past five years | | Berkshire Hathaway, Inc. (since 1997) |
| | |
| Interested Director and Officer | | |
| |
| Jane Trust, CFA7 | | |
| |
| Year of birth | | 1962 |
| Position(s) with Fund | | Director, President and Chief Executive Officer |
| Term of office1 and length of time served2 | | Since 2015 |
| Principal occupation(s) during the past five years | | Senior Vice President, Fund Board Management, Franklin Templeton (since 2020); Officer and/or Trustee/Director of 145 funds associated with LMPFA or its affiliates (since 2015); President and Chief Executive Officer of LMPFA (since 2015); formerly, Senior Managing Director (2018 to 2020) and Managing Director (2016 to 2018) of Legg Mason & Co., LLC (“Legg Mason & Co.”); Senior Vice President of LMPFA (2015) |
| Number of funds in fund complex overseen by Director3 | | 143 |
| Other Directorships held by Director during the past five years | | None |
| | |
| Additional Officers | | |
| |
Ted P. Becker Franklin Templeton 620 Eighth Avenue, 47th Floor, New York, NY 10018 | | |
| Year of birth | | 1951 |
| Position(s) with Fund | | Chief Compliance Officer |
| Term of office1 and length of time served2 | | Since 2007 |
| Principal occupation(s) during the past five years | | Vice President, Global Compliance of Franklin Templeton (since 2020); Chief Compliance Officer of LMPFA (since 2006); Chief Compliance Officer of certain funds associated with Legg Mason & Co. or its affiliates (since 2006); formerly, Director of Global Compliance at Legg Mason, Inc. (2006 to 2020); Managing Director of Compliance of Legg Mason & Co. (2005 to 2020) |
| | |
74 | | Western Asset High Yield Fund |
| | |
| Additional Officers (cont’d) |
|
| Susan Kerr |
|
| Franklin Templeton |
|
| 620 Eighth Avenue, 47th Floor, New York, NY 10018 |
| |
| Year of birth | | 1949 |
| Position(s) with Fund | | Chief Anti-Money Laundering Compliance Officer |
| Term of office1 and length of time served2 | | Since 2013 |
| Principal occupation(s) during the past five years | | Senior Compliance Analyst, Franklin Templeton (since 2020); Chief Anti-Money Laundering Compliance Officer of certain funds associated with Legg Mason & Co. or its affiliates (since 2013) and Anti-Money Laundering Compliance Officer (since 2012), Senior Compliance Officer (since 2011) and Assistant Vice President (since 2010) of Legg Mason Investor Services, LLC (“LMIS”); formerly, Assistant Vice President of Legg Mason & Co. (2010 to 2020) |
| |
| Jenna Bailey | | |
|
| Franklin Templeton |
|
| 100 First Stamford Place, 5th Floor, Stamford, CT 06902 |
| |
| Year of birth | | 1978 |
| Position(s) with Fund | | Identity Theft Prevention Officer |
| Term of office1 and length of time served2 | | Since 2015 |
| Principal occupation(s) during the past five years | | Senior Compliance Analyst of Franklin Templeton (since 2020); Identity Theft Prevention Officer of certain funds associated with Legg Mason & Co. or its affiliates (since 2015); formerly, Compliance Officer of Legg Mason & Co. (2013 to 2020); Assistant Vice President of Legg Mason & Co. (2011 to 2020) |
| |
| Marc A. De Oliveira* | | |
|
| Franklin Templeton |
|
| 100 First Stamford Place, 6th Floor, Stamford, CT 06902 |
| |
| Year of birth | | 1971 |
| Position(s) with Fund | | Secretary and Chief Legal Officer |
| Term of office1 and length of time served2 | | Since 2020 |
| Principal occupation(s) during the past five years | | Associate General Counsel of Franklin Templeton (since 2020); Assistant Secretary of certain funds associated with Legg Mason & Co. or its affiliates (since 2006); formerly, Managing Director (2016 to 2020) and Associate General Counsel of Legg Mason & Co. (2005 to 2020) |
| | |
| Western Asset High Yield Fund | | 75 |
Additional information (unaudited) (cont’d)
Information about Directors and Officers
| | |
| Additional Officers (cont’d) |
|
| Thomas C. Mandia |
|
| Franklin Templeton |
|
| 100 First Stamford Place, 6th Floor, Stamford, CT 06902 |
| |
| Year of birth | | 1962 |
| Position(s) with Fund | | Senior Vice President |
| Term of office1 and length of time served2 | | Since 2020 |
| Principal occupation(s) during the past five years | | Senior Associate General Counsel of Franklin Templeton (since 2020); Secretary of LMPFA (since 2006); Assistant Secretary of certain funds associated with Legg Mason & Co. or its affiliates (since 2006); Secretary of LM Asset Services, LLC (“LMAS”) (since 2002) and Legg Mason Fund Asset Management, Inc. (“LMFAM”) (since 2013) (formerly registered investment advisers); formerly, Managing Director and Deputy General Counsel of Legg Mason & Co. (2005 to 2020) |
| |
| Christopher Berarducci | | |
|
| Franklin Templeton |
|
| 620 Eighth Avenue, 47th Floor, New York, NY 10018 |
| |
| Year of birth | | 1974 |
| Position(s) with Fund | | Treasurer and Principal Financial Officer |
| Term of office1 and length of time served2 | | Since 2019 |
| Principal occupation(s) during the past five years | | Vice President, Fund Administration and Reporting, Franklin Templeton (since 2020); Treasurer (since 2010) and Principal Financial Officer (since 2019) of certain funds associated with Legg Mason & Co. or its affiliates; formerly, Managing Director (2020), Director (2015 to 2020), and Vice President (2011 to 2015) of Legg Mason & Co. |
| |
| Jeanne M. Kelly | | |
|
| Franklin Templeton |
|
| 620 Eighth Avenue, 47th Floor, New York, NY 10018 |
| |
| Year of birth | | 1951 |
| Position(s) with Fund | | Senior Vice President |
| Term of office1 and length of time served2 | | Since 2007 |
| Principal occupation(s) during the past five years | | U.S. Fund Board Team Manager, Franklin Templeton (since 2020); Senior Vice President of certain funds associated with Legg Mason & Co. or its affiliates (since 2007); Senior Vice President of LMPFA (since 2006); President and Chief Executive Officer of LMAS and LMFAM (since 2015); formerly, Managing Director of Legg Mason & Co. (2005 to 2020); Senior Vice President of LMFAM (2013 to 2015) |
| † | Directors who are not “interested persons” of the Fund within the meaning of Section 2(a)(19) of the Investment Company Act of 1940, as amended (the “1940 Act”). |
| * | Effective September 15, 2020, Mr. De Oliveira became Secretary and Chief Legal Officer. |
| 1 | Each Director and officer serves until his or her respective successor has been duly elected and qualified or until his or her earlier death, resignation, retirement or removal. |
| | |
76 | | Western Asset High Yield Fund |
| 2 | Indicates the earliest year in which the Director became a board member for a fund in the Legg Mason fund complex or the officer took such office. |
| 3 | Each board member also serves as a Director of Western Asset Investment Grade Income Fund Inc. and a Trustee of Western Asset Premier Bond Fund (closed-end investment companies), which are considered part of the same fund complex. Additionally, each board member serves as a Trustee of Western Asset Inflation-Linked Income Fund and Western Asset Inflation-Linked Opportunities & Income Fund, closed-end investment companies that are part of the same fund complex. |
| 4 | Mr. Larson is the chief investment officer for William H. Gates III and in that capacity oversees the investments of Mr. Gates and the investments of the Bill and Melinda Gates Foundation Trust (such combined investments are referred to as the “Accounts”). Since 1997, Western Asset has provided discretionary investment advice with respect to one or more Accounts. |
| 5 | Western Asset and its affiliates provide investment advisory services with respect to registered investment companies sponsored by an affiliate of Pacific Mutual Holding Company (“Pacific Holdings”). Affiliates of Pacific Holdings receive compensation from LMPFA or its affiliates for shareholder or distribution services provided with respect to registered investment companies for which Western Asset or its affiliates serve as investment adviser. |
| 6 | Mr. Olson is an “interested person” of the Fund, as defined in the 1940 Act, because his law firm has provided legal services to Western Asset. |
| 7 | Ms. Trust is an “interested person” of the Fund, as defined in the 1940 Act, because of her position with LMPFA and/or certain of its affiliates. |
| | |
| Western Asset High Yield Fund | | 77 |
Important tax information (unaudited)
The following information is provided with respect to the distributions paid during the taxable year ended May 31, 2021:
| | | | | | | | |
| Record date: | | | Monthly | | | | Monthly | |
| Payable date: | |
| June 2020 through
December 2020 |
| |
| January 2021 through
May 2021 |
|
| Tax Return of Capital | | | — | | | | 1.26 | % |
| | |
78 | | Western Asset High Yield Fund |
Western Asset
High Yield Fund
Directors
Robert Abeles, Jr.
Jane F. Dasher
Anita L. DeFrantz
Susan B. Kerley
Michael Larson
Ronald L. Olson
Avedick B. Poladian
William E.B. Siart
Chairman
Jaynie M. Studenmund
Peter J. Taylor
Jane Trust
Investment manager
Legg Mason Partners Fund Advisor, LLC
Subadvisers
Western Asset Management Company, LLC
Western Asset Management Company Limited
Distributor
Legg Mason Investor Services, LLC
Custodian
The Bank of New York Mellon
Transfer agent
BNY Mellon Investment
Servicing (US) Inc.
4400 Computer Drive
Westborough, MA 01581
Independent registered public accounting firm
PricewaterhouseCoopers LLP
Baltimore, MD
Western Asset High Yield Fund
The Fund is a separate investment series of Western Asset Funds, Inc.
Western Asset High Yield Fund
Legg Mason Funds
620 Eighth Avenue, 47th Floor
New York, NY 10018
The Fund files its complete schedule of portfolio holdings with the Securities and Exchange Commission (“SEC”) for the first and third quarters of each fiscal year as an exhibit to its reports on Form N-PORT. The Fund’s Forms N-PORT are available on the SEC’s website at www.sec.gov. To obtain information on Form N-PORT, shareholders can call the Fund at 1-877-721-1926.
Information on how the Fund voted proxies relating to portfolio securities during the prior 12-month period ended June 30th of each year and a description of the policies and procedures that the Fund uses to determine how to vote proxies related to portfolio transactions are available (1) without charge, upon request, by calling the Fund at 1-877-721-1926, (2) at www.leggmason.com/mutualfunds and (3) on the SEC’s website at www.sec.gov.
This report is submitted for the general information of the shareholders of Western Asset High Yield Fund. This report is not authorized for distribution to prospective investors in the Fund unless preceded or accompanied by a current prospectus.
Investors should consider the Fund’s investment objectives, risks, charges and expenses carefully before investing. The prospectus contains this and other important information about the Fund. Please read the prospectus carefully before investing.
www.leggmason.com
© 2021 Legg Mason Investor Services, LLC
Member FINRA, SIPC
Legg Mason Funds Privacy and Security Notice
Your Privacy and the Security of Your Personal Information is Very Important to the Legg Mason Funds
This Privacy and Security Notice (the “Privacy Notice”) addresses the Legg Mason Funds’ privacy and data protection practices with respect to nonpublic personal information the Funds receive. The Legg Mason Funds include any funds sold by the Funds’ distributor, Legg Mason Investor Services, LLC, as well as Legg Mason-sponsored closed-end funds. The provisions of this Privacy Notice apply to your information both while you are a shareholder and after you are no longer invested with the Funds.
The Type of Nonpublic Personal Information the Funds Collect About You
The Funds collect and maintain nonpublic personal information about you in connection with your shareholder account. Such information may include, but is not limited to:
| • | | Personal information included on applications or other forms; |
| • | | Account balances, transactions, and mutual fund holdings and positions; |
| • | | Bank account information, legal documents, and identity verification documentation; |
| • | | Online account access user IDs, passwords, security challenge question responses; and |
| • | | Information received from consumer reporting agencies regarding credit history and creditworthiness (such as the amount of an individual’s total debt, payment history, etc.). |
How the Funds Use Nonpublic Personal Information About You
The Funds do not sell or share your nonpublic personal information with third parties or with affiliates for their marketing purposes, or with other financial institutions or affiliates for joint marketing purposes, unless you have authorized the Funds to do so. The Funds do not disclose any nonpublic personal information about you except as may be required to perform transactions or services you have authorized or as permitted or required by law.
The Funds may disclose information about you to:
| • | | Employees, agents, and affiliates on a “need to know” basis to enable the Funds to conduct ordinary business, or to comply with obligations to government regulators; |
| • | | Service providers, including the Funds’ affiliates, who assist the Funds as part of the ordinary course of business (such as printing, mailing services, or processing or servicing your account with us) or otherwise perform services on the Funds’ behalf, including companies that may perform statistical analysis, market research and marketing services solely for the Funds; |
| • | | Permit access to transfer, whether in the United States or countries outside of the United States to such Funds’ employees, agents and affiliates and service providers as required to enable the Funds to conduct ordinary business, or to comply with obligations to government regulators; |
| • | | The Funds’ representatives such as legal counsel, accountants and auditors to enable the Funds to conduct ordinary business, or to comply with obligations to government regulators; |
| • | | Fiduciaries or representatives acting on your behalf, such as an IRA custodian or trustee of a grantor trust. |
|
| NOT PART OF THE ANNUAL REPORT |
Legg Mason Funds Privacy and Security Notice (cont’d)
Except as otherwise permitted by applicable law, companies acting on the Funds’ behalf, including those outside the United States, are contractually obligated to keep nonpublic personal information the Funds provide to them confidential and to use the information the Funds share only to provide the services the Funds ask them to perform. The Funds may disclose nonpublic personal information about you when necessary to enforce their rights or protect against fraud, or as permitted or required by applicable law, such as in connection with a law enforcement or regulatory request, subpoena, or similar legal process. In the event of a corporate action or in the event a Fund service provider changes, the Funds may be required to disclose your nonpublic personal information to third parties. While it is the Funds’ practice to obtain protections for disclosed information in these types of transactions, the Funds cannot guarantee their privacy policy will remain unchanged.
Keeping You Informed of the Funds’ Privacy and Security Practices
The Funds will notify you annually of their privacy policy as required by federal law. While the Funds reserve the right to modify this policy at any time they will notify you promptly if this privacy policy changes.
The Funds’ Security Practices
The Funds maintain appropriate physical, electronic and procedural safeguards designed to guard your nonpublic personal information. The Funds’ internal data security policies restrict access to your nonpublic personal information to authorized employees, who may use your nonpublic personal information for Fund business purposes only.
Although the Funds strive to protect your nonpublic personal information, they cannot ensure or warrant the security of any information you provide or transmit to them, and you do so at your own risk. In the event of a breach of the confidentiality or security of your nonpublic personal information, the Funds will attempt to notify you as necessary, so you can take appropriate protective steps. If you have consented to the Funds using electronic communications or electronic delivery of statements, they may notify you under such circumstances using the most current email address you have on record with them.
In order for the Funds to provide effective service to you, keeping your account information accurate is very important. If you believe that your account information is incomplete, not accurate or not current, if you have questions about the Funds’ privacy practices, or our use of your nonpublic personal information, write the Funds using the contact information on your account statements, email the Funds by clicking on the Contact Us section of the Funds’ website at www.leggmason.com, or contact the Fund at 1-877-721-1926.
Revised April 2018
Legg Mason California Consumer Privacy Act Policy
Although much of the personal information we collect is “nonpublic personal information” subject to federal law, residents of California may, in certain circumstances, have additional rights under the California Consumer Privacy Act (“CCPA”). For example, if you are a broker,
|
| NOT PART OF THE ANNUAL REPORT |
Legg Mason Funds Privacy and Security Notice (cont’d)
dealer, agent, fiduciary, or representative acting by or on behalf of, or for, the account of any other person(s) or household, or a financial advisor, or if you have otherwise provided personal information to us separate from the relationship we have with personal investors, the provisions of this Privacy Policy apply to your personal information (as defined by the CCPA).
| • | | In addition to the provisions of the Legg Mason Funds Security and Privacy Notice, you may have the right to know the categories and specific pieces of personal information we have collected about you. |
| • | | You also have the right to request the deletion of the personal information collected or maintained by the Funds. |
If you wish to exercise any of the rights you have in respect of your personal information, you should advise the Funds by contacting them as set forth below. The rights noted above are subject to our other legal and regulatory obligations and any exemptions under the CCPA. You may designate an authorized agent to make a rights request on your behalf, subject to the identification process described below. We do not discriminate based on requests for information related to our use of your personal information, and you have the right not to receive discriminatory treatment related to the exercise of your privacy rights.
We may request information from you in order to verify your identity or authority in making such a request. If you have appointed an authorized agent to make a request on your behalf, or you are an authorized agent making such a request (such as a power of attorney or other written permission), this process may include providing a password/passcode, a copy of government issued identification, affidavit or other applicable documentation, i.e. written permission. We may require you to verify your identity directly even when using an authorized agent, unless a power of attorney has been provided. We reserve the right to deny a request submitted by an agent if suitable and appropriate proof is not provided.
For the 12-month period prior to the date of this Privacy Policy, the Legg Mason Funds have not sold any of your personal information; nor do we have any plans to do so in the future.
Contact Information
Address: Data Privacy Officer, 100 International Dr., Baltimore, MD 21202
Email: DataProtectionOfficer@franklintempleton.com
Phone: 1-800-396-4748
Revised October 2020
|
| NOT PART OF THE ANNUAL REPORT |
Western Asset Management Company, LLC
Legg Mason, Inc. Subsidiaries
www.leggmason.com
© 2021 Legg Mason Investor Services, LLC Member FINRA, SIPC
WASX013141 7/21 SR21-4196
The registrant has adopted a code of ethics that applies to the registrant’s principal executive officer, principal financial officer, principal accounting officer or controller.
| ITEM 3. | AUDIT COMMITTEE FINANCIAL EXPERT. |
The Board of Directors of the registrant has determined that Mr. Robert Abeles, Jr., possesses the technical attributes identified in Instruction 2(b) of Item 3 to Form N-CSR to qualify as “audit committee financial expert,” and have designated Mr. Abeles as the Audit Committee’s financial expert. Mr. Abeles is an “independent” Director pursuant to paragraph (a) (2) of Item 3 to Form N-CSR.
| ITEM 4. | PRINCIPAL ACCOUNTANT FEES AND SERVICES |
a) Audit Fees. The aggregate fees billed in the last two fiscal years ending May 31, 2020 and May 31, 2021 (the “Reporting Periods”) for professional services rendered by the Registrant’s principal accountant (the “Auditor”) for the audit of the Registrant’s annual financial statements, or services that are normally provided by the Auditor in connection with the statutory and regulatory filings or engagements for the Reporting Periods, were $173,112 in May 31, 2020 and in $169,204 in May 31, 2021.
b) Audit-Related Fees. The aggregate fees billed in the Reporting Period for assurance and related services by the Auditor that are reasonably related to the performance of the Registrant’s financial statements were $0 in May 31, 2020 and $0 in May 31, 2021.
(c) Tax Fees. The aggregate fees billed in the Reporting Periods for professional services rendered by the Auditor for tax compliance, tax advice and tax planning (“Tax Services”) were $0 in May 31, 2020 and $0 in May 31, 2021. These services consisted of (i) review or preparation of U.S. federal, state, local and excise tax returns; (ii) U.S. federal, state and local tax planning, advice and assistance regarding statutory, regulatory or administrative developments, and (iii) tax advice regarding tax qualification matters and/or treatment of various financial instruments held or proposed to be acquired or held.
There were no fees billed for tax services by the Auditors to service affiliates during the Reporting Periods that required pre-approval by the Audit Committee.
d) All Other Fees. The aggregate other fees billed in the Reporting Periods for products and services provided by the Auditor were $0 in May 31, 2020 and $0 in May 31, 2021, other than the services reported in paragraphs (a) through (c) for the Item for the Western Asset Funds, Inc.
All Other Fees. There were no other non-audit services rendered by the Auditor to Legg Mason Partners Fund Advisors, LLC (“LMPFA”), and any entity controlling, controlled by or under common control with LMPFA that provided ongoing services to Western Asset Funds, Inc. requiring pre-approval by the Audit Committee in the Reporting Period.
(e) Audit Committee’s pre–approval policies and procedures described in paragraph (c)(7) of Rule 2-01 of Regulation S-X.
(1) The Charter for the Audit Committee (the “Committee”) of the Board of each registered investment company (the “Fund”) advised by LMPFA or one of their affiliates (each, an “Adviser”) requires that the Committee shall approve (a) all audit and permissible non-audit services to be provided to the Fund and (b) all permissible non-audit services to be provided by the Fund’s independent auditors to the Adviser and any Covered Service Providers if the engagement relates directly to the operations and financial reporting of the Fund. The Committee may implement policies and procedures by which such services are approved other than by the full Committee.
The Committee shall not approve non-audit services that the Committee believes may impair the independence of the auditors. As of the date of the approval of this Audit Committee Charter, permissible non-audit services include any professional services (including tax services), that are not prohibited services as described below, provided to the Fund by the independent auditors, other than
those provided to the Fund in connection with an audit or a review of the financial statements of the Fund. Permissible non-audit services may not include: (i) bookkeeping or other services related to the accounting records or financial statements of the Fund; (ii) financial information systems design and implementation; (iii) appraisal or valuation services, fairness opinions or contribution-in-kind reports; (iv) actuarial services; (v) internal audit outsourcing services; (vi) management functions or human resources; (vii) broker or dealer, investment adviser or investment banking services; (viii) legal services and expert services unrelated to the audit; and (ix) any other service the Public Company Accounting Oversight Board determines, by regulation, is impermissible.
Pre-approval by the Committee of any permissible non-audit services is not required so long as: (i) the aggregate amount of all such permissible non-audit services provided to the Fund, the Adviser and any service providers controlling, controlled by or under common control with the Adviser that provide ongoing services to the Fund (“Covered Service Providers”) constitutes not more than 5% of the total amount of revenues paid to the independent auditors during the fiscal year in which the permissible non-audit services are provided to (a) the Fund, (b) the Adviser and (c) any entity controlling, controlled by or under common control with the Adviser that provides ongoing services to the Fund during the fiscal year in which the services are provided that would have to be approved by the Committee; (ii) the permissible non-audit services were not recognized by the Fund at the time of the engagement to be non-audit services; and (iii) such services are promptly brought to the attention of the Committee and approved by the Committee (or its delegate(s)) prior to the completion of the audit.
(2) For the Western Asset Funds, Inc., the percentage of fees that were approved by the audit committee, with respect to: Audit-Related Fees were 100% and 100% for May 31, 2020 and May 31, 2021; Tax Fees were 100% and 100% for May 31, 2020 and May 31, 2021; and Other Fees were 100% and 100% for May 31, 2020 and May 31, 2021.
(f) N/A
(g) Non-audit fees billed by the Auditor for services rendered to Western Asset Funds, Inc., LMPFA and any entity controlling, controlled by, or under common control with LMPFA that provides ongoing services to Western Asset Funds, Inc. during the reporting period were $457,301 in May 31, 2020 and $773,011 in May 31, 2021.
(h) Yes. Western Asset Funds, Inc.’s Audit Committee has considered whether the provision of non-audit services that were rendered to Service Affiliates, which were not pre-approved (not requiring pre-approval), is compatible with maintaining the Accountant’s independence. All services provided by the Auditor to the Western Asset Funds, Inc. or to Service Affiliates, which were required to be pre-approved, were pre-approved as required.
| ITEM 5. | AUDIT COMMITTEE OF LISTED REGISTRANTS. |
| | a) | The independent board members are acting as the registrant’s audit committee as specified in Section 3(a)(58)(B) of the Exchange Act. The Audit Committee consists of the following Board members: |
Robert Abeles, Jr.
Jane F. Dasher
Anita L. DeFrantz
Susan B. Kerley
Michael Larson
Ronald L. Olson
Avedick B. Poladian
William E.B. Siart
Jaynie M. Studenmund
Peter J. Taylor
Jane Trust
| ITEM 6. | SCHEDULE OF INVESTMENTS. |
Included herein under Item 1.
| ITEM 7. | DISCLOSURE OF PROXY VOTING POLICIES AND PROCEDURES FOR CLOSED-END MANAGEMENT INVESTMENT COMPANIES. |
Not applicable.
| ITEM 8. | PORTFOLIO MANAGERS OF CLOSED-END MANAGEMENT INVESTMENT COMPANIES. |
Not applicable.
| ITEM 9. | PURCHASES OF EQUITY SECURITIES BY CLOSED-END MANAGEMENT INVESTMENT COMPANY AND AFFILIATED PURCHASERS. |
Not applicable.
| ITEM 10. | SUBMISSION OF MATTERS TO A VOTE OF SECURITY HOLDERS. |
Not applicable.
| ITEM 11. | CONTROLS AND PROCEDURES. |
| | (a) | The registrant’s principal executive officer and principal financial officer have concluded that the registrant’s disclosure controls and procedures (as defined in Rule 30a- 3(c) under the Investment Company Act of 1940, as amended (the “1940 Act”)) are effective as of a date within 90 days of the filing date of this report that includes the disclosure required by this paragraph, based on their evaluation of the disclosure controls and procedures required by Rule 30a-3(b) under the 1940 Act and 15d-15(b) under the Securities Exchange Act of 1934. |
| | (b) | There were no changes in the registrant’s internal control over financial reporting (as defined in Rule 30a-3(d) under the 1940 Act) that occurred during the second fiscal quarter of the period covered by this report that have materially affected, or are likely to materially affect the registrant’s internal control over financial reporting. |
| ITEM 12. | DISCLOSURE OF SECURITIES LENDING ACTIVITIES FOR CLOSED-END MANAGEMENT INVESTMENT COMPANIES. |
Not applicable.
(a) (1) Code of Ethics attached hereto.
Exhibit 99.CODE ETH
(a) (2) Certifications pursuant to section 302 of the Sarbanes-Oxley Act of 2002 attached hereto.
Exhibit 99.CERT
(b) Certifications pursuant to Section 906 of the Sarbanes-Oxley Act of 2002 attached hereto.
Exhibit 99.906CERT
SIGNATURES
Pursuant to the requirements of the Securities Exchange Act of 1934 and the Investment Company Act of 1940, the registrant has duly caused this Report to be signed on its behalf by the undersigned, there unto duly authorized.
| | |
| Western Asset Funds, Inc. |
| |
| By: | | /s/ Jane Trust Jane Trust |
| | Chief Executive Officer |
Date: July 22, 2021
Pursuant to the requirements of the Securities Exchange Act of 1934 and the Investment Company Act of 1940, this report has been signed below by the following persons on behalf of the registrant and in the capacities and on the dates indicated.
| | |
| By: | | /s/ Jane Trust |
| | Jane Trust |
| | Chief Executive Officer |
Date: July 22, 2021
| | |
| By: | | /s/ Christopher Berarducci |
| | Christopher Berarducci |
| | Principal Financial Officer |
Date: July 22, 2021