UNITED STATES
SECURITIES AND EXCHANGE COMMISSION
Washington, D.C. 20549
FORM N-CSR
CERTIFIED SHAREHOLDER REPORT OF REGISTERED
MANAGEMENT INVESTMENT COMPANIES
Investment Company Act file number 811-06111
The Mexico Equity and Income Fund, Inc.
(Exact name of registrant as specified in charter)
615 E. Michigan Street
Milwaukee, WI 53202
(Address of principal executive offices) (Zip code)
Mr. Arnulfo Rodriguez
c/o U.S. Bancorp Fund Services, LLC
615 E. Michigan Street
Milwaukee, WI 53202
(Name and address of agent for service)
(414) 765-4255
Registrant's telephone number, including area code
Date of fiscal year end: July 31, 2018
Date of reporting period: January 31, 2018
Item 1. Reports to Stockholders.
The Mexico Equity
and Income Fund, Inc.
Semi-Annual Report
January 31, 2018
The Mexico Equity and Income Fund, Inc.
Report of Pichardo Asset Management (“PAM”),
The Investment Adviser.
Dear Fund Stockholders,
We are writing our semi-annual letter for The Mexico Equity and Income Fund, Inc. (the “Fund”) for the six-month period ended January 31, 2018, amid an environment of generalized upward revisions to growth projections for advanced and emerging market economies for both 2018 and 2019 on the back of robust global trade flows reflecting a rebound in investment and greater manufacturing production.
While this has translated into moderately higher inflation, inflation expectations remain anchored below central bank target levels. Nevertheless, expectations of stronger U.S. economic growth arising from the recent fiscal reform, which has increased the risk of a faster pace of U.S. interest rate normalization (2.5%-3.0%), could lead to greater volatility in financial markets and tighten financing conditions in emerging markets, according to the Central Bank of Mexico. (“BANXICO”).
In this context, Mexico managed to plot a resilient real annual growth rate of 2.2% in 2017, its fifth consecutive year at or above 2.0%, according to the National Institute of Statistics and Geography (“INEGI”), reflecting the government’s commitment to maintaining prudent and responsible macroeconomic policy and financial stability. (Please see Exhibit 1 in our January 2018 Semi Annual Economy Report located in the Investor Reports section of the Fund’s web page www.mxefund.com).
At the time of this writing, the outlook for the renegotiation of NAFTA has improved. Involved parties have made a number of constructive statements raising expectations that negotiations could be positive for Mexico. The Mexican Peso remains in a range of 18.34-18.90 for the year-to-date period ended March 23, 2018, as shown in the table below. (Source: Bloomberg).
MXN / USD Spot Exchange Rate
Since January 1, 2015 through March 23, 2018.
Source: PAM; Bloomberg.
Our discipline in maintaining a fund portfolio built on independent fundamental analysis and a value and growth investment strategy has enabled us to bring about a significant relative recovery in the Fund’s performance vs. its benchmark at the end of the Fund’s semi-annual period and one year period ended January 31, 2018, compared to the same periods in 2017, as reported in the table below.
MXE’s U.S. Dollar Net Asset Value per Share Return (“NAV”) with Dividends Reinvested
Source: U.S. Bancorp1; Thomson 2; PAM 3; Bloomberg.
Performance calculation assumes the Fund’s dividends and distributions are reinvested at the closing NAV on the dividend ex-date and takes into account dilution resulting from prior stock dividends. The NAV calculation of the Fund’s performance figures may differ from other financial sources, such as Bloomberg. Performance data quoted represents past performance; past performance does not guarantee future results. The investment return and principal value of an investment will fluctuate earnings that an investor’s shares, when sold, may be worth more or less than their original cost. Performance data as of the most recent month end may be obtained by calling U.S. Bancorp Fund Services, LLC, at (414) 765-4255 or by consulting the Fund’s web page: www.mxefund.com.
The Fund registered a 400 basis points positive excess annual average U.S. Dollar return for the 5-year period ended January 31, 2018 relative to the MEXBOL Index. (Please refer to the previous performance table).
The Fund’s portfolio construction by sectors presents a -9% and -20% discount to the Mexbol Index sectors construction in the 12 month forward P/E and EV/EBITDA valuations, in contrast with the relative recovery of the trailing 12 month spread performance of the Fund at the end of the Fund’s semi-annual period ended January 31, 2018. (Please see Exhibits 1, 2, 3 and 4 below).
This is the result of our independent in-depth fundamental analysis, input data hard work and revision of companies’ financial valuation models every quarter with a team of four fundamental analysts.
Exhibit 1.
MXE’s 12-Month Forward Valuation vs. the MEXBOL Index
As of January 31, 2018.
Source: PAM & Bloomberg
Exhibit 2.
Source: PAM & Bloomberg
Exhibit 3.
Source: PAM & Bloomberg
Exhibit 4.
Source: PAM & Bloomberg
We maintain an active investment strategy that is disciplined in seeking attractive valuations among growth companies displaying organic and M&A efficiencies as well as value stocks that trade at a high discount and have good management.
Exhibit 5.
Source: PAM & Bloomberg
We have sought to tactically lower the Fund’s turnover and at the same time deliver Alpha to the Fund’s stockholders when the market presents high stock price swings over short periods of time. (Please see Exhibit 6)
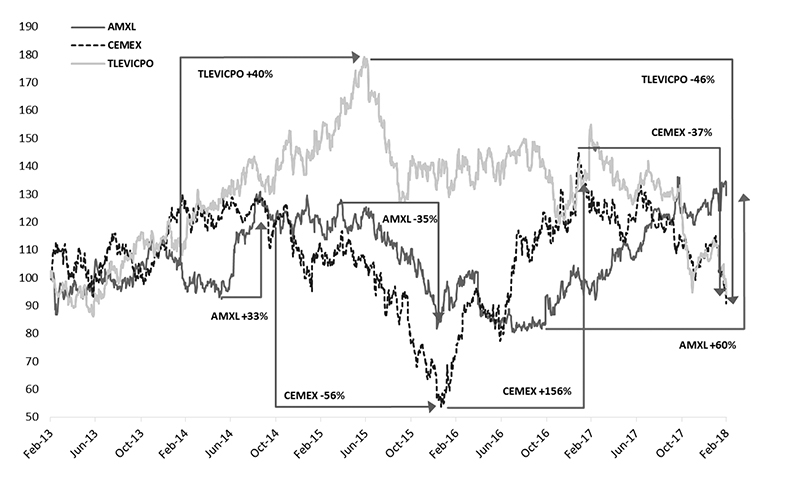
Exhibit 6.
MEXBOL Index Large Cap Constituents Performance
Five Year to February 28, 2018.
Source: PAM; Bloomberg
The graph below shows that the Fund had a 96.73% cumulative turnover rate for the six-month period ended January 31, 2018, compared to 184.26% for the six-month period ended January 31, 2017.
Exhibit 7.
MXE’s Turnover Ratio & Spread Performance vs. MEXBOL Index
Ten Year to Fund’s Fiscal Year ended July 31, 2017.
Source: PAM; Bloomberg
Exhibit 8.
Portfolio’s Total Asset Value Classified by Sector (%)
As of January 31, 2018
Source: PAM; Bloomberg
PAM’s systematic portfolio management process which includes top down macro and bottom up (stock picking) active strategy follows the classification of companies by investment themes. Valuation models and characteristics of companies in each category are ranked and analyze through the buy-and-sell methodology every quarter.
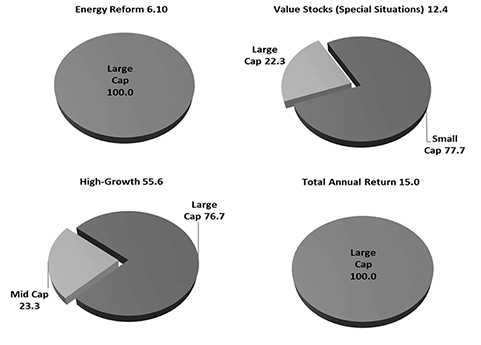
Exhibit 9.
Portfolio’s Total Asset Value Classified by Investment Themes (%)
As of January 31, 2018
Source: PAM; Bloomberg
Exhibit 10.
Investment Themes Classified by Market Capitalization (%)
As of January 31, 2018
Source: PAM; Bloomberg
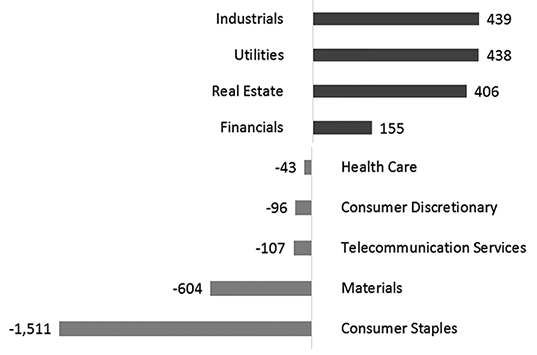
Exhibit 11.
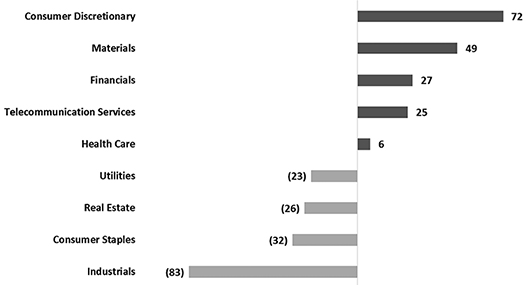
Sector Overweight / Underweight vs. MEXBOL Index in Basis Points
As of January 31, 2018
Source: PAM; Bloomberg
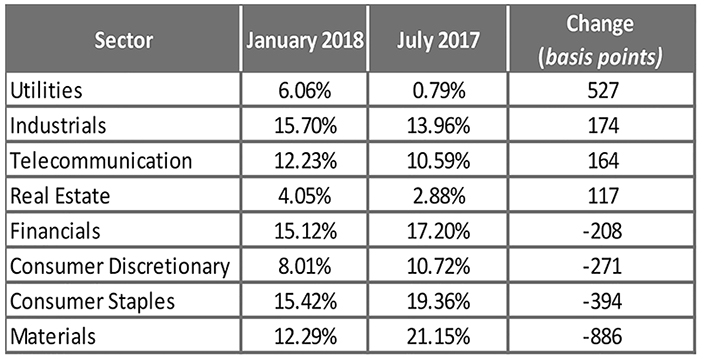
Exhibit 12.
MXE Portfolio’s Sector Changes
Six-Month Period ended January 31, 2018.
The major changes in sectors weights occurred in:
| | • | Energy/Utilities, an increase of approximately 530 basis points due to the solid growth plan of a unique stock opportunity in the energy sector (gas, hydrocarbons, electricity), its diversified business and customer and high dollar revenue component; and |
| | | |
| | • | Materials, a reduction of approximately 900 basis points, mainly as a result of our decision to lower indebted companies with relatively fair valuations due to expectations of a faster pace of FED interest rate normalization. |
Exhibit 13.
MXE’s Contribution by Sectors compared to MEXBOL Index
Six-Month Period ended January 31, 2018.
Source: PAM; Bloomberg
Exhibit 14.
MXE’s Attribution by Sectors vs. MEXBOL Index (Basis Points)
Six-Month Period ended January 31, 2018
Source: PAM; Bloomberg
Indeed, at the time of this writing, volatility is expected to continue for at least 3 months as the largest general elections in Mexican history take place on July 1, 2018: i) president elect will be sworn in on December 1, 2018, ii) a new congress of 500 lower house representatives and 128 senators, will be sworn in on September 1, 2018, iii) 9 state gubernatorial (including the Federal District), iv) approximately 1,600 mayoral, and v) several state and municipal legislative elections.
The Bloomberg weighted pool of polls tracker gives Mr. Andres Manuel Lopez Obrador a close to 42% lead compared to Mr. Jose Antonio Meade close to 25% and Mr. Ricardo Anaya 24%.
We believe that Mexico is a “grown-up” democracy, and although the electoral environment has become more radical, the country’s politicians are, above all, pragmatic, making it unlikely that any new government would attempt to impede economic progress, including a commitment of more than US$ 140 billion in foreign direct investment arising from Energy reform. (Source: Ministry of the Economy). We invite you to read our updated NAFTA and Political Reports located in the Investor Reports section of the Fund’s web page www.mxefund.com.
We continue to enhance our portfolio management service to give certainty to clients and staff regarding the continuity of our 27-year experience through a dedicated young professional Team bound by PAM’s internal code of ethics.
Yours sincerely,
Eugenia Pichardo
Portfolio Manager
March 23, 2018
The information provided herein represents the opinion of Pichardo Asset Management not the Fund’s Board of Directors’ and is not intended to be a forecast of future events, a guarantee of future results, or investment advice.
The Fund’s investment objectives, risks, charges and expenses must be considered carefully before investing. The prospectus contains this and other important information about the investment company, and it may be obtained by calling U.S. Bancorp Fund Services, LLC, (414) 765-4255 or visiting www.themexicoequityandincomefund.com. Read it carefully before investing.
All investments involve risk. Principal loss is possible. Investing internationally involves additional risks such as currency fluctuations, currency devaluations, price volatility, social and economic instability, differing securities regulations and accounting standards, limited publicly available information, changes in taxation, periods of illiquidity and other factors. These risks are greater in the emerging markets. Stocks of small-and-mid-capitalization companies involve greater volatility and less liquidity than larger-capitalization companies.
Investing in Foreign Securities
Investment in Mexican securities involves special considerations and risks that are not normally associated with investments in U.S. securities, including (1) relatively higher price volatility, lower liquidity and the small market capitalization of Mexican securities markets; (2) currency fluctuations and the cost of converting Mexican pesos into U.S. dollars; (3) restrictions on foreign investment; (4) political, economic and social risks and uncertainties (5) higher rates of inflation and interest rates than in the United States.
Diversification does not assure a profit or protect against a loss in a declining market.
The Portfolio Securities are denominated in pesos. As a result, the Portfolio Securities must increase in market value at a rate in excess of the rate of any decline in the value of the peso against the U.S. dollar in order to avoid a decline in their equivalent U.S. dollar value.
The Fund’s holdings and sector allocations are subject to change at any time and should not be considered recommendations to buy or sell any security. Please refer to the Schedule of Investments in this report for a complete list of fund holdings. Current and future portfolio holdings are subject to risk.
The Fund may have a higher turnover rate, which could result in higher transaction costs and higher tax liability, which may affect returns.
Earnings growth is not a measure of the Fund’s future performance.
Definitions
| | • | BANXICO: Banco de Mexico is the central bank of Mexico. By constitutional mandate, it is autonomous in both its operations and management. Its main function is to provide domestic currency to the Mexican economy and its main priority is to ensure the stability of the domestic currency’s purchasing power. |
| | | |
| | • | MEXBOL, or the IPC (Indice de Precios y Cotizaciones), is a capitalization-weighted index of the leading stocks traded on the Mexican Stock Exchange. The index was developed with a base level of 0.78 on October 30th, 1978. |
| | | |
| | • | Basis point (bps) is one hundredth of a percentage point (0.01%). |
| | • | The net asset value per share (“NAV”) is calculated as the total market value of all the securities and other assets held by a fund minus total liabilities divided by the total number of common shares outstanding. The NAV of an investment company will fluctuate due to changes in the market prices of the underlying securities. |
| | | |
| | • | The market price of the common share of a closed-end fund is determined in the open market by buyers and sellers and is the price at which investors may purchase or sell the common shares of a closed-end fund, which fluctuates throughout the day. The common share market price may differ from the Fund’s Net Asset Value; shares of a closed-end fund may trade at a premium to (higher than) or a discount to (lower than) NAV. The difference between the market price and NAV is expressed as a percentage that is either a discount or a premium to NAV. |
| | | |
| | • | References to other funds should not be considered a recommendation to buy or sell any security. |
| | | |
| | • | INEGI: The National Institute of Statistics and Geography. |
| | | |
| | • | Return on Equity (“ROE”): the amount of net income returned as a percentage of shareholder’s equity. Return on equity measures a corporation’s profitability by revealing how much profit a company generates with the money shareholders have invested. |
| | | |
| | • | M&A: Mergers and acquisitions is a general term that refers to the consolidation of companies or assets. M&A can include a number of different transactions, such as mergers, acquisitions, consolidations, tender offers, purchase of assets and management acquisitions. In all cases, two companies are involved. |
| | | |
| | • | Alpha: The excess return of an investment relative to the return of a benchmark index is the investment’s alpha. |
| | | |
| | • | Return on Invested Capital (“ROIC”), a calculation used to assess a company’s efficiency at allocating the capital to profitable investments. Return on invested capital gives a sense of how well a company is using its money to generate returns. |
| | | |
| | • | Free Cash Flow (“FCF”) is a measure of a company’s financial performance, calculated as operating cash flow minus capital expenditures. FCF represents the cash that a company is able to generate after spending the money required to maintain or expand its asset base. FCF is important because it allows a company to pursue opportunities that enhance shareholder value. |
| | | |
| | • | P/E: The price-earnings ratio (P/E ratio) is the ratio for valuing a company that measures its current share price relative to its per-share earnings. The price-earnings ratio is also sometimes known as the price multiple or the earnings multiple. The P/E ratio can be calculated as: Market Value per Share / Earnings per Share. |
| | | |
| | • | EV/EBITDA: Enterprise value/EBITDA is a popular valuation multiple used in the finance industry to measure the value of a company. It is the most widely used valuation multiple based on enterprise value and is often used in conjunction with, or as an alternative to, the P/E ratio(Price/Earnings ratio) to determine the fair market value of a company. |
| | • | EBITDA: EBITDA stands for earnings before interest, taxes, depreciation and amortization. EBITDA is one indicator of a company’s financial performance and is used as a proxy for the earning potential of a business, although doing so can have drawbacks. EBITDA strips out the cost of debt capital and its tax effects by adding back interest and taxes to earnings. |
| | | |
| | • | CAGR: The compound annual growth rate (CAGR) is the mean annual growth rate of an investment over a specified period of time longer than one year. To calculate compound annual growth rate, divide the value of an investment at the end of the period in question by its value at the beginning of that period, raise the result to the power of one divided by the period length, and subtract one from the subsequent result. |
RELEVANT ECONOMIC INFORMATION for the years ended December 31
Real Activity (million US$) | | 2017 | | | 2016 | | | 2015 | | | 2014 | | | 2013 | |
| Real GDP growth (y-o-y) | | 2.00 | % (e) | | 2.36 | % | | 2.46 | % | | 2.25 | % | | 1.36 | % |
| Industrial Production (y-o-y) | | 0.10 | % | | 0.00 | % | | 0.95 | % | | 2.65 | % | | -0.50 | % |
| Trade Balance (US billion) | | -$10.80 | | | -$13.14 | | | -$14.60 | | | -$3.06 | | | -$1.20 | |
| Exports (US billion) | | $409.49 | | | $373.93 | | | $380.62 | | | $396.91 | | | $380.02 | |
| Exports (y-o-y) | | 9.50 | % | | -1.80 | % | | -4.12 | % | | 4.40 | % | | 2.49 | % |
| Imports (US billion) | | $420.37 | | | $387.06 | | | $395.23 | | | $399.98 | | | $381.21 | |
| Imports (y-o-y) | | 8.60 | % | | -2.10 | % | | -1.20 | % | | 4.90 | % | | 2.80 | % |
| | | | | | | | | | | | | | | | |
Financial Variables and Prices | | | | | | | | | | | | | | | |
| 28-Day CETES (T-bills)/Average | | 6.69 | % | | 4.16 | % | | 2.98 | % | | 2.99 | % | | 3.70 | % |
| Exchange rate (Pesos/US$)Average | | 18.91 | | | 18.68 | | | 15.88 | | | 13.31 | | | 12.77 | |
| Inflation IPC, 12 month trailing | | 6.77 | % | | 3.36 | % | | 2.13 | % | | 4.08 | % | | 3.97 | % |
| | | | | | | | | | | | | | | | |
Mexbol Index | | | | | | | | | | | | | | | |
| USD Return | | 15.44 | % | | -9.74 | % | | -13.15 | % | | -9.43 | % | | -1.33 | % |
| Market Cap (US billion) | | $298.87 | | | $252.77 | | | $279.00 | | | $326.32 | | | $356.02 | |
| EV/EBITDA | | 9.27 | x | | 9.57 | x | | 9.93 | x | | 9.92 | x | | 9.91 | x |
| | | | | | | | | | | | | | | | |
| Fund's NAV & Common Share | | | | | | | | | | | | | | | |
Market Price Performance | | | | | | | | | | | | | | | |
| NAV’s per share | | 11.82 | % | | -14.88 | % | | -6.90 | % | | -3.45 | % | | 15.85 | % |
| Share Price | | 12.40 | % | | -14.78 | % | | -10.23 | % | | -4.57 | % | | 19.24 | % |
(e) Estimate
Sources: Banamex, Banco de Mexico, Bloomberg, INEGI
| Allocation of Portfolio Assets | January 31, 2018 (Unaudited) |
(Calculated as a percentage of Total Investments)
| Schedule of Investments | January 31, 2018 (Unaudited) |
| MEXICO – 91.14% | | Shares | | | Value | |
| | | | | | | |
| COMMON STOCKS – 89.03% | | | | | | |
| | | | | | | |
| Airlines – 1.40% | | | | | | |
| Controladora Vuela Compania de Aviacion, S.A.B. de C.V. – Series A (a) | | | 1,547,832 | | | $ | 1,324,806 | |
| | | | | | | | | |
| Auto Parts and Equipment – 1.95% | | | | | | | | |
| Rassini, S.A.B. de C.V. | | | 449,998 | | | | 1,843,102 | |
| | | | | | | | | |
| Beverages – 10.83% | | | | | | | | |
| Arca Continental, S.A.B. de C.V. | | | 522,516 | | | | 3,791,464 | |
| Coca-Cola Femsa, S.A.B. de C.V. – Series L | | | 151,000 | | | | 1,154,178 | |
| Fomento Economico Mexicano, S.A.B. de C.V. – Series UBD | | | 544,852 | | | | 5,313,930 | |
| | | | | | | | 10,259,572 | |
| Building Materials – 2.04% | | | | | | | | |
| Cemex, S.A.B. de C.V. – Series CPO (a) | | | 2,320,449 | | | | 1,929,993 | |
| | | | | | | | | |
| Chemical Products – 3.90% | | | | | | | | |
| Mexichem, S.A.B. de C.V. | | | 1,304,026 | | | | 3,695,910 | |
| | | | | | | | | |
| Construction and Infrastructure – 5.77% | | | | | | | | |
| Promotora y Operadora de Infraestructura, S.A.B. de C.V. | | | 377,872 | | | | 3,873,382 | |
| Promotora y Operadora de Infraestructura, S.A.B. de C.V. – Series L | | | 203,045 | | | | 1,595,297 | |
| | | | | | | | 5,468,679 | |
| Consumer Financing Services – 0.82% | | | | | | | | |
| Credito Real, S.A.B. de C.V. | | | 577,682 | | | | 775,964 | |
| | | | | | | | | |
| Energy – 6.07% | | | | | | | | |
| Infraestructura Energetica Nova, S.A.B. de C.V. | | | 1,102,801 | | | | 5,748,128 | |
| | | | | | | | | |
| Financial Groups – 14.33% | | | | | | | | |
| Banco del Bajio, S.A. (a) | | | 1,015,212 | | | | 2,145,327 | |
| Banregio Grupo Financiero, S.A.B. de C.V. – Series O | | | 559,398 | | | | 3,484,112 | |
| Grupo Financiero Banorte, S.A.B. de C.V. – Series O | | | 1,236,288 | | | | 7,943,117 | |
| | | | | | | | 13,572,556 | |
| Food – 3.70% | | | | | | | | |
| Gruma, S.A.B. de C.V. – Series B | | | 293,457 | | | | 3,505,070 | |
The accompanying notes are an integral part of these financial statements.
| Schedule of Investments (continued) | January 31, 2018 (Unaudited) |
| COMMON STOCKS (continued) | | Shares | | | Value | |
| | | | | | | |
| Holding Companies – 4.58% | | | | | | |
| Alfa, S.A.B. de C.V. – Series A | | | 2,094,044 | | | $ | 2,628,279 | |
| Grupo Carso, S.A.B. de C.V. – Series A – 1 | | | 456,972 | | | | 1,714,282 | |
| | | | | | | | 4,342,561 | |
| Hotels, Restaurants, and Recreation – 2.71% | | | | | | | | |
| Alsea, S.A.B. de C.V. – Series A | | | 368,547 | | | | 1,205,537 | |
| Grupe, S.A.B. de C.V. – Series B (a)(b)(c)(d) | | | 552,928 | | | | 1,366,593 | |
| | | | | | | | 2,572,130 | |
| Mining – 6.37% | | | | | | | | |
| Grupo Mexico, S.A.B. de C.V. – Series B | | | 1,274,491 | | | | 4,518,163 | |
| Industrias Penoles, S.A.B. de C.V. | | | 65,383 | | | | 1,515,331 | |
| | | | | | | | 6,033,494 | |
| Railroads – 3.97% | | | | | | | | |
| GMexico Transportes S.A.B. de C.V. | | | 2,073,500 | | | | 3,761,138 | |
| | | | | | | | | |
| Real Estate Services – 4.06% | | | | | | | | |
| Corporacion Inmobiliaria Vesta, S.A.B. de C.V. | | | 2,791,226 | | | | 3,845,261 | |
| | | | | | | | | |
| Retail – 4.28% | | | | | | | | |
| El Puerto de Liverpool, S.A.B. de C.V. – Series C – 1 | | | 431,134 | | | | 3,191,157 | |
| Wal-Mart de Mexico, S.A.B. de C.V. | | | 344,296 | | | | 862,787 | |
| | | | | | | | 4,053,944 | |
| Telecommunication – 12.25% | | | | | | | | |
| America Movil, S.A.B. de C.V. – Series L | | | 12,385,359 | | | | 11,605,607 | |
| TOTAL COMMON STOCKS (Cost $77,025,819) | | | | | | | 84,337,915 | |
The accompanying notes are an integral part of these financial statements.
| Schedule of Investments (concluded) | January 31, 2018 (Unaudited) |
| CAPITAL DEVELOPMENT CERTIFICATES – 1.79% | | Shares | | | Value | |
| Atlas Discovery Trust II (b)(c)(d) | | | 300,000 | | | $ | 1,693,254 | |
| TOTAL CAPITAL DEVELOPMENT CERTIFICATES (Cost $1,460,703) | | | | | | | 1,693,254 | |
| | | | | | | | | |
| MEXICAN MUTUAL FUNDS – 0.32% | | | | | | | | |
| Scotiabankinverlat – Scotia Gubernamental S.A. de C.V. SIID (a) | | | 1,722,551 | | | | 306,228 | |
| TOTAL MEXICAN MUTUAL FUNDS (Cost $304,979) | | | | | | | 306,228 | |
| TOTAL MEXICO (Cost $78,791,501) | | | | | | | 86,337,397 | |
| | | | | | | | | |
| UNITED STATES – 7.61% | | | | | | | | |
| EXCHANGE TRADED FUNDS – 3.95% | | | | | | | | |
| iShares 1-3 Year Treasury Bond ETF | | | 44,737 | | | | 3,737,749 | |
| TOTAL EXCHANGE TRADED FUNDS (Cost $3,767,990) | | | | | | | 3,737,749 | |
| | | | | | | | | |
| INVESTMENT COMPANIES – 3.66% | | | | | | | | |
| Fidelity Investments Money Market Funds – | | | | | | | | |
| Government Portfolio – Institutional Class – 1.210% (e) | | | 1,500,000 | | | | 1,500,000 | |
| Morgan Stanley Institutional Liquidity Funds – | | | | | | | | |
| Government Portfolio – Institutional Class – 1.208% (e) | | | 1,968,434 | | | | 1,968,434 | |
| TOTAL INVESTMENT COMPANIES (Cost $3,468,434) | | | | | | | 3,468,434 | |
| TOTAL UNITED STATES (Cost $7,236,424) | | | | | | | 7,206,183 | |
| | | | | | | | | |
| Total Investments (Cost $86,027,925) – 98.75% | | | | | | | 93,543,580 | |
| Other Assets in Excess of Liabilities – 1.25% | | | | | | | 1,182,424 | |
| TOTAL NET ASSETS – 100.00% | | | | | | $ | 94,726,004 | |
Percentages are stated as a percent of net assets.
(a) | Non-income producing security. |
(b) | Fair valued securities. The total market value of these securities were $3,059,847, representing 3.23% of net assets. |
(c) | Illiquid securities. The total market value of these securities were $3,059,847, representing 3.23% of net assets. |
(d) | Level 3 securities. Values determined using significant unobservable inputs. |
(e) | The rate shown represents the 7-day yield at January 31, 2018. |
The accompanying notes are an integral part of these financial statements.
| Statement of Assets & Liabilities | January 31, 2018 (Unaudited) |
| ASSETS: | | | |
| Investments, at value (cost $86,027,925) | | $ | 93,543,580 | |
| Receivable for investments sold | | | 1,368,787 | |
| Interest receivable | | | 1,561 | |
| Other assets | | | 24,002 | |
| Total Assets | | | 94,937,930 | |
| | | | | |
| LIABILITIES: | | | | |
| Advisory fees payable | | | 73,879 | |
| Administration fees payable | | | 28,048 | |
| NYSE fees payable | | | 22,934 | |
| Custody fees payable | | | 19,378 | |
| Legal fees payable | | | 19,253 | |
| Audit fees payable | | | 17,753 | |
| Fund accounting fees payable | | | 11,788 | |
| Printing and mailing fees payable | | | 10,300 | |
| Transfer Agent fees and expenses payable | | | 4,172 | |
| CCO fees payable | | | 4,140 | |
| Director fees payable | | | 233 | |
| Accrued expenses and other liabilities | | | 48 | |
| Total Liabilities | | | 211,926 | |
| Net Assets | | $ | 94,726,004 | |
| Net Asset Value Per Common Share ($94,726,004 / 7,343,416) | | $ | 12.90 | |
| | | | | |
| NET ASSETS CONSIST OF: | | | | |
| Common stock, $0.001 par value; 7,343,416 shares outstanding | | | | |
| (98,144,872 shares authorized) | | $ | 7,343 | |
| Paid-in capital | | | 96,903,638 | |
| Accumulated undistributed net investment loss | | | (221,010 | ) |
| Accumulated net realized loss on investments and foreign currency | | | (9,489,209 | ) |
| Net unrealized appreciation on investments and foreign currency | | | 7,525,242 | |
| Net Assets | | $ | 94,726,004 | |
The accompanying notes are an integral part of these financial statements.
| Statement of Operations | For the Six Months Ended January 31, 2018 (Unaudited) |
| INVESTMENT INCOME | | | |
Dividends(1) | | $ | 418,713 | |
| Interest | | | 136,187 | |
| Total Investment Income | | | 554,900 | |
| | | | | |
| EXPENSES | | | | |
| Advisory fees (Note B) | | | 416,143 | |
| Directors’ fees and expenses (Note B) | | | 105,602 | |
| Administration fees (Note B) | | | 59,045 | |
| Custodian fees (Note B) | | | 34,210 | |
| Legal fees | | | 32,473 | |
| CCO fees and expenses (Note B) | | | 26,310 | |
| Fund accounting fees (Note B) | | | 23,613 | |
| Insurance expense | | | 18,216 | |
| Audit fees | | | 17,755 | |
| Printing and mailing fees | | | 15,186 | |
| NYSE fees | | | 13,064 | |
| Transfer agent fees and expenses (Note B) | | | 8,094 | |
| Miscellaneous | | | 5,314 | |
| Total Expenses | | | 775,025 | |
| NET INVESTMENT LOSS | | | (220,125 | ) |
| NET REALIZED AND UNREALIZED GAIN (LOSS) ON INVESTMENTS | | | | |
| Net realized gain from investments and foreign currency transactions | | | 1,241,544 | |
| Net change in unrealized depreciation on investments and foreign currency transactions | | | (6,633,365 | ) |
| Net loss from investments and foreign currency transactions | | | (5,391,821 | ) |
| Net decrease in net assets resulting from operations | | $ | (5,611,946 | ) |
| (1) | Net of $9,491 in dividend withholding tax. |
The accompanying notes are an integral part of these financial statements.
Statements of Changes in Net Assets
| | | For the Six | | | | |
| | | Months Ended | | | For the | |
| | | January 31, 2018 | | | Year Ended | |
| | | (Unaudited) | | | July 31, 2017 | |
| INCREASE (DECREASE) IN NET ASSETS | | | | | | |
| | | | | | | |
| Operations: | | | | | | |
| Net investment income (loss) | | $ | (220,125 | ) | | $ | 637,234 | |
| Net realized gain (loss) on investments and foreign currency transactions | | | 1,241,544 | | | | (1,335,875 | ) |
| Net change in unrealized appreciation (depreciation) in value | | | | | | | | |
| of investments and foreign currency transactions | | | (6,633,365 | ) | | | 10,757,114 | |
| Net increase (decrease) in net assets resulting from operations | | | (5,611,946 | ) | | | 10,058,473 | |
| | | | | | | | | |
| Distributions to Shareholders from: | | | | | | | | |
| Net investment income | | | | | | | | |
| Common stock | | | (352,484 | ) | | | — | |
| Decrease in net assets resulting from distributions | | | (352,484 | ) | | | — | |
| | | | | | | | | |
| Capital Share Transactions: | | | | | | | | |
| Repurchase of common stock | | | (64,615 | ) | | | (882,728 | ) |
| Decrease in net assets from capital share transactions | | | (64,615 | ) | | | (882,728 | ) |
| | | | | | | | | |
| Total increase (decrease) in net assets | | | (6,029,045 | ) | | | 9,175,745 | |
| | | | | | | | | |
| Net Assets: | | | | | | | | |
| Beginning of period | | | 100,755,049 | | | | 91,579,304 | |
| End of period* | | $ | 94,726,004 | | | $ | 100,755,049 | |
| * Including accumulated net investment income (loss) of | | $ | (221,010 | ) | | $ | 351,599 | |
The accompanying notes are an integral part of these financial statements.
Financial Highlights
For a Common Share Outstanding Throughout Each Period
| | | For the Six | | | | | | | | | | | | | | | | |
| | | Months Ended | | | | | | | | | | | | | | | | |
| | | January 31, | | | | | | | | | | | | | | | | |
| | | 2018 | | | For the Year Ended July 31, | |
| | | (Unaudited) | | | 2017 | | | 2016 | | | 2015 | | | 2014 | | | 2013 | |
| Per Share Operating Performance | | | | | | | | | | | | | | | | | | |
| Net asset value, beginning of period | | $ | 13.71 | | | $ | 12.32 | | | $ | 13.79 | | | $ | 17.77 | | | $ | 17.91 | | | $ | 13.78 | |
| Net investment income (loss) | | | (0.03 | ) | | | 0.09 | | | | 0.01 | | | | (0.09 | ) | | | 0.01 | | | | (0.09 | ) |
| Net realized and unrealized gains (losses) on | | | | | | | | | | | | | | | | | | | | | | | | |
| investments and foreign currency transactions | | | (0.73 | ) | | | 1.28 | | | | (0.92 | ) | | | (2.14 | ) | | | 2.10 | | | | 4.35 | |
| Net increase (decrease) from | | | | | | | | | | | | | | | | | | | | | | | | |
| investment operations | | | (0.76 | ) | | | 1.37 | | | | (0.91 | ) | | | (2.23 | ) | | | 2.11 | | | | 4.26 | |
| | | | | | | | | | | | | | | | | | | | | | | | | |
| Less: Distributions | | | | | | | | | | | | | | | | | | | | | | | | |
| Dividends from net investment income | | | (0.05 | ) | | | — | | | | — | | | | (0.01 | ) | | | — | | | | — | |
| Distributions from net realized gains | | | — | | | | — | | | | (0.56 | ) | | | (1.61 | ) | | | (2.13 | ) | | | (0.19 | ) |
| Total dividends and distributions | | | (0.05 | ) | | | — | | | | (0.56 | ) | | | (1.62 | ) | | | (2.13 | ) | | | (0.19 | ) |
| | | | | | | | | | | | | | | | | | | | | | | | | |
| Capital Share Transactions | | | | | | | | | | | | | | | | | | | | | | | | |
| Anti-dilutive effect of | | | | | | | | | | | | | | | | | | | | | | | | |
| Common Share Repurchase Program | | | 0.00 | (3) | | | 0.02 | | | | 0.03 | | | | — | | | | 0.00 | (3) | | | 0.06 | |
| Anti-dilutive effect of | | | | | | | | | | | | | | | | | | | | | | | | |
| Preferred Share Redemption | | | — | | | | — | | | | 0.00 | (3) | | | — | | | | — | | | | — | |
| Dilutive effect of Reinvestment of | | | | | | | | | | | | | | | | | | | | | | | | |
| Distributions to the Fund’s Stockholders | | | — | | | | — | | | | (0.03 | ) | | | (0.13 | ) | | | (0.12 | ) | | | — | |
| Total capital share transactions | | | — | | | | 0.02 | | | | — | | | | (0.13 | ) | | | (0.12 | ) | | | 0.06 | |
| Net Asset Value, end of period | | $ | 12.90 | | | $ | 13.71 | | | $ | 12.32 | | | $ | 13.79 | | | $ | 17.77 | | | $ | 17.91 | |
| | | | | | | | | | | | | | | | | | | | | | | | | |
| Per share market value, end of period | | $ | 11.22 | | | $ | 11.88 | | | $ | 10.78 | | | $ | 12.11 | | | $ | 16.08 | | | $ | 15.84 | |
| Total Investment Return Based on | | | | | | | | | | | | | | | | | | | | | | | | |
Market Value, end of period(1) | | | (5.12 | )% | | | 10.20 | % | | | (6.35 | )% | | | (15.19 | )% | | | 15.93 | % | | | 32.55 | % |
| | | | | | | | | | | | | | | | | | | | | | | | | |
| Ratios/Supplemental Data | | | | | | | | | | | | | | | | | | | | | | | | |
| Net assets, end of period (000’s) | | $ | 94,726 | | | $ | 100,755 | | | $ | 91,579 | | | $ | 102,448 | | | $ | 120,386 | | | $ | 109,337 | |
| Ratios of expenses to average net assets | | | 1.64 | %(2) | | | 1.71 | % | | | 1.89 | % | | | 1.76 | % | | | 1.79 | % | | | 1.62 | % |
| Ratios of net investment income (loss) | | | | | | | | | | | | | | | | | | | | | | | | |
| to average net assets | | | (0.47 | )%(2) | | | 0.72 | % | | | 0.10 | % | | | (0.58 | )% | | | 0.07 | % | | | (0.52 | )% |
| Portfolio turnover rate | | | 96.73 | % | | | 315.95 | % | | | 167.08 | % | | | 175.19 | % | | | 134.98 | % | | | 179.10 | % |
| (1) | Total investment return is calculated assuming a purchase of common stock at the current market price on the first day and a sale at the current market price on the last day of each period reported. Dividends and distributions, if any, are assumed for purposes of this calculation to be reinvested at the closing market price on the dividend ex-date. Total investment does not reflect brokerage commissions. |
| (2) | Annualized. |
| (3) | Less than 0.5 cents per share. |
The accompanying notes are an integral part of these financial statements.
| Notes to Financial Statements | January 31, 2018 (Unaudited) |
NOTE A: ORGANIZATION AND SUMMARY OF SIGNIFICANT ACCOUNTING POLICIES
The Mexico Equity and Income Fund, Inc. (the “Fund”) was incorporated in Maryland on May 24, 1990, and commenced operations on August 21, 1990. The Fund is registered under the Investment Company Act of 1940, as amended, as a closed-end, non-diversified management investment company.
The Fund is an investment company and accordingly follows the investment company accounting and reporting guidance of the Financial Accounting Standards Board (FASB) Accounting Standard Codification Topic 946 “Financial Services—Investment Companies”.
The preparation of financial statements in accordance with accounting principles generally accepted in the United States of America requires management to make estimates and assumptions that affect the reported amounts and disclosures in the financial statements. Actual results could differ from those estimates.
Significant accounting policies are as follows:
Portfolio Valuation. Investments are stated at value in the accompanying financial statements. Listed equity securities are valued at the closing price on the exchange or market on which the security is primarily traded (the “Primary Market”) at the valuation time. If the security did not trade on the Primary Market, it shall be valued at the closing price on another comparable exchange where it trades at the valuation time. If there are no such closing prices, the security shall be valued at the mean between the most recent highest bid and lowest ask prices at the valuation time. Investments in short-term debt securities having a maturity of 60 days or less are valued at amortized cost if their term to maturity from the date of purchase was less than 60 days, or by amortizing their value on the 61st day prior to maturity if their term to maturity from the date of purchase when acquired by the Fund was more than 60 days. Other assets and securities for which no quotations are readily available will be valued in good faith at fair value using methods determined by the Board of Directors. These methods include, but are not limited to, the fundamental analytical data relating to the investment; the nature and duration of restrictions in the market in which they are traded (including the time needed to dispose of the security, methods of soliciting offers and mechanics of transfer); the evaluation of the forces which influence the market in which these securities may be purchased or sold, including the economic outlook and the condition of the industry in which the issuer participates. The Fund has a Valuation Committee comprised of independent directors which oversees the valuation of portfolio securities.
Investment Transactions and Investment Income. The cost of investments sold is determined by use of the specific identification method for both financial reporting and income tax purposes. Interest income, including the accretion of discount and amortization of premium on investments, is recorded on an accrual basis; dividend income is recorded on the ex-dividend date or, using reasonable diligence, when known to the Fund. The collectibility of income receivable from foreign securities is evaluated periodically, and any resulting allowances for uncollectible amounts are reflected currently in the determination of investment income. There was no allowance for uncollectible amounts at January 31, 2018.
| Notes to Financial Statements (continued) | January 31, 2018 (Unaudited) |
Tax Status. No provision is made for U.S. Federal income or excise taxes as it is the Fund’s intention to continue to qualify as a regulated investment company and to make the requisite distributions to its shareholders that will be sufficient to relieve it from all or substantially all U.S. Federal income and excise taxes.
The Fund is subject to the following withholding taxes on income from Mexican sources:
| | Interest income on debt issued by the Mexican federal government is generally not subject to withholding. Withholding tax on interest from other debt obligations such as publicly traded bonds and loans by banks or insurance companies is at a rate of 4.9% under the tax treaty between Mexico and the United States. |
| | |
| | Gains realized from the sale or disposition of debt securities may be subject to a 4.9% withholding tax. Gains realized by the Fund from the sale or disposition of equity securities that are listed and traded on the Mexican Stock Exchange (“MSE”) are exempt from Mexican withholding tax if sold through the stock exchange. Gains realized on transactions outside of the MSE may be subject to withholding at a rate of 25% (20% rate prior to January 1, 2002) of the value of the shares sold or, upon the election of the Fund, at 35% (40% rate prior to January 1, 2002) of the gain. If the Fund has owned less than 25% of the outstanding stock of the issuer of the equity securities within the 12 month period preceding the disposition, then such disposition will not be subject to capital gains taxes as provided for in the treaty to avoid double taxation between Mexico and the United States. |
Summary of Fair Value Exposure at January 31, 2018. The Fund follows the FASB ASC Topic 820 hierarchy, under which various inputs are used in determining the value of the Fund’s investments.
The basis of the hierarchy is dependent upon various “inputs” used to determine the value of the Fund’s investments. These inputs are summarized in the three broad levels listed below:
| Level 1 – | Unadjusted quoted prices in active markets for identical assets or liabilities that the company has the ability to access. |
| | |
| Level 2 – | Observable inputs other than quoted prices included in Level 1 that are observable for the asset or liability, either directly or indirectly. These inputs may include quoted prices for the identical instrument on an inactive market, prices for similar instruments, interest rates, prepayment speeds, credit risk, yield curves, default rates and similar data. |
| | |
| Level 3 – | Unobservable inputs for the asset or liability, to the extent relevant observable inputs are not available, representing the company’s own assumptions about the assumptions a market participant would use in valuing the asset or liability, and would be based on the best information available. |
The availability of observable inputs can vary from security to security and is affected by a wide variety of factors, including, for example, the type of security, whether the security is new and not yet established in the marketplace, the liquidity of markets, and other characteristics particular to the security. To the extent that valuation is based on models or inputs that are less observable or unobservable in the market, the
| Notes to Financial Statements (continued) | January 31, 2018 (Unaudited) |
determination of fair value requires more judgment. Accordingly, the degree of judgment exercised in determining fair value is greatest for instruments categorized in Level 3.
The inputs used to measure fair value may fall into different levels of the fair value hierarchy. In such cases, for disclosure purposes, the level in the fair value hierarchy within which the fair value measurement falls in its entirety, is determined based on the lowest level input that is significant to the fair value measurement in its entirety.
The inputs or methodology used for valuing securities are not necessarily an indication of the risk associated with investing in those securities. The following is a summary of the inputs used to value the Fund’s investments carried at fair value as of January 31, 2018:
| | | Level 1* | | | Level 2* | | | Level 3** | | | Total | |
| Equity | | | | | | | | | | | | |
| Airlines | | $ | 1,324,806 | | | $ | — | | | $ | — | | | $ | 1,324,806 | |
| Auto Parts and Equipment | | | 1,843,102 | | | | — | | | | — | | | | 1,843,102 | |
| Beverages | | | 10,259,572 | | | | — | | | | — | | | | 10,259,572 | |
| Building Materials | | | 1,929,993 | | | | — | | | | — | | | | 1,929,993 | |
| Capital Development Certificates | | | — | | | | — | | | | 1,693,254 | | | | 1,693,254 | |
| Chemical Products | | | 3,695,910 | | | | — | | | | — | | | | 3,695,910 | |
| Construction and Infrastructure | | | 5,468,679 | | | | — | | | | — | | | | 5,468,679 | |
| Consumer Financing Services | | | 775,964 | | | | — | | | | — | | | | 775,964 | |
| Energy | | | 5,748,128 | | | | — | | | | — | | | | 5,748,128 | |
| Financial Groups | | | 13,572,556 | | | | — | | | | — | | | | 13,572,556 | |
| Food | | | 3,505,070 | | | | — | | | | — | | | | 3,505,070 | |
| Holding Companies | | | 4,342,561 | | | | — | | | | — | | | | 4,342,561 | |
| Hotels, Restaurants, and Recreation | | | 1,205,537 | | | | — | | | | 1,366,593 | | | | 2,572,130 | |
| Mining | | | 6,033,494 | | | | — | | | | — | | | | 6,033,494 | |
| Railroads | | | 3,761,138 | | | | — | | | | — | | | | 3,761,138 | |
| Real Estate Services | | | 3,845,261 | | | | — | | | | — | | | | 3,845,261 | |
| Retail | | | 4,053,944 | | | | — | | | | — | | | | 4,053,944 | |
| Telecommunication | | | 11,605,607 | | | | — | | | | — | | | | 11,605,607 | |
| Total Equity | | $ | 82,971,322 | | | $ | — | | | $ | 3,059,847 | | | $ | 86,031,169 | |
| Mexican Mutual Funds | | $ | 306,228 | | | $ | — | | | $ | — | | | $ | 306,228 | |
| Exchange Traded Funds | | $ | 3,737,749 | | | $ | — | | | $ | — | | | $ | 3,737,749 | |
| Short-Term Investments | | $ | 3,468,434 | | | $ | — | | | $ | — | | | $ | 3,468,434 | |
| Total Investments in Securities | | $ | 90,483,733 | | | $ | — | | | $ | 3,059,847 | | | $ | 93,543,580 | |
| * | | Transfers between Levels are recognized at the end of the reporting period. |
| ** | | The Fund measures Level 3 activity as of the beginning and end of each financial reporting period. |
| Notes to Financial Statements (continued) | January 31, 2018 (Unaudited) |
Transfers between Level 2 and Level 3 securities as of January 31, 2018 resulted from securities priced previously at the mean between the most recent bid and asked prices (Level 2 securities) to a price provided by the Adviser (Level 3 securities). Transfers as of January 31, 2018 are summarized in the table below:
| Transfers into Level 2 | | $ | — | |
| Transfers out of Level 2 | | | (1,366,593 | ) |
| Net transfers in and/or out of Level 2 | | $ | (1,366,593 | ) |
| | | | | |
| Transfers into Level 3 | | $ | 1,366,593 | |
| Transfers out of Level 3 | | | — | |
| Net transfers in and/or out of Level 3 | | $ | 1,366,593 | |
Level 3 Reconciliation Disclosure
The following is a reconciliation of Level 3 assets for which significant unobservable inputs were used to determine fair value:
| | | | | | | | | | | | | | | | | | Change | | | | |
| | | | | | | | | | | | | | | | | | in | | | | |
| | | Balance | | | | | | | | | Return | | | Realized | | | unrealized | | | Balance | |
| | | as of | | | | | | | | | of | | | Gain | | | appreciation | | | as of | |
| Category | | 7/31/2017 | | | Acquisitions | | | Dispositions | | | Capital | | | (Loss) | | | (depreciation)(1) | | | 1/31/2018 | |
| Common | | | | | | | | | | | | | | | | | | | | | |
| Stock | | $ | 1,364,078 | | | $ | — | | | $ | (45,356 | ) | | $ | — | | | $ | 17,438 | | | $ | 30,433 | | | $ | 1,366,593 | |
| Capital | | | | | | | | | | | | | | | | | | | | | | | | | | | | |
| Development | | | | | | | | | | | | | | | | | | | | | | | | | | | | |
| Certificates | | | 2,277,007 | | | | — | | | | — | | | | — | | | | — | | | | (583,753 | ) | | | 1,693,254 | |
| | | $ | 3,641,085 | | | $ | — | | | $ | (45,356 | ) | | $ | — | | | $ | 17,438 | | | $ | (553,320 | ) | | $ | 3,059,847 | |
| (1) | Included in the net unrealized appreciation on investments and foreign currency on the Statement of Assets & Liabilities. |
| Notes to Financial Statements (continued) | January 31, 2018 (Unaudited) |
The following table presents additional information about valuation methodologies and inputs used for investments that are measured at fair value and categorized within Level 3 as of January 31, 2018:
| | | | | Impact to |
| | | | | Valuation from |
| | Fair Value | Valuation | Unobservable | an Increase in |
| | January 31, 2018 | Methodologies | Input(1) | Input(2) |
| Common Stock | $1,366,593 | Market | Liquidity | Decrease |
| | | Comparables | Discount | |
| | | | | |
| Capital Development Certificates | $1,693,254 | Market | Liquidity | Decrease |
| | | Comparables/ | Discount | |
| | | Sum of the Parts | | |
| | | Valuation | | |
| (1) | In determining these inputs, management evaluates a variety of factors including economic conditions, foreign exchange rates, industry and market developments, market valuations of comparable companies and company specific developments. |
| (2) | This column represents the directional change in the fair value of the Level 3 investment that would result from increases to the corresponding unobservable input. A decrease to the unobservable input would have the opposite effect. |
Disclosures about Derivative Instruments and Hedging Activities
The Fund did not invest in derivative securities or engage in hedging activities during the period ended January 31, 2018.
Federal Income Taxes. The Fund intends to comply with the requirements of the Internal Revenue Code necessary to qualify as a regulated investment company and to make the requisite distributions of income and capital gains to its shareholders sufficient to relieve it from all or substantially all federal income taxes. Therefore, no federal income tax provision is required. Accounting principles generally accepted in the United States of America require that permanent differences between financial reporting and tax reporting be reclassified between various components of net assets.
The Fund recognizes the tax benefits of uncertain tax positions only where the position is “more-likely-than-not” to be sustained assuming examination by tax authorities. The Adviser has analyzed the Fund’s tax positions, and has concluded that no liability for unrecognized tax benefits should be recorded related to uncertain tax positions taken on returns filed for open tax years (2014-2016), or expected to be taken in the Fund’s 2017 tax returns. The Fund identifies its major tax jurisdictions as U.S. Federal, New York State and foreign jurisdictions where the Fund makes significant investments; however, the Fund is not aware of any tax positions for which it is reasonably possible that the total amounts of unrecognized tax benefits will change materially in the next twelve months.
| Notes to Financial Statements (continued) | January 31, 2018 (Unaudited) |
Reclassification of Capital Accounts. Accounting Principles generally accepted in the United States of America require certain components of net assets relating to permanent differences be reclassified between financial and tax reporting. These reclassifications have no effect on net assets or net asset value per share. The permanent differences are primarily attributed to foreign currency gain reclassifications. For the year ended July 31, 2017, the following reclassifications were made for permanent tax differences on the Statement of Assets and Liabilities.
| Accumulated Undistributed Net Investment Income | | | $(92,087 | ) |
| Accumulated Net Realized Loss | | | 92,087 | |
| Paid-in Capital | | | — | |
Foreign Currency Translation. The books and records of the Fund are maintained in U.S. dollars. Foreign currency amounts are translated into U.S. dollars on the following basis:
| | (i) | market value of investment securities, assets and liabilities at the current Mexican peso exchange rate on the valuation date, and |
| | | |
| | (ii) | purchases and sales of investment securities, income and expenses at the Mexican peso exchange rate prevailing on the respective dates of such transactions. Fluctuations in foreign currency rates, however, when determining the gain or loss upon the sale of foreign currency denominated debt obligations pursuant to U.S. Federal income tax regulations; such amounts are categorized as foreign exchange gain or loss for income tax reporting purposes. |
The Fund reports realized foreign exchange gains and losses on all other foreign currency related transactions as components of realized gains and losses for financial reporting purposes, whereas such gains and losses are treated as ordinary income or loss for Federal income tax purposes.
Securities denominated in currencies other than U.S. dollars are subject to changes in value due to fluctuations in the foreign exchange rate. Foreign security and currency transactions may involve certain considerations and risks not typically associated with those of domestic origin as a result of, among other factors, the level of governmental supervision and regulation of foreign securities markets and the possibilities of political or economic instability.
Distribution of Income and Gains. The Fund intends to distribute to shareholders, at least annually, substantially all of its net investment income, including foreign currency gains. The Fund also intends to distribute annually any net realized capital gains in excess of net realized capital losses (including any capital loss carryovers), except in circumstances where the Directors of the Fund determine that the decrease in the size of the Fund’s assets resulting from the distribution of the gains would generally not be in the interest of the Fund’s shareholders. An additional distribution may be made to the extent necessary to avoid payment of a 4% U.S. Federal excise tax.
| Notes to Financial Statements (continued) | January 31, 2018 (Unaudited) |
Distributions to shareholders are recorded on the ex-dividend date. The amount of dividends and distributions from net investment income and net realized gains are determined in accordance with U.S. Federal income tax regulations, which may differ from accounting principles generally accepted in the United States of America. These “book/tax” differences are either considered temporary or permanent in nature. To the extent these differences are permanent in nature, such amounts are reclassified within the capital accounts based on their Federal tax-basis treatment; temporary differences do not require reclassification. To the extent they exceed net investment income and net realized gains for tax purposes, they are reported as distributions from additional paid-in capital.
Distributions to Shareholders. The tax character of distributions paid to shareholders during the periods ended July 31, 2017 and July 31, 2016 were as follows:
Distributions paid from: | | 7/31/17 | | | 7/31/16 | |
| Ordinary Income | | $ | — | | | $ | — | |
| Long-Term Capital Gain | | | — | | | | 4,187,372 | |
| Total | | $ | — | | | $ | 4,187,372 | |
As of July 31, 2017, the components of distributable earnings on a tax basis were as follows:
| | Cost of Investments for tax purposes(a) | | $ | 92,614,112 | |
| | Gross tax unrealized appreciation on investments | | | 14,678,227 | |
| | Gross tax unrealized depreciation on investments | | | (4,888,089 | ) |
| | Net tax unrealized appreciation on investments | | | 9,790,138 | |
| | Undistributed ordinary income | | | 351,599 | |
| | Undistributed long-term capital gains | | | — | |
| | Total distributable earnings | | | 351,599 | |
| | Other accumulated gains(losses) | | $ | (6,362,284 | ) |
| | Total accumulated earnings(losses) | | $ | 3,779,453 | |
| (a) | Represents cost for federal income tax purposes. Differences between the Fund’s cost basis of investments at July 31, 2017, for book and tax purposes, relates primarily to the deferral of losses related to wash sales. |
At July 31, 2017, the Fund had tax basis capital losses which may be carried forward to offset future short term and long term capital gains indefinitely in the amount of $2,280,517 and $4,079,410, respectively. To the extent that the Fund may realize future net capital gains, those gains will be offset by any of the unused capital loss carryforward.
| Notes to Financial Statements (continued) | January 31, 2018 (Unaudited) |
NOTE B: MANAGEMENT, INVESTMENT ADVISORY AND ADMINISTRATIVE SERVICES
Pichardo Asset Management, S.A. de C.V. serves as the Fund’s Investment Adviser (the “Investment Adviser”) under the terms of the Investment Advisory Agreement (the “Advisory Agreement”) effective July 1, 2003. Pursuant to the Advisory Agreement, the Investment Adviser makes investment decisions for the Fund and supervises the acquisition and disposition of securities by the Fund. For its services, the Investment Adviser is paid a base fee, accrued daily at the annual rate of 1.00%, subject to a performance fee adjustment which increases or decreases the fee depending upon how well the Fund has performed relative to the MSCI Mexico Index (the “Index”) 12 month rolling average. The fee adjustment will be calculated using a monthly adjustment rate that is based upon the Fund’s relative performance to the Index. The performance adjustment rate will be positive (resulting in an upward fee adjustment) for each percentage point, or portion thereof, that the investment performance of the Fund exceeds the investment performance of the Index for the performance period multiplied by three (3) and will be negative (resulting in a downward fee adjustment) for each percentage point, or portion thereof, that the investment performance of the Index exceeds the investment performance of the Fund for the performance period multiplied by three (3). Determinations of the performance adjustment rate (positive or negative) will be made in increments of 0.01% of differential performance. As an example, if the Fund’s performance for the preceding 12 months exceeds the performance of the Index by 1.00%, the performance adjustment rate would be 3 x 0.01, which would result in a monthly fee equal to an annual rate of 1.03%. The performance adjustment rate will be limited to a 0.15% fee adjustment, positive or negative.
For the six months ended January 31, 2018, the Fund’s monthly investment performance ranged from (1.6)% to (6.2)% below the monthly investment performance of the Index. Accordingly, for the six months ended January 31, 2018 the net investment advisor fee consisted of the base fee of $472,077 and a downward performance fee adjustment of $(55,934).
Effective January 1, 2015, the Fund pays each of its directors who is not a director, officer or employee of the Investment Adviser, the Administrator or any affiliate thereof an annual fee of $35,000, paid pro rata, quarterly plus a fee of $500 for each meeting held telephonically. As additional annual compensation, the Chairman of the Fund will receive $5,000, the Audit Committee Chairman and Valuation Committee Chairman will receive $3,000, and the Nomination Committee Chairman will receive $2,000. For serving the Fund as Chief Compliance Officer, in addition to the aforementioned Directors’ fees, Mr. Hellerman receives annual compensation in the amount of $45,000. In addition, the Fund reimburses the directors and Chief Compliance Officer (“CCO”) for travel and out-of-pocket expenses incurred in connection with Board of Directors’ meetings and CCO due diligence requirements.
U.S. Bancorp Fund Services, LLC (“USBFS”), an indirect wholly-owned subsidiary of U.S. Bancorp, serves as the Fund’s Administrator and, in that capacity, performs various administrative services for the Fund. USBFS also serves as the Fund’s Fund Accountant (the “Fund Accountant”) and Transfer Agent.
| Notes to Financial Statements (continued) | January 31, 2018 (Unaudited) |
U.S. Bank, N.A. serves as the Fund’s custodian (the “Custodian”). The Custodian is an affiliate of the Administrator. The Administrator prepares various federal and state regulatory filings, reports and returns for the Fund; prepares reports and materials to be supplied to the directors; monitors the activities of the Fund’s Custodian and Fund Accountant; coordinates the preparation and payment of the Fund’s expenses and reviews the Fund’s expense accruals.
NOTE C: PORTFOLIO ACTIVITY
Purchases and sales of securities other than short-term obligations, aggregated $89,106,511 and $93,449,969 respectively, for the six months ended January 31, 2018.
At January 31, 2018 approximately 91.1% of the Fund’s net assets were invested in Mexican securities. The Mexican securities markets are substantially smaller, less liquid, and more volatile than the major securities markets in the United States. Consequently, acquisitions and dispositions of securities by the Fund may be limited.
NOTE D: CAPITAL STOCK
During the six months ended January 31, 2018, the Fund purchased 6,300 shares of capital stock in the open market at a cost of $64,615. The weighted average discount of these purchases comparing the average purchase price to net asset value at the close of the New York Stock Exchange was 13.77%.
During the year ended July 31, 2017, the Fund purchased 82,941 shares of capital stock in the open market at a cost of $882,728. The weighted average discount of these purchases comparing the average purchase price to net asset value at the close of the New York Stock Exchange was 13.74%.
During the year ended July 31, 2016, the Fund purchased 109,636 shares of capital stock in the open market at a cost of $1,207,197. The weighted average discount of these purchases comparing the average purchase price to net asset value at the close of the New York Stock Exchange was 13.68%.
On December 8, 2015, the Board of Directors declared a stock dividend of $0.56 per share. This dividend was paid in shares of common stock of the Fund, or in cash by specific election of the stockholders. The Fund issued 113,378 shares of common stock to stockholders that did not elect the cash option, which amounted to $1,089,584.
On December 17, 2015 at the Annual Meeting of Stockholders of the Fund, the preferred stockholders, voting as a separate class, and the common and preferred stockholders, voting together as a single class, each approved an amendment to the Fund’s Articles Supplementary authorizing the elimination of the preferred stock. Consequently, the Fund redeemed all 48,535 preferred shares outstanding at 98% of the Fund’s net asset value per common share as of the close of business on Friday, January 8, 2016. Since such net asset
| Notes to Financial Statements (concluded) | January 31, 2018 (Unaudited) |
value was $11.50, the Fund paid each preferred stockholder $11.27 per share on or about February 10, 2016. The total amount of the redemption payment was $546,989. The net asset value per share of the Fund’s stockholders was increased by approximately $0.001 per share as a result of this redemption.
Share Repurchase
Notice is hereby given in accordance with Section 23(c) of the Investment Company Act of 1940 that the Fund may purchase, from time to time, shares of its common stock in the open market.
NOTE E: SUBSEQUENT EVENTS
The Fund announced on January 19, 2018 that it was offering to purchase up to 5% of common shares outstanding of the Fund at 95% of the net asset value (“NAV”) per common share on February 23, 2018. At the expiration of the offer on February 23, 2018, a total of 1,961,143 shares or approximately 26.71% of the Fund’s outstanding common shares were validly tendered. As the total number of shares tendered exceeded the number of shares the Fund offered to purchase pursuant to the Offer, on a pro-rated basis, approximately 18.72% of the Fund’s shares tendered by each tendering shareholder were accepted for payment. There were 367,174 shares accepted for payment at a price of $12.15 per share (95% of the NAV per common share of $12.79) or $4,461,164.
| Additional Information | January 31, 2018 (Unaudited) |
NOTE 1: INFORMATION ABOUT PROXY VOTING
Information regarding how the Fund votes proxies relating to portfolio securities is available without charge upon request by calling toll-free at 1-877-785-0376 and the SEC’s website at www.sec.gov. Information regarding how the Fund voted proxies relating to portfolio securities during the most recent twelve month period ended June 30 is available on the SEC’s website at www.sec.gov or by calling the toll-free number listed above.
NOTE 2: AVAILABILITY OF QUARTERLY PORTFOLIO SCHEDULE
The Fund files its complete schedule of portfolio holdings with the SEC for the first and third quarters of each fiscal year on Form N-Q. The filing will be available, upon request, by calling 1-877-785-0376. Furthermore, you will be able to obtain a copy of the filing on the SEC’s website at http://www.sec.gov beginning with the filing for the period ended October 31, 2004. The Fund’s Forms N-Q may also be reviewed and copied at the SEC’s Public Reference Room in Washington, DC and information on the operation of the Public Reference Room may be obtained by calling 1-800-SEC-0330.
NOTE 3: INFORMATION ABOUT CERTIFICATIONS
In December 2017, the Fund submitted a CEO annual certification to the NYSE in which the Fund’s principal executive officer certified that she was not aware, as of the date of the certification, of any violation by the Fund of the NYSE’s Corporate Governance listing standards. In addition, as required by Section 302 of the Sarbanes-Oxley Act of 2002 and related SEC rules, the Fund’s principal executive and principal financial officers have made quarterly certifications, included in the filing with the SEC on Forms N-CSR and N-Q, relating to, among other things, the Fund’s disclosure controls and procedures and internal control over financial reporting.
NOTE 4: INFORMATION ON FORWARD LOOKING STATEMENTS
Except for historical information contained in this report for the Fund, the matters discussed in this report may constitute forward-looking statements made pursuant to the safe-harbor provisions of the Private Securities Litigation Reform Act of 1995. These include any adviser or portfolio manager predictions, assessments, analyses or outlooks for individual securities, industries, market sectors and/or markets. These statements involve risks and uncertainties. In addition to the general risks described for the Fund in the most recent Prospectus, other factors bearing on this report include the accuracy of the adviser’s or portfolio manager’s data, forecasts and predictions, and the appropriateness of the investment programs designed by the adviser or portfolio manager to implement their strategies efficiently and effectively. Any one or more of these factors, as well as other risks affecting the securities markets and investment instruments generally, could cause the actual results of the Fund to differ materially as compared to benchmarks associated with the Fund.
| Additional Information (concluded) | January 31, 2018 (Unaudited) |
ADDITIONAL INFORMATION APPLICABLE TO FOREIGN SHAREHOLDERS ONLY
The percent of ordinary income distributions designated as interest related dividends for the fiscal year ended July 31, 2017 was 0.00%. (unaudited)
The percentage of taxable ordinary income distributions that are designated as short-term capital gain distributions under Internal Revenue Section 871(k)(2)(C) was 0.00%. (unaudited)
The Fund designates 0.00% of dividends declared for the fiscal year July 31, 2017 from net investment income as qualified dividend income under the Jobs and Growth Tax Relief Reconciliation Act of 2003. (unaudited)
| Dividends and Distributions | January 31, 2018 (Unaudited) |
DIVIDEND REINVESTMENT PLAN
The Fund intends to distribute to shareholders substantially all of its net investment company taxable income at least annually. Investment company taxable income, as defined in section 852 of the Internal Revenue Service Code of 1986, includes all of the Fund’s taxable income minus the excess, if any, of its net realized long-term capital gains over its net realized short-term capital losses (including any capital loss carryovers), plus or minus certain other required adjustments. The Fund also expects to distribute annually substantially all of its net realized long-term capital gains in excess of net realized short-term capital losses (including any capital loss carryovers), except in circumstances where the Fund realizes very large capital gains and where the Directors of the Fund determine that the decrease in the size of the Fund’s assets resulting from the distribution of the gains would not be in the interest of the Fund’s shareholders generally.
Pursuant to the Fund’s Dividend Reinvestment Plan (the “Plan”), each shareholder will be deemed to have elected, unless the Plan Agent (as defined below) is otherwise instructed by the shareholder in writing, to have all distributions, net of any applicable U.S. withholding tax, automatically reinvested in additional shares of the Fund by U.S. Bancorp Fund Services, LLC, the Fund’s transfer agent, as the Plan Agent (the “Plan Agent”). Shareholders who do not participate in the Plan will receive all dividends and distributions in cash, net of any applicable U.S. withholding tax, paid in U.S. dollars by check mailed directly to the shareholder by the Plan Agent, as dividend-paying agent. Shareholders who do not wish to have dividends and distributions automatically reinvested should notify the Plan Agent for The Mexico Equity and Income Fund, Inc., c/o U.S. Bancorp Fund Services, ATTN: Ms. Casey Sauer, 615 East Michigan Street, Milwaukee, WI 53202. Dividends and distributions with respect to shares of the Fund’s Common Stock registered in the name of a broker-dealer or other nominee (i.e., in “street name”) will be reinvested under the Plan unless the service is not provided by the broker or nominee or the shareholder elects to receive dividends and distributions in cash. A shareholder whose shares are held by a broker or nominee that does not provide a dividend reinvestment program may be required to have his shares registered in his own name to participate in the Plan. Investors who own shares of the Fund’s Common Stock registered in street name should contact the broker or nominee for details.
The Plan Agent serves as agent for the shareholders in administering the Plan. If the Directors of the Fund declare an income dividend or a capital gains distribution payable in the Fund’s Common Stock, or in cash, as shareholders may have elected, nonparticipants in the Plan will receive cash and participants in the Plan will receive Common Stock to be issued by the Fund. If the market price per share on the valuation date equals or exceeds net asset value per share on that date, the Fund will issue new shares to participants at net asset value; or, if the net asset value is less than 95% of the market price on the valuation date, then such shares will be issued at 95% of the market price.
If net asset value per share on the valuation date exceeds the market price per share on that date, participants in the Plan will receive shares of Common Stock from the Fund valued at market price. The
| Dividends and Distributions (concluded) | January 31, 2018 (Unaudited) |
valuation date is the dividend or distribution payment date or, if that date is not a New York Stock Exchange trading day, the next preceding trading day. If the Fund should declare an income dividend or capital gains distribution payable only in cash, the Plan Agent will, as agent for the participants, buy Fund shares in the open market on the New York Stock Exchange or elsewhere, for the participants’ accounts on, or shortly after, the payment date.
The Plan Agent maintains all shareholder accounts in the Plan and furnishes written confirmations of all transactions in an account, including information needed by shareholders for personal and tax records. Shares in the account of each Plan participant will be held by the Plan Agent in noncertified form in the name of the participant, and each shareholder’s proxy will include those shares purchased pursuant to the Plan.
In the case of shareholders such as banks, brokers or nominees that hold shares for others who are beneficial owners, the Plan Agent will administer the Plan on the basis of the number of shares certified from time to time by the shareholders as representing the total amount registered in the shareholder’s name and held for the account of beneficial owners who participate in the Plan.
There is no charge to participants for reinvesting dividends or capital gains distributions payable in either Common Stock or cash. The Plan Agent’s fees for the handling or reinvestment of such dividends and capital gains distributions will be paid by the Fund. There will be no brokerage charges with respect to shares issued directly by the Fund as a result of dividends or capital gains distributions payable either in stock or in cash. However, each participant will pay a pro rata share of brokerage commissions incurred with respect to the Plan Agent’s open market purchases in connection with the reinvestment of dividends or capital gains distributions payable in cash.
Brokerage charges for purchasing small amounts of Common Stock for individual accounts through the Plan are expected to be less than usual brokerage charges for such transactions because the Plan Agent will be purchasing stock for all participants in blocks and prorating the lower commissions thus attainable. Brokerage commissions will vary based on, among other things, the broker selected to effect a particular purchase and the number of participants on whose behalf such purchase is being made.
The receipt of dividends and distributions in Common Stock under the Plan will not relieve participants of any income tax (including withholding tax) that may be payable on such dividends or distributions.
Experience under the Plan may indicate that changes in the Plan are desirable. Accordingly, the Fund and the Plan Agent reserve the right to terminate the Plan as applied to any dividend or distribution paid subsequent to notice of the termination sent to participants at least 30 days before the record date for such dividend or distribution. The Plan also may be amended by the Fund or the Plan Agent, but (except when necessary or appropriate to comply with applicable law, or rules or policies of a regulatory authority) only upon at least 30 days’ written notice to participants. All correspondence concerning the Plan should be directed to the Plan Agent at the address above.
| Results of Annual | January 31, 2018 (Unaudited) |
| Stockholders Meeting |
The Fund’s Annual Stockholders meeting was held on December 14, 2017, at the offices of U.S. Bancorp Fund Services LLC, 777 E. Wisconsin Avenue, Milwaukee, WI 53202. As of October 12, 2017, the record date, outstanding shares of common stock were 7,349,716. Holders of 6,649,174 common shares of the Fund were present at the meeting either in person or by proxy. These holders, as being holders of a majority of the outstanding shares of the Fund, constituted a quorum. The stockholders voted on one proposal. The stockholders elected one Director to the Board of Directors. The following table provides information concerning the matter voted on at the meeting:
| I. | (A) Election of Directors – Common | | |
| | | Votes For | Votes Withheld |
| | Phillip Goldstein | 6,471,202 | 177,972 |
| Privacy Policy | January 31, 2018 (Unaudited) |
| | FACTS | | WHAT DOES THE MEXICO EQUITY AND INCOME FUND, INC. (THE “FUND”), AND SERVICE PROVIDERS TO THE FUND, ON THE FUND’S BEHALF, DO WITH YOUR PERSONAL INFORMATION? | |
| | Why? | | Financial companies choose how they share your personal information. Federal law gives consumers the right to limit some but not all sharing. Federal law also requires us to tell you how we collect, share, and protect your personal information. Please read this notice carefully to understand what we do. | |
| | What? | | The types of personal information we, and our service providers, on our behalf, collect and share depends on the product or service you have with us. This information can include: | |
| | | | • Social Security number | |
| | | | • account balances | |
| | | | • account transactions | |
| | | | • transaction history | |
| | | | • wire transfer instructions | |
| | | | • checking account information | |
| | | | When you are no longer our customer, we continue to share your information as described in this notice. | |
| | How? | | All financial companies need to share customers' personal information to run their everyday business. In the section below, we list the reasons financial companies can share their customers’ personal information; the reasons the Fund, and our service providers, on our behalf, choose to share; and whether you can limit this sharing. | |
| | Reasons we can share your personal information | Does the Fund share? | Can you limit this sharing? |
| | For our everyday business purposes – | | |
| | such as to process your transactions, maintain your account(s), | | |
| | respond to court orders and legal investigations, or report to | | |
| | credit bureaus | Yes | No |
| | For our marketing purposes – | | |
| | to offer our products and services to you | No | We don’t share |
| | For joint marketing with other financial companies | No | We don’t share |
| | For our affiliates’ everyday business purposes – | | |
| | information about your transactions and experiences | Yes | No |
| | For our affiliates’ everyday business purposes – | | |
| | information about your creditworthiness | No | We don’t share |
| | For our affiliates to market to you | No | We don’t share |
| | For nonaffiliates to market to you | No | We don’t share |
| | Questions? | | Call (877) 785-0376 |
| Privacy Policy (concluded) | January 31, 2018 (Unaudited) |
| | What we do | | | |
| | Who is providing this notice? | | The Mexico Equity and Income Fund, Inc. (the “Fund”) | |
| | How does the Fund, and the | | To protect your personal information from unauthorized access and use, | |
| | Fund’s service providers, on the | | we and our service providers use security measures that comply with | |
| | Fund’s behalf, protect my | | federal law. These measures include computer safeguards and secured | |
| | personal information? | | files and buildings. | |
| | How does the Fund, and the | | We collect your personal information, for example, when you: | |
| | Fund’s service providers, on | | • open an account | |
| | the Fund’s behalf, collect my | | • provide account information | |
| | personal information? | | • give us your contact information | |
| | | | • make a wire transfer | |
| | | | We also collect your information from others, such as credit bureaus, affiliates, or other companies. | |
| | Why can’t I limit all sharing? | | Federal law gives you the right to limit only | |
| | | | • sharing for affiliates’ everyday business purposes – information about your creditworthiness | |
| | | | • affiliates from using your information to market to you | |
| | | | • sharing for nonaffiliates to market to you | |
| | | | State laws and individual companies may give you additional rights to limit sharing. | |
| | Definitions | | | |
| | Affiliates | | Companies related by common ownership or control. They can be financial and nonfinancial companies. | |
| | | | • None | |
| | Nonaffiliates | | Companies not related by common ownership or control. They can be financial and nonfinancial companies. | |
| | | | • The Fund does not share with nonaffiliates so they can market to you. | |
| | Joint marketing | | A formal agreement between nonaffiliated financial companies that together market financial products or services to you. | |
| | | | • The Fund does not jointly market. | |
| Management of the Fund | January 31, 2018 (Unaudited) |
Board of Directors. The management and affairs of the Fund are supervised by the Board of Directors. The Board consists of five individuals, whom are not “interested persons” of the Fund as the term is defined in the Investment Company Act of 1940, as amended (the “1940 Act”). The Directors are fiduciaries for the Fund’s shareholders and are governed by the laws of the State of Maryland in this regard. The Board establishes policies for the operation of the Fund and appoints the officers who conduct the daily business of the Fund. The Directors and Interested Officers of the Fund are listed below with their addresses, present position(s) with the Fund, length of time served, principal occupations over at least the last five years, and any other Directorships held. Please note that the Fund is not part of a fund complex.
| | | | Term of | | |
| | Year | Position(s) | Office/Length | Principal Occupation | Other Directorships |
Name and Address | Born | with the Fund | of Time Served | During the Past Five Years | Held by Director |
| Gerald Hellerman | 1937 | Director, Chief | Since | Managing Director of | Trustee, Crossroads |
| 615 E. Michigan Street | | Compliance | 2016 / 16 years | Hellerman Associates | Liquidating Trust; |
| Milwaukee, WI 53202 | | Officer | | (a financial and corporate | Director, Emergent |
| | | | | consulting firm) since 1993 | Capital, Inc. (until |
| | | | | (which terminated activities | 2017); Director, |
| | | | | as of December 31, 2013). | MVC Capital, Inc.; |
| | | | | | Director, Special |
| | | | | | Opportunities |
| | | | | | Fund, Inc.; Trustee, |
| | | | | | Fiera Capital Series |
| | | | | | Trust; Director, |
| | | | | | Ironsides Partners |
| | | | | | Opportunity |
| | | | | | Offshore Fund Ltd. |
| | | | | | (2012-2016); |
| | | | | | Director, Brantley |
| | | | | | Capital Corporation |
| | | | | | (until 2013). |
| Management of the Fund (continued) | January 31, 2018 (Unaudited) |
| | | | Term of | | |
| | Year | Position(s) | Office/Length | Principal Occupation | Other Directorships |
Name and Address | Born | with the Fund | of Time Served | During the Past Five Years | Held by Director |
| Phillip Goldstein | 1945 | Chairman | Since | Since its inception in 2009, | Trustee, Crossroads |
| Park 80 West, Plaza Two, | | | 2017 / 17 years | Mr. Goldstein has been a | Liquidating Trust; |
| 250 Pehle Avenue, | | | | member of Bulldog Investors, | Director, Brookfield |
| Suite 708 | | | | LLC, the investment advisor | DTLA Fund Office |
| Saddle Brook, NJ 07663 | | | | of Special Opportunities | Trust Investor; |
| | | | | Fund, Inc. and the Bulldog | Chairman, Emergent |
| | | | | Investors group of funds. | Capital, Inc. (until |
| | | | | He also is a member of | 2017); Director, |
| | | | | Kimball & Winthrop, LLC, | MVC Capital, Inc.; |
| | | | | the managing general | Chairman, Special |
| | | | | partner of Bulldog Investors | Opportunities Fund, |
| | | | | General Partnership, since | Inc.; Chairman, |
| | | | | 2012. From 1992-2012, | Brantley Capital |
| | | | | Mr. Goldstein was a | Corporation (until |
| | | | | member of the general | 2013); Director, |
| | | | | partners of several private | ASA Ltd. (until |
| | | | | funds in the Bulldog | 2013). |
| | | | | Investors group of funds | |
| | | | | and in 2012 became a | |
| | | | | member of Bulldog | |
| | | | | Holdings, LLC, which | |
| | | | | became the sole owner of | |
| | | | | such general partners. | |
| | | | | | |
| Glenn Goodstein | 1963 | Director | Since | Registered Investment | None |
| 5650 El Camino Real, | | | 2016 / 16 years | Advisor; held numerous | |
| Suite 155 | | | | executive positions with | |
| Carlsbad, CA 92008 | | | | Automatic Data Processing | |
| | | | | until 1996. | |
| Management of the Fund (concluded) | January 31, 2018 (Unaudited) |
| | | | Term of | | |
| | Year | Position(s) | Office/Length | Principal Occupation | Other Directorships |
Name and Address | Born | with the Fund | of Time Served | During the Past Five Years | Held by Director |
| Rajeev Das | 1968 | Director | Since | Since 2004, Mr. Das has | None |
| 68 Lafayette Avenue | | | 2015 / 16 years | been a Principal of the | |
| Dumont, NJ 07628 | | | | entities serving as the general | |
| | | | | partner of the private | |
| | | | | investment partnerships in | |
| | | | | the Bulldog Investors group | |
| | | | | of investment funds. Head | |
| | | | | Trader of Bulldog Investors, | |
| | | | | LLC, the investment | |
| | | | | adviser to the Special | |
| | | | | Opportunities Fund, Inc., | |
| | | | | since its inception in | |
| | | | | 2009. Treasurer of | |
| | | | | Special Opportunities Fund, | |
| | | | | Inc., from 2009-2014. | |
| | | | | | |
| Richard Abraham | 1955 | Director | Since | Since 1998, Mr. Abraham | None |
| 143 Colfax Rd | | | 2015 / 2 years | has been self employed as | |
| Havertown, PA 19083 | | | | a securities trader. | |
| | | | | | |
| Maria Eugenia Pichardo | 1950 | Officer, | Indefinite / 13 years | Portfolio Manager of the | None |
| Andres Bello No. 45 – 22 Floor | | President | | Fund since the Fund’s | |
| Col. Chapultepec Polanco | | | | Inception; President and | |
| Del. Miguel Hidalgo | | | | General Partner, Pichardo | |
| Mexico, CDMX (D.F.), | | | | Asset Management, S.A. de | |
| C.P. 11560 | | | | C.V. since 2003; Managing | |
| | | | | Director, Acciones y Valores | |
| | | | | de Mexico, S.A. de C.V. | |
| | | | | from 1979-2002. | |
| | | | | | |
| Luis Calzada | 1965 | Secretary | Indefinite / 6 years | Administrative and | None |
| Andres Bello No. 45 – 22 Floor | | | | Compliance Director, | |
| Col. Chapultepec Polanco | | | | Pichardo Asset | |
| Mexico, CDMX (D.F.), | | | | Management S.A. de C.V. | |
| C.P. 11560 | | | | | |
| | | | | | |
| Arnulfo Rodriguez | 1962 | Chief | Since 2016 / 1 year | Strategist and Debt Portfolio | None |
| Andres Bello No. 45 – 22 Floor | | Financial | | Manager, Pichardo Asset | |
| Col. Chapultepec Polanco | | Officer | | Management, S.A. de C.V. | |
| Mexico, CDMX (D.F.), | | | | from January 2016-present; | |
| C.P. 11560 | | | | Local Fixed Income Research | |
| | | | | Vice President, Acciones y | |
| | | | | Valores Banamex from July | |
| | | | | 2011-January 2016. | |
THE MEXICO EQUITY
AND INCOME FUND, INC.
Investment Adviser:
Pichardo Asset Management, S.A. de C.V.
Andres Bello No. 45 – 22 Floor
Col. Chapultepec Polanco
Del. Miguel Hidalgo
Mexico, CDMX (D.F.), C.P. 11560
Independent Registered Public
Accounting Firm:
Tait, Weller & Baker LLP
1818 Market Street, Suite 2400
Philadelphia, PA 19103
Transfer Agent and Registrar,
Fund Administrator
and Fund Accountant:
U.S. Bancorp Fund Services, LLC
615 East Michigan Street
Milwaukee, WI 53202
Custodian:
U.S. Bank, N.A.
Custody Operations
1555 Rivercenter Drive, Suite 302
Milwaukee, WI 53212
Board of Directors:
Richard Abraham
Rajeev Das
Phillip Goldstein
Glenn Goodstein
Gerald Hellerman
Item 2. Code of Ethics.
Not applicable for semi-annual reports.
Item 3. Audit Committee Financial Expert.
Not applicable for semi-annual reports.
Item 4. Principal Accountant Fees and Services.
Not applicable for semi-annual reports.
Item 5. Audit Committee of Listed Registrants.
Not applicable for semi-annual reports.
Item 6. Investments.
| (a) | Schedule of Investments is included as part of the report to shareholders filed under Item 1 of this Form. |
Item 7. Disclosure of Proxy Voting Policies and Procedures for Closed-End Management Investment Companies.
Not applicable for semi-annual reports.
Item 8. Portfolio Managers of Closed-End Management Investment Companies.
Not applicable for semi-annual reports.
Item 9. Purchases of Equity Securities by Closed‑End Management Investment Company and Affiliated Purchasers.
| Period | (a)
Total Number of Shares (or Units) Purchased | (b)
Average Price Paid per Share (or Unit) | (c)
Total Number of Shares (or Units) Purchased as Part of Publicly Announced Plans or Programs | (d)
Maximum Number (or Approximate Dollar Value) of Shares (or Units) that May Yet Be Purchased Under the Plans or Programs |
| 8/1/17 to 8/31/17 | 0 | $0.00 | 0 | 0 |
| 9/1/17 to 9/30/17 | 0 | $0.00 | 0 | 0 |
| 10/1/17 to 10/31/17 | 0 | $0.00 | 0 | 0 |
| 11/1/17 to 11/30/17 | 6,300 | $10.26 | 0 | 0 |
| 12/1/17 to 12/31/17 | 0 | $0.00 | 0 | 0 |
| 1/1/18 to 1/31/18 | 0 | $0.00 | 0 | 0 |
| Total | 6,300(1) | $10.26 | 0 | 0 |
(1) 6,300 common shares were repurchased pursuant to the Fund’s stock repurchase program.
Item 10. Submission of Matters to a Vote of Security Holders.
There have been no material changes to the procedures by which shareholders may recommend nominees to the registrant’s board of directors.
Item 11. Controls and Procedures.
| (a) | The Registrant’s President and Chief Financial Officer have reviewed the Registrant's disclosure controls and procedures (as defined in Rule 30a-3(c) under the Investment Company Act of 1940 (the “Act”)) as of a date within 90 days of the filing of this report, as required by Rule 30a-3(b) under the Act and Rules 13a-15(b) or 15d‑15(b) under the Securities Exchange Act of 1934. Based on their review, such officers have concluded that the disclosure controls and procedures are effective in ensuring that information required to be disclosed in this report is appropriately recorded, processed, summarized and reported and made known to them by others within the Registrant and by the Registrant’s service provider. |
| (b) | There were no changes in the Registrant's internal control over financial reporting (as defined in Rule 30a-3(d) under the Act) that occurred during the second fiscal quarter of the period covered by this report that has materially affected, or is reasonably likely to materially affect, the Registrant's internal control over financial reporting. |
Item 12. Disclosure of Securities Lending Activities for Closed-End Management Investment Companies
The registrant did not engage in securities lending activities during the fiscal period reported on this Form N-CSR.
Item 13. Exhibits.
| (a) | (1) Any code of ethics or amendment thereto, that is the subject of the disclosure required by Item 2, to the extent that the registrant intends to satisfy Item 2 requirements through filing an exhibit. Not Applicable. |
(2) A separate certification for each principal executive and principal financial officer pursuant to Section 302 of the Sarbanes-Oxley Act of 2002. Filed herewith.
(3) Any written solicitation to purchase securities under Rule 23c‑1 under the Act sent or given during the period covered by the report by or on behalf of the registrant to 10 or more persons. None.
(4) Change in the registrant’s independent public accountant. There was no change in the registrant’s independent public accountant for the period covered by this report.
| (b) | Certifications pursuant to Section 906 of the Sarbanes‑Oxley Act of 2002. Furnished herewith. |
SIGNATURES
Pursuant to the requirements of the Securities Exchange Act of 1934 and the Investment Company Act of 1940, the registrant has duly caused this report to be signed on its behalf by the undersigned, thereunto duly authorized.
(Registrant) The Mexico Equity and Income Fund, Inc.
By (Signature and Title)* /s/ Maria Eugenia Pichardo
Maria Eugenia Pichardo, President
Date April 4, 2018
Pursuant to the requirements of the Securities Exchange Act of 1934 and the Investment Company Act of 1940, this report has been signed below by the following persons on behalf of the registrant and in the capacities and on the dates indicated.
By (Signature and Title)* /s/ Maria Eugenia Pichardo
Maria Eugenia Pichardo, President
Date April 4, 2018
By (Signature and Title)* /s/ Arnulfo Rodriguez
Arnulfo Rodriguez, Chief Financial Officer
Date April 4, 2018
* Print the name and title of each signing officer under his or her signature.