Exhibit 99.1

Exhibit 99.1
Cascade Microtech Investor Day
Business Model and Growth Plan
Agenda
Financial Report – Jeff Killian
Technology Strategies – Eric Strid
Market Update – Mike Kondrat
Sales and Customer Support– Paul O’Mara
Business Unit Overview – Steve Harris
2 |
| November 30, 2010 |
Safe Harbor and Non-GAAP Measures
This presentation includes “forward-looking” statements within the meaning of the Securities Litigation Reform Act of 1995. Such forward-looking statements include statements regarding Cascade’s anticipated revenue growth, increased revenue from certain products, related increases in customer demand, future quarterly earnings, correlation between bookings and revenues, facility changes and utilization, and integration and restructuring of product lines. Words such as expects, anticipates, intends, plans, believes, sees, estimates and variations of such words and similar expressions are intended to identify these and other forward-looking statements. All such statements are based on current expectations, estimates and projections about the Company’s business based in part on assumptions made by management. These statements are not guarantees of future performance and involve risks and uncertainties that are difficult to predict. Therefore, actual outcomes and results may differ materially from what is expressed or forecasted in such forward-looking statements due to numerous factors, including changes in demand for the Company’s products and product mix; the timing of shipments and customer orders; constraints on supplies of components; excess or shortage of production capacity; difficulties or unexpected costs or delays in the integration of the operations, employees, products, sales channels, strategies, and technologies of acquired businesses; difficulties or unexpected costs or delays in the consolidation of facilities and manufacturing operations; the inability to achieve anticipated savings from cost reduction efforts; the potential failure of expected market opportunities to materialize; the potential inability to realize expected benefits and synergies; potential diversion of management’s attention from our existing business as well as that of acquired businesses; potential adverse effects on relationships with our existing suppliers, customers or partners and other risks discussed from time to time in the Company’s Securities and Exchange Commission filings and reports, including the Company’s Annual Report on Form 10-K. In addition, such statements could be affected by general industry and market conditions and growth rates and general domestic and international economic conditions. Such forward-looking statements speak only as of the date on which they are made and the company does not undertake any obligation to update any forward-looking statement to reflect events or circumstances after the date of this presentation.
3 |
| November 30, 2010 |
Executive Officers
Extensive business, technical and market experience
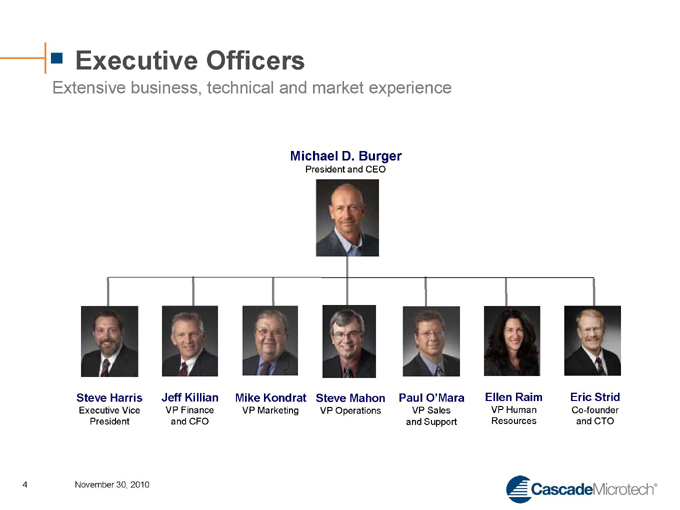
Michael D. Burger
President and CEO
Steve Harris
Executive Vice President
Jeff Killian
VP Finance and CFO
Mike Kondrat
VP Marketing
Steve Mahon
VP Operations
Paul O’Mara
VP Sales and Support
Ellen Raim
VP Human Resources
Eric Strid
Co-founder and CTO
4 |
| November 30, 2010 |
Company Overview
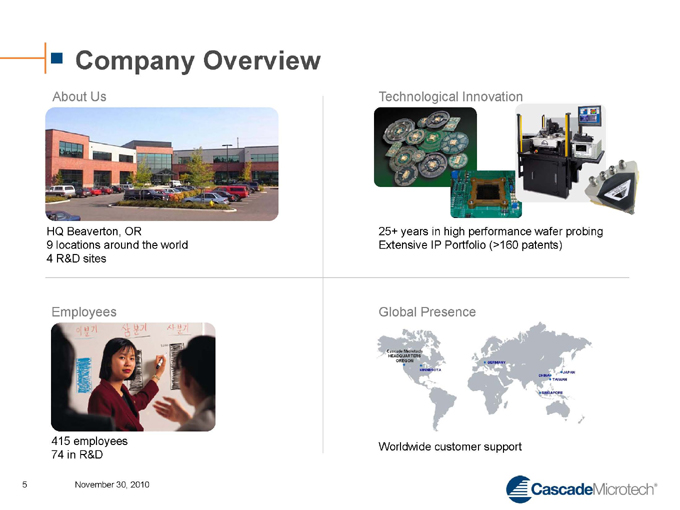
About Us
HQ Beaverton, OR
9 locations around the world
4 |
| R&D sites |
Employees
415 employees 74 in R&D
Technological Innovation
25+ years in high performance wafer probing Extensive IP Portfolio (>160 patents)
Global Presence
Worldwide customer support
5 |
| November 30, 2010 |
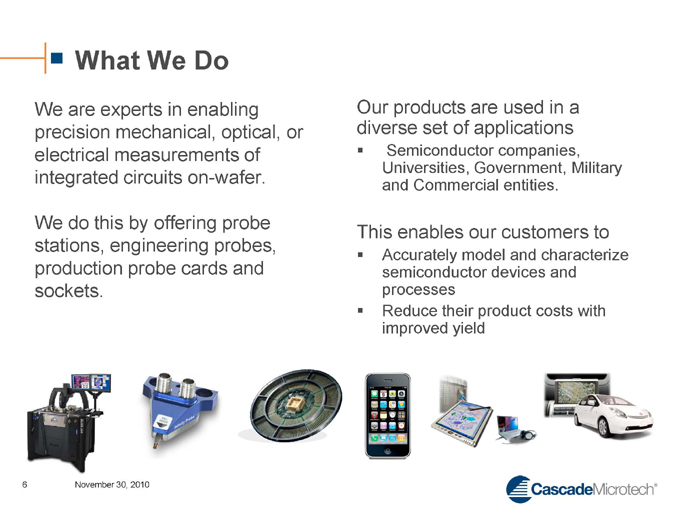
What We Do
We are experts in enabling precision mechanical, optical, or electrical measurements of integrated circuits on-wafer.
We do this by offering probe stations, engineering probes, production probe cards and sockets.
Our products are used in a diverse set of applications
Semiconductor companies, Universities, Government, Military and Commercial entities.
This enables our customers to
Accurately model and characterize semiconductor devices and processes?? Reduce their product costs with improved yield
6 |
| November 30, 2010 |
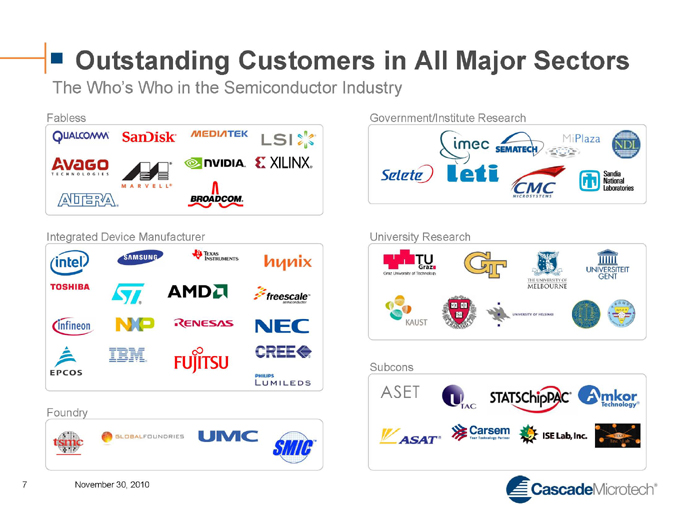
Outstanding Customers in All Major Sectors
The Who’s Who in the Semiconductor Industry
Fabless
Integrated Device Manufacturer
Foundry
Government/Institute Research University Research Subcons
7 |
| November 30, 2010 |
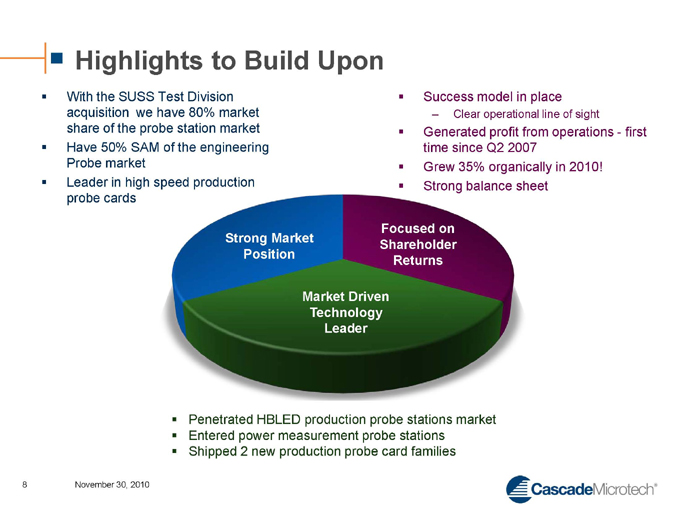
Highlights to Build Upon
With the SUSS Test Division acquisition we have 80% market share of the probe station market
Have 50% SAM of the engineering Probe market
Leader in high speed production probe cards
Success model in place
– Clear operational line of sight
Generated profit from operations—first time since Q2 2007
Grew 35% organically in 2010!
Strong balance sheet
Strong Market Position
Focused on Shareholder Returns
Market Driven Technology Leader
Penetrated HBLED production probe stations market
Entered power measurement probe stations
Shipped 2 new production probe card families
8 |
| November 30, 2010 |
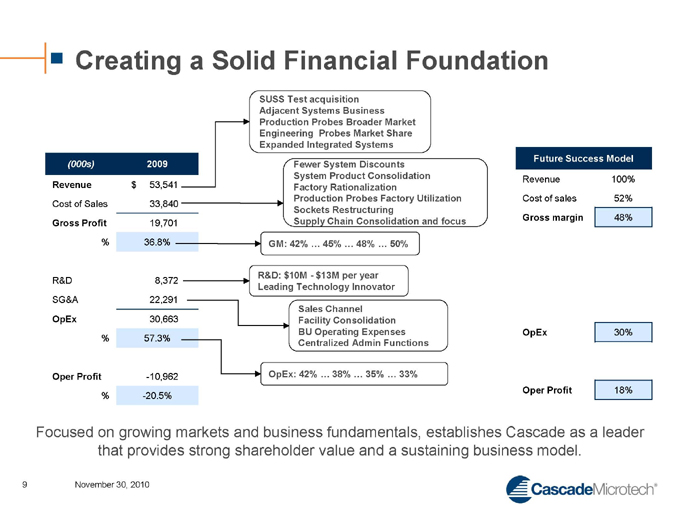
Creating a Solid Financial Foundation
(000s) 2009
Revenue $53,541
Cost of Sales 33,840
Gross Profit 19,701
% 36.8%
R&D 8,372
SG&A 22,291
OpEx 30,663
% 57.3%
Oper Profit -10,962
% -20.5%
SUSS Test acquisition Adjacent Systems Business Production Probes Broader Market Engineering Probes Market Share Expanded Integrated Systems
Fewer System Discounts System Product Consolidation Factory Rationalization Production Probes Factory Utilization Sockets Restructuring Supply Chain Consolidation and focus
GM: 42% … 45% … 48% … 50%
R&D: $10M—$13M per year Leading Technology Innovator
Sales Channel Facility Consolidation BU Operating Expenses Centralized Admin Functions
OpEx: 42% … 38% … 35% … 33%
Future Success Model
Revenue 100%
Cost of sales 52%
Gross margin 48%
OpEx 30%
Oper Profit 18%
Focused on growing markets and business fundamentals, establishes Cascade as a leader that provides strong shareholder value and a sustaining business model.
9 November 30, 2010
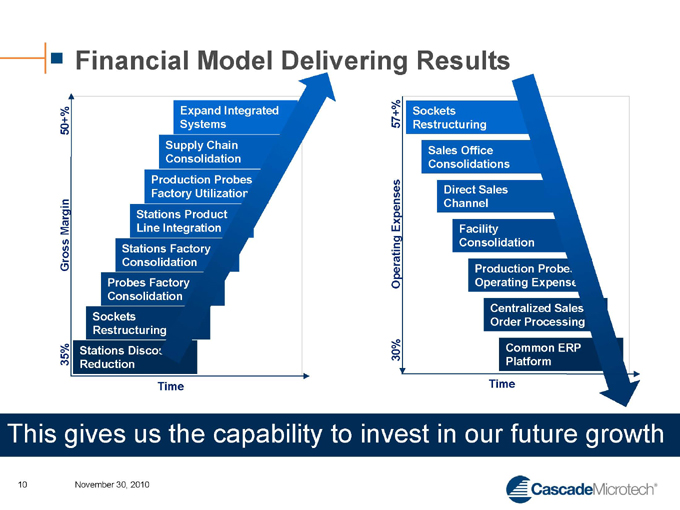
Financial Model Delivering Results
35%
Gross Margin
50+%
Expand Integrated Systems
Supply Chain Consolidation
Production Probes Factory Utilization
Stations Product Line Integration
Stations Factory Consolidation
Probes Factory Consolidation
Sockets Restructuring
Stations Discount Reduction
Time
30%
Operating Expenses
57+%
Sockets Restructuring
Sales Office Consolidations
Direct Sales Channel
Facility Consolidation
Production Probes Operating Expenses
Centralized Sales Order Processing
Common ERP Platform
Time
This gives us the capability to invest in our future growth
10 November 30, 2010
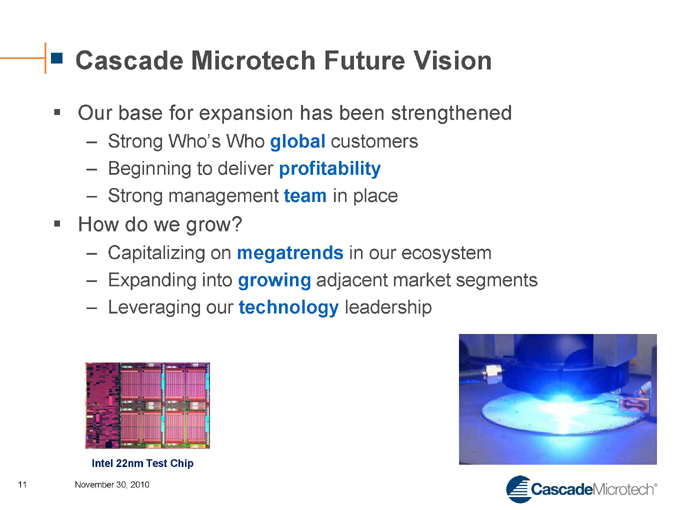
Cascade Microtech Future Vision
Our base for expansion has been strengthened
Strong Who’s Who global customers
Beginning to deliver profitability
Strong management team in place
How do we grow?
Capitalizing on megatrends in our ecosystem
Expanding into growing adjacent market segments
Leveraging our technology leadership
Intel 22nm Test Chip
11 November 30, 2010
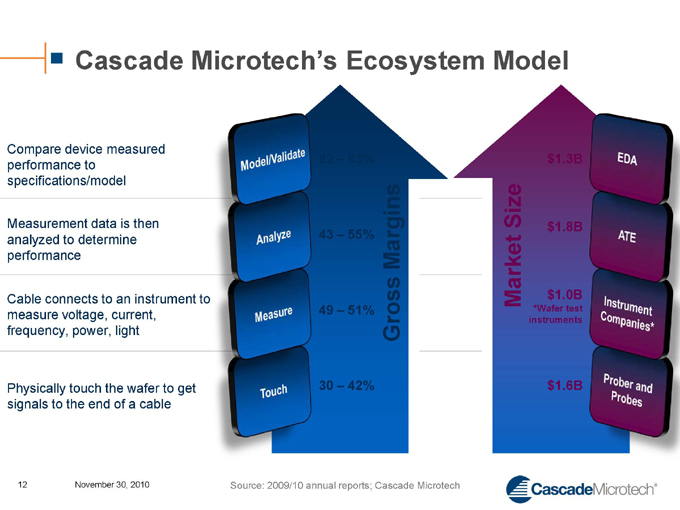
Cascade Microtech’s Ecosystem Model
Compare device measured performance to specifications/model
Measurement data is then analyzed to determine performance
Cable connects to an instrument to measure voltage, current, frequency, power, light
Physically touch the wafer to get signals to the end of a cable
82 – 83%
43 – 55%
49 – 51%
30 – 42%
Gross Margins
Market Size
$1.3B
$1.8B
$1.0B
*Wafer test instruments
$1.6B
Source: 2009/10 annual reports; Cascade Microtech
12 November 30, 2010
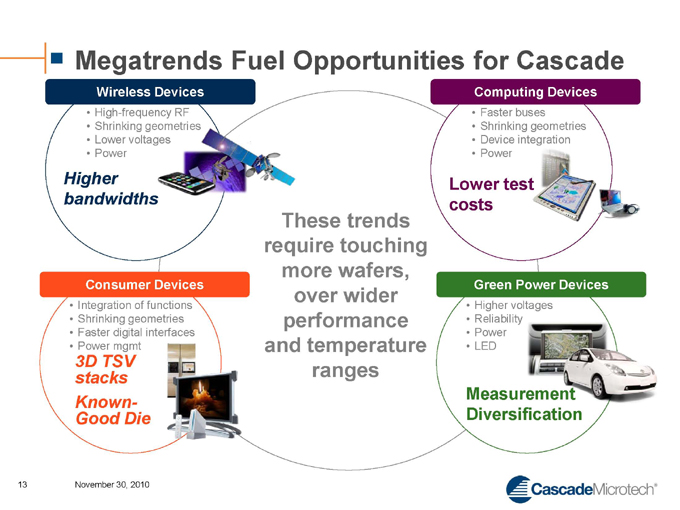
Megatrends Fuel Opportunities for Cascade
Wireless Devices
High-frequency RF
Shrinking geometries
Lower voltages
Power
Higher bandwidths
Consumer Devices
Integration of functions
Shrinking geometries
Faster digital interfaces
Power mgmt
3D TSV
stacks
Known-
Good Die
These trends require touching more wafers, over wider performance and temperature ranges
Computing Devices
Faster buses
Shrinking geometries
Device integration
Power
Lower test costs
Green Power Devices
Higher voltages
Reliability
Power
LED
Measurement
Diversification
13 November 30, 2010
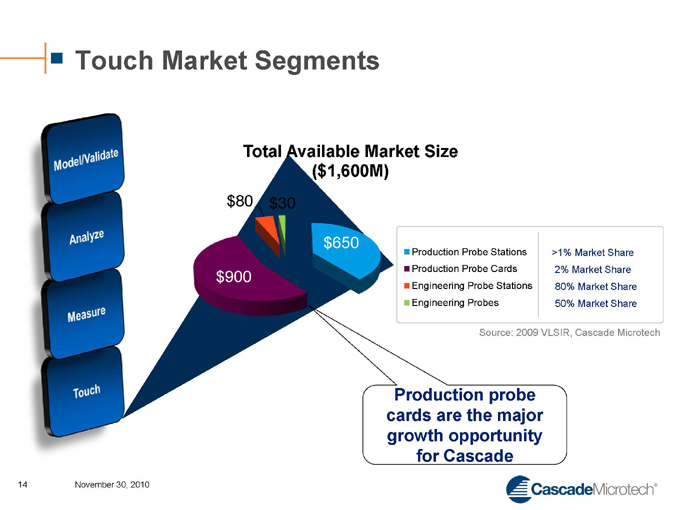
Touch Market Segments
Total Available Market Size ($1,600M)
$80
$30
$900
$650
Production Probe Stations >1% Market Share
Production Probe Cards 2% Market Share
Engineering Probe Stations 80% Market Share
Engineering Probes 50% Market Share
Source: 2009 VLSIR, Cascade Microtech
Production probe cards are the major growth opportunity for Cascade
14 November 30, 2010
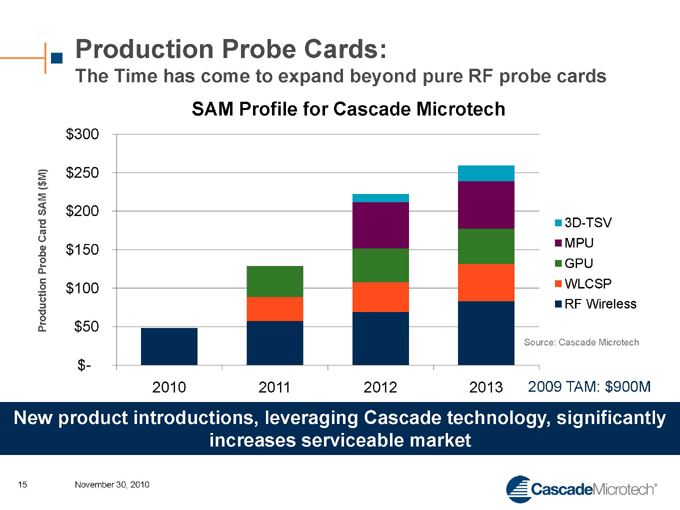
Production Probe Cards:
The Time has come to expand beyond pure RF probe cards SAM Profile for Cascade Microtech
Production Probe Card SAM ($M)
$300
$250
$200
$150
$100
$50
$-
2010
2011
2012
2013
3D-TSV MPU GPU WLCSP RF Wireless
Source: Cascade Microtech
2009 TAM: $900M
New product introductions, leveraging Cascade technology, significantly increases serviceable market
15 November 30, 2010
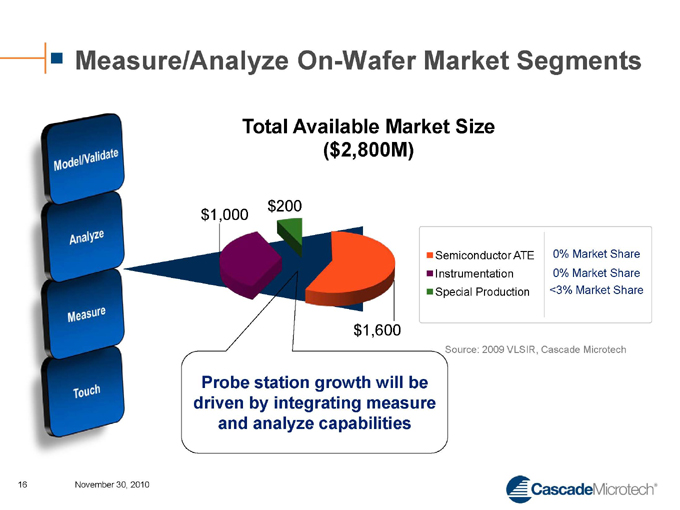
Measure/Analyze On-Wafer Market Segments
Total Available Market Size
($2,800M)
$200
$1,000
$1,600
Probe station growth will be driven by integrating measure and analyze capabilities
Semiconductor ATE 0% Market Share
Instrumentation 0% Market Share
Special Production <3% Market Share
Source: 2009 VLSIR, Cascade Microtech
16 November 30, 2010
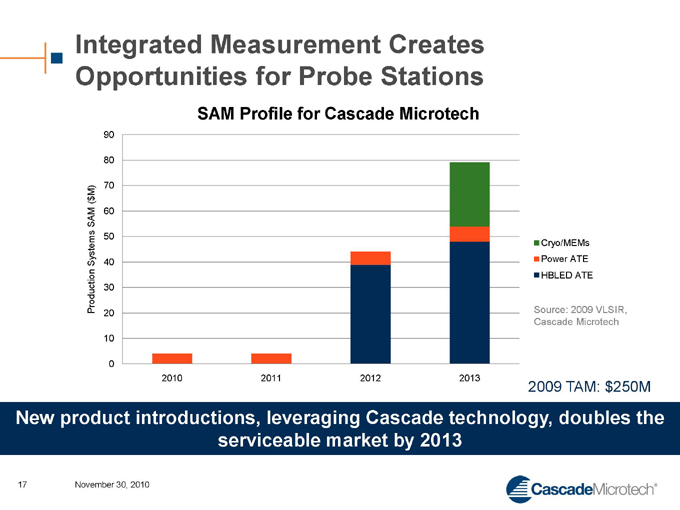
Integrated Measurement Creates Opportunities for Probe Stations
SAM Profile for Cascade Microtech
Production Systems SAM ($M)
90
80
70
60
50
40
30
20
10
0
2010
2011
2012
2013
Cryo/MEMs Power ATE HBLED ATE
Source: 2009 VLSIR, Cascade Microtech
2009 TAM: $250M
New product introductions, leveraging Cascade technology, doubles the serviceable market by 2013
17 November 30, 2010

Cascade Microtech Highlights
Strong management team
Focused on execution
Strong Who’s Who global customers
Strong relationships mean strong partnerships
Focused on delivering sustained profitability via new business model
Encouraging results; improving balance sheet
Investing in growth opportunities
Strong differentiated leadership position
Leveraging technology into high growth areas
18 November 30, 2010

Financial Report
Jeff Killian
Vice President Finance Chief Financial Officer
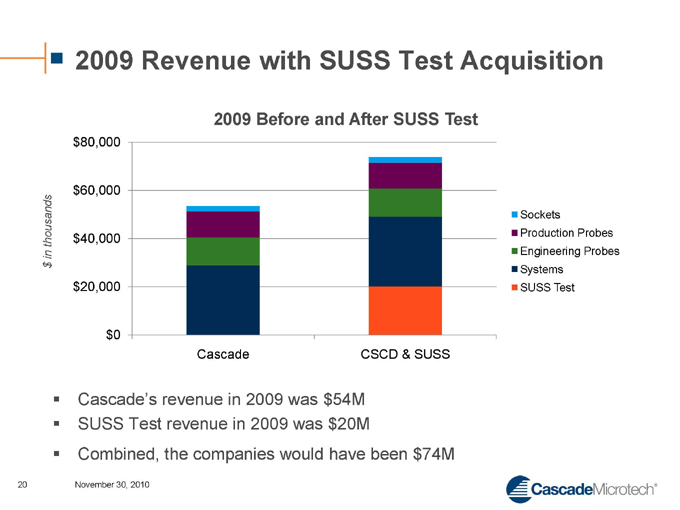
2009 Revenue with SUSS Test Acquisition
2009 Before and After SUSS Test
$ in thousands
$80,000 $60,000 $40,000 $20,000 $0
Cascade
CSCD & SUSS
Sockets
Production Probes Engineering Probes Systems SUSS Test
Cascade’s revenue in 2009 was $54M
SUSS Test revenue in 2009 was $20M
Combined, the companies would have been $74M
20 November 30, 2010
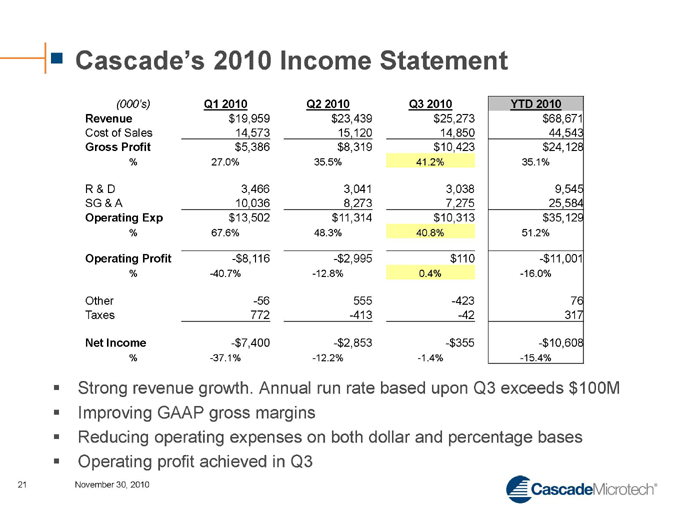
Cascade’s 2010 Income Statement
(000’s) Q1 2010 Q2 2010 Q3 2010 YTD 2010
Revenue $19,959 $23,439 $25,273 $68,671
Cost of Sales 14,573 15,120 14,850 44,543
Gross Profit $5,386 $8,319 $10,423 $24,128
% 27.0% 35.5% 41.2% 35.1%
R & D 3,466 3,041 3,038 9,545
SG & A 10,036 8,273 7,275 25,584
Operating Exp $13,502 $11,314 $10,313 $35,129
% 67.6% 48.3% 40.8% 51.2%
Operating Profit - -$8,116 -$2,995 $110 -$11,001
% -40.7% -12.8% 0.4% -16.0%
Other -56 555 -423 76
Taxes 772 -413 -42 317
Net Income -$7,400 -$2,853 - -$355 -$10,608
% -37.1% -12.2% -1.4% -15.4%
Strong revenue growth. Annual run rate based upon Q3 exceeds $100M??
Improving GAAP gross margins??
Reducing operating expenses on both dollar and percentage bases??
Operating profit achieved in Q3
21 November 30, 2010
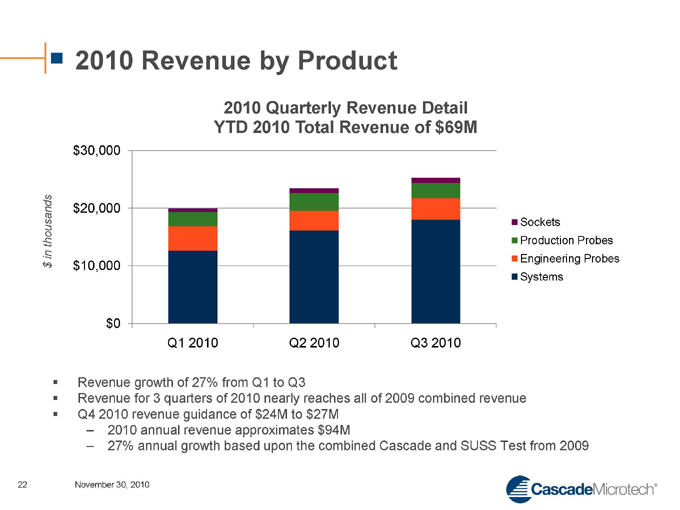
2010 Revenue by Product
2010 Quarterly Revenue Detail YTD 2010 Total Revenue of $69M
$ in thousands
$30,000 $20,000 $10,000 $0
Q1 2010
Q2 2010
Q3 2010
Sockets
Production Probes Engineering Probes Systems
Revenue growth of 27% from Q1 to Q3
Revenue for 3 quarters of 2010 nearly reaches all of 2009 combined revenue
Q4 2010 revenue guidance of $24M to $27M
2010 annual revenue approximates $94M
27% annual growth based upon the combined Cascade and SUSS Test from 2009
22 November 30, 2010
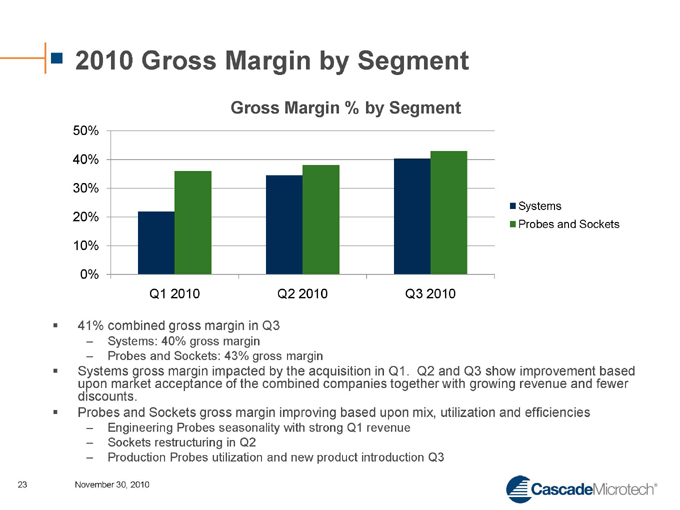
2010 Gross Margin by Segment
Gross Margin % by Segment
50% 40% 30% 20% 10% 0%
Q1 2010
Q2 2010
Q3 2010
Systems
Probes and Sockets
41% combined gross margin in Q3
Systems: 40% gross margin
Probes and Sockets: 43% gross margin
Systems gross margin impacted by the acquisition in Q1. Q2 and Q3 show improvement based upon market acceptance of the combined companies together with growing revenue and fewer discounts.
Probes and Sockets gross margin improving based upon mix, utilization and efficiencies
Engineering Probes seasonality with strong Q1 revenue
Sockets restructuring in Q2
Production Probes utilization and new product introduction Q3
23 November 30, 2010
2010 R&D and SGA Expenses
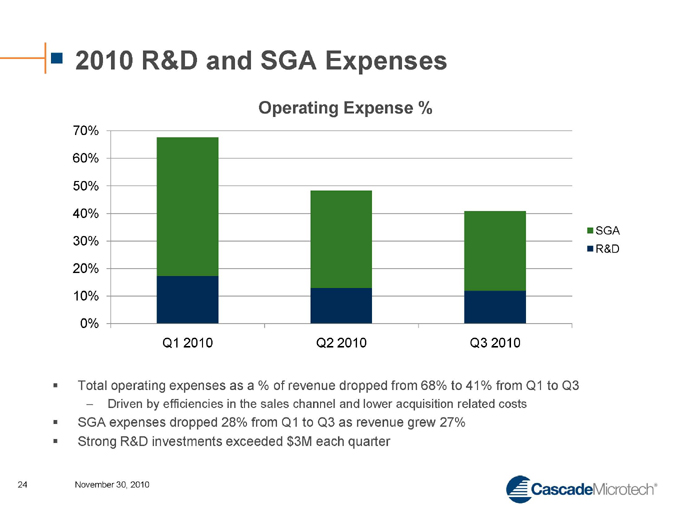
Operating Expense %
70% 60% 50% 40% 30% 20% 10% 0%
Q1 2010 Q2 2010 Q3 2010
SGA R&D
Total operating expenses as a % of revenue dropped from 68% to 41% from Q1 to Q3 – Driven by efficiencies in the sales channel and lower acquisition related costs
SGA expenses dropped 28% from Q1 to Q3 as revenue grew 27%
Strong R&D investments exceeded $3M each quarter
24 November 30, 2010
Financial Model Delivering Results
35%
Gross Margin
50+%
Expand Integrated Systems
Supply Chain Consolidation
Prod. Probes Factory Utilization
Stations Product Line Integration
Stations Factory Consolidation
Probes Factory Consolidation
Sockets Restructuring
Stations Discount Reduction
2010
2011
Beyond
30%
Operating Expenses
57+%
Sockets Restructuring
Sales Office Consolidations
Direct Sales Channel
Facility Consolidation
Production Probes OpEx
Centralized Sales Order
Processing
Common ERP Platform
2010
2011
Beyond
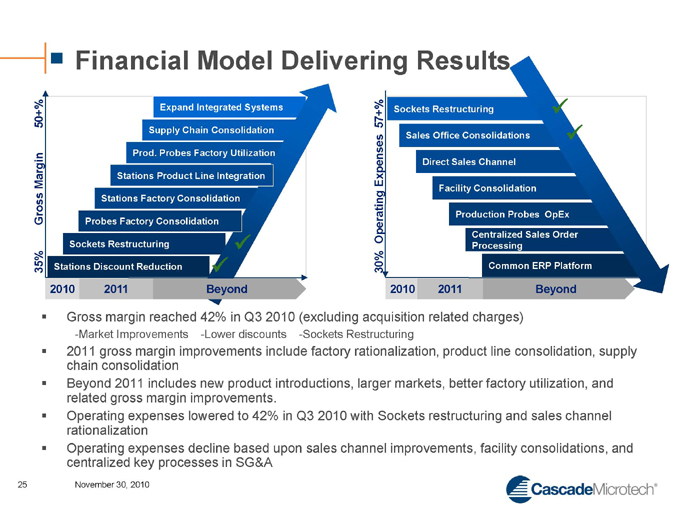
Gross margin reached 42% in Q3 2010 (excluding acquisition related charges)
-Market Improvements -Lower discounts -Sockets Restructuring
2011 gross margin improvements include factory rationalization, product line consolidation, supply chain consolidation??
Beyond 2011 includes new product introductions, larger markets, better factory utilization, and related gross margin improvements.
Operating expenses lowered to 42% in Q3 2010 with Sockets restructuring and sales channel rationalization??
Operating expenses decline based upon sales channel improvements, facility consolidations, and centralized key processes in SG&A
25 November 30, 2010
Target Financial Model
Revenue Trough Success
GM % 42% 48%
Oper Exp % 42% 30%
Oper Profit % 0% 12%
EBITDAS 8% 18%
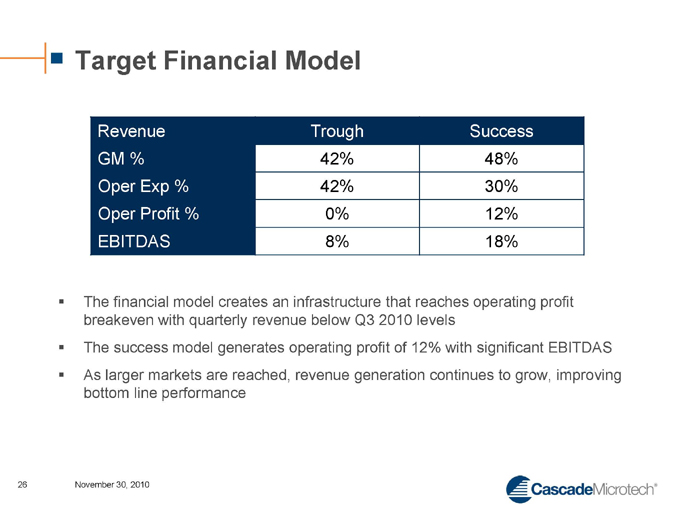
The financial model creates an infrastructure that reaches operating profit breakeven with quarterly revenue below Q3 2010 levels
The success model generates operating profit of 12% with significant EBITDAS
As larger markets are reached, revenue generation continues to grow, improving bottom line performance
26 November 30, 2010
Strong Balance Sheet
(000’s) Q3 2010
Cash and investments 19,537
Accounts receivable 18,315
Inventories 21,282
Prepaids and Other Current 4,392
Total Current Assets $63,526
Fixed assets 10,565
Goodwill & Purchased intangibles 4,357
Other assets 2,885
Total assets $81,333
Accounts payable 5,341
Accrued liabilities 5,119
Other Current Liabilities 2,504
Total Current Liabilities $12,964
Deferred Income Taxes 708
Other Long-Term Liabilities 2,810
Total Liabilities $16,482
Equity $64,851
Total Liabilities and Equity $81,333
Balance Sheet Ratios
Average DSO 62
Average Inventory Turns 2.8
Average Days AP 36
Current Ratio 4.9
Working Capital Position $50,562
Long Term Debt $0
Total Liabilities to Equity Ratio 0.25
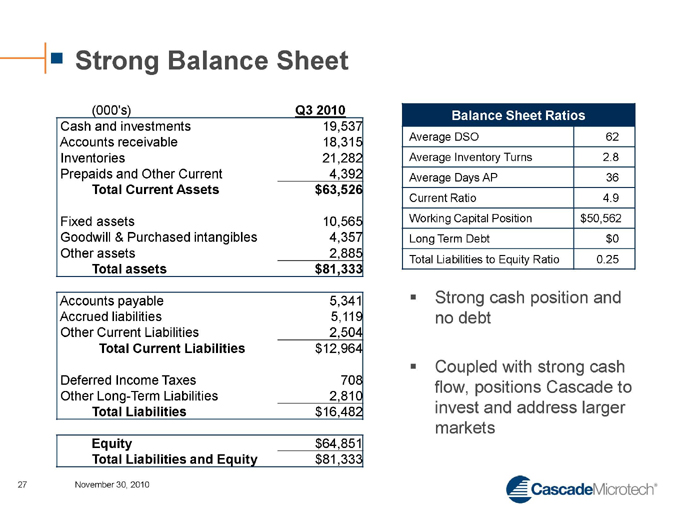
Strong cash position and no debt
Coupled with strong cash flow, positions Cascade to invest and address larger markets
27 November 30, 2010
Summary
Position Cascade for the semiconductor business cycles
– Leverage the resources within the combined organization
– Adjust infrastructure to lower costs and expenses
Clearly defined initiatives and action plans
– Achieve operating profit break even at lower revenue levels
Retain positive EBITDAS during down-cycles
– Produce significant profits and EBITDAS during up-cycles
Combine the business model with a strong balance sheet – Positioned to invest and address larger markets
28 November 30, 2010

Technology Strategies
Eric Strid
Chief Technology Officer

Electronic System Drivers
IT productivities
5 |
| billion cell phone subscribers want smarter phones |
Tipping points: telepresence, voice recognition, automated surveillance…
Pervasive computing for shopping, security, healthcare,…
Wireless and Internet bandwidth will increase ~100X by 2020
Energy
Higher system efficiencies: LEDs, power supplies in everything
Renewable sources: wind, PV, storage systems
Electrified transportation: autos, rail
Massive ramps in LEDs, power devices, PV
30 November 30, 2010
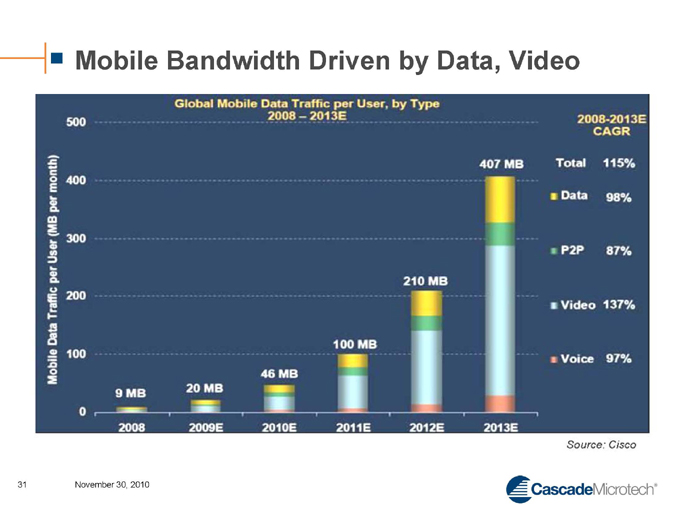
Mobile Bandwidth Driven by Data, Video
31 November 30, 2010
Semiconductor Drivers
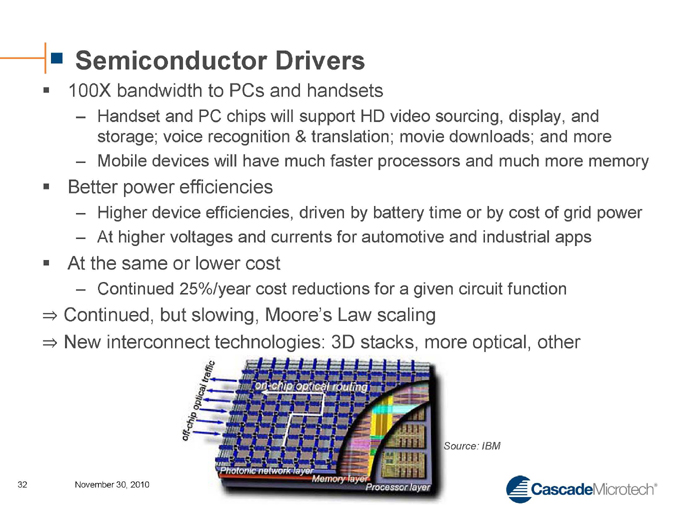
100X bandwidth to PCs and handsets
– Handset and PC chips will support HD video sourcing, display, and storage; voice recognition & translation; movie downloads; and more
– Mobile devices will have much faster processors and much more memory
Better power efficiencies
– Higher device efficiencies, driven by battery time or by cost of grid power
– At higher voltages and currents for automotive and industrial apps
At the same or lower cost
– Continued 25%/year cost reductions for a given circuit function
Continued, but slowing, Moore’s Law scaling
New interconnect technologies: 3D stacks, more optical, other
Source: IBM
32 November 30, 2010
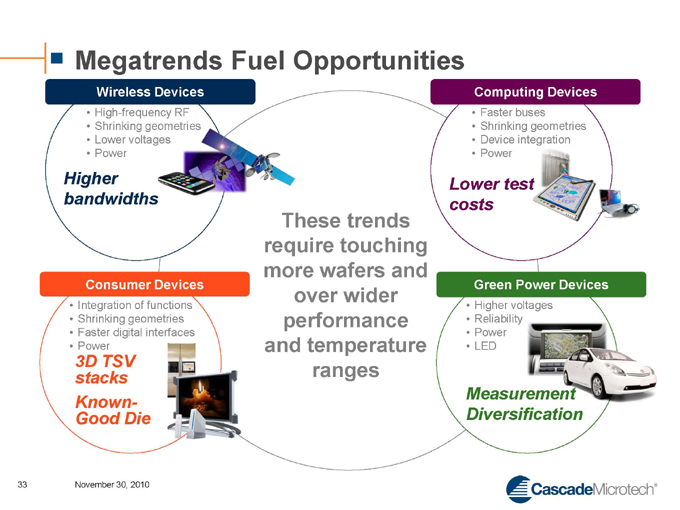
Megatrends Fuel Opportunities
Wireless Devices
High-frequency RF
Shrinking geometries
Lower voltages
Power
Higher
bandwidths
Consumer Devices
Integration of functions
Shrinking geometries
Faster digital interfaces
Power
3D TSV
stacks
Known-
Good Die
These trends require touching more wafers and over wider performance and temperature ranges
Computing Devices
Faster buses
Shrinking geometries
Device integration
Power
Lower test costs
Green Power Devices
Higher voltages
Reliability
Power
LED
Measurement Diversification
33 November 30, 2010
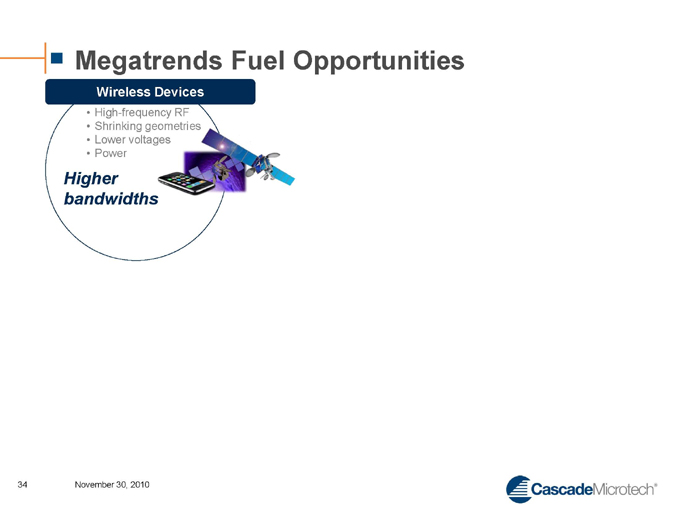
Megatrends Fuel Opportunities
Wireless Devices
High-frequency RF
Shrinking geometries
Lower voltages
Power
Higher bandwidths
34 November 30, 2010
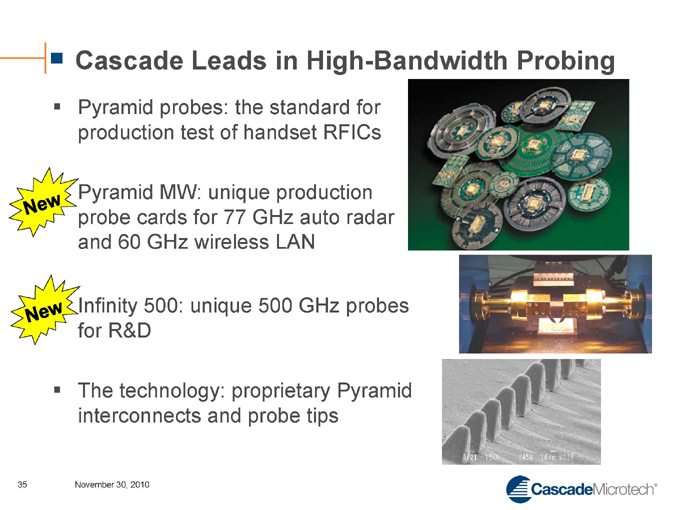
Cascade Leads in High-Bandwidth Probing
Pyramid probes: the standard for production test of handset RFICs
New Pyramid MW: unique production probe cards for 77 GHz auto radar and 60 GHz wireless LAN
New Infinity 500: unique 500 GHz probes for R&D
The technology: proprietary Pyramid interconnects and probe tips
35 November 30, 2010
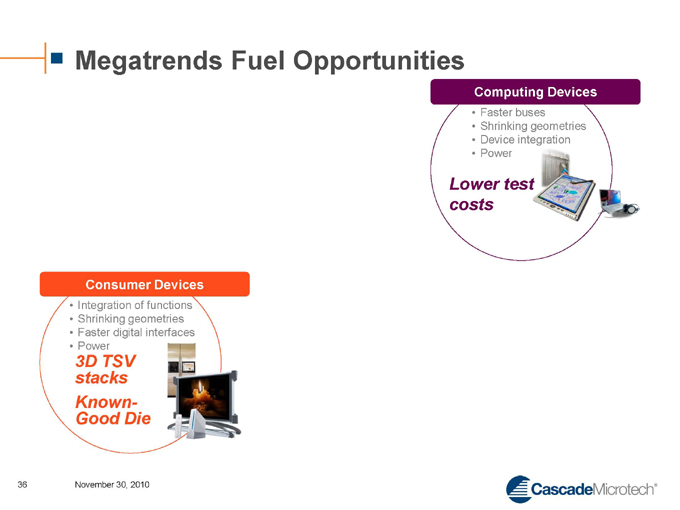
Megatrends Fuel Opportunities
Consumer Devices
Integration of functions
Shrinking geometries
Faster digital interfaces
Power
3D TSV
stacks
Known-
Good Die
Computing Devices
Faster buses
Shrinking geometries
Device integration
Power
Lower test
costs
36 November 30, 2010
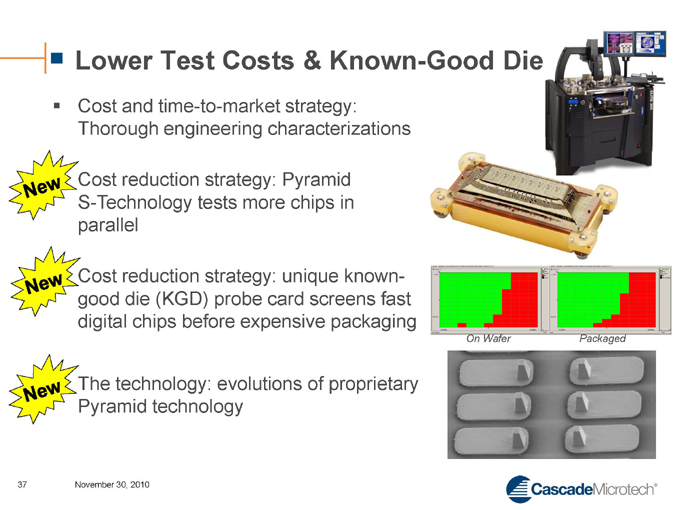
Lower Test Costs & Known-Good Die
Cost and time-to-market strategy: Thorough engineering characterizations
New Cost reduction strategy: Pyramid S-Technology tests more chips in parallel
New Cost reduction strategy: unique known-good die (KGD) probe card screens fast digital chips before expensive packaging
New The technology: evolutions of proprietary Pyramid technology
On Wafer
Packaged
37 November 30, 2010
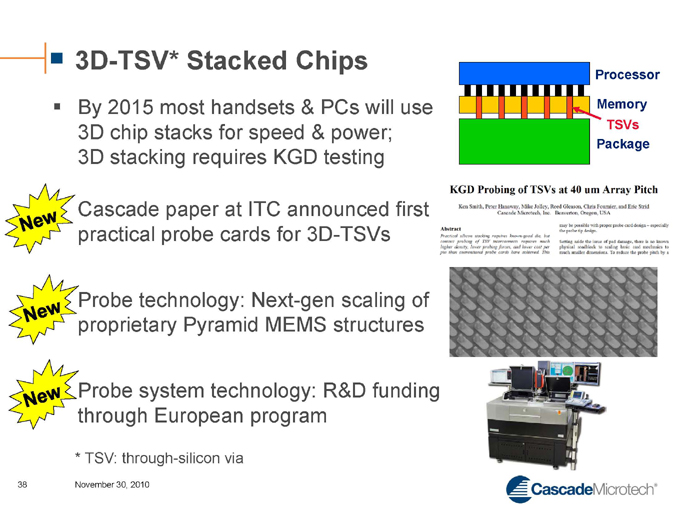
3D-TSV* Stacked Chips
By 2015 most handsets & PCs will use 3D chip stacks for speed & power; 3D stacking requires KGD testing
New
Cascade paper at ITC announced first practical probe cards for 3D-TSVs
New
Probe technology: Next-gen scaling of proprietary Pyramid MEMS structures
New
Probe system technology: R&D funding through European program
* |
| TSV: through-silicon via |
Processor Memory TSVs Package
KGD Probing of TSVs at 40 um Array Pitch
Ken Smith, Peter Hanaway, Mike Jolley, Reed Gleason, Chris Fournier, and Eric Strid Cascade Microtech, Inc. Beaverton, Oregon, USA
Abstract
Practical silicon stacking requires known-good die, but contact probing of TSV interconnects requires much higher density, lower probing forces, and lower cost per pin than conventional probe cards have achieved. This may be possible with proper probe card design – especially the probe tip design.
Setting aside the issue of pad damage, there is no known physical roadblock to scaling basic card mechanics to much smaller dimensions. To reduce the probe pitch by a
38 November 30, 2010
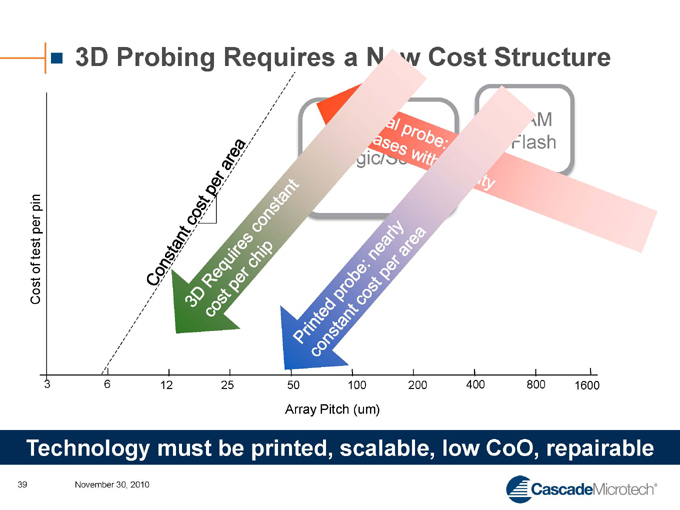
3D Probing Requires a New Cost Structure
Cost of test per pin
Logic/SoC
DRAM
& Flash
Constant cost per area
3D Requires constant cost per chip
Printed probe: nearly constant cost per area
3 |
|
6 |
|
12
25
50
100
200
400
800
1600
Array Pitch (um)
Technology must be printed, scalable, low CoO, repairable
39 November 30, 2010

Megatrends Fuel Opportunities
Green Power Devices
Higher voltages
Reliability
Power
LED
Measurement Diversification
40 November 30, 2010
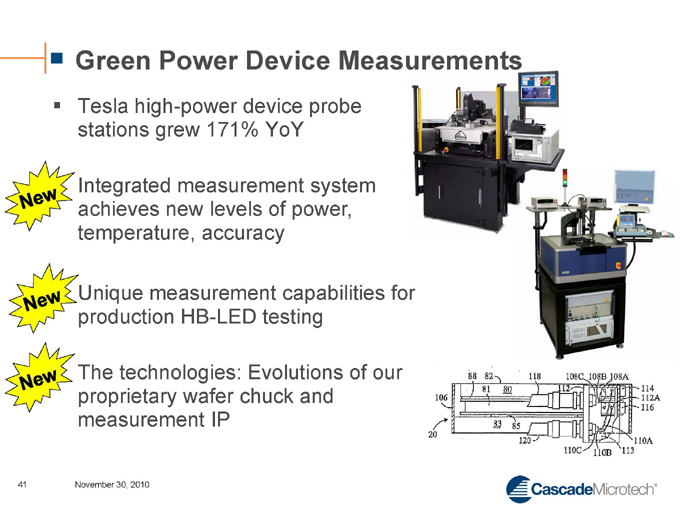
Green Power Device Measurements
Tesla high-power device probe stations grew 171% YoY
NEW
Integrated measurement system achieves new levels of power, temperature, accuracy
Unique measurement capabilities for production HB-LED testing
The technologies: Evolutions of our proprietary wafer chuck and measurement IP
41 November 30, 2010
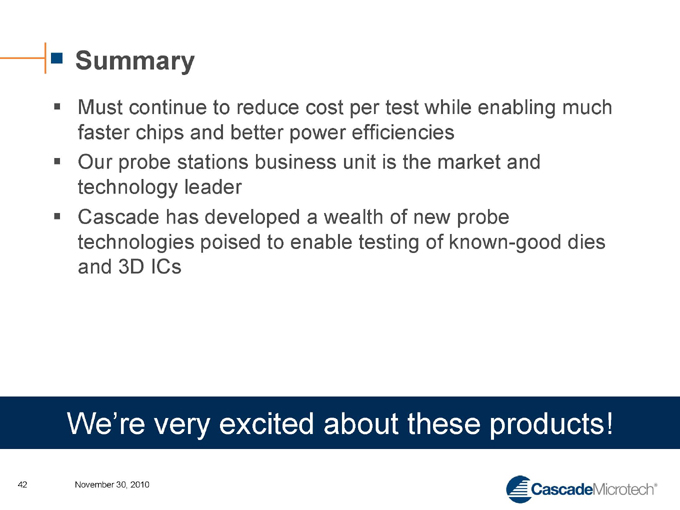
Summary
Must continue to reduce cost per test while enabling much faster chips and better power efficiencies
Our probe stations business unit is the market and technology leader
Cascade has developed a wealth of new probe technologies poised to enable testing of known-good dies and 3D ICs
We’re very excited about these products!
42 November 30, 2010

Market Update
Mike Kondrat
Vice President Marketing
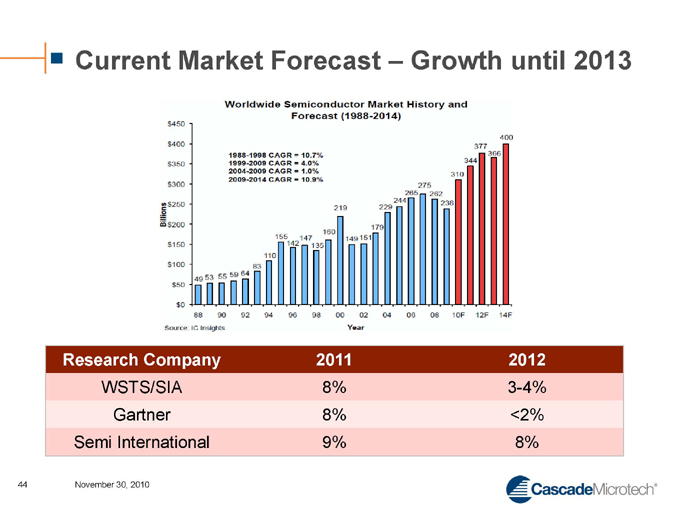
Current Market Forecast – Growth until 2013
Research Company 2011 2012
WSTS/SIA 8% 3-4%
Gartner 8% <2%
Semi International 9% 8%
44 November 30, 2010
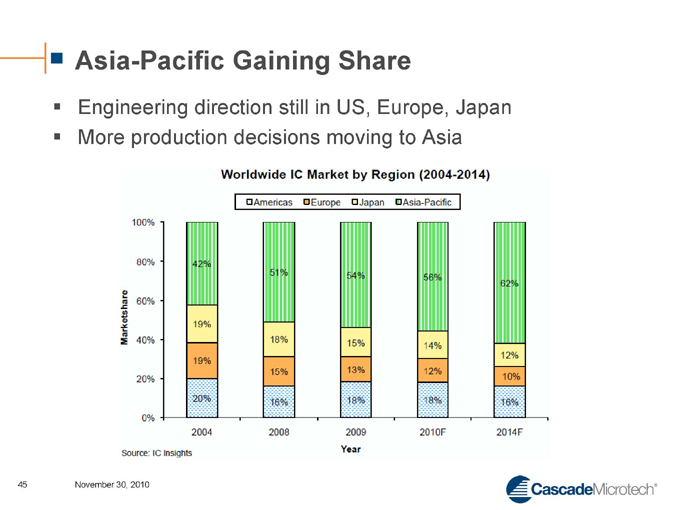
Asia-Pacific Gaining Share
Engineering direction still in US, Europe, Japan
More production decisions moving to Asia
45 November 30, 2010
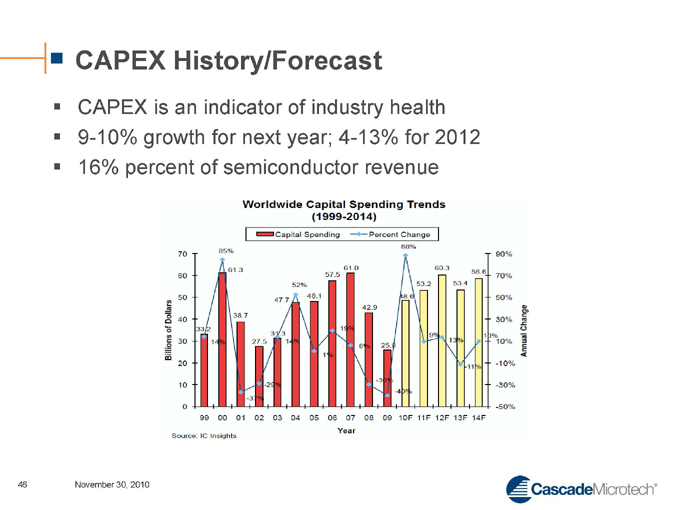
CAPEX History/Forecast
CAPEX is an indicator of industry health 9-10% growth for next year; 4-13% for 2012 16% percent of semiconductor revenue
46 November 30, 2010
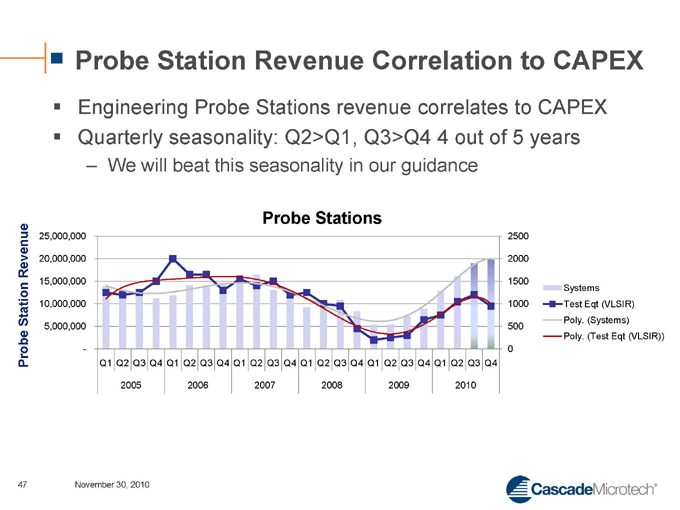
Probe Station Revenue Correlation to CAPEX
Engineering Probe Stations revenue correlates to CAPEX Quarterly seasonality: Q2>Q1, Q3>Q4 4 out of 5 years
– We will beat this seasonality in our guidance
Probe Stations
Probe Station Revenue
25,000,000
20,000,000
15,000,000
10,000,000
5,000,000
2500
2000
1500
1000
500
0
Systems
Test Eqt (VLSIR)
Poly. (Systems)
Poly. (Test Eqt (VLSIR))
Q1 Q2 Q3 Q4 Q1 Q2 Q3 Q4 Q1 Q2 Q3 Q4 Q1 Q2 Q3 Q4 Q1 Q2 Q3 Q4 Q1 Q2 Q3 Q4
2005
2006
2007
2008
2009
2010
47 November 30, 2010
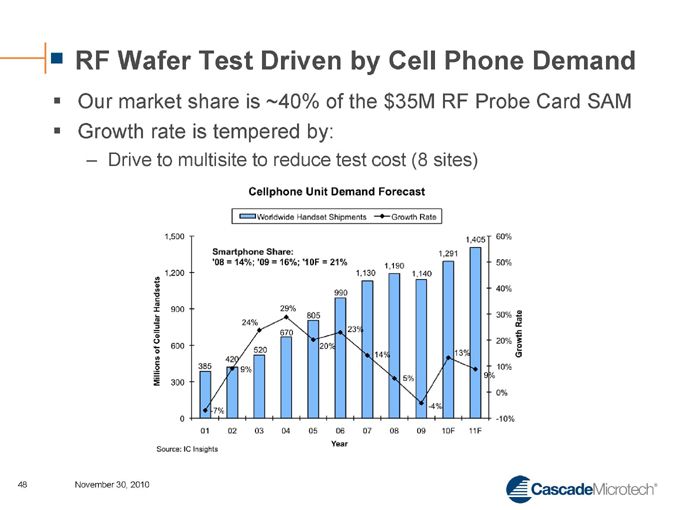
RF Wafer Test Driven by Cell Phone Demand
Our market share is ~40% of the $35M RF Probe Card SAM Growth rate is tempered by:
– Drive to multisite to reduce test cost (8 sites)
48 November 30, 2010
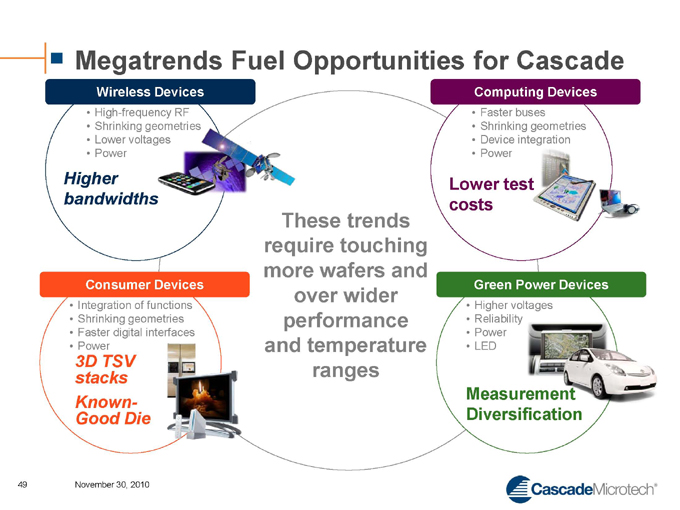
Megatrends Fuel Opportunities for Cascade
Wireless Devices
High-frequency RF
Shrinking geometries
Lower voltages
Power
Higher
bandwidths
Consumer Devices
Integration of functions
Shrinking geometries
Faster digital interfaces
Power
3D TSV
stacks
Known-
Good Die
These trends require touching more wafers and over wider performance and temperature ranges
Computing Devices
Faster buses
Shrinking geometries
Device integration
Power
Lower test costs
Green Power Devices
Higher voltages
Reliability
Power
LED
Measurement Diversification
49 November 30, 2010
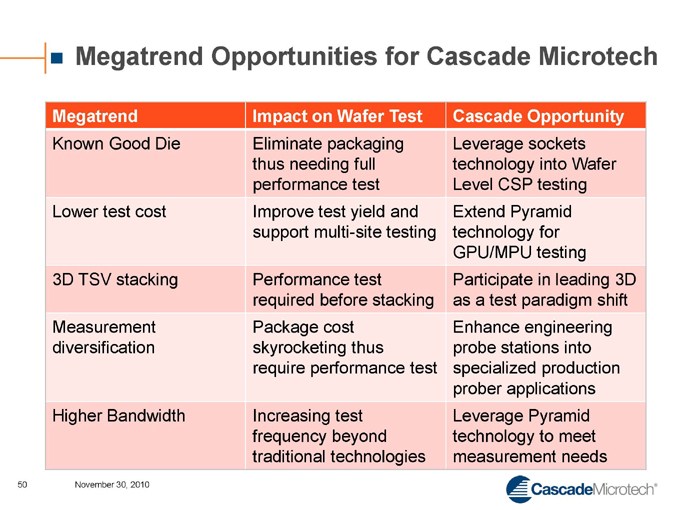
Megatrend Opportunities for Cascade Microtech
Megatrend Impact on Wafer Test Cascade Opportunity
Known Good Die Eliminate packaging thus needing full performance test Leverage sockets technology into Wafer Level CSP testing
Lower test cost Improve test yield and support multi-site testing Extend Pyramid technology for GPU/MPU testing
3D TSV stacking Performance test required before stacking Participate in leading 3D as a test paradigm shift
Measurement diversification Package cost skyrocketing thus require performance test Enhance engineering probe stations into specialized production prober applications
Higher Bandwidth Increasing test frequency beyond traditional technologies Leverage Pyramid technology to meet measurement needs
50 November 30, 2010
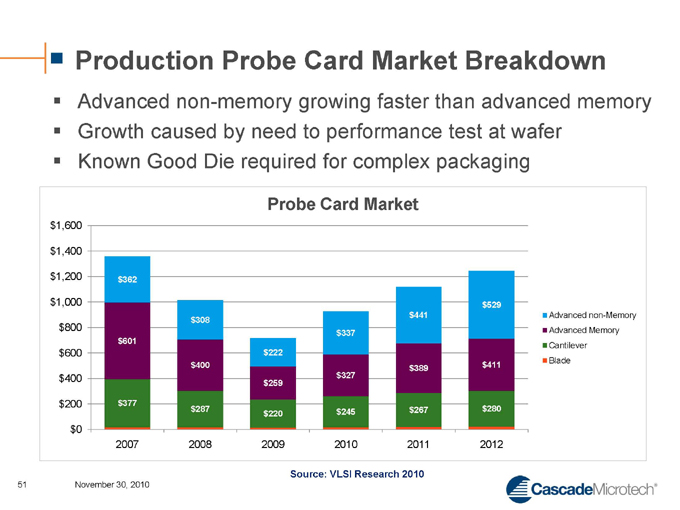
Production Probe Card Market Breakdown
Advanced non-memory growing faster than advanced memory Growth caused by need to performance test at wafer Known Good Die required for complex packaging
Probe Card Market
$1,600
$1,400
$1,200
$1,000
$800
$600
$400
$200
$0
$362
$601
$377
$308
$400
$287
$222
$259
$220
$337
$327
$245
$441
$389
$267
$529 $411 $280
Advanced non-Memory Advanced Memory Cantilever Blade
2007
2008
2009
2010
2011
2012
Source: VLSI Research 2010
51 November 30, 2010
Market Forecast Summary – 2011
Market will have good growth after fantastic growth Base probe station business will grow with CAPEX
– HBLED production will be stronger
Advanced non-memory production probe market is growing
– Market is ready for new Cascade Microtech products
52 November 30, 2010

Sales and Customer Support
Paul O’Mara
Vice President Sales and Support
Near Term Market Trends
300mm market strong in major semiconductor customers Applications a strong driver
– HBLEDs, Power
– Specialty probe stations (vacuum, cryogenic, board test) 150/200mm market strong in institutions/education Smart handset and PCs leading the way for production customers
54 November 30, 2010
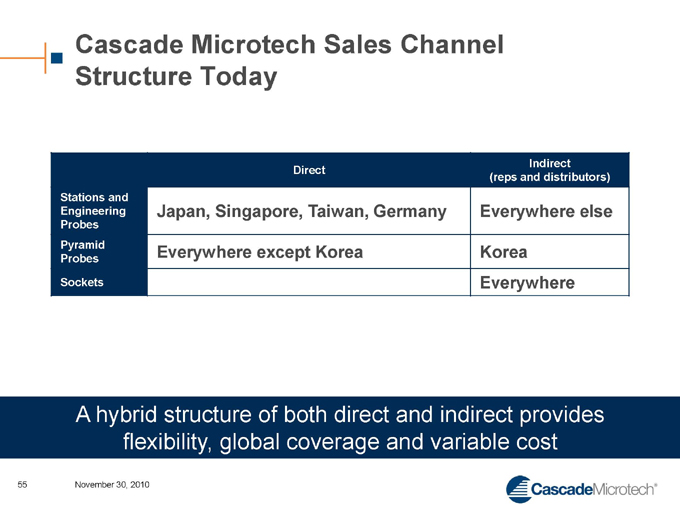
Cascade Microtech Sales Channel Structure Today
Direct Indirect (reps and distributors)
Stations and Engineering Probes Japan, Singapore, Taiwan, Germany Everywhere else
Pyramid Probes Everywhere except Korea Korea
Sockets Everywhere
A hybrid structure of both direct and indirect provides flexibility, global coverage and variable cost
55 November 30, 2010
Channel Initiatives
Cascade direct channel
– Selling Engineering Probes and ultimately accessories and small systems directly
– One world price Major account focus
– Taking top 20 global accounts direct
Top 20 customers represent 41% of revenue for 9 months ending September 2010
– Advantages
Allows Cascade to get closer to key accounts
Closer to key customer roadmaps
Expect deeper account penetration
56 November 30, 2010
Driving Revenue Growth
Close co-operation with the business units Engineering probes direct channel Tesla-Power Probe Station
– Power is a growth market
– Targeting accounts with power measurement needs
BlueRay Probe Station
– Targeting additional HBLED customers in high growth market
S-Technology Probe Card
– Successor to VLSI core technology
– Well received and now beginning to ramp
57 November 30, 2010
Superior technology and extraordinary support where and when you need it
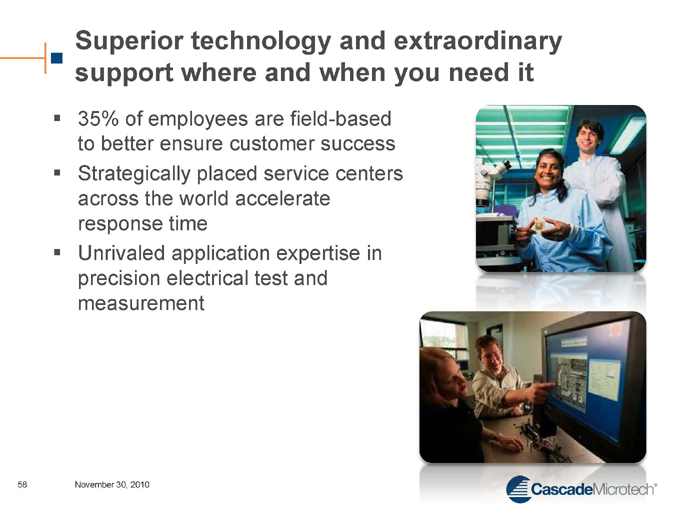
35% of employees are field-based to better ensure customer success Strategically placed service centers across the world accelerate response time Unrivaled application expertise in precision electrical test and measurement
58 November 30, 2010
Summary
Our markets are showing strength
Transitioning channel to gain greater direct access to our key customers, reduce selling costs, enhance competitive position and align with strategic initiatives Ready to take new product offerings to market Continue to invest in world class customer support
59 November 30, 2010
Business Units & R&D
Steve Harris
Executive Vice President
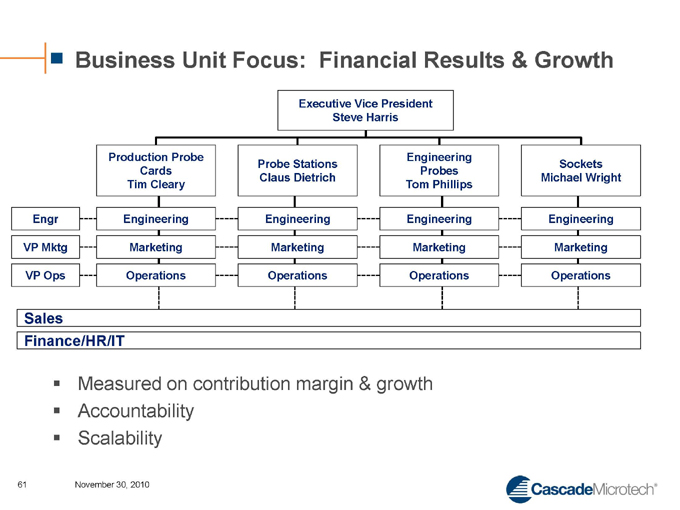
Business Unit Focus: Financial Results & Growth
Executive Vice President
Steve Harris
Production Probe Cards Tim Cleary Probe Stations Claus Dietrich Engineering Probes Tom Phillips Sockets Michael Wright
Engr Engineering Engineering Engineering Engineering
VP Mktg Marketing Marketing Marketing Marketing
VP Ops Operations Operations Operations Operations
Sales Finance/HR/IT
Measured on contribution margin & growth ??Accountability?? Scalability
61 November 30, 2010
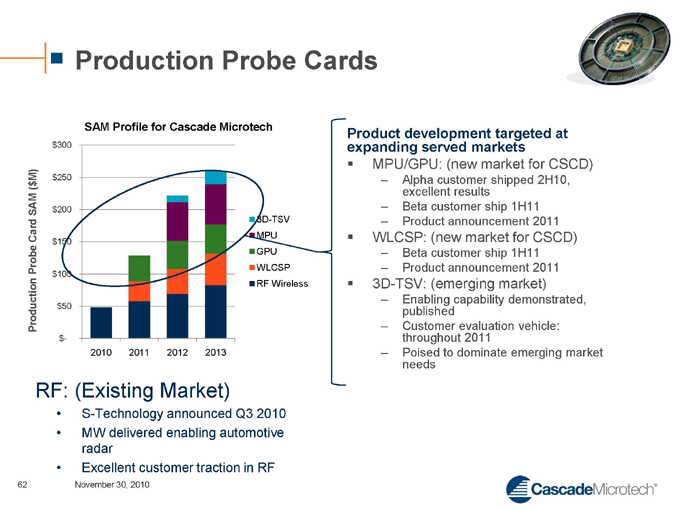
Production Probe Cards
Production Probe Card SAM ($M)
$300
$250
$200
$150
$100
$50
$-
2010
2011
2012
2013
3D-TSV
MPU
GPU
WLCSP
RF Wireless
Product development targeted at expanding served markets
MPU/GPU: (new market for CSCD)
– Alpha customer shipped 2H10, excellent results
– Beta customer ship 1H11
– Product announcement 2011
WLCSP: (new market for CSCD)
– Beta customer ship 1H11
– Product announcement 2011
3D-TSV: (emerging market)
– Enabling capability demonstrated, published
– Customer evaluation vehicle: throughout 2011
– Poised to dominate emerging market needs
RF: (Existing Market)
S-Technology announced Q3 2010
MW delivered enabling automotive radar
Excellent customer traction in RF
62 November 30, 2010
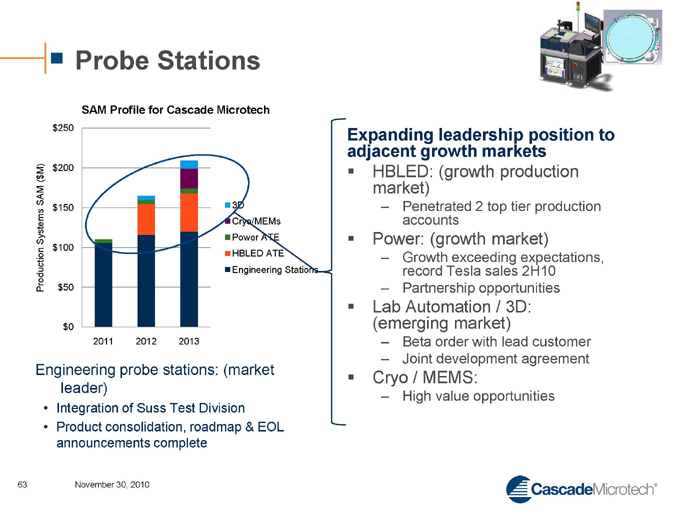
Probe Stations
SAM Profile for Cascade Microtech
Production Systems SAM ($M)
$250
$200
$150
$100
$50
$0
2011
2012
2013
3D Cryo/MEMs Power ATE HBLED ATE Engineering Stations
Expanding leadership position to adjacent growth markets
HBLED: (growth production market)
– Penetrated 2 top tier production accounts
Power: (growth market)
– Growth exceeding expectations, record Tesla sales 2H10
– Partnership opportunities
Lab Automation / 3D: (emerging market)
– Beta order with lead customer
– Joint development agreement
Cryo / MEMS:
– High value opportunities
Engineering probe stations: (market leader)
Integration of Suss Test Division
Product consolidation, roadmap & EOL announcements complete
63 November 30, 2010
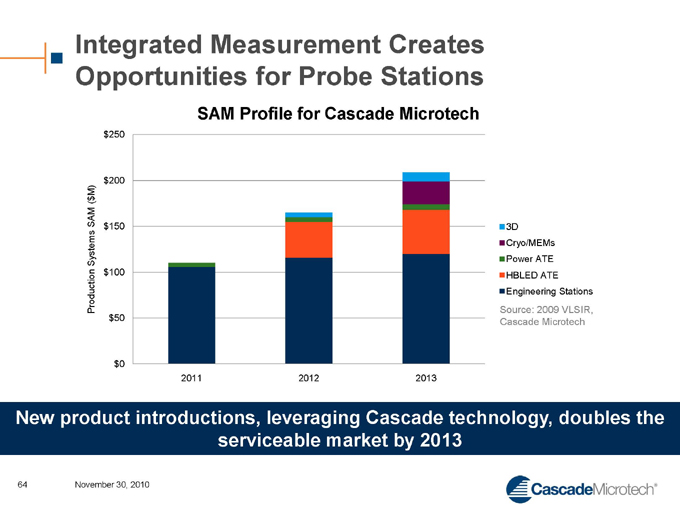
Integrated Measurement Creates Opportunities for Probe Stations
SAM Profile for Cascade Microtech
Production Systems SAM ($M)
$250
$200
$150
$100
$50
$0
2011
2012
2013
3D Cryo/MEMs Power ATE HBLED ATE Engineering Stations Source: 2009 VLSIR, Cascade Microtech
New product introductions, leveraging Cascade technology, doubles the serviceable market by 2013
64 November 30, 2010
Engineering Probes
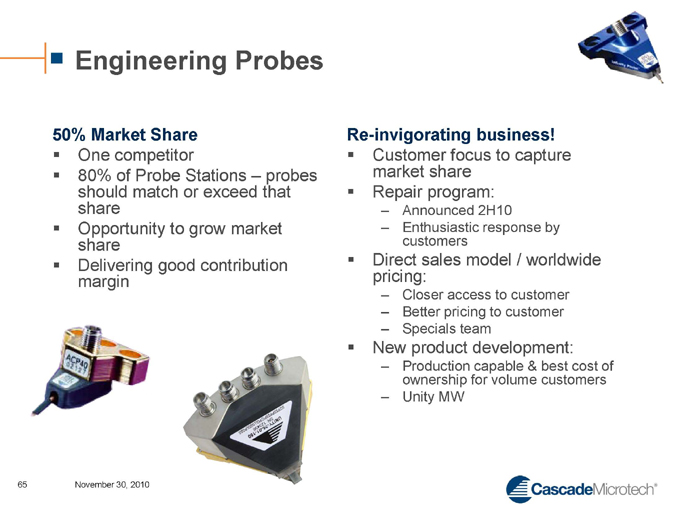
50% Market Share
One competitor
80% of Probe Stations – probes should match or exceed that share??Opportunity to grow market share??Delivering good contribution margin
Re-invigorating business!
Customer focus to capture market share??Repair program:
– Announced 2H10
– Enthusiastic response by customers
Direct sales model / worldwide pricing:
– Closer access to customer
– Better pricing to customer
– Specials team
New product development:
– Production capable & best cost of ownership for volume customers
– Unity MW
65 November 30, 2010
Facilities Consolidation
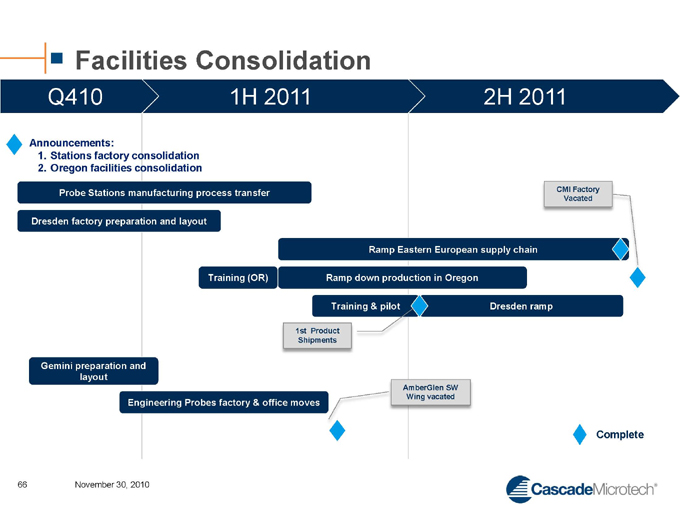
Q410
1H 2011
2H 2011
Announcements:
1. Stations factory consolidation
2. Oregon facilities consolidation
Probe Stations manufacturing process transfer
Dresden factory preparation and layout
Gemini preparation and layout
Engineering Probes factory & office moves
Training (OR)
Ramp Eastern European supply chain Ramp down production in Oregon Training & pilot Dresden ramp
CMI Factory Vacated
1st Product Shipments
AmberGlen SW Wing vacated
Complete
66 November 30, 2010
Summary
Success model driven by each business unit Metric driven culture
– Contribution margin
– Return on R&D
– Growth
Cost structure improvements
– Factory consolidations
– Supply chain leverage
– COGS and margin improvements
Business Units provide scalability, accountability
67 November 30, 2010
Cascade Microtech Highlights
Strong management team
– Focused on execution
Strong Who’s Who global customers
– Strong relationships mean strong partnerships Focused on delivering sustained profitability via new business model
– Encouraging results; improving balance sheet Investing in growth opportunities
– Strong differentiated leadership position Leveraging technology into high growth areas
68 November 30, 2010

Thank you
Investor Relations Day