 Cascade Microtech December 2013 Michael Burger, President & CEO Jeff Killian, Vice President & CFO Exhibit 99.1 |
 Safe Harbor and Non-GAAP Measures 2 This presentation includes “forward-looking” statements within the meaning of the Private Securities Litigation Reform Act of 1995. All statements other than statements of historical fact made in this presentation are forward-looking including, among others, statements regarding: anticipated growth of Cascade Microtech (the “Company”); market opportunities; new products; results of recent acquisitions; and the Company’s target model. All such statements are only predictions and are based on current expectations, estimates and projections about the Company’s business based in part on assumptions made by management. In evaluating these statements, you should specifically consider various factors, including: changes in demand for the Company’s products; trends in semiconductor R&D spending; the potential failure of expected market opportunities to materialize; potential delays in product introductions or market acceptance; potential loss of customers; general challenges in integrating acquired businesses; and other risks discussed from time to time in the Company’s Securities and Exchange Commission filings and reports, including the Company’s Annual Report on Form 10-K. Such forward-looking statements speak only as of the date on which they are made and the Company does not undertake any obligation to update any forward-looking statement to reflect events or circumstances after the date of this presentation. Please refer to the Appendix for a description and reconciliation of Non-GAAP financial measures used in this presentation: EBITDAS and adjusted EBITDAS. |
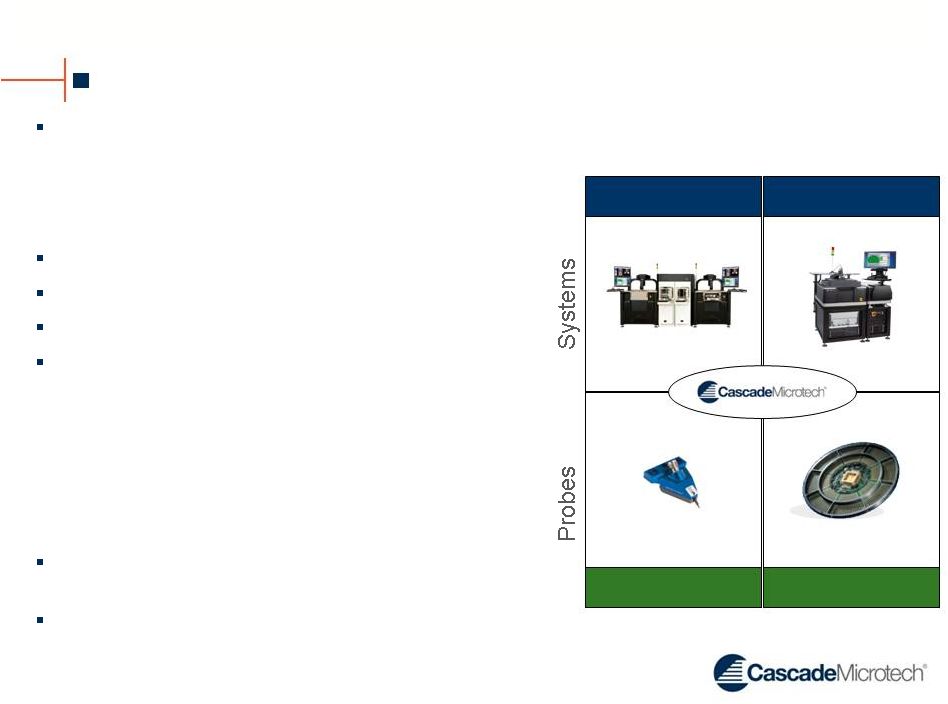 Cascade Microtech at a Glance 3 Cascade Microtech, Inc. (NASDAQ: CSCD) is a worldwide leader in precision mechanical, electrical measurements which aid in the test of integrated circuits (ICs), optical devices and other small structures Founded in 1983 Headquartered in Beaverton, OR >400 employees worldwide Dominant market share in our target markets – Focused on research and engineering communities within the semiconductor market – The majority of all new processes and device types are characterized using Cascade Microtech products Last twelve months (LTM) Revenue of $116M with 6% year on year growth LTM Adjusted EBITDAS of $14M with 16% year on year growth Engineering Test Systems Production Test Systems Engineering Probes Production Probe Cards Note: Revenue and adjusted EBITDAS do not include the impact of ATT Systems; includes RTP from Aug 1, 2013. (1) Adjusted EBITDAS is a non-GAAP measure, please refer to the Appendix for a reconciliation of this non-GAAP measure. We operate our business in two segments: Probes and Systems (1) |
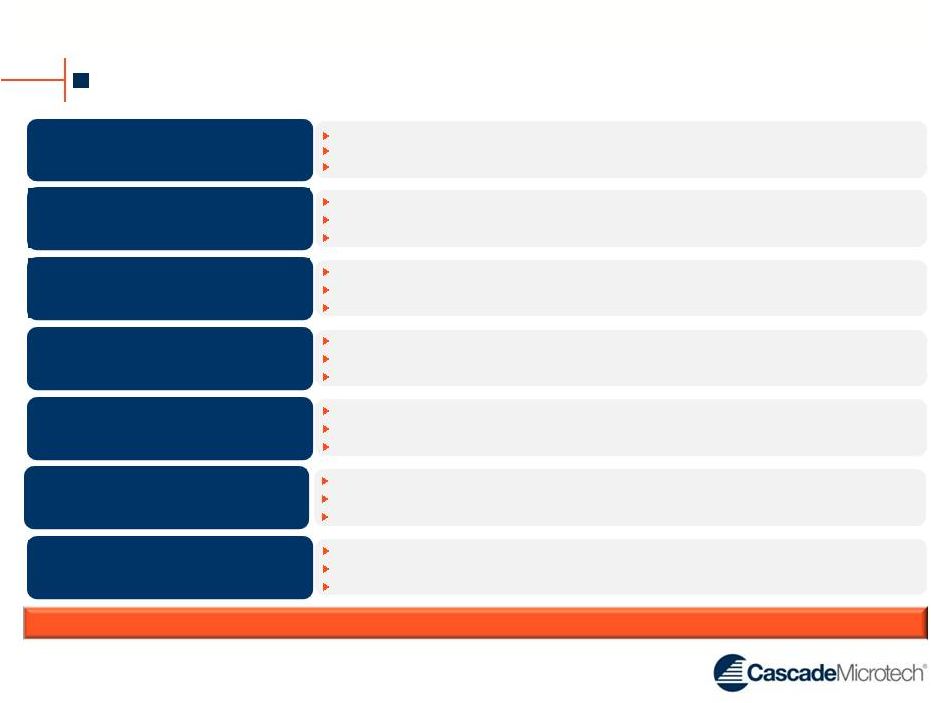
 New product introductions and recent acquisitions drive segment SAM expansion Strong revenue growth, expanding margins and cash flows with no debt Diversified blue-chip customers across major capex spenders Global service and support infrastructure aligned to customer locations Critical enabler of next generation process technologies Investment Highlights 4 Management team with a track record of execution and innovation Product portfolio well-suited to solve customers’ most complex test challenges |
 Cascade team capable of leveraging deep industry and operations expertise to drive results Cascade Microtech’s Seasoned Leadership 5 Michael Burger President & CEO Appointed President and CEO in 2010 Member of Board of Directors CEO experience: Merix Steven Harris Executive Vice President Appointed EVP in June 2009 Former Vice President of Research & Development at Electro Scientific Industries Served in a variety of product development and engineering positions at Tektronix Ellen Raim Vice President, HR Joined Cascade Microtech as Vice President of Human Resources in 2010 Served as Vice President of Human Resources at Electro Scientific Industries Former Director of World Wide Talent Acquisition at Intel Steve Mahon Vice President, Operations Joined Cascade Microtech as Vice President of Operations in 2010 Served as director of process engineering at TriQuint Semiconductor Former fabrication manager of Electronic Designs Debbora Ahlgren Vice President, Marketing Joined Cascade Microtech as Vice President of Marketing in 2012 Served as Vice President of Marketing at the CBA Group Former Senior Vice President of Sales and Marketing for OptimalTest Appointed CFO in 2010 Joined Cascade Microtech as Director of Finance in 2008 Held various position at TriQuint Semiconductor including treasurer, corporate controller Jeff Killian Vice President & CFO Robert Selley Vice President, Sales & Service Joined Cascade Microtech as Vice President of Sales and Service in 2013 Led the internationals sales organizations at both Apcon and ONPATH Technologies Served as Director of Sales Operations at Electro Scientific Industries |
 What is Wafer Probing? 6 On-wafer testing is a growing requirement – Identifies and characterizes performance on the wafer – Enables significantly improved yield – More cost effective than packaged test Advanced packaging accelerates trend – Cascade Microtech enables new developments at the wafer level Customer Wafer Cascade Systems Cascade Probes Contacting a Customer Circuit Wafer probing refers to the functional testing of semiconductor devices while they are still in wafer form |
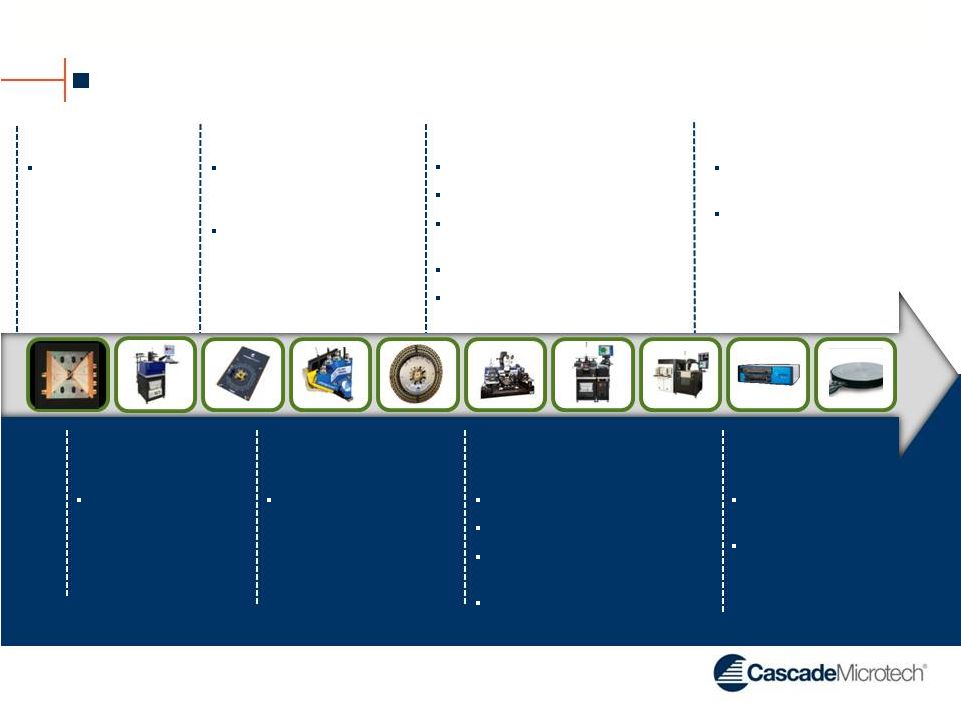 A Strong History of Innovation 2010 First multi-contact probe for small pads Acquires Test Division of SUSS MicroTec 2000 1990 HP invests in MicroChamber™ environment First RF-capable GHz probe card Infinity Probe® introduced 1980 First 18 GHz µw probe 1995 First double-sided probe system HF chucks for up to 200 GHz Alessi acquired for FA 1/f noise measurement system First HP device characterization system DC/RF parametric probe card New 300 mm on-wafer prober 1985 First submicron probe holder 2005 300 mm ‘vertical probe’ system First WLR system for 300 mm BlueRay high-speed production prober ProbeShield® technology Acquires Aetrium’s Reliability Test Business Acquires ATT Test Systems 2013 7 |
 Consumer Trends Fuel Growth Opportunities Wireless Devices • High-frequency RF • Shrinking geometries • Lower voltages • Power Higher data rates More data Consumer Devices • Faster digital interfaces • Video • IC packaging innovation Integration of functions Shrinking geometries Green Power Devices • Higher voltages • Higher current • Reliability • LED Lower cost of test Computing Devices • Faster buses • Shrinking geometries • Device integration • Power Measurement diversification Accelerating the Need for Cascade Microtech’s Products 8 |
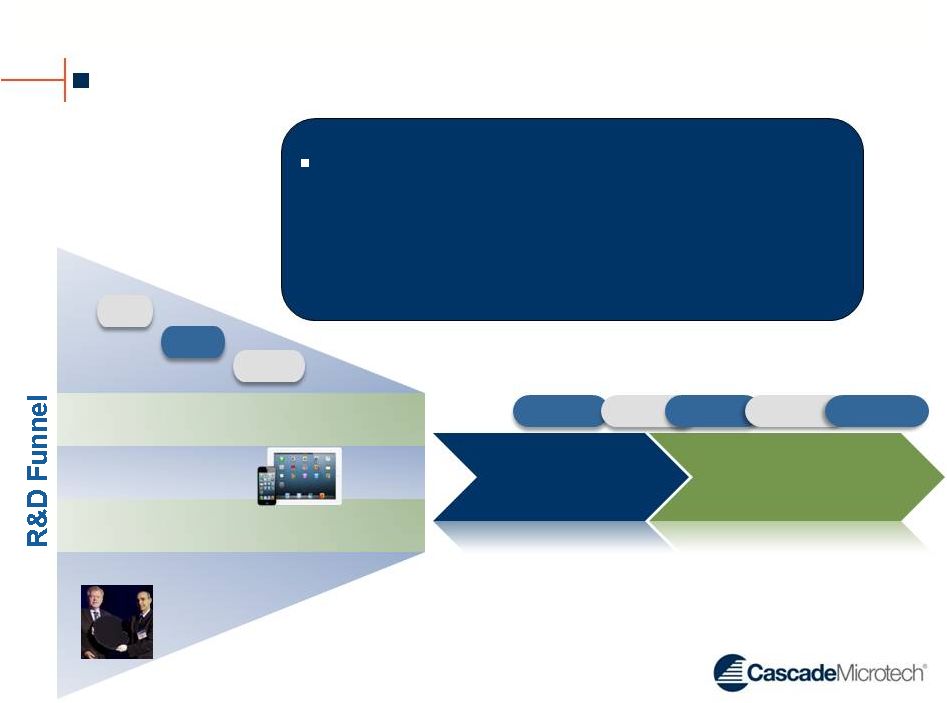 22 nm Cascade Microtech Growth Funnel Production (FAB) 90 nm 65 nm 32/45 nm 28 nm 1 Silicon Process nodes Technology integration & materials Device designs Wafer diameter 450 mm 20 nm 14 nm 5 nm HKMG FinFET RF-CMOS Growth funnel driven by - New process nodes - New technology integrations and materials - New device structures and device designs - New wafer geometries 9 Advanced packages Microbump TSV st |
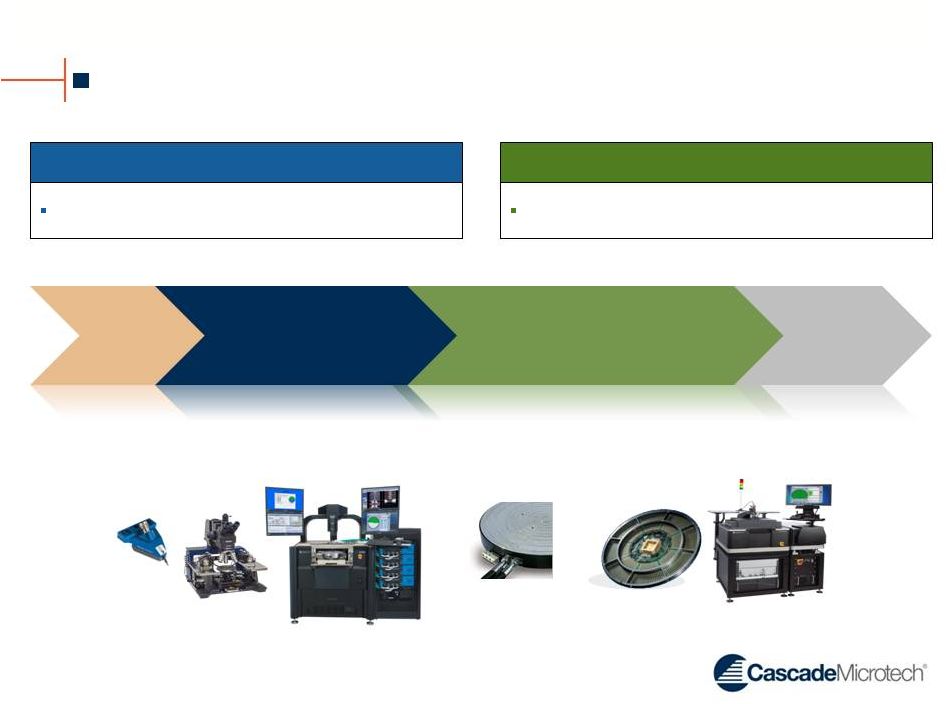 Products Cover Entire Semiconductor Lifecycle Production (FAB) Assembly & Test 1 Silicon Virtual design Support pre-production and validation activities Engineering Products Support application or production flow Production Products 10 Engineering Probes Engineering Probe Stations Reliability Test Products Production Probe Cards Production Probers (HBLED & High Power) st Thermal Systems |
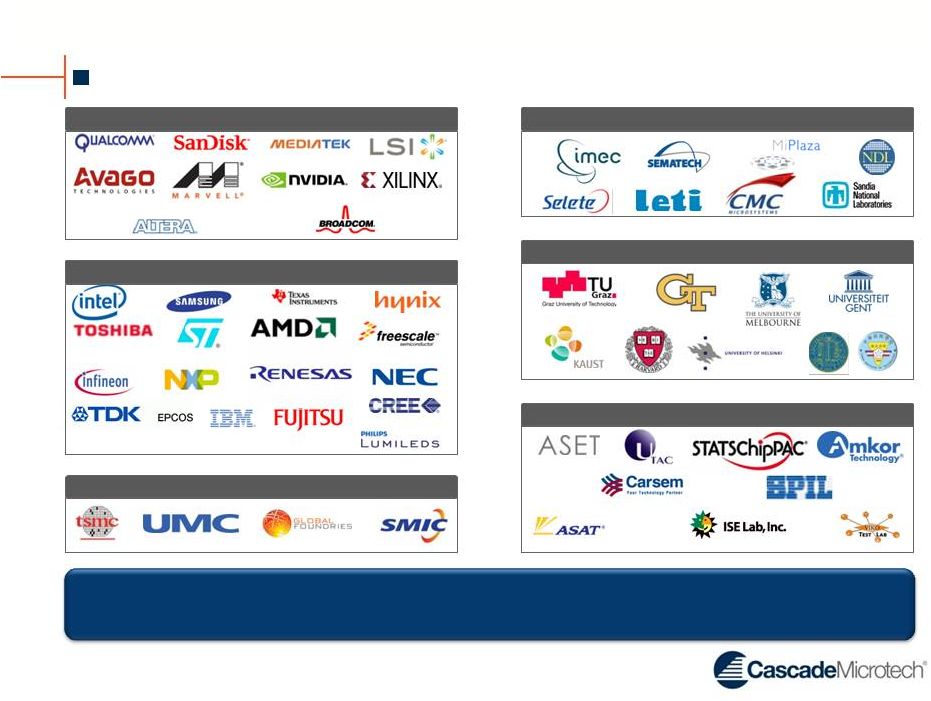 Outstanding Customers in All Major Sectors 11 Fabless Government/Institute Research Integrated Device Manufacturer University Research Subcons Foundry The Who’s Who of the semiconductor industry with minimal concentration |
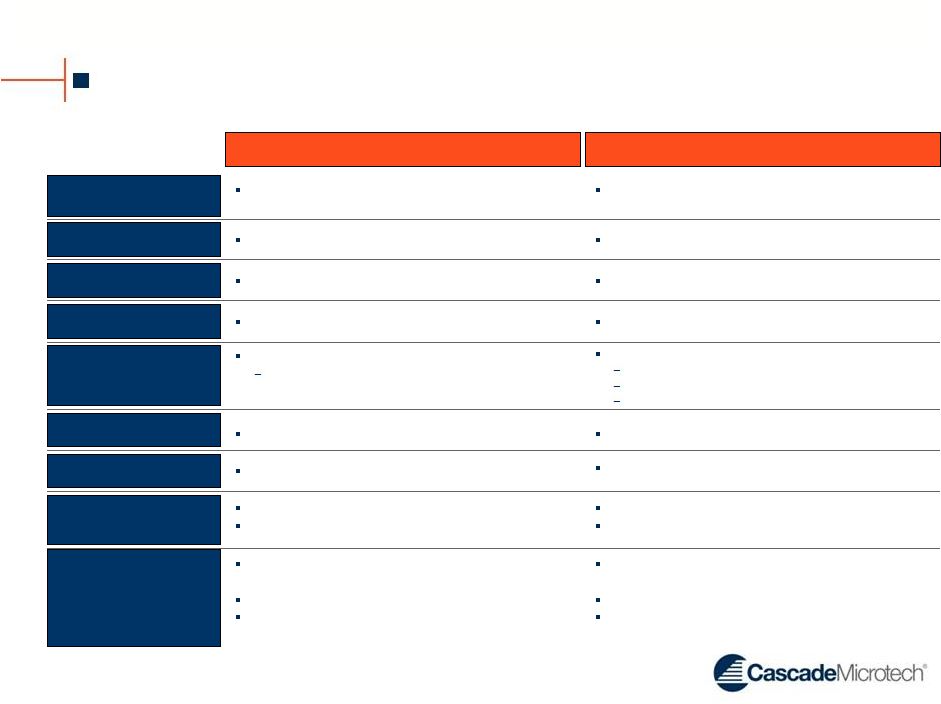
 12 Market Industry Participants Market Share Comments Systems Engineering Probes Production Probe Cards Focused primarily on engineering applications Accretech and TEL not competitors Production platforms aimed at HB-LED and Power markets Significant long term opportunity in 450mm Relatively small, but stable market Addresses nearly all of the market and has 50% share today Large, highly-fragmented market Do not compete in memory CSCD focuses only on advanced test Strong position in RF with leading global semiconductor vendors Large opportunity in SoC Significant Market Opportunities Growth & acquisitions $654M $210M $100M $310M TAM SAM $39M $35M TAM SAM $1.2B $59M TAM SAM |
 CM300 300mm lab probe station – Scalable configurations with enhancement roadmap – Semi- or fully- automated – New Velox™ test automation software – Announced January, 2013; Units shipped to customers APS200TESLA fab prober (Power) – Advanced power IC testing with safety and anti-arcing technology – Addressing an emerging $20 billion IC market; $60 million SAM – 3”-, 4”-, 6”- and 8”- wafer capable, production prober – Capable of withstanding up to 10.5 kV and 400 Amps – Announced in Q2 2012; First shipments in Q3 2013 SMART150 lab probe station – Protect extensive installed base of manual probe stations – Address customer pain points with focused applications (mmW, RF, others) – Flexibility and scalability through upgradeable configurations – Announced in Q3 2012; Now shipping in volume 13 New Products, Expanding Markets New products are aligned with market/customer requirements and expand Cascade’s SAM |
 Acquisitions: Aetrium’s RTP Products & ATT Systems Closing Date Purchase Price LTM Revenue LTM EBITDA Valuation Multiple Year Founded Headquarters Aetrium’s Reliability Test Products ATT Test Systems 10/1/13 7/31/13 2001 First Product released in 1998 Munich, Germany North St. Paul, MN $2.4M in cash Additional $1.0M upon achievement of certain milestones $10.3M (2) $3.3M (1) $0.6M (1) 1.0x LTM Revenue 6.0x LTM EBITDA $26.9 M $11.2M in cash at close $1.0M deferred cash payment 1.6M shares of CSCD Stock ~2.6x LTM Revenue ~6.2x LTM EBITDA $4.4M (2) (1) Based on Aetrium 8-K filed July 31, 2013. EBITDA based on GAAP operating income. (2) Annualized using the unaudited 11 months ending October 1, 2013 14 Business Description Offers package- and wafer-level reliability solutions for wafer process technologies A leading manufacturer of advanced thermal systems used in testing of semiconductor wafers Strategic Rationale Expands wafer-level reliability (WLR) test capabilities Enables Cascade to offer complete WLR solution Leverage Cascade’s sales channel and global support organization to drive additional revenue Accelerates development of next-generation system products with thermal capabilities Current installed base of 1,500+ systems Lowers product cost through vertical integration of high-cost components |
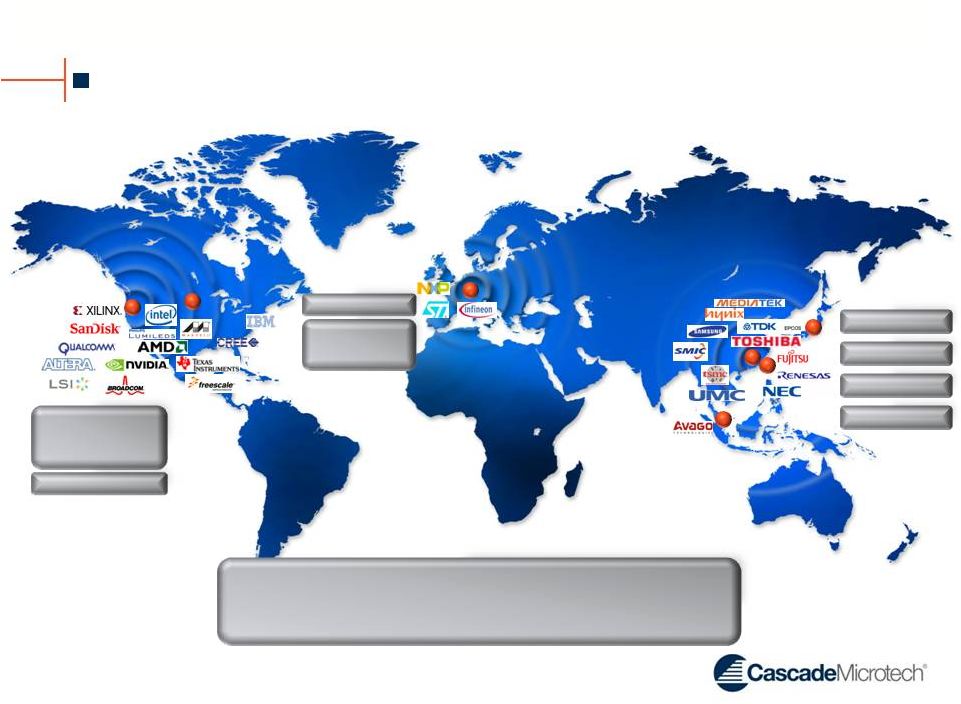 Global Support Infrastructure Aligned with Customer Centers 15 • Coverage of all major engineering & production areas worldwide • Over 1,700 active customers • Nearly 8,000 probe stations installed worldwide • Cascade Microtech Certified Pre-owned business launched in 2012 Headquarters Beaverton, OR Manufacturing, Customer Operations North St Paul, Minnesota Reliability Test Products Munich, Germany ATT Systems & Customer Operations Dresden, Germany Manufacturing Japan Customer Operations Shanghai Customer Operations Taiwan Customer Operations Singapore Customer Operations |
 Key Financials |
 Financial Highlights Strong Growth Complementary acquisitions expected to accelerate growth; achieved 30% revenue CAGR from 2009 to 2012 Improving Margins Success model goals of 50% gross margins and 20% EBITDAS; Generated 45% gross margins and 12% Adjusted EBITDAS margins over LTM (9/30/13) Commitment to Investing in R&D Continued investment in R&D further builds upon technology leadership position Stable Revenue with Consistent Profitability Revenue has been much less cyclical than broader semi cap equipment industry Positive earnings for last 8 consecutive quarters Strong Balance Sheet Strong cash position with no debt 17 Newly introduced products expected to contribute to long-term growth Minimal CapEx requirements (1) (1) (1) EBITDAS and Adjusted EBITDAS are non-GAAP measures, please refer to the Appendix for a reconciliation of these non-GAAP measures. |
 Track Record of Revenue Growth and Profitability 18 Revenue Adjusted EBITDAS 2010: Strong recovery with market improvement and M&A 2011: Growth outpaced the market and totaled 13% 2012: Consistently strong performance quarter over quarter 2013: Record Q3 and LTM revenue EPS (1) (2) Note: Graphs do not include the impact of ATT Systems. Note: LTM Revenue represents the revenue for the 4 consecutive quarters ending 9/30/2013 (1) Adjusted EBITDAS is a non-GAAP measure, please refer to the Appendix for a reconciliation of this non-GAAP measure (2) Earnings per share (EPS) shown is diluted EPS from continuing operations |
 Strong Balance Sheet 19 $21 million in cash and investments Debt free $10 million revolving credit facility (1) Pro forma (PF) based on 8K/A filed December 2013 Note: 3/31/10 is first quarter after Suss Microtech acquisition cost of $15.6M in cash and 0.7M shares of Cascade Microtech stock Assets 3/31/2010 12/31/2011 12/31/2012 9/30/2013 PF (1) Cash and Investments $23 $15 $23 $32 $21 Accounts Receivable 13 24 21 18 19 Inventory 22 24 24 23 26 Prepaid and other current 5 5 4 3 4 Total Current $63 $68 $72 $76 $70 Fixed Assets 12 9 8 7 7 Goodwill & purchased Intangibles 5 3 3 4 30 Other Assets 3 3 2 2 2 Total Assets $83 $83 $85 $89 $109 Liabilities Accounts Payable $5 $6 $6 $6 $6 Accrued Liabilities 6 8 7 6 7 Other Current Liabilities 1 6 3 1 1 Total Current Liabilities $12 $20 $16 $13 $14 Other Long-Term Liabilities 4 4 3 3 8 Total Liabilities $16 $24 $19 $16 $22 Shareholders' Equity Equity 67 59 66 73 87 Total Liabilities and Equity $83 $83 $85 $89 $109 |
 Attractive Margin Structure 20 2010 2011 2012 Q1 2013 Q2 2013 Q3 2013 Revenue 100% 100% 100% 100% 100% 100% Gross Margin 38% 40% 44% 42% 47% 48% Adjusted EBITDAS(1) 3% 7% 12% 9% 14% 13% Target Success Model 100% 50% 20% Poised to leverage growth driven by new products and market expansion Supply chain efficiencies Channel leverage (1) Adjusted EBITDAS is a non-GAAP measure, please refer to the Appendix for a reconciliation of this non-GAAP measure. |
 Investment Highlights 21 Critical enabler of next generation process technologies Critical enabler of next generation process technologies Strong revenue growth and cash flows with expanding margins Strong revenue growth and cash flows with expanding margins Management team with a track record of execution and innovation Management team with a track record of execution and innovation Diversified blue-chip customers across major capex spenders New product introductions and recent acquisitions drive segment SAM expansion Global service and support infrastructure aligned to customer locations Product portfolio well-suited to solve customers’ most complex test challenges |
 Appendix |
 Appendix: Reconciliations of GAAP to Non-GAAP Financial Measures In this presentation we use the following Non-GAAP financial measures, which we define in this Appendix and reconcile to GAAP financial measures : EBITDAS and Adjusted EBITDAS. Definitions: – EBITDAS is defined as operating income from continuing operations before depreciation and amortization and stock-based compensation. EBITDAS should not be construed as a substitute for net income or net cash provided by (used in) operating activities (all as determined in accordance with GAAP) for the purpose of analyzing the Company’s operating performance, financial position and cash flows, as EBITDAS is not defined by GAAP. However, the Company regards EBITDAS as a complement to net income and other GAAP financial performance measures, including an indirect measure of operating cash flow. – Adjusted EBITDAS is defined as operating income from continuing operations before depreciation and amortization and stock-based compensation and certain other items (adjustments) such as restructuring, facility move and project costs, and acquisition related expenses that the Company believes are not representative of its ongoing operating performance. Adjusted EBITDAS should not be construed as a substitute for net income or net cash provided by (used in) operating activities (all as determined in accordance with GAAP) for the purpose of analyzing the Company’s operating performance, financial position and cash flows, as adjusted EBITDAS is not defined by GAAP. However, the Company regards adjusted EBITDAS as a complement to net income and other GAAP financial performance measures, including an indirect measure of operating cash flow. 23 |
 Reconciliation of Pro Forma to GAAP 24 Twelve Months Ended December 31, 2013 Quarterly Data Nine Months Ended September 30, Twelve Months Ended September 30, 2010 2011 2012 Q1 2013 Q2 2013 Q3 2013 2012 2013 2012 2013 Revenue 92,597 104,610 112,962 27,471 30,307 28,197 82,594 85,975 109,892 116,343 Reconciliation to EBITDAS Income (Loss) from Operations (8,108) (4,190) 7,557 1,041 2,517 1,571 5,273 5,129 6,388 7,413 Depreciation and Amortization 4,374 4,559 4,629 1,200 1,176 1,146 3,407 3,522 4,505 4,744 Stock Based Comp 1,836 1,853 1,459 334 538 343 1,136 1,215 1,528 1,538 EBITDAS (1,898) 2,222 13,645 2,575 4,231 3,060 9,816 9,866 12,421 13,695 EBITDAS % -2.0% 2.1% 12.1% 9.4% 14.0% 10.9% 11.9% 11.5% 11.3% 11.8% Reconciliation to Adjusted EBITDAS EBITDAS (1,898) 2,222 13,645 2,575 4,231 3,060 9,816 9,866 12,421 13,695 Restructuring 2,684 3,418 - - 112 - - 112 3 112 Acquisition and Acquisition Related 2,056 - - - - 627 - 627 - 627 Facility Consolidation and Other 23 1,174 - - - - - - 41 - Adjusted EBITDAS 2,865 6,814 13,645 2,575 4,343 3,687 9,816 10,605 12,465 14,434 Adjusted EBITDAS % 3.1% 6.5% 12.1% 9.4% 14.3% 13.1% 11.9% 12.3% 11.3% 12.4% |