UNITED STATES
SECURITIES AND EXCHANGE COMMISSION
Washington, D.C. 20549
FORM N-CSR
CERTIFIED SHAREHOLDER REPORT OF REGISTERED
MANAGEMENT INVESTMENT COMPANIES
Investment Company Act file number: (811- 06128 )
Exact name of registrant as specified in charter: Putnam New Opportunities Fund
Address of principal executive offices: One Post Office Square, Boston, Massachusetts 02109
Name and address of agent for service: Beth S. Mazor, Vice President
One Post Office Square
Boston, Massachusetts 02109
Copy to: John W. Gerstmayr, Esq.
Ropes & Gray LLP
One International Place
Boston, Massachusetts 02110
Registrant’s telephone number, including area code: (617) 292-1000
Date of fiscal year end: June 30, 2006
Date of reporting period: July 1, 2005—June 30, 2006
Item 1. Report to Stockholders:
The following is a copy of the report transmitted to stockholders pursuant
to Rule 30e-1 under the Investment Company Act of 1940:
What makes Putnam different?

In 1830, Massachusetts Supreme Judicial Court Justice Samuel Putnam established The Prudent Man Rule, a legal foundation for responsible money management.
THE PRUDENT MAN RULE
All that can be required of a trustee to invest is that he shall conduct himself faithfully and exercise a sound discretion. He is to observe how men of prudence, discretion, and intelligence manage their own affairs, not in regard to speculation, but in regard to the permanent disposition of their funds, considering the probable income, as well as the probable safety of the capital to be invested.

A time-honored tradition in money management
Since 1937, our values have been rooted in a profound sense of responsibility for the money entrusted to us.
A prudent approach to investing
We use a research-driven team approach to seek consistent, dependable, superior investment results over time, although there is no guarantee a fund will meet its objectives.
Funds for every investment goal
We offer a broad range of mutual funds and other financial products so investors and their financial representatives can build diversified portfolios.
A commitment to doing what’s right for investors
We have below-average expenses and stringent investor protections, and provide a wealth of information about the Putnam funds.
Industry-leading service
We help investors, along with their financial representatives, make informed investment decisions with confidence.
| Putnam New Opportunities Fund |
| 6| 30| 06 Annual Report |
| Message from the Trustees | 2 |
| About the fund | 4 |
| Report from the fund managers | 7 |
| Performance | 12 |
| Expenses | 15 |
| Portfolio turnover | 17 |
| Risk | 18 |
| Your fund’s management | 19 |
| Terms and definitions | 22 |
| Trustee approval of management contract | 24 |
| Other information for shareholders | 29 |
| Financial statements | 30 |
| Federal tax information | 56 |
| Brokerage commissions | 57 |
| About the Trustees | 58 |
| Officers | 64 |
| Cover photograph: Vineyard, Napa County, California © Charles O’Rear |
Message from the Trustees
Dear Fellow Shareholder
Over the last two months of your fund’s reporting period, investors were particularly preoccupied with the course of the economy. A more pessimistic outlook pervaded the markets in May and June as leading economic indicators began to warn of slower growth and the Federal Reserve (the Fed) continued its series of interest-rate increases. The resulting correction undercut much of the progress that markets had achieved in the first four months of 2006.
However, we believe that today’s higher interest rates, far from being a threat to global economic fundamentals, are in fact an integral part of them. These higher rates are bringing business borrowing costs closer to the rate of return available from investments. At some point, this could mean that economic growth may, indeed, slow somewhat, but we consider this a typical development for the middle of an economic cycle, and one that could help provide the basis for a longer and more durable business expansion and a continued healthy investment environment.
We believe the recent correction has brought valuations back to attractive levels and created opportunities in a wide array of markets and sectors. You can be assured that the investment professionals managing your fund are working to take advantage of these opportunities as they arise. Moreover, Putnam Investments’ management team, under the leadership of Chief Executive Officer Ed Haldeman, continues to focus on investment performance and remains committed to putting the interests of shareholders first.
2
We would like to take this opportunity to announce the retirement of one of your fund’s Trustees, John Mullin, who has been an independent Trustee of the Putnam funds since 1997. We thank him for his service. In the following pages, members of your fund’s management team discuss the fund’s performance and strategies for the fiscal period ended June 30, 2006, and provide their outlook for the months ahead. As always, we thank you for your support of the Putnam funds.
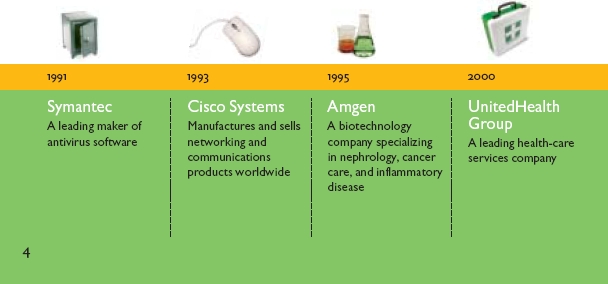
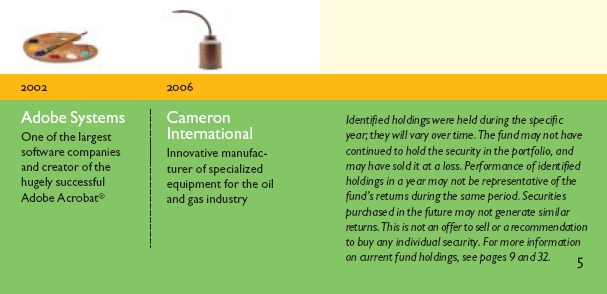
| Putnam New Opportunities Fund: investing through 15 years of unprecedented innovation |
Long before most Americans could imagine the Internet, digital music files, or owning a cell phone small enough to fit in their pockets, Putnam New Opportunities Fund was seeking growth potential in emerging, cutting-edge companies. The fund was also targeting stocks in more traditional industries, such as restaurants, retail stores, health care, and broadcasting, which can also offer strong growth potential.
For example, among the holdings in the fund’s portfolio shortly after the fund was introduced in 1990 was the stock of Symantec, then a 9-year-old emerging software company. Today, Symantec is a leading maker of antivirus software, which has seen explosive demand as the Internet and computer networks have become an essential component of everyday life.
The managers of the fund focus on bottom-up stock selection in seeking above-average growth for investors. Putnam’s in-house research organization, whose dedicated analysts work in teams, helps the management teams find growth stocks that other investors may have overlooked. The specialized expertise of these Putnam analysts, who visit with the managements of thousands of companies each year, is critical to the success of the fund’s growth strategy.
An important benefit of the fund’s strategy is its flexibility— it diversifies across a range of industries and capitalizations. The fund can invest in smaller companies that are in their emerging- or expansionary-growth phases, and these companies can remain in the

| Putnam New Opportunities Fund’s holdings have spanned many sectors and industries over time. |
fund’s portfolio until they grow to become market leaders.
Of course, historically, markets have been volatile at times for growing companies; the growth potential offered by these stocks comes with the risk of greater price fluctua-tions. Combining small-cap stocks with the stocks of larger, well-established companies provides a more diversified approach to help manage those risks.
While it seems likely that the next decade will bring as many extraordinary changes as the last one, the teams managing Putnam New Opportunities Fund will continue to focus on capturing growth potential for investors.
The fund invests some or all of its assets in small and/or midsize companies. Such investments increase the risk of fluctuations in the value of your investment. Stocks with above-average earnings growth may be more volatile, especially if earnings do not continue to grow.
| In-depth analysis is key to successful stock selection. |
Drawing on the expertise of a dedicated team of stock analysts, the fund’s management teams seek attractive growth stocks. Once a stock is selected for the portfolio, it is regularly assessed by the members of the teams to ensure that it continues to meet their criteria, including:
Growth They examine each company’s financials, including its sales and earnings, and target those believed to offer growth potential.
Quality They look for high-quality companies, seeking characteristics such as solid management teams, sound business models, a record of strong performance, and high levels of free-cash flow.
Valuation They carefully consider how each stock is valued, seeking stocks whose valuations are attractive relative to the company’s growth potential.
Putnam New Opportunities Fund has a multi-cap strategy, seeking to invest in the highest-quality large-cap companies as well as small- and mid-cap growth companies. The fund’s management team seeks to identify dynamic companies that are positioned in sectors believed to offer above-average growth potential. The fund may be appropriate for investors who are seeking long-term capital appreciation potential from stocks of small, midsize, and large companies.
Highlights
| * For the 12 months ended June 30, 2006, class A shares of Putnam New Opportunities Fund returned 9.90% without sales charges. * Over the same period, the fund’s benchmark, the Russell 3000 Growth Index, returned 6.84% . * The average return for the fund’s Lipper category, Multi-Cap Growth Funds, was 10.44% . * Additional fund performance, comparative performance, and Lipper data can be found in the performance section beginning on page 12. |
| Performance Total return for class A shares for periods ended 6/30/06 |
| Since the fund’s inception (8/31/90), average annual return is 13.78% at NAV and 13.39% at POP. | ||||
| Average annual return | Cumulative return | |||
| NAV | POP | NAV | POP | |
| 10 years | 3.56% | 3.01% | 41.92% | 34.47% |
| 5 years | –0.96 | –2.02 | –4.69 | –9.70 |
| 3 years | 11.72 | 9.72 | 39.43 | 32.10 |
| 1 year | 9.90 | 4.12 | 9.90 | 4.12 |
Data is historical. Past performance does not guarantee future results. More recent returns may be less or more than those shown. Investment return and principal value will fluctuate, and you may have a gain or a loss when you sell your shares. Performance assumes reinvestment of distributions and does not account for taxes. Returns at NAV do not reflect a sales charge of 5.25% . For the most recent month-end performance, visit www.putnam.com. A short-term trading fee of up to 2% may apply.
6
| Report from the fund managers |
The year in review
Your fund’s 2006 fiscal year can be characterized as one in which the market environment was generally supportive of growth stocks. However, near the end of the period, a pronounced market downturn created challenges for the fund. Despite this difficult period, strong stock selection enabled the fund to outperform its benchmark, the Russell 3000 Growth Index, based on results for the period at net asset value (NAV, or without sales charges). The fund avoided major sector bets, instead favoring an approach that combines moderate thematic concentrations across sectors with rigorous, bottom-up stock picking, and systematic risk management at the stock and portfolio level. Nonetheless, some funds in the same Lipper peer group maintained heavier concentrations in certain better-performing sectors, causing the fund to lag the peer group’s average.
Market overview
Throughout most of the fund’s 2006 fiscal year, the market rewarded the solid business fundamentals and favorable earnings prospects of many growth-oriented companies. Supported by continuing economic expansion, companies increased their productivity, hired new employees, strengthened their balance sheets, and posted strong earnings results. Small- and mid-cap stocks led a sustained growth-stock rally as market volatility remained low. All of this changed in May, when the U.S. equity market corrected and many of the stocks that had advanced the most suffered the greatest declines. Growth stocks around the world moved lower in lockstep, severely reducing the effectiveness of risk-management techniques that rely on diversification across an array of markets and sectors.
The sudden and sharp sell-off in May and the early part of June was fairly typical for growth-style investing. Market participants, led by large institutional investors, buy stocks based on forecasts of strong earnings momentum and estimates of fundamental value. As more investors accumulate the same stocks, prices are driven up to a level at which investors begin to reassess the risk inherent in their earnings and valuation forecasts. At that point, the collective reaction is often a pronounced
7
sell-off designed to bring prices back to levels that are more in line with earnings expectations and valuations. Normally, if broader business and economic conditions remain favorable, such price declines are often a relatively short-lived phenomenon.
Strategy overview
Our goal is to invest in a limited number of stocks in order to better focus our research and analysis on what we consider to be the most attractive opportunities in the growth-stock universe. Specifically, we look for high-quality growth companies with favorable valuations. As such, our stock-selection strategy is based on three fundamental criteria: quality of the company, near-term growth prospects, and a valuation forecast that meets our parameters. Because our view of each stock is informed by all three of these criteria, the fund has the advantage of potentially favorable market positioning whether the market is rewarding one, two, or all three of these factors.
Although it is not a key consideration for many growth managers, valuation is a central component of our investment process. Our approach to valuing companies incorporates both historical financial data and forward-looking scenario analyses that enable us to examine a range of possible outcomes. The key elements that we consider when valuing a company include the
| Market sector performance |
These indexes provide an overview of performance in different market sectors for the 12 months ended 6/30/06.
| Equities | |
| Russell 3000 Growth Index (multi-cap growth stocks) | 6.84% |
| Russell Midcap Growth Index (midsize-company growth stocks) | 13.04% |
| S&P 500/Citigroup Value Index (large-company value stocks) | 14.90% |
| MSCI EAFE Index (international stocks) | 26.56% |
| Bonds | |
| Lehman Aggregate Bond Index (broad bond market) | -0.81% |
| Lehman Government Bond Index (U.S. Treasury and agency securities) | -1.16% |
| Citigroup World Government Bond Index (global government bonds) | -0.36% |
8
company’s price-to-free-cash-flow ratio, which measures its ability to generate cash flow relative to its current market valuation. We also examine each company’s operating profit margin and look for those companies that we believe have the potential to expand their margins. We then break companies down into 21 distinct market sectors and rank them in comparison to other companies with similar growth potential, operating margins, competitive environments and capital requirements. Finally, in order to gauge current market sentiment toward a company, we consider other indicators such as analysts’ earnings forecasts.
Your fund’s holdings
The fund maintained an overweight position in the basic materials sector throughout the fiscal year, enabling it to benefit substantially from the exceptional performance of companies such as Phelps Dodge, the world’s second-largest copper producer. The price of copper hit record highs during the second half of calendar 2005, bolstering the firm’s cash flow and earnings, and driving the stock’s price up by more than 76% over the fiscal period. While we believe the long-term trend for copper prices remains favorable, we took profits by trimming the fund’s position prior to the end of the period based on our assessment of the stock’s near-term valuation.
| Comparison of top industry weightings |
This chart shows how the fund’s top weightings have changed over the last six months.
Weightings are shown as a percentage of net assets. Holdings will vary over time.
9
Apple Computer was one of the fund’s largest technology holdings for a significant portion of the fund’s fiscal year and delivered outstanding performance. The success of the firm’s iPod products had the effect of reawakening the Apple brand. As iPod sales volume exploded, the firm’s computer sales expanded as well. Following a steady advance in the stock’s price during the first half of the fund’s fiscal year, we took profits and exited the position on valuation concerns.
Reflecting rising oil and natural gas prices and increased drilling and refining activity, the fund’s energy holdings were also standout performers for the year. Stock of Frontier Oil, which specializes in refining heavy crude oil as opposed to light, sweet crude, has appreciated dramatically over the past 12 months as its earnings exceeded forecasts. Likewise, the stock of Cameron International, a manufacturer of oil and gas pressure control and separation equipment, including valves, wellheads and assembled systems, advanced by more than 50% over the period.
WESCO International, a wholesale distributor of electrical products, industrial supplies, automation equipment, and data communication apparatus, was also among the fund’s top performers. Robust demand for the company’s products resulted in first quarter 2006 earnings that were substantially higher than those achieved for the first quarter of 2005. We were attracted to the firm’s
Top holdings
This table shows the fund's top holdings, and the percentage of the fund's net assets that each comprised, as of 6/30/06. The fund's holdings will change over time.
| Holding (percent of fund's net assets) | Industry |
| Microsoft Corp. (2.3%) | Software |
| Cisco Systems, Inc. (2.1%) | Communications equipment |
| Amgen, Inc. (1.9%) | Biotechnology |
| Qualcomm, Inc. (1.7%) | Communications equipment |
| American Eagle Outfitters, Inc. (1.6%) | Retail |
| Becton, Dickinson and Co. (1.6%) | Medical technology |
| Goldman Sachs Group, Inc. (The) (1.5%) | Investment banking/brokerage |
| Corporate Executive Board Co. (The) (1.5%) | Commercial and consumer services |
| PepsiCo, Inc. (1.4%) | Beverage |
| Boeing Co. (The) (1.4%) | Aerospace and defense |
10
improving operating performance, particularly the efficiencies it is achieving in inventory management.
Among the positions that detracted from performance over the period were our holdings in home builders such as NVR and Toll Brothers. After surging in price very early in your fund’s fiscal year, NVR’s stock struggled and then declined sharply toward the end of the period. Despite the slowdown in new home construction, we continue to hold NVR because we believe the company’s land-acquisition strategy places it in a better competitive position relative to many other firms in the sector. However, Toll Brothers is very concentrated in the high-end home market. Consequently, with softening becoming particularly pronounced in that segment of the real estate market, we do not believe the firm’s near-term prospects are favorable and eliminated the fund’s position prior to the end of the period.
We also eliminated the fund’s investment in XM Satellite Radio. While we remain positive about the long-term prospects for satellite radio in general, XM’s subscriber-acquisition costs have steadily increased due to competitive pressures. As a result, the firm’s return on capital has deteriorated and its stock price has suffered accordingly.
Please note that the holdings discussed in this report may not have been held by the fund for the entire period. Portfolio composition is subject to review in accordance with the fund’s investment strategy and may vary in the future.
| The outlook for your fund |
The following commentary reflects anticipated developments that could affect your fund over the next six months, as well as your management team’s plans for responding to them.
The market volatility that reemerged during the final months of the fiscal period remains elevated, but is still below long-term historical averages. We still consider economic conditions generally favorable and believe that the potential for continuing business growth still exists; however, current volatility levels and market sentiment have begun to work against such potential. In our view, Wall Street analysts have shifted from being overly optimistic in their earnings estimates (leading to subsequent downward revisions) to being more pessimistic.
All of this highlights the fact that there is considerable uncertainty as to what sectors will emerge to lead the market. Consequently, we believe the value of our three-pronged approach to seeking out high-quality growth companies at reasonable valuations should keep the fund well positioned to take advantage of the opportunities likely to arise amidst shifting market preferences.
The views expressed in this report are exclusively those of Putnam Management. They are not meant as investment advice.
The fund invests some or all of its assets in small and/or midsize companies. Such investments increase the risk of fluctuations in the value of your investment. Stocks with above-average earnings growth may be more volatile, especially if earnings do not continue to grow.
11
| Your fund’s performance |
This section shows your fund’s performance for periods ended June 30, 2006, the end of its fiscal year. Performance should always be considered in light of a fund’s investment strategy. Data represents past performance. Past performance does not guarantee future results. More recent returns may be less or more than those shown. Investment return and principal value will fluctuate, and you may have a gain or a loss when you sell your shares. For the most recent month-end performance, please visit www.putnam.com or call Putnam at 1-800-225-1581. Class Y shares are generally only available to corporate and institutional clients. See the Terms and Definitions section in this report for definitions of the share classes offered by your fund.
| Fund performance |
Total return for periods ended 6/30/06
| Class A | Class B | Class C | Class M | Class R | Class Y | |||||
| (inception dates) | (8/31/90) | (3/1/93) | (7/26/99) | (12/1/94) | (1/21/03) | (7/19/94) | ||||
| NAV | POP | NAV | CDSC | NAV | CDSC | NAV | POP | NAV | NAV | |
| Annual average | ||||||||||
| (life of fund) | 13.78% | 13.39% | 12.94% | 12.94% | 12.93% | 12.93% | 13.19% | 12.95% | 13.50% | 13.99% |
| 10 years | 41.92 | 34.47 | 32.10 | 32.10 | 31.68 | 31.68 | 34.99 | 30.62 | 38.52 | 45.53 |
| Annual average | 3.56 | 3.01 | 2.82 | 2.82 | 2.79 | 2.79 | 3.05 | 2.71 | 3.31 | 3.82 |
| 5 years | –4.69 | –9.70 | –8.20 | –10.04 | –8.20 | –8.20 | –7.04 | –10.07 | –5.79 | -3.49 |
| Annual average | –0.96 | –2.02 | –1.70 | –2.09 | –1.70 | –1.70 | –1.45 | –2.10 | –1.19 | -0.71 |
| 3 years | 39.43 | 32.10 | 36.35 | 33.35 | 36.33 | 36.33 | 37.37 | 32.89 | 38.49 | 40.48 |
| Annual average | 11.72 | 9.72 | 10.89 | 10.07 | 10.88 | 10.88 | 11.16 | 9.94 | 11.47 | 12.00 |
| 1 year | 9.90 | 4.12 | 9.08 | 4.08 | 9.09 | 8.09 | 9.32 | 5.79 | 9.64 | 10.17 |
Performance assumes reinvestment of distributions and does not account for taxes. Returns at public offering price (POP) for class A and M shares reflect a sales charge of 5.25% and 3.25%, respectively. Class B share returns reflect the applicable contingent deferred sales charge (CDSC), which is 5% in the first year, declining to 1% in the sixth year, and is eliminated thereafter. Class C shares reflect a 1% CDSC the first year that is eliminated thereafter. Class R and Y shares have no initial sales charge or CDSC. Performance for class B, C, M, R, and Y shares before their inception is derived from the historical performance of class A shares, adjusted for the applicable sales charge (or CDSC) and, except for class Y shares, the higher operating expenses for such shares.
A 2% short-term trading fee may be applied to shares exchanged or sold within 5 days of purchase.
12

Past performance does not indicate future results. At the end of the same time period, a $10,000 investment in the fund’s
class B and class C shares would have been valued at $13,210 and $13,168, respectively, and no contingent deferred
sales charges would apply. A $10,000 investment in the fund’s class M shares would have been valued at $13,062 at
public offering price. A $10,000 investment in the fund’s class R and class Y shares would have been valued at $13,852
and $14,553, respectively. See first page of performance section for performance calculation method.
| Comparative index returns |
| For periods ended 6/30/06 |
| Lipper Multi-Cap | ||
| Russell 3000 | Growth Funds | |
| Growth Index | category average* | |
| Annual average | ||
| (life of fund) | 9.51% | 11.55% |
| 10 years | 66.69 | 101.15 |
| Annual average | 5.24 | 6.59 |
| 5 years | –2.12 | 5.96 |
| Annual average | –0.43 | 0.76 |
| 3 years | 29.36 | 40.99 |
| Annual average | 8.96 | 12.01 |
| 1 year | 6.84 | 10.44 |
Index and Lipper results should be compared to fund performance at net asset value.
* Over the 1-, 3-, 5-, and 10-year periods ended 6/30/06, there were 414, 355, 284, and 97 funds, respectively, in this Lipper category.
13
| Fund price and distribution* information |
| For the 12-month period ended 6/30/06 |
| Class A | Class B | Class C | Class M | Class R | Class Y | |||
| Share value: | NAV | POP | NAV | NAV | NAV | POP | NAV | NAV |
| 6/30/05 | $41.60 | $43.91 | $37.45 | $39.73 | $39.14 | $40.45 | $41.38 | $42.97 |
| 6/30/06 | 45.72 | 48.25 | 40.85 | 43.34 | 42.79 | 44.23 | 45.37 | 47.34 |
* The fund made no distributions during the period.
14
| Your fund’s expenses |
As a mutual fund investor, you pay ongoing expenses, such as management fees, distribution fees (12b-1 fees), and other expenses. In the most recent six-month period, your fund limited these expenses; had it not done so, expenses would have been higher. Using the information below, you can estimate how these expenses affect your investment and compare them with the expenses of other funds. You may also pay one-time transaction expenses, including sales charges (loads) and redemption fees, which are not shown in this section and would have resulted in higher total expenses. For more information, see your fund’s prospectus or talk to your financial advisor.
| Review your fund’s expenses |
The table below shows the expenses you would have paid on a $1,000 investment in Putnam New Opportunities Fund from January 1, 2006, to June 30, 2006. It also shows how much a $1,000 investment would be worth at the close of the period, assuming actual returns and expenses.
| Class A | Class B | Class C | Class M | Class R | Class Y | |
| Expenses paid per $1,000* | $ 5.66 | $ 9.36 | $ 9.36 | $ 8.13 | $ 6.89 | $ 4.42 |
| Ending value (after expenses) | $1,001.30 | $997.80 | $997.70 | $998.80 | $1,000.20 | $1,002.80 |
* Expenses for each share class are calculated using the fund’s annualized expense ratio for each class, which represents the ongoing expenses as a percentage of net assets for the six months ended 6/30/06. The expense ratio may differ for each share class (see the table at the bottom of the next page). Expenses are calculated by multiplying the expense ratio by the average account value for the period; then multiplying the result by the number of days in the period; and then dividing that result by the number of days in the year. Does not reflect the effect of a non-recurring reimbursement by Putnam. If this amount had been reflected in the table above, expenses for each share class would have been lower.
| Estimate the expenses you paid |
To estimate the ongoing expenses you paid for the six months ended June 30, 2006, use the calculation method below. To find the value of your investment on January 1, 2006, go to www.putnam.com and log on to your account. Click on the “Transaction History” tab in your Daily Statement and enter 01/01/2006 in both the “from” and “to” fields. Alternatively, call Putnam at 1-800-225-1581.

15
| Compare expenses using the SEC’s method |
The Securities and Exchange Commission (SEC) has established guidelines to help investors assess fund expenses. Per these guidelines, the table below shows your fund’s expenses based on a $1,000 investment, assuming a hypothetical 5% annualized return. You can use this information to compare the ongoing expenses (but not transaction expenses or total costs) of investing in the fund with those of other funds. All mutual fund shareholder reports will provide this information to help you make this comparison. Please note that you cannot use this information to estimate your actual ending account balance and expenses paid during the period.
| Class A | Class B | Class C | Class M | Class R | Class Y | |
| Expenses paid per $1,000* | $ 5.71 | $ 9.44 | $ 9.44 | $ 8.20 | $ 6.95 | $ 4.46 |
| Ending value (after expenses) | $1,019.14 | $1,015.42 | $1,015.42 | $1,016.66 | $1,017.90 | $1,020.38 |
* Expenses for each share class are calculated using the fund’s annualized expense ratio for each class, which represents the ongoing expenses as a percentage of net assets for the six months ended 6/30/06. The expense ratio may differ for each share class (see the table at the bottom of this page). Expenses are calculated by multiplying the expense ratio by the average account value for the period; then multiplying the result by the number of days in the period; and then dividing that result by the number of days in the year. Does not reflect the effect of a non-recurring reimbursement by Putnam. If this amount had been reflected in the table above, expenses for each share class would have been lower.
Compare expenses using industry averages
You can also compare your fund’s expenses with the average of its peer group, as defined by Lipper, an independent fund-rating agency that ranks funds relative to others that Lipper considers to have similar investment styles or objectives. The expense ratio for each share class shown below indicates how much of your fund’s net assets have been used to pay ongoing expenses during the period.
| Class A | Class B | Class C | Class M | Class R | Class Y | |
| Your fund's annualized | ||||||
| expense ratio* | 1.14% | 1.89% | 1.89% | 1.64% | 1.39% | 0.89% |
| Average annualized expense | ||||||
| ratio for Lipper peer group† | 1.52% | 2.27% | 2.27% | 2.02% | 1.77% | 1.27% |
* For the fund’s most recent fiscal half year; may differ from expense ratios based on one-year data in the financial highlights. Does not reflect the effect of a non-recurring reimbursement by Putnam. If this amount had been reflected in the table above, the expense ratio for each share class would have been lower.
† Simple average of the expenses of all front-end load funds in the fund’s Lipper peer group, calculated in accordance with Lipper’s standard method for comparing fund expenses (excluding 12b-1 fees and without giving effect to any expense offset and brokerage service arrangements that may reduce fund expenses). This average reflects each fund’s expenses for its most recent fiscal year available to Lipper as of 6/30/06. To facilitate comparison, Putnam has adjusted this average to reflect the 12b-1 fees carried by each class of shares other than class Y shares, which do not incur 12b-1 fees. The peer group may include funds that are significantly smaller or larger than the fund, which may limit the comparability of the fund’s expenses to the simple average, which typically is higher than the asset-weighted average.
16
| Your fund’s portfolio turnover |
Putnam funds are actively managed by teams of experts who buy and sell securities based on intensive analysis of companies, industries, economies, and markets. Portfolio turnover is a measure of how often a fund’s managers buy and sell securities for your fund. A portfolio turnover of 100%, for example, means that the managers sold and replaced securities valued at 100% of a fund’s assets within a one-year period. Funds with high turnover may be more likely to generate capital gains and dividends that must be distributed to shareholders as taxable income. High turnover may also cause a fund to pay more brokerage commissions and other transaction costs, which may detract from performance.
| Turnover comparisons | |||||
| Percentage of holdings that change every year | |||||
| 2006 | 2005 | 2004 | 2003 | 2002 | |
| Putnam New Opportunities Fund | 84% | 97% | 61% | 42% | 77% |
| Lipper Multi-Cap Growth Funds | |||||
| category average | 112% | 117% | 125% | 142% | 153% |
Turnover data for the fund is calculated based on the fund’s fiscal-year period, which ends on June 30. Turnover data for the fund’s Lipper category is calculated based on the average of the turnover of each fund in the category for its fiscal year ended during the indicated year. Fiscal years vary across funds in the Lipper category, which may limit the comparability of the fund’s portfolio turnover rate to the Lipper average. Comparative data for 2006 is based on information available as of 6/30/06.
17
| Your fund’s risk |
This risk comparison is designed to help you understand how your fund compares with other funds. The comparison utilizes a risk measure developed by Morningstar, an independent fund-rating agency. This risk measure is referred to as the fund’s Overall Morningstar Risk.
| Your fund’s Overall Morningstar® Risk |

Your fund’s Overall Morningstar Risk is shown alongside that of the average fund in its broad asset class, as determined by Morningstar. The risk bar broadens the comparison by translating the fund’s Overall Morningstar Risk into a percentile, which is based on the fund’s ranking among all funds rated by Morningstar as of June 30, 2006. A higher Overall Morningstar Risk generally indicates that a fund’s monthly returns have varied more widely.
Morningstar determines a fund’s Overall Morningstar Risk by assessing variations in the fund’s monthly returns — with an emphasis on downside variations — over 3-, 5-, and 10-year periods, if available. Those measures are weighted and averaged to produce the fund’s Overall Morningstar Risk. The information shown is provided for the fund’s class A shares only; information for other classes may vary. Overall Morningstar Risk is based on historical data and does not indicate future results. Morningstar does not purport to measure the risk associated with a current investment in a fund, either on an absolute basis or on a relative basis. Low Overall Morningstar Risk does not mean that you cannot lose money on an investment in a fund. Copyright 2006 Morningstar, Inc. All Rights Reserved. The information contained herein (1) is proprietary to Morningstar and/or its content providers; (2) may not be copied or distributed; and (3) is not warranted to be accurate, complete, or timely. Neither Morningstar nor its content providers are responsible for any damages or losses arising from any use of this information.
18
| Your fund’s management |
Your fund is managed by the members of the Putnam Mid-Cap Growth and Small and Emerging Growth teams. Kevin Divney is the Portfolio Leader and Brian DeChristopher and Richard Weed are Portfolio Members of your fund. The Portfolio Leader and Portfolio Members coordinate the teams’ management of the fund.
For a complete listing of the members of the Putnam Mid-Cap Growth and Small and Emerging Growth teams, including those who are not Portfolio Leaders or Portfolio Members of your fund, visit Putnam’s Individual Investor Web site at www.putnam.com.
| Investment team fund ownership |
The table below shows how much the fund’s current Portfolio Leader and Portfolio Members have invested in the fund and in all Putnam mutual funds (in dollar ranges). Information shown is as of June 30, 2006, and June 30, 2005.
N/A indicates the individual was not a Portfolio Leader or Portfolio Member as of 6/30/05.
| Trustee and Putnam employee fund ownership |
As of June 30, 2006, all of the Trustees on the Board of the Putnam funds owned fund shares. The table below shows the approximate value of investments in the fund and all Putnam funds as of that date by the Trustees and Putnam employees. These amounts include investments by the Trustees’ and employees’ immediate family members and investments through retirement and deferred compensation plans.
| Total assets in | ||
| Assets in the fund | all Putnam funds | |
| Trustees | $ 501,000 | $ 87,000,000 |
| Putnam employees | $15,072,000 | $421,000,000 |
19
| Fund manager compensation |
The total 2005 fund manager compensation that is attributable to your fund is approximately $2,500,000. This amount includes a portion of 2005 compensation paid by Putnam Management to the fund managers listed in this section for their portfolio management responsibilities, calculated based on the fund assets they manage taken as a percentage of the total assets they manage. The compensation amount also includes a portion of the 2005 compensation paid to the Chief Investment Officer of the team and the Group Chief Investment Officer of the fund’s broader investment category for their oversight responsibilities, calculated based on the fund assets they oversee taken as a percentage of the total assets they oversee. This amount does not include compensation of other personnel involved in research, trading, administration, systems, compliance, or fund operations; nor does it include non-compensation costs. These percentages are determined as of the fund’s fiscal period-end. For personnel who joined Putnam Management during or after 2005, the calculation reflects annualized 2005 compensation or an estimate of 2006 compensation, as applicable.
Other Putnam funds managed by the Portfolio Leader and Portfolio Members
Kevin Divney is also a Portfolio Leader of Putnam Vista Fund.
Brian DeChristopher is also a Portfolio Member of Putnam Vista Fund.
Richard Weed is also a Portfolio Leader of Putnam Discovery Growth Fund, Putnam OTC & Emerging Growth Fund, and Putnam Small Cap Growth Fund.
Kevin Divney, Brian DeChristopher, and Richard Weed may also manage other accounts and variable trust funds advised by Putnam Management or an affiliate.
Changes in your fund’s Portfolio Leader and Portfolio Members
During the year ended June 30, 2006, Brian DeChristopher became a Portfolio Member of your fund, following the departure of Portfolio Leader Paul Marrkand.
20
| Putnam fund ownership by Putnam’s Executive Board |
The table below shows how much the members of Putnam’s Executive Board have invested in all Putnam mutual funds (in dollar ranges). Information shown is as of June 30, 2006, and June 30, 2005.
| $1 – | $10,001 – | $50,001 – | $100,001 – | $500,001 – | $1,000,001 | |||
| Year | $0 | $10,000 | $50,000 | $100,000 | $500,000 | $1,000,000 | and over | |
| Philippe Bibi | 2006 | * | ||||||
| Chief Technology Officer | 2005 | * | ||||||
| Joshua Brooks | 2006 | * | ||||||
| Deputy Head of Investments | 2005 | * | ||||||
| William Connolly | 2006 | * | ||||||
| Head of Retail Management | N/A | |||||||
| Kevin Cronin | 2006 | * | ||||||
| Head of Investments | 2005 | * | ||||||
| Charles Haldeman, Jr. | 2006 | * | ||||||
| President and CEO | 2005 | * | ||||||
| Amrit Kanwal | 2006 | * | ||||||
| Chief Financial Officer | 2005 | * | ||||||
| Steven Krichmar | 2006 | * | ||||||
| Chief of Operations | 2005 | * | ||||||
| Francis McNamara, III | 2006 | * | ||||||
| General Counsel | 2005 | * | ||||||
| Richard Robie, III | 2006 | * | ||||||
| Chief Administrative Officer | 2005 | * | ||||||
| Edward Shadek | 2006 | * | ||||||
| Deputy Head of Investments | 2005 | * | ||||||
| Sandra Whiston | 2006 | * | ||||||
| Head of Institutional Management | N/A | |||||||
N/A indicates the individual was not a member of Putnam’s Executive Board as of 6/30/05.
21
| Terms and definitions |
| Important terms |
Total return shows how the value of the fund’s shares changed over time, assuming you held the shares through the entire period and reinvested all distributions in the fund.
Net asset value (NAV) is the price, or value, of one share of a mutual fund, without a sales charge. NAVs fluctuate with market conditions. NAV is calculated by dividing the net assets of each class of shares by the number of outstanding shares in the class.
Public offering price (POP) is the price of a mutual fund share plus the maximum sales charge levied at the time of purchase. POP performance figures shown here assume the 5.25% maximum sales charge for class A shares and 3.25% for class M shares.
Contingent deferred sales charge (CDSC) is generally a charge applied at the time of the redemption of class B or C shares and assumes redemption at the end of the period. Your fund’s class B CDSC declines from a 5% maximum during the first year to 1% during the sixth year. After the sixth year, the CDSC no longer applies. The CDSC for class C shares is 1% for one year after purchase.
| Share classes |
Class A shares are generally subject to an initial sales charge and no CDSC (except on certain redemptions of shares bought without an initial sales charge).
Class B shares are not subject to an initial sales charge. They may be subject to a CDSC.
Class C shares are not subject to an initial sales charge and are subject to a CDSC only if the shares are redeemed during the first year.
Class M shares have a lower initial sales charge and a higher 12b-1 fee than class A shares and no CDSC (except on certain redemptions of shares bought without an initial sales charge).
Class R shares are not subject to an initial sales charge or CDSC and are available only to certain defined contribution plans.
Class Y shares are not subject to an initial sales charge or CDSC, and carry no 12b-1 fee. They are only available to eligible purchasers, including eligible defined contribution plans or corporate IRAs.
22
| Comparative indexes |
Citigroup World Government Bond Index is an unmanaged index of global investment-grade fixed-income securities.
Lehman Aggregate Bond Index is an unmanaged index of U.S. investment-grade fixed-income securities.
Lehman Government Bond Index is an unmanaged index of U.S. Treasury and agency securities.
Morgan Stanley Capital International (MSCI) EAFE Index is an unmanaged index of equity securities from developed countries in Western Europe, the Far East, and Australasia.
Russell 3000 Growth Index is an unmanaged index of those companies in the broad-market Russell 3000 Index chosen for their growth orientation.
Russell Midcap Growth Index is an unmanaged index of those companies in the Russell Midcap Index chosen for their growth orientation.
S&P 500/Citigroup Value Index is an unmanaged capitalization-weighted index of large-cap stocks chosen for their value orientation.
Indexes assume reinvestment of all distributions and do not account for fees. Securities and performance of a fund and an index will differ. You cannot invest directly in an index.
Lipper is a third-party industry-ranking entity that ranks mutual funds. Its rankings do not reflect sales charges. Lipper rankings are based on total return at net asset value relative to other funds that have similar current investment styles or objectives as determined by Lipper. Lipper may change a fund’s category assignment at its discretion. Lipper category averages reflect performance trends for funds within a category.
23
| Trustee approval of management contract |
| General conclusions |
The Board of Trustees of the Putnam funds oversees the management of each fund and, as required by law, determines annually whether to approve the continuance of your fund’s management contract with Putnam Management. In this regard, the Board of Trustees, with the assistance of its Contract Committee consisting solely of Trustees who are not “interested persons” (as such term is defined in the Investment Company Act of 1940, as amended) of the Putnam funds (the “Independent Trustees”), requests and evaluates all information it deems reasonably necessary under the circumstances. Over the course of several months ending in June 2006, the Contract Committee met four times to consider the information provided by Putnam Management and other information developed with the assistance of the Board’s independent counsel and independent staff. The Contract Committee reviewed and discussed key aspects of this information with all of the Independent Trustees. Upon completion of this review, the Contract Committee recommended, and the Independent Trustees approved, the continuance of your fund’s management contract, effective July 1, 2006.
This approval was based on the following conclusions:
* That the fee schedule in effect for your fund represents reasonable compensation in light of the nature and quality of the services being provided to the fund, the fees paid by competitive funds and the costs incurred by Putnam Management in providing such services, and
* That such fee schedule represents an appropriate sharing between fund shareholders and Putnam Management of such economies of scale as may exist in the management of the fund at current asset levels.
These conclusions were based on a comprehensive consideration of all information provided to the Trustees and were not the result of any single factor. Some of the factors that figured particularly in the Trustees’ deliberations and how the Trustees considered these factors are described below, although individual Trustees may have evaluated the information presented differently, giving different weights to various factors. It is also important to recognize that the fee arrangements for your fund and the other Putnam funds are the result of many years of review and discussion between the Independent Trustees and Putnam Management, that certain aspects of such arrangements may receive greater scrutiny in some years than others, and that the Trustees’ conclusions may be based, in part, on their consideration of these same arrangements in prior years.
24
| Management fee schedules and categories; total expenses |
The Trustees reviewed the management fee schedules in effect for all Putnam funds, including fee levels and breakpoints, and the assignment of funds to particular fee categories. In reviewing fees and expenses, the Trustees generally focused their attention on material changes in circumstances — for example, changes in a fund’s size or investment style, changes in Putnam Management’s operating costs, or changes in competitive practices in the mutual fund industry — that suggest that consideration of fee changes might be warranted. The Trustees concluded that the circumstances did not warrant changes to the management fee structure of your fund, which had been carefully developed over the years, re-examined on many occasions, and adjusted where appropriate. The Trustees focused on two areas of particular interest, as discussed further below:
* Competitiveness. The Trustees reviewed comparative fee and expense information for competitive funds, which indicated that, in a custom peer group of competitive funds selected by Lipper Inc., your fund ranked in the 3rd percentile in management fees and in the 3rd percentile in total expenses (less any applicable 12b-1 fees) as of December 31, 2005 (the first percentile being the least expensive funds and the 100th percentile being the most expensive funds). The Trustees noted that expense ratios for a number of Putnam funds, which show the percentage of fund assets used to pay for management and administrative services, distribution (12b-1) fees and other expenses, had been increasing recently as a result of declining net assets and the natural operation of fee breakpoints.
The Trustees noted that the expense ratio increases described above were currently being controlled by expense limitations implemented in January 2004 and which Putnam Management, in consultation with the Contract Committee, has committed to maintain at least through 2007. These expense limitations give effect to a commitment by Putnam Management that the expense ratio of each open-end fund would be no higher than the average expense ratio of the competitive funds included in the fund’s relevant Lipper universe (exclusive of any applicable 12b-1 charges in each case). The Trustees observed that this commitment to limit fund expenses has served shareholders well since its inception. In order to ensure that the expenses of the Putnam funds continue to meet evolving competitive standards, the Trustees requested, and Putnam Management agreed, to implement an additional expense limitation for certain funds for the twelve months beginning January 1, 2007 equal to the average expense ratio (exclusive of 12b-1 charges) of a custom peer group of competitive funds selected by Lipper based on the size of the fund. This additional expense limitation will be applied to those open-end funds that had above-average expense ratios (exclusive of 12b-1 charges) based on the custom Lipper peer group data for the period ended December 31, 2005. This additional expense limitation will not be applied to your fund.
25
* Economies of scale. Your fund currently has the benefit of breakpoints in its management fee that provide shareholders with significant economies of scale, which means that the effective management fee rate of a fund (as a percentage of fund assets) declines as a fund grows in size and crosses specified asset thresholds. Conversely, as a fund shrinks in size — as has been the case for many Putnam funds in recent years — these breakpoints result in increasing fee levels. In recent years, the Trustees have examined the operation of the existing breakpoint structure during periods of both growth and decline in asset levels. The Trustees concluded that the fee schedules in effect for the funds represented an appropriate sharing of economies of scale at current asset levels. In reaching this conclusion, the Trustees considered the Contract Committee’s stated intent to continue to work with Putnam Management to plan for an eventual resumption in the growth of assets, including a study of potential economies that might be produced under various growth assumptions.
In connection with their review of the management fees and total expenses of the Putnam funds, the Trustees also reviewed the costs of the services to be provided and profits to be realized by Putnam Management and its affiliates from the relationship with the funds. This information included trends in revenues, expenses and profitability of Putnam Management and its affiliates relating to the investment management and distribution services provided to the funds. In this regard, the Trustees also reviewed an analysis of Putnam Management’s revenues, expenses, and profitability with respect to the funds’ management contracts, allocated on a fund-by-fund basis. Because many of the costs incurred by Putnam Management in managing the funds are not readily identifiable to particular funds, the Trustees observed that the methodology for allocating costs is an important factor in evaluating Putnam Management’s costs and profitability, both as to the Putnam funds in the aggregate and as to individual funds. The Trustees reviewed Putnam Management’s cost allocation methodology with the assistance of independent consultants and concluded that this methodology was reasonable and well considered.
| Investment performance |
The quality of the investment process provided by Putnam Management represented a major factor in the Trustees’ evaluation of the quality of services provided by Putnam Management under your fund’s management contract. The Trustees were assisted in their review of the Putnam funds’ investment process and performance by the work of the Investment Process Committee of the Trustees and the Investment Oversight Committee of the Trustees, which meet on a regular monthly basis with the funds’ portfolio teams throughout the year. The Trustees concluded that Putnam Management generally provides a high-quality investment process — as measured by the experience and skills of the individuals assigned to the management of fund portfolios, the resources made available to such personnel, and in general the ability of Putnam Management to attract and retain high-quality personnel — but also recognize that this does not guarantee favorable investment results for every fund in every time period.
26
The Trustees considered the investment performance of each fund over multiple time periods and considered information comparing each fund’s performance with various benchmarks and with the performance of competitive funds.
The Trustees noted the satisfactory investment performance of many Putnam funds. They also noted the disappointing investment performance of certain funds in recent years and discussed with senior management of Putnam Management the factors contributing to such underperfor-mance and actions being taken to improve performance. The Trustees recognized that, in recent years, Putnam Management has made significant changes in its investment personnel and processes and in the fund product line to address areas of underperformance. In particular, they noted the important contributions of Putnam Management’s leadership in attracting, retaining, and supporting high-quality investment professionals and in systematically implementing an investment process that seeks to merge the best features of fundamental and quantitative analysis. The Trustees indicated their intention to continue to monitor performance trends to assess the effectiveness of these changes and to evaluate whether additional changes to address areas of underperformance are warranted.
In the case of your fund, the Trustees considered that your fund’s class A share cumulative total return performance at net asset value was in the following percentiles of its Lipper peer group (Lipper Multi-Cap Growth Funds) for the one-, three- and five-year periods ended March 31, 2006 (the first percentile being the best-performing funds and the 100th percentile being the worst-performing funds):
| One-year period | Three-year period | Five-year period |
| 51st | 48th | 66th |
(Because of the passage of time, these performance results may differ from the performance results for more recent periods shown elsewhere in this report. Over the one-, three- and five-year periods ended March 31, 2006, there were 418, 359, and 288 funds, respectively, in your fund’s Lipper peer group.* Past performance is no guarantee of future performance.)
As a general matter, the Trustees concluded that cooperative efforts between the Trustees and Putnam Management represent the most effective way to address investment performance problems. The Trustees noted that investors in the Putnam funds have, in effect, placed their trust in the Putnam organization, under the oversight of the funds’ Trustees, to make appropriate decisions regarding the management of the funds. Based on the responsiveness of Putnam Management in the recent past to Trustee concerns about investment performance, the Trustees concluded that it is preferable to seek change within Putnam Management to address performance shortcomings. In the Trustees’ view, the alternative of terminating a
* The percentile rankings for your fund’s class A share annualized total return performance in the Lipper Multi-Cap Growth Funds category for the one-, five- and ten-year periods ended June 30, 2006 , were 50%, 71%, and 82%, respectively. Over the one-, five- and ten-year periods ended June 30, 2006, the fund ranked 206 out of 414, 200 out of 284, and 80 out of 97 funds, respectively. Note that this more recent information was not available when the Trustees approved the continuance of your fund’s management contract.
27
management contract and engaging a new investment adviser for an underperforming fund would entail significant disruptions and would not provide any greater assurance of improved investment performance.
Brokerage and soft-dollar allocations; other benefits
The Trustees considered various potential benefits that Putnam Management may receive in connection with the services it provides under the management contract with your fund. These include benefits related to brokerage and soft-dollar allocations, whereby a portion of the commissions paid by a fund for brokerage may be used to acquire research services that may be useful to Putnam Management in managing the assets of the fund and of other clients. The Trustees indicated their continued intent to monitor the potential benefits associated with the allocation of fund brokerage to ensure that the principle of seeking “best price and execution” remains paramount in the portfolio trading process.
The Trustees’ annual review of your fund’s management contract also included the review of its distributor’s contract and distribution plan with Putnam Retail Management Limited Partnership and the custodian agreement and investor servicing agreement with Putnam Fiduciary Trust Company, all of which provide benefits to affiliates of Putnam Management.
Comparison of retail and institutional fee schedules
The information examined by the Trustees as part of their annual contract review has included for many years information regarding fees charged by Putnam Management and its affiliates to institutional clients such as defined benefit pension plans, college endowments, etc. This information included comparison of such fees with fees charged to the funds, as well as a detailed assessment of the differences in the services provided to these two types of clients. The Trustees observed, in this regard, that the differences in fee rates between institutional clients and the mutual funds are by no means uniform when examined by individual asset sectors, suggesting that differences in the pricing of investment management services to these types of clients reflect to a substantial degree historical competitive forces operating in separate market places. The Trustees considered the fact that fee rates across all asset sectors are higher on average for mutual funds than for institutional clients, as well as the differences between the services that Putnam Management provides to the Putnam funds and those that it provides to institutional clients of the firm, but did not rely on such comparisons to any significant extent in concluding that the management fees paid by your fund are reasonable.
28
| Other information for shareholders |
| Putnam’s policy on confidentiality |
In order to conduct business with our shareholders, we must obtain certain personal information such as account holders’ addresses, telephone numbers, Social Security numbers, and the names of their financial advisors. We use this information to assign an account number and to help us maintain accurate records of transactions and account balances. It is our policy to protect the confidentiality of your information, whether or not you currently own shares of our funds, and in particular, not to sell information about you or your accounts to outside marketing firms. We have safeguards in place designed to prevent unauthorized access to our computer systems and procedures to protect personal information from unauthorized use. Under certain circumstances, we share this information with outside vendors who provide services to us, such as mailing and proxy solicitation. In those cases, the service providers enter into confidentiality agreements with us, and we provide only the information necessary to process transactions and perform other services related to your account. We may also share this information with our Putnam affiliates to service your account or provide you with information about other Putnam products or services. It is also our policy to share account information with your financial advisor, if you’ve listed one on your Putnam account. If you would like clarification about our confidentiality policies or have any questions or concerns, please don’t hesitate to contact us at 1-800-225-1581, Monday through Friday, 8:30 a.m. to 7:00 p.m., or Saturdays from 9:00 a.m. to 5:00 p.m. Eastern Time.
| Proxy voting |
Putnam is committed to managing our mutual funds in the best interests of our shareholders. The Putnam funds’ proxy voting guidelines and procedures, as well as information regarding how your fund voted proxies relating to portfolio securities during the 12-month period ended June 30, 2006, are available on the Putnam Individual Investor Web site, www.putnam.com/individual, and on the SEC’s Web site, www.sec.gov. If you have questions about finding forms on the SEC’s Web site, you may call the SEC at 1-800-SEC-0330. You may also obtain the Putnam funds’ proxy voting guidelines and procedures at no charge by calling Putnam’s Shareholder Services at 1-800-225-1581.
| Fund portfolio holdings |
The fund will file a complete schedule of its portfolio holdings with the SEC for the first and third quarters of each fiscal year on Form N-Q. Shareholders may obtain the fund’s Forms N-Q on the SEC’s Web site at www.sec.gov. In addition, the fund’s Forms N-Q may be reviewed and copied at the SEC’s Public Reference Room in Washington, D.C. You may call the SEC at 1-800-SEC-0330 for information about the SEC’s Web site or the operation of the Public Reference Room.
29
| Financial statements |
| A guide to financial statements |
These sections of the report, as well as the accompanying Notes, preceded by the Report of Independent Registered Public Accounting Firm, constitute the fund’s financial statements.
The fund’s portfolio lists all the fund’s investments and their values as of the last day of the reporting period. Holdings are organized by asset type and industry sector, country, or state to show areas of concentration and diversification.
Statement of assets and liabilities shows how the fund’s net assets and share price are determined. All investment and noninvestment assets are added together. Any unpaid expenses and other liabilities are subtracted from this total. The result is divided by the number of shares to determine the net asset value per share, which is calculated separately for each class of shares. (For funds with preferred shares, the amount subtracted from total assets includes the liquidation preference of preferred shares.)
Statement of operations shows the fund’s net investment gain or loss. This is done by first adding up all the fund’s earnings — from dividends and interest income — and subtracting its operating expenses to determine net investment income (or loss). Then, any net gain or loss the fund realized on the sales of its holdings — as well as any unrealized gains or losses over the period — is added to or subtracted from the net investment result to determine the fund’s net gain or loss for the fiscal year.
Statement of changes in net assets shows how the fund’s net assets were affected by the fund’s net investment gain or loss, by distributions to shareholders, and by changes in the number of the fund’s shares. It lists distributions and their sources (net investment income or realized capital gains) over the current reporting period and the most recent fiscal year-end. The distributions listed here may not match the sources listed in the Statement of operations because the distributions are determined on a tax basis and may be paid in a different period from the one in which they were earned.
Financial highlights provide an overview of the fund’s investment results, per-share distributions, expense ratios, net investment income ratios, and portfolio turnover in one summary table, reflecting the five most recent reporting periods. In a semiannual report, the highlight table also includes the current reporting period.
30
Report of Independent Registered Public Accounting Firm
| To the Trustees and Shareholders of Putnam New Opportunities Fund: |
In our opinion, the accompanying statement of assets and liabilities, including the fund's portfolio, and the related statements of operations and of changes in net assets and the financial highlights present fairly, in all material respects, the financial position of Putnam New Opportunities Fund (the "fund") at June 30, 2006, and the results of its operations, the changes in its net assets and the financial highlights for each of the periods indicated, in conformity with accounting principles generally accepted in the United States of America. These financial statements and financial highlights (hereafter referred to as "financial statements") are the responsibility of the fund's management; our responsibility is to express an opinion on these financial statements based on our audits. We conducted our audits of these financial statements in accordance with the standards of the Public Company Accounting Oversight Board (United States). Those standards require that we plan and perform the audit to obtain reasonable assurance about whether the financial statements are free of material misstatement. An audit includes examining, on a test basis, evidence supporting the amounts and disclosures in the financial statements, assessing the accounting principles used and significant estimates made by management, and evaluating the overall financial statement presentation. We believe that our audits, which included confirmation of investments owned at June 30, 2006, by correspondence with the custodian and brokers, provide a reasonable basis for our opinion.
| PricewaterhouseCoopers LLP Boston, Massachusetts August 10, 2006 |
31
| The fund’s portfolio 6/30/06 | |||
| COMMON STOCKS (97.4%)* | |||
| Shares | Value | ||
| Aerospace and Defense (4.5%) | |||
| Boeing Co. (The) | 826,400 | $ | 67,690,424 |
| General Dynamics Corp. | 341,400 | 22,348,044 | |
| L-3 Communications Holdings, Inc. | 563,700 | 42,514,254 | |
| Raytheon Co. | 1,461,100 | 65,121,227 | |
| Rockwell Collins, Inc. | 364,700 | 20,375,789 | |
| 218,049,738 | |||
| Airlines (0.9%) | |||
| Southwest Airlines Co. | 2,660,200 | 43,547,474 | |
| Automotive (0.4%) | |||
| Oshkosh Truck Corp. | 395,800 | 18,808,416 | |
| Banking (0.7%) | |||
| Commerce Bancorp, Inc. | 467,500 | 16,675,725 | |
| UnionBanCal Corp. | 284,100 | 18,350,019 | |
| 35,025,744 | |||
| Basic Materials (0.5%) | |||
| Rio Tinto PLC (United Kingdom) | 409,975 | 21,675,988 | |
| Beverage (1.9%) | |||
| Fomento Economico Mexicano SA de CV ADR (Mexico) | 292,400 | 24,479,728 | |
| PepsiCo, Inc. | 1,148,800 | 68,973,952 | |
| 93,453,680 | |||
| Biotechnology (5.0%) | |||
| Amgen, Inc. † | 1,439,200 | 93,879,016 | |
| Applera Corp. - Applied Biosystems Group | 495,500 | 16,029,425 | |
| Biogen Idec, Inc. † | 1,279,600 | 59,283,868 | |
| Celgene Corp. † | 387,683 | 18,387,805 | |
| Genzyme Corp. † | 578,400 | 35,311,320 | |
| Imclone Systems, Inc. † | 191,400 | 7,395,696 | |
| Invitrogen Corp. † | 161,500 | 10,670,305 | |
| 240,957,435 | |||
| Building Materials (0.3%) | |||
| Sherwin-Williams Co. (The) | 348,600 | 16,551,528 | |
| Chemicals (0.9%) | |||
| Airgas, Inc. | 445,300 | 16,587,425 | |
| Monsanto Co. | 301,200 | 25,358,028 | |
| 41,945,453 | |||
32
| COMMON STOCKS (97.4%)* continued | |||
| Shares | Value | ||
| Commercial and Consumer Services (2.8%) | |||
| Alliance Data Systems Corp. † | 402,300 | $ | 23,663,286 |
| Corporate Executive Board Co. (The) | 723,000 | 72,444,600 | |
| Monster Worldwide, Inc. † | 391,600 | 16,705,656 | |
| Paychex, Inc. | 623,100 | 24,288,438 | |
| 137,101,980 | |||
| Communications Equipment (4.4%) | |||
| Cisco Systems, Inc. † | 5,314,800 | 103,798,044 | |
| Harris Corp. | 545,800 | 22,656,158 | |
| Qualcomm, Inc. | 2,100,400 | 84,163,028 | |
| 210,617,230 | |||
| Computers (4.2%) | |||
| Anixter International, Inc. | 225,000 | 10,678,500 | |
| Autodesk, Inc. † | 840,800 | 28,973,968 | |
| EMC Corp. † | 4,093,200 | 44,902,404 | |
| Emulex Corp. † | 647,500 | 10,534,825 | |
| Intergraph Corp. † | 149,700 | 4,714,053 | |
| Lexmark International, Inc. Class A † | 279,700 | 15,615,651 | |
| NCR Corp. † | 424,100 | 15,539,024 | |
| Network Appliance, Inc. † | 1,106,800 | 39,070,040 | |
| Palm, Inc. † | 1,098,200 | 17,681,020 | |
| Western Digital Corp. † | 869,400 | 17,222,814 | |
| 204,932,299 | |||
| Conglomerates (0.5%) | |||
| Danaher Corp. | 366,200 | 23,553,984 | |
| Construction (0.4%) | |||
| Eagle Materials, Inc. | 421,200 | 20,007,000 | |
| Consumer Cyclicals (0.8%) | |||
| Black & Decker Manufacturing Co. | 192,800 | 16,283,888 | |
| Harman International Industries, Inc. | 263,200 | 22,469,384 | |
| 38,753,272 | |||
| Consumer Finance (1.0%) | |||
| Accredited Home Lenders Holding Co. † | 172,100 | 8,228,101 | |
| AmeriCredit Corp. † | 580,800 | 16,215,936 | |
| Capital One Financial Corp. | 104,400 | 8,920,980 | |
| Countrywide Financial Corp. | 394,700 | 15,030,176 | |
| 48,395,193 | |||
| Consumer Goods (2.3%) | |||
| American Greetings Corp. Class A | 479,700 | 10,078,497 | |
| Colgate-Palmolive Co. | 938,600 | 56,222,140 | |
| Newell Rubbermaid, Inc. | 1,669,500 | 43,123,185 | |
| 109,423,822 | |||
33
| COMMON STOCKS (97.4%)* continued | |||
| Shares | Value | ||
| Consumer Services (0.7%) | |||
| Ceridian Corp. † | 799,800 | $ | 19,547,112 |
| Labor Ready, Inc. † | 584,000 | 13,227,600 | |
| 32,774,712 | |||
| Electric Utilities (0.7%) | |||
| TXU Corp. | 550,300 | 32,902,437 | |
| Electrical Equipment (1.2%) | |||
| WESCO International, Inc. † | 848,300 | 58,532,700 | |
| Electronics (4.0%) | |||
| Amphenol Corp. Class A | 281,400 | 15,747,144 | |
| Arrow Electronics, Inc. † | 640,500 | 20,624,100 | |
| Freescale Semiconductor, Inc. Class A † | 586,500 | 17,008,500 | |
| Freescale Semiconductor, Inc. Class B † | 453,900 | 13,344,660 | |
| Komag, Inc. † | 419,447 | 19,370,062 | |
| Microchip Technology, Inc. | 255,100 | 8,558,605 | |
| National Semiconductor Corp. | 360,800 | 8,605,080 | |
| NVIDIA Corp. † | 1,152,600 | 24,538,854 | |
| Texas Instruments, Inc. | 2,233,400 | 67,649,686 | |
| 195,446,691 | |||
| Energy (4.0%) | |||
| BJ Services Co. | 204,200 | 7,608,492 | |
| Cameron International Corp. † | 1,342,700 | 64,140,779 | |
| Grey Wolf, Inc. † | 1,164,200 | 8,964,340 | |
| Halliburton Co. | 89,300 | 6,626,953 | |
| Helix Energy Solutions Group, Inc. † | 546,300 | 22,048,668 | |
| Pride International, Inc. † | 617,500 | 19,284,525 | |
| Rowan Cos., Inc. | 1,268,400 | 45,142,356 | |
| Superior Energy Services † | 567,000 | 19,221,300 | |
| 193,037,413 | |||
| Engineering & Construction (0.3%) | |||
| Jacobs Engineering Group, Inc. † | 207,100 | 16,493,444 | |
| Entertainment (0.2%) | |||
| Dreamworks Animation SKG, Inc. Class A † | 422,900 | 9,684,410 | |
| Financial (1.2%) | |||
| JPMorgan Chase & Co. | 472,300 | 19,836,600 | |
| Moody’s Corp. | 727,000 | 39,592,420 | |
| 59,429,020 | |||
| Food (0.3%) | |||
| Campbell Soup Co. | 401,500 | 14,899,665 | |
34
| COMMON STOCKS (97.4%)* continued | |||
| Shares | Value | ||
| Health Care Services (5.6%) | |||
| AmerisourceBergen Corp. | 477,000 | $ | 19,995,840 |
| Caremark Rx, Inc. | 659,800 | 32,904,226 | |
| Charles River Laboratories International, Inc. † | 273,600 | 10,068,480 | |
| Coventry Health Care, Inc. † | 123,600 | 6,790,584 | |
| Humana, Inc. † | 335,500 | 18,016,350 | |
| McKesson Corp. | 1,192,400 | 56,376,672 | |
| Pharmaceutical Product Development, Inc. | 260,100 | 9,134,712 | |
| Sierra Health Services, Inc. † | 1,036,700 | 46,682,601 | |
| UnitedHealth Group, Inc. | 215,500 | 9,650,090 | |
| WellCare Health Plans, Inc. † | 234,600 | 11,507,130 | |
| WellPoint, Inc. † | 674,300 | 49,068,811 | |
| 270,195,496 | |||
| Homebuilding (0.5%) | |||
| NVR, Inc. † | 48,300 | 23,727,375 | |
| Household Furniture and Appliances (0.4%) | |||
| Select Comfort Corp. † | 899,550 | 20,662,664 | |
| Insurance (1.0%) | |||
| Selective Insurance Group | 266,200 | 14,872,594 | |
| W.R. Berkley Corp. | 910,400 | 31,071,952 | |
| 45,944,546 | |||
| Investment Banking/Brokerage (4.2%) | |||
| Bear Stearns Cos., Inc. (The) | 263,800 | 36,953,104 | |
| Calamos Asset Management, Inc. Class A | 564,000 | 16,350,360 | |
| Goldman Sachs Group, Inc. (The) | 490,100 | 73,725,743 | |
| Lazard, Ltd. Class A (Bermuda) | 385,100 | 15,558,040 | |
| Legg Mason, Inc. | 145,900 | 14,519,968 | |
| Lehman Brothers Holdings, Inc. | 717,400 | 46,738,610 | |
| 203,845,825 | |||
| Leisure (1.3%) | |||
| Harley-Davidson, Inc. | 851,400 | 46,733,346 | |
| Thor Industries, Inc. | 378,900 | 18,357,705 | |
| 65,091,051 | |||
| Lodging/Tourism (0.6%) | |||
| Choice Hotels International, Inc. | 517,000 | 31,330,200 | |
| Machinery (3.4%) | |||
| Cummins, Inc. | 492,200 | 60,171,450 | |
| JLG Industries, Inc. | 1,148,400 | 25,839,000 | |
| MSC Industrial Direct Co., Inc. Class A | 265,400 | 12,625,078 | |
| Parker-Hannifin Corp. | 195,500 | 15,170,800 | |
| Terex Corp. † | 256,445 | 25,311,122 | |
| Timken Co. | 586,900 | 19,667,019 | |
| Wabtec Corp. | 92,800 | 3,470,720 | |
| 162,255,189 | |||
35
| COMMON STOCKS (97.4%)* continued | |||
| Shares | Value | ||
| Manufacturing (1.0%) | |||
| Dover Corp. | 106,002 | $ | 5,239,679 |
| Freightcar America, Inc. | 61,900 | 3,436,069 | |
| Mettler-Toledo International, Inc. (Switzerland) † | 366,100 | 22,174,677 | |
| Roper Industries, Inc. | 385,100 | 18,003,425 | |
| 48,853,850 | |||
| Medical Technology (6.3%) | |||
| Becton, Dickinson and Co. | 1,254,500 | 76,687,585 | |
| C.R. Bard, Inc. | 460,100 | 33,706,926 | |
| Dade Behring Holdings, Inc. | 468,000 | 19,487,520 | |
| Hologic, Inc. † | 362,737 | 17,904,698 | |
| Kinetic Concepts, Inc. † | 1,185,800 | 52,353,070 | |
| Medtronic, Inc. | 632,000 | 29,653,440 | |
| Millipore Corp. † | 252,400 | 15,898,676 | |
| Respironics, Inc. † | 300,400 | 10,279,688 | |
| St. Jude Medical, Inc. † | 755,600 | 24,496,552 | |
| Techne Corp. † | 304,600 | 15,510,232 | |
| Varian Medical Systems, Inc. † | 195,800 | 9,271,130 | |
| 305,249,517 | |||
| Metals (1.8%) | |||
| Century Aluminum Co. † | 180,700 | 6,449,183 | |
| Freeport-McMoRan Copper & Gold, Inc. Class B | 563,100 | 31,201,371 | |
| Phelps Dodge Corp. | 138,800 | 11,403,808 | |
| Reliance Steel & Aluminum Co. | 154,200 | 12,790,890 | |
| Steel Dynamics, Inc. | 347,600 | 22,851,224 | |
| 84,696,476 | |||
| Oil & Gas (3.4%) | |||
| EOG Resources, Inc. | 486,600 | 33,740,844 | |
| Exxon Mobil Corp. | 413,800 | 25,386,630 | |
| Frontier Oil Corp. | 1,641,000 | 53,168,400 | |
| Noble Energy, Inc. | 328,100 | 15,374,766 | |
| Tesoro Corp. | 337,200 | 25,074,192 | |
| Unit Corp. † | 229,000 | 13,027,810 | |
| 165,772,642 | |||
| Pharmaceuticals (2.7%) | |||
| Allergan, Inc. | 132,700 | 14,233,402 | |
| Barr Pharmaceuticals, Inc. † | 796,250 | 37,973,163 | |
| Cephalon, Inc. † | 209,900 | 12,614,990 | |
| Endo Pharmaceuticals Holdings, Inc. † | 678,000 | 22,360,440 | |
| Johnson & Johnson | 228,349 | 13,682,672 | |
| Medicis Pharmaceutical Corp. Class A | 875,700 | 21,016,800 | |
| Mylan Laboratories, Inc. | 465,800 | 9,316,000 | |
| 131,197,467 | |||
36
| COMMON STOCKS (97.4%)* continued | |||
| Shares | Value | ||
| Publishing (1.4%) | |||
| Marvel Entertainment, Inc. † | 79,229 | $ | 1,584,580 |
| McGraw-Hill Cos., Inc. (The) | 907,400 | 45,578,702 | |
| R. H. Donnelley Corp. | 391,600 | 21,173,812 | |
| 68,337,094 | |||
| Railroads (0.4%) | |||
| Canadian National Railway Co. (Canada) | 477,500 | 20,890,625 | |
| Real Estate (0.5%) | |||
| CB Richard Ellis Group, Inc. Class A † | 882,300 | 21,969,270 | |
| Restaurants (0.6%) | |||
| Darden Restaurants, Inc. | 741,600 | 29,219,040 | |
| Retail (7.3%) | |||
| American Eagle Outfitters, Inc. | 2,253,900 | 76,722,756 | |
| AnnTaylor Stores Corp. † | 344,200 | 14,931,396 | |
| Bed Bath & Beyond, Inc. † | 793,500 | 26,320,395 | |
| Best Buy Co., Inc. | 610,401 | 33,474,391 | |
| Claire’s Stores, Inc. | 627,700 | 16,012,627 | |
| Dollar Tree Stores, Inc. † | 451,500 | 11,964,750 | |
| Dress Barn, Inc. † | 322,800 | 8,182,980 | |
| Guess ?, Inc. † | 613,100 | 25,596,925 | |
| Home Depot, Inc. (The) | 260,300 | 9,316,137 | |
| Lowe’s Cos., Inc. | 888,800 | 53,923,496 | |
| OfficeMax, Inc. | 453,200 | 18,467,900 | |
| Pantry, Inc. (The) † | 363,200 | 20,898,528 | |
| Staples, Inc. | 1,458,750 | 35,476,800 | |
| 351,289,081 | |||
| Semiconductor (2.0%) | |||
| Lam Research Corp. † | 1,319,000 | 61,491,780 | |
| Novellus Systems, Inc. † | 766,200 | 18,925,140 | |
| Photronics, Inc. † | 1,089,700 | 16,127,560 | |
| 96,544,480 | |||
| Software (4.7%) | |||
| Adobe Systems, Inc. † | 477,500 | 14,496,900 | |
| Amdocs, Ltd. (Guernsey) † | 309,500 | 11,327,700 | |
| Citrix Systems, Inc. † | 623,300 | 25,019,262 | |
| McAfee, Inc. † | 1,132,567 | 27,487,401 | |
| Microsoft Corp. # | 4,687,400 | 109,216,418 | |
| MicroStrategy, Inc. † | 185,900 | 18,128,968 | |
| Symantec Corp. † | 1,269,400 | 19,726,476 | |
| 225,403,125 | |||
| Staffing (0.4%) | |||
| Administaff, Inc. | 515,100 | 18,445,731 | |
37
| COMMON STOCKS (97.4%)* continued | |||
| Shares | Value | ||
| Technology Services (1.7%) | |||
| Accenture, Ltd. Class A (Bermuda) | 1,674,800 | $ | 47,430,336 |
| Acxiom Corp. | 673,300 | 16,832,500 | |
| Fair Isaac Corp. | 7,625 | 276,864 | |
| Global Payments, Inc. | 334,100 | 16,220,555 | |
| 80,760,255 | |||
| Telecommunications (1.0%) | |||
| Brightpoint, Inc. † | 852,260 | 11,531,078 | |
| InterDigital Communications Corp. † | 350,000 | 12,218,500 | |
| j2 Global Communications, Inc. † | 745,900 | 23,286,998 | |
| 47,036,576 | |||
| Textiles (0.5%) | |||
| Phillips-Van Heusen Corp. | 578,800 | 22,087,008 | |
| Tobacco (0.6%) | |||
| Reynolds American, Inc. | 240,700 | 27,752,710 | |
| Total common stocks (cost $4,399,869,819) | $ | 4,704,558,021 | |
| SHORT-TERM INVESTMENTS (2.7%)* | |||
| Principal amount / shares | Value | ||
| Interest in $51,000,000 tri-party repurchase | |||
| agreement dated June 30, 2006 with UBS | |||
| Securities, LLC due July 3, 2006 with respect | |||
| to various U.S. Government obligations — maturity | |||
| value of $51,022,313 for an effective yield | |||
| of 5.25% (collateralized by Freddie Mac securities | |||
| with yields ranging from 3.50% to 10.50% and due | |||
| dates ranging from March 1, 2008 to June 1, 2036 | |||
| valued at $52,020,461) | $51,000,000 | $ | 51,000,000 |
| Interest in $333,000,000 joint tri-party repurchase | |||
| agreement dated June 30, 2006 with UBS | |||
| Securities, LLC due July 3, 2006 with respect | |||
| to various U.S. Government obligations — maturity | |||
| value of $48,512,134 for an effective yield | |||
| of 5.23% (collateralized by Freddie Mac securities | |||
| with yields ranging from 4.00% to 12.00% and due | |||
| dates ranging from June 1, 2007 to June 1, 2036 | |||
| valued at $339,662,581) | 48,491,000 | 48,491,000 | |
| Putnam Prime Money Market Fund (e) | 31,685,660 | 31,685,660 | |
| Total short-term investments (cost $131,176,660) | $ | 131,176,660 | |
| TOTAL INVESTMENTS | |||
| Total investments (cost $4,531,046,479) | $ | 4,835,734,681 | |
38
* Percentages indicated are based on net assets of $4,831,656,745.
† Non-income-producing security.
# A portion of this security was pledged and segregated with the custodian to cover margin requirements for futures contracts at June 30, 2006.
(e) See Note 5 to the financial statements regarding investments in Putnam Prime Money Market Fund.
At June 30, 2006, liquid assets totaling $106,971,073 have been designated as collateral for open written options and futures contracts.
ADR after the name of a foreign holding stands for American Depository Receipts, representing ownership of foreign securities on deposit with a custodian bank.
| FUTURES CONTRACTS OUTSTANDING at 6/30/06 | ||||
| Number of | Expiration | Unrealized | ||
| contracts | Value | date | appreciation | |
| NASDAQ 100 Index E-Mini (Long) | 811 | $25,814,130 | Sep-06 | $ 46,239 |
| Russell 2000 Index Mini (Long) | 169 | 12,362,350 | Sep-06 | 560,305 |
| S&P 500 Index (Long) | 207 | 66,208,950 | Sep-06 | 770,160 |
| S&P MidCap 400 Index E-Mini (Long) | 16 | 1,234,560 | Sep-06 | 39,122 |
| Total | $1,415,826 | |||
| WRITTEN OPTIONS OUTSTANDING at 6/30/06 (premiums received $24,549) | |||
| Contract | Expiration date/ | ||
| amount | strike price | Value | |
| Lam Research Corp. (Call) | $28,800 | Jul 06 / $46.88 | $42,402 |
| The accompanying notes are an integral part of these financial statements. |
39
| Statement of assets and liabilities 6/30/06 | |
| ASSETS | |
| Investment in securities, at value (Note 1): | |
| Unaffiliated issuers (identified cost $4,499,360,819) | $ 4,804,049,021 |
| Affiliated issuers (identified cost $31,685,660) (Note 5) | 31,685,660 |
| Cash | 104,410 |
| Dividends, interest and other receivables | 2,361,518 |
| Receivable for shares of the fund sold | 393,271 |
| Receivable for securities sold | 33,836,815 |
| Total assets | 4,872,430,695 |
| LIABILITIES | |
| Payable for variation margin (Note 1) | 219,152 |
| Payable for securities purchased | 18,470,133 |
| Payable for shares of the fund repurchased | 8,551,540 |
| Payable for compensation of Manager (Notes 2 and 5) | 7,195,464 |
| Payable for investor servicing and custodian fees (Note 2) | 1,255,094 |
| Payable for Trustee compensation and expenses (Note 2) | 959,227 |
| Payable for administrative services (Note 2) | 13,295 |
| Payable for distribution fees (Note 2) | 3,202,619 |
| Written options outstanding, at value (premiums received $24,549) (Note 1) | 42,402 |
| Other accrued expenses | 865,024 |
| Total liabilities | 40,773,950 |
| Net assets | $ 4,831,656,745 |
| REPRESENTED BY | |
| Paid-in capital (Unlimited shares authorized) (Notes 1 and 4) | $ 8,292,752,447 |
| Accumulated net realized loss on investments and foreign | |
| currency transactions (Note 1) | (3,767,181,877) |
| Net unrealized appreciation of investments | 306,086,175 |
| Total — Representing net assets applicable to capital shares outstanding | $ 4,831,656,745 |
| (Continued on next page) | |
40
| Statement of assets and liabilities (Continued) | |
| COMPUTATION OF NET ASSET VALUE AND OFFERING PRICE | |
| Net asset value and redemption price per class A share | |
| ($3,688,422,916 divided by 80,673,126 shares) | $45.72 |
| Offering price per class A share | |
| (100/94.75 of $45.72)* | $48.25 |
| Net asset value and offering price per class B share | |
| ($610,990,779 divided by 14,958,267 shares)** | $40.85 |
| Net asset value and offering price per class C share | |
| ($39,825,450 divided by 918,875 shares)** | $43.34 |
| Net asset value and redemption price per class M share | |
| ($78,230,279 divided by 1,828,058 shares) | $42.79 |
| Offering price per class M share | |
| (100/96.75 of $42.79)* | $44.23 |
| Net asset value, offering price and redemption price per class R share | |
| ($516,959 divided by 11,395 shares) | $45.37 |
| Net asset value, offering price and redemption price per class Y share | |
| ($413,670,362 divided by 8,738,967 shares) | $47.34 |
* On single retail sales of less than $50,000. On sales of $50,000 or more the offering price is reduced.
** Redemption price per share is equal to net asset value less any applicable contingent deferred sales charge.
The accompanying notes are an integral part of these financial statements.
41
| Statement of operations Year ended 6/30/06 | |
| INVESTMENT INCOME | |
| Dividends (net of foreign tax of $111,092) | $ 47,118,032 |
| Interest (including interest income of $1,782,273 | |
| from investments in affiliated issuers) (Note 5) | 2,004,475 |
| Total investment income | 49,122,507 |
| EXPENSES | |
| Compensation of Manager (Note 2) | 30,869,645 |
| Investor servicing fees (Note 2) | 18,449,214 |
| Custodian fees (Note 2) | 284,869 |
| Trustee compensation and expenses (Note 2) | 218,183 |
| Administrative services (Note 2) | 96,212 |
| Distribution fees — Class A (Note 2) | 11,329,479 |
| Distribution fees — Class B (Note 2) | 7,245,044 |
| Distribution fees — Class C (Note 2) | 432,577 |
| Distribution fees — Class M (Note 2) | 713,273 |
| Distribution fees — Class R (Note 2) | 2,239 |
| Other | 1,905,334 |
| Non-recurring costs (Notes 2 and 6) | 77,215 |
| Costs assumed by Manager (Notes 2 and 6) | (77,215) |
| Fees waived and reimbursed by Manager or affiliate (Notes 5 and 6) | (3,660,278) |
| Total expenses | 67,885,791 |
| Expense reduction (Note 2) | (2,458,674) |
| Net expenses | 65,427,117 |
| Net investment loss | (16,304,610) |
| Net realized gain on investments (including $77,351,574 | |
| from redemptions in kind) (Notes 1 and 3) | 943,801,682 |
| Net realized gain on futures contracts (Note 1) | 359,176 |
| Net realized gain on foreign currency transactions (Note 1) | 16,540 |
| Net realized gain on written options (Notes 1 and 3) | 224,775 |
| Net unrealized appreciation of assets and liabilities in | |
| foreign currencies during the year | 552 |
| Net unrealized depreciation of investments, futures | |
| contracts and written options during the year | (347,818,555) |
| Net gain on investments | 596,584,170 |
| Net increase in net assets resulting from operations | $ 580,279,560 |
| The accompanying notes are an integral part of these financial statements. | |
42
| Statement of changes in net assets | ||
| DECREASE IN NET ASSETS | ||
| Year ended | Year ended | |
| 6/30/06 | 6/30/05 | |
| Operations: | ||
| Net investment loss | $ (16,304,610) | $ (3,165,647) |
| Net realized gain on investments | ||
| and foreign currency transactions | 944,402,173 | 898,294,344 |
| Net unrealized depreciation of investments | ||
| and assets and liabilities in foreign currencies | (347,818,003) | (506,149,683) |
| Net increase in net assets resulting from operations | 580,279,560 | 388,979,014 |
| Redemption fees (Note 1) | 12,783 | 13,971 |
| Decrease from capital share transactions (Note 4) | (1,736,185,398) | (2,191,303,347) |
| Total decrease in net assets | (1,155,893,055) | (1,802,310,362) |
| NET ASSETS | ||
| Beginning of year | 5,987,549,800 | 7,789,860,162 |
| End of year | $ 4,831,656,745 | $ 5,987,549,800 |
The accompanying notes are an integral part of these financial statements.
43
| Financial | highlights | (For a common share outstanding throughout the period) | |||||||||
| INVESTMENT OPERATIONS: | RATIOS AND SUPPLEMENTAL DATA: | ||||||||||
| Net | Total | Ratio of net | |||||||||
| Net asset | realized and | Total | Net asset | return | Net | Ratio of | investment | ||||
| value, | Net | unrealized | from | value, | at net | assets, | expenses to | income (loss) | Portfolio | ||
| beginning | investment | gain (loss) on | investment | Redemption | end | asset | end of period | average net | to average | turnover | |
| Period ended | of period | income (loss)(a) | investments | operations | fees | of period | value (%)(b) | (in thousands) | assets (%)(c) | net assets (%) | (%) |
| CLASS A | |||||||||||
| June 30, 2006 | $41.60 | (.09)(d,h) | 4.21 | 4.12 | —(e) | $45.72 | 9.90(h) | $3,688,423 | 1.08(d,h) | (.19)(d,h) | 83.63 |
| June 30, 2005 | 38.96 | .03(d,f,g) | 2.61 | 2.64 | —(e) | 41.60 | 6.78(g) | 4,650,755 | 1.12(d) | .07(d,f,g) | 97.25 |
| June 30, 2004 | 32.79 | (.19)(d) | 6.36 | 6.17 | —(e) | 38.96 | 18.82 | 5,075,005 | 1.09(d) | (.52)(d) | 60.86 |
| June 30, 2003 | 32.28 | (.17) | .68 | .51 | — | 32.79 | 1.58 | 6,262,164 | 1.09 | (.57) | 42.43 |
| June 30, 2002 | 47.97 | (.22) | (15.47) | (15.69) | — | 32.28 | (32.71) | 7,683,016 | .98 | (.57) | 76.67 |
| CLASS B | |||||||||||
| June 30, 2006 | $37.45 | (.38)(d,h) | 3.78 | 3.40 | —(e) | $40.85 | 9.08(h) | $610,991 | 1.83(d,h) | (.94)(d,h) | 83.63 |
| June 30, 2005 | 35.34 | (.24)(d,f,g) | 2.35 | 2.11 | —(e) | 37.45 | 5.97(g) | 784,295 | 1.87(d) | (.68)(d,f,g) | 97.25 |
| June 30, 2004 | 29.96 | (.43)(d) | 5.81 | 5.38 | —(e) | 35.34 | 17.96 | 1,674,238 | 1.84(d) | (1.27)(d) | 60.86 |
| June 30, 2003 | 29.72 | (.36) | .60 | .24 | — | 29.96 | .81 | 1,850,775 | 1.84 | (1.33) | 42.43 |
| June 30, 2002 | 44.50 | (.48) | (14.30) | (14.78) | — | 29.72 | (33.21) | 2,739,100 | 1.73 | (1.32) | 76.67 |
| CLASS C | |||||||||||
| June 30, 2006 | $39.73 | (.41)(d,h) | 4.02 | 3.61 | —(e) | $43.34 | 9.09(h) | $39,825 | 1.83(d,h) | (.94)(d,h) | 83.63 |
| June 30, 2005 | 37.49 | (.25)(d,f,g) | 2.49 | 2.24 | —(e) | 39.73 | 5.98(g) | 42,827 | 1.87(d) | (.68)(d,f,g) | 97.25 |
| June 30, 2004 | 31.79 | (.45)(d) | 6.15 | 5.70 | —(e) | 37.49 | 17.93 | 55,005 | 1.84(d) | (1.27)(d) | 60.86 |
| June 30, 2003 | 31.53 | (.37) | .63 | .26 | — | 31.79 | .83 | 64,015 | 1.84 | (1.32) | 42.43 |
| June 30, 2002 | 47.21 | (.50) | (15.18) | (15.68) | — | 31.53 | (33.21) | 79,149 | 1.73 | (1.32) | 76.67 |
| CLASS M | |||||||||||
| June 30, 2006 | $39.14 | (.29)(d,h) | 3.94 | 3.65 | —(e) | $42.79 | 9.32(h) | $78,230 | 1.58(d,h) | (.69)(d,h) | 83.63 |
| June 30, 2005 | 36.83 | (.16)(d,f,g) | 2.47 | 2.31 | —(e) | 39.14 | 6.27(g) | 104,545 | 1.62(d) | (.43)(d,f,g) | 97.25 |
| June 30, 2004 | 31.15 | (.36)(d) | 6.04 | 5.68 | —(e) | 36.83 | 18.24 | 134,157 | 1.59(d) | (1.02)(d) | 60.86 |
| June 30, 2003 | 30.82 | (.30) | .63 | .33 | — | 31.15 | 1.07 | 171,675 | 1.59 | (1.07) | 42.43 |
| June 30, 2002 | 46.03 | (.40) | (14.81) | (15.21) | — | 30.82 | (33.04) | 223,964 | 1.48 | (1.07) | 76.67 |
| CLASS R | |||||||||||
| June 30, 2006 | $41.38 | (.19)(d,h) | 4.18 | 3.99 | —(e) | $45.37 | 9.64(h) | $517 | 1.33(d,h) | (.40)(d,h) | 83.63 |
| June 30, 2005 | 38.85 | (.09)(d,f,g) | 2.62 | 2.53 | —(e) | 41.38 | 6.51(g) | 184 | 1.37(d) | (.23)(d,f,g) | 97.25 |
| June 30, 2004 | 32.76 | (.27)(d) | 6.36 | 6.09 | —(e) | 38.85 | 18.59 | 25 | 1.34(d) | (.76)(d) | 60.86 |
| June 30, 2003† | 28.90 | (.10) | 3.96 | 3.86 | — | 32.76 | 13.36* | 1 | .59* | (.36)* | 42.43 |
| CLASS Y | |||||||||||
| June 30, 2006 | $42.97 | .03(d,h) | 4.34 | 4.37 | —(e) | $47.34 | 10.17(h) | $413,670 | .83(d,h) | .06(d,h) | 83.63 |
| June 30, 2005 | 40.14 | .13(d,f,g) | 2.70 | 2.83 | —(e) | 42.97 | 7.05(g) | 404,943 | .87(d) | .34(d,f,g) | 97.25 |
| June 30, 2004 | 33.70 | (.10)(d) | 6.54 | 6.44 | —(e) | 40.14 | 19.11 | 851,430 | .84(d) | (.27)(d) | 60.86 |
| June 30, 2003 | 33.09 | (.10) | .71 | .61 | — | 33.70 | 1.85 | 930,912 | .84 | (.33) | 42.43 |
| June 30, 2002 | 49.05 | (.13) | (15.83) | (15.96) | — | 33.09 | (32.54) | 1,170,852 | .73 | (.32) | 76.67 |
| See notes to financial highlights at the end of this section. | |||||||||||
| The accompanying notes are an integral part of these financial statements. |
44 45
| Financial highlights (Continued) |
* Not annualized.
† For the period January 21, 2003 (commencement of operations) to June 30, 2003.
(a) Per share net investment income (loss) has been determined on the basis of the weighted average number of shares outstanding during the period.
(b) Total return assumes dividend reinvestment and does not reflect the effect of sales charges.
(c) Includes amounts paid through expense offset and brokerage service arrangements (Note 2).
(d) Reflects waivers of certain fund expenses in connection with investments in Putnam Prime Market Fund during the period. As a result of such waivers, the expenses of each class, as a percentage of its net assets, reflect a reduction of the following amounts (Note 5):
| 6/30/06 | 6/30/05 | 6/30/04 | |
| Class A | <0.01% | <0.01% | <0.01% |
| Class B | <0.01 | <0.01 | <0.01 |
| Class C | <0.01 | <0.01 | <0.01 |
| Class M | <0.01 | <0.01 | <0.01 |
| Class R | <0.01 | <0.01 | <0.01 |
| Class Y | <0.01 | <0.01 | <0.01 |
(e) Amount represents less than $0.01 per share.
(f) Net investment income (loss) per share and ratio of net investment income (loss) to average net assets reflect a special dividend received by the fund which amounted to the following amounts:
| Percentage of | ||
| Per share | net assets | |
| Class A | $0.15 | 0.39% |
| Class B | 0.15 | 0.42 |
| Class C | 0.15 | 0.40 |
| Class M | 0.15 | 0.40 |
| Class R | 0.12 | 0.31 |
| Class Y | 0.17 | 0.43 |
(g) Reflects a non-recurring accrual related to Putnam Management’s settlement with the SEC regarding brokerage allocation practices, which amounted to the following amounts (Note 6):
| Percentage of | ||
| Per share | net assets | |
| Class A | $0.02 | 0.05% |
| Class B | 0.01 | 0.04 |
| Class C | 0.02 | 0.05 |
| Class M | 0.02 | 0.05 |
| Class R | 0.03 | 0.08 |
| Class Y | 0.01 | 0.04 |
(h) Reflects a non-recurring reimbursement from Putnam Investments relating to the calculation of certain amounts paid by the fund to Putnam in previous years for transfer agent services, which amounted to $0.03 per share and 0.06% of average net assets for the period ended June 30, 2006 (Note 6).
The accompanying notes are an integral part of these financial statements.
46
Notes to financial statements 6/30/06
Note 1: Significant accounting policies
Putnam New Opportunities Fund (the “fund”), a Massachusetts business trust, is registered under the Investment Company Act of 1940, as amended, as a diversified, open-end management investment company. The fund seeks capital appreciation by investing principally in common stocks of companies in sectors of the economy which, in the judgment of Putnam Investment Management, LLC (“Putnam Management”), the fund’s manager, an indirect wholly-owned subsidiary of Putnam, LLC, possess above-average, long-term growth potential.
The fund offers class A, class B, class C, class M, class R and class Y shares. Class A and class M shares are sold with a maximum front-end sales charge of 5.25% and 3.25%, respectively, and generally do not pay a contingent deferred sales charge. Class B shares, which convert to class A shares after approximately eight years, do not pay a front-end sales charge and are subject to a contingent deferred sales charge, if those shares are redeemed within six years of purchase. Class C shares have a one-year 1.00% contingent deferred sales charge and do not convert to class A shares. Class R shares, which are offered to qualified employee-benefit plans, are sold without a front-end sales charge or a contingent deferred sales charge. The expenses for class A, class B, class C, class M and class R shares may differ based on the distribution fee of each class, which is identified in Note 2. Class Y shares, which are sold at net asset value, are generally subject to the same expenses as class A, class B, class C, class M and class R shares, but do not bear a distribution fee. Class Y shares are sold to certain eligible purchasers including certain defined contribution plans (including corporate IRAs), bank trust departments, trust companies and certain college savings plans.
A 2.00% redemption fee may apply to any shares that are redeemed (either by selling or exchanging into another fund) within 5 days of purchase. The redemption fee is accounted for as an addition to paid-in-capital.
Investment income, realized and unrealized gains and losses and expenses of the fund are borne pro-rata based on the relative net assets of each class to the total net assets of the fund, except that each class bears expenses unique to that class (including the distribution fees applicable to such classes). Each class votes as a class only with respect to its own distribution plan or other matters on which a class vote is required by law or determined by the Trustees. Shares of each class would receive their pro-rata share of the net assets of the fund, if the fund were liquidated. In addition, the Trustees declare separate dividends on each class of shares.
In the normal course of business, the fund enters into contracts that may include agreements to indemnify another party under given circumstances. The fund’s maximum exposure under these arrangements is unknown as this would involve future claims that may be, but have not yet been, made against the fund. However, the fund expects the risk of material loss to be remote.
The following is a summary of significant accounting policies consistently followed by the fund in the preparation of its financial statements. The preparation of financial statements is in conformity with accounting principles generally accepted in the United States of America and requires management to make estimates and assumptions that affect the reported amounts of assets and liabilities in the financial statements and the reported amounts of increases and decreases in net assets from operations during the reporting period. Actual results could differ from those estimates.
A) Security valuation Investments for which market quotations are readily available are valued at the last reported sales price on their principal exchange, or official closing price for certain markets. If no sales are reported — as in the case of some securities traded over-the-counter — a security is valued at its last reported bid price. Many securities markets and exchanges outside the U.S. close prior to the close of the New York Stock Exchange and therefore the closing prices for securities in such markets or on such
47
exchanges may not fully reflect events that occur after such close but before the close of the New York Stock Exchange. Accordingly, on certain days, the fund will fair value foreign equity securities taking into account multiple factors, including movements in the U.S. securities markets. The number of days on which fair value prices will be used will depend on market activity and it is possible that fair value prices will be used by the fund to a significant extent. Securities quoted in foreign currencies, if any, are translated into U.S. dollars at the current exchange rate. Other investments, including certain restricted securities, are valued at fair value following procedures approved by the Trustees. Such valuations and procedures are reviewed periodically by the Trustees. The fair value of securities is generally determined as the amount that the fund could reasonably expect to realize from an orderly disposition of such securities over a reasonable period of time. By its nature, a fair value price is a good faith estimate of the value of a security at a given point in time and does not reflect an actual market price.
B) Joint trading account Pursuant to an exemptive order from the Securities and Exchange Commission, the fund may transfer uninvested cash balances, including cash collateral received under security lending arrangements, into a joint trading account along with the cash of other registered investment companies and certain other accounts managed by Putnam Management. These balances may be invested in issues of high-grade, short-term investments having maturities of up to 397 days for collateral received under security lending arrangements and up to 90 days for other cash investments.
C) Repurchase agreements The fund, or any joint trading account, through its custodian, receives delivery of the underlying securities, the market value of which at the time of purchase is required to be in an amount at least equal to the resale price, including accrued interest. Collateral for certain tri-party repurchase agreements is held at the counterparty’s custodian in a segregated account for the benefit of the fund and the counterparty. Putnam Management is responsible for determining that the value of these underlying securities is at all times at least equal to the resale price, including accrued interest.
D) Security transactions and related investment income Security transactions are recorded on the trade date (the date the order to buy or sell is executed). Gains or losses on securities sold are determined on the identified cost basis.
Interest income is recorded on the accrual basis. Dividend income, net of applicable withholding taxes, is recognized on the ex-dividend date except that certain dividends from foreign securities, if any, are recognized as soon as the fund is informed of the ex-dividend date. Non-cash dividends, if any, are recorded at the fair market value of the securities received. Dividends representing a return of capital or capital gains, if any, are reflected as a reduction of cost and/or as a realized gain when the amounts are conclusively determined.
E) Foreign currency translation The accounting records of the fund are maintained in U.S. dollars. The market value of foreign securities, currency holdings, and other assets and liabilities are recorded in the books and records of the fund after translation to U.S. dollars based on the exchange rates on that day. The cost of each security is determined using historical exchange rates. Income and withholding taxes are translated at prevailing exchange rates when earned or incurred. The fund does not isolate that portion of realized or unrealized gains or losses resulting from changes in the foreign exchange rate on investments from fluctua-tions arising from changes in the market prices of the securities. Such gains and losses are included with the net realized and unrealized gain or loss on investments. Net realized gains and losses on foreign currency transactions represent net realized exchange gains or losses on closed forward currency contracts, disposition of foreign currencies, currency gains and losses realized between the trade and settlement dates on securities transactions and the difference between the amount of investment income and foreign
48
withholding taxes recorded on the fund’s books and the U.S. dollar equivalent amounts actually received or paid. Net unrealized appreciation and depreciation of assets and liabilities in foreign currencies arise from changes in the value of open forward currency contracts and assets and liabilities other than investments at the period end, resulting from changes in the exchange rate. Investments in foreign securities involve certain risks, including those related to economic instability, unfavorable political developments, and currency fluctuations, not present with domestic investments.
F) Futures and options contracts The fund may use futures and options contracts to hedge against changes in the values of securities the fund owns or expects to purchase, or for other investment purposes. The fund may also write options on swaps or securities it owns or in which it may invest to increase its current returns.
The potential risk to the fund is that the change in value of futures and options contracts may not correspond to the change in value of the hedged instruments. In addition, losses may arise from changes in the value of the underlying instruments, if there is an illiquid secondary market for the contracts, or if the counterparty to the contract is unable to perform. Risks may exceed amounts recognized on the statement of assets and liabilities. When the contract is closed, the fund records a realized gain or loss equal to the difference between the value of the contract at the time it was opened and the value at the time it was closed. Realized gains and losses on purchased options are included in realized gains and losses on investment securities. If a written call option is exercised, the premium originally received is recorded as an addition to sales proceeds. If a written put option is exercised, the premium originally received is recorded as a reduction to the cost of investments.
Futures contracts are valued at the quoted daily settlement prices established by the exchange on which they trade. The fund and the broker agree to exchange an amount of cash equal to the daily fluctuation in the value of the futures contract. Such receipts or payments are known as “variation margin.” Exchange traded options are valued at the last sale price or, if no sales are reported, the last bid price for purchased options and the last ask price for written options. Options traded over-the-counter are valued using prices supplied by dealers. Futures and written option contracts outstanding at period end, if any, are listed after the fund’s portfolio.
G) Federal taxes It is the policy of the fund to distribute all of its taxable income within the prescribed time and otherwise comply with the provisions of the Internal Revenue Code of 1986 (the “Code”) applicable to regulated investment companies. It is also the intention of the fund to distribute an amount sufficient to avoid imposition of any excise tax under Section 4982 of the Code, as amended. Therefore, no provision has been made for federal taxes on income, capital gains or unrealized appreciation on securities held nor for excise tax on income and capital gains.
At June 30, 2006, the fund had a capital loss carryover of $3,761,597,037 available to the extent allowed by the Code to offset future net capital gain, if any. The amount of the carryover and the expiration dates are:
| Loss Carryover | Expiration |
| $1,985,109,119 | June 30, 2010 |
| 1,776,487,918 | June 30, 2011 |
H) Distributions to shareholders Distributions to shareholders from net investment income are recorded by the fund on the ex-dividend date. Distributions from capital gains, if any, are recorded on the ex-dividend date and paid at least annually. The amount and character of income and gains to be distributed are determined in accordance with income tax regulations, which may differ from generally accepted accounting principles. These differences include temporary and permanent differences of losses on wash sale transactions, unrealized gains and losses on certain futures contracts, net operating
49
loss and redemption in kind. Reclassifications are made to the fund’s capital accounts to reflect income and gains available for distribution (or available capital loss carryovers) under income tax regulations. For the year ended June 30, 2006, the fund reclassified $16,304,610 to decrease accumulated net investment loss and $60,656,917 to increase paid-in-capital, with an increase to accumulated net realized loss of $76,961,527.
The tax basis components of distributable earnings and the federal tax cost as of period end June 30, 2006, were as follows:
| Unrealized appreciation | $ 553,087,716 |
| Unrealized depreciation | (252,568,528) |
| ——————————————— | |
| Net unrealized appreciation | 300,519,188 |
| Capital loss carryforward | (3,761,597,037) |
| Cost for federal income | |
| tax purposes | $ 4,535,215,493 |
Note 2: Management fee, administrative services and other transactions
Putnam Management is paid for management and investment advisory services quarterly based on the average net assets of the fund. Such fee is based on the following annual rates: 0.70% of the first $500 million of average net assets, 0.60% of the next $500 million, 0.55% of the next $500 million, 0.50% of the next $5 billion, 0.475% of the next $5 billion, 0.455% of the next $5 billion, 0.44% of the next $5 billion, 0.43% of the next $5 billion, 0.42% of the next $5 billion, 0.41% of the next $5 billion, 0.40% of the next $5 billion, 0.39% of the next $5 billion, 0.38% of the next $8.5 billion and 0.37% thereafter.
Putnam Management has agreed to waive fees and reimburse expenses of the fund through June 30, 2007, to the extent necessary to ensure that the fund’s expenses do not exceed the simple average of the expenses of all front-end load funds viewed by Lipper, Inc. as having the same investment classification or objective as the fund. The expense reimbursement is based on a comparison of the fund’s expenses with the average annualized operating expenses of the funds in its Lipper peer group for each calendar quarter during the fund’s last fiscal year, excluding 12b-1 fees and without giving effect to any expense offset and brokerage service arrangements that may reduce fund expenses. For the year ended June 30, 2006, Putnam Management did not waive any of its management fee from the fund.
For the year ended June 30, 2006, Putnam Management has assumed $77,215 of legal, shareholder servicing and communication, audit and Trustee fees incurred by the fund in connection with certain legal and regulatory matters (including those described in Note 6).
The fund reimburses Putnam Management an allocated amount for the compensation and related expenses of certain officers of the fund and their staff who provide administrative services to the fund. The aggregate amount of all such reimbursements is determined annually by the Trustees.
Custodial functions for the fund’s assets are provided by Putnam Fiduciary Trust Company (“PFTC”), a subsidiary of Putnam, LLC. PFTC receives fees for custody services based on the fund’s asset level, the number of its security holdings and transaction volumes. Putnam Investor Services, a division of PFTC, provides investor servicing agent functions to the fund. Putnam Investor Services receives fees for investor servicing based on the number of shareholder accounts in the fund and the level of defined contribution plan assets in the fund. During the year ended June 30, 2006, the fund incurred $18,734,083 for these services.
The fund has entered into an arrangement with PFTC whereby credits realized as a result of uninvested cash balances are used to reduce a portion of the fund’s expenses. The fund also reduced expenses through brokerage service arrangements. For the year ended June 30, 2006, the fund’s expenses were reduced by $2,458,674 under these arrangements.
50
Each independent Trustee of the fund receives an annual Trustee fee, of which $1,335, as a quarterly retainer, has been allocated to the fund, and an additional fee for each Trustees meeting attended. Trustees receive additional fees for attendance at certain committee meetings, industry seminars and for certain compliance-related matters. Trustees also are reimbursed for expenses they incur relating to their services as Trustees. George Putnam, III, who is not an independent Trustee, also receives the foregoing fees for his services as Trustee.
The fund has adopted a Trustee Fee Deferral Plan (the “Deferral Plan”) which allows the Trustees to defer the receipt of all or a portion of Trustees fees payable on or after July 1, 1995. The deferred fees remain invested in certain Putnam funds until distribution in accordance with the Deferral Plan.
The fund has adopted an unfunded noncontributory defined benefit pension plan (the “Pension Plan”) covering all Trustees of the fund who have served as a Trustee for at least five years and were first elected prior to 2004. Benefits under the Pension Plan are equal to 50% of the Trustee’s average annual attendance and retainer fees for the three years ended December 31, 2005. Pension expense for the fund is included in Trustee compensation and expenses in the statement of operations. Accrued pension liability is included in Payable for Trustee compensation and expenses in the statement of assets and liabilities. The Trustees have terminated the Pension Plan with respect to any Trustee first elected after 2003.
The fund has adopted distribution plans (the “Plans”) with respect to its class A, class B, class C, class M and class R shares pursuant to Rule 12b-1 under the Investment Company Act of 1940. The purpose of the Plans is to compensate Putnam Retail Management, a wholly-owned subsidiary of Putnam, LLC and Putnam Retail Management GP, Inc., for services provided and expenses incurred in distributing shares of the fund. The Plans provide for payments by the fund to Putnam Retail Management at an annual rate of up to 0.35%, 1.00%, 1.00%, 1.00% and 1.00% of the average net assets attributable to class A, class B, class C, class M and class R shares, respectively. The Trustees have approved payment by the fund at an annual rate of 0.25%, 1.00%, 1.00%, 0.75% and 0.50% of the average net assets attributable to class A, class B, class C, class M and class R shares, respectively.
For the year ended June 30, 2006, Putnam Retail Management, acting as underwriter, received net commissions of $146,963 and $2,676 from the sale of class A and class M shares, respectively, and received $1,185,894 and $2,251 in contingent deferred sales charges from redemptions of class B and class C shares, respectively. A deferred sales charge of up to 1.00% and 0.65% is assessed on certain redemptions of class A and class M shares, respectively. For the year ended June 30, 2006, Putnam Retail Management, acting as underwriter, received $895 and no monies on class A and class M redemptions, respectively.
Note 3: Purchases and sales of securities
During the year ended June 30, 2006, cost of purchases and proceeds from sales of investment securities other than short-term investments aggregated $4,805,436,977 and $6,709,389,833, respectively. There were no purchases or sales of U.S. government securities.
For the year ended June 30, 2006, the fund had redemptions in kind which resulted in redemptions out of the fund totaling $529,080,227.
Written option transactions during the year ended June 30, 2006 are summarized as follows:
51
| Contract | Premiums | |||
| Amounts | Received | |||
| Written options | ||||
| outstanding at | ||||
| beginning of year | $ — | $ | — | |
| Options opened | 451,550 | 444,860 | ||
| Options exercised | (179,045) | (195,536) | ||
| Options expired | (243,705) | (224,775) | ||
| Options closed | — | — | ||
| Written options | ||||
| outstanding at | ||||
| end of year | $ 28,800 | $ 24,549 | ||
Note 4: Capital shares
At June 30, 2006, there was an unlimited number of shares of beneficial interest authorized. In certain circumstances shares may be purchased or redeemed through the delivery to the fund or receipt by the shareholders, respectively, of securities, the fair value of which is used to determine the number of shares issued or redeemed.
Transactions in capital shares were as follows:
| CLASS A | Shares | Amount |
| Year ended 6/30/06: | ||
| Shares sold | 7,090,831 | $ 323,578,415 |
| Shares issued | ||
| in connection | ||
| with reinvestment | ||
| of distributions | — | — |
| 7,090,831 | 323,578,415 | |
| Shares | ||
| repurchased | (26,760,549) | (1,213,365,048) |
| Redemptions | ||
| in kind | (11,442,046) | (529,080,227) |
| Net decrease | (31,111,764) | $(1,418,866,860) |
| Year ended 6/30/05: | ||
| Shares sold | 22,948,084 | $ 886,479,528 |
| Shares issued | ||
| in connection | ||
| with reinvestment | ||
| of distributions | — | — |
| 22,948,084 | 886,479,528 | |
| Shares | ||
| repurchased | (41,417,076) | (1,620,097,643) |
| Net decrease | (18,468,992) | $ (733,618,115) |
52
| CLASS B | Shares | Amount | CLASS M | Shares | Amount |
| Year ended 6/30/06: | Year ended 6/30/06: | ||||
| Shares sold | 1,098,871 | $ 44,859,067 | Shares sold | 181,349 | $ 7,716,906 |
| Shares issued | Shares issued | ||||
| in connection | in connection | ||||
| with reinvestment | with reinvestment | ||||
| of distributions | — | — | of distributions | — | — |
| 1,098,871 | 44,859,067 | 181,349 | 7,716,906 | ||
| Shares | Shares | ||||
| repurchased | (7,083,792) | (288,129,279) | repurchased | (1,024,641) | (43,488,871) |
| Net decrease | (5,984,921) | $(243,270,212) | Net decrease | (843,292) | $(35,771,965) |
| Year ended 6/30/05: | Year ended 6/30/05: | ||||
| Shares sold | 1,409,602 | $ 49,728,811 | Shares sold | 249,786 | $ 9,211,102 |
| Shares issued | Shares issued | ||||
| in connection | in connection | ||||
| with reinvestment | with reinvestment | ||||
| of distributions | — | — | of distributions | — | — |
| 1,409,602 | 49,728,811 | 249,786 | 9,211,102 | ||
| Shares | Shares | ||||
| repurchased | (27,845,983) | (971,691,503) | repurchased | (1,220,735) | (45,132,105) |
| Net decrease | (26,436,381) | $(921,962,692) | Net decrease | (970,949) | $(35,921,003) |
| CLASS C | Shares | Amount | CLASS R | Shares | Amount |
| Year ended 6/30/06: | Year ended 6/30/06: | ||||
| Shares sold | 130,754 | $ 5,654,158 | Shares sold | 16,608 | $ 757,250 |
| Shares issued | Shares issued | ||||
| in connection | in connection | ||||
| with reinvestment | with reinvestment | ||||
| of distributions | — | — | of distributions | — | — |
| 130,754 | 5,654,158 | 16,608 | 757,250 | ||
| Shares | Shares | ||||
| repurchased | (289,685) | (12,509,194) | repurchased | (9,669) | (466,245) |
| Net decrease | (158,931) | $ (6,855,036) | Net increase | 6,939 | $ 291,005 |
| Year ended 6/30/05: | Year ended 6/30/05: | ||||
| Shares sold | 101,542 | $ 3,817,980 | Shares sold | 5,012 | $ 196,076 |
| Shares issued | Shares issued | ||||
| in connection | in connection | ||||
| with reinvestment | with reinvestment | ||||
| of distributions | — | — | of distributions | — | — |
| 101,542 | 3,817,980 | 5,012 | 196,076 | ||
| Shares | Shares | ||||
| repurchased | (490,866) | (18,373,952) | repurchased | (1,204) | (48,601) |
| Net decrease | (389,324) | $(14,555,972) | Net increase | 3,808 | $ 147,475 |
53
| CLASS Y | Shares | Amount |
| Year ended 6/30/06: | ||
| Shares sold | 1,292,228 | $ 61,098,068 |
| Shares issued | ||
| in connection | ||
| with reinvestment | ||
| of distributions | — | — |
| 1,292,228 | 61,098,068 | |
| Shares | ||
| repurchased | (1,977,874) | (92,810,398) |
| Net decrease | (685,646) | $ (31,712,330) |
| Year ended 6/30/05: | ||
| Shares sold | 2,889,224 | $ 114,469,140 |
| Shares issued | ||
| in connection | ||
| with reinvestment | ||
| of distributions | — | — |
| 2,889,224 | 114,469,140 | |
| Shares | ||
| repurchased | (14,676,760) | (599,862,180) |
| Net decrease | (11,787,536) | $(485,393,040) |
Note 5: Investment in Putnam Prime Money Market Fund
Pursuant to an exemptive order from the Securities and Exchange Commission, the fund invests in Putnam Prime Money Market Fund, an open-end management investment company managed by Putnam Management. Management fees paid by the fund are reduced by an amount equal to the management and administrative services fees paid by Putnam Prime Money Market Fund with respect to assets invested by the fund in Putnam Prime Money Market Fund. For the year ended June 30, 2006, management fees paid were reduced by $54,846 relating to the fund’s investment in Putnam Prime Money Market Fund. Income distributions earned by the fund are recorded as income in the statement of operations and totaled $1,782,273 for the year ended June 30, 2006. During the year ended June 30, 2006, cost of purchases and cost of sales of investments in Putnam Prime Money Market Fund aggregated $1,061,633,837 and $1,052,031,373, respectively.
Note 6: Regulatory matters and litigation
Putnam Management has entered into agreements with the Securities and Exchange Commission and the Massachusetts Securities Division settling charges connected with excessive short-term trading by Putnam employees and, in the case of the charges brought by the Massachusetts Securities Division, by participants in some Putnam-administered 401(k) plans. Pursuant to these settlement agreements, Putnam Management will pay a total of $193.5 million in penalties and restitution, with $153.5 million being paid to certain open-end funds and their shareholders. The amount will be allocated to shareholders and funds pursuant to a plan developed by an independent consultant, and will be paid following approval of the plan by the SEC and the Massachusetts Securities Division.
The Securities and Exchange Commission’s and Massachusetts Securities Division’s allegations and related matters also serve as the general basis for numerous lawsuits, including purported class action lawsuits filed against Putnam Management and certain related parties, including certain Putnam funds. Putnam Management will bear any costs incurred by Putnam funds in connection with these lawsuits. Putnam Management believes that the likelihood that the pending private lawsuits and purported class action lawsuits will have a material adverse financial impact on the fund is remote, and the pending actions are not likely to materially affect its ability to provide investment management services to its clients, including the Putnam funds.
Pursuant to a settlement with the Securities and Exchange Commission relating to Putnam Management’s brokerage allocation practices, on October 13, 2005 the fund received $3,010,524 in proceeds paid by Putnam Management. The fund had accrued a receivable for this amount in the prior fiscal year.
In March 2006, the fund received $3,605,432 from Putnam to address issues relating to the calculation of certain amounts paid by the Putnam mutual funds
54
to Putnam for transfer agent services. This amount is included in Fees waived and reimbursed by Manager or affiliate on the Statement of operations. Review of this matter is ongoing and the amount received by the fund may be adjusted in the future. Such adjustment is not expected to be material.
Putnam Management and Putnam Retail Management are named as defendants in a civil suit in which the plaintiffs allege that the management and distribution fees paid by certain Putnam funds were excessive and seek recovery under the Investment Company Act of 1940. Putnam Management and Putnam Retail Management have contested the plaintiffs’ claims and the matter is currently pending in the U.S. District Court for the District of Massachusetts. Based on currently available information, Putnam Management believes that this action is without merit and that it is unlikely to have a material effect on Putnam Management’s and Putnam Retail Management’s ability to provide services to their clients, including the fund.
Note 7: New accounting pronouncement
In June 2006, FASB issued Interpretation No. 48, Accounting for Uncertainty in Income Taxes (the “Interpretation”). The Interpretation prescribes a minimum threshold for financial statement recognition of the benefit of a tax position taken or expected to be taken by a filer in the filer’s tax return. The Interpretation will become effective for fiscal years beginning after December 15, 2006, but will also apply to tax positions reflected in the fund’s financial statements as of that date. No determination has been made whether the adoption of the Interpretation will require the fund to make any adjustments to its net assets or have any other effect on the fund’s financial statements.
55
| Federal tax information (Unaudited) |
The Form 1099 you receive in January 2007 will show the tax status of all distributions paid to your account in calendar 2006.
56
| Brokerage commissions (Unaudited) |
Brokerage commissions are paid to firms that execute trades on behalf of your fund. When choosing these firms, Putnam is required by law to seek the best execution of the trades, taking all relevant factors into consideration, including expected quality of execution and commission rate. Listed below are the largest relationships based upon brokerage commissions for your fund and the other funds in Putnam’s U.S. Small- and Mid-Cap group for the year ended June 30, 2006. The other Putnam mutual funds in this group are Putnam Capital Opportunities Fund, Putnam Discovery Growth Fund, Putnam Mid Cap Value Fund, Putnam OTC & Emerging Growth Fund, Putnam Small Cap Growth Fund, Putnam Small Cap Value Fund, Putnam Vista Fund, Putnam VT Capital Opportunities Fund, Putnam VT Discovery Growth Fund, Putnam VT Mid Cap Value Fund, Putnam VT New Opportunities Fund, Putnam VT OTC & Emerging Growth Fund, Putnam VT Small Cap Value Fund, and Putnam VT Vista Fund.
The top five firms that received brokerage commissions for trades executed for the U.S. Small-and Mid-Cap group are (in descending order) Citigroup Global Markets, Goldman Sachs, Lehman Brothers, Credit Suisse First Boston, and Bear Stearns & Company. Commissions paid to these firms together represented approximately 35% of the total brokerage commissions paid for the year ended June 30, 2006.
Commissions paid to the next 10 firms together represented approximately 37% of the total brokerage commissions paid during the period. These firms are (in alphabetical order) Bank of America, CIBC World Markets, Deutsche Bank Securities, JP Morgan Clearing, Merrill Lynch, Morgan Stanley Dean Witter, RBC Capital Markets, SG Cowen, UBS Warburg, and Wachovia Securities.
Additional information about brokerage commissions is available on the Securities and Exchange Commission (SEC) Web site at www.sec.gov. Putnam funds disclose commissions by firm to the SEC in semiannual filings on Form N-SAR.
57
| About the Trustees |
Jameson A. Baxter (Born 1943), Trustee since 1994, Vice Chairman since 2005
Ms. Baxter is the President of Baxter Associates, Inc., a private investment firm that she founded in 1986.
Ms. Baxter serves as a Director of ASHTA Chemicals, Inc., Banta Corporation (a printing and digital imaging firm), Ryerson Tull, Inc. (a steel service corporation), the Mutual Fund Directors Forum, Advocate Health Care and BoardSource, formerly the National Center for Nonprofit Boards. She is Chairman Emeritus of the Board of Trustees, Mount Holyoke College, having served as Chairman for five years and as a board member for thirteen years. Until 2002, Ms. Baxter was a Director of Intermatic Corporation (a manufacturer of energy control products).
Ms. Baxter has held various positions in investment banking and corporate finance, including Vice President and Principal of the Regency Group, and Vice President of and Consultant to First Boston Corporation. She is a graduate of Mount Holyoke College.
Charles B. Curtis (Born 1940), Trustee since 2001
Mr. Curtis is President and Chief Operating Officer of the Nuclear Threat Initiative (a private foundation dealing with national security issues) and serves as Senior Advisor to the United Nations Foundation.
Mr. Curtis is a member of the Council on Foreign Relations and the Trustee Advisory Council of the Applied Physics Laboratory, Johns Hopkins University. Until 2003, Mr. Curtis was a member of the Electric Power Research Institute Advisory Council and the University of Chicago Board of Governors for Argonne National Laboratory. Prior to 2002, Mr. Curtis was a Member of the Board of Directors of the Gas Technology Institute and the Board of Directors of the Environment and Natural Resources Program Steering Committee, John F. Kennedy School of Government, Harvard University. Until 2001, Mr. Curtis was a member of the Department of Defense Policy Board and Director of EG&G Technical Services, Inc. (a fossil energy research and development support company).
From August 1997 to December 1999, Mr. Curtis was a Partner at Hogan & Hartson L.L.P., a Washington, D.C. law firm. Prior to May 1997, Mr. Curtis was Deputy Secretary of Energy and Under Secretary of the U.S. Department of Energy. He served as Chairman of the Federal Energy Regulatory Commission from 1977 to 1981 and has held positions on the staff of the U.S. House of Representatives, the U.S. Treasury Department, and the SEC.
58
Myra R. Drucker (Born 1948), Trustee since 2004
Ms. Drucker is a Vice Chair of the Board of Trustees of Sarah Lawrence College, Vice Chair of the Board of Trustees of the Commonfund (a not-for-profit firm specializing in asset management for educational endowments and foundations) and a member of the Investment Committee of the Kresge Foundation (a charitable trust).
Ms. Drucker is an ex-officio member of the New York Stock Exchange (NYSE) Pension Managers Advisory Committee, having served as Chair for seven years and a member of the Executive Committee of the Committee on Investment of Employee Benefit Assets. She is Chair of the Advisory Board of Hamilton Lane Advisors (an investment management firm) and a member of the Advisory Board of RCM (an investment management firm). Until August 31, 2004, Ms. Drucker was Managing Director and a member of the Board of Directors of General Motors Asset Management and Chief Investment Officer of General Motors Trust Bank. Ms. Drucker also served as a member of the NYSE Corporate Accountability and Listing Standards Committee and the NYSE/NASD IPO Advisory Committee.
Prior to joining General Motors Asset Management in 2001, Ms. Drucker held various executive positions in the investment management industry. Ms. Drucker served as Chief Investment Officer of Xerox Corporation (a technology and service company in the document industry), where she was responsible for the investment of the company’s pension assets. Ms. Drucker was also Staff Vice President and Director of Trust Investments for International Paper (a paper, paper distribution, packaging and forest products company) and previously served as Manager of Trust Investments for Xerox Corporation. Ms. Drucker received a B.A. degree in Literature and Psychology from Sarah Lawrence College and pursued graduate studies in economics, statistics and portfolio theory at Temple University.
John A. Hill (Born 1942), Trustee since 1985 and Chairman since 2000
Mr. Hill is Vice Chairman of First Reserve Corporation, a private equity buyout firm that specializes in energy investments in the diversified worldwide energy industry.
Mr. Hill is a Director of Devon Energy Corporation, TransMontaigne Oil Company and various private companies controlled by First Reserve Corporation, as well as Chairman of TH Lee, Putnam Investment Trust (a closed-end investment company advised by an affiliate of Putnam Management). He is also a Trustee of Sarah Lawrence College. Until 2005, he was a Director of Continuum Health Partners of New York.
Prior to acquiring First Reserve Corporation in 1983, Mr. Hill held executive positions in investment banking and investment management with several firms and with the federal government, including Deputy Associate Director of the Office of Management and Budget and Deputy
59
Director of the Federal Energy Administration. He is active in various business associations, including the Economic Club of New York, and lectures on energy issues in the United States and Europe. Mr. Hill holds a B.A. degree in Economics from Southern Methodist University and pursued graduate studies there as a Woodrow Wilson Fellow.
| Paul L. Joskow (Born 1947), Trustee since 1997 |
Dr. Joskow is the Elizabeth and James Killian Professor of Economics and Management, and Director of the Center for Energy and Environmental Policy Research at the Massachusetts Institute of Technology.
Dr. Joskow serves as a Director of National Grid plc (a UK-based holding company with interests in electric and gas transmission and distribution and telecommunications infrastructure) and TransCanada Corporation (an energy company focused on natural gas transmission and power services). He also serves on the Board of Overseers of the Boston Symphony Orchestra. Prior to February 2005, he served on the board of the Whitehead Institute for Biomedical Research (a non-profit research institution) and has been President of the Yale University Council since 1993. Prior to February 2002, he was a Director of State Farm Indemnity Company (an automobile insurance company), and, prior to March 2000, he was a Director of New England Electric System (a public utility holding company).
Dr. Joskow has published five books and numerous articles on topics in industrial organization, government regulation of industry, and competition policy. He is active in industry restructuring, environmental, energy, competition and privatization policies — serving as an advisor to governments and corporations worldwide. Dr. Joskow holds a Ph.D. and M. Phil from Yale University and a B.A. from Cornell University.
Elizabeth T. Kennan (Born 1938), Trustee since 1992
Dr. Kennan is a Partner of Cambus-Kenneth Farm (thoroughbred horse and cattle breeding). She is President Emeritus of Mount Holyoke College.
Dr. Kennan served as Chairman and is now Lead Director of Northeast Utilities. Until 2005, she was a Director of Talbots, Inc. She has served as Director on a number of other boards, including Bell Atlantic, Chastain Real Estate, Shawmut Bank, Berkshire Life Insurance and Kentucky Home Life Insurance. She is a Trustee of the National Trust for Historic Preservation, of Centre College and of Midway College in Midway, Kentucky. Until 2006, she was a member of The Trustees of Reservations. Dr. Kennan has served on the oversight committee of the Folger Shakespeare Library, as President of Five Colleges Incorporated, as a Trustee of Notre Dame University and is active in various educational and civic associations.
60
As a member of the faculty of Catholic University for twelve years, until 1978, Dr. Kennan directed the post-doctoral program in Patristic and Medieval Studies, taught history and published numerous articles. Dr. Kennan holds a Ph.D. from the University of Washington in Seattle, an M.S. from St. Hilda’s College at Oxford University and an A.B. from Mount Holyoke College. She holds several honorary doctorates.
Robert E. Patterson (Born 1945), Trustee since 1984
Mr. Patterson is Senior Partner of Cabot Properties, L.P. and Chairman of Cabot Properties, Inc. (a private equity firm investing in commercial real estate).
Mr. Patterson serves as Chairman Emeritus and Trustee of the Joslin Diabetes Center and as a Director of Brandywine Trust Group, LLC. Prior to June 2003, he was a Trustee of Sea Education Association. Prior to December 2001, he was President and Trustee of Cabot Industrial Trust (a publicly traded real estate investment trust). Prior to February 1998, he was Executive Vice President and Director of Acquisitions of Cabot Partners Limited Partnership (a registered investment adviser involved in institutional real estate investments). Prior to 1990, he served as Executive Vice President of Cabot, Cabot & Forbes Realty Advisors, Inc. (the predecessor company of Cabot Partners).
Mr. Patterson practiced law and held various positions in state government and was the founding Executive Director of the Massachusetts Industrial Finance Agency. Mr. Patterson is a graduate of Harvard College and Harvard Law School.
W. Thomas Stephens (Born 1942), Trustee since 1997
Mr. Stephens is Chairman and Chief Executive Officer of Boise Cascade, L.L.C. (a paper, forest products and timberland assets company).
Until 2005, Mr. Stephens was a director of TransCanadaPipelines, Ltd. Until 2004, Mr. Stephens was a Director of Xcel Energy Incorporated (a public utility company), Qwest Communications, and Norske Canada, Inc. (a paper manufacturer). Until 2003, Mr. Stephens was a Director of Mail-Well, Inc. (a diversified printing company). He served as Chairman of Mail-Well until 2001 and as CEO of MacMillan-Bloedel, Ltd. (a forest products company) until 1999.
Prior to 1996, Mr. Stephens was Chairman and Chief Executive Officer of Johns Manville Corporation. He holds B.S. and M.S. degrees from the University of Arkansas.
61
Richard B. Worley (Born 1945), Trustee since 2004
Mr. Worley is Managing Partner of Permit Capital LLC, an investment management firm.
Mr. Worley serves on the Executive Committee of the University of Pennsylvania Medical Center, is a Trustee of The Robert Wood Johnson Foundation (a philanthropic organization devoted to health care issues) and is a Director of The Colonial Williamsburg Foundation (a historical preservation organization). Mr. Worley also serves on the investment committees of Mount Holyoke College and World Wildlife Fund (a wildlife conservation organization).
Prior to joining Permit Capital LLC in 2002, Mr. Worley served as Chief Strategic Officer of Morgan Stanley Investment Management. He previously served as President, Chief Executive Officer and Chief Investment Officer of Morgan Stanley Dean Witter Investment Management and as a Managing Director of Morgan Stanley, a financial services firm. Mr. Worley also was the Chairman of Miller Anderson & Sherrerd, an investment management firm.
Mr. Worley holds a B.S. degree from University of Tennessee and pursued graduate studies in economics at the University of Texas.
Charles E. Haldeman, Jr.* (Born 1948), Trustee since 2004
Mr. Haldeman is President and Chief Executive Officer of Putnam, LLC (“Putnam Investments”). He is a member of Putnam Investments’ Executive Board of Directors and Advisory Council. Prior to November 2003, Mr. Haldeman served as Co-Head of Putnam Investments’ Investment Division.
Prior to joining Putnam Investments in 2002, Mr. Haldeman held executive positions in the investment management industry. He previously served as Chief Executive Officer of Delaware Investments and President & Chief Operating Officer of United Asset Management. Mr. Haldeman was also a partner and director of Cooke & Bieler, Inc. (an investment management firm).
Mr. Haldeman currently serves on the Board of Governors of the Investment Company Institute and as a Trustee of Dartmouth College, and he is a member of the Partners HealthCare Systems Investment Committee. He is a graduate of Dartmouth College, Harvard Law School and Harvard Business School. Mr. Haldeman is also a Chartered Financial Analyst (CFA) charterholder.
62
George Putnam, III* (Born 1951), Trustee since 1984 and President since 2000
Mr. Putnam is President of New Generation Research, Inc. (a publisher of financial advisory and other research services), and of New Generation Advisers, Inc. (a registered investment advisor to private funds). Mr. Putnam founded the New Generation companies in 1986.
Mr. Putnam is a Director of The Boston Family Office, LLC (a registered investment adviser). He is a Trustee of St. Mark’s School and Shore Country Day School, and until 2002 was a Trustee of the Sea Education Association.
Mr. Putnam previously worked as an attorney with the law firm of Dechert LLP (formerly known as Dechert Price & Rhoads) in Philadelphia. He is a graduate of Harvard College, Harvard Business School and Harvard Law School.
The address of each Trustee is One Post Office Square, Boston, MA 02109.
As of June 30, 2006, there were 108 Putnam Funds. All Trustees serve as Trustees of all Putnam funds.
Each Trustee serves for an indefinite term, until his or her resignation, retirement at age 72, death, or removal.
* Trustees who are or may be deemed to be “interested persons” (as defined in the Investment Company Act of 1940) of the fund, Putnam Management, Putnam Retail Management, or Marsh & McLennan Companies, Inc., the parent company of Putnam, LLC and its affiliated companies. Messrs. Haldeman and Putnam, III are deemed “interested persons” by virtue of their positions as officers of the fund, Putnam Management or Putnam Retail Management and as shareholders of Marsh & McLennan Companies, Inc. Mr. Putnam, III is the President of your fund and each of the other Putnam funds. Mr. Haldeman is President and Chief Executive Officer of Putnam Investments.
63
| Officers |
In addition to George Putnam, III, the other officers of the fund are shown below:
| Charles E. Porter (Born 1938) Executive Vice President, Associate Treasurer, Compliance Liaison and Principal Executive Officer Since 1989 Jonathan S. Horwitz (Born 1955) Senior Vice President and Treasurer Since 2004 Prior to 2004, Managing Director, Putnam Investments Steven D. Krichmar (Born 1958) Vice President and Principal Financial Officer Since 2002 Senior Managing Director, Putnam Investments. Prior to July 2001, Partner, PricewaterhouseCoopers LLP Michael T. Healy (Born 1958) Assistant Treasurer and Principal Accounting Officer Since 2000 Managing Director, Putnam Investments Beth S. Mazor (Born 1958) Vice President Since 2002 Managing Director, Putnam Investments James P. Pappas (Born 1953) Vice President Since 2004 Managing Director, Putnam Investments and Putnam Management. During 2002, Chief Operating Officer, Atalanta/Sosnoff Management Corporation; prior to 2001, President and Chief Executive Officer, UAM Investment Services, Inc. |
| Richard S. Robie, III (Born 1960) Vice President Since 2004 Senior Managing Director, Putnam Investments, Putnam Management and Putnam Retail Management. Prior to 2003, Senior Vice President, United Asset Management Corporation Francis J. McNamara, III (Born 1955) Vice President and Chief Legal Officer Since 2004 Senior Managing Director, Putnam Investments, Putnam Management and Putnam Retail Management. Prior to 2004, General Counsel, State Street Research & Management Company Charles A. Ruys de Perez (Born 1957) Vice President and Chief Compliance Officer Since 2004 Managing Director, Putnam Investments Mark C. Trenchard (Born 1962) Vice President and BSA Compliance Officer Since 2002 Managing Director, Putnam Investments Judith Cohen (Born 1945) Vice President, Clerk and Assistant Treasurer Since 1993 Wanda M. McManus (Born 1947) Vice President, Senior Associate Treasurer and Assistant Clerk Since 2005 Nancy E. Florek (Born 1957) Vice President, Assistant Clerk, Assistant Treasurer and Proxy Manager Since 2005 |
The address of each Officer is One Post Office Square, Boston, MA 02109.
64
| The Putnam family of funds |
The following is a complete list of Putnam’s open-end mutual funds. Investors should carefully consider the investment objective, risks, charges, and expenses of a fund before investing. For a prospectus containing this and other information for any Putnam fund or product, call your financial advisor at 1-800-225-1581 and ask for a prospectus. Please read the prospectus carefully before investing.
| Growth funds | Value funds |
| Discovery Growth Fund | Classic Equity Fund |
| Growth Opportunities Fund | Convertible Income-Growth Trust |
| Health Sciences Trust | Equity Income Fund |
| International New Opportunities Fund* | The George Putnam Fund of Boston |
| New Opportunities Fund | The Putnam Fund for Growth |
| OTC & Emerging Growth Fund | and Income |
| Small Cap Growth Fund | International Growth and Income Fund* |
| Vista Fund | Mid Cap Value Fund |
| Voyager Fund | New Value Fund |
| Small Cap Value Fund† | |
| Blend funds | Income funds |
| Capital Appreciation Fund | American Government Income Fund |
| Capital Opportunities Fund | Diversified Income Trust |
| Europe Equity Fund* | Floating Rate Income Fund |
| Global Equity Fund* | Global Income Trust* |
| Global Natural Resources Fund* | High Yield Advantage Fund*† |
| International Capital | High Yield Trust* |
| Opportunities Fund* | Income Fund |
| International Equity Fund* | Limited Duration Government |
| Investors Fund | Income Fund‡ |
| Research Fund | Money Market Fund§ |
| Tax Smart Equity Fund® | U.S. Government Income Trust |
| Utilities Growth and Income Fund | |
* A 1% redemption fee on total assets redeemed or exchanged between 6 and 90 days of purchase may be imposed for all share classes of these funds.
| † Closed to new investors. |
‡ Formerly Putnam Intermediate U.S. Government Income Fund.
§ An investment in a money market fund is not insured or guaranteed by the Federal Deposit Insurance Corporation or any other government agency. Although the fund seeks to preserve your investment at $1.00 per share, it is possible to lose money by investing in the fund.
65
| Tax-free income funds AMT-Free Insured Municipal Fund** Tax Exempt Income Fund Tax Exempt Money Market Fund§ Tax-Free High Yield Fund |
| State tax-free income funds: Arizona, California, Florida, Massachusetts, Michigan, Minnesota, New Jersey, New York, Ohio, and Pennsylvania |
| Asset allocation funds Income Strategies Fund |
| Putnam Asset Allocation Funds — three investment portfolios that spread your money across a variety of stocks, bonds, and money market investments. |
| The three portfolios: Asset Allocation: Balanced Portfolio Asset Allocation: Conservative Portfolio Asset Allocation: Growth Portfolio |
| Putnam RetirementReady® Funds Putnam RetirementReady Funds — ten investment portfolios that offer diversifica- tion among stocks, bonds, and money market instruments and adjust to become more conservative over time based on a target date for withdrawing assets. |
| The ten funds: Putnam RetirementReady 2050 Fund Putnam RetirementReady 2045 Fund Putnam RetirementReady 2040 Fund Putnam RetirementReady 2035 Fund Putnam RetirementReady 2030 Fund Putnam RetirementReady 2025 Fund Putnam RetirementReady 2020 Fund Putnam RetirementReady 2015 Fund Putnam RetirementReady 2010 Fund Putnam RetirementReady Maturity Fund |
** Formerly Putnam Tax-Free Insured Fund.
With the exception of money market funds, a 2% redemption fee may be applied to shares exchanged or sold within 5 days of purchase.
Check your account balances and the most recent month-end performance at www.putnam.com.
66
| Services for shareholders |
| Investor services |
Help your investment grow Set up a program for systematic investing with as little as $25 a month from a Putnam fund or from your own savings or checking account. (Regular investing does not guarantee a profit or protect against loss in a declining market.)
Switch funds easily* You can move money from one Putnam fund to another within the same class of shares without a service charge.
Access your money easily You can have checks sent regularly or redeem shares any business day at the then-current net asset value, which may be more or less than the original cost of the shares. Class B and class C shares carry a sales charge that is applied to certain withdrawals.
How to buy additional shares You may buy shares through your financial advisor or directly from Putnam. To open an account by mail, send a check made payable to the name of the fund along with a completed fund application. To add to an existing account, complete the investment slip found at the top of your Confirmation of Activity statement and return it with a check payable to your fund.
| For more information |
Visit www.putnam.com A secure section of our Web site contains complete information on your account, including balances and transactions, updated daily. You may also conduct transactions, such as exchanges, additional investments, and address changes. Log on today to get your password.
Call us toll free at 1-800-225-1581 Ask a helpful Putnam representative or your financial advisor for details about any of these or other services, or see your prospectus.
*This privilege is subject to change or termination. An exchange of funds may result in a taxable event. In addition, a 2% redemption fee will be applied to shares exchanged or sold within 5 days of purchase, and certain funds have imposed a 1% redemption fee on total assets redeemed or exchanged between 6 and 90 days of purchase.
67
| Putnam puts your interests first |
In January 2004, Putnam began introducing a number of voluntary initiatives designed to reduce fund expenses, provide investors with more useful information, and help safeguard the interests of all Putnam investors. Visit www.putnam.com for details.
| Cost-cutting initiatives |
| Reduced sales charges The maximum sales charge for class A shares has been reduced to 5.25% for equity funds (formerly 5.75%) and 3.75% for most income funds (formerly 4.50%) . The maximum sales charge for class M shares has been reduced to 3.25% for equity funds (formerly 3.50%) .* |
Lower class B purchase limit To help ensure that investors are in the most cost-effective share class, the maximum amount that can be invested in class B shares has been reduced to $100,000. (Larger trades or accumulated amounts will be refused.)
Ongoing expenses will be limited Through calendar 2006, total ongoing expenses, including management fees for all funds, will be maintained at or below the average of each fund’s industry peers in its Lipper load-fund universe. For more information, please see the Statement of Additional information.
Improved disclosure
Putnam fund prospectuses and shareholder reports have been revised to disclose additional information that will help shareholders compare funds and weigh their costs and risks along with their potential benefits. Shareholders will find easy-to-understand information about fund expense ratios, portfolio manager compensation, risk comparisons, turnover comparisons, brokerage commissions, and employee and trustee ownership of Putnam funds. Disclosure of breakpoint discounts has also been enhanced to alert investors to potential cost savings.
Protecting investors’ interests
Short-term trading fee introduced To discourage short-term trading, which can interfere with a fund’s long-term strategy, a 2% short-term trading fee may be imposed on any Putnam fund shares (other than money market funds) redeemed or exchanged within five calendar days of purchase.
* The maximum sales charge for class A shares of Putnam Limited Duration Government Income Fund (formerly Putnam Intermediate U.S. Government Income Fund) and Putnam Floating Rate Income Fund remains 3.25% ..
68
| Fund information |
Founded over 65 years ago, Putnam Investments was built around the concept that a balance between risk and reward is the hallmark of a well-rounded financial program. We manage over 100 mutual funds in growth, value, blend, fixed income, and international.
| Investment Manager | Robert E. Patterson | Richard S. Robie, III |
| Putnam Investment | George Putnam, III | Vice President |
| Management, LLC | W. Thomas Stephens | |
| One Post Office Square | Richard B. Worley | Francis J. McNamara, III |
| Boston, MA 02109 | Vice President and Chief | |
| Legal Officer | ||
| Marketing Services | Officers | |
| Putnam Retail Management | George Putnam, III | Charles A. Ruys de Perez |
| One Post Office Square | President | Vice President and Chief |
| Boston, MA 02109 | Charles E. Porter | Compliance Officer |
| Executive Vice President, | Mark C. Trenchard | |
| Custodian | Associate Treasurer, Compliance | Vice President and |
| Putnam Fiduciary | Liaison and Principal | BSA Compliance Officer |
| Trust Company | Executive Officer | |
| Judith Cohen | ||
| Legal Counsel | Jonathan S. Horwitz | Vice President, Clerk and |
| Ropes & Gray LLP | Senior Vice President | Assistant Treasurer |
| Independent Registered | and Treasurer | |
| Wanda M. McManus | ||
| Public Accounting Firm | Steven D. Krichmar | Vice President, Senior |
| PricewaterhouseCoopers LLP | Vice President and | Associate Treasurer and |
| Principal Financial Officer | ||
| Trustees | Assistant Clerk | |
| John A. Hill, Chairman | Michael T. Healy | Nancy E. Florek |
| Jameson Adkins Baxter, | Assistant Treasurer and | Vice President, Assistant Clerk, |
| Vice Chairman | Principal Accounting Officer | Assistant Treasurer and |
| Charles B. Curtis | Beth S. Mazor | Proxy Manager |
| Myra R. Drucker | Vice President | |
| Charles E. Haldeman, Jr. | ||
| Paul L. Joskow | James P. Pappas | |
| Elizabeth T. Kennan | Vice President |
This report is for the information of shareholders of Putnam New Opportunities Fund. It may also be used as sales literature when preceded or accompanied by the current prospectus, the most recent copy of Putnam’s Quarterly Performance Summary, and Putnam���s Quarterly Ranking Summary. For more recent performance, please visit www.putnam.com. Investors should carefully consider the investment objective, risks, charges, and expenses of a fund, which are described in its prospectus. For this and other information or to request a prospectus, call 1-800-225-1581 toll free. Please read the prospectus carefully before investing. The fund’s Statement of Additional Information contains additional information about the fund’s Trustees and is available without charge upon request by calling 1-800-225-1581.
Item 2. Code of Ethics:
(a) The fund’s principal executive, financial and accounting officers are employees of Putnam Investment Management, LLC, the Fund's investment manager. As such they are subject to a comprehensive Code of Ethics adopted and administered by Putnam Investments which is designed to protect the interests of the firm and its clients. The Fund has adopted a Code of Ethics which incorporates the Code of Ethics of Putnam Investments with respect to all of its officers and Trustees who are employees of Putnam Investment Management, LLC. For this reason, the Fund has not adopted a separate code of ethics governing its principal executive, financial and accounting officers.
(c) In July 2005, Putnam Investment Management, LLC, the Fund's investment manager, Putnam Retail Management Limited Partnership, the Fund's principal underwriter, and Putnam Investments Limited, the sub-manager for a portion of the assets of certain funds as determined by Putnam Management from time to time, adopted several amendments to their Code of Ethics. Insofar as such Code of Ethics applies to the Fund's principal executive officer, principal financial officer and principal accounting officer, the amendments provided for an exception to the standard 90-day holding period (one year, in the case of employees deemed to be “access persons” under the Code) for shares of Putnam mutual funds in the case of redemptions from an employee’s account in a college savings plan qualified under Section 529 of the Internal Revenue Code. Under this exception, an employee may, without penalty under the Code, make “qualified redemptions” of shares from such an account less than 90 days (or one year, as applicable) after purchase. “Qualified redemptions” include redemptions for higher education purposes for the account beneficiary and redemptions made upon death or disability. The July 2005 amendments also provide that an employee may, for purposes of the rule limiting the number of trades per calendar quarter in an employee’s personal account to a maximum of 10, count all trades of the same security in the same direction (all buys or all sells) over a period of five consecutive business days as a single trade.
The July 2005 amendments were incorporated into a restated Code of Ethics dated December 2005 (filed as an exhibit hereto).
Item 3. Audit Committee Financial Expert:
The Funds' Audit and Compliance Committee is comprised solely of Trustees who are "independent" (as such term has been defined by the Securities and Exchange Commission ("SEC") in regulations implementing Section 407 of the Sarbanes-Oxley Act (the "Regulations")). The Trustees believe that each of the members of the Audit and Compliance Committee also possess a combination of knowledge and experience with respect to financial accounting matters, as well as other attributes, that qualify them for service on the Committee. In addition, the Trustees have determined that all members of the Funds' Audit and Compliance Committee meet the financial literacy requirements of the New York Stock Exchange's rules and that Mr. Patterson, Mr. Stephens and Mr. Hill qualify as "audit committee financial experts" (as such term has been defined by the Regulations) based on their review of their pertinent experience and education. Certain other Trustees, although not on the Audit and Compliance Committee, would also qualify as "audit committee financial experts." The SEC has stated that the designation or identification of a person as an audit committee financial expert pursuant to this Item 3 of Form N-CSR does not impose on such person any duties, obligations or liability that are greater than the duties, obligations and liability imposed on such person as a member of the Audit and Compliance Committee and the Board of Trustees in the absence of such designation or identification.
Item 4. Principal Accountant Fees and Services:
The following table presents fees billed in each of the last two fiscal years for services rendered to the fund by the fund’s independent auditor:
| Fiscal | Audit- | |||
| year | Audit | Related | Tax | All Other |
| ended | Fees | Fees | Fees | Fees |
| June 30, 2006 | $112,126* | $-- | $3,460 | $ - |
| June 30, 2005 | $108,521* | $-- | $3,408 | $3,876 |
* Includes fees of $5,298 and $7,901 billed by the fund’s independent auditor to the fund for audit procedures necessitated by regulatory and litigation matters for the fiscal years ended June 30, 2006 and June 30, 2005, respectively. These fees were reimbursed to the fund by Putnam Investment Management, LLC (“Putnam Management”).
For the fiscal years ended June 30, 2006 and June 30, 2005, the fund’s independent auditor billed aggregate non-audit fees in the amounts of $263,135 and $197,609 respectively, to the fund, Putnam Management and any entity controlling, controlled by or under common control with Putnam Management that provides ongoing services to the fund.
Audit Fees represent fees billed for the fund’s last two fiscal years.
Audit-Related Fees represent fees billed in the fund’s last two fiscal years for services traditionally performed by the fund’s auditor, including accounting consultation for proposed transactions or concerning financial accounting and reporting standards and other audit or attest services not required by statute or regulation.
Tax Fees represent fees billed in the fund’s last two fiscal years for tax compliance, tax planning and tax advice services. Tax planning and tax advice services include assistance with tax audits, employee benefit plans and requests for rulings or technical advice from taxing authorities.
All Other Fees represent fees billed for services relating to an analysis of recordkeeping fees.
Pre-Approval Policies of the Audit and Compliance Committee. The Audit and Compliance Committee of the Putnam funds has determined that, as a matter of policy, all work performed for the funds by the funds’ independent auditors will be pre-approved by the Committee itself and thus will generally not be subject to pre-approval procedures.
The Audit and Compliance Committee also has adopted a policy to pre-approve the engagement by Putnam Management and certain of its affiliates of the funds’ independent auditors, even in circumstances where pre-approval is not required by applicable law. Any such requests by Putnam Management or certain of its affiliates are typically submitted in writing to the Committee and explain, among other things, the nature of the proposed engagement, the estimated fees, and why this work should be performed by that particular audit firm as opposed to another one.
The following table presents fees billed by the fund’s independent auditor for services required to be approved pursuant to paragraph (c)(7)(ii) of Rule 2-01 of Regulation S-X.
| Fiscal | Audit- | All | Total | |
| year | Related | Tax | Other | Non-Audit |
| ended | Fees | Fees | Fees | Fees |
| June 30, | ||||
| 2006 | $ - | $ 138,160 | $ - | $ - |
| June |
| 30, 2005 | $ - | $ - | $ - | $ - |
Item 5. Audit Committee of Listed Registrants
Not applicable
Item 6. Schedule of Investments:
The registrant’s schedule of investments in unaffiliated issuers is included in the report to shareholders in Item 1 above.
Item 7. Disclosure of Proxy Voting Policies and Procedures For Closed-End Management Investment Companies:
Not applicable
Item 8. Portfolio Managers of Closed-End Investment Companies
Not Applicable
Item 9. Purchases of Equity Securities by Closed-End Management Investment Companies and Affiliated Purchasers:
Not applicable
Item 10. Submission of Matters to a Vote of Security Holders:
Not applicable
Item 11. Controls and Procedures:
(a) The registrant's principal executive officer and principal financial officer have concluded, based on their evaluation of the effectiveness of the design and operation of the registrant's disclosure controls and procedures as of a date within 90 days of the filing date of this report, that the design and operation of such procedures are generally effective to provide reasonable assurance that information required to be disclosed by the registrant in this report is recorded, processed, summarized and reported within the time periods specified in the Commission's rules and forms.
(b) Changes in internal control over financial reporting: Not applicable
Item 12. Exhibits:
(a)(1) The Code of Ethics of The Putnam Funds, which incorporates the Code of Ethics of Putnam Investments, is filed herewith.
(a)(2) Separate certifications for the principal executive officer and principal financial officer of the registrant as required by Rule 30a-2(a) under the Investment Company Act of 1940, as amended, are filed herewith.
(b) The certifications required by Rule 30a-2(b) under the Investment Company Act of 1940, as amended, are filed herewith.
SIGNATURES
Pursuant to the requirements of the Securities Exchange Act of 1934 and the Investment Company Act of 1940, the registrant has duly caused this report to be signed on its behalf by the undersigned, thereunto duly authorized.
Putnam New Opportunities Fund
By (Signature and Title):
/s/Michael T. Healy
Michael T. Healy
Principal Accounting Officer
Date: August 28, 2006
Pursuant to the requirements of the Securities Exchange Act of 1934 and the Investment Company Act of 1940, this report has been signed below by the following persons on behalf of the registrant and in the capacities and on the dates indicated.
By (Signature and Title):
/s/Charles E. Porter
Charles E. Porter
Principal Executive Officer
Date: August 28, 2006
By (Signature and Title):
/s/Steven D. Krichmar
Steven D. Krichmar
Principal Financial Officer
Date: August 28, 2006