|
Key to holding’s abbreviations
|
| ADR | American Depository Receipts: represents ownership of foreign securities on deposit with a custodian bank |
| bp | Basis points |
| Notes to the fund’s portfolio |
| Unless noted otherwise, the notes to the fund’s portfolio are for the close of the fund’s reporting period, which ran from July 1, 2014 through June 30, 2015 (the reporting period). Within the following notes to the portfolio, references to “ASC 820” represent Accounting Standards Codification 820 Fair Value Measurements and Disclosures and references to “OTC”, if any, represent over-the-counter. |
* | Percentages indicated are based on net assets of $4,001,757,175. |
† | This security is non-income-producing. |
ΔΔ | This security is restricted with regard to public resale. The total fair value of this security and any other restricted securities (excluding 144A securities), if any, held at the close of the reporting period was $19,223,680, or 0.5% of net assets. |
Δ | This security, in part or in entirety, was pledged and segregated with the custodian for collateral on certain derivative contracts at the close of the reporting period. |
## | Forward commitment, in part or in entirety (Note 1). |
d | Affiliated company. See Note 1 to the financial statements regarding securities lending. The rate quoted in the security description is the annualized 7-day yield of the fund at the close of the reporting period. |
F | This security is valued at fair value following procedures approved by the Trustees. Securities may be classified as Level 2 or Level 3 for ASC 820 based on the securities’ valuation inputs (Note 1). |
L | Affiliated company (Note 5). The rate quoted in the security description is the annualized 7-day yield of the fund at the close of the reporting period. |
P | This security was pledged, or purchased with cash that was pledged, to the fund for collateral on certain derivative contracts. The rate quoted in the security description is the annualized 7-day yield of the fund at the close of the reporting period (Note 1). |
R | Real Estate Investment Trust. |
S | Security on loan, in part or in entirety, at the close of the reporting period (Note 1). |
| At the close of the reporting period, the fund maintained liquid assets totaling $4,233,312 to cover the settlement of certain securities. |
| Unless otherwise noted, the rates quoted in short-term investments security descriptions represent the weighted average yield to maturity. |
| Debt obligations are considered secured unless otherwise indicated. |
| The dates shown on debt obligations are the original maturity dates. |
|
FORWARD CURRENCY CONTRACTS at 6/30/15 (aggregate face value $64,017,094)
|
| Counterparty | Currency | Contract
type | Delivery
date | Value | Aggregate
face value | Unrealized
appreciation/
(depreciation) |
|
Barclays Bank PLC
|
| | Japanese Yen | Sell | 8/19/15 | $15,617,665 | $15,948,890 | $331,225 |
|
JPMorgan Chase Bank N.A.
|
| | Euro | Sell | 9/16/15 | 11,500,384 | 11,607,366 | 106,982 |
|
State Street Bank and Trust Co.
|
| | Japanese Yen | Sell | 8/19/15 | 8,482,811 | 8,563,572 | 80,761 |
|
UBS AG
|
| | Euro | Sell | 9/16/15 | 27,893,455 | 27,897,266 | 3,811 |
| Total |
$522,779
|
|
WRITTEN OPTIONS OUTSTANDING at 6/30/15 (premiums $25,981)
|
| | Expiration date/
strike price | Contract
amount | Value |
| Coca-Cola Co. (The) (Call) | Aug-15/$55.00 | $2,598,142 | $811 |
| Total |
$811
|
|
OTC TOTAL RETURN SWAP CONTRACTS OUTSTANDING at 6/30/15
|
| Swap counterparty/
Notional amount | Upfront
premium
received (paid) | Termination
date | Payments
received (paid) by
fund per annum | Total return
received by
or paid by fund |
Unrealized
appreciation/
(depreciation)
|
|
JPMorgan Chase Bank N.A.
|
| baskets 96,185 | | $— | 7/16/15 | (3 month USD-LIBOR-BBA plus 30 bp) | A basket (JPCMPTMD) of common stocks | $1,028,126 |
| baskets 344,394 | | — | 4/15/16 | (3 month USD-LIBOR-BBA plus 0.38%) | A basket (JPCMPNET) of common stocks | (1,125,026) |
| Total | $— | $(96,900) |
| ASC 820 establishes a three-level hierarchy for disclosure of fair value measurements. The valuation hierarchy is based upon the transparency of inputs to the valuation of the fund’s investments. The three levels are defined as follows: |
| Level 1: Valuations based on quoted prices for identical securities in active markets. |
| Level 2: Valuations based on quoted prices in markets that are not active or for which all significant inputs are observable, either directly or indirectly. |
| Level 3: Valuations based on inputs that are unobservable and significant to the fair value measurement. |
| The following is a summary of the inputs used to value the fund’s net assets as of the close of the reporting period: |
| | Valuation inputs |
| Investments in securities: | Level 1 | Level 2 | Level 3 |
| Common stocks*: | | | |
| Consumer discretionary | $673,015,681 | $— | $7,805,190 |
| Consumer staples | 207,475,328 | — | — |
| Energy | 181,907,055 | — | — |
| Financials | 251,791,186 | — | 1,648,079 |
| Health care | 743,825,979 | — | — |
| Industrials | 559,495,007 | — | — |
| Information technology | 1,087,116,064 | — | — |
| Materials | 162,758,155 | — | — |
| Telecommunication services | 17,312,629 | — | — |
| Utilities | 18,670,670 | — | — |
| Total common stocks | 3,903,367,754 | — | 9,453,269 |
| Convertible preferred stocks | — | — | 9,770,411 |
| Purchased options outstanding | — | 8,002 | — |
| Warrants | 1,245,315 | — | — |
| Short-term investments | 80,759,641 | 193,087,972 | — |
| Totals by level | $3,985,372,710 | $193,095,974 | $19,223,680 |
| | | | |
| | Valuation inputs |
| Other financial instruments: | Level 1 | Level 2 | Level 3 |
| Forward currency contracts | $— | $522,779 | $— |
| Written options outstanding | — | (811) | — |
| Total return swap contracts | — | (96,900) | — |
| Totals by level | $— | $425,068 | $— |
* Common stock classifications are presented at the sector level, which may differ from the fund’s portfolio presentation. |
| During the reporting period, transfers within the fair value hierarchy, if any, (other than certain transfers involving non-U.S. equity securities as described in Note 1) did not represent, in the aggregate, more than 1% of the fund’s net assets measured as of the end of the period. |
| At the start and close of the reporting period, Level 3 investments in securities represented less than 1% of the fund’s net assets and were not considered a significant portion of the fund’s portfolio. |
The accompanying notes are an integral part of these financial statements.
| Statement of assets and liabilities 6/30/15 | |
| ASSETS | |
| Investment in securities, at value, including $190,482,115 of securities on loan (Note 1): | |
| Unaffiliated issuers (identified cost $3,280,420,118) | $3,926,207,721 |
| Affiliated issuers (identified cost $271,484,643) (Notes 1 and 5) | 271,484,643 |
| Foreign currency (cost $20) (Note 1) | 20 |
| Dividends, interest and other receivables | 4,284,674 |
| Receivable for shares of the fund sold | 845,474 |
| Receivable for investments sold | 16,686,336 |
| Unrealized appreciation on forward currency contracts (Note 1) | 522,779 |
| Unrealized appreciation on OTC swap contracts (Note 1) | 1,028,126 |
| Prepaid assets | 30,032 |
| Total assets | 4,221,089,805 |
| LIABILITIES | |
| Payable for investments purchased | 10,045,290 |
| Payable for purchases of delayed delivery securities (Note 1) | 4,234,786 |
| Payable for shares of the fund repurchased | 1,906,868 |
| Payable for compensation of Manager (Note 2) | 1,963,840 |
| Payable for custodian fees (Note 2) | 20,318 |
| Payable for investor servicing fees (Note 2) | 1,241,897 |
| Payable for Trustee compensation and expenses (Note 2) | 2,283,826 |
| Payable for administrative services (Note 2) | 12,356 |
| Payable for distribution fees (Note 2) | 2,494,804 |
| Unrealized depreciation on OTC swap contracts (Note 1) | 1,125,026 |
| Written options outstanding, at value (premiums $25,981) (Notes 1 and 3) | 811 |
| Collateral on securities loaned, at value (Note 1) | 192,070,002 |
| Collateral on certain derivative contracts, at value (Note 1) | 1,345,000 |
| Other accrued expenses | 587,806 |
| Total liabilities | 219,332,630 |
| Net assets | $4,001,757,175 |
| | |
| REPRESENTED BY | |
| Paid-in capital (Unlimited shares authorized) (Notes 1 and 4) | $3,087,577,564 |
| Undistributed net investment income (Note 1) | 17,608,544 |
| Accumulated net realized gain on investments and foreign currency transactions (Note 1) | 250,329,879 |
| Net unrealized appreciation of investments and assets and liabilities in foreign currencies | 646,241,188 |
| Total — Representing net assets applicable to capital shares outstanding | $4,001,757,175 |
| (Continued on next page) | |
The accompanying notes are an integral part of these financial statements.
| Statement of assets and liabilities (Continued) | |
| COMPUTATION OF NET ASSET VALUE AND OFFERING PRICE | |
| Net asset value and redemption price per class A share ($3,627,974,619 divided by 46,303,422 shares) | $78.35 |
| Offering price per class A share (100/94.25 of $78.35)* | $83.13 |
| Net asset value and offering price per class B share ($82,571,284 divided by 1,277,640 shares)** | $64.63 |
| Net asset value and offering price per class C share ($66,682,208 divided by 963,816 shares)** | $69.19 |
| Net asset value and redemption price per class M share ($57,796,853 divided by 826,600 shares) | $69.92 |
| Offering price per class M share (100/96.50 of $69.92)* | $72.46 |
| Net asset value, offering price and redemption price per class R share ($8,888,069 divided by 116,293 shares) | $76.43 |
| Net asset value, offering price and redemption price per class Y share ($157,844,142 divided by 1,907,421 shares) | $82.75 |
* | On single retail sales of less than $50,000. On sales of $50,000 or more the offering price is reduced. |
** | Redemption price per share is equal to net asset value less any applicable contingent deferred sales charge. |
The accompanying notes are an integral part of these financial statements.
| Statement of operations Year ended 6/30/15 | |
| INVESTMENT INCOME | |
| Dividends (net of foreign tax of $481,907) | $42,619,167 |
| Interest (including interest income of $50,138 from investments in affiliated issuers) (Note 5) | 50,983 |
| Securities lending (Note 1) | 1,824,787 |
| Total investment income | 44,494,937 |
| EXPENSES | |
| Compensation of Manager (Note 2) | 22,774,687 |
| Investor servicing fees (Note 2) | 7,829,318 |
| Custodian fees (Note 2) | 82,187 |
| Trustee compensation and expenses (Note 2) | 146,824 |
| Distribution fees (Note 2) | 11,156,539 |
| Administrative services (Note 2) | 100,651 |
| Other | 1,162,626 |
| Total expenses | 43,252,832 |
| Expense reduction (Note 2) | (210,092) |
| Net expenses | 43,042,740 |
| Net investment income | 1,452,197 |
| | |
| Net realized gain on investments (Notes 1 and 3) | 458,524,659 |
| Net realized loss on swap contracts (Note 1) | (351,489) |
| Net realized gain on foreign currency transactions (Note 1) | 21,046,912 |
| Net realized gain on written options (Notes 1 and 3) | 1,462,405 |
| Net unrealized appreciation of assets and liabilities in foreign currencies during the year | 1,414,411 |
| Net unrealized depreciation of investments, swap contracts and written options during the year | (153,013,458) |
| Net gain on investments | 329,083,440 |
| Net increase in net assets resulting from operations | $330,535,637 |
The accompanying notes are an integral part of these financial statements.
| Statement of changes in net assets | | |
| INCREASE (DECREASE) IN NET ASSETS | Year ended 6/30/15 | Year ended 6/30/14 |
| Operations: | | |
| Net investment income | $1,452,197 | $12,698,753 |
| Net realized gain on investments and foreign currency transactions | 480,682,487 | 695,506,142 |
| Net unrealized appreciation (depreciation) of investments and assets and liabilities in foreign currencies | (151,599,047) | 289,585,324 |
| Net increase in net assets resulting from operations | 330,535,637 | 997,790,219 |
| Distributions to shareholders (Note 1): | | |
| From ordinary income | | |
| Net investment income | | |
| Class A | (10,186,178) | (7,663,055) |
| Class R | (517) | (2,283) |
| Class Y | (917,835) | (675,961) |
| Net realized short-term gain on investments | | |
| Class A | (48,281,440) | — |
| Class B | (1,413,162) | — |
| Class C | (951,221) | — |
| Class M | (850,087) | — |
| Class R | (116,077) | — |
| Class Y | (2,331,966) | — |
| From net realized long-term gain on investments | | |
| Class A | (365,442,781) | — |
| Class B | (10,696,236) | — |
| Class C | (7,199,803) | — |
| Class M | (6,434,317) | — |
| Class R | (878,592) | — |
| Class Y | (17,650,675) | — |
| Increase (decrease) from capital share transactions (Note 4) | 122,582,319 | (306,047,496) |
| Total increase (decrease) in net assets | $(20,232,931) | $683,401,424 |
| NET ASSETS | | |
| Beginning of year | 4,021,990,106 | 3,338,588,682 |
| End of year (including undistributed net investment income of $17,608,544 and $10,125,352, respectively) | $4,001,757,175 | $4,021,990,106 |
| |
The accompanying notes are an integral part of these financial statements.
Financial highlights (For a common share outstanding throughout the period)
INVESTMENT OPERATIONS: | LESS DISTRIBUTIONS: | | RATIOS AND SUPPLEMENTAL DATA: |
Period ended | Net asset value, beginning of period | Net investment income (loss)a | Net realized and unrealized gain (loss) on investments | Total from investment operations | From
net investment income | From
net realized gain on investments | Total
distributions | Redemption
fees | Non-recurring reimbursements | Net asset value, end of period | Total return at net asset value (%)b | Net assets, end of period (in thousands) | Ratio of expenses to average net assets (%)c | Ratio of net investment income (loss) to average net assets (%) | Portfolio turnover (%) |
Class A | | | | | | | | | | | | | | | |
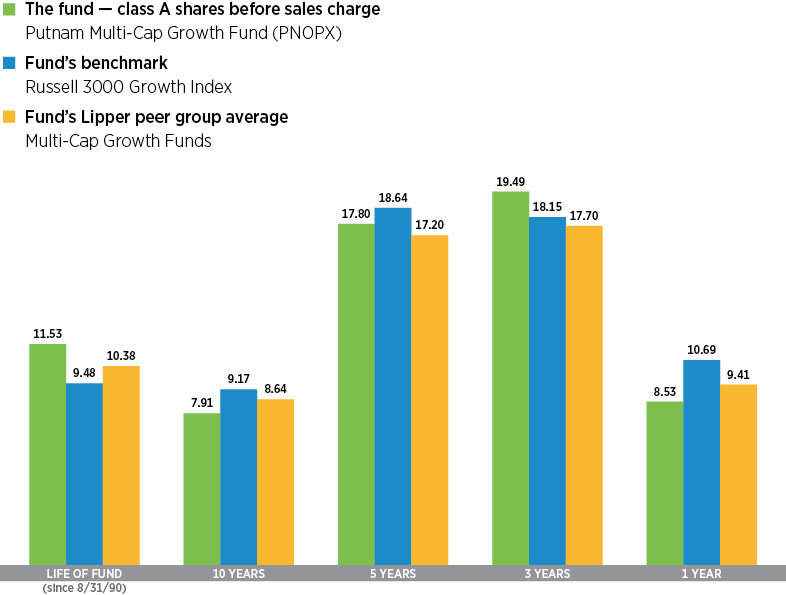
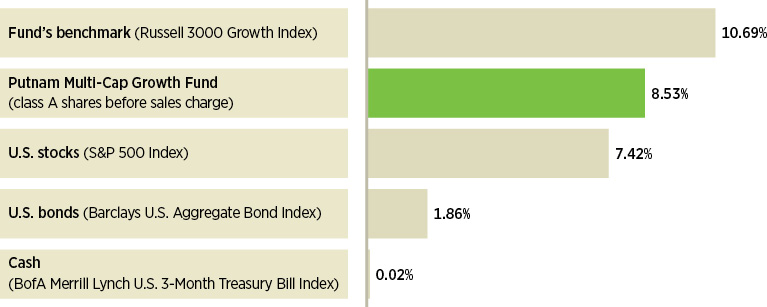
June 30, 2015 | $81.46 | .05 | 6.70 | 6.75 | (.24) | (9.62) | (9.86) | — | — | $78.35 | 8.53 | $3,627,975 | 1.04 | .06 | 69 |
June 30, 2014 | 62.31 | .27 | 19.05 | 19.32 | (.17) | — | (.17) | — | — | 81.46 | 31.03 | 3,622,814 | 1.04 | .37 | 88 |
June 30, 2013 | 52.15 | .19 | 10.20 | 10.39 | (.23) | — | (.23) | — | — | 62.31 | 19.98 | 3,004,507 | 1.08 | .32 | 78 |
June 30, 2012 | 53.66 | .10 | (1.71) | (1.61) | — | — | — | — | .10e,f,g,h | 52.15 | (2.81) | 2,822,270 | 1.15 | .20 | 57 |
June 30, 2011 | 39.22 | (.06) | 14.49 | 14.43 | — | — | — | —d | .01i,j,k | 53.66 | 36.82 | 3,283,602 | 1.22 | (.13) | 69 |
Class B | | | | | | | | | | | | | | | |
June 30, 2015 | $69.07 | (.46) | 5.64 | 5.18 | — | (9.62) | (9.62) | — | — | $64.63 | 7.73 | $82,571 | 1.79 | (.69) | 69 |
June 30, 2014 | 53.11 | (.24) | 16.20 | 15.96 | — | — | — | — | — | 69.07 | 30.05 | 95,550 | 1.79 | (.39) | 88 |
June 30, 2013 | 44.60 | (.21) | 8.72 | 8.51 | — | — | — | — | — | 53.11 | 19.08 | 93,740 | 1.83 | (.43) | 78 |
June 30, 2012 | 46.24 | (.24) | (1.49) | (1.73) | — | — | — | — | .09e,f,g,h | 44.60 | (3.55) | 103,691 | 1.90 | (.56) | 57 |
June 30, 2011 | 34.05 | (.38) | 12.56 | 12.18 | — | — | — | —d | .01i,j,k | 46.24 | 35.80 | 152,335 | 1.97 | (.88) | 69 |
Class C | | | | | | | | | | | | | | | |
June 30, 2015 | $73.30 | (.49) | 6.00 | 5.51 | — | (9.62) | (9.62) | — | — | $69.19 | 7.74 | $66,682 | 1.79 | (.69) | 69 |
June 30, 2014 | 56.37 | (.25) | 17.18 | 16.93 | — | — | — | — | — | 73.30 | 30.03 | 63,105 | 1.79 | (.38) | 88 |
June 30, 2013 | 47.33 | (.22) | 9.26 | 9.04 | — | — | — | — | — | 56.37 | 19.10 | 50,514 | 1.83 | (.43) | 78 |
June 30, 2012 | 49.07 | (.26) | (1.57) | (1.83) | — | — | — | — | .09e,f,g,h | 47.33 | (3.55) | 47,333 | 1.90 | (.55) | 57 |
June 30, 2011 | 36.13 | (.39) | 13.32 | 12.93 | — | — | — | —d | .01i,j,k | 49.07 | 35.81 | 55,393 | 1.97 | (.88) | 69 |
Class M | | | | | | | | | | | | | | | |
June 30, 2015 | $73.81 | (.31) | 6.04 | 5.73 | — | (9.62) | (9.62) | — | — | $69.92 | 8.00 | $57,797 | 1.54 | (.44) | 69 |
June 30, 2014 | 56.62 | (.09) | 17.28 | 17.19 | — | — | — | — | — | 73.81 | 30.36 | 57,211 | 1.54 | (.14) | 88 |
June 30, 2013 | 47.42 | (.09) | 9.29 | 9.20 | — | — | — | — | — | 56.62 | 19.40 | 47,819 | 1.58 | (.18) | 78 |
June 30, 2012 | 49.05 | (.14) | (1.58) | (1.72) | — | — | — | — | .09e,f,g,h | 47.42 | (3.32) | 46,932 | 1.65 | (.30) | 57 |
June 30, 2011 | 36.02 | (.28) | 13.30 | 13.02 | — | — | — | —d | .01i,j,k | 49.05 | 36.17 | 58,016 | 1.72 | (.63) | 69 |
Class R | | | | | | | | | | | | | | | |
June 30, 2015 | $79.65 | (.15) | 6.56 | 6.41 | (.01) | (9.62) | (9.63) | — | — | $76.43 | 8.28 | $8,888 | 1.29 | (.19) | 69 |
June 30, 2014 | 60.96 | .09 | 18.62 | 18.71 | (.02) | — | (.02) | — | — | 79.65 | 30.69 | 9,313 | 1.29 | .13 | 88 |
June 30, 2013 | 51.03 | .05 | 9.97 | 10.02 | (.09) | — | (.09) | — | — | 60.96 | 19.67 | 7,381 | 1.33 | .08 | 78 |
June 30, 2012 | 52.64 | (.02) | (1.69) | (1.71) | — | — | — | — | .10e,f,g,h | 51.03 | (3.06) | 7,457 | 1.40 | (.05) | 57 |
June 30, 2011 | 38.57 | (.17) | 14.23 | 14.06 | — | — | — | —d | .01i,j,k | 52.64 | 36.48 | 6,553 | 1.47 | (.38) | 69 |
Class Y | | | | | | | | | | | | | | | |
June 30, 2015 | $85.51 | .26 | 7.04 | 7.30 | (.44) | (9.62) | (10.06) | — | — | $82.75 | 8.80 | $157,844 | .79 | .30 | 69 |
June 30, 2014 | 65.37 | .47 | 20.00 | 20.47 | (.33) | — | (.33) | — | — | 85.51 | 31.37 | 173,998 | .79 | .62 | 88 |
June 30, 2013 | 54.70 | .35 | 10.69 | 11.04 | (.37) | — | (.37) | — | — | 65.37 | 20.27 | 134,628 | .83 | .57 | 78 |
June 30, 2012 | 56.14 | .24 | (1.79) | (1.55) | — | — | — | — | .11e,f,g,h | 54.70 | (2.56) | 115,279 | .90 | .45 | 57 |
June 30, 2011 | 40.93 | .04 | 15.16 | 15.20 | — | — | — | —d | .01i,j,k | 56.14 | 37.16 | 123,618 | .97 | .14 | 69 |
See notes to financial highlights at the end of this section.
The accompanying notes are an integral part of these financial statements.
38 | Multi-Cap Growth Fund | Multi-Cap Growth Fund | 39 |
Financial highlights (Continued)
a Per share net investment income (loss) has been determined on the basis of the weighted average number of shares outstanding during the period.
b Total return assumes dividend reinvestment and does not reflect the effect of sales charges.
c Includes amounts paid through expense offset and/or brokerage/service arrangements, if any (Note 2). Also excludes acquired fund fees and expenses, if any.
d Amount represents less than $0.01 per share.
e Reflects a non-recurring reimbursement pursuant to a settlement between the Securities and Exchange Commission (SEC) and Canadian Imperial Holdings, Inc./CIBC World Markets Corp. which amounted to $0.01 per share outstanding on February 24, 2012.
f Reflects a non-recurring reimbursement pursuant to a settlement between the SEC and Canadian Imperial Holdings, Inc./CIBC World Markets Corp. which amounted to less than $0.01 per share outstanding on November 29, 2011.
g Reflects a non-recurring reimbursement related to restitution amounts in connection with a distribution plan approved by the SEC which amounted to the following amounts per share outstanding on July 21, 2011:
| Per share |
Class A | $0.09 |
Class B | 0.07 |
Class C | 0.08 |
Class M | 0.08 |
Class R | 0.08 |
Class Y | 0.09 |
h Reflects a non-recurring reimbursement pursuant to a settlement between the SEC and Southwest Securities, Inc. which amounted to less than $0.01 per share outstanding on August 22, 2011.
i Reflects a non-recurring reimbursement pursuant to a settlement between the SEC and Zurich Capital Markets, Inc. which amounted to less than $0.01 per share outstanding on December 21, 2010.
j Reflects a non-recurring reimbursement pursuant to a settlement between the SEC and Prudential Securities, Inc. which amounted to $0.01 per share outstanding on May 16, 2011.
k Reflects a non-recurring reimbursement related to short-term trading related lawsuits, which amounted to less than $0.01 per share outstanding on May 11, 2011.
The accompanying notes are an integral part of these financial statements.
Notes to financial statements 6/30/15
Within the following Notes to financial statements, references to “State Street” represent State Street Bank and Trust Company, references to “the SEC” represent the Securities and Exchange Commission, references to “Putnam Management” represent Putnam Investment Management, LLC, the fund’s manager, an indirect wholly-owned subsidiary of Putnam Investments, LLC and references to “OTC”, if any, represent over-the-counter. Unless otherwise noted, the “reporting period” represents the period from July 1, 2014 through June 30, 2015.
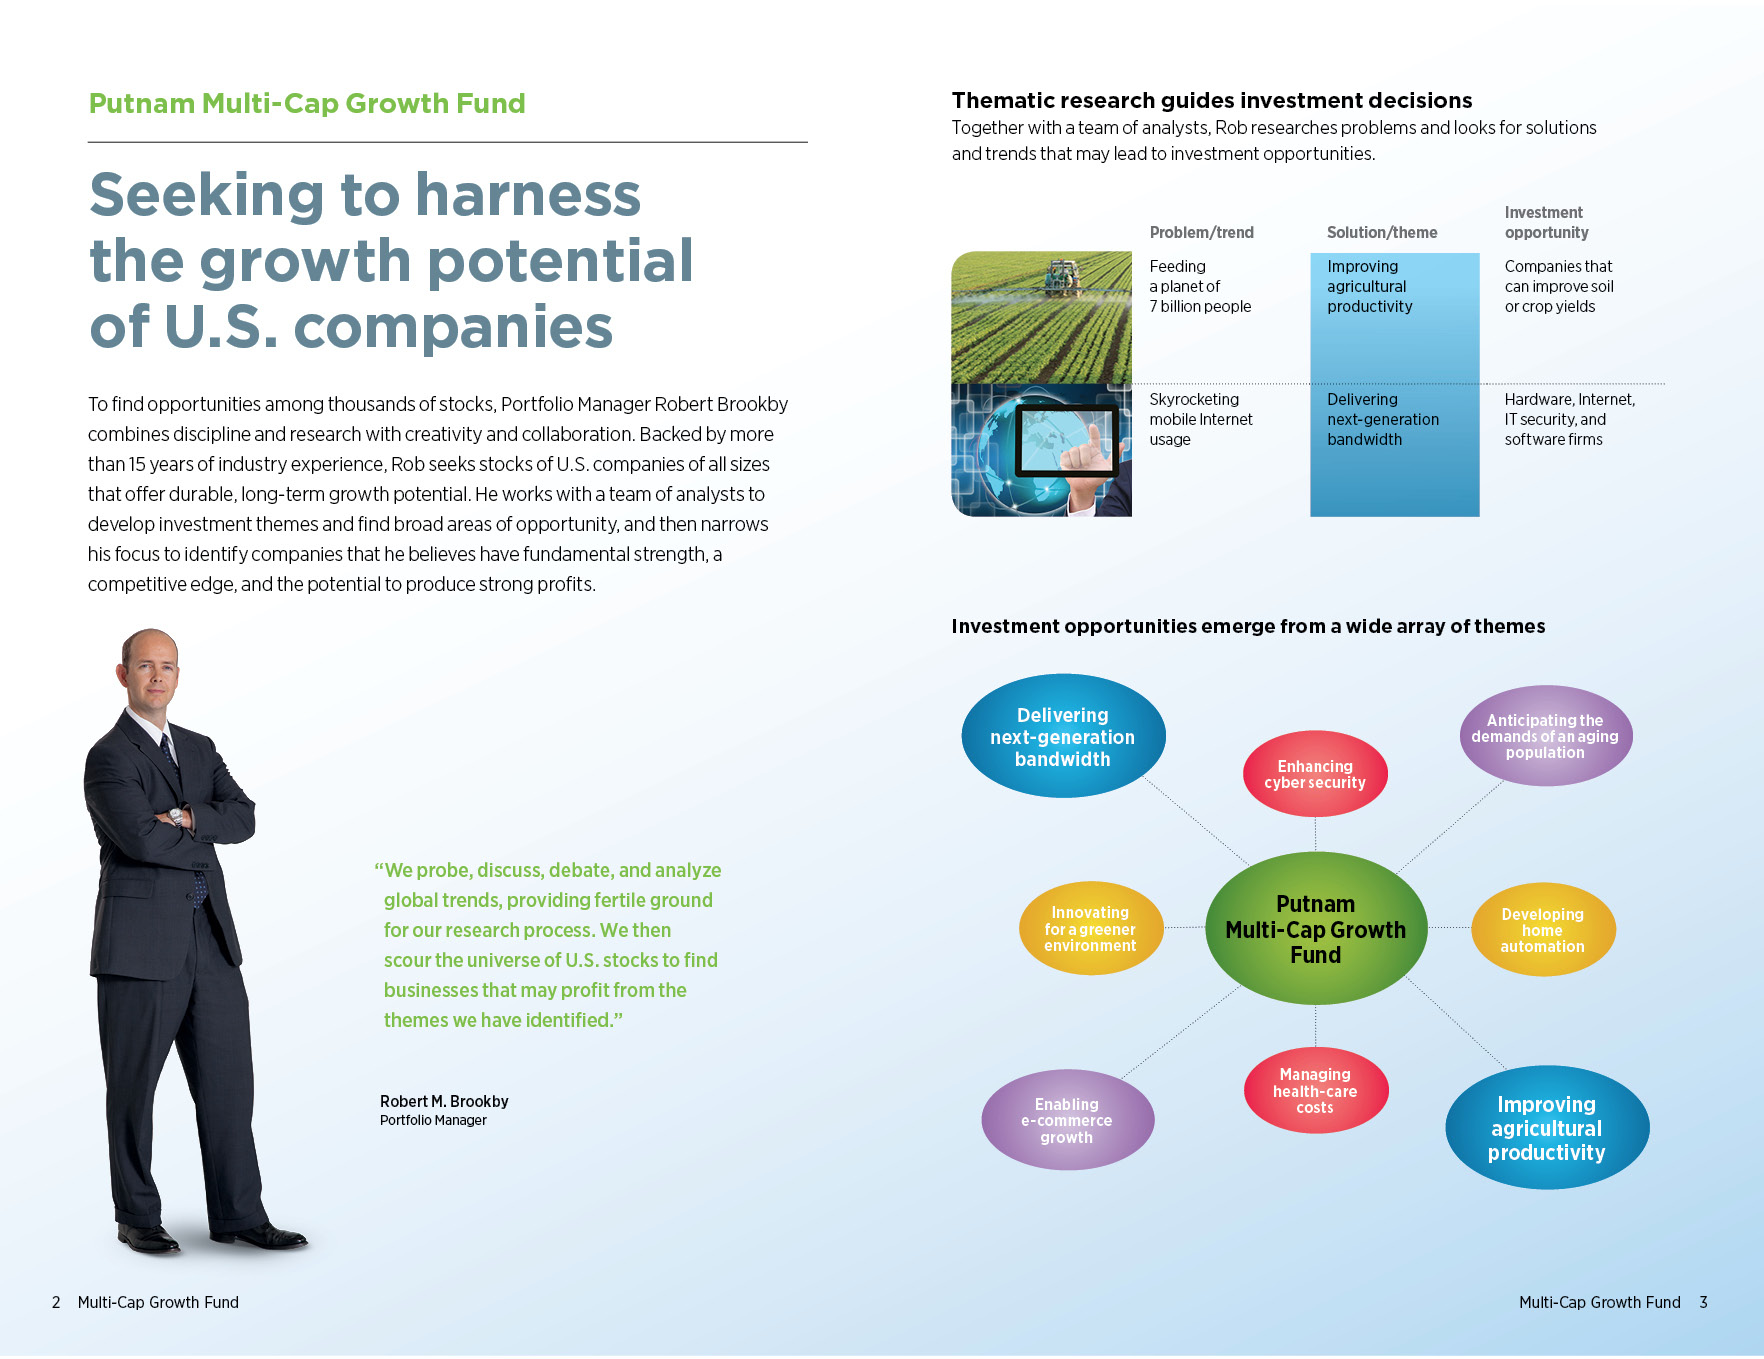
Putnam Multi-Cap Growth Fund (the fund) is a Massachusetts business trust, which is registered under the Investment Company Act of 1940, as amended, as a diversified, open-end management investment company. The goal of the fund is to seek long-term capital appreciation. The fund invests mainly in common stocks of U.S. companies of any size, with a focus on growth stocks. Growth stocks are issued by companies whose earnings are expected to grow faster than those of similar firms, and whose business growth and other characteristics may lead to an increase in stock price. Putnam Management may consider, among other factors, a company’s valuation, financial strength, growth potential, competitive position in its industry, projected future earnings, cash flows and dividends when deciding whether to buy or sell investments.
The fund offers class A, class B, class C, class M, class R and class Y shares. Class A and class M shares are sold with a maximum front-end sales charge of 5.75% and 3.50%, respectively, and generally do not pay a contingent deferred sales charge. Class B shares, which convert to class A shares after approximately eight years, do not pay a front-end sales charge and are subject to a contingent deferred sales charge if those shares are redeemed within six years of purchase. Class C shares have a one-year 1.00% contingent deferred sales charge and do not convert to class A shares. Class R shares, which are not available to all investors, are sold at net asset value. The expenses for class A, class B, class C, class M and class R shares may differ based on the distribution fee of each class, which is identified in Note 2. Class Y shares, which are sold at net asset value, are generally subject to the same expenses as class A, class B, class C, class M and class R shares, but do not bear a distribution fee. Class Y shares are not available to all investors.
In the normal course of business, the fund enters into contracts that may include agreements to indemnify another party under given circumstances. The fund’s maximum exposure under these arrangements is unknown as this would involve future claims that may be, but have not yet been, made against the fund. However, the fund’s management team expects the risk of material loss to be remote.
Note 1: Significant accounting policies
The following is a summary of significant accounting policies consistently followed by the fund in the preparation of its financial statements. The preparation of financial statements is in conformity with accounting principles generally accepted in the United States of America and requires management to make estimates and assumptions that affect the reported amounts of assets and liabilities in the financial statements and the reported amounts of increases and decreases in net assets from operations. Actual results could differ from those estimates. Subsequent events after the Statement of assets and liabilities date through the date that the financial statements were issued have been evaluated in the preparation of the financial statements.
Investment income, realized and unrealized gains and losses and expenses of the fund are borne pro-rata based on the relative net assets of each class to the total net assets of the fund, except that each class bears expenses unique to that class (including the distribution fees applicable to such classes). Each class votes as a class only with respect to its own distribution plan or other matters on which a class vote is required by law or determined by the Trustees. If the fund were liquidated, shares of each class would receive their pro-rata share of the net assets of the fund. In addition, the Trustees declare separate dividends on each class of shares.
Security valuation Portfolio securities and other investments are valued using policies and procedures adopted by the Board of Trustees. The Trustees have formed a Pricing Committee to oversee the implementation of these procedures and have delegated responsibility for valuing the fund’s assets in accordance with these procedures to Putnam Management. Putnam Management has established an internal Valuation Committee that is responsible for making fair value determinations, evaluating the effectiveness of the pricing policies of the fund and reporting to the Pricing Committee.
Investments for which market quotations are readily available are valued at the last reported sales price on their principal exchange, or official closing price for certain markets, and are classified as Level 1 securities under Accounting Standards Codification 820 Fair Value Measurements and Disclosures (ASC 820). If no sales are
reported, as in the case of some securities that are traded OTC, a security is valued at its last reported bid price and is generally categorized as a Level 2 security.
Investments in open-end investment companies (excluding exchange-traded funds), if any, which can be classified as Level 1 or Level 2 securities, are valued based on their net asset value. The net asset value of such investment companies equals the total value of their assets less their liabilities and divided by the number of their outstanding shares.
Market quotations are not considered to be readily available for certain debt obligations and other investments; such investments are valued on the basis of valuations furnished by an independent pricing service approved by the Trustees or dealers selected by Putnam Management. Such services or dealers determine valuations for normal institutional-size trading units of such securities using methods based on market transactions for comparable securities and various relationships, generally recognized by institutional traders, between securities (which consider such factors as security prices, yields, maturities and ratings). These securities will generally be categorized as Level 2. Short-term securities with remaining maturities of 60 days or less may be valued at amortized cost, which approximates fair value, and are classified as Level 2 securities.
Many securities markets and exchanges outside the U.S. close prior to the close of the New York Stock Exchange and therefore the closing prices for securities in such markets or on such exchanges may not fully reflect events that occur after such close but before the close of the New York Stock Exchange. Accordingly, on certain days, the fund will fair value foreign equity securities taking into account multiple factors including movements in the U.S. securities markets, currency valuations and comparisons to the valuation of American Depository Receipts, exchange-traded funds and futures contracts. These securities, which would generally be classified as Level 1 securities, will be transferred to Level 2 of the fair value hierarchy when they are valued at fair value. The number of days on which fair value prices will be used will depend on market activity and it is possible that fair value prices will be used by the fund to a significant extent. Securities quoted in foreign currencies, if any, are translated into U.S. dollars at the current exchange rate.
To the extent a pricing service or dealer is unable to value a security or provides a valuation that Putnam Management does not believe accurately reflects the security’s fair value, the security will be valued at fair value by Putnam Management in accordance with policies and procedures approved by the Trustees. Certain investments, including certain restricted and illiquid securities and derivatives, are also valued at fair value following procedures approved by the Trustees. These valuations consider such factors as significant market or specific security events such as interest rate or credit quality changes, various relationships with other securities, discount rates, U.S. Treasury, U.S. swap and credit yields, index levels, convexity exposures, recovery rates, sales and other multiples and resale restrictions. These securities are classified as Level 2 or as Level 3 depending on the priority of the significant inputs.
To assess the continuing appropriateness of fair valuations, the Valuation Committee reviews and affirms the reasonableness of such valuations on a regular basis after considering all relevant information that is reasonably available. Such valuations and procedures are reviewed periodically by the Trustees. The fair value of securities is generally determined as the amount that the fund could reasonably expect to realize from an orderly disposition of such securities over a reasonable period of time. By its nature, a fair value price is a good faith estimate of the value of a security in a current sale and does not reflect an actual market price, which may be different by a material amount.
Security transactions and related investment income Security transactions are recorded on the trade date (the date the order to buy or sell is executed). Gains or losses on securities sold are determined on the identified cost basis.
Interest income, net of any applicable withholding taxes, is recorded on the accrual basis. Dividend income, net of any applicable withholding taxes, is recognized on the ex-dividend date except that certain dividends from foreign securities, if any, are recognized as soon as the fund is informed of the ex-dividend date. Non-cash dividends, if any, are recorded at the fair value of the securities received. Dividends representing a return of capital or capital gains, if any, are reflected as a reduction of cost and/or as a realized gain.
All premiums/discounts are amortized/accreted on a yield-to-maturity basis.
Securities purchased or sold on a forward commitment or delayed delivery basis may be settled at a future date beyond customary settlement time; interest income is accrued based on the terms of the securities. Losses may arise due to changes in the fair value of the underlying securities or if the counterparty does not perform under the contract.
Foreign currency translation The accounting records of the fund are maintained in U.S. dollars. The fair value of foreign securities, currency holdings, and other assets and liabilities is recorded in the books and records of the
fund after translation to U.S. dollars based on the exchange rates on that day. The cost of each security is determined using historical exchange rates. Income and withholding taxes are translated at prevailing exchange rates when earned or incurred. The fund does not isolate that portion of realized or unrealized gains or losses resulting from changes in the foreign exchange rate on investments from fluctuations arising from changes in the market prices of the securities. Such gains and losses are included with the net realized and unrealized gain or loss on investments. Net realized gains and losses on foreign currency transactions represent net realized exchange gains or losses on closed forward currency contracts, disposition of foreign currencies, currency gains and losses realized between the trade and settlement dates on securities transactions and the difference between the amount of investment income and foreign withholding taxes recorded on the fund’s books and the U.S. dollar equivalent amounts actually received or paid. Net unrealized appreciation and depreciation of assets and liabilities in foreign currencies arise from changes in the value of open forward currency contracts and assets and liabilities other than investments at the period end, resulting from changes in the exchange rate.
Options contracts The fund uses options contracts to manage downside risks.
The potential risk to the fund is that the change in value of options contracts may not correspond to the change in value of the hedged instruments. In addition, losses may arise from changes in the value of the underlying instruments if there is an illiquid secondary market for the contracts, if interest or exchange rates move unexpectedly or if the counterparty to the contract is unable to perform. Realized gains and losses on purchased options are included in realized gains and losses on investment securities. If a written call option is exercised, the premium originally received is recorded as an addition to sales proceeds. If a written put option is exercised, the premium originally received is recorded as a reduction to the cost of investments.
Exchange-traded options are valued at the last sale price or, if no sales are reported, the last bid price for purchased options and the last ask price for written options. OTC traded options are valued using prices supplied by dealers.
Options on swaps are similar to options on securities except that the premium paid or received is to buy or grant the right to enter into a previously agreed upon interest rate or credit default contract. Forward premium swap option contracts include premiums that have extended settlement dates. The delayed settlement of the premiums is factored into the daily valuation of the option contracts. In the case of interest rate cap and floor contracts, in return for a premium, ongoing payments between two parties are based on interest rates exceeding a specified rate, in the case of a cap contract, or falling below a specified rate in the case of a floor contract.
Written option contracts outstanding at period end, if any, are listed after the fund’s portfolio.
Forward currency contracts The fund buys and sells forward currency contracts, which are agreements between two parties to buy and sell currencies at a set price on a future date. These contracts are used to hedge foreign exchange risk.
The U.S. dollar value of forward currency contracts is determined using current forward currency exchange rates supplied by a quotation service. The fair value of the contract will fluctuate with changes in currency exchange rates. The contract is marked to market daily and the change in fair value is recorded as an unrealized gain or loss. The fund records a realized gain or loss equal to the difference between the value of the contract at the time it was opened and the value at the time it was closed when the contract matures or by delivery of the currency. The fund could be exposed to risk if the value of the currency changes unfavorably, if the counterparties to the contracts are unable to meet the terms of their contracts or if the fund is unable to enter into a closing position. Risks may exceed amounts recognized on the Statement of assets and liabilities.
Forward currency contracts outstanding at period end, if any, are listed after the fund’s portfolio.
Total return swap contracts The fund entered into OTC total return swap contracts, which are arrangements to exchange a market-linked return for a periodic payment, both based on a notional principal amount, to gain exposure to specific markets or countries and to gain exposure to specific sectors or industries.
To the extent that the total return of the security, index or other financial measure underlying the transaction exceeds or falls short of the offsetting interest rate obligation, the fund will receive a payment from or make a payment to the counterparty. OTC total return swap contracts are marked to market daily based upon quotations from an independent pricing service or market makers and the change, if any, is recorded as an unrealized gain or loss. Payments received or made are recorded as realized gains or losses. Certain OTC total return swap contracts may include extended effective dates. Payments related to these swap contracts are accrued based on the terms of the contract. The fund could be exposed to credit or market risk due to unfavorable changes in the fluctuation of interest rates or in the price of the underlying security or index, the possibility that there is no liquid market for these agreements or that the counterparty may default on its obligation to perform. The fund’s maximum
risk of loss from counterparty risk is the fair value of the contract. This risk may be mitigated by having a master netting arrangement between the fund and the counterparty. Risk of loss may exceed amounts recognized on the Statement of assets and liabilities.
OTC total return swap contracts outstanding, including their respective notional amounts at period end, if any, are listed after the fund’s portfolio.
Master agreements The fund is a party to ISDA (International Swaps and Derivatives Association, Inc.) Master Agreements (Master Agreements) with certain counterparties that govern OTC derivative and foreign exchange contracts entered into from time to time. The Master Agreements may contain provisions regarding, among other things, the parties’ general obligations, representations, agreements, collateral requirements, events of default and early termination. With respect to certain counterparties, in accordance with the terms of the Master Agreements, collateral posted to the fund is held in a segregated account by the fund’s custodian and, with respect to those amounts which can be sold or repledged, is presented in the fund’s portfolio.
Collateral pledged by the fund is segregated by the fund’s custodian and identified in the fund’s portfolio. Collateral can be in the form of cash or debt securities issued by the U.S. Government or related agencies or other securities as agreed to by the fund and the applicable counterparty. Collateral requirements are determined based on the fund’s net position with each counterparty.
Termination events applicable to the fund may occur upon a decline in the fund’s net assets below a specified threshold over a certain period of time. Termination events applicable to counterparties may occur upon a decline in the counterparty’s long-term and short-term credit ratings below a specified level. In each case, upon occurrence, the other party may elect to terminate early and cause settlement of all derivative and foreign exchange contracts outstanding, including the payment of any losses and costs resulting from such early termination, as reasonably determined by the terminating party. Any decision by one or more of the fund’s counterparties to elect early termination could impact the fund’s future derivative activity.
At the close of the reporting period, the fund did not have a net liability position on open derivative contracts subject to the Master Agreements.
Securities lending The fund may lend securities, through its agent, to qualified borrowers in order to earn additional income. The loans are collateralized by cash in an amount at least equal to the fair value of the securities loaned. The fair value of securities loaned is determined daily and any additional required collateral is allocated to the fund on the next business day. The risk of borrower default will be borne by the fund’s agent; the fund will bear the risk of loss with respect to the investment of the cash collateral. Income from securities lending is included in investment income on the Statement of operations. Cash collateral is invested in Putnam Cash Collateral Pool, LLC, a limited liability company managed by an affiliate of Putnam Management. Investments in Putnam Cash Collateral Pool, LLC are valued at its closing net asset value each business day. There are no management fees charged to Putnam Cash Collateral Pool, LLC. At the close of the reporting period, the fund received cash collateral of $192,070,002 and the value of securities loaned amounted to $190,482,115.
Interfund lending The fund, along with other Putnam funds, may participate in an interfund lending program pursuant to an exemptive order issued by the SEC. This program allows the fund to borrow from or lend to other Putnam funds that permit such transactions. Interfund lending transactions are subject to each fund’s investment policies and borrowing and lending limits. Interest earned or paid on the interfund lending transaction will be based on the average of certain current market rates. During the reporting period, the fund did not utilize the program.
Lines of credit The fund participates, along with other Putnam funds, in a $392.5 million unsecured committed line of credit and a $235.5 million unsecured uncommitted line of credit, both provided by State Street. Borrowings may be made for temporary or emergency purposes, including the funding of shareholder redemption requests and trade settlements. Interest is charged to the fund based on the fund’s borrowing at a rate equal to the Federal Funds rate plus 1.25% for the committed line of credit and the Federal Funds rate plus 1.30% for the uncommitted line of credit. A closing fee equal to 0.04% of the committed line of credit and 0.04% of the uncommitted line of credit has been paid by the participating funds. In addition, a commitment fee of 0.11% per annum on any unutilized portion of the committed line of credit is allocated to the participating funds based on their relative net assets and paid quarterly. During the reporting period, the fund had no borrowings against these arrangements.
Federal taxes It is the policy of the fund to distribute all of its taxable income within the prescribed time period and otherwise comply with the provisions of the Internal Revenue Code of 1986, as amended (the Code), applicable to regulated investment companies. It is also the intention of the fund to distribute an amount sufficient to avoid imposition of any excise tax under Section 4982 of the Code.
The fund is subject to the provisions of Accounting Standards Codification 740 Income Taxes (ASC 740). ASC 740 sets forth a minimum threshold for financial statement recognition of the benefit of a tax position taken or expected to be taken in a tax return. The fund did not have a liability to record for any unrecognized tax benefits in the accompanying financial statements. No provision has been made for federal taxes on income, capital gains or unrealized appreciation on securities held nor for excise tax on income and capital gains. Each of the fund’s federal tax returns for the prior three fiscal years remains subject to examination by the Internal Revenue Service.
The fund may also be subject to taxes imposed by governments of countries in which it invests. Such taxes are generally based on either income or gains earned or repatriated. The fund accrues and applies such taxes to net investment income, net realized gains and net unrealized gains as income and/or capital gains are earned. In some cases, the fund may be entitled to reclaim all or a portion of such taxes, and such reclaim amounts, if any, are reflected as an asset on the fund’s books. In many cases, however, the fund may not receive such amounts for an extended period of time, depending on the country of investment.
At June 30, 2015, the fund had a capital loss carryover of $142,316,044 available to the extent allowed by the Code to offset future net capital gain, if any. The amounts of the carryovers and the expiration dates are:
Loss carryover |
Short-term | Long-term | Total | Expiration |
$44,620,034 | N/A | $44,620,034 | June 30, 2016 |
44,620,034 | N/A | 44,620,034 | June 30, 2017 |
53,075,976 | N/A | 53,075,976 | June 30, 2018 |
Under the Regulated Investment Company Modernization Act of 2010, the fund will be permitted to carry forward capital losses incurred in taxable years beginning after December 22, 2010 for an unlimited period. However, any losses incurred will be required to be utilized prior to the losses incurred in pre-enactment tax years. As a result of this ordering rule, pre-enactment capital loss carryforwards may be more likely to expire unused. Additionally, post-enactment capital losses that are carried forward will retain their character as either short-term or long-term capital losses rather than being considered all short-term as under previous law.
Distributions to shareholders Distributions to shareholders from net investment income are recorded by the fund on the ex-dividend date. Distributions from capital gains, if any, are recorded on the ex-dividend date and paid at least annually. The amount and character of income and gains to be distributed are determined in accordance with income tax regulations, which may differ from generally accepted accounting principles. These differences include temporary and/or permanent differences from losses on wash sale transactions, foreign currency gains and losses, income on swap contracts and partnership income. Reclassifications are made to the fund’s capital accounts to reflect income and gains available for distribution (or available capital loss carryovers) under income tax regulations. At the close of the reporting period, the fund reclassified $17,135,525 to increase undistributed net investment income, $14,797 to decrease paid-in-capital and $17,120,728 to decrease accumulated net realized gain.
The tax basis components of distributable earnings and the federal tax cost as of the close of the reporting period were as follows:
Unrealized appreciation | $798,455,276 |
Unrealized depreciation | (159,337,431) |
Net unrealized appreciation | 639,117,845 |
Undistributed ordinary income | 18,030,539 |
Capital loss carryforward | (142,316,044) |
Undistributed long-term gain | 331,024,690 |
Undistributed short-term gain | 68,290,991 |
Cost for federal income tax purposes | $3,558,574,519 |
Note 2: Management fee, administrative services and other transactions
The fund pays Putnam Management a management fee (base fee) (based on the fund’s average net assets and computed and paid monthly) at annual rates that may vary based on the average of the aggregate net assets of most open-end funds, as defined in the fund’s management contract, sponsored by Putnam Management. Such annual rates may vary as follows:
0.710% | of the first $5 billion, |
0.660% | of the next $5 billion, |
0.610% | of the next $10 billion, |
0.560% | of the next $10 billion, |
0.510% | of the next $50 billion, |
0.490% | of the next $50 billion, |
0.480% | of the next $100 billion and |
0.475% | of any excess thereafter. |
In addition, the monthly management fee consists of the monthly base fee plus or minus a performance adjustment for the month. The performance adjustment is determined based on performance over the thirty-six month period then ended. Each month, the performance adjustment is calculated by multiplying the performance adjustment rate and the fund’s average net assets over the performance period and the result is divided by twelve. The resulting dollar amount is added to, or subtracted from the base fee for that month. The performance adjustment rate is equal to 0.03 multiplied by the difference between the fund’s annualized performance (measured by the fund’s class A shares) and the annualized performance of the Russell 3000 Growth Index, each measured over the performance period. The maximum annualized performance adjustment rate is +/–0.12%. The monthly base fee is determined based on the fund’s average net assets for the month, while the performance adjustment is determined based on the fund’s average net assets over the performance period of up to thirty-six months. This means it is possible that, if the fund underperforms significantly over the performance period, and the fund’s assets have declined significantly over that period, the negative performance adjustment may exceed the base fee. In this event, Putnam Management would make a payment to the fund.
Because the performance adjustment is based on the fund’s performance relative to its applicable benchmark index, and not its absolute performance, the performance adjustment could increase Putnam Management’s fee even if the fund’s shares lose value during the performance period provided that the fund outperformed its benchmark index, and could decrease Putnam Management’s fee even if the fund’s shares increase in value during the performance period provided that the fund underperformed its benchmark index.
For the reporting period, the base fee represented an effective rate (excluding the impact from any expense waivers in effect) of 0.548% of the fund’s average net assets before an increase of $641,803 (0.016% of the fund’s average net assets) based on performance.
Putnam Management has contractually agreed, through October 30, 2016, to waive fees or reimburse the fund’s expenses to the extent necessary to limit the cumulative expenses of the fund, exclusive of brokerage, interest, taxes, investment-related expenses, extraordinary expenses, acquired fund fees and expenses and payments under the fund’s investor servicing contract, investment management contract and distribution plans, on a fiscal year-to-date basis to an annual rate of 0.20% of the fund’s average net assets over such fiscal year-to-date period. During the reporting period, the fund’s expenses were not reduced as a result of this limit.
Putnam Investments Limited (PIL), an affiliate of Putnam Management, is authorized by the Trustees to manage a separate portion of the assets of the fund as determined by Putnam Management from time to time. Putnam Management pays a quarterly sub-management fee to PIL for its services at an annual rate of 0.35% of the average net assets of the portion of the fund managed by PIL.
The fund reimburses Putnam Management an allocated amount for the compensation and related expenses of certain officers of the fund and their staff who provide administrative services to the fund. The aggregate amount of all such reimbursements is determined annually by the Trustees.
Custodial functions for the fund’s assets are provided by State Street. Custody fees are based on the fund’s asset level, the number of its security holdings and transaction volumes.
Putnam Investor Services, Inc., an affiliate of Putnam Management, provides investor servicing agent functions to the fund. Putnam Investor Services, Inc. received fees for investor servicing that included (1) a per account fee for each direct and underlying non-defined contribution account (“retail account”) of the fund and each of the other funds in its specified category, which was totaled and then allocated to each fund in the category based on its average daily net assets; (2) a specified rate of the fund’s assets attributable to defined contribution plan accounts; and (3) for the portion of the fund’s fiscal year beginning after January 1, 2015, a specified rate based on the
average net assets in retail accounts. Putnam Investor Services has agreed that the aggregate investor servicing fees for each fund’s retail and defined contribution accounts will not exceed an annual rate of 0.320% of the fund’s average assets attributable to such accounts. During the reporting period, the expenses for each class of shares related to investor servicing fees were as follows:
Class A | $7,079,388 |
Class B | 173,231 |
Class C | 125,954 |
Class M | 112,649 |
Class R | 17,365 |
Class Y | 320,731 |
Total | $7,829,318 |
The fund has entered into expense offset arrangements with Putnam Investor Services, Inc. and State Street whereby Putnam Investor Services, Inc.’s and State Street’s fees are reduced by credits allowed on cash balances. The fund also reduced expenses through brokerage/service arrangements. For the reporting period, the fund’s expenses were reduced by $6,206 under the expense offset arrangements and by $203,886 under the brokerage/service arrangements.
Each Independent Trustee of the fund receives an annual Trustee fee, of which $2,377, as a quarterly retainer, has been allocated to the fund, and an additional fee for each Trustees meeting attended. Trustees also are reimbursed for expenses they incur relating to their services as Trustees.
The fund has adopted a Trustee Fee Deferral Plan (the Deferral Plan) which allows the Trustees to defer the receipt of all or a portion of Trustees fees payable on or after July 1, 1995. The deferred fees remain invested in certain Putnam funds until distribution in accordance with the Deferral Plan.
The fund has adopted an unfunded noncontributory defined benefit pension plan (the Pension Plan) covering all Trustees of the fund who have served as a Trustee for at least five years and were first elected prior to 2004. Benefits under the Pension Plan are equal to 50% of the Trustee’s average annual attendance and retainer fees for the three years ended December 31, 2005. The retirement benefit is payable during a Trustee’s lifetime, beginning the year following retirement, for the number of years of service through December 31, 2006. Pension expense for the fund is included in Trustee compensation and expenses in the Statement of operations. Accrued pension liability is included in Payable for Trustee compensation and expenses in the Statement of assets and liabilities. The Trustees have terminated the Pension Plan with respect to any Trustee first elected after 2003.
The fund has adopted distribution plans (the Plans) with respect to its class A, class B, class C, class M and class R shares pursuant to Rule 12b–1 under the Investment Company Act of 1940. The purpose of the Plans is to compensate Putnam Retail Management Limited Partnership, an indirect wholly-owned subsidiary of Putnam Investments, LLC, for services provided and expenses incurred in distributing shares of the fund. The Plans provide for payments by the fund to Putnam Retail Management Limited Partnership at an annual rate of up to 0.35%, 1.00%, 1.00%, 1.00% and 1.00% of the average net assets attributable to class A, class B, class C, class M and class R shares, respectively. The Trustees have approved payment by the fund at an annual rate of 0.25%, 1.00%, 1.00%, 0.75% and 0.50% of the average net assets attributable to class A, class B, class C, class M and class R shares, respectively. During the reporting period, the class specific expenses related to distribution fees were as follows:
Class A | $9,132,266 |
Class B | 893,122 |
Class C | 650,366 |
Class M | 435,996 |
Class R | 44,789 |
Total | $11,156,539 |
For the reporting period, Putnam Retail Management Limited Partnership, acting as underwriter, received net commissions of $219,758 and $2,626 from the sale of class A and class M shares, respectively, and received $49,234 and $1,144 in contingent deferred sales charges from redemptions of class B and class C shares, respectively.
A deferred sales charge of up to 1.00% and 0.65% is assessed on certain redemptions of class A and class M shares, respectively. For the reporting period, Putnam Retail Management Limited Partnership, acting as underwriter, received $389 and no monies on class A and class M redemptions, respectively.
Note 3: Purchases and sales of securities
During the reporting period, the cost of purchases and the proceeds from sales, excluding short-term investments, were as follows:
| Cost of purchases | Proceeds from sales |
Investments in securities (Long-term) | $2,730,046,276 | $3,063,789,886 |
U.S. government securities (Long-term) | — | — |
Total | $2,730,046,276 | $3,063,789,886 |
Written option transactions during the reporting period are summarized as follows:
| Written option
contract amounts | Written option
premiums |
Written options outstanding at the beginning of the reporting period | $— | $— |
Options opened | 4,473,020 | 1,488,386 |
Options exercised | — | — |
Options expired | (1,874,878) | (1,462,405) |
Options closed | — | — |
Written options outstanding at the end of the reporting period | $2,598,142 | $25,981 |
Note 4: Capital shares
At the close of the reporting period, there were an unlimited number of shares of beneficial interest authorized. Transactions in capital shares were as follows:
| Year ended 6/30/15 | Year ended 6/30/14 |
Class A | Shares | Amount | Shares | Amount |
Shares sold | 1,214,938 | $96,293,968 | 1,017,089 | $74,276,005 |
Shares issued in connection with reinvestment of distributions | 5,182,291 | 397,896,352 | 98,060 | 7,171,099 |
| 6,397,229 | 494,190,320 | 1,115,149 | 81,447,104 |
Shares repurchased | (4,567,372) | (364,464,783) | (4,857,919) | (354,732,700) |
Net increase (decrease) | 1,829,857 | $129,725,537 | (3,742,770) | $(273,285,596) |
| Year ended 6/30/15 | Year ended 6/30/14 |
Class B | Shares | Amount | Shares | Amount |
Shares sold | 93,066 | $6,168,282 | 100,387 | $6,186,854 |
Shares issued in connection with reinvestment of distributions | 184,990 | 11,765,340 | — | — |
| 278,056 | 17,933,622 | 100,387 | 6,186,854 |
Shares repurchased | (383,857) | (25,527,362) | (481,880) | (29,844,415) |
Net decrease | (105,801) | $(7,593,740) | (381,493) | $(23,657,561) |
| Year ended 6/30/15 | Year ended 6/30/14 |
Class C | Shares | Amount | Shares | Amount |
Shares sold | 99,301 | $7,018,196 | 69,125 | $4,561,327 |
Shares issued in connection with reinvestment of distributions | 111,803 | 7,611,530 | — | — |
| 211,104 | 14,629,726 | 69,125 | 4,561,327 |
Shares repurchased | (108,200) | (7,698,435) | (104,363) | (6,956,111) |
Net increase (decrease) | 102,904 | $6,931,291 | (35,238) | $(2,394,784) |
| Year ended 6/30/15 | Year ended 6/30/14 |
Class M | Shares | Amount | Shares | Amount |
Shares sold | 20,633 | $1,470,707 | 20,202 | $1,344,102 |
Shares issued in connection with reinvestment of distributions | 103,829 | 7,134,071 | — | — |
| 124,462 | 8,604,778 | 20,202 | 1,344,102 |
Shares repurchased | (72,971) | (5,204,832) | (89,698) | (5,898,688) |
Net increase (decrease) | 51,491 | $3,399,946 | (69,496) | $(4,554,586) |
| Year ended 6/30/15 | Year ended 6/30/14 |
Class R | Shares | Amount | Shares | Amount |
Shares sold | 22,991 | $1,781,937 | 20,365 | $1,454,342 |
Shares issued in connection with reinvestment of distributions | 13,260 | 994,520 | 32 | 2,283 |
| 36,251 | 2,776,457 | 20,397 | 1,456,625 |
Shares repurchased | (36,874) | (2,900,416) | (24,548) | (1,777,647) |
Net decrease | (623) | $(123,959) | (4,151) | $(321,022) |
| Year ended 6/30/15 | Year ended 6/30/14 |
Class Y | Shares | Amount | Shares | Amount |
Shares sold | 443,749 | $37,348,426 | 328,557 | $25,337,233 |
Shares issued in connection with reinvestment of distributions | 250,078 | 20,251,294 | 8,626 | 661,157 |
| 693,827 | 57,599,720 | 337,183 | 25,998,390 |
Shares repurchased | (821,286) | (67,356,476) | (361,658) | (27,832,337) |
Net decrease | (127,459) | $(9,756,756) | (24,475) | $(1,833,947) |
Note 5: Affiliated transactions
Transactions during the reporting period with Putnam Short Term Investment Fund, which is under common ownership and control, were as follows:
Name of affiliate | Fair value at the beginning of the reporting period | Purchase cost | Sale proceeds | Investment income | Fair value at the end of the reporting period |
Putnam Short Term Investment Fund* | $53,391,813 | $795,603,059 | $769,580,231 | $50,138 | $79,414,641 |
Totals | $53,391,813 | $795,603,059 | $769,580,231 | $50,138 | $79,414,641 |
* Management fees charged to Putnam Short Term Investment Fund have been waived by Putnam Management.
Note 6: Market, credit and other risks
In the normal course of business, the fund trades financial instruments and enters into financial transactions where risk of potential loss exists due to changes in the market (market risk) or failure of the contracting party to the transaction to perform (credit risk). The fund may be exposed to additional credit risk that an institution or other entity with which the fund has unsettled or open transactions will default. Investments in foreign securities involve certain risks, including those related to economic instability, unfavorable political developments, and currency fluctuations.
Note 7: Summary of derivative activity
The volume of activity for the reporting period for any derivative type that was held during the period is listed below and was as follows based on an average of the holdings at the end of each fiscal quarter:
Purchased equity option contracts (contract amount) | $600,000 |
Written equity option contracts (contract amount) (Note 3) | $600,000 |
Forward currency contracts (contract amount) | $114,200,000 |
OTC total return swap contracts (notional) | $41,900,000 |
Warrants (number of warrants) | 2,400,000 |
The following is a summary of the fair value of derivative instruments as of the close of the reporting period:
Fair value of derivative instruments as of the close of the reporting period
| Asset derivatives | Liability derivatives |
Derivatives not accounted for as hedging instruments under ASC 815 | Statement of
assets and
liabilities location | Fair value | Statement of
assets and
liabilities location | Fair value |
Foreign exchange
contracts | Receivables | $522,779 | Payables | $— |
Equity contracts | Investments, Receivables | 2,281,443 | Payables | 1,125,837 |
Total | | $2,804,222 | | $1,125,837 |
The following is a summary of realized and change in unrealized gains or losses of derivative instruments on the Statement of operations for the reporting period (see Note 1):
Amount of realized gain or (loss) on derivatives recognized in net gain or (loss) on investments
Derivatives not accounted for as hedging instruments under ASC 815 | Options | Forward currency contracts | Swaps | Total |
Foreign exchange contracts | $— | $20,982,474 | $— | $20,982,474 |
Equity contracts | (412,473) | — | (351,489) | (763,962) |
Total | $(412,473) | $20,982,474 | $(351,489) | $20,218,512 |
Change in unrealized appreciation or (depreciation) on derivatives recognized in net gain or (loss) on investments
Derivatives not accounted for as hedging instruments under ASC 815 | Warrants | Options | Forward currency contracts | Swaps | Total |
Foreign exchange
contracts | $— | $— | $1,414,276 | $— | $1,414,276 |
Equity contracts | (199,504) | (200,661) | — | (1,770,052) | (2,170,217) |
Total | $(199,504) | $(200,661) | $1,414,276 | $(1,770,052) | $(755,941) |
Note 8: Offsetting of financial and derivative assets and liabilities
The following table summarizes any derivatives, repurchase agreements and reverse repurchase agreements, at the end of the reporting period, that are subject to an enforceable master netting agreement or similar agreement. For securities lending transactions or borrowing transactions associated with securities sold short, if any, see Note 1. For financial reporting purposes, the fund does not offset financial assets and financial liabilities that are subject to the master netting agreements in the Statement of assets and liabilities.
| Barclays Bank PLC | JPMorgan Chase
Bank N.A. | State Street Bank
and Trust Co. | UBS AG | Total |
Assets: | | | | | |
OTC Total return swap contracts*# | $— | $1,028,126 | $— | $— | $1,028,126 |
Forward currency
contracts# | 331,225 | 106,982 | 80,761 | 3,811 | 522,779 |
Purchased options**# | — | 8,002 | — | — | 8,002 |
Total Assets | $331,225 | $1,143,110 | $80,761 | $3,811 | $1,558,907 |
Liabilities: | | | | | |
OTC Total return swap contracts*# | — | 1,125,026 | — | — | 1,125,026 |
Forward currency
contracts# | — | — | — | — | — |
Written options# | — | 811 | — | — | 811 |
Total Liabilities | $— | $1,125,837 | $— | $— | $1,125,837 |
Total Financial and Derivative Net Assets | $331,225 | $17,273 | $80,761 | $3,811 | $433,070 |
Total collateral received (pledged)†## | $331,225 | $17,273 | $— | $(75,000) | |
Net amount | $— | $— | $80,761 | $78,811 | |
* | Excludes premiums, if any. Included in unrealized appreciation and depreciation on OTC swap contracts on the Statement of assets and liabilities. |
** | Included with Investments in securities on the Statement of assets and liabilities. |
† | Additional collateral may be required from certain brokers based on individual agreements. |
# | Covered by master netting agreement (Note 1). |
## | Any over-collateralization of total financial and derivative net assets is not shown. Collateral may include amounts related to unsettled agreements. |
Federal tax information (Unaudited)
Pursuant to §852 of the Internal Revenue Code, as amended, the fund hereby designates $372,850,715 as a capital gain dividend with respect to the taxable year ended June 30, 2015, or, if subsequently determined to be different, the net capital gain of such year.
The fund designated 39.02% of ordinary income distributions as qualifying for the dividends received deduction for corporations.
For the reporting period, the fund hereby designates 46.07%, or the maximum amount allowable, of its taxable ordinary income distributions as qualified dividends taxed at the individual net capital gain rates.
For the reporting period, pursuant to §871(k) of the Internal Revenue Code, the fund hereby designates $13,325 of distributions paid as qualifying to be taxed as interest-related dividends, and no amount to be taxed as short-term capital gain dividends for nonresident alien shareholders.
The Form 1099 that will be mailed to you in January 2016 will show the tax status of all distributions paid to your account in calendar 2015.
About the Trustees
Independent Trustees
Liaquat Ahamed
Born 1952, Trustee since 2012
Principal occupations during past five years: Pulitzer Prize-winning author of Lords of Finance: The Bankers Who Broke the World, whose articles on economics have appeared in such publications as the New York Times, Foreign Affairs, and the Financial Times. Director of Aspen Insurance Co., a New York Stock Exchange company, and Chair of the Aspen Board’s Investment Committee. Trustee of the Brookings Institution.
Other directorships: The Rohatyn Group, an emerging-market fund complex that manages money for institutions
Ravi Akhoury
Born 1947, Trustee since 2009
Principal occupations during past five years: Trustee of American India Foundation and of the Rubin Museum. From 1992 to 2007, was Chairman and CEO of MacKay Shields, a multi-product investment management firm.
Other directorships: RAGE Frameworks, Inc., a private software company; English Helper, Inc., a private software company
Barbara M. Baumann
Born 1955, Trustee since 2010
Principal occupations during past five years: President and Owner of Cross Creek Energy Corporation, a strategic consultant to domestic energy firms and direct investor in energy projects. Current Board member of The Denver Foundation. Former Chair and current Board member of Girls Incorporated of Metro Denver. Member of the Finance Committee, the Children’s Hospital of Colorado.
Other directorships: Buckeye Partners, L.P., a publicly traded master limited partnership focused on pipeline transport, storage, and distribution of petroleum products; Devon Energy Corporation, a leading independent natural gas and oil exploration and production company
Jameson A. Baxter
Born 1943, Trustee since 1994, Vice Chair from 2005 to 2011, and Chair since 2011
Principal occupations during past five years: President of Baxter Associates, Inc., a private investment firm. Chair of Mutual Fund Directors Forum. Chair Emeritus of the Board of Trustees of Mount Holyoke College. Director of the Adirondack Land Trust and Trustee of the Nature Conservancy’s Adirondack Chapter.
Robert J. Darretta
Born 1946, Trustee since 2007
Principal occupations during past five years: From 2009 until 2012, served as Health Care Industry Advisor to Permira, a global private equity firm. Until April 2007, was Vice Chairman of the Board of Directors of Johnson & Johnson. Served as Johnson & Johnson’s Chief Financial Officer for a decade.
Other directorships: UnitedHealth Group, a diversified health-care company
Katinka Domotorffy
Born 1975, Trustee since 2012
Principal occupations during past five years: Voting member of the Investment Committees of the Anne Ray Charitable Trust and Margaret A. Cargill Foundation, part of the Margaret A. Cargill Philanthropies. Until 2011, Partner, Chief Investment Officer, and Global Head of Quantitative Investment Strategies at Goldman Sachs Asset Management.
Other directorships: Reach Out and Read of Greater New York, an organization dedicated to promoting childhood literacy; Great Lakes Science Center
John A. Hill
Born 1942, Trustee since 1985 and Chairman from 2000 to 2011
Principal occupations during past five years: Founder and Vice-Chairman of First Reserve Corporation, the leading private equity buyout firm focused on the worldwide energy industry. Trustee and Chairman of the Board of Trustees of Sarah Lawrence College. Member of the Advisory Board of the Millstein Center for Global Markets and Corporate Ownership at The Columbia University Law School.
Other directorships: Devon Energy Corporation, a leading independent natural gas and oil exploration and production company
Paul L. Joskow
Born 1947, Trustee since 1997
Principal occupations during past five years: Economist and President of the Alfred P. Sloan Foundation, a philanthropic institution focused primarily on research and education on issues related to science, technology, and economic performance. Elizabeth and James Killian Professor of Economics, Emeritus at the Massachusetts Institute of Technology (MIT). Prior to 2007, served as the Director of the Center for Energy and Environmental Policy Research at MIT.
Other directorships: Yale University; Exelon Corporation, an energy company focused on power services; Boston Symphony Orchestra; Prior to April 2013, served as Director of TransCanada Corporation and TransCanada Pipelines Ltd., energy companies focused on natural gas transmission, oil pipelines and power services
Kenneth R. Leibler
Born 1949, Trustee since 2006
Principal occupations during past five years: Founder and former Chairman of Boston Options Exchange, an electronic marketplace for the trading of derivative securities. Serves on the Board of Trustees of Beth Israel Deaconess Hospital in Boston, Massachusetts. Director of Beth Israel Deaconess Care Organization. Until November 2010, director of Ruder Finn Group, a global communications and advertising firm.
Other directorships: Eversource Corporation, which operates New England’s largest energy delivery system
Robert E. Patterson
Born 1945, Trustee since 1984
Principal occupations during past five years: Co-Chairman of Cabot Properties, Inc., a private equity firm investing in commercial real estate, and Chairman of its Investment Committee. Past Chairman and Trustee of the Joslin Diabetes Center.
George Putnam, III
Born 1951, Trustee since 1984
Principal occupations during past five years: Chairman of New Generation Research, Inc., a publisher of financial advisory and other research services. Founder and President of New Generation Advisors, LLC, a registered investment advisor to private funds. Director of The Boston Family Office, LLC, a registered investment advisor.
W. Thomas Stephens
Born 1942, Trustee from 1997 to 2008 and since 2009
Principal occupations during past five years: Retired as Chairman and Chief Executive Officer of Boise Cascade, LLC, a paper, forest products, and timberland assets company, in December 2008. Prior to 2010, Director of Boise Inc., a manufacturer of paper and packaging products.
Other directorships: Prior to April 2014, served as Director of TransCanada Pipelines Ltd., an energy infrastructure company
Interested Trustee
Robert L. Reynolds*
Born 1952, Trustee since 2008 and President of the Putnam Funds since 2009
Principal occupations during past five years: President and Chief Executive Officer of Putnam Investments since 2008 and, since 2014, President and Chief Executive Officer of Great-West Financial, a financial services company that provides retirement savings plans, life insurance, and annuity and executive benefits products, and of Great-West Lifeco U.S. Inc., a holding company that owns Putnam Investments and Great-West Financial. Prior to joining Putnam Investments, served as Vice Chairman and Chief Operating Officer of Fidelity Investments from 2000 to 2007.
* Mr. Reynolds is an “interested person” (as defined in the Investment Company Act of 1940) of the fund and Putnam Investments. He is President and Chief Executive Officer of Putnam Investments, as well as the President of your fund and each of the other Putnam funds.
The address of each Trustee is One Post Office Square, Boston, MA 02109.
As of June 30, 2015, there were 117 Putnam funds. All Trustees serve as Trustees of all Putnam funds.
Each Trustee serves for an indefinite term, until his or her resignation, retirement at age 75, removal, or death.
Officers
In addition to Robert L. Reynolds, the other officers of the fund are shown below:
Jonathan S. Horwitz (Born 1955)
Executive Vice President, Principal Executive Officer, and Compliance Liaison
Since 2004
Steven D. Krichmar (Born 1958)
Vice President and Principal Financial Officer
Since 2002
Chief of Operations, Putnam Investments and Putnam Management
Robert T. Burns (Born 1961)
Vice President and Chief Legal Officer
Since 2011
General Counsel, Putnam Investments, Putnam Management, and Putnam Retail Management
Robert R. Leveille (Born 1969)
Vice President and Chief Compliance Officer
Since 2007
Chief Compliance Officer, Putnam Investments, Putnam Management, and Putnam Retail Management
Michael J. Higgins (Born 1976)
Vice President, Treasurer, and Clerk
Since 2010
Manager of Finance, Dunkin’ Brands (2008–2010); Senior Financial Analyst, Old Mutual Asset Management (2007–2008); Senior Financial Analyst, Putnam Investments (1999–2007)
Janet C. Smith (Born 1965)
Vice President, Principal Accounting Officer, and Assistant Treasurer
Since 2007
Director of Fund Administration Services, Putnam Investments and Putnam Management
Susan G. Malloy (Born 1957)
Vice President and Assistant Treasurer
Since 2007
Director of Accounting & Control Services, Putnam Investments and Putnam Management
James P. Pappas (Born 1953)
Vice President
Since 2004
Director of Trustee Relations, Putnam Investments and Putnam Management
Mark C. Trenchard (Born 1962)
Vice President and BSA Compliance Officer
Since 2002
Director of Operational Compliance, Putnam Investments and Putnam Retail Management
Nancy E. Florek (Born 1957)
Vice President, Director of Proxy Voting and Corporate Governance, Assistant Clerk, and Associate Treasurer
Since 2000
The principal occupations of the officers for the past five years have been with the employers as shown above, although in some cases they have held different positions with such employers. The address of each officer is One Post Office Square, Boston, MA 02109.
Putnam family of funds
The following is a list of Putnam’s open-end mutual funds offered to the public. Investors should carefully consider the investment objective, risks, charges, and expenses of a fund before investing. For a prospectus, or a summary prospectus if available, containing this and other information for any Putnam fund or product, contact your financial advisor or call Putnam Investor Services at 1-800-225-1581. Please read the prospectus carefully before investing.
Growth
Growth Opportunities Fund
International Growth Fund
Multi-Cap Growth Fund
Small Cap Growth Fund
Voyager Fund
Blend
Asia Pacific Equity Fund
Capital Opportunities Fund
Capital Spectrum Fund
Emerging Markets Equity Fund
Equity Spectrum Fund
Europe Equity Fund
Global Equity Fund
International Capital Opportunities Fund
International Equity Fund
Investors Fund
Low Volatility Equity Fund
Multi-Cap Core Fund
Research Fund
Strategic Volatility Equity Fund
Value
Convertible Securities Fund
Equity Income Fund
Global Dividend Fund
The Putnam Fund for Growth and Income
International Value Fund
Multi-Cap Value Fund
Small Cap Value Fund
Income
American Government Income Fund
Diversified Income Trust
Emerging Markets Income Fund
Floating Rate Income Fund
Global Income Trust
High Yield Advantage Fund
High Yield Trust
Income Fund
Money Market Fund*
Short Duration Income Fund
U.S. Government Income Trust
Tax-free Income
AMT-Free Municipal Fund
Intermediate-Term Municipal Income Fund
Short-Term Municipal Income Fund
Tax Exempt Income Fund
Tax Exempt Money Market Fund*
Tax-Free High Yield Fund
State tax-free income funds†:
Arizona, California, Massachusetts, Michigan, Minnesota, New Jersey, New York, Ohio, and Pennsylvania.
* An investment in a money market fund is not insured or guaranteed by the Federal Deposit Insurance Corporation or any other government agency. Although the fund seeks to preserve the value of your investment at $1.00 per share, it is possible to lose money by investing in the fund.
† Not available in all states.
Absolute Return
Absolute Return 100 Fund®
Absolute Return 300 Fund®
Absolute Return 500 Fund®
Absolute Return 700 Fund®
Global Sector
Global Consumer Fund
Global Energy Fund
Global Financials Fund
Global Health Care Fund
Global Industrials Fund
Global Natural Resources Fund
Global Sector Fund
Global Technology Fund
Global Telecommunications Fund
Global Utilities Fund
Asset Allocation
George Putnam Balanced Fund
Global Asset Allocation Funds — four investment portfolios that spread your money across a variety of stocks, bonds, and money market instruments.
Dynamic Asset Allocation Balanced Fund
Dynamic Asset Allocation Conservative Fund
Dynamic Asset Allocation Growth Fund
Dynamic Risk Allocation Fund
Retirement Income Lifestyle Funds — portfolios with managed allocations to stocks, bonds, and money market investments to generate retirement income.
Retirement Income Fund Lifestyle 1
Retirement Income Fund Lifestyle 2
Retirement Income Fund Lifestyle 3
RetirementReady® Funds — portfolios with adjusting allocations to stocks, bonds, and money market instruments, becoming more conservative over time.
RetirementReady® 2055 Fund
RetirementReady® 2050 Fund
RetirementReady® 2045 Fund
RetirementReady® 2040 Fund
RetirementReady® 2035 Fund
RetirementReady® 2030 Fund
RetirementReady® 2025 Fund
RetirementReady® 2020 Fund
RetirementReady® 2015 Fund
Check your account balances and the most recent month-end performance in the Individual Investors section at putnam.com.
Services for shareholders
Investor services
Systematic investment plan Tell us how much you wish to invest regularly — weekly, semimonthly, or monthly — and the amount you choose will be transferred automatically from your checking or savings account. There’s no additional fee for this service, and you can suspend it at any time. This plan may be a great way to save for college expenses or to plan for your retirement.
Please note that regular investing does not guarantee a profit or protect against loss in a declining market. Before arranging a systematic investment plan, consider your financial ability to continue making purchases in periods when prices are low.
Systematic exchange You can make regular transfers from one Putnam fund to another Putnam fund. There are no additional fees for this service, and you can cancel or change your options at any time.
Dividends PLUS You can choose to have the dividend distributions from one of your Putnam funds automatically reinvested in another Putnam fund at no additional charge.
Free exchange privilege You can exchange money between Putnam funds free of charge, as long as they are the same class of shares. A signature guarantee is required if you are exchanging more than $500,000. The fund reserves the right to revise or terminate the exchange privilege.
Reinstatement privilege If you’ve sold Putnam shares or received a check for a dividend or capital gain, you may reinvest the proceeds with Putnam within 90 days of the transaction and they will be reinvested at the fund’s current net asset value — with no sales charge. However, reinstatement of class B shares may have special tax consequences. Ask your financial or tax representative for details.
Check-writing service You have ready access to many Putnam accounts. It’s as simple as writing a check, and there are no special fees or service charges. For more information about the check-writing service, call Putnam or visit our website.
Dollar cost averaging When you’re investing for long-term goals, it’s time, not timing, that counts. Investing on a systematic basis is a better strategy than trying to figure out when the markets will go up or down. This means investing the same amount of money regularly over a long period. This method of investing is called dollar cost averaging. When a fund’s share price declines, your investment dollars buy more shares at lower prices. When it increases, they buy fewer shares. Over time, you will pay a lower average price per share.
For more information
Visit the Individual Investors section at putnam.com A secure section of our website contains complete information on your account, including balances and transactions, updated daily. You may also conduct transactions, such as exchanges, additional investments, and address changes. Log on today to get your password.
Call us toll free at 1-800-225-1581 Ask a helpful Putnam representative or your financial advisor for details about any of these or other services, or see your prospectus.
Founded over 75 years ago, Putnam Investments was built around the concept that a balance between risk and reward is the hallmark of a well-rounded financial program. We manage over 100 funds across income, value, blend, growth, asset allocation, absolute return, and global sector categories.
Investment Manager
Putnam Investment
Management, LLC
One Post Office Square
Boston, MA 02109
Investment Sub-Manager
Putnam Investments Limited
57–59 St James’s Street
London, England SW1A 1LD
Marketing Services
Putnam Retail Management
One Post Office Square
Boston, MA 02109
Custodian
State Street Bank
and Trust Company
Legal Counsel
Ropes & Gray LLP
Independent Registered Public Accounting Firm
PricewaterhouseCoopers LLP
Trustees
Jameson A. Baxter, Chair
Liaquat Ahamed
Ravi Akhoury
Barbara M. Baumann
Robert J. Darretta
Katinka Domotorffy
John A. Hill
Paul L. Joskow
Kenneth R. Leibler
Robert E. Patterson
George Putnam, III
Robert L. Reynolds
W. Thomas Stephens
Officers
Robert L. Reynolds
President
Jonathan S. Horwitz
Executive Vice President,
Principal Executive Officer, and
Compliance Liaison
Steven D. Krichmar
Vice President and
Principal Financial Officer
Robert T. Burns
Vice President and
Chief Legal Officer
Robert R. Leveille
Vice President and
Chief Compliance Officer
Michael J. Higgins
Vice President, Treasurer,
and Clerk
Janet C. Smith
Vice President,
Principal Accounting Officer,
and Assistant Treasurer
Susan G. Malloy
Vice President and
Assistant Treasurer
James P. Pappas
Vice President
Mark C. Trenchard
Vice President and
BSA Compliance Officer
Nancy E. Florek
Vice President, Director of
Proxy Voting and Corporate
Governance, Assistant Clerk,
and Associate Treasurer
This report is for the information of shareholders of Putnam Multi-Cap Growth Fund. It may also be used as sales literature when preceded or accompanied by the current prospectus, the most recent copy of Putnam’s Quarterly Performance Summary, and Putnam’s Quarterly Ranking Summary. For more recent performance, please visit putnam.com. Investors should carefully consider the investment objectives, risks, charges, and expenses of a fund, which are described in its prospectus. For this and other information or to request a prospectus or summary prospectus, call 1-800-225-1581 toll free. Please read the prospectus carefully before investing. The fund’s Statement of Additional Information contains additional information about the fund’s Trustees and is available without charge upon request by calling 1-800-225-1581.
| |
| (a) The fund’s principal executive, financial and accounting officers are employees of Putnam Investment Management, LLC, the Fund’s investment manager. As such they are subject to a comprehensive Code of Ethics adopted and administered by Putnam Investments which is designed to protect the interests of the firm and its clients. The Fund has adopted a Code of Ethics which incorporates the Code of Ethics of Putnam Investments with respect to all of its officers and Trustees who are employees of Putnam Investment Management, LLC. For this reason, the Fund has not adopted a separate code of ethics governing its principal executive, financial and accounting officers. |
| |
| Item 3. Audit Committee Financial Expert: |
| |
| The Funds’ Audit, Compliance and Distributions Committee is comprised solely of Trustees who are “independent” (as such term has been defined by the Securities and Exchange Commission (“SEC”) in regulations implementing Section 407 of the Sarbanes-Oxley Act (the “Regulations”)). The Trustees believe that each of the members of the Audit, Compliance and Distributions Committee also possess a combination of knowledge and experience with respect to financial accounting matters, as well as other attributes, that qualify them for service on the Committee. In addition, the Trustees have determined that each of Mr. Darretta, Mr. Patterson, Mr. Hill, and Ms. Baumann qualifies as an “audit committee financial expert” (as such term has been defined by the Regulations) based on their review of his or her pertinent experience and education. The SEC has stated, and the funds’ amended and restated agreement and Declaration of Trust provides, that the designation or identification of a person as an audit committee financial expert pursuant to this Item 3 of Form N-CSR does not impose on such person any duties, obligations or liability that are greater than the duties, obligations and liability imposed on such person as a member of the Audit, Compliance and Distributions Committee and the Board of Trustees in the absence of such designation or identification. |
| |
| Item 4. Principal Accountant Fees and Services: |
| |
| The following table presents fees billed in each of the last two fiscal years for services rendered to the fund by the fund’s independent auditor: |
| | | | | |
| Fiscal year ended | Audit Fees | Audit-Related Fees | Tax Fees | All Other Fees |
|
|
| | | | | |
| June 30, 2015 | $168,694 | $ — | $5,860 | $ — |
| June 30, 2014 | $147,240 | $ — | $5,474 | $ — |
| |
| For the fiscal years ended June 30, 2015 and June 30, 2014, the fund’s independent auditor billed aggregate non-audit fees in the amounts of $607,005 and $505,474 respectively, to the fund, Putnam Management and any entity controlling, controlled by or under common control with Putnam Management that provides ongoing services to the fund. |
| |
| Audit Fees represent fees billed for the fund’s last two fiscal years relating to the audit and review of the financial statements included in annual reports and registration statements, and other services that are normally provided in connection with statutory and regulatory filings or engagements. |
| |
| Audit-Related Fees represent fees billed in the fund’s last two fiscal years for services traditionally performed by the fund’s auditor, including accounting consultation for proposed transactions or concerning financial accounting and reporting standards and other audit or attest services not required by statute or regulation. |
| |
| Tax Fees represent fees billed in the fund’s last two fiscal years for tax compliance, tax planning and tax advice services. Tax planning and tax advice services include assistance with tax audits, employee benefit plans and requests for rulings or technical advice from taxing authorities. |
| |
| Pre-Approval Policies of the Audit, Compliance and Distributions Committee. The Audit, Compliance and Distribution Committee of the Putnam funds has determined that, as a matter of policy, all work performed for the funds by the funds’ independent auditors will be pre-approved by the Committee itself and thus will generally not be subject to pre-approval procedures. |
| |
| The Audit, Compliance and Distributions Committee also has adopted a policy to pre-approve the engagement by Putnam Management and certain of its affiliates of the funds’ independent auditors, even in circumstances where pre-approval is not required by applicable law. Any such requests by Putnam Management or certain of its affiliates are typically submitted in writing to the Committee and explain, among other things, the nature of the proposed engagement, the estimated fees, and why this work should be performed by that particular audit firm as opposed to another one. In reviewing such requests, the Committee considers, among other things, whether the provision of such services by the audit firm are compatible with the independence of the audit firm. |
| |
| The following table presents fees billed by the fund’s independent auditor for services required to be approved pursuant to paragraph (c)(7)(ii) of Rule 2-01 of Regulation S-X. |
| | | | | |
| Fiscal year ended | Audit-Related Fees | Tax Fees | All Other Fees | Total Non-Audit Fees |
|
|
| | | | | |
| June 30, 2015 | $ — | $601,145 | $ — | $ — |
| | | | | |
| June 30, 2014 | $ — | $500,000 | $ — | $ — |
| |
| Item 5. Audit Committee of Listed Registrants |
| |
| Item 6. Schedule of Investments: |
| |
| The registrant’s schedule of investments in unaffiliated issuers is included in the report to shareholders in Item 1 above. |
| |
| Item 7. Disclosure of Proxy Voting Policies and Procedures For Closed-End Management Investment Companies: |
| |
| Item 8. Portfolio Managers of Closed-End Investment Companies |
| |
| Item 9. Purchases of Equity Securities by Closed-End Management Investment Companies and Affiliated Purchasers: |
| |
| Item 10. Submission of Matters to a Vote of Security Holders: |
| |
| Item 11. Controls and Procedures: |
| |
| (a) The registrant’s principal executive officer and principal financial officer have concluded, based on their evaluation of the effectiveness of the design and operation of the registrant’s disclosure controls and procedures as of a date within 90 days of the filing date of this report, that the design and operation of such procedures are generally effective to provide reasonable assurance that information required to be disclosed by the registrant in this report is recorded, processed, summarized and reported within the time periods specified in the Commission’s rules and forms. |
| |
| (b) Changes in internal control over financial reporting: Not applicable |
| |
| (a)(1) The Code of Ethics of The Putnam Funds, which incorporates the Code of Ethics of Putnam Investments, is filed herewith. |
| |
| (a)(2) Separate certifications for the principal executive officer and principal financial officer of the registrant as required by Rule 30a-2(a) under the Investment Company Act of 1940, as amended, are filed herewith. |
| |
| (b) The certifications required by Rule 30a-2(b) under the Investment Company Act of 1940, as amended, are filed herewith. |
| |
| Pursuant to the requirements of the Securities Exchange Act of 1934 and the Investment Company Act of 1940, the registrant has duly caused this report to be signed on its behalf by the undersigned, thereunto duly authorized. |
| |
| Putnam Multi-Cap Growth Fund |
| |
| By (Signature and Title): |
| |
| /s/ Janet C. Smith
Janet C. Smith
Principal Accounting Officer
|
| |
| Pursuant to the requirements of the Securities Exchange Act of 1934 and the Investment Company Act of 1940, this report has been signed below by the following persons on behalf of the registrant and in the capacities and on the dates indicated. |
| |
| By (Signature and Title): |
| |
| /s/ Jonathan S. Horwitz
Jonathan S. Horwitz
Principal Executive Officer
|
| |
| By (Signature and Title): |
| |
| /s/ Steven D. Krichmar
Steven D. Krichmar
Principal Financial Officer
|