 |
| MANAGEMENT'S DISCUSSION AND ANALYSIS |
| YEAR ENDED DECEMBER 31, 2010 |
1
| |
| MANAGEMENT'S DISCUSSION AND ANALYSIS |
| YEAR ENDED DECEMBER 31, 2010 |
| Cautionary Note regarding Forward Looking Statements |
This discussion includes certain statements that may be deemed "forward-looking statements" and information.These forward-looking statements constitute "forward-looking statements" within the meaning of Section 27A of theSecurities Act of 1933andSection 21E of theSecurities Exchange Act of 1934.All statements in this discussion, other than statements of historical facts, that address future production, reserve potential, exploration drilling, exploitation activities and events or developments that the Company expects to take place in the future are forward-looking statements and information. Although the Company believes the expectations expressed in such forward-looking statements and information are based on reasonable assumptions, such statements are not guarantees of future performance and actual results or developments may differ materially from those in the forward-looking statements and information. Factors that could cause actual results to differ materially from those in forward- looking statements include market prices, exploitation and exploration successes, drilling and development results, continued availability of capital and financing and general economic, market or business conditions. Investors are cautioned that any such statements are not guarantees of future performance and actual results or developments may differ materially from those stated herein. |
| Cautionary Note regarding Non-GAAP Measurements |
Cash cost per ounce/ton is not a generally accepted accounting principle ("GAAP") based figure but rather is intended to serve as a performance measure providing some indication of the mining and processing efficiency and effectiveness of test mining at Hollister. It is determined by dividing the relevant mining and processing costs including royalties by the ounces produced/tons milled in the period. There may be some variation in the method of computation of "cash cost per ounce/ton" as determined by the Company compared with other mining companies. Cash costs per ounce/ton may vary from one period to another due to operating efficiencies, waste to ore ratios, grade of ore processed and gold recovery rates in the period. We provide this measure to our investors to allow them to also monitor operational efficiencies of test mining at Hollister. As a Non-GAAP Financial Measure cash costs should not be considered in isolation or as a substitute for measures of performance prepared in accordance with GAAP. Adjusted loss per share is also a Non-GAAP measure and is calculated by excluding the impact of certain fair-value accounting charges. There is material limitations associated with the use of such Non-GAAP measures. |
| Cautionary Note to U.S. Investors Concerning Estimates of Measured and Indicated Resources |
This document refers to “measured mineral resources” and “indicated mineral resources”. We advise U.S. investors that while these categories of mineral resource estimates are recognized and required by Canadian securities regulations (under National Instrument 43-101Standards of Disclosure for Mineral Projects), the SEC does not recognize them. Mineral resources that are not mineral reserves do not have demonstrated economic viability.U.S. investors are cautioned not to assume thatany part or all of mineral deposits in these categories will ever be converted into SEC defined reserves. |
| Cautionary Note to U.S. Investors Concerning Estimates of Inferred Resources |
This document refers to“inferred mineral resources”.We advise U.S. investors that while this category of mineral resource estimates is recognized and required by Canadian securities regulations (under National Instrument 43-101Standards ofDisclosure for Mineral Projects), the SEC does not recognize it. “Inferred mineral resources” have a great amount of uncertainty as to their existence, and great uncertainty as to their economic and legal feasibility. It cannot be assumed that all or any part of a mineral resource will ever be upgraded to a higher category. Under Canadian rules, estimates of inferred mineral resources may not form the basis of economic studies, except in rare cases. Mineral resources that are not mineral reserves do not have demonstrated economic viability. None of this mineralization has been demonstrated to be ore nor is considered to be a mineral reserve.U.S. investors are cautioned not to assume that any part or all of an inferred mineral resource exists, or iseconomically or legally mineable. |
| Cautionary Note to U.S. Investors Concerning Reserve Estimates |
This document refers to “proven reserves” and “probable reserves” which have been determined in accordance with Canadian securities regulations (under National Instrument 43-101Standards of Disclosure for Mineral Projects), which differ from the SEC’s standards for reserve classification. |
2
| |
| MANAGEMENT'S DISCUSSION AND ANALYSIS |
| YEAR ENDED DECEMBER 31, 2010 |
Great Basin is a mineral exploration and development company that is currently focused on delivering two advanced stage projects: theHollister Project (“Hollister”)on the Carlin Trend in Nevada, USA and theBurnstone Project (“Burnstone”)in the Witwatersrand Goldfields in South Africa. The Company, currently recognized as an emerging producer, will migrate to the rank of a junior gold producer as production from these two projects increase during 2011 and 2012. Over and above the exploration being conducted at the above mentioned properties, greenfields exploration is being undertaken in Tanzania and Mozambique.
This Management’s Discussion and Analysis ("MD&A") should be read in conjunction with the annual financial statements of Great Basin Gold Ltd. ("Great Basin", the "Company", or the “Group”) for the years ended December 31, 2010 and 2009 which are prepared in accordance with Canadian Generally Accepted Accounting Principles and are available through the internet on SEDAR at www.sedar.com. All dollar amounts herein are expressed in Canadian Dollars unless stated otherwise. This MD&A is prepared as of March 14, 2011.
| 1. | Executive summary |
The objectives for the Company in 2010 were predominantly centered on delivering the Burnstone capital project to enable commencement of the production build-up in 2011, and to improve efficiencies and production costs from trial mining activities at Hollister as well as the operating efficiencies of the Esmeralda mill. The Company had to react and respond to challenges it encountered in delivering on its objectives and was successful in minimizing the impact on project delivery. The Company achieved the following:
Corporate activities
Adjusted loss per share1for the year decreased by 69% to $0.05.
Successfully closed a US$47 million term loan agreement in May 2010 and upsized the facility to US$72 million in August 2010 with proceeds used to fund the development of Burnstone.
Restructured the senior secured notes (“Notes”) in May 2010 to cancel the put option on 29,500 Notes, postponing a US$35.4 million obligation until December 2011. The put option on a further 12,000 Notes was cancelled in October 2010 with the US$14.4 million settlement also postponed till December 2011.
Executed the credit agreement on a new US$60 million term loan facility in February 2011 with the proceeds to be used for full and final settlement of all outstanding Notes on March 15, 2011.
Successfully closed a bought deal public offering with gross proceeds of $86 million (including the 15% over-allotment option) on February 23, 2011 with proceeds to be used to fund working capital required for the Burnstone production build-up and advance exploration at the Hollister property.
Restructuring of guarantee to Black Economic Empowerment (“BEE”) partner for Burnstone and reinstated good standing of loan granted.
Settled contingent exploration liability on Rusaf acquisition with equity, thereby preserving $15 million in cash flow and avoiding further potential dilution.
_______________________________
1Adjusted loss per share is a non-GAAP measure used by the Company to compare quarterly and annual results on a sustaining basis by eliminating out of the ordinary expenses incurred
3
| |
| MANAGEMENT'S DISCUSSION AND ANALYSIS |
| YEAR ENDED DECEMBER 31, 2010 |
Nevada operations
• Revenue from trial mining activities more than doubled from 2009 to $100 million in 2010 with a 98% increase in Au eqv2oz sold for the year.
Sold 62,604 Au eqv oz during the year that was recovered through our Esmeralda mill with a further 25,873 Au eqv oz recovered through third party milling agreements.
47% improvement in tons extracted from trial mining activities in 2009.
63% improvement in contained Au eqv oz extracted from trial mining activities in 2009.
Substantially completed the optimization of the Esmeralda mill.
Poured first gold at Esmeralda on April 14, 2010.
Completed a total of 44,414 ft (13,459 meters) of underground exploration and infill drilling and 41,108 feet (12,457 meters) stope delineation diamond drilling during 2010.
Successfully reduced cash production costs3per Au eqv oz by 16% and per ton by 11% since Q1 2010 when our Esmeralda mill commenced treating Hollister ore.
Updated mineral resource statement issued in August 2010 with 1.6 million Au eqv oz in the combined measured and indicated categories.
Updated mineral reserve statement issued in February 2011 showing a 13% net increase in proven and probable Reserves.
Good progress with environmental impact study (“EIS”).
South African operations
Commissioned all major capital projects, including the metallurgical plant, vertical shaft, main ventilation shaft, decline, tailings dam and required surface infrastructure.
Poured first gold on October 31, 2010.
Completed in excess of 19,061 ft (5,810 meters) of reef development.
Successfully completed long hole stoping (“LHS”) trial which will be implemented as the preferred mining method.
Updated mineral resource statement issued in August 2010 with 12.1 million ounces in the combined measured and indicated categories.
Updated mineral reserve statement issued in February 2011 showing a 55% net increase in proven and probable Reserves.
The Company made significant progress in 2010 towards its transitioning to a mid-tier gold producer. In 2011, the Company will build-up production at Burnstone and expects further improvements from trial mining activities at Hollister. In addition, the EIS for Hollister remains on target for completion in late 2011, which should see the operation moving into commercial production in 2012.
________________________________
2Au eqv oz is calculated based on US$1,000Au and US$15Ag.
3Cash production cost is a non-GAAP measure and is calculated by deducting non-cash charges from production costs (refer to section 15.3)
4
| |
| MANAGEMENT'S DISCUSSION AND ANALYSIS |
| YEAR ENDED DECEMBER 31, 2010 |
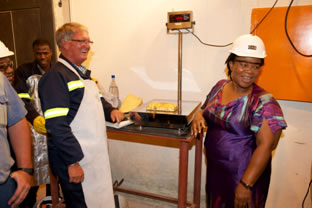 | 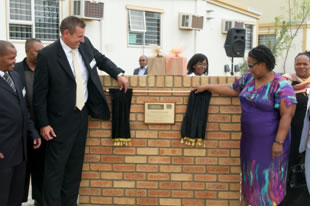 |
Ceremonial Burnstone mine opening by the South African Minister of Mineral Resources on February 22, 2011.
Key objectives for 2011 include:
Nevada operations
Recovering 110,000Au eqv ounces through the Esmeralda mill at a targeted cash production cost of US$550 – US$600 per Au eqv oz.
Improving metal recoveries of the Esmeralda mill to achieve 92% Au and 85% Ag on a consistent basis.
Completion of the EIS and obtain record of decision in early 2012.
Continued exploration of the Blanket style mineralization, Hatter Graben, Velvet, Gloria and South Gwenivere targets.
South African operations
Recovering 110,000 – 140,000 Au ounces at a targeted cash production cost of US$520 – US$620 per Au eqv oz.
Focus on increasing the rate of reef development to deliver on the planned production targets.
Completion of remaining Phase II underground infrastructure.
Exploration in Tanzania and Mozambique is also planned to resume in late 2011 once cash flow from operations become available. Delivering on our production targets for Burnstone will be dependent on achieving the planned rates of reef development to ensure the required stopes are available. Management is confident that our 2011 objectives are achievable as we have the appropriate practices in place as well as teams with the skills, experience and passion to unlock value for our shareholders.
| 2. | Results of Operations for the Fiscal Year and Fourth Quarter |
The Company incurred a pre-tax loss of $29.1 million for the year ended December 31, 2010 compared to a pre-tax loss of $53.9 million in the previous year, an improvement of 46% year on year. The 2010 pre-tax loss includes a $10.5 million fair value adjustment on the zero cost collar (“ZCC”) hedge structure that was entered into during the year. Adjusting for this fair value charge allows for a more direct comparison of the pre-tax results year-on-year. The adjusted pre-tax loss4 of $18.6 million is a 65% improvement year-on-year.
5
| |
| MANAGEMENT'S DISCUSSION AND ANALYSIS |
| YEAR ENDED DECEMBER 31, 2010 |
The improvement in the pre-tax loss resulted in similar improvements in the loss per share and adjusted loss per share for the year; the adjusted loss per share decreased to $0.05 from $0.16 reported in 2009. The reported decrease in the loss per share for 2010 is mainly due to the increase in metal sold from trial mining activities at Hollister as well as the success of the aggressive cost management campaign initiated in 2009. Revenue recognized during 2010 more than doubled, following an almost 100% increase in the Au eqv oz sold for the year.
The Company reported its maiden earnings per share during Q4 2010; the Company earned $0.02 per share (Q4 2009: $0.05 loss per share). The 32,300 Au eqv oz sold during the quarter was a 190% increase from Q3 2010, with cash cost per Au eqv oz improving 19% quarter-on-quarter.
Pre-development costs incurred at the Hollister project are still being expensed until such time as the required permitting is granted to allow for full-scale underground mining. Accumulated pre-development costs of $96 million have been expensed up to December 31, 2010.
Revenue
Gold and silver ounces sold were recovered from ore extracted through trial mining activities at Hollister. The table below summarizes ore tons treated through various processing facilities during the quarter and year and compares them to the same periods in 2009:
| 3 months ended | 12 months ended | |||
| December 31 2010 | December 31 2009 | December 31 2010 | December 31 2009 | |
| Ore tons treated/sold – third party agreements | 5,027 | - | 43,364 | 35,916 |
| Ore tons treated/sold – Esmeralda mill | 39,087 | - | 79,010 | - |
| Total ore tons treated/sold | 44,114 | - | 122,374 | 35,916 |
The table below provides a summary of Au eqv oz sold recovered through the various processing facilities in 2009 and 2010.
| 3 months ended | 12 months ended | |||
| December 31 2010 | December 31 2009 | December 31 2010 | December 31 2009 | |
| Au eqv oz recovered sold– Third party agreements | 389 | - | 26,185 | 44,706 |
| Au eqv oz recovered sold – Esmeralda mill | 31,911 | - | 62,604 | N/A |
| Total Au eqv oz recovered/sold | 32,300 | - | 88,789 | 44,706 |
Sale of 31,911 Au eqv oz recovered from the Esmeralda mill during the quarter, generated revenue of $42.6 million. A further 389 Au eqv oz were sold under the toll milling agreement with Queenstake, bringing the total Au eqv oz sold for the quarter to 32,300. Net revenue of $18.1 million from third party milling agreements, and $81.6 million from ounces recovered from our Esmeralda mill were recorded for the year ended December 31, 2010. All of the revenue recognized in 2009 relates to ounces recovered through third party milling agreements. There was no revenue recognized in Q4 2009 as the Company was still refurbishing the Esmeralda mill and no toll milling agreements were entered into during the quarter. The Company does not plan to make use of third party milling agreements in 2011.
____________________
4Adjusted pre-tax loss is a non-GAAP measure used by the Company to compare quarterly and annual results on a sustaining basis by eliminating out of the ordinary expenses incurred.
6
| |
| MANAGEMENT'S DISCUSSION AND ANALYSIS |
| YEAR ENDED DECEMBER 31, 2010 |
Production costs
The following table provides a breakdown of the production costs incurred on the various processing arrangements in Q4 and full fiscal year periods of 2010 and 2009.
| 3 months ended | 12 months ended | |||
| December 31 2010 | December 31 2009 | December 31 2010 | December 31 2009 | |
| Production costs – Third party agreements ($’000) | $434 | - | $21,348 | $20,615 |
| Production costs – Nevada operations ($’000) | $23,858 | - | $ 47,483 | - |
| Inventory adjustment ($’000) | - | - | $1,495 | - |
| Total production costs ($’000) | $24,292 | - | $70,326 | $20,615 |
| Production cost per ton sold– Nevada operations | $610 | - | $642 | - |
| Production cost per Au eqv oz sold – Nevada operations | $748 | - | $810 | - |
The table below provides a summary of cash production costs for metal recovered by the Nevada operations:
| 3 months ended | 12 months ended | |||
| December 31 2010 | December 31 2009 | December 31 2010 | December 31 2009 | |
| Cash production cost per ton | $ 563 | - | $ 589 | - |
| Cash production cost per Au eqv oz | $ 690 | - | $ 743 | - |
Refer to Section 15.3 for the reconciliation of cash production cost to total production cost. Cash production costs for the Nevada operations5over the quarter decreased 11% from the prior quarter and amounted to $563 (Q3 2010: $635) per ton consisting of $372 (Q3 2010: $427) mining and $191 (Q3 2010: $208) milling and haulage. On an Au eqv oz basis, cash production costs for the quarter improved by 19% over Q3 2010 and consisted of $455 (Q3 2010: $575) for mining and $235 (Q3 2010: $279) for milling and haulage. The improvement in the cash production costs is a result of the increase in tons extracted and processed during the quarter. The cash production costs have shown a downward trend over the 2010 fiscal year as production volumes increased. The trial mining operations are achieving their operating cost targets but operating costs at the Esmeralda mill are higher than planned. Improving efficiencies as well as automation of certain components within the mill are expected to reduce the mill operating costs to within plan by end of Q2 2011.
Production costs for 2009 relate 100% to third party milling agreements. The production costs as well as cash costs incurred on these milling campaigns are not directly comparable to the costs incurred on ounces recovered through our Esmeralda mill. Third party milling agreements entered into since 2008 contained a metal retention cost from the mill operator that varied for each contract. Some agreements also had fixed metal prices and recoveries. These charges were accounted for as a reduction in revenue with only mining costs recorded as production costs.
____________________________________
5Nevada operations refer to metal extracted from the trial mining activities at our Hollister property and processed through our Esmeralda mill and exclude all other processing and/or ore sale agreements.
7
| |
| MANAGEMENT'S DISCUSSION AND ANALYSIS |
| YEAR ENDED DECEMBER 31, 2010 |
Depletion charge
This is a non-cash item and relates to the amortization charge on the Hollister mineral property. It is calculated on the ratio of Au eqv oz sold to the proven and probable reserves. The increase year on year is due to the increase in Au eqv oz recovered and sold from trial mining at Hollister.
Exploration expenses
The exploration expense for the quarter was $2.4 million compared to $3.2 million in the previous quarter and $4.7 million during the quarter ended December 31, 2009. These costs predominantly relate to underground exploration at our Hollister property which amounted to $2.2 million for Q4 2010.
Year to date exploration expenses are 37% lower than 2009 and consist of $8.2 million incurred on underground exploration at our Hollister property (2009: $13.8 million) with the remainder of the costs attributable to care and maintenance expenses on our other exploration projects. Improved drilling contracts and focusing on underground exploration at Hollister had a positive impact on the exploration costs for 2010. No surface exploration was conducted during the year.
Pre-development expenses
The pre-development expenditures relate to underground development at our Hollister Project and amounted to $3.1 million during the quarter compared to $3.7 million in the previous quarter and $3.7 million for the quarter ended December 31, 2009. The decrease of 48% year on year is due to less waste development and more focus on ore development and extraction through trial mining. Optimizing stope and mine design also had a positive impact on the costs incurred during 2010.
Environmental impact study
Activities on the EIS project have increased significantly during 2010 as the project moves through the detailed project plan as agreed between the Company and the Bureau of Land Management (“BLM”). The EIS is targeted for completion in late 2011.
Foreign exchange gain
This movement predominantly relates to the fluctuation between the Canadian (“C$”) and United States (“US$”) dollar on the senior secured notes and term facility agreement as these are denominated in US$. The strong performance of the C$ against the US$ in 2010 resulted in a decrease in the liability measured in C$ with the corresponding credit charged to earnings.
Stock based compensation
The income statement charge relating to this non-cash expense is impacted by the quantum and timing of stock options issued as well as the valuation thereof being influenced by the volatility of the Company’s share price. The charge for the year ended December 31, 2009 includes $3.3 million relating to the cancellation and replacement of certain stock options.
Unrealized loss on financial instruments
A loss of $3.2 million (Q3 2010: $3.7 million) on the fair value adjustment for the ZCC hedge program executed in August 2010 was recorded in Q4 2010. A further loss of $3.6 million was recognized in Q3 2010 on initial recognition of the hedge structure. The increase in the gold price since the execution of the hedge impacted on the fair value adjustment made. The hedge program consists of a total of 105,000 Au oz spread over a 3 year period that commenced in January, 2011. The call option on the hedge has been priced at US$1,705 and the fair value adjustment recorded in the financial statements is calculated with reference to the price of the call option and impacted by gold price volatility, US interest rates and the quantity and remaining term of the put and call options in the structure. These fair value adjustments are non-cash charges with cash earnings only impacted should the price of gold exceed the price of the call option.
8
| |
| MANAGEMENT'S DISCUSSION AND ANALYSIS |
| YEAR ENDED DECEMBER 31, 2010 |
Profit on disposal of available-for-sale financial assets
The Company disposed of its investment in Kryso Resources Plc. during June 2010 for a net consideration of $3.5 million (GBP2.3 million) resulting in a profit of $489,000. The disposal of the investment was in accordance with the Company’s strategic longer term objectives.
| 3. | Financial condition review |
Total assets
Total assets increased by $270 million since December 30, 2009 predominantly due to the capital development costs capitalized at Burnstone. Current assets have decreased by $85 million during this period as a result of a decrease in cash balances as well as inventory.
Total liabilities
Total liabilities, excluding future income taxes, increased by $134 million since December 31, 2009 mainly due to the following reasons:
Convertible debentures
The balance increased by $5 million due to the accretion charge being recorded over the term of this facility.Term facility
The Company entered into a term facility agreement with Credit Suisse in May 2010 for an initial US$47 million loan that was increased to US$72 million during August 2010.Accounts payable
Accounts payable and accrued liabilities increased by $32 million since December 31, 2009 as a result of the increase in the capital expenditure at Burnstone.Other liabilities
A fair value liability of $10 million was recorded on the hedge program executed in August 2010 and a further $3 million liability was recorded on the fair value of the guarantee provided on behalf of the Company’s BEE Partner (refer section 8).
Shareholder’s equity
During the year, the Company’s issued share capital increased by 80 million common shares due to the following transactions:
Share purchase warrants exercised
60 million share purchase warrants were exercised during the year and consist of 58 million $1.60 warrants that expired in October 2010 and 2 million $1.25 warrants that expire in November 2011.Settlement of Rusaf contingent payment
In connection with the contingent payment requirement contained in the original acquisition agreement, the Company issued 3,073,773 shares in January 2010. The terms of the remaining liability were amended and settled in full through the issuance of 7.5 million shares in June 2010, thus eliminating any further discovery-contingent common share issuance requirements as well as eliminating the mandatory exploration expenditure timetable. The Company now holds all the prospects outright without further obligations in terms of the acquisition agreement.
9
| |
| MANAGEMENT'S DISCUSSION AND ANALYSIS |
| YEAR ENDED DECEMBER 31, 2010 |
Settlement of senior secured notes
The Company successfully negotiated the cancellation of the put option on 29,500 Notes and settled 6,925 Notes in May 2010. The $8.5 million (US$8.3 million) was settled by the issuance of 2.2 million common shares to the Note holders at a price of $1.75 (US$1.72) per share and cash payments of $4.6 million (US$4.5 million).
Through a second agreement, the put option on a further 12,000 Notes was also cancelled in October 2010 and the Company settled 3,000 Notes in December 2010 by the issuance of 1.5 million common shares to the Note holders at a price of ˜ $2.81 per share.Share purchase options exercised
6.1 million share purchase options were exercised by employees, directors and management during the year.
At December 31, 2010, the Company had 414 million common shares issued and outstanding. A further 25 million share purchase warrants and 16 million share options were outstanding.
Subsequent to December 31, 2010, 3.8 million warrants and 0.5 million share options were also exercised up to February 28, 2011.
The Company also successfully closed an $86 million (inclusive of over-allotment) bought deal public offering on February 23, 2011. 34 million shares were issued at a price of $2.55 per share under this transaction, with net proceeds of $81.7 million.
As of the date of this MD&A the Company had 452.2 million common shares issued and outstanding. A further 21.1 million share purchase warrants and 19.2 million share options were outstanding.
Liquidity
The Company monitors its spending plans, repayment obligations and cash resources and takes actions with the objective of ensuring that there is sufficient capital in order to meet short term business requirements, after taking into account cash flows from operations and the Company’s holdings of cash and cash equivalents. The Company believes that these sources will be sufficient to cover the likely short and long term operating cash requirements.
The Company utilised net cash of $1.1 million in operating activities during the year, compared to the $55 million utilized in operating activities during the year ended December 31, 2009. The pre-development costs incurred at the Company’s Hollister project are being expensed and are also included under cash utilised in operating activities as opposed to investment activities where capital development is included. Cash utilized in investment activities increased to $233 million during the year compared to $120 million in the year ended December 31, 2009. This increase is due to the increased development activities associated with the completion of the Burnstone project during 2010.
The Company received a net amount of $159 million from financing activities during the year, compared to $229 million received in 2009. Net proceeds from financing activities predominantly relate to the term facility agreement ($72 million) as well as warrants and share purchase options exercised ($104 million). Management pro-actively manages future cash requirements based on estimated cash flow from operations, planned capital investments and financing obligations. Taking cognizance of the start-up risks associated with new projects management has initiated and closed a bought deal public offering in February 2011 with net proceeds of $81 million received on February 23, 2010. Proceeds from this offering were used to settle outstanding construction creditors for Burnstone with the remainder predominantly being used to fund working capital during the Burnstone production build-up.
10
| |
| MANAGEMENT'S DISCUSSION AND ANALYSIS |
| YEAR ENDED DECEMBER 31, 2010 |
The Company also executed the credit agreement relating to a US$60 million term loan facility with Credit Suisse AG on February 23, 2011. The loan has a term of 4 years and is repayable in quarterly installments commencing September 2011, and will bear interest at a premium of 3.75% over the 3 month US LIBOR rate. The Company will execute a ZCC hedging program, consisting of a total of approximately 105,000 Au eqv oz spread over a 4 year term, prior to draw down. Draw down on this facility is set for March 15, 2011 with approximately US$52 million to be applied towards full and final settlement of the Notes issued in December 2008.
At December 31, 2010, the Company had a working capital deficit of $21 million. Included in accounts payable and accruals are approximately $30 million construction related creditors that were only settled in February 2011 following the commissioning of the Burnstone metallurgical plant and the closing of the bought deal public offering.
The Company has no "Purchase Obligations", defined as any agreement to purchase goods or services that are enforceable and legally binding on the Company that specify all significant terms, including: fixed or minimum quantities to be purchased; fixed, minimum or variable price provisions; and the approximate timing of the transaction.
| 4. | Operations review |
| 4.1 | Nevada operations |
The Company’s Nevada operations consist of the Hollister Property (“Hollister”) located in the northern part of the Carlin Trend and the Esmeralda Property (“Esmeralda”) located in the south-west close to the border between Nevada and California. Great Basin’s surface exploration efforts at Hollister during 1997-2001 resulted in the discovery and delineation of several high-grade epithermal gold-silver vein systems on the property. The main vein systems, called Clementine and Gwenivere, have been accessed by decline and underground development for geological and resource confirmation and trial extraction of mineral resources; the development also provides staging for the ongoing exploration and development drilling that is in progress.
![]()
The EIS process for the Hollister Project is currently underway by the BLM. Pending the completion of the EIS process and receipt of BLM approval for the amended Plan of Operations, the underground exploration and development activities at the Hollister Property must be conducted within the 275,000 ore tons per year limit set out in the Water Pollution Control Permit issued by the Nevada Department of Environmental Protection , in a manner that aims to fully protect the environment and archaeological resources near the development and will not create any additional surface disturbance or significant new environmental impacts.
Esmeralda consists of patented and unpatented mining claims, fee lands, water rights and a mill. Ore extracted through the trial mining activities conducted at Hollister is trucked to Esmeralda for metallurgical processing.
11
| |
| MANAGEMENT'S DISCUSSION AND ANALYSIS |
| YEAR ENDED DECEMBER 31, 2010 |
Other features of Esmeralda include crushing facilities, stockpile areas, waste rock facilities, roads and other miscellaneous areas. There are currently no mining activities or further exploration work being conducted at Esmeralda.
Esmeralda is approximately 220 miles (354 kilometers) from Winnemucca and approximately 290 miles (467 kilometers) from the Hollister property with 80% of the latter distance over paved roads.

Progress on the Environmental Impact Statement
The Notice of Intent for the EIS was published in the Federal Register on April 19, 2010, which formally initiated the EIS scoping process. Work has been ongoing on all required elements of the EIS, but particularly chapters 2 and 3, which describe the proposed action and alternatives and the affected environment and environmental consequences of the proposed action. All resource survey work has been completed and final reports have been approved by BLM. Cultural resource survey work was completed in September 2010 and the final report is being drafted. All hydrologic modeling and reports have been completed and are awaiting final BLM approval. The preliminary draft EIS is scheduled for completion by November 2011. The estimated completion date for the issuance of a record of decision is early 2012.
The milestones of the EIS process to date are:
Third Party Contractor (“AECOM”) Selection Process: Completed September 2009;
Public Scoping Process: Completed May 2010;
A Preliminary Draft Environmental Impact Statement (“PDEIS”) was circulated for comments in late November 2010 and a review of the main chapters of the PDEIS by the Company is in progress. Recommended revisions to Chapter 2 (which describes the existing and proposed activities) have been forwarded to BLM. BLM is in process of scheduling a meeting where all parties (BLM, cooperating agencies, the Company and AECOM) will meet to review the comments and to make any necessary changes prior to the document being determined to be ready for public review and comment as the Draft EIS.
Weekly EIS team conference calls have been implemented to manage and monitor the EIS process. The calls are attended by the Company, BLM and AECOM.
The Company requested that the BLM record in the PDEIS that the current ore extraction rates for bulk sampling and testing in the range of 280 to 400 tons per day constitutes a “no action” alternative for the BLM. The BLM agreed to this request in September 2010 and hence PDEIS is one of the material documents in the EIS process. This accommodation by BLM has in management’s view mitigated the risks associated with the EIS as the existing trial mining rate is expected to continue un-affected during the entire EIS process.
12
| |
| MANAGEMENT'S DISCUSSION AND ANALYSIS |
| YEAR ENDED DECEMBER 31, 2010 |
Trial stoping and milling6
| 3 months ended December 31 2010 | 3 months ended December 31 2009 | 12 months ended December 31 2010 | 12 months ended December 31 2009 | |
| Ore tons to surface | 27,490 | 16,787 | 98,753 | 67,019 |
| Contained Au oz extracted | 25,328 | 18,226 | 100,867 | 56,189 |
| Contained Ag oz extracted | 101,401 | 99,737 | 559,195 | 462,746 |
| Contained Au eqv oz extracted | 26,849 | 19,722 | 109,255 | 67,132 |
| Contained average grade Au eqv oz/ton | 0.98 | 1.17 | 1.11 | 1.01 |
| Tons milled | 27,553 | - | 84,500 | - |
| Recovered Au oz | 20,520 | - | 64,664 | - |
| Recovered Ag oz | 92,003 | - | 289,136 | - |
| Recovered Au eqv oz | 21,901 | - | 69,001 | - |
| Au eqv oz sold | 31,911 | - | 62,604 | - |
| Recovery % Au | 80% | - | 82% | - |
| Recovery % Ag | 61% | - | 60% | - |
| Cash production cost per ton sold (US$) | US$546 | - | US$570 | - |
| Cash production cost per Au eqv oz sold (US$) | US$669 | - | US$719 | - |
| Cash production cost per ton sold | $563 | - | $589 | - |
| Cash production cost per Au eqv oz sold | $690 | - | $743 | - |
Ore tons to surface improved 64% from the comparative quarter in 2009 with a 47% improvement in the year to date compared to the 12 months ended December 31, 2009. Ore tons for the quarter were also 23% higher than Q3 2010. The continued focus on and action plans to increase ore tons from underground are showing positive results.
Estimated contained Au eqv oz extracted improved 41% and 63%, respectively, compared to the results for the 3 and 12 months ended December 31, 2009. Contained Au eqv oz for the quarter was also 16% higher than Q3 2010.
The Esmeralda mill achieved a new milling record in Q4 2010 with 27,553 tons milled. This is a 40% improvement over Q3 2010 and a 26% improvement over Q2 2010, which was the previous best quarter. Recoveries for the quarter of 80% Au and 61% Ag are still below our target of 92% Au and 85% Ag; lower recoveries were related to the high metal content fouling the carbon in the process. This issue is being addressed by the installation of a carbon regeneration system and automation of certain components within the mill. While the installation is underway, carbon is being replaced at a rate of 3 tons per day. This measure appears to be positively impacting recoveries with preliminary results for February 2011 showing an improvement when compared to Q4 2010.
Cash production costs for the Nevada operations over the quarter decreased by 11% from the prior quarter and amounted to $563 (Q3 2010: $635) per ton, consisting of $372 (Q3 2010: $427) mining and $191 (Q3 2010: $208) milling and haulage. On an Au eqv oz basis, cash production costs for the quarter improved by 19% over Q3 2010 and consisted of $455 (Q3 2010: $575) for mining and $235 (Q3 2010: $279) for milling and haulage. The improvement in the cash production costs is a result of the increase in tons extracted and processed during the quarter. The cash production costs have shown a downward trend over the 2010 fiscal year as production volumes increased. The trial mining operations are achieving their operating cost targets but operating costs at the Esmeralda mill are higher than planned. Improving efficiencies as well as automation of certain components within the mill is expected to reduce the mill operating costs to within plan by Q2 2011.
__________________________
6Metallurgical and cost information presented in the table are from our Esmeralda mill and exclude results of toll milling and ore sale agreements.
13
| |
| MANAGEMENT'S DISCUSSION AND ANALYSIS |
| YEAR ENDED DECEMBER 31, 2010 |
Ore sales and toll milling agreements
| 3 months ended December 31 2010 | 3 months ended December 31 2009 | 12 months ended December 31 2010 | 12 months ended December 31 2009 | |
| Queenstake Resources USA Inc. - Tons milled | 5,027 | - | 9,360 | - |
| - Au oz recovered | 359 | - | 3,152 | - |
| - Ag oz recovered | 2,024 | - | 6,186 | - |
| - Au eqv oz recovered | 389 | - | 3,246 | - |
| Newmont Mining Limited - Tons milled | - | - | 34,004 | 30,900 |
| - Au oz recovered | - | - | 20,333 | 30,071 |
| - Ag oz recovered | - | - | 153,031 | 220,960 |
| - Au eqv oz recovered | - | - | 22,939 | 33,190 |
| Kinross Mining Limited - Tons milled | - | - | - | 5,016 |
| - Au oz recovered | - | - | - | 9,966 |
| - Ag oz recovered | - | - | - | 73,461 |
| - Au eqv oz recovered | - | - | - | 11,516 |
| Total - Tons milled | 5,027 | - | 43,364 | 35,916 |
| - Au oz recovered | 359 | - | 23,485 | 40,037 |
| - Ag oz recovered | 2,024 | - | 159,217 | 294,421 |
| - Au eqv oz recovered | 389 | - | 26,185 | 44,706 |
The material from the high grade stock pile delivered to Queenstake Resources USA Inc. (“Queenstake”) in November 2009 was processed during Q3 2010 under the settlement agreement signed with Queenstake on June 14, 2010. In terms of the settlement agreement the parties share the metal proceeds and milling costs of $88 per ton. The 5,000 tons of material from the low grade stock pile delivered to Queenstake during 2007 was processed in Q4 2010 under the same agreement. This concluded the planned milling campaigns with Queenstake’ Jerrit Canyon mill.
The Company completed the ore purchase agreement with Newmont Mining Limited (“Newmont”) during Q3 2010. Once all materials delivered to Newmont were crushed and sampled, the final recovered metal ounces from this transaction amounted to 22,939 Au eqv oz.
The completion of the milling campaigns and the depletion of the stockpile that had accumulated since May 2009 allowed for a comprehensive reconciliation between contained and recovered metal in September 2010. The impact of rain and snow during this extended period of stock piling as well as using grab samples to estimate the contained metal in the stockpile create an inherent risk in achieving accurate estimates of metal on hand. The final milling campaign results showed some 12,000 Au eqv oz less being recovered than estimated from the available stock pile information in 2009. The risk of future losses is significantly mitigated now that all material are being processed through our Esmeralda mill resulting in an average of 14 days between extracting and processing the material which allows for a more diligent reconciliation process and confirmation of estimates used.
14
| |
| MANAGEMENT'S DISCUSSION AND ANALYSIS |
| YEAR ENDED DECEMBER 31, 2010 |
Mineral Resources
An updated estimate of the mineral resources at Hollister was announced during August 2010. Gold equivalent ounces in the measured and indicated categories increased by 14% from the March 2009 mineral resource update. In management’s view, resource estimates for the Hollister Property have continued to benefit significantly from the ongoing underground stope delineation and infill/cover drilling, which has provided the basis for detailed planning for trial mining. An additional 320 diamond core holes (totalling 109,731 feet or 33,295 meters) were completed in the period from April 2009 to June 30, 2010, and the information from these holes has been integrated into the updated model. The drilling program has provided infill data to delineate stopes for trial mining, and significantly improved our understanding of the lateral and vertical geological continuity of the vein system. The trial mining has generated geological mapping and channel sampling data that is used for empirical reconciliation of the resource wireframe model versus actual excavated vein. As a result, more stringent parameters continue to be applied to measured and indicated classifications. The resource estimate is based on a combination of informing surface and underground diamond drilling and ore control channel sampling, and reflects depletion of material mined up to June 30, 2010 (the effective date of the estimate).
At an assumed gold grade cut-off of 8.57 g/t (0.25 oz/short ton (“st”)), the combined measured and indicated mineral resources in the HDB contain an estimated 1.637 million in-situ equivalent gold Troy ounces (using an average gold price = US$1,000/Troy ounce, average silver price = US$15/Troy ounce with no recovery factor applied) in 1.017 million tonnes (1.121 million short tons) with average in-situ grades of 44.73 g/t (1.305 oz/st) of gold and 354.8 g/t (10.35 oz/st) of silver. A further 1.274 million equivalent in-situ gold Troy ounces (using an average gold price = US$1,000/Troy ounce, average silver price = US$15/Troy ounce with no recovery factor applied) are contained in the inferred mineral resource category of 1.349 million tonnes (1.487 million short tons) with average in-situ grades of 23.67 g/t (0.69 oz/st) of gold and 380 g/t (11.1 oz/st) of silver, at a gold grade cut-off of 8.57 g/t (0.25 oz/st).
Summary of In Situ Mineral Resources Estimate by Gold Grade Cut Off (August 2010)
Category | Au Grade Cut-off | Amount (’000) | Average Au Grade | Average Ag Grade | Equivalent Au oz | ||||
g/t | oz/ st | tonne(s) | ton(s) | g/t | oz/ st | g/t | oz/ ton | ||
Measured | 5.14 | 0.15 | 389 | 429 | 65.06 | 1.898 | 545.7 | 15.92 | 915,800 |
| 6.86 | 0.20 | 362 | 399 | 69.50 | 2.027 | 583.4 | 17.02 | 910,000 | |
| 8.57 | 0.25 | 337 | 371 | 74.05 | 2.160 | 622.0 | 18.14 | 903,100 | |
| 10.29 | 0.30 | 313 | 345 | 79.03 | 2.305 | 664.3 | 19.37 | 895,000 | |
Indicated | 5.14 | 0.15 | 975 | 1,075 | 23.10 | 0.674 | 167.7 | 4.89 | 802,800 |
| 6.86 | 0.20 | 802 | 884 | 26.79 | 0.781 | 196.1 | 5.72 | 766,800 | |
| 8.57 | 0.25 | 680 | 750 | 30.21 | 0.881 | 222.5 | 6.49 | 733,900 | |
| 10.29 | 0.30 | 586 | 646 | 33.58 | 0.979 | 248.1 | 7.24 | 702,300 | |
Measured + Indicated | 5.14 | 0.15 | 1,364 | 1,503 | 35.06 | 1.023 | 275.5 | 8.03 | 1,718,600 |
| 6.86 | 0.20 | 1,164 | 1,283 | 40.06 | 1.169 | 316.4 | 9.23 | 1,676,800 | |
| 8.57 | 0.25 | 1,017 | 1,121 | 44.73 | 1.305 | 354.8 | 10.35 | 1,637,000 | |
| 10.29 | 0.30 | 898 | 990 | 49.40 | 1.441 | 393.0 | 11.46 | 1,597,000 | |
15
| |
| MANAGEMENT'S DISCUSSION AND ANALYSIS |
| YEAR ENDED DECEMBER 31, 2010 |
Summary of Hollister Property Inferred Mineral Resources (August 2010)
Category | Au Grade Cut-off | Mass (000’s) | Average Au Grade | Average Ag Grade | Equivalent Au oz (‘000s) | ||||||
g/t | oz/ st | tonne(s) | ton(s) | g/t | oz/ st | Oz (000’s) | g/t | oz/ st | Oz (000’s) | ||
Total Inferred | 5.14 | 0.15 | 2,073 | 2,285 | 17.72 | 0.517 | 1,181 | 257 | 7.5 | 17,115 | 1,437 |
| 6.86 | 0.20 | 1,621 | 1,787 | 20.98 | 0.612 | 1,094 | 322 | 9.4 | 16,806 | 1,346 | |
| 8.57 | 0.25 | 1,349 | 1,487 | 23.67 | 0.690 | 1,027 | 380 | 11.1 | 16,497 | 1,274 | |
| 10.29 | 0.30 | 1,170 | 1,289 | 25.84 | 0.754 | 972 | 433 | 12.6 | 16,293 | 1,216 | |
Note to tables: | The equivalent gold oz shown in the above tables are calculated by applying a gold price of US$1,000 per Troy ounce and US$15 per Troy ounce for silver. Mineral resources that are not mineral reserves do not have demonstrated economic viability. Contained ounces and equivalent ounces are undiluted and assume 100% recoveries. |
The resource classification, in comparison to the previous estimate, reflects movement from inferred to indicated and from indicated to measured, and underpins increasing confidence in the block estimations. The higher confidence is directly linked to the significantly increased evaluation database from the trial mining and underground drilling. The grade estimation more closely reflects what is observed empirically underground. It also indicates that there is a quantifiable increase in block grade with increased density of sample data. The depth extent of the vein system has been maintained at a depth of 1,318 meters (4,350 feet) above mean sea level (approximately 1,200 feet or 380 meters below surface), and is the current maximum depth extent of inferred resources.
The mineral resource estimate was completed under the supervision of Phil Bentley, Pr.Sci.Nat., Vice President of Geology and Exploration for Great Basin, who is the qualified person responsible for the estimate.
Mineral Reserves
An updated estimate of the mineral reserve at Hollister was announced during February 2011. Mineral reserves were determined or “declared” using a gold cut-off grade of 8.57 g/t (0.25 oz/st). The Hollister Property is still in the trial mining stage; however, based on production techniques tested to date, the Company has estimated applicable call factors for mining of approximately 85% and metallurgical recoveries of approximately 92% for Au and 85% for Ag. Since the 2009 Mineral Reserve estimate, a total of 165,772 tons have been extracted at an average grade of 36.4 g/t (1.06 Au eqv oz/ton), yielding 176,387 Au eqv oz.
Reconciliation between the January 2009 and January 2011 Reserve Estimates without applying
the call factors at a cut-off grade of 0.25 oz/st and taking depletion into account
| Description | Cut-off oz/ton | Tons (’000) | Au eqv oz/ton | Au eqv oz (’000) |
| January 2009 Reserve estimate* | 0.25 | 1,398 | 0.90 | 1,257 |
| Apply 85% call factor | N/A | ---- | ---- | (188) |
| Trial mined 2009 – 2011 | N/A | (166) | 1.06 | (176) |
| Apply metallurgical recoveries | N/A | ---- | ---- | (90) |
| Restated January 2009 Reserve estimate | N/A | 1,232 | 0.65 | 803 |
| January 2011 Reserve estimate | 0.25 | 1,048 | 0.87 | 907 |
| Mineral Reserves added | 104 |
Note: * No mining and plant recovery factors applied. The January 2011 figures use the same gold and silver prices as noted for resources above, whereas the January 2009 Au eqv oz were based on US$800 for gold and $12 for silver, in each case per Troy ounce.
16
| |
| MANAGEMENT'S DISCUSSION AND ANALYSIS |
| YEAR ENDED DECEMBER 31, 2010 |
As the Hollister Property did not have a dedicated plant, no metallurgical recoveries or call factors were applied to the January 2009 Reserve statement.
A minimum stoping width of 0.91 meters (36 inches) was assumed for purposes of Mineral Reserve estimation, along with dilution defined as waste tonnes (or tons) carrying zero grade and 100 percent in-stope extraction. An analysis by the Company’s technical staff confirms that no systematic, in-stope pillars will be required because of the cut-and-fill trial mining method now being utilized. Based on the results of trial stoping and grade reconciliation studies, where vein widths of 0.76 meters (30 inches) or greater were considered, a total of 0.15 meters (six inches) of hanging wall dilution and 0.15 meters (six inches) of footwall dilution was applied. Where appropriate, other average dilution rates were applied. The in-situ wireframe model generated with the measured and indicated mineral resources in the table above was used as basis for this mineral reserve update.
Summary of the Hollister Property Mineral Reserve Estimates at a 8.57 g/t (0.25 oz/st)(January 2011)
| Reserve Category | Au Cut-off Grade oz/st | Tons | Au oz/st | Ag oz | Ag oz/st | Ag oz | Au eqv oz |
| Proven | 0.25 | 347,100 | 1.33 | 460,300 | 7.75 | 2,689,400 | 500,700 |
| Probable | 0.25 | 701,800 | 0.53 | 371,800 | 3.27 | 2,296,600 | 406,300 |
| Total Proven & Probable | 0.25 | 1,048,900 | 0.79 | 832,100 | 4.75 | 4,986,000 | 907,000 |
Note: | The equivalent gold ounces reported above are as stated by the Company. They were calculated by the Company by applying a gold price of US$1,000 per Troy ounce, a silver price of US$15 per Troy ounce. A Mining Call Factor of 85% and Metallurgical Recovery factors of 92% for Au and 85% for Ag were applied. |
The mineral reserve estimate was completed under the supervision of Johan Oelofse, Pr.Eng, FSAIMM, Chief Operating Officer for Great Basin who is the qualified person responsible for the estimate. A technical report on the Resource and Reserve update was completed in February 2011 and filed onwww.sedar.com.
Underground Drilling
Underground drilling is an important phase of evaluation, enabling more detailed delineation of vein mineralization. The updated in-situ vein model now reflects 32 veins, compared to 21 in 2009. Three drill rigs are currently utilized underground evaluating i) future trial stopes, ii) Blanket mineralization above the Tertiary volcanic unconformity, and iii) exploration and infill targets to test continuity of mineralization.
Of note are advances being achieved in understanding the vertical expression of the mineralization hosted in the epithermal vein systems from depth and upwards to surface. Recent advances in the 3000N 1E trial stope on the Clementine vein #18 have exposed mineralization occurring at and above the unconformity between the Ordovician (~ 430 million year) metasediments and overlying Tertiary (12-15 million year) volcanic. Spectacular enrichment in gold and silver grades in this so-called Blanket zone have been exposed. A tabulation of the results is shown below.
17
| |
| MANAGEMENT'S DISCUSSION AND ANALYSIS |
| YEAR ENDED DECEMBER 31, 2010 |
| Distance along strike | |||
| Distance Feet | Channel Au opt. | Dil Channel Au opt. | Muck Au opt. |
| 0 10 20 30 40 50 60 70 80 90 100 110 120 130 140 150 160 170 | 46.6 55.7 189.4 12.8 464.0 32.4 69.6 752.8 2,560.4 283.8 228.5 99.5 1.5 36.0 24.2 7.4 3.7 2.5 | 6.7 4.8 18.9 2.6 92.8 16.2 34.8 188.2 640.1 70.9 68.5 24.9 0.8 9.0 12.1 3.7 0.6 0.4 | - - 1.0 1.7 26.3 - 8.2 16.0 79.6 116.0 19.8 3.4 1.4 4.7 4.9 7.5 - - |
| Average | 270.6 | 66.4 | 22.3 |
Figures showing the stope locality, channel sample results and Blanket Zone targets are shown below.

Figure 1 : Trial mining stope 3000N 1 E Lift 43 plan view channel assays (Au oz/ton)
18
| |
| MANAGEMENT'S DISCUSSION AND ANALYSIS |
| YEAR ENDED DECEMBER 31, 2010 |
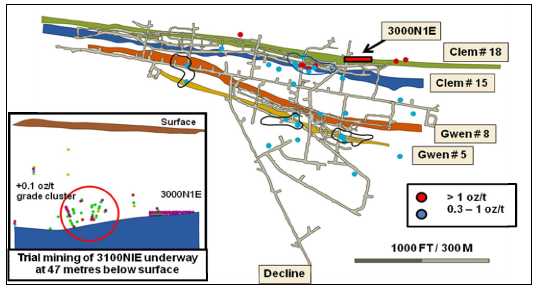
Figure 2 : Existing Blanket Zone high grade drilling intercept clusters relative to trial mining stope 3000N 1E
The very high grade zones are directly related to the propagation of the Clementine vein #18 structure upwards into the Tertiary volcanic strata, and upwards to surface, creating a geothermal vent, close to the historical Clementine mercury mine. The 3000N 1E trial stope is at an elevation of 5,440 feet (1,648 meters) above sea level, and there is an estimated 360 feet (~109 meters) to surface (5,800 feet (1,758 meters) above sea level). The dimensions of the current exposures in 3000N 1E will be investigated by a combination of diamond core drilling, cross cuts and raises.
The evaluation of Blanket Zone material progressed during Q4 2010. Bulk sampling involved the successful extraction of some 500 tons grading on average 12 oz/ton Au eqv. An initial phase of underground drilling was initiated to determine the grade profile and strike continuity of the Blanket Zone style of mineralization exposed at 3000N 1E. As at February 21, 2011, 5 boreholes (each approximately 600 feet long) had been completed. A further 11 holes are planned for completion by end March 2011 to enable preliminary mineral resource modelling. The super high grade (>10 oz/ton Au) zones are directly related to vertical extensions into the Tertiary volcanic strata of narrow mineralised structures in the underlying Ordovicician metasediments.
Potential exists to test other Blanket style zones in similar structural settings at the top of all mineralized epithermal veins included in the current life of mine plans for Hollister.
The first long flat underground borehole testing the Velvet area to the north of current infrastructure (HDB 432; EOH 2,800 ft) was completed on February 14, 2011. The borehole intersected a number of silicified and weak to moderately mineralised silicified zones and fault structures that are indicative of fluid circulation and alteration. As at February 22, 2011, a second hole had reached 1,520 ft with approximately 1,480 ft remaining. The structural and alteration features in this area are being modelled so as to put the borehole results into context.
Underground structural mapping has helped advance the geometry of structures localizing vein development. A left-lateral “side-stepping” pattern of vein clusters is emerging, and specifically supports the ongoing drilling program which will focus on extensions of the Gloria vein system to the west/northwest, encouraging Gwenivere intersections to the southeast, and development of a subparallel vein system to the north.
19
| |
| MANAGEMENT'S DISCUSSION AND ANALYSIS |
| YEAR ENDED DECEMBER 31, 2010 |
Underground drilling during Q4, 2010 continued to gain positive results for the recently discovered SE Gwenivere vein system. Preliminary modelling of the vein system has been initiated.
Surface Exploration
No surface exploration drilling was conducted during the year. The integration of geophysical survey interpretations (in particular geological structures) with available geological data has progressed, but still needs tying in with exposed and mapped underground structures. Permitting by the BLM for the next round of surface exploration drilling on the Hatter and Ivanhoe Plan of Operations has been received.
The second Hollister geochemical standard, which will match the common grade range of the ore stockpile material (~ 1 oz/ton / 31 ppm Au and 8 oz/ton / 250 ppm Ag) is still in the process of being completed. The sample, comprised of approximately 1,500 pounds of coarse crushed drill core rejects, has been pulped and prepped by American Assay Laboratories. The sample will be mixed in a ribbon blender prior to its use in round robin assay analysis. These standards are a critical step to accurate QAQC analysis of laboratories used for assaying the various sample sources (eg. exploration drilling, channel, core drilling, and bulk blanket-style).
Safety watch list
On November 19, 2010, the Company was notified by letter from the Federal Mine Safety and Health Administration (“MSHA”) that MSHA had conducted a “pattern” of violation screening pursuant to Section 104(e) of theFederal Mine Safety and Health Act of 1977(the “Mine Safety Act”). The letter stated that MSHA has initially concluded that a potential pattern of violations exists at Hollister and set out a process by which Hollister could work with MSHA to avoid any further sanctions pursuant to that program.
MSHA’s initial finding was based mostly on alleged violations, rather than violations which had been fully adjudicated. Many of the alleged violations that form the basis for MSHA’s finding as well as the injury severity measure screening data used by MSHA, are being challenged by the Company. The Company is confident that it will prevail in the great majority of those challenges and believes, for that and other reasons, that it should be removed from the watch-list without the penalties of Section 104(e) of the Mine Safety Act being invoked.
Plans for fiscal 2011
The Company plans to continue its trial mining (ore removal and test-processing) activities at Hollister within the allowable ore tonnage authorizations of its existing permits, with all extracted material to be processed at the Esmeralda mill. A carbon regeneration system will be installed at the Esmeralda mill to enhance recoveries by preventing carbon fouling. The Nevada operations are targeted to produce an estimated 110,000 Au eqv oz in 2011 at a cash cost estimated to range between US$550 to US$600.
The Company is continuing with underground infill drilling with a view to bringing the current inferred mineral resources into the indicated or measured categories, as well as step-out drilling to further explore the potential for western, northwestern, down dip and Blanket zone extensions to the mineralized vein systems. The results of underground mapping and exploration drilling continue to refine the Company’s understanding of the Hollister Property deposit, to the extent that additional mineralization continues to be identified within the mineralized vein systems.
The Company will also continue working on finalization of the EIS for Hollister by Q1 2012.
20
| |
| MANAGEMENT'S DISCUSSION AND ANALYSIS |
| YEAR ENDED DECEMBER 31, 2010 |
| 4.2 | South African operations |
The Burnstone Property is located in the South Rand area of the Witwatersrand Goldfields, approximately 50 miles (80 kilometers) southeast of the city of Johannesburg and near the town of Balfour. The Burnstone Project has received all of the required permits to complete the development of the mine and commence full-scale underground mining. Block B and Block C, containing an estimated 280,000 oz and 231,400 oz of Au, respectively, will be the first areas of the ore body to be accessed and mined in the next 36 months, while underground access to the remaining areas of the ore body under the mine plan is being developed.
Permitting
On February 17, 2009, Southgold Exploration (Pty) Ltd (“Southgold”) (100% subsidiary of the Company) was officially awarded the right to mine for gold, silver and aggregate in the Burnstone mining area for a period of 18 years from date of execution of the mining right, as well as renewal rights.
On October 5, 2010 the South African Diamond and Precious Metal Regulator (“SADPMR”) granted a Precious Metal Refining License to Burnstone for a period of 30 years authorizing the smelting, refining or changing the form of unwrought precious metal. This allowed the Company to commission the gold room in the metallurgical plant in late October 2010.
On October 18, 2010 the SADPMR granted an export license to Burnstone authorizing the export of gold and silver and thereby allowing for the sale of precious metal.
Commissioning of capital projects
The initial mine capital expenditure program has generally been completed and the mine has commenced with production build-up. Major capital projects that include the vertical shaft, metallurgical plant, decline, ventilation shaft and required surface and underground infrastructure have been commissioned by January 2011. The components of the mine required to enter commercial production have thus been completed and commissioned and therefore conclude the development phase of the project. Revenue and production costs will be recognized as from Q1 2011 with capitalization of further development costs as per the Company’s accounting policy.
Vertical shaft complex
The vertical shaft is intended primarily for rock hoisting, but is also equipped for the insertion and extraction of men and material. For this purpose, two winders have been installed. The 7.5 meter diameter vertical shaft, lined with 300mm concrete is designed for the extraction of rock at a rate of 206,000 tonnes per month. Shaft bottom (1,601 ft/488 meters) was reached in May 2010 which concluded the sinking phase of the project. The decline was also holed with the vertical shaft in Q2 2010, resulting in additional access to 40 level as well as improved ventilation.
The main equipping of the shaft commenced in Q3 2010 and was completed during Q4 2010. The focus was to first get the winders (personnel and rock) commissioned and licensed. Both were licensed on October 15, 2010 by the Department of Mineral Resources. Tipping arrangements on 40 Level through the temporarily ore pass was completed on October 30, 2010 and trial tipping started on November 2, 2010. The development of the remaining underground station infrastructure that includes another three ore passes, the settlers and a clear water dam commenced in November 2010 and will be completed in Q2 2011 which will allow the vertical shaft to operate at full design capacity.
21
| |
| MANAGEMENT'S DISCUSSION AND ANALYSIS |
| YEAR ENDED DECEMBER 31, 2010 |
Metallurgical plant
The metallurgical plant for Burnstone was designed for a production rate of 125,000 tonnes per month with an increase to 175,000 tonnes per month by adding a second ball mill in-line with the production profile of the mine. A combination of a Semi Autogenous Grinding (“SAG”) mill and Ball mill with a Carbon-in-Leach (“CIL”) process is used to maximize recoveries.
The completion of the plant terrace and site establishment by the construction contractors in February 2010 allowed for commencement of plant construction. An aggressive construction schedule was followed to ensure the plant was delivered as a fully integrated, commissioned unit by the end of 2010. The project encountered various challenges that included extraordinary rainfall, extreme cold winter as well as the impact on deliveries and contractors by the soccer world cup hosted in South Africa in July 2010. The construction schedule was closely monitored and alternative measures were put in place to keep the delivery schedule intact. Additional shifts were implemented and additional contractors were brought onto site to catch-up lost time.
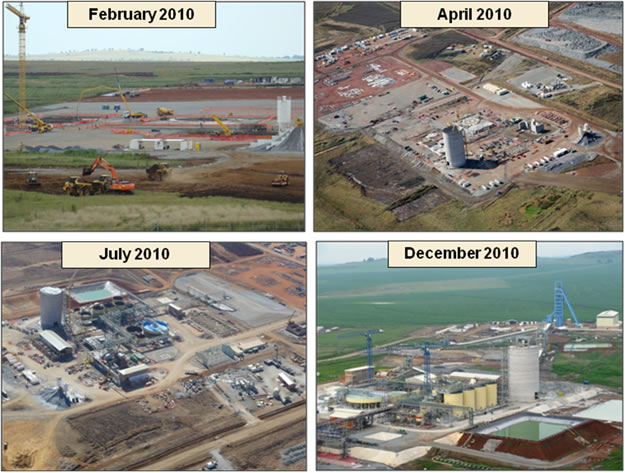
Construction of Metallurgical Plant completed within 12 months.
Diesel powered generators were used for power generation during the construction phase. The late delivery of permanent power to the site had a severe impact on the delivery schedule as commissioning of the major components could not commence without it. The commissioning of the plant was structured in a manner that allowed for this to be done sequentially. The crusher and the silo feed conveyer were commissioned on October 4, 2010 with crushed material being fed into the silo. Conveyers were run at low speed for the duration of the commissioning phase to ensure optimal performance prior to production.
22
| |
| MANAGEMENT'S DISCUSSION AND ANALYSIS |
| YEAR ENDED DECEMBER 31, 2010 |
The SAG and Ball mills were commissioned in October, 2010. The SAG and Ball mills are controlled using medium voltage drives, which offer improved reliability through the use of high voltage insulate gate bipolar transistors that are 99% efficient at full load and have a high dynamic response based on voltage source inverter technology. This is the first application of this power management technology in South Africa.
The tailings storage facility, inclusive of a bulk water storage dam was also completed in Q3 2010 to coincide with the commissioning schedule of the plant.
Gold slag recovered from the mills during the refurbishment process was used to commission the gold room in October, 2010. The first gold pour took place on October 31, 2010 with gold recovered through the gravity circuit. Commissioning of the gravity and CIL circuits as well as the thickener is now completed allowing for the uninterrupted processing of material starting in February 2011.
Close-out of construction packages is targeted for completion in Q1 2011. The plant has achieved its targeted rate for January 2011 of 90,000 tonnes milled. The current focus is to ramp up production and achieve a milling rate of 125,000 tons per month by July 2011.
General surface infrastructure
Power
The first phase for power supply to Burnstone consisting of 21 MvA, and on-site power reticulation has been completed and all facilities on site are now connected to Eskom power. Power supply to site will build-up to the required 51 MvA with the upgrade of the existing Eskom sub-station and feeder lines by the end of Q3 2011. Current Eskom supply is adequate to complete commissioning and to allow for the planned production build-up.Ventilation shaft
The presence of a 100 feet (30 meters) coal seam resulted in a partial collapse of the sidewall close to surface during Q2 2010. Additional support work which included a 27 feet (8 meters) steel sleeve was installed and the subsided area backfilled with concrete to stabilize the top portion of the shaft. Further support with shotcrete, mesh, lacing as well as long anchors were also installed. The installation and commissioning of the three 720 kW fans has been completed and these are now operational.
Long Hole Stoping (“LHS”)
The LHS trial has been completed in Q4 2010, following 12 months experimenting with drilling, blasting and cleaning techniques. The progress made and results achieved during the trial period enabled the Company to implement LHS as the preferred mining method and develop a life-of-mine (“LOM”) plan based on this mining method. Our ore body also allows us to use LHS due to the relative flat dip (7 – 11 degrees) as well as the fact that we are mining at depths of 924 – 1,980 ft (280 – 600 meters) for the majority of the LOM. The development of standard drill rigs being able to drill the 50 ft (15 meters) extremely accurate also benefits this mining technique. The remainder of the equipment is also standard to the industry and includes load haul dumpers, dump trucks, roof bolters and single and twin boom drill rigs used for development in most underground mines throughout the world. The actual drilling, blasting and cleaning of the stope material is performed by a few specialized teams that have received the necessary training while the majority of the workforce focuses on development and support services to the mine.
23
| |
| MANAGEMENT'S DISCUSSION AND ANALYSIS |
| YEAR ENDED DECEMBER 31, 2010 |
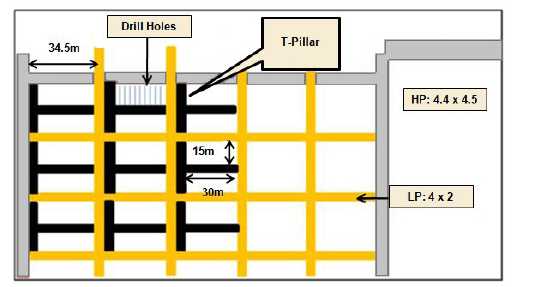
Figure 3 : Plan view of LHS stope lay-out.
As illustrated in Figure 3, reef areas are cut into 113 ft (34.5 meters) by 113 ft blocks by low profile reef drives of 13 ft (4 meters) by 7 ft (2 meters). “T” shaped pillars of 15 ft (4.5 meters) are left for support with the “T” configuration also providing support with blasting and cleaning of material into the low profile reef drives. Every fifth reef drive is a high profile drive of 15 ft (4.5 meters) by 15 ft. Low profile load haul dumpers muck the blasted material from the low profile drive to the high profile drives where it is loaded onto dump trucks and transported to the vertical shaft for hoisting.
The reef development completed thus far as well as the information from drilling has indicated an average channel width of 2.24 ft (0.68 meters). During the trial period the stoping team had been successful in managing the dilution to the average channel width. Ensuring that dilution is managed to the minimum will remain a key focus during the LOM as this will create the opportunity to increase the ore tons delivered to the plant at an increased head grade.
LHS has numerous benefits that include:
| a. | Safety | |
No personnel enter the stopes as trackless drill rigs are used to drill into the reef from the reef drives. | ||
| b. | Skills | |
Our employees all had 10 years of schooling and are fluent in English. This enables us to utilize world-class training and testing techniques to equip our personal with the skills required. | ||
| c. | Efficiencies | |
LHS enables us to achieve significantly higher efficiencies than conventional mining in terms of tons and ounces per employee. Production build-up and the sustaining rate of production is higher than with conventional mining. |
24
| |
| MANAGEMENT'S DISCUSSION AND ANALYSIS |
| YEAR ENDED DECEMBER 31, 2010 |
Underground development and Production Build-up
Good progress continues to be made to open up mining blocks B and C. A total of approximately 19,061ft (5,810 meters) of reef development had been completed for the year ended December 31, 2010 with 21,792 ft (6,644 meters) of reef development being completed to date.
Tons from reef development will be treated by the Plant but due to the added dilution associated with these tons a relatively low head grade is delivered to the mill. The rate of stoping will be increased as more stopes become available which will increase the blended head grade delivered to the Plant. Production build-up during 2011 to reach the planned Au ounces of 110,000 to 140,000 for the year will be dependent on achieving the planned rate of development as this will ensure required stopes being available to achieve production targets. Development rates will increase from a monthly average of 3,300 ft (1,000 meters) in Q1 2011 to 10,000 ft (3,000 meters) by the end of Q4 2010. As at December 31, 2010, approximately 197,000 ore tonnes from mining and development had been accumulated on the surface stockpiles at an average grade of 1 g/t. These tons are being co-mingled with development and stope tons mined in Q1 2011 to allow for a steady increase in the milling rate from 90,000 tonnes in January to 125,000 tonnes in July 2011. The blended head grade will also increase from 0.03 Au oz/t in Q1 2011 to 0.10 Au oz/t in Q4 2011.
Mineral resources
A mineral resource estimate was announced in August 2010 based on a “4 2 1 model”, which uses a minimum of four informing samples for a measured resource classification 2 for an indicated classification and 1 for an inferred classification. The number of informing Kimberley Reef intersections utilized in this resource estimate totals 610, inclusive of 339 surface boreholes, 35 underground boreholes, and 362 underground channel intersections. In addition, historic deflections from surface boreholes totalling 819 have been used where appropriate for assay and sedimentological confirmation. Geozones of the area of interest were updated as part of the basis for the estimation, but have remained very similar to the previous June 2009 update. These zones are delineated by a combination of variable geological parameters such as channel width, gold grade (g/t) and gold accumulation (cm.g/t), footwall lithology, and sedimentary facies.
Variography generated from the current geostatistical analyses have confirmed sediment influx from the NE in Geozones 1 and 3, mixing with an overall NW – SE paleofacies trend, and in line with previous observations. The continued underground exposure of Kimberley Reef is providing a basis for detailed evaluation data (channel samples) and structural mapping. All told, the results demonstrate higher confidence in the estimated total Measured and Indicated resources An updated resource model was announced in February 2011 using the same estimation parameters but more stringent classification criteria, which is a minimum of 6 informing samples for measured, 3 for indicated and 2 for inferred. These resources are tabulated below:
25
| |
| MANAGEMENT'S DISCUSSION AND ANALYSIS |
| YEAR ENDED DECEMBER 31, 2010 |
Summary of the Burnstone Property Measured and Indicated Mineral Resource at Various Cut-off Gold Content (Cmg/t) (February 2011)
Classification | Content Cmg/t cut off | Millions tonnes | Au g/t | Au oz |
Measured | 300 | 41.2 | 5.67 | 7,496,000 |
| 350 | 37.2 | 5.78 | 6,900,000 | |
| 400 | 33.1 | 5.94 | 6,326,000 | |
Indicated | 300 | 23.5 | 7.31 | 5,516,000 |
| 350 | 21.3 | 7.60 | 5,199,000 | |
| 400 | 19.8 | 7.77 | 4,956,000 | |
Total measured and indicated | 300 | 64.6 | 6.26 | 13,012,000 |
| 350 | 58.4 | 6.44 | 12,099,000 | |
| 400 | 53.0 | 6.63 | 11,283,000 |
Summary of Burnstone Property Inferred Mineral Resource at Various Cut-off Gold Content
(Cmg/t) (February 2011)
| Classification | Content cmg/t cut off | Millions tonnes | Au g/t | Au oz |
Inferred | 300 | 66.8 | 4.33 | 9,306,000 |
| 350 | 54.9 | 4.75 | 8,374,000 | |
| 400 | 49.1 | 4.86 | 7,679,000 |
Note: | Resources are calculated by applying a gold price of US$1,000 per Troy ounce and US$15 per Troy ounce for silver. Mineral resources that are not mineral reserves do not have demonstrated economic viability. Contained ounces and equivalent ounces are undiluted and assume 100% recoveries. |
Comparison of the 6 3 2 and the 4 2 1 Mineral Resource Estimate Models
| 6 3 2(1)model | 4 2 1(2)model | ||||||
| Resource | Cut off | Mass | Au grade | Au Content | Mass | Au grade | Au Content |
| Classification | cmg/t | M tons | g/t | oz | M tons | g/t | Oz |
| Measured | 300 | 41.2 | 5.67 | 7,496,000 | 40.0 | 5.78 | 7,435,000 |
| 350 | 37.2 | 5.78 | 6,900,000 | 36.5 | 5.90 | 6,927,180 | |
| 400 | 33.1 | 5.94 | 6,326,000 | 33.7 | 6.01 | 6,514,390 | |
| Indicated | 300 | 23.5 | 7.31 | 5,516,000 | 31.2 | 6.44 | 6,472,770 |
| 350 | 21.3 | 7.60 | 5,199,000 | 27.2 | 6.84 | 5,978,830 | |
| 400 | 19.8 | 7.77 | 4,956,000 | 24.1 | 7.20 | 5,567,960 | |
| Measured + Indicated | 300 | 64.6 | 6.26 | 13,012,000 | 71.2 | 6.07 | 13,907,770 |
| 350 | 58.4 | 6.44 | 12,099,000 | 63.7 | 6.30 | 12,906,010 | |
| 400 | 53.0 | 6.63 | 11,283,000 | 57.8 | 6.50 | 12,082,350 | |
| Inferred | 300 | 66.8 | 4.33 | 9,306,000 | 67.5 | 4.33 | 9,392,970 |
| 350 | 54.9 | 4.75 | 8,374,000 | 61.0 | 4.49 | 8,799,830 | |
| 400 | 49.1 | 4.86 | 7,679,000 | 52.2 | 4.75 | 7,977,520 | |
| Note: | The contained gold oz are calculated using a gold price of US$1,000 per Troy ounce. Mineral resources that are not mineral reserves do not have demonstrated economic viability. Contained ounces are undiluted and assume 100% metallurgical recovery. Measured and Indicated Resource includes Proven and Probable reserves. |
| (1) 6 3 2 indicates minimum number of informing points for measured (6), indicated (3) and inferred (2). | |
| (2) 4 2 1 indicates minimum number of informing points for measured (4), indicated (2) and inferred (1). | |
26
| |
| MANAGEMENT'S DISCUSSION AND ANALYSIS |
| YEAR ENDED DECEMBER 31, 2010 |
At a 350 cmg/t cut-off, the tighter classification parameters have resulted in an 8% decrease in total measured and indicated resources tonnage, a 2% increase in grade from 6.30 to 6.44 g/t Au, and a combined 6% adjustment downwards of contained gold in the measured and indicated resources categories from the 2009 mineral resource estimate. The 350 cmg/t cut-off is lower than the 400 cmg/t used for previous estimates and conversions to mineral reserves, reflecting increased confidence in these estimates. This cut-off is also in line with the mineral reserve cut-off, and is anticipated to decrease slightly in the future due to increased confidence in pay limit calculations.
The updated estimate was completed by Freddie de Bruin, Pr.Sci.Nat., of Deswik Consultants under the supervision of Phil Bentley, Pr.Sci.Nat., Vice President Geology and Exploration for Great Basin, who is the qualified person responsible for the estimate.
Mineral Reserves
At the Burnstone Property, mineral reserves increased by 55% with the majority of the increase attributable to the improved geological information obtained from underground development and drilling conducted since the January 2009 reserve update as well as additional reserves included from Area 2. Detailed planning has shown that production at Area 2 of the Burnstone Property can be increased and be extracted through separate infrastructure. Since the January 2009 reserve update, the Company has completed over 6,000 meters (19,685 feet) of on-reef development and over 3,851 meters2(41,452 feet2) of LHS. The January 2011 mineral reserve update and Life-of-Mine planning is based on LHS as the preferred mining method, and the decrease in dilution from this mining method has also positively impacted on the updated reserve estimate.
At a cut-off gold content of 350 centimeter-grams per tonne (cmg/t) the combined proven and probable mineral reserves of the Burnstone Property are 6.4 million Au oz grading 4.47 g/t (0.13 oz/ton) Au after application of a 95% Call Factor for mining and a 95% metallurgical recovery. Currently, 53% of the measured and indicated mineral resources have been converted into proven and probable reserves.
The proven and probable reserves have been determined in terms of Canadian regulations under NI 43-101, which differ from the SEC’s standards for such classification.
Summary of Burnstone Diluted Reserve Estimates at a 350 cm g/t Gold Content Cut-off (January 2011)
| Category | Tonnes Treated | Recovered Grade (g/t) | Recovered Au content (oz) |
| Proven | 29,784,000 | 4.11 | 3,933,000 |
| Probable | 14,436,000 | 5.23 | 2,427,000 |
| Proven and Probable Reserve | 44,220,000 | 4.47 | 6,360,000 |
Note: | The gold ounces reported above are as stated by the Company. They were calculated by the Company by applying a gold price of US$ 1,000 per Troy ounce. Dilution factors including LHS panels where the channel width is < 60 cm and Metallurgical Recovery factors of 95% for Au were applied. |
The reserve estimate was completed under the supervision of Johan Oelofse, Pr.Eng, FSAIMM, Chief Operating Officer for Great Basin who is the qualified person responsible for the estimate. A technical report on the Resource and Reserve update was completed in February 2011 and filed onwww.sedar.com.
27
| |
| MANAGEMENT'S DISCUSSION AND ANALYSIS |
| YEAR ENDED DECEMBER 31, 2010 |
Underground drilling
Drilling totalled 25,905 ft (7850 m) for the year, split between 4,907 ft (1,487 meters) cover and 20,998ft (6,363 meters) delineation drilling. The focus continues to be on Block C delineation and infill evaluation to support the mine plan. The number of operating rigs increased to six during the year. In addition, a more powerful LM75 diamond drill rig capable of drilling holes up to 3,300 ft (1,000 meters) was mobilized in order to drill deeper fan boreholes into Block C.
Surface drilling
Surface drilling was aimed towards infill drilling in the initial mine plan area. Twenty-three surface diamond boreholes were completed during 2010. This drilling specifically targeted areas where better resolution structural data was needed. Work programs outside the mining right as well as investigations of sub-cropping mineralization in four areas are being reviewed. In particular a 3-D seismic survey is being scoped for possible effecting in 2012.
Project capital
The table below provides a summary of the project capital spent to date (converted at a fixed exchange rate of CAD/ZAR = 7.22) .
Historical spent CAD (million) | Actual capital Q1 2010 CAD (million) | Actual capital Q2 2010 CAD (million) | Actual capital Q3 2010 CAD (million) | Actual capital Q4 2010 CAD (million) | Total capital 2010 CAD (million) | Project to date capital CAD (million) | |
| Process plant | $ 23 | $ 10 | $ 31 | $ 27 | $ 23 | $ 92 | $ 114 |
| Mining equipment | 18 | 1 | 3 | 4 | 11 | 19 | 36 |
| Vertical shaft complex | 40 | 10 | 11 | 7 | 7 | 34 | 74 |
| Mine development | 62 | 5 | 6 | 5 | 14 | 30 | 91 |
| Tailings dam | - | 1 | 4 | 4 | 2 | 11 | 11 |
| Total capital costs | $ 143 | $ 27 | $ 55 | $ 47 | $ 56 | $ 185 | $ 326 |
| Pre-production operating costs | 25 | 9 | 14 | 20 | 21 | 64 | 89 |
| Total capital | $ 168 | $ 36 | $ 69 | $ 67 | $ 77 | $ 249 | $ 415 |
The detail design phase on major capital components like the metallurgical plant, vertical shaft and power reticulation continued until construction commenced on these components and in certain instances integration design of components could only be completed while construction was in progress. The preferred LHS mining method has also resulted in an increase in the mining equipment required to support the planned development and production rates.
Planned mine development rates were negatively influenced by the interruptions caused by the lack of permanent power supply, excessive water that had to be handled through temporary infrastructure and the cost of recruitment of skilled labour from the host community. The slower rate of mine development had a negative impact on the previously projected development costs.
The initial project capital expenditure has all but been completed. Estimated project capital of $125 million is to be spent over the next 8 years and sustaining capital of $343 million is currently estimated to be required over the next 26 years (LOM).
28
| |
| MANAGEMENT'S DISCUSSION AND ANALYSIS |
| YEAR ENDED DECEMBER 31, 2010 |
| TOTAL PROJECT CAPITAL | |||||
| Project capital spent to December 31, 2010 | Remaining project capital to be spent over LOM | Total project capital | Sustaining capex | Total project capital | |
| CAD$ (million) | CAD$ (million) | CAD$ (million) | CAD$ (million) | CAD$ (million) | |
| Process plant Mining equipment Vertical shaft Mine development Tailings | 114 36 74 91 11 | 9 8 5 104 - | 123 44 79 195 11 | - 203 - 139 - | 123 247 79 334 11 |
| Total capital costs Pre-production operating costs | 326 89 | 125 - | 452 89 | 343 - | 794 89 |
| Total project capital | 415 | 125 | 540 | 343 | 883 |
Cost per oz (ZAR7.22) Cost per oz (ZAR8.00) | 65 59 | 20 18 | 85 77 | 54 49 | 141 128 |
Plans for fiscal 2011
Reef development remains the key to delivering the planned production build-up and will therefore be the priority focus for 2011. The 2011 production range of 110,000 to 140,000 oz of Au is therefore the result of the increased focus on reef development. Cash costs for 2011 are forecast in the range of US$520 –US$620/oz which includes the impact of the diluted grade from the additional reef development. Completion of remaining mine infrastructure, above and below surface is also planned, which entails development on 40 and 41 level of the vertical shaft, close out of construction packages for the metallurgical plant, surface infrastructure and the completion of permanent power supply. The Company will also source, employ and train the necessary workforce and purchase the remaining trackless equipment required. A total of $90 - $100 million of capital is to be spent during 2011 with more than 90% attributable to underground development to support the production profile for the short to medium term. Meeting our production and development targets for 2011 will provide a solid foundation for the production target of 220,000 Au oz for 2012 with the average LOM production of 254,000 Au oz to be reached in 2013.
| 5. | Exploration properties |
| 5.1 | Tanzania |
In Tanzania, exploration programs are being conducted in two separate geological terrains, namely the Archean (2.7 -3.3 billion years old “Ga”), greenstone-hosted, Lake Victoria Goldfields (north-west) and the Proterozoic (2.2 -1.6 Ga) Lupa Goldfields (south-west). The Company also manages a joint venture with African Barrick in the Geita Belt of the Lake Victoria Goldfields.
The acquisition agreement entered into in 2008 provided for additional Great Basin shares to be issued in the first three years from closing, contingent upon gold discoveries above a threshold of 500,000 ounces in size being made on certain mineral prospects held. In the event of such discoveries, the Company would issue shares valued at the higher of closing price on date of acquisition ($3.30) or then-prevailing market price to the former owners on the basis of valuing these gold ounces at US$15/oz for inferred resources and US$40/oz for measured and indicated resources (subject to a minimum average cut-off grade of 1.5 grams per tonne or 0.04 oz per ton).
The Company also agreed to spend a minimum of $15 million and up to a maximum of $27 million in terms of the agreement to explore the acquired properties during the first three years from closing of the transaction on April 1, 2008. The increased expenditure would also be contingent upon gold discoveries above a threshold of 500,000 ounces in size being made on certain mineral prospects.
29
| |
| MANAGEMENT'S DISCUSSION AND ANALYSIS |
| YEAR ENDED DECEMBER 31, 2010 |
In connection with this contingent payment requirement, the Company issued 3,073,773 shares in January 2010 with a total value of $5.5 million. During May 2010, the terms of the remaining liability were amended and settled in full through the issuance of 7.5 million shares in June 2010, thus eliminating any further discovery-contingent common share issuance requirements as well as eliminating the mandatory exploration expenditure timetable. The Company now holds all the prospects outright without further obligations in terms of the acquisition agreement.
There remains a considerable amount of preliminary exploration work still to be completed on these properties. A number of permits are held that extend over significant strike extents of prospective structures, and which still require systematic exploration and potentially follow-up drilling. This process could ultimately allow a sizeable reduction of area of permits held.
An initial target prioritization exercise has been completed, and this work continues to be supported with desk-top structural studies of airborne magnetic data and integration of gravity, geochemical and drilling data. The Imweru prospect (Geita West) remains a key follow-up target, with extensive drilling required to fully evaluate the 9 kilometer long shear corridor. Subject to orientation studies, Mobile Metals and Iron (“MMI”) geochemical surveys are planned on a number of covered structural targets. The Lupa Goldfield has also provided a number of follow-up targets, and work is progressing to seek a balanced prioritization with drilling and trenching programs to augment infill geochemical surveys.
| 5.2 | Russia |
In addition, the Company owns mineral rights on the island of Kurils (eastern Russia) where an initial phase of diamond drilling was done in 2008, aimed at establishing indicated mineral resources in the main project area.
The Kurils Project in Russia still requires a significant amount of phased exploration programs in order to generate a significant mineral resource base. The Company plans to dispose of this property.
| 5.3 | Mozambique |
The Company holds an 80% interest in an unincorporated joint venture with G S Minase Refnaria Limitade (“GSR”) in Mozambique. The purpose of the joint venture is to establish a gold exploration and mining business in Mozambique, whereby the Company will have the exclusive right to explore all GSR’s properties.
GSR currently owns the 17 square kilometer Tsetsera Property. The property was worked historically by artisanal miners, who crushed quartz vein material and panned gold from the fines. The artisanal miners have exposed over 985 feet (300 meters) strike length of quartz veins, 5 to 60 cm in width, within a phyllite (strongly metamorphosed sediments).
An initial soil sampling and ground geophysics program was completed on the property during 2008. A shear corridor in excess of 8,200 feet (2,500 meters) in strike and 1,310 feet (400 meters) in width has been identified for follow-up investigation. Although the project was placed on care and maintenance during 2009, a decision has since been made to continue with the joint venture.
| 6. | Market Trends |
Gold opened at US$1,087 on January 4, 2010 and generally traded upwards from this point during the year fuelled by an increased demand and continuous concern regarding stability and growth in the Global economy. Gold traded at a cumulative average price of US$1,225 during the year and closed at a record high of US$1,421 on November 9, 2010. We saw some volatility during November and December with gold trading as low as US$1,337 on November 17, 2010 and again up to US$1,420 by December 7, 2010 before it closed at US$1,405 on December 31, 2010. The volatility continued into 2011 with gold prices declining to US$1,319 on January 28, 2011 but recovering to close at US$1,420 on March 1, 2011. The volatility and increase in early 2011 is driven by the political unrest in the Middle-East and North Africa with gold again seen as the “safe-haven” investment.
30
| |
| MANAGEMENT'S DISCUSSION AND ANALYSIS |
| YEAR ENDED DECEMBER 31, 2010 |
The price of silver also impacts on the revenue and earnings of the Company, although to a lesser extent than the price of gold. Included in revenue is 400,895 Ag oz sold from trial mining activities at Hollister. Silver opened on January 4, 2010 at US$17.17 and traded at a cumulative average of US$20.19 during the year before closing on US$30.63. Silver prices continued to rise in 2011 and closed as high as US$34.37 on March 1, 2011.
Good progress with the completion of the Burnstone capital project and imminent production from this project as well as the continued improvement in all areas at our Hollister project has had a significant impact on the Company’s share price during the year. After opening at $1.81 on January 4, 2010 the share price increased to $3.33 on November 9, 2010 and closed at $2.95 on December 31, 2010, an increase of 63% during the year. The volatility of the gold price seen in early 2011 as well as the bought deal public offering closed on February 23, 2011 impacted on our share price in early 2011 with an average trading price of $2.65 achieved up to March 1, 2011.
The exchange rate between the US$, $ and the South African Rand (“ZAR”) impacts on the Company’s earnings and cash flow. The ZAR opened at R7.39 against the US$ on January 1, 2010 and weakened to R7.96 in May 2010. The ZAR strengthened in the second half of 2010 and after trading at an average exchange rate of US$1 = R7.32 during the year it closed at US$1 = R6.62 on December 31, 2010. The ZAR showed some weakness against the US$ in early 2011 but recovered again to levels below US$1 = ZAR7 against the USD by end of February 2011.The US$ and $ traded at an average of US$1 = $1.03 during the year with a strengthening in the $ to US$1 = $0.97 in early 2011.
| 7. | Selected Annual and Quarterly Information |
In thousands of Canadian dollars, except per-share figures and number of shares. Small differences arise from rounding.
| As at and for the years ended | |||
| December 31 2010 | December 31 2009 | December 31 2008 | |
| Current assets | $ 41,918 | $ 126,8622 | $ 53,6062 |
| Mineral properties | 245,650 | 222,919 | 259,859 |
| Other assets | 530,475 | 198,5032 | 51,7352 |
| Total assets | 818,043 | 548,284 | 365,200 |
| Current liabilities | 115,526 | 72,974 | 27,446 |
| Future income taxes and other liabilities | 193,080 | 101,597 | 80,546 |
| Shareholders’ equity | 509,437 | 373,713 | 257,208 |
| Total liabilities and shareholders’ equity | 818,043 | 548,284 | 365,200 |
| Working capital1(deficit) | $ (21,097) | $ 91,624 | $ 20,460 |
| Revenue | 99,706 | 33,738 | 24,716 |
| Expenses | (128,796) | (87,716) | (141,533) |
| Loss for the year | $ (28,912) | $ (48,446) | $ (84,872) |
| Basic loss per share | $ (0.08) | $ (0.16) | $ (0.40) |
| Weighted average number of common shares outstanding | |||
| (thousands) | 358,711 | 310,068 | 211,283 |
31
| |
| MANAGEMENT'S DISCUSSION AND ANALYSIS |
| YEAR ENDED DECEMBER 31, 2010 |
| Dec 31 2010 | Sept 30 2010 | Jun 30 2010 | Mar 31 2010 | Dec 31 2009 | Sept 30 2009 | Jun 30 2009 | Mar 31 2009 | |
| Current assets | 41,918 | 60,102 | 84,904 | 92,6132 | 126,8622 | 78,8542 | 131,5452 | 168,9372 |
| Mineral properties | 245,650 | 246,798 | 244,998 | 223,864 | 222,919 | 254,648 | 257,247 | 257,639 |
| Other assets | 530,475 | 435,012 | 333,284 | 240,8882 | 198,5032 | 157,3452 | 123,5922 | 71,8842 |
| Total assets | 818,043 | 741,912 | 663,186 | 557,365 | 548,284 | 490,847 | 512,384 | 498,460 |
| Current liabilities | 115,526 | 87,352 | 89,467 | 60,295 | 72,974 | 27,324 | 25,369 | 18,881 |
| Future income taxes | 193,080 | 236,085 | 189,946 | 133,071 | 101,597 | 86,527 | 90,570 | 82,844 |
| and other liabilities | ||||||||
| Shareholders’ equity | 509,437 | 418,475 | 386,773 | 363,999 | 373,713 | 376,996 | 396,445 | 396,735 |
| Total liabilities and | ||||||||
| shareholders’ equity | 818,043 | 741,912 | 663,186 | 557,365 | 548,284 | 490,847 | 512,384 | 498,460 |
| Working (deficit) | ||||||||
| capital1 | (21,097) | (19,821) | 15,400 | 48,987 | 91,624 | 47,7282 | 98,5912 | 145,1372 |
| Revenue | 42,714 | 12,230 | 37,940 | 6,822 | - | - | 21,876 | 11,861 |
| Expenses | (36,171) | (35,951) | (43,340) | (13,334) | (8,365) | (16,382) | (35,492) | (21,944) |
| Profit (loss) for the | ||||||||
| period | 6,721 | (23,721) | (5,400) | (6,512) | (8,365) | (16,382) | (13,616) | (10,083) |
| Basic earnings (loss) | ||||||||
| per share | $0.02 | ($0.07) | ($0.02) | ($0.02) | ($0.03) | ($0.05) | ($0.04) | ($0.04) |
| Weighted average | ||||||||
| number of common | ||||||||
| shares outstanding | ||||||||
| (thousands) | 405,857 | 351,739 | 340,609 | 336,983 | 333,856 | 333,531 | 333,215 | 238,364 |
1Working capital includes cash and cash receivables, accounts receivable, inventory and accounts payable and is considered a non-GAAP measure.
2Certain prior historical amounts have been reclassified to conform to fiscal 2010 and 2009 year presentation. These reclassifications had no impact on previously reported results of operations or shareholders' equity.
The Company’s loss per share has generally been decreasing on a quarterly basis from $0.05 to earnings of $0.02 per quarter in Q4 2010. The third quarter 2010 loss was burdened by some unusual items including an unrealized mark-to-mark hedge loss ($7.3 million), revenue and cost adjustments due to final toll milling reconciliations and an ore stockpile adjustment (together $7.1 million) but, excluding these items, the per share loss would have been $0.03. The generally decreasing losses are attributable to the increased gold sale proceeds from trial mining at Hollister, which benefited from higher gold prices and increased production. The Company also has an aggressive cost management project aimed at reducing the costs of the trial mining, as well as exploration and general corporate expenses. Pre-development expenditures at Hollister have been decreasing in line with the optimized mine designs and stoping techniques. All development costs relating to Burnstone have been capitalized in 2009 and 2010.
| 8. | Off-Balance Sheet Arrangements |
(a) Financial guarantee
BEE legislation in South Africa requires a target of 26% ownership in the Company’s South African projects by historically disadvantaged South Africans by 2014. In order to comply with this legislation, Tranter Burnstone (Pty) Ltd. (“Tranter”), a BEE company, acquired 19,938,650 treasury common shares for $38 million in 2007, which was deemed equivalent to the 26% underlying value of Burnstone. Tranter borrowed the funds from Investec Bank Ltd (“Investec”), a South African bank, to purchase the shares and Great Basin gave a loan guarantee in favour of Tranter initially limited to ZAR80 ($12 million) million.
Subsequently the Company, through Southgold agreed with Investec to increase the guarantee to ZAR140 million ($21 million) to cover any shortfall in interest or principal repayments on the loan outstanding by Tranter to Investec. This revised agreement required Southgold to increase the balance in the security call deposit to $12 million (ZAR80 million) and allowed for these funds to be utilized towards any advances required to be made to Tranter under the guarantee agreement. A loan of $13 million (ZAR 88 million) was advanced to Tranter in October 2010 under the guarantee agreement to enable Tranter to meet its interest payment obligation to Investec. The amount set aside in the security call deposit was used to partially fulfill this obligation.
32
| |
| MANAGEMENT'S DISCUSSION AND ANALYSIS |
| YEAR ENDED DECEMBER 31, 2010 |
As a result of this loan the remaining Tranter guarantee is now reduced to $6.9 million (ZAR52 million). Any advances to Tranter under this guarantee are due to be repaid by Tranter in installments from 2014 to 2017, with interest accruing at the South African prime interest rate plus 2%. Security for any advances made pursuant to this guarantee includes a second charge against any shares of the Company held by Tranter (second to Investec).
The fair value of the guarantee is determined by reference to the Company’s exposure to potential future losses under the guarantee. The probability of future losses under the guarantee agreement, and therefore the fair value of the guarantee, is dependent on the estimated fair value of the security granted by Tranter on grant date of the guarantee. Future assessments are not required unless a change to the contractual relationship results in a change in fair value.
(b) Hedging program
In connection with the term facility agreement entered into in 2010, the Company executed a ZCC hedging program for a total of 105,000 gold ounces over a period of three years.
As of January 1, 2011, the Company is required to deliver 1,250 gold ounces per month over a twelve month period. The remaining 90,000 gold ounces will be delivered in 24 equal monthly deliveries of 3,750 gold ounces, starting January 1, 2012. The program includes put options priced at US$850 and call options priced at US$1,705 per Au eqv oz.
The fair value on inception and subsequent mark-to-market movements were calculated using an option pricing model with inputs based on the following assumptions:
| August 13 2010 | December 31 2010 | |
| Gold price (per ounce) Risk free interest rate Expected life Gold price volatility | US$1,216 0.58% - 1.04% 5 – 40 months 21.9% - 27.8% | US$1,419 0.25% - 1.34% 1 - 36 months 17.3% - 27% |
| 9. | Contractual obligations |
| Payments due by period (CAD millions) | ||||
| Total (million) | Less than one year (million) | 1 to 5 years (million) | More than 5 years (million) | |
| Exploration commitment Environmental commitment Senior secured notes Convertible debentures Term facility agreement Finance lease liability Operating lease obligations | $ 1.7 1.0 55.4 166.5 80.0 8.2 0.4 | $ Nil 0.2 55.4 10.1 10.4 7.8 0.2 | $ 1.7 0.4 Nil 156.4 69.6 0.4 0.2 | $ Nil 0.4 Nil Nil Nil Nil Nil |
| Total | $ 313.2 | $ 84.1 | $ 228.7 | $ 0.4 |
Senior secured notes
41,575 Notes remain outstanding on December 31, 2010. These Notes bear interest at 14% per annum and are repayable on or before December 12, 2011. The Notes are guaranteed on a joint and several basis by all of the Company’s Nevada subsidiaries and secured by their assets. These notes will be settled on March 15, 2011 with the proceeds from the new Term finance loan from Credit Suisse. The Term loan will be repayable over 4 years.
33
| |
| MANAGEMENT'S DISCUSSION AND ANALYSIS |
| YEAR ENDED DECEMBER 31, 2010 |
Convertible debentures
The Debentures mature on November 30, 2014 and bear interest at the rate of 8% per annum. Interest is payable semi-annually in arrears on May 30 and November 30 of each year. The Debentures are direct senior unsecured obligations of the Company and are guaranteed by certain of the Company’s subsidiaries.
Term facility agreement
The $74 million (US$72 million) term facility agreement (“the facility”) has a maximum term of 4 years from date of draw down and will be repaid in 13 quarterly consecutive installments, commencing on May 26, 2011, 12 months after the draw down. The facility bears interest at a margin of 4% over the US LIBOR rate. The Company has the option to retire the loan 12 months after draw down at no additional cost. The Burnstone project and certain subsidiary guarantees serve as security for the facility.
Finance lease liability
The principal debt amounts will be repaid in equal monthly installments over a period of 12 to 13 months and bear interest at rates between 6.5% and 22.4% on outstanding capital. The finance leases are collateralized by the leased assets which had a carrying value of $9 million at December 31, 2010.
| 10. | Transactions with Related Parties |
Related party transactions are recorded at the exchange amount which is the amount of consideration paid or received as agreed to by the parties. On October 1, 2010 the Company advanced $13 million (ZAR88 million) on a loan to Tranter in terms of the guarantee agreement, with the proceeds to be used by Tranter to settle its obligations due under its agreement with Investec. The funds disclosed as restricted cash on the Consolidated Balance sheet for September 30, 2010 were applied to this loan, with the Company advancing the shortfall of $1 million (refer section 8). There were no other material related party transactions during the quarter.
Information relating to the Company’s related party transactions is available in the Company’s annual financial statements which are available on SEDAR atwww.sedar.com.
| 11. | Critical Accounting Estimates |
The Company's accounting policies are presented in note 3 of the most recent annual consolidated financial statements and a description of changes in accounting policies is set out in section 13 of this document.
The preparation of consolidated financial statements in accordance with generally accepted accounting principles requires management to select accounting policies and make estimates. Such estimates may have a significant impact on the financial statements.
These estimates include:
mineral resources and reserves
the carrying value of mineral properties,
the allocation of purchase price consideration to the fair value of identifiable assets and liabilities acquired,
34
| |
| MANAGEMENT'S DISCUSSION AND ANALYSIS |
| YEAR ENDED DECEMBER 31, 2010 |
the carrying values of property, plant and equipment,
the determination of amortization, depletion and accretion,
the valuation of inventories,
the valuation of stock-based compensation expense,
the estimation of asset retirement obligations,
the valuation of warrants and derivatives,
the determination of valuation allowance for future income taxes,
the determination of fair values of financial instruments,
the estimated market related interest rate used to calculate the equity component of compound financial instruments, and
the allocation of indirect mining and overhead expenses to production and development costs.
Actual amounts could differ from the estimates used and, accordingly, affect the results of operations.
Mineral resources and reserves, the carrying values of mineral properties, and of property, plant and equipment as well as the allocation of purchase price consideration to the fair value of identifiable assets and liabilities acquired and determination of amortization and depletion.
Mineral resources and reserves are estimated by professional geologists and engineers in accordance with recognized industry, professional and regulatory standards. These estimates require inputs such as future metal prices, future operating costs, and various technical geological, engineering, and construction parameters. Changes in any of these inputs could cause a significant change in the estimated resources and reserves, which in turn could have a material effect on the carrying value of property, plant and equipment.
The carrying value of mineral properties is also dependant on the valuation used for the common shares and warrants of the Company issued for the acquisition of mineral properties.
The value of the common shares issued is the fair market value, based on the trading price of the shares at the agreement and announcement date, pursuant to the terms of the relevant agreement. The Company uses the Black-Scholes pricing model to estimate a value for the warrants issued upon the acquisition of a property. This model, and other models which are used to value options and warrants, require inputs such as expected volatility, expected life to exercise, and interest rates. Changes in any of these inputs could cause a significant change in the carrying value initially recorded for mineral properties.
The carrying value of property, plant and equipment are considered in terms of the remaining useful life of the particular asset. These estimates are prepared by engineers in accordance with their knowledge and experience in the mining industry. Re-assessment of the remaining useful life could cause a significant change in the carrying value initially recorded for property, plant and equipment.
Inventories and the allocation of indirect mining and overhead expenses to production and development costs.
Inventories are measured at the lower of cost or net realizable value. Net realizable value is the estimated selling price in the ordinary course of business less the estimated cost of completion and the estimated cost necessary to perform the sale. Production costs include allocated overhead expenses and constitute the cost of an inventory item. The determination of estimated selling prices, estimated completion and selling costs, and cost allocations are done by management in accordance with their knowledge and experience in the mining industry. Changes in any of these factors could cause a significant change in the inventory valuation in a period.
35
| |
| MANAGEMENT'S DISCUSSION AND ANALYSIS |
| YEAR ENDED DECEMBER 31, 2010 |
Site reclamation costs (asset retirement obligations) and the determination of accretion
Upon the completion of any mining activities, the Company will ordinarily be required to undertake environmental reclamation activities in accordance with local and/or industry standards. The estimated costs of these reclamation activities are dependent on labour costs, the environmental impact of the Company's operations, the effectiveness of the chosen reclamation techniques, and applicable government environmental standards. Changes in any of these factors could cause a significant change in the reclamation expense and accretion charged in a period.
Stock-based compensation expense
From time to time, the Company grants share purchase options to directors, employees, and service providers. The Company uses the Black-Scholes option pricing model to estimate a value for these options. This model, and other models which are used to value options, require inputs such as expected volatility, expected life to exercise, and interest rates. Changes in any of these inputs could cause a significant change in the stock-based compensation expense charged in a period.
Warrants
The Company from time to time may grant share purchase warrants as part of its capital raising and under the conclusion of business transactions. The Company uses the Black-Scholes option pricing model to estimate a value for these warrants. This model, and other models which are used to value the warrants, require inputs such as expected volatility, expected life to exercise, and interest rates. Changes in any of these inputs could cause a significant change in the fair value attributed to warrants issued in a period.
Future income taxes
Future income tax assets and liabilities are computed based on differences between the carrying amount of existing assets and liabilities on the balance sheet and their corresponding tax values, using the substantively enacted income tax rates expected to apply to taxable income in the years in which those temporary differences are expected to be recovered or settled. Future income tax assets also result from unused loss carry forwards and other deductions. Future tax assets are recognized to the extent that they are considered more likely than not to be realized. The carrying value of future income tax assets is adjusted, if necessary, by the use of a valuation allowance to reflect the estimated realizable amount.
Financial instruments
If the value for a financial instrument cannot be obtained from an active market, the Company establishes fair value by using valuation techniques. These include the use of recent arm’s length transactions, reference to other instruments that are substantially the same, discounted cash flow analysis, estimated market related interest rates, and option pricing models refined to reflect the issuer’s specific circumstances. Changes in any of these inputs could cause a significant change in the fair value of the financial instruments in a period.
| 12. | Adoption of new Accounting Policies |
Accounting standard updates issued by the Canadian Institute of Chartered Accountants (“CICA”) which are effective for 2010 are considered to be not applicable to the Company, nor will it have any impact on the Company’s consolidated financial statements.
| 13. | New accounting pronouncements |
The Company converted to International Financial Reporting Standards (“IFRS”) effective January 1, 2011 and amendments to standards issued by the Canadian Institute of Chartered Accountants (“CICA”) would therefore not affect the financial disclosures and results of operations of the Company for interim and annual periods beginning January 1, 2011.
36
| |
| MANAGEMENT'S DISCUSSION AND ANALYSIS |
| YEAR ENDED DECEMBER 31, 2010 |
| 14. | Financial Instruments |
The Company’s investment in Kryso Resources Plc (“Kryso”) shares and warrants, were respectively classified as available-for-sale and held-for-trading financial instruments. These instruments were carried at fair value. Unrealized gains and losses from changes in the fair value of available-for-sale financial instruments were recognized in the statement of operations and comprehensive loss under “other comprehensive loss”, whilst fair value changes on held-for-trading financial instruments were recognized in the statement of operations and comprehensive loss.
The Company disposed of its entire investment in Kryso during June 2010 for net proceeds of $3.5 million (GBP2.2 million). At disposal date the carrying value of the investment was $5.6 million (GBP3.6 million), which was calculated based on the closing price of GBP15.15 pence per share and an exchange rate of $1.55:1GBP.
The Company reversed unrealized fair value gains of $2.6 million (GBP1.7 million) and $1.1 million foreign exchange losses from other comprehensive income to current loss, resulting in a net realized gain of $0.5 million (GBP0.3 million) and $1.1 million foreign exchange loss being recorded in current loss. The Company’s investment in Kryso warrants was disposed for net proceeds of $0.1 million (GBP0.07 million), resulting in a net loss of $0.07 million (GBP0.04 million) recognized in current loss. The warrants were carried at fair value.
Refer to section 8 above for information relating to the fair value of financial guarantees and hedge structures and note 22 of the financial statements for a summary of the Company’s remaining financial assets and liabilities.
| 15. | Other |
Additional information relating to the Company, including the Company's Annual Information Form, is available on SEDAR atwww.sedar.com.
| 15.1 | International financial reporting standards (“IFRS”) |
The Company has converted its accounting framework to International Financial Reporting Standards (“IFRS”) on January 1, 2011.
The Company’s IFRS conversion project began during 2009. A formal project plan, governance structure and a project team, including an external advisor, were established. The project philosophy was to align with current accounting practices and to minimize, where possible, the impact of any changes to the business. Regular reporting was provided to senior management and the Audit Committee of the Board of Directors.
The IFRS conversion project consisted of four phases: diagnostic; design and planning; implementation; and post implementation. The major variances identified and adjusted include the valuation of compound financial instruments, accounting for property, plant and equipment, the effects of changes in foreign currency exchange rates and alternatives available under IFRS 1 – First Time Adoption of IFRS. The conversion to IFRS has had a relatively low impact on the financial record keeping, internal control and financial disclosure of the Company due to the historical exploration and project development nature of the Company’s business. Accounting systems have been assessed and re-configured to ensure accurate reporting under IFRS, both internally and externally. The Company’s key financial staff has been trained in IFRS and the majority of them have been exposed to reporting under IFRS for five years or more. The adoption of IFRS principles has not had a material effect on the manner in which the Company reports its accounts.
37
| |
| MANAGEMENT'S DISCUSSION AND ANALYSIS |
| YEAR ENDED DECEMBER 31, 2010 |
| 15.2 | Disclosure of Outstanding Share Data |
The following details the share capital structure as at March 14, 2011. These figures may be subject to minor accounting adjustments prior to presentation in future consolidated financial statements.
| Share Capital Structure | ||||
Equity type | Expiry date | Exercise price | Number granted (thousands) | Total (thousands) |
| Common shares | 452,183 | |||
| Share purchase options | March 31, 2011 April 30, 2011 May 21, 2011 August 18, 2011 October 30, 2011 December 11, 2011 February 11, 2012 April 18, 2012 July 15, 2012 October 9, 2012 February 10, 2013 March 26, 2013 April 10, 2013 August 3, 2013 November 9, 2013 December 11, 2013 January 14, 2014 March 11, 2014 February 11, 2014 April 12, 2014 July 15, 2014 March 26, 2015 March 11, 2016 | $3.57 $2.45 $3.47 $2.78 $1.50 $1.25 $1.75 $2.68 $1.49 $1.65 $1.78 $1.74 $3.60 $1.81 $2.96 $1.25 $1.35 $2.46 $1.75 $1.49 $1.49 $1.74 $2.46 | 90 450 150 220 114 1,607 1,650 90 333 295 660 2,461 110 1,107 450 255 825 5,580 690 2,380 100 1,500 1,475 | 22,592 |
| Warrants | December 12, 2011 | $1.25 | 21,068 | 21,068 |
| Convertible debentures | November 30, 2014 | $2.15 | 58,837 | 58,837 |
| Fully diluted shares | 554,680 | |||
| 15.3 | Non GAAP measures |
The Company makes reference to certain non-GAAP measures in its reporting and believes that these measures, in addition to conventional measures prepared in accordance with GAAP, are used by certain investors to evaluate the Company’s performance and ability to generate cash flow. Accordingly, these measures are intended to provide additional information and should not be considered in isolation or as a substitute for measures of performance prepared in accordance with GAAP.
Cash production cost
The Company reports cash cost of ounces sold. In the gold mining industry, this is a common performance measure but does not have any standardized meaning. Cash production cost includes direct development, mining, royalties and processing costs incurred in the recovery of and disposal of Au and Ag as well as allocated overhead charges.
The reconciliation of production cost to cash production cost is presented below:
38
| |
| MANAGEMENT'S DISCUSSION AND ANALYSIS |
| YEAR ENDED DECEMBER 31, 2010 |
| 3 months ended | 12 months ended | |||
| December 31, 2010 ($’000) | December 31, 2009 ($’000) | December 31, 2010 ($’000) | December 31, 2009 ($’000) | |
| Production cost relating to metal produced by the Nevada operations Less amortization and non-cash overhead costs included in production cost. | $ 23,858 (1,853) | - - | $ 47,483 (964) | - - |
| Total cash production costs for theperiod | $22,005 | - | $ 46,519 | - |
| Gold equivalent ounces sold Ore tons milled related to ounces sold Cash production cost per Au eqv oz sold Cash production cost per ton sold | 31,911 39,087 $690 $563 | - - - - | 62,604 79,010 $743 $589 | - - - - |
Adjusted loss per share
Adjusted loss per share is used by the Company to compare quarterly and annual results on a sustaining basis by eliminating certain fair value adjustments and out of the ordinary expenses incurred. The reconciliation of loss per share to adjusted loss per share is presented below :
| 3 months ended | 12 months ended | |||
| December 31, 2010 ($’000) | December 31, 2009 ($’000) | December 31, 2010 ($’000) | December 31, 2009 ($’000) | |
| Profit (loss) for the period Net unrealized loss on held-for-trading financial instruments Net unrealized market-to-market adjustment on held-for-trading financial instruments | $ 6,721 - 3,161 | ($8,365) - - | ($28,912) 3,606 6,860 | ($48,446) - - |
| Adjusted profit (loss) for the period | $9,882 | ($8,365) | ($18,446) | ($48,446) |
| Weighted average number of common shares outstanding (‘000) Adjusted earnings (loss) per share | 405,857 $0.02 | 333,856 ($0.03) | 358,711 ($0.05) | 310,068 ($0.16) |
| 15.4 | Reconciliation of Use of Proceeds from March 2009 Offering |
In March 2009, the Company undertook an offering of $149.5 million (including a 15% over-allotment option) of units consisting of one common share and one-half of one common share purchase warrant with net proceeds (after deducting underwriters’ fees and expenses) of $139 million. The following table sets out a comparison of how the Company used the proceeds during the 11 month period following the closing date in March 2009, an explanation of variances and the impact of variances on the ability of the Company to achieve its business objectives and milestones.
39
| |
| MANAGEMENT'S DISCUSSION AND ANALYSIS |
| YEAR ENDED DECEMBER 31, 2010 |
| Intended Use of proceeds of March 2009 Offering CAD$ | Actual Use of Proceeds from March 2009 Offering and Explanation of Variance and impact on business objectives | (Over)/under expenditure | ||
| Offering expenses | $1.6 million | Offering expenses | $1.6 million | N/A |
| Underwriting fee | $8.9 million | Underwriting fee | $8.9 million | N/A |
| Burnstone Property Mine development, surface development and engineering | $ 28 million | Mine development | $36 million | ($8 million) |
| Mining equipment | $ 23 million | Mining equipment | $ 9 million | $14 million |
| Vertical shaft | $ 26 million | Vertical shaft | $27 million | ($1 million) |
| Metallurgical plant | $ 26 million | Metallurgical plant | $19 million | $7 million |
| Production costs | $13 million | Production costs | $18 million | ($5 million) |
| Corporate overhead cost (assumes approximately $1 million spent per month) | $4.5 million | Corporate overhead cost | $15 million | ($10.5 million) |
| General working capital (over- allotment proceeds were not allocated) | $18.5 million | Exploration General working capital | $9 million $9.5 million | N/A |
| Total | $149.5 million | Total | $153 million | ($3.5 million) |
Explanation of variances and the impact of variances on the ability of the Company to achieve its business objectives and milestones | Cost increases resulted from delays, exchange rates, price inflation and some construction inefficiencies due to fast tracking. Planned mine development rates were negatively influenced by the interruptions caused by the lack of permanent power supply, excessive water that had to be handled through temporary infrastructure and the cost of recruitment of skilled labour from the local community. The slower than anticipated rate of mine development had a negative impact on pre-production costs and also postponed the procurement of mining equipment. The net result of these variances was a 7 month delay in reaching commencement of production (originally estimated to commence by June 30, 2010) and a shortfall in the funds needed to complete the planned mine development, requiring the Company to undertake the bought deal public offering in February 2011. | |||
| 15.5 | Reconciliation of Use of Proceeds from November 2009 Offering |
In November 2009, the Company undertook an offering of $126.5 million principal amount of senior unsecured convertible debentures (including over-allotment option) when it became evident that the planned project finance facility would not be available in time. The following table sets out a comparison of how the Company used the net proceeds (after deducting underwriters’ fees and expenses) of $121 million during the four and a half month period following the closing date in November 2009, an explanation of variances and the impact of variances on the ability of the Company to achieve its business objectives and milestones.
40
| |
| MANAGEMENT'S DISCUSSION AND ANALYSIS |
| YEAR ENDED DECEMBER 31, 2010 |
| Intended Use of proceeds of November 2009 Offering CAD$ | Actual Use of Proceeds from November 2009 Offering and Explanation of Variance and impact on business objectives | (Over)/under expenditure | ||
| Offering expenses | $ 0.4 million | Offering expenses | $ 0.4 million | N/A |
| Underwriting fee | $ 5.1 million | Underwriting fee | $ 5.1 million | N/A |
| Repayment of project finance credit facility | $ 32 million | Repayment of project finance credit facility | $ 32.8 million | ($ 0.8 million) |
Development of Burnstone Property to commence commercial production | $ 89 million | Development of Burnstone property to commence commercial production | $ 91 million | ($ 2 million) |
| Total | Total | $ 129.3 million | ($ 2.8 million) | |
Explanation of variances and the impact of variances on the ability of the Company to achieve its business objectives and milestones. | Capital cost increases resulted because the detail design phase on major capital components such as the metallurgical plant, vertical shaft and power reticulation was ongoing right up until construction commenced on these components and in certain instances integration design of components could only be completed while construction was in progress. The fact that design work was not completed well in advance of construction resulted in some inefficiencies and the need to revise work already completed. This resulted in capital cost increases over the capital estimates included in the 2009 technical reports. The preferred LHS mining method has also resulted in an increase in the mining equipment required to support the planned development and production rates. The increase in capital costs was manageable because the Company augmented the proceeds of the November 2009 offering with a US$72 million loan facility from Credit Suisse AG and also applied the majority of the proceeds from the exercise of the warrants issued with the March 2009 offering towards completion of the capital projects at Burnstone to enable production to commence by January 2011. | |||
| 15.6 | Disclosure Controls and Procedures |
The Chief Executive Officer (“CEO”) and Chief Financial Officer (“CFO”) are responsible for establishing and maintaining adequate disclosure controls and procedures. Disclosure controls and procedures are designed to ensure that information required to be disclosed in the Company’s filings under securities legislation is accumulated and communicated to management, including the CEO and CFO as appropriate, to allow timely decisions regarding public disclosure. They are designed to provide reasonable assurance that all information required to be disclosed in these filings is recorded, processed, summarized and reported within the time periods specified in securities legislation. The Company evaluates its disclosure controls and procedures annually.
Under the supervision of our CEO and CFO, management conducted an evaluation of the effectiveness of our disclosure controls and procedures as at December 31, 2010. Based on this evaluation, our Chief Executive Officer and the Chief Financial Officer have concluded that, as at December 31, 2010, our disclosure controls and procedures were effective to provide reasonable assurance that information required to be disclosed by us in our annual filings, interim filings or other reports that we file or submit under applicable securities legislation is recorded, processed, summarized and reported within the time periods specified in such legislation and that these controls and procedures also provide reasonable assurance that material information relating to us is made known to our CEO and CFO by others.
41
| |
| MANAGEMENT'S DISCUSSION AND ANALYSIS |
| YEAR ENDED DECEMBER 31, 2010 |
It should be noted that while our officers believe that our disclosure controls and procedures provide a reasonable level of assurance with regard to their effectiveness, they do not expect that the disclosure controls and procedures or internal controls over financial reporting will prevent all errors and fraud. A control system, no matter how well conceived or operated, can only provide reasonable, but not absolute, assurance that the objectives of the control system are met.
| 15.7 | Internal Control over Financial Reporting |
Management is responsible for establishing and maintaining adequate internal control over financial reporting to provide reasonable assurance regarding the reliability of financial reporting and the preparation of financial statements for external purposes in accordance with GAAP. Internal control over financial reporting includes those policies and procedures that: (1) pertain to the maintenance of records that in reasonable detail accurately and fairly reflect the transactions and dispositions of the assets of the Company, (2) provide reasonable assurance that transactions are recorded as necessary to permit preparation of financial statements in accordance with GAAP, and that receipts and expenditures of the Company are being made only in accordance with authorizations of management and directors of the Company, and (3) provide reasonable assurance regarding prevention or timely detection of unauthorized acquisition, use or disposition of the Company’s assets that could have a material effect on the financial statements.
Under the supervision of our CEO and our CFO, management conducted an evaluation of the effectiveness of our internal control over financial reporting as at December 31, 2010 based on the framework and criteria established in Internal Control – Integrated Framework, issued by the Committee of Sponsoring Organizations of the Treadway Commission. Based on this evaluation, our Chief Executive Officer and our Chief Financial Officer concluded that our internal control over financial reporting was effective as of December 31, 2010 to provide reasonable assurance regarding the reliability of financial reporting and the preparation of financial statements in accordance with GAAP.
During the year the Company has designed and implemented relevant internal controls in response to the Company’s transition from developer to producer with further internal controls to be implemented during 2011 in response to the Burnstone production build-up. These include new internal controls addressing revenue recognition, inventory and production costs, depletion, depreciation and development costs incurred following commencement of commercial production. The implementation of these internal controls over financial reporting will have a material impact and are reasonably likely to affect our internal control over financial reporting.
42