 | MANAGEMENT'S DISCUSSION AND ANALYSIS | |
| QUARTER ENDED SEPTEMBER 30, 2011 |
| Cautionary Note regarding Forward Looking Statements |
This discussion includes certain statements that may be deemed "forward-looking statements" and information.These forward-looking statements constitute "forward-looking statements" within the meaning of Section 27A of theSecurities Act of 1933andSection 21E of theSecurities Exchange Act of 1934.All statements in this discussion, other than statements of historical facts, that address future production, reserve potential, exploration drilling, exploitation activities and events or developments that the Company expects to take place in the future are forward-looking statements and information. Although the Company believes the expectations expressed in such forward-looking statements and information are based on reasonable assumptions, such statements are not guarantees of future performance and actual results or developments may differ materially from those in the forward-looking statements and information. Factors that could cause actual results to differ materially from those in forward- looking statements include market prices, exploitation and exploration successes, drilling and development results, continued availability of capital and financing and general economic, market or business conditions. |
| Cautionary Note regarding Non-GAAP Measurements |
Cash production cost per ounce/tonne is a not a generally accepted accounting principles ("GAAP") based figure but rather is intended to serve as a performance measure providing some indication of the mining and processing efficiency and effectiveness. It is determined by dividing the relevant mining and processing costs including royalties by the ounces produced/tonnes processed in the period. There may be some variation in the method of computation of "cash production cost per ounce/tonne" as determined by the Company compared with other mining companies. Cash production costs per ounce/tonne may vary from one period to another due to operating efficiencies, waste to ore ratios, grade of ore processed and gold recovery rates in the period. We provide this measure to our investors to allow them to also monitor operational efficiencies. As a Non-GAAP Financial Measure cash production costs should not be considered in isolation or as a substitute for measures of performance prepared in accordance with GAAP. Adjusted loss per share is also a Non-GAAP measure and is calculated by excluding the impact of certain fair-value accounting charges and other non-operating charges. There is material limitations associated with the use of such Non-GAAP measures. |
1
| | MANAGEMENT'S DISCUSSION AND ANALYSIS | |
| QUARTER ENDED SEPTEMBER 30, 2011 |
Great Basin Gold Ltd (“the Company” or “Great Basin”) is a mineral exploration and development company that is currently focused on delivering two advanced stage projects: theHollister Project (“Hollister”)on the Carlin Trend in Nevada, USA and theBurnstone Project (“Burnstone”) in the Witwatersrand Goldfields in South Africa. The Company, currently recognized as an emerging producer, will migrate to the rank of a junior gold producer as production from these two projects increases during 2011 and 2012. Over and above the exploration being conducted at the above mentioned properties, greenfields exploration is being undertaken in Tanzania and Mozambique.
This Management’s Discussion and Analysis ("MD&A") should be read in conjunction with the interim financial statements of Great Basin for the three and nine months ended September 30, 2011 and the annual financial statements for the year ended December 31, 2010 which are available through the internet on SEDAR at www.sedar.com. All dollar amounts herein are expressed in Canadian Dollars unless stated otherwise. This MD&A is prepared as of November 15, 2011.
1. Executive summary
Highlights for the quarter (compared to Q2 2011) included :
- 5% increase in ore tonnes from Hollister trial mining activities
- 34% increase in tonnes processed at Esmeralda mill.
- 80% improvement in meters of mechanized ore development at Burnstone.
- Optimized stope lay-out at Burnstone to reduce required development over life-of-mine.
- 45% increase in square meters stoped at Burnstone.
- 33% increase in Au recovered at Burnstone.
| 3 months ended | 9 months ended | ||||
| September 30 2011 | June 30 2011 | September 30 2010 | September 30 2011 | September 30 2010 | |
| Recovered Au eqv oz | 32,531 | 31,651 | 16,938 | 93,775 | 72,896 |
| Au eqv oz sold | 29,308 | 40,141 | 11,005 | 89,567 | 56,489 |
| Realized Au eqv price | $1,593 | $1,413 | $1,111 | $1,449 | $1,009 |
| Cash production cost per Au eqv oz sold | $1,005 | $728 | $854 | $811 | $799 |
| Gross cash operating margin | 37% | 49% | 23% | 44% | 21% |
| Revenue ($’000) | $46,673 | $56,738 | $12,230 | $129,754 | $56,992 |
| (Loss)/profit from operating activities ($’000) | ($8,588) | $6,278 | ($16,380) | ($3,137) | ($28,791) |
| Adjusted (loss)/earnings per share | ($0.03) | $0.00 | ($0.05) | ($0.04) | ($0.08) |
2
| | MANAGEMENT'S DISCUSSION AND ANALYSIS | |
| QUARTER ENDED SEPTEMBER 30, 2011 |
Hollister
The Nevada operations produced 26,045 Au eqv ounces from trial mining activities during the quarter (Q2 2011: 26,757 Au eqv ounces). During the quarter, ore tonnes mined from the Hollister project increased 5% to 26,474 (Q2 2011: 25,297 tonnes) and tonnes processed at the Esmeralda mill increased by 34% from 22,237 to 29,869. The contained grade of 0.9 Au eqv oz/t was lower than the 1.35 Au eqv oz/t reported for the previous quarter, and remains in-line with the reserve grade of the Hollister ore body. Notwithstanding the significant increase in tonnes processed during the quarter, gold and silver recoveries at the Esmeralda mill remained within the targeted levels at 92% Au and 74% Ag, respectively. The installation of the acid wash and carbon regeneration system at the Esmeralda Mill was completed during October 2011 and doré is being poured on site since the end of October 2011. Only 22,790 Au eqv ounces were sold during the quarter (Q2 2011: 34,522 Au eqv ounces) with 6,850 Au eqv ounces remaining at the refiner that will be sold and the revenue recognized in Q4 2011.
Primary waste development was again focused on the Blanket Zone (“BZ”) spiral ramp, the BZ Alimak raise, and the 5400 BZ I-Drift. During the quarter, the BZ Ramp achieved 1,136 feet (344 meters) of advance; 204 feet (62 meters) of development remained at quarter end to complete the ramp. The 5400 I-drift, which originates from the BZ Alimak raise, was advanced 169 feet (51 meters) to the east during the quarter, with 161 feet (49 meters) remaining to reach the +1 opt Au grade shells modelled from surface and underground drilling for the 3000N 1W area.
Cash production costs of $639 Au eqv oz was recorded for the quarter, a marginal increase in comparison with Q2 2011 ($611), mainly due to the increase in royalty payments following the higher average metal prices as well as the lower mill head grade for the quarter.
Burnstone
Operational improvements continued at Burnstone, with mechanized ore development increasing by 80% quarter on quarter to 2,786 meters (Q2 2011: 1,550 meters). Ore to waste development ratio also improved, with ore development representing 67% of total development during the quarter (Q2 2011: 45% ore development). Following increased infill and cover drilling to identify geological structures and faulting, improved geological data and refinement of interpretations, waste development reduced by 25% from 1,872 to 1,403 meters during Q3 2011.
Further optimization of the Long Hole Stoping mining method continued during the period with a revised stope lay-out design being implemented. This design increases the square meters available for stoping for each meter of ore developed by 89% from 9 to over 17 square meters. The revised layout, which could allow larger stopes to be mined, is still in its trial phase but positive preliminary results are already evident. This stope design change will have an adverse short term impact as initially fewer stopes will be available for mining as a result of the increase in ore development meters required to open up the larger stopes. However, over the longer term this change could positively impact the ore tonnes mined per meter developed as well as cash costs on a per ton and per ounce basis. Notwithstanding the impact of opening up the larger stopes, the stoping square meters increased by 45% to 7,408 square meters during the quarter (Q2 2011: 5,122 square meters), with stoping widths of between 60 – 80 cm being achieved on a consistent basis. The contained gold grade from stoped material also increased by 39% to 3.57 g/t (Q2 2011: 2.57 g/t). The contained gold grade from development ore also increased by 25% to 0.80 g/t (Q2 2011: 0.64 g/t). Stope block availability is expected to increase steadily during Q4 2011 and the first 6 months of 2012.
________________________________
1 Gold equivalent (“Au eqv”) calculations use US$1,400/oz for Au and US$30/oz for Ag.
3
| | MANAGEMENT'S DISCUSSION AND ANALYSIS | |
| QUARTER ENDED SEPTEMBER 30, 2011 |
The Metallurgical Plant continued to perform in-line with expectations, with 209,224 tonnes processed during the quarter (Q2 2011: 202,660 tonnes). Although the last of the lower grade surface stock pile material was milled during the quarter, plant recoveries improved to 89% (Q2 2011: 85%) mainly due to the higher grades of stope and development tonnes delivered from underground.
Although recovered ounces of gold were below planned levels, the gold recovered increased by 33% quarter on quarter to 6,486 ounces with sales of 6,518 ounces recorded. Cash production costs which came to $2,299 per Au oz and $77 per tonne for the quarter (Q2 2011:$1,447 per Au oz and $59 per tonne), are still impacted by the low average grade of material resulting from the high ratio of development ore to stoping material being processed.
The Company announced an updated mineral resource estimate for Burnstone during the quarter. At a cutoff of 300 cmg/t, the total Measured and Indicated Resources contain approximately12.6 million ounces of gold, and the Inferred Resources contain approximately 10.1 million ounces of gold. At a 300cmg/t cut-off, the current update reflects a slight increase in tonnage (3%) and a slight drop in grade (-6%) when compared to the August 2010 estimate, include the mine’s mineral reserves and have been depleted with production to June 30, 2011 and are stated as of that date. Confidence in our resource estimation continue to improve with 2,050 informing Kimberley Reef intersections utilized for the estimate, a substantial increase from the 610 intersections used in the 2010 estimate.
Corporate
The loss from operating activities was impacted by a $5.1 million foreign exchange movement charge resulting from the strengthening of the US$. Pre-development expenses incurred at the Nevada operations also increased quarter on quarter as a result of the construction of the BZ ramp. Adjusted loss per share for the quarter was $0.03 per share compared to $0.00 per share in Q2 2011. As at September 30, 2011, the Company had approximately $14 million in cash and near cash reserves with 6,850 Au eqv ounces remaining at the refiner that will be converted to cash in Q4 2011. The Company has accepted an offer from Credit Suisse Ag and Standard Chartered Bank to restructure the current Term loan and the previously announced undrawn $40 million standby debt facility into a US$150 million term loan with a 5 year tenure. This facility will not only add an additional US$80 million to the cash resources of the Company but also reduce the debt service obligation in 2012 as capital repayment will only commence in 2013.
Ferdi Dippenaar, Great Basin Gold President and CEO, commented:“The Nevada operations continue to build momentum in delivering improved quarter on quarter operational results as evident from the Q3 2011 performance. At Burnstone, production is increasing but remains behind schedule. Although the initial production build up is important for cash flow purposes, the decision to change the underground stope layouts will impact on the short term availability of mining areas, but is expected to result in a number of positive benefits over the longer term exploitation of the ore body. We believe that our decision to utilize mechanized mining as the preferred mining method at Burnstone was the correct one, with the results starting to support this. The continued improvement in ore development and stoping rates at Burnstone is reassuring, with more improvement expected in the short term to get to the planned production levels.”
4
| | MANAGEMENT'S DISCUSSION AND ANALYSIS | |
| QUARTER ENDED SEPTEMBER 30, 2011 |
2. Results of Operations
Revenue
The table below provides a summary of Au eqv oz sold.
| 3 months ended | 9 months ended | ||||
| September 30 2011 | June 30 2011 | September 30 2010 | September 30 2011 | September 30 2010 | |
| Au eqv oz sold – Nevada operations | 22,790 | 34,522 | 10,845 | 74,636 | 30,693 |
| Au eqv oz sold – Third party milling (Nevada operations) | - | - | 160 | - | 25,796 |
| Au eqv oz sold – South African operations | 6,518 | 5,619 | - | 14,931 | - |
| Total Au eqv oz sold | 29,308 | 40,141 | 11,005 | 89,567 | 56,489 |
Au eqv oz sold for the quarter increased 166% compared to the quarter ended September 30, 2010 and increased 59% for the 9 month period ended September 2011 compared to the same period for 2010. Included in the Au eqv ounces sold by our Nevada operations in Q2 2011 is 6,920 Au eqv ounces recovered in Q1 2011 and delivered to the refiner by March 31, 2011. Adjusting for the delay in recognizing the revenue on these ounces as well as for the increase of 2,816 Au eqv ounces in process from Q2 2011 to Q3 2012 resulted in a net 8% decrease in sales quarter on quarter. Revenue of the Nevada operation for the quarter is also impacted by the lower average contained Au eqv grade of tonnes trial mined.
Au eqv oz sold from our South African operations increased 16% quarter on quarter, but was below the planned 14,000 Au ounces to be sold for the quarter, mainly due to the unavailability of sufficient stopes to meet the targeted ore tonnes.
The $1,593 average Au eqv gold price realized for Q3 2011 was 13% higher than the $1,413 realized in Q2 2011. Included in revenue for the quarter is $4.5 million (YTD $11.8 million) derived from the sale of 134,844 Ag ounces (YTD 361,664 Ag ounces).
Production costs
The following table provides a breakdown of the production costs incurred.
| 3 months ended | 9 months ended | ||||
| September 30 2011 | June 30 2011 | September 30 2010 | September 30 2011 | September 30 2010 | |
| Production costs – Nevada operations ($’000) | $15,070 | $21,602 | $15,540 | $48,362 | $46,033 |
| Production costs – South African operations ($’000) | $15,483 | $8,432 | - | $26,371 | - |
| Total production costs ($’000) | $30,553 | $30,034 | $15,540 | $74,733 | $46,033 |
| Cash production cost per Au eqv oz – Nevada operations | $639 | $611 | $854 | $634 | $799 |
| Cash production cost per Au oz – South African operations | $2,283 | $1,447 | - | $1,699 | - |
Cash production costs for the Nevada operations recorded a marginal increase in comparison with Q2 2011, mainly due to the increase in royalty payments following the higher average metal prices as well as the lower mill head grade for the quarter. Cash production costs per tonne was $603 (Q2 2011: $703) for the quarter, consisting of $400 (Q2 2011: $525) mining and $203 (Q2 2011: $178) milling and haulage. This decrease in cash production cost per tonne of 14% quarter on quarter is predominantly due to increased tonnages processed during the quarter. Cash production costs per Au eqv oz for the 9 months ended September 30, 2011 improved 25% over the comparative period in 2010 as a result of the improved throughput, recoveries and the continued costs management campaign.
5
| | MANAGEMENT'S DISCUSSION AND ANALYSIS | |
| QUARTER ENDED SEPTEMBER 30, 2011 |
Production costs as well as cash production costs for the South African operation which came to $2,283 per Au oz and $77 per tonne for the quarter (Q2 2011:$1,447 per Au oz and $59 per tonne), are still impacted by the low average grade of material processed resulting from the high ratio of development ore to stoping material. Mining cost increased to $55 per tonne (Q2 2011:$40) per tonne with milling costs increasing to $22 per tonne (Q2 2011:$19 per tonne). The consistent increase in the mined tonnes during the quarter reduced the mining cost to $43 per tonne in September, which is within the targeted mining cost during the build-up phase. Milling costs in September also decreased 10% from the average for the quarter but remain higher than planned due to the mill only operating at 50% of capacity based on available ore. The planned increase in the rate of mining is expected to have a positive impact on the mining and milling cost per tonne with the cost per Au oz to improve substantially with the increase in the mill head grade.
Depletion charge
| 3 months ended | 9 months ended | ||||
| September 30 2011 | June 30 2011 | September 30 2010 | September 30 2011 | September 30 2010 | |
| Nevada operations ($’000) | $1,174 | $1,625 | $1,071, | $3,894 | $4,612 |
| South African operations ($’000) | $233 | $231 | - | $503 | - |
| Total ($’000) | $1,407 | $1,856 | $1,071 | $4,397 | $4,612 |
This is a non-cash item and relates to the amortization charge on the Hollister and Burnstone mineral properties.
Depreciation charge
| 3 months ended | 9 months ended | ||||
| September 30 2011 | June 30 2011 | September 30 2010 | September 30 2011 | September 30 2010 | |
| Nevada operations ($’000) | $894 | $1,265 | $609 | $2,880 | $1,845 |
| South African operations ($’000) | $4,136 | $4,719 | - | $9,348 | - |
| Total ($’000) | $5,030 | $5,984 | $609 | $12,228 | $1,845 |
This is a non-cash item and relates to the depreciation charge for the Nevada and South African operations. The increase year on year is due to the commencement of production at the Burnstone operation as well as the increase in trial mining activities at the Nevada operations.
Exploration expenses
The exploration expense for the quarter was $1.3 million compared to $3.4 million in the previous quarter and $3.2 million during the quarter ended September 30, 2010. These costs predominantly relate to underground exploration at our Hollister property which amounted to $0.9 million for Q3 2011. The decrease from Q2 2011 is due to the completion of additional drilling conducted on the Blanket zone during Q2 2011.
Pre-development expenses
The pre-development expenditures relate to underground development at our Hollister Project which increased to $6.3 million during the quarter following the development of the Blanket zone ramp. The ramp has been substantially completed with pre-development expenses expected to return to the average of $3.5 - $4.5 million per quarter in Q4 2011.
6
| | MANAGEMENT'S DISCUSSION AND ANALYSIS | |
| QUARTER ENDED SEPTEMBER 30, 2011 |
Foreign exchange gain
This movement predominantly relates to the fluctuation between the Canadian (“$”) and United States (“US$”) dollar on the Senior Secured Notes (“SSN”) (up to settlement in March 2011), the term facility agreement as well as the Zero Cost Collar (“ZCC’) hedge structure as these are denominated in US$. The strong performance of the US$ against the $ in Q3 2011 resulted in an increase in the liability measured in $ with the corresponding charge included in loss from operating activities.
Stock based compensation
The income statement charge relating to this non-cash expense is impacted by the quantum and timing of stock options issued as well as the valuation thereof being influenced by the option price and volatility of the Company’s share price.
Interest expense
Interest expenses were capitalized during the construction phase of the Burnstone project in terms of the Company’s accounting policy. The construction phase concluded in January 2011 and interest expenses are now being expensed through the income statement. The interest expense includes the accretion charge on the convertible debentures, interest on the term loan facilities as well as the interest incurred on the SSN up to settlement in March 2011.
Loss on settlement of Senior Secured Notes
This is a non-cash accounting charge resulting from the accounting policy for the SSN. A monthly accretion charge to increase the recorded liability is processed to increase the liability to the settlement value over the maturity period of the notes. Due to the notes being settled on March 15, 2011 as opposed to December 12, 2011 the remaining accretion charge was recorded on the day of settlement, resulting in an accounting loss on settlement. From a cash flow perspective the notes were settled in terms of the note agreement and no additional costs were incurred on settlement.
Unrealized loss and mark-to-market adjustments on financial instruments
A fair value loss of $7.2 million was recorded in March 2011 on initial recognition of the ZCC hedge program for the US$70 million term loan entered into. A loss of $19.7 million was recognized on the fair value movement of the ZCC hedge programs for the quarter ended September 30, 2011. The fair value adjustment recorded in the financial statements is calculated with reference to the price of the call options and is impacted by gold price volatility, US interest rates and the quantity and remaining term of the put and call options in the structure. These fair value adjustments are non-cash charges with cash earnings only impacted should the price of gold exceed the price of the call options (US$1,705 and US$1,930). In August 2011 the price of gold exceeded US$1,705 and a realized loss of $0.1 million was recorded.
Other comprehensive loss
A $56 million cumulative translation adjustment charge was recorded for the quarter ($86 million year to date) relating to the devaluation of the South African Rand (“ZAR”) against the $ as well as the strengthening of the US$ against the $. The translation adjustment is recorded on conversion of the respective subsidiaries’ trial balances from their functional currency to the reporting currency of the Company.
3. Financial condition review
Total assets
Total assets increased by $20 million and current assets by $4 million since December 31, 2010 predominantly due to the increase in inventories as well as capitalized costs at Burnstone. The net movement in total assets includes a $22 million depreciation and exploration charge as well as $82 million in foreign exchange movement on property, plant and equipment.
7
| | MANAGEMENT'S DISCUSSION AND ANALYSIS | |
| QUARTER ENDED SEPTEMBER 30, 2011 |
Total liabilities
Total liabilities increased by $40 million since December 31, 2010 mainly due to the following reasons:
Trade payables and accrued liabilities
The balance decreased by $12 million following the completion of the Burnstone construction program in February 2011.Convertible debentures
The balance increased by $8 million due to the accretion charge being recorded over the term of this facility.Term facility and SSN
The Company entered into a term facility agreement with Credit Suisse in March 2011 for US$70 million. US$52 million from the proceeds of this loan was used to settle the SSN on March 15, 2011. $20 million in capital was repaid on the term facilities and leases for the 9 months ended September 30, 2011.Other liabilities
A net fair value liability of $27 million was recorded on the hedge programs.Foreign exchange
Movement in foreign exchange resulted in a net increase of $7 million in Long term debt and Other liabilities.
Shareholder’s equity
During the nine months ended September 30, 2011, the Company’s issued share capital increased by 61.5 million common shares due to the following transactions:
Bought deal public offering
The Company closed a $75 million bought deal public offering in February 2011. The 15% overallotment option of the underwriters was executed as well taking the gross proceeds to $86 million. 33.8 million shares were issued at a price of $2.55 per share which constituted a 5% discount to market price on the day.Share purchase warrants exercised
24.7 million share purchase warrants were exercised for the 9 months ended September 30, 2011.Share purchase options exercised
3 million share purchase options were exercised by employees and management.
At September 30, 2011, the Company had 476 million common shares issued and outstanding. A further 0.2 million share purchase warrants and 19 million share options were outstanding.
As of the date of this MD&A the Company had 476 million common shares issued and outstanding. A further 223,501 share purchase warrants and 19 million share options were outstanding.
8
| | MANAGEMENT'S DISCUSSION AND ANALYSIS | |
| QUARTER ENDED SEPTEMBER 30, 2011 |
Liquidity
The Company generated net cash of $8.6 million from operating activities during the quarter, compared to the $0.5 million during the quarter ended September 30, 2010. On a year to date basis cash of $22.9 million was generated from operations against $12.4 million utilized in operations for the comparative period. The pre-development costs incurred at the Company's Hollister project are being expensed and are also included under cash utilised in operating activities as opposed to investment activities where capital development is included.
Cash utilized in investment activities decreased to $35 million during the quarter compared to $70 million in the quarter ended September 30, 2010 which included the development of the Burnstone capital project. Approximately $20 million in payments to construction contractors for work completed in 2010 is included under investment activities for the 9 months ended September 30, 2011.
The Company paid a net amount of $4.9 million on financing activities during the quarter which included $12.6 million proceeds on warrants and share options exercised. Interest as well as principal of $17.5 million was paid on the Term facilities and equipment leases. On a year to date basis net proceeds from financing activities amount to $101.6 million which predominantly relate to the bought deal public offering in February 2011 and warrants and share options exercised ($115 million) and the net outflow on debt ($13 million).
The Company monitors its spending plans, repayment obligations and cash resources and acts with the objective of ensuring that there is sufficient capital in order to meet short term business requirements, after taking into account cash flows from operations and the Company’s holdings of cash and cash equivalents.
Taking cognizance of the start-up risks associated with new projects management initiated and closed a bought deal public offering in February 2011 with net proceeds of $81 million received on February 23, 2011. Proceeds from this offering were used to settle outstanding construction creditors for Burnstone with the remainder predominantly used to fund working capital during the Burnstone production build-up.
The Company offered a $0.07 early exercise discount to holders of the $1.25 warrants expiring November 2011 in order to mitigate the risk of inadequate cash flow resources during the production build-up phase at Burnstone. 10 million of the warrants were exercised prior to June 30, 2011 with another 9.2 million warrants exercised in July 2011, leaving approximately 223,000 warrants to be exercised prior to expiry on November 15, 2011.
During July 2011 the Company negotiated a US$40 million standby debt facility with Credit Suisse Ag, as an interim measure, to fund additional working capital required due to the delay in production build-up experienced at Burnstone. If drawn upon, this facility will share in the security package for Term Loan I (refer to the interim financial statements for the period ended September 30, 2011) and be repayable at the latest May 2014.
To negate the negative impact on working capital from the carbon shipment arrangement at our Nevada operation, a US$15 million gold sales advance was agreed with our bullion off taker, RK Finance Trust 1, during October 2011. This advance will be repaid in monthly installments over the period ending April 2012.
The slower than planned production build-up at Burnstone has a consequential impact on the cash resources of the Company which remains a constant concern with investors as evidenced by our share price performance. Taking cognizance of these concerns and the dilutive impact of issuing equity, the Company agreed to a restructuring of the Burnstone term loan facility (Term loan 1), the US$40 million standby debt facility as well as the associated ZCC hedge structure that is in-the-money at the current high gold prices. Credit Suisse Ag and Standard Chartered Bank, on a co-arranger basis, have obtained the necessary approvals from their respective credit committees to provide the Company with a US$150 million term facility loan with proceeds to be used to settle Term loan I and what may be drawn on the standby debt facility at the time of closing the transaction. Capital repayment will only commence in 2013 to account for the continued production build-up at Burnstone with the current ZCC hedge structure being restructured into a revised ZCC hedge structure of approximately 15% of the production from Burnstone over the term of the facility with an increased call price estimated close to US$2,000/oz (current structure at US$1,705/oz) with the final price to be determined on execution of the hedge structure and impacted by Au spot price at the time. As the US$40 million standby facility was undrawn at the date of the MD&A, the restructured facility adds an additional US$80 million to available cash resources.
9
| | MANAGEMENT'S DISCUSSION AND ANALYSIS | |
| QUARTER ENDED SEPTEMBER 30, 2011 |
The loan will be secured by the Burnstone property with no material changes envisaged to current covenants and will have a similar coupon as the current facility of US Libor plus 4%.
The facility agreement is currently under review by all parties with closing and funding planned for early December 2011.
This restructured Tem facility provides the Company with the required cash resources to fund the current production build-up profile at Burnstone. Delivering on planned production from both the Nevada and South African operations remains essential to the Company’s ability to fund its operations and debt repayment obligations in the short term.
At September 30, 2011, the Company had a net working capital deficit2 of $5 million that included $6 million in cash reserves and another $8 million in near cash reserves.
The Company has no "Purchase Obligations", defined as “any agreement to purchase goods or services that is enforceable and legally binding on the Company that specifies all significant terms, including: fixed or minimum quantities to be purchased; fixed, minimum or variable price provisions; and the approximate timing of the transaction”.
4. Operations review
4.1 Nevada operations
The Company’s Nevada operations consist of the Hollister Property (“Hollister”) located in the northern part of the Carlin Trend and the Esmeralda Property (“Esmeralda”) located in south west Nevada close to the border between Nevada and California. Great Basin’s surface exploration efforts at Hollister during 1997-2001 resulted in the discovery and delineation of several high-grade epithermal gold-silver vein systems on the property. The main vein systems, called Clementine and Gwenivere, have been accessed by decline and underground development for geological and resource confirmation and trial extraction of mineral resources; the development also provides staging for the ongoing exploration and development drilling that is in progress.
The environmental impact study (“EIS”) process for the Hollister Project is currently underway by the Bureau of Land Management (“BLM”). Pending the completion of the EIS process and receipt of BLM approval for the amended Plan of Operations, the underground exploration and development activities at Hollister must be conducted within the 275,000 ore tons per year limit set out in the Water Pollution Control Permit issued by the Nevada Department of Environmental Protection , and in a manner that aims to fully protect the environment and archaeological resources near the development and will not create any additional surface disturbance or significant new environmental impacts.
Esmeralda consists of patented and unpatented mining claims, fee lands, water rights and a mill. Ore extracted through the trial mining activities conducted at Hollister is trucked to Esmeralda for metallurgical processing.
Other features of Esmeralda include crushing facilities, stockpile areas, waste rock facilities, roads and other miscellaneous areas. There are currently no mining activities or further exploration work being conducted at Esmeralda.
______________________________________________
2 Working capital includes cash and cash equivalents, trade and other receivables, inventories, trade payables and accrued liabilities and is considered a non-GAAP measure.
10
| | MANAGEMENT'S DISCUSSION AND ANALYSIS | |
| QUARTER ENDED SEPTEMBER 30, 2011 |
Esmeralda is approximately 220 miles (354 kilometers) from Winnemucca and approximately 290 miles (467 kilometers) from Hollister with 80% of the latter distance over paved roads.
Progress on the Environmental Impact Statement
The Preliminary Draft EIS (“PDEIS”) was completed and presented to the BLM for comments and sign-off. Once the revised PDEIS has been signed off a number of activities will commence, including:
- The actual preparation of the Draft Environmental Impact Statement (“DEIS”)
- Final preparation of the Notice of Availability (“NOA”)
- Initiation of that review process by BLM of the DEIS before it is determined ready to print; and
- Printing & mailing of the DEIS.
The DEIS is expected to be published in November 2011 which will give an indication as to the timeline for final approval of the EIS.
11
| | MANAGEMENT'S DISCUSSION AND ANALYSIS | |
| QUARTER ENDED SEPTEMBER 30, 2011 |
Trial stoping and milling
| 3 months ended | 9 months ended | ||||
| September 30 2011 | June 30 2011 | September 30 2010 | September 30 2011 | September 30 2010 | |
| Ore tonnes to surface | 26,474 | 25,297 | 20,274 | 73,599 | 64,667 |
| Contained Au oz extracted | 19,985 | 28,075 | 22,016 | 68,237 | 75,539 |
| Contained Ag oz extracted | 178,539 | 233,880 | 126,659 | 571,867 | 457,792 |
| Contained Au eqv oz extracted | 23,811 | 34,246 | 23,916 | 80,491 | 82,405 |
| Contained average grade Au oz/tonne (gram/tonne) | 0.75 (24.3 g/t) | 1.11 (35.7 g/t) | 1.09 (34.9 g/t) | 0.93 (29.8 g/t) | 1.17 (37.6 g/t) |
| Contained average grade Au eqv oz/tonne (gram/tonne) | 6.74 (216.8 g/t) | 9.25 (297.2 g/t) | 6.25 (200.9 g/t) | 7.77 (249.8 g/t) | 7.08 (227.6 g/t) |
| Tonnes milled | 29,869 | 22,237 | 24,706 | 73,740 | 86,954 |
| Recovered Au oz | 22.701 | 23,179 | 16,067 | 67,892 | 67,270 |
| Recovered Ag oz | 156,030 | 151,825 | 37,630 | 419,612 | 354,326 |
| Recovered Au eqv oz | 26,045 | 26,757 | 16,938 | 76,884 | 72,896 |
| Recovery % Au | 92% | 95% | 87% | 92% | 82% |
| Recovery % Ag | 74% | 75% | 66% | 73% | 59% |
The presentation of production results for the Nevada operations were changed from imperial to metric on January 1, 2011 to be consistent and comparable with production results reported for the industry and our South African operations. Comparative results have been adjusted to conform. The tonnes milled, Au and Ag ounces recovered as well as recovered Au eqv oz in the table above for the 3 and 9 months ended September 30, 2010 include the third party toll milling campaigns.
Ore tonnes to surface increased 5% quarter on quarter and 31% over the comparative period in 2010. The continued focus to increase throughput from underground is starting to deliver results with additional activities planned to achieve a consistent 320 ore tonnes per day. The average contained grade of 0.90 Au eqv oz p/t for the quarter is in line with the reserve grade and the movement from the previous quarter is a function of the areas where trial mining occurred during the quarter.
Primary waste development was again focused on the Blanket Zone (“BZ”) spiral ramp, the BZ Alimak raise, and the 5400 BZ I-Drift. During the quarter, the BZ Ramp achieved 1,136 feet (344 meters) of advance; 204 feet (62 meters) of development remained at quarter end to complete the ramp. The 5400 I-drift, which originates from the BZ Alimak raise, was advanced 169 feet (51 meters) to the east during the quarter, with 161 feet (49 meters) remaining to reach the +1 opt Au grade shells modelled from surface and underground drilling for the 3000N 1W area.
Tonnes milled increased 34% quarter on quarter and 21% over the comparative period in 2010. Notwithstanding the significant increase in tonnes processed during the quarter, gold and silver recoveries at the Esmeralda mill remained within the targeted levels at 92% Au and 74% Ag, respectively. The installation of the acid wash and carbon regeneration system at the Esmeralda Mill was completed during October 2011 and doré is once again being poured on site since the end of October 2011.
12
| | MANAGEMENT'S DISCUSSION AND ANALYSIS | |
| QUARTER ENDED SEPTEMBER 30, 2011 |
Underground exploration
Underground exploration and stope delineation drilling continued during Q3 2011. In total 25 boreholes for 12,349 feet or 4,075 meters were completed. These comprised 17 exploration and cover boreholes testing Clementine and SE Gwenivere targets (totaling 8,956 feet or 2,687 meters), 5 stope delineation holes (totaling 2,837 feet or 851 meters), and 3 Bazooka cover boreholes (totaling 556 feet or 167 meters). Drilling was scaled back in Q3 2011 due to high productivity in Q2 with only one drill rig now operational which will service future Blanket Zone, exploration and stope delineation drilling programs.
During the quarter final results from the Phase 1 Blanket Zone drilling and initial Phase 2 drilling have been received and processed. The drilling has continued to confirm the linkage of super high grade zones (over 5 oz/ton Au) with the propagation of underlying mineralized vein structures and the “sponge-like” receptability of tuffaceous stratigraphic horizons within the Tertiary volcanics. The data generated from the drilling has been included in modeled grade shells which are providing the basis for an initial resource estimate that will be included in the upcoming mineral resource update.
17 exploration boreholes (totaling 8,956 feet or 2,687 meters) were completed to test and provide more definition on the SE Gwenivere target and infill coverage on the Clementine system. The SE Gwenivere veins have been modeled, and are included in the upcoming mineral resource update. This area has a more complex geological structure with mineralization styles that includes stockworks, banded epithermal veins, and hydrothermal brecciation.
Surface Exploration
Although limited surface exploration activities are conducted, continued progress is being made ground truthing the Hollister claim block and updating of the structural and detailed geological map. This work is in the process of being integrated with a first-pass structural interpretation of the larger Hollister area. The distribution and mapping of hydrothermal eruption centers and vents forming silica domes has been advanced, with 10 major eruptive centers and over 50 satellite hydrothermal vents being identified. These localities are significant from an exploration targeting perspective, as they indicate areas of long lived meteoric/volcanic water circulation and volcanic activity, favorable for the deposition of Au/Ag, and the potential build up of economic concentrations.
This work is part of an ongoing sub-regional and mine site scale collation and interpretation of geophysical data, specifically, airborne magnetic, ground CSMAT (high resolution resistivity), and gravity. The phases of this work include:
Ground truthing the Hollister claim block, updating structural and detailed geological map (in progress);
Integration of historic stream sediment, ridge and spur soil and rock chip sampling into the exploration database (in progress);
Conduct low impact BLEG (bulk leach extraction geochemistry) survey and MMI (Mobile metal Ion) orientation survey to test mineralized structures (planned);
Integration of High Resolution (CSMAT) with existing borehole data base (initiated);
Integration of this interpretation with gravity and magnetic data, and then with the structural interpretation, leading to a revised geological / structural / vein / fluid flow map (planned);
Review, update underground mapping (initiated);
Model vein textures, mineralogy and alteration patterns (including clay spectroscopy);
Integrate and update structural interpretation (planned);
Update the Hollister vein system model and controls on gold and silver mineralization relative to the structural model (planned);
13
| | MANAGEMENT'S DISCUSSION AND ANALYSIS | |
| QUARTER ENDED SEPTEMBER 30, 2011 |
- Review target criteria, prioritize, and motivate phased drill testing of one or more targets.
We plan to complete the above during the next 12 months to allow for a focused and well planned surface drill program thereafter.
Plans for remainder of 2011
The Company plans to continue its trial mining (ore removal and processing) activities at Hollister within the allowable ore tonnage authorizations of its existing permits, with all extracted material to be processed at the Esmeralda mill. The Nevada operations remain on target to produce an estimated 100,000 to 110,000 Au eqv oz in 2011 at a cash production cost estimated to range between US$600 and US$650 per Au eqv oz.
The Company will complete the BZ ramp and will continue with underground exploration drilling of the Blanket Zone targets and infill drilling with the objective to extract ore from this high grade zone by the end of 2012.
The Company, together with the BLM, will also continue working on finalization of the EIS for Hollister by mid 2012.
4.2 South African operations
The Burnstone Property is located in the South Rand area of the Witwatersrand Goldfields, approximately 50 miles (80 kilometers) southeast of the city of Johannesburg and near the town of Balfour. The Burnstone Project has received all of the required permits to complete the development of the mine and commence full-scale underground mining. Block B and Block C are the areas of the ore body to be mined in the next 36 months, while underground access to the remaining areas of the ore body under the mine plan is being developed.
Commissioning of capital projects
The initial mine capital expenditure program has been completed and the mine has commenced with production build-up. Major capital projects that include the vertical shaft, metallurgical plant, decline, ventilation shaft and required surface and underground infrastructure were commissioned by January 2011. The components of the mine required to enter commercial production have thus been completed and commissioned and therefore concludes the development phase of the project. Further development costs are being capitalized as per the Company’s accounting policy.
14
| | MANAGEMENT'S DISCUSSION AND ANALYSIS | |
| QUARTER ENDED SEPTEMBER 30, 2011 |
Production results
| 3 months ended September 30 2011 | 3 months ended June 30 2011 | 9 months ended September 30 2011 | |
| Ore development (meters) | 2,786 | 1,550 | 5,502 |
| Waste development (meters) | 1,403 | 1,872 | 5,358 |
| Total development (meters) | 4,189 | 3,422 | 10,860 |
| Stoping (square meters) | 7,408 | 5,122 | 16,290 |
| Ore tonnes to surface – development | 138,158 | 154,849 | 373,027 |
| Ore tonnes to surface – stoping | 24,379 | 22,990 | 59,465 |
| Ore tonnes to surface – total | 162,537 | 177,839 | 432,492 |
| Contained Au oz extracted - development | 3,451 | 3,168 | 9,377 |
| Contained Au oz extracted - stoping | 2,705 | 1,830 | 5,186 |
| Contained Au oz extracted - total | 6,156 | 4,998 | 14,563 |
| Contained average grade Au eqv oz/tonne (g/t)– development | 0.02 (0.80 g/t) | 0.02 (0.64 g/t) | 0.03 (0.81 g/t) |
| Contained average grade Au eqv oz/tonne (g/t) – stoping | 0.11 (3.57 g/t) | 0.08 (2.57 g/t) | 0.09 (2.80 g/t) |
| Contained average grade Au eqv oz/tonne (g/t) – total | 0.04 (1.22 g/t) | 0.03 (0.96g/t) | 0.03 (1.08 g/t) |
| Tonnes milled | 209,224 | 202,660 | 611,762 |
| Recovered Au oz | 6,486 | 4,894 | 16,891 |
| Recovery % Au | 89% | 85% | 86% |
66% additional waste development had to be undertaken during the 6 months ended June 30, 2011 due to geological faulting encountered in the planned mining area. Despite the relatively close drill spacing in the mining area, the exact position and orientation of the faults could not be identified as they were mainly of a graben nature.
Additional infill and delineation drilling during the 6 months ended June 30, 2011, as well as extensive mapping and interpretation of the structural information from the over 10 kilometers of underground development, provided management with additional data to incorporate the faulting into the updated mine plan resulting in actual waste development for Q3 2011 being only 4% in addition to the plan.
The additional waste development during the first 6 months of 2011 had a negative impact on ore development, with only 35% of the planned ore development achievable. 67% of the planned ore development for Q3 2011 was completed with the available ore development ends now averaging over 25, up from an average of 12 for the 6 months ended June 30, 2011.
The ore to waste development ratio further improved during Q3 2011 with ore development representing 67% of total development (45% in Q2 2011) for the quarter. Year to date the ratio improved to 51% (41% for the 6 months ended June 2011) with the targeted ratio being 85% ore and 15% waste development at steady state production.
Further optimization of the Long Hole Stoping mining method continued during the period with a revised stope lay-out design, the Up-Dip Strike Pillar (figure 1), being implemented. This design increases the square meters available for stoping for each meter of ore developed by 88% from 9 to over 17 square meters compared with the L-Pillar design. The L-Pillar was only at a concept stage and was never implemented. Comparing the new design with the T-Pillar (figure 2), that was implemented successfully, the ratio of square meters opened per ore meter developed improved from 13 to 19. This is a 46% improvement. The revised layout, which could allow larger stopes to be mined, is still in its trial phase but positive preliminary results are already evident. Over the short term this design will have a limited initial adverse effect on stope availability, due to 147 meters of ore developed required to cut a stoping block of 2,500 square meters compared to 69 meters of ore development required for the T-Pillar design which only open up 900 square meters. However, over the longer term this change will positively impact the ore tonnes mined per meter developed as well as cash costs on a per ton and per ounce basis.
15
| | MANAGEMENT'S DISCUSSION AND ANALYSIS | |
| QUARTER ENDED SEPTEMBER 30, 2011 |
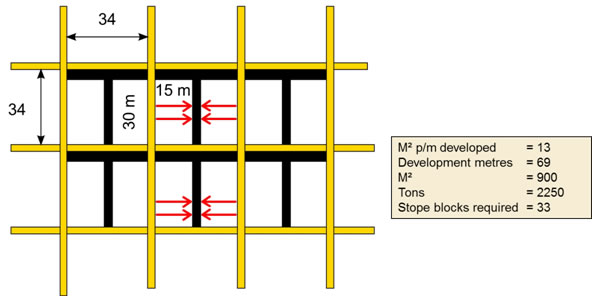
Figure 1. Long Hole Stoping utilizing the T-Pillar design
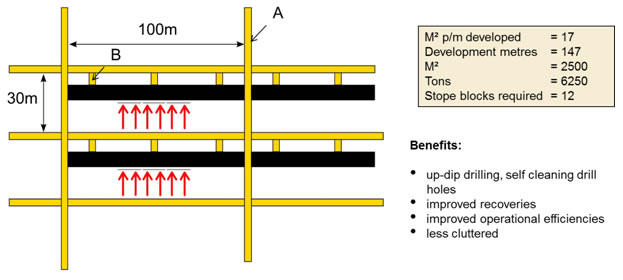
Figure 2. Long Hole Stoping utilizing the Up-dip Strike Pillar design
The ore development meters to open up the required 30,000 stope square meters per month will reduce from 2,307 meters to 1,764 meters at full production. This reduction in ore development meters will allow us to expedite building up our ore development reserves as we are currently equipped to do 2,300 ore development meters per month. Stope blocks required to achieve full production will also reduce 64% from 33 to 12 with flexibility in mining areas improving substantially. The concentration of mining will also have a positive effect on our trackless mining equipment, labour and ventilation requirements. There will be a steady build-up over the next 18 months towards our target of having a one year ore development reserve.
16
| | MANAGEMENT'S DISCUSSION AND ANALYSIS | |
| QUARTER ENDED SEPTEMBER 30, 2011 |
The revised up-dip strike pillar layout allows for improved cleaning and can be adjusted in size depending on the available ground. Drive A in figure 2 can be developed at any spacing, e.g. at 50 meters if a stope block is required sooner or if a fault is intersected. The stope block will then only be 30x50 meters. Cleaning with water jets are also improved with the cleaning gulley (B in figure 2) that will cut through the pillar (black area) and will allow the operator to remove ore at a down dip angle. The 20 meter holes that will be drilled are indicated by the red arrows at an up-dip angle which will resolve challenges with de-sledging the holes drilled at a down-dip angle and thus becoming self-cleaning.
The shortfall in ore development not only impacted on the mined ounces, but also on the availability of stopes. Only 14% of the planned stoping for the 6 months ended June 30, 2011 could be completed due to the lack of available stopes. Notwithstanding the impact of opening up the larger stopes, the stoping square meters increased by 45% during the quarter (Q2 2011: 5,122 square meters), with stoping widths of between 60 – 80 cm being achieved on a consistent basis. Only 49% of the planned stoping for Q3 2011 was completed as a result of the unavailability of stopes. Improved dilution control in Q3 2011 also resulted in a 39% improvement in stoping grade to 3.57 g/t (Q2 2011: 2.57 g/t).
Another key ratio that showed a marked improvement from Q2 2011 is the extracted Au ounces from ore development and stoping (“development/stoping ratio”). This ratio impacts on the head grade of tonnes delivered to the mill which in turn impacts on the recovered and sold ounces. 44% of contained Au ounces delivered to the mill were derived from stoping during Q3 2011, compared to only 36% in Q2 2011. The targeted development/stoping ratio at steady state production is to deliver an average of 65% of contained ounces from stoping.
The Metallurgical Plant is performing in line with expectation with 209,224 tonnes processed during the quarter, a marginal improvement over Q2 2011. Mill feed is controlled to account for the lower than planned ore from development and stopes. The improvement in the head grade of ore delivered to the mill had a positive impact on Au recovery which increased to 89% (Q2 2011:85%). The last material from the lower grade development ore stockpile was processed during Q3 2011 with further improvement in Au recovery expected in Q4 2011. The Au ounces recovered during Q3 2011 increased by 33% from Q2 2011, but were below the planned 14,000 Au ounces for the quarter, mainly due to the variance in actual and planned stoping.
Resource update
The Company announced an updated mineral resource estimate for Burnstone during the quarter. The updated mineral resource estimate, inclusive of all drilling and underground evaluation up to June 30, 2011, is tabulated below at a range of cutoffs. At a cutoff of 300 cmg/t, the total Measured and Indicated Resources contain approximately12.6 million ounces of gold, and the Inferred Resources contain approximately 10.1 million ounces of gold.
17
| | MANAGEMENT'S DISCUSSION AND ANALYSIS | |
| QUARTER ENDED SEPTEMBER 30, 2011 |
Class | Cut Off cmg/t | Tonnes Mt | Gold g/t | Gold oz |
| Measured | 250 | 43.0 | 5.20 | 7,187,100 |
| Measured | 300 | 38.8 | 5.34 | 6,664,900 |
| Measured | 350 | 34.8 | 5.52 | 6,166,600 |
| Indicated | 250 | 30.7 | 6.39 | 6,315,700 |
| Indicated | 300 | 28.1 | 6.59 | 5,947,780 |
| Indicated | 350 | 25.8 | 6.83 | 5,654,100 |
| Total measured and indicated | 250 | 73.7 | 5.70 | 13,502,800 |
| Total measured and indicated | 300 | 66.9 | 5.87 | 12,612,600 |
| Total measured and indicated | 350 | 60.5 | 6.07 | 11,820,700 |
| Inferred | 250 | 82.4 | 4.11 | 10,889,300 |
| Inferred | 300 | 72.8 | 4.30 | 10,061,900 |
| Inferred | 350 | 61.0 | 4.60 | 9,023,000 |
| 1. | Mineral resources that are not mineral reserves do not have demonstrated economic viability. |
| 2. | Metallurgical recoveries are not applied to resource values. |
At a 300cmg/t cut-off, the current update reflects a slight increase in tonnage (3%) and a slight drop in grade (-6%) when compared to the August 2010 estimate, include the mine’s mineral reserves and have been depleted with production to June 30, 2011 and are stated as of that date.
The mineral resource classification method applied in this update is in line with that utilized in the August 2010 estimate, with a minimum of six informing samples used for estimates in the Measured category, a minimum of three informing samples used for Indicated, and two informing samples used for Inferred. The total number of informing Kimberley Reef intersections utilized for the estimate is 2,050, a substantial increase from the 610 intersections used in the 2010 estimate. For the 2011 estimate, these include 514 from surface boreholes (339 in 2010), 42 from underground boreholes (35 in 2010), and 1,494 from underground channel composite samples (362 in 2010). In addition, a total of 819 historic deflections from surface boreholes have been used, where appropriate, for assay and sedimentological confirmation. Geozones developed from deposit modeling in the area of interest were updated as part of the basis for the estimation, but remain very similar to those used in the August 2010 resource update. These zones are delineated by a combination of variable geological parameters such as channel width, gold grade (g/t) and gold accumulation (cmg/t), footwall lithology, and sedimentary facies.
Variography, generated from the current geostatistical analyses for the estimates, is in line with previous observations. The continued underground exposure of Kimberley Reef from mine development is providing a basis for detailed evaluation data (channel samples) and structural mapping. All told, the results continue to demonstrate higher confidence in the estimated total Measured and Indicated resources.
Underground and surface exploration
Infill drilling (5,054 meters) from surface continued during the quarter, and continues to provide positive results in tightening up on the evaluation and structural geometry of certain mining blocks. Development and stope panel evaluation is undertaken by channel sampling of exposed sidewalls. Horizontal or shallow dipping cover drilling is undertaken for development control.
During Q3 2011, 1,631 channel samples were taken with over 16,500 samples taken to date. The summary gold grade (g/t), channel width (cw) and gold content (cmg/t) statistics for the various mining blocks are shown below.
18
| | MANAGEMENT'S DISCUSSION AND ANALYSIS | |
| QUARTER ENDED SEPTEMBER 30, 2011 |
BLOCK | Channel Grade Au g/t | Planned Grade Au g/t | Channel Reef width CW cm | Planned Reef width CW cm | Channel Content Cmg/t | Planned Content Cmg/t |
| B2 B3 C3 C Upper | 8.08 3.01 17.72 14.68 | 11.87 3.19 12.56 13.30 | 58 94 31 49 | 54 102 30 43 | 466 284 552 720 | 641 325 377 572 |
| Averages | 6.40 | 6.90 | 79 | 56 | 505 | 335 |
These results are in-line with or better than mine development expectations. The Life-of-Mine plan indicates an average channel width of 68 cm.
Surface Exploration outside the Burnstone Mining Right
Surface exploration continued on mineral rights located outside the Burnstone mining right, with the continuation of the shallow basin edge target evaluation program. Field investigations and planning for drilling that will test the sub-cropping Kimberley Reef at Roodepoort – Kildare were advanced, including bulk sampling of sand and rock dumps.
Plans for remainder of 2011
Ore development remains the key to delivering the planned production build-up. During H1 2011 the ratio of waste to reef development was weighted towards waste development with the resultant impact on stope availability for mining. The improvement seen in this ratio in Q3 2011 is expected to continue during Q4 2011 which will result in an increase in stope availability. The optimized stope lay-out will have a short term impact on available stopes due to the additional ore development required to open up the stopes. Production for Q4 2011 is estimated to be between 12,500 and 15,000 Au oz. Cash costs for the remainder of 2011 will be impacted by the Au head grade delivered to the mill and are estimated in the range of US$1,500 – US$1,700 for Q4 2011.
4.3 Tanzanian exploration properties
In Tanzania, exploration properties are held in two separate geological terrains, namely the Archean (2.7 -3.3 billion years old “Ga”), greenstone-hosted, Lake Victoria Goldfields (north-west) and the Proterozoic (2.2 -1.6 Ga) Lupa Goldfields (south-west). The Company also manages a joint venture with African Barrick in the Geita Belt of the Lake Victoria Goldfields.
19
| | MANAGEMENT'S DISCUSSION AND ANALYSIS | |
| QUARTER ENDED SEPTEMBER 30, 2011 |
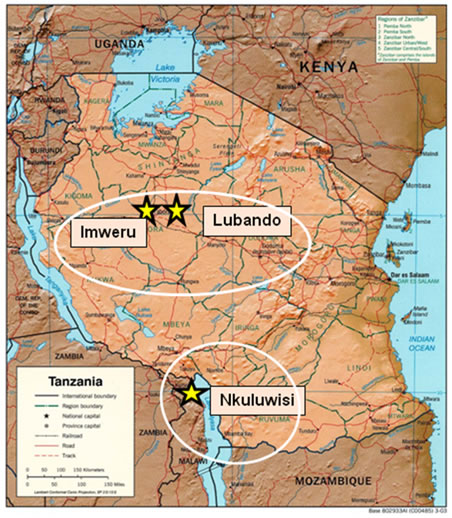
Figure 3 : The Company’s project areas in Tanzania
The Company entered into an agreement in June 2011 whereby it granted Shanta Gold Limited (“Shanta”) the option, following the fulfillment of the conditions precedent, to acquire an 80% interest in the Company’s wholly-owned subsidiary, Shield Resources Limited (“Shield”), who is the holder of various prospecting licenses in the Lupa region of Tanzania.
In consideration for providing Shanta with the exclusive right to acquire shareholding in Shield, Shanta is obliged to issue ordinary shares to the value of US$7 million and Shanta warrants to the value of US$7 million (at an implied value of 35p each) to the Company. Furthermore Shanta has to fund a US$12 million exploration program, spread over a period of 3 years commencing January 1, 2012. Shanta will acquire the 80% equity interest in Shield upon the completion of the exploration program. There is also a claw-back function in the agreement, whereby Great Basin can earn back into the assets if Shanta discover in excess of 500koz Indicated and Inferred resources. The due diligence will be completed by December 2011. The Shield Resources / Shanta JV properties in the Lupa Goldfield are shown below.
20
| | MANAGEMENT'S DISCUSSION AND ANALYSIS | |
| QUARTER ENDED SEPTEMBER 30, 2011 |
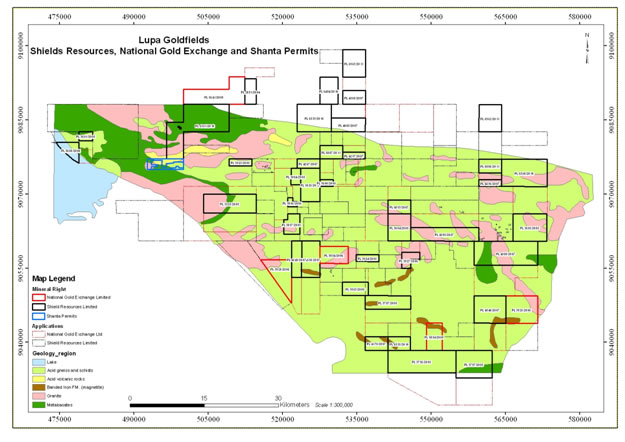
Figure 4 : Shield Resources / Shanta JV properties in the Lupa Goldfield.
Shanta has a proven track record in the Lupa region with prospects of near term production from their advanced development projects and we believe they are ideally suited to explore our properties in the region and add economical resources to the current resource base. The JV also provides Great Basin Gold with the flexibility to direct all our activities in Tanazania to our Geita project areas.
5. Market Trends
Gold opened at US$1,505 on July 1, 2011 and generally traded upwards during the quarter. Continuous concern regarding stability and growth in the Global economy as well as the Euro debt concern contributed to the upward trend in the price of Au during the quarter. A new record close of US$1,895 was recorded on September 5, 2011 and was also the highest close for the quarter. Growing concern over the Euro debt crisis in the latter part of September 2011 impacted on the gold price as investors liquidated their holdings. After closing at US$1,598 on September 26, 2011 the market remained volatile with gold closing at US$1,620 on September 30, 2011. Subsequent to quarter end gold prices remained volatile and traded between US$1,617 and US$1,680 until it again broke through US$1,700 on October 26, 2011.
The price of silver also impacts on the revenue and earnings of the Company, although to a lesser extent than the price of gold. Included in revenue for the quarter is 134,844 Ag oz sold from trial mining activities at Hollister (361,664 Ag oz ytd). Silver opened on July 1, 2011 at US$35.02 and traded similar to gold with a low of US$28.69 recorded on October 5, 2011 and closing the quarter at US$30.45. Similar to gold, the price of silver remained volatile subsequent to quarter end trading range bound between US$30 and US$33 per oz.
21
Gold equities did not always follow the trend set by the metal price with a growing disparity between equity performance and metal price evident. The growing concerns over the Euro zone debt crisis also resulted in investors de-risking their portfolios and liquidating investments. After opening at $1.98 on July1, 2011 the Company’s share price decreased to $1.72 on September 29, 2011 and closed at $1.77 on September 30, 2011.
The exchange rate between the US$, $ and the South African Rand (“ZAR”) impacts on the Company’s earnings and cash flow. Global concerns over the Euro zone debt crisis also impacted on the $, US$ as well as the $ /ZAR exchange rate. The US$ and ZAR traded at an average of US1 = R7.43 (Q2 2011:R6.79) during the quarter. The US$ and $ traded at an average of US$1 = $0.98 (Q2 2011:$0.97) .
6. Quarterly Information
| Sept 30 2011 IFRS | Jun 30 2011 IFRS | Mar 31 2011 IFRS | Dec 31 2010 IFRS | Sept 30 2010 IFRS | Jun 30 2010 IFRS | Mar 31 2010 IFRS | Dec 31 2009 CGAAP | |||||||||||||||||
| Current assets | 46,263 | 76,575 | 105,633 | 41,918 | 60,102 | 84,904 | 92,613 | 126,8622 | ||||||||||||||||
| Other assets | 729,034 | 750,077 | 718,825 | 713,4653 | 618,9933 | 516,1913 | 408,8563 | 421,4222 | ||||||||||||||||
| Total assets | 775,297 | 826,652 | 824,458 | 755,3833 | 679,0953 | 601,0953 | 501,4693 | 548,284 | ||||||||||||||||
| Current liabilities | 100,263 | 87,952 | 89,265 | 115,525 | 87,352 | 89,467 | 60,295 | 72,974 | ||||||||||||||||
| Non-current liabilities | 229,220 | 216,748 | 226,479 | 174,1413 | 217,1463 | 168,0073 | 120,0143 | 101,597 | ||||||||||||||||
| Shareholders’ equity | 445,814 | 521,952 | 508,714 | 465,7173 | 374,5973 | 343,6213 | 321,1603 | 373,713 | ||||||||||||||||
| Total liabilities andshareholders’ equity | 775,297 | 826,652 | 824,458 | 755,3833 | 679,0953 | 601,0953 | 501,4693 | 548,284 | ||||||||||||||||
| Working (deficit)capital | (5,438 | ) | 30,314 | 49,419 | (21,096 | ) | (19,821 | ) | 15,400 | 48,987 | 91,624 | |||||||||||||
| Revenue | 46,673 | 56,738 | 26,343 | 42,714 | 12,230 | 37,940 | 6,822 | - | ||||||||||||||||
| Expenses | (80,660 | ) | (57,789 | ) | (46,684 | ) | (35,529 | )3 | (35,567 | )3 | (42,843 | )3 | (12,909 | )3 | (8,365 | ) | ||||||||
| (Loss) profit for theperiod | (33,987 | ) | (1,051 | ) | (20,341 | ) | 7,1853 | (23,337 | )3 | (4,903 | )3 | (6,087 | )3 | (8,365 | ) | |||||||||
| Basic (loss) earnings per share | ($0.07 | ) | $ | 0.00 | ($0.05 | ) | $ | 0.02 | ($0.07 | ) | ($0.01 | ) | ($0.02 | ) | ($0.03 | ) | ||||||||
| Adjusted (loss) earnings per share | ($0.03 | ) | $ | 0.00 | ($0.01 | ) | $ | 0.02 | ($0.05 | ) | ($0.01 | ) | ($0.02 | ) | ($0.03 | ) | ||||||||
| Weighted average number of common shares outstanding (thousands) | 473,856 | 454,559 | 431,624 | 405,857 | 351,739 | 340,609 | 336,893 | 333,856 |
1 Working capital includes cash and cash equivalents, trade and other receivables, inventories, trade payables and accrued liabilities and is considered a non-GAAP measure.
2 Certain prior historical amounts have been reclassified to conform to fiscal 2011 and 2010 year presentation. These reclassifications had no impact on previously reported results of operations or shareholders' equity.
3 Adjusted to conform to IFRS.
The Company’s adjusted loss per share has generally been decreasing on a quarterly basis with the adjusted loss for the quarter ended September 30, 2011 being impacted by foreign exchange losses resulting in an increase in the loss per share. The generally decreasing losses are attributable to the increased gold sale proceeds from trial mining at Hollister as well as the commencement of production at Burnstone during Q1 2011, which benefited from higher gold and silver prices. The Company also has an aggressive cost management project aimed at reducing the costs at operations as well as exploration and general corporate expenses.
22
| | MANAGEMENT'S DISCUSSION AND ANALYSIS | |
| QUARTER ENDED SEPTEMBER 30, 2011 |
7. Off-Balance Sheet Arrangements
(a) Financial guarantee
BEE legislation in South Africa requires a target of 26% ownership in the Company’s South African projects by historically disadvantaged South Africans by 2014. In order to comply with this legislation, Tranter Burnstone (Pty) Ltd. (“Tranter”), a BEE company, acquired 19,938,650 treasury common shares for $38 million in 2007, which was deemed equivalent to the 26% underlying value of Burnstone. Tranter borrowed the funds from Investec Bank Ltd (“Investec”), a South African bank, to purchase the shares and the Company provided a guarantee of ZAR140 million ($21 million) to cover any shortfall in interest or principal repayments on the loan outstanding by Tranter to Investec. A loan of $12 million (ZAR 88 million) was advanced to Tranter in October 2010 with a further $1.6 million (ZAR11 million) advanced in April 2011 as well as $1.1 million (ZAR8.9 million) in October 2011 under the guarantee agreement to enable Tranter to meet its interest payment obligation to Investec.
As a result of this loan the remaining Tranter guarantee is now reduced to $4 million (ZAR32 million). Any advances to Tranter under this guarantee are due to be repaid by Tranter in installments from 2014 to 2017, with interest accruing at the South African prime interest rate plus 2%. Security for any advances made pursuant to this guarantee includes a second charge against any shares of the Company held by Tranter (second to Investec).
The fair value of the guarantee was determined by reference to the Company’s exposure to potential future losses under the guarantee on grant date. The probability of future losses under the guarantee agreement, and therefore the fair value of the guarantee, is dependent on the estimated fair value of the security granted by Tranter on grant date of the guarantee. Future assessments are not required unless a change to the contractual relationship results in a change in fair value.
(b) Hedging program
The Company does not follow a general policy of hedging commodity prices or currencies. The ZCC hedge programs described below were entered into as a condition precedent to finance transactions during 2010 and 2011. Management is of the opinion that the ZCC structures still allow investors exposure to increases in metal prices over the medium term.
The Company executed a ZCC hedging program in August 2010 for a total of 105,000 gold ounces over a period of three years that commenced in January 2011.
As of January 1, 2011, the Company is required to deliver 1,250 gold ounces per month over a twelve month period. The remaining 90,000 gold ounces will be delivered in 24 equal monthly deliveries of 3,750 gold ounces, starting January 1, 2012. The program includes put options priced at US$850 and call options priced at US$1,705 per gold oz.
Gold delivery positions as at September 30, 2011:
| September 30 2011 | December 31 2010 | |
| Expired unexercised at no cost Delivered Remaining positions Cash cost of delivered ounces to date | 10,000 ounces 1,250 ounces 93,750 ounces $130,000 | Nil ounces Nil ounces 105,000 ounces Nil |
Marked-to-market movements were calculated using an option pricing model with inputs based on the following assumptions:
23
| | MANAGEMENT'S DISCUSSION AND ANALYSIS | |
| QUARTER ENDED SEPTEMBER 30, 2011 |
| September 30 2011 | December 31 2010 | |
| Gold price (per ounce) Risk free interest rate Expected life Gold price volatility | US$1,623 0.27% - 0.55% 1 - 27 months 37.06% - 32.52% | US$1,419 0.25% - 1.34% 1 - 36 months 17.30% - 27% |
The Company executed another ZCC hedging program in March 2011 for a total 117,500 gold ounces over a period of four years, commencing in January 2012.
The Company will be required to deliver 875 gold ounces per month over a twelve month period followed by 3,000 gold ounces per month over a twenty four month period. The remaining 35,000 gold ounces will be delivered in 12 equal monthly deliveries of 2,916 gold ounces, starting January 30, 2015. The program includes put options priced at US$1,050 and call options priced at US$1,930 per gold oz.
The fair value on inception and subsequent mark-to-market movements were calculated using an option pricing model with inputs based on the following assumptions:
| September 30 2011 | March 10 2011 | |
| Gold price (per ounce) Risk free interest rate Expected life Gold price volatility | US$1,623 0.40% - 0.98% 3 - 51 months 33.37% - 34.10% | US$1,410 0.40% - 1.91% 10 - 57 months 19.65% - 26.26% |
8. Contractual obligations
| Payments due by period | |||||||||||||||
Total ($’million) | Less than one year ($’million) | 1 to 3 years($’million) | 3 to 5 years($’million) | More than 5 years ($’million) | |||||||||||
| Convertible debentures(a)(b) | 161.4 | 10.1 | 20.2 | 131.1 | Nil | ||||||||||
| Term loan facilities(a)(c) | 152.1 | 52.6 | 83.9 | 15.6 | Nil | ||||||||||
| Finance lease liabilities(a)(d) | 5.2 | 5.2 | Nil | Nil | Nil | ||||||||||
| Operating lease obligations | 0.3 | 0.3 | Nil | Nil | Nil | ||||||||||
| Asset retirement obligations | 7.0 | Nil | Nil | Nil | 7.0 | ||||||||||
| Other(e) | 2.7 | 0.2 | 1.9 | 0.2 | 0.4 | ||||||||||
| Total | $ | 328.7 | $ | 68.4 | $ | 106.0 | $ | 146.9 | $ | 7.4 | |||||
Notes
| (a) | Amounts include scheduled interest payments. | |
| (b) | The convertible debentures mature on November 30, 2014 and bear interest at the rate of 8% per annum. Interest is payable semi-annually in arrears on May 30 and November 30 of each year. The debentures are direct senior unsecured obligations of the Company and are guaranteed by certain of the Company’s subsidiaries. | |
| (c) | Term loan I | |
The Company closed a $71 million (US$72 million) term loan facility agreement (“Term loan I”) with Credit Suisse in 2010. The loan has a maximum term of 4 years from date of first drawdown and will be repaid in 11 remaining quarterly consecutive installments and bears interest at a margin of 4% over the USD LIBOR rate. The Company applied the interest rate in effect on September 30, 2011 in determining the value of future payments. The Burnstone project and certain subsidiary guarantees serve as security for the loan. |
24
| | MANAGEMENT'S DISCUSSION AND ANALYSIS | |
| QUARTER ENDED SEPTEMBER 30, 2011 |
Term loan II | ||
The Company closed the $69 million (US$70 million) Term loan II with Credit Suisse in March 2011. The loan has been fully drawn down, has a term of 4 years and is repayable in 17 remaining quarterly installments. The first installment was settled on September 13, 2011, 6 months after initial draw down. The interest rate is linked to the USD LIBOR at a premium of 3.75% and is fixed on a quarterly basis. The Company applied the interest rate in effect on September 30, 2011 in determining the value of future payments. The Nevada assets and certain guarantees by the Company serve as security for the loan. | ||
| (d) | The principal debt amounts will be repaid in equal monthly installments over a period of 12 months and bear interest at rates between 6.5% and 22.4% on outstanding capital. The finance leases are collateralized by the leased assets which had a carrying value of $6.9 million at September 30, 2011. | |
| (e) | Other obligations include nominal exploration and environmental obligations. |
9. Transactions with Related Parties
Related party transactions are recorded at the exchange amount which is the amount of consideration paid or received as agreed to by the parties. Refer section 7(a) for details on transactions with related parties. There were no other material related party transactions during the quarter.
Information relating to the Company’s related party transactions is available in the Company’s annual financial statements which are available on SEDAR atwww.sedar.com.
10. Critical Accounting Estimates
The Company's accounting policies are presented in note 3 of the most recent annual consolidated financial statements. The preparation of consolidated financial statements in accordance with generally accepted accounting principles requires management to select accounting policies and make estimates. Such estimates may have a significant impact on the financial statements.
11. Financial Instruments
Refer to section 7 above for information relating to the fair value of financial guarantees and hedge structures.
12. Other
Additional information relating to the Company, including the Company's Annual Information Form, is available on SEDAR atwww.sedar.com.
12.1 International financial reporting standards
The Company has converted its accounting framework to IFRS on January 1, 2011. The adoption of IFRS principles has not had a material effect on the manner in which the Company reports its accounts.
The Company’s IFRS conversion project began during 2009. A formal project plan, governance structure and a project team, including an external advisor, were established. The project philosophy was to align with current accounting practices and, where possible, to minimize the impact of any changes to the business. Regular reporting was provided to senior management and the Audit Committee of the Board of Directors.
25
| | MANAGEMENT'S DISCUSSION AND ANALYSIS | |
| QUARTER ENDED SEPTEMBER 30, 2011 |
The IFRS conversion project consisted of four phases: diagnostic; design and planning; implementation; and post implementation. The impact of the conversion to IFRS is set out in note 11 to the interim consolidated financial statements for the quarter ended September 30, 2011.
The conversion to IFRS has had a low impact on the financial record keeping, internal control and financial disclosure of the Company due to the historical exploration and project development nature of the Company’s business. Accounting systems have been assessed and re-configured to ensure accurate reporting under IFRS, both internally and externally. The Company’s key financial staff has been trained in IFRS and the majority of them have been exposed to reporting under IFRS for five years or more.
12.2 Non GAAP measures
The Company makes reference to certain non-GAAP measures in its reporting and believes that these measures, in addition to conventional measures prepared in accordance with GAAP, are used by certain investors to evaluate the Company’s performance and ability to generate cash flow. Accordingly, these measures are intended to provide additional information and should not be considered in isolation or as a substitute for measures of performance prepared in accordance with GAAP.
Cash production cost
The Company reports cash production cost of ounces sold and tonnes produced. In the gold mining industry this is a common performance measure but does not have any standardized meaning. Cash production cost includes direct development, mining, royalties, transport and processing costs incurred in the recovery of and disposal of Au and Ag as well as allocated overhead charges.
The reconciliation of production cost to cash production cost is presented below:
| 3 months ended September 30, | 3 months ended September 30, | |||||||||||
| 2011 | 2010 | |||||||||||
| Nevada | South Africa | Nevada3 | South Africa | |||||||||
| ($’000) | ($’000) | ($’000) | ($’000) | |||||||||
| Production cost relating to metal sold | $ | 15,070 | $ | 15,483 | $ | 9,848 | - | |||||
| Less non-cash overhead costs | ||||||||||||
| included in production cost. | (507 | ) | (605 | ) | (576 | ) | - | |||||
| Total cash production costs for theperiod | $ | 14,653 | $ | 14,878 | $ | 9,272 | - | |||||
| Au eqv oz sold | 22,790 | 6,518 | 10,845 | - | ||||||||
| Ore tonnes processed | 24,300 | 193,221 | 14,575 | - | ||||||||
| Cash production cost per Au eqv oz | $ | 639 | $ | 2,283 | $ | 854 | - | |||||
| Cash production cost per tonne | $ | 603 | $ | 77 | $ | 635 | - | |||||
___________________________________________________
3Nevada results for the 3 and 9 months ended September 30, 2010 excludes production costs and sales relating to third party milling agreements.
26
| | MANAGEMENT'S DISCUSSION AND ANALYSIS | |
| QUARTER ENDED SEPTEMBER 30, 2011 |
| 9 months ended September 30, | 9 months ended September 30, | |||||||||||
| 2011 | 2010 | |||||||||||
| Nevada | South Africa | Nevada | South Africa | |||||||||
| ($’000) | ($’000) | ($’000) | ($’000) | |||||||||
| Production cost relating to metal sold | $ | 48,362 | $ | 26,371 | $ | 26,060 | - | |||||
| Less non-cash overhead costs | ||||||||||||
| included in production cost. | (1,069 | ) | (1,010 | ) | (1,525 | ) | - | |||||
| Total cash production costs for theperiod | $ | 47,293 | $ | 25,361 | $ | 24,535 | - | |||||
| Au eqv oz sold | 74,636 | 14,931 | 30,693 | - | ||||||||
| Ore tonnes processed | 70,904 | 396,266 | 39,923 | - | ||||||||
| Cash production cost per Au eqv oz | $ | 634 | $ | 1,699 | $ | 799 | - | |||||
| Cash production cost per tonne | $ | 667 | $ | 64 | $ | 615 | - | |||||
Adjusted loss per share
Adjusted loss per share is used by the Company to compare quarterly and annual results on a sustaining basis by eliminating certain fair value adjustments and out of the ordinary expenses incurred. The reconciliation of loss per share to adjusted loss per share is presented below:
| 3 months ended | 9 months ended | |||||||||||
| September 30, | September 30, | September 30, | September 30, | |||||||||
| 2011 | 2010 | 2011 | 2010 | |||||||||
| ($’000 | ) | ($’000 | ) | ($’000 | ) | ($’000 | ) | |||||
| Loss for the period | ($33,987 | ) | ($23,337 | ) | ($55,379 | ) | ($34,326 | ) | ||||
| Loss with settlement of SSN | - | - | $ | 8,817 | - | |||||||
| Net unrealized loss on financial instruments | $ | 10 | $ | 3,606 | $ | 7,219 | $ | 3,606 | ||||
| Net unrealized mark-to-market adjustment on financial instruments | $ | 19,670 | $ | 3,699 | $ | 19,849 | $ | 3,699 | ||||
| Other | - | - | $ | 232 | - | |||||||
| Adjusted loss for the period | ($14,307 | ) | ($16,032 | ) | ($19,262 | ) | ($27,021 | ) | ||||
| Weighted average number of common shares outstanding (‘000) | 473,856 | 351,739 | 453,501 | 343,135 | ||||||||
| Adjusted loss per share | $ | 0.03 | $ | 0.05 | $ | 0.04 | $ | 0.08 | ||||
12.3 Disclosure Controls and Procedures
The Chief Executive Officer (“CEO”) and Chief Financial Officer (“CFO”) are responsible for establishing and maintaining adequate disclosure controls and procedures. Disclosure controls and procedures are designed to ensure that information required to be disclosed in the Company’s filings under securities legislation is accumulated and communicated to management, including the CEO and CFO as appropriate, to allow timely decisions regarding public disclosure. They are designed to provide reasonable assurance that all information required to be disclosed in these filings is recorded, processed, summarized and reported within the time periods specified in securities legislation. The Company evaluates its disclosure controls and procedures annually.
It should be noted that while our officers believe that our disclosure controls and procedures provide a reasonable level of assurance with regard to their effectiveness, they do not expect that the disclosure controls and procedures or internal controls over financial reporting will prevent all errors and fraud. A control system, no matter how well conceived or operated, can only provide reasonable, but not absolute, assurance that the objectives of the control system are met.
27
| | MANAGEMENT'S DISCUSSION AND ANALYSIS | |
| QUARTER ENDED SEPTEMBER 30, 2011 |
Except for the impact of converting the Company’s accounting framework to IFRS as noted in section 12.1 above, there have been no other significant changes in disclosure controls and procedures during the period ended September 30, 2011, that could have affected or are reasonably likely to affect the Company’s internal control over financial reporting.
12.4 Internal Control over Financial Reporting
Management is responsible for establishing and maintaining adequate internal control over financial reporting to provide reasonable assurance regarding the reliability of financial reporting and the preparation of financial statements for external purposes in accordance with GAAP. Internal control over financial reporting includes those policies and procedures that: (1) pertain to the maintenance of records that in reasonable detail accurately and fairly reflect the transactions and dispositions of the assets of the Company, (2) provide reasonable assurance that transactions are recorded as necessary to permit preparation of financial statements in accordance with GAAP, and that receipts and expenditures of the Company are being made only in accordance with authorizations of management and directors of the Company, and (3) provide reasonable assurance regarding prevention or timely detection of unauthorized acquisition, use or disposition of the Company’s assets that could have a material effect on the financial statements.
During 2010 the Company has designed and implemented relevant internal controls in response to the Company’s transition from developer to producer with further internal controls implemented during 2011 in response to the Burnstone production build-up. These include new internal controls addressing revenue recognition, inventory and production costs, depletion, depreciation and development costs incurred following commencement of commercial production. The implementation of these internal controls over financial reporting will have a material impact and are reasonably likely to affect our internal control over financial reporting.
There have been no other significant changes in internal controls over financial reporting that have affected or are reasonably likely to affect our internal control over financial reporting during the period ended September 30, 2011.
28