UNITED STATES
SECURITIES AND EXCHANGE COMMISSION
Washington, D.C. 20549
FORM N-CSR
CERTIFIED SHAREHOLDER REPORT OF REGISTERED
MANAGEMENT INVESTMENT COMPANIES
Investment Company Act file number 811-06135
Templeton Institutional Funds
(Exact name of registrant as specified in charter)
300 S.E. 2nd Street, Fort Lauderdale, FL 33301-1923
(Address of principal executive offices) (Zip code)
Alison Baur
Franklin Templeton
One Franklin Parkway
San Mateo, CA 94403-1906
(Name and address of agent for service)
Registrant’s telephone number, including area code: (954) 527-7500
Date of fiscal year end: December 31
Date of reporting period: December 31, 2024
| ITEM 1. | REPORT TO STOCKHOLDERS. |
(a) The Report to Shareholders is filed herewith
| | |
TIF Foreign Smaller Companies Series | |
| Advisor Class [TFSCX] |
| Annual Shareholder Report | December 31, 2024 |
|
This annual shareholder report contains important information about TIF Foreign Smaller Companies Series for the period January 1, 2024, to December 31, 2024.
You can find additional information about the Fund at https://www.franklintempleton.com/regulatory-fund-documents. You can also request this information by contacting us at (800) 321-8563.
WHAT WERE THE FUND COSTS FOR THE LAST YEAR? (based on a hypothetical $10,000 investment)
| | |
Class Name | Costs of a $10,000 investment | Costs paid as a percentage of a $10,000 investment* |
| Advisor Class | $109 | 1.10% |
| * | Reflects fee waivers and/or expense reimbursements, without which expenses would have been higher. |
HOW DID THE FUND PERFORM LAST YEAR AND WHAT AFFECTED ITS PERFORMANCE?
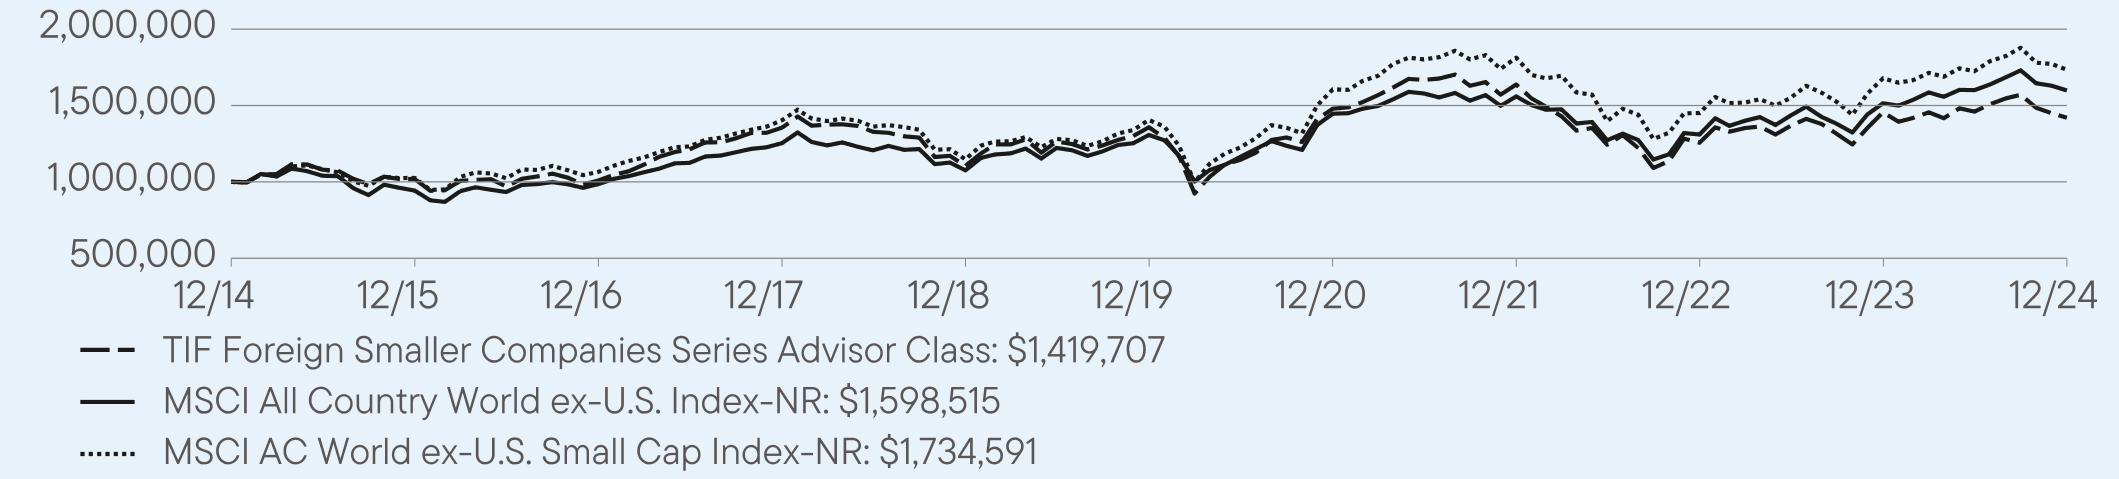
For the twelve months ended December 31, 2024, Advisor Class shares of TIF Foreign Smaller Companies Series (Fund) returned -2.49%. The Fund compares its performance to the MSCI AC World ex-U.S. Small Cap Index-NR, which returned 3.36% for the same period.
| |
Top contributors to performance: |
| ↑ | Stock selection in the consumer discretionary, real estate and communication services sectors contributed to relative performance for the year. |
| ↑ | Geographically, stock selection in Canada and Japan contributed to relative returns. |
| ↑ | Asics (Japan), Tsumura (Japan), Johnson Health Tech (Taiwan), OneSpaWorld (Bahamas) and Topcon (Japan). |
| |
Top detractors from performance: |
| ↓ | Stock selection in the industrial, consumer staples and information technology sectors detracted from relative performance for the year. |
| ↓ | Geographically, stock selection and overweights in the Eurozone and Latin America detracted from relative returns. |
| ↓ | i-SENS (South Korea), Dexco (Brazil), Hana Microelectronics (South Korea), Sanlorenzo (Italy) and M. Dias Branco (Brazil). |
| TIF Foreign Smaller Companies Series | PAGE 1 | 458-ATSR-0225 |
HOW DID THE FUND PERFORM OVER THE LAST 10 YEARS?
The Fund’s past performance is not necessarily an indication of how the Fund will perform in the future. The graph and table do not reflect the deduction of taxes that a shareholder would pay on Fund distributions or redemption of Fund shares.
VALUE OF A $1,000,000 INVESTMENT – Advisor Class 12/31/2014 — 12/31/2024
AVERAGE ANNUAL TOTAL RETURNS (%) Period Ended December 31, 2024
| | | |
| | 1 Year | 5 Year | 10 Year |
Advisor Class | -2.49 | 0.90 | 3.57 |
MSCI All Country World ex-U.S. Index-NR | 5.53 | 4.10 | 4.80 |
MSCI AC World ex-U.S. Small Cap Index-NR | 3.36 | 4.30 | 5.66 |
Fund performance figures may reflect fee waivers and/or expense reimbursements, without which the performance would have been lower.
For current month-end performance, please call Franklin Templeton at (800) 321-8563 or visit ftinstitutional.com.
Important data provider notices and terms available at www.franklintempletondatasources.com.
KEY FUND STATISTICS (as of December 31, 2024)
| |
Total Net Assets | $111,846,256 |
Total Number of Portfolio Holdings* | 104 |
Total Management Fee Paid | $1,485,884 |
Portfolio Turnover Rate | 29.65% |
| * | Does not include derivatives, except purchased options, if any. |
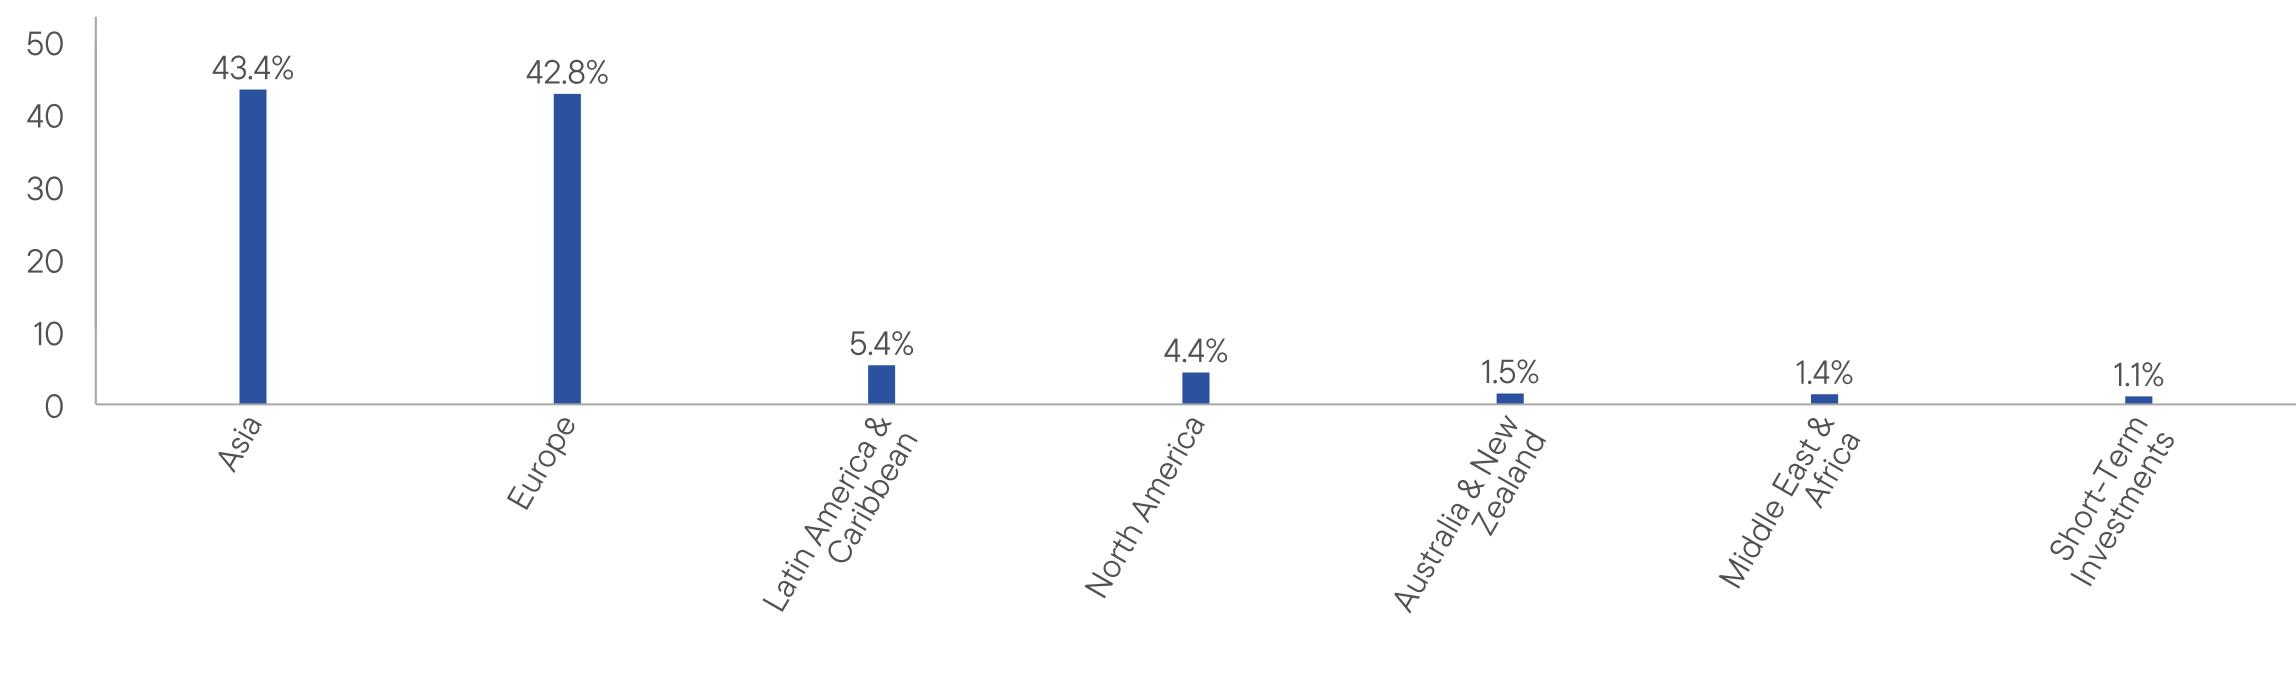
WHAT DID THE FUND INVEST IN? (as of December 31, 2024)
Portfolio Composition* (% of Total Investments)
| * | Does not include derivatives, except purchased options, if any. |
| TIF Foreign Smaller Companies Series | PAGE 2 | 458-ATSR-0225 |
| |
| WHERE CAN I FIND ADDITIONAL INFORMATION ABOUT THE FUND? |
Additional information is available on https://www.franklintempleton.com/regulatory-fund-documents, including its: |
| • prospectus • proxy voting information • financial information • holdings • tax information |
HOUSEHOLDING
You will receive the Fund’s shareholder reports every six months. In addition, you will receive an annual updated summary prospectus (detail prospectus available upon request). To reduce Fund expenses, we try to identify related shareholders in a household and send only one copy of the shareholder reports and summary prospectus. This process, called “householding,” will continue indefinitely unless you instruct us otherwise. If you prefer not to have these documents householded, please call us at (800) 321-8563. At any time, you may view current prospectuses/summary prospectuses and shareholder reports on our website. If you choose, you may receive these documents through electronic delivery.
| TIF Foreign Smaller Companies Series | PAGE 3 | 458-ATSR-0225 |
100000010187831010088135533411048741357475147902616375681256318145601214197071000000943379985785125383710758181307280144653115597081310106151469115985151000000102602710661291403511114806214054631605632181317714510331678242173459143.442.85.44.41.51.41.1
| | |
TIF International Equity Series | |
| Primary Shares [TFEQX] |
| Annual Shareholder Report | December 31, 2024 |
|
This annual shareholder report contains important information about TIF International Equity Series for the period January 1, 2024, to December 31, 2024.
You can find additional information about the Fund at https://www.franklintempleton.com/regulatory-fund-documents. You can also request this information by contacting us at (800) 321-8563.
WHAT WERE THE FUND COSTS FOR THE LAST YEAR? (based on a hypothetical $10,000 investment)
| | |
Class Name | Costs of a $10,000 investment | Costs paid as a percentage of a $10,000 investment* |
| Primary Shares | $96 | 0.92% |
| * | Reflects fee waivers and/or expense reimbursements, without which expenses would have been higher. |
HOW DID THE FUND PERFORM LAST YEAR AND WHAT AFFECTED ITS PERFORMANCE?
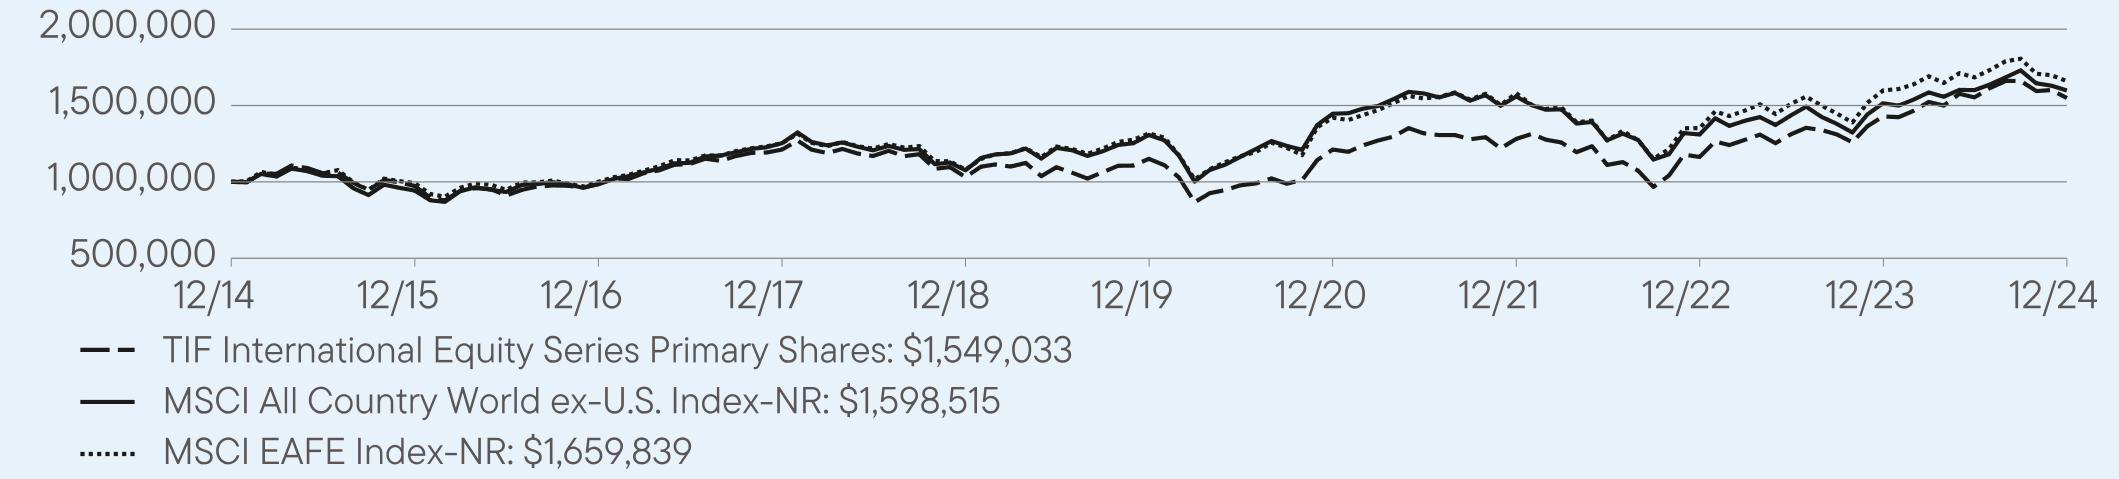
For the twelve months ended December 31, 2024, Primary Shares of TIF International Equity Series (Fund) returned 8.40%. The Fund compares its performance to the MSCI All Country World ex-U.S. Index-NR and the MSCI EAFE Index-NR, which returned 5.53% and 3.82%, respectively, for the same period.
| |
Top contributors to performance: |
| ↑ | Stock selection in the materials, financials and industrials sectors contributed to relative performance for the year. In materials, we continued to favor construction materials firms offering strong economic and secular tailwinds as well as packaging companies and industrial metals firms that, in our analysis, have sound balance sheets, good cost positions and upside exposure to structural demand drivers such as electrification and the green energy transition. |
| ↑ | Geographically, stock selection in Japan and the Eurozone contributed to relative returns. We continued to favor Japanese companies that, in our view, benefit from domestic tailwinds such as corporate reforms to boost returns on shareholder equity. The majority of our European holdings are globally focused, with a reach far outside their domestic market. |
| ↑ | Sumitomo Mitsui Financial Group (Japan), Hitachi (Japan), Deutsche Telekom (Germany), CRH (Ireland) and Standard Chartered (United Kingdom). |
| |
Top detractors from performance: |
| ↓ | Stock selection in the consumer discretionary and health care sectors and an overweight and stock selection in the energy sector detracted from relative performance for the year. In health care, we remained focused on fundamentals, including free cash flow generation, cost discipline, earnings growth trajectories, competitive advantages and structural growth drivers. |
| ↓ | Geographically, lack of exposure to China and stock selection in the U.K. detracted. We maintained a zero weighting in China and do not believe recent stimulus measures are enough to address longer-term structural issues. Long-term fundamental analysis of individual companies has led us to favor indirect Chinese exposure and other Asian-market equities. |
| ↓ | Adecco Group (Switzerland), Kering (France), Samsung Electronics (South Korea), ICON (Ireland) and BP (United Kingdom). |
| TIF International Equity Series | PAGE 1 | 454-ATSR-0225 |
HOW DID THE FUND PERFORM OVER THE LAST 10 YEARS?
The Fund’s past performance is not necessarily an indication of how the Fund will perform in the future. The graph and table do not reflect the deduction of taxes that a shareholder would pay on Fund distributions or redemption of Fund shares.
VALUE OF A $1,000,000 INVESTMENT – Primary Shares 12/31/2014 — 12/31/2024
AVERAGE ANNUAL TOTAL RETURNS (%) Period Ended December 31, 2024
| | | |
| | 1 Year | 5 Year | 10 Year |
Primary Shares | 8.40 | 6.12 | 4.47 |
MSCI All Country World ex-U.S. Index-NR | 5.53 | 4.10 | 4.80 |
MSCI EAFE Index-NR | 3.82 | 4.73 | 5.20 |
Fund performance figures may reflect fee waivers and/or expense reimbursements, without which the performance would have been lower.
For current month-end performance, please call Franklin Templeton at (800) 321-8563 or visit ftinstitutional.com.
Important data provider notices and terms available at www.franklintempletondatasources.com.
KEY FUND STATISTICS (as of December 31, 2024)
| |
Total Net Assets | $101,339,074 |
Total Number of Portfolio Holdings* | 53 |
Total Management Fee Paid | $771,803 |
Portfolio Turnover Rate | 30.90% |
| * | Does not include derivatives, except purchased options, if any. |
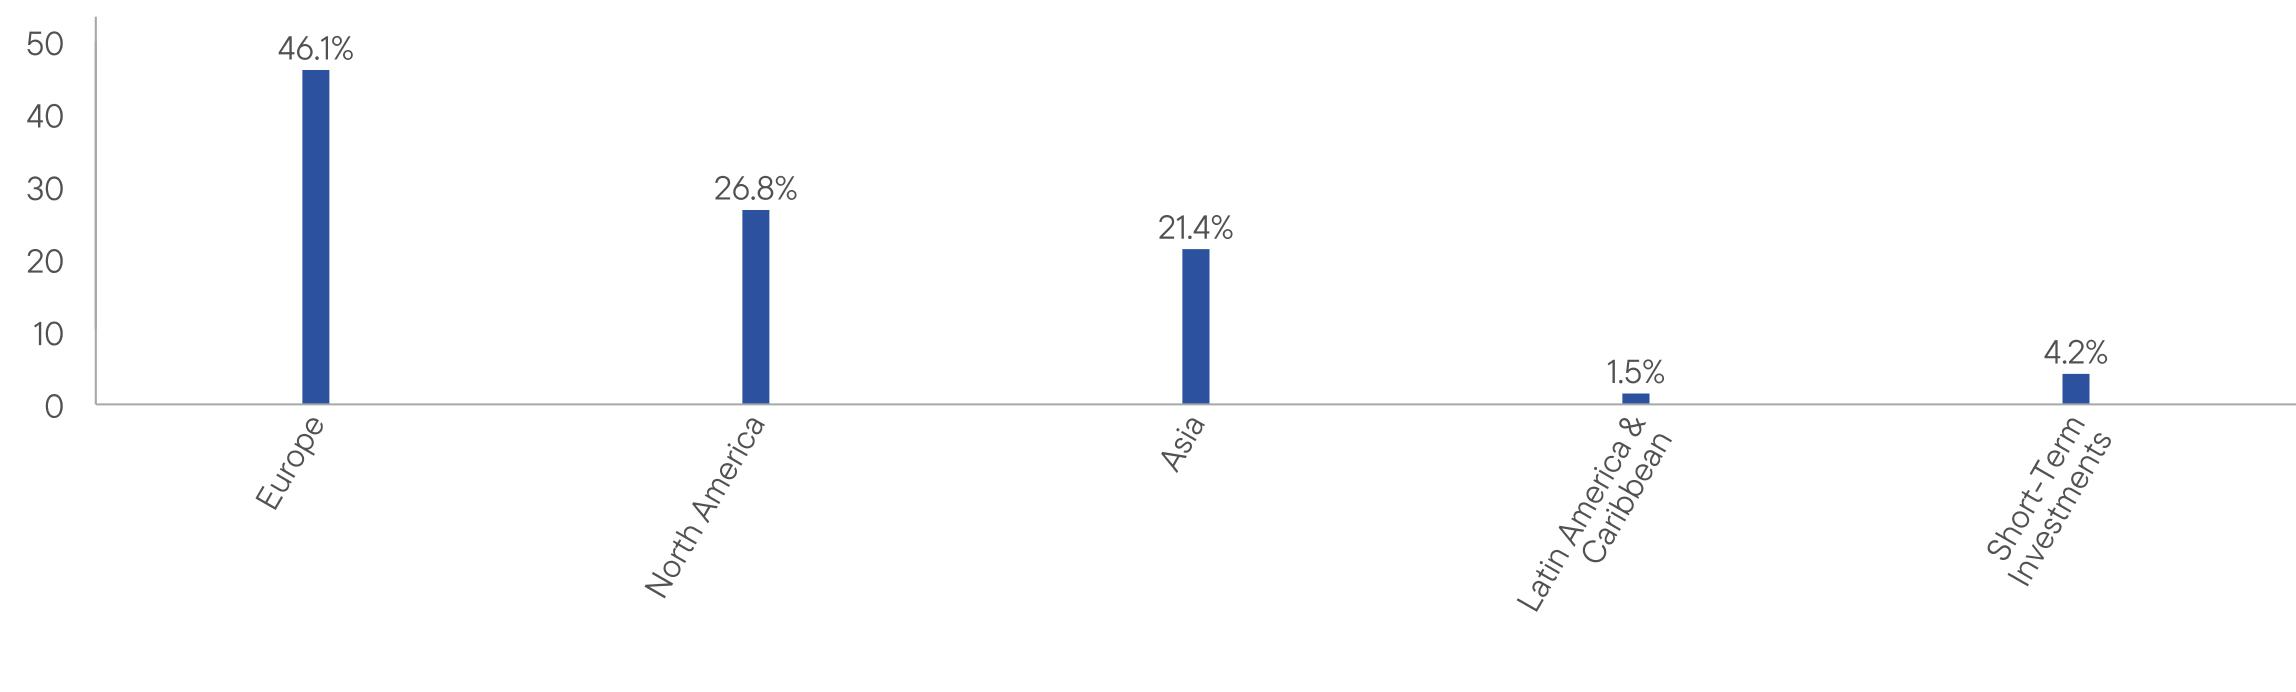
WHAT DID THE FUND INVEST IN? (as of December 31, 2024)
Portfolio Composition* (% of Total Investments)
| * | Does not include derivatives, except purchased options, if any. |
| TIF International Equity Series | PAGE 2 | 454-ATSR-0225 |
| |
| WHERE CAN I FIND ADDITIONAL INFORMATION ABOUT THE FUND? |
Additional information is available on https://www.franklintempleton.com/regulatory-fund-documents, including its: |
| • prospectus • proxy voting information • financial information • holdings • tax information |
HOUSEHOLDING
You will receive the Fund’s shareholder reports every six months. In addition, you will receive an annual updated summary prospectus (detail prospectus available upon request). To reduce Fund expenses, we try to identify related shareholders in a household and send only one copy of the shareholder reports and summary prospectus. This process, called “householding,” will continue indefinitely unless you instruct us otherwise. If you prefer not to have these documents householded, please call us at (800) 321-8563. At any time, you may view current prospectuses/summary prospectuses and shareholder reports on our website. If you choose, you may receive these documents through electronic delivery.
| TIF International Equity Series | PAGE 3 | 454-ATSR-0225 |
100000097326898591212118401031620115095012119771281628116330414289481549033100000094337998578512538371075818130728014465311559708131010615146911598515100000099185810017791252568107983513175561420532158053313521191598717165983946.126.821.41.54.2
| | |
TIF International Equity Series | |
| Service Shares [TFESX] |
| Annual Shareholder Report | December 31, 2024 |
|
This annual shareholder report contains important information about TIF International Equity Series for the period January 1, 2024, to December 31, 2024.
You can find additional information about the Fund at https://www.franklintempleton.com/regulatory-fund-documents. You can also request this information by contacting us at (800) 321-8563.
This report describes changes to the Fund that occurred during the reporting period.
WHAT WERE THE FUND COSTS FOR THE LAST YEAR? (based on a hypothetical $10,000 investment)
| | |
Class Name | Costs of a $10,000 investment | Costs paid as a percentage of a $10,000 investment* |
| Service Shares | $120 | 1.15% |
| * | Reflects fee waivers and/or expense reimbursements, without which expenses would have been higher. |
HOW DID THE FUND PERFORM LAST YEAR AND WHAT AFFECTED ITS PERFORMANCE?
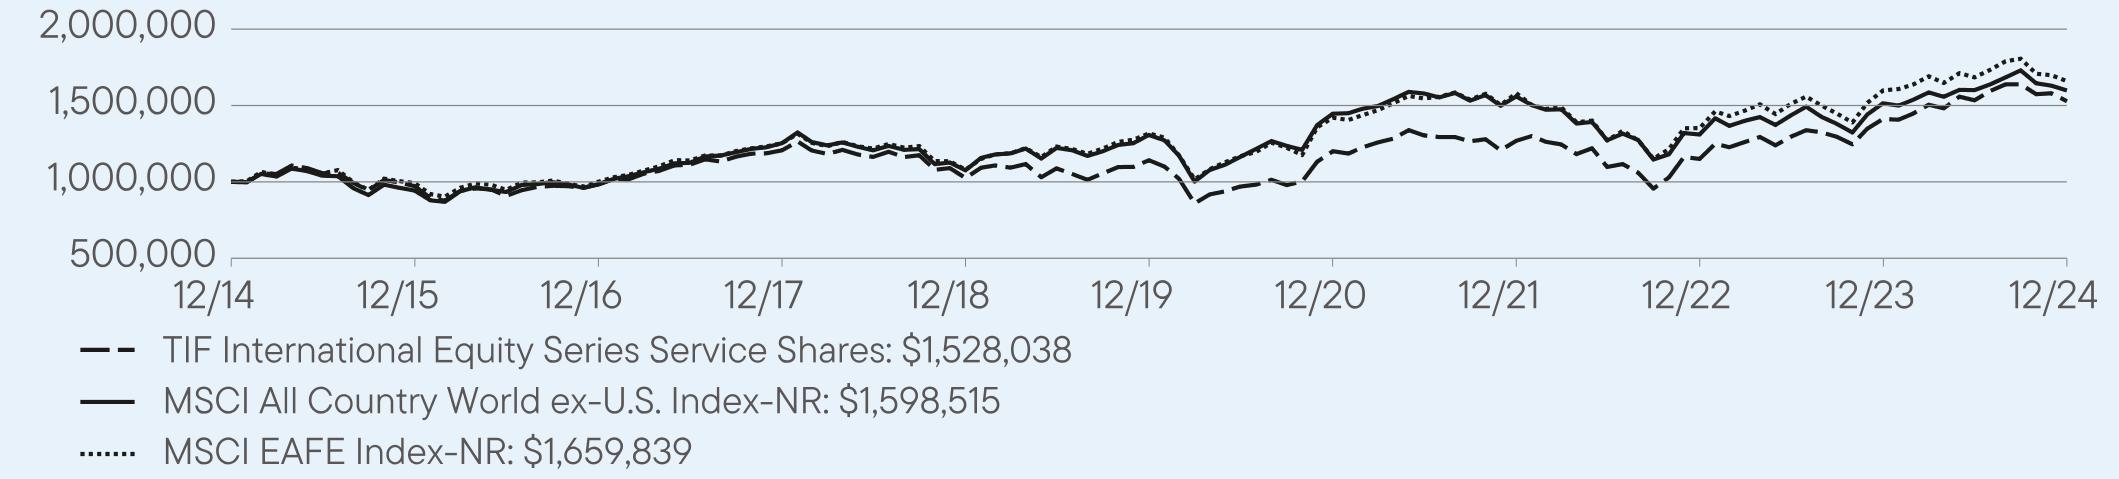
For the twelve months ended December 31, 2024, Service Shares of TIF International Equity Series (Fund) returned 8.21%. The Fund compares its performance to the MSCI All Country World ex-U.S. Index-NR and the MSCI EAFE Index-NR, which returned 5.53% and 3.82%, respectively, for the same period.
| |
Top contributors to performance: |
| ↑ | Stock selection in the materials, financials and industrials sectors contributed to relative performance for the year. In materials, we continued to favor construction materials firms offering strong economic and secular tailwinds as well as packaging companies and industrial metals firms that, in our analysis, have sound balance sheets, good cost positions and upside exposure to structural demand drivers such as electrification and the green energy transition. |
| ↑ | Geographically, stock selection in Japan and the Eurozone contributed to relative returns. We continued to favor Japanese companies that, in our view, benefit from domestic tailwinds such as corporate reforms to boost returns on shareholder equity. The majority of our European holdings are globally focused, with a reach far outside their domestic market. |
| ↑ | Sumitomo Mitsui Financial Group (Japan), Hitachi (Japan), Deutsche Telekom (Germany), CRH (Ireland) and Standard Chartered (United Kingdom). |
| |
Top detractors from performance: |
| ↓ | Stock selection in the consumer discretionary and health care sectors and an overweight and stock selection in the energy sector detracted from relative performance for the year. In health care, we remained focused on fundamentals, including free cash flow generation, cost discipline, earnings growth trajectories, competitive advantages and structural growth drivers. |
| ↓ | Geographically, lack of exposure to China and stock selection in the U.K. detracted. We maintained a zero weighting in China and do not believe recent stimulus measures are enough to address longer-term structural issues. Long-term fundamental analysis of individual companies has led us to favor indirect Chinese exposure and other Asian-market equities. |
| ↓ | Adecco Group (Switzerland), Kering (France), Samsung Electronics (South Korea), ICON (Ireland) and BP (United Kingdom). |
| TIF International Equity Series | PAGE 1 | 444-ATSR-0225 |
HOW DID THE FUND PERFORM OVER THE LAST 10 YEARS?
The Fund’s past performance is not necessarily an indication of how the Fund will perform in the future. The graph and table do not reflect the deduction of taxes that a shareholder would pay on Fund distributions or redemption of Fund shares.
VALUE OF A $1,000,000 INVESTMENT – Service Shares 12/31/2014 — 12/31/2024
AVERAGE ANNUAL TOTAL RETURNS (%) Period Ended December 31, 2024
| | | |
| | 1 Year | 5 Year | 10 Year |
Service Shares | 8.21 | 6.00 | 4.33 |
MSCI All Country World ex-U.S. Index-NR | 5.53 | 4.10 | 4.80 |
MSCI EAFE Index-NR | 3.82 | 4.73 | 5.20 |
Fund performance figures may reflect fee waivers and/or expense reimbursements, without which the performance would have been lower.
For current month-end performance, please call Franklin Templeton at (800) 321-8563 or visit ftinstitutional.com.
Important data provider notices and terms available at www.franklintempletondatasources.com.
KEY FUND STATISTICS (as of December 31, 2024)
| |
Total Net Assets | $101,339,074 |
Total Number of Portfolio Holdings* | 53 |
Total Management Fee Paid | $771,803 |
Portfolio Turnover Rate | 30.90% |
| * | Does not include derivatives, except purchased options, if any. |
WHAT DID THE FUND INVEST IN? (as of December 31, 2024)
Portfolio Composition* (% of Total Investments)
| * | Does not include derivatives, except purchased options, if any. |
| TIF International Equity Series | PAGE 2 | 444-ATSR-0225 |
HOW HAS THE FUND CHANGED?
The net expense ratio increased during the period primarily due to an increase in transfer agency fees.
This is a summary of certain changes to the Fund since January 1, 2024. For more complete information, you may review the Fund’s current prospectus and any applicable supplements and the Fund’s next prospectus, which we expect to be available by May 1, 2025, at https://www.franklintempleton.com/regulatory-fund-documents or upon request at (800) 321-8563 or
prospectus@franklintempleton.com.
| |
| WHERE CAN I FIND ADDITIONAL INFORMATION ABOUT THE FUND? |
Additional information is available on https://www.franklintempleton.com/regulatory-fund-documents, including its: |
| • prospectus • proxy voting information • financial information • holdings • tax information |
HOUSEHOLDING
You will receive the Fund’s shareholder reports every six months. In addition, you will receive an annual updated summary prospectus (detail prospectus available upon request). To reduce Fund expenses, we try to identify related shareholders in a household and send only one copy of the shareholder reports and summary prospectus. This process, called “householding,” will continue indefinitely unless you instruct us otherwise. If you prefer not to have these documents householded, please call us at (800) 321-8563. At any time, you may view current prospectuses/summary prospectuses and shareholder reports on our website. If you choose, you may receive these documents through electronic delivery.
| TIF International Equity Series | PAGE 3 | 444-ATSR-0225 |
100000097195898318012066461025478114174212006291268909114992314120911528038100000094337998578512538371075818130728014465311559708131010615146911598515100000099185810017791252568107983513175561420532158053313521191598717165983946.126.821.41.54.2
(b) Not applicable
(a) The Registrant has adopted a code of ethics that applies to its principal executive officers and principal financial and accounting officer.
(c) N/A
(d) N/A
(f) Pursuant to Item 19(a) (1), the Registrant is attaching as an exhibit a copy of its code of ethics that applies to its principal executive officers and principal financial and accounting officer.
| ITEM 3. | AUDIT COMMITTEE FINANCIAL EXPERT. |
| | | |
| | | The Board of Trustees of the Registrant has determined that Ann Torre Bates and David W. Niemiec possess the technical attributes identified in Instruction 2(b) of Item 3 to Form N-CSR to qualify as an “audit committee financial expert,” and has designated Ann Torre Bates and David W. Niemiec as the Audit Committee’s financial experts. Ann Torre Bates and David W. Niemiec are “independent” Trustees pursuant to paragraph (a) (2) of Item 3 to Form N-CSR. |
| ITEM 4. | PRINCIPAL ACCOUNTANT FEES AND SERVICES. |
(a) Audit Fees. The aggregate fees billed in the last two fiscal years ending December 31, 2023 and December 31, 2024 (the “Reporting Periods”) for professional services rendered by the Registrant’s principal accountant (the “Auditor”) for the audit of the Registrant’s annual financial statements, or services that are normally provided by the Auditor in connection with the statutory and regulatory filings or engagements for the Reporting Periods, were $82,442 in December 31, 2023 and $85,081 in December 31, 2024.
(b) Audit-Related Fees. The aggregate fees billed in the Reporting Periods for assurance and related services by the Auditor that are reasonably related to the performance of the Registrant’s financial statements were $3,000 in December 31, 2023 and $0 in December 31, 2024. The services for which these fees were paid included attestation services.
(c) Tax Fees. The aggregate fees billed in the Reporting Periods for professional services rendered by the Auditor for tax compliance, tax advice and tax planning (“Tax Services”) were $0 in December 31, 2023 and $21,000 in December 31, 2024. These services consisted of (i) review or preparation of U.S. federal, state, local and excise tax returns; (ii) U.S. federal, state and local tax planning, advice and assistance regarding statutory, regulatory or administrative developments, and (iii) tax advice regarding tax qualification matters and/or treatment of various financial instruments held or proposed to be acquired or held.
There were no fees billed for tax services by the Auditor to the Registrant’s investment adviser and any entity controlling, controlled by, or under common control with the investment adviser that provides ongoing services to the Registrant (“Service Affiliates”) during the Reporting Periods that required pre-approval by the Audit Committee.
(d) All Other Fees. The aggregate fees billed in the Reporting Periods for products and services provided by the Auditor to the Registrant, other than the services reported in paragraphs (a) through (c) of this item, were $0 in December 31, 2023 and $0 in December 31, 2024.
There were no other non-audit services rendered by the Auditor to the Service Affiliates requiring pre-approval by the Audit Committee in the Reporting Periods.
(e) Audit Committee’s pre-approval policies and procedures described in paragraph (c) (7) of Rule 2-01 of Regulation S-X.
(1) The Registrant’s Audit Committee is directly responsible for approving the services to be provided by the Auditors, including:
(i) pre-approval of all audit and audit related services;
(ii) pre-approval of all non-audit related services to be provided to the Registrant by the Auditors;
(iii) pre-approval of all non-audit related services to be provided by the Auditors to the Registrant and the Service Affiliates where the non-audit services relate directly to the operations or financial reporting of the Registrant; and
(iv) establishment by the Audit Committee, if deemed necessary or appropriate, as an alternative to committee pre-approval of services to be provided by the Auditors, as required by paragraphs (ii) and (iii) above, of policies and procedures to permit such services to be pre-approved by other means, such as through establishment of guidelines or by action of a designated member or members of the committee; provided the policies and procedures are detailed as to the particular service and the committee is informed of each service and such policies and procedures do not include delegation of Audit Committee responsibilities, as contemplated under the Securities Exchange Act of 1934, to management; subject, in the case of (ii) through (iv), to any waivers, exceptions or exemptions that may be available under applicable law or rules.
(2) None of the services described in paragraphs (b) through (d) of this Item were performed in reliance on paragraph (c)(7)(i)(C) of Rule 2-01 of Regulation S-X.
(f) Not applicable.
(g) Non-audit fees billed by the Auditor for services rendered to the Registrant and the Service Affiliates during the Reporting Periods were $118,626 in December 31, 2023 and $182,840 in December 31, 2024.
(h) Yes. The Registrant’s audit committee has considered whether the provision of non-audit services that were rendered to Service Affiliates, which were not pre-approved (not requiring pre-approval), is compatible with maintaining the Auditor’s independence. All services provided by the Auditor to the Registrant or to the Service Affiliates, which were required to be pre-approved, were pre-approved as required.
(i) Not applicable.
(j) Not applicable.
| ITEM 5. | AUDIT COMMITTEE OF LISTED REGISTRANTS. |
| ITEM 6. | SCHEDULE OF INVESTMENTS. |
| (a) | Please see schedule of investments contained in the Financial Statements and Financial Highlights included under Item 7 of this Form N-CSR. |
| ITEM 7. | FINANCIAL STATEMENTS AND FINANCIAL HIGLIGHTS FOR OPEN-END MANAGEMENT INVESTMENT COMPANIES. |
Templeton
Institutional
Funds
Financial
Statements
and
Other
Important
Information
Annual
|
December 31, 2024
Foreign
Smaller
Companies
Series
International
Equity
Series
Financial
Statements
and
Other
Important
Information—Annual
Financial
Highlights
and
Schedules
of
Investments
2
Financial
Statements
13
Notes
to
Financial
Statements
16
Report
of
Independent
Registered
Public
Accounting
Firm
30
Tax
Information
31
Changes
In
and
Disagreements
with
Accountants
32
Results
of
Meeting(s)
of
Shareholders
32
Remuneration
Paid
to
Directors,
Officers
and
Others
32
Board
Approval
of
Management
and
Subadvisory
Agreements
32
Templeton
Institutional
Funds
Financial
Highlights
Foreign
Smaller
Companies
Series
Annual
Report
The
accompanying
notes
are
an
integral
part
of
these
financial
statements.
a
Year
Ended
December
31,
2024
2023
2022
2021
2020
Per
share
operating
performance
(for
a
share
outstanding
throughout
the
year)
Net
asset
value,
beginning
of
year
...................
$18.67
$16.35
$21.80
$23.03
$21.40
Income
from
investment
operations
a
:
Net
investment
income
b
.........................
0.28
0.26
0.31
0.28
0.17
Net
realized
and
unrealized
gains
(losses)
...........
(0.72)
2.30
(5.38)
2.07
1.74
Total
from
investment
operations
....................
(0.44)
2.56
(5.07)
2.35
1.91
Less
distributions
from:
Net
investment
income
..........................
(0.63)
(0.24)
(0.32)
(0.28)
(0.22)
Net
realized
gains
.............................
(1.66)
—
(0.06)
(3.30)
(0.06)
Total
distributions
...............................
(2.29)
(0.24)
(0.38)
(3.58)
(0.28)
Net
asset
value,
end
of
year
.......................
$15.94
$18.67
$16.35
$21.80
$23.03
Total
return
....................................
(2.49)%
15.75%
(23.19)%
10.72%
8.95%
Ratios
to
average
net
assets
Expenses
before
waiver
and
payments
by
affiliates
......
1.10%
1.09%
1.02%
1.04%
1.04%
Expenses
net
of
waiver
and
payments
by
affiliates
.......
1.10%
c
1.09%
c
1.02%
c
1.04%
c
1.03%
Net
investment
income
...........................
1.50%
1.49%
1.76%
1.13%
0.87%
Supplemental
data
Net
assets
,
end
of
year
(000’s)
.....................
$111,846
$191,256
$353,380
$739,717
$725,098
Portfolio
turnover
rate
............................
29.65%
36.62%
16.54%
31.09%
34.89%
a
The
amount
shown
for
a
share
outstanding
throughout
the
period
may
not
correlate
with
the
Statement
of
Operations
for
the
period
due
to
the
timing
of
sales
and
repurchases
of
the
Fund’s
shares
in
relation
to
income
earned
and/or
fluctuating
fair
value
of
the
investments
of
the
Fund.
b
Based
on
average
daily
shares
outstanding.
c
Benefit
of
waiver
and
payments
by
affiliates
rounds
to
less
than
0.01%.
Templeton
Institutional
Funds
Schedule
of
Investments,
December
31,
2024
Foreign
Smaller
Companies
Series
The
accompanying
notes
are
an
integral
part
of
these
financial
statements.
Annual
Report
a
a
Industry
Shares
a
Value
a
Common
Stocks
93.9%
Austria
1.1%
a
DO
&
CO
AG
...................
Commercial
Services
&
Supplies
6,620
$
1,234,319
Bahamas
2.0%
OneSpaWorld
Holdings
Ltd.
........
Diversified
Consumer
Services
112,553
2,239,805
Belgium
1.7%
Barco
NV
......................
Electronic
Equipment,
Instruments
&
Components
85,541
925,398
b
Kinepolis
Group
NV
..............
Entertainment
24,827
1,013,426
1,938,824
Brazil
2.7%
Arcos
Dorados
Holdings,
Inc.
,
A
.....
Hotels,
Restaurants
&
Leisure
102,404
745,501
Camil
Alimentos
SA
...............
Food
Products
729,300
691,230
Dexco
SA
......................
Paper
&
Forest
Products
1,195,100
1,150,168
M
Dias
Branco
SA
................
Food
Products
145,600
472,759
3,059,658
Canada
2.6%
b
Canaccord
Genuity
Group,
Inc.
......
Capital
Markets
207,800
1,461,517
Computer
Modelling
Group
Ltd.
......
Software
199,904
1,481,080
2,942,597
China
1.6%
c
JNBY
Design
Ltd.
,
Reg
S
..........
Textiles,
Apparel
&
Luxury
Goods
350,500
789,021
Xtep
International
Holdings
Ltd.
......
Textiles,
Apparel
&
Luxury
Goods
1,309,663
942,862
1,731,883
Denmark
0.6%
Matas
A/S
......................
Specialty
Retail
34,090
641,815
Finland
1.9%
Fiskars
OYJ
Abp
.................
Household
Durables
42,496
657,651
Huhtamaki
OYJ
..................
Containers
&
Packaging
42,566
1,507,761
2,165,412
France
0.6%
Kaufman
&
Broad
SA
.............
Household
Durables
20,607
697,668
Germany
4.6%
Duerr
AG
......................
Machinery
24,662
547,123
Gerresheimer
AG
................
Life
Sciences
Tools
&
Services
9,924
730,591
Jenoptik
AG
....................
Electronic
Equipment,
Instruments
&
Components
41,022
959,314
a,c
Montana
Aerospace
AG
,
144A
,
Reg
S
.
Aerospace
&
Defense
57,096
901,718
Rational
AG
....................
Machinery
1,691
1,448,355
Stabilus
SE
.....................
Machinery
17,181
539,821
5,126,922
Greece
0.7%
JUMBO
SA
.....................
Specialty
Retail
30,596
808,782
Hong
Kong
3.3%
Techtronic
Industries
Co.
Ltd.
.......
Machinery
148,000
1,945,601
VTech
Holdings
Ltd.
..............
Communications
Equipment
254,300
1,724,286
3,669,887
India
1.3%
Exide
Industries
Ltd.
..............
Automobile
Components
291,724
1,416,709
Templeton
Institutional
Funds
Schedule
of
Investments
Foreign
Smaller
Companies
Series
(continued)
Annual
Report
The
accompanying
notes
are
an
integral
part
of
these
financial
statements.
a
a
Industry
Shares
a
Value
a
Common
Stocks
(continued)
Indonesia
0.6%
Industri
Jamu
Dan
Farmasi
Sido
Muncul
Tbk.
PT
......................
Personal
Care
Products
17,554,500
$
643,501
Israel
1.3%
a
Nayax
Ltd.
.....................
Electronic
Equipment,
Instruments
&
Components
51,266
1,507,447
Italy
9.3%
Brunello
Cucinelli
SpA
.............
Textiles,
Apparel
&
Luxury
Goods
13,982
1,527,384
b,c
Carel
Industries
SpA
,
144A
,
Reg
S
...
Building
Products
29,145
559,720
c
Cromwell
European
Real
Estate
Investment
Trust
,
Reg
S
..........
Diversified
REITs
479,100
783,439
Intercos
SpA
....................
Personal
Care
Products
89,223
1,280,501
Interpump
Group
SpA
.............
Machinery
39,696
1,760,509
LU-VE
SpA
.....................
Building
Products
22,941
659,435
Sanlorenzo
SpA
.................
Leisure
Products
49,354
1,661,651
c
Technogym
SpA
,
144A
,
Reg
S
......
Leisure
Products
200,810
2,180,324
10,412,963
Japan
18.7%
Anicom
Holdings,
Inc.
.............
Insurance
121,000
491,834
Asics
Corp.
.....................
Textiles,
Apparel
&
Luxury
Goods
100,300
1,956,631
Bunka
Shutter
Co.
Ltd.
............
Building
Products
63,200
772,001
CKD
Corp.
.....................
Machinery
74,700
1,197,126
Glory
Ltd.
......................
Machinery
37,500
613,163
Idec
Corp.
......................
Electrical
Equipment
43,100
674,972
IDOM,
Inc.
.....................
Specialty
Retail
145,600
1,036,129
Kaneka
Corp.
...................
Chemicals
56,100
1,330,729
MEITEC
Group
Holdings,
Inc.
.......
Professional
Services
96,800
1,815,367
Morinaga
&
Co.
Ltd.
..............
Food
Products
34,200
589,928
Nichiha
Corp.
...................
Building
Products
69,200
1,278,402
Nissei
ASB
Machine
Co.
Ltd.
........
Machinery
43,200
1,382,383
Qol
Holdings
Co.
Ltd.
.............
Consumer
Staples
Distribution
&
Retail
64,900
604,205
Roland
Corp.
...................
Leisure
Products
37,100
917,568
Sato
Holdings
Corp.
..............
Commercial
Services
&
Supplies
44,200
612,701
Shima
Seiki
Manufacturing
Ltd.
......
Machinery
97,400
643,281
TechnoPro
Holdings,
Inc.
..........
Professional
Services
78,300
1,464,041
Topcon
Corp.
...................
Electronic
Equipment,
Instruments
&
Components
80,500
1,435,153
Tsumura
&
Co.
..................
Pharmaceuticals
70,800
2,106,311
20,921,925
Mexico
0.4%
a,c
Grupo
Traxion
SAB
de
CV
,
A
,
144A
,
Reg
S
.......................
Ground
Transportation
441,143
402,616
New
Zealand
1.4%
Summerset
Group
Holdings
Ltd.
.....
Health
Care
Providers
&
Services
216,203
1,587,457
Norway
1.4%
TGS
ASA
......................
Energy
Equipment
&
Services
151,349
1,516,461
Philippines
2.7%
Century
Pacific
Food,
Inc.
..........
Food
Products
2,332,900
1,690,269
Puregold
Price
Club,
Inc.
...........
Consumer
Staples
Distribution
&
Retail
2,514,700
1,341,144
3,031,413
Portugal
0.7%
b
Corticeira
Amorim
SGPS
SA
........
Containers
&
Packaging
87,951
732,011
Templeton
Institutional
Funds
Schedule
of
Investments
Foreign
Smaller
Companies
Series
(continued)
The
accompanying
notes
are
an
integral
part
of
these
financial
statements.
Annual
Report
a
a
Industry
Shares
a
Value
a
Common
Stocks
(continued)
Singapore
1.0%
Digital
Core
REIT
Management
Pte.
Ltd.
Specialized
REITs
1,973,200
$
1,145,374
South
Korea
3.3%
a
AMOREPACIFIC
Group
...........
Personal
Care
Products
45,608
640,213
BNK
Financial
Group,
Inc.
..........
Banks
135,309
945,231
DGB
Financial
Group,
Inc.
..........
Banks
140,359
775,420
a
i-SENS,
Inc.
....................
Health
Care
Equipment
&
Supplies
73,179
753,368
a
NongShim
Co.
Ltd.
...............
Food
Products
2,224
562,077
3,676,309
Sweden
2.8%
c
Dometic
Group
AB
,
144A
..........
Automobile
Components
140,237
657,282
Electrolux
Professional
AB
,
B
.......
Machinery
171,129
1,059,517
a,d
Karnov
Group
AB
................
Interactive
Media
&
Services
15,751
117,146
c
Thule
Group
AB
,
144A
,
Reg
S
.......
Leisure
Products
43,624
1,342,454
3,176,399
Switzerland
4.6%
Bucher
Industries
AG
.............
Machinery
3,813
1,371,937
Logitech
International
SA
..........
Technology
Hardware,
Storage
&
Peripherals
7,363
606,343
c
Medacta
Group
SA
,
144A
,
Reg
S
....
Health
Care
Equipment
&
Supplies
11,113
1,305,323
Siegfried
Holding
AG
..............
Life
Sciences
Tools
&
Services
1,718
1,868,758
5,152,361
Taiwan
6.8%
Giant
Manufacturing
Co.
Ltd.
........
Leisure
Products
104,482
450,222
Johnson
Health
Tech
Co.
Ltd.
.......
Leisure
Products
271,000
1,523,172
King
Yuan
Electronics
Co.
Ltd.
......
Semiconductors
&
Semiconductor
Equipment
261,000
883,744
Merida
Industry
Co.
Ltd.
...........
Leisure
Products
136,000
625,226
Nien
Made
Enterprise
Co.
Ltd.
......
Household
Durables
64,000
714,448
Primax
Electronics
Ltd.
............
Electronic
Equipment,
Instruments
&
Components
341,000
789,338
Shin
Zu
Shing
Co.
Ltd.
............
Machinery
173,000
1,104,916
Topkey
Corp.
...................
Leisure
Products
106,000
660,510
Tripod
Technology
Corp.
...........
Electronic
Equipment,
Instruments
&
Components
143,000
859,186
7,610,762
Thailand
1.9%
Hana
Microelectronics
PCL
.........
Electronic
Equipment,
Instruments
&
Components
803,700
578,453
Major
Cineplex
Group
PCL
.........
Entertainment
2,400,800
1,035,101
Mega
Lifesciences
PCL
............
Pharmaceuticals
510,200
497,063
TOA
Paint
Thailand
PCL
...........
Chemicals
127,700
56,181
2,166,798
United
Kingdom
10.7%
Coats
Group
plc
.................
Textiles,
Apparel
&
Luxury
Goods
814,404
962,457
Fevertree
Drinks
plc
..............
Beverages
105,585
887,967
Greggs
plc
.....................
Hotels,
Restaurants
&
Leisure
41,774
1,456,991
Johnson
Service
Group
plc
.........
Commercial
Services
&
Supplies
412,128
699,619
Man
Group
plc
..................
Capital
Markets
688,590
1,837,522
Oxford
Instruments
plc
............
Electronic
Equipment,
Instruments
&
Components
32,617
879,956
Pagegroup
plc
..................
Professional
Services
282,881
1,213,761
Rathbones
Group
plc
.............
Capital
Markets
65,981
1,367,969
Savills
plc
......................
Real
Estate
Management
&
Development
75,381
977,668
Warpaint
London
plc
..............
Personal
Care
Products
96,750
629,831
Templeton
Institutional
Funds
Schedule
of
Investments
Foreign
Smaller
Companies
Series
(continued)
Annual
Report
The
accompanying
notes
are
an
integral
part
of
these
financial
statements.
See
Abbreviations
on
page
29
.
a
a
Industry
Shares
a
Value
a
Common
Stocks
(continued)
United
Kingdom
(continued)
a,c
Watches
of
Switzerland
Group
plc
,
144A
Specialty
Retail
143,315
$
999,994
11,913,735
United
States
1.6%
Axis
Capital
Holdings
Ltd.
..........
Insurance
7,651
678,032
a,b
IMAX
Corp.
.....................
Entertainment
42,004
1,075,302
1,753,334
Total
Common
Stocks
(Cost
$
78,839,896
)
......................................
105,025,147
Short
Term
Investments
1.1%
a
a
Industry
Principal
Amount
*
a
Value
a
a
a
a
a
a
U.S.
Government
and
Agency
Securities
0.9%
United
States
0.9%
e
FHLB
,
4.2
%,
1/02/25
..............
1,000,000
999,767
Total
U.S.
Government
and
Agency
Securities
(Cost
$
999,887
)
....................
999,767
Shares
f
Investments
from
Cash
Collateral
Received
for
Loaned
Securities
0.2%
Money
Market
Funds
0.2%
g,h
Institutional
Fiduciary
Trust
-
Money
Market
Portfolio
,
4.183
%
.........
218,982
218,982
Total
Investments
from
Cash
Collateral
Received
for
Loaned
Securities
(Cost
$
218,982
)
...................................................................
218,982
a
a
a
a
a
Total
Short
Term
Investments
(Cost
$
1,218,869
)
.................................
1,218,749
a
a
a
Total
Investments
(Cost
$
80,058,765
)
95.0
%
....................................
$106,243,896
Other
Assets,
less
Liabilities
5.0
%
.............................................
5,602,360
Net
Assets
100.0%
...........................................................
$111,846,256
a
a
a
*
The
principal
amount
is
stated
in
U.S.
dollars
unless
otherwise
indicated.
a
Non-income
producing.
b
A
portion
or
all
of
the
security
is
on
loan
at
December
31,
2024.
See
Note
1(e).
c
Security
was
purchased
pursuant
to
Rule
144A
or
Regulation
S
under
the
Securities
Act
of
1933.
144A
securities
may
be
sold
in
transactions
exempt
from
registration
only
to
qualified
institutional
buyers
or
in
a
public
offering
registered
under
the
Securities
Act
of
1933.
Regulation
S
securities
cannot
be
sold
in
the
United
States
without
either
an
effective
registration
statement
filed
pursuant
to
the
Securities
Act
of
1933,
or
pursuant
to
an
exemption
from
registration.
At
December
31,
2024,
the
aggregate
value
of
these
securities
was
$9,921,891,
representing
8.9%
of
net
assets.
d
A
portion
or
all
of
the
security
purchased
on
a
delayed
delivery
basis.
See
Note
1(c).
e
The
rate
shown
represents
the
yield
at
period
end.
f
See
Note
1(e)
regarding
securities
on
loan.
g
See
Note
3(d)
regarding
investments
in
affiliated
management
investment
companies.
h
The
rate
shown
is
the
annualized
seven-day
effective
yield
at
period
end.
Templeton
Institutional
Funds
Financial
Highlights
International
Equity
Series
The
accompanying
notes
are
an
integral
part
of
these
financial
statements.
Annual
Report
a
Year
Ended
December
31,
2024
2023
2022
2021
2020
Primary
Shares
Per
share
operating
performance
(for
a
share
outstanding
throughout
the
year)
Net
asset
value,
beginning
of
year
...................
$10.91
$10.19
$11.96
$15.22
$15.54
Income
from
investment
operations
a
:
Net
investment
income
b
.........................
0.24
0.49
c
0.26
0.26
1.03
d
Net
realized
and
unrealized
gains
(losses)
...........
0.67
1.77
(1.40)
0.55
(0.32)
Total
from
investment
operations
....................
0.91
2.26
(1.14)
0.81
0.71
Less
distributions
from:
Net
investment
income
..........................
(0.30)
(0.90)
(0.10)
(1.46)
(0.67)
Net
realized
gains
.............................
(1.31)
(0.64)
(0.53)
(2.61)
(0.36)
Total
distributions
...............................
(1.61)
(1.54)
(0.63)
(4.07)
(1.03)
Net
asset
value,
end
of
year
.......................
$10.21
$10.91
$10.19
$11.96
$15.22
Total
return
....................................
8.40%
22.84%
(9.23)%
5.75%
5.30%
Ratios
to
average
net
assets
Expenses
before
waiver
and
payments
by
affiliates
......
0.97%
0.92%
0.87%
0.94%
0.87%
Expenses
net
of
waiver
and
payments
by
affiliates
.......
0.92%
0.88%
0.83%
0.91%
0.84%
Net
investment
income
...........................
2.02%
4.31%
c
2.35%
1.64%
7.51%
d
Supplemental
data
Net
assets
,
end
of
year
(000’s)
.....................
$101,210
$127,735
$196,051
$386,291
$447,139
Portfolio
turnover
rate
............................
30.90%
18.18%
e
46.42%
44.73%
89.34%
a
The
amount
shown
for
a
share
outstanding
throughout
the
period
may
not
correlate
with
the
Statement
of
Operations
for
the
period
due
to
the
timing
of
sales
and
repurchas-
es
of
the
Fund’s
shares
in
relation
to
income
earned
and/or
fluctuating
fair
value
of
the
investments
of
the
Fund.
b
Based
on
average
daily
shares
outstanding.
c
Net
investment
income
per
share
includes
approximately
$0.23
per
share
related
to
an
adjustment
for
EU
reclaims
in
connection
with
certain
Fund
holdings.
Excluding
this
amount,
the
ratio
of
net
investment
income
to
average
net
assets
would
have
been
2.34%.
d
Net
investment
income
per
share
includes
approximately
$0.77
per
share
related
to
an
adjustment
for
EU
reclaims
in
connection
with
certain
Fund
holdings.
Excluding
this
amount,
the
ratio
of
net
investment
income
to
average
net
assets
would
have
been
1.86%
and
total
return
would
have
been
(0.03)%.
e
Excludes
the
value
of
portfolio
activity
as
a
result
of
in-kind
transactions.
See
Note
9
for
prior
year
information.
Templeton
Institutional
Funds
Financial
Highlights
International
Equity
Series
(continued)
Annual
Report
The
accompanying
notes
are
an
integral
part
of
these
financial
statements.
a
Year
Ended
December
31,
2024
2023
2022
2021
2020
Service
Shares
Per
share
operating
performance
(for
a
share
outstanding
throughout
the
year)
Net
asset
value,
beginning
of
year
...................
$11.23
$10.45
$12.24
$15.48
$15.79
Income
from
investment
operations
a
:
Net
investment
income
b
.........................
0.22
0.49
c
0.20
0.24
1.17
d
Net
realized
and
unrealized
gains
(losses)
...........
0.69
1.84
(1.38)
0.58
(0.47)
Total
from
investment
operations
....................
0.91
2.33
(1.18)
0.82
0.70
Less
distributions
from:
Net
investment
income
..........................
(0.28)
(0.91)
(0.08)
(1.45)
(0.65)
Net
realized
gains
.............................
(1.31)
(0.64)
(0.53)
(2.61)
(0.36)
Total
distributions
...............................
(1.59)
(1.55)
(0.61)
(4.06)
(1.01)
Net
asset
value,
end
of
year
.......................
$10.55
$11.23
$10.45
$12.24
$15.48
Total
return
....................................
8.21%
22.68%
(9.29)%
5.69%
5.16%
Ratios
to
average
net
assets
Expenses
before
waiver
and
payments
by
affiliates
......
1.19%
0.86%
1.01%
1.04%
1.01%
Expenses
net
of
waiver
and
payments
by
affiliates
.......
1.15%
0.82%
0.97%
1.00%
0.98%
Net
investment
income
...........................
1.82%
4.26%
c
1.71%
1.52%
8.42%
d
Supplemental
data
Net
assets
,
end
of
year
(000’s)
.....................
$129
$136
$123
$521
$448
Portfolio
turnover
rate
............................
30.90%
18.18%
e
46.42%
44.73%
89.34%
a
The
amount
shown
for
a
share
outstanding
throughout
the
period
may
not
correlate
with
the
Statement
of
Operations
for
the
period
due
to
the
timing
of
sales
and
repurchas-
es
of
the
Fund’s
shares
in
relation
to
income
earned
and/or
fluctuating
fair
value
of
the
investments
of
the
Fund.
b
Based
on
average
daily
shares
outstanding.
c
Net
investment
income
per
share
includes
approximately
$0.23
per
share
related
to
an
adjustment
for
EU
reclaims
in
connection
with
certain
Fund
holdings.
Excluding
this
amount,
the
ratio
of
net
investment
income
to
average
net
assets
would
have
been
2.29%.
d
Net
investment
income
per
share
includes
approximately
$0.78
per
share
related
to
an
adjustment
for
EU
reclaims
in
connection
with
certain
Fund
holdings.
Excluding
this
amount,
the
ratio
of
net
investment
income
to
average
net
assets
would
have
been
2.77%
and
total
return
would
have
been
(0.14)%.
e
Excludes
the
value
of
portfolio
activity
as
a
result
of
in-kind
transactions.
See
Note
9
for
prior
year
information.
Templeton
Institutional
Funds
Schedule
of
Investments,
December
31,
2024
International
Equity
Series
The
accompanying
notes
are
an
integral
part
of
these
financial
statements.
Annual
Report
a
a
Industry
Shares
a
Value
a
Common
Stocks
94.8%
Canada
5.1%
Manulife
Financial
Corp.
...........
Insurance
71,700
$
2,202,700
Royal
Bank
of
Canada
............
Banks
24,800
2,990,251
5,192,951
Chile
1.5%
Antofagasta
plc
..................
Metals
&
Mining
75,601
1,497,618
China
1.1%
NXP
Semiconductors
NV
..........
Semiconductors
&
Semiconductor
Equipment
5,586
1,161,050
Denmark
1.2%
a,b
Orsted
A/S
,
144A
,
Reg
S
...........
Independent
Power
and
Renewable
Electricity
Producers
26,634
1,202,625
France
8.4%
Cie
de
Saint-Gobain
SA
...........
Building
Products
21,154
1,879,780
Danone
SA
.....................
Food
Products
22,021
1,488,174
Kering
SA
......................
Textiles,
Apparel
&
Luxury
Goods
4,452
1,099,624
TotalEnergies
SE
................
Oil,
Gas
&
Consumable
Fuels
41,877
2,333,172
Veolia
Environnement
SA
..........
Multi-Utilities
60,699
1,703,064
8,503,814
Germany
12.7%
Daimler
Truck
Holding
AG
..........
Machinery
34,503
1,321,537
Deutsche
Boerse
AG
..............
Capital
Markets
7,997
1,842,160
Deutsche
Telekom
AG
.............
Diversified
Telecommunication
Services
150,332
4,504,413
Fresenius
Medical
Care
AG
.........
Health
Care
Providers
&
Services
25,264
1,150,290
Infineon
Technologies
AG
..........
Semiconductors
&
Semiconductor
Equipment
53,451
1,744,734
SAP
SE
.......................
Software
9,277
2,281,903
12,845,037
Hungary
0.9%
Richter
Gedeon
Nyrt.
.............
Pharmaceuticals
37,000
969,184
India
1.2%
Reliance
Industries
Ltd.
............
Oil,
Gas
&
Consumable
Fuels
89,606
1,269,055
Japan
12.6%
Ebara
Corp.
....................
Machinery
125,700
1,928,567
Hitachi
Ltd.
.....................
Industrial
Conglomerates
49,410
1,210,054
Honda
Motor
Co.
Ltd.
.............
Automobiles
223,428
2,127,215
KDDI
Corp.
.....................
Wireless
Telecommunication
Services
42,041
1,339,031
Mitsubishi
Electric
Corp.
...........
Electrical
Equipment
130,458
2,202,881
Sumitomo
Mitsui
Financial
Group,
Inc.
.
Banks
141,458
3,395,027
Tokyo
Electron
Ltd.
...............
Semiconductors
&
Semiconductor
Equipment
3,762
565,502
12,768,277
Netherlands
3.1%
ING
Groep
NV
..................
Banks
133,738
2,095,887
SBM
Offshore
NV
................
Energy
Equipment
&
Services
58,381
1,028,091
3,123,978
Norway
1.2%
Norsk
Hydro
ASA
................
Metals
&
Mining
223,861
1,231,388
South
Korea
2.8%
Samsung
Electronics
Co.
Ltd.
.......
Technology
Hardware,
Storage
&
Peripherals
43,972
1,569,221
Templeton
Institutional
Funds
Schedule
of
Investments
International
Equity
Series
(continued)
Annual
Report
The
accompanying
notes
are
an
integral
part
of
these
financial
statements.
a
a
Industry
Shares
a
Value
a
Common
Stocks
(continued)
South
Korea
(continued)
Shinhan
Financial
Group
Co.
Ltd.
....
Banks
37,877
$
1,228,231
2,797,452
Sweden
1.8%
Securitas
AB
,
B
..................
Commercial
Services
&
Supplies
144,325
1,784,427
Switzerland
0.9%
Adecco
Group
AG
................
Professional
Services
35,645
880,529
Taiwan
3.5%
Taiwan
Semiconductor
Manufacturing
Co.
Ltd.
......................
Semiconductors
&
Semiconductor
Equipment
108,298
3,519,691
United
Kingdom
15.4%
AstraZeneca
plc
.................
Pharmaceuticals
19,762
2,576,563
BAE
Systems
plc
................
Aerospace
&
Defense
91,716
1,315,692
Barratt
Redrow
plc
...............
Household
Durables
255,490
1,400,567
HSBC
Holdings
plc
...............
Banks
122,122
1,199,617
JD
Sports
Fashion
plc
.............
Specialty
Retail
1,093,030
1,306,440
Lloyds
Banking
Group
plc
..........
Banks
2,316,380
1,581,922
Smith
&
Nephew
plc
..............
Health
Care
Equipment
&
Supplies
144,719
1,793,419
Standard
Chartered
plc
............
Banks
217,312
2,675,373
Unilever
plc
.....................
Personal
Care
Products
31,885
1,811,726
15,661,319
United
States
21.4%
BP
plc
.........................
Oil,
Gas
&
Consumable
Fuels
570,000
2,817,493
CNH
Industrial
NV
................
Machinery
172,588
1,955,422
CRH
plc
.......................
Construction
Materials
32,589
3,016,771
GFL
Environmental,
Inc.
...........
Commercial
Services
&
Supplies
33,256
1,481,222
a
ICON
plc
.......................
Life
Sciences
Tools
&
Services
5,823
1,221,141
Sanofi
SA
......................
Pharmaceuticals
31,549
3,066,903
Shell
plc
.......................
Oil,
Gas
&
Consumable
Fuels
104,022
3,242,470
Smurfit
WestRock
plc
.............
Containers
&
Packaging
45,577
2,458,504
Swiss
Re
AG
....................
Insurance
16,703
2,419,172
21,679,098
Total
Common
Stocks
(Cost
$
71,676,076
)
......................................
96,087,493
a
a
a
a
a
Escrows
and
Litigation
Trusts
0.0%
a,c
Hemisphere
Properties
India
Ltd.,
Escrow
Account
................
2,094,964
—
Total
Escrows
and
Litigation
Trusts
(Cost
$
–
)
...................................
—
Total
Long
Term
Investments
(Cost
$
71,676,076
)
................................
96,087,493
Templeton
Institutional
Funds
Schedule
of
Investments
International
Equity
Series
(continued)
The
accompanying
notes
are
an
integral
part
of
these
financial
statements.
Annual
Report
Short
Term
Investments
4.2%
a
a
Industry
Shares
a
Value
a
a
a
a
a
a
Money
Market
Funds
4.2%
United
States
4.2%
d,e
Institutional
Fiduciary
Trust
-
Money
Market
Portfolio
,
4.183
%
.........
4,241,876
$
4,241,876
Total
Money
Market
Funds
(Cost
$
4,241,876
)
...................................
4,241,876
a
a
a
a
a
Total
Short
Term
Investments
(Cost
$
4,241,876
)
.................................
4,241,876
a
a
a
Total
Investments
(Cost
$
75,917,952
)
99.0
%
....................................
$100,329,369
Other
Assets,
less
Liabilities
1.0
%
.............................................
1,009,705
Net
Assets
100.0%
...........................................................
$101,339,074
a
a
a
a
Non-income
producing.
b
Security
was
purchased
pursuant
to
Rule
144A
or
Regulation
S
under
the
Securities
Act
of
1933.
144A
securities
may
be
sold
in
transactions
exempt
from
registration
only
to
qualified
institutional
buyers
or
in
a
public
offering
registered
under
the
Securities
Act
of
1933.
Regulation
S
securities
cannot
be
sold
in
the
United
States
without
either
an
effective
registration
statement
filed
pursuant
to
the
Securities
Act
of
1933,
or
pursuant
to
an
exemption
from
registration.
At
December
31,
2024,
the
value
of
this
security
was
$1,202,625,
representing
1.2%
of
net
assets.
c
Fair
valued
using
significant
unobservable
inputs.
See
Note
10
regarding
fair
value
measurements.
d
See
Note
3(d)
regarding
investments
in
affiliated
management
investment
companies.
e
The
rate
shown
is
the
annualized
seven-day
effective
yield
at
period
end.
Templeton
Institutional
Funds
Schedule
of
Investments
International
Equity
Series
(continued)
Annual
Report
The
accompanying
notes
are
an
integral
part
of
these
financial
statements.
At
December
31,
2024,
the
Fund
had
the
following futures
contracts
outstanding.
See
Note
1(d).
See
Note 6 regarding
other
derivative
information.
Futures
Contracts
Description
Type
Number
of
Contracts
Notional
Amount
*
Expiration
Date
Value/
Unrealized
Appreciation
(Depreciation)
Equity
contracts
MSCI
EAFE
Index
............................
Long
20
$
2,267,500
3/21/25
$
(
73,233
)
Total
Futures
Contracts
......................................................................
$(73,233)
*
As
of
period
end.
Templeton
Institutional
Funds
Financial
Statements
Statements
of
Assets
and
Liabilities
December
31,
2024
The
accompanying
notes
are
an
integral
part
of
these
financial
statements.
Annual
Report
Foreign
Smaller
Companies
Series
International
Equity
Series
Assets:
Investments
in
securities:
Cost
-
Unaffiliated
issuers
..................................................
$79,839,783
$71,676,076
Cost
-
Non-controlled
affiliates
(Note
3
d
)
.......................................
218,982
4,241,876
Value
-
Unaffiliated
issuers
(Includes
securities
loaned
of
$2,855,495
and
$—,
respectively)
$106,024,914
$96,087,493
Value
-
Non-controlled
affiliates
(Note
3
d
)
......................................
218,982
4,241,876
Cash
...................................................................
5,337,981
1,300
Foreign
currency,
at
value
(cost
$22
and
$79,
respectively)
...........................
22
79
Receivables:
Investment
securities
sold
..................................................
180,326
—
Capital
shares
sold
.......................................................
13,867
175,618
Dividends
..............................................................
327,740
3,185,531
European
Union
tax
reclaims
(Note
1
f
)
........................................
207,475
182,814
Deposits
with
brokers
for:
Futures
contracts
.......................................................
—
79,817
Total
assets
.........................................................
112,311,307
103,954,528
Liabilities:
Payables:
Investment
securities
purchased
.............................................
1,921
—
Capital
shares
redeemed
..................................................
25,513
17,188
Management
fees
........................................................
91,134
198
Custodian
fees
..........................................................
42,977
15,641
Transfer
agent
fees
.......................................................
5,116
5,202
Professional
fees
........................................................
53,778
65,241
Trustees'
fees
and
expenses
................................................
355
13
IRS
closing
agreement
payments
for
European
Union
tax
reclaims
(Note
1
f
)
............
—
2,483,272
Variation
margin
on
futures
contracts
..........................................
—
2,146
Payable
upon
return
of
securities
loaned
(Note
1
e
)
.................................
218,982
—
Accrued
expenses
and
other
liabilities
..........................................
25,275
26,553
Total
liabilities
........................................................
465,051
2,615,454
Net
assets,
at
value
................................................
$111,846,256
$101,339,074
Net
assets
consist
of:
Paid-in
capital
............................................................
$88,656,800
$77,326,504
Total
distributable
earnings
(losses)
............................................
23,189,456
24,012,570
Net
assets,
at
value
................................................
$111,846,256
$101,339,074
Shares
outstanding
........................................................
7,016,787
Net
asset
value
per
share
a
...................................................
$15.94
International
Equity
Series
Primary
Shares:
Net
assets,
at
value
.......................................................................
$101,209,868
Shares
outstanding
........................................................................
9,915,818
Net
asset
value
per
share
a
..................................................................
$10.21
Service
Shares:
Net
assets,
at
value
.......................................................................
$129,206
Shares
outstanding
........................................................................
12,249
Net
asset
value
per
share
a
..................................................................
$10.55
a
Net
asset
value
per
share
may
not
recalculate
due
to
rounding.
Templeton
Institutional
Funds
Financial
Statements
Statements
of
Operations
for
the
year
ended
December
31,
2024
Annual
Report
The
accompanying
notes
are
an
integral
part
of
these
financial
statements.
Foreign
Smaller
Companies
Series
International
Equity
Series
Investment
income:
Dividends:
(net
of
foreign
taxes
of
$329,143
and
$181,981,
respectively)
Unaffiliated
issuers
.......................................................
$3,967,900
$3,090,752
Non-controlled
affiliates
(Note
3
d
)
............................................
—
136,221
Interest:
Unaffiliated
issuers
.......................................................
23,495
3,482
Income
from
securities
loaned:
Unaffiliated
entities
(net
of
fees
and
rebates)
....................................
11,876
(9,585)
Non-controlled
affiliates
(Note
3
d
)
............................................
43,009
15,553
Other
income
(Note
1
f
)
......................................................
21,437
4,330
Less:
IRS
closing
agreement
payments
for
European
Union
tax
reclaims
(Note
1
f
)
.........
—
(126,249)
Total
investment
income
..................................................
4,067,717
3,114,504
Expenses:
Management
fees
(Note
3
a
)
..................................................
1,488,368
819,559
Transfer
agent
fees:
(Note
3c
)
Primary
Shares
.........................................................
—
28,775
Service
Shares
.........................................................
—
150
Transfer
agent
fees
(Note
3
c
)
.................................................
32,791
—
Sub-transfer
agent
fees:
(Note
3c
)
Service
Shares
.........................................................
—
218
Custodian
fees
...........................................................
23,369
8,516
Reports
to
shareholders
fees
.................................................
—
6,229
Registration
and
filing
fees
...................................................
40,199
63,463
Professional
fees
..........................................................
91,401
117,541
Trustees'
fees
and
expenses
.................................................
20,938
14,175
Other
...................................................................
28,805
(35,471)
Total
expenses
........................................................
1,725,871
1,023,155
Expenses
waived/paid
by
affiliates
(Note
3
d
and
3
e
)
.............................
(2,484)
(47,756)
Net
expenses
........................................................
1,723,387
975,399
Net
investment
income
...............................................
2,344,330
2,139,105
Realized
and
unrealized
gains
(losses):
Net
realized
gain
(loss)
from:
Investments:
(net
of
foreign
taxes
of
$–
and
$2,974,
respectively)
Unaffiliated
issuers
.....................................................
22,814,836
15,757,177
Foreign
currency
transactions
...............................................
(96,749)
(8,280)
Futures
contracts
........................................................
—
98,343
Net
realized
gain
(loss)
.................................................
22,718,087
15,847,240
Net
change
in
unrealized
appreciation
(depreciation)
on:
Investments:
Unaffiliated
issuers
.....................................................
(25,779,110)
(9,440,786)
Translation
of
other
assets
and
liabilities
denominated
in
foreign
currencies
.............
(23,261)
(219,606)
Futures
contracts
........................................................
—
(154,390)
Net
change
in
unrealized
appreciation
(depreciation)
...........................
(25,802,371)
(9,814,782)
Net
realized
and
unrealized
gain
(loss)
...........................................
(3,084,284)
6,032,458
Net
increase
(decrease)
in
net
assets
resulting
from
operations
.........................
$(739,954)
$8,171,563
Templeton
Institutional
Funds
Financial
Statements
Statements
of
Changes
in
Net
Assets
The
accompanying
notes
are
an
integral
part
of
these
financial
statements.
Annual
Report
Foreign
Smaller
Companies
Series
International
Equity
Series
Year
Ended
December
31,
2024
Year
Ended
December
31,
2023
Year
Ended
December
31,
2024
Year
Ended
December
31,
2023
Increase
(decrease)
in
net
assets:
Operations:
Net
investment
income
............
$2,344,330
$3,334,550
$2,139,105
$7,668,743
Net
realized
gain
(loss)
............
22,718,087
24,618,226
15,847,240
20,108,897
Net
change
in
unrealized
appreciation
(depreciation)
.................
(25,802,371)
10,379,894
(9,814,782)
4,156,901
Net
increase
(decrease)
in
net
assets
resulting
from
operations
.
(739,954)
38,332,670
8,171,563
31,934,541
Distributions
to
shareholders:
Primary
Shares
..................
—
—
(13,938,011)
(17,093,312)
Service
Shares
..................
—
—
(19,030)
(18,325)
Distributions
to
shareholders
.........
(14,138,493)
(2,478,019)
—
—
Total
distributions
to
shareholders
.....
(14,138,493)
(2,478,019)
(13,957,041)
(17,111,637)
Capital
share
transactions:
(Note
2
)
Primary
Shares
..................
—
—
(20,748,019)
(83,129,418)
Service
Shares
..................
—
—
1,583
3,731
Capital
share
transactions
(Note
2
)
.....
(64,531,610)
(197,978,448)
—
—
Total
capital
share
transactions
.......
(64,531,610)
(197,978,448)
(20,746,436)
(83,125,687)
Net
increase
(decrease)
in
net
assets
.....................
(79,410,057)
(162,123,797)
(26,531,914)
(68,302,783)
Net
assets:
Beginning
of
year
..................
191,256,313
353,380,110
127,870,988
196,173,771
End
of
year
......................
$111,846,256
$191,256,313
$101,339,074
$127,870,988
Templeton
Institutional
Funds
Notes
to
Financial
Statements
1.
Organization
and
Significant
Accounting
Policies
Templeton
Institutional
Funds
(Trust)
is
registered
under
the
Investment
Company
Act
of
1940
(1940
Act)
as
an
open-
end
management
investment
company,
consisting
of two
separate
funds
(Funds).
The Funds
follow
the
accounting
and
reporting
guidance
in
Financial
Accounting
Standards
Board
(FASB)
Accounting
Standards
Codification
Topic
946,
Financial
Services
–
Investment
Companies
(ASC
946)
and apply
the
specialized
accounting
and
reporting
guidance
in
U.S.
Generally
Accepted
Accounting
Principles
(U.S.
GAAP),
including,
but
not
limited
to,
ASC
946.
International
Equity
Series
offers
Primary
and
Service
Shares.
Each
class
of
shares
may
differ
by
its
initial
sales
load,
contingent
deferred
sales
charges,
voting
rights
on
matters
affecting
a
single
class,
its
exchange
privilege
and
fees
due
to
differing
arrangements
for
distribution
and
transfer
agent
fees.
The
following
summarizes
the Funds'
significant
accounting
policies.
a.
Financial
Instrument
Valuation
The Funds'
investments
in
financial
instruments
are
carried
at
fair
value
daily.
Fair
value
is
the
price
that
would
be
received
to
sell
an
asset
or
paid
to
transfer
a
liability
in
an
orderly
transaction
between
market
participants
on
the
measurement
date.
The Funds calculate the
net
asset
value
(NAV)
per
share
each
business
day
as
of
4
p.m.
Eastern
time
or
the
regularly
scheduled
close
of
the
New
York
Stock
Exchange
(NYSE),
whichever
is
earlier. Under
compliance
policies
and
procedures
approved
by
the
Trust’s
Board
of
Trustees
(the
Board),
the
Board
has
designated
the
Funds’
investment
manager
as
the
valuation
designee
and
has
responsibility
for
oversight
of
valuation.
The
investment
manager
is
assisted
by
the
Funds'
administrator
in
performing
this
responsibility,
including
leading
the
cross-
functional
Valuation
Committee
(VC).
The
Funds
may
utilize
independent
pricing
services,
quotations
from
securities
and
financial
instrument
dealers,
and
other
market
sources
to
determine
fair
value.
Equity
securities
and
derivative
financial instruments listed
on
an
exchange
or
on
the
NASDAQ
National
Market
System
are
valued
at
the
last
quoted
sale
price
or
the
official
closing
price of
the
day,
respectively.
Foreign
equity
securities
are
valued
as
of
the
close
of
trading
on
the
foreign
stock
exchange
on
which
the
security
is
primarily
traded,
or
as
of
4
p.m.
Eastern
time.
The
value
is
then
converted
into
its
U.S.
dollar
equivalent
at
the
foreign
exchange
rate
in
effect
at
4
p.m.
Eastern
time
on
the
day
that
the
value
of
the
security
is
determined.
Over-the-counter
(OTC)
securities
are
valued
within
the
range
of
the
most
recent
quoted
bid
and
ask
prices.
Securities
that
trade
in
multiple
markets
or
on
multiple
exchanges
are
valued
according
to
the
broadest
and
most
representative
market.
Certain
equity
securities
are
valued
based
upon
fundamental
characteristics
or
relationships
to
similar
securities.
Debt
securities
generally
trade
in
the
OTC
market rather
than
on
a
securities
exchange.
The
Funds'
pricing
services
use
multiple
valuation
techniques
to
determine
fair
value.
In
instances
where
sufficient
market
activity
exists,
the
pricing
services
may
utilize
a
market-based
approach
through
which
quotes
from
market
makers
are
used
to
determine
fair
value.
In
instances
where
sufficient
market
activity
may
not
exist
or
is
limited,
the
pricing
services
also
utilize
proprietary
valuation
models
which
may
consider
market
characteristics
such
as
benchmark
yield
curves,
credit
spreads,
estimated
default
rates,
anticipated
market
interest
rate
volatility,
coupon
rates,
anticipated
timing
of
principal
repayments,
underlying
collateral,
and
other
unique
security
features
in
order
to
estimate
the
relevant
cash
flows,
which
are
then
discounted
to
calculate
the
fair
value.
Securities
denominated
in
a
foreign
currency
are
converted
into
their
U.S.
dollar
equivalent
at
the
foreign
exchange
rate
in
effect
at
4
p.m.
Eastern
time
on
the
date
that
the
values
of
the
foreign
debt
securities
are
determined.
Investments
in open-end mutual
funds
are
valued
at
the
closing
NAV.
The
Funds
have
procedures
to
determine
the
fair
value
of
financial
instruments
for
which
market
prices
are
not
reliable
or
readily
available.
Under
these
procedures,
the
Funds
primarily
employ
a
market-based
approach
which
may
use
related
or
comparable
assets
or
liabilities,
recent
transactions,
market
multiples,
and
other
relevant
information
for
the
investment
to
determine
the
fair
value
of
the
investment.
An
income-based
valuation
approach
may
also
be
used
in
which
the
anticipated
future
cash
flows
of
the
investment
are
discounted
to
calculate
fair
value.
Discounts
may
also
be
applied
due
to
the
nature
or
duration
of
any
restrictions
on
the
disposition
of
the
investments.
Due
to
the
inherent
uncertainty
of
valuations
of
such
investments,
the
fair
values
may
differ
significantly
from
the
values
that
would
have
been
used
had
an
active
market
existed.
Templeton
Institutional
Funds
Notes
to
Financial
Statements
Trading
in
securities
on
foreign
securities
stock
exchanges
and
OTC
markets
may
be
completed
before
4
p.m.
Eastern
time.
In
addition,
trading
in
certain
foreign
markets
may
not
take
place
on
every
Funds'
business
day.
Events
can occur
between
the
time
at
which
trading
in
a
foreign
security
is
completed
and
4
p.m.
Eastern
time
that
might
call
into
question
the
reliability
of
the
value
of
a
portfolio
security
held
by
the
Fund.
As
a
result,
differences
may
arise
between
the
value
of
the
Funds'
portfolio
securities
as
determined
at
the
foreign
market
close
and
the
latest
indications
of
value
at
4
p.m.
Eastern
time.
In
order
to
minimize
the
potential
for
these
differences,
an
independent
pricing
service
may
be
used
to
adjust
the
value
of
the
Funds'
portfolio
securities
to
the
latest
indications
of
fair
value
at
4
p.m.
Eastern
time.
At
December
31,
2024,
certain
securities
may
have
been
fair
valued
using
these
procedures,
in
which
case
the
securities
were
categorized
as
Level
2
within
the
fair
value
hierarchy
(referred
to
as
“market
level
fair
value”).
See
the
Fair
Value
Measurements
note
for
more
information.
When
the
last
day
of
the
reporting
period
is
a
non-business
day,
certain
foreign
markets
may
be
open
on
those
days
that
the
Funds'
NAV
is
not
calculated,
which
could
result
in
differences
between
the
value
of
the
Funds'
portfolio
securities
on
the
last
business
day
and
the
last
calendar
day
of
the
reporting
period.
Any
security
valuation
changes
due
to
an
open
foreign
market
are
adjusted
and
reflected
by
the
Funds
for
financial
reporting
purposes.
b.
Foreign
Currency
Translation
Portfolio
securities
and
other
assets
and
liabilities
denominated
in
foreign
currencies
are
translated
into
U.S.
dollars
based
on
the
exchange
rate
of
such
currencies
against
U.S.
dollars
on
the
date
of
valuation.
The
Funds
may
enter
into
foreign
currency
exchange
contracts
to
facilitate
transactions
denominated
in
a
foreign
currency.
Purchases
and
sales
of
securities,
income
and
expense
items
denominated
in
foreign
currencies
are
translated
into
U.S.
dollars
at
the
exchange
rate
in
effect
on
the
transaction
date.
Portfolio
securities
and
assets
and
liabilities
denominated
in
foreign
currencies
contain
risks
that
those
currencies
will
decline
in
value
relative
to
the
U.S.
dollar.
Occasionally,
events
may
impact
the
availability
or
reliability
of
foreign
exchange
rates
used
to
convert
the
U.S.
dollar
equivalent
value.
If
such
an
event
occurs,
the
foreign
exchange
rate
will
be
valued
at
fair
value
using
procedures
established
and
approved
by
the
Board.
The
Funds
do
not
separately
report
the
effect
of
changes
in
foreign
exchange
rates
from
changes
in
market
prices
on
securities
held.
Such
changes
are
included
in
net
realized
and
unrealized
gain
or
loss
from
investments
in
the
Statements
of
Operations.
Realized
foreign
exchange
gains
or
losses
arise
from
sales
of
foreign
currencies,
currency
gains
or
losses
realized
between
the
trade
and
settlement
dates
on
securities
transactions
and
the
difference
between
the
recorded
amounts
of
dividends,
interest,
and
foreign
withholding
taxes
and
the
U.S.
dollar
equivalent
of
the
amounts
actually
received
or
paid.
Net
unrealized
foreign
exchange
gains
and
losses
arise
from
changes
in
foreign
exchange
rates
on
foreign
denominated
assets
and
liabilities
other
than
investments
in
securities
held
at
the
end
of
the
reporting
period.
c.
Securities
Purchased
on
a
When-Issued,
Forward
Commitment or
Delayed
Delivery
Basis
Certain
or
all
Funds
may
purchase
securities
on
a
when-
issued,
forward
commitment
or
delayed
delivery
basis,
with
payment
and
delivery
scheduled
for
a
future
date.
These
transactions
are
subject
to
market
fluctuations
and
are
subject
to
the
risk
that
the
value
at
delivery
may
be
more
or
less
than
the
trade
date
purchase
price.
Although
the
Funds
will
generally
purchase
these
securities
with
the
intention
of
holding
the
securities, they
may
sell
the
securities
before
the
settlement
date.
d.
Derivative
Financial
Instruments
Certain
or
all
Funds
invested
in
derivative
financial
instruments
in
order
to
manage
risk
or
gain
exposure
to
various
other
investments
or
markets.
Derivatives
are
financial
contracts
based
on
an
underlying
or
notional
amount,
require
no
initial
investment
or
an
initial
net
investment
that
is
smaller
than
would
normally
be
required
to
have
a
similar
response
to
changes
in
market
factors,
and
require
or
permit
net
settlement.
Derivatives
contain
various
risks
including
the
potential
inability
of
the
counterparty
to
fulfill
their
obligations
under
the
terms
of
the
contract,
the
potential
for
an
illiquid
secondary
market,
and/or
the
potential
for
market
movements
which
expose
the
Fund
to
gains
or
losses
in
excess
of
the
amounts
shown
in
the
Statements
of
1.
Organization
and
Significant
Accounting
Policies
(continued)
a.
Financial
Instrument
Valuation
(continued)
Templeton
Institutional
Funds
Notes
to
Financial
Statements
Assets
and
Liabilities.
Realized
gain
and
loss
and
unrealized
appreciation
and
depreciation
on
these
contracts
for
the
period
are
included
in
the
Statements
of
Operations.
Collateral
requirements
differ
by
type
of
derivative.
Collateral
or
initial
margin
requirements
are
set
by
the
broker
or
exchange
clearing
house
for
exchange
traded
and
centrally
cleared
derivatives.
Initial
margin
deposited
is
held
at
the
exchange
and
can
be
in
the
form
of
cash
and/or
securities.
Certain
or
all
Funds
entered
into
exchange
traded
futures
contracts
primarily
to
manage
and/or
gain
exposure
to equity
price
risk.
A
futures
contract
is
an
agreement
between
the
Fund
and
a
counterparty
to
buy
or
sell
an
asset
at
a
specified
price
on
a
future
date.
Required
initial
margins
are
pledged
by
the
Fund,
and
the
daily
change
in
fair
value
is
accounted
for
as
a
variation
margin
payable
or
receivable
in
the
Statements
of
Assets
and
Liabilities.
Futures
contracts
outstanding
at
period
end,
if
any,
are
listed
in
the
Funds'
Schedules
of
Investments.
See
Note
6
regarding
other
derivative
information.
e.
Securities
Lending
Certain
or
all
Funds
participate
in
an
agency
based
securities
lending
program
to
earn
additional
income.
The
Fund
receives
collateral
in
the
form
of
cash
and/or
U.S.
Government
and
Agency
securities
against
the
loaned
securities
in
an
amount
equal
to
at
least
102%
of
the
fair
value
of
the
loaned
securities.
Collateral
is
maintained
over
the
life
of
the
loan
in
an
amount
not
less
than
100%
of
the
fair
value
of
loaned
securities,
as
determined
at
the
close
of
Fund
business
each
day;
any
additional
collateral
required
due
to
changes
in
security
values
is
delivered
to
the
Fund
on
the
next
business
day.
Any
cash
collateral
received
is
deposited
into
a
joint
cash
account
with
other
funds
and
is
used
to
invest
in
a
money
market
fund
managed
by
Franklin
Advisers,
Inc.,
an
affiliate
of
the
Funds.
Additionally,
at
December
31,
2024,
Foreign
Smaller
Companies
Series
held
$2,750,623
in
U.S.
Government
and
Agency
securities
as
collateral.
These
securities
are
held
as
collateral
in
segregated
accounts
with
the
Fund's
custodian.
The
Fund
cannot
repledge
or
resell
these
securities
held
as
collateral.
As
such,
the
non-cash
collateral
is
excluded
from
the
Statements
of
Assets
and
Liabilities. The
Fund
may
receive
income
from
the
investment
of
cash
collateral,
in
addition
to
lending
fees
paid
by
the
borrower.
Income
from
securities
loaned,
net
of
fees
paid
to
the
securities
lending
agent
and/or
third-party
vendor,
is
reported
separately
in
the Statements of
Operations.
The
Fund
bears
the
market
risk
with
respect
to
any
cash
collateral
investment,
securities
loaned,
and
the
risk
that
the
agent
may
default
on
its
obligations
to
the
Fund.
If
the
borrower
defaults
on
its
obligation
to
return
the
securities
loaned,
the
Fund
has
the
right
to
repurchase
the
securities
in
the
open
market
using
the
collateral
received.
The
securities
lending
agent
has
agreed
to
indemnify
the
Fund
in
the
event
of
default
by
a
third
party
borrower.
At
December
31,
2024,
International
Equity
Series
had
no
securities
on
loan.
f.
Income
and
Deferred
Taxes
It
is each
Fund's
policy
to
qualify
as
a
regulated
investment
company
under
the
Internal
Revenue
Code. Each
Fund
intends
to
distribute
to
shareholders
substantially
all
of
its
taxable
income
and
net
realized
gains
to
relieve
it
from
federal
income
and excise
taxes.
As
a
result,
no
provision
for
U.S.
federal
income
taxes
is
required.
The
Funds
may
be
subject
to
foreign
taxation
related
to
income
received,
capital
gains
on
the
sale
of
securities
and
certain
foreign
currency
transactions
in
the
foreign
jurisdictions
in
which
the
Funds
invest.
Foreign
taxes,
if
any,
are
recorded
based
on
the
tax
regulations
and
rates
that
exist
in
the
foreign
markets
in
which
the
Funds
invest.
When
a
capital
gain
tax
is
determined
to
apply,
certain
or
all
Funds
record
an
estimated
deferred
tax
liability
in
an
amount
that
would
be
payable
if
the
securities
were
disposed
of
on
the
valuation
date.
As
a
result
of
several
court
cases,
in
certain
countries
across
the
European
Union,
certain
or
all
Funds
filed
additional
tax
reclaims
for
previously
withheld
taxes
on
dividends
earned
in
those
countries
(EU
reclaims). Income
recognized,
if
any,
for
EU
reclaims
is
reflected
as
other
income
in
the
Statements of
Operations
and
any
related
receivable,
if
any,
is
reflected
as
European
Union
tax
reclaims
in
the
Statements
of
Assets
and
Liabilities.
Any
fees
associated
with
these
filings
are
reflected
in
other
expenses
in
the
Statements
of
Operations.
When
uncertainty
exists
as
to
the
ultimate
resolution
of
these
proceedings,
the
likelihood
of
receipt
of
these
EU
reclaims,
and
the
potential
timing
of
payment,
no
amounts
are
reflected
in
the
financial
statements.
For
U.S.
income
tax
purposes,
EU
reclaims
received
by
the
Funds,
if
any,
reduce
the
amount
of
foreign
taxes
Fund
shareholders
can
use
as
1.
Organization
and
Significant
Accounting
Policies
(continued)
d.
Derivative
Financial
Instruments
(continued)
Templeton
Institutional
Funds
Notes
to
Financial
Statements
tax
deductions
or credits
on
their income
tax
returns.
In
the
event
that
EU
reclaims
received
by
the
Funds during a
fiscal
year
exceed
foreign
withholding
taxes
paid
by
the
Funds,
and
the Funds
previously
passed through
to
its
shareholders
foreign
taxes
incurred
by
the
Funds
to
be
used
as
a
credit
or
deduction
on
a
shareholder’s
income
tax
return,
the
Funds will
enter
into
a
closing
agreement
with
the
Internal
Revenue
Service
(IRS)
in
order
to
pay
the
associated
tax
liability
on
behalf
of
the Funds'
shareholders.
The
Funds
determined
to
enter
into
a
closing
agreement
with
the
IRS
and
recorded
estimated
payments
as
a
reduction
to
income,
as
reflected
in
the
Statements
of
Operations.
Each
Fund
may
recognize
an
income
tax
liability
related
to
its
uncertain
tax
positions
under
U.S.
GAAP
when
the
uncertain
tax
position
has
a
less
than
50%
probability
that
it
will
be
sustained
upon
examination
by
the
tax
authorities
based
on
its
technical
merits.
As
of
December
31,
2024, each
Fund
has
determined
that
no
tax
liability
is
required
in
its
financial
statements
related
to
uncertain
tax
positions
for
any
open
tax
years
(or
expected
to
be
taken
in
future
tax
years).
Open
tax
years
are
those
that
remain
subject
to
examination
and
are
based
on
the
statute
of
limitations
in
each
jurisdiction
in
which
the
Fund
invests.
g.
Security
Transactions,
Investment
Income,
Expenses
and
Distributions
Security
transactions
are
accounted
for
on
trade
date.
Realized
gains
and
losses
on
security
transactions
are
determined
on
a
specific
identification
basis.
Interest
income
(including
interest
income
from
payment-in-kind
securities,
if
any)
and
estimated
expenses
are
accrued
daily.
Amortization
of
premium
and
accretion
of
discount
on
debt
securities
are
included
in
interest
income.
Dividend
income
is
recorded
on
the
ex-dividend
date
except
for
certain
dividends
from
securities
where
the
dividend
rate
is
not
available.
In
such
cases,
the
dividend
is
recorded
as
soon
as
the
information
is
received
by
the
Funds.
Distributions
to
shareholders
are
recorded
on
the
ex-dividend
date.
Distributable
earnings
are
determined
according
to
income
tax
regulations
(tax
basis)
and
may
differ
from
earnings
recorded
in
accordance
with
U.S.
GAAP.
These
differences
may
be
permanent
or
temporary.
Permanent
differences
are
reclassified
among
capital
accounts
to
reflect
their
tax
character.
These
reclassifications
have
no
impact
on
net
assets
or
the
results
of
operations.
Temporary
differences
are
not
reclassified,
as
they
may
reverse
in
subsequent
periods.
Common
expenses
incurred
by
the
Trust
are
allocated
among
the
Funds
based
on
the
ratio
of
net
assets
of
each
Fund
to
the
combined
net
assets
of
the
Trust
or
based
on
the
ratio
of
number
of
shareholders
of
each
Fund
to
the
combined
number
of
shareholders
of
the
Trust.
Fund
specific
expenses
are
charged
directly
to
the
Fund
that
incurred
the
expense.
Realized
and
unrealized
gains
and
losses
and
net
investment
income,
excluding
class
specific
expenses,
are
allocated
daily
to
each
class
of
shares
based
upon
the
relative
proportion
of
net
assets
of
each
class.
Differences
in
per
share
distributions
by
class
are
generally
due
to
differences
in
class
specific
expenses.
h.
Accounting
Estimates
The
preparation
of
financial
statements
in
accordance
with
U.S.
GAAP
requires
management
to
make
estimates
and
assumptions
that
affect
the
reported
amounts
of
assets
and
liabilities
at
the
date
of
the
financial
statements
and
the
amounts
of
income
and
expenses
during
the
reporting
period.
Actual
results
could
differ
from
those
estimates.
i.
Guarantees
and
Indemnifications
Under
the Trust's
organizational
documents,
its
officers
and trustees
are
indemnified
by
the Trust against
certain
liabilities
arising
out
of
the
performance
of
their
duties
to
the
Trust.
Additionally,
in
the
normal
course
of
business,
the Trust,
on
behalf
of
the
Funds, enters
into
contracts
with
service
providers
that
contain
general
indemnification
clauses.
The Trust's
maximum
exposure
under
these
arrangements
is
unknown
as
this
would
involve
future
claims
that
may
be
made
against
the Trust
that
have
not
yet
occurred.
Currently,
the Trust
expects
the
risk
of
loss
to
be
remote.
1.
Organization
and
Significant
Accounting
Policies
(continued)
f.
Income
and
Deferred
Taxes
(continued)
Templeton
Institutional
Funds
Notes
to
Financial
Statements
2.
Shares
of
Beneficial
Interest
At
December
31,
2024,
there
were
an
unlimited
number
of
shares
authorized
(without
par value).
Transactions
in
the
Funds'
shares
were
as
follows:
Foreign
Smaller
Companies
Series
Shares
Amount
Advisor
Class
Year
ended
December
31,
2024
Shares
sold
...................................
916,450
$16,451,068
Shares
issued
in
reinvestment
of
distributions
..........
855,958
13,996,485
Shares
redeemed
...............................
(4,997,817)
(94,979,163)
Net
increase
(decrease)
..........................
(3,225,409)
$(64,531,610)
Year
ended
December
31,
2023
Shares
sold
...................................
774,913
$13,498,672
Shares
issued
in
reinvestment
of
distributions
..........
139,219
2,434,410
Shares
redeemed
...............................
(12,288,620)
(213,911,530)
Net
increase
(decrease)
..........................
(11,374,488)
$(197,978,448)
International
Equity
Series
Shares
Amount
Primary
Shares
Primary
Shares:
Year
ended
December
31,
2024
Shares
sold
...................................
1,526,338
$18,049,589
Shares
issued
in
reinvestment
of
distributions
..........
1,322,254
13,421,021
Shares
redeemed
...............................
(4,639,729)
(52,218,629)
Net
increase
(decrease)
..........................
(1,791,137)
$(20,748,019)
Year
ended
December
31,
2023
Shares
sold
...................................
1,390,671
$15,553,199
Shares
issued
in
reinvestment
of
distributions
..........
1,536,843
16,457,252
Shares
redeemed
in-kind
(Note
9
)
...................
(5,437,954)
(59,545,598)
Shares
redeemed
...............................
(5,026,589)
(55,594,271)
Net
increase
(decrease)
..........................
(7,537,029)
$(83,129,418)
Service
Shares
Service
Shares:
Year
ended
December
31,
2024
Shares
sold
...................................
123
$1,479
Shares
issued
in
reinvestment
of
distributions
..........
1,814
19,030
Shares
redeemed
...............................
(1,766)
(18,926)
Net
increase
(decrease)
..........................
171
$1,583
Year
ended
December
31,
2023
Shares
sold
...................................
114
$1,319
Shares
issued
in
reinvestment
of
distributions
..........
1,667
18,324
Shares
redeemed
...............................
(1,448)
(15,912)
Net
increase
(decrease)
..........................
333
$3,731
Templeton
Institutional
Funds
Notes
to
Financial
Statements
3.
Transactions
with
Affiliates
Franklin
Resources,
Inc.
is
the
holding
company
for
various
subsidiaries
that
together
are
referred
to
as
Franklin
Templeton.
Certain
officers
and
trustees
of
the Trust are
also
officers
and/or
directors
of
the
following
subsidiaries:
a.
Management
Fees
Foreign
Smaller
Companies
Series pays
an
investment
management fee,
calculated
daily
and
paid
monthly,
to TIC based
on the
average
daily
net
assets
of
the
Fund
as
follows:
International
Equity
Series pays
an
investment
management fee,
calculated
daily
and
paid
monthly,
to TIC based
on the
average
daily
net
assets
of
the
Fund
as
follows:
For
the
year
ended
December
31,
2024,
each
Fund's
gross
effective
investment
management
fee
rate
based
on
average
daily
net
assets
was
as
follows:
Under
a
subadvisory
agreement,
FTIC,
an
affiliate
of
TIC,
provides
subadvisory
services
to
Foreign
Smaller
Companies
Series.
The
subadvisory
fee
is
paid
by
TIC
based
on
the
Fund's
average
daily
net
assets,
and
is
not
an
additional
expense
of
the
Fund.
Subsidiary
Affiliation
Templeton
Investment
Counsel,
LLC
(TIC)
Investment
manager
Franklin
Templeton
Investments
Corp.
(FTIC)
Investment
manager
Franklin
Templeton
Services,
LLC
(FT
Services)
Administrative
manager
Franklin
Distributors,
LLC
(Distributors)
Principal
underwriter
Franklin
Templeton
Investor
Services,
LLC
(Investor
Services)
Transfer
agent
Annualized
Fee
Rate
Net
Assets
0.950%
Up
to
and
including
$500
million
0.930%
Over
$500
million,
up
to
and
including
$1
billion
0.910%
Over
$1
billion,
up
to
and
including
$5
billion
0.890%
Over
$5
billion,
up
to
and
including
$10
billion
0.870%
Over
$10
billion,
up
to
and
including
$15
billion
0.850%
In
excess
of
$15
billion
Annualized
Fee
Rate
Net
Assets
0.775%
Up
to
and
including
$500
million
0.755%
Over
$500
million,
up
to
and
including
$1
billion
0.735%
Over
$1
billion,
up
to
and
including
$5
billion
0.715%
Over
$5
billion,
up
to
and
including
$10
billion
0.695%
Over
$10
billion,
up
to
and
including
$15
billion
0.675%
In
excess
of
$15
billion
Foreign
Smaller
Companies
Series
International
Equity
Series
Gross
effective
investment
management
fee
rate
........
0.950%
0.775%
Templeton
Institutional
Funds
Notes
to
Financial
Statements
b.
Administrative
Fees
Under
an
agreement
with
TIC,
FT
Services
provides
administrative
services
to
the
Funds.
The
fee
is
paid
by TIC
based
on
each
of the
Funds'
average
daily
net
assets,
and
is
not
an
additional
expense
of
the
Funds.
c.
Transfer
Agent
Fees
Each
class
of
shares
pays
transfer
agent
fees,
calculated
monthly
and
paid
monthly, to
Investor
Services
for
its
performance
of
shareholder
servicing
obligations. The
fees
are based
on
a
fixed
margin
earned
by
Investor
Services
and
are allocated
to
the Funds
based
upon
relative
assets
and
relative
transactions. In
addition,
each
class reimburses
Investor
Services
for
out
of
pocket
expenses
incurred
and reimburses
shareholder
servicing
fees
paid
to
third
parties.
These
fees
paid
to
third
parties
are
accrued
and
allocated
daily
based
upon
their
relative
proportion
of
such
classes'
aggregate
net
assets.
For
the
year
ended
December
31,
2024,
the Funds
paid
transfer
agent
fees
as
noted
in
the
Statements of
Operations
of
which
the
following
amounts
were
retained
by
Investor
Services:
International
Equity
Series'
Service
shares
may
pay
up
to
0.15%
of
average
daily
net
assets
for
sub-transfer
agency
fees
as
noted
in
the
Statements
of
Operations.
d.
Investments
in
Affiliated
Management
Investment
Companies
Certain
or
all
Funds
invest
in
one
or
more
affiliated
management
investment
companies.
As
defined
in
the
1940
Act,
an
investment
is
deemed
to
be
a
“Controlled
Affiliate”
of
a
fund
when
a
fund
owns,
either
directly
or
indirectly,
25%
or
more
of
the
affiliated
fund’s
outstanding
shares
or
has
the
power
to
exercise
control
over
management
or
policies
of
such
fund.
The
Funds
do
not
invest
for
purposes
of
exercising
a
controlling
influence
over
the
management
or
policies.
Management
fees
paid
by
the
Funds
are
waived
on
assets
invested
in
the
affiliated
management
investment
companies,
as
noted
in
the
Statements
of
Operations,
in
an
amount
not
to
exceed
the
management
and
administrative
fees
paid
directly
or
indirectly
by
each
affiliate.
During
the
year
ended
December
31,
2024,
investments
in
affiliated
management
investment
companies
were
as
follows:
Foreign
Smaller
Companies
Series
International
Equity
Series
Transfer
agent
fees
........................
$31,199
$26,605
Value
at
Beginning
of
Year
Purchases
Sales
Realized
Gain
(Loss)
Net
Change
in
Unrealized
Appreciation
(Depreciation)
Value
at
End
of
Year
Number
of
Shares
Held
at
End
of
Year
Investment
Income
a
a
a
a
a
a
a
a
Foreign
Smaller
Companies
Series
Non-Controlled
Affiliates
Income
from
securities
loaned
Institutional
Fiduciary
Trust
-
Money
Market
Portfolio,
4.183%
$525,321
$16,014,817
$(16,321,156)
$—
$—
$218,982
218,982
$43,009
Total
Affiliated
Securities
...
$525,321
$16,014,817
$(16,321,156)
$—
$—
$218,982
$43,009
3.
Transactions
with
Affiliates
(continued)
Templeton
Institutional
Funds
Notes
to
Financial
Statements
e.
Waiver
and
Expense
Reimbursements
TIC has
contractually
agreed
in
advance
to
limit
the
investment
management
fees
for
International
Equity
Series
to
0.74%
of
the
average
daily
net
assets
of
the
Fund
until
April
30,
2025.
Total
expenses
waived
or
paid
are
not
subject
to
recapture
subsequent
to
the
Fund's
fiscal
year
end.
4.
Income
Taxes
For
tax
purposes,
capital
losses
may
be
carried
over
to
offset
future
capital
gains.
During
the
year
ended
December
31,
2024,
the
utilized
capital
loss
carryforwards
were
as
follows:
For
tax
purposes,
the
Funds
may
elect
to
defer
any
portion
of
a
post-October
capital
loss
or
late-year
ordinary
loss
to
the
first
day
of
the
following
fiscal
year.
At December
31,
2024,
the
deferred
losses
were
as
follows:
Value
at
Beginning
of
Year
Purchases
Sales
Realized
Gain
(Loss)
Net
Change
in
Unrealized
Appreciation
(Depreciation)
Value
at
End
of
Year
Number
of
Shares
Held
at
End
of
Year
Investment
Income
International
Equity
Series
Non-Controlled
Affiliates
Dividends
Institutional
Fiduciary
Trust
-
Money
Market
Portfolio,
4.183%
$2,548,785
$38,093,597
$(36,400,506)
$—
$—
$4,241,876
4,241,876
$136,221
Non-Controlled
Affiliates
Income
from
securities
loaned
Institutional
Fiduciary
Trust
-
Money
Market
Portfolio,
4.183%
$221,250
$8,049,414
$(8,270,664)
$—
$—
$—
—
$15,553
Total
Affiliated
Securities
...
$2,770,035
$46,143,011
$(44,671,170)
$—
$—
$4,241,876
$151,774
Foreign
Smaller
Companies
Series
International
Equity
Series
Capital
loss
utilized
carryforwards
....
$9,900,242
$—
Foreign
Smaller
Companies
Series
International
Equity
Series
Late-year
ordinary
loss
...........................
$69,836
$29,422
3.
Transactions
with
Affiliates
(continued)
d.
Investments
in
Affiliated
Management
Investment
Companies
(continued)
Templeton
Institutional
Funds
Notes
to
Financial
Statements
The
tax
character
of
distributions
paid
during
the
years
ended
December
31,
2024
and
2023,
was
as
follows:
At
December
31,
2024,
the
cost
of
investments
and
net
unrealized
appreciation
(depreciation)
for
income
tax
purposes
were
as
follows:
Differences
between
income
and/or
capital
gains
as
determined
on
a
book
basis
and
a
tax
basis
are
primarily
due
to
differing
treatments
of
foreign
currency
transactions,
wash
sales,
EU
reclaims,
passive
foreign
investment
company
shares
and
derivative
financial
instruments.
The
Funds
utilized
a
tax
accounting
practice
to
treat
a
portion
of
the
proceeds
from
capital
shares
redeemed
as
a
distribution
from
net
investment
income
and
realized
capital
gains.
5.
Investment
Transactions
Purchases
and
sales
of
investments
(excluding
short
term
securities)
for
the
year
ended
December
31,
2024,
were
as
follows:
Foreign
Smaller
Companies
Series
International
Equity
Series
2024
2023
2024
2023
Distributions
paid
from:
Ordinary
income
........................
$4,006,587
$2,478,019
$3,488,464
$12,062,977
Long
term
capital
gain
....................
10,131,906
—
10,468,577
5,048,660
$14,138,493
$2,478,019
$13,957,041
$17,111,637
Foreign
Smaller
Companies
Series
International
Equity
Series
a
a
a
Cost
of
investments
.......................
$83,181,874
$77,047,673
Unrealized
appreciation
.....................
$33,884,959
$27,427,133
Unrealized
depreciation
.....................
(10,822,937)
(4,218,670)
Net
unrealized
appreciation
(depreciation)
.......
$23,062,022
$23,208,463
Distributable
earnings:
Undistributed
long
term
capital
gains
...........
—
1,191,156
Total
distributable
earnings
..................
$—
$1,191,156
Foreign
Smaller
Companies
Series
International
Equity
Series
Purchases
..............................
$44,150,882
$31,338,012
Sales
..................................
$119,069,997
$64,174,310
Templeton
Institutional
Funds
Notes
to
Financial
Statements
At
December
31,
2024,
in
connection
with
securities
lending
transactions,
certain
or
all
Funds
loaned
investments
and
received
cash
collateral
as
follows:
6.
Other
Derivative
Information
At
December
31,
2024,
investments
in
derivative
contracts
are
reflected
in
the
Statements
of
Assets
and
Liabilities
as
follows:
For
the
year
ended
December
31,
2024
,
the
effect
of
derivative
contracts
in
the
Statements
of
Operations
was
as
follows:
For
the
year
ended
December
31,
2024,
the
average
month
end
notional
amount
of
futures
contracts
represented
$2,338,208.
See
Note
1(d) regarding
derivative
financial
instruments.
Foreign
Smaller
Companies
Series
International
Equity
Series
Securities
lending
transactions
a
:
Equity
investments
b
........................
$218,982
$—
a
The
agreements
can
be
terminated
at
any
time.
b
The
gross
amount
of
recognized
liability
for
such
transactions
is
included
in
payable
upon
return
of
securities
loaned
in
the
Statements
of
Assets
and
Liabilities.
Asset
Derivatives
Liability
Derivatives
Derivative
Contracts
Not
Accounted
for
as
Hedging
Instruments
Statement
of
Assets
and
Liabilities
Location
Fair
Value
Statement
of
Assets
and
Liabilities
Location
Fair
Value
International
Equity
Series
Equity
contracts
...........
Variation
margin
on
futures
contracts
$
—
Variation
margin
on
futures
contracts
$
73,233
a
Total
....................
$—
$73,233
a
This
amount
reflects
the
cumulative
appreciation
(depreciation)
of
futures
contracts
as
reported
in
the
Schedule
of
Investments.
Only
the
variation
margin
receivable/payable
at
year
end
is
separately
reported
within
the
Statement
of
Assets
and
Liabilities.
Prior
variation
margin
movements
were
recorded
to
cash
upon
receipt
or
payment.
Derivative
Contracts
Not
Accounted
for
as
Hedging
Instruments
Statement
of
Operations
Location
Net
Realized
Gain
(Loss)
for
the
Year
Statement
of
Operations
Location
Net
Change
in
Unrealized
Appreciation
(Depreciation)
for
the
Year
International
Equity
Series
Net
realized
gain
(loss)
from:
Net
change
in
unrealized
appreciation
(depreciation)
on:
Equity
contracts
..............
Futures
contracts
$98,343
Futures
contracts
$(154,390)
Total
.......................
$98,343
$(154,390)
5.
Investment
Transactions
(continued)
Templeton
Institutional
Funds
Notes
to
Financial
Statements
7.
Concentration
of
Risk
Investing
in
foreign
securities
may
include
certain
risks
and
considerations
not
typically
associated
with
investing
in
U.S.
securities,
such
as
fluctuating
currency
values
and
changing
local,
regional
and
global
economic,
political
and
social
conditions,
which
may
result
in
greater
market
volatility.
Political
and
financial
uncertainty
in
many
foreign
regions
may
increase
market
volatility
and
the
economic
risk
of
investing
in
foreign
securities.
In
addition,
certain
foreign
securities
may
not
be
as
liquid
as
U.S.
securities.
8.
Credit
Facility
The
Funds,
together
with
other
U.S.
registered
and
foreign
investment
funds
(collectively,
Borrowers),
managed
by
Franklin
Templeton,
are
borrowers
in
a
joint
syndicated
senior
unsecured
credit
facility
totaling
$2.675
billion
(Global
Credit
Facility)
which
matured
on
January
31,
2025.
This
Global
Credit
Facility
provides
a
source
of
funds
to
the
Borrowers
for
temporary
and
emergency
purposes,
including
the
ability
to
meet
future
unanticipated
or
unusually
large
redemption
requests.
Effective
January
31,
2025,
the
Borrowers
renewed
the
Global
Credit
Facility
for
a
one-year
term,
maturing
January
30,
2026,
for
a
total
of
$2.995
billion.
Under
the
terms
of
the
Global
Credit
Facility,
the
Funds
may,
in
addition
to
interest
charged
on
any
borrowings
made
by
the
Funds
and
other
costs
incurred
by
the
Funds,
pay
their
share
of
fees
and
expenses
incurred
in
connection
with
the
implementation
and
maintenance
of
the
Global
Credit
Facility,
based
upon
their
relative
share
of
the
aggregate
net
assets
of
all
of
the
Borrowers,
including
an
annual
commitment
fee
of
0.15%
based
upon
the
unused
portion
of
the
Global
Credit
Facility.
These
fees
are
reflected
in
other
expenses
in
the
Statements
of
Operations.
During
the
year ended
December
31,
2024,
the
Funds
did
not
use
the
Global
Credit
Facility.
9.
Redemption
In-Kind
During
the year
ended
December
31,
2023,
International
Equity
Series
realized
$8,468,998
of
net
gains
resulting
from
a
redemption in-kind
in
which
a shareholder
redeemed
fund
shares
for
cash
and
securities
held
by
the
Fund.
Because
such
gains
are
not
taxable
to
the
Fund
and
are
not
distributed
to
remaining
shareholders,
they
are
reclassified
from
accumulated
net
realized
gains
to
paid-in
capital.
10.
Fair
Value
Measurements
The Funds
follow
a
fair
value
hierarchy
that
distinguishes
between
market
data
obtained
from
independent
sources
(observable
inputs)
and
the Funds'
own
market
assumptions
(unobservable
inputs).
These
inputs
are
used
in
determining
the
value
of
the Funds' financial
instruments
and
are
summarized
in
the
following
fair
value
hierarchy:
Level
1
–
quoted
prices
in
active
markets
for
identical
financial
instruments
Level
2
–
other
significant
observable
inputs
(including
quoted
prices
for
similar
financial
instruments,
interest
rates,
prepayment
speed,
credit
risk,
etc.)
Level
3
–
significant
unobservable
inputs
(including
the Funds'
own
assumptions
in
determining
the
fair
value
of
financial
instruments)
Templeton
Institutional
Funds
Notes
to
Financial
Statements
The
input
levels
are
not
necessarily
an
indication
of
the
risk
or
liquidity
associated
with
financial
instruments
at
that
level.
A
summary
of
inputs
used
as
of
December
31,
2024,
in
valuing
the
Funds'
assets
and
liabilities carried
at
fair
value,
is
as
follows:
Level
1
Level
2
Level
3
Total
Foreign
Smaller
Companies
Series
Assets:
Investments
in
Securities:
Common
Stocks
:
Austria
...............................
$
1,234,319
$
—
$
—
$
1,234,319
Bahamas
.............................
2,239,805
—
—
2,239,805
Belgium
..............................
—
1,938,824
—
1,938,824
Brazil
................................
745,501
2,314,157
—
3,059,658
Canada
..............................
2,942,597
—
—
2,942,597
China
...............................
—
1,731,883
—
1,731,883
Denmark
.............................
—
641,815
—
641,815
Finland
..............................
657,651
1,507,761
—
2,165,412
France
...............................
—
697,668
—
697,668
Germany
.............................
—
5,126,922
—
5,126,922
Greece
..............................
—
808,782
—
808,782
Hong
Kong
...........................
—
3,669,887
—
3,669,887
India
................................
—
1,416,709
—
1,416,709
Indonesia
............................
643,501
—
—
643,501
Israel
................................
1,507,447
—
—
1,507,447
Italy
.................................
1,219,155
9,193,808
—
10,412,963
Japan
...............................
—
20,921,925
—
20,921,925
Mexico
..............................
402,616
—
—
402,616
New
Zealand
..........................
—
1,587,457
—
1,587,457
Norway
..............................
—
1,516,461
—
1,516,461
Philippines
............................
1,341,144
1,690,269
—
3,031,413
Portugal
..............................
—
732,011
—
732,011
Singapore
............................
—
1,145,374
—
1,145,374
South
Korea
..........................
—
3,676,309
—
3,676,309
Sweden
..............................
1,059,517
2,116,882
—
3,176,399
Switzerland
...........................
1,911,666
3,240,695
—
5,152,361
Taiwan
...............................
—
7,610,762
—
7,610,762
Thailand
.............................
1,091,282
1,075,516
—
2,166,798
United
Kingdom
........................
5,606,522
6,307,213
—
11,913,735
United
States
..........................
1,753,334
—
—
1,753,334
Short
Term
Investments
...................
218,982
999,767
—
1,218,749
Total
Investments
in
Securities
...........
$24,575,039
$81,668,857
a
$—
$106,243,896
International
Equity
Series
Assets:
Investments
in
Securities:
Common
Stocks
:
Canada
..............................
5,192,951
—
—
5,192,951
Chile
................................
—
1,497,618
—
1,497,618
China
...............................
1,161,050
—
—
1,161,050
Denmark
.............................
—
1,202,625
—
1,202,625
France
...............................
—
8,503,814
—
8,503,814
Germany
.............................
—
12,845,037
—
12,845,037
Hungary
.............................
—
969,184
—
969,184
India
................................
—
1,269,055
—
1,269,055
Japan
...............................
—
12,768,277
—
12,768,277
Netherlands
...........................
—
3,123,978
—
3,123,978
Norway
..............................
—
1,231,388
—
1,231,388
10.
Fair
Value
Measurements
(continued)
Templeton
Institutional
Funds
Notes
to
Financial
Statements
A
reconciliation
in
which
Level
3
inputs
are
used
in
determining
fair
value
is
presented
when
there
are
significant
Level
3
assets
and/or
liabilities
at
the
beginning
and/or
end
of
the year.
11.
Operating
Segments
The Funds
have
adopted
the
FASB
Accounting
Standards
Update
(ASU)
2023-07,
Segment
Reporting
(Topic
280)
-
Improvements
to
Reportable
Segment
Disclosures.
The
update
is
limited
to
disclosure
requirements
and
does
not
impact
the Funds'
financial
position
or
results
of
operations.
Each
Fund
operates
as
a
single
operating
segment,
which
is
an
investment
portfolio.
The
Funds'
Investment
manager
serves
as
the
Chief
Operating
Decision
Maker
(CODM),
evaluating
fund-wide
results
and
performance
under
a
unified
investment
strategy.
The
CODM
uses
these
measures
to
assess
fund
performance
and
allocate
resources
effectively.
Internal
reporting
provided
to
the
CODM
aligns
with
the
accounting
policies
and
measurement
principles
used
in
the
financial
statements.
For
information
regarding
segment
assets,
segment
profit
or
loss,
and
significant
expenses,
refer
to
the
Statements
of
Assets
and
Liabilities
and
the
Statements
of
Operations,
along
with
the
related
notes
to
the
financial
statements.
The
Schedules
of
Investments
provides
details
of
the
Funds'
investments
that
generate
returns
such
as
interest,
dividends,
and
realized
and
unrealized
gains
or
losses.
Performance
metrics,
including
portfolio
turnover
and
expense
ratios,
are
disclosed
in
the
Financial
Highlights.
12.
Subsequent
Events
The
Funds
have
evaluated
subsequent
events
through
the
issuance
of
the financial
statements
and
determined
that
no
events
have
occurred
that
require
disclosure
other
than
those
already
disclosed
in
the
financial
statements.
Level
1
Level
2
Level
3
Total
International
Equity
Series
(continued)
Assets:
(continued)
Investments
in
Securities:
(continued)
Common
Stocks:
(continued)
South
Korea
..........................
$
—
$
2,797,452
$
—
$
2,797,452
Sweden
..............................
—
1,784,427
—
1,784,427
Switzerland
...........................
—
880,529
—
880,529
Taiwan
...............................
—
3,519,691
—
3,519,691
United
Kingdom
........................
—
15,661,319
—
15,661,319
United
States
..........................
4,657,785
17,021,313
—
21,679,098
Escrows
and
Litigation
Trusts
...............
—
—
—
b
—
Short
Term
Investments
...................
4,241,876
—
—
4,241,876
Total
Investments
in
Securities
...........
$15,253,662
$85,075,707
c
$—
$100,329,369
Liabilities:
Other
Financial
Instruments:
Futures
Contracts
........................
$
73,233
$
—
$
—
$
73,233
Total
Other
Financial
Instruments
.........
$73,233
$—
$—
$73,233
a
Includes
foreign
securities
valued
at
$80,669,090,
which
were
categorized
as
Level
2
as
a
result
of
the
application
of
market
level
fair
value
procedures.
See
the
Financial
Instrument
Valuation
note
for
more
information.
b
Includes
financial
instruments
determined
to
have
no
value.
c
Includes
foreign
securities
valued
at
$85,075,707,
which
were
categorized
as
Level
2
as
a
result
of
the
application
of
market
level
fair
value
procedures.
See
the
Financial
Instrument
Valuation
note
for
more
information.
10.
Fair
Value
Measurements
(continued)
Templeton
Institutional
Funds
Notes
to
Financial
Statements
Abbreviations
Selected
Portfolio
FHLB
Federal
Home
Loan
Banks
REIT
Real
Estate
Investment
Trust
TEMPLETON
INSTITUTIONAL
FUNDS
Report
of
Independent
Registered
Public
Accounting
Firm
To
the
Board
of
Trustees
of
Templeton
Institutional
Funds
and
Shareholders
of
Foreign
Smaller
Companies
Series
and
International
Equity
Series
Opinions
on
the
Financial
Statements
We
have
audited
the
accompanying
statements
of
assets
and
liabilities,
including
the
schedules
of
investments,
of
Foreign
Smaller
Companies
Series
and
International
Equity
Series
(constituting
Templeton
Institutional
Funds,
hereafter
collectively
referred
to
as
the
"Funds")
as
of
December
31,
2024,
the
related
statements
of
operations
for
the
year
ended
December
31,
2024,
the
statements
of
changes
in
net
assets
for
each
of
the
two
years
in
the
period
ended
December
31,
2024,
including
the
related
notes,
and
the
financial
highlights
for
each
of
the
five
years
in
the
period
ended
December
31,
2024
(collectively
referred
to
as
the
“financial
statements”).
In
our
opinion,
the
financial
statements
present
fairly,
in
all
material
respects,
the
financial
position
of
each
of
the
Funds
as
of
December
31,
2024,
the
results
of
each
of
their
operations
for
the
year
then
ended,
the
changes
in
each
of
their
net
assets
for
each
of
the
two
years
in
the
period
ended
December
31,
2024
and
each
of
the
financial
highlights
for
each
of
the
five
years
in
the
period
ended
December
31,
2024
in
conformity
with
accounting
principles
generally
accepted
in
the
United
States
of
America.
Basis
for
Opinions
These
financial
statements
are
the
responsibility
of
the
Funds’
management.
Our
responsibility
is
to
express
an
opinion
on
the
Funds’
financial
statements
based
on
our
audits.
We
are
a
public
accounting
firm
registered
with
the
Public
Company
Accounting
Oversight
Board
(United
States)
(PCAOB)
and
are
required
to
be
independent
with
respect
to
the
Funds
in
accordance
with
the
U.S.
federal
securities
laws
and
the
applicable
rules
and
regulations
of
the
Securities
and
Exchange
Commission
and
the
PCAOB.
We
conducted
our
audits
of
these
financial
statements
in
accordance
with
the
standards
of
the
PCAOB.
Those
standards
require
that
we
plan
and
perform
the
audit
to
obtain
reasonable
assurance
about
whether
the
financial
statements
are
free
of
material
misstatement,
whether
due
to
error
or
fraud.
Our
audits
included
performing
procedures
to
assess
the
risks
of
material
misstatement
of
the
financial
statements,
whether
due
to
error
or
fraud,
and
performing
procedures
that
respond
to
those
risks.
Such
procedures
included
examining,
on
a
test
basis,
evidence
regarding
the
amounts
and
disclosures
in
the
financial
statements.
Our
audits
also
included
evaluating
the
accounting
principles
used
and
significant
estimates
made
by
management,
as
well
as
evaluating
the
overall
presentation
of
the
financial
statements.
Our
procedures
included
confirmation
of
securities
owned
as
of
December
31,
2024
by
correspondence
with
the
custodian,
private
placement
agent,
transfer
agent
and
brokers;
when
replies
were
not
received
from
brokers,
we
performed
other
auditing
procedures.
We
believe
that
our
audits
provide
a
reasonable
basis
for
our
opinions.
/s/PricewaterhouseCoopers
LLP
San
Francisco,
California
February
20,
2025
We
have
served
as
the
auditor
of
one
or
more
investment
companies
in
the
Franklin
Templeton
Group
of
Funds
since
1948.
TEMPLETON
INSTITUTIONAL
FUNDS
Tax
Information
(unaudited)
By
mid-February,
tax
information
related
to
a
shareholder's
proportionate
share
of
distributions
paid
during
the
preceding
calendar
year
will
be
received,
if
applicable.
Please
also
refer
to
www.franklintempleton.com
for
per
share
tax
information
related
to
any
distributions
paid
during
the
preceding
calendar
year.
Shareholders
are
advised
to
consult
with
their
tax
advisors
for
further
information
on
the
treatment
of
these
amounts
on
their
tax
returns.
The
following
tax
information
for
the
Funds
is
required
to
be
furnished
to
shareholders
with
respect
to
income
earned
and
distributions
paid
during their
fiscal
year.
The
Funds
hereby
report
the
following
amounts,
or
if
subsequently
determined
to
be
different,
the
maximum
allowable
amounts,
for
the
fiscal
year
ended
December
31,
2024:
Under
Section
853
of
the
Internal
Revenue
Code,
the
Funds
below intend
to
elect
to
pass
through
to
their
shareholders
the
following
amounts,
or
amounts
as
finally
determined,
of
foreign
taxes
paid
and
foreign
source
income
earned
by
the
Funds
during
the
fiscal
year
ended
December
31,
2024
:
Pursuant
to:
Foreign
Smaller
Companies
Series
International
Equity
Series
Long-Term
Capital
Gain
Dividends
Distributed
§852(b)(3)(C)
$11,608,809
$12,384,670
Income
Eligible
for
Dividends
Received
Deduction
(DRD)
§854(b)(1)(A)
$11,809
—
Qualified
Dividend
Income
Earned
(QDI)
§854(b)(1)(B)
$2,816,130
$3,128,541
Short-Term
Capital
Gain
Dividends
Distributed
§871(k)(2)(C)
—
$984,540
Section
163(j)
Interest
Dividends
Earned
§163(j)
$16,837
—
Foreign
Smaller
Companies
Series
International
Equity
Series
Foreign
Taxes
Paid
$270,423
$175,438
Foreign
Source
Income
Earned
$2,375,064
$2,610,529
Templeton
Institutional
Funds
Changes
In
and
Disagreements
with
Accountants
For
the
period
covered
by
this
report
Not
applicable.
Results
of
Meeting(s)
of
Shareholders
For
the
period
covered
by
this
report
Not
applicable.
Remuneration
Paid
to
Directors,
Officers
and
Others
For
the
period
covered
by
this
report
Refer
to
the
financial
statements
included
herein.
Board
Approval
of
Management
and
Subadvisory
Agreements
For
the
period
covered
by
this
report
Not
applicable.
©
2025
Franklin
Templeton.
All
rights
reserved.
| ITEM 8. | CHANGES IN AND DISAGREEMENTS WITH ACCOUNTANTS FOR OPEN-END MANAGEMENT INVESTMENT COMPANIES. |
The information is disclosed as part of the Financial Statements included in Item 7 of this Form N-CSR.
| ITEM 9. | PROXY DISCLOSURES FOR OPEN-END MANAGEMENT INVESTMENT COMPANIES. |
The information is disclosed as part of the Financial Statements included in Item 7 of this Form N-CSR.
| ITEM 10. | REMUNERATION PAID TO DIRECTORS, OFFICERS, AND OTHERS OF OPEN-END MANAGEMENT INVESTMENT COMPANIES. |
The information is disclosed as part of the Financial Statements included in Item 7 of this Form N-CSR.
| ITEM 11. | STATEMENT REGARDING BASIS FOR APPROVAL OF INVESTMENT ADVISORY CONTRACT. |
The information is disclosed as part of the Financial Statements included in Item 7 of this Form N-CSR, as applicable.
| ITEM 12. | DISCLOSURE OF PROXY VOTING POLICIES AND PROCEDURES FOR CLOSED-END MANAGEMENT INVESTMENT COMPANIES. |
Not applicable.
| ITEM 13. | PORTFOLIO MANAGERS OF CLOSED-END MANAGEMENT INVESTMENT COMPANIES. |
Not applicable.
| ITEM 14. | PURCHASES OF EQUITY SECURITIES BY CLOSED-END MANAGEMENT INVESTMENT COMPANY AND AFFILIATED PURCHASERS. |
Not applicable.
| ITEM 15. | SUBMISSION OF MATTERS TO A VOTE OF SECURITY HOLDERS. |
| | | |
| | | There have been no changes to the procedures by which shareholders may recommend nominees to the Registrant’s Board of Trustees that would require disclosure herein. |
| ITEM 16. | CONTROLS AND PROCEDURES. |
| (a) | The Registrant’s chief executive officer and chief financial officer have concluded that the Registrant’s disclosure controls and procedures (as defined in Rule 30a- 3(c) under the Investment Company Act of 1940, as amended (the “1940 Act”)) are effective as of a date within 90 days of the filing date of this report that includes the disclosure required by this paragraph, based on their evaluation of the disclosure controls and procedures required by Rule 30a-3(b) under the 1940 Act and 15d-15(b) under the Securities Exchange Act of 1934. |
| (b) | There were no changes in the registrant’s internal control over financial reporting (as defined in Rule 30a-3(d) under the 1940 Act) that occurred during the period covered by this report that have materially affected, or are likely to materially affect the registrant’s internal control over financial reporting. |
| ITEM 17. | DISCLOSURE OF SECURITIES LENDING ACTIVITIES FOR CLOSED-END MANAGEMENT INVESTMENT COMPANIES. |
Not applicable.
| ITEM 18. | RECOVERY OF ERRONEOUSLY AWARDED COMPENSATION. |
(a) (1) Code of Ethics attached hereto.
Exhibit 99.CODE ETH
(a) (2) Certifications pursuant to section 302 of the Sarbanes-Oxley Act of 2002 attached hereto.
Exhibit 99.CERT
(b) Certifications pursuant to Section 906 of the Sarbanes-Oxley Act of 2002 attached hereto.
Exhibit 99.906CERT
SIGNATURES
Pursuant to the requirements of the Securities Exchange Act of 1934 and the Investment Company Act of 1940, the registrant has duly caused this Report to be signed on its behalf by the undersigned, there unto duly authorized.
| TEMPLETON INSTITUTIONAL FUNDS | |
| | | |
| By: | /s/ Christopher Kings | |
| | Christopher Kings | |
| | Chief Executive Officer – Finance and Administration | |
| | | |
| Date: | February 28, 2025 | |
Pursuant to the requirements of the Securities Exchange Act of 1934 and the Investment Company Act of 1940, this report has been signed below by the following persons on behalf of the registrant and in the capacities and on the dates indicated.
| By: | /s/ Christopher Kings | |
| | Christopher Kings | |
| | Chief Executive Officer – Finance and Administration | |
| | | |
| Date: | February 28, 2025 | |
| By: | /s/ Jeffrey White | |
| | Jeffrey White | |
| | Chief Financial Officer, Chief Accounting Officer and Treasurer | |
| | | |
| Date: | February 28, 2025 | |