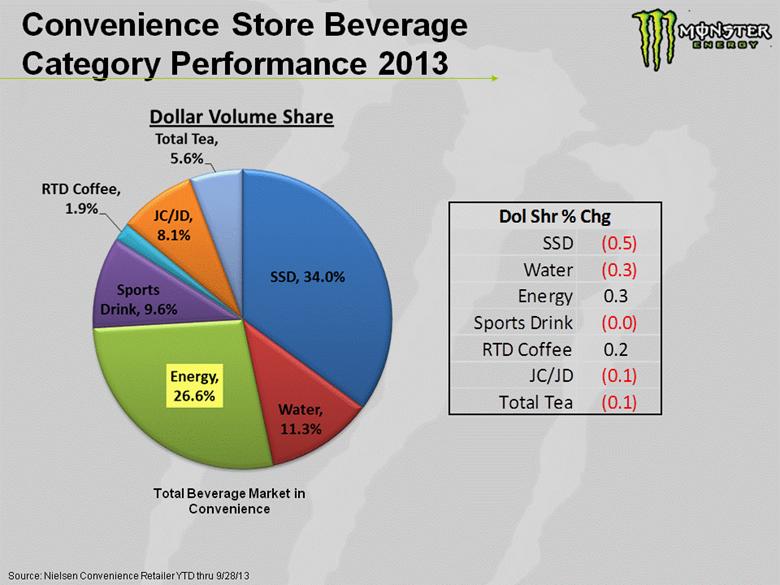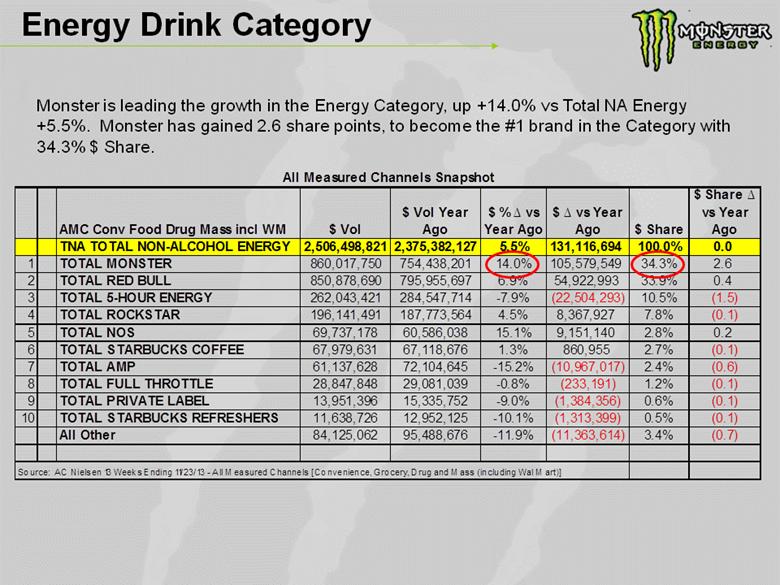
| Energy Drink Category Monster is leading the growth in the Energy Category, up +14.0% vs Total NA Energy +5.5%. Monster has gained 2.6 share points, to become the #1 brand in the Category with 34.3% $ Share. AMC Conv Food Drug Mass incl WM $ Vol $ Vol Year Ago $ % vs Year Ago $ vs Year Ago $ Share $ Share vs Year Ago TNA TOTAL NON-ALCOHOL ENERGY 2,506,498,821 2,375,382,127 5.5% 131,116,694 100.0% 0.0 1 TOTAL MONSTER 860,017,750 754,438,201 14.0% 105,579,549 34.3% 2.6 2 TOTAL RED BULL 850,878,690 795,955,697 6.9% 54,922,993 33.9% 0.4 3 TOTAL 5-HOUR ENERGY 262,043,421 284,547,714 -7.9% (22,504,293) 10.5% (1.5) 4 TOTAL ROCKSTAR 196,141,491 187,773,564 4.5% 8,367,927 7.8% (0.1) 5 TOTAL NOS 69,737,178 60,586,038 15.1% 9,151,140 2.8% 0.2 6 TOTAL STARBUCKS COFFEE 67,979,631 67,118,676 1.3% 860,955 2.7% (0.1) 7 TOTAL AMP 61,137,628 72,104,645 -15.2% (10,967,017) 2.4% (0.6) 8 TOTAL FULL THROTTLE 28,847,848 29,081,039 -0.8% (233,191) 1.2% (0.1) 9 TOTAL PRIVATE LABEL 13,951,396 15,335,752 -9.0% (1,384,356) 0.6% (0.1) 10 TOTAL STARBUCKS REFRESHERS 11,638,726 12,952,125 -10.1% (1,313,399) 0.5% (0.1) All Other 84,125,062 95,488,676 -11.9% (11,363,614) 3.4% (0.7) Source: AC Nielsen 13 Weeks Ending 11/23/13 - All Measured Channels [Convenience, Grocery, Drug and Mass (including Wal Mart)] All Measured Channels Snapshot |