SECURITIES AND EXCHANGE COMMISSION
Washington, DC 20549
FORM 10-K
ANNUAL REPORT PURSUANT TO SECTION 13 OR 15(d) OF THE
SECURITIES EXCHANGE ACT OF 1934
FOR THE FISCAL YEAR ENDED DECEMBER 31, 2006
COMMISSION FILE NUMBER: 1-14097
SAUER-DANFOSS INC.
(Exact name of registrant as specified in its charter)
Delaware | | 36-3482074 |
(State or other jurisdiction of
incorporation or organization) | | (I.R.S. Employer
Identification No.) |
250 Parkway Drive, Suite 270,
Lincolnshire, Illinois | | 60069 |
Krokamp 35, 24539
Neumünster, Germany | | |
(Address of principal executive offices) | | (Zip Code) |
(515) 239-6000 |
(Registrant’s telephone number, including Area Code) |
Securities registered pursuant to Section 12(b) of the Act: |
Common Stock, par value $0.01 per share | | New York Stock Exchange |
(Title of each class) | | (Name of each exchange on which registered) |
Securities registered pursuant to Section 12(g) of the Act: |
None |
(Title of class) |
Indicate by check mark if the registrant is a well-known seasoned issuer, as defined in Rule 405 of the Securities Act of 1933. Yes o No x
Indicate by check mark if the registrant is not required to file reports pursuant to Section 13 or 15(d) of the Securities Exchange Act of 1934 (the “Act”). Yes o No x
Indicate by check mark whether the registrant: (1) has filed all reports required to be filed by Section 13 or 15(d) of the Act during the preceding 12 months (or for such shorter periods that the Registrant was required to file such reports), and (2) has been subject to such filing requirements for the past 90 days. Yes x No o
Indicate by check mark if disclosure of delinquent filers pursuant to Item 405 of Regulation S-K is not contained herein, and will not be contained, to the best of registrant’s knowledge, in definitive proxy or information statements incorporated by reference in Part III of this Form 10-K or any amendment to this Form 10-K: x
Indicate by check mark whether the registrant is a large accelerated filer, accelerated filer, or a non-accelerated filer. See definition of “accelerated filer and large accelerated filer” in Rule 12b-2 of the Act. (Check one):
Large Accelerated Filer o Accelerated Filer x Non-Accelerated Filer o
Indicate by check mark whether the registrant is a shell company (as defined in Rule 12b-2 of the Act): Yes o No x
The aggregate market value of the voting common stock of the registrant held by nonaffiliates based on the last sale price on June 30, 2006 was $266,136,368. (The registrant does not have any other authorized common equity.)
As of March 9, 2007 there were 48,125,961 shares of common stock, $0.01 par value, of the registrant outstanding.
DOCUMENTS INCORPORATED BY REFERENCE
Portions of the Proxy Statement for the annual meeting of stockholders to be held June 14, 2007 are incorporated by reference into Part III.
PART I
Item 1. Business.
(a) General Development of Business
Sauer-Danfoss Inc. (the Company), a U.S. Delaware corporation, and its predecessor organizations have been active in the mobile hydraulics industry since the 1960s. Sauer-Danfoss is a global leader in the development, manufacture, and marketing of advanced systems for the distribution and control of power in mobile equipment. The Company designs, manufactures, and markets hydraulic, electronic, electric, mechanical components, software, and integrated systems, that generate, transmit, and control power in mobile equipment. Principal products are hydrostatic transmissions, gear pumps and motors, orbital motors, hydrostatic steering units, proportional load-sensing valves, microprocessor controls, electric drives, and electrohydraulics. The Company sells its products to original equipment manufacturers (OEMs) of highly engineered, off-road vehicles who use Sauer-Danfoss products to provide the hydraulic and electronic power for the propel, work, and control functions of their vehicles. The Company’s products are sold primarily to the agriculture, construction, road building, turf care, material handling, and specialty vehicle markets. The Company conducts its business globally under the Sauer-Danfoss name.
(b) Financial Information About Segments
The Company reports its operating segments based on its product lines of Propel, Work Function, and Controls. Propel products include hydrostatic transmissions and related products that transmit the power from the engine to the wheel to propel a vehicle. Work Function products include steering motors as well as gear pumps and motors that transmit power for the work functions of the vehicle. Controls products include electrohydraulic controls, microprocessors, electric drives, and valves that control and direct the power of a vehicle. Information about the Company’s reportable segments defined by product lines is set forth in Note 17 in the Notes to Consolidated Financial Statements on pages F-33 through F-35 of this report and is incorporated herein by reference.
(c) Description of Business
Information regarding the Company’s principal products, by segment, and the business in general is presented below. Information regarding sales by the Company’s segments and geographic regions is set forth in Note 17 in the Notes to Consolidated Financial Statements on pages F-33 through F-35, and is incorporated herein by reference. No individual customer, OEM or other, accounted for 10 percent or more of the Company’s total net sales in 2006, 2005, or 2004.
Propel Segment
Hydrostatic Transmissions
Sauer-Danfoss designs, manufactures, and markets a range of closed circuit axial piston hydrostatic transmissions for the propulsion of mobile equipment in the Americas, Europe, and Asia-Pacific region. High-power (typically over 50 HP) and medium-power (typically 25 to 50 HP) applications for hydrostatic transmissions manufactured by the Company include construction, road building, specialty, and agricultural mobile equipment. Light-power (typically 15 to 25 HP) and bantam-power (typically under 15 HP) applications for hydrostatic transmissions manufactured by the Company include light agricultural and turf care mobile equipment. The Company manufactures these hydrostatic transmissions at its facilities in Ames, Iowa; Lawrence, Kansas; Sullivan, Illinois; Princeton, Kentucky; Freeport, Illinois; Neumunster, Germany; Dubnica nad Vahom, Slovakia; Povazská Bystrica, Slovakia; Shanghai, China; and Osaka, Japan.
2
Open Circuit Piston Pumps
Sauer-Danfoss designs, manufactures, and markets custom-designed open circuit piston pumps used to transform mechanical power from the engine to hydraulic power for the various functions of the vehicle. The advantages of open circuit piston pumps compared to other types of pumps, such as vane or gear pumps, are the high degree of control within the work function hydraulic system and the more efficient use of engine power. These products are designed and manufactured at facilities in Ames, Iowa and Dubnica, Slovakia.
Work Function Segment
Open Circuit Gear Pumps and Motors
Sauer-Danfoss designs, manufactures, and markets custom-designed gear pumps, as well as a broad range of high-performance standard gear pumps and motors. Gear pumps and motors are the most widely used type of mobile hydraulic pumps and motors in the industry. The Company manufactures gear pumps and motors at its Swindon, England; Lawrence, Kansas; Bologna, Italy; and Povazská Bystrica, Slovakia facilities.
Low Speed High Torque Motors
Sauer-Danfoss designs, manufactures, and markets a complete line of geroller and gerotor motors at its Lawrence, Kansas, and Nordborg, Denmark, facilities. These motors are used for both propel and work functions in all served markets.
Steering Units
Sauer-Danfoss designs, manufactures, and markets hydrostatic steering units to customers throughout the world. The Company manufactures steering units in Nordborg, Denmark; Wroclaw, Poland; and Pune, India. These steering units convert steering wheel motion into hydraulic flow and pressure to provide steering motion for agriculture tractors, combines, turf care, marine, and earthmoving equipment.
Controls Segment
Mobile Electronics
Sauer-Danfoss designs, manufactures, and markets electronic controls including microprocessor-based controls, electronic sensors, and joysticks through its electrohydraulics operations in Minneapolis, Minnesota, and Almhult, Sweden, and also designs electrohydraulic products in Neumunster, Germany; Redditch, United Kingdom; Cento, Italy; and Nordborg, Denmark. Electrohydraulic controls and sensors integrate hydraulics, hydrostatic transmissions, and mechanical components with electronic controls and are used by OEMs of mobile equipment to control the Company’s hydraulic systems, as well as the hydraulic systems of other manufacturers. The electrohydraulic products bring together the propulsion and work functions by providing standard or custom-designed controls.
Additionally, the Company designs and manufactures both alternating current (AC) and direct current (DC) electric motors, electronic motor controllers, and power units through its electric drives operations in Odense, Denmark and Berching, Germany. The Kaiserslautern, Germany, facility designs inverters used to control the AC electric motors which are manufactured by the facility in Almhult, Sweden.
Control Valves
Sauer-Danfoss designs, manufactures and markets a variety of spool type control valves to meet its customers’ needs, ranging from very sophisticated electrohydraulic valves for highly sophisticated forestry
3
and agricultural harvesting equipment, to very simple low cost valves for turf care agricultural tractors. These products are manufactured in facilities located in Caxias do Sul, Brazil; Nordborg, Denmark; Easley, South Carolina; and Pune, India.
The Company also designs, manufactures and markets a complete line of cartridge valves and hydraulic integrated circuits in facilities located in Reggio Emilia, Italy; Hillsboro, Oregon; Easley, South Carolina; and Caxias do Sul, Brazil. Aerial lift platforms and road building equipment are significant users of cartridge valves.
Major Markets and Applications
Construction and Road
Building | | Agriculture and Turf Care | | Material Handling and
Specialty Vehicles |
Chip spreaders | | Combines | | Fruit pickers |
Concrete pumps | | Cotton pickers | | Industrial lift trucks |
Concrete saws | | Detasselers | | Logging equipment |
Crawler dozers | | Seeders | | Marine equipment |
Crawler loaders | | Sprayers | | Mining equipment |
Ditchers/trenchers | | Tractors | | Oil field equipment |
Excavators | | Windrowers | | Railway maintenance vehicles |
Grinders | | Commercial wide-area, walk- | | Rough terrain fork lifts |
Landfill compactors | | behind mowers | | Self-propelled boom aerial lifts |
Oil distributors | | Commercial zero-turn mowers | | Self-propelled scissor aerial lifts |
Pavers | | General turf maintenance | | Snow groomers |
Planers | | equipment | | Sweepers |
Rollers | | Lawn and garden tractors | | Tree shakers |
Skid steer loaders | | | | Truck and bus fan drives |
Transit mixers | | | | |
Utility tractors | | | | |
Wheel loaders | | | | |
General Characteristics
Sauer-Danfoss sells both standard and customized products, with most products being built to order. With respect to some of the most technologically demanding vehicles, such as those used in agriculture, forestry, construction, and road building, Sauer-Danfoss’ engineers work closely with customers from design through manufacture of the final product, a cycle that can take as long as four to six years for a major application.
Sauer-Danfoss operates 24 manufacturing facilities in the Americas, Europe, and the Asia-Pacific region. The Company’s decentralized manufacturing capabilities allow it to adapt its products to local market needs and to provide flexibility to meet customer delivery requirements. The Company sells and distributes its products directly to large OEMs and serves smaller OEM’s through Company owned sales companies or independent distributors.
In accordance with standard industry practice for the mobile equipment industry, the Company warrants its products to be free from defects in material and workmanship. The warranty period varies from one to three years, from the date of first use or date of manufacture, depending on the type of product or, in some cases, the application. The Company’s warranty expense has been less than one percent of net sales in each of the past three years.
Because many of its products are designed and developed in conjunction with its customers’ design teams to fit their specific needs and to minimize inventory levels, the Company primarily manufactures
4
products to order. The Company typically machines components with long lead times according to a sales forecast and machines certain unique components for specific customers according to firm orders. Inventories at the Company’s manufacturing sites consist primarily of raw materials and machined iron housings and components. Limited amounts of assembled finished units are maintained in inventory at the manufacturing sites. Certain Company’s sales locations maintain inventory that consist primarily of finished units manufactured specifically for distribution to customers in those locations.
The Company does not accept orders subject to late delivery penalties. On occasion, the Company sells its products to government agencies, including those used for military applications, but it does not design its products to meet specific government standards and usually only enters into contracts for the supply of commercial products. There are no government contracts of material value to the Company.
Raw Materials
The Company purchases iron housings and components from various U.S., European, and Asian foundries and metal suppliers. The principal materials used by the Company are iron, steel, brass, and aluminum. All materials used by the Company are generally available from a number of sources in quantities sufficient to meet current requirements. In 2006 the availability of steel improved, but was still limited. The Company was still able to obtain sufficient quantities of steel and castings to meet its production needs. The cost of these materials was higher than in the past years due to continued limited supplies and metal surcharges. The Company has a global supplier quality program that is used by the Company to ensure all suppliers meet the Company’s quality expectations.
Patents, Trademarks, and Licenses
The Company owns or licenses rights to approximately 600 patents and trademarks relating to its business. While the Company considers its patents and trademarks important in the operation of its business and in protecting its technology from being used by competitors, its business is not dependent on any single patent or trademark or group of related patents or trademarks.
To ensure worldwide availability of the Company’s design of products, the Company has, in the past, licensed its technology to unaffiliated companies in certain countries. The Company does not currently have any such license agreements in place. The Company currently has license agreements in place as part of joint venture agreements to which the company is a party for the joint venture entity to manufacture or distribute the Company’s technology.
Seasonality
Seasonal patterns in retail demand for agricultural, construction, road building, and turf care equipment sold by the Company’s customers result in variations in the volume and mix of products sold by the Company during various times of the year. Historically, the Company has higher sales levels in the first half of the year. Seasonal demand must be estimated in advance, and products must be manufactured in anticipation of such demand in order to achieve efficient utilization of labor and production resources.
Working Capital
The Company has historically funded its working capital requirements through cash flow from operations and its various credit facilities.
Backlog
At December 31, 2006 the Company’s backlog (consisting of accepted but unfilled customer orders primarily scheduled for delivery during 2007) was $632 million, an increase of 19 percent from
5
December 31, 2005, excluding the impact of currency fluctuation. The amount of the Company’s backlog is significant because, among other factors, customer orders have historically involved long lead times and specific model types. Orders can be increased, canceled, or rescheduled by customers causing the backlog level to vary. In addition, customers’ ordering patterns can impact the level of reported backlog. For example, the Company’s U.S. distributor customers are placing orders with shorter lead times due to the Company’s ability to fill such orders.
Competition
The mobile hydraulics industry is very competitive. Sauer-Danfoss competes based on technological product innovation, quality, and customer service. The Company believes that to be successful over the long term, suppliers to mobile equipment manufacturers must have the ability to capitalize on the changing needs of the industry by providing technological innovation, shorter product development times, and reduced manufacturing lead times at globally competitive price levels.
Hydrostatic Transmission Market
The closed circuit hydrostatic transmission market is highly concentrated and intensely competitive. There are a small number of manufacturers of hydrostatic transmissions with which the Company competes worldwide that are not captive suppliers of OEMs. These include Bosch Rexroth AG, Eaton Corporation, and Linde AG. In addition, the Company competes with alternative products, such as mechanical transmissions of other manufacturers.
The Company competes with a number of smaller companies that typically offer a single, specialized product on a more limited geographic basis as a component of a closed circuit hydrostatic transmission system.
In terms of global supply of closed circuit hydrostatic transmissions, the Company believes it is the world leader in terms of product range, market share, and geographic coverage. Only Bosch Rexroth AG offers similar geographic coverage.
Open Circuit Piston Pumps and Gear Pumps and Motors Market
The open circuit work function market is fragmented with a large number of suppliers of all types of products, including open circuit piston pumps, gear pumps and motors, and with intensive competition on pricing at the component level. There are approximately ten major companies that compete on a global basis, including Bosch Rexroth AG, Parker-Hannifin Corporation, and Eaton Corporation, and in Japan, Kayaba and Kawasaki. The supply of standard gear pumps and motors is particularly fragmented with more than 50 companies worldwide in each respective area. Most of these competitors have a limited product range and operate in a limited geographic market.
Low Speed High Torque Motor Market
There are a limited number of competitors who can provide a complete line of low speed, high torque motors (LSHT). Competitors include Eaton Corporation, Bosch Rexroth AG, White Hydraulics, Parker-Hannifin Corporation, and M&S Hydraulics. This market is extremely price-competitive and is growing, providing Sauer-Danfoss opportunity to develop new products to increase market share.
Steering Unit Market
Hydrostatic steering units are provided to the market from the same competitors as LSHT motors (above) plus Ognibene. Sauer-Danfoss believes it has the largest European market share for steering units and a growing share globally. As steering systems grow and needs expand, Sauer-Danfoss is providing
6
electronic control of steering and complete electrical steering solutions to meet the growing demands of the steering market. Today, Sauer-Danfoss believes that it leads the industry in this direction for steering technology.
Mobile Electronics Market
In the mobile electronics market, which covers both propulsion and work function systems, there are few suppliers of propulsion system controls and only three are worldwide competitors. The main competition in this area comes from major OEMs, who produce controls for their own use. In work function electrohydraulic valves, electronic sensors, and controls, there is a wide range of niche suppliers in limited geographic markets. In recent years larger companies have increasingly acquired these niche or regional suppliers and thereby have improved their ability to offer integrated systems. The Company also produces alternating current (AC) and direct current (DC) motors and controls and is well equipped to serve customers in these segments with either a hydraulic solution or an electric solution for their propel and work function needs. The Company believes it is well positioned to establish itself as a technology leader in the work function and propel segments, as there is no clearly established technology in this sector that is deemed to be an industry standard.
Control Valves Market
The control valve marketplace is fragmented with a large number of suppliers most of which are focused on limited valve types or flow ranges. Sauer-Danfoss provides a comprehensive line of both spool valves and cartridge valves to meet the specific needs of its customers. Competitors who provide partial lines include Hydra-Force, Sterling Hydraulics, Husco, Sun Hydraulics, Integrated Hydraulics, Walvoil, and Oil Control, plus many others. Complete global control valve line competitors are limited to Parker-Hannifin Corporation, Bosch Rexroth AG, and Eaton Corporation.
Research and Development
The Company’s research and development expenditures during 2006, 2005, and 2004 were approximately $61.9 million, $58.7 million, and $51.9 million, respectively.
Environmental Matters
In all countries in which it operates, the Company is subject to environmental laws and regulations concerning emissions to air, discharge to waterways, and the generation, handling, storage, transportation, treatment, and disposal of waste materials. These laws and regulations are constantly evolving, and it is impossible to predict accurately the effect they will have on the Company in the future. The regulations are subject to varying and conflicting interpretations and implementation. In some cases, compliance can only be achieved by additional capital expenditures. The Company cannot accurately predict what capital expenditures, if any, may be required to comply with applicable environmental laws and regulations in the future; however, the Company does not currently estimate that any future capital expenditures for environmental control facilities will be material. The Company is not currently subject to any governmental remediation order, nor is the Company aware of any environmental issues that would have a materially adverse effect on the Company.
Employees
As of December 31, 2006, 2005, and 2004 the Company had approximately 9,200, 8,600, and 8,300, employees, respectively. Of its full time employees at December 31, 2006, approximately 3,100 were located in the Americas with the remaining located in Europe and Asia. From time to time, the Company also retains consultants, independent contractors, and temporary and part-time workers.
7
Financial Information about Geographic Areas
Information regarding the Company’s net sales and long-lived assets by geographic area is set forth in Note 17 in the Notes to Consolidated Financial Statements on pages F-33 through F-35 of this report, and is incorporated herein by reference.
Available Information
The Company maintains an Internet Website and the address of that site is http://www.sauer-danfoss.com. The Company provides access to its annual report on Form 10-K, quarterly reports on Form 10-Q, current reports on Form 8-K, and amendments to those reports filed or furnished pursuant to Section 13(a) of the Securities Exchange Act of 1934 through its Internet website as soon as reasonably practicable after the Company electronically files such material with, or furnishes it to, the Securities and Exchange Commission (SEC). The SEC maintains an Internet Website that contains reports, proxy and information statements, and other information regarding issuers that file electronically with the SEC. The address of the SEC site is http://www.sec.gov.
Item 1A. Risk Factors.
The Company’s business, financial condition, results of operations and cash flows can be affected by a number of factors, including but not limited to those set forth below and elsewhere in this annual report on Form 10-K, any one of which could cause actual results to vary materially from recent results or from anticipated future results.
International Operations
The Company depends on the strength of the economies in various parts of the world, particularly in the U.S. and Europe. As a result of this worldwide exposure, net revenue and profitability may be harmed as a result of economic conditions in the major markets in which the Company operates, including, but not limited to, recessions, inflation and deflation, general weakness in the agriculture, construction and specialty markets, and changes in consumer purchasing power.
Technology Change
The hydraulic industry and markets for component parts of mobile hydraulics are subject to technological change, evolving industry standards, changing customer requirements and improvements in and expansion of product offerings. Although the Company believes that it has the technological capabilities to remain competitive, technological advances or developments by competitors or others could result in the Company making significant capital expenditures in order to remain competitive and to avoid material adverse effects on its business, financial conditions and results of operations.
Implementation of New Business System
The Company is in the process of implementing a common business system at all locations. Any significant problems incurred related to this system implementation may delay or stop manufacturing and hinder the Company’s ability to ship product in a timely manner or affect the Company’s ability to access financial information. These problems could result in the loss of customers, a decrease in revenue or significant costs to correct the problem.
Raw Material Availability
The Company purchases raw materials and component parts from suppliers to be used in the manufacture of products. Changes in relationships with suppliers or increases in the costs of purchased raw materials including steel and other metals, and component parts could result in manufacturing
8
interruptions, delays, inefficiencies, or the inability to market products. In addition, profit margins would decrease if prices of purchased raw materials or component parts increase and the Company is unable to pass on those increases to its customers.
Pricing and Competitive Pressures from OEM Customers
A majority of the Company’s sales are directly to OEM customers. Increasingly, OEM customers are seeking to use their positions as volume purchasers in the mobile hydraulics market to obtain preferential pricing and to obtain substantial quality assurance protection from suppliers.
Currency Exchange Rates
The Company has a number of manufacturing sites throughout the world and sells products in several countries other than those where the product is manufactured. As a result, the Company has exposure to movements in the exchange rates of various currencies against the U.S. dollar and against the currencies of countries in which the main manufacturing facilities are located. The Company’s most significant foreign currency exposures are the euro, Japanese yen, Slovakian koruna, Polish zloty, and Danish kroner. Exchange rate fluctuations relative to the U.S. dollar could adversely affect the Company’s results of operations. The Company does enter into forward contracts to reduce the impact of currency fluctuations on cash flows related to forecasted sales denominated in currencies other than the functional currency of the selling location.
Cyclicality: Risks Associated with General Economic Conditions
The capital goods industry in general and mobile hydraulics industry in particular are subject to economic cycles. Cyclical downturns have in the past had and could in the future have a material adverse effect on the demand for the Company’s products and, consequently, on the Company’s business, financial condition, and results of operations. Demand for the Company’s products is dependent upon the general condition of the off-highway mobile equipment industry which may be affected by numerous factors, including levels of construction activity, weather conditions and interest rates. The Company’s results of operations are also subject to price competition and the cost of supplies and labor, both of which are affected by general economic conditions. The Company derives substantial sales from cyclical industries, including the turf care, material handling, construction and agricultural equipment industries. Periods of economic recession in the U.S. or Europe or any other major industrial market could cause a substantial decrease in the Company’s net sales and have a material adverse effect on the Company’s business, financial conditions and results of operations.
Income Tax Estimates
The Company is subject to income taxes in the U.S. and numerous non-U.S. jurisdictions. Significant judgment is required in determining the worldwide provision for income taxes. In the ordinary course of business, there are many transactions and calculations where the ultimate tax determination is uncertain. The Company is periodically under audit by tax authorities. Although management believes tax estimates are reasonable, the final outcome of tax audits and any related litigation could be materially different than that which is reflected in historical income tax provisions and accruals. Based on the outcome of a given tax audit or related litigation, a material effect on the Company’s income tax provision or net income may result in the period or periods from initial recognition in the Company’s reported financial results to the final closure of that tax audit or settlement of related litigation when the ultimate tax and related cash flow is known with certainty. In 2007 the Company will adopt Financial Interpretation No. 48, “Accounting for Uncertainty in Income Taxes — an interpretation of FASB Statement No. 109” (FIN No. 48), which requires that a tax position have a greater than 50 percent likelihood of being sustained in order to
9
recognize in the financial statements. The Company does not expect the adoption of FIN No. 48 to have a significant impact on its consolidated financial statements.
Catastrophic Events
Unforeseen events, including war, terrorism and other international conflicts, public health issues, and natural disasters such as earthquakes, hurricanes or other adverse weather and climate conditions, whether occurring in the U.S. or abroad, could disrupt the Company’s operations, disrupt the operations of suppliers or customers, or result in political or economic instability. These events could reduce demand for hydraulic and electric products and make it difficult or impossible for the Company to manufacture products, deliver products to customers, or to receive products from suppliers.
The foregoing list is not exhaustive. There can be no assurance that the Company has correctly identified and appropriately assessed all factors affecting the Company or that the publicly available and other information with respect to these matters is complete and correct. Additional risk and uncertainties not presently known to the Company or that are currently believed to be immaterial also may adversely impact the business. Should any risks or uncertainties develop into actual events, these developments could have a material adverse effect on the Company’s business, financial condition, and results of operations.
10
Item 2. Properties.
Sauer-Danfoss Inc. conducts its manufacturing operations at 24 locations; eight in the United States, three in Italy, two each in Germany, Denmark, and Slovakia, and one each in the United Kingdom, Brazil, China, India, Japan, Poland, and Sweden. The Company leases approximately 15,000 square feet of office space in Lincolnshire, Illinois, where its principal executive offices are located. In addition, the Company has executive offices in Neumünster, Germany. The following table sets forth certain information relating to the Company’s principal manufacturing facilities:
| Location | | | Segment that Uses the Facility | | Approx.
Area in
Sq. Ft. | | Owned/Leased |
United States | | | | | | |
Ames, Iowa | | Propel | | 330,000 | | Owned |
Easley, South Carolina | | Controls | | 184,000 | | Owned |
Freeport, Illinois | | Propel | | 183,000 | | Owned |
Sullivan, Illinois | | Propel | | 176,000 | | Owned |
Lawrence, Kansas | | Propel and Work Function | | 162,000 | | Owned |
Minneapolis, Minnesota | | Controls | | 75,000 | | Leased |
Princeton, Kentucky | | Propel | | 68,000 | | Owned |
Hillsboro, Oregon | | Controls | | 60,000 | | Leased |
South America | | | | | | |
Caxias do Sul, Brazil | | Controls | | 29,000 | | Leased |
Europe | | | | | | |
Nordborg, Denmark | | Work Function and Controls | | 680,000 | | Leased |
Neumünster, Germany | | Propel and Controls | | 463,000 | | Owned |
Povazská Bystrica, Slovakia | | Propel, Work Function and Controls | | 354,500 | | Owned |
Dubnica nad Váhom, Slovakia | | Propel | | 250,000 | | Owned |
Bologna, Italy | | Work Function | | 246,000 | | Owned |
Swindon, England | | Work Function | | 229,000 | | Leased |
Berching, Germany | | Controls | | 131,000 | | Leased |
Odense, Denmark | | Controls | | 121,500 | | Leased |
Reggio Emilia, Italy | | Controls | | 76,500 | | Leased |
Wroclaw, Poland | | Work Function | | 41,000 | | Owned |
Älmhult, Sweden | | Controls | | 20,000 | | Owned |
Cento, Italy | | Controls | | 3,500 | | Leased |
India | | | | | | |
Pune, India | | Work Function | | 31,000 | | Leased |
Asia | | | | | | |
Shanghai/Pudong, China | | Propel | | 105,000 | | Leased |
Osaka, Japan | | Propel | | 94,000 | | Leased |
Total | | | | 4,113,000 | | |
Item 3. Legal Proceedings.
From time to time, the Company is involved in various legal matters considered normal in the course of its business. The Company intends to vigorously defend against all such claims. It is the Company’s policy to accrue for amounts related to these matters if it is probable that a liability has been incurred and an amount can be reasonably estimated. Although the outcome of such matters cannot be predicted with certainty and no assurances can be given with respect to such matters, the Company believes that the
11
outcome of these matters in which it is currently involved will not have a materially adverse effect on its results of operations, liquidity, or financial position.
Item 4. Submission of Matters to a Vote of Security Holders.
The Company did not submit any matter to a vote of security holders, through a solicitation of proxies or otherwise, during the fourth quarter of 2006.
EXECUTIVE OFFICERS OF THE COMPANY
The following table sets forth certain information regarding the executive officers of the Company:
Name | | | | Age | | Position | | Year
Appointed |
David J. Anderson (1) | | 59 | | President and Chief Executive Officer | | 2000 |
Hans J. Cornett (1) | | 56 | | Executive Vice President Chief Marketing Officer | | 2000 |
Thomas K. Kittel (1) | | 58 | | Executive Vice President and President Propel Division | | 2000 |
Karl J. Schmidt (2) | | 53 | | Executive Vice President and Chief Financial Officer | | 2002 |
James R. Wilcox (1) | | 61 | | Executive Vice President and President Work Function Division | | 2000 |
Ronald C. Hanson (3) | | 44 | | Vice President — Human Resources | | 2003 |
Henrik Krabsen (1) | | 45 | | Vice President — Valves | | 2000 |
Finn H. Lyhne (1) | | 52 | | Vice President — Electric Drives | | 2000 |
Kenneth D. McCuskey (1) | | 52 | | Vice President and Chief Accounting Officer, Secretary | | 2000 |
Albert K. Zahalka (1) | | 55 | | Vice President — Mobile Electronics | | 2000 |
Charles M. Cohrs (4) | | 44 | | Treasurer | | 2005 |
(1) These executive officers have served in various capacities with the Company or its subsidiaries for more than the past five years.
(2) Prior to joining the Company, Mr. Schmidt was employed by Degussa-Huls Corporation as Vice President and Chief Financial Officer.
(3) Prior to joining the Company, Mr. Hanson was employed by Maytag Corporation as Vice President, Human Resources.
(4) Prior to joining the Company, Mr. Cohrs was employed by Cable Design Technologies as Treasurer.
12
PART II
Item 5. Market for the Company’s Common Stock. Related Stockholder Matters and Company Purchases of Common Stock.
Market and Dividend Information
The Company’s Common Stock is traded on the New York Stock Exchange. Prior to February 2006 the Company’s common stock was also traded on the Frankfurt (Germany) Stock Exchange. As of March 2, 2007 there were 205 stockholders of record.
The Company is currently paying a quarterly dividend, which is subject to Board of Directors approval.
The following table sets forth the high and low prices on the New York Stock Exchange for the Company’s Common Stock since January 1, 2005, and the quarterly cash dividends declared in 2006 and 2005:
| | 1st | | 2nd | | 3rd | | 4th | | Full Year | |
2006 | | | | | | | | | | | | | |
High | | $ | 23.13 | | $ | 25.98 | | $ | 26.53 | | $ | 33.56 | | | $ | 33.56 | | |
Low | | $ | 18.79 | | $ | 21.55 | | $ | 22.22 | | $ | 23.80 | | | $ | 18.79 | | |
Dividends | | $ | 0.14 | | $ | 0.14 | | $ | 0.16 | | $ | 0.16 | | | $ | 0.60 | | |
2005 | | | | | | | | | | | | | |
High | | $ | 24.20 | | $ | 23.27 | | $ | 20.77 | | $ | 21.25 | | | $ | 24.20 | | |
Low | | $ | 18.80 | | $ | 16.99 | | $ | 17.12 | | $ | 17.34 | | | $ | 16.99 | | |
Dividends | | $ | 0.12 | | $ | 0.12 | | $ | 0.12 | | $ | 0.12 | | | $ | 0.48 | | |
13
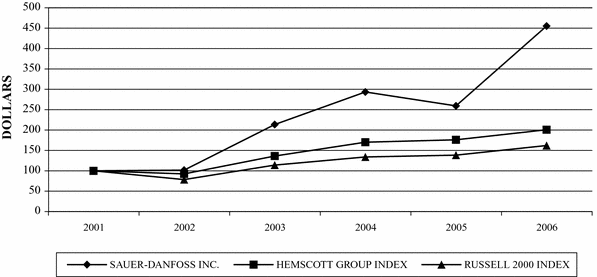
Performance Graph
The following graph shows a comparison of the cumulative total returns from December 31, 2001 to December 31, 2006, for the Company, the Russell 2000 Index and the Hemscott, Inc. — Diversified Machinery Index (“Hemscott-Group Index”). The graph assumes that $100 was invested on December 31, 2001 in the Company’s common stock, the Russell 2000 Index and the Hemscott-Group Index, a peer group index, and that all dividends were reinvested.
COMPARE CUMULATIVE TOTAL RETURN
AMONG SAUER-DANFOSS INC.
RUSSELL 2000 INDEX AND HEMSCOTT GROUP INDEX
14
Equity Compensation Plan Information
The following table summarizes, as of December 31, 2006, information about compensation plans under which equity securities of the Company are authorized for issuance:
Plan Category | | | | Number of securities to
be Issued upon Exercise
of Outstanding Options,
Warrants and Rights
(a) | | Weighted-Average
Exercise Price of
Outstanding Options,
Warrants and Rights
(b) | | Number of Securities Remaining
Avaliable for Future Issuance
under Equity Compensation
Plans (Excluding Securities
Reflected in Column (a))
(c) | |
Equity compensation plans approved by security holders | | | 1,342,504 | | | | $ | 0.00 | | | | 4,280,435 | | |
| | | | | | | | | | | | | | | | |
The Company does not have any equity compensation plans that were not approved by security holders. Refer to Note 13 in the Notes to the Consolidated Financial Statements on pages F-29 through F-31 of this report for a description of the equity compensation plans.
Column (a) includes performance units granted in 2004, 2005, and 2006. The extent to which the performance goals established for each grant are met will determine how many shares of common stock are issued upon completion of the three year performance period. Subsequent to December 31, 2006, the Company’s Compensation Committee determined that the 2004 performance units would vest, based on satisfaction of the performance criteria established when such units were awarded, at 190 percent of the target levels. Therefore, included in the above amounts are the 2004 performance units at 190 percent and the 2005 and 2006 performance units at 100 percent of the target levels.
Column (c) includes 868,754 shares available for future issuance under the Company’s 1998 Long-Term Incentive Plan, 167,000 shares available for issuance under the Company’s Non-Employee Director Stock Option and Restricted Stock Plan, and 3,244,681 shares available for issuance under the Company’s 2006 Omnibus Incentive Plan. Each of these plans permits the Company to issue common stock at times other than upon the exercise of options, warrants, or rights; for example, issuance in the form of restricted stock grants.
15
Item 6. Selected Financial Data.
SELECTED FINANCIAL DATA
| | 2006 | | 2005 | | 2004 | | 2003 | | 2002 | |
| | (in millions except per share and employee data) | |
Operating Data: | | | | | | | | | | | |
Net Sales | | $ | 1,739.1 | | $ | 1,547.8 | | $ | 1,404.2 | | $ | 1,126.8 | | $ | 952.3 | |
Gross profit | | 396.8 | | 357.7 | | 346.1 | | 252.4 | | 219.0 | |
Selling, general and administrative | | 215.6 | | 217.1 | | 200.2 | | 156.7 | | 128.6 | |
Research and development | | 61.9 | | 58.7 | | 51.9 | | 43.4 | | 37.8 | |
Impairment charges and loss on disposal of
fixed assets | | 3.2 | | 1.4 | | 2.1 | | 5.3 | | 0.4 | |
Total operating expenses | | 280.7 | | 277.2 | | 254.2 | | 205.4 | | 166.8 | |
Total interest expense, net | | 17.8 | | 15.7 | | 17.4 | | 17.4 | | 17.2 | |
Net income | | 53.7 | | 38.7 | | 33.2 | | 11.2 | | 13.7 | |
Per Share Data: | | | | | | | | | | | |
Income per common share, basic | | $ | 1.13 | | $ | 0.82 | | $ | 0.70 | | $ | 0.24 | | $ | 0.29 | |
Income per common share, diluted | | $ | 1.11 | | $ | 0.81 | | $ | 0.70 | | $ | 0.24 | | $ | 0.29 | |
Cash dividends declared per share | | $ | 0.60 | | $ | 0.48 | | $ | 0.34 | | $ | 0.28 | | $ | 0.28 | |
Weighted average basic shares outstanding | | 47.7 | | 47.5 | | 47.4 | | 47.4 | | 47.4 | |
Weighted average diluted shares outstanding | | 48.2 | | 47.8 | | 47.5 | | 47.5 | | 47.4 | |
Balance Sheet Data: | | | | | | | | | | | |
Inventories | | $ | 272.3 | | $ | 238.9 | | $ | 241.6 | | $ | 198.9 | | $ | 164.7 | |
Property, plant and equipment, net | | 504.0 | | 450.4 | | 478.5 | | 452.9 | | 435.1 | |
Total assets | | 1,309.2 | | 1,170.9 | | 1,211.6 | | 1,101.8 | | 970.5 | |
Total debt | | 349.6 | | 332.3 | | 345.1 | | 355.5 | | 318.3 | |
Stockholders’ equity | | 466.0 | | 438.9 | | 444.1 | | 397.2 | | 367.3 | |
Debt to total capital (1) | | 40.2 | % | 40.4 | % | 41.6 | % | 45.3 | % | 44.7 | % |
Other Data: | | | | | | | | | | | |
Backlog (at year-end) | | $ | 632.4 | | $ | 504.2 | | $ | 467.4 | | $ | 408.6 | | $ | 382.8 | |
Depreciation and amortization | | 95.7 | | 88.3 | | 82.4 | | 80.4 | | 72.6 | |
Capital expenditures | | 116.2 | | 95.2 | | 79.3 | | 60.0 | | 42.3 | |
EBITDA (2) | | 206.1 | | 172.3 | | 170.2 | | 124.0 | | 121.8 | |
Cash flows from (used in): | | | | | | | | | | | |
Operating activities | | 167.9 | | 116.3 | | 124.8 | | 95.6 | | 98.3 | |
Investing activities | | (109.3 | ) | (93.3 | ) | (75.5 | ) | (65.0 | ) | (66.3 | ) |
Financing activities | | (45.0 | ) | (20.1 | ) | (53.3 | ) | (28.8 | ) | (34.4 | ) |
Number of employees (at year end) | | 9,167 | | 8,614 | | 8,275 | | 7,409 | | 7,207 | |
(1) The debt to total capital ratio represents the percentage of total capital attributable to external financing. As such, the denominator of the ratio includes the total debt and total stockholders’ equity shown here as well as the minority interest presented on the balance sheet.
(2) EBITDA represents net income plus net interest expense, income tax expense (benefit), depreciation and amortization, and minority interest. EBITDA may not be comparable to similarly titled measures reported by other companies. While EBITDA should not be construed as a substitute for operating income or a better indicator of liquidity than cash flow from operating activities, which are determined in accordance with accounting principles generally accepted in the United States, it is included herein to provide additional information as management of the Company believes it provides an indication with respect to the ability of Sauer-Danfoss to meet its future debt service, capital expenditures, and
16
working capital requirements. The following table further demonstrates how EBITDA is derived from cash flows from operating activities:
| | 2006 | | 2005 | | 2004 | | 2003 | | 2002 | |
Cash flows from operating activities | | $ | 167.9 | | $ | 116.3 | | $ | 124.8 | | $ | 95.6 | | $ | 98.3 | |
Cumulative effect of change in accounting
principle | | — | | — | | — | | — | | (0.7 | ) |
Increase (decrease) in operating assets and liabilities, excluding the effects of acquisitions | | | | | | | | | | | |
Accounts receivable, net | | 24.5 | | 4.8 | | 30.8 | | 5.6 | | (2.8 | ) |
Inventories | | 14.2 | | 24.9 | | 23.5 | | 7.6 | | (1.1 | ) |
Accounts payable | | (27.2 | ) | 13.3 | | (22.7 | ) | (6.1 | ) | (2.5 | ) |
Accrued liabilities | | (8.5 | ) | (17.6 | ) | (10.2 | ) | (6.2 | ) | (4.1 | ) |
Deferred income taxes and other | | 0.1 | | 3.9 | | (9.1 | ) | 10.6 | | 10.3 | |
Interest expense, net | | 17.8 | | 15.7 | | 17.4 | | 17.4 | | 17.2 | |
Tax expense (benefit) | | 17.3 | | 11.0 | | 15.7 | | (0.5 | ) | 7.2 | |
EBITDA | | $ | 206.1 | | $ | 172.3 | | $ | 170.2 | | $ | 124.0 | | $ | 121.8 | |
17
Item 7. Management’s Discussion and Analysis of Financial Condition and Results of Operations.
Safe Harbor Statement
This Management’s Discussion and Analysis of Financial Condition and Results of Operations, as well as other portions of this annual report on Form 10-K, contain statements that constitute “forward-looking statements” within the meaning of the Private Securities Litigation Reform Act of 1995. Forward-looking statements provide current expectations of future events based on certain assumptions and include any statement that does not directly relate to any historical or current fact. All statements regarding future performance, growth, sales and earnings projections, conditions or developments are forward-looking statements. Words such as “anticipates,” “in the opinion,” “believes,” “intends,” “expects,” “may,” “will,” “should,” “could,” “plans,” “forecasts,” “estimates,” “predicts,” “projects,” “potential,” “continue,” and similar expressions may be intended to identify forward-looking statements.
Actual future results may differ materially from those described in the forward-looking statements due to a variety of factors, including the fact material handling and specialty markets have, in recent months, been stronger than in recent years. It is difficult to determine if past experience is a good guide to the future. While the economy in the U.S. was strong in the first half of the year it weakened in the second half of the year. The economic situation in Europe has begun to improve in the last half of the year although that improvement may not necessarily continue. The economy in China strengthened in 2006 after a sluggish 2005. Any downturn in the Company’s business segments could adversely affect the Company’s revenues and results of operations. Other factors affecting forward-looking statements include, but are not limited to, the following: specific economic conditions in the agriculture, construction, road building, turf care, material handling and specialty vehicle markets and the impact of such conditions on the Company’s customers in such markets; the cyclical nature of some of the Company’s businesses; the ability of the Company to win new programs and maintain existing programs with its original equipment manufacturer (OEM) customers; the highly competitive nature of the markets for the Company’s products as well as pricing pressures that may result from such competitive conditions; the continued operation and viability of the Company’s significant customers; the Company’s execution of internal performance plans; difficulties or delays in manufacturing; cost-reduction and productivity efforts; competing technologies and difficulties entering new markets, both domestic and foreign; changes in the Company’s product mix; future levels of indebtedness and capital spending; claims, including, without limitation, warranty claims, field retrofit claims, product liability claims, charges or dispute resolutions; ability of suppliers to provide materials as needed and the Company’s ability to recover any price increases for materials and product pricing; the Company’s ability to attract and retain key technical and other personnel; labor relations; the failure of customers to make timely payment; any inadequacy of the Company’s intellectual property protection or the potential for third-party claims of infringement; global economic factors, including currency exchange rates; general economic conditions, including interest rates, the rate of inflation, and commercial and consumer confidence; energy prices; governmental laws and regulations affecting operations, including tax obligations; changes in accounting standards; worldwide political stability; the effects of terrorist activities and resulting political or economic instability; natural catastrophes; U.S. military action overseas; and the effect of acquisitions, divestitures, restructurings, product withdrawals, and other unusual events.
The Company cautions the reader that these lists of cautionary statements and risk factors may not be exhaustive. The Company expressly disclaims any obligation or undertaking to release publicly any updates or changes to these forward-looking statements that may be made to reflect any future events or circumstances.
About the Company
Sauer-Danfoss Inc. and subsidiaries (the Company) is a worldwide leader in the design, manufacture, and sale of engineered hydraulic and electronic systems and components that generate, transmit and control power in mobile equipment. The Company’s products are used by original equipment manufacturers (OEMs) of mobile equipment, including construction, road building, agricultural, turf care, material handling, and specialty equipment. The Company designs, manufactures, and markets its products
18
in the Americas, Europe, and the Asia-Pacific region, and markets its products throughout the rest of the world either directly or through distributors.
Executive Summary of 2006 Compared to 2005
The nature of the Company’s operations as a global producer and supplier in the fluid power industry means the Company is impacted by changes in local economies, including currency exchange rate fluctuations. In order to gain a better understanding of the Company’s base results, a financial statement user needs to understand the impact of those currency exchange rate fluctuations. The following table summarizes the change in the Company’s results from operations by separately identifying changes due to currency fluctuations and the underlying change in operations from 2005 to 2006. This analysis is more consistent with how the Company’s management internally evaluates results.
(in millions) | | | | 2005 | | Currency
Fluctuations | | Underlying
increase
(decrease) | | 2006 | |
Net Sales | | $ | 1,547.8 | | | $ | 7.9 | | | | $ | 183.4 | | | $ | 1,739.1 | |
Gross Profit | | 357.7 | | | 1.9 | | | | 37.2 | | | 396.8 | |
% of Net Sales | | 23.1 | % | | | | | | | | | 22.8 | % |
Selling, general and administrative | | 217.1 | | | 1.2 | | | | (2.7 | ) | | 215.6 | |
Research and development | | 58.7 | | | 0.3 | | | | 2.9 | | | 61.9 | |
Impairment charges and loss on
disposal of fixed assets | | 1.4 | | | — | | | | 1.8 | | | 3.2 | |
Total operating costs | | 277.2 | | | 1.5 | | | | 2.0 | | | 280.7 | |
Operating income | | 80.5 | | | 0.4 | | | | 35.2 | | | 116.1 | |
% of Net Sales | | 5.2 | % | | | | | | | | | 6.7 | % |
Net interest expense | | (15.7 | ) | | (0.1 | ) | | | (2.0 | ) | | (17.8 | ) |
Other expense, net | | 3.5 | | | (0.2 | ) | | | (9.0 | ) | | (5.7 | ) |
Income before taxes and minority interest | | 68.3 | | | 0.1 | | | | 24.2 | | | 92.6 | |
Minority interest | | (18.6 | ) | | $ | — | | | | $ | (3.0 | ) | | (21.6 | ) |
Earnings before taxes | | 49.7 | | | 0.1 | | | | 21.2 | | | 71.0 | |
% of Net Sales | | 3.2 | % | | | | | | | | | 4.1 | % |
Income tax benefit (expense) | | (11.0 | ) | | 0.2 | | | | (6.5 | ) | | (17.3 | ) |
Net income | | $ | 38.7 | | | $ | 0.3 | | | | $ | 14.7 | | | $ | 53.7 | |
| | | | | | | | | | | | | | | | | | | | |
The underlying growth in sales, excluding the effect of currency fluctuations, was approximately 12 percent in 2006. Sales were up in all regions and all segments with increases of 11 percent in the Americas, 13 percent in Europe and 12 percent in Asia-Pacific, excluding the impact of currency. The increase in sales was due to overall strong economic conditions, price increases and higher sales volumes. Gross profit margin on total net sales decreased due to several factors, including restructuring costs incurred, costs incurred for the transfer of production lines, labor costs for overtime worked to meet the high demand for product, and costs to expedite product to meet customer demand.
Selling, general and administrative costs decreased 1 percent during 2006 when compared to the same period in 2005. Costs associated with the implementation of a common company wide business system were $13.7 million in 2006, a decrease of $3.4 million compared to 2005. Costs incurred in 2006 were related to implementation of the system at seven U.S. locations, one Danish location, two Slovakian locations as well as implementations in process in China, Italy and several Scandinavian sales companies. Outside service costs related to the assessment of internal controls under Section 404 of the Sarbanes-
19
Oxley Act of 2002 also decreased $3.4 million. These reductions were partially offset by general price increases.
During the first quarter of 2006 the Company announced plans to close the LaSalle, Illinois plant, to discontinue the production of certain product lines currently manufactured in the Swindon, England plant, and to restructure certain activities in the Propel and Controls segments. The Company incurred a total of $13.5 million in restructuring charges in connection with these plans during 2006, $10.9 million was included in cost of sales and $0.5 million in selling, general and administrative expenses and $2.1 million was loss on disposal of fixed assets. Costs incurred include employee termination costs of $3.8 million, impairment and loss on disposal of fixed assets of $2.1 million, accelerated depreciation of $2.1 million, pension curtailment costs of $1.6 million, facilities moving costs of $1.4 million, and other costs of $2.5 million. The restructuring costs as a percent of sales were 0.8 percent in 2006.
In 2006 the Company recognized $5.7 million of other expense, primarily related to foreign currency losses. During 2005 the Company recognized $3.5 million of other income, primarily related to foreign currency gains. The combined negative currency impact of $9.0 million in 2006 is due to the weakening of the U.S. dollar throughout 2006.
Operating Results — 2006 Compared to 2005
Sales Growth by Market
The following table summarizes the Company’s sales growth by market. The table and following discussion is on a comparable basis, which excludes the effects of currency fluctuations.
| | Americas | | Asia-Pacific | | Europe | | Total | |
Agriculture/Turf Care | | | 5 | % | | | (26 | )% | | | 8 | % | | | 5 | % | |
Construction/Road Building | | | 6 | | | | 17 | | | | 20 | | | | 14 | | |
Material Handling/Specialty | | | 22 | | | | 32 | | | | 14 | | | | 17 | | |
Distribution | | | 18 | | | | 21 | | | | 8 | | | | 15 | | |
Agriculture/Turf Care
The turf care market in the U.S. was moderately strong through the first half of the year but declined during the last half of the year. The strengthening agriculture market in Brazil and the increasing commodity prices in the U.S. contributed to the increased sales in the agricultural market in the Americas. Sales in the European market increased slightly compared to 2005 due primarily to strengthening economic conditions, particularly in Germany. The Asia-Pacific region contributes less than 5 percent of the sales in the agriculture and turf care markets and therefore the decrease in the Asia-Pacific region does not significantly impact the total market.
Construction/Road Building
All regions experienced sales increases in the construction and road building markets during 2006. Europe experienced the strongest growth at 20 percent. Increases in Europe are attributable to strengthening of the overall economy and strong export markets. The 6 percent increase in sales in the Americas region is primarily driven by strengthening economic conditions in Brazil as well as increased production of skid steer loaders and crawlers, particularly during the first half of the year. The Asia-Pacific market also benefited from the growth in the skid steer loader market, in addition to increased demand from the Chinese transit mixer market. The road building market in the Asia-Pacific region showed strong increases, mainly due to China’s increased focus on infrastructure spending.
20
Material Handling/Specialty
Specialty vehicles are comprised of a variety of markets including forestry, material handling, marine, waste management and waste recycling. All regions contributed to the sales growth in the specialty markets. Growth in the aerial lift market continues to be the main contributor to the overall 17 percent increase in sales in 2006.
Distribution
Products related to all of the above markets are sold to distributors, who then serve smaller OEMs.
Order Backlog
The following table shows the Company’s order backlog and orders written activity for 2005 and 2006, separately identifying the impact of currency fluctuations.
(in millions) | | | | 2005 | | Currency
Fluctuation | | Underlying
increase
(decrease) | | 2006 | |
Total | | | | | | | | | | | | | |
Backlog at December 31 | | $ | 504.2 | | | $ | 32.8 | | | | $ | 95.4 | | | $ | 632.4 | |
Orders written | | 1,631.7 | | | 8.8 | | | | 244.4 | | | 1,884.9 | |
| | | | | | | | | | | | | | | | | | | |
Total order backlog at the end of 2006 was $632.4 million, compared to $504.2 million at the end of 2005. On a comparable basis, excluding the impact of currency fluctuation, order backlog increased 19 percent over 2005. New sales orders written for 2006 were $1,884.9 million, an increase of 15 percent over 2005, excluding the impact of currency fluctuations.
In recent years backlog information has become less reliable as an indicator of future sales levels as customers alter their sales order patterns. The 15 percent increase in orders written in 2006 is reflective of the strong sales experienced during the year and backlog remains strong at the end of the year with over $630 million of customer orders received for future delivery.
Business Segment Results
The following discussion of operating results by reportable segment relates to information as presented in Note 17 in the Notes to Consolidated Financial Statements. Segment income is defined as the respective segment’s portion of the total Company’s net income, excluding net interest expense, income taxes, minority interest, and global service expenses. Propel products include hydrostatic transmissions and related products that transmit the power from the engine to the wheel to propel a vehicle. Work Function products include steering motors as well as gear pumps and motors that transmit power for the work functions of the vehicle. Controls products include electrohydraulic controls, microprocessors, electric drives and valves that control and direct the power of a vehicle.
21
The following table provides a summary of each segment’s net sales and segment income, separately identifying the impact of currency fluctuations during the year.
(in millions) | | | | 2005 | | Currency
fluctuation | | Underlying
increase
(decrease) | | 2006 | |
Net sales | | | | | | | | | | | | | |
Propel | | $ | 751.1 | | | $ | 1.0 | | | | $ | 87.2 | | | $ | 839.3 | |
Work Function | | 430.7 | | | 3.3 | | | | 37.4 | | | 471.4 | |
Controls | | 366.0 | | | 3.6 | | | | 58.8 | | | 428.4 | |
Segment income (loss) | | | | | | | | | | | | | |
Propel | | $ | 106.4 | | | $ | 0.0 | | | | $ | 5.4 | | | $ | 111.8 | |
Work Function | | 6.3 | | | 0.3 | | | | 9.9 | | | 16.5 | |
Controls | | 31.4 | | | 0.1 | | | | 11.2 | | | 42.7 | |
Global Services and other expenses, net | | (60.1 | ) | | (0.2 | ) | | | (0.3 | ) | | (60.6 | ) |
Propel Segment
The Propel segment experienced strong growth in 2006, with a sales increase of 12 percent excluding the effects of currency fluctuations. Gross profit margin decreased 1.2 percent excluding the effects of currency fluctuations during 2006. The decrease in gross profit margin is primarily due to $8.3 million of restructuring charges. In March 2006 the Company announced plans to close the manufacturing facility in LaSalle, Illinois during 2006 along with certain other restructuring activities. Restructuring costs incurred in 2006 consist of employee termination costs of $1.6 million, pension curtailment charges of $1.6 million, accelerated depreciation of fixed assets of $2.1 million, and $3.0 million of other charges.
Work Function Segment
Sales in the Work Function segment increased 9 percent, excluding the effects of currency fluctuations during 2006. The gross profit margin increased 0.7 percent excluding the impacts of currency fluctuations during 2006. Segment income was negatively impacted by $3.5 million of restructuring costs. In March 2006 the Company announced plans to discontinue production of certain product lines manufactured in the Swindon, England plant resulting in recognizing $1.9 million of employee termination costs and $1.6 million of fixed asset impairment charges.
Controls Segment
Net sales in the Controls segment, excluding the effects of currency fluctuations, increased 16 percent during 2006. The gross profit margin decreased 0.5 percent, excluding the impact of currency fluctuations, with increases through September 2006 offset by declines in the fourth quarter due to costs incurred for the introduction of new products. Despite increased sales, operating costs were $0.2 million lower primarily due to higher costs in 2005 for research and development spending for new products in the development stage as well as start-up costs related to a new production facility in India. The increase in sales, nearly flat margins and decreases in operating costs contributed to a 36 percent increase in segment income.
Global Services and other expenses, net
Segment costs in Global Services and other expenses, net relate to internal global service departments, along with the operating costs of the Company’s executive offices. Global services include costs such as consulting for special projects, tax, and accounting fees paid to outside third parties, certain insurance premiums, and the amortization of intangible assets from certain business combinations. Global Services
22
costs decreased $0.3 million in 2006 compared to the same period in 2005, excluding the effects of currency fluctuations. The Company incurred $5.8 million of losses on foreign currency transactions in 2006 compared to $3.2 million of gains on foreign currency transactions in 2005, which negatively affected other expenses by $9.0 million when comparing to the 2005 results. These increases were offset by a $3.4 million decrease in costs associated with the implementation of a common company wide business system, decreased long-term incentive plan costs of $2.7 million, and a decrease of $3.4 million in outside service costs related to the assessment of internal controls under Section 404 of the Sarbanes-Oxley Act of 2002.
Income Taxes
The Company’s effective tax rate was 24.3 percent in 2006 compared to 22.1 percent in 2005.
The 2006 rate includes benefit of $5.7 million for reversal of valuation allowances on deferred tax assets. The 2005 rate also included benefit of $4.4 million for reversal of valuation allowances on deferred tax assets. These deferred tax assets were generated in prior years and no tax benefits were recognized at that time. In addition, the 2005 rate included the benefit of the reduction of the statutory tax rate in Denmark from 30 percent to 28 percent, enacted in 2005, that resulted in a tax benefit of $1.5 million.
Executive Summary of 2005 Compared to 2004
The following table summarizes the change in the Company’s results from operations by separately identifying changes due to currency fluctuations and the underlying change in operations from 2004 to 2005. This analysis is more consistent with how the Company’s management internally evaluates results.
(in millions) | | | | 2004 | | Currency
fluctuations | | Underlying
increase
(decrease) | | 2005 | |
Net sales | | $ | 1,404.2 | | | $ | 3.6 | | | | $ | 140.0 | | | $ | 1,547.8 | |
Gross profit | | 346.1 | | | 2.1 | | | | 9.5 | | | 357.7 | |
% of Net Sales | | 24.6 | % | | | | | | | | | 23.1 | % |
Selling, general and administrative | | 200.2 | | | 0.1 | | | | 16.8 | | | 217.1 | |
Research and development | | 51.9 | | | 0.1 | | | | 6.7 | | | 58.7 | |
Loss on disposal of fixed assets | | 2.1 | | | 0.0 | | | | (0.7 | ) | | 1.4 | |
Total operating costs | | 254.2 | | | 0.2 | | | | 22.8 | | | 277.2 | |
Operating income | | 91.9 | | | 1.9 | | | | (13.3 | ) | | 80.5 | |
% of Net Sales | | 6.5 | % | | | | | | | | | 5.2 | % |
Net interest expense | | (17.4 | ) | | 0.0 | | | | 1.7 | | | (15.7 | ) |
Other expense, net | | (4.1 | ) | | 0.0 | | | | 7.6 | | | 3.5 | |
Income before taxes and minority interest | | 70.4 | | | 1.9 | | | | (4.0 | ) | | 68.3 | |
Minority interest | | (21.5 | ) | | 0.0 | | | | 2.9 | | | (18.6 | ) |
Earnings before taxes | | 48.9 | | | 1.9 | | �� | | (1.1 | ) | | 49.7 | |
% of Net Sales | | 3.5 | % | | | | | | | | | 3.2 | % |
Income tax benefit (expense) | | (15.7 | ) | | 1.0 | | | | 3.7 | | | (11.0 | ) |
Net income | | $ | 33.2 | | | $ | 2.9 | | | | $ | 2.6 | | | $ | 38.7 | |
The underlying growth in sales, excluding the effect of currency fluctuations, was approximately 10 percent in 2005. The improving economy in the U.S., not only resulted in increased sales within the Americas, but also increased export business from the Company’s European and Asia-Pacific customers. Margin on total net sales decreased due to several factors, including labor costs for overtime worked to meet the high demand for product, costs to expedite product to meet customer demand, and costs for subcontract suppliers used to reduce the cost of production bottlenecks, primarily in the Work Function segment.
23
The increase in selling, general, and administrative costs in 2005 was due to the continuing development and implementation of a common business system to standardize business processes and provide a single interface to direct OEM customers and suppliers. The new business system has been in development since 2003 and the costs incurred in 2004, with the exception of $3.5 million, related to development and therefore were capitalized. The common business system was implemented at five locations during 2005 and costs related to the system and its implementation are now expensed. Costs in 2005 related to the common business system totaled $23.0 million, of which $5.8 million are of an ongoing nature that will replace costs related to the current systems in place. In future years it is anticipated that the investment in the common business system will drive improved operational efficiency, customer service, and thereby improve financial performance. The system will continue to be implemented at additional locations until complete in 2008. The Company incurred $4.4 million of expense in 2004 to restructure its sales and distribution operations in Europe resulting in consolidated inventory, warehouse, and distribution operations as well as streamlined delivery directly from the manufacturing locations to the customer. There were no additional costs related to this restructuring in 2005.
Research and development costs increased approximately 13 percent in 2005, due to ongoing research projects, primarily related to the Propel and Controls segments.
In 2005 the Company recognized other income of $3.2 million related to foreign currency gains on transactions. The Company recognized $4.1 million of expense in 2004 due to foreign currency losses on transactions. This fluctuation between years was primarily due to the significant weakening of the U.S. dollar in late 2004 and the strengthening of the U.S. dollar throughout 2005.
Operating Results — 2005 Compared to 2004
Sales Growth by Market
The following table summarizes the Company’s sales growth by market. The table and following discussion is on a comparable basis, which excludes the effects of currency fluctuations.
| | Americas | | Asia-Pacific | | Europe | | Total | |
Agriculture/Turf Care | | | 1 | % | | | 28 | % | | | 4 | % | | | 3 | % | |
Construction/Road Building | | | 20 | | | | 29 | | | | 10 | | | | 17 | | |
Material Handling/Specialty | | | 30 | | | | 5 | | | | 11 | | | | 14 | | |
Distribution | | | 14 | | | | 2 | | | | 7 | | | | 10 | | |
Agriculture/Turf Care
The Asia-Pacific region showed the greatest percentage of growth, however this is a relatively small market as it represents less than five percent of the Company’s sales in the agriculture and turf care markets. The agriculture market in the Americas was down overall; however, increased sales in the North American sprayer market offset reduced tractor production. The consumer turf care market in the Americas was level with 2004, while demand in the commercial market was lower than in 2004. The agriculture market in Europe was also down compared to 2004 resulting in reduced tractor sales.
Construction/Road Building
The construction and road building markets were improved in the Americas in 2005. The 20 percent growth in the Americas is primarily due to a strong market for skid steer loaders; however, sales also increased due to new sales of medium power hydrostatic products to a major OEM in 2005. The 29 percent growth in Asia-Pacific is also due to strong markets for skid steer loaders and road roller products in North America as the OEMs are exporting product to the Americas. The transit mixer market drove the growth in the European market in 2005, in addition to OEMs exporting product to the Americas for the road building market.
24
Material Handling/Specialty
A strong aerial lift market is contributing to the 30 percent growth in the Americas. In Europe several of the material handling markets experienced growth in 2005 including forklift, aerial lifts, and container handling equipment. The forestry and marine markets have also contributed to the 11 percent growth in the European specialty markets. The sales growth in the Asia-Pacific region is due to increased sales into the mining market, although Asia-Pacific sales are a small percentage of the Company’s total sales in the specialty markets.
Distribution
Products related to all of the above markets are sold to distributors, who then serve smaller OEMs.
Order Backlog
The following table shows the Company’s order backlog and orders written activity for 2004 and 2005, separately identifying the impact of currency fluctuations. Order backlog represents the amount of customer orders received for future shipment.
(in millions) | | | | 2004 | | Currency
Fluctuation | | Underlying
increase
(decrease) | | 2005 | |
Total | | | | | | | | | | | | | |
Backlog at December 31 | | $ | 467.4 | | | $ | (22.0 | ) | | | $ | 58.8 | | | $ | 504.2 | |
Orders written | | 1,429.4 | | | 3.6 | | | | 198.7 | | | 1,631.7 | |
| | | | | | | | | | | | | | | | | | | |
Total order backlog at the end of 2005 was $504.2 million, compared to $467.4 million at the end of 2004. On a comparable basis, excluding the impact of currency fluctuation, order backlog increased 13 percent over 2004. New sales orders written for 2005 were $1,631.7 million, an increase of 14 percent over 2004, excluding the impact of currency fluctuations.
In recent years backlog information has become less reliable as an indicator of future sales levels as customers alter their sales order patterns. The 14 percent increase in orders written in 2005 is reflective of the strong sales experienced during the year and backlog remains strong at the end of the year with over $500 million of customers orders received for future delivery.
Business Segment Results
The following table provides a summary of each segment’s net sales and segment income, separately identifying the impact of currency fluctuations during the year.
(in millions) | | | | 2004 | | Currency
fluctuation | | Underlying
increase
(decrease) | | 2005 | |
Net sales | | | | | | | | | | | | | |
Propel | | $ | 656.5 | | | $ | 0.7 | | | | $ | 93.9 | | | $ | 751.1 | |
Work Function | | 412.1 | | | 1.2 | | | | 17.4 | | | 430.7 | |
Controls | | 335.6 | | | 1.7 | | | | 28.7 | | | 366.0 | |
Segment income (loss) | | | | | | | | | | | | | |
Propel | | $ | 90.0 | | | $ | 0.6 | | | | $ | 15.8 | | | $ | 106.4 | |
Work Function | | 20.8 | | | 0.7 | | | | (15.2 | ) | | 6.3 | |
Controls | | 24.7 | | | 0.3 | | | | 6.4 | | | 31.4 | |
Global Services and other expenses, net | | (47.7 | ) | | 0.3 | | | | (12.7 | ) | | (60.1 | ) |
25
Propel Segment
The Propel segment experienced the strongest growth in 2005, with a sales increase of 14 percent excluding the effects of currency fluctuations. Consumers continue to move away from mechanical transmissions to hydrostatic transmissions in the turf care market, which has contributed to increased sales in the Propel segment, although, as noted in the market section, the growth in the turf care market is beginning to level off. The gross profit percentage of sales in the Propel segment was consistent in 2005 with the 25 percent achieved in 2004. Segment income increased 18 percent from 2004, excluding the effects of currency fluctuations.
Work Function Segment
Sales in the Work Function segment increased by 4 percent, excluding the effect of currency fluctuations, in 2005 compared to 2004. Similar to 2004, demand for Work Function product has been high and has resulted in increased overtime costs and increased delivery costs to expedite shipments to meet customer demand which has had a negative impact on the gross margin. In late 2005 the Company established production capacity in the U.S. for Work Function products that are sold in the U.S. market. This additional production capability is expected to reduce capacity constraints and freight costs in 2006. During 2005 the Work Function segment recognized $1.0 million of field recall costs related to two separate quality issues. In 2004 the income of the Work Function segment was negatively affected by $2.2 million of restructuring costs, including the remaining costs to relocate the operations of the Company’s West Branch, Iowa facility that was started in 2003.
Controls Segment
Net sales increased 8 percent, excluding the effects of currency fluctuations, in 2005 compared to 2004. Gross profit as a percent of sales was consistent with 2004 at 28 percent. Segment income in 2005 increased 26 percent compared to 2004 excluding the impact of currency fluctuations.
Global Services and other expenses, net
Expenses in global services increased in 2005 due to $19.5 million of increased expenses related to the common business system. This increased expense was partially off-set by a $7.3 million fluctuation in foreign currency gain/loss and a $1.5 million reduction in outside service costs to assess internal controls and related audit costs to test management’s assessment of internal control under Section 404 of the Sarbanes-Oxley Act of 2002. Total costs in 2005 related to the internal control assessment were $5.2 million in 2005, compared to $6.7 million in 2004. As noted in the executive summary, the Company recognized other income of $3.2 million related to foreign currency gains on transactions in 2005 compared to $4.1 million of losses on foreign currency exchange in 2004, which is included in global services and other expenses.
Income Taxes
The Company’s effective tax rate was 22.1 percent in 2005 compared to 32.2 percent in 2004.
The 2005 rate includes the benefit of the reduction of the statutory tax rate in Denmark from 30 percent to 28 percent that was enacted in 2005. This change in tax rate resulted in a decrease of tax expense of $0.4 million for current year income and $1.1 million for the change in deferred tax liabilities related to earlier periods for a total benefit of $1.5 million. The benefit was partially offset by $0.8 million of tax expense in the U.S. related to the repatriation of previously undistributed earnings from a subsidiary in Denmark, in connection with the American Jobs Creation Act. The 2005 rate also includes benefit of $4.4 million for reversal of valuation allowances on deferred tax assets. These deferred tax assets were generated in prior years and no tax benefits were recognized at that time.
26
Market Risk
The Company is naturally exposed to various market risks, including changes in foreign currency exchange rates and interest rates.
Foreign Currency Changes
The Company has operations and sells its products in many different countries of the world and therefore, conducts its business in various currencies. The Company’s financial statements, which are presented in U.S. dollars, can be impacted by foreign exchange fluctuations through both translation risk and transaction risk. Translation risk is the risk that the financial statements of the Company, for a particular period or as of a certain date, may be affected by changes in the exchange rates that are used to translate the financial statements of the Company’s operations from foreign currencies into U.S. dollars. Transaction risk is the risk from the Company receiving its sale proceeds or holding its assets in a currency different from that in which it pays its expenses and holds its liabilities.
In previous years, the Company had been well balanced between its U.S. and European operations because the Company generated its sales in the same country in which it incurred its expenses, or shipped products between geographic regions on a balanced basis. However, in recent years the balance has shifted and the amount of sales made in U.S. dollars has increased, whereas the production costs are in a currency other than the U.S. dollar, increasing the Company’s exposure to transaction risk. In 2006 the Company sold a total of $159.7 million into the U.S. of product that had been produced in European based currencies compared to sales into Europe of $57.6 million of product produced in U.S. dollars. This imbalance had a significant impact on the results of the Company. In 2006 the results were unfavorable as the dollar weakened in comparison to other currencies compared to 2005. The Company produces and sells its product in several regions of the world, however the U.S. and European transactions comprise the majority of the imbalance between regions.
In 2005 the Company began to enter into forward contracts to minimize the impact of currency fluctuations on cash flows related to forecasted sales denominated in currencies other than the functional currency of the selling location. The forecasted sales represent sales to both external and internal parties. Any effects of the forward contracts related to sales to internal parties are eliminated in the consolidation process until the related inventory has been sold to an external party. The forward contracts qualify for hedge accounting and therefore are subject to effectiveness testing at the inception of the contract and throughout the life of the contract. In 2006 as a result of hedge accounting for the forward contracts, the Company recognized an increase to net sales of $0.5 million and expense of $0.3 million was recorded to offset gain on currency transactions. The fair value of forward contracts included as an asset on the balance sheet at December 31, 2006 was $1.1 million.
The Company is also impacted by translation risk in terms of comparing results from period to period. Fluctuations of currencies against the U.S. dollar can be substantial and therefore, significantly impact comparisons with prior periods. The translation impact on making prior period comparisons with respect to the Company’s net sales can be material, although the impact has not been significant in either 2006 or 2005. Translation affects the comparability of both the income statement and the balance sheet.
The change in the exchange rate does affect the comparability of the balance sheet between 2006 and 2005 as the balance sheet accounts are translated at the exchange rate as of December 31. The U.S. dollar weakened by 11 percent against the euro and the Danish kroner from December 31, 2005 to December 31, 2006. The weakening of the dollar has resulted in approximately 40 percent of the Company’s total balance sheet being stated 11 percent higher than the prior year since roughly 40 percent of the Company’s total assets and liabilities are denominated in the euro or the Danish kroner.
27
Interest Rate Changes
The Company uses interest rate swap agreements on a limited basis to manage the interest rate risk on the total debt portfolio. The Company was a party to three interest rate swap agreements at December 31, 2006, with a combined notional amount of 4.7 million euro, that require the Company to pay interest at a fixed rate and receive interest at a variable rate. The fair value of the interest rate swap agreements is recorded as a liability of $0.1 million on the balance sheet at December 31, 2006, with the offset recorded in accumulated other comprehensive income as the derivatives are accounted for using hedge accounting. The interest rate swap agreements mature at various dates through March 2009.
The following table summarizes the maturity of the Company’s debt obligations for fixed and variable rate debt (amounts in millions):
| | Fixed Rate
Debt (1) | | Variable Rate
Debt | |
2007 | | | $ | 7.5 | | | | $ | 112.7 | | |
2008 | | | 14.6 | | | | — | | |
2009 | | | 13.3 | | | | — | | |
2010 | | | 15.2 | | | | 5.2 | | |
2011 | | | 18.1 | | | | 10.4 | | |
2012 and Thereafter | | | 69.1 | | | | 36.5 | | |
Total | | | $ | 137.8 | | | | $ | 164.8 | | |
(1) Includes total principal repayments of $6.2 million on variable rate debt. The rate has been fixed through the use of interest rate swaps.
Liquidity and Capital Resources
The Company’s principal sources of liquidity have been cash flow from operations and from its various credit facilities. The Company historically has accessed diverse funding sources, including short and long-term unsecured bank lines of credit in the United States, Europe, and Asia, as well as the private debt markets in the United States as discussed in Note 7 in the Notes to Consolidated Financial Statements. The Company expects to have sufficient sources of liquidity to meet its future funding needs due to the multiple funding sources that have been, and continue to be, available to the Company.
The multicurrency revolving credit facility, as modified in July 2006, provides up to $300 million of unsecured credit through December 2010, as well as 40 million euro term loan which expires in July 2013. At December 31, 2006 the Company had $106.4 million outstanding under the revolving credit facility. The Company is required to meet certain financial covenants under this facility as described in Note 7 in the Notes to Consolidated Financial Statements. The Company was in compliance with the covenants at December 31, 2006 and is not aware of any circumstances currently that would impact compliance during the next twelve months.
Cash Flows from Operations
Cash provided by operations was $167.9 million in 2006. The Company invested an additional $14.3 million, excluding the effect of currency, in inventories in 2006 in order to meet the anticipated increase in demand for product in early 2007. In addition, a large increase in receivables of $24.5 million contributed to a use of cash due to the higher level of sales in the fourth quarter. These increases were offset by an increase in accounts payable of $27.2 million, primarily due to the increase in inventory.
28
Total cash of the Company increased $14.9 million from December 31, 2005 to December 31, 2006. At December 31, 2006 cash balances in China totaled $23.0 million, an increase of $12.5 million from December 31, 2005. The Company is paying dividends from its Chinese entities to the maximum extent possible under current regulations, however, due to the nature of the governmental and other regulatory controls, it is difficult to move cash out of China for reasons other than payment for goods shipped into that country. As the Company continues to consider expanding its manufacturing capabilities in low cost regions, it will make every effort to utilize the cash balances in those regions to fund future expansions. Total cash outside of China increased by $2.4 million in 2006.
Cash Used in Investing Activities
Capital expenditures for 2006 totaled $116.2 million. Capital expenditures were high in all business segments and were primarily related to the addition of production capacity in order to meet anticipated future demand levels.
Cash Used in Financing Activities
The Company continues to pay dividends to stockholders on a quarterly basis with $26.7 million of cash used to pay dividends in 2006. In addition, the Company periodically makes distributions to its minority interest partners from its various joint venture activities with distributions totaling $19.9 million in 2006. The distributions can vary from year to year depending on the amount of undistributed earnings of the businesses and the needs of the partners. The Company borrowed an additional $1.8 million, net, in 2006, and paid $0.3 million of fees related to the modification of its multicurrency revolving credit facility discussed above in Liquidity and Capital Resources.
Contractual Cash Obligations
The majority of the Company’s contractual obligations to make cash payments to third parties are for financing obligations. These include future lease payments under both operating and capital leases. The following table discloses the Company’s future commitments under contractual obligations as of December 31, 2006:
| | | | | | | | | | | | | | 2012 and | |
Contractual Cash Obligations (3) | | | | Total | | 2007 | | 2008 | | 2009 | | 2010 | | 2011 | | Thereafter | |
Long-term debt | | $ | 302,631 | | $ | 120,243 | | $ | 14,554 | | $ | 13,292 | | $ | 20,360 | | $ | 28,513 | | $ | 105,669 | |
Interest on long-term debt (1),(2) | | 63,192 | | 14,609 | | 13,642 | | 12,397 | | 11,105 | | 3,922 | | 7,517 | |
Capital leases | | 19,076 | | 1,131 | | 1,139 | | 1,129 | | 999 | | 876 | | 13,802 | |
Operating leases | | 54,389 | | 10,956 | | 8,819 | | 6,730 | | 3,517 | | 1,496 | | 22,871 | |
Rental and service agreemnts with related party Danfoss A/S | | 54,959 | | 7,583 | | 7,582 | | 7,580 | | 7,588 | | 7,597 | | 17,029 | |
Total contractual cash obligations | | $ | 494,247 | | $ | 154,522 | | $ | 45,736 | | $ | 41,128 | | $ | 43,569 | | $ | 42,404 | | $ | 166,888 | |
| | | | | | | | | | | | | | | | | | | | | | | | |
The following assumptions are used in the calculation of the contractual cash obligations:
(1) The annual amount borrowed under revolving credit agreements does not change from the $106.4 million borrowed at December 31, 2006, through the maturity date of the agreements.
(2) The margin rate on variable interest rate debt does not change from December 31, 2006. The base interest rate for future years is based on the interest yield curves as of December 31, 2006.
(3) Commitments denominated in a currency other than the U.S. dollar are translated at the December 31, 2006 exchange rate.
29
In addition to the above contractual obligations, the Company has certain other funding needs that are non-contractual by nature, including funding of certain pension plans. In 2007 the Company anticipates contributing $6.1 million to its U.S. and U.K. pension and health benefit plans. Although the Company has not funded the German pension plan in the past, it is discussing funding options and may partially fund the pension liabilities in 2007.
Other Matters
Critical Accounting Estimates
The SEC’s guidance surrounding the disclosure of critical accounting estimates requires disclosures about estimates a company makes in applying its accounting policies. However, such discussion is limited to “critical accounting estimates,” or those that management believes meet two criteria: 1) the accounting estimate must require a company to make assumptions about matters that are highly uncertain at the time the accounting estimate is made, and 2) different estimates that the company reasonably could have used for the accounting estimate in the current period, or changes in the accounting estimate that are reasonably likely to occur from period to period could have a material impact on the presentation of the company’s financial condition, changes in financial condition or results of operations.
Besides the estimates that meet the two criteria for a “critical estimate” above, the Company makes many other accounting estimates in preparing its financial statements and related disclosures. All estimates, whether or not deemed critical, can affect the reported amounts of assets, liabilities, revenues, and expenses as well as disclosures of contingent assets and liabilities. Estimates are based on experience and information available prior to the issuance of the financial statements. Materially different results can occur as circumstances change and additional information becomes known, including estimates not deemed “critical” under the SEC’s guidance.
The discussion below should be read in conjunction with disclosures elsewhere in this discussion and in the Notes to the Consolidated Financial Statements related to estimates, uncertainties, contingencies, and new accounting standards. Significant accounting policies are discussed in Note 1 to the Consolidated Financial Statements beginning on page F-5. The development and selection of accounting estimates, including those deemed “critical,” and the associated disclosures in this discussion, have been discussed by management with the audit committee of the Board of Directors.
Inventory Valuation — As a manufacturer in the capital goods industry, inventory is a substantial portion of the assets of the Company, amounting to over 20 percent of total assets at December 31, 2006. The Company must periodically evaluate the carrying value of its inventory to assess the proper valuation. This includes recording period adjustments as needed to 1) record expenses due to excess capacity, 2) provide for excess and obsolete inventory, and 3) ensure that inventory is valued at the lower of cost or market. On a quarterly basis, management within each segment performs an analysis of the underlying inventory to identify the need for appropriate write-downs to cover each of these items. In doing so, management applies consistent practices based upon historical data such as actual loss experience, past and projected usage, actual margins generated from trade sales of its products, and finally its best judgment to estimate the appropriate carrying value of the inventory.
Warranty Provisions — The Company warrants its various products over differing periods depending upon the type of product and application. Consequently, the Company records liabilities for the estimated warranty costs that may be incurred under its basic warranty based on past trends of actual warranty claims compared to the actual sales levels to which those claims apply. These liabilities are accrued at the time the sales of the products are recorded. Factors that affect the Company’s warranty liability include the number of units in the field currently under warranty, historical and anticipated rates of warranty claims on those units and the cost per claim to satisfy the Company’s warranty obligation. The anticipated rate of warranty
30
claims is the primary factor impacting the Company’s estimated warranty obligation. Each quarter, the Company reevaluates its estimates to assess the adequacy of its recorded warranty liabilities and adjusts the amounts as necessary.
In addition to its normal warranty liability, the Company, from time to time in the normal course of business, incurs costs to repair or replace defective products with a specific customer or group of customers. The Company refers to these as “field recalls” and in these instances, the Company will record a specific provision for the expected costs it will incur to repair or replace these products utilizing information from customers and internal information regarding the specific cost of materials and labor. Typically, field recalls are infrequent in occurrence, however, when they occur, field recalls can be for a large number of units and quite costly to rectify. Because of the sporadic and infrequent nature of field recalls, and due to the extreme range of costs associated with field recalls, the Company cannot accurately estimate these costs at the time the products are sold. Therefore, these costs are recorded at the time information becomes known to the Company. As the field recalls are settled, the Company relieves the specific liability related to that field recall. These specific field recall liabilities are reviewed on a quarterly basis.
Long-Lived Asset Recovery — A significant portion of the Company’s total assets consist of property, plant and equipment (PP&E) and definite life intangibles, as well as goodwill. Changes in technology or in the Company’s intended use of these assets, as well as changes in the broad global economy in which the Company operates, may cause the estimated period of use or the carrying value of these assets to change.
This requires the Company to periodically assess the estimated useful lives of its assets in order to match, through depreciation and amortization, the cost of those assets with the benefits derived over the period of usefulness. The useful lives of these assets can be shortened through greater use due to volume increases, rapidly changing technology such as the use of electronics and computer-operated controls, and through inadequate maintenance. Despite management’s best efforts to determine the appropriate useful lives of its equipment, certain situations may arise that lead to an asset or group of assets becoming impaired, meaning their economic value becomes less than the value at which the Company is carrying the asset on its books. Examples of these situations are product rationalization efforts or restructuring of manufacturing facilities. When these situations arise, the Company tests the assets for impairment and will write down the asset in the period when the impairment becomes known. In addition, goodwill is tested for impairment at least annually. As of December 31, 2006 a ten percent change in the depreciable lives of the Company’s assets would impact depreciation expense by approximately $9.6 million.
Valuation of Trade Receivables — The Company records trade receivables due from its customers at the time a sale is recorded in accordance with its revenue recognition policy. The future collectibility of these amounts can be impacted by the Company’s collection efforts, the financial stability of its customers, and the general economic climate in which it operates. The Company applies a consistent practice of establishing an allowance for accounts that it believes may become uncollectible through reviewing the historical aging of its receivables, looking at the historical losses incurred as a percentage of net sales, and by monitoring the financial strength of its customers. In addition, local customary practices have to be taken into account due to varying payment terms being applied in various parts of the world where the Company conducts its business. If the Company becomes aware of a customer’s inability to meet its financial obligations (e.g., where it has filed for bankruptcy), the Company establishes a specific allowance for the potential bad debt to reduce the net recognized receivable to the amount it reasonably believes will be collected. The valuation of trade receivables is performed quarterly.
Workers Compensation — The Company has an insurance policy to cover workers compensation claims in the United States, in which the Company pays the first $0.25 million per claim, per incident. The Company establishes its workers compensation reserve based on historic growth factors of claims and an estimate of incurred, but not reported claims. This analysis is performed on a quarterly basis.
31
U.S. Health Care Costs — The Company self insures its U.S. health care costs for eligible employees and their qualified dependents with exposure for any one year, excluding prescription costs, limited to $0.2 million per individual. The Company establishes reserves for its health care cost based on historic claims data and an estimate of incurred, but not reported claims. This analysis is performed on a quarterly basis.
Pensions — The Company has noncontributory defined benefit pension plans for a portion of its employees. In certain countries, such as the United States and the United Kingdom, these plans are funded with plan assets whereas in other countries such as Germany, the plans are completely unfunded, which is customary. The measurement of the Company’s pension obligations and costs is dependent on a variety of assumptions determined by management and used by the Company’s actuaries. These assumptions include estimates of the present value of projected future pension payments to all plan participants, taking into consideration the likelihood of potential future events such as salary increases and other experience. These assumptions may have an effect on the amount and timing of future contributions. The plan trustee conducts an independent valuation of the fair value of pension plan assets.
The assumptions used in developing the required estimates include the following key factors:
Discount rates | | Inflation |
Salary growth | | Expected return on plan assets |
Retirement rates | | Mortality rates |
The Company bases the discount rate assumption on investment yields available at or near year-end on corporate long-term bonds rated AA. The inflation assumption is based on an evaluation of external market indicators. The salary growth assumptions reflect the Company’s long-term actual experience, the near-term outlook and assumed inflation. The expected return on plan assets reflects asset allocations, investment strategy, and the views of investment managers and other large pension plan sponsors. Retirement and mortality rates are based primarily on actual plan experience and standard industry actuarial tables, respectively. The effects of actual results differing from our assumptions are accumulated and amortized over future periods and, therefore, generally affect recognized expense in such future periods.
The Company’s funding policy for the U.S. plans are to contribute amounts sufficient to meet the minimum funding requirement of the Employee Retirement Income Security Act of 1974, plus any additional amounts the Company may deem to be appropriate. In 2007 the Company anticipates contributing $2.2 million to its U.S. plans and $1.3 million to its U.K. plans.
Postretirement Benefits Other Than Pensions — The Company provides postretirement health care benefits for certain employee groups in the United States. This plan is contributory and contains certain other cost-sharing features such as deductibles and coinsurance. The Company does not pre-fund this plan and has the right to modify or terminate this plan in the future.
The postretirement liability, which is determined on an actuarial basis, is recognized in the Company’s Consolidated Balance Sheets and the postretirement expense is recognized in the Consolidated Statements of Income. The Company must determine the actuarial assumption for the discount rate used to reflect the time value of money in the calculation of the accumulated postretirement benefit obligation for the end of the current year and to determine the postretirement cost for the subsequent year. For guidance in determining this rate, the Company looks at investment yield trends available near year-end on corporate bonds rated AA. In addition, the Company must determine the actuarial assumption for the health care cost trend rate used in the calculation of the accumulated postretirement benefit obligation for the end of the current year and to determine the net periodic postretirement benefit cost for the subsequent year. As
32
of December 31, 2006 a one-percentage-point change in the assumed health care cost trend rate would impact the expense recognized in 2006 by $0.2 million and would affect the post-retirement benefit obligation by $2.4 million. In 2007 the Company anticipates contributing $2.6 million to this plan.
Deferred Income Taxes — Tax regulations may require items to be included in the tax return at different times than the items are reflected in the financial statements. Some of the differences are permanent, such as expenses that are not deductible on a tax return, and some of the differences are temporary such as depreciation expense. Temporary differences create deferred tax assets and liabilities. Deferred tax assets generally are attributable to items that can be used as a tax deduction or credit in a tax return in future years but the amount has already been included as an expense in the financial statements. Deferred tax liabilities generally represent deductions that have been taken on the tax return but have not been recognized as expense in the financial statements. Valuation allowances are recorded to reduce deferred tax assets when it is more likely than not that a tax benefit will not be realized.
New Accounting Policies
In November 2004 the Financial Accounting Standards Board (FASB) issued SFAS No. 151, “Inventory Costs.” SFAS No. 151 amends Accounting Research Bulletin No. 43, Chapter 4 on inventory pricing to clarify that abnormal amounts of idle facility expense, freight, handling costs, and wasted materials should be recognized as current period charges. In addition, SFAS No. 151 requires that allocation of fixed production overhead to the costs of conversion be based on the normal capacity of the production facilities. The Company adopted SFAS No. 151 in 2006 with no material effect on the Company’s consolidated financial statements.
In September 2006 the FASB issued SFAS No. 158, “Employers’ Accounting for Defined Benefit Pension and Other Postretirement Plans an amendment of SFAS No. 87, 88, 106, and 132(R)”. This standard requires employers to recognize the underfunded or overfunded status of a defined benefit postretirement plan as an asset or liability in its balance sheet and to recognize changes in the funded status in the year in which the changes occur through accumulated other comprehensive income. Additionally, SFAS No. 158 requires employers to measure the funded status of a plan as of the date of its fiscal year-end. The Company adopted SFAS No. 158 in 2006. The effect of adoption was to decrease assets by $1.4 million, increase liabilities by $27.9 million, and decrease accumulated other comprehensive income by $29.3 million. The new measurement date requirement applies for fiscal years ending after December 15, 2008, however the Company already uses a measurement date of December 31 so this change will have no impact on the consolidated financial statements.
In September 2006 the U.S. Securities and Exchange Commission staff issued Staff Accounting Bulletin No. 108 (“SAB 108”), “Considering the Effects of Prior Year Misstatements when Quantifying Misstatements in Current Year Financial Statements.” SAB 108 requires quantification of financial statement misstatements based on the effects of the misstatements on each of the company’s financial statements and the related financial statement disclosures. The Company adopted SAB 108 in 2006 with no impact on the consolidated financial statements.
In June 2006 the FASB issued FASB Interpretation No. 48, “Accounting for Uncertainty in Income Taxes — an interpretation of FASB Statement No. 109” (FIN 48), which prescribes a recognition threshold and measurement attribute for the financial statement recognition and measurement of a tax position taken or expected to be taken in a tax return. FIN 48 also provides guidance on derecognition, classification, interest and penalties, accounting in interim periods, disclosure and transition. FIN 48 is effective for fiscal years beginning after December 15, 2006. The Company does not expect the adoption of FIN 48 to have a material impact on financial reporting and is currently evaluating the impact, if any, the adoption of FIN 48 will have on the consolidated financial statements.
33
In June 2006 the FASB ratified Emerging Issues Task Force (“EITF”) Issue No. 06 — 3, “How Taxes Collected from Customers and Remitted to Governmental Authorities Should Be Presented in the Income Statement (that is, Gross versus Net Presentation)”, which allows companies to adopt a policy of presenting taxes in the income statement on either a gross or net basis. Taxes within the scope of this EITF would include taxes that are imposed on a revenue transaction between a seller and a customer. If such taxes are significant, the accounting policy should be disclosed as well as the amount of taxes included in the financial statements if presented on a gross basis. EITF No. 06 — 3 is effective for reporting periods beginning after December 15, 2006. The Company is currently assessing the impact, if any, of EITF No. 06 — 03 on its consolidated financial statements.
In September 2006 FASB issued SFAS No. 157, “Fair Value Measurements” which clarifies the principle that fair value should be based on the assumptions that market participants would use when pricing an asset or liability. Additionally, it establishes a fair value hierarchy that prioritizes the information used to develop those assumptions. The Company has not yet determined the impact that the implementation of SFAS No. 157 will have on the consolidated financial statements. SFAS No. 157 is effective for financial statements issued for fiscal years beginning after November 15, 2007.
In February 2007 the FASB issued SFAS No. 159, “The Fair Value Option for Financial Assets and Financial Liabilities — Including an Amendment of FASB Statement No. 115.” SFAS No. 159 permits many financial instruments and certain other items to be measured at fair value at the option of the Company. SFAS No. 159 is effective for financial statements issued for first fiscal years beginning after November 15, 2007. The Company does not expect the adoption of SFAS No. 159 to have a significant impact on the consolidated financial statements.
Non-Audit Services of Independent Registered Public Accounting Firm
The Company’s Independent Registered Public Accounting Firm, KPMG LLP, performed the following non-audit services that have been approved by the Audit Committee of the Board of Directors: international tax planning and compliance services, expatriate tax services for persons not in a financial reporting oversight role, statutory audits and related matters, and tax and accounting technical support.
Outlook
Management of the Company anticipates strong sales growth in 2007. This should be led by the strong European and Asia-Pacific markets, with the North American markets still showing some growth. The implementation of the Company’s common business system will continue, with implementation at the Company’s Chinese and Italian locations occurring in the second quarter of 2007, leaving some sales companies and smaller plants to be implemented later in 2007 and in 2008.
Item 7A. Quantitative and Qualitative Disclosures about Market Risk.
Certain market risks are discussed on pages 27-28 of this report, and the other disclosure requirements are considered either not applicable or not material.
Item 8. Financial Statements and Supplementary Data.
The Consolidated Financial Statements, Report of Management, and Reports of Independent Registered Public Accounting Firm are presented on pages F-1 through F-40 of this report.
34
Item 9A. Controls and Procedures.
Conclusion Regarding the Effectiveness of Disclosure Controls and Procedures
At December 31, 2006 the Registrant carried out an evaluation under the supervision and with the participation of the Registrant’s management, including the Registrant’s Chief Executive Officer and Chief Financial Officer, of the effectiveness of the design and operation of the Registrant’s disclosure controls and procedures pursuant to Exchange Act Rule 13a-14. Based upon that evaluation, the Chief Executive Officer and Chief Financial Officer have concluded that the Registrant’s disclosure controls and procedures are effective to ensure that information required to be disclosed in the reports that the Registrant files or submits under the Exchange Act is recorded, processed, summarized, and reported as required and within the time periods specified in the SEC’s rules and forms. There have been no significant changes in the Registrant’s disclosure controls or in other factors that could significantly affect these controls subsequent to the date of this evaluation.
Management’s Report on Internal Control Over Financial Reporting
The Registrant’s management is responsible for establishing and maintaining a system of internal controls over financial reporting, as such term is defined in Exchange Act Rules 13a-15(f) and 15d-15(f). This system is augmented by written policies and procedures, careful selection and training of financial management personnel, a continuing management commitment to the integrity of the system, and examinations by an internal audit function that coordinates its activities with the Company’s Independent Registered Public Accounting Firm. There have been no significant changes in the Registrant’s internal control over financial reporting during the fourth quarter.
Under the supervision and with the participation of the Registrant’s management, including the Registrant’s Chief Executive Officer and Chief Financial Officer, the Registrant conducted an evaluation of the effectiveness of the Registrant’s internal controls over financial reporting based on the framework in Internal Control — Integrated Framework issued by the Committee of Sponsoring Organizations of the Treadway Commission (COSO). Based on the Registrant’s evaluation under the framework in Internal Control — Integrated Framework, the Registrant’s management concluded that its internal control over financial reporting was effective as of December 31, 2006.
The Registrant’s management’s assessment of the effectiveness of its internal control over financial reporting as of December 31, 2006 has been audited by KPMG LLP, an independent registered public accounting firm, as stated in their report which is presented on pages F-39 and F-40.
35
PART III
Item 10. Directors. Executive Officers and Corporate Governance
Information regarding directors of the Company is set forth under the section entitled “ELECTION OF DIRECTORS” of the Company’s Proxy Statement for the annual meeting of stockholders to be held June 14, 2007, (the “Proxy Statement”), and is incorporated herein by reference. Information regarding executive officers of the Company is set forth in Part I of this report under the caption “Executive Officers of the Company.” Information regarding the Company’s code of conduct and code of ethics is set forth under the section entitled “GOVERNANCE OF THE COMPANY — Code of Conduct and Code of Ethics” of the Proxy Statement, and is incorporated herein by reference. Information regarding the Company’s audit committee is set forth under the section entitled “GOVERNANCE OF THE COMPANY — Audit Committee” of the Proxy Statement and is incorporated herein by reference. Copies of the Worldwide Code of Legal and Ethical Business Conduct and the Code of Ethics for Chief Executive Officer, Chief Financial Officer, Principal Accounting Officer or Controller and other Senior Financial Staff are posted on the Company’s website at www.sauer-danfoss.com, and printed copies of such codes may be obtained, without charge, by written request addressed to Kenneth D. McCuskey, Corporate Secretary, 2800 E. 13th Street, Ames, Iowa 50010.
The Company’s Audit Committee Charter, Compensation Committee Charter, Executive Committee Charter, and Corporate Governance Guidelines are posted on the Company’s website set forth in the preceding paragraph. Also, printed copies of such charters and guidelines may be obtained, without charge, by sending a written request to the Corporate Secretary at the address set forth in the preceding paragraph.
Item 11. Executive Compensation
Information as to Executive Compensation is set forth under the section entitled “Executive Compensation” of the Proxy Statement, and is incorporated herein by reference. Information regarding compensation committee interlocks is set forth under the section entitled “Compensation Committee Interlocks and Insider Participation” of the Proxy Statement, and is incorporated herein by reference. The Company’s compensation committee’s report is set forth under the section entitled “Compensation Committee Report” of the Proxy Statement, and is incorporated herein by reference.
Item 12. Security Ownership of Certain Beneficial Owners and Management
Information regarding securities authorized for issuance under equity compensation plans is set forth under the section entitled “EXECUTIVE COMPENSATION — Equity Compensation” of the Proxy Statement, and is incorporated herein by reference. Information regarding security ownership is set forth under the section entitled “SECURITY OWNERSHIP OF CERTAIN BENEFICIAL OWNERS AND MANAGEMENT” of the Proxy Statement, and is incorporated herein by reference.
Item 13. Certain Relationships and Related Transactions
In connection with the acquisition of Danfoss Fluid Power in May 2000 and the acquisition of additional assets and business operations of the fluid power business of Danfoss A/S in January 2001, the Company has entered into several agreements with Danfoss A/S to purchase ongoing operational services from Danfoss A/S. Information regarding these relationships and agreements, in addition to other related party transactions, is set forth in Note 14 in the Notes to Consolidated Financial Statements on pages F-31 to F-32 of this report, and is incorporated herein by reference. Additional information regarding related party transactions is set forth under the section entitled “GOVERNANCE OF THE COMPANY — Related Party Transaction” of the Proxy Statement, and is incorporated herein by reference. Information about the independence of the Company’s directors is set forth under the section entitled
36
“‘GOVERNANCE OF THE COMPANY’ and ‘GOVERNANCE OF THE COMPANY — Basis for Board Determination of Independence of Directors’” of the Proxy Statement, and is incorporated herein by reference.
Item 14. Principal Accountant Fees and Services
Information regarding accounting services and fees is set forth under the section entitled “RATIFICATON OF APPOINTMENT OF INDEPENDENT REGISTERED PUBLIC ACCOUNTING FIRM” of the Proxy Statement, and is incorporated herein by reference.
37
PART IV
Item 15. Exhibits and Financial Statement Schedules.
(a) The following documents are filed as a part of this report.
(1) The following consolidated financial statements and related information, included in Item 8, are filed as a separate section of this report:
Consolidated Statements of Income for the years ended December 31, 2006, 2005, and 2004, on page F-1.
Consolidated Balance Sheets as of December 31, 2006 and 2005, on page F-2.
Consolidated Statements of Stockholders’ Equity and Comprehensive Income for the years ended December 31, 2006, 2005, and 2004, on page F-3.
Consolidated Statements of Cash Flows for the years ended December 31, 2006, 2005, and 2004, on page F-4.
Notes to Consolidated Financial Statements, December 31, 2006, 2005, and 2004, on pages F-5 through F-35.
Report of Management and Reports of Independent Registered Public Accounting Firm, KPMG LLP, on pages F-36 through F-40.
(2) The following schedule:
Schedule II, Valuation and Qualifying Accounts, on page F-41.
Report of Independent Registered Public Accounting Firm, KPMG LLP, on Schedule II, on page F-42.
All other schedules for which provision is made in Regulation S-X of the Securities and Exchange Commission, are not required under the related instructions or are inapplicable and, therefore, have been omitted.
(3) Exhibits
Exhibit
No. | | Description of Document |
3.1 | | The Amended and Restated Certificate of Incorporation of the Company dated May 3, 2000, is attached as Exhibit 3.1 to the Company’s Form 10-Q filed on August 16, 2000, and is incorporated herein by reference. |
3.2 | | The Amended and Restated Bylaws of the Company dated May 5, 2004, is attached as Exhibit 3.2 to the Company’s Form 10-Q filed on August 6, 2004, and is incorporated herein by reference. |
4 | | The form of Certificate of the Company’s Common Stock, $.01 Par Value, is attached as Exhibit 4 to the Company’s Form 10-Q filed on August 16, 2000 and is incorporated herein by reference. |
10.1(a) | | The Termination Agreement and Release dated May 3, 2000 relating to the termination of a Silent Partnership Agreement is attached as Exhibit 10.1(a) to the Company’s Form 10-Q filed on August 16, 2000, and is incorporated herein by reference. |
10.1(b) | | The Registration Rights Agreement is attached as Exhibit 10.1(b) to Amendment No. 1 to the Company’s Form S-1 Registration Statement filed on April 23, 1998, and is incorporated herein by reference. |
38
10.1(c) | | The form of Indemnification Agreement entered into between the Company and each of its directors and certain officers is attached as Exhibit 10.1(c) to Amendment No. 1 to the Company’s Form S-1 Registration Statement filed on April 23, 1998, and is incorporated herein by reference. |
10.1(d) | | The Lease Agreement for the Company’s Osaka, Japan facility is attached as Exhibit 10.1d to the Companies Form 10-K filed March 14, 2005, and is incorporated herein by reference. |
10.1(e) | | The Lease Agreement for the Company’s Swindon, England facility is attached as Exhibit 10.1(e) to the Company’s Form 10-K filed on March 10, 2006, and is incorporated herein by reference. |
10.1(f) | | The Lease Agreement for the Company’s Minneapolis, Minnesota, facility is attached as Exhibit 10.1(h) to Amendment No. 1 to the Company’s Form S-1 Registration Statement filed on April 23, 1998, and is incorporated herein by reference. |
10.1(g) | | The Lease Agreement for the Company’s Berching, Germany, facility dated November 15, 1996, is attached as Exhibit 10.1(g) to the Company’s Form 10-K filed on March 12, 2003, and is incorporated herein by reference. |
10.1(h) | | The Lease Agreement for the Company’s Shanghai/Pudong, China, facility is attached as Exhibit 10.1(j) to Amendment No. 1 to the Company’s Form S-1 Registration Statement filed on April 23, 1998, and is incorporated herein by reference. |
10.1(i) | | The Lease Agreement for the Company’s Odense, Denmark, facility dated November 15, 1996, is attached as Exhibit 10.1(h) to the Company’s Form 10-K filed on March 12, 2003, and is incorporated herein by reference. |
10.1(j) | | The Indenture of Lease agreement for the Company’s Nordborg, Denmark, facility effective May 3, 2000, is attached as Exhibit 10.1(ah) to the Company’s Form 10-K filed on March 30, 2001, and is incorporated herein by reference. |
10.1(k) | | The Lease Agreement for the Company’s Hillsboro, Oregon, facility effective January 19, 2001, is attached as Exhibit 10.1(ai) to the Company’s Form 10-K filed on March 30, 2001, and is incorporated herein by reference. |
10.1(l) | | The Lease Agreement for the Company’s leased facility in Ames, Iowa, effective April 1, 2002, is attached as Exhibit 10.1(am) to the Company’s Form 10-Q filed on May 15, 2002, and is incorporated herein by reference. |
10.1(m) | | The Office Lease for the Company’s Chicago, Illinois, Executive Office effective June 1, 2002, is attached as Exhibit 10.1(an) to the Company’s Form 10-Q filed on May 15, 2002, and is incorporated herein by reference. |
10.1(n) | | The Executive Employment Agreement with David J. Anderson dated January 1, 2003, is attached as Exhibit 10.1(m) to the Company’s Form 10-K filed on March 12, 2003, and is incorporated herein by reference. |
10.1(o) | | The Executive Employment Agreement with Karl J. Schmidt dated January 1, 2003, is attached as Exhibit 10.1(n) to the Company’s Form 10-K filed on March 12, 2003, and is incorporated herein by reference. |
39
10.1(p) | | The Executive Employment Agreement with James R. Wilcox dated January 1, 2003, is attached as Exhibit 10.1(o) to the Company’s Form 10-K filed on March 12, 2003, and is incorporated herein by reference. |
10.1(q) | | The Executive Employment Agreement with Hans J. Cornett dated January 1, 2003, is attached as Exhibit 10.1(p) to the Company’s Form 10-K filed on March 12, 2003, and is incorporated herein by reference. |
10.1(r) | | The Executive Employment Agreement with Thomas Kittel dated December 1, 2002, is attached as Exhibit 10.1(q) to the Company’s Form 10-K filed on March 12, 2003, and is incorporated herein by reference. |
10.1(s) | | The Addendum to Executive Employment Agreement, dated December 1, 2002, relating to the Executive Employment Agreement referred to in 10.1(r) above with Thomas Kittel is attached as Exhibit 10.1(r) to the Company’s Form 10-K filed on March 12, 2003, and is incorporated herein by reference. |
10.1(t) | | The Executive Employment Agreement with Finn Lyhne dated December 1, 2002, is attached as Exhibit 10.1(s) to the Company’s Form 10-K filed on March 12, 2003, and is incorporated herein by reference. |
10.1(u) | | The Addendum to Executive Employment Agreement, dated December 1, 2002, relating to the Executive Employment Agreement referred to in 10.1(t) above with Finn Lyhne is attached as Exhibit 10.1(t) to the Company’s Form 10-K filed on March 12, 2003, and is incorporated herein by reference. |
10.1(v) | | The Executive Employment Agreement with Henrik Krabsen dated January 1, 2003, is attached as Exhibit 10.1(v) to the Company’s Form 10-K filed on March 12, 2003, and is incorporated herein by reference. |
10.1(w) | | The Executive Employment Agreement with Kenneth D. McCuskey dated January 1, 2003, is attached as Exhibit 10.1(w) to the Company’s Form 10-K filed on March 12, 2003, and is incorporated herein by reference. |
10.1(x) | | The Executive Employment Agreement with Albert Zahalka dated January 1, 2003, is attached as Exhibit 10.1(x) to the Company’s Form 10-K filed on March 12, 2003, and is incorporated herein by reference. |
10.1(y) | | The Executive Employment Agreement with Ronald C. Hanson dated July 1, 2003, is attached as Exhibit 10.1(z) to the Company’s Form 10-K filed on March 15, 2004, and is incorporated herein by reference. |
10.1(z) | | The Consulting Agreement with Klaus Murmann dated May 5, 2004, is attached as Exhibit 10.1(z) to the Company’s Form 10-Q filed on August 6, 2004, and is incorporated herein by reference. |
10.1(aa) | | The Amended and Restated Post-Retirement Care Agreement for Klaus Murmann, effective May 3, 2000, is attached as Exhibit 10.1(s) to the Company’s Form 10-Q filed on August 16, 2000, and is incorporated herein by reference. |
10.1(ab) | | The Sauer-Danfoss Inc. Annual Management Performance Incentive Plan amended and restated as of March 4, 2003, is attached as Exhibit 10.1(ab) to the Company’s Form 10-Q filed on August 6, 2004, and is incorporated herein by reference. |
40
10.1(ac) | | The Sauer-Sundstrand Company Supplemental Retirement Benefit Plan for Certain Key Executives is attached as Exhibit 10.1(t) to Amendment No. 1 to the Company’s Form S-1 Registration Statement filed on April 23, 1998, and is incorporated herein by reference. |
10.1(ad) | | The First Amendment to the Sauer-Sundstrand Company Supplemental Retirement Benefit Plan for Certain Key Executives referred to in Exhibit 10.1(ac) above, which renames the Plan to the Sauer-Danfoss Inc. Supplemental Retirement Benefit Plan for Certain Key Executives, is attached as Exhibit 10.1(ad) to the Company’s Form Form 10-Q filed on August 6, 2004, and is incorporated herein by reference. |
10.1(ae) | | The Sauer-Sundstrand Company Supplemental Retirement Benefit Plan for Certain Key Executives Previously Employed by the Sundstrand Corporation is attached as Exhibit 10.1(u) to Amendment No. 1 to the Company’s Form S-1 Registration Statement filed on April 23, 1998, and is incorporated herein by reference. |
10.1(af) | | The European Employees’ Pension Plan is attached as Exhibit 10.1(y) to Amendment No. 1 to the Company’s Form S-1 Registration Statement filed on April 23, 1998, and is incorporated herein by reference. |
10.1(ag) | | The Sauer-Danfoss Inc. 1998 Long-Term Incentive Plan is attached as Exhibit 10.1(p) to Amendment No. 1 to the Company’s Form S-1 Registration Statement filed on April 23, 1998, and is incorporated herein by reference. |
10.1(ah) | | The Amendment, effective May 3, 2000, to the Sauer-Danfoss Inc. 1998 Long-Term Incentive Plan referred to in 10.1(ag) above is attached as Exhibit 10.1(v) to the Company’s Form 10-Q filed on August 16, 2000, and is incorporated herein by reference. |
10.1(ai) | | The Amendment to the Sauer-Danfoss Inc. 1998 Long-Term Incentive Plan effective December 4, 2002, is attached as Exhibit 10.1(bd) to the Company’s Form 10-K filed on March 12, 2003, and is incorporated herein by reference. |
10.1(aj) | | The Second Amendment to Sauer-Danfoss Inc. 1998 Long-Term Incentive Plan is attached as Exhibit 10 to the Company’s Form 8-K filed on August 24, 2006, and is incorporated herein by reference. |
10.1(ak) | | The Sauer-Danfoss Inc. Non-employee Director Stock Option and Restricted Stock Plan is attached as Exhibit 10.1(q) to Amendment No. 1 to the Company’s Registration Statement filed on April 23, 1998, and is incorporated herein by reference. |
10.1(al) | | The Amendment, effective May 3, 2000, to the Sauer-Danfoss Inc. Non-Employee Director Stock Option and Restricted Stock Plan referred to in 10.1(ak) above is attached as Exhibit 10.1(x) to the Company’s Form 10-Q filed on August 16, 2000, and is incorporated herein by reference. |
10.1(am) | | The Amendment to the Sauer-Danfoss Inc. Non-Employee Director Stock Option and Restricted Stock Plan effective December 4, 2002, is attached as Exhibit 10.1(ak) to the Company’s Form 10-K filed on March 12, 2003, and is incorporated herein by reference. |
10.1(an) | | The Trademark and Trade Name Agreement dated May 3, 2000, between the Company and Danfoss A/S is attached as Exhibit 10.1(ac) to the Company’s Form 10-Q filed on August 16, 2000, and is incorporated herein by reference. |
41
10.1(ao) | | The Stock Exchange Agreement dated January 22, 2000, by and among the Registrant, Danfoss A/S, Danfoss Murmann Holding A/S. and K. Murmann Verwaltungsgesellschaft mbH is attached as Annex A to the Company’s Proxy Statement filed on March 28, 2000, and is incorporated herein by reference. |
10.1(ap) | | The Sauer-Danfoss Inc. Annual Officer Performance Incentive Plan amended and restated as of March 4, 2003, is attached as Exhibit 10.1(bc) to the Company’s Form 10-K filed on March 12, 2003 and is incorporated herein by reference. |
10.1(aq) | | First Amendment to the Sauer-Danfoss Inc. Annual Officer Incentive Plan Effective December13, 2005, is attached as exhibit 9.4 to the Company’s Form 8-K filed on December 7, 2005, and is incorporated herein by reference. |
10.1(ar) | | The Sauer-Danfoss Inc. Deferred Compensation Plan for Selected Employees dated December 9, 2003, is attached as exhibit 10.1(bk) to the Company’s Form 10-K filed on March 15, 2004, and is incorporated herein by reference. |
10.1(as) | | First Amendment to the Sauer-Danfoss Inc. Deferred Compensation Plan for Selected Employees, effective December 31, 2005, is attached as exhibit 9.1 to the Company’s Form 8-K filed on December 7, 2005, and is incorporated herein by reference. |
10.1(at) | | The Sauer-Danfoss Inc. Supplemental Executive Savings & Retirement Plan (As Amended and Restated Effective as of January 1, 2005), is attached as exhibit 9.3 to the Company’s 8-K filed on December 7, 2005, and is incorporated herein by reference. |
10.1(au) | | Summary of increased non-employee director compensation, effective April 27, 2005, is attached as Exhibit 10.1(bv) to the Company’s Form 8-K filed on May 3, 2005, and is incorporated herein by reference. |
10.1(av) | | Summary of increase in base salary for the Company’s President and Chief Executive Officer adopted by the Compensation Committee on February 22, 2005, is attached as Exhibit 10.1(bw) to the Company’s Form 10-Q filed on May 10, 2005, and is incorporated herein by reference. |
10.1(aw) | | Form of 2005 Performance Unit Award Agreement under the Sauer-Danfoss Inc. 1998 Long-Term Incentive Plan (“LTIP”) representing awards of Performance Units under the LTIP granted by the Compensation Committee on February 22, 2005 to participants under the LTIP, including all executive officers, as previously reported on the Form 8-K filed by the Company on February 28, 2005. The Form of the Award Agreement is attached as exhibit 10.1(bx) to the Company’s Form 10-Q filed on May 10, 2005, and is incorporated herein by reference. |
10.1(ax) | | Form of Non-employee Director Restricted Stock Award Agreement, is attached as Exhibit 10.1(by) to the Company’s Form 10-Q filed on May 10, 2005, and is incorporated herein by reference, representing the grant of 1,500 shares of Restricted Stock awarded by the Board of Directors to each non-employee director on April 27, 2005 pursuant to the Sauer-Danfoss Inc. Non-employee Director Stock Option and Restricted Stock Plan, as previously reported in the Company’s Form 8-K filed on May 3, 2005. |
10.1(ay) | | The Sauer-Danfoss Inc. 409A Deferred Compensation Plan for Selected Employees, effective December 13, 2005, is attached as Exhibit 9.2 to the Company’s Form 8-K, filed on December 7, 2005, and is incorporate herein by reference |
42
10.1(az) | | First Amendment to the Sauer-Danfoss Inc. 409A Deferred Compensation Plan for Selected Employees effective January 1, 2006, is attached as Exhibit 9.5 to the Companies Form 8-K filed on December 7, 2005, and is incorporated herein by reference. |
10.1(ba) | | The Sauer-Danfoss Inc. 2006 Omnibus Incentive Plan is filed as Appendix A to the Company’s Definitive Proxy Statement filed on April 24, 2006, and is incorporated herein by reference. |
10.1(bb) | | Form of Performance Unit Award Agreement under the Sauer-Danfoss Inc. 2006 Omnibus Incentive Plan (the “2006 Plan”), representing awards of Performance Units to participants under the 2006 Plan, including all executive officers, is attached as Exhibit 10.2 to the Company’s Form 8-K filed on June 7, 2006, and is incorporated herein by reference. |
10.1(bc) | | Amended and Restated Credit Agreement dated as of July 28, 2006, by and among Sauer-Danfoss Inc., the subsidiary borrowers listed therein, the lenders listed therein, and JPMorgan Chase Bank, N.A., as Administrative Agent and Collateral Agent, is attached as Exhibit 10 to the Company’s Form 8-K filed on August 3, 2006, and is incorporated herein by reference. |
21 | | Subsidiaries of the Registrant. |
23.1 | | Consent of KPMG LLP. |
31.1 | | Certification by the Chief Executive Officer Pursuant to Rule 13a-14(a). |
31.2 | | Certification by the Chief Financial Officer Pursuant to Rule 13a-14(a). |
32.1 | | Certification by the Chief Executive Officer Pursuant to 18 U.S.C. Section 1350. |
32.2 | | Certification by the Chief Financial Officer Pursuant to 18 U.S.C. Section 1350. |
(b) The exhibits that are listed under Item 15(a)(3) above are filed or incorporated by reference hereunder.
43
SIGNATURES
Pursuant to the requirements of Section 13 or 15(d) of the Securities Exchange Act of 1934, the registrant has duly caused this report to be signed on its behalf by the undersigned, thereunto duly authorized.
| SAUER-DANFOSS INC. |
| By: | /s/ KENNETH D. MCCUSKEY |
| | Kenneth D. McCuskey |
| | Vice President and Chief Accounting Officer,
Secretary |
Date: March 12, 2007
Pursuant to the requirements of the Securities Exchange Act of 1934, this report has been signed below by the following persons on behalf of the registrant and in the capacities and on the dates indicated. Each person signing below also hereby appoints David J. Anderson and Kenneth D. McCuskey, and each of them singly, his or her lawful attorney-in-fact with full power to execute and file any and all amendments to this report together with exhibits thereto and generally to do all such things as such attorney-in-fact may deem appropriate to enable Sauer-Danfoss Inc. to comply with the provisions of the Securities Exchange Act of 1934 and all requirements of the Securities and Exchange Commission.
| Signature | | | | Title | | | | Date | |
/s/ DAVID J. ANDERSON | | Director and President and Chief | | March 12, 2007 |
David J. Anderson | | Executive Officer | | |
/s/ KARL J. SCHMIDT | | Executive Vice President and Chief | | March 12, 2007 |
Karl J. Schmidt | | Financial Officer | | |
/s/ KENNETH D. MCCUSKEY | | Vice President and Chief Accounting | | March 12, 2007 |
Kenneth D. McCuskey | | Officer, Secretary | | |
/s/ OLE STEEN ANDERSEN | | Director | | March 12, 2007 |
Ole Steen Andersen | | | | |
/s/ JORGEN M. CLAUSEN | | Director | | March 12, 2007 |
JOrgen M. Clausen | | | | |
/s/ NICOLA KEIM | | Director | | March 12, 2007 |
Nicola Keim | | | | |
/s/ JOHANNES F. KIRCHOFF | | Director | | March 12, 2007 |
Johannes F. Kirchhoff | | | | |
/s/ HANS KIRK | | Director | | March 12, 2007 |
Hans Kirk | | | | |
44
/s/ F. JOSEPH LOUGHREY | | Director | | March 12, 2007 |
F. Joseph Loughrey | | | | |
/s/ KLAUS H. MURMANN | | Director | | March 12, 2007 |
Klaus H. Murmann | | | | |
/s/s SVEN MURMANN | | Director | | March 12, 2007 |
Sven Murmann | | | | |
/s/ STEVEN H. WOOD | | Director | | March 12, 2007 |
Steven H. Wood | | | | |
45
Sauer-Danfoss Inc. and Subsidiaries
Consolidated Statements of Income
(Dollars in thousands, except per share data)
| | For the Years Ended December 31, | |
| | 2006 | | 2005 | | 2004 | |
Net Sales | | $ | 1,739,088 | | $ | 1,547,816 | | $ | 1,404,159 | |
Costs and Expenses: | | | | | | | |
Cost of sales | | 1,342,324 | | 1,190,070 | | 1,058,075 | |
Selling, general and administrative | | 215,565 | | 217,130 | | 200,142 | |
Research and development | | 61,880 | | 58,673 | | 51,913 | |
Impairment charges and loss on disposal of fixed assets | | 3,246 | | 1,391 | | 2,119 | |
Total costs and expenses | | 1,623,015 | | 1,467,264 | | 1,312,249 | |
Operating income | | 116,073 | | 80,552 | | 91,910 | |
Nonoperating Income (Expenses): | | | | | | | |
Interest expense | | (18,415 | ) | (17,540 | ) | (18,403 | ) |
Interest income | | 654 | | 1,887 | | 988 | |
Other, net | | (5,675 | ) | 3,465 | | (4,052 | ) |
Nonoperating expenses, net | | (23,436 | ) | (12,188 | ) | (21,467 | ) |
Income Before Income Taxes and Minority Interest | | 92,637 | | 68,364 | | 70,443 | |
Minority Interest | | (21,617 | ) | (18,657 | ) | (21,522 | ) |
Income Before Income Taxes | | 71,020 | | 49,707 | | 48,921 | |
Income Tax Expense | | (17,272 | ) | (10,992 | ) | (15,735 | ) |
Net Income | | $ | 53,748 | | $ | 38,715 | | $ | 33,186 | |
Net Income per common share, basic | | $ | 1.13 | | $ | 0.82 | | $ | 0.70 | |
Net Income per common share, diluted | | $ | 1.11 | | $ | 0.81 | | $ | 0.70 | |
Weighted average basic shares outstanding | | 47,699,972 | | 47,455,507 | | 47,409,377 | |
Weighted average diluted shares outstanding | | 48,237,814 | | 47,795,160 | | 47,509,941 | |
See accompanying notes to consolidated financial statements.
F-1
Sauer-Danfoss Inc. and Subsidiaries
Consolidated Balance Sheets
(Dollars in thousands, except per share data)
| | December 31, | |
| | 2006 | | 2005 | |
Assets | | | | | |
Current Assets: | | | | | |
Cash and cash equivalents | | $ | 29,112 | | $ | 14,194 | |
Accounts receivable (net of allowances for doubtful accounts of $5,705 and $4,900 in 2006 and 2005, respectively) | | 259,976 | | 220,752 | |
Inventories | | 272,286 | | 238,905 | |
Other current assets | | 43,931 | | 38,369 | |
Total current assets | | 605,305 | | 512,220 | |
Property, Plant and Equipment, net | | 503,977 | | 450,426 | |
Other Assets: | | | | | |
Goodwill | | 108,811 | | 120,318 | |
Other intangible assets, net | | 27,160 | | 29,587 | |
Deferred income taxes | | 58,217 | | 42,871 | |
Other | | 5,685 | | 15,491 | |
Total other assets | | 199,873 | | 208,267 | |
| | $ | 1,309,155 | | $ | 1,170,913 | |
Liabilities and Stockholders’ Equity | | | | | |
Current Liabilities: | | | | | |
Notes payable and bank overdrafts | | $ | 46,952 | | $ | 28,275 | |
Long-term debt due within one year | | 120,243 | | 168,548 | |
Accounts payable | | 142,234 | | 107,090 | |
Accrued salaries and wages | | 56,923 | | 44,035 | |
Accrued warranty | | 17,022 | | 17,047 | |
Other accrued liabilities | | 54,588 | | 46,312 | |
Total current liabilities | | 437,962 | | 411,307 | |
Long-Term Debt | | 182,388 | | 135,452 | |
Other Liabilities | | | | | |
Long-term pension liability | | 80,607 | | 49,590 | |
Postretirement benefits other than pensions | | 35,193 | | 19,461 | |
Deferred income taxes | | 30,590 | | 44,277 | |
Other | | 22,976 | | 20,464 | |
Total other liabilities | | 169,366 | | 133,792 | |
Minority Interest in Net Assets of Consolidated Companies | | 53,448 | | 51,440 | |
Stockholders’ Equity: | | | | | |
Preferred stock, par value $.01 per share, authorized 4,500,000 shares, no shares issued or outstanding | | — | | — | |
Common stock, par value $.01 per share, authorized shares 75,000,000 in 2006 and 2005; issued and outstanding 47,746,279 in 2006 and 47,498,232 in 2005 | | 477 | | 475 | |
Additional paid-in capital | | 336,146 | | 332,861 | |
Retained earnings | | 103,278 | | 78,176 | |
Accumulated other comprehensive income | | 26,090 | | 27,410 | |
Total stockholders’ equity | | 465,991 | | 438,922 | |
| | $ | 1,309,155 | | $ | 1,170,913 | |
See accompanying notes to consolidated financial statements.
F-2
Sauer-Danfoss Inc. and Subsidiaries
Consolidated Statements of Stockholders’ Equity and Comprehensive Income
(Dollars in thousands, except per share data)
| | Number of Shares
Outstanding | | Common
Stock | | Aditional Paid
in Capital | | Retained
Earnings | | Accumulated Other
Comprehensive
Income | | Unamortized
Restricted Stock
Compensation | | Total | |
Year Ended December 31, 2004: | | | | | | | | | | | | | | | | | | | | | | | | | | | |
Beginning balance | | | 47,432,268 | | | | $ | 474 | | | | $ | 314,319 | | | | $ | 45,202 | | | | $ | 37,376 | | | | $ | (157 | ) | | $ | 397,214 | |
Comprehensive income: | | | | | | | | | | | | | | | | | | | | | | | | | | | |
Net income | | | — | | | | — | | | | — | | | | 33,186 | | | | — | | | | — | | | | |
Pension adjustment | | | — | | | | — | | | | — | | | | — | | | | (7,655 | ) | | | — | | | | |
Unrealized losses on hedging activities | | | — | | | | — | | | | — | | | | — | | | | (538 | ) | | | — | | | | |
Currency translation | | | — | | | | — | | | | — | | | | — | | | | 32,527 | | | | — | | | | |
Total comprehensive income | | | | | | | | | | | | | | | | | | | | | | | | | | 57,520 | |
Restricted stock grant | | | 13,500 | | | | — | | | | 208 | | | | — | | | | — | | | | (208 | ) | | — | |
Restricted stock and performance unit compensation | | | — | | | | — | | | | 5,344 | | | | — | | | | — | | | | 128 | | | 5,472 | |
Cash dividends declared ($.34 per share) | | | — | | | | — | | | | — | | | | (16,131 | ) | | | — | | | | — | | | (16,131 | ) |
Ending Balance | | | 47,445,768 | | | | 474 | | | | 319,871 | | | | 62,257 | | | | 61,710 | | | | (237 | ) | | 444,075 | |
Year Ended December 31, 2005: | | | | | | | | | | | | | | | | | | | | | | | | | | | |
Comprehensive income: | | | | | | | | | | | | | | | | | | | | | | | | | | | |
Net income | | | — | | | | — | | | | — | | | | 38,715 | | | | — | | | | — | | | | |
Pension adjustment | | | — | | | | — | | | | — | | | | — | | | | 92 | | | | — | | | | |
Unrealized gains on hedging activities | | | — | | | | — | | | | — | | | | — | | | | 192 | | | | — | | | | |
Currency translation | | | — | | | | — | | | | — | | | | — | | | | (34,584 | ) | | | — | | | | |
Total comprehensive income | | | | | | | | | | | | | | | | | | | | | | | | | | 4,415 | |
Adoption of SFAS No. 123R | | | | | | | | | | | | | | | | | | | | | | | | | | | |
“Share Based Payment” | | | — | | | | — | | | | (237 | ) | | | — | | | | — | | | | 237 | | | — | |
Performance units vested | | | 38,964 | | | | 1 | | | | (1 | ) | | | — | | | | — | | | | — | | | — | |
Modification of performance units | | | — | | | | — | | | | 3,545 | | | | — | | | | — | | | | — | | | 3,545 | |
Restricted stock grant | | | 13,500 | | | | — | | | | — | | | | — | | | | — | | | | — | | | — | |
Restricted stock and performance unit compensation | | | — | | | | — | | | | 9,683 | | | | — | | | | — | | | | — | | | 9,683 | |
Cash dividends declared ($.48 per share) | | | — | | | | — | | | | — | | | | (22,796 | ) | | | — | | | | — | | | (22,796 | ) |
Ending Balance | | | 47,498,232 | | | | 475 | | | | 332,861 | | | | 78,176 | | | | 27,410 | | | | — | | | 438,922 | |
Year Ended December 31, 2006: | | | | | | | | | | | | | | | | | | | | | | | | | | | |
Comprehensive income: | | | | | | | | | | | | | | | | | | | | | | | | | | | |
Net income | | | — | | | | — | | | | — | | | | 53,748 | | | | — | | | | — | | | | |
Pension and postretirement adjustment | | | — | | | | — | | | | — | | | | — | | | | (40,256 | ) | | | — | | | | |
Unrealized gains on hedging activities | | | — | | | | — | | | | — | | | | — | | | | 847 | | | | — | | | | |
Currency translation | | | — | | | | — | | | | — | | | | — | | | | 38,089 | | | | — | | | | |
Total comprehensive income | | | | | | | | | | | | | | | | | | | | | | | | | | 52,428 | |
Performance units vested | | | 234,547 | | | | 2 | | | | — | | | | — | | | | — | | | | — | | | 2 | |
Restricted stock grant | | | 13,500 | | | | — | | | | — | | | | — | | | | — | | | | — | | | — | |
Restricted stock and performance unit compensation | | | — | | | | — | | | | 6,292 | | | | — | | | | — | | | | — | | | 6,292 | |
Tax benefits on performance unit compensation | | | | | | | | | | | 137 | | | | | | | | | | | | | | | 137 | |
Minimum tax witholding settlement | | | — | | | | — | | | | (3,144 | ) | | | — | | | | — | | | | — | | | (3,144 | ) |
Cash dividends declared ($.60 per share) | | | — | | | | — | | | | — | | | | (28,646 | ) | | | — | | | | — | | | (28,646 | ) |
Ending Balance | | | 47,746,279 | | | | $ | 477 | | | | $ | 336,146 | | | | $ | 103,278 | | | | $ | 26,090 | | | | $ | — | | | $ | 465,991 | |
See accompanying notes to consolidated financial statements.
F-3
Sauer-Danfoss Inc. and Subsidiaries
Consolidated Statements of Cash Flows
(Dollars in thousands)
| | For the Years Ended December 31, | |
| | 2006 | | 2005 | | 2004 | |
Cash Flows from Operating Activities: | | | | | | | |
Net Income | | $ | 53,748 | | $ | 38,715 | | $ | 33,186 | |
Adjustments to reconcile net income to net cash provided by (used in) operating activities: | | | | | | | |
Depreciation and amortization | | 95,665 | | 88,322 | | 82,363 | |
Minority interest | | 21,617 | | 18,657 | | 21,522 | |
Restricted stock and performance unit compensation under equity method | | 6,292 | | 9,683 | | 5,344 | |
Impairment charge and net loss on disposal of fixed assets | | 3,246 | | 1,391 | | 2,119 | |
Change in deferred income taxes | | (13,909 | ) | (12,449 | ) | (2,174 | ) |
(Increase) decrease in operating assets and liabilities, excluding effects of acquisitions — | | | | | | | |
Accounts receivable, net | | (24,512 | ) | (4,829 | ) | (30,780 | ) |
Inventories | | (14,242 | ) | (24,860 | ) | (23,466 | ) |
Accounts payable | | 27,244 | | (13,368 | ) | 22,705 | |
Accrued liabilities | | 8,511 | | 17,621 | | 10,191 | |
Other | | 4,252 | | (2,571 | ) | 3,802 | |
Net cash provided by operating activities | | 167,912 | | 116,312 | | 124,812 | |
Cash Flows from Investing Activities: | | | | | | | |
Purchases of property, plant and equipment | | (116,244 | ) | (95,247 | ) | (79,257 | ) |
Payments for acquisitions and license rights, net of cash acquired | | — | | — | | (5,656 | ) |
Proceeds from sales of property, plant and equipment | | 6,959 | | 1,942 | | 9,367 | |
Net cash used in investing activities | | (109,285 | ) | (93,305 | ) | (75,546 | ) |
Cash Flows from Financing Activities: | | | | | | | |
Net borrowings (repayments) on notes payable and bank overdrafts | | 20,351 | | 7,598 | | (14,978 | ) |
Net borrowings (repayments) on revolving credit facility | | (37,918 | ) | (62,355 | ) | 33,420 | |
Repayments of long-term debt | | (32,137 | ) | (13,253 | ) | (42,355 | ) |
Borrowings of long-term debt | | 51,517 | | 77,190 | | — | |
Payments for debt financing costs | | (285 | ) | (898 | ) | — | |
Performance unit compensation excess tax deduction | | 137 | | — | | — | |
Cash dividends | | (26,706 | ) | (21,843 | ) | (14,706 | ) |
Distribution to minority interest partners | | (19,908 | ) | (6,570 | ) | (14,711 | ) |
Net cash used in financing activities | | (44,949 | ) | (20,131 | ) | (53,330 | ) |
Effect of Exchange Rate Changes on Cash | | 1,240 | | 45 | | 251 | |
Cash and Cash Equivalents: | | | | | | | |
Net increase (decrease) during the year | | 14,918 | | 2,921 | | (3,813 | ) |
Beginning balance | | 14,194 | | 11,273 | | 15,086 | |
Ending balance | | $ | 29,112 | | $ | 14,194 | | $ | 11,273 | |
Supplemental Cash Flow Disclosures: | | | | | | | |
Interest paid | | $ | 17,163 | | $ | 15,601 | | $ | 17,984 | |
Income taxes paid | | $ | 25,337 | | $ | 14,780 | | $ | 12,324 | |
See accompanying notes to consolidated financial statements.
F-4
Sauer-Danfoss Inc. and Subsidiaries
Notes to Consolidated Financial Statements
December 31, 2006, 2005, and 2004
(Dollars in thousands, except per share data)
(1) Summary of Significant Accounting Policies:
Basis of Presentation and Principles of Consolidation —
Sauer-Danfoss Inc., a U.S. Delaware corporation, and subsidiaries (the Company) is a worldwide leader in the design, manufacture, and sale of engineered hydraulic and electronic systems and components that generate, transmit and control power in mobile equipment. The Company’s products are used by original equipment manufacturers of mobile equipment, including construction, road building, agricultural, turf care, material handling, and specialty vehicle equipment. The Company’s products are sold throughout the world either directly or through distributors.
The consolidated financial statements represent the consolidation of all companies in which the Company has a controlling interest and are stated in accordance with accounting principles generally accepted in the United States. All significant intercompany balances, transactions, and profits have been eliminated in the consolidated financial statements.
Use of Estimates —
The preparation of financial statements in conformity with accounting principles generally accepted in the United States requires management to make estimates and assumptions that affect the amounts reported in the financial statements and accompanying notes. Actual results may differ from those estimates.
Revenue Recognition —
Net sales are recorded when all of the following criteria are met: persuasive evidence of an arrangement exists, delivery has occurred, the price is fixed and determinable, and collectibility is reasonably assured. Estimates for future warranty expense are recorded when the related revenue is recognized. Timing of revenue recognition is consistent with when the risks and rewards of ownership and title to the product have transferred to the customer.
Cash and Cash Equivalents —
Cash equivalents are considered by the Company to be all highly liquid instruments purchased with original maturities of three months or less. At December 31, 2006 cash and cash equivalents balances in China totaled approximately $23,000. The Company is paying dividends from its Chinese entities to the maximum extent possible under current regulations, however, due to the nature of the governmental and other regulatory controls it is difficult to move cash out of this country for reasons other than payment for goods shipped into the country.
Trade Receivables —
The Company records trade receivables due from its customers at the time sales are recorded in accordance with its revenue recognition policy. The future collectibility of these amounts can be impacted by the Company’s collection efforts, the financial stability of its customers, and the general economic climate in which it operates. The Company applies a consistent practice of establishing an allowance for accounts that it believes may become uncollectible through reviewing the historical write-offs of accounts,
F-5
Sauer-Danfoss Inc. and Subsidiaries
Notes to Consolidated Financial Statements (Continued)
December 31, 2006, 2005, and 2004
(Dollars in thousands, except per share data)
aging of its receivables, and by monitoring the financial strength of its customers. If the Company becomes aware of a customer’s inability to meet its financial obligations (e.g., where it has filed for bankruptcy), the Company establishes a specific allowance for the potential bad debt to reduce the net recognized receivable to the amount it reasonably believes will be collected. The valuation of trade receivables is performed quarterly.
Inventories —
Inventories are valued at the lower of cost or market, using various cost methods, and include the cost of material, labor, and factory overhead. The last-in, first-out (LIFO) method was adopted in 1987 and is used to value inventories at the U.S. locations which existed at that time. Inventories at all of the non-U.S. locations and the U.S. locations obtained through acquisition after 1987, which produce products different than those produced at U.S. locations existing at 1987, are valued under the inventory valuation method in place prior to acquisition, either weighted average or first-in, first-out (FIFO). The percentage of year-end inventory valued under the LIFO and FIFO, cost methods was 19% and 81%, respectively, for 2006, and 18% and 82%, respectively, for 2005.
Property, Plant and Equipment and Depreciation —
Property, plant and equipment are stated at historical cost, net of accumulated depreciation. Depreciation is generally computed using the straight-line method for building equipment and buildings over 10 to 37 years and for machinery and equipment over 3 to 8 years (3 to 12 years for additions in 1999 and prior). Additions and improvements that substantially extend the useful life of a particular asset are capitalized. Repair and maintenance costs ($41,729, $38,697, and $36,533 in 2006, 2005, and 2004, respectively) are charged to expense. When property, plant and equipment are retired or otherwise disposed of, the cost and related accumulated depreciation are removed from the accounts and any gain or loss is included in the consolidated statements of income.
Goodwill and Other Intangible Assets —
Goodwill represents the excess of the purchase price over the estimated fair values of net assets acquired in the purchase of businesses. The Company accounts for goodwill and intangible assets in accordance with Statement of Financial Accounting Standards (SFAS) No. 142, “Goodwill and Other Intangible Assets,” which requires that goodwill is not amortized, but tested for impairment at least annually. Intangible assets consist primarily of trade names, technology, and customer relationships and are recorded at cost or fair value at the time of acquisition. Intangible assets are amortized on a straight-line basis over their legal or estimated useful lives, which range from three to thirty five years.
Product Warranty —
The Company warrants its various products over differing periods depending upon the type of product and application. Consequently, the Company records warranty liabilities for the estimated costs that may be incurred under its basic warranty based on past trends of actual warranty claims compared to the actual sales levels to which those claims apply. These liabilities are accrued at the time the sales of the products are recorded. Factors that affect the Company’s warranty liability include the number of units in the field
F-6
Sauer-Danfoss Inc. and Subsidiaries
Notes to Consolidated Financial Statements (Continued)
December 31, 2006, 2005, and 2004
(Dollars in thousands, except per share data)
currently under warranty, historical and anticipated rates of warranty claims on those units and the cost per claim to satisfy the Company’s warranty obligation. The anticipated rate of warranty claims is the primary factor impacting the Company’s estimated warranty obligation. Each quarter, the Company reevaluates its estimates to assess the adequacy of its recorded warranty liabilities and adjusts the amounts as necessary.
In addition to its normal warranty liability, the Company, from time to time in the normal course of business, incurs costs to repair or replace defective products with a specific customer or group of customers. The Company refers to these as field recalls and in these instances, the Company records a specific provision for the expected costs it will incur to repair or replace these products utilizing information from customers and internal information regarding the specific cost of materials and labor. Due to the sporadic and infrequent nature of field recalls, and the potential for a range of costs associated with field recalls, the Company cannot accurately estimate these costs at the time the products are sold. Therefore, these costs are recorded at the time information becomes known to the Company. As the field recalls are carried out, the Company relieves the specific liability related to that field recall. These specific field recall liabilities are reviewed on a quarterly basis.
Impairment of Long-Lived Assets and Assets to be Disposed Of —
Consistent with the requirements of SFAS No. 144, “Accounting for the Impairment or Disposal of Long-Lived Assets,” the Company periodically assesses whether events or circumstances have occurred that may indicate the carrying value of its long-lived tangible and intangible assets may not be recoverable. The carrying value of long-lived tangible and intangible assets to be held and used is evaluated based on the expected future undiscounted operating cash flows. When events or circumstances indicate the carrying value of an asset or group of assets is impaired, the Company recognizes an impairment loss to the extent that the carrying value of the assets exceeds the fair value of the assets. In 2006 the Company recognized an impairment of long-lived assets to be disposed of related to restructuring activity in the Work Function segment of approximately $1,500 (see Note 3 for more information).
Income Taxes —
The provision for income taxes has been determined using the asset and liability approach of accounting for income taxes. Under this approach, deferred taxes represent the future tax consequences expected to occur when the reported amounts of assets and liabilities are recovered or paid. The provision for income taxes represents income taxes paid or payable for the current year plus the change in deferred taxes during the year. Deferred taxes result from differences between the financial and tax bases of the Company’s assets and liabilities, net operating loss carryforwards, and tax credit carryforwards and are adjusted for changes in tax rates and tax laws when changes are enacted. Valuation allowances are recorded to reduce deferred tax assets when it is more likely than not that a tax benefit will not be realized.
Income Per Share —
Basic net income per common share is based on the weighted average number of common shares outstanding in each year. Diluted net income per common share assumes that outstanding common shares were increased by shares issuable upon (i) exercise of restricted stock shares, and (ii) granting of shares under the long-term incentive plan, after it becomes certain that the performance requirements needed to
F-7
Sauer-Danfoss Inc. and Subsidiaries
Notes to Consolidated Financial Statements (Continued)
December 31, 2006, 2005, and 2004
(Dollars in thousands, except per share data)
be met in accordance with the incentive plan will be achieved. Shares under both the restricted stock plan and the long term incentive plan have an exercise price of zero.
| | Net Income | | Shares | | EPS | |
December 31, 2006 | | | | | | | | | |
Basic net income | | | $ | 53,748 | | | 47,699,972 | | $ | 1.13 | |
Effect of dilutive securities: | | | | | | | | | |
Restricted stock | | | — | | | 22,768 | | — | |
Performance units | | | — | | | 515,074 | | (0.02 | ) |
Diluted net income | | | $ | 53,748 | | | 48,237,814 | | $ | 1.11 | |
December 31, 2005 | | | | | | | | | |
Basic net income | | | $ | 38,715 | | | 47,455,507 | | $ | 0.82 | |
Effect of dilutive securities: | | | | | | | | | |
Restricted stock | | | — | | | 22,486 | | — | |
Performance units | | | — | | | 317,167 | | (0.01 | ) |
Diluted net income | | | $ | 38,715 | | | 47,795,160 | | $ | 0.81 | |
December 31, 2004 | | | | | | | | | |
Basic net income | | | $ | 33,186 | | | 47,409,377 | | $ | 0.70 | |
Effect of dilutive securities: | | | | | | | | | |
Restricted stock | | | — | | | 18,185 | | — | |
Performance units | | | — | | | 82,379 | | — | |
Diluted net income | | | $ | 33,186 | | | 47,509,941 | | $ | 0.70 | |
Fair Value of Financial Instruments —
The carrying values of cash and cash equivalents, accounts and other receivables, notes payable and bank overdrafts, and accounts payable approximate fair value because of the short-term nature of these instruments.
The fair value of long-term debt is calculated by discounting scheduled cash flows through maturity using estimated market discount rates. The discount rate is estimated using the rates currently offered for long-term debt of similar remaining maturities. At December 31, 2006 the Company estimated the fair value of its long-term debt, including amounts due within one year, at $302,979 compared to its carrying value of $302,631. At December 31, 2005 the Company estimated the fair value of its long-term debt, including amounts due within one year, at $307,550 compared to its carrying value of $304,000. These estimates are subjective in nature and involve uncertainties and, therefore, cannot be determined with precision. Changes in assumptions could significantly affect these estimates.
Translation of Non-U.S. Currencies —
Assets and liabilities of consolidated non-U.S. subsidiaries are translated into U.S. dollars at exchange rates in effect at the end of each period, while revenues and expenses are translated at average exchange rates prevailing during the period. The resulting translation adjustments are included in stockholders’
F-8
Sauer-Danfoss Inc. and Subsidiaries
Notes to Consolidated Financial Statements (Continued)
December 31, 2006, 2005, and 2004
(Dollars in thousands, except per share data)
equity. Gains or losses on transactions denominated in non-functional currencies and the related tax effects are reflected in the consolidated statements of income.
Derivatives and Hedging —
It is the Company’s policy that derivative transactions are executed only to manage exposures arising in the normal course of business and not for the purpose of creating speculative positions or trading. Derivative financial instruments are accounted for under SFAS No. 133, “Accounting for Derivative Instruments and Hedging Activities,” as amended. Under SFAS No. 133, all derivatives are recorded at fair value on the balance sheet as current or long-term other assets or other liabilities depending on whether the maturity date of the derivative contract is within one year from the balance sheet date.
The Company uses interest rate swaps to establish fixed interest rates on outstanding borrowings. There is no ineffectiveness of the interest rate swaps and therefore, the changes in fair value of the derivatives is recorded in accumulated other comprehensive income. The Company utilizes forward contracts to minimize the impact of currency fluctuations on cash flows related to forecasted sales denominated in currencies other than the functional currency of the selling location. The forward contracts qualify for hedge accounting and therefore are subject to effectiveness testing at the inception of the contract and throughout the life of the contract.
When, and if, a derivative is determined not to be highly effective as a hedge, or the underlying hedged transaction is no longer likely to occur, or the derivative is terminated, the hedge accounting is discontinued and any past or future changes in the derivative’s fair value that will not be effective as an offset to the income effects of the item being hedged are recognized currently in the income statement. Any changes in fair values of derivatives not qualifying as hedges would be reported immediately in other income (expense) on the consolidated statement of income, however, the Company did not have any derivatives that did not qualify as hedges in 2006 or 2005.
Employee Stock-Based Compensation —
The Company accounts for employee stock-based compensation in accordance with SFAS No. 123R, “Share-Based Payments.” The fair value method is used to account for employee-stock compensation .
New Accounting Principles —
In November 2004 the Financial Accounting Standards Board (FASB) issued SFAS No. 151, “Inventory Costs.” SFAS No. 151 amends Accounting Research Bulletin No. 43, Chapter 4 on inventory pricing to clarify that abnormal amounts of idle facility expense, freight, handling costs, and wasted materials should be recognized as current period charges. In addition, SFAS No. 151 requires that allocation of fixed production overhead to the costs of conversion be based on the normal capacity of the production facilities. The Company adopted SFAS No. 151 in 2006 with no material effect on the Company’s consolidated financial statements.
In September 2006 the FASB issued SFAS No. 158, “Employers’ Accounting for Defined Benefit Pension and Other Postretirement Plans an amendment of SFAS No. 87, 88, 106, and 132(R).” This
F-9
Sauer-Danfoss Inc. and Subsidiaries
Notes to Consolidated Financial Statements (Continued)
December 31, 2006, 2005, and 2004
(Dollars in thousands, except per share data)
standard requires employers to recognize the underfunded or overfunded status of a defined benefit postretirement plan as an asset or liability in its balance sheet and to recognize changes in the funded status in the year in which the changes occur through accumulated other comprehensive income. Additionally, SFAS No. 158 requires employers to measure the funded status of a plan as of the date of its fiscal year-end. The Company adopted SFAS No. 158 in 2006. The effect of adoption was to decrease assets by $1,438, increase liabilities by $27,888, and decrease accumulated other comprehensive income by $29,326. The new measurement date requirement applies for fiscal years ending after December 15, 2008. The Company already uses a measurement date of December 31 so this change will have no impact on the consolidated financial statements.
In September 2006 the U.S. Securities and Exchange Commission staff issued Staff Accounting Bulletin No. 108 (“SAB 108”), “Considering the Effects of Prior Year Misstatements when Quantifying Misstatements in Current Year Financial Statements.” SAB 108 requires quantification of financial statement misstatements based on the effects of the misstatements on each of the company’s financial statements and the related financial statement disclosures. The Company adopted SAB 108 in 2006 with no impact on the consolidated financial statements.
In June 2006 the FASB issued FASB Interpretation No. 48, “Accounting for Uncertainty in Income Taxes — an interpretation of FASB Statement No. 109” (FIN 48), which prescribes a recognition threshold and measurement attribute for the financial statement recognition and measurement of a tax position taken or expected to be taken in a tax return. FIN 48 also provides guidance on derecognition, classification, interest and penalties, accounting in interim periods, disclosure and transition. FIN 48 is effective for fiscal years beginning after December 15, 2006. The Company does not expect the adoption of FIN 48 to have a material impact on financial reporting and is currently evaluating the impact, if any, the adoption of FIN 48 will have on the consolidated financial statements.
In June 2006 the FASB ratified Emerging Issues Task Force (“EITF”) Issue No. 06 — 3, “How Taxes Collected from Customers and Remitted to Governmental Authorities Should Be Presented in the Income Statement (that is, Gross versus Net Presentation)”, which allows companies to adopt a policy of presenting taxes in the income statement on either a gross or net basis. Taxes within the scope of this EITF would include taxes that are imposed on a revenue transaction between a seller and a customer. If such taxes are significant, the accounting policy should be disclosed as well as the amount of taxes included in the financial statements if presented on a gross basis. EITF No. 06 — 3 is effective for reporting periods beginning after December 15, 2006. The Company does not expect the adoption of EITF No. 06 — 03 to have a significant impact on the consolidated financial statements.
In September 2006 FASB issued SFAS No. 157, “Fair Value Measurements” which clarifies the principle that fair value should be based on the assumptions that market participants would use when pricing an asset or liability. Additionally, it establishes a fair value hierarchy that prioritizes the information used to develop those assumptions. The Company has not yet determined the impact that the implementation of SFAS No. 157 will have on the consolidated financial statements. SFAS No. 157 is effective for financial statements issued for fiscal years beginning after November 15, 2007.
In February 2007 the FASB issued SFAS No. 159, “The Fair Value Option for Financial Assets and Financial Liabilities — Including an Amendment of FASB Statement No. 115.” SFAS No. 159 permits
F-10
Sauer-Danfoss Inc. and Subsidiaries
Notes to Consolidated Financial Statements (Continued)
December 31, 2006, 2005, and 2004
(Dollars in thousands, except per share data)
many financial instruments and certain other items to be measured at fair value at the option of the Company. SFAS No. 159 is effective for financial statements issued for first fiscal years beginning after November 15, 2007. The Company does not expect the adoption of SFAS 159 to have a significant impact on the consolidated financial statements.
Reclassifications —
Certain previously reported amounts have been reclassified to conform to the current period presentation. Spare machining parts and perishable tooling totaling approximately $6,500 at December 31, 2005 was reclassified from inventory to other assets in the current year.
(2) Business Combinations:
During the second quarter of 2004 the Company exercised its option to acquire the remaining 15% of Comatrol S.p.A for approximately $4,300. The Company acquired Comatrol, located in Reggio Emilia, Italy, with approximately 100 employees and $22,000 in annual sales, for its manufacturing and product technology. In the second quarter of 2003, the Company purchased 40% of the outstanding shares of Comatrol, increasing its ownership percentage to 85%, and therefore began to consolidate the financial results of the business. The total purchase price paid to acquire Comatrol was approximately $22,100. The Company recognized intangible assets of approximately $600 and $2,200 for technology and customer relationships, respectively, in connection with the Comatrol acquisition. The transaction also resulted in recognizing approximately $14,500 of goodwill in the Controls segment.
(3) Restructuring Charges:
In March 2006 the Company announced its plans to close the LaSalle, Illinois, plant, and discontinue production of certain product lines manufactured in Swindon, England. Certain products currently manufactured in LaSalle were outsourced to reduce costs and increase efficiencies. The total cost of the restructuring activities at LaSalle and Swindon are expected to be approximately $8,500 and $4,800, respectively. Costs related to the LaSalle plant closing are included in the Propel segment and are anticipated to be completed by the end of the first quarter 2007. Costs related to the Swindon product line discontinuance are included in the Work Function segment and are anticipated to be completed by the end of the third quarter 2007. In addition the Propel and Controls segments have incurred costs related to smaller restructuring activities. Other than the accrual of employee termination costs, the restructuring charges are expensed as incurred.
F-11
Sauer-Danfoss Inc. and Subsidiaries
Notes to Consolidated Financial Statements (Continued)
December 31, 2006, 2005, and 2004
(Dollars in thousands, except per share data)
The following table summarizes the restructuring charges incurred in 2006:
| | Propel | | Work
Function | | Controls | | Total | |
Employee termination costs | | $ | 1,572 | | | $ | 1,915 | | | | $ | 271 | | | $ | 3,758 | |
Property and equipment impairment and loss on
disposal | | 309 | | | 1,567 | | | | 290 | | | 2,166 | |
Accelerated depreciation due to change in useful lives | | 2,086 | | | — | | | | — | | | 2,086 | |
Pension curtailment | | 1,551 | | | — | | | | — | | | 1,551 | |
Production inefficiencies | | 1,064 | | | — | | | | — | | | 1,064 | |
Equipment moving costs | | 740 | | | — | | | | 620 | | | 1,360 | |
Other | | 968 | | | — | | | | 543 | | | 1,511 | |
Total | | $ | 8,290 | | | $ | 3,482 | | | | $ | 1,724 | | | $ | 13,496 | |
Costs incurred during the year ended December 31, 2006 consist of $10,855, $475, and $2,166 included in cost of sales; selling, general and administrative expenses; and impairment charges and net loss on disposal of fixed assets, respectively. The amount for pension curtailment is the recognition of unamortized prior service costs related to the LaSalle pension plan.
No significant restructuring projects were underway in 2005. The Company completed restructuring of its European sales and distribution operations in 2004. During 2004 the Company also completed the relocation of the operations of its West Branch, Iowa, location to other existing facilities and outsourced certain processes to reduce costs and increase efficiencies. The costs related to the West Branch restructuring and to management reorganization were included in the Work Function segment. The charges related to the European sales and distribution restructuring were allocated to all segments. The following table summarizes the restructuring charges incurred in 2004:
| | Work Function | | European Sales
Operations | |
| | | 2004 | | | | 2004 | | |
Employee termination costs | | | $ | 1,338 | | | | $ | 2,323 | | |
Employee retraining & relocation costs | | | 148 | | | | 176 | | |
Property and equipment impairment and loss on disposal | | | 131 | | | | — | | |
Coordinating team | | | — | | | | 1,166 | | |
Equipment relocation costs | | | 136 | | | | — | | |
Other costs | | | 470 | | | | 743 | | |
Total | | | $ | 2,223 | | | | $ | 4,408 | | |
In addition to the Work Function and European sales and distribution restructuring, the Company incurred $165 of employee termination costs related to the partial consolidation of the U.S. non-manufacturing functions within the Controls segment. The cost for restructuring in 2004 totaled $6,796 consisting of $1,320, $5,345, and $131 included in cost of sales, selling, general and administrative expenses, and loss on disposal of fixed assets, respectively. The West Branch relocation was completed in March 2004. The European sales and distribution restructuring was completed in December 2004.
F-12
Sauer-Danfoss Inc. and Subsidiaries
Notes to Consolidated Financial Statements (Continued)
December 31, 2006, 2005, and 2004
(Dollars in thousands, except per share data)
The following table summarizes the activity in the restructuring accrued liability for the years ended December 31, 2006, 2005, and 2004.
| | 2006 | | 2005 | | 2004 | |
Balance at beginning of year | | $ | — | | | $ | — | | | $ | — | |
Charges to expense | | 3,758 | | | — | | | 3,661 | |
Severence payments made | | (643 | ) | | — | | | (3,661 | ) |
Balance at end of year | | $ | 3,115 | | | $ | — | | | $ | — | |
(4) Inventories:
The composition of inventories is as follows:
| | December 31, | |
| | 2006 | | 2005 | |
Raw materials | | $ | 116,122 | | $ | 95,434 | |
Work in progress | | 56,274 | | 59,583 | |
Finished goods and parts | | 117,104 | | 98,530 | |
LIFO allowance | | (17,214 | ) | (14,642 | ) |
Total | | $ | 272,286 | | $ | 238,905 | |
(5) Property, Plant and Equipment and Property Held for Disposal:
The cost and related accumulated depreciation of property, plant and equipment are summarized as follows:
| | December 31, | |
| | 2006 | | 2005 | |
Cost — | | | | | |
Land and improvements | | $ | 16,063 | | $ | 15,134 | |
Buildings and improvements | | 132,418 | | 117,901 | |
Machinery and equipment | | 1,044,030 | | 981,647 | |
Construction in progress | | 79,433 | | 42,778 | |
Plant and equipment under capital leases | | 16,694 | | 15,447 | |
Total costs | | 1,288,638 | | 1,172,907 | |
Less — accumulated depreciation | | (784,661 | ) | (722,481 | ) |
Net property, plant and equipment | | $ | 503,977 | | $ | 450,426 | |
Depreciation expense for 2006, 2005, and 2004 was $92,902, $85,346, and $79,307, respectively.
In connection with the discontinuation of certain product lines discussed in Note 3 the Company intends to sell or dispose of the related machinery and equipment. The Company recorded an impairment charge of approximately $1,500 when it reduced the carrying value of these assets to their fair market value, calculated based on expected sales price. During 2001 the Company closed a manufacturing facility in Racine, Wisconsin, as part of a restructuring related to an acquisition. In 2004 this property was sold and
F-13
Sauer-Danfoss Inc. and Subsidiaries
Notes to Consolidated Financial Statements (Continued)
December 31, 2006, 2005, and 2004
(Dollars in thousands, except per share data)
a gain on sale of approximately $600 was recognized in the income statement in the Global Services segment results. The Company also had an undeveloped piece of land in Brooklyn Park, Minnesota, which had a carrying value of approximately $3,000, which was classified in other current assets on the consolidated balance sheet at December 31, 2005. In 2006 this property was sold and a gain of $100 was recognized in the income statement in the Controls segment results.
In 2003 the Company closed a manufacturing facility in West Branch, Iowa and determined the land and building would be sold. This property is classified in other current assets with a carrying value of approximately $3,600 in the Work Function segment on the consolidated balance sheets at December 31, 2006 and 2005 as it is held for sale. Based upon its most recent analysis, the Company believes that no impairments existed at December 31, 2006.
(6) Intangible Assets:
The following table summarizes the components of the other intangible asset balances at December 31, 2006 and 2005:
| | Trade
Name | | Technology | | Customer
Relationships | | Other | | Total | |
December 31, 2006 | | | | | | | | | | | | | | | |
Cost | | $ | 19,000 | | | $ | 11,324 | | | | $ | 6,670 | | | $ | 2,615 | | $ | 39,609 | |
Accumulated amortization | | (3,258 | ) | | (4,866 | ) | | | (3,123 | ) | | (1,202 | ) | (12,449 | ) |
Other intangible assets, net | | $ | 15,742 | | | $ | 6,458 | | | | $ | 3,547 | | | $ | 1,413 | | $ | 27,160 | |
December 31, 2005 | | | | | | | | | | | | | | | |
Cost | | $ | 19,000 | | | $ | 11,263 | | | | $ | 6,065 | | | $ | 5,057 | | $ | 41,385 | |
Accumulated amortization | | (2,715 | ) | | (3,965 | ) | | | (2,242 | ) | | (2,876 | ) | (11,798 | ) |
Other intangible assets, net | | $ | 16,285 | | | $ | 7,298 | | | | $ | 3,823 | | | $ | 2,181 | | $ | 29,587 | |
The weighted average useful lives for the intangible assets are 35, 14, and 12 years for trade name, technology, and customer relationships, respectively. Amortization of intangible assets was $2,763, $2,976, and $3,056 in 2006, 2005, and 2004, respectively. Amortization expense is expected to be approximately $1,800 in 2007, $1,600 in 2008, and $1,500 in 2009 through 2011.
F-14
Sauer-Danfoss Inc. and Subsidiaries
Notes to Consolidated Financial Statements (Continued)
December 31, 2006, 2005, and 2004
(Dollars in thousands, except per share data)
(7) Long-Term Debt:
Long-term debt outstanding at December 31, 2006 and 2005 consisted of the following:
| | 2006 | | 2005 | |
| | Long-term debt
due within
one year | | Long-term
debt | | Long-term debt
due within
one year | | Long-term
debt | |
Multicurrency Revolving and Term Loan Facility | | | $ | 106,374 | | | $ | 52,106 | | | $ | 98,268 | | | $ | — | |
Danish Revolving Credit Facility | | | — | | | — | | | 56,278 | | | — | |
German Long-Term Bank Facilities maturing through 2018 | | | 9,802 | | | 11,212 | | | 9,820 | | | 18,952 | |
Multicurrency Term Loan Facility due through 2015 | | | — | | | 80,512 | | | — | | | 75,556 | |
U.S. 1997 Senior Notes, due through 2007 | | | 4,000 | | | — | | | 4,000 | | | 4,000 | |
U.S. 2000 Senior Notes, due through 2010 | | | — | | | 35,000 | | | — | | | 35,000 | |
Other Borrowings | | | 67 | | | 3,558 | | | 182 | | | 1,944 | |
Total | | | $ | 120,243 | | | $ | 182,388 | | | $ | 168,548 | | | $ | 135,452 | |
Multicurrency and Non-U.S. Bank Facilities
In December 2005 the Company entered into a Multicurrency Revolving Facility Agreement which was modified in July 2006 (the Agreement). Under the Agreement the Company may borrow up to $300,000 through December 2010. The Agreement includes a 40,000 euro term loan which expires in July 2013. Proceeds from the term loan were used to pay off a portion of the Company’s revolving credit balances. Debt issuance costs of approximately $1,000 were capitalized and are being amortized to interest expense over the term of the Agreement. Any amounts drawn under the revolving portion of the facility must be repaid or reborrowed within 360 days. The revolving portion of this facility is classified as current and the 40,000 euro term loan is classified as long-term.
Borrowings under the Agreement bear interest at a rate based on either the relevant interbank offering rate plus a margin (0.625% at December 31, 2006), Federal Funds plus 0.5%, or the prevailing Prime Rate. The margin on the interbank offering rate option ranges from 0.5% to 1.125%, depending upon the Company’s ratio of net debt to EBITDA, as defined. The weighted average interest rate on outstanding borrowings under the Agreement was approximately 5.6% at December 31, 2006. The Company is also required to pay a commitment fee on the unused portion of the Agreement. The commitment fee rate varies depending upon the Company’s ratio of net debt to EBITDA, as defined. This fee was 0.15% at December 31, 2006 and the Company incurred commitment fee expense of $310 and $12 in 2006 and 2005, respectively. The Agreement contains certain financial covenants relating to the Company’s EBITDA to net interest expense and net debt to EBITDA, as defined. The Company was in compliance with the covenants at December 31, 2006.
The Agreement was a modification of the Multicurrency Revolving Credit Facility Agreement that the Company had entered into in September 2003 (the Prior Agreement). The Company incurred $468 of commitment fee expense related to the Prior Agreement in 2005.
F-15
Sauer-Danfoss Inc. and Subsidiaries
Notes to Consolidated Financial Statements (Continued)
December 31, 2006, 2005, and 2004
(Dollars in thousands, except per share data)
(7) Long-Term Debt: (Continued)
The Company also had a revolving credit facility of 800,000 Danish kroner that was available through June 2006. At December 31, 2005 the Company had 447,149 Danish kroner or $71,254 available under this facility. The interest rate on the loans outstanding at December 31, 2005 was 3.4%. In addition, the Company was required to pay a commitment fee on the unused portion of this credit facility, which was at a rate of 0.50% at December 31, 2005. The Company incurred $114 and $71 of commitment fee expense in 2006 and 2005, respectively.
The German Long-Term Bank Facilities represent a series of long-term and short-term bank loans. Included in the balance of $21,014 are loans with $14,900 outstanding at December 31, 2006 that are secured by property. Interest on the German facilities may be either fixed or variable depending on the individual loan. Interest rates range from 4.1% to 6.0% at December 31, 2006. These facilities contain a variety of repayment schedules and have final maturities ranging from June 2007 through June 2018.
In December 2005 the Company borrowed $75,000 under a new term loan facility. The Company borrowed $30,000 in U.S. dollars at a fixed interest rate of 5.74% and 38,450 euro at a fixed interest rate of 4.05% over the ten year term of the loan. The euro portion of the loan is allocated to a Danish subsidiary. Sauer-Danfoss Inc. guarantees these euro borrowings including interest, amortization and fees. Repayments on the term loan are scheduled from December 2011 through December 2015. The outstanding balance on this loan at December 31, 2006 was $80,512. The Agreement contains certain financial covenants relating to the Company’s EBITDA to net interest expense and net debt to EBITDA, as defined, which the Company was in compliance with at December 31, 2006.
U.S. Borrowings
In December 1997 the Company issued $25,000 of 6.68% Senior Notes (1997 Senior Notes), of which $4,000 remains outstanding at December 31, 2006. The 1997 Senior Notes have one remaining repayment on December 15, 2007. The 1997 Senior Notes contain certain restrictions and require the maintenance of minimum tangible net worth and maximum leverage, as defined. At December 31, 2006 the Company was in compliance with these requirements.
In October 2000 the Company issued $35,000 of 8.07% Senior Notes (2000 Senior Notes). The 2000 Senior Notes have scheduled annual payments starting on September 30, 2008, through September 30, 2010. The 2000 Senior Notes contain certain restrictions and require the maintenance of certain financial ratios that are similar to the 1997 Senior Notes. At December 31, 2006 the Company was in compliance with these requirements.
The Company maintains overdraft facilities in various currencies in multiple countries for cash management purposes. The interest rates and commitment fees vary by country and arrangement. At December 31, 2006 there was $46,952 outstanding under the overdraft facilities. A Danish subsidiary maintains a line of credit for purposes of centralizing cash management for the European locations. Sauer-Danfoss Inc. guarantees this line of credit up to 20,000 euro.
Payments required to be made on long-term debt outstanding as of December 31, 2006 during the years ending 2007 through 2011 and for 2012 and thereafter are $120,243, $14,554, $13,292, $20,360, $28,513, and $105,669, respectively.
F-16
Sauer-Danfoss Inc. and Subsidiaries
Notes to Consolidated Financial Statements (Continued)
December 31, 2006, 2005, and 2004
(Dollars in thousands, except per share data)
(8) Pension and Postretirement Benefits other than Pensions:
The Company has noncontributory defined benefit pension plans covering a significant number of its employees. The benefits under these plans are based primarily on years of service and compensation levels. The Company also provides health benefits for certain retired employees and certain dependents when the employee becomes eligible for these benefits by satisfying plan provisions that include certain age and service requirements. The measurements for the pension and health benefits plans were performed at December 31.
The Company has adopted the provisions of SFAS No. 158, “Employers’ Accounting for Defined Benefit Pension and Other Postretirement Plans, an amendment of FASB Statements No. 87, 88, 106, and 132(R)” in December 2006. In accordance with SFAS 158, the 2005 accounting and related disclosures were not adjusted by the adoption of the new standard. The table below summarizes the incremental effects of the adoption of SFAS No. 158 on the individual line items in the Consolidated Balance Sheet at December 31, 2006:
| | Pre SFAS
No. 158
Adoption | | SFAS
No. 158
Adjustment | | Post SFAS
No. 158
Adoption | |
Assets: | | | | | | | | | | | | | |
Other assets | | | $ | 13,469 | | | | $ | (13,242 | ) | | | $ | 227 | | |
Deferred income taxes | | | 3,232 | | | | 11,804 | | | | 15,036 | | |
Liabilities: | | | | | | | | | | | | | |
Other accrued liabilities | | | 10,012 | | | | (5,460 | ) | | | 4,552 | | |
Long-term pension liability | | | 64,868 | | | | 15,739 | | | | 80,607 | | |
Post retirment benefits other than pensions | | | 17,584 | | | | 17,609 | | | | 35,193 | | |
Stockholders’ equity: | | | | | | | | | | | | | |
Accumulated other comprehensive income | | | 22,483 | | | | 29,326 | | | | 51,809 | | |
| | | | | | | | | | | | | | | | |
Pension Benefits
The Company’s funding policy for pension plans outside of Germany is to contribute annually an amount that falls within the range determined to be deductible for income tax purposes. The net pension liabilities reflected in the accompanying consolidated balance sheets result principally from unfunded pension plans of the Company’s operations in Germany, where it is common practice to fund pension obligations at the time payments are made to retirees, and the unfunded portions of the U.S. and U.K. plans.
F-17
Sauer-Danfoss Inc. and Subsidiaries
Notes to Consolidated Financial Statements (Continued)
December 31, 2006, 2005, and 2004
(Dollars in thousands, except per share data)
(8) Pension and Postretirement Benefits other than Pensions: (Continued)
Pension expense for 2006, 2005, and 2004 for these defined benefit plans consists of the following components:
| | December 31, | |
| | 2006 | | 2005 | | 2004 | |
Service cost | | $ | 5,576 | | $ | 4,516 | | $ | 4,250 | |
Interest cost | | 11,265 | | 10,559 | | 9,945 | |
Expected return on plan assets | | (9,500 | ) | (8,226 | ) | (7,528 | ) |
Amortization of prior service cost | | 122 | | 526 | | 530 | |
Amortization of net loss | | 3,095 | | 2,362 | | 1,476 | |
Net periodic pension expense | | $ | 10,558 | | $ | 9,737 | | $ | 8,673 | |
The Company incurred $1,551 of curtailment expense in 2006 related to the LaSalle Factory pension plan as a result of the decision to close the LaSalle plant. The curtailment expense is not included in the net periodic pension expense disclosed above.
The Company expects to incur $107 and $2,933 for amortization of prior service cost and amortization of net loss in 2007.
F-18
Sauer-Danfoss Inc. and Subsidiaries
Notes to Consolidated Financial Statements (Continued)
December 31, 2006, 2005, and 2004
(Dollars in thousands, except per share data)
(8) Pension and Postretirement Benefits other than Pensions: (Continued)
The following table sets forth the plans’ funded status as of the respective balance sheet dates:
| | December 31, | |
| | 2006 | | 2005 | |
Reconciliation of benefit obligation: | | | | | |
Benefit obligation at January 1 | | $ | (208,909 | ) | $ | (196,149 | ) |
Service cost | | (5,576 | ) | (4,516 | ) |
Interest cost | | (11,265 | ) | (10,559 | ) |
Plan participant contributions | | (647 | ) | (456 | ) |
Plan amendments | | — | | (238 | ) |
Actuarial loss | | (6,843 | ) | (16,217 | ) |
Benefit payments | | 9,352 | | 8,696 | |
Effect of exchange rate changes | | (12,317 | ) | 10,530 | |
Benefit obligation at December 31 | | $ | (236,205 | ) | $ | (208,909 | ) |
Reconciliation of fair value of plan assets: | | | | | |
Fair value of plan assets at January 1 | | 134,379 | | 116,138 | |
Actual return on plan assets | | 14,146 | | 13,254 | |
Employer contributions | | 6,115 | | 15,963 | |
Effect of exchange rate changes | | 6,340 | | (4,221 | ) |
Plan participant contributions | | 647 | | 456 | |
Benefit payments | | (7,747 | ) | (7,211 | ) |
Fair value of plan assets at December 31 | | 153,880 | | 134,379 | |
Funded status at December 31 | | (82,325 | ) | (74,530 | ) |
Unrecognized actuarial loss | | — | | 46,233 | |
Unrecognized prior service costs | | — | | 1,511 | |
Net amount recognized | | $ | (82,325 | ) | $ | (26,786 | ) |
Amounts recognized in the consolidated balance sheets as of:
| | December 31, | |
| | 2006 | | 2005 | |
Long-term pension liability, net (1) | | $ | (80,380 | ) | $ | (37,549 | ) |
Current pension liability | | (1,945 | ) | (5,049 | ) |
Intangible asset | | — | | 1,665 | |
Accumulated other comprehensive income | | — | | 14,147 | |
Net amount recognized | | $ | (82,325 | ) | $ | (26,786 | ) |
(1) Includes plan assets of $227 and $12,041 in 2006 and 2005, respectively for the U.K. plan that is included in other assets.
F-19
Sauer-Danfoss Inc. and Subsidiaries
Notes to Consolidated Financial Statements (Continued)
December 31, 2006, 2005, and 2004
(Dollars in thousands, except per share data)
(8) Pension and Postretirement Benefits other than Pensions: (Continued)
Amounts recognized in accumulated other comprehensive income as of:
| | December 31, | |
| | 2006 | | 2005 | |
Actuarial loss | | $ | 48,052 | | $ | — | |
Prior Service Cost | | 1,183 | | — | |
Additional minimum pension liability | | — | | 14,147 | |
| | $ | 49,235 | | $ | 14,147 | |
Significant assumptions used in determining pension expense and related pension obligations are as follows:
| | December 31, | |
| | 2006 | | 2005 | | 2004 | |
Discount Rates | | | | | | | |
United States | | 6.00 | % | 5.75 | % | 6.00 | % |
Germany | | 4.50 | | 4.50 | | 4.75 | |
United Kingdom | | 5.00 | | 4.66 | | 5.25 | |
Rates of increase in compensation levels | | | | | | | |
United States | | 3.50 | | 3.50 | | 3.50 | |
Germany | | 2.00 | | 2.00 | | 2.50 | |
United Kingdom | | 4.20 | | 3.90 | | 4.00 | |
Expected long-term rate of return on assets | | | | | | | |
United States | | 8.50 | | 8.50 | | 8.50 | |
United Kingdom | | 5.88 | | 5.86 | | 6.20 | |
The target asset allocation for the U.S. pension assets, on average, is 60% in equity securities and 40% in fixed income securities. This allocation is expected to earn an average annual rate of return of approximately 8.5% measured over a planning horizon of twenty years with reasonable and acceptable levels of risk. This expected level will be obtained, with an allowance for expenses, and cash investments, if equity securities realize an average annual return of 11% and fixed income securities produce an average annual yield of 6%. The target asset allocation for the U.K. pension assets, on average, is 58% in equity securities, 40% in fixed income securities, and 2% in cash. This allocation is expected to earn an average annual rate of return of approximately 5.86%.
The discount rate assumptions were based on investment yields available on AA rated long-term corporate bonds with cash flows that are similar to expected benefit payments.
The expected return on plan assets is based on the asset allocation mix and the historical return, taking into account current and expected market conditions.
F-20
Sauer-Danfoss Inc. and Subsidiaries
Notes to Consolidated Financial Statements (Continued)
December 31, 2006, 2005, and 2004
(Dollars in thousands, except per share data)
(8) Pension and Postretirement Benefits other than Pensions: (Continued)
The weighted average asset allocations by asset category for the U.S. and U.K. pension plans at December 31 are as follows:
| | U.S. Plan | | U.K. Plan | |
| | 2006 | | 2005 | | 2006 | | 2005 | |
Equity securities | | | 66 | % | | | 62 | % | | | 50 | % | | | 48 | % | |
Debt securities | | | 31 | | | | 35 | | | | 32 | | | | 34 | | |
Other | | | 3 | | | | 3 | | | | 18 | | | | 18 | | |
Total | | | 100 | % | | | 100 | % | | | 100 | % | | | 100 | % | |
During December 2005 the Company contributed approximately $8,600 to the U.K. Plan funds, which is being held in a high-interest cash deposit account pending a review of long-term investment strategy.
Postretirement Benefits
The health benefit plans covering certain groups of U.S. employees are contributory, with contributions reviewed annually and adjusted as appropriate. These plans contain other cost-sharing features such as deductibles and coinsurance. The Company does not pre-fund these plans and has the right to modify or terminate any of these plans in the future. Health benefits for retirees of non-U.S. operations, where applicable, are provided through government-sponsored plans to which the Company contributes funds during the individuals’ employment periods.
The components of the postretirement benefit expense of the Company-sponsored health benefit plans for 2006, 2005, and 2004, were as follows:
| | 2006 | | 2005 | | 2004 | |
Service cost | | $ | 595 | | $ | 553 | | $ | 621 | |
Interest cost | | 2,016 | | 1,876 | | 1,753 | |
Net deferral and amortization | | 762 | | 693 | | 543 | |
Postretirement benefit expense | | $ | 3,373 | | $ | 3,122 | | $ | 2,917 | |
The Company expects to incur $923 for net deferral and amortization in 2007.
F-21
Sauer-Danfoss Inc. and Subsidiaries
Notes to Consolidated Financial Statements (Continued)
December 31, 2006, 2005, and 2004
(Dollars in thousands, except per share data)
(8) Pension and Postretirement Benefits other than Pensions: (Continued)
The funded status of the Company-sponsored health benefit plans was as follows:
| | December 31, | |
| | 2006 | | 2005 | |
Reconciliation of benefit obligation: | | | | | |
Accumulated postretirement benefit liability at January 1 | | $ | (34,219 | ) | $ | (29,502 | ) |
Service cost | | (595 | ) | (553 | ) |
Interest cost | | (2,016 | ) | (1,876 | ) |
Actuarial loss | | (3,615 | ) | (4,494 | ) |
Benefit payments | | 2,648 | | 2,206 | |
Accumulated postretirement benefit liability at December 31 | | (37,797 | ) | (34,219 | ) |
Reconciliation of fair value of plan assets: | | | | | |
Fair value of plan assets at January 1 | | — | | — | |
Employer contributions | | 2,648 | | 2,206 | |
Benefit payments | | (2,648 | ) | (2,206 | ) |
Fair value of plan assets at December 31 | | — | | — | |
Funded status | | (37,797 | ) | (34,219 | ) |
Unrecognized actuarial loss | | — | | 14,758 | |
Postretirement benefit obligation | | (37,797 | ) | (19,461 | ) |
Less current portion | | 2,604 | | — | |
Postretirement benefit obligation, long-term | | $ | (35,193 | ) | $ | (19,461 | ) |
At December 31, 2006 there is $17,610 of actuarial loss recognized in accumulated other comprehensive income.
The assumed weighted average annual rate of increase in the per capita cost of medical benefits is 10.0% for 2007 and is assumed to decrease ratably in 2008 through 2012 and remain level at 4.5% thereafter.
U.S. employees retiring after March 1, 1993, and hired prior to January 1, 1993, will receive the standard health benefits up to age 65 and then will be eligible for a Medicare reimbursement allowance based on years of service. U.S. employees hired after January 1, 1993, and retiring after age 65 with ten years of service, will be eligible 65 for a Medicare reimbursement allowance based on years of service.
A one percent increase or decrease in the annual health care trend rates would have increased or decreased the accumulated postretirement benefit obligation at December 31, 2006, by $2,418, and increased or decreased postretirement benefit expense for 2006 by $209. The weighted average discount rate used to estimate the accumulated postretirement benefit obligation was 6.0%, 5.75%, and 6.0%, for 2006, 2005, and 2004, respectively.
F-22
Sauer-Danfoss Inc. and Subsidiaries
Notes to Consolidated Financial Statements (Continued)
December 31, 2006, 2005, and 2004
(Dollars in thousands, except per share data)
(8) Pension and Postretirement Benefits other than Pensions: (Continued)
The benefits expected to be paid from the benefit plans, which reflect expected future years of service, and the Medicare subsidy expected to be received are as follows:
| | Pensions | | Health Care | | Health Care
subsidy receipts (1) | |
2007 | | $ | 7,409 | | | $ | 2,681 | | | | $ | 78 | | |
2008 | | 8,086 | | | 2,945 | | | | 98 | | |
2009 | | 8,821 | | | 3,223 | | | | 118 | | |
2010 | | 9,649 | | | 3,497 | | | | 141 | | |
2011 | | 10,400 | | | 3,853 | | | | 154 | | |
2012-2016 | | 64,919 | | | 20,926 | | | | 1,210 | | |
| | | | | | | | | | | | | | |
(1) See discussion of Medicare subsidy provided by the Medicare Prescription Drug Improvement and Modernization Act of 2003 in Note 1.
The Company plans to contribute approximately $6,100 to the Company pension and health benefit plans in 2007.
The Company also maintains two defined contribution plans, the Sauer-Danfoss Employees’ Savings Plan and the Sauer-Danfoss LaSalle Factory Employee Savings Plan, for eligible employees. Company contributions include both base and matching amounts. The Company contributed approximately $2,500, $2,200 and $1,900 to these plans in 2006, 2005 and 2004, respectively.
(9) Income Taxes:
The Company’s income (loss) before income taxes is as follows:
| | Years Ended December 31, | |
| | 2006 | | 2005 | | 2004 | |
United States | | $ | 6,519 | | $ | 5,790 | | $ | (4,973 | ) |
European and other | | 64,501 | | 43,917 | | 53,894 | |
Total | | $ | 71,020 | | $ | 49,707 | | $ | 48,921 | |
The Company’s primary German operation is treated as a flow-through entity for United States tax purposes. The above analysis of pretax income and the following analysis of the income tax provision by taxing jurisdiction are therefore not directly related.
F-23
Sauer-Danfoss Inc. and Subsidiaries
Notes to Consolidated Financial Statements (Continued)
December 31, 2006, 2005, and 2004
(Dollars in thousands, except per share data)
(9) Income Taxes: (Continued)
The expense for income taxes by taxing jurisdiction is as follows:
| | Years Ended December 31, | |
| | 2006 | | 2005 | | 2004 | |
Current | | | | | | | |
United States | | | | | | | |
Federal | | $ | 585 | | $ | (414 | ) | $ | 2,411 | |
State | | (446 | ) | 357 | | (100 | ) |
European and other | | (23,373 | ) | (23,722 | ) | (21,294 | ) |
Total Current | | (23,234 | ) | (23,779 | ) | (18,983 | ) |
Deferred | | | | | | | |
United States | | | | | | | |
Federal | | 3,070 | | 7,594 | | 3,130 | |
State | | 1,165 | | 252 | | (563 | ) |
European and other | | 1,727 | | 4,941 | | 681 | |
Total Deferred | | 5,962 | | 12,787 | | 3,248 | |
Total income tax expense | | $ | (17,272 | ) | $ | (10,992 | ) | $ | (15,735 | ) |
A reconciliation of tax expense calculated using the U.S. statutory tax rate and recorded income tax expense based on the Company’s income before income taxes is as follows:
| | Years Ended December 31, | |
| | 2006 | | 2005 | | 2004 | |
Tax expense based on U.S. statutory tax rate | | $ | (24,857 | ) | $ | (17,398 | ) | $ | (17,124 | ) |
Deferred tax benefit not previously recognized | | 5,660 | | 4,355 | | — | |
Reduction of income tax accrued liability | | — | | — | | 2,600 | |
Statutory tax rate change | | — | | 1,072 | | — | |
Tax holiday in China | | — | | 539 | | 251 | |
Tax on Dividend repatriation under AJCA | | — | | (829 | ) | — | |
European and Asian locations’ losses not tax benefit | | (1,199 | ) | (627 | ) | (1,435 | ) |
Taxes on non-U.S. locations’ income at rates which differ from the U.S. rate | | 4,385 | | 2,690 | | 3,806 | |
State income taxes | | 467 | | 396 | | (431 | ) |
Tax effect of minority interest | | (1,752 | ) | (914 | ) | (900 | ) |
Other | | 24 | | (276 | ) | (2,502 | ) |
Total income tax expense | | $ | (17,272 | ) | $ | (10,992 | ) | $ | (15,735 | ) |
F-24
Sauer-Danfoss Inc. and Subsidiaries
Notes to Consolidated Financial Statements (Continued)
December 31, 2006, 2005, and 2004
(Dollars in thousands, except per share data)
(9) Income Taxes: (Continued)
The components of the Company’s net deferred tax assets and liabilities, determined on a jurisdictional and entity basis, are attributable to the following:
| | December 31, | |
| | 2006 | | 2005 | |
| | Assets | | Liabilities | | Assets | | Liabilities | |
Net operating loss (NOL) and tax credit carryforwards | | $ | 27,414 | | $ | — | | $ | 26,122 | | $ | — | |
Deferred compensation, post-retirement medical and accrued pension benefits | | 35,415 | | — | | 20,996 | | (953 | ) |
Fixed asset basis differences | | 6,230 | | (27,477 | ) | 7,250 | | (30,688 | ) |
Inventory and warranty accruals | | 6,660 | | (1,577 | ) | 10,177 | | (1,958 | ) |
Intangible asset fair market value step-up | | 6,199 | | (1,194 | ) | 10,748 | | (10,909 | ) |
Other items | | 9,879 | | (2,944 | ) | 11,658 | | (4,060 | ) |
Gross deferred tax assets/liabilities | | 91,797 | | (33,192 | ) | 86,951 | | (48,568 | ) |
Valuation allowance | | (15,440 | ) | — | | (30,808 | ) | — | |
Net deferred tax assets/liabilities | | 76,357 | | (33,192 | ) | 56,143 | | (48,568 | ) |
Less current portion | | (18,140 | ) | 2,602 | | (13,272 | ) | 4,291 | |
Net deferred tax assets/liabilities, long-term | | $ | 58,217 | | $ | (30,590 | ) | $ | 42,871 | | $ | (44,277 | ) |
In 2006 the company determined that unrecognized tax benefit of tax credits would be realized in the U.S. As a result $5,660 in valuation allowance was reversed and tax expense was reduced. Also in 2006 the company determined that most of the US NOL carryforward will offset future taxable income. This resulted in a decrease to the valuation allowance of $16,533 and a corresponding decrease to goodwill. This NOL was acquired in 2000 related to the merger with Danfoss Fluid Power and is subject to annual limits under IRC section 382. The remaining valuation allowance relates primarily to German deferred tax assets in excess of the German NOL-National noted below and an NOL in the U.K. which management has determined is not likely to be recognized in the future. To the extent the unrecognized tax benefit is recognized in the future, the tax benefit will reduce tax expense.
As of December 31, 2006 and 2005, the Company had not provided U.S. federal income taxes on $149,143, and $122,934 of undistributed earnings recorded by certain subsidiaries outside the United States since these earnings were deemed permanently invested. Although it is not practicable to determine the deferred tax liability on the unremitted earnings, foreign tax credits would be available to reduce U.S. tax liability if these foreign earnings were remitted.
F-25
Sauer-Danfoss Inc. and Subsidiaries
Notes to Consolidated Financial Statements (Continued)
December 31, 2006, 2005, and 2004
(Dollars in thousands, except per share data)
The Company had the following tax return carryforwards available to offset future years’ taxable income at December 31, 2006:
| | Amount | | Expiration Dates | |
German NOL — National | | $ | 56,955 | | | None | | |
German NOL — Local | | 5,979 | | | None | | |
U.S. NOL | | 24,469 | | | 2010-2019 | | |
U.K. NOL | | 8,368 | | | None | | |
Other non-U.S. NOL | | 1,516 | | | Various | | |
State NOL | | 17,884 | | | Various | | |
Foreign tax credits (available to offset U.S. taxes) | | 10,858 | | | 2011-2015 | | |
State tax credits | | 2,577 | | | Various | | |
US general business tax credits | | 1,908 | | | 2022-2026 | | |
| | | | | | | | |
The German NOLs reflected above have reduced U.S. income taxes in prior years due to the treatment of the Company’s primary German operations as a flow-through entity for U.S. tax purposes. Accordingly, no net deferred tax asset has been established for the German NOL carryforwards.
The ultimate realization of net deferred tax assets is dependent upon the generation of future taxable income during (i) the years in which temporary differences reverse and (ii) the years prior to the expiration of NOL and credit carryforwards. Management considers projected future taxable income and tax planning strategies in making this assessment including invoicing of costs to non-U.S. locations related to the common business system and discontinuance of LIFO method of valuing inventory for a total of $16,600. Based on these factors, management believes it is more likely than not that the Company will realize benefits of the net deferred tax assets as of December 31, 2006.
The American Jobs Creation Act of 2004 introduced a limited time 85% dividends received deduction on the repatriation of certain foreign earnings to a U.S. taxpayer, provided certain criteria are met. During 2005 the company recognized a tax expense of $829 related to repatriation of foreign earnings under this provision.
The Company’s resolved the IRS audit of its federal income tax returns for years 1997 through 2001 during 2005. The Company reduced its expense for income taxes by $335 in 2005 to reflect the final settlement.
(10) Minority Interests:
Minority interests in net assets and income reflected in the accompanying consolidated financial statements consists of:
a) A 40% minority interest held by Agri-Fab, Inc. in Hydro-Gear Limited Partnership, a U.S. limited partnership, for 2006, 2005, and 2004.
b) A 40% minority interest held by Shanghai Hydraulics and Pneumatics in Sauer Shanghai Hydraulic Transmission Co., Ltd., a Chinese equity business venture for 2006, 2005, and 2004.
F-26
Sauer-Danfoss Inc. and Subsidiaries
Notes to Consolidated Financial Statements (Continued)
December 31, 2006, 2005, and 2004
(Dollars in thousands, except per share data)
c) A 35% minority interest held by Daikin Industries Ltd. in Sauer-Danfoss-Daikin, Ltd., a Japanese corporation, for 2006, 2005, and 2004.
(10) Minority Interests: (Continued)
d) A 49.9% minority interest held by Topcon Laser Systems in TSD Integrated Controls LLC, a U.S. limited partnership, for 2006, 2005, and 2004.
e) A 55% minority interest held by Daikin Industries Ltd. in Daikin-Sauer-Danfoss Manufacturing, Ltd., a Japanese corporation, for 2006, 2005 and 2004.
f) A 15% minority interest held by Mr. Mose Natale Arduini in Comatrol S.p.A., an Italian corporation, through April 30, 2004.
The following table sets forth the components of minority interest in the consolidated balance sheets:
| | December 31, | |
| | 2006 | | 2005 | |
Hydro-Gear Limited Partnership | | $ | 29,938 | | $ | 33,586 | |
Sauer Shanghai Hydraulic Transmission Co., Ltd | | 5,552 | | 4,357 | |
Sauer-Danfoss-Daikin, Ltd | | 9,725 | | 7,765 | |
TSD Integrated Controls LLC | | 1,834 | | 847 | |
Daikin-Sauer-Danfoss Manufacturing, Ltd. | | 6,399 | | 4,885 | |
Total | | $ | 53,448 | | $ | 51,440 | |
The Hydro-Gear Limited Partnership agreement indicates a termination date of December 31, 2035. This entity is consolidated in the Company’s financial statements. The agreement indicates that if the partnership were to terminate the partnership would be liquidated and the resulting proceeds would be distributed in accordance with each partner’s ownership percentage.
F-27
Sauer-Danfoss Inc. and Subsidiaries
Notes to Consolidated Financial Statements (Continued)
December 31, 2006, 2005, and 2004
(Dollars in thousands, except per share data)
(11) Accumulated Other Comprehensive Income:
The changes in accumulated other comprehensive income for the years ended December 31, 2004, 2005, and 2006 follows:
| | Currency
Translation | | Pension /
Postretirement
Benefit Adjustment | | Hedging
Activities | | Accumulated
Other
Comprehensive
Income | |
Balance as of January 1, 2004 | | | $ | 41,299 | | | | $ | (3,990 | ) | | | $ | 67 | | | | $ | 37,376 | | |
Change in period | | | 32,527 | | | | (9,331 | ) | | | (674 | ) | | | 22,522 | | |
Effect of exchange rate changes | | | — | | | | (127 | ) | | | — | | | | (127 | ) | |
Income tax benefit | | | — | | | | 1,803 | | | | 136 | | | | 1,939 | | |
Balance as of December 31, 2004 | | | 73,826 | | | | (11,645 | ) | | | (471 | ) | | | 61,710 | | |
Change in period | | | (34,584 | ) | | | 88 | | | | 301 | | | | (34,195 | ) | |
Effect of exchange rate changes | | | — | | | | 699 | | | | — | | | | 699 | | |
Income tax expense | | | — | | | | (695 | )(1) | | | (109 | ) | | | (804 | ) | |
Balance as of December 31, 2005 | | | 39,242 | | | | (11,553 | ) | | | (279 | ) | | | 27,410 | | |
Change in period | | | 38,089 | | | | (51,800 | ) | | | 1,145 | | | | (12,566 | ) | |
Effect of exchange rate changes | | | — | | | | (817 | ) | | | — | | | | (817 | ) | |
Income tax benefit (expense) | | | — | | | | 12,361 | | | | (298 | ) | | | 12,063 | | |
Balance as of December 31, 2006 | | | $ | 77,331 | | | | $ | (51,809 | ) | | | $ | 568 | | | | $ | 26,090 | | |
(1) Represents tax effect on German pension amounts, not previously tax-effected related to net operating loss carryforwards.
(12) Derivative Financial Instruments:
The Company recognizes all derivative financial instruments, including foreign exchange contracts and interest rate swaps, in the consolidated financial statements at fair value in accordance with SFAS No. 133.
In 2005 the Company began to enter into forward contracts to hedge the value of the U.S. dollar cash flow at locations that do not have the U.S. dollar as their functional currency but conduct certain transactions in U.S. dollars. The objective of all outstanding forward contracts is to hedge forecasted transactions in U.S. dollars through the cash settlement date. The Company enters forward contracts that mature from two to eighteen months after the contract date.
Changes in the fair value of derivative financial instruments are recognized in income or in stockholders’ equity as a component of comprehensive income depending on whether any transaction related to the hedged risk has occurred. The fair value estimates used to value the foreign exchange contracts are based on information available to management and were determined using quoted market prices and the discounted value of future cash flows.
Changes in fair values of derivatives that are accounted for as cash flow hedges are recorded in other comprehensive income. Any portion of the hedge that is deemed ineffective due to the absolute value of
F-28
Sauer-Danfoss Inc. and Subsidiaries
Notes to Consolidated Financial Statements (Continued)
December 31, 2006, 2005, and 2004
(Dollars in thousands, except per share data)
(12) Derivative Financial Instruments: (Continued)
the cumulative change in the derivative being greater than the cumulative change in the hedged item is recorded immediately in other income (expense) on the consolidated statement of income. There was no hedge ineffectiveness in 2006 or 2005.
During the year ended December 31, 2006 the Company recognized an increase in net sales of $483 due to the effects of hedge accounting for forward contracts. In addition, the Company recognized additional other expense of $327 as a result of the forward contracts.
At December 31, 2006 the Company expects to reclassify $643 of gains, net of tax, on derivative instruments from accumulated other comprehensive income to earnings during the next twelve months due to the actual fulfillment of forecasted transactions.
Interest rate swaps, which are designated as cash flow hedges, are used by the Company to establish fixed interest rates on outstanding borrowings. At December 31, 2006 and 2005, the Company had three interest rate swaps outstanding that mature at various dates through March 2009. The combined notional amount of the three contracts was 4,686 and 6,769 euros at December 31, 2006 and 2005, respectively. There is no ineffectiveness of the interest rate swaps and therefore, the changes in fair value of the derivatives of $74 and $221, net of deferred taxes, were recorded in accumulated other comprehensive income at December 31, 2006 and 2005, respectively.
(13) Long-Term Incentive Plan:
The Company’s 1998 Long-Term Incentive Plan (1998 Incentive Plan) provides for the grant of stock options, stock appreciation rights, restricted stock, performance units, performance shares, and other incentive awards to officers and key employees. The total number of shares of common stock that may be subject to awards or be issued under the 1998 Incentive Plan shall not exceed 2,400,000 shares, of which no more than 1,200,000 shares may be issued as restricted stock. The settlement of performance units is in shares of company stock or cash as determined by the Compensation Committee of the Board of Directors. The performance units entitle the participants to receive an amount equal to the Company’s dividends during the vesting period.
In December 2005 the Board of Directors approved the adoption of the Sauer-Danfoss Inc. 2006 Omnibus Incentive Plan (2006 Incentive Plan), which was approved by the stockholders at the annual meeting in June 2006. The 2006 Incentive Plan provides for grants similar to those under the 1998 Incentive Plan and qualifies certain awards for the performance-based exception to obtain favorable tax treatment. The total number of shares of common stock that may be issued under the 2006 Incentive Plan shall not exceed 3,500,000 shares. In February 2006 the Compensation Committee granted 346,013 performance units under the 2006 Incentive Plan, 260,862 of which would be settled 100% in company stock with shares withheld having a value to meet the minimum statutory withholding requirements and 85,151 performance units granted to certain individuals that would be settled as cash. The units to be settled in cash are accounted for as liability units, with the remainder of the units accounted for as equity units.
F-29
Sauer-Danfoss Inc. and Subsidiaries
Notes to Consolidated Financial Statements (Continued)
December 31, 2006, 2005, and 2004
(Dollars in thousands, except per share data)
(13) Long-Term Incentive Plan: (Continued)
The following chart summarizes performance unit activity under the Plan for the year ended December 31, 2006:
| | Number | | Weighted Average
Grant Date
Fair Value | | Weighted Average
Vesting Period
in Years | |
Units Outstanding at January 1 | | 948,029 | | | $ | 18.42 | | | | 2.8 | | |
Units settled | | (257,164 | ) | | 16.98 | | | | 2.0 | | |
Units granted | | 260,862 | | | 25.93 | | | | 3.0 | | |
Units forefeited | | (17,033 | ) | | 21.74 | | | | 3.0 | | |
Units Outstanding at December 31 | | 934,694 | | | 20.85 | | | | 3.0 | | |
Cash Units | | | | Number | | Fair Value | | Weighted Average
Vesting Period
in Years | |
Units Outstanding at January 1 | | | — | | | | — | | | | — | | |
Units granted | | | 85,151 | | | | $ | 32.25 | | | | 3.0 | | |
Units Outstanding at December 31 | | | 85,151 | | | | $ | 32.25 | | | | 3.0 | | |
The Compensation Committee sets performance goals for each performance unit grant and depending on the extent to which these goals are met will determine the number of performance units that will be paid out to the participants. Based on performance results for 2004 through 2006 the performance units granted in 2004 are expected to be settled at 190% or the equivalent of approximately 700,000 shares.
In February 2005 the Compensation Committee of the Board of Directors determined that performance units outstanding, after settlement of the awards related to the 2004 performance, would be settled 100% in company stock with a value withheld to meet the minimum statutory withholding requirements of the Company in the countries where the individual participants pay tax. In accordance with SFAS No. 123R, “Share-Based Payment,” this change was a modification of the original award and therefore these units are being accounted for as equity units with compensation expense recognized based on the fair value of the Company’s stock price at the modification date. The liability accrued in previous years related to the modified performance units was reclassified to additional paid-in-capital at the time the awards were modified.
In February 2004 the Board of Directors approved granting approximately 323,000 performance units under the 1998 Incentive Plan to replace all performance units and stock options previously granted, as the original targets established for those grants were no longer deemed reasonable due to unforeseen economic conditions. In addition, on that date, the Board of Directors approved granting approximately 385,000 additional performance units under the 1998 Incentive Plan. In 2004 compensation cost related to the units to be distributed in company stock and in cash had been recognized based on the fair value of the equity instruments at the performance unit grant date and fair value at December 31, 2004, respectively.
F-30
Sauer-Danfoss Inc. and Subsidiaries
Notes to Consolidated Financial Statements (Continued)
December 31, 2006, 2005, and 2004
(Dollars in thousands, except per share data)
(13) Long-Term Incentive Plan: (Continued)
In accordance with SFAS No. 123R, “Share-Based Payment,” compensation expense is recognized over the vesting period of three years, measured based on the market price of the Company’s stock at the date of grant or modification, with an offsetting increase in additional paid-in capital. The expense related to the performance units granted under the 2006 Incentive Plan was based on the market price of the Company’s stock as of June 1, 2006, the time the 2006 Incentive Plan was approved by the Company’s stockholders. The expense related to the grants that will be settled in cash is based on the market price of the Company’s stock as of the balance sheet date. Compensation expense recognized in selling, general, and administrative expenses in conjunction with the performance units outstanding was $6,827, $9,499, and $10,458 in 2006, 2005, and 2004, respectively. The tax benefits recognized related to this expense was $2,468, $3,506, and $4,125 in 2006, 2005, and 2004, respectively. The Company expects to recognize approximately $10,800 of additional expense through 2008 related to the outstanding performance units under these two plans.
The Company also has a Non-employee Director Stock Option and Restricted Stock Plan which permits the granting of non-qualified stock options and restricted common stock to directors of the Company who are not employees of the Company. The total number of shares of common stock to be issued under this plan shall not exceed 250,000 shares.
Under the Non-employee Director Stock Option and Restricted Stock Plan the Company awarded, 13,500 shares of restricted stock to non-employee directors in 2006, 2005, and 2004. The restricted stock awards entitle the participants to full dividend and voting rights. Unvested shares are restricted as to disposition and subject to forfeiture under certain circumstances. The value of each award was established based on the market value of the stock as of the grant date. The shares vest over three years. Prior to the adoption of SFAS No. 123R, unearned compensation related to the restricted stock was shown as a reduction of stockholders’ equity. The Company adopted SFAS No. 123R using a modified prospective application which requires that any unearned compensation related to awards prior to the adoption of SFAS No. 123R be eliminated against the appropriate equity account on the consolidated balance sheet. Compensation expense is computed based on the market value of the restricted shares at the grant date, which is amortized ratably over the vesting period of the grants. Compensation expense recognized in conjunction with the restricted stock outstanding in 2006, 2005, and 2004 amounted to $243, $184, and $128, respectively.
(14) Related Party Transactions:
In connection with the acquisition of Danfoss Fluid Power on May 3, 2000, the Company entered into several agreements with Danfoss A/S to purchase ongoing operational services from Danfoss A/S. These services include rental of shared facilities, administrative support and information technology support. These fees are paid on a monthly basis. Total expense recognized for goods and services purchased from Danfoss A/S for 2006, 2005, and 2004 was approximately $63,400, $52,900, and $51,800, respectively. At December 31, 2006 and 2005 approximately $10,700 and $8,000 owed to Danfoss A/S is included in accounts payable on the consolidated balance sheet. Payments required under these agreements as of December 31, 2006, during the years ending 2007 though 2011 and 2012 and thereafter, are $7,583, $7,582, $7,580, $7,588, $7,597, and $17,029, respectively.
F-31
Sauer-Danfoss Inc. and Subsidiaries
Notes to Consolidated Financial Statements (Continued)
December 31, 2006, 2005, and 2004
(Dollars in thousands, except per share data)
(14) Related Party Transactions: (Continued)
The Company purchases inventory components from Shanghai Hydraulics and Pneumatics, a minority interest owner in an entity included in the Company’s consolidated financial statements. Purchases were approximately $3,200, $3,300, and, $2,600 in 2006, 2005, and 2004, respectively.
In addition, the Company sold product totaling approximately $4,600, $5,400 and $6,000 in 2006, 2005, and 2004, respectively, to Daikin Industries Ltd. (Daikin), a minority interest owner in an entity consolidated by the Company. The Company also purchases inventory components and ongoing operational services from Daikin. These services include shared facilities and administrative support. Total expense recognized for goods and services purchased from Daikin in 2006, 2005, and 2004 were approximately $5,900, $6,600 and $6,900, respectively.
The Company had advertising expense of $150 in 2004 to sponsor a competitive sailing yacht owned by a director of the Company. In 2005 the Company also contributed $350 to a science park principally sponsored by a shareholder of Danfoss A/S. In addition, the Company had sales to Faun Umwelttechnik GmbH & Co., a company owned by a director, of $1,200, $900 and $800 in 2006, 2005 and 2004, respectively.
(15) Commitments, Contingencies, and Guarantees:
The Company leases certain facilities and equipment under operating leases, many of which contain renewal options. Total rental expense on all operating leases during 2006, 2005, and, 2004 was $18,490, $16,429, and $17,678, respectively. Rent is expensed on a straight-line basis over the term of the leases.
Minimum future rental commitments under all noncancelable operating leases as of December 31, 2006, during the years ending 2007 through 2011 and for 2012 and thereafter, are $10,956, $8,819, $6,730, $3,517, $1,496, and $22,871, respectively.
The Company also leases certain facilities and equipment under capital leases. The liability related to these capital leases is included in current other accrued liabilities and other long-term liabilities on the consolidated balance sheets. Minimum future lease payments under all noncancelable capital leases as of December 31, 2006, during the years ending 2007 through 2011 and for 2012 and thereafter, are $1,131, $1,139, $1,129, $999, $876, and $13,802, respectively.
The Company, from time to time, is involved in various legal matters considered normal in the course of its business. The Company intends to vigorously defend against all such claims. It is the Company’s policy to accrue for amounts related to these matters if it is probable that a liability has been incurred and an amount can be reasonably estimated. Although the outcome of such matters cannot be predicted with certainty and no assurances can be given with respect to such matters, the Company believes that the outcome of these matters in which it is currently involved will not have a materially adverse effect on its results of operations, liquidity or financial position.
F-32
Sauer-Danfoss Inc. and Subsidiaries
Notes to Consolidated Financial Statements (Continued)
December 31, 2006, 2005, and 2004
(Dollars in thousands, except per share data)
(16) Quarterly Financial Data (Unaudited):
Summarized quarterly data is set forth in the following table:
| | Quarter | |
| | First | | Second | | Third | | Fourth | | Total | |
2006 | | | | | | | | | | | |
Net sales | | $ | 483,959 | | $ | 469,856 | | $ | 381,895 | | $ | 403,378 | | $ | 1,739,088 | |
Gross profit | | 115,972 | | 118,475 | | 82,500 | | 79,817 | | 396,764 | |
Net income (loss) | | 25,221 | | 23,510 | | 7,078 | | (2,061 | ) | 53,748 | |
Basic net income (loss) per common share (1) | | $ | 0.54 | | $ | 0.49 | | $ | 0.15 | | $ | (0.04 | ) | $ | 1.13 | |
Diluted net income (loss) per common share (1) | | $ | 0.54 | | $ | 0.49 | | $ | 0.15 | | $ | (0.04 | ) | $ | 1.11 | |
2005 | | | | | | | | | | | |
Net sales | | $ | 422,585 | | $ | 438,096 | | $ | 342,032 | | $ | 345,103 | | $ | 1,547,816 | |
Gross profit | | 98,988 | | 109,376 | | 76,205 | | 73,177 | | 357,746 | |
Net income | | 10,810 | | 19,562 | | 4,292 | | 4,051 | | 38,715 | |
Basic net income per common share | | $ | 0.23 | | $ | 0.41 | | $ | 0.09 | | $ | 0.09 | | $ | 0.82 | |
Diluted net income per common share | | $ | 0.23 | | $ | 0.41 | | $ | 0.09 | | $ | 0.08 | | $ | 0.81 | |
2004 | | | | | | | | | | | |
Net sales | | $ | 361,054 | | $ | 379,117 | | $ | 324,729 | | $ | 339,259 | | $ | 1,404,159 | |
Gross profit | | 87,677 | | 106,187 | | 77,811 | | 74,409 | | 346,084 | |
Net income (loss) | | 11,023 | | 21,607 | | 7,744 | | (7,188 | ) | 33,186 | |
Basic and diluted net income (loss)
per common share | | $ | 0.23 | | $ | 0.46 | | $ | 0.16 | | $ | (0.15 | ) | $ | 0.70 | |
(1) Basic and diluted net income (loss) per common share is computed independently for each of the periods presented. Accordingly, the sum of the quarterly basic and diluted net income (loss) per common share may not agree to the annual total.
(17) Segment and Geographic Information:
The Company reports its operating segments around its various product lines of Propel, Work Function and Controls. Propel products include hydrostatic transmissions and related products that transmit the power from the engine to the wheel to propel a vehicle. Work Function products include steering motors as well as gear pumps and motors that transmit power for the work functions of the vehicle. Controls products include electrohydraulic controls, microprocessors, electric motors, and valves that control and direct the power of a vehicle. Segment costs in Global Services relate to internal global service departments and include costs such as consulting for special projects, tax and accounting fees paid to outside third parties, certain insurance premiums, and amortization of intangible assets from certain business combinations.
F-33
Sauer-Danfoss Inc. and Subsidiaries
Notes to Consolidated Financial Statements (Continued)
December 31, 2006, 2005, and 2004
(Dollars in thousands, except per share data)
(17) Segment and Geographic Information: (Continued)
The accounting policies of the segments are the same as those described in the summary of significant accounting policies. The Company evaluates individual segment performance based on segment income or loss defined as the respective segment’s portion of the total Company’s net income, excluding net interest expense, income taxes, minority interest, and equity in net earnings of affiliates. The following table presents the significant items by operating segment for the results of operations for the years ended December 31, 2006, 2005, and 2004, respectively:
| | Propel | | Work
Function | | Controls | | Global
Services | | Total | |
2006 | | | | | | | | | | | |
Trade sales | | $ | 839,306 | | $ | 471,379 | | $ | 428,403 | | $ | — | | $ | 1,739,088 | |
Segment income (loss) | | 111,762 | | 16,509 | | 42,680 | | (60,553 | ) | 110,398 | |
Interest expense | | | | | | | | | | (18,415 | ) |
Interest income | | | | | | | | | | 654 | |
Minority interest | | | | | | | | | | (21,617 | ) |
Income before income taxes | | | | | | | | | | 71,020 | |
Depreciation and amortization | | 42,822 | | 29,190 | | 18,399 | | 5,254 | | 95,665 | |
Total assets | | 405,847 | | 335,843 | | 242,724 | | 324,741 | | 1,309,155 | |
Capital expenditures | | 42,934 | | 39,050 | | 29,393 | | 4,867 | | 116,244 | |
2005 | | | | | | | | | | | |
Trade sales | | $ | 751,134 | | $ | 430,668 | | $ | 366,014 | | $ | — | | $ | 1,547,816 | |
Segment income (loss) | | 106,376 | | 6,345 | | 31,436 | | (60,140 | ) | 84,017 | |
Interest expense | | | | | | | | | | (17,540 | ) |
Interest income | | | | | | | | | | 1,887 | |
Minority interest | | | | | | | | | | (18,657 | ) |
Income before income taxes | | | | | | | | | | 49,707 | |
Depreciation and amortization | | 38,636 | | 27,408 | | 17,190 | | 5,088 | | 88,322 | |
Total assets | | 397,950 | | 321,738 | | 256,958 | | 194,267 | | 1,170,913 | |
Capital expenditures | | 39,285 | | 33,043 | | 19,454 | | 3,465 | | 95,247 | |
2004 | | | | | | | | | | | |
Trade sales | | $ | 656,482 | | $ | 412,046 | | $ | 335,631 | | $ | — | | $ | 1,404,159 | |
Segment income (loss) | | 89,992 | | 20,840 | | 24,680 | | (47,654 | ) | 87,858 | |
Interest expense | | | | | | | | | | (18,403 | ) |
Interest income | | | | | | | | | | 988 | |
Minority interest | | | | | | | | | | (21,522 | ) |
Income before income taxes | | | | | | | | | | 48,921 | |
Depreciation and amortization | | 34,564 | | 24,466 | | 14,789 | | 8,544 | | 82,363 | |
Total assets | | 417,684 | | 340,272 | | 269,378 | | 184,247 | | 1,211,581 | |
Capital expenditures | | 28,156 | | 21,838 | | 14,122 | | 15,141 | | 79,257 | |
F-34
Sauer-Danfoss Inc. and Subsidiaries
Notes to Consolidated Financial Statements (Continued)
December 31, 2006, 2005, and 2004
(Dollars in thousands, except per share data)
(17) Segment and Geographic Information: (Continued)
A summary of the Company’s net sales and long-lived assets by geographic area is presented below:
| | Net Sales (1) | | Long-Lived Assets (2) | |
| | 2006 | | 2005 | | 2004 | | 2006 | | 2005 | |
United States | | $ | 734,844 | | $ | 679,849 | | $ | 598,007 | | $ | 181,242 | | $ | 174,201 | |
Germany | | 166,756 | | 145,521 | | 134,513 | | 64,743 | | 56,687 | |
Italy | | 118,334 | | 100,641 | | 100,072 | | 31,892 | | 28,222 | |
Denmark (3) | | 19,362 | | 22,747 | | 22,187 | | 192,271 | | 188,109 | |
Other countries | | 699,792 | | 599,058 | | 549,380 | | 175,485 | | 168,603 | |
Total | | $ | 1,739,088 | | $ | 1,547,816 | | $ | 1,404,159 | | $ | 645,633 | | $ | 615,822 | |
(1) Net sales are attributed to countries based on location of customer.
(2) Long-lived assets include property, plant and equipment net of accumulated depreciation, goodwill, intangible assets net of accumulated amortization, and certain other long-lived assets.
(3) Majority of this country’s sales are shipped outside of the home country where the product is produced.
No single customer accounted for 10% or more of total consolidated sales in any year presented.
F-35
Report of Management
Management Oversight
Sauer-Danfoss believes that good corporate governance promotes ethical business practices, demands meticulous accounting policies and procedures, and includes a structure with effective checks and balances. The management of Sauer-Danfoss Inc. is responsible for the integrity and objectivity of the financial information presented in this annual report on Form 10-K. Sauer-Danfoss believes that the consolidated financial statements have been prepared in conformity with accounting principles generally accepted in the United States applying certain estimates and judgments as required.
Our management is responsible for establishing and maintaining a system of internal controls over financial reporting. This system is augmented by written policies and procedures, careful selection and training of financial management personnel, a continuing management commitment to the integrity of the system, and through examinations by an internal audit function that coordinates its activities with the Company’s independent auditors.
Under the supervision and with the participation of our management, including our Chief Executive Officer and Chief Financial Officer, we conducted an evaluation of the effectiveness of our internal controls over financial reporting based on the framework in Internal Control — Integrated Framework issued by the Committee of Sponsoring Organizations of the Treadway Commission (COSO). Based on our evaluation under the framework in Internal Control — Integrated Framework, our management concluded that our internal control over financial reporting was effective as of December 31, 2006.
Independent Oversight
All of our directors are skilled business leaders. The members of the Board and each committee have express authority to retain outside advisors. The Board and each committee perform annual self-evaluations in order to assess their performance and to ensure that the Board and committee structure is providing effective oversight of corporate management.
Our Audit Committee is composed entirely of independent outside directors. The Committee meets periodically with management, the internal auditors, and the independent auditors, both separately and jointly, to discuss internal accounting controls and the quality of financial reporting. To ensure complete independence, the internal auditors and representatives of KPMG LLP have full access to meet with the Audit Committee, with or without management representatives present, to discuss the results of their audits and their opinions on the adequacy of internal controls and the quality of financial reporting. The Audit Committee has the direct responsibility for the appointment of the independent registered accounting firm to be retained for the coming year, subject to stockholder approval.
Disclosure Controls
We have established rigorous procedures to ensure that we provide complete and accurate disclosure in our publicly filed documents. Our Disclosure Committee, made up of key individuals from various corporate functions, has been in place for the past few years. This Committee meets at least quarterly to review public filings, and earnings releases, and to discuss any potential disclosure issues that may arise. We have established a “whistle-blower” hotline for employees, customers, suppliers or any stakeholder anywhere in the world to anonymously submit any concern they may have regarding corporate controls or ethical breaches. All complaints are investigated, and where necessary, concerns involving our financial statements, public disclosures or management are directed to our Audit Committee.
F-36
Code of Legal and Ethical Business Conduct
The Sauer-Danfoss Code of Legal and Ethical Business Conduct is based not just solely on what we have a right to do, but even more importantly, on what is the right thing to do. Annually, we reiterate the vital importance of our Code of Legal and Ethical Business Conduct by requiring employees in key functional areas to certify their compliance with the standards of the Code.
David J. Anderson | | Karl J. Schmidt |
President and Chief Executive Officer | | Executive Vice President and |
| | Chief Financial Officer |
F-37
Report of Independent Registered Public Accounting Firm
To the Shareholders of Sauer-Danfoss Inc.:
We have audited the accompanying consolidated balance sheets of Sauer-Danfoss Inc. and subsidiaries (the Company) as of December 31, 2006 and 2005, and the related consolidated statements of income, stockholders’ equity and comprehensive income and cash flows for each of the years in the three-year period ended December 31, 2006. These consolidated financial statements are the responsibility of the Company’s management. Our responsibility is to express an opinion on these consolidated financial statements based on our audits.
We conducted our audits in accordance with the standards of the Public Company Accounting Oversight Board (United States). Those standards require that we plan and perform the audits to obtain reasonable assurance about whether the financial statements are free of material misstatement. An audit includes examining, on a test basis, evidence supporting the amounts and disclosures in the financial statements. An audit also includes assessing the accounting principles used and significant estimates made by management, as well as evaluating the overall financial statement presentation. We believe that our audits provide a reasonable basis for our opinion.
In our opinion, the consolidated financial statements referred to above present fairly, in all material respects, the financial position of Sauer-Danfoss Inc. and subsidiaries as of December 31, 2006 and 2005, and the results of their operations and their cash flows for each of the years in the three-year period ended December 31, 2006, in conformity with U.S. generally accepted accounting principles.
As disclosed in Notes 1 and 8 to the consolidated financial statements, the Company adopted the provisions of Statement of Financial Accounting Standards No. 158, Employers’ Accounting for Defined Benefit Pension and other Postretirement Plans, on December 31, 2006.
We also audited, in accordance with the standards of the Public Company Accounting Oversight Board (United States), the effectiveness of the Company’s internal control over financial reporting as of December 31, 2006, based on criteria established in Internal Control — Integrated Framework issued by the Committee of Sponsoring Organizations of the Treadway Commission (COSO), and our report dated March 12, 2007, expressed an unqualified opinion on management’s assessment of, and effective operations of, internal control over financial reporting.
/s/ KPMG LLP
Des Moines, Iowa
March 12, 2007
F-38
Report of Independent Registered Public Accounting Firm
The Board of Directors and
Stockholders of Sauer-Danfoss Inc:
We have audited management’s assessment, included in the accompanying Management’s Report on Internal Control Over Financial Reporting appearing under Item 9A, that Sauer-Danfoss Inc. (a Delaware corporation) and subsidiaries (the Company) maintained effective internal control over financial reporting as of December 31, 2006, based on criteria established in Internal Control — Integrated Framework issued by the Committee of Sponsoring Organizations of the Treadway Commission (COSO). The Company’s management is responsible for maintaining effective internal control over financial reporting and for its assessment of the effectiveness of internal control over financial reporting. Our responsibility is to express an opinion on management’s assessment and an opinion on the effectiveness of the Company’s internal control over financial reporting based on our audit.
We conducted our audit in accordance with the standards of the Public Company Accounting Oversight Board (United States). Those standards require that we plan and perform the audit to obtain reasonable assurance about whether effective internal control over financial reporting was maintained in all material respects. Our audit included obtaining an understanding of internal control over financial reporting, evaluating management’s assessment, testing and evaluating the design and operating effectiveness of internal control, and performing such other procedures as we considered necessary in the circumstances. We believe that our audit provides a reasonable basis for our opinion.
A company’s internal control over financial reporting is a process designed to provide reasonable assurance regarding the reliability of financial reporting and the preparation of financial statements for external purposes in accordance with generally accepted accounting principles. A company’s internal control over financial reporting includes those policies and procedures that (1) pertain to the maintenance of records that, in reasonable detail, accurately and fairly reflect the transactions and dispositions of the assets of the company; (2) provide reasonable assurance that transactions are recorded as necessary to permit preparation of financial statements in accordance with generally accepted accounting principles, and that receipts and expenditures of the company are being made only in accordance with authorizations of management and directors of the company; and (3) provide reasonable assurance regarding prevention or timely detection of unauthorized acquisition, use, or disposition of the company’s assets that could have a material effect on the financial statements.
Because of its inherent limitations, internal control over financial reporting may not prevent or detect misstatements. Also, projections of any evaluation of effectiveness to future periods are subject to the risk that controls may become inadequate because of changes in conditions, or that the degree of compliance with the policies or procedures may deteriorate.
In our opinion, management’s assessment that Sauer-Danfoss Inc. and subsidiaries maintained effective internal control over financial reporting as of December 31, 2006, is fairly stated, in all material respects, based on criteria established in Internal Control — Integrated Framework issued by the Committee of Sponsoring Organizations of the Treadway Commission (COSO). Also, in our opinion, the Company maintained in all material respects, effective internal control over financial reporting as of December 31, 2006, based on criteria established in Internal Control — Integrated Framework issued by the Committee of Sponsoring Organizations of the Treadway Commission (COSO).
F-39
We also have audited, in accordance with the standards of the Public Company Accounting Oversight Board (United States), the consolidated balance sheets of Sauer-Danfoss Inc. and subsidiaries as of December 31, 2006 and 2005, and the related consolidated statements of income, stockholders’ equity and comprehensive income and cash flows for each of the years in the three-year period ended December 31, 2006, and our report dated March 12, 2007 expressed an unqualified opinion on those consolidated financial statements.
/s/ KPMG LLP
Des Moines, Iowa
March 12, 2007
F-40
Schedule II
Sauer-Danfoss Inc. and Subsidiaries
Valuation and Qualifying Accounts
Years Ended December 31, 2004, 2005, and 2006
(in thousands)
| | Balance at
Beginning of
Year | | Charged to
Costs and
Expenses | | Receivables
Written Off/
Settlement
of Claims | | Foreign
Currency
Translation
Adjustment | | Balance at
End of
Year | |
For the year ended
December 31, 2004 | | | | | | | | | | | | | | | | | | | | | |
Allowance for doubtful accounts | | | $ | 4,144 | | | | 411 | | | | (147 | ) | | | 263 | | | | $ | 4,671 | | |
For the year ended
December 31, 2005 | | | | | | | | | | | | | | | | | | | | | |
Allowance for doubtful accounts | | | $ | 4,671 | | | | 1,178 | | | | (349 | ) | | | (600 | ) | | | $ | 4,900 | | |
For the year ended
December 31, 2006 | | | | | | | | | | | | | | | | | | | | | |
Allowance for doubtful accounts | | | $ | 4,900 | | | | 1,140 | | | | (613 | ) | | | 278 | | | | $ | 5,705 | | |
F-41
Report of Independent Registered Public Accounting Firm on Financial Statement Schedule
To the Shareholders of Sauer-Danfoss Inc.:
Under date of March 12, 2007, we reported on the consolidated balance sheets of Sauer-Danfoss Inc. and subsidiaries as of December 31, 2006 and 2005, and the related consolidated statements of income, stockholders’ equity and comprehensive income, and cash flows for each of the years in the three-year period ended December 31, 2006, which are included in this Form 10-K. In connection with our audits of the aforementioned consolidated financial statements, we also audited the related consolidated financial statement schedule as listed in Item 15.(a)(2) of this Form 10-K. This financial statement schedule is the responsibility of the Company’s management. Our responsibility is to express an opinion on the financial statement schedule based on our audits.
In our opinion, the financial statement schedule, when considered in relation to the 2006, 2005, and 2004 basic consolidated financial statements taken as a whole, presents fairly, in all material respects, the information set forth therein.
Our report dated March 12, 2007, notes that the Company adopted the provisions of Statement of Financial Accounting Standards No. 158, Employers’ Accounting for Defined Benefit Pension and Other Postretirement Plans, on December 31, 2006.
We also audited, in accordance with the standards of the Public Company Accounting Oversight Board (United States), the effectiveness of the Company’s internal control over financial reporting as of December 31, 2006, based on criteria established in Internal Control — Integrated Framework issued by the Committee of Sponsoring Organizations of the Treadway Commission (COSO), and our report dated March 12, 2007, expressed an unqualified opinion on management’s assessment of, and effective operation of, internal control over financial reporting.
/s/ KPMG LLP
Des Moines, Iowa
March 12, 2007
F-42