UNITED STATES
SECURITIES AND EXCHANGE COMMISSION
Washington, D.C. 20549
FORM 10-K
| x | ANNUAL REPORT PURSUANT TO SECTION 13 OR 15(d) OF THE SECURITIES EXCHANGE ACT OF 1934 |
| For the fiscal year ended December 31, 2009 |
| |
| o | TRANSITION REPORT PURSUANT TO SECTION 13 OR 15(d) OF THE SECURITIES EXCHANGE ACT OF 1934 |
| |
| For the transition period from ____________ to ______________ |
| | |
Commission File Number 0-18731
FORLINK SOFTWARE CORPORATION, INC.
(Exact name of Registrant as specified in its charter)
| Nevada | 98-0398666 |
| (State or other jurisdiction of | (I.R.S. Employer Identification No.) |
| incorporation or organization) | |
| 9F Shenzhou Mansion, No. 31 | N/A |
| ZhongGuanCun South Road | (Zip Code) |
| Haidian District, Beijing, P.R. China | |
| (Address of principal executive offices) | |
| (0086) 10 6811 8866 |
| (Issuer's telephone number, including area code) |
| |
| Securities registered pursuant to Section 12(b) of the Act: |
| | |
| Title of each class | Name of each exchange on which registered |
| None | None |
| | |
| Securities registered pursuant to Section 12(g) of the Act: |
Title of Class Common Stock, $.001 par value |
Indicate by check mark if the registrant is a well-known seasoned issuer, as defined in Rule 405 of the Securities Act. Yes o No x
Indicate by check mark if the registrant is not required to file reports pursuant to Section 13 or 15(d) of the Act. Yes o No x
Indicate by check mark whether the registrant (1) has filed all reports required to be filed by Section 13 or 15(d) of the Securities Exchange Act of 1934 during the preceding 12 months (or for such shorter period that the registrant was required to file such reports), and (2) has been subject to such filing requirements for the past 90 days. Yes x No o
Indicate by check mark whether the registrant has submitted electronically and posted on its corporate Web site, if any, every Interactive Data File required to be submitted and posted pursuant to Rule 405 of Regulation S-T (§ 232.405 of this chapter) during the preceding 12 months (or for such shorter period that the registrant was required to submit and post such files). Yes o No o
Indicate by check mark if disclosure of delinquent filers pursuant to Item 405 of Regulation S-K (§229.405 of this chapter) is not contained herein, and will not be contained, to the best of registrant's knowledge, in definitive proxy or information statements incorporated by reference in Part III of this Form 10-K or any amendment to this Form 10-K. x
Indicate by check mark whether the registrant is a large accelerated filer, an accelerated filer, a non-accelerated filer, or a smaller reporting company. See the definitions of “large accelerated filer”, “accelerated filer” and “smaller reporting company” in Rule 12b-2 of the Exchange Act.
Large accelerated filer o Accelerated filer o
Non-accelerated filer o Smaller reporting company x
Indicate by check mark whether the registrant is a shell company (as defined in Rule 12b-2 of the Exchange Act). Yes o No x
The aggregate market value of the voting and non-voting common equity held by non-affiliates of the registrant on June 30, 2009 was approximately $2,790,704. The per share stock price for computational purposes was $0.60, based on the closing sale price per share for the registrant's common stock as reported on the OTC Bulletin Board on such date. This value is not intended to be a representation as to the value or worth of the registrant's common stock. The number of non-affiliates of the registrant has been calculated by subtracting the number of shares held by persons affiliated with the registrant from the number of outstanding shares.
The number of shares of the registrant's common stock, $.001 par value, outstanding on March 22, 2010 was 4,651,173 shares.
TABLE OF CONTENTS
TO ANNUAL REPORT ON FORM 10-K
FOR YEAR ENDED DECEMBER 31, 2009
| | Page |
| PART I | | |
| Item 1. | Business | 4 |
| Item 1A. | Risk Factors | 12 |
| Item 1B. | Unresolved Staff Comments | 13 |
| Item 2. | Properties | 13 |
| Item 3. | Legal Proceedings | 13 |
| | | |
| PART II | | |
| Item 5. | Market for Registrant's Common Equity, Related Stockholder Matters and Issuer Purchases of Equity Securities | 14 |
| Item 6. | Selected Financial Data | 14 |
| Item 7. | Management’s Discussion and Analysis or Plan of Operation | 15 |
| Item 7A. | Quantitative and Qualitative Disclosures About Market Risk | 22 |
| Item 8. | Financial Statements and Supplementary Data Changes in and Disagreements with Accountants on Accounting and Financial Disclosure | 22 |
| Item 9. | Changes in and Disagreements With Accountants on Accounting and Financial Disclosure | 24 |
| Item 9A(T). | Controls and Procedures | 24 |
| Item 9B. | Other Information | 25 |
| | | |
| PART III | | |
| Item 10. | Directors, Executive Officers and Corporate Governance | 25 |
| Item 11. | Executive Compensation | 27 |
| Item 12. | Security Ownership of Certain Beneficial Owners and Management and Related Stockholder Matters | 28 |
| Item 13. | Certain Relationships and Related Transactions, and Director Independence | 28 |
| Item 14. | Principal Accountant Fees and Services | 29 |
| Item 15. | Exhibits, Financial Statement Schedules | 30 |
| | | |
| Signatures | | 31 |
CAUTIONARY NOTES REGARDING
FORWARD LOOKING INFORMATION
Readers of this document and any document incorporated by reference herein, are advised that this document and documents incorporated by reference into this document contain both statements of historical facts and forward looking statements. Forward looking statements are subject to certain risks and uncertainties, which could cause actual results to differ materially for those indicated by the forward-looking statements. Forward-looking statements usually contain the words “estimate,” “anticipate,” “believe,” “expect,” or similar expressions, and are subject to numerous known and unknown risks and uncertainties. Examples of forward looking statements include, but are not limited to (i) projections of revenues, income or loss, earning or loss per share, capital expenditures, dividends, capital structure and other financial items, (ii) statements of the plans and objectives of the Company or its management or board of directors, including the introduction of new products, or estimates or predictions of actions by customers, suppliers, competitors or regulatory authorities, (iii) statements of future economic performance, and (iv) statements of assumptions underlying other statements and statements about the Company or its business.
This document and any documents incorporated by reference herein also identify important factors which could cause actual results to differ materially from those indicated by forward looking statements. These risks and uncertainties include price competition, the decisions of customers, the actions of competitors, the effects of government regulation, possible delays in the introduction of new products and services, customer acceptance of products and services, the Company's ability to secure debt and/or equity financing on reasonable terms, and other factors which are described herein and/or in documents incorporated by reference herein.
The cautionary statements made above and elsewhere by the Company should not be construed as exhaustive or as any admission regarding the adequacy of disclosures made by the Company. Forward looking statements are beyond the ability of the Company to control and in many cases the Company cannot predict what factors would cause results to differ materially from those indicated by the forward looking statements. Unless otherwise required by applicable law, we do not undertake, and we specifically disclaim any obligation, to update any forward looking statements to reflect occurrences, developments, unanticipated events or circumstances after the date of such statement.
PART I
Overview
Forlink Software Corporation, Inc. (the "Company" or the "Registrant" or "Forlink" or "we" or "us") is in the business of providing e-business application solutions and IT outsourcing services in the People’s Republic of China (“PRC” or “China”). Through our subsidiaries, we offer our clients business information management consulting and planning, application software design, agency and integrated application services for the third party’s software and other online application services. We also offer the “For”-series of software products. Our clients are mainly in the telecom and logistics industries, as well as government agencies. We have also invested in companies in logistics, finance and information technology (IT) industries. The application platforms used by these companies are supported by our integrated application systems, software and IT outsourcing services. Our headquarters are located in Beijing, with branch offices in Chengdu, Nanning, Shanghai and Guangzhou. We also have a research and development (“R&D”) center located in Chengdu.
Company Organization and History
We are a Nevada corporation which was originally incorporated on January 7, 1986 as "Why Not?, Inc." under the laws of the State of Utah and subsequently reorganized under the laws of Nevada on December 30, 1993. From 1996 until 1999, the Company continued as an unfunded venture in search of a suitable business acquisition or business combination.
On November 3, 1999, we entered into a Plan of Reorganization with Beijing Forlink Software Technology Co., Ltd., (hereinafter "BFSTC"), a limited liability company organized under the laws of the PRC, under the terms of which BFSTC gained control of the Company. Pursuant to the Plan of Reorganization, we acquired 100% of the registered and fully paid-up capital of BFSTC in exchange for 20,000,000 shares of the Company's authorized, but unissued, common stock. BFSTC is engaged in the provision of computer software consultancy and engineering services and the development and sale of computer software in the PRC. As a part of its computer consultancy and engineering services, BFSTC is also engaged in the sale of computer hardware. In June 2001, BFSTC changed its name to Forlink Technologies Co. Ltd. (“FTCL”). FTCL is our major operating subsidiary in China.
In August 2001, we acquired Beijing Slait Science & Technology Development Limited Co. (“SLAIT”) pursuant to a Plan of Reorganization dated January 11, 2001. We issued 59,430,000 shares of our common stock to SLAIT’s original owners in exchange for 100% of the outstanding equity of SLAIT. As a result of the share exchange, the former owners of SLAIT own approximately 70% of the issued and outstanding shares of the Company, and SLAIT became a wholly-owned subsidiary of the Company. We also agreed to transfer 1,085,000 Renminbi (“RMB”) (approximately US$131,039) to the former owners of SLAIT. A change in control occurred in which all but one of the officers and directors of the Company resigned and two former directors (also former owners) of SLAIT became officers and directors of the Company. Prior to its dissolution in 2004, SLAIT provided application system integration technology and specializes in large volume transaction processing software for networks such as mobile phone billing and band operation. Subsequent to our acquisition, the principal activities of SLAIT were gradually shifted to those of FTCL. On February 13, 2004, SLAIT was officially dissolved in accordance with relevant PRC regulations.
On June 18, 2003, Forlink Technologies (Hong Kong) Limited (“FTHK”) was incorporated in Hong Kong Special Administrative Region as a limited liability company. In December 2003, FTHK became a wholly owned subsidiary of Forlink. FTHK is an investment holding company. Because of the favorable business environment in Hong Kong, we can simplify and speed up investment transactions through this subsidiary. Through FTHK, on December 18, 2003, we invested $760,870 in All China Logistics Online Co., Ltd. ("All China Logistics"), a privately held PRC company and a leading provider of logistic services in China, in exchange for a 17.8% equity interest. Through this investment, we have become the second largest shareholder of All China Logistics and its sole software solution provider. FTHK is also responsible for directly importing from overseas companies certain hardware needed for product integration, which allows us to improve our hardware pass-through profit margin.
On June 14, 2004, Forlink Technologies (Chengdu) Limited ("FTCD") was established as a limited liability company in Chengdu, PRC and subsequently became a wholly owned subsidiary of FTHK in September 2004. FTCD is in the business of providing software outsourcing services and software development. The registered capital of FTCD is $5,000,000 and the fully paid up capital was $750,000 as of December 31, 2005. In April 2006, FTHK further invested $130,000 in FTCD. FTCD commenced operations in late 2005. The registered capital of FTCD was reduced to $200,000 in December 2007.
In compliance with China’s foreign investment restrictions on telecom value-added services and other laws and regulations, we conduct our telecom value-added services and application integration services for government organizations in China via Beijing Forlink Hua Xin Technology Co. Ltd. ("BFHX"). BFHX was established in the PRC on September 19, 2003 as a limited liability company. The registered capital of BFHX is $120,733 (RMB 1,000,000) and was fully paid up as of March 31, 2005. Mr. Yi He and Mr. Wei Li have been entrusted as nominee owners of BFHX to hold 70% and 30%, respectively, of the fully paid up capital of BFHX on behalf of Forlink as the primary beneficiary. BFHX is considered a Variable Interest Entity ("VIE"), and because we are the primary beneficiary, our consolidated financial statements include BFHX. Upon the request of the Company, Mr. Yi He and Mr. Wei Li are required to transfer their ownership in BFHX to us or our designee at any time for the amount of the fully paid registered capital of BFHX. Mr. Yi He is the Chief Executive Officer, a director and a major stockholder of the Company. Mr. Wei Li is the administration manager of FTCL.
On October 24, 2005, we entered into a definitive agreement to acquire a 17.5% equity interest from China Liquid Chemical Exchange Company Limited (“CLCE”), a PRC limited liability company. Under the terms of the agreement, Forlink deployed the “For-online Electronic Trading System”, a proprietary, integrated software solution, to support CLCE’s operations, including, but not limited to, online trading, online billing and payment, user authentication and customer care, in exchange for the 17.5% equity interest. In early 2007, CLCE increased its share capital to $1,708,526 (RMB 13,000,000). As we did not subscribe for the new shares, our shareholding of CLCE was diluted and as of December 31 2008 was 13.46%. CLCE commenced operations fully in early 2007.
On October 3, 2006, we entered into a Transfer of Right to Invest and Project Cooperation Agreement (“Statelink Agreement”) with Statelink International Group, Ltd., a British Virgin Islands company (“Statelink”), pursuant to which we acquired 22.73% registered capital in Guangxi Caexpo International Trade and Logistics Co., Ltd. (“Guangxi Caexpo”), a PRC limited liability company in the businesses of real estate development, advertising and computer distribution, for cash consideration of $2,557,545 (RMB 20,000,000) from BFHX and stock consideration of 13,000,000 shares of our restricted common stock. Thereafter, we also won a contract from Guangxi Caexpo to build an “Electronic Trade and Logistics Information Platform and Call Center” (the “Project”). On October 26, 2006, BFHX established Forlink Technologies (Guangxi) Limited (“FTGX”), a PRC limited liability company and wholly owned subsidiary, to carry out this contract. At the time of incorporation, BFHX injected RMB 20,000,000 (approximately US$2,557,545) as registered capital to FTGX. The Project was completed in the fourth quarter of 2007, and with the successful deployment of the relevant software, the client signed the final inspection report in January 2009. FTGX now maintains the Project’s software.
On October 12, 2006, we invested $31,969 (RMB 250,000) in Wuxi Stainless Steel Exchange Co., Ltd. (“Wuxi Exchange”), a PRC limited liability company, for a 12.5% equity interest. In addition, we agreed to deploy a proprietary, integrated software solution, estimated at RMB 1,000,000, to support Wuxi Exchange’s operations. The software was deployed in February 2007. On January 14, 2007, the Company entered into an agreement with a major shareholder of Wuxi Exchange pursuant to which the Company transferred 2.5% of the Company’s interest in Wuxi Exchange to this major shareholder for a cash payment of RMB 500,000.
On January 25, 2007, our board of directors and the majority holders of the Company’s common stock jointly approved an amendment to our Articles of Incorporation by written consent, to increase the number of authorized shares of common stock from 100,000,000 to 200,000,000. The Certificate of Amendment to our Articles of Incorporation to effect the increase of the number of our authorized common shares was filed with Nevada’s Secretary of State on April 4, 2007.
On April 29, 2007, we invested, through BFHX, $138,158 (RMB 1,050,000) in Beijing GuoXin Forlink Internet Technologies Limited (“BGXF”), a privately held PRC company that operates a finance study website, for a 35% equity interest. The investment in BGXF is accounted for under the equity method of accounting due to the Company’s significant influence over the operational and financial policies of BGXF. BGXF commenced operations on March 9 2008. On October 14, 2008, BGXF increased its registered capital to RMB 4,285,700, and since we did not invest additional funds into BGXF, the ratio of our holding was diluted to a 24.5% equity interest.
On July 12, 2007, we invested through FTGX, $1,063,830 (RMB 8,000,000) in Nanning Bulk Commodities Exchange Corporation Limited (“NNBCE”), a privately held PRC company, for an 80% equity interest. NNBCE became a subsidiary of FTGX. NNBCE, established on April 29, 2007, commenced operations on March 28, 2008, and provides logistical e-commerce service.
On September 5, 2007, we invested through NNBCE, $465,425 (RMB 3,500,000) in Guangxi Bulk Sugar & Ethanol Exchange Corporation Limited (“GBSEE”), a PRC limited liability company established on September 12, 2007, for a 35% equity interest. On the same date, All China Logistics was entrusted to hold 20% of the fully paid up capital of GBSEE on behalf of NNBCE as the primary beneficiary. Upon the request of NNBCE, All China Logistics is required to transfer its ownership interests in GBSEE to NNBCE or its designees at any time for the amount of the 20% fully paid up capital. In accordance with Financial Accounting Standards Board (“FASB”) Interpretation No. 46R “Consolidation of Variable Interest Entities - An Interpretation of ARB No. 51” (“FIN 46R”), NNBCE is deemed to hold the primary beneficial interest of the 55% equity interest in GBSEE. GBSEE was established to provide logistical e-commerce service, but it was dissolved on December 16, 2007 before it commenced any operations, and NNBCE received payments back of its investment in GBSEE of $410,397 (RMB 3,000,000) in December 2007; $66,211 (RMB 484,000) in February 2008, and $2,189 (RMB 16,000) in September 2008.
On December 24, 2007, our board of directors and the majority holders of the Company’s common stock jointly approved an amendment to our Articles of Incorporation by written consent, to effect a 1-for-20 reverse stock split. The Certificate of Amendment to our Articles of Incorporation to effect the reverse split was filed with Nevada’s Secretary of State on February 21, 2008.
On March 20, 2008, Forlink invested $71,124 (RMB 500,000), through BFHX, in Shandong LongDong Internet Technologies Limited (“SDLD”), a PRC limited liability company, established on October 24, 2007, for a 5% equity interest. SDLD, which commenced operations in December 2007, is in the business of providing of providing primary products e-commerce services. The purpose of the investment is to gain cash dividends from SDLD.
On February 8, 2010, the Company transferred all its ownership interests in FTCL to BFHX for the amount of FTCL’s 100% fully paid up capital.
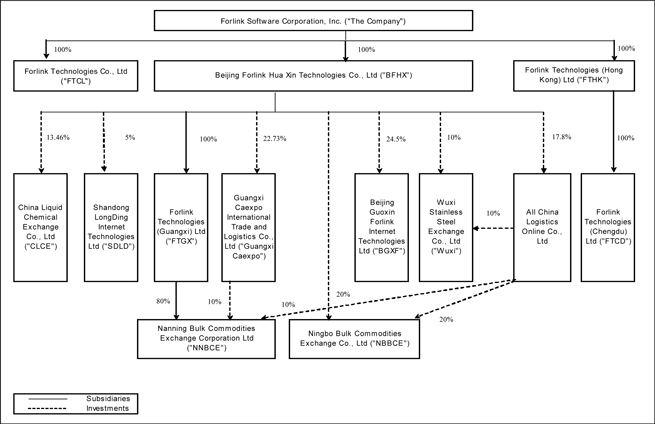
Forlink and its subsidiaries are all operating companies, and during the reporting period, none of the companies’ operations were discontinued or dissolved. Set forth below is a diagram illustrating our corporate structure as of December 31, 2009:
Employees
As of December 31, 2009, we had 181 employees, of which 180 are full-time. Approximately 127 of our full-time employees are software and information technology specialists engaged in research and development, maintenance and support activities. The remaining employees are sales, marketing and administrative personnel. As an incentive, we have created employee stock option plans that include vesting provisions designed to encourage long-term employment.
Products and Solutions
Our application solutions are developed on Enterprise Application Integration (EAI) platforms. Our current product offerings include:
| For-EAI: For-EAI is an e-business application integration platform based on SOA, including basic components (SSO, workflow, etc.) and product components (For-Mail, ForCRM, ForOA, etc.) and mobile-commerce application technologies. Now all of our industry application solutions are developed on For-EAI. |
| For-Online: For-Online is a SaaS operating platform designed to deliver application services over the internet. The applications that can be delivered over the internet include many of our flagship products such as ForOA and ForCRM. |
| For-eMarket: Forlink bulk stock electronic transaction system is an online exchange system designed to facilitate the matching of vendors and sellers on electronic trading market. |
| ForOSS: Forlink Operation Support System is our solution for Business & Operation Support Systems (BSS/OSS) for e-business carriers and telecom carriers, and is consist of software products designed to support existing and expanding business operations of these companies. ForOSS supports billing, customer care, customer relation management, accounting, decision support and other internal functionalities. |
Distribution Methods of the Products and Services
We mainly sell our products and services directly to our customers. We also utilize distribution partners to sell our products and services.
Research and Development
We are committed to continuously research, design and develop information technology solutions and software products that meet the needs of our customers. Our Chengdu R&D center was established in February 1998. As of December 31, 2009, we had 52 employees at the Chengdu R&D Center. Our R&D expenses in 2009 and 2008 were $1,039,742 and $639,927, respectively.
Status of New Product or Service
We released For-EAI 5.0 and For-Online 5.0 in June 2009. The strengths of For-EAI 5.0 include function integration, data integration and business integration. We have also added more co-operating products and cell phone terminal components on For-EAI 5.0. We plan to develop more product components and application solutions based on For-EAI 5.0 and For-Online 5.0 in 2010.
Market Opportunities
Based on our extensive market research and industry insights, we believe that the major market opportunities for our business include the following: industry application integration; industry SaaS (software-as-a-Service); and mobile-commerce applications.
Our Strategy
As a professional software-solutions and technology service company, our business objective is to become a leading e-business application solutions and online application services provider in China. Our operating strategy is to use shared core technologies and management systems to identify potential clients, and through consistent long-term technology supports, build tight strategic partnerships with our clients.
The key aspects of our strategy include the following:
| · | Establish a unified and standard software engineering and project management system to provide assurance for designing high-quality software products and services. As an important milestone, we have achieved Level 3 (Managed Level of Software Process Maturity) of Capability Maturity Model® Integration (CMMI), which was certified by the Software Engineering Institution. |
| · | Establish a unified e-business application platform and online services platform. We provide support for e-business application technologies and platforms in different industries, and strive to make available to our clients’ high-quality IT outsourcing services that are cost-effective. To that end, we have made gradual improvements to the power and reliability of our For-Online platform since 2004, culminating with the launch in August 2007 of For-Online 4.0. |
| · | Participate in our clients’ e-business application operations to become their strategic partner. We have invested in several companies in logistics, finance, IT industries, whose application platforms are supported by our integrated application systems, software and IT outsourcing services. These companies include NNBCE, CLCE, BGXF, NBBCE, and Wuxi Stainless Steel Exchange Co., Ltd. |
Our Competitive Strengths
· Professional Software Development and Services System.
Our professional software development and services system has substantially strengthened our competitive advantages by ensuring that we are in compliance with all relevant international standards and regulations for business. We have passed the ISO9001:2000 international quality assurance system certification and the CMMI Level 3 certification, certifying that our software development and services system is in compliance with international standards. We have passed system integration Level 2 certification.
· Seventeen Years of Experience in Industry Applications with Proven Solutions and Products.
Forlink has developed core application software products such as For-eMarket, ForCRM, ForOSS and ForROA based on standardized application integration technologies. Our customers, strategic partners and suppliers recognize our company as a dependable provider of high quality services, solutions and products, and frequently recommend us to their business contacts.
| · | Established Customer Relationships. |
Because of our successful track record, we have established relationships with leading companies in telecom, logistic, finance, government, and other industry verticals in China. Our in-depth understanding of their requirements allows us to successfully deliver customized solutions. Moreover, we have strong customer service and research and development teams based in China, which allows us to respond quickly and efficiently to the needs of our clients.
· A Strong and Stable Management Team.
The current management team has been with Forlink since we commenced business, and includes pioneers of enterprise application integration (EAI) technologies in China. The backgrounds of the individuals in our management team offer a breadth of knowledge and experience that covers all aspects relating to the control and development of EAI systems. Beyond expertise in the field, their close working relationships with major long-term clients demonstrate a proven ability to sustain and cultivate a successful business.
Our Strategic Partners
Strategic partnerships are essential elements of our business model. At this time, we have three types of partners that contribute to the continuing success of our business.
| Technology Development Partners. These partners provide technology (through licensing or other arrangements) for our solutions or for joint development. Our major technology development partners include HP, Oracle, BEA, IONA, Redhat and Redflag-linux. |
| Marketing and Product Partners. These partners provide products and/or technology that are bundled with our solutions and products for marketing purposes. Our marketing and product partners include HP, Intel, IBM, Oracle, Lenovo and Digital China. |
| Distribution Partners. These partners distribute our solutions and products to our customers. Our current distribution partner is Beijing Federal. |
Competitive Conditions
The market for information technology services in China is rapidly growing and changing. We compete with domestic companies. Our principal competitors in application integration services include AsiaInfo and Digital China. Our principal competitors in the SaaS field include UFSOFT and MYCRM. All of these companies are leading companies in the Chinese IT industry.
Government Regulations
The Chinese government has generally encouraged the development of the information technology industry, and the products and services we offer are currently subject to PRC government regulations.
The State Council of the PRC (the “State Council”) promulgated the Regulations on the Protection of Computer Software (the “Software Protection Regulations”) in December 2001, which became effective in January 2002. The Software Protection Regulations were promulgated, among other things, to protect the copyright of computer software in China. According to the Software Protection Regulations, computer software that is independently developed and exists in a physical form or is attached to physical goods will be protected. However, such protection does not apply to any ideas, mathematical concepts, processing and operation methods used in the development of software solutions.
Under the Software Protection Regulations, PRC citizens, legal persons and organizations enjoy copyright protection over computer software they have developed, regardless of whether the software has been published. Other developers may enjoy PRC copyright protection over computer software they have developed if such computer software was first distributed in China, or in accordance with a bilateral agreement between China and the developer’s country of citizenship or residence, or in accordance with an international treaty to which China is a party.
Under the Software Protection Regulations, owners of software copyright protection enjoy rights of publication, authorship, modification, duplication, issuance, lease, transmission on the information network, translation, licensing and transfer. Software copyright protection takes effect on the day of completion of the software’s development.
For software developed by legal persons and other organizations, software protection extends until December 31st of the fiftieth year from the date the software solution was first published. However, the Software Protection Regulations will not protect the software unless it is published within 50 years of the completion of its development. Licensing agreements may allow others to exploit the software copyright, but exclusive licenses must be in writing. A written contract is also required to transfer any software copyright.
Civil remedies available under the Software Protection Regulations against infringements of copyright include cessation of the infringement and elimination of its effects, an apology and compensation for losses. The administrative department of copyright may order the infringer of a software copyright to stop all infringing acts, confiscate illegal gains, confiscate and destroy infringing copies, and impose a fine on the infringer under certain circumstances. Disputes regarding infringements of software copyright may be settled through mediation, arbitration, or the PRC courts directly.
Dependence on Major Customers
For the year ended December 31, 2009, approximately 49% of the Company's total net revenues were generated by two customers, Beijing Mobile Communication Company (“Beijing Mobile”) and Guangxi Caexpo International Trade and Logistics Co., Ltd (“Guangxi Caexpo”). The loss of any or both of these customers could have a material adverse effect on our business.
Our largest customer has been Guangxi Caexpo. We won the contract in 2006 to build the Electronic Trade and Logistics Information Platform and Call Center. The revenue from hardware integration sales was recognized in 2009.
During the year ended December 31, 2009, sales to Guangxi Caexpo totaled $2,218,118, which accounted for 35% of our total revenue for the period.
Although we are an important strategic IT partner of Guangxi Caexpo, we do not have long-term contracts with Guangxi Caexpo. All of our agreements with Guangxi Caexpo are for short-term projects or sales of third-party hardware. While we feel that our significant relationships with Guangxi Caexpo will likely provide additional sales agreements in the future, Guangxi Caexpo is not contractually bound to purchase any products or services from us. The loss of this customer could hurt our business by reducing our revenues and profitability.
Our second largest customer in 2009 was Beijing Mobile. Since 1998, we have been developing and maintaining the carrier’s BOSS. BOSS is an integrated software platform and it is developed in stages to accommodate the carrier’s increasing subscribers and service offerings. We completed phase one in 2002, phrase two in 2006 and phrase three in 2007. We are currently continuing to maintain phases one, two and three.
Patents, Intellectual Property, and Licensing
We rely on a combination of patents, copyrights, trademarks, trade secrets, confidentiality agreements, and other contractual restrictions with employees and third parties to establish and protect our proprietary rights. Despite these precautions, the measures we undertake may not prevent misappropriation or infringement of our proprietary technology. These measures may not preclude competitors from independently developing products with functionality or features similar to our products.
As of December 31, 2009, we have been issued 59 patents in the PRC that are currently in force. We also have 2 patent applications submitted for review and approval. The normal expiration dates of our issued patents in the PRC range from 2026 to 2030. It is possible that we will not receive patents for applications that we have submitted and those that we plan to file in the future. Furthermore, our issued patents may not adequately protect our technology from infringement or prevent others from claiming that our products infringe the patents of those third parties. Our failure to protect our intellectual property could materially harm our business. In addition, our competitors may independently develop similar or superior technology, duplicate our products, or design around our patents. It is possible that litigation may be necessary in the future to enforce our intellectual property rights, to protect our trade secrets, or to determine the validity and scope of the proprietary rights of others. Litigation could result in substantial costs and diversion of resources and could materially harm our business.
Some of our products are designed to include software or other intellectual property licensed from third parties. While it may be necessary in the future to seek or renew licenses relating to various aspects of our products, we believe that such licenses generally could be obtained on commercially reasonable terms. However, failure to obtain such licenses on commercially reasonable terms could materially harm our business.
Environmental Matters
None.
Item 1A. Risk Factors.
In addition to the other information in this report, the following factors should be considered in evaluating our business and our future prospects:
POLITICAL AND ECONOMIC POLICIES OF THE CHINESE GOVERNMENT COULD AFFECT OUR INDUSTRY IN GENERAL AND OUR COMPETITIVE POSITION IN PARTICULAR
Since the establishment of the People's Republic of China in 1949, the Communist Party has been the governing political party in the PRC. The highest bodies of leadership are the Politburo of the Communist Party, the Central Committee and the National People's Congress. The State Council, which is the highest institution of government administration, reports to the National People's Congress and has under its supervision various commissions, agencies and ministries, including The Ministry of Information Industry and the telecommunications regulatory body of the Chinese government. Since the late 1970s, the Chinese government has been reforming the Chinese economic system. Although we believe that economic reforms and the macroeconomic measures adopted by the Chinese government have had and will continue to have a positive effect on economic development in China, there can be no assurance that the economic reform strategy will not from time to time be modified or revised. Such modifications or revisions, if any, could have a material adverse effect on the overall economic growth of China and investment in the Internet and the telecommunications industry in China. Such developments could reduce, perhaps significantly, the demand for our products and services. There is no guarantee that the Chinese government will not impose other economic or regulatory controls that would have a material adverse effect on our business. Furthermore, changes in political, economic and social conditions in China, adjustments in policies of the Chinese government or changes in laws and regulations could affect our industry in general and our competitive position in particular.
THE GROWTH OF OUR BUSINESS IS DEPENDENT ON GOVERNMENT TELECOMMUNICATIONS INFRASTRUCTURE AND BUDGETARY POLICY, PARTICULARLY THE ALLOCATION OF FUNDS TO SUSTAIN THE GROWTH OF THE TELECOMMUNICATIONS INDUSTRY IN CHINA
Virtually all of our large customers are directly or indirectly owned or controlled by the government of China. Accordingly, their business strategies, capital expenditure budgets and spending plans are largely decided in accordance with government policies, which, in turn, are determined on a centralized basis at the highest level by the National Development and Reform Commission of China. As a result, the growth of our business is heavily dependent on government policies for telecommunications and internet infrastructure. Insufficient government allocation of funds to sustain the growth of China's telecommunications industries in the future could reduce the demand for our products and services and have a material adverse effect on our ability to grow our business.
CURRENCY EXCHANGE RATE RISK DUE TO FLUCTUATIONS IN THE EXCHANGE RATE BETWEEN U.S. DOLLARS AND RENMINBI
The functional currency of our operations is Renminbi (“RMB”) and our financial statements are expressed in U.S. dollars (“USD”). As a result, we are subject to the effects of exchange rate fluctuations between these currencies. In July 2005, the Chinese government announced that it would no longer peg its currency exclusively to USD but instead would switch to a managed floating exchange rate based on market supply and demand with reference to a basket of currencies determined by the People’s Bank of China. The exchange rate of RMB to USD changed from RMB 8.28 to RMB 7.82 in late December 2006. Any future devaluation of the RMB against the USD may have an adverse effect on our reported net income. As our operations are conducted in the PRC, substantially all our revenues, expenses, assets and liabilities are denominated in RMB. In general, our exposure to foreign exchange risks should be limited. However, the value in our shares may be affected by the foreign exchange rate between the USD and the RMB because the value of our business is effectively denominated in RMB, while our shares are traded in USD. Furthermore, a decline in the value of RMB could reduce the USD equivalent of the value of the earnings from, and our investment in, our subsidiaries in the PRC; while an increase in the value of the RMB may require us to exchange more USD into RMB to meet the working capital requirements of our subsidiaries in China. Depreciation of the value of the USD will also reduce the value of the cash we hold in USD, which we may use for purposes of future acquisitions or other business expansion. We actively monitor our exposure to these risks and adjust our cash position in RMB and USD when we believe such adjustments will reduce risks.
GENERAL RISK OF FINANCING
In order for the Company to meet its continuing cash requirements and to successfully implement its growth strategy, the Company will need to rely on increased future revenues and/or will require additional financing. In the event additional financing is required, no assurances can be given that such financing will be available in the amount required or, if available, that it can be on terms satisfactory to the Company.
RISK OF CHINESE ECONOMIC SLOW DOWN
The Chinese economy has recently experienced a slowing of its growth rate. The slow-down has been exacerbated by the recent global crisis in the financial services and credit markets, which has resulted in significant volatility and dislocation in the global capital markets. It is still uncertain how long the global crisis in the financial services and credit markets will continue and how much adverse impact it will have on the global economy in general or the Chinese economy in particular. Slowing economic growth in China could result in slowing growth for China’s major telecommunications carriers, which are our major customers, as well as slowing growth for enterprises and government entities that buy our IT software products and services. Any such adverse conditions for our customers could reduce their demand for our software and services and therefore reduce our revenues.
Item 1B. Unresolved Staff Comments.
Not applicable.
Item 2. Description of Property.
We have an office in Chengdu, PRC, which houses FTCD. The building is located at B-16B, Wangfujing Business Mansion, No.5 Huaxingzheng Street, Chengdu, Sichuan Province, PRC, and was purchased on behalf of the Company by Mr. Yi He, our Chief Executive Officer. By a stockholders’ resolution passed on March 8, 1999, it was ratified that the title to the building belongs to the Company. In 2005, the title to the building was transferred to FTCD.
We currently rent office space of approximately 2,027 square meters that serves as our headquarters at 9/F Shenzhou Mansion, No. 31 Zhongguancun Street, Haidian District, Beijing, China. We have a renewable lease agreement for these premises until March 29, 2011. The total rent from March 30, 2009 to March 29, 2011 is $770,457 (RMB 5,326,944).
In addition, we currently have three regional field support offices in the PRC, namely, in Shanghai, Chengdu and Guangzhou. The leases for these offices are as follows:
| Name | | Rent Period | | Size (in m2) | | Annual Rent |
| Guangzhou Office | | 3/01/2010 – 2/28/2011 | | 45.00 | | $2,455 (RMB 16,800) |
| Shanghai Office | | 4/01/2009 – 3/31/2010* | | 95.15 | | $7,015(RMB48,000) |
| Chengdu R&D Center | | 11/22/2009 – 11/21/2010 | | 602.59 | | $35,927 (RMB 248,400) |
* At the expiration of the lease, we will continue to lease the premises on a month-to-month basis for $585 (RMB 4,000) per month.
We believe that the current facilities occupied by the Company and its subsidiaries will be able to meet the Company’s operational needs for the coming year.
| Item 3. | Legal Proceedings. |
The Company is not a party to any legal proceedings and to the best of the Company's knowledge, no such proceedings are threatened or contemplated. At this time, the Company has no bankruptcy, receivership, or similar proceedings pending.
PART II
| Item 5. | Market for Registrant’s Common Equity Related Stockholder Matters and Issuer Purchases of Equity Securities. |
Market Information
Our common stock, par value $0.001 per share, is currently trading on the Over the Counter Bulletin Board system under the symbol "FLSW". There is no assurance that our common stock will continue to be quoted or that any liquidity exists for the Company’s shareholders.
The following table sets forth the range of high and low bid prices for the Company's common stock for each quarterly period indicated, as reported by the “Businessweek Companies” website. Quotations reflect inter-dealer prices without retail markup, markdown or commissions and may not represent actual trades.
Common Stock
| Quarter Ended | | High Bid | | | Low Bid | |
| | | | | | | |
| December 31, 2009 | | $ | 0.30 | | | $ | 0.13 | |
| September 30, 2009 | | $ | 0.36 | | | $ | 0.12 | |
| June 30, 2009 | | $ | 0.80 | | | $ | 0.22 | |
| March 31, 2009 | | $ | 0.90 | | | $ | 0.85 | |
| | | | | | | | | |
| December 31, 2008 | | $ | 1.65 | | | $ | 0.25 | |
| September 30, 2008 | | $ | 1.75 | | | $ | 0.55 | |
| June 30, 2008 | | $ | 1.80 | | | $ | 0.55 | |
| March 31, 2008* | | $ | 1.55 | | | $ | 0.07 | |
* Increase in stock price commencing in the first quarter of our 2008 fiscal year reflect the effect of a 1-for-20 reverse stock split of the Company’s common stock that became effective on February 21, 2008.
Holders
As of March 22, 2010, there were 4,651,173 shares of the Company's common stock outstanding held of record by approximately 548 stockholders (not including beneficial owners who hold shares at broker/dealers in “street name”).
Dividends
The Company has never paid cash dividends on its common stock and does not intend to do so in the foreseeable future. The Company currently intends to retain its earnings for the operation and expansion of its business.
Securities Authorized for Issuance under Equity Compensation Plans
Please see the discussion in Item 12 titled “Equity Compensation Plan Information” below.
Item 6. Selected Financial Data
Not applicable.
Item 7. Management’s Discussion and Analysis or Plan of Operation
General
Statements contained herein that are not historical facts are forward-looking statements as that term is defined by the Private Securities Litigation Reform Act of 1995. Although we believe that the expectations reflected in such forward looking statements are reasonable, the forward looking statements are subject to risks and uncertainties that could cause actual results to differ from those projected. We caution investors that any forward looking statements made by us are not guarantees of future performance and those actual results may differ materially from those in the forward-looking statements. Such risks and uncertainties include, without limitation: well-established competitors who have substantially greater financial resources and longer operating histories, regulatory delays or denials, ability to compete as a start-up company in a highly competitive market, and access to sources of capital.
The following discussion and analysis should be read in conjunction with our financial statements and notes thereto included elsewhere in this Annual Report on Form 10-K (“Form 10-K”). Except for the historical information contained herein, the discussion in this Form 10-K contains certain forward-looking statements that involve risks and uncertainties, such as statements of our plans, objectives, expectations and intentions. The cautionary statements made in this Form 10-K should be read as being applicable to all related forward looking statements wherever they appear in this Form 10-K. The Company's actual results could differ materially from those discussed here. We undertake no obligation to update publicly any forward-looking statements for any reason even if new information becomes available or other events occur in the future.
Overview
We are a professional software development and technology service company. We are also a leading provider of industry e-business application solutions in China. Our main business is providing application development and maintenance services for companies in the telecom, logistics and government industries. We are inputting our efforts to develop our new products and services on on-line trading platform, SaaS platform (For-Online), the internet of things (“IOT”) application solutions and mobile business application solutions. We anticipate making profits from these products and services in the foreseeable future
In addition to our core business, we believe that there are opportunities for us to expand into new areas and to grow our business not only internally but through acquisitions and investments. For a description of all of our investments and other business activities since 1999, please refer to the section titled “Company History and Recent Developments” under Item 1 (Description of Business) in Part I of this Form 10-K.
Our business includes Forlink brand "For-"series software system sales such as ForOSS, ForRMS, For-Mail and their copyright licensing, and For-series related system integration, which consists of hardware sales and other related services rendered to customers. The following table shows our revenue breakdown by business line:
| | | Year Ended December 31, | |
| | | 2009 | | | 2008 | |
| | | | | | | |
| Sales of For-series software | | $ | 3,473,568 | | | $ | 5,307,669 | |
| as a percentage of net sales | | | 55 | % | | | 95 | % |
| | | | | | | | | |
| For-series related system integration | | $ | 2,815,396 | | | $ | 261,208 | |
| as a percentage of net sales | | | 45 | % | | | 5 | % |
As indicated in the foregoing table, sales of For-series software as a percentage of net sales decreased from 95% in 2008 to 55% in 2009 while sales of For-series related system integration as a percentage of net sales increased from 5% in 2008 to 45% in 2009. The main reason is that our third and last sale from system integration project for Guangxi Caexpo was recognized in 2009. However, the Company’s strategy is still to increase software sales that carry higher profit margins.
Generally, we offer our products and services to our customers on a total-solutions basis. Most of the contracts we undertake for our customers include revenue from hardware and software sales and professional services.
Sources of Revenue
| · | Hardware Revenue: Revenues from sales of products are mainly derived from sales of hardware. Normally, the hardware that we procure is in connection with total-solutions basis system integration contracts. |
| · | Service Revenue: Service revenue consists of revenue for the professional services we provide to our customers for network planning, design and systems integration, software development, modification and installation, and related training services. |
| · | Software License Revenue: We generate revenue in the form of fees received from customers to whom we issue licenses for the use of our software products over an agreed period of time. |
Costs of Revenue
Our costs of revenue include hardware costs, software-related costs and compensation and travel expenses for the professionals involved in the relevant projects. Hardware costs consist primarily of third party hardware costs. We recognize hardware costs in full upon delivery of the hardware to our customers. Software-related costs consist primarily of packaging and written manual expenses for our proprietary software products and software license fees paid to third-party software providers for the right to sublicense their products to our customers as part of our solutions offerings. The costs associated with designing and modifying our proprietary software are classified as research and development expenses as such costs are incurred.
Operating Expenses
Operating expenses are comprised of selling expenses, research and development expenses and general and administrative expenses.
Selling expenses include compensation expenses for employees in our sales and marketing departments, third party advertising expenses, as well as sales commissions and sales agency fees.
Research and development expenses relate to the development of new software and the modification of existing software. We expense such costs as they are incurred.
Taxes
According to the relevant PRC tax rules and regulations, FTCL and BFHX, both of which are recognized as New Technology Enterprises operating within a New and High Technology Development Zone, are entitled to an Enterprise Income Tax (“EIT”) rate of 15%.
Pursuant to approval documents dated September 23, 1999 and August 2, 2000 issued by the Beijing Tax Bureau and the State Tax Bureau respectively, FTCL received full exemption from EIT for fiscal years 1999 through 2002, and a 50% EIT reduction at the rate of 7.5% for fiscal years 2003 through 2005. As of December, 31, 2008, FTCL was entitled to an EIT rate of 25%.
Pursuant to an approval document dated January 19, 2004 issued by the State Tax Bureau, BFHX received full exemption from EIT for fiscal years 2004 through 2006. As of December 31, 2008, BFHX was entitled to an EIT rate of 7.5%.
Hong Kong profits tax is calculated at 17.5% on the estimated assessable profits of FTHK for the period. The EIT rates for FTCD and NNBCE are 25%. No provision for EIT and Hong Kong profits tax were made for FTCL, BFHX, FTCD, FTGX, NNBCE and FTHK as they have not gained taxable income for the periods.
Revenue from the sale of hardware procured in China together with the related system integration is subject to a 17% value added tax (“VAT”). However, companies that develop their own software and have the software registered are generally entitled to a VAT refund. If the net amount of the VAT payable exceeds 3% of software sales, the excess portion of the VAT is refundable upon our application to the tax authority. This policy is effective until 2011. Changes in Chinese tax laws may adversely affect our future operations.
Foreign Exchange
Our functional currency is United States Dollars (USD) and our financial records are maintained and the financial statements prepared in USD. The functional currency of FTHK is Hong Kong Dollars (HKD) and the financial records are maintained and the financial statements prepared in HKD. The functional currency of FTCL, BFHX, FTGX and FTCD is Renminbi (RMB) and the financial records are maintained and the financial statements are prepared in RMB.
Foreign currency transactions during the year are translated into each company’s denominated currency at the exchange rates ruling at the transaction dates. Gains and losses resulting from foreign currency transactions are included in the consolidated statement of operations. Assets and liabilities denominated in foreign currencies at the balance sheet date are translated into each company’s denominated currency at year-end exchange rates. All exchange differences are dealt with in the consolidated statements of operations.
The financial statements of our operations based outside of the United States have been translated into USD in accordance with SFAS 52. We have determined that the functional currency for each of the Company’s foreign operations is its applicable local currency. When translating functional currency financial statements into USD, year-end exchange rates are applied to the consolidated balance sheets, while average period rates are applied to consolidated statements of operations. Translation gains and losses are recorded in translation reserve as a component of shareholders’ equity.
The value of the RMB is subject to changes in China’s central government policies and to international economic and political developments affecting supply and demand in the China Foreign Exchange Trading System market. Since 1994, the conversion of RMB into foreign currencies, including USD, has been based on rates set by the People’s Bank of China, which are set daily based on the previous day’s interbank foreign exchange market rates and current exchange rates on the world financial markets. Since 1994, the official exchange rate generally has been stable. In July 2005, the Chinese government announced that it will no longer peg its currency exclusively to USD but will switch to a managed floating exchange rate based on market supply and demand with reference to a basket of currencies yet to be named by the People’s Bank of China, which will likely increase the volatility of RMB as compared to USD. The exchange rate of RMB to USD changed from RMB 8.28 to 8.11 in late July 2005.
The following table shows the exchange rates and the weighted average rates for the years ended December 31, 2009 and 2008:
| | | | | US$ | | | HK$ | | | RMB | |
| Exchange rate as of December 31, | | 2009 | | | 1 | | | | 7.79 | | | | 6.84 | |
| | | 2008 | | | 1 | | | | 7.78 | | | | 6.83 | |
| | | | | | | | | | | | | | | |
| Weighted average rates ruling for | | 2009 | | | 1 | | | | 7.78 | | | | 6.84 | |
| | | 2008 | | | 1 | | | | 7.81 | | | | 6.91 | |
Critical Accounting Policies and Estimates
We prepare our consolidated financial statements in accordance with generally accepted accounting principles in the United States of America. The preparation of those financial statements requires us to make estimates and assumptions that affect the reported amounts of assets and liabilities and the disclosure of contingent assets and liabilities at the date of the financial statements and the reported amount of revenues and expenses during the reporting period. On an on-going basis, we evaluate our estimates and judgments, including those related to revenues and cost of revenues under customer contracts, bad debts, income taxes, investment in affiliate, long-lived assets and goodwill. We base our estimates and judgments on historical experience and on various other factors that we believe are reasonable. Actual results may differ from these estimates under different assumptions or conditions. We believe the following critical accounting policies affect the more significant judgments and estimates used in the preparation of our consolidated financial statements.
Revenue Recognition
We generally provide services under multiple element arrangements, which include software license fees, hardware and software sales, provision of system integration services including consulting, implementation, and software maintenance. We evaluate revenue recognition on a contract-by-contract basis as the terms of each arrangement vary. The evaluation of the contractual arrangements often requires judgments and estimates that affect the timing of revenue recognized in the statements of operations. Specifically, we may be required to make judgments about:
| | · | whether the fees associated with our products and services are fixed or determinable; |
| | · | whether collection of our fees is reasonably assured; |
| | · | whether professional services are essential to the functionality of the related software product; |
| | · | whether we have the ability to make reasonably dependable estimates in the application of the percentage-of-completion method; and |
| | · | whether we have verifiable objective evidence of fair value for our products and services. |
We recognize revenues in accordance with the provisions of Statements of Position, or SOP, No. 97-2, “Software Revenue Recognition”, as amended by SOP No. 98-9, “Modification of SOP 97-2, Software Revenue Recognition, with respect to Certain Transactions”, Staff Accounting Bulletin, or SAB, 104, “Revenue Recognition”. SOP 97-2 and SAB 104 require among other matters, that there be a signed contract evidencing an arrangement exists, delivery has occurred, the fee is fixed or determinable, and collectability is probable.
Revenue from provision of system integration services and other related services are recognized when services are rendered in stages as separate identifiable phases of a project are completed and accepted by customers.
Revenue from software sales is recognized when the related products are delivered and installed and collection of sales proceeds is deemed probable and persuasive evidence of an arrangement exists.
Software license revenue is recognized over the accounting periods contained in the terms of the relevant agreements, commencing upon the delivery of the software provided that (1) there is evidence of an arrangement, (2) the fee is fixed or determinable, and (3) collection of the fee is considered probable.
In the case of maintenance revenues, vendor-specific objective evidence, or VSOE, of fair value is based on substantive renewal prices, and the revenues are recognized ratably over the maintenance period.
In the case of consulting and implementation services revenues, where VSOE is based on prices from stand-alone sale transactions, such revenues are recognized as services are performed pursuant to paragraph 65 of SOP 97-2.
For hardware transactions where software is incidental, we do not apply separate accounting guidance to the hardware and software elements. We apply the provisions of EITF 03-05, “Applicability of AICPA Statement of Position 97-2, Software Revenue Recognition, to Non-Software Deliverables in an Arrangement Containing More-Than-Incidental Software” (EITF 03-05). Per EITF 03-05, if the software is considered not essential to the functionality of the hardware, then the hardware is not considered “software related” and is excluded from the scope of SOP 97-2. Such sale of computer hardware is recognized as revenue on the transfer of risks and rewards of ownership, which coincides with the time when the goods are delivered to customers and title has passed, pursuant to SAB 104.
Revenues from remote hosting services, where VSOE is based upon consistent pricing charged to customers based on volumes and performance requirements on a stand-alone basis and substantive renewal terms, are recognized ratably over the contract term as the services are performed. The remote hosting arrangements generally require the Company to perform one-time set-up activities and include a one-time set-up fee. This one-time set-up fee is generally paid by the customer at contract execution. The Company determined that these set-up activities do not constitute a separate unit of accounting, and accordingly, the related set-up fees are recognized ratably over the term of the contract.
We consider the applicability of EITF 00-3, “Application of AICPA Statement of SOP 97-2 to Arrangements That Include the Right to Use Software Stored on Another Entity’s Hardware”, to the hosting services arrangements on a contract-by-contract basis. If we determine that the customer does not have the contractual right to take possession of our software at any time during the hosting period without significant penalty, SOP 97-2 does not apply to these contracts in accordance with EITF 00-3. Accordingly, these contracts would be accounted for pursuant to SAB 104.
Income Taxes
We account for income taxes in accordance with SFAS No. 109 “Accounting for Income Taxes”. Under SFAS No. 109, deferred tax liabilities or assets at the end of each period are determined using the tax rate expected to be in effect when taxes are actually paid or recovered. Valuation allowances are established when it is more likely than not that some or all of the deferred tax assets will not be realized.
Allowance for Doubtful Accounts
We record an allowance for doubtful accounts based on specifically identified amounts that the Company believes to be uncollectible. We have a limited number of customers with individually large amounts due at any given balance sheet date. Any unanticipated change in one of those customers’ credit worthiness or other matters affecting the collectability of amounts due from such customers could have a material effect on the results of operations in the period in which such changes or events occur. After all attempts to collect a receivable have failed, the receivable is written off against the allowance.
Goodwill
SFAS 142, Goodwill and Other Intangible Assets, requires that goodwill be tested for impairment on an annual basis (December 31 for us) and between annual tests if an event occurs or circumstances change that would more likely than not reduce the fair value of a reporting unit below its carrying value. These events or circumstances could include a significant change in the business climate, legal factors, operating performance indicators, competition, sale or disposition of a significant portion of a company. Application of the goodwill impairment test requires judgment, including the determination of the fair value of a company. The fair value of a company is estimated using a discounted cash flow methodology. This requires significant judgments including estimation of future cash flows, which is dependent on internal forecasts, estimation of the long-term rate of growth for our business, the useful life over which cash flows will occur, and the determination of our weighted average cost of capital. Changes in these estimates and assumptions could materially affect the determination of fair value and/or goodwill impairment for a company.
Recent Accounting Pronouncements
In June 2009, the FASB issued FAS 168 “The FASB Accounting Standards Codification TM and the Hierarchy of Generally Accepted Accounting Principles—a replacement of FASB Statement No. 162 (Codification)”. The Codification will become the source of authoritative U.S. generally accepted accounting principles (GAAP) recognized by the FASB to be applied by nongovernmental entities. Rules and interpretive releases of the Securities and Exchange Commission (SEC) under authority of federal securities laws are also sources of authoritative GAAP for SEC registrants. On the effective date of this Statement, the Codification will supersede all then-existing non-SEC accounting and reporting standards. All other nongrandfathered non-SEC accounting literature not included in the Codification will become nonauthoritative. This Statement is effective for financial statements issued for interim and annual periods ending after September 15, 2009.
In June 2009, the FASB issued FAS 167, “Amendments to FASB Interpretation No. 46(R)”. This Statement amends certain guidance in Interpretation 46(R) for determining whether an entity is a variable interest entity. This Statement is effective as of the beginning of each reporting entity’s first annual reporting period that begins after November 15, 2009.
In May 2009, the FASB issued FAS 165, “Subsequent Events” The objective of this Statement is to establish general standards of accounting for disclosure of events that occur after the balance sheet date but before financial statements are issued or are available to be issued.
The Company does not anticipate that the adoption of the above statements will have a material effect on the Company's financial condition and results of operations.
In September 2009, new guidance was introduced on revenue recognition on arrangements with multiple elements and certain revenue arrangements that include software. The new guidance will allow companies to allocate consideration in a multiple element arrangement in a way that better reflects the economics of the transaction.. Under this guidance, tangible products that have software components that are “essential to the functionality” of the tangible product will be scoped out of the software revenue guidance. The new guidance will also result in more disclosure requirements. The new guidance will be effective on January 1, 2011, with early adoption permitted. The Company is currently evaluating the impact of adopting the new guidance.
In September 2006, the FASB issued FAS 157, Fair Value Measurements (FAS 157). FAS 157 defines fair value, establishes a framework for measuring fair value in accordance with generally accepted accounting principles, and expands disclosures about fair value measurements. The provisions of FAS 157 are effective for the fiscal year beginning after November 15, 2007. We are currently evaluating the impact of the provisions of FAS 157.
Consolidated Results of Operations
Year Ended December 31, 2009 Compared to Year Ended December 31, 2008
The following table sets forth the results of our operations for the periods indicated:
| | | Year Ended | | | Year Ended | |
| | | December 31, | | | December 31, | |
| | | 2009 | | | 2008 | |
| Net Sales | | $ | 6,288,964 | | | $ | 5,568,877 | |
| Cost of Sales | | | (2,592,005 | ) | | | (1,836,509 | ) |
| Gross Profit | | | 3,696,959 | | | | 3,732,368 | |
| Selling Expenses | | | (1,199,800 | ) | | | (1,377,501 | ) |
| Research and Development Expenses | | | (1,039,742 | ) | | | (639,927 | ) |
| General and Administrative Expenses | | | (1,199,494 | ) | | | (1,752,975 | ) |
| Operating Profit (Loss) | | | 257,923 | | | | (38,035 | ) |
| Other Income | | | 298,254 | | | | 72,533 | |
| Net Profit (Loss) | | | 664,032 | | | | (1,289,081 | ) |
| Gain/Loss Per Share | | | 0.13 | | | | (0.28 | ) |
| Basic Weighted Average Shares Outstanding | | | 4,651,173 | | | | 4,651,173 | |
| Diluted Weighted Average Shares Outstanding | | | 4,651,173 | | | | 4,651,173 | |
Net Sales.
Our net sales increased 13% from $5,568,877 in 2008 to $6,288,964 in 2009. Sales of For-series software decreased 35% from $5,307,669 in 2008 to $3,473,568 in 2009. The increase in net sales was mainly attributable to an increase in system integration sales, from $261,208 in 2008 to $2,815,396 in 2009, an increase of 978%. Our third and last sale from system integration project for Guangxi Caexpo was recognized in 2009. However, the Company’s strategy is to increase software sales that carry higher profit margins.
Cost of Sales.
Our cost of sales increased 41% from $1,836,509 in 2008 to $2,592,005 in 2009. This increase was in line with our increase in sales for 2009. Cost of sales, as a percentage of net sales, increased from 33% in 2008 to 41% in 2009 largely due to increase in lower margins in hardware sales.
Gross Profit.
Gross profit stayed approximately the same from $3,732,368 in 2008 to $3,696,959 in 2009. However, the gross profit margin decreased from 67% in 2008 to 59% in 2009. The decrease in gross profit margin was attributable to the significant increase in system integration sales, which have a lower gross profit margin compared to software sales.
Operating Expenses.
Total operating expenses year-over-year was maintained at comparable levels, with $3,440,061 in 2009 and $3,770,403 in 2008. This situation resulted largely from the offset of a decrease in general and administrative expenses against an increase in research and development expenses.
Selling expenses decreased 13% from $1,377,501 in 2008 to $1,199,800 in 2009, as a result of the dissolution of one sales agency located in Hangzhou, China on September 28, 2009.
Research and development expenses increased 62% from $639,927 in 2008 to $1,039,742 in 2009, as a result of our continuing increased efforts in our research and development department in 2009. We started several new internal projects in 2009 which required additional research and development. These projects may be integrated into our new products in the foreseeable future.
General and administrative expenses decreased 32% from $1,752,975 in 2008 to $1,199,494 in 2009. The decrease was primarily due to our continuing cost control efforts in our administration department in 2009. We decreased the number of our employees from 208 in 2008 to 181 in 2009.
Operating Profit (Loss).
We recorded an operating profit of $257,923 in 2009 as compared to an operating loss of $38,035 in 2008, an increase of 932%. The increase was largely due to the increase in net sales of 14% from $5,568,877 in 2008 to $6,288,964 in 2009 and a decrease in operating expenses.
Other Income.
Our other income increased 311% from $72,533 in 2008 to $298,254 in 2009, as a result of an increase in our VAT refund. Our other income is derived entirely from VAT refund associated with our software sales.
Net Profit (Loss).
We recorded a net profit of $664,032 in 2009, or basic and diluted profit of $0.13 per share, as compared to a net loss of $1,289,081 in 2008, or basic and diluted loss of $0.28 per share.
Liquidity and Capital Resources
Our capital requirements are primarily working capital requirements related to costs of hardware for network solution projects and costs associated with the expansion of our business. In order to minimize our working capital requirements, we generally obtain from our hardware vendors payment terms that are timed to permit us to receive payment from our customers for the hardware before our payments to our hardware vendors are due. However, we sometimes obtain less favorable payment terms from our customers, thereby increasing our working capital requirements. We have historically financed our working capital and other financing requirements through careful management of our billing cycle and, to a limited extent, bank loans. The net cash used in operating activities was $685,985 in 2009 as compared to $553,209 in 2008. The increase in net cash used was mainly due to the increased balance of account receivables in 2009. The cash flow from investing activities was $340,862 in 2009, compared to $357,021 in 2008. The slight decrease in cash flow from investing activities resulted from the decrease in dividends that we received from companies that we have invested in, from $452,607 in 2008 to $360,033 in 2009. We did not have any net cash generated from financing activities in 2009 compared to $10,000 generated in 2008. The decrease in cash flow from financing activities resulted from the decrease in issuance of common stock under our 2002 Stock Plan and related additional paid-in capital in 2008.
Our accounts receivable balance at December 31, 2009 was $2,434,557, as compared to $898,005 at the end of 2008. The increase is mainly attributable to two customers, All China and Beijing Mobile. The balance of All China’s accounts receivable increased to $1,826,776 at December 31, 2009 from $267,112 at December 31, 2008, and the balance of Beijing Mobile’s accounts receivable increased to $11,600 at December 31, 2009 from $1,696 at December 31, 2008. Our inventory position at the end of 2009 was $935,566, as compared to $1,019,713 at the beginning of the year. At the end of 2009, we had several inventory items in the process of delivery to two of our major customers.
We ended the year with a cash position of $2,240,863. We had negative operating cash flow of $302,567, primarily due to the increased balance of accounts receivable in 2009.
Although our revenues and operating results for any period are not necessarily indicative of future periods, we anticipate that our available funds and cash flows generated from operations will be sufficient to meet our anticipated needs for working capital, capital expenditures and business expansion through 2009. We may need to raise additional funds in the future, however, in order to fund acquisitions, develop new or enhanced services or products, respond to competitive pressures to compete successfully for larger projects involving higher levels of hardware purchases, or if our business otherwise grows more rapidly than we currently predict. If we do need to raise additional funds, we expect to raise those funds through new issuances of shares of our equity securities in one or more public offerings or private placements, or through credit facilities extended by lending institutions.
Off-Balance Sheet Arrangements
As of December 31, 2009, we have not entered into any off-balance sheet arrangements with any individuals or entities.
Contractual Obligations
As of December 31, 2009, we had commitments under non-cancelable operating leases requiring annual minimum rental payments as follows:
| | | December 31, | |
| | | 2009 | |
| | | | |
| January 1, 2009 to December 31, 2009 | | $ | 474,411 | |
| January 1, 2010 to December 31, 2010 | | | 475,522 | |
| January 1, 2011 to December 31, 2011 | | | 97,726 | |
| | | | | |
| | | $ | 1,047,659 | |
ITEM 7A. Quantitative and Qualitative Disclosures about Market Risk’
Not applicable.
Item 8. Financial Statements.
The information required by Item 8 and the index thereto commences on the next page.
Forlink Software Corporation, Inc.
Index To Consolidated Financial Statements
| | | Pages | |
| | | | |
| Report of Independent Registered Public Accounting Firm | | F-1 | |
| | | | |
| Consolidated Balance Sheets | | F-2 | |
| | | | |
| Consolidated Statements of Operations | | F-3 | |
| | | | |
| Consolidated Statements of Stockholders’ Equity | | F-4 | |
| | | | |
| Consolidated Statements of Cash Flows | | F-5 | |
| | | | |
| Notes to Consolidated Financial Statements | | F-6 - F-20 | |
REPORT OF INDEPENDENT REGISTERED PUBLIC ACCOUNTING FIRM
To the board of directors and stockholders of
Forlink Software Corporation, Inc.
We have audited the accompanying consolidated balance sheets of Forlink Software Corporation Inc as of December 31, 2009 and 2008, and the related consolidated statements of income, stockholders’ equity and comprehensive income, and cash flows for the years then ended. Forlink Software Corporation Inc’s management is responsible for these financial statements. Our responsibility is to express an opinion on these financial statements based on our audits.
We conducted our audits in accordance with the standards of the Public Company Accounting Oversight Board (United States). Those standards require that we plan and perform the audit to obtain reasonable assurance about whether the financial statements are free of material misstatement. The company is not required to have, nor were we engaged to perform, an audit of its internal control over financial reporting. Our audit included consideration of internal control over financial reporting as a basis for designing audit procedures that are appropriate in the circumstances, but not for the purpose of expressing an opinion on the effectiveness of the company’s internal control over financial reporting. Accordingly, we express no such opinion. An audit also includes examining, on a test basis, evidence supporting the amounts and disclosures in the financial statements, assessing the accounting principles used and significant estimates made by management, as well as evaluating the overall financial statement presentation. We believe that our audits provide a reasonable basis for our opinion.
In our opinion, the financial statements referred to above present fairly, in all material respects, the financial position of Forlink Software Corporation Inc as of December 31, 2009 and 2008, and the results of its operations and its cash flows for the years then ended in conformity with accounting principles generally accepted in the United States of America.
As discussed in Note 2 to the consolidated financial statements, the Company has changed its accounting method for one of its long term investments.
/s/ Kenne Ruan, CPA, P.C.
Woodbridge, Connecticut
March 16, 2010
Forlink Software Corporation, Inc.
Consolidated Balance Sheets
(Expressed in US Dollars)
| | | December 31, | | | December 31, | |
| | | 2009 | | | 2008 | |
| Current assets | | | | | | |
| Cash and cash equivalents | | $ | 2,240,863 | | | $ | 2,543,430 | |
| Accounts receivable | | | 2,434,557 | | | | 898,005 | |
| Other receivables, deposit and prepayments | | | 687,413 | | | | 1,627,555 | |
| Inventories | | | 935,566 | | | | 1,019,713 | |
| Deferred Taxes Assets | | | 0 | | | | 3,160 | |
| Total current assets | | | 6,298,399 | | | | 6,091,863 | |
| | | | | | | | | |
| Property, plant and equipment | | | 391,671 | | | | 593,805 | |
| Long term investments | | | 4,707,136 | | | | 4,994,953 | |
| | | | | | | | | |
| Total assets | | $ | 11,397,206 | | | $ | 11,680,621 | |
| | | | | | | | | |
| Liabilities and stockholders' equity | | | | | | | | |
| Current liabilities | | | | | | | | |
| Accounts payable | | $ | 1,193,643 | | | $ | 2,050,321 | |
| Amounts due to shareholders | | | 415,078 | | | | 378,672 | |
| Customer deposits | | | 1,329,203 | | | | 1,123,060 | |
| Other payables and accrued expenses | | | 535,668 | | | | 605,319 | |
| Income tax payable | | | 0 | | | | 16 | |
| Other tax payable | | | 727,097 | | | | 973,588 | |
| Deferred Taxes Debt | | | 38,992 | | | | 0 | |
| Total current liabilities | | $ | 4,239,681 | | | $ | 5,130,976 | |
| | | | | | | | | |
| Commitments and contingencies | | | | | | | | |
| Non-controlling interest in subsidiaries | | $ | 151,785 | | | $ | 193,295 | |
| Stockholders' equity | | | | | | | | |
| | | | | | | | | |
| Common stock, par value $0.001 per share; 200,000,000 and 200,000,000 shares authorized; 4,966,173 and 4,966,173 shares issued and 4,651,173and 4,651,173 shares outstanding, respectively | | $ | 99,322 | | | $ | 99,322 | |
| Treasury stock | | | (163,800 | ) | | | (163,800 | ) |
| Additional paid-in capital | | | 10,195,693 | | | | 10,195,693 | |
| Accumulated losses | | | (4,214,220 | ) | | | (4,839,261 | ) |
| Accumulated other comprehensive income | | | 1,088,745 | | | | 1,064,396 | |
| | | | | | | | | |
| Total stockholders' equity | | $ | 7,005,740 | | | $ | 6,356,350 | |
| | | | | | | | | |
| Total liabilities and stockholders' equity | | $ | 11,397,206 | | | $ | 11,680,621 | |
See accompanying notes to consolidated financial statements.
Forlink Software Corporation, Inc.
Consolidated Statements of Operations
(Expressed in US Dollars)
| | | Year ended December 31,2009 | | | Year ended December 31,2008 | |
| | | | | | | |
| Net sales | | $ | 6,288,964 | | | $ | 5,568,877 | |
| Cost of sales | | | (2,592,005 | ) | | | (1,836,509 | ) |
| | | | | | | | | |
| Gross profit | | | 3,696,959 | | | | 3,732,368 | |
| | | | | | | | | |
| Selling expenses | | | (1,199,800 | ) | | | (1,377,501 | ) |
| Research and development expenses | | | (1,039,742 | ) | | | (639,927 | ) |
| General and administrative expenses | | | (1,199,494 | ) | | | (1,752,975 | ) |
| | | | | | | | - | |
| Operating profit / (loss) | | | 257,923 | | | | (38,035 | ) |
| | | | | | | | | |
| Investment income | | | (181,497 | ) | | | 9,408 | |
| Loss on disposal of subsidiaries | | | 0 | | | | 0 | |
| Interest income | | | 9,636 | | | | 16,234 | |
| Interest expenses | | | 0 | | | | 0 | |
| Impairment loss on goodwill | | | 0 | | | | (1,684,023 | ) |
| Income from cost method investee | | | 257,522 | | | | 248,710 | |
| Other income, net | | | 298,254 | | | | 72,533 | |
| | | | | | | | | |
| Profit before income taxes | | | 641,838 | | | | (1,375,173 | ) |
| | | | | | | | | |
| Income tax | | | (58,308 | ) | | | 9,615 | |
| | | | | | | | | |
| Consolidated profit | | | 583,530 | | | | (1,365,558 | ) |
| | | | | | | | | |
| Net loss attributable to minority interest | | | (41,510 | ) | | | (76,477 | ) |
| | | | | | | | | |
| Net consolidated profit (loss) | | $ | 625,040 | | | $ | (1,289,081 | ) |
| | | | | | | | | |
| Gain/Loss per share | | $ | 0.13 | | | $ | (0.28 | ) |
| Weighted average common shares outstanding - basic and diluted | | | 4,651,173 | | | | 4,651,173 | |
See accompanying notes to consolidated financial statements.
Forlink Software Corporation, Inc.
Consolidated Statement of Stockholders’ Equity
(Expressed in US Dollars)
| | | Common Stock | | | | | | | | | Accumulated | | | Retained | | | | | | | |
| | | Number of Share Issued | | | Number of Share Outstanding | | | Number of Treasury Stock | | | Amount | | | Treasury Stock | | | Additional Paid-in Capital | | | other comprehensive income | | | Profits/ (Accumulated Losses) | | | Total Stockholders’ Equity | | | Comprehensive Income/ (Losses) | |
| | | | | | | | | | | | | | | | | | | | | | | | | | | | | | | |
| Balance, December 31, 2007 | | | 99,121,707 | | | | 92,821,707 | | | | 6,300,000 | | | $ | 99,122 | | | $ | (163,800 | ) | | $ | 10,177,812 | | | $ | 596,963 | | | $ | (3,517,749 | ) | | $ | 7,192,348 | | | $ | | |
| | | | | | | | | | | | | | | | | | | | | | | | | | | | | | | | | | | | | | | | | |
| Shares issued | | | | | | | | | | | | | | | 200 | | | | | | | | 17,881 | | | | | | | | | | | | 18,081 | | | | | |
| | | | | | | | | | | | | | | | | | | | | | | | | | | | | | | | | | | | | | | | | |
| Net profit for the year | | | | | | | | | | | | | | | | | | | | | | | | | | | | | | | (1,241,843 | ) | | | (1,241,843 | ) | | | (1,241,843 | ) |
| | | | | | | | | | | | | | | | | | | | | | | | | | | | | | | | | | | | | | | | | |
| Translation reserve | | | | | | | | | | | | | | | | | | | | | | | | | | | 467,433 | | | | | | | | 467,433 | | | | 467,433 | |
| | | | | | | | | | | | | | | | | | | | | | | | | | | | | | | | | | | | | | | | | |
| Comprehensive income | | | | | | | | | | | | | | | | | | | | | | | | | | | | | | | | | | | | | | $ | (774,410 | ) |
| | | | | | | | | | | | | | | | | | | | | | | | | | | | | | | | | | | | | | | | | |
| Balance, December 31, 2008 | | | 4,966,173 | | | | 4,651,173 | | | | 315,000 | | | $ | 99,322 | | | $ | (163,000 | ) | | $ | 10,195,693 | | | $ | 1,064,396 | | | $ | (4,759,592 | ) | | $ | 6,436,019 | | | | | |
| | | | | | | | | | | | | | | | | | | | | | | | | | | | | | | | | | | | | | | | | |
| Shares issued | | | | | | | | | | | | | | | | | | | | | | | | | | | | | | | | | | | | | | | | |
| | | | | | | | | | | | | | | | | | | | | | | | | | | | | | | | | | | | | | | | | |
| Net profit for the year | | | | | | | | | | | | | | | | | | | | | | | | | | | | | | | 545,372 | | | | | | | | 545,372 | |
| | | | | | | | | | | | | | | | | | | | | | | | | | | | | | | | | | | | | | | | | |
| Translation reserve | | | | | | | | | | | | | | | | | | | | | | | | | | | 24,349 | | | | | | | | | | | | 24,349 | |
| | | | | | | | | | | | | | | | | | | | | | | | | | | | | | | | | | | | | | | | | |
| Comprehensive income | | | | | | | | | | | | | | | | | | | | | | | | | | | | | | | | | | | | | | $ | 569,721 | |
| | | | | | | | | | | | | | | | | | | | | | | | | | | | | | | | | | | | | | | | | |
| Balance, December 31, 2009 | | | 4,966,173 | | | | 4,651,173 | | | | 315,000 | | | $ | 99,322 | | | $ | (163,000 | ) | | $ | 10,195,693 | | | $ | 1,088,745 | | | $ | (4,214,220 | ) | | $ | 7,005,740 | | | | | |
See accompanying notes to consolidated financial statements.
Forlink Software Corporation, Inc.
Consolidated Statements of Cash Flows
(Decrease)/Increase in Cash and Cash Equivalents
(Expressed in US Dollars)
| | | Year Ended December 31, | |
| | | 2009 | | | 2008 | |
| Cash flows from operating activities | | | | | | |
| | | | | | | | |
| Net income | | | 625,041 | | | (1,289,081 | ) |
| Adjustment to reconcile net income to net cash provided by (used in) operating activities: | | | | | | | |
| Minority interest | | | (41,510 | ) | | | (76,477 | ) |
| Proceeds from transferred of treasury stock | | | - | | | | - | |
| Depreciation of property, plant and equipment | | | 204,262 | | | | 273,172 | |
| Amortization of intangible assets | | | - | | | | - | |
| Loss on disposal of property, plant and equipment | | | - | | | | - | |
| Loss from equity method investee | | | 181,498 | | | | (9,408 | ) |
| Loss on disposal from subsidiaries | | | - | | | | - | |
| Dividend from cost method investee | | | (257,522 | ) | | | (248,710 | ) |
| Loss from goodwill impairment | | | - | | | | 1,684,023 | |
| Effect of deferred taxes | | | (16,659 | ) | | | (22,342 | ) |
| | | | | | | | | |
| Charge in: | | | | | | | | |
| Account Receivables | | | (1,536,902 | ) | | | 762,132 | |
| Other receivables, deposits & prepayments | | | 959,005 | | | | (1,063,502 | ) |
| Inventories | | | 83,715 | | | | (486,080 | ) |
| Account Payable | | | (855,809 | ) | | | 338,662 | |
| Amounts due to stockholders | | | 36,567 | | | | 30,398 | |
| Customers deposits | | | 199,308 | | | | (735,804 | ) |
| Other payables & accrued expenses | | | (20,884 | ) | | | 239,262 | |
| Income tax payable | | | (16 | ) | | | (1,633 | ) |
| Other taxes payable / recoverable | | | (246,078 | ) | | | 52,179 | |
| | | | | | | | | |
| Net cash used in operating activities | | | (685,985 | ) | | | (553,209 | ) |
| | | | | | | | | |
| Cash flows from investing activities | | | | | | | | |
| Acquisition of property, plant & equipments | | | (19,171 | ) | | | (95,586 | ) |
| Disposal of subsidiary | | | - | | | | - | |
| Cash payment associated with long term investments | | | - | | | | - | |
| Cash dividend from cost method investee | | | 360,033 | | | | 452,607 | |
| Cash Received from disposal property, plant& equipments | | | - | | | | - | |
| | | | | | | | | |
| Net cash used in investing activities | | | 340,862 | | | | 357,021 | |
| | | | | | | | | |
| Cash flow from financing activities | | | | | | | | |
| Proceeds from issuance of common stock under Plan 2002 | | | - | | | | 200 | |
| Increase in treasury stock | | | - | | | | - | |
| Increase/decrease in additional paid in capital | | | - | | | | 9,800 | |
| Capital contribution from minority interest | | | - | | | | - | |
| | | | | | | | | |
| Net cash generated from financing activities | | | - | | | | 10,000 | |
| | | | | | | | | |
| Effect of exchange rate changes on cash and cash equivalents | | | 42,556 | | | | 328,717 | |
| | | | | | | | | |
| Net increase (decrease) in cash and cash equivalents | | | (302,567 | ) | | | 142,529 | |
| | | | | | | | | |
| Cash and cash equivalents at the beginning of year | | | 2,543,430 | | | | 2,400,901 | |
| | | | | | | | | |
| Cash and cash equivalents at the end of year | | | 2,240,863 | | | | 2,543,430 | |
| | | | | | | | | |
| Supplemental disclosure of cash flow information | | | | | | | | |
| Income tax paid | | $ | 28,755 | | | $ | 1,665 | |
| Interest paid | | $ | - | | | $ | - | |
See accompanying notes to consolidated financial statements.
Forlink Software Corporation, Inc. (the "Company" or the "Registrant" or "Forlink"), is a Nevada corporation which was originally incorporated on January 7, 1986 as "Why Not?, Inc. " under the laws of the State of Utah and subsequently reorganized under the laws of Nevada on December 30, 1993. From 1996 until 1999, the Company continued as an unfunded venture in search of a suitable business acquisition or business combination.
On November 3, 1999, the Company entered into a Plan of Reorganization with Beijing Forlink Software Technology Co., Ltd., (hereinafter "BFSTC"), a limited liability company organized under the laws of the People’s Republic of China (“PRC” or “China”), under the terms of which BFSTC gained control of the Company. Pursuant to the Plan of Reorganization, the Company acquired 100% of the registered and fully paid-up capital of BFSTC in exchange for 20,000,000 shares of the Company's authorized, but unissued, common stock. BFSTC is engaged in the provision of computer software consultancy and engineering services and the development and sale of computer software in the People’s Republic of China (“PRC”). As a part of its computer consultancy and engineering services, BFSTC is also engaged in the sale of computer hardware. In June 2001, BFSTC changed its name to Forlink Technologies Co. Ltd. (“FTCL”). FTCL is the Company’s major operating subsidiary in China.
In August 2001, the Company acquired Beijing Slait Science & Technology Development Limited Co. (“SLAIT”) pursuant to a Plan of Reorganization dated January 11, 2001. The Company issued 59,430,000 shares of its common stock to SLAIT’s original beneficial owners in exchange for 100% of the outstanding equity of SLAIT. As a result of the share exchange, the former beneficial owners of SLAIT own approximately 70% of the issued and outstanding shares of the Company, and SLAIT became a wholly-owned subsidiary of the Company. The Company also agreed to transfer 1,085,000 Renminbi (“RMB”) (approximately US$131,039) to the former owners of SLAIT. A change in control occurred in which all but one of the officers and directors of the Company resigned and two former directors (also former owners) of SLAIT became officers and directors of the Company. Prior to its dissolution 2004, SLAIT provided application system integration technology and specializes in large volume transaction processing software for networks such as mobile phone billing and band operation. Subsequent to the acquisition, the principal activities of SLAIT were gradually shifted to those of FTCL. On February 13, 2004, SLAIT was officially dissolved in accordance with relevant PRC regulations.
On June 18, 2003, Forlink Technologies (Hong Kong) Limited (“FTHK”) was incorporated in Hong Kong Special Administrative Region as a limited liability company. In December 2003, FTHK became a wholly owned subsidiary of Forlink. FTHK is an investment holding company set up to take advantage of the favorable business environment in Hong Kong and to facilitate the Company’s investment transactions. Through FTHK, on December 18, 2003, the Company invested $760,870 in All China Logistics Online Co., Ltd. ("All China Logistics"), a privately held PRC company providing logistic services in China, in exchange for a 17.8% equity interest.
On June 14, 2004, Forlink Technologies (Chengdu) Limited ("FTCD") was established as a limited liability company in Chengdu, PRC and subsequently became a wholly owned subsidiary of FTHK in September 2004. FTCD is in the business of providing software outsourcing services and software development. The registered capital of FTCD is $5,000,000 and the fully paid up capital was $750,000 as of December 31, 2005. In April 2006, FTHK further invested $130,000 in FTCD. FTCD commenced operations in late 2005. The registered capital of FTCD was reduced to $200,000 in December 2007, which amount was fully paid as of December 2007.
In compliance with China’s foreign investment restrictions on telecom value-added services and other laws and regulations, the Company conducts telecom value-added services and application integration services for government organizations in China via Beijing Forlink Hua Xin Technology Co. Ltd. ("BFHX"). BFHX was established in the PRC on September 19, 2003 as a limited liability company. The registered capital of BFHX is $120,733 (RMB 1,000,000) and was fully paid up as of March 31, 2005. Mr. Yi He and Mr. Wei Li have been entrusted as nominee owners of BFHX to hold 70% and 30%, respectively, of the fully paid up capital of BFHX on behalf of the Company as the primary beneficiary. BFHX is considered a Variable Interest Entity ("VIE"), and because the Company is the primary beneficiary, the Company’s consolidated financial statements include BFHX. Upon the request of the Company, Mr. Yi He and Mr. Wei Li are required to transfer their ownership interests in BFHX to the Company or its designees at any time for the amount of the fully paid registered capital of BFHX. Mr. Yi He is the Chief Executive Officer, a director and a major stockholder of the Company. Mr. Wei Li is the administration manager of FTCL.
On October 24, 2005, the Company entered into a definitive agreement to acquire a 17.5% equity interest of China Liquid Chemical Exchange Company Limited (“CLCE”), a PRC limited liability company, in exchange for deployment of the Company’s For-online Electronic Trading System. In early 2007, CLCE increased its share capital to $1,708,526 (RMB 13,000,000). As the Company did not subscribed the new shares, the Company’s shareholding of CLCE was diluted and as of December 31 2007 was 13.46%. CLCE commenced operations fully in early 2007.
On October 3, 2006, the Company entered into a Transfer of Right to Invest and Project Cooperation Agreement (“Statelink Agreement”) with Statelink International Group, Ltd., a British Virgin Islands company (“Statelink”), pursuant to which the Company acquired 22.73% registered capital in Guangxi Caexpo International Trade and Logistics Co., Ltd. (“Guangxi Caexpo”), a PRC limited liability company in the businesses of real estate development, advertising and computer distribution for cash consideration of $2,557,545 (RMB 20,000,000) from BFHX and stock consideration of 13,000,000 shares of the Company’s restricted common stock. On October 26, 2006, BFHX established Forlink Technologies (Guangxi) Limited (“FTGX”), a PRC limited liability company, to carry out a contract from Guangxi Caexpo to build an “Electronic Trade and Logistics Information Platform and Call Center” (the “Project”). At the time of incorporation, BFHX injected RMB 20,000,000 (approximately US$2,557,545) as registered capital to FTGX.
On October 12, 2006, the Company invested $31,969 (RMB 250,000) in Wuxi Stainless Steel Exchange Co., Ltd. (“Wuxi Exchange”), a PRC limited liability company, for a 12.5% equity interest. On January 14, 2007, the Company entered into an agreement with a major shareholder of Wuxi Exchange to transfer 2.5% of the Company’s interest in Wuxi Exchange to the major shareholder for a cash payment of RMB 500,000.
On January 25, 2007, the board of directors and the majority holders of the Company’s common stock jointly approved an amendment to the Company’s Articles of Incorporation by written consent, to increase the number of authorized shares of common stock from 100,000,000 to 200,000,000. The Certificate of Amendment to the Articles of Incorporation to effect the increase of the number of the Company’s authorized common shares was filed with Nevada’s Secretary of State on April 4, 2007.
On April 29, 2007, the Company invested, through BFHX, $138,158 (RMB 1,050,000) in Beijing GuoXin Forlink Internet Technologies Limited (“BGXF”), a privately held PRC company that operates a finance study website, for a 35% equity interest. The investment in BGXF is accounted for under the equity method of accounting due to the Company’s significant influence over the operational and financial policies of BGXF. BGXF commenced operations on March 9 2008. On October 14, 2008, the registered capital of BGXF was increased to RMB 4,285,700, and since the Company did not invest additional funds into BGFX, the ratio of its holding was diluted to a 24.5% equity interest.
On July 12, 2007, the Company invested through FTGX, $1,063,830 (RMB 8,000,000) in Nanning Bulk Commodities Exchange Corporation Limited (“NNBCE”), a privately held PRC company, for an 80% equity interest. NNBCE became a subsidiary of FTGX. NNBCE, set up on April 29, 2007, commenced operations on March 28, 2008, and provides logistical e-commerce service.
On September 5, 2007, the Company invested $465,425 (RMB 3,500,000), through NNBCE, in Guangxi Bulk Sugar & Ethanol Exchange Corporation Limited (“GBSEE”), a PRC limited liability company established on September 12, 2007, for a 35% equity interest. Concurrently, All China Logistics was entrusted as nominee owner of GBSEE to hold 20% of the fully paid up capital of GBSEE on behalf of NNBCE as the primary beneficiary. Upon the request of NNBCE, All China Logistics is required to transfer its ownership interests in GBSEE to NNBCE or its designees at any time for the amount of the 20% fully paid up capital. In accordance with Financial Accounting Standards Board (“FASB”) Interpretation No. 46R “Consolidation of Variable Interest Entities - An Interpretation of ARB No. 51” (“FIN 46R”), NNBCE is deemed to hold the primary beneficial interest of 55% equity interest in GBSEE. GBSEE was established to provide logistical e-commerce service, but it was dissolved on December 16, 2007 before it commenced any operations and NNBCE received payments back of its investment in GBSEE of $410,397 (RMB 3,000,000) in December 2007; $66,211 (RMB 484,000) in February 2008, and $2,189 (RMB 16,000) in September 2008.
On December 24, 2007, the board of directors and the majority holders of the Company’s common stock jointly approved an amendment to the Company’s Articles of Incorporation by written consent, to effect a 1-for-20 reverse stock split. The Certificate of Amendment to the Articles of Incorporation to effect the reverse split was filed with Nevada’s Secretary of State on February 21, 2008.
On March 20, 2008, the Company invested $71,124 (RMB 500,000), through BFHX, in Shandong LongDong Internet Technologies Limited (“SDLD”), a PRC limited liability company established on October 24, 2007, for a 5% equity interest. SDLD, which commenced operations in December 2007, is in the business of providing of providing primary products e-commerce services. The purpose of this investment is to gain cash dividends from SDLD.
On February 8, 2010, the Company transferred all its ownership interests in FTCL to BFHX for the amount of FTCL’s 100% fully paid up capital.
The principal activities of the Company are the development and sale of network software systems and the provision of enterprise application system integration services in the PRC. The Company is also engaged in the sale of computer hardware. Set forth below is a diagram illustrating our corporate structure as of December 31, 2009:
NOTE 2 - BASIS OF PRESENTATION AND SUMMARY OF SIGNIFICANT ACCOUNTING POLICIES
Basis of Accounting and Principles of Consolidation
The consolidated financial statements are prepared in accordance with generally accepted accounting principles in the United States of America that include the financial statements of Forlink and its subsidiaries, namely, FTCL, FTHK, BFHX, FTCD, FTGX, and NNBCE. All inter-company transactions and balances have been eliminated.
Minority interests at the balance sheet date, being the portion of the net assets of subsidiaries attributable to equity interests that are not owned by Forlink, whether directly or indirectly through subsidiaries, are presented in the consolidated balance sheet separately from liabilities and the shareholders’ equity. Minority interests in the results of the Company for the years are also separately presented in the income statement.
Use of Estimates
The preparation of financial statements in accordance with generally accepted accounting principles requires management to make estimates and assumptions that affect reported amounts of assets and liabilities and disclosure of contingent assets and liabilities at the date of the financial statements and the reported amounts of revenues and expenses during the reporting period. Actual results could differ from those estimates.
Foreign Currency Translation and Transactions
The functional currency of Forlink is U.S. Dollars (US$) and the financial records are maintained and the financial statements prepared in US$. The functional currency of FTHK is Hong Kong Dollars (HK$) and its financial records are maintained, and its financial statements prepared, in HK$. The functional currency of FTCL, BFHX, FTCD, FTGX, and NNBCE is Renminbi (RMB) and their financial records are maintained, and their financial statements are prepared, in RMB.
Foreign currency transactions during the period are translated into each company’s denominated currency at the exchange rates at the transaction dates. Gain and loss resulting from foreign currency transactions are included in the consolidated statement of operations. Assets and liabilities denominated in foreign currencies at the balance sheet date are translated into each company’s denominated currency at the yearend exchange rates. All exchange differences are dealt with in the consolidated statements of operations.
The financial statements of the Company’s operations based outside of the United States have been translated into US$ in accordance with SFAS 52. Management has determined that the functional currency for each of the Company’s foreign operations is its applicable local currency. When translating functional currency financial statements into US$, year-end exchange rates are applied to the consolidated balance sheets, while average period rates are applied to consolidated statements of operations. Translation gains and losses are recorded in translation reserve as a component of stockholders’ equity.
The value of the RMB is subject to changes in China’s central government policies and to international economic and political developments affecting supply and demand in the China Foreign Exchange Trading System market. Since 1994, the conversion of RMB into foreign currencies, including US$, has been based on rates set by the People’s Bank of China, which are set daily based on the previous day’s inter-bank foreign exchange market rates and current exchange rates on the world financial markets. Since 1994, the official exchange rate generally has been stable. In July 2005, the Chinese government announced that it will no longer peg its currency exclusively to US$ but will switch to a managed floating exchange rate based on market supply and demand with reference to a basket of currencies which will likely increase the volatility of RMB as compared to US$. The exchange rate of RMB to US$ changed from RMB8.28 to RMB8.11 in late July 2005.
The exchange rates used as of December 31, 2009 and 2008 are US$1:HK$7.79:RMB6.84 and US$1:HK$7.78:RMB6.83, respectively. The weighted average rates ruling for the years ended December 31, 2009 and 2008 are US$1:HK$7.78:RMB6.84, and US$1:HK$7.81:RMB6.91, respectively.
Foreign Currency Risk
The RMB is not a freely convertible currency. The State Administration for Foreign Exchange, under the authority of the People’s Bank of China, controls the conversion of RMB into foreign currencies. The value of the RMB is subject to changes in central government policies and to international economic and political developments affecting supply and demand in the China Foreign Exchange Trading System market.
The PRC subsidiaries conduct their business substantially in the PRC, and their financial performance and position are measured in terms of RMB. Any devaluation of the RMB against the US$ would consequently have an adverse effect on the financial performance and asset values of the Company when measured in terms of US$. The PRC subsidiaries’ products are primarily procured, sold and delivered in the PRC for RMB. Thus, their revenues and profits are predominantly denominated in RMB. Should the RMB devalue against US$, such devaluation could have a material adverse effect on the Company’s profits and the foreign currency equivalent of such profits repatriated by the PRC entities to the Company.
Cash and Cash Equivalents
Cash and cash equivalents include cash in hand and all highly liquid investments with an original maturity of three months or less.
Allowance for Doubtful Accounts
We record an allowance for doubtful accounts based on specifically identified amounts that the Company believes to be uncollectible. We have a limited number of customers with individually large amounts due at any given balance sheet date. Any unanticipated change in one of those customers’ credit worthiness or other matters affecting the collectability of amounts due from such customers could have a material effect on the results of operations in the period in which such changes or events occur. After all attempts to collect a receivable have failed, the receivable is written off against the allowance.
Inventories
Inventories are stated at the lower of cost or market. For inventory used in system integration services, cost is calculated using the specific identification method. For the sale of computer hardware, cost is calculated using first-in, first-out method. Cost includes all costs of purchase, cost of conversion and other costs incurred in bringing the inventories to their present location and condition. Market value is determined by reference to the sales proceeds of items sold in the ordinary course of business after the balance sheet date or to management estimates based on prevailing market conditions.
Property, Plant, Equipment and Depreciation
Property, plant and equipment are stated at cost. Depreciation is computed using the straight-line method to allocate the cost of depreciable assets over the estimated useful lives of the assets as follows:
| | | Estimated useful life (in years) | |
| | | | |
| Building | | 20 | |
| Computer equipment | | 3 | |
| Office equipment | | 5 | |
| Motor vehicle | | 10 | |
Major improvements of property, plant and equipment are capitalized, while expenditures for repair and maintenance and minor renewals and betterments are charged directly to the statements of operations as incurred. When assets are disposed of, the related cost and accumulated depreciation thereon are removed from the accounts and any resulting gain or loss is included in the statement of operations.
Computer Software Development Costs
In accordance with SFAS No. 86 “Accounting for the Cost of Computer Software to be Sold, Leased or Otherwise Marketed,” software development costs are expensed as incurred until technological feasibility in the form of a working model has been established. Deferred software development costs will be amortized over the estimated economic life of the software once the product is available for general release to customers. For the current software products, the Company determined that technological feasibility was reached at the point in time it was available for general distribution. Therefore, no costs were capitalized.
Long term investments
The Company’s long term investments consist of (1) equity investments which are accounted for in accordance with the equity method and (2) cost investments which are accounted for under the cost method. Under the equity method, each such investment is reported at cost plus the Company’s proportionate share of the income or loss or other changes in stockholders’ equity of each such investee since its acquisition. The consolidated results of operations include such proportionate share of income or loss. See Note 8.
Correction of a prior year error
The Company made a correction on the calculation on its investment on Guangxi Caexpo International Trade and Logistics Co., Ltd. (Guangxi Caexpo) and changed the accounting method from cost method to equity method. The Company has 22.73% ownership of Guangxi Caexpo, and the cost method was used to record such investment because the Company believed that it did not have significant influence on the operations of Guangxi Caexpo. The Company subsequently studied APB No. 18 The Equity Method of Accounting for Investments in Common Stock and FIN 35: Criteria for Applying the Equity Method of Accounting for Investments in Common Stock, and now believes that the equity method is more appropriate to record its investment in Guangxi Caexpo. The impact of this change is illustrated as follows:
| | | Accumulative Impact - Year Ended December 31, 2008 | |
| Financial statement line item | | Cost method | | | Equity method | | | Difference | |
| | | | | | | | | | |
| Long-term investment | | | 5,074,622 | | | | 4,994,953 | | | | -79,669 | |
| Accumulated losses | | | -4,759,592 | | | | -4,839,261 | | | | -79,669 | |
| Investment income from equity method | | | 56,646 | | | | 9,408 | | | | -47,238 | |
| Gain/loss per share | | | -0.27 | | | | -0.28 | | | | -0.01 | |
Fair Values of Financial Instruments
The carrying amounts of financial instruments (cash and cash equivalents, investments, accounts receivable and accounts payable) approximate their fair values as of December 31, 2009 and 2008 because of the relatively short-term maturity of these instruments.
Goodwill
SFAS 142, Goodwill and Other Intangible Assets, requires that goodwill be tested for impairment on an annual basis (December 31 for us) and between annual tests if an event occurs or circumstances change that would more likely than not reduce the fair value of a reporting unit below its carrying value. These events or circumstances could include a significant change in the business climate, legal factors, operating performance indicators, competition, sale or disposition of a significant portion of a company. Application of the goodwill impairment test requires judgment, including the determination of the fair value of a company. The fair value of a company is estimated using a discounted cash flow methodology. This requires significant judgments including estimation of future cash flows, which is dependent on internal forecasts, estimation of the long-term rate of growth for our business, the useful life over which cash flows will occur, and the determination of our weighted average cost of capital. Changes in these estimates and assumptions could materially affect the determination of fair value and/or goodwill impairment for a company.
Revenue Recognition
The Company generally provides services under multiple element arrangements, which include software license fees, hardware and software sales, and the provision of system integration services including consulting, implementation, and software maintenance. The Company evaluates revenue recognition on a contract-by-contract basis as the terms of each arrangement vary. The evaluation of the contractual arrangements often requires judgments and estimates that affect the timing of revenue recognized in the statements of operations. Specifically, the Company may be required to make judgments about:
| | | whether the fees associated with our products and services are fixed or determinable; |
| | | whether collection of our fees is reasonably assured; |
| | | whether professional services are essential to the functionality of the related software product; |
| | | whether we have the ability to make reasonably dependable estimates in the application of the percentage-of-completion method; and |
| | | whether we have verifiable objective evidence of fair value for our products and services. |
The Company recognizes revenues in accordance with the provisions of Statements of Position, or SOP, No. 97-2, “Software Revenue Recognition,” as amended by SOP No. 98-9, “Modification of SOP 97-2, Software Revenue Recognition, with respect to Certain Transactions,” Staff Accounting Bulletin, or SAB, 104, “Revenue Recognition.” SOP 97-2 and SAB 104 require among other matters, that there be a signed contract evidencing an arrangement exists, delivery has occurred, the fee is fixed or determinable, and collectability is probable.
Software license revenue is recognized over the accounting periods contained in the terms of the relevant agreements, commencing upon the delivery of the software provided that (1) there is evidence of an arrangement, (2) the fee is fixed or determinable, and (3) collection of the fee is considered probable.
Revenue from non-software, multiple-element arrangements is recognized in accordance with Emerging Issues Task Force No. 00-21, “Revenue Arrangements with Multiple Deliverables” (“EITF No. 00-21”). Under EITF 00-21, the Company recognizes revenue from the multiple-deliverables which has value to the customer on a stand-alone basis. Deliverables in an arrangement that do not meet the separation criteria in EITF 00-21 are treated as one unit of accounting for purposes of revenue recognition.
In the case of maintenance revenues, vendor-specific objective evidence, or VSOE, of fair value is based on substantive renewal prices, and the revenues are recognized ratably over the maintenance period.
In the case of consulting and implementation services revenues, where VSOE is based on prices from stand-alone sale transactions, the revenues are recognized as services are performed pursuant to paragraph 65 of SOP 97-2.
For hardware transactions where software is incidental, the Company does not apply separate accounting guidance to the hardware and software elements. The Company applies the provisions of EITF 03-05, “Applicability of AICPA Statement of Position 97-2, Software Revenue Recognition, to Non-Software Deliverables in an Arrangement Containing More-Than-Incidental Software” (EITF 03-05). Per EITF 03-05, if the software is considered not essential to the functionality of the hardware, then the hardware is not considered “software related” and is excluded from the scope of SOP 97-2. Such sale of computer hardware is recognized as revenue on the transfer of risks and rewards of ownership, which generally coincides with the time when the goods are delivered to customers and title has passed, pursuant to SAB 104.
Remote hosting services, where VSOE is based upon consistent pricing charged to customers based on volumes and performance requirements on a stand-alone basis and substantive renewal terms, are recognized ratably over the contract term as the services are performed. The remote hosting arrangements generally require the Company to perform one-time set-up activities and include a one-time set-up fee. This one-time set-up fee is generally paid by the customer at contract execution. The Company has determined that these set-up activities do not constitute a separate unit of accounting, and accordingly the related set-up fees are recognized ratably over the term of the contract.
The Company is considering the applicability of EITF 00-3, “Application of AICPA Statement of SOP 97-2 to Arrangements That Include the Right to Use Software Stored on Another Entity’s Hardware,” to the hosting services arrangements on a contract-by-contract basis. If the Company determines that the customer does not have the contractual right to take possession of the Company’s software at any time during the hosting period without significant penalty, SOP 97-2 would not apply to these contracts in accordance with EITF 00-3. Accordingly, these contracts would be accounted for pursuant to SAP 104.
Stock Based Compensation
Effective January 1, 2006, we adopted Statement of Financial Accounting Standards 123(R), Share-Based Payment (SFAS 123(R)), using the modified prospective application transition method. Before we adopted SFAS 123(R), we accounted for share-based compensation in accordance with Accounting Principles Board Opinion No. 25, Accounting for Stock Issued to Employees.
SFAS 123(R) requires the Company to record the cost of stock options and other equity-based compensation in its income statement based upon the estimated fair value of those rewards. The Company elected to use the modified prospective method for adoption, which requires compensation expense to be recorded for all unvested stock options and other equity-based compensation beginning in the first quarter of adoption. Accordingly, prior periods have not been restated to reflect stock based compensation. On January 1, 2006, the Company adopted SFAS 123(R) using the modified prospective method, and the adoption of this standard did not have a material impact on the Company’s consolidated financial statements because most of the Company’s outstanding stock options were vested as of December 31, 2005 and the unvested portion of the stock options was considered immaterial.
SFAS 123(R) also requires the Company to estimate forfeitures in calculating the expense relating to share-based compensation as opposed to recognizing forfeitures as an expense reduction as they incur. The adjustment to apply estimated forfeitures to previously share-based compensation was considered immaterial by the Company and as such was not classified as a cumulative effect of a change in accounting principle. As of January 1, 2006, the Company had no unrecognized compensation cost remaining associated with existing stock option grants. Also, the Company made no modifications to outstanding stock option grants prior to the adoption of Statement No. 123(R), and there were no changes in valuation methodologies or assumptions compared to those used by the Company prior to January 1, 2006.
In November 2005, the FASB issued FSP No. 123(R)-3, “Transition Election Related to Accounting for the Tax Effects of Share-Based Payment Awards.” The Company adopted the alternative transition method provided in the FSP for calculating the tax effects of share-based compensation pursuant to FAS 123(R) in the fourth quarter of fiscal 2006. The alternative transition method includes simplified methods to establish the beginning balance of the Additional Paid-in Capital (“APIC”) pool related to the tax effects of employee share-based compensation, and to determine the subsequent impact on the APIC pool and Consolidated Statements of Cash Flows of the tax effects of employee share-based compensation awards that are outstanding upon adoption of FAS 123(R). The adoption did not have a material impact on the Company’s results of operations and financial position.
In February 2006, the FASB issued FASB Staff Position No. FAS 123(R)-4, “Classification of Options and Similar Instruments Issued as Employee Compensation That Allow for Cash Settlement upon the Occurrence of a Contingent Event.” This position amended SFAS 123(R) to incorporate that a cash settlement feature that can be exercised only upon the occurrence of a contingent event that is outside the employee’s control does not meet certain conditions in SFAS 123(R) until it becomes probable that the event will occur. The guidance in this FASB Staff Position was required to be applied upon initial adoption of Statement No. 123(R). The Company does not have any option grants that allow for cash settlement.
The Company did not adopt any new share-based compensation plans in 2008. 200,000 stock options issued under the Company’s 2002 Stock Plan were exercised during the year 2008.
Advertising costs
All advertising costs incurred in the promotion of the Company’s products and services are expensed as incurred. Advertising expenses were insignificant for 2009 and 2008.
Income Taxes
The Company accounts for income taxes in accordance with SFAS No. 109 “Accounting for Income Taxes.” Under SFAS No. 109, deferred tax liabilities or assets at the end of each period are determined using the tax rate expected to be in effect when taxes are actually paid or recovered. Valuation allowances are established when it is more likely than not that some or all of the deferred tax assets not be realized.
In July, 2006, the FASB Interpretation No. 48, Accounting for Uncertainty in Income Taxes-an interpretation of FASB Statement No. 109 (FIN 48). This Interpretation provides guidance for recognizing and measuring uncertain tax positions, as defined in SFAS No. 109, Accounting for Income Taxes. FIN 48 prescribes a threshold condition that a tax position must meet for any of the benefit of the uncertain tax position to be recognized in the financial statements. Guidance is also provided regarding derecognition, classification and disclosure of these uncertain tax positions.
Earnings Per Common Share
The Company computes net earnings per share in accordance with SFAS No. 128, “Earnings per Share” and SEC Staff Accounting Bulletin No. 98 (“SAB 98”). Under the provisions of SFAS No. 128 and SAB 98, basic net earnings per share is computed by dividing the net earnings available to common shareholders for the period by the weighted average number of shares of common stock outstanding during the period. The calculation of diluted net earnings per share gives effect to common stock equivalents; however, potential common stock in the diluted EPS computation is excluded in net loss periods, as their effect is anti-dilutive.
Recent Accounting Pronouncements
In June 2009, the FASB issued FAS 168 “The FASB Accounting Standards CodificationTM and the Hierarchy of Generally Accepted Accounting Principles—a replacement of FASB Statement No. 162 (Codification)”. The Codification will become the source of authoritative U.S. generally accepted accounting principles (GAAP) recognized by the FASB to be applied by nongovernmental entities. Rules and interpretive releases of the Securities and Exchange Commission (SEC) under authority of federal securities laws are also sources of authoritative GAAP for SEC registrants. On the effective date of this Statement, the Codification will supersede all then-existing non-SEC accounting and reporting standards. All other non-grandfathered non-SEC accounting literature not included in the Codification will become non-authoritative. This statement is effective for financial statements issued for interim and annual periods ending after September 15, 2009.
In June 2009, the FASB issued FAS 167, “Amendments to FASB Interpretation No. 46(R)”. This statement amends certain guidance in Interpretation 46(R) for determining whether an entity is a variable interest entity. This Statement is effective as of the beginning of each reporting entity’s first annual reporting period that begins after November 15, 2009
In May 2009, the FASB issued FAS 165, “Subsequent Events” The objective of this statement is to establish general standards of accounting for and disclosure of events that occur after the balance sheet date but before financial statements are issued or are available to be issued.
The Company does not anticipate that the adoption of the above statements will have a material effect on the Company's financial condition and results of operations.
In September 2009, new guidance was introduced on revenue recognition on arrangements with multiple elements and certain revenue arrangements that include software. The new guidance will allow companies to allocate consideration in a multiple element arrangement in a way that better reflects the economics of the transaction.. Under this guidance, tangible products that have software components that are “essential to the functionality” of the tangible product will be scoped out of the software revenue guidance. The new guidance will also result in more disclosure requirements. The new guidance will be effective on January 1, 2011, with early adoption permitted. The Company is currently evaluating the impact of adopting the new guidance.
NOTE 3 - ACCOUNTS RECEIVABLE AND ALLOWANCE FOR DOUBTFUL ACCOUNTS
Accounts receivable are customer obligations due under normal trade terms. The Company performs continuing credit evaluations of the customers’ financial conditions and the Company generally does not require collateral.
Senior management reviews accounts receivable from time to time to determine if any receivables will potentially be uncollectible. The Company included any accounts receivable balances that are determined to be uncollectible in the allowance for doubtful accounts. After all attempts to collect a receivable have failed, the receivable is written off against the allowance. Based on the information available to the Company, $0 for doubtful accounts as of December 31, 2009 ($54,400 for 2008) is required.
NOTE 4 - OTHER RECEIVABLES, DEPOSITS AND PREPAYMENTS
| | December 31, | | December 31, | |
| | 2009 | | 2008 | |
| | | | | |
| Other receivables | $ | 675,801 | | $ | 1,545,025 | |
| Deposits | | 3,661 | | | 58,875 | |
| Prepayments | | 7,951 | | | 23,655 | |
| | | | | | | |
| | $ | 687,413 | | $ | 1,627,555 | |
Other receivables include deposits for operating leases and advances to employee for traveling outlays.
NOTE 5 - INVENTORIES
| | December 31, | | December 31, | |
| | 2009 | | 2008 | |
| | | | | |
| Computer hardware and software | $ | 23,784 | | $ | 13,335 | |
| Work-in-progress | | 911,782 | | | 1,006,378 | |
| | | | | | | |
| | $ | 935,566 | | $ | 1,019,713 | |
All the inventories were purchased for identified system integration contracts.
Work-in-progress includes payroll and other operating expenses associated with various contracts in progress.
NOTE 6 - RELATED PARTY
The Company has had and expects to have transactions in the ordinary course of business with its stockholders, directors, senior officers and other affiliates (and their associates) on substantially the same terms as those prevailing for comparable transactions with others. Listed below is a summary of material relationships or transactions with the Company’s stockholders, directors, senior officers and other affiliates:
Amounts due to stockholders
The Company, from time to time, received from or made repayment to one major stockholder who is also a member of management of the Company. The amounts due to stockholders do not bear any interest and do not have clearly defined terms of repayment.
As of December 31, 2009 and 2008, the amounts due to stockholders represented advances from stockholders with the amount of $415,078 and $378,672, respectively.
Related Party Transactions
| | | Sales | | | Receivable | | | Customer Deposit | |
| | | Year Ended Dec 31, | | | As of Dec 31, | | | As of Dec 31, | |
Related party | | 2009 | | | 2008 | | | 2009 | | | 2008 | | | 2009 | | | 2008 | |
| | | | | | | | | | | | | | | | | | | |
| All China | | | - | | | | - | | | | 12,140 | | | | 501,642 | | | | 61,385 | | | | 48,246 | |
| Guangxi Caexpo | | | 2,218,118 | | | | - | | | | 1,779,550 | | | | 294,262 | | | | - | | | | - | |
SDLD | | | 223,059 | | | | 123,619 | | | | - | | | | - | | | | 7,311 | | | | 9,752 | |
| Total | | $ | 2,441,177 | | | $ | 123,619 | | | $ | 1,791,690 | | | $ | 795,904 | | | $ | 68,696 | | | $ | 57,998 | |
NOTE 7 - PROPERTY, PLANT AND EQUIPMENT, NET
| | | December 31, | | | December 31, | |
| | | 2009 | | | 2008 | |
| | | | | | | |
| Building | | $ | 213,705 | | | $ | 213,705 | |
| Computer and office equipment | | | 1,061,915 | | | | 1,060,165 | |
| Motor vehicles | | | 211,698 | | | | 211,698 | |
| | | | 1,487,318 | | | | 1,485,568 | |
| Less: Accumulated depreciation | | | (1,095,647 | ) | | | (891,763 | ) |
| | | | | | | | | |
| | | $ | 391,671 | | | | 593,805 | |
The building is located in Chengdu, PRC and was purchased on behalf of the Company by Mr. Yi He, a Company director and stockholder. By a stockholders’ resolution passed on March 8, 1999, it was ratified that the title to the building belonged to the Company. In 2005, the title to the building was transferred to the Company.
NOTE 8 - LONG TERM INVESTMENTS
| | | December 31, | | | December 31, | |
| | | 2009 | | | 2008 | |
| | | | | | | |
| Equity investments | | $ | 3,766,876 | | | $ | 4,054,225 | |
| Cost investments | | | 940,260 | | | | 940,728 | |
| | | | | | | | | |
| | | $ | 4,707,136 | | | | 4,994,953 | |
In December 2003, the Company invested $760,870 in a privately held PRC company, All China Logistics Online Co., Ltd., for a 17.8% equity interest. The Company has recorded the investment at cost because it does not have the ability to exercise significant influence over the investee.
On October 24, 2005, the Company set up China Liquid Chemical Exchange Company Limited, a limited liability company in PRC, and shares the risk and rewards up to the equity interest of 13.46%. The consideration is made in form of the Company-developed “For-Online Electronic Trading System” without any cash outflow. Therefore, the Company recorded the contribution of software at the lower of its carrying amount or fair value, and accounted for under the equity method under SOP 78-9. As of December 31, 2009 and 2008, the Company’s share of the joint venture’s profit (loss) was $119,746 and $205,505, respectively.
On October 3, 2006, the Company acquired 22.73% of registered capital in Guangxi Caexpo International Trade and Logistics Co., Ltd. (“Guangxi Caexpo”), a private held PRC company, from Statelink International Group, Ltd., a company incorporated in the British Virgin Islands (“Statelink”). Consideration paid to Statelink for this acquisition included a cash payment of $2,557,545 (RMB 20,000,000) by BFHX and 13,000,000 shares of the Company’s restricted common stock. The acquisition cost of the common shares issued to Statelink is based on a per share price of $0.075, which was the average market price of the Company’s common shares over a 10-day period before and after the terms of the acquisition were agreed to. The overall acquisition cost was $3,529,450. After study of APB No. 18: The Equity Method of Accounting for Investments in Common Stock, and FIN 35: Criteria for Applying the Equity Method of Accounting for Investments in Common Stock, the Company changed the accounting treatment of this acquisition from cost method to equity method. See Note 2 for the impact of this change.
On October 12, 2006, the Company entered into a definitive agreement to acquire 12.5% of registered capital in Wuxi Stainless Steel Exchange Co., Ltd. (“Wuxi”), a private held PRC company. In exchange for the 12.5% registered capital, the Company was to deploy a proprietary, integrated software solution (“software”), estimated at RMB 1,000,000, by reference to the similar products sold to third parties in 2006, to support Wuxi’s operations, plus RMB 250,000 cash payment to Wuxi. In 2006, the Company contributed cash of $31,969 (RMB 250,000), the software been deployed to Wuxi in December 2006. The Company recorded the investment at cost because it does not have the ability to exercise significant influence over Wuxi. On January 14, 2007, the Company entered into a Share Transfer Agreement with a major shareholder of Wuxi to transfer 2.5% interest in Wuxi held by the Company to the major shareholder for a cash payment of RMB 500,000. After this transfer, the Company continues to hold a 10% equity interest in Wuxi.
On April 29, 2007, the Company invested $138,158 in a privately held PRC company, Beijing GuoXin Forlink Internet Technologies Limited (“BGXF”), for a 35% equity interest. The Company’s investment was made through BFHX. The investment in BGXF is accounted for under the equity method of the accounting due to the Company’s significant influence over the operational and financial policies of BGXF. On March 9, 2008, BGXF commenced operations.
On September 17, 2007, the Company invested $99,734 in a privately held PRC Company, Ningbo Bulk Commodities Exchange Corporation Limited (“NBBCE”), for a 25% equity interest. The Company’s investment was made through BFHX. The Company recorded the investment at cost as the Company does not have the ability to exercise significant influence over NBBCE because NBBCE’s strategic and business decisions are dominated by another major shareholder.
On March 20, 2008, Forlink invested $71,124 (500,000 RMB), through BFHX, in Shandong LongDong Internet Technologies Limited (“SDLD”), a PRC limited liability company, established on October 24, 2007, for a 5% equity interest. SDLD, which commenced operations in December 2007, is in the business of providing of providing primary products e-commerce services. The purpose of this investment is to gain cash dividends from SDLD.
NOTE 9 - GOODWILL
Goodwill represents the excess of the acquisition cost of Beijing Slait Science & Technology Development Limited Co. (“Slait”) over the estimated fair value of net assets acquired as of August 27, 2001 as described in Note 1.
The acquisition was completed after June 30, 2001, and no amortization of goodwill was necessary in accordance with SFAS No. 142 “Goodwill and other Intangible Assets.”
However, in the quarter ended June 30, 2002, the closing trading price of the Company’s common stock had fallen to $0.05 per share, which indicated that there might be a potential impairment of goodwill since January 1, 2002. Therefore, the Company performed an additional impairment test as of June 30, 2002. As a result of the impairment test performed, which was based on the fair value of the Company as determined by the trading price of the Company’s common stock, an impairment of $5,308,760 was recorded in the quarter ended June 30, 2002. As the closing trading price of the Company’s common stock as of December 31, 2002 had fallen to $0.04 per share, a total impairment of $6,966,546 was recorded for the year ended December 31, 2002.
Since December 31, 2003, the Company has conducted an annual impairment test at December 31 of each year. Based on the results of the first step of such tests, the Company believes that there was no further impairment of goodwill as of December 31, 2004, 2005, 2006, and 2007.
During 2008, especially in the last two quarters, the price of the Company’s common stock was impacted by declines in the overall financial market and had fallen to $1.20 per share at September 30, 2008, and $0.90 per share at December 31, 2008. The goodwill was determined from the difference between the fair value of the Company’s common stock and the book value of the Company’s net assets. The result of the annual impairment test for 2008 indicated that the goodwill had been impaired by the declining prices, and the fair value of common stock was much lower than the net assets of the book value. The Company believed that the impairment was other than temporary. Based on the result of the impairment testing, the balance of $1,684,023 was written off for the year ended December 31, 2008. The balance was zero for the year ended December 31, 2009.
NOTE 10 - OTHER PAYABLES AND ACCRUED EXPENSES
| | | December 31, | | | December 31, | |
| | | 2009 | | | 2008 | |
| | | | | | | |
| Other payables | | $ | 221,972 | | | $ | 428,334 | |
| Accrued salaries & wages | | | 313,696 | | | | 176,985 | |
| Other accrued expenses | | | - | | | | - | |
| | | | | | | | | |
| | | $ | 535,668 | | | $ | 605,319 | |
NOTE 11 – NON-CONTROLLING INTEREST
The non-controlling interest balance of $151,785 represents cash provided by minority shareholders of NNBCE.
NOTE 12 - INCOME TAX
According to the relevant PRC tax rules and regulations, FTCL, which is recognized as a New Technology Enterprise operating within a New and High Technology Development Zone, is entitled to an Enterprise Income Tax (“EIT”) rate of 15%.
Pursuant to approval documents dated September 23, 1999 and August 2, 2000 issued by the Beijing Tax Bureau and State Tax Bureau respectively, FTCL was fully exempted from EIT for fiscal years 1999, 2000, 2001 and 2002. FTCL received a 50% EIT reduction at the rate of 7.5% for fiscal years 2003, 2004 and 2005. As of December 31, 2009, FTCL was entitled to an EIT rate of 15%.
Pursuant to an approval document dated January 19, 2004 issued by the State Tax Bureau, BFHX was fully exempted from EIT for fiscal years 2004, 2005 and 2006. As of December 31, 2009, BFHX was entitled to an EIT rate of 25%.
Hong Kong profits tax is calculated at 17.5% on the estimated assessable profits of FTHK for the period. The EIT rate for FTCD, FTGX and NNBCE is 25%. No provision for EIT and Hong Kong profits tax were made for FTCL, FTCD, FTGX, NNBCE and FTHK as they have not gained taxable income for the periods.
On January 1, 2007, the Company adopted FASB Interpretation No. 48, Accounting for Uncertainty in Income Taxes-an interpretation of FASB Statement No. 109 (FIN 48). This Interpretation provides guidance for recognizing and measuring uncertain tax positions, as defined in SFAS No. 109, Accounting for Income Taxes. FIN 48 prescribes a threshold condition that a tax position must meet for any of the benefits of the uncertain tax position to be recognized in the financial statements. Guidance is also provided regarding derecognition, classification and disclosure of these uncertain tax positions. The Company classified all interest and penalties related to tax uncertainties as income tax expense. The Company’s liability for income taxes includes the liability for unrecognized tax benefits, interest and penalties which relate to tax years still subject to review by taxing authorities. Audit periods remain open for review until the statute of limitations has passed. The completion of review or the expiration of the statute of limitations for a given audit period could result in an adjustment to our liability for income taxes. Any such adjustment could be material to the Company’s results of operations for any given quarterly or annual period based, in part, upon the results of operations for the given period. As of December 31, 2007, the Company does not have any liability for uncertain tax positions. The adoption of FIN 48 did not have a material impact on the Company’s results operations, financial position or liquidity.
On March 16, 2007, the 5th Plenary Session of the 10th National People's Congress passed the Corporate Income Tax Law of the PRC ("the New Corporate Income Tax Law"), which took effect on January 1, 2008. Beginning on that date, the EIT rate is expected to gradually increase to the standard rate of 25% over a five-year transition period. However, the New Corporate Income Tax Law does not specify how the existing preferential tax rate will gradually increase to the standard rate of 25%. Also, under the New Corporate Income Tax Law, certain high technology enterprises will continue to be entitled to a reduced tax rate of 15%. However, the implementation rules regarding the preferential tax policies (e.g. the details on how the taxpayer can qualify as a high-tech enterprise under the New Corporate Income Tax Law) have yet to be made public. Consequently, the Company is not able to make an estimate of the expected financial effect of the New Corporate Income Tax Law on its deferred tax assets and liabilities. The enactment of the New Corporate Income Tax Law did not have any financial effect on the provision for income tax for the year ended December 31, 2009 and on the amounts accrued in the balance sheet in respect of current tax payable.
Reconciliation between the provision for income taxes computed by applying the statutory tax rate in Mainland China to income before income taxes and the actual provision for income taxes is as follows:
| | | YE 2009 | | | | YE 2008 | |
| | | USD | | | | USD | |
| Provision of income taxes at statutory tax rate of 15% | | | 11,457 | | | | | (199,190 | ) |
| Tax holidays and concessions | | | - | | | | | - | |
| Effect of different tax rate of a subsidiary operating in Hong Kong | | | 135,645 | | | | | 2,880 | |
| Permanent difference | | | (165,528 | ) | | | | 210,879 | |
| Increase in valuation allowance | | | - | | | | | (33,529 | ) |
| Timing different on revenue recognition & FA, etc. | | | (39,882 | ) | | | | 28,912 | |
| Others | | | - | | | | | (336 | ) |
| Effective tax | | | (58,308 | ) | | | | 9,616 | |
NOTE 13 - OTHER TAXES RECOVERABLE/(PAYABLE)
Other taxes payable comprise mainly of the Valued-Added Tax (“VAT”) and Business Tax (“BT”). The Company is subject to output VAT levied at the rate of 17% of its operating revenue. The input VAT paid on purchases of materials and other direct inputs can be used to offset the output VAT levied on operating revenue to determine the net VAT payable or recoverable. BT is charged at a rate of 5% on the revenue from other services.
As part of the PRC government’s policy of encouraging software development in the PRC, companies that fulfill certain criteria set by the relevant authorities, and which develop their own software products and have the software products registered with the relevant authorities in the PRC, are entitled to a refund of VAT equivalent to the excess over 3% of revenue paid in the month when output VAT exceeds input VAT (excluding export sales). The excess portion of the VAT is refundable and is recorded by the Company on an accrual basis. The VAT rebate included in other income was $298,254 and $72,533 for the years ended December 31, 2009 and 2008, respectively.
NOTE 14 - COMMITMENTS AND CONTINGENCIES
Operating Lease Commitment
During the years ended December 31, 2009 and 2008, the Company incurred lease expenses amounting to $361,336 and $489,583 respectively. As of December 31, 2009 and 2008, the Company had commitments under non-cancelable operating leases, requiring annual minimum rentals as follows:
| | | December 31, | | | December 31, | |
| | | 2009 | | | 2008 | |
| January 1, 2009 to December 31, 2009 | | $ | 474,411 | | | $ | 442,062 | |
| January 1, 2010 to December 31, 2010 | | | 475,522 | | | | 438,809 | |
| January 1, 2011 to December 31, 2011 | | | 97,726 | | | | 149,427 | |
| | | | | | | | | |
| | | $ | 1,047,659 | | | $ | 1,030,298 | |
NOTE 15 - STOCK PLAN
On August 16, 2002, the Company established the “Forlink Software Corporation, Inc. 2002 Stock Plan” (the “2002 Plan”), and reserved 8,000,000 shares of common stock for issuance under the 2002 Plan either directly as stock awards or underlying options . The board of directors would determine the terms and conditions of each option granted under the 2002 plan, which terms and conditions would be in writing and may vary from one eligible participant to another. On August 15, 2007, the 2002 Plan expired pursuant to its terms.
The following table summarizes the activities of stock options granted under the 2002 Plan prior to its expiration:
| | | Number of shares | | | Weighted average exercise price | |
| Granted on September 7, 2004 | | | 3,315,000 | | | $ | 0.10 | |
| Exercised | | | (15,000 | ) | | $ | (0.10 | ) |
| Forfeited or Cancelled | | | 0 | | | $ | 0.00 | |
| Outstanding at December 31, 2004 | | | 3,300,000 | | | $ | 0.10 | |
| Exercised | | | (136,500 | ) | | $ | (0.10 | ) |
| Forfeited or Cancelled | | | (132,500 | ) | | $ | (0.10 | ) |
| Outstanding at December 31, 2005 | | | 3,031,000 | | | $ | 0.10 | |
| Exercised | | | 0 | | | $ | 0.00 | |
| Forfeited or Cancelled | | | (1,734,000 | ) | | $ | (0.10 | ) |
| Outstanding at December 31, 2006 | | | 1,297,000 | | | $ | 0.10 | |
| Exercised | | | (897,000 | ) | | $ | (0.10 | ) |
| Forfeited or Cancelled | | | 0 | | | $ | 0.00 | |
| Outstanding at December 31, 2007 | | | 400,000 | | | $ | 0.10 | |
| Exercised | | | 200,000 | | | | 0.00 | |
| Forfeited or Cancelled | | | 200,000 | | | | 0.00 | |
| Outstanding at December 31, 2008 | | | 0 | | | | 0.10 | |
| Fully vested and exercisable at December 31, 2009 | | | 0 | | | $ | 0.10 | |
On September 7, 2004, 3,315,000 options were granted to the Company’s employees to purchase the Company’s shares of common stock, $0.001 par value, at an exercise price of $0.10 per share. Of the 3,315,000 options, 800,000 options with a 5-year vesting period were granted to an employee, and 2,515,000 options with a 3-year vesting period were granted to selected employees. Of the 2,515,000 options with the 3-year vesting period, 2,385,000 options was to expire on December 30, 2006 (the “December 2006 Options”), while the remaining 130,000 options expired on June 30, 2007 (the “June 2007 Options”). The expiration date for 800,000 options with the 5-year vesting period is June 30, 2009 (the “June 2009 Options”). On September 7, 2004, January 1, 2005, January 1, 2006 and January 1, 2007, 854,500 (the “December 2006 Options”), 904,500, 1,156,000 (400,000 of “June 2009 Options”; 130,000 of “June 2007 Options”; and 626,000 of “December 2006 Options”) and 200,000 (the “June 2009 Options”) options were vested to employees respectively. The market price of the stock as of September 7, 2004 and January 1, 2005 was $0.10 per share. In December 2006, the Company extended the expiration date of the December 2006 Options by one month to the end of January 2007, but there was no additional compensation expense as the Company considered the amount was immaterial. On January 29, 2007, 367,000 options of the “December 2006 Options” and 400,000 of the “June 2009 options” were exercised. On July 6, 2007, 130,000 options of the “June 2007 Options” were exercised.
The following table summarizes the cumulative activities up to December 31, 2009 of the options issued under the 2002 Plan with different expiration dates:
| | | Granted | | Exercised | | Forfeited or Cancelled | | Outstanding at December 31, 2009 |
| December 2006 Options | | | 2,385,000 | | 518,500 | | | 1,866,500 | | 0 |
| June 2007 Options | | | 130,000 | | 130,000 | | | 0 | | 0 |
| June 2009 Options | | | 800,000 | | 600,000 | | | 200,000 | | 0 |
| | | | 3,315,000 | | 1,248,500 | | | 2,066,500 | | 0 |
The weighted average fair value of the December 2006 Options, the June 2007 Options and the June 2009 Options granted on the date of grant, were $0.042, $0.046 and $0.058 per option, respectively. At December 31, 2009, all future compensation expenses were recognized.
There was no aggregate intrinsic value of options outstanding and exercisable as of December 31, 2009 and December 31, 2008. The aggregate intrinsic value represents the intrinsic value, based on options with an exercise price less than the market value of the Company’s stock on December 31, 2009 and December 31, 2008 which would have been received by the option holders had those option holders exercised those options at of that date.
The Company calculated the fair value of each option award on the date of grant using the Black-Scholes option pricing model. The following assumptions were used for each respective option.
| | | The value of Options | |
| | | December 2006 Options | | | June 2007 Options | | | June 2009 Options | |
| | | | | | | | | | |
| Risk-free interest rate | | | 2.17 | % | | 2.28 | % | | 2.66 | % |
| Expected lives (in years) | | | 1.167 | | | 1.417 | | | 2.417 | |
| Dividend yield | | | 0 | % | | 0 | % | | 0 | % |
| Expected volatility | | | 100 | % | | 100 | % | | 100 | % |
NOTE 16 - CONCENTRATION OF CUSTOMERS
During the year, the following customers accounted for more than 10% of total sales:
| | | Years Ended |
| December 31, |
| | | 2009 | | 2008 |
| Net sales derived from - Customer A | | | 880,266 | | 2,089,554 |
| - Customer B | | | 2,218,118 | | * |
| - Customer C | | | * | | * |
| -Customer D | | | * | | * |
| - Customer E | | | * | | 2,148,539 |
| | | | | | |
| % to total net sales - Customer A | | | 14% | | 38% |
| - Customer B | | | 35% | | * |
| - Customer C | | | * | | * |
| -Customer D | | | * | | * |
| - Customer E | | | * | | 39% |
| | | | | | |
| Account receivable from - Customer A | | | * | | 232,750 |
| - Customer B | | | 1,779,550 | | * |
| - Customer C | | | 267,112 | | * |
| -Customer D | | | * | | * |
| - Customer E | | | * | | 244,657 |
| | | | | | |
| % to total accounts receivable- Customer A | | | * | | 26% |
| - Customer B | | | 73% | | * |
| - Customer C | | | 11% | | * |
| -Customer D | | | * | | * |
| - Customer E | | | * | | 27% |
* less than 10%
Note 17 – GAIN (LOSS) PER SHARE
The Company reported a profit of 0.13 per share for the year 2009 but a loss of $(0.28) per share for the year 2008.
Note 18 – SUBSEQUENT EVENT
The Company transferred all its ownership interests in FTCL to BFHX for the amount of FTCL’s 100% fully paid up capital on February 8, 2010.
Item 9. Changes in and Disagreements with Accountants on Accounting and Financial Disclosure.
None.
Item 9A(T). Controls and Procedures.
Evaluation of Disclosure Controls and Procedures
Our management evaluated our disclosure controls and procedures (as defined in Rule 13a-15(e) or Rule 15a-15(e) under the Securities Exchange Act of 1934, as amended (the “Exchange Act”)) and internal control over financial reporting. The evaluation was conducted under the supervision and with the participation of our Chief Executive Officer (“CEO”) and Chief Financial Officer (“CFO”), of the effectiveness of the design and operation of our disclosure controls and procedures (“Disclosure Controls”) as of the end of the period covered by this report pursuant to Rule 13a-15 of the Exchange Act. Based on this Evaluation, our CEO and CFO concluded that our Disclosure Controls were effective as of the end of the period covered by this report. In addition, no change in internal control over financial reporting occurred during the year ended December 31, 2009, that has materially affected, or is reasonably likely to materially affect, such internal control over financial reporting. It should be noted that any system of controls is based in part upon certain assumptions designed to obtain reasonable (and not absolute) assurance as to its effectiveness, and there can be no assurance that any design will succeed in achieving its stated goals. Notwithstanding this caution, the CEO and CFO have reasonable assurance that the disclosure controls and procedures were effective as of December 31, 2009.
Management’s Report on Internal Control Over Financial Reporting
Our management is responsible for establishing and maintaining adequate internal control over financial reporting as defined in Rules 13a-15(f) and 15d-15(f) under the Exchange Act. The Company’s internal control over financial reporting is a process designed to provide reasonable assurance regarding the reliability of financial reporting and the preparation of financial statements for external purposes in accordance with generally accepted accounting principles in the United States of America.
Because of its inherent limitations, internal control over financial reporting may not prevent or detect misstatements. Also, projections of any evaluation of effectiveness to future periods are subject to the risk that controls may become inadequate because of changes in conditions, or that the degree of compliance with internal control policies or procedures may deteriorate.
Management assessed the effectiveness of the Company’s internal control over financial reporting as of December 31, 2009. In making this assessment, management used the criteria set forth by the Committee of Sponsoring Organizations of the Treadway Commission (COSO) in Internal Control - Integrated Framework. Management’s assessment included evaluating the design of the Company’s internal control over financial reporting and testing of the operational effectiveness of the Company’s internal control over financial reporting. Based on our assessment, we concluded that, as of December 31, 2009, the Company’s internal control over financial reporting was effective based on the criteria issued by COSO in Internal Control – Integrated Framework.
This report does not include an attestation report of our registered public accounting firm regarding internal control over financial reporting. Management’s report was not subject to attestation by our registered public accounting firm pursuant to temporary rules of the Securities and Exchange Commission that permit us to provide only management’s report in this Form 10-K.
Changes in Internal Controls
There were no changes in our internal control over financial reporting (as defined in Rules 13a-15(f) and 15d-15(f) under the Securities Exchange Act of 1934, as amended) during the quarter ended December 31, 2009 that have materially affected, or are reasonably likely to materially affect, our international control over financial reporting.
| Item 9B. | Other Information. |
None.
PART III
| Item 10. | Directors, Executive Officers, and Corporate Governance |
As of December 31, 2009 and as of the date of the filing of this report, the directors and executive officers of the Company, their ages, positions in the Company, the dates of their initial election or appointment as director or executive officer, and the expiration of the terms as directors (if applicable) were as follows:
| Name | | Age | | Position | | Since |
| | | | | | | |
| Yi He | | 43 | | Chief Executive Officer, Chairman of the board of directors | | August 2001 |
| | | | | | | |
| Hongkeung Lam | | 57 | | Chief Financial Officer, Chief Accounting Officer, Secretary and Director | | August 2001 |
| | | | | | | |
| Guoliang Tian | | 70 | | Director | | May 2003 |
| | | | | | | |
| Yu Fang | | 63 | | Director | | May 2003 |
| | | | | | | |
| Zhenying Sun | | 53 | | Director | | November 2006 |
The Company's directors hold office until their successors are elected and qualified. The Company's officers are appointed annually by the board of directors and serve at the pleasure of the Board.
Yi He has been a director of the Company since August 2001, and the Chief Executive Officer since May 2003. Mr. He is the founder of Beijing SLAIT Science & Technology Development Limited Co., where he served as Chairman and President from January 1998 to August of 2001. From March 1993 to January 1998, Mr. He was the President of Beijing Sunny Computer System Engineering Co. Mr. He has a Master Degree in Computer Science from Peking University.
Hongkeung Lam has been the Chief Financial Officer, Chief Accounting Officer, Secretary and a director of the Company since August 2001. From July 2000 to August 2001, Mr. Lam was the Chairman of Beijing Hi Sun In Soft Information Technology Ltd. From June 1998 to June 2000, Mr. Lam was the Chairman and President of Beijing Jinshili Information Technology Ltd. From 1992 to February 1998, Mr. Lam was the Manager of Beijing office of Taiwan Acer Computer (Far East) Co.
Guoliang Tian has been a director of the Company since May 2003. Currently, Mr. Tian is a professor with the Institute of Remote Sensing Applications at the Chinese Academy of Sciences, where he has been employed since 1986, and he is in charge of the study of natural disaster monitoring and assessment. His areas of expertise and studies involve the use of remote sensing data to research and monitor geographic and atmospheric changes. He has published 105 papers and 4 books. In 1965, Mr. Tian received a degree in physics from Jilin University of China.
Yu Fang has been a director of the Company since May 2003. Currently Mr. Fang is a professor at Peking University, where he has been employed since 1987. He has served as the Vice Director of the Institute of Remote Sensing and Geographic Information System at Peking University since 2001. From 1982 until 2000, he worked in the Department of Computer Science & Technology at Peking University, and served as Vice Chairman of the Department of Computer Science & Technology at Peking University from 1987 to 1999. His areas of expertise and studies are software engineering, geographic information systems, management information systems, and parallel processing and distribution systems. He has written 68 articles and 5 books. In 1982, Mr. Fang received a Masters Degree in Computer Science at Peking University after graduating from the Department of Mathematics at Peking University in 1968.
Zhenying Sun has been a director of the Company since November 2006. Ms. Sun is currently the President of New West International, Inc., a real estate development and trading company, and she has held this position since 2001. Ms. Sun is also a director of Statelink International Group, Inc. From 2003 until the present, Ms. Sun has also served as the Finance Director of Nanning New West Property & Investment Ltd. Ms. Sun graduated with a degree in accounting from Beijing Xicheng Finance & Trade School in 1990. Ms. Sun also graduated with a degree in accounting from the Machine Industry Management Staff College, which she attended from 1990 to 1992.
Family Relationships
There are no family relationships between or among any of our current directors, executive officers or persons nominated or charged by the Company to become directors or executive officers. There are no family relationships among our officers and directors and the officers and directors of our direct and indirect subsidiaries.
Involvement in Certain Legal Proceedings
None.
Audit Committee and Audit Committee Financial Expert Disclosure
The Company does not have a separately designated standing audit committee at this time because it is not required to do so. Accordingly, the Company does not have an audit committee financial expert.
Material Changes to the Procedures by which Security Holders May Recommend Nominees to the board of directors
There have been no material changes to the procedures by which security holders may recommend nominees to the board of directors.
Code of Ethics
On August 3, 2004, the board of directors established a written code of ethics that applies to the Company’s senior executive and financial officers. A copy of the code of ethics is posted on the Corporation’s web-site at www.forlink.com.
Compliance With Section 16(a) of the Securities Exchange Act of 1934
Section 16(a) of the Securities Exchange Act of 1934 requires the Company's officers and directors, and persons who own more than 10% of a registered class of the Company's equity securities, to file reports of ownership and changes in ownership with the Securities and Exchange Commission (“SEC”). Officers, directors, and greater than 10% shareholders are required by SEC regulation to furnish the Company with copies of all Section 16(a) forms they file. Based solely on review of copies of such reports received or written representations from certain reporting persons, the Company believes that, during the year ended December 31, 2009, all Section 16(a) filing requirements applicable to its officers, directors and ten percent shareholders were in compliance with SEC regulations.
| Item 11. | Executive Compensation. |
The following summary compensation table indicates the cash and non-cash compensation earned for years ended December 31, 2009 and 2008 by our Chief Executive Officer and each of our other two highest paid executives, whose total compensation exceeded $100,000 (if any) for the years ended December 31, 2009 and 2008.
| SUMMARY COMPENSATION TABLE | |
Name and Principal Position | | Year | | Salary ($) | | Bonus ($) | | Stock Awards ( $) | | Option Awards ($) | | Non-Equity Incentive Plan Compensation ($) | | Nonqualified Deferred Compensation Earnings ($) | | All Other Compensation ( $) | | Total ($) | |
| Yi He, | | | 2009 | | 43,924 | | | -0- | | -0- | | | -0- | | -0- | | | -0- | | -0- | | | 43,924 | |
| current CEO (1) | | | 2008 | | 43,407 | | | -0- | | -0- | | | -0- | | -0- | | | -0- | | -0- | | | 43,407 | |
1 Yi He became the Company’s Chief Executive Officer on May 15, 2003. Mr. He is not compensated for his services as a director of the Company.
Outstanding Equity Awards at Fiscal Year-End
There were no unexercised options, unvested stock awards or equity incentive plan awards for any of the above-named executive officers outstanding as of December 31, 2009.
Employment Agreements, Termination of Employment and Change-in-Control Arrangements with our Executive Officers
We currently have no employment agreements with any of our executive officers, nor any compensatory plans or arrangements resulting from the resignation, retirement or any other termination of any of our executive officers, from a change-in-control, or from a change in any executive officer’s responsibilities following a change-in-control.
Compensation of Directors
The Company paid no compensation to its directors for any services provided as a director during the year ended December 31, 2009. There are no other formal or informal understandings or arrangements relating to compensation; however, the directors may be reimbursed for all reasonable expenses incurred by them in conducting the Company’s business. These expenses would include out-of-pocket expenses for such items as travel, telephone, and postage. For the fiscal year 2009, none of the directors received reimbursement payments from the Company.
Indemnification of Officers and Directors
We are a Nevada corporation, and accordingly, we are subject to the corporate laws under the Nevada Revised Statutes. Article XII of our articles of incorporation contains the following indemnification provision for our directors and officers:
No director or officer of the Corporation shall be personally liable to the Corporation or any of its stockholders for damage for breach of fiduciary duty as a director or officer involving any act or omission of any such director or officer provided, however, that the foregoing provision shall not eliminate or limit the liability of a director or officer for acts or omissions which involve intentional misconduct, fraud or a knowing violation of law, or the payment of dividends in violation of Section 78.300 of the Nevada Revised Statutes. Any repeal or modification of this Article by the stockholders of the Corporation shall be prospective only, and shall not adversely affect any limitation on the personal liability of a director or officer of the Corporation to acts or omissions prior to such repeal or modification.
Such indemnification provision may be sufficiently broad to permit indemnification of our executive officers and directors for liabilities (including reimbursement of expenses incurred) arising under the Securities Act of 1933.
Insofar as indemnification for liabilities arising under the Securities Act of 1933 may be permitted to our directors, officers and controlling persons pursuant to the foregoing provision, or otherwise, we have been advised that in the opinion of the SEC such indemnification is against public policy as expressed in the Securities Act of 1933 and is, therefore, unenforceable. No pending material litigation or proceeding involving our directors, executive officers, employees or other agents as to which indemnification is being sought exists, and we are not aware of any pending or threatened material litigation that may result in claims for indemnification by any of our directors or executive officers.
We do not currently carry directors’ and officers’ liability insurance covering our directors and officers, nor do we have plans to do so. Insofar as indemnification for liabilities under the Securities Act may be permitted to directors, officers, or persons controlling the Company pursuant to the foregoing provisions, we have been informed that, in the opinion of the Commission, such indemnification is against public policy as expressed in the Securities Act and is therefore unenforceable.
| Item 12. | Security Ownership of Certain Beneficial Owners and Management and Related Stockholder Matters. |
The following table sets forth certain information with respect to the beneficial ownership of our common stock as of March 14, 2009, by: (i) each person known to beneficially own more than five percent of our common stock; (ii) each of our officers, directors and nominees for election as director; and (iii) all of our directors and executive officers as a group.
The number of shares beneficially owned by each director or executive officer is determined under rules of the SEC, and the information is not necessarily indicative of beneficial ownership for any other purpose. Under the SEC rules, beneficial ownership includes any shares as to which the individual has the sole or shared voting power or investment power. In addition, beneficial ownership includes any shares that the individual has the right to acquire within 60 days. Unless otherwise indicated, each person listed below has sole investment and voting power (or shares such powers with his or her spouse). In certain instances, the number of shares listed includes (in addition to shares owned directly), shares held by the spouse or children of the person, or by a trust or estate of which the person is a trustee or an executor or in which the person may have a beneficial interest.
Title of Class | | Name and Address of Beneficial Owner | | Amount and Nature of Beneficial Ownership3 | | | Percentage Owned Beneficially5 | |
| Common Stock | | Yi He1 | | | 1,290,001 | | | | 27.8 | % |
| Common Stock | | Hongkeung Lam1 | | | 525,000 | | | | 11.3 | % |
| Common Stock | | Guoliang Tian1 | | | -0- | | | | — | |
| Common Stock | | Yu Fang1 | | | -0- | | | | — | |
| Common Stock | | Zhenying Sun1 | | | 650,0004 | | | | 14.0 | % |
| Common Stock | | Jing Zeng2 | | | 288,000 | | | | 6.2 | % |
| Common Stock | | Statelink International Group, Ltd.2 | | | 650,0004 | | | | 14.0 | % |
| Common Stock | | All officers and directors of the Company as a group (five persons) | | | 2,465,001 | | | | 53.1 | % |
1 An officer and/or director of the Company. The address for each officer and director is in care of the Company at 9/F Shenzhou Mansion, No. 31 Zhongguancun Street, Haidian District, Beijing, China.
2 A beneficial owner of more than five percent of the Company’s common stock. The address for each such beneficial owner is in care of the Company at 9/F Shenzhou Mansion, No. 31 Zhongguancun Street, Haidian District, Beijing, China.
3 Unless otherwise indicated, all shares are directly owned and investing power is held by the persons named in the table.
4 These shares of common stock are held directly by Statelink International Group, Ltd., of which Ms. Sun is the controlling person and has both voting and dispositive power over these shares.
5 Based upon 4,651,173 shares of Common Stock outstanding as of March 14, 2010.
Equity Compensation Plan Information
As of December 31, 2009, we did not have any equity compensation plan in effect. The Company’s 2002 Stock Plan, which was adopted on August 16, 2002, expired as of August 15, 2007, pursuant to the terms of such plan. The plan had not been approved by our shareholders prior to its expiration.
| Item 13. | Certain Relationships and Related Transactions, and Director Independence. |
Transactions with Related Person
The Company, from time to time, received from or made repayments to Mr. Yi He, who is a major stockholder and our Chief Executive Officer. The amounts due from/to stockholders do not bear any interest and do not have clearly defined terms of repayment. The amounts due from stockholders as of December 31, 2008 and December 31, 2007, which were $75,734.26 and $237,631.08 respectively, represented travel advances to Mr. Yi He. The amounts due to stockholders as of December 31, 2009 and December 31, 2008, which were $36,567 and $30,398, respectively, represented advances from stockholders.
Other than the transactions described above, we have not entered into any transactions with our officers, directors, persons nominated for these positions, beneficial owners of 5% or more of our common stock, or family members of these persons since the beginning of our last fiscal year wherein the amount involved in the transaction or a series of similar transactions exceeded $120,000.
Director Independence
The Company has determined that the following directors are independent under Rule IM-5605(a)(2) of the Nasdaq Listing rules: Guoliang Tian, Yu Fang and Zhengying Sun. In determining independence, the Board reviews and seeks to determine whether directors have any material relationship with the Company, direct or indirect, which would interfere with the exercise of independent judgment in carrying out the responsibilities of a director. The Board reviews business, professional, charitable and familial relationships of the independent directors in determining independence.
| Item 14. | Principal Accountant Fees and Services. |
Audit Fees
The aggregate fees billed for professional services rendered by Kenne Ruan, CPA, P.C. for the audit of our 2009 annual financial statements and the reviews of the financial statements included in our quarterly reports on Form 10-Q for fiscal year 2009 were $100,000. The aggregate fees billed for professional services rendered by Kenne Ruan for the audit of our 2008 annual financial statements and the reviews of the financial statements included in our quarterly reports on Form 10-Q for fiscal year 2008 were $100,000.
Audit-Related Fees
There were no other fees billed by Kenne Ruan during the last two fiscal years for assurance and related services that were reasonably related to the performance of the audit or review of the Company’s financial statements and not reported under “Audit Fees” above.
Tax Fees
There were no fees billed for professional services rendered by Kenne Ruan for tax compliance services in fiscal years 2009 and 2008.
All Other Fees
There were no other fees billed by Kenne Ruan during the last two fiscal years for products and services provided by Kenne Ruan outside of those fees disclosed above under “Audit Fees.”
Pre-Approval Policy and Procedures
The Company’s board of directors reviews and approves audit and permissible non-audit services performed by our auditors, as well as the fees charged for such services. In reviewing the non-audit service fees and appointment of the Company’s auditors, the board of directors considered whether the provision of such services is compatible with maintaining the auditors’ independence. All of the services provided and fees charged by our auditors were pre-approved by the board of directors.
(1) Financial Statements
The following consolidated financial statements of the Company are included in Part II, Item 8 of this report:
Report of Kenne Ruan, CPA, P.C., Independent Auditors
Consolidated Balance Sheets at December 31, 2009 and 2008
Consolidated Statements of Operations and Comprehensive Income for the Years Ended December 31, 2009 and 2008
Consolidated Statements of Stockholders’ Equity for the Years Ended December 31, 2009 and 2008
Consolidated Statements of Cash Flows for the Years Ended December 31, 2009 and 2008
Notes to Consolidated Financial Statements
(2) Financial Statement Schedules
Schedules are omitted because the required information is not present or is not present in amounts sufficient to require submission of the schedule or because the information required is given in the consolidated financial statements or the notes thereto.
(3) Exhibits
| Exhibit | | |
| Number | | Description |
| | | |
| 3.1 | | Articles of Incorporation, as amended. (Incorporated by reference to Exhibit No. 3.1 of the Form 10-QSB for the quarter ended March 31, 2000, and filed on May 13, 2000.) |
| | | |
| 3.2 | | Certificate of Amendment to Increase Number of Authorized Shares of Common Stock as filed with the Nevada Secretary of State on April 4, 2007 (Filed herewith) |
| | | |
| 3.3 | | Certificate of Amendment to Effect a 1-for-20 Reverse Stock Split as filed with the Nevada Secretary of State on February 21, 2008 (Filed herewith) |
| | | |
| 3.4 | | Bylaws dated May 11, 2000. (Incorporated by reference to Exhibit No. 3.2 of the Form 10-QSB for the quarter ended March 31, 2000, and filed on May 13, 2000.) |
| | | |
| 3.5 | | Text of Amendment to Bylaws of Forlink Software Corporation, Inc. (Incorporated by reference to Exhibit 3.3 of the Company’s Form 8-K filed on January 18, 2007.) |
| | | |
| 10 | | Transfer of “Right to Invest” and Project Cooperation Agreement dated October 3, 2006, by and between the Company and Statelink International Group, Ltd. (Incorporated by reference to Exhibit 10.1 of the Company’s Current Report on Form 8-K (file no. 000-18731) filed October 10, 2006.) |
| | | |
| 14 | | Code of Ethics (Filed herewith.) |
| | | |
| 21 | | List of Subsidiaries (Filed herewith.) |
| | | |
| 31.1 | | Section 302 Certification by the Corporation’s Chief Executive Officer. (Filed herewith.) |
| | | |
| 31.2 | | Section 302 Certification by the Corporation’s Chief Financial Officer. (Filed herewith.) |
| | | |
| 32.1 | | Section 906 Certification by the Corporation’s Chief Executive Officer. (Filed herewith.) |
| | | |
| 32.2 | | Section 906 Certification by the Corporation’s Chief Financial Officer. (Filed herewith.) |
SIGNATURES
In accordance with Section 13 or 15(d) of the Exchange Act, the Registrant caused this report to be signed on its behalf by the undersigned, thereunto duly authorized.
| | FORLINK SOFTWARE CORPORATION, INC. |
| | (Registrant) |
| | |
| | |
| Date: March 26, 2010 | By: | /s/ Yi He |
| | Yi He |
| | Chief Executive Officer |
| | |
| Date: March 26, 2010 | By: | /s/ Hongkeung Lam |
| | Hongkeung Lam |
| | Chief Financial and Accounting Officer |
In accordance with the Exchange Act, this report has been signed below by the following persons on behalf of the registrant and in the capacities and on the dates indicated.
| Date: March 26, 2010 | By: | /s/ Yi He |
| | | Yi He, Director |
| | | |
| Date: March 26, 2010 | By: | /s/ Hongkeung Lam |
| | | Hongkeung Lam, Director |
| | | |
| Date: March 26, 2010 | By: | /s/ Guoliang Tian |
| | | Guoliang Tian, Director |
| | | |
| Date: March 26, 2010 | By: | /s/ Yu Fang |
| | | Yu Fang, Director |
| | | |
| Date: March 26, 2010 | By: | /s/ Zhenying Sun |
| | | Zhenying Sun, Director |