


Searchable text section of graphics shown above
Forward-looking Statement
All presentations today may contain forward-looking statements within the meaning of the Private Securities Litigation Reform Act of 1995. These forward-looking statements include statements as to expectations, beliefs and future financial performance, such as statements relating to the Company’s business prospects, future sales, market growth, gross margin and other statements that are not of historical fact.
Investors are cautioned that all forward-looking statements are based on management’s current expectations and include known and unknown risks, uncertainties and other factors, many of which the Company is unable to predict or control, that may cause the Company’s actual results or performance to materially differ from any future results or performance expressed or implied. These risks and uncertainties include the timing and development of the Company’s products and services and market acceptance of the Company’s new and revised product offerings, and other risk factors disclosed by the Company from time to time in its filings with the SEC, including in its Annual Report on Form 10-K for the year ended December 31, 2004.
[LOGO] |
| [LOGO] |
| [LOGO] |
2
Agenda
8:30 a.m. |
| Welcome & Strategic Overview |
| Bob Peebler |
|
|
|
| President & CEO |
|
|
|
|
|
9:15 a.m. |
| Imaging Systems Group |
| Chris Friedemann |
|
|
|
| VP, Commercial Development |
|
|
|
|
|
10:00 a.m. |
| Break |
|
|
|
|
|
|
|
10:15 a.m. |
| GX Technology |
| Mick Lambert |
|
|
|
| President, GXT |
|
|
|
|
|
11:00 a.m. |
| Full-wave Demonstrations |
| Cara Kiger – Land |
|
|
|
| Dave Ridyard – Seabed |
|
|
|
|
|
12:15 p.m. |
| Lunch in Spellman Room |
|
|
|
| (Includes Industry Full-wave Testimonials) |
|
|
|
|
|
|
|
1:15 p.m. |
| Financial Review |
| Mike Kirksey |
|
|
|
| EVP & CFO |
|
|
|
|
|
1:45 p.m. |
| Closing Remarks |
| Bob Peebler |
3
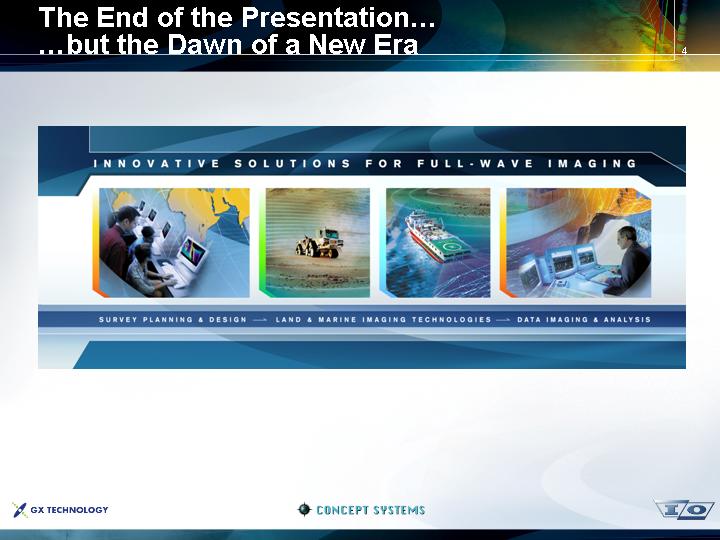
The End of the Presentation…
…but the Dawn of a New Era
INNOVATIVE SOLUTIONS FOR FULL - WAVE IMAGING
[GRAPHIC]
SURVEY PLANNING & DESIGN —> LAND & MARINE IMAGING TECHNOLOGIES —> DATA IMAGING & ANALYSIS
4
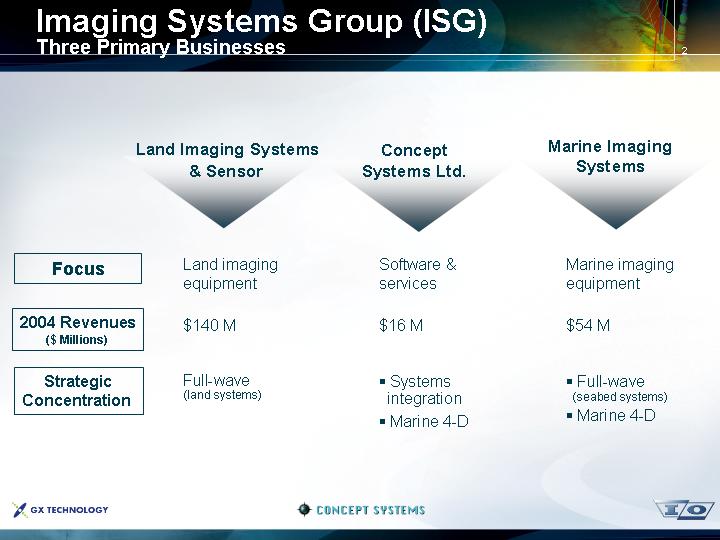
Imaging Systems Group (ISG)
Three Primary Businesses
|
| Land Imaging Systems |
| Concept |
| Marine Imaging |
|
| & Sensor |
| Systems Ltd. |
| Systems |
|
|
|
|
|
|
|
Focus |
| Land imaging equipment |
| Software & services |
| Marine imaging equipment |
|
|
|
|
|
|
|
2004 Revenues |
| $140 M |
| $16 M |
| $54 M |
|
|
|
|
|
|
|
Strategic |
| Full-wave |
| • Systems integration |
| • Full-wave |
|
|
|
|
|
| • Marine 4-D |
[LOGO] |
| [LOGO] |
| [LOGO] |
2
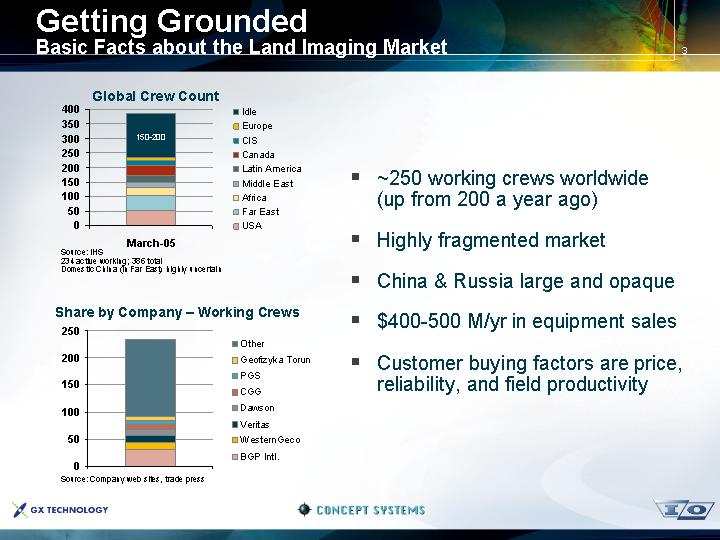
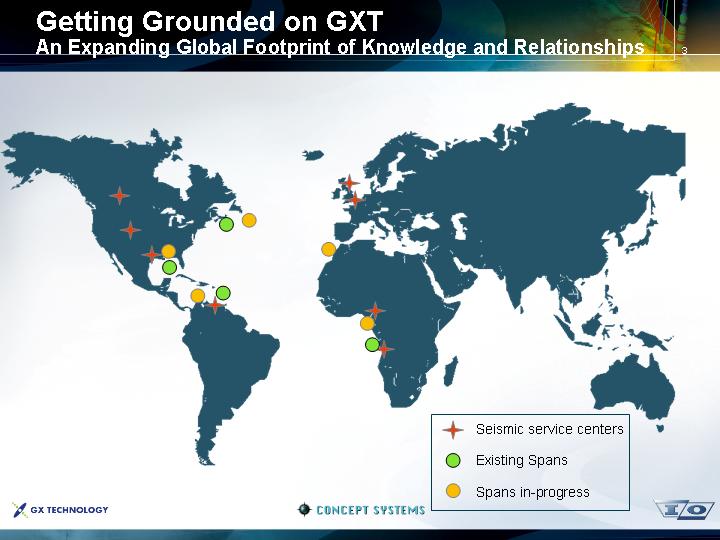
Getting Grounded
Basic Facts about the Land Imaging Market
Global Crew Count
[CHART]
Source: IHS
234 active working; 386 total
Domestic China (in Far East) highly uncertain
Share by Company – Working Crews
[CHART]
Source: Company web sites, trade press
• ~250 working crews worldwide (up from 200 a year ago)
• Highly fragmented market
• China & Russia large and opaque
• $400-500 M/yr in equipment sales
• Customer buying factors are price, reliability, and field productivity
3
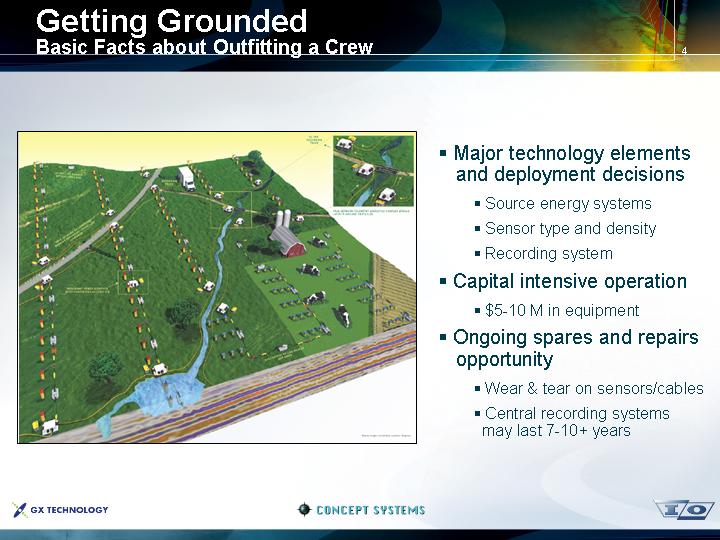
Getting Grounded
Basic Facts about Outfitting a Crew
[GRAPHIC]
• Major technology elements and deployment decisions
• Source energy systems
• Sensor type and density
• Recording system
• Capital intensive operation
• $5-10 M in equipment
• Ongoing spares and repairs opportunity
• Wear & tear on sensors/cables
• Central recording systems may last 7-10+ years
4
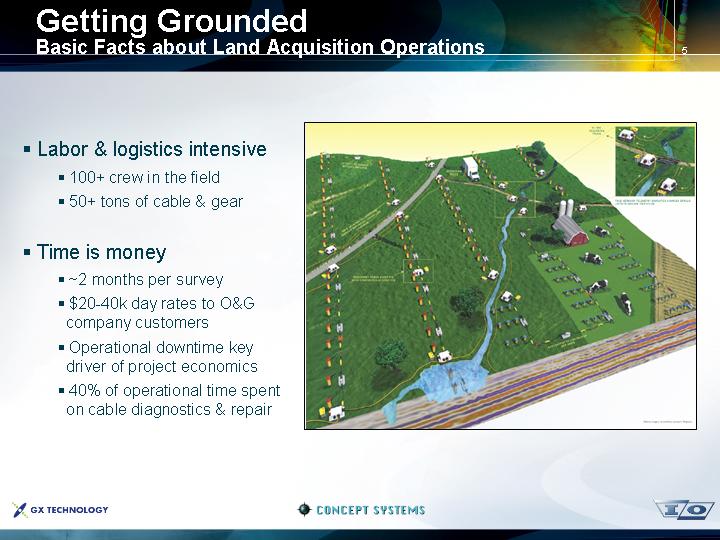
Getting Grounded
Basic Facts about Land Acquisition Operations
• Labor & logistics intensive
• 100+ crew in the field
• 50+ tons of cable & gear
• Time is money
• ~2 months per survey
• $20-40k day rates to O&G company customers
• Operational downtime key driver of project economics
• 40% of operational time spent on cable diagnostics & repair
[GRAPHIC]
5
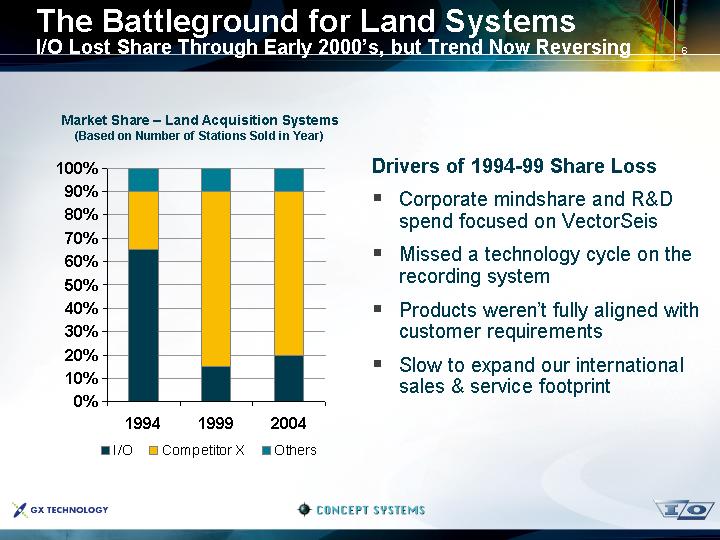
The Battleground for Land Systems
I/O Lost Share Through Early 2000’s, but Trend Now Reversing
Market Share – Land Acquisition Systems
(Based on Number of Stations Sold in Year)
[CHART]
Drivers of 1994-99 Share Loss
• Corporate mindshare and R&D spend focused on VectorSeis
• Missed a technology cycle on the recording system
• Products weren’t fully aligned with customer requirements
• Slow to expand our international sales & service footprint
6
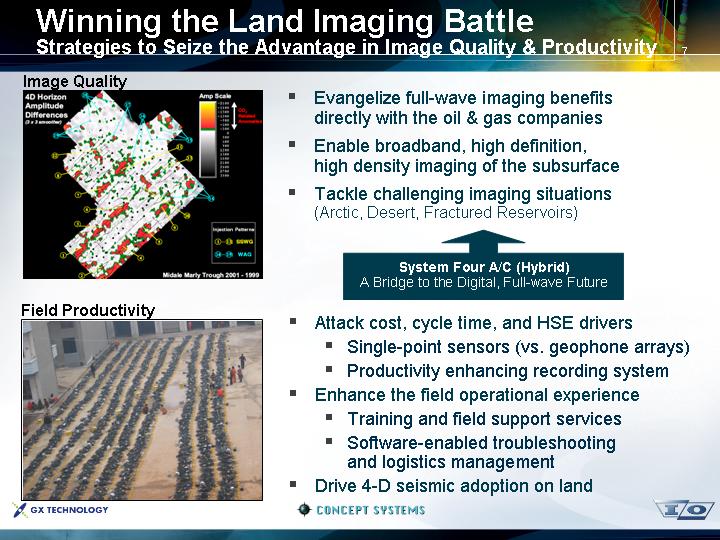
Winning the Land Imaging Battle
Strategies to Seize the Advantage in Image Quality & Productivity
Image Quality
[GRAPHIC]
Field Productivity
[GRAPHIC]
• Evangelize full-wave imaging benefits directly with the oil & gas companies
• Enable broadband, high definition, high density imaging of the subsurface
• Tackle challenging imaging situations (Arctic, Desert, Fractured Reservoirs)
System Four A/C (Hybrid)
A Bridge to the Digital, Full-wave Future
• Attack cost, cycle time, and HSE drivers
• Single-point sensors (vs. geophone arrays)
• Productivity enhancing recording system
• Enhance the field operational experience
• Training and field support services
• Software-enabled troubleshooting and logistics management
• Drive 4-D seismic adoption on land
7
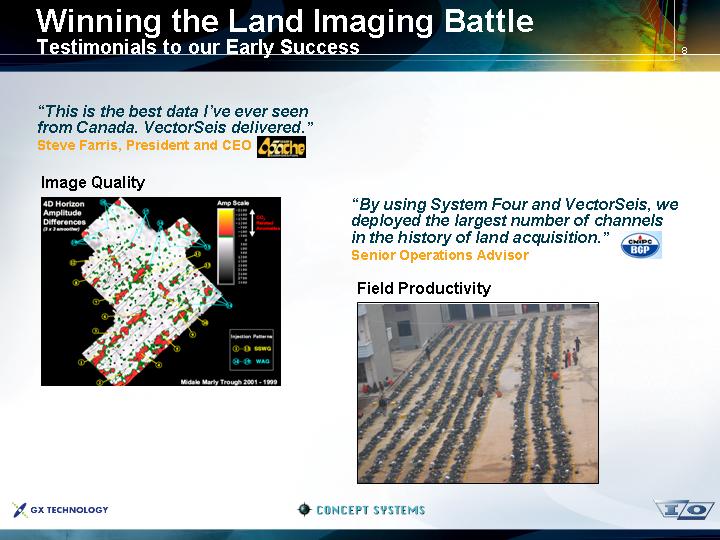
Winning the Land Imaging Battle
Testimonials to our Early Success
“This is the best data I’ve ever seen from Canada. VectorSeis delivered.”
Steve Farris, President and CEO
[LOGO]
Image Quality
[GRAPHIC]
“By using System Four and VectorSeis, we deployed the largest number of channels in the history of land acquisition.”
Senior Operations Advisor
[LOGO]
Field Productivity
[GRAPHIC]
8
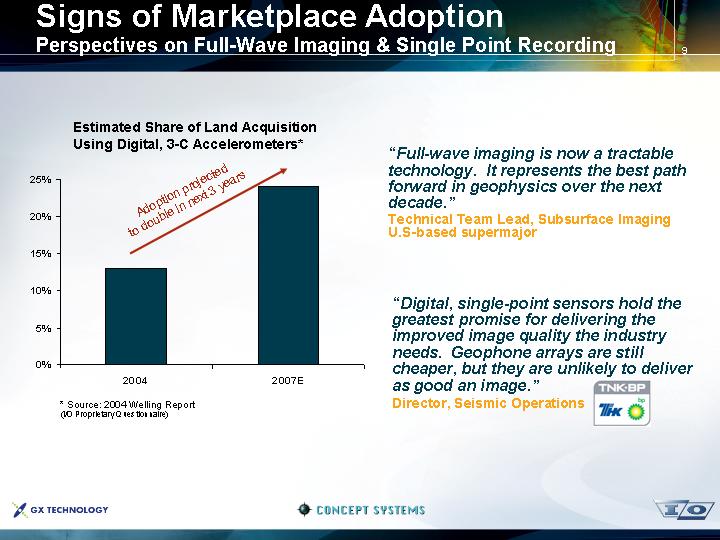
Signs of Marketplace Adoption
Perspectives on Full-Wave Imaging & Single Point Recording
Estimated Share of Land Acquisition
Using Digital, 3-C Accelerometers*
[CHART]
* Source: 2004 Welling Report
(I/O Proprietary Questionnaire)
“Full-wave imaging is now a tractable technology. It represents the best path forward in geophysics over the next decade.”
Technical Team Lead, Subsurface Imaging U.S-based supermajor
“Digital, single-point sensors hold the greatest promise for delivering the improved image quality the industry needs. Geophone arrays are still cheaper, but they are unlikely to deliver as good an image.”
Director, Seismic Operations
[LOGO]
9
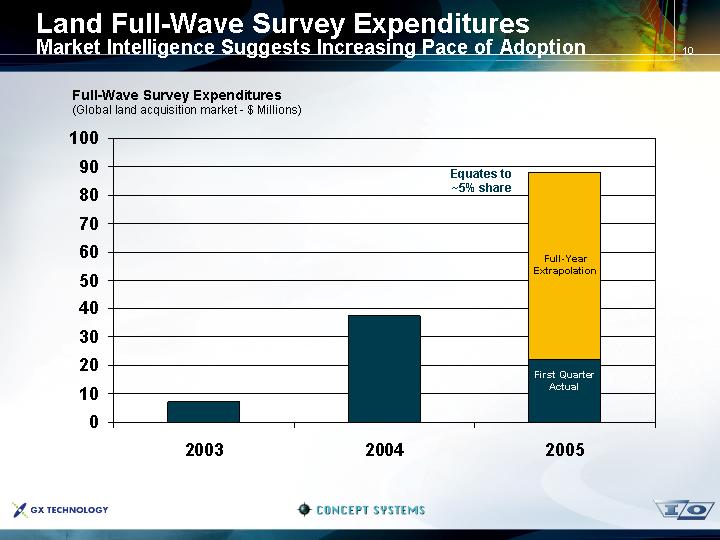
Land Full-Wave Survey Expenditures
Market Intelligence Suggests Increasing Pace of Adoption
Full-Wave Survey Expenditures
(Global land acquisition market - $ Millions)
[CHART]
10
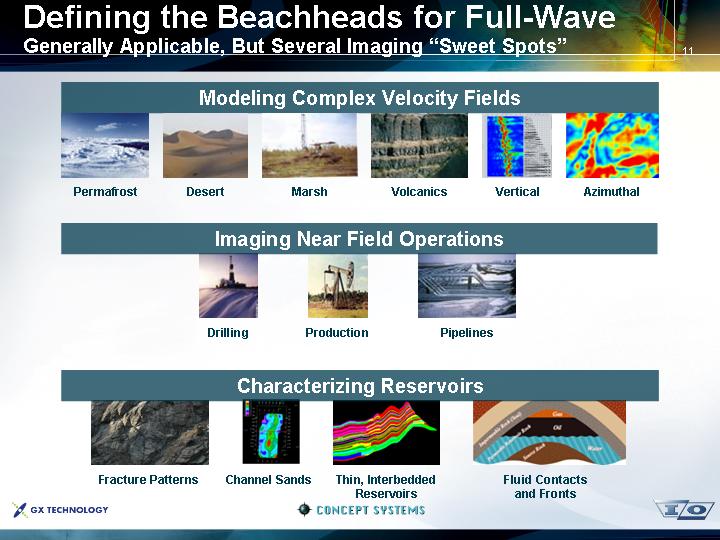
Defining the Beachheads for Full-Wave
Generally Applicable, But Several Imaging “Sweet Spots”
Modeling Complex Velocity Fields
[GRAPHIC] | [GRAPHIC] | [GRAPHIC] | [GRAPHIC] | [GRAPHIC] | [GRAPHIC] |
|
|
|
|
|
|
Permafrost | Desert | Marsh | Volcanics | Vertical | Azimuthal |
Imaging Near Field Operations
| [GRAPHIC] | [GRAPHIC] | [GRAPHIC] |
|
|
|
|
|
|
| Drilling | Production | Pipelines |
|
Characterizing Reservoirs
[GRAPHIC] | [GRAPHIC] | [GRAPHIC] | [GRAPHIC] |
|
|
|
|
Fracture Patterns | Channel Sands | Thin, Interbedded | Fluid Contacts |
11
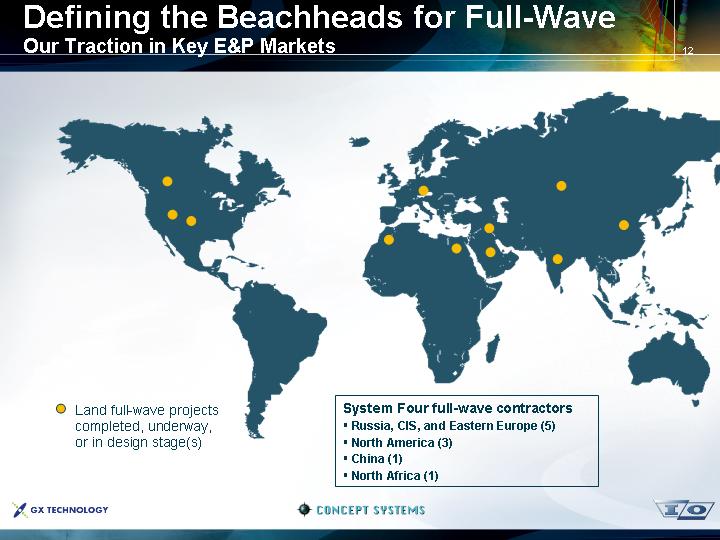
Defining the Beachheads for Full-Wave
Our Traction in Key E&P Markets
[GRAPHIC]
System Four full-wave contractors
• Russia, CIS, and Eastern Europe (5)
• North America (3)
• China (1)
• North Africa (1)
12
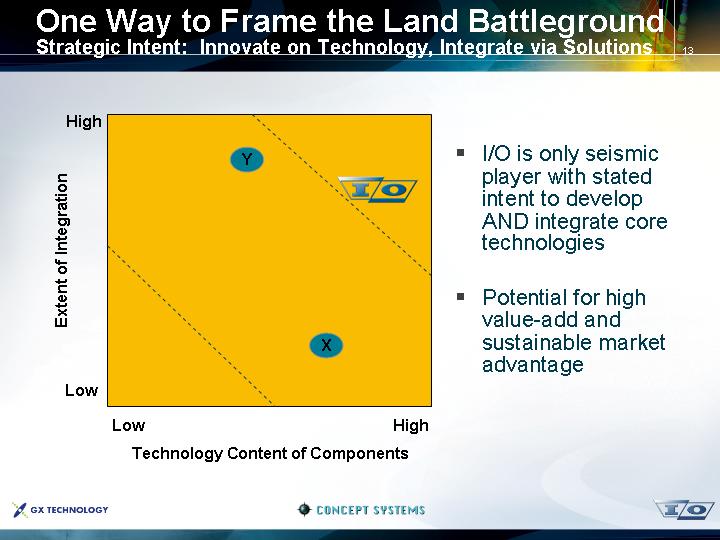
One Way to Frame the Land Battleground
Strategic Intent: Innovate on Technology, Integrate via Solutions
[GRAPHIC]
Technology Content of Components
• I/O is only seismic player with stated intent to develop AND integrate core technologies
• Potential for high value-add and sustainable market advantage
13
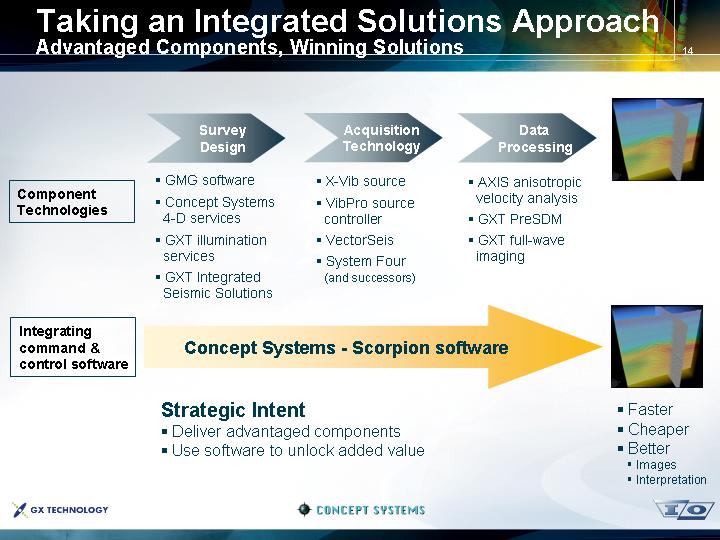
Taking an Integrated Solutions Approach
Advantaged Components, Winning Solutions
|
| Survey |
| Acquisition |
| Data | [GRAPHIC] |
|
| Design |
| Technology |
| Processing | |
|
|
|
|
|
|
|
|
|
| • GMG software |
| • X-Vib source |
| • AXIS anisotropic |
|
Component |
| • Concept Systems |
| • VibPro source |
| velocity analysis |
|
Technologies |
| 4-D services |
| controller |
| • GXT PreSDM |
|
|
| • GXT illumination |
| • VectorSeis |
| • GXT full-wave |
|
|
| services |
| • System Four |
| imaging |
|
|
| • GXT Integrated |
| (and successors) |
|
|
|
|
| Seismic Solutions |
|
|
|
|
|
|
|
|
|
|
|
|
|
Integrating |
|
|
|
|
|
|
|
command & |
| Concept Systems - Scorpion software | [GRAPHIC] | ||||
control software |
|
|
|
|
|
|
|
|
| Strategic Intent | • Faster | ||||
|
| • Deliver advantaged components | • Cheaper | ||||
|
| • Use software to unlock added value | • Better | ||||
|
|
| • Images | ||||
|
|
| • Interpretation | ||||
14
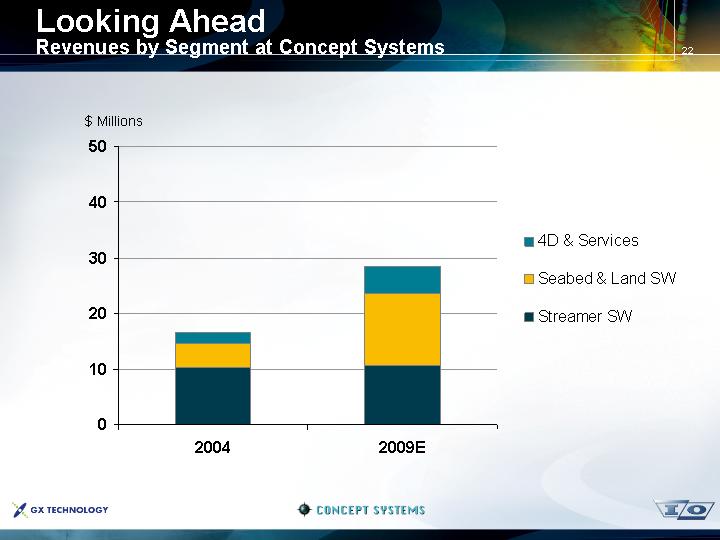
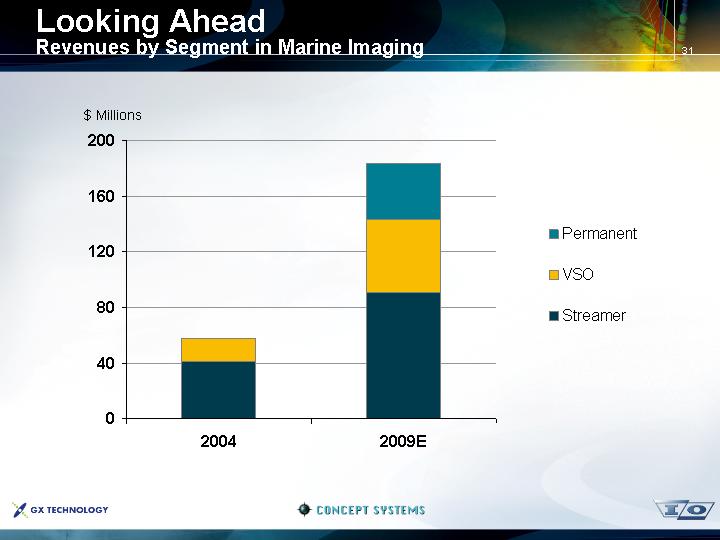
Looking Ahead
Revenues by Segment in Land Imaging
[CHART]
A Word on Forecasting Methodology
• Annual plans with quarterly updates
(by sub-segment)
• Bottoms-up forecast of key activity drivers
(# of crews, # of stations per crew, etc.)
• Estimates of adoption, mix, and share
• Validated via competitive intelligence
(public data, from the channel, market research)
15
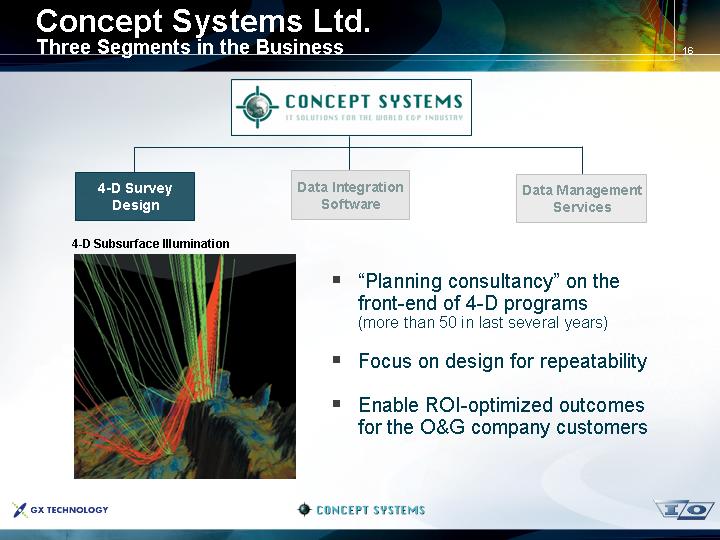
Concept Systems Ltd.
Three Segments in the Business
| [LOGO] |
|
|
|
|
4-D Survey | Data Integration | Data Management |
Design | Software | Services |
4-D Subsurface Illumination
[GRAPHIC]
• “Planning consultancy” on the front-end of 4-D programs
(more than 50 in last several years)
• Focus on design for repeatability
• Enable ROI-optimized outcomes for the O&G company customers
16
|
| |
|
|
|
4-D Survey | Data Integration | Data Management |
Design | Software | Services |
Orca Command & Control Platform
[GRAPHIC]
• Operations Command & Control software platform
• Integrates data streams from multiple seismic sub-systems
• QC’s the data real-time
• Acts as the “auto pilot” of the acquisition operation
17
Overcoming the Data Integration Challenge
Key Functions of Concept Systems Software
Integrated seismic data in both time and place
[GRAPHIC]
18
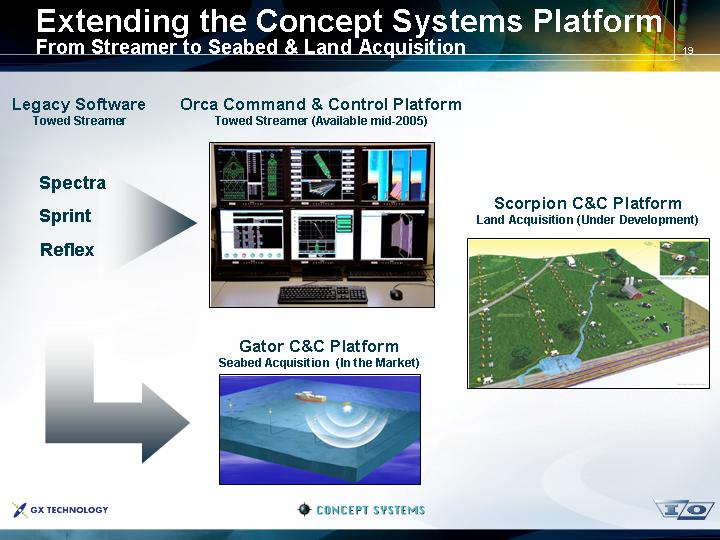
Extending the Concept Systems Platform
From Streamer to Seabed & Land Acquisition
Legacy Software | Orca Command & Control Platform |
|
Towed Streamer | Towed Streamer (Available mid-2005) |
|
|
|
|
| [GRAPHIC] | Scorpion C&C Platform |
Spectra |
| Land Acquisition (Under Development) |
Sprint |
|
|
Reflex | Gator C&C Platform | [GRAPHIC] |
| Seabed Acquisition (In the Market) |
|
|
|
|
| [GRAPHIC] |
|
19
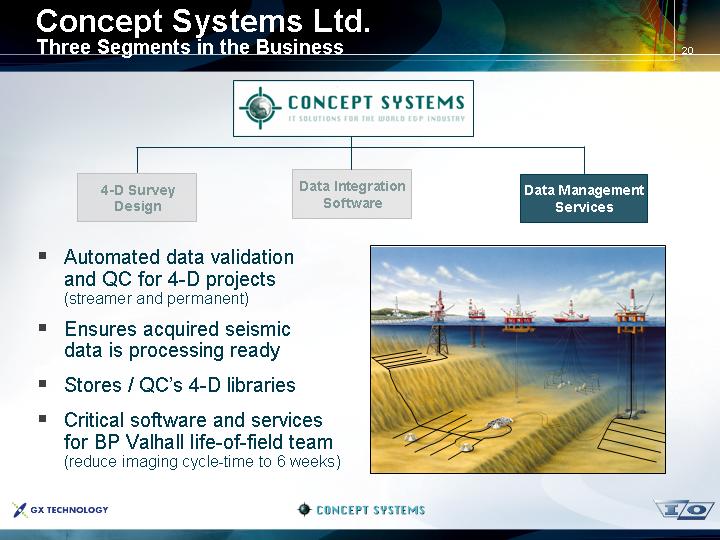
Concept Systems Ltd.
Three Segments in the Business
| [LOGO] |
|
|
|
|
4-D Survey | Data Integration | Data Management |
Design | Software | Services |
• Automated data validation and QC for 4-D projects
(streamer and permanent)
• Ensures acquired seismic data is processing ready
• Stores / QC’s 4-D libraries
• Critical software and services for BP Valhall life-of-field team (reduce imaging cycle-time to 6 weeks)
[GRAPHIC]
20
Concept Systems Ltd.
Sources of Competitive Advantage and Growth
[LOGO]
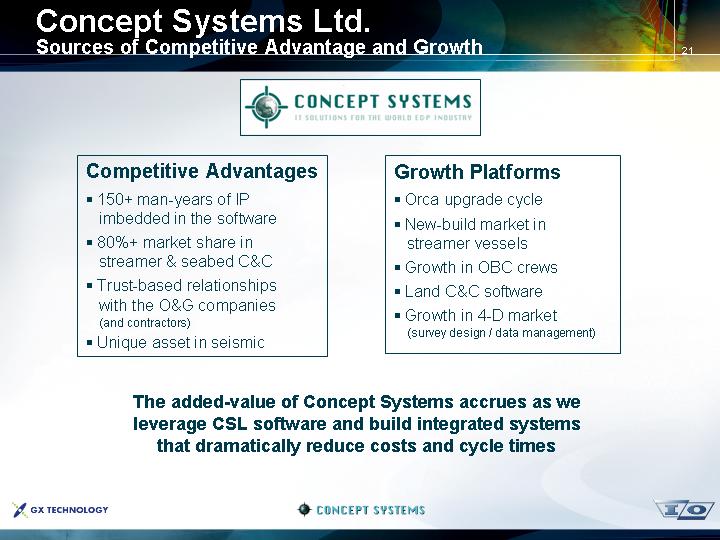
Competitive Advantages
• 150+ man-years of IP imbedded in the software
• 80%+ market share in streamer & seabed C&C
• Trust-based relationships with the O&G companies
(and contractors)
• Unique asset in seismic
Growth Platforms
• Orca upgrade cycle
• New-build market in streamer vessels
• Growth in OBC crews
• Land C&C software
• Growth in 4-D market
(survey design / data management)
The added-value of Concept Systems accrues as we
leverage CSL software and build integrated systems
that dramatically reduce costs and cycle times
21
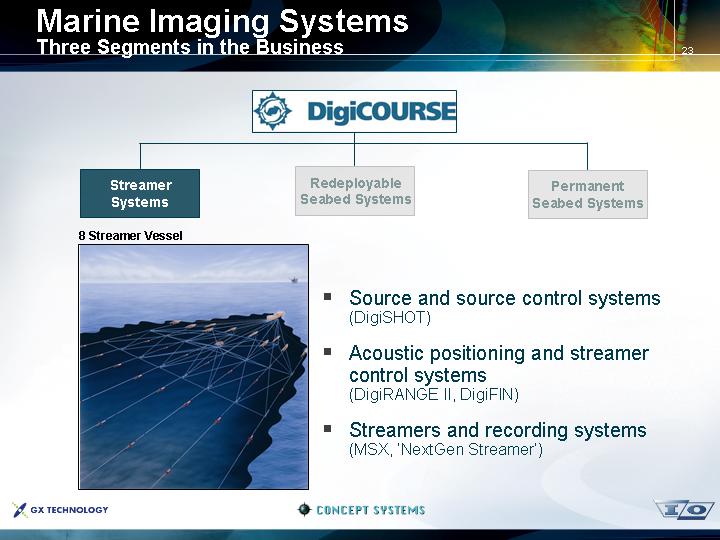
Marine Imaging Systems
Three Segments in the Business
| [LOGO] |
|
|
|
|
Streamer | Redeployable | Permanent |
Systems | Seabed Systems | Seabed Systems |
8 Streamer Vessel
[GRAPHIC]
• Source and source control systems
(DigiSHOT)
• Acoustic positioning and streamer control systems
(DigiRANGE II, DigiFIN)
• Streamers and recording systems
(MSX, ‘NextGen Streamer’)
23
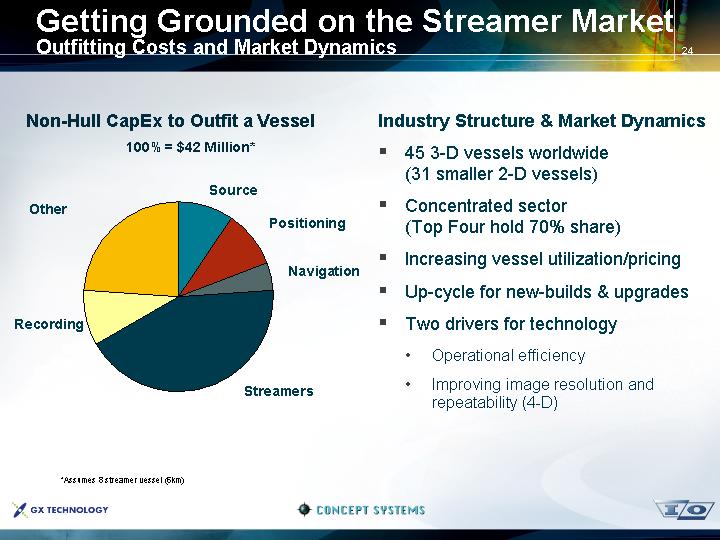
Getting Grounded on the Streamer Market
Outfitting Costs and Market Dynamics
Non-Hull CapEx to Outfit a Vessel
100% = $42 Million*
[CHART]
*Assumes 8 streamer vessel (6km)
Industry Structure & Market Dynamics
• 45 3-D vessels worldwide
(31 smaller 2-D vessels)
• Concentrated sector
(Top Four hold 70% share)
• Increasing vessel utilization/pricing
• Up-cycle for new-builds & upgrades
• Two drivers for technology
• Operational efficiency
• Improving image resolution and repeatability (4-D)
24
WesternGeco “Q-Marine”
Raises the Bar for the Acquisition Contractors
[GRAPHIC]
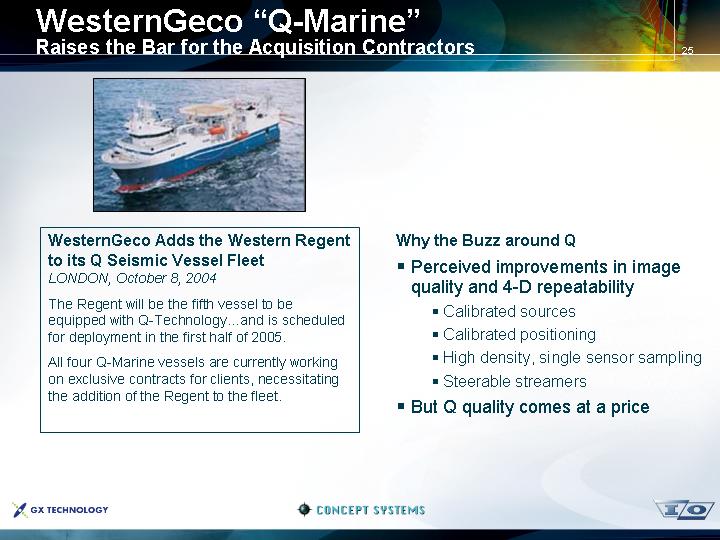
WesternGeco Adds the Western Regent to its Q Seismic Vessel Fleet
LONDON, October 8, 2004
The Regent will be the fifth vessel to be equipped with Q-Technology…and is scheduled for deployment in the first half of 2005.
All four Q-Marine vessels are currently working on exclusive contracts for clients, necessitating the addition of the Regent to the fleet.
Why the Buzz around Q
• Perceived improvements in image quality and 4-D repeatability
• Calibrated sources
• Calibrated positioning
• High density, single sensor sampling
• Steerable streamers
• But Q quality comes at a price
25
Winning the Streamer Technology Battle
Strategies to Seize the Advantage in Image Quality & Productivity
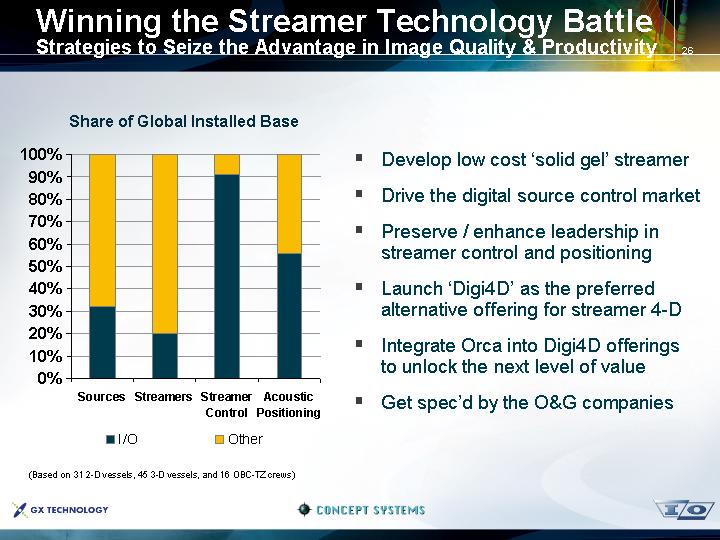
Share of Global Installed Base
[CHART]
(Based on 31 2-D vessels, 45 3-D vessels, and 16 OBC-TZ crews)
• Develop low cost ‘solid gel’ streamer
• Drive the digital source control market
• Preserve / enhance leadership in streamer control and positioning
• Launch ‘Digi4D’ as the preferred alternative offering for streamer 4-D
• Integrate Orca into Digi4D offerings to unlock the next level of value
• Get spec’d by the O&G companies
26
Marine Imaging Systems
Three Segments in the Business
| [LOGO] |
|
|
|
|
Streamer | Redeployable | Permanent |
Systems | Seabed Systems | Seabed Systems |
[GRAPHIC]
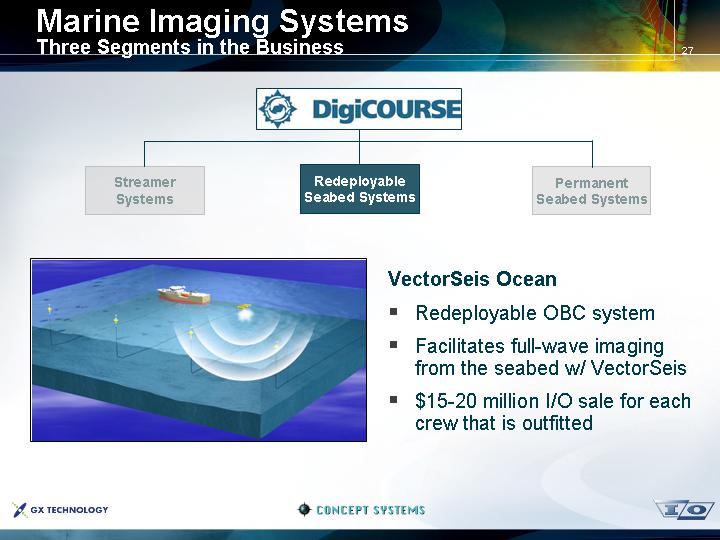
VectorSeis Ocean
• Redeployable OBC system
• Facilitates full-wave imaging from the seabed w/ VectorSeis
• $15-20 million I/O sale for each crew that is outfitted
27
Getting Grounded on the Seabed Market
Relative Acquisition Costs – Streamer vs. OBC
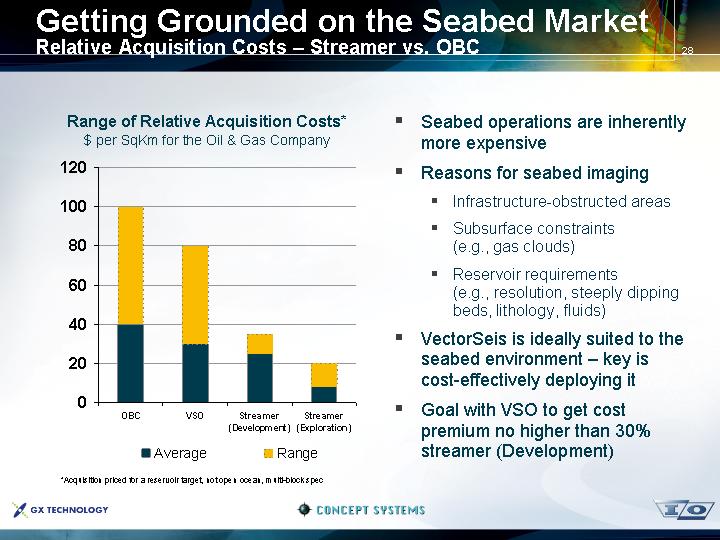
Range of Relative Acquisition Costs*
$ per SqKm for the Oil & Gas Company
[CHART]
*Acquisition priced for a reservoir target, not open ocean, multi-block spec
• Seabed operations are inherently more expensive
• Reasons for seabed imaging
• Infrastructure-obstructed areas
• Subsurface constraints (e.g., gas clouds)
• Reservoir requirements
(e.g., resolution, steeply dipping beds, lithology, fluids)
• VectorSeis is ideally suited to the seabed environment – key is cost-effectively deploying it
• Goal with VSO to get cost premium no higher than 30% streamer (Development)
28
Beachheads for Full-Wave Seabed
Potential Areas that Could Support a VSO Crew (at the Right Price)
[GRAPHIC]
Note that there are only 6-8 non-TZ OBC crews operating worldwide today
29
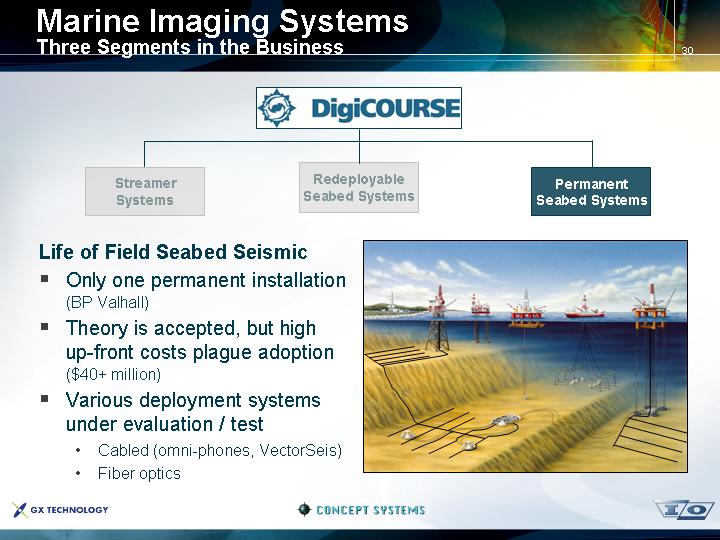
Marine Imaging Systems
Three Segments in the Business
| [LOGO] |
|
|
|
|
Streamer | Redeployable | Permanent |
Systems | Seabed Systems | Seabed Systems |
Life of Field Seabed Seismic
• Only one permanent installation
(BP Valhall)
• Theory is accepted, but high up-front costs plague adoption
($40+ million)
• Various deployment systems under evaluation / test
• Cabled (omni-phones, VectorSeis)
• Fiber optics
[GRAPHIC]
30
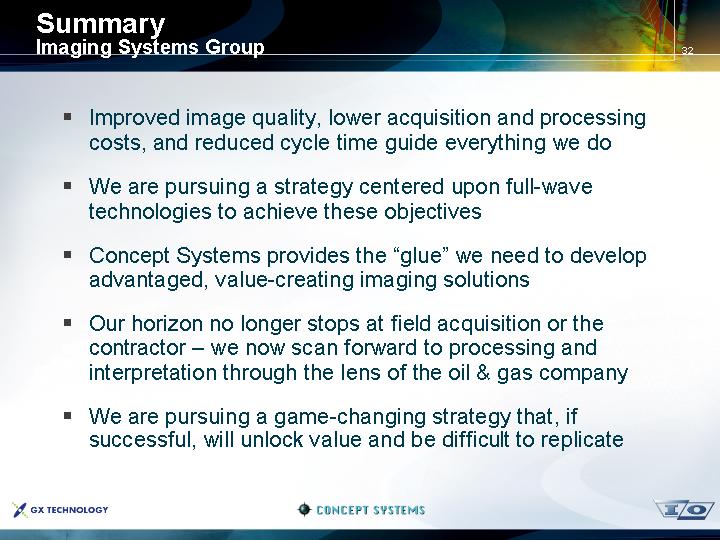
Summary
Imaging Systems Group
• Improved image quality, lower acquisition and processing costs, and reduced cycle time guide everything we do
• We are pursuing a strategy centered upon full-wave technologies to achieve these objectives
• Concept Systems provides the “glue” we need to develop advantaged, value-creating imaging solutions
• Our horizon no longer stops at field acquisition or the contractor – we now scan forward to processing and interpretation through the lens of the oil & gas company
• We are pursuing a game-changing strategy that, if successful, will unlock value and be difficult to replicate
32
Overview - Three Business Segments
Services Built Around High Resolution Seismic Imaging
[LOGO] | Advanced Data | Integrated | Data |
(Re)Processing | Seismic Solutions | Library Licenses | |
|
|
|
|
Description | High resolution sub-surface imaging services for newly acquired and legacy data | Customized end-to-end seismic programs for challenging imaging environments | Differentiated libraries of Image-DrivenTM, high resolution seismic data |
|
|
|
|
Differentiators | • Advanced technologies
• Velocity modeling
• Pre-SDM
• Anisotropy
• R&D capabilities / talent
• Full-wave imaging
• Process integration
• Collaborative approach | • Objective advisor with minimal capital exposure
• No seismic vessels
• No land or OBC crews
• Strong relationships with supermajors, NOC’s, and energy ministries
• Ability to originate and structure complex deals | • Substantially pre-funded
• Designed by regional geoscience experts
• Images rendered using GXT’s advanced imaging technology
• BasinSpans – basin-scale programs focused on ultra-deep imaging of the regional petroleum system |
[LOGO] |
| [LOGO] |
| [LOGO] |
2
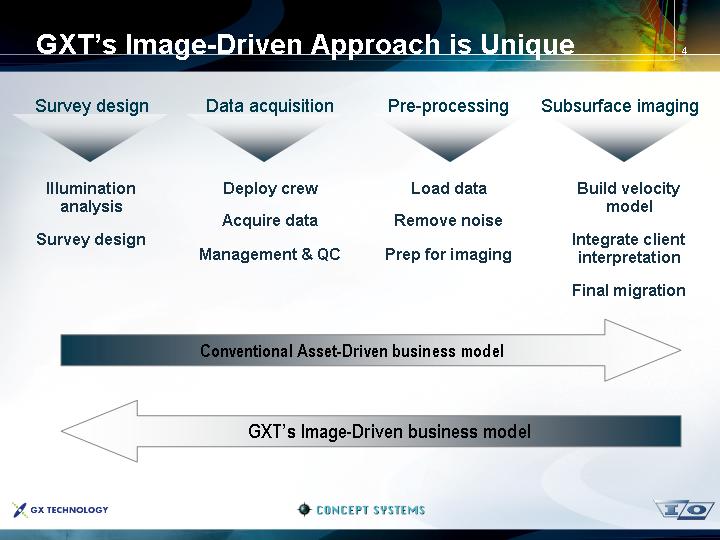
GXT’s Image-Driven Approach is Unique
Survey design | Data acquisition | Pre-processing | Subsurface imaging |
|
|
|
|
Illumination analysis | Deploy crew | Load data | Build velocity model |
Conventional Asset-Driven business model
GXT’s Image-Driven business model
4
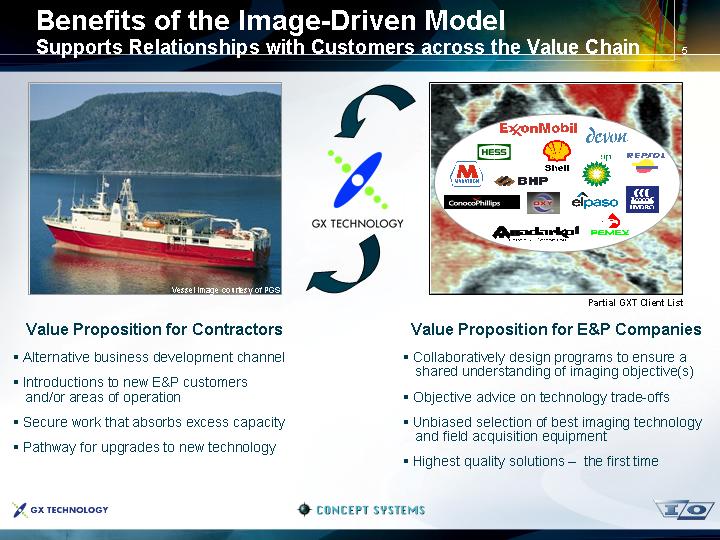
Benefits of the Image-Driven Model
Supports Relationships with Customers across the Value Chain
[GRAPHIC] |
| [LOGO] |
| [GRAPHIC] |
Value Proposition for Contractors
• Alternative business development channel
• Introductions to new E&P customers and/or areas of operation
• Secure work that absorbs excess capacity
• Pathway for upgrades to new technology
Value Proposition for E&P Companies
• Collaboratively design programs to ensure a shared understanding of imaging objective(s)
• Objective advice on technology trade-offs
• Unbiased selection of best imaging technology and field acquisition equipment
• Highest quality solutions – the first time
5
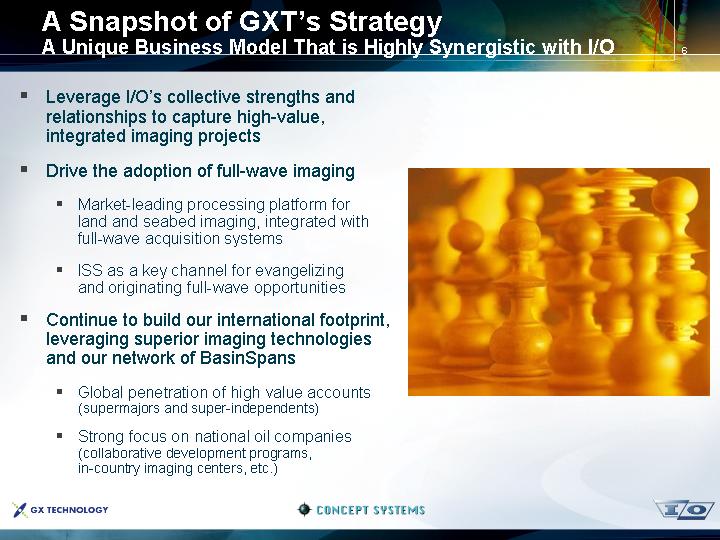
A Snapshot of GXT’s Strategy
A Unique Business Model That is Highly Synergistic with I/O
• Leverage I/O’s collective strengths and relationships to capture high-value, integrated imaging projects
• Drive the adoption of full-wave imaging
• Market-leading processing platform for land and seabed imaging, integrated with full-wave acquisition systems
• ISS as a key channel for evangelizing and originating full-wave opportunities
• Continue to build our international footprint, leveraging superior imaging technologies and our network of BasinSpans
• Global penetration of high value accounts
(supermajors and super-independents)
• Strong focus on national oil companies
(collaborative development programs, in-country imaging centers, etc.)
[GRAPHIC]
6
Opportunities with the NOC’s
[LOGO]
• Importance of the NOC’s on the E&P stage
• Control 90+% of world’s oil
• Influence award of acreage and seismic contracts to the IOC’s
• A thirst for technology
• Need improved subsurface imaging
• Large data libraries in need of reprocessing
• GXT (and I/O) have established relationships with many of the key players
• Relationships lead to BasinSpans, which in turn lead to in-country imaging centers and high-value, 3-D ISS projects
• Significant expansion opportunity for GXT to act as preferred technology provider for advanced geophysical services
7
Getting Grounded on Advanced Data Processing
[GRAPHIC]
[GRAPHIC]
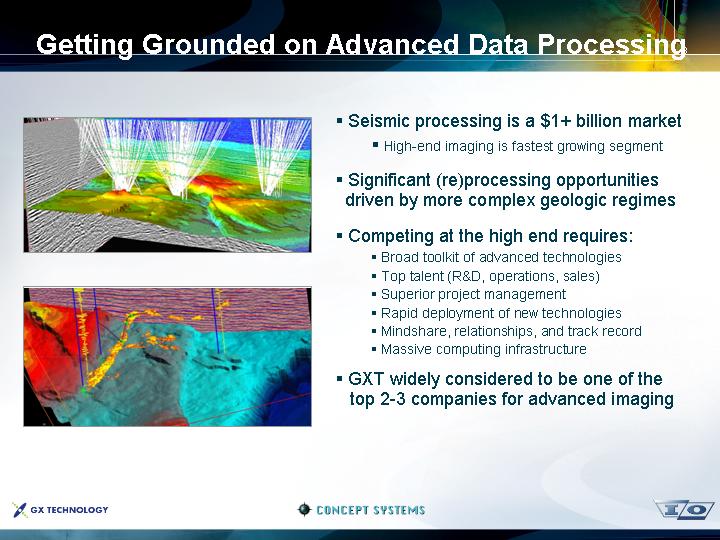
• Seismic processing is a $1+ billion market
• High-end imaging is fastest growing segment
• Significant (re)processing opportunities driven by more complex geologic regimes
• Competing at the high end requires:
• Broad toolkit of advanced technologies
• Top talent (R&D, operations, sales)
• Superior project management
• Rapid deployment of new technologies
• Mindshare, relationships, and track record
• Massive computing infrastructure
• GXT widely considered to be one of the top 2-3 companies for advanced imaging
8
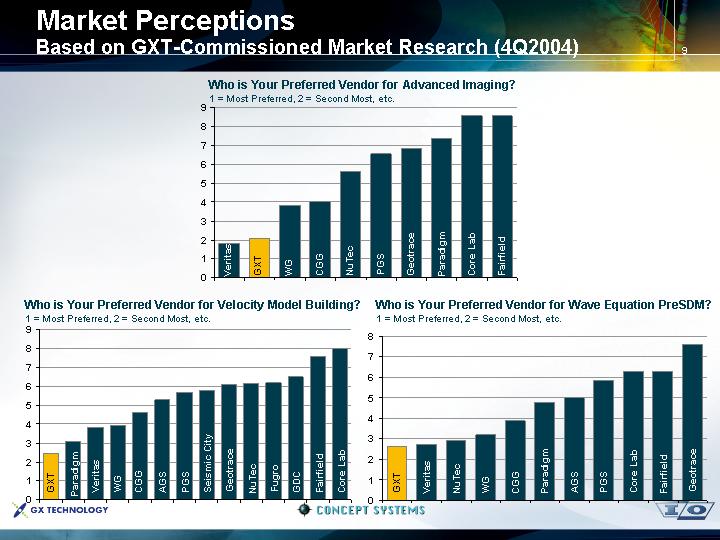
Market Perceptions
Based on GXT-Commissioned Market Research (4Q2004)
Who is Your Preferred Vendor for Advanced Imaging?
[CHART]
Who is Your Preferred Vendor for Velocity Model Building?
[CHART]
Who is Your Preferred Vendor for Wave Equation PreSDM?
[CHART]
9
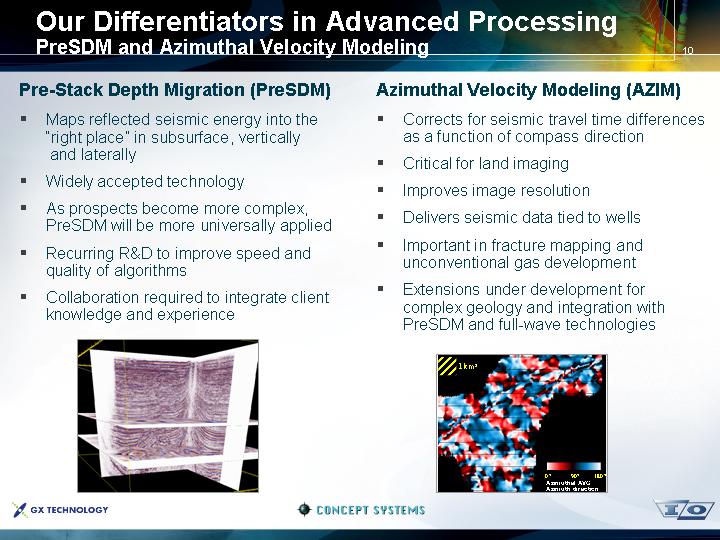
Our Differentiators in Advanced Processing
PreSDM and Azimuthal Velocity Modeling
Pre-Stack Depth Migration (PreSDM)
• Maps reflected seismic energy into the “right place” in subsurface, vertically and laterally
• Widely accepted technology
• As prospects become more complex, PreSDM will be more universally applied
• Recurring R&D to improve speed and quality of algorithms
• Collaboration required to integrate client knowledge and experience
[GRAPHIC]
Azimuthal Velocity Modeling (AZIM)
• Corrects for seismic travel time differences as a function of compass direction
• Critical for land imaging
• Improves image resolution
• Delivers seismic data tied to wells
• Important in fracture mapping and unconventional gas development
• Extensions under development for complex geology and integration with PreSDM and full-wave technologies
[GRAPHIC]
10
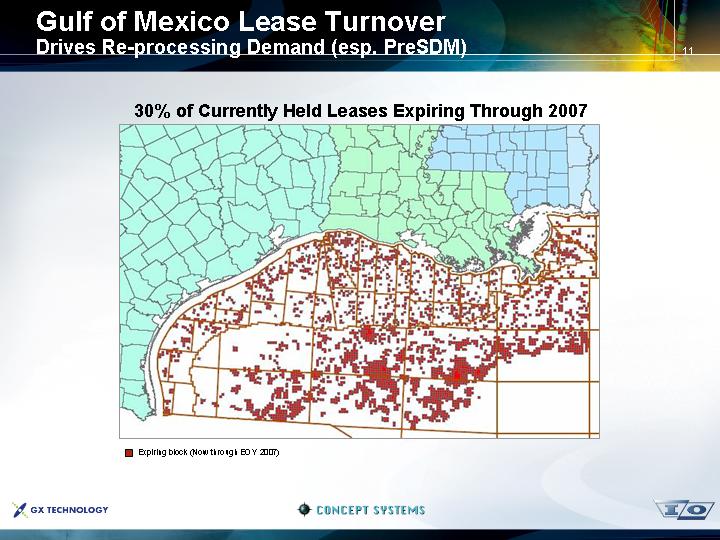
Gulf of Mexico Lease Turnover
Drives Re-processing Demand (esp. PreSDM)
30% of Currently Held Leases Expiring Through 2007
[GRAPHIC]
11
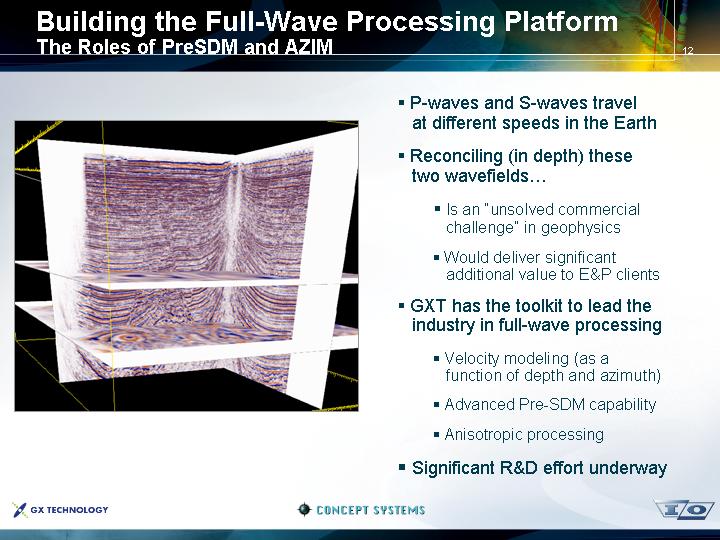
Building the Full-Wave Processing Platform
The Roles of PreSDM and AZIM
[GRAPHIC]
• P-waves and S-waves travel at different speeds in the Earth
• Reconciling (in depth) these two wavefields…
• Is an “unsolved commercial challenge” in geophysics
• Would deliver significant additional value to E&P clients
• GXT has the toolkit to lead the industry in full-wave processing
• Velocity modeling (as a function of depth and azimuth)
• Advanced Pre-SDM capability
• Anisotropic processing
• Significant R&D effort underway
12
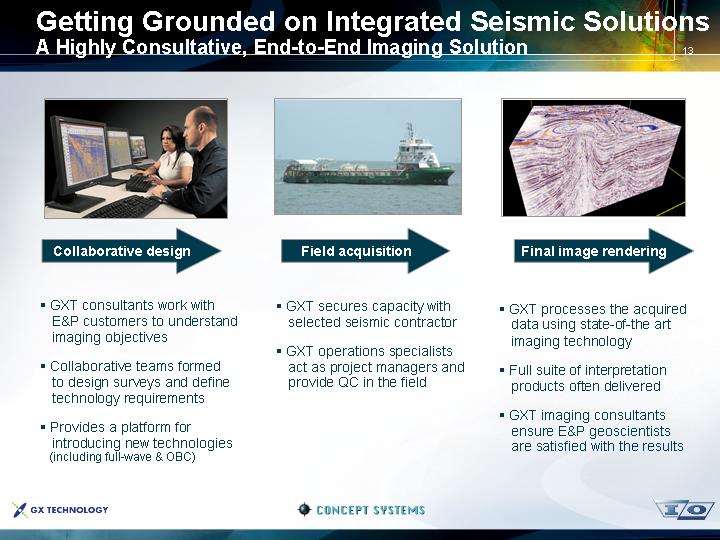
Getting Grounded on Integrated Seismic Solutions
A Highly Consultative, End-to-End Imaging Solution
[GRAPHIC] |
| [GRAPHIC] |
| [GRAPHIC] |
|
|
|
|
|
Collaborative design |
| Field acquisition |
| Final image rendering |
|
|
|
|
|
• GXT consultants work with E&P customers to understand imaging objectives |
| • GXT secures capacity with selected seismic contractor |
| • GXT processes the acquired data using state-of-the art imaging technology |
|
|
|
|
|
• Collaborative teams formed to design surveys and define technology requirements |
| • GXT operations specialists act as project managers and provide QC in the field |
| • Full suite of interpretation products often delivered |
|
|
|
|
|
• Provides a platform for introducing new technologies (including full-wave & OBC) |
|
|
| • GXT imaging consultants ensure E&P geoscientists are satisfied with the results |
13
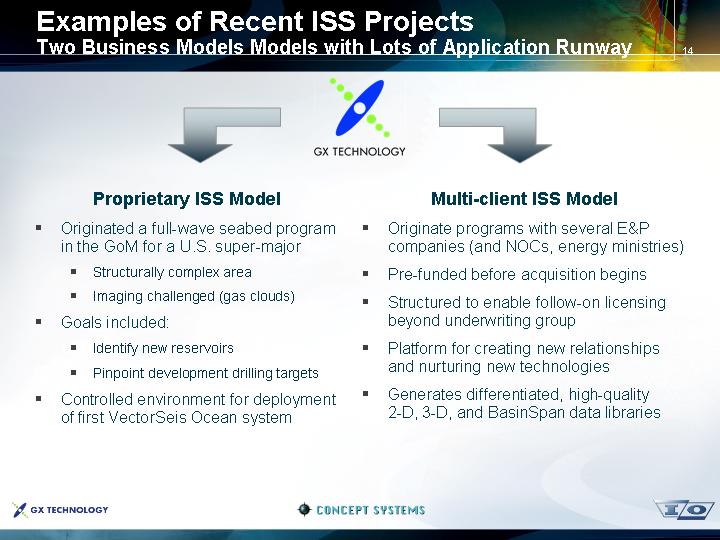
Examples of Recent ISS Projects
Two Business Models Models with Lots of Application Runway
[LOGO] | ||
|
|
|
Proprietary ISS Model |
| Multi-client ISS Model |
|
|
|
• Originated a full-wave seabed program in the GoM for a U.S. super-major
• Structurally complex area
• Imaging challenged (gas clouds)
• Goals included:
• Identify new reservoirs
• Pinpoint development drilling targets
• Controlled environment for deployment of first VectorSeis Ocean system |
| • Originate programs with several E&P companies (and NOCs, energy ministries)
• Pre-funded before acquisition begins
• Structured to enable follow-on licensing beyond underwriting group
• Platform for creating new relationships and nurturing new technologies
• Generates differentiated, high-quality 2-D, 3-D, and BasinSpan data libraries |
14
Getting Grounded on GXT BasinSpans
Not Your Traditional Multi-Client Spec Business
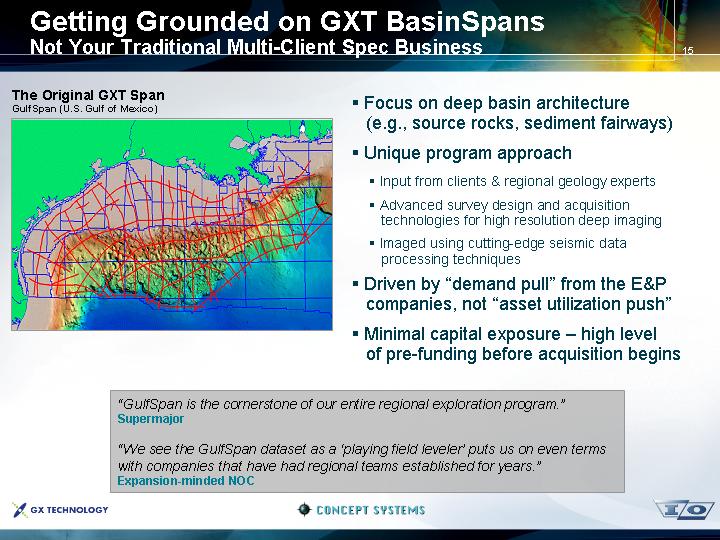
The Original GXT Span
GulfSpan (U.S. Gulf of Mexico)
[GRAPHIC]
• Focus on deep basin architecture
(e.g., source rocks, sediment fairways)
• Unique program approach
• Input from clients & regional geology experts
• Advanced survey design and acquisition technologies for high resolution deep imaging
• Imaged using cutting-edge seismic data processing techniques
• Driven by “demand pull” from the E&P companies, not “asset utilization push”
• Minimal capital exposure – high level of pre-funding before acquisition begins
“GulfSpan is the cornerstone of our entire regional exploration program.”
Supermajor
“We see the GulfSpan dataset as a ‘playing field leveler’ puts us on even terms with companies that have had regional teams established for years.”
Expansion-minded NOC
15
Span Expansion Opportunities
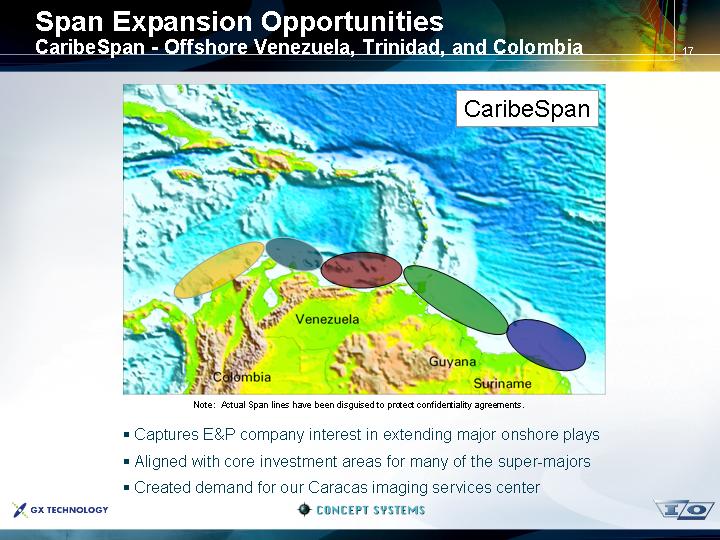
CaribeSpan - Offshore Venezuela, Trinidad, and Colombia
[GRAPHIC]
Note: Actual Span lines have been disguised to protect confidentiality agreements.
• Captures E&P company interest in extending major onshore plays
• Aligned with core investment areas for many of the super-majors
• Created demand for our Caracas imaging services center
17
Span Expansion Opportunities
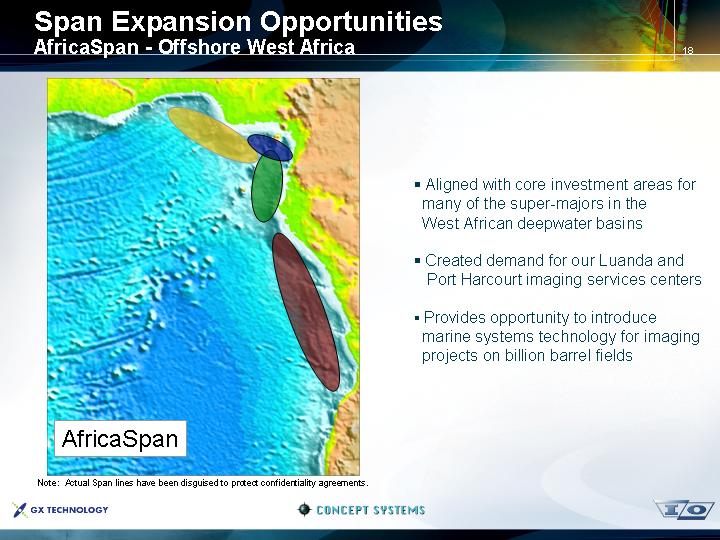
AfricaSpan - Offshore West Africa
[GRAPHIC]
Note: Actual Span lines have been disguised to protect confidentiality agreements.
• Aligned with core investment areas for many of the super-majors in the West African deepwater basins
• Created demand for our Luanda and Port Harcourt imaging services centers
• Provides opportunity to introduce marine systems technology for imaging projects on billion barrel fields
18
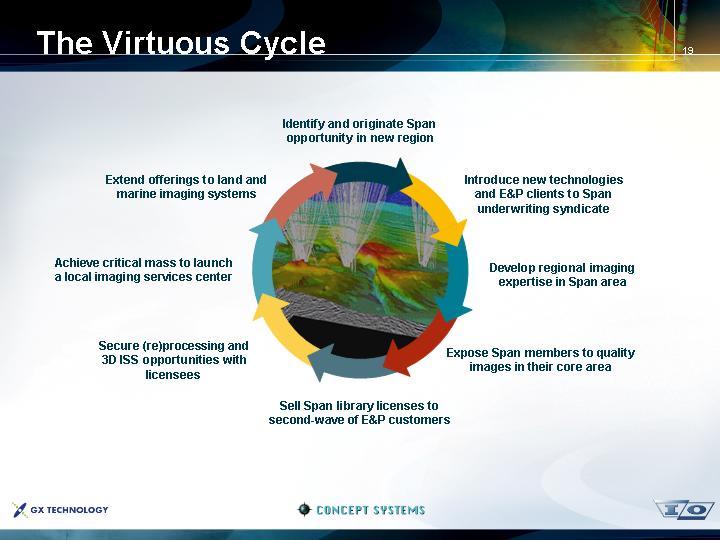
The Virtuous Cycle
|
| Identify and originate Span |
|
|
|
|
|
|
|
|
|
|
|
|
Extend offerings to land and |
|
|
| Introduce new technologies and E&P clients to Span underwriting syndicate |
|
|
|
|
|
|
|
|
|
|
Achieve critical mass to launch |
| [GRAPHIC] |
| Develop regional imaging |
|
|
|
|
|
|
|
|
|
|
Secure (re)processing and |
|
|
| Expose Span members to quality |
|
|
|
|
|
|
|
|
|
|
|
| Sell Span library licenses to |
|
|
19
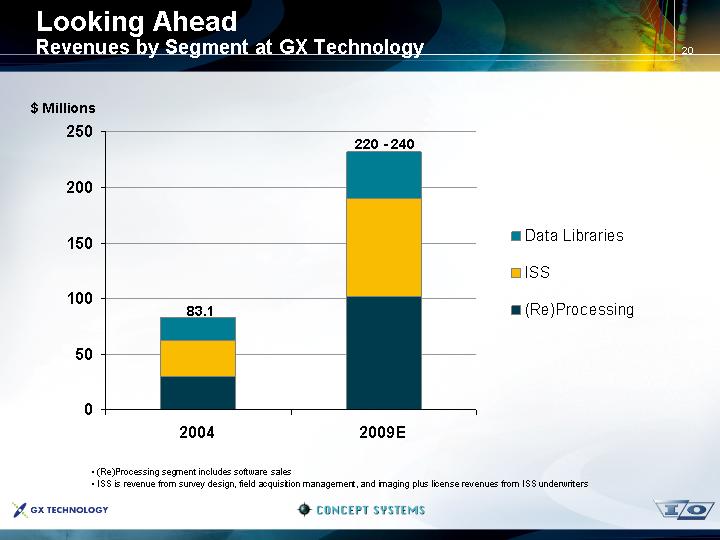
Looking Ahead
Revenues by Segment at GX Technology
[CHART]
• (Re)Processing segment includes software sales
• ISS is revenue from survey design, field acquisition management, and imaging plus license revenues from ISS underwriters
20
Agenda
• Importance and Implications of Full-wave Imaging
• VectorSeis®
• Benefits
• Who has used VectorSeis and why?
• Summary
[LOGO] |
| [LOGO] |
| [LOGO] |
2
Conventional Seismic Imaging
Technology of the Last 50 Years
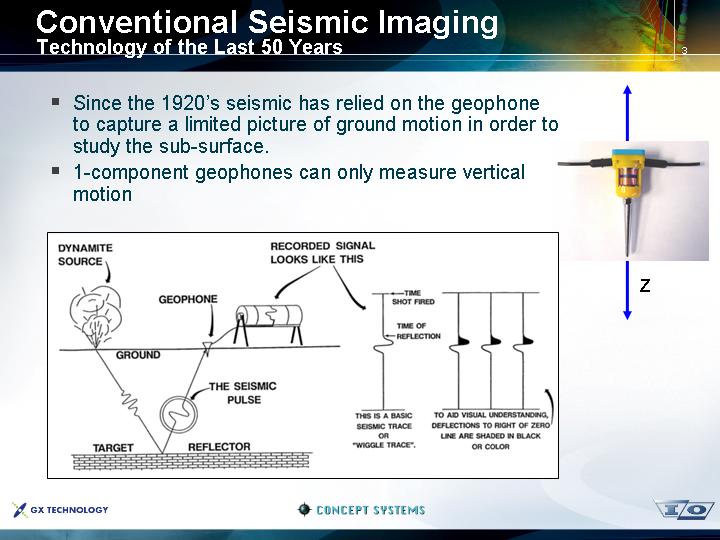
• Since the 1920’s seismic has relied on the geophone to capture a limited picture of ground motion in order to study the sub-surface.
• 1-component geophones can only measure vertical motion
[GRAPHIC]
[GRAPHIC]
3
Conventional Seismic Imaging
Why Do We Need to Change?
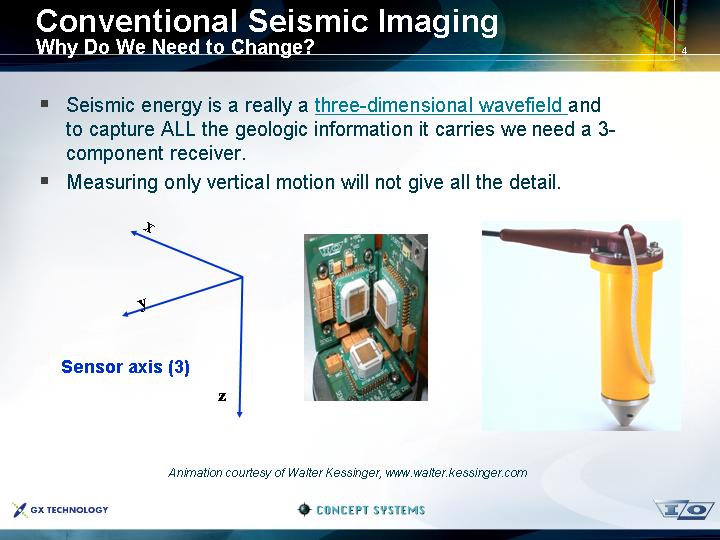
• Seismic energy is a really a three-dimensional wavefield and to capture ALL the geologic information it carries we need a
3-component receiver.
• Measuring only vertical motion will not give all the detail.
[GRAPHIC] |
| [GRAPHIC] |
| [GRAPHIC] |
Animation courtesy of Walter Kessinger, www.walter.kessinger.com
4
Full-wave Imaging Fundamentals
What is Full-wave Imaging?
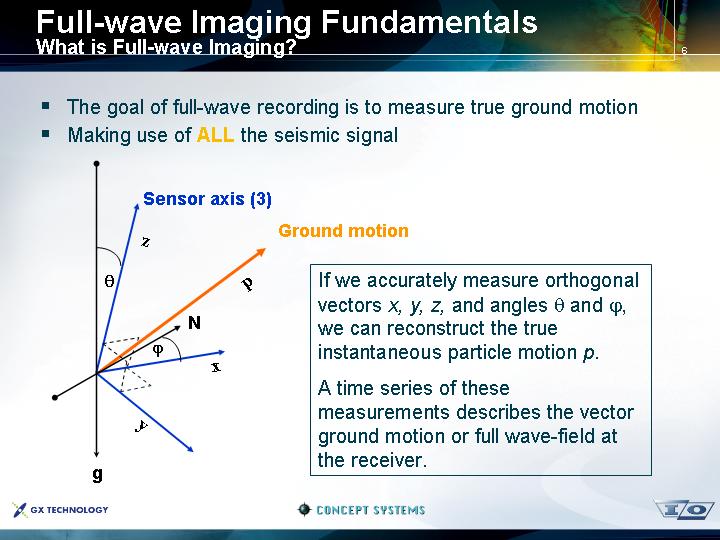
• The goal of full-wave recording is to measure true ground motion
• Making use of ALL the seismic signal
[GRAPHIC]
If we accurately measure orthogonal vectors x, y, z, and angles ![]() and
and ![]() , we can reconstruct the true instantaneous particle motion p.
, we can reconstruct the true instantaneous particle motion p.
A time series of these measurements describes the vector ground motion or full wave-field at the receiver.
6
Why Full-wave Imaging?
• Conventional 3-D imaging limits our ability to improve reservoir images well enough to have maximum economic impact. Current imaging suffers from:
• Assumptions of isotropy and vertical emergent angle
• Limitations of frequency bandwidth and survey design limitations imposed by source-generated noise
• These assumptions and limitations can obscure geologic detail
• Because of these assumptions, currently implemented 3-D imaging is less able to deliver additional economic value
• Directly affects our ability to find and develop new reserves at an acceptable risk
• Currently producing fields are seriously suffering from the diminishing economic impact of current 3-D technology
7
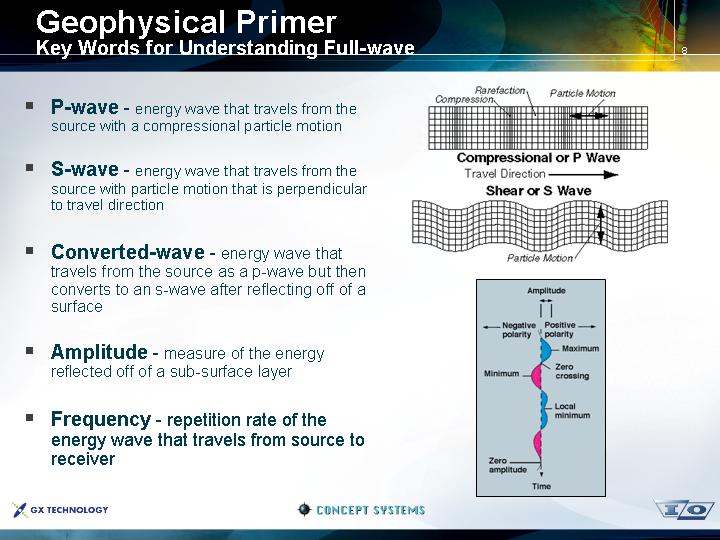
Geophysical Primer
Key Words for Understanding Full-wave
• P-wave - energy wave that travels from the source with a compressional particle motion
• S-wave - energy wave that travels from the source with particle motion that is perpendicular to travel direction
• Converted-wave - energy wave that travels from the source as a p-wave but then converts to an s-wave after reflecting off of a surface
• Amplitude - measure of the energy reflected off of a sub-surface layer
• Frequency - repetition rate of the energy wave that travels from source to receiver
[GRAPHIC]
8
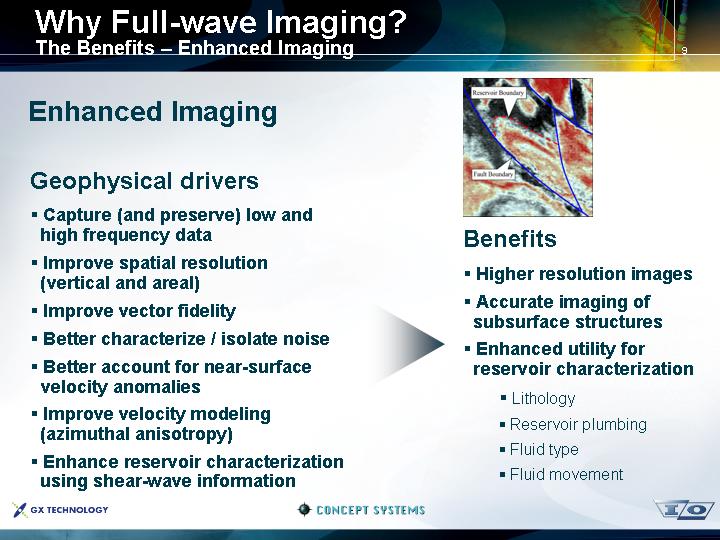
Why Full-wave Imaging?
The Benefits – Enhanced Imaging
Enhanced Imaging
Geophysical drivers |
| [GRAPHIC] |
|
|
|
• Capture (and preserve) low and high frequency data
• Improve spatial resolution
• Improve vector fidelity
• Better characterize / isolate noise
• Better account for near-surface velocity anomalies
• Improve velocity modeling
• Enhance reservoir characterization using shear-wave information |
| Benefits
• Higher resolution images
• Accurate imaging of subsurface structures
• Enhanced utility for reservoir characterization
• Lithology
• Reservoir plumbing
• Fluid type
• Fluid movement |
9
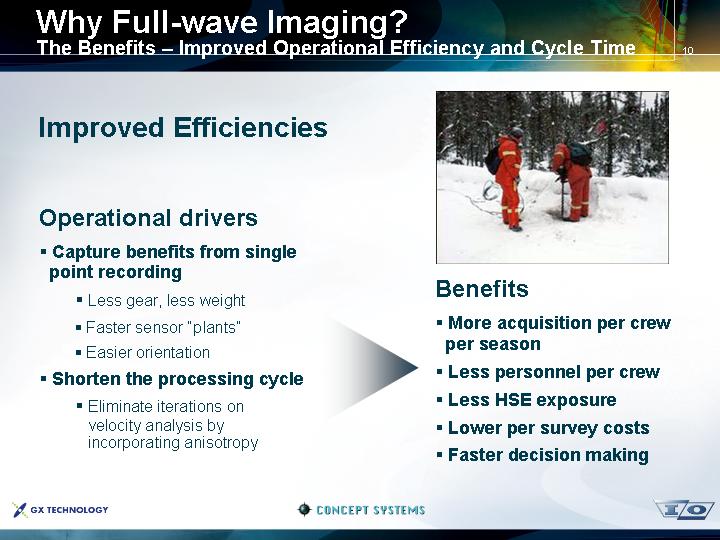
Why Full-wave Imaging?
The Benefits – Improved Operational Efficiency and Cycle Time
Improved Efficiencies |
|
|
|
|
|
Operational drivers |
| [GRAPHIC] |
|
|
|
• Capture benefits from single point recording |
| Benefits |
|
|
|
• Less gear, less weight
• Faster sensor “plants”
• Easier orientation
• Shorten the processing cycle
• Eliminate iterations on velocity analysis by incorporating anisotropy |
| • More acquisition per crew per season
• Less personnel per crew
• Less HSE exposure
• Lower per survey costs
• Faster decision making |
10
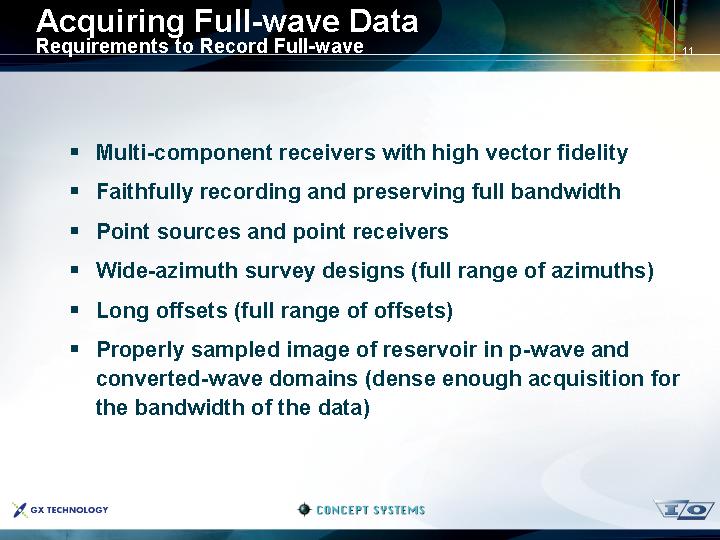
Acquiring Full-wave Data
Requirements to Record Full-wave
• Multi-component receivers with high vector fidelity
• Faithfully recording and preserving full bandwidth
• Point sources and point receivers
• Wide-azimuth survey designs (full range of azimuths)
• Long offsets (full range of offsets)
• Properly sampled image of reservoir in p-wave and converted-wave domains (dense enough acquisition for the bandwidth of the data)
11
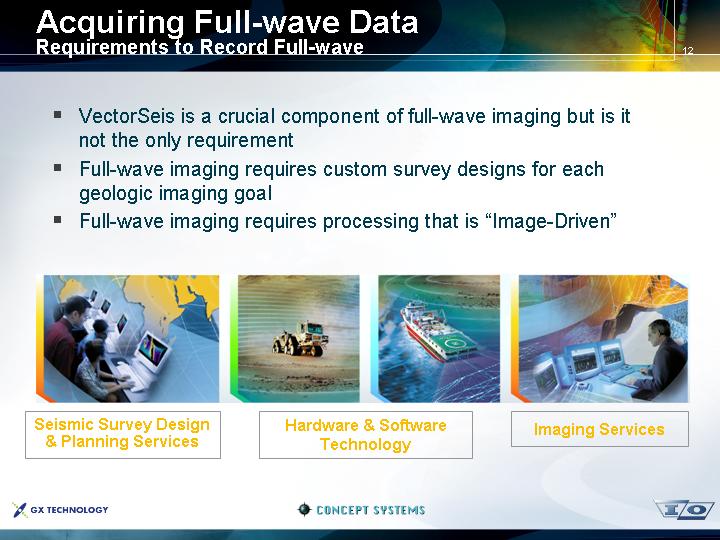
• VectorSeis is a crucial component of full-wave imaging but is it not the only requirement
• Full-wave imaging requires custom survey designs for each geologic imaging goal
• Full-wave imaging requires processing that is “Image-Driven”
[GRAPHIC] | [GRAPHIC] | [GRAPHIC] | [GRAPHIC] |
|
|
|
|
Seismic Survey Design | Hardware & Software | Imaging Services | |
12
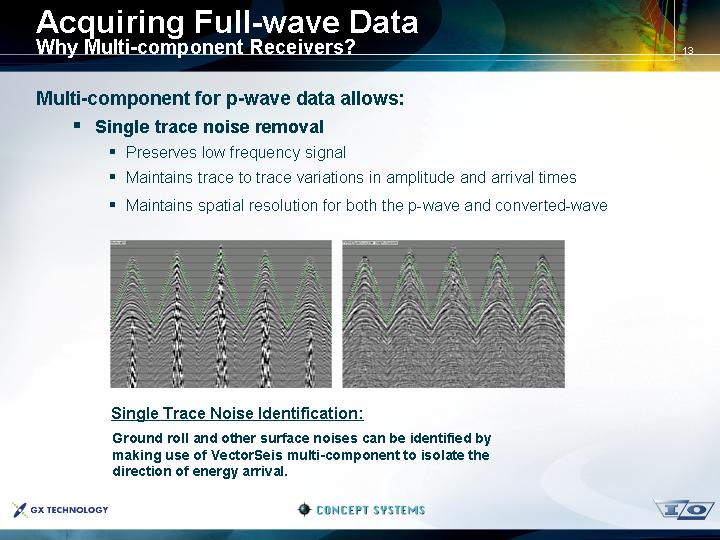
Acquiring Full-wave Data
Why Multi-component Receivers?
Multi-component for p-wave data allows:
• Single trace noise removal
• Preserves low frequency signal
• Maintains trace to trace variations in amplitude and arrival times
• Maintains spatial resolution for both the p-wave and converted-wave
[GRAPHIC] |
| [GRAPHIC] |
Single Trace Noise Identification:
Ground roll and other surface noises can be identified by making use of VectorSeis multi-component to isolate the direction of energy arrival.
13
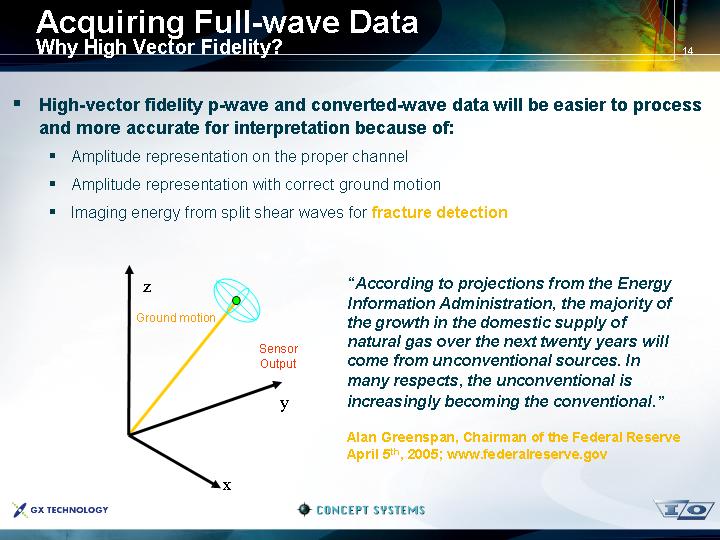
Acquiring Full-wave Data
Why High Vector Fidelity?
• High-vector fidelity p-wave and converted-wave data will be easier to process and more accurate for interpretation because of:
• Amplitude representation on the proper channel
• Amplitude representation with correct ground motion
• Imaging energy from split shear waves for fracture detection
[GRAPHIC]
“According to projections from the Energy Information Administration, the majority of the growth in the domestic supply of natural gas over the next twenty years will come from unconventional sources. In many respects, the unconventional is increasingly becoming the conventional.”
Alan Greenspan, Chairman of the Federal Reserve April 5th, 2005; www.federalreserve.gov
14
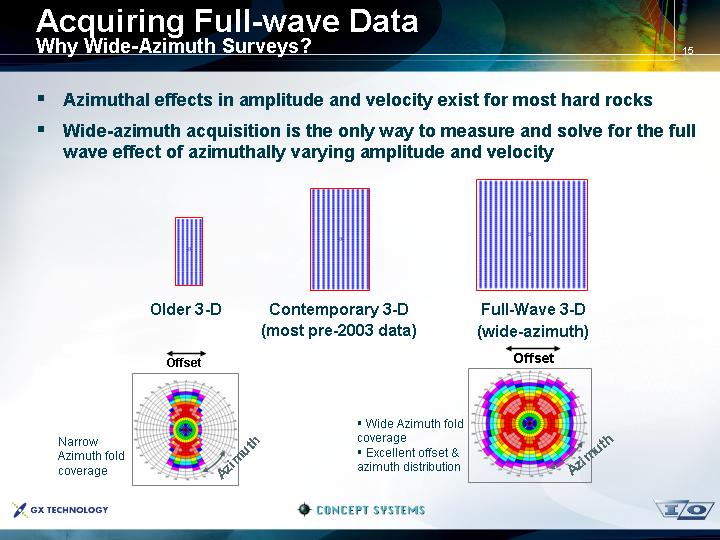
Acquiring Full-wave Data
Why Wide-Azimuth Surveys?
• Azimuthal effects in amplitude and velocity exist for most hard rocks
• Wide-azimuth acquisition is the only way to measure and solve for the full wave effect of azimuthally varying amplitude and velocity
[GRAPHIC] |
| [GRAPHIC] |
| [GRAPHIC] | ||
|
|
|
|
| ||
Older 3-D |
| Contemporary 3-D |
| Full-Wave 3-D | ||
|
|
|
|
| ||
Narrow | [GRAPHIC] |
|
| • Wide Azimuth fold coverage • Excellent offset & azimuth distribution | [GRAPHIC] | |
15
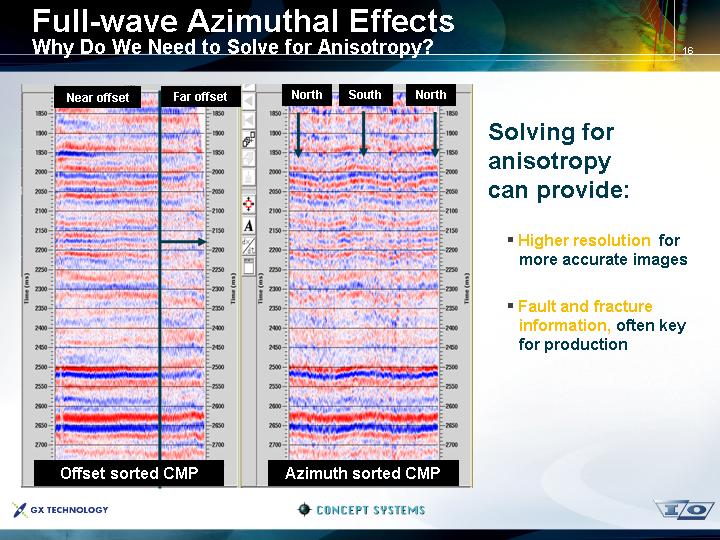
Full-wave Azimuthal Effects
Why Do We Need to Solve for Anisotropy?
[CHART] |
| [CHART] |
|
|
|
Offset sorted CMP |
| Azimuth sorted CMP |
Solving for anisotropy can provide:
• Higher resolution for more accurate images
• Fault and fracture information, often key for production
16
Acquiring Full-wave Data
Why Point Sources and Point Receivers?
• Geophone arrays have been used for 50 years to cancel surface noise generated during acquisition.
• The array is good at canceling noise but it introduces other problems such as:
• Removing high frequency signal that we need
• “Smearing”signal which removes detail from the image
• Slows down acquisition!
[GRAPHIC]
Output is spatially summed to the group center. This can filter out signal as well as noise.
17
Arrays deteriorate vector fidelity which leads to
• Poor performance in vector filtering
• Incorrect fracture detection = poor image of unconventional reservoirs
Arrays average statics results in poor statics corrections and poor velocity analysis
• Loss of resolution
12 Traces |
| Stack Result |
| Animation demonstrates difference in frequency content between data recorded with arrays and single point receivers |
|
|
|
|
|
[CHART] |
| [CHART] |
| [CHART] |
18
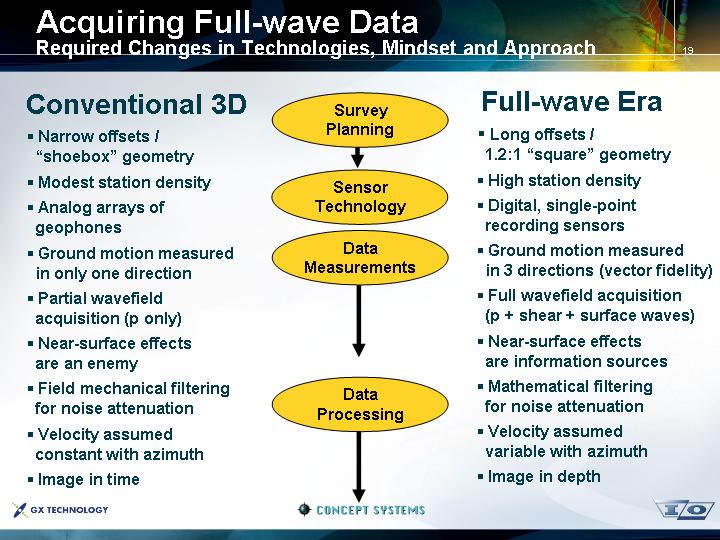
Acquiring Full-wave Data
Required Changes in Technologies, Mindset and Approach
Conventional 3D
• Narrow offsets / “shoebox” geometry
• Modest station density
• Analog arrays of geophones
• Ground motion measured in only one direction
• Partial wavefield acquisition (p only)
• Near-surface effects are an enemy
• Field mechanical filtering for noise attenuation
• Velocity assumed constant with azimuth
• Image in time |
| Survey
Sensor
Data
Data |
| Full-wave Era
• Long offsets / 1.2:1 “square” geometry
• High station density
• Digital, single-point recording sensors
• Ground motion measured in 3 directions (vector fidelity)
• Full wavefield acquisition (p + shear + surface waves)
• Near-surface effects are information sources
• Mathematical filtering for noise attenuation
• Velocity assumed variable with azimuth
• Image in depth |
19
Summary
Importance and Implications of Full-wave Imaging
• Over the last 50 years, seismic imaging has advanced in several stages, each resulting in:
• Improved exploration success
• Better hydrocarbon reservoir characterizations
• Full-wave imaging and the technologies that make it possible deliver:
• High quality seismic images to oil companies
• Operational benefits to contractors
• With improved understanding, uncertainty is reduced and better decisions are made
20
VectorSeis - Benefits
The Most Advanced and Reliable Digital Receiver
Why VectorSeis?
Enhanced P-wave Imaging
• Extremely accurate measurements of all ground motion – signal and noise
• Ideal for recording azimuthal variations in seismic velocities (anisotropy)
• Broad bandwidth, enhanced resolution
Converted-wave imaging
• Joint use of p-wave and converted-wave data volumes to reduce uncertainty
• Imaging targets with weak p-wave impedance contrast
• Reservoir characterization; lithology/fluid prediction
• Fracture detection and mapping
Improved Operational Efficiency
• Less equipment (weight and bulk) to deploy and transport
• Less field effort, manpower and associated HSE exposure
21
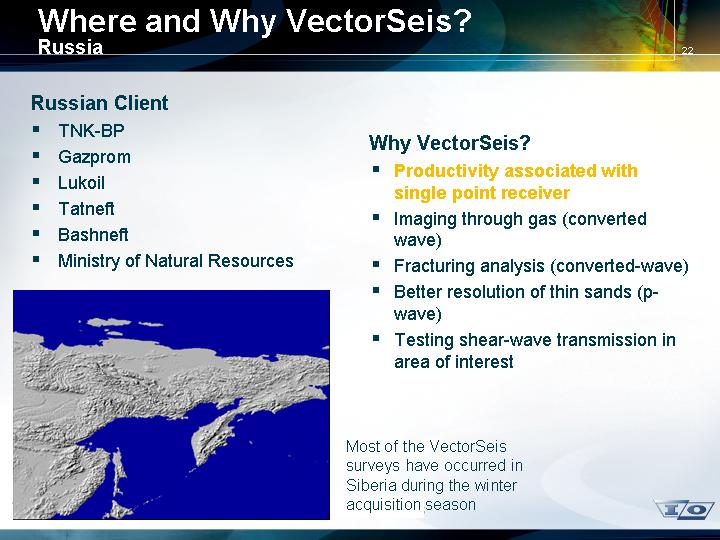
Where and Why VectorSeis?
Russia
Russian Client
• TNK-BP
• Gazprom
• Lukoil
• Tatneft
• Bashneft
• Ministry of Natural Resources
[GRAPHIC]
Why VectorSeis?
• Productivity associated with single point receiver
• Imaging through gas (converted wave)
• Fracturing analysis (converted-wave)
• Better resolution of thin sands (p-wave)
• Testing shear-wave transmission in area of interest
Most of the VectorSeis surveys have occurred in Siberia during the winter acquisition season
22
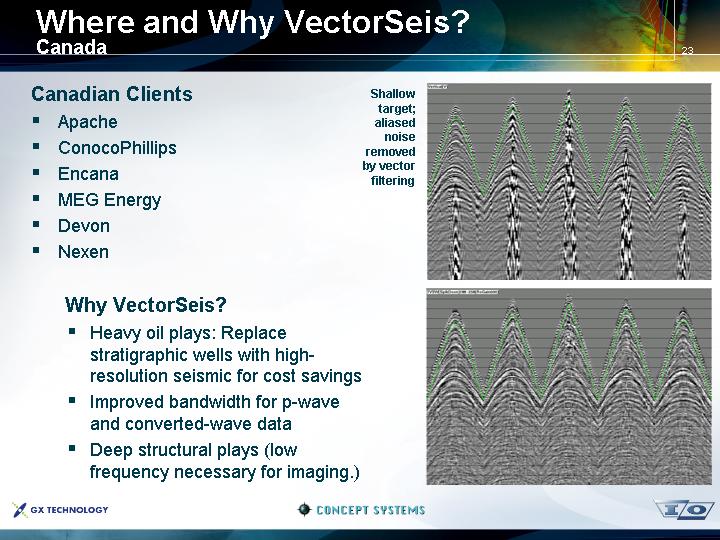
Where and Why VectorSeis?
Canada
Canadian Clients
• Apache
• ConocoPhillips
• Encana
• MEG Energy
• Devon
• Nexen
Why VectorSeis?
• Heavy oil plays: Replace stratigraphic wells with high-resolution seismic for cost savings
• Improved bandwidth for p-wave and converted-wave data
• Deep structural plays (low frequency necessary for imaging.)
Shallow target; aliased noise removed by vector filtering
[GRAPHIC]
[GRAPHIC]
23
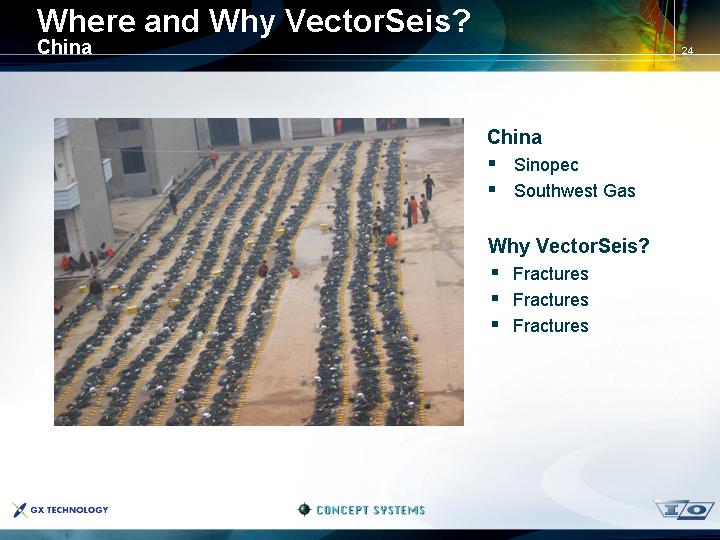
Where and Why VectorSeis?
China
[GRAPHIC]
China
• Sinopec
• Southwest Gas
Why VectorSeis?
• Fractures
• Fractures
• Fractures
24
Where and Why VectorSeis?
United States
United States Clients
• Anadarko
• Apache
• Colorado School of Mines
• Samson
• Devon
[GRAPHIC]
Why VectorSeis?
• High resolution p-wave data
• Low frequencies for imaging deep targets (p-wave)
• Converted-wave data for imaging deep targets
• Fractured carbonates/sands; shear-wave and converted-wave data used to determine:
• Fracture density
• Fracture orientation
25
Where and Why VectorSeis?
Europe, Africa, India
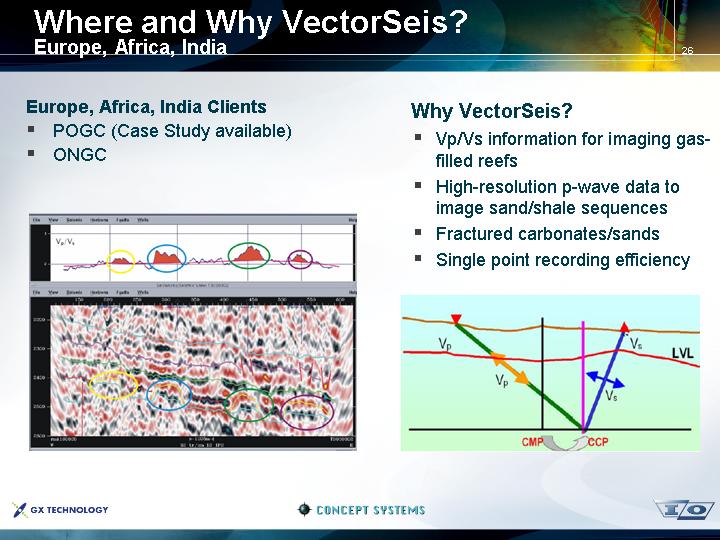
Europe, Africa, India Clients
• POGC (Case Study available)
• ONGC
[GRAPHIC]
Why VectorSeis?
• Vp/Vs information for imaging gas-filled reefs
• High-resolution p-wave data to image sand/shale sequences
• Fractured carbonates/sands
• Single point recording efficiency
[GRAPHIC]
26
VectorSeis – Summary
Benefits Seen Around the World
Why VectorSeis?
• Enhanced P-wave Imaging
• Extremely accurate measurements of all ground motion – signal and noise
• Ideal for recording azimuthal variations in seismic velocities (anisotropy)
• Broad bandwidth, enhanced resolution
• Converted-wave imaging
• Joint use of p-wave and converted-wave data volumes to reduce uncertainty
• Imaging targets with weak p-wave impedance contrast
• Reservoir characterization; lithology/fluid prediction
• Fracture detection and mapping
• Improved Operational Efficiency
• Less equipment (weight and bulk) to deploy and transport
• Less field effort, manpower and associated HSE exposure
27
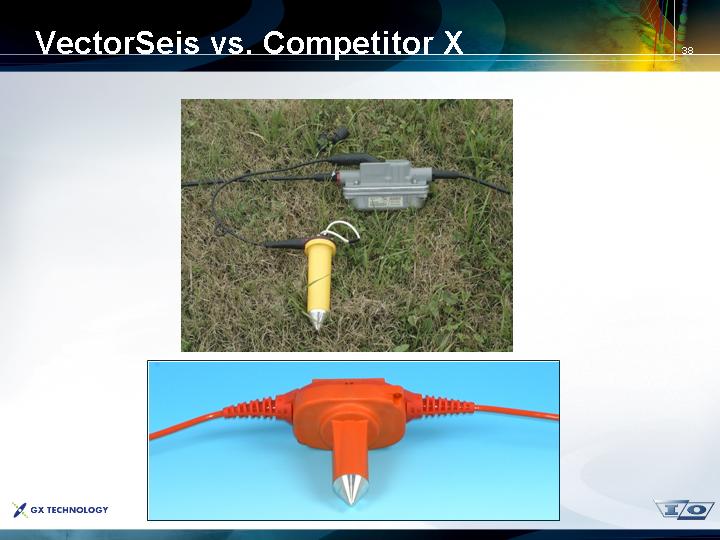
VectorSeis vs. Competitor X
• Introduction
• Sensor Design
• In the field comparison
[LOGO] |
| [LOGO] |
| [LOGO] |
29
Introduction
• There is currently one main commercial competitor to VectorSeis. On the surface these receivers appear similar.
• Both are single point receivers
• Both receivers record 3-Component seismic
• Both receivers use MEMS sensors to record data
• However, there are many geophysical and operationally significant differences that we will explore
30
VectorSeis Full-wave Imaging
Competitive Landscape
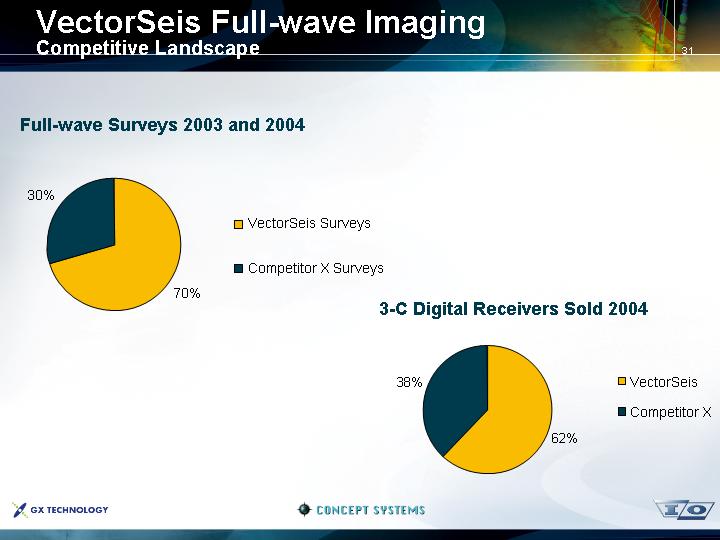
Full-wave Surveys 2003 and 2004
[CHART]
3-C Digital Receivers Sold 2004
[CHART]
31
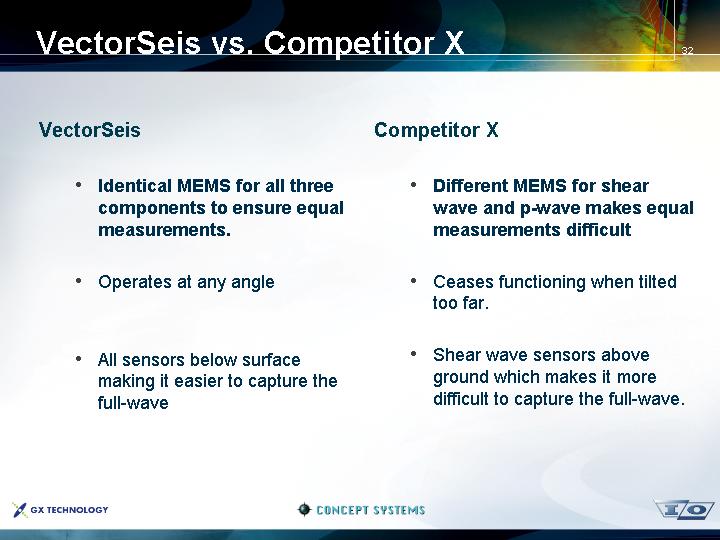
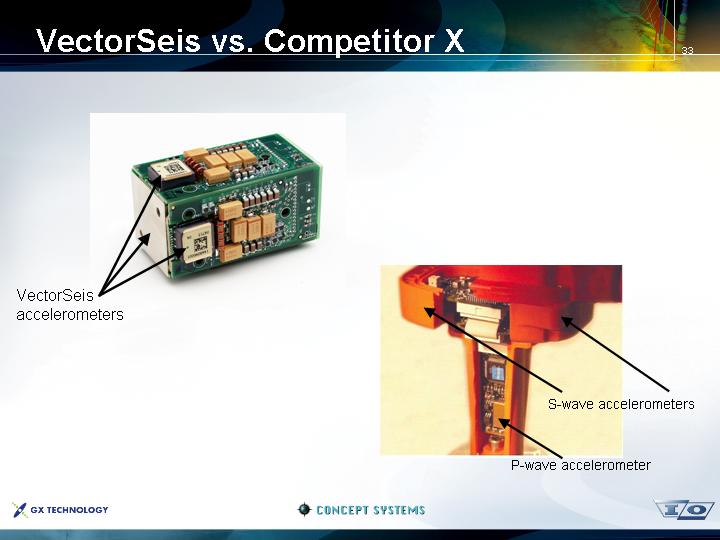
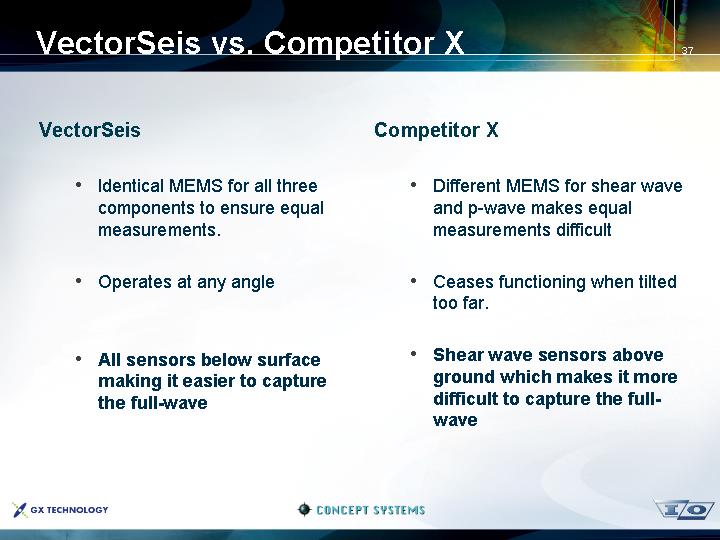
VectorSeis vs. Competitor X
VectorSeis |
| Competitor X |
|
|
|
• Identical MEMS for all three components to ensure equal measurements.
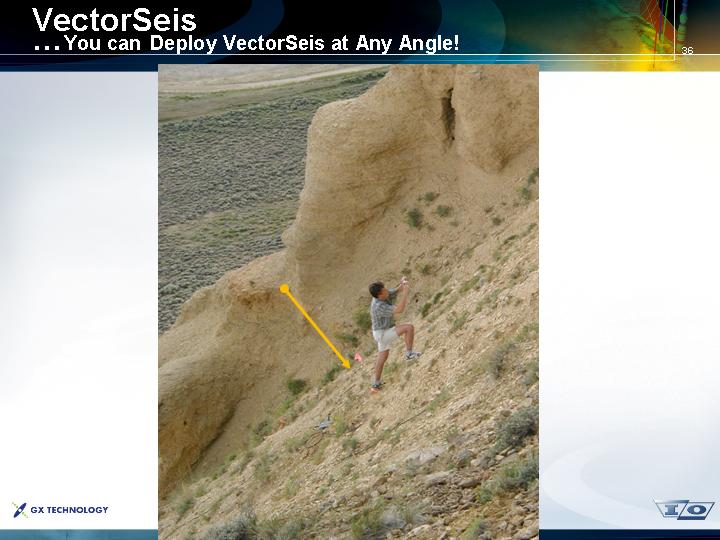
• Operates at any angle
• All sensors below surface making it easier to capture the full-wave |
| • Different MEMS for shear wave and p-wave makes equal measurements difficult
• Ceases functioning when tilted too far.
• Shear wave sensors above ground which makes it more difficult to capture the full-wave. |
32
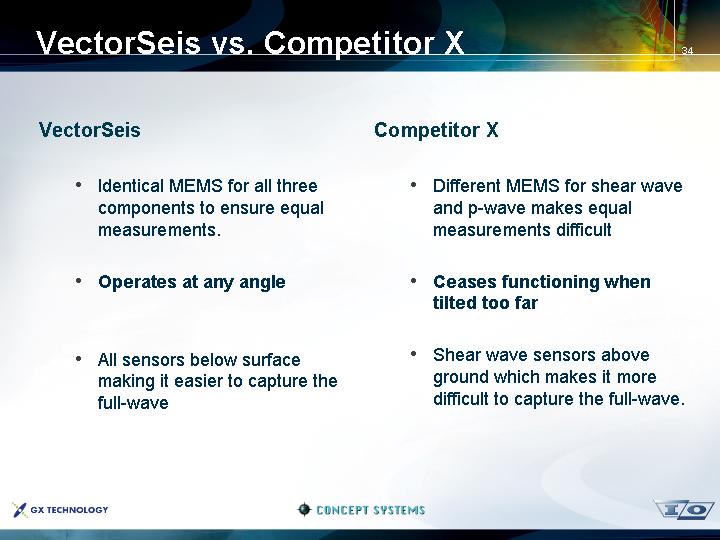
VectorSeis |
| Competitor X |
|
|
|
• Identical MEMS for all three components to ensure equal measurements.
• Operates at any angle
• All sensors below surface making it easier to capture the full-wave |
| • Different MEMS for shear wave and p-wave makes equal measurements difficult
• Ceases functioning when tilted too far.
• Shear wave sensors above ground which makes it more difficult to capture the full-wave. |
34
VectorSeis |
| Competitor X |
|
|
|
• Identical MEMS for all three components to ensure equal measurements.
• Operates at any angle
• All sensors below surface making it easier to capture the full-wave |
| • Different MEMS for shear wave and p-wave makes equal measurements difficult
• Ceases functioning when tilted too far.
• Shear wave sensors above ground which makes it more difficult to capture the full-wave |
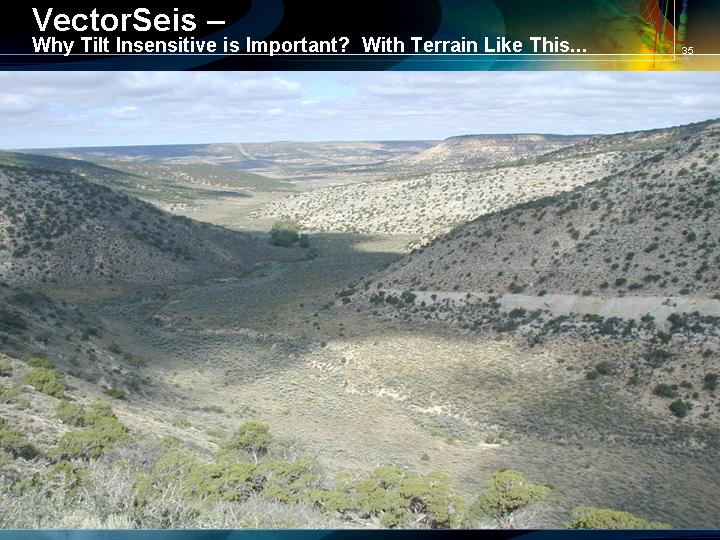
37
VectorSeis vs. Competitor X
In Field Comparison
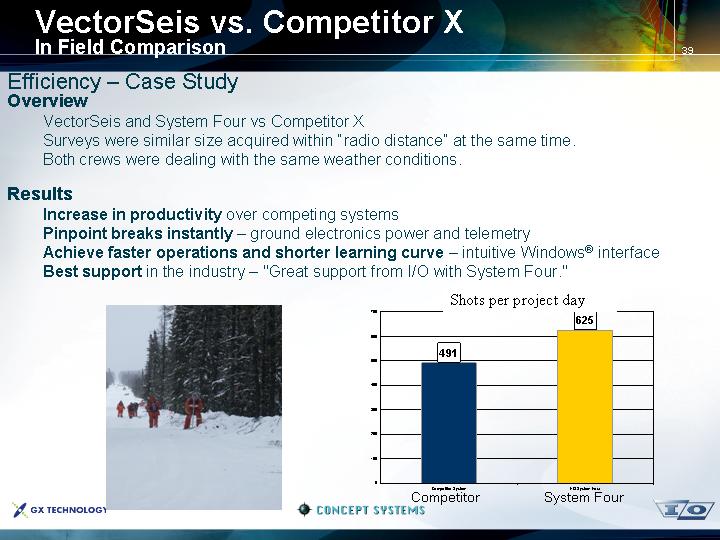
Efficiency – Case Study
Overview
VectorSeis and System Four vs Competitor X
Surveys were similar size acquired within “radio distance” at the same time.
Both crews were dealing with the same weather conditions.
Results
Increase in productivity over competing systems
Pinpoint breaks instantly – ground electronics power and telemetry
Achieve faster operations and shorter learning curve – intuitive Windows® interface
Best support in the industry – “Great support from I/O with System Four.”
|
| Shots per project day |
|
|
|
[GRAPHIC] |
| [CHART] |
39
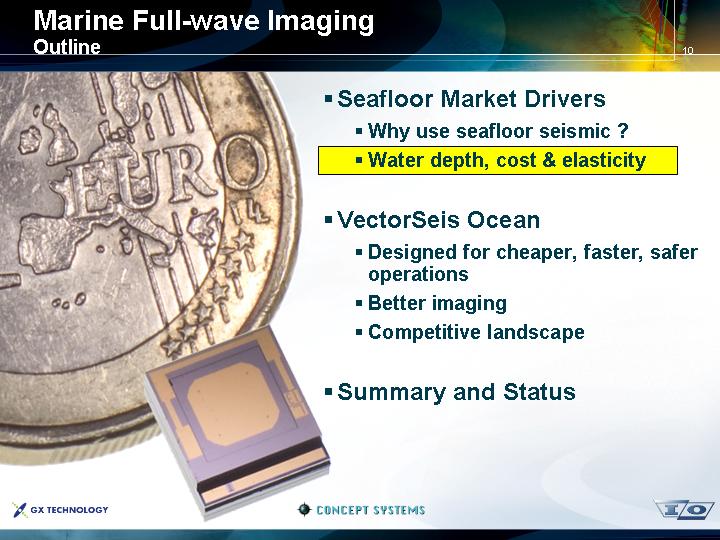
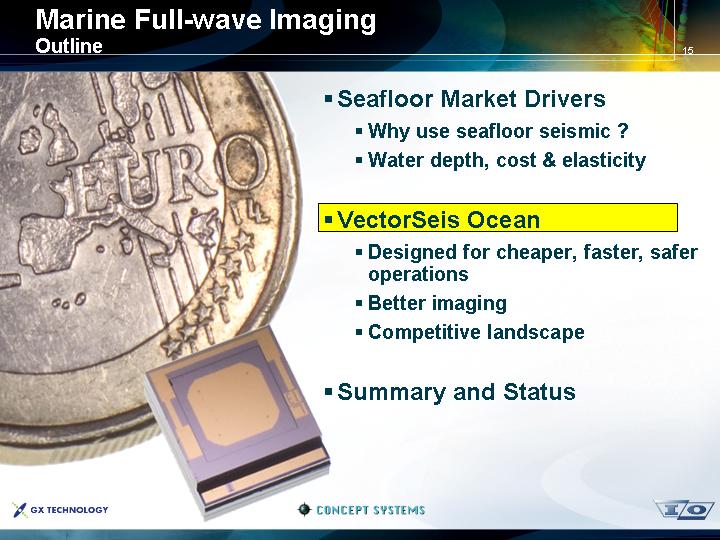
Marine Full-wave Imaging
Outline
[GRAPHIC]
• Seafloor Market Drivers
• Why use seafloor seismic ?
• Water depth, cost & elasticity
• VectorSeis Ocean*
• Designed for cheaper, faster, safer operations
• Better imaging
• Competitive landscape
• Summary and Status
* I/O’s redeployable, full-wave seabed acquisition system
3
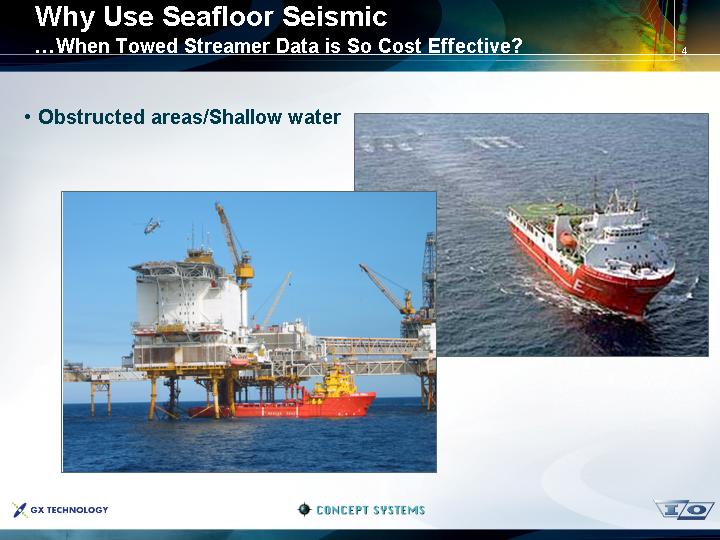
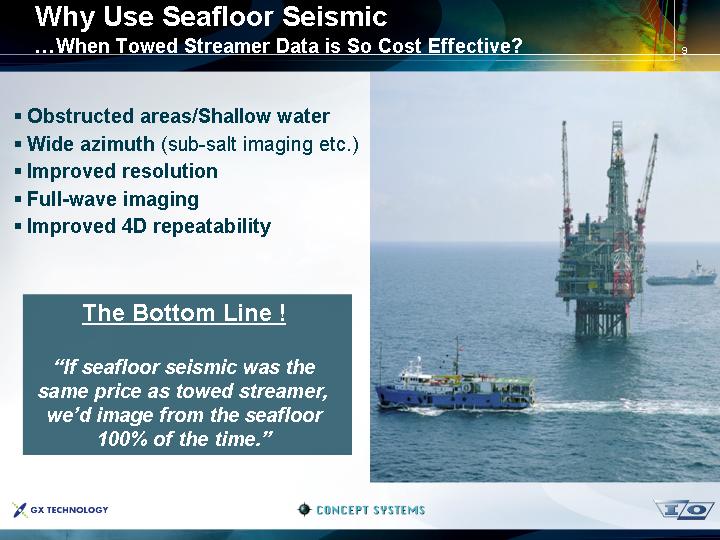
Why Use Seafloor Seismic
...When Towed Streamer Data is So Cost Effective?
• Obstructed areas/Shallow water
[GRAPHIC] |
| [GRAPHIC] |
4
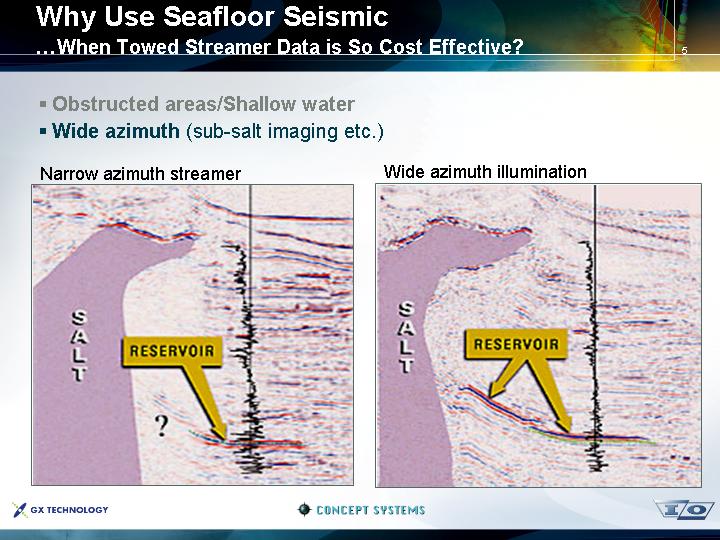
• Obstructed areas/Shallow water
• Wide azimuth (sub-salt imaging etc.)
Narrow azimuth streamer
[GRAPHIC]
Wide azimuth illumination
[GRAPHIC]
5
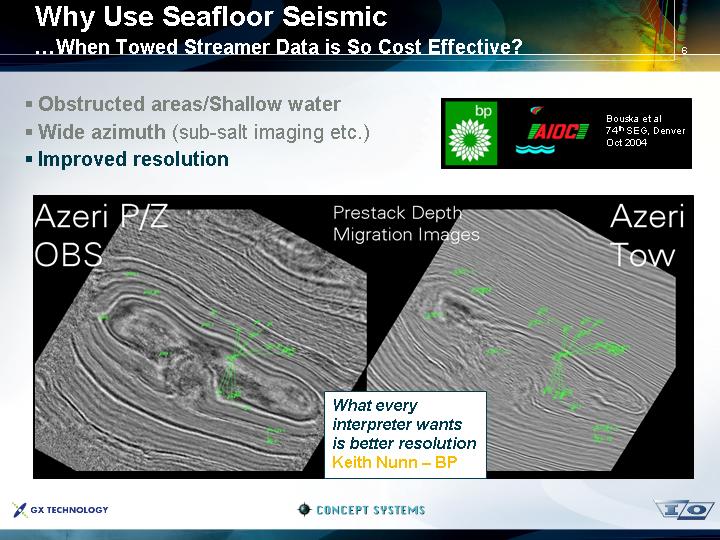
• Obstructed areas/Shallow water
• Wide azimuth (sub-salt imaging etc.)
• Improved resolution | [LOGO] | Bouska et al 74th SEG, Denver Oct 2004 |
Azeri P/Z |
|
| Prestack Depth |
|
| Azeri |
OBS |
|
| Migration Images |
|
| Tow |
|
|
|
|
|
|
|
|
|
| [GRAPHIC] |
|
|
|
|
|
|
|
|
|
|
|
|
| What every interpreter wants is better resolution |
|
|
|
|
|
| Keith Nunn – BP |
|
|
|
6
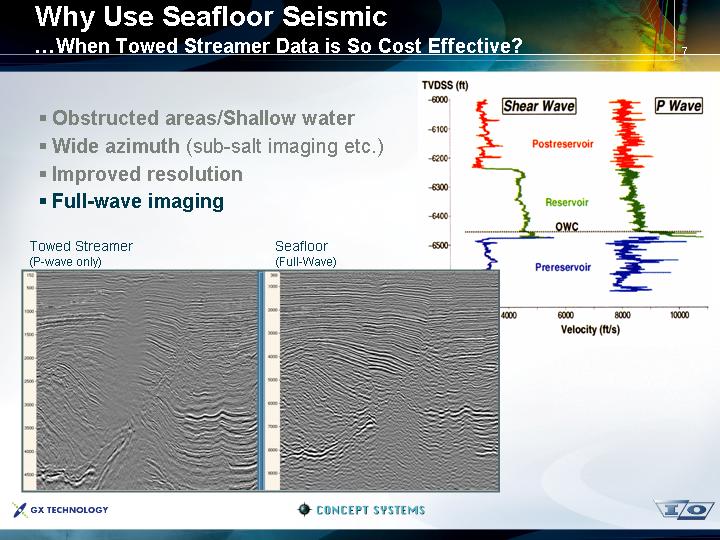
• Obstructed areas/Shallow water
• Wide azimuth (sub-salt imaging etc.)
• Improved resolution
• Full-wave imaging
Towed Streamer (P-wave only) |
| Seafloor (Full-Wave) |
|
|
|
|
|
|
|
[CHART] |
| [CHART] |
| [CHART] |
7
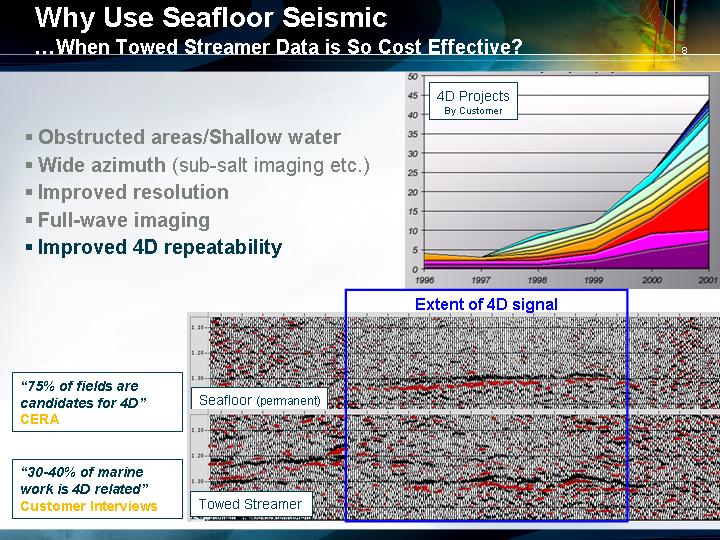
• Obstructed areas/Shallow water
• Wide azimuth (sub-salt imaging etc.)
• Improved resolution
• Full-wave imaging
• Improved 4D repeatability
[CHART]
|
| Extent of 4D signal |
|
|
|
“75% of fields are candidates for 4D” |
| [CHART] |
CERA |
|
|
|
|
|
“30-40% of marine work is 4D related” |
|
|
Customer Interviews |
| [CHART] |
8
• Obstructed areas/Shallow water
• Wide azimuth (sub-salt imaging etc.)
• Improved resolution
• Full-wave imaging
• Improved 4D repeatability
The Bottom Line !
“If seafloor seismic was the same price as towed streamer, we’d image from the seafloor 100% of the time.”
[GRAPHIC]
9
Marine Full-wave Imaging
Outline
[GRAPHIC]
• Seafloor Market Drivers
• Why use seafloor seismic ?
• Water depth, cost & elasticity
• VectorSeis Ocean
• Designed for cheaper, faster, safer operations
• Better imaging
• Competitive landscape
• Summary and Status
10
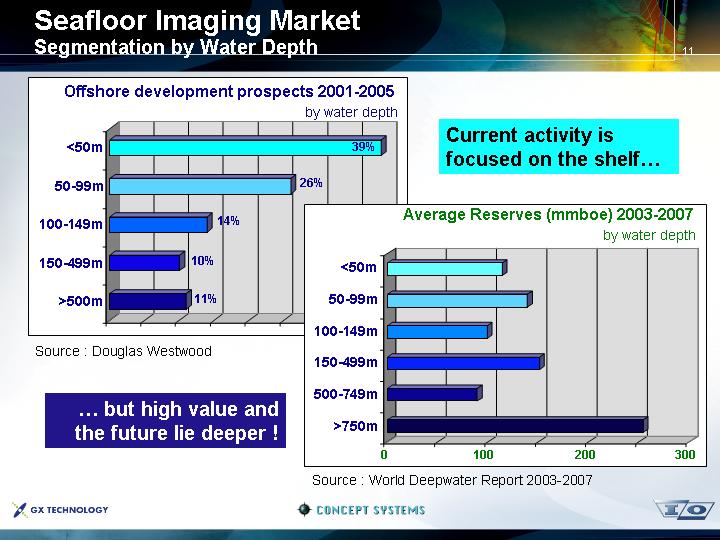
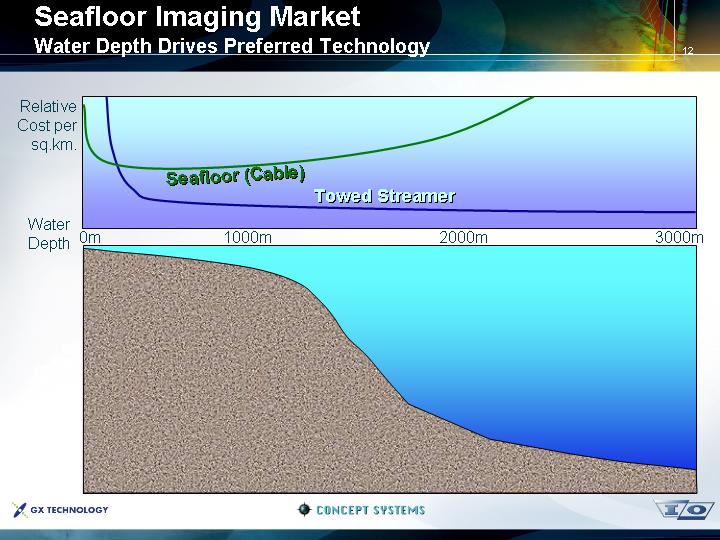
Seafloor Imaging Market
Segmentation by Water Depth
Offshore development prospects 2001-2005 |
|
|
by water depth |
|
|
|
| Current activity is focused on the shelf... |
[CHART] |
|
|
|
|
|
Source : Douglas Westwood |
| Average Reserves (mmboe) 2003-2007 |
|
| by water depth |
… but high value and the future lie deeper ! |
|
|
|
| [CHART] |
|
|
|
|
| Source : World Deepwater Report 2003-2007 |
11
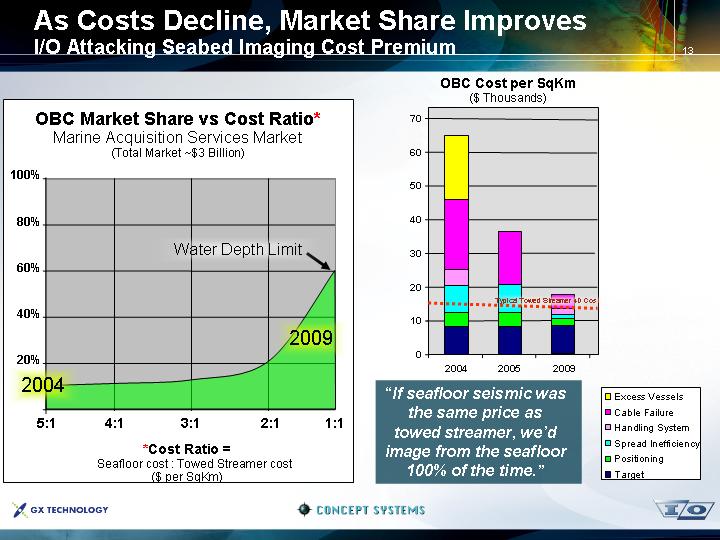
As Costs Decline, Market Share Improves
I/O Attacking Seabed Imaging Cost Premium
OBC Market Share vs Cost Ratio*
Marine Acquisition Services Market
(Total Market ~$3 Billion)
[CHART]
*Cost Ratio = |
|
|
|
|
Seafloor cost : Towed Streamer cost |
|
|
|
|
($ per SqKm) |
|
|
|
|
OBC Cost per SqKm
($ Thousands)
[CHART]
“If seafloor seismic was the same price as towed streamer, we’d image from the seafloor 100% of the time.”
13
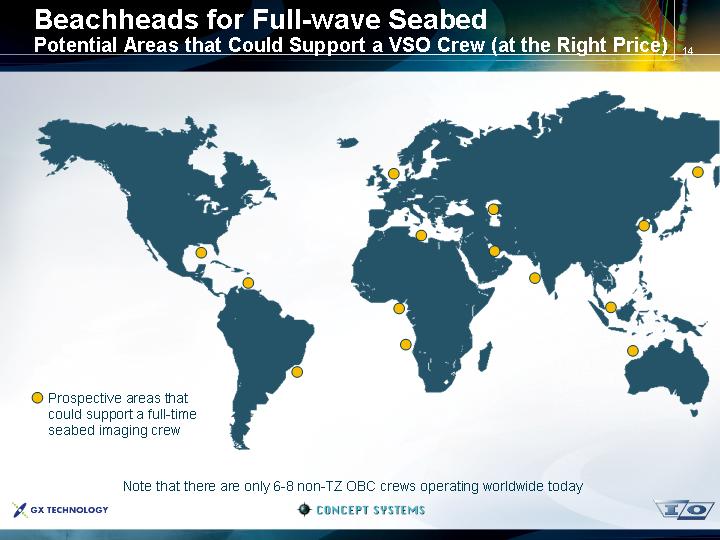
Beachheads for Full-wave Seabed
Potential Areas that Could Support a VSO Crew (at the Right Price)
[GRAPHIC]
Note that there are only 6-8 non-TZ OBC crews operating worldwide today
14
Marine Full-wave Imaging
Outline
[GRAPHIC]
• Seafloor Market Drivers
• Why use seafloor seismic ?
• Water depth, cost & elasticity
• VectorSeis Ocean
• Designed for cheaper, faster, safer operations
• Better imaging
• Competitive landscape
• Summary and Status
15
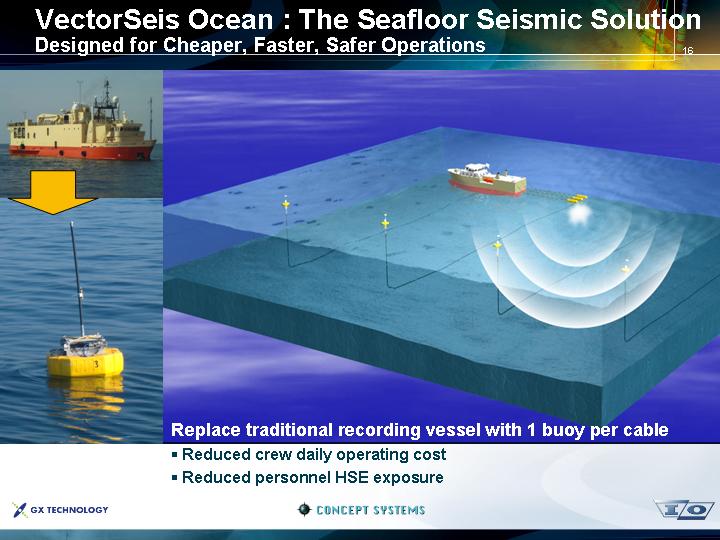
VectorSeis Ocean : The Seafloor Seismic Solution
Designed for Cheaper, Faster, Safer Operations
[GRAPHIC]
Replace traditional recording vessel with 1 buoy per cable
• Reduced crew daily operating cost
• Reduced personnel HSE exposure
16
Marine Full-wave Imaging
Outline
[GRAPHIC]
• Seafloor Market Drivers
• Why use seafloor seismic ?
• Water depth, cost & elasticity
• VectorSeis Ocean
• Designed for cheaper, faster, safer operations
• Better imaging
• Competitive landscape
• Summary and Status
17
Seafloor Imaging
Broadband, High Definition Images from the Ocean Bottom
[GRAPHIC]
VectorSeis Ocean
Conventional Seafloor Imaging
[GRAPHIC]
18
VectorSeis Sensors
Uniquely Suited to the Seabed vs. Conventional Alternatives
[GRAPHIC]
• VectorSeis
• Self orienting
• Less impacted by tidal action
• Tolerant of uneven seafloor
• Reduced cycle time
• More accurate orientation speeds processing steps
• Improved vector fidelity
[GRAPHIC]
• Traditional systems
• Mechanical gimbals
• Omni-directional geophones
• Inclinometers + ROV planting
19
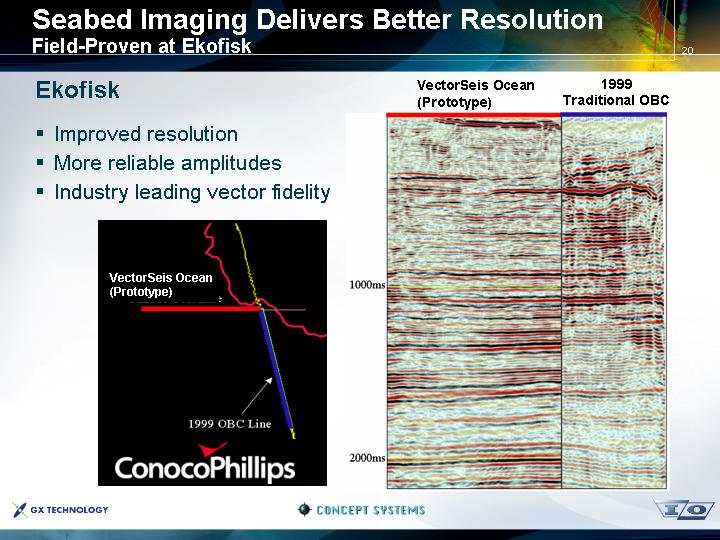
Seabed Imaging Delivers Better Resolution
Field-Proven at Ekofisk
Ekofisk
• Improved resolution
• More reliable amplitudes
• Industry leading vector fidelity
VectorSeis Ocean
(Prototype)
[GRAPHIC]
VectorSeis Ocean | 1999 |
(Prototype) | Traditional OBC |
[CHART]
20
Marine Full-wave Imaging
Outline
[GRAPHIC]
• Seafloor Market Drivers
• Why use seafloor seismic ?
• Water depth, cost & elasticity
• VectorSeis Ocean
• Designed for cheaper, faster, safer operations
• Better imaging
• Competitive landscape
• Summary and Status
21
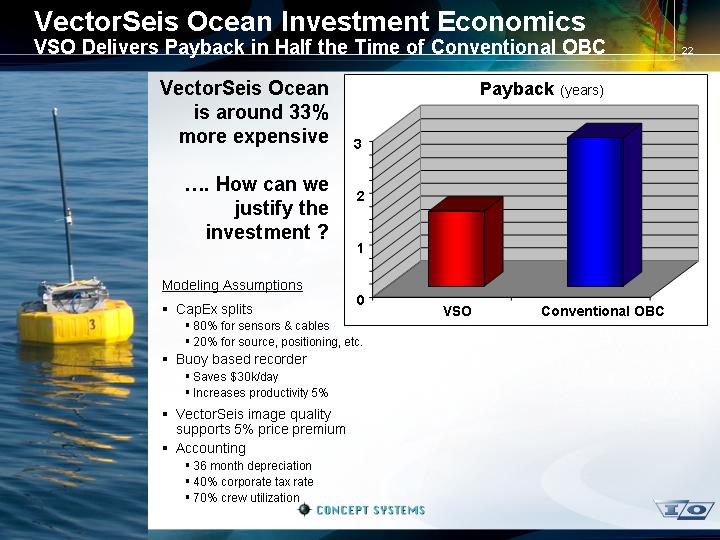
VectorSeis Ocean Investment Economics
VSO Delivers Payback in Half the Time of Conventional OBC
[GRAPHIC]
VectorSeis Ocean is around 33% more expensive
…. How can we justify the investment ?
Payback (years)
[CHART]
Modeling Assumptions
• CapEx splits
• 80% for sensors & cables
• 20% for source, positioning, etc.
• Buoy based recorder
• Saves $30k/day
• Increases productivity 5%
• VectorSeis image quality supports 5% price premium
• Accounting
• 36 month depreciation
• 40% corporate tax rate
• 70% crew utilization
22
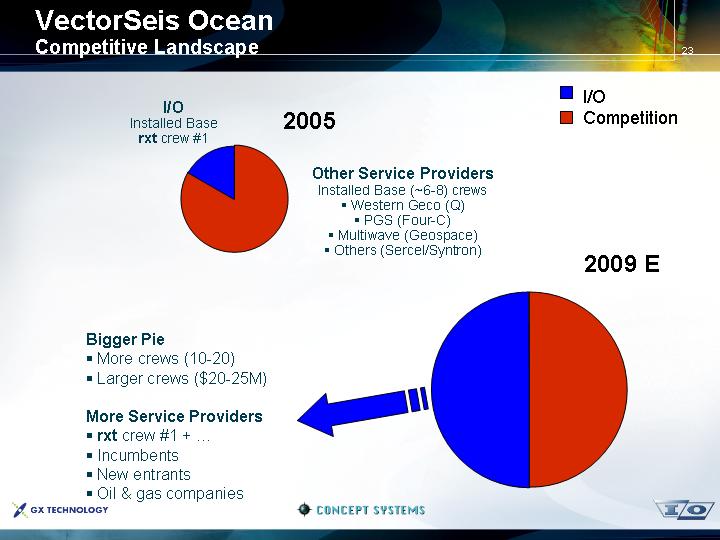
VectorSeis Ocean
Competitive Landscape
I/O |
|
|
|
|
Installed Base |
| 2005 |
|
|
rxt crew #1 |
|
|
|
|
|
|
|
|
|
[CHART] |
| Other Service Providers |
|
|
|
| • Western Geco (Q) |
|
|
|
|
|
|
|
|
|
|
| 2009 E |
Bigger Pie |
|
|
|
|
• More crews (10-20) |
|
|
|
|
|
|
|
|
|
More Service Providers |
|
|
| [CHART] |
• rxt crew #1 + … |
|
|
|
|
23
Marine Full-wave Imaging
Outline
[GRAPHIC]
• Seafloor Market Drivers
• Why use seafloor seismic ?
• Water depth, cost & elasticity
• VectorSeis Ocean
• Designed for cheaper, faster, safer operations
• Better imaging
• Competitive landscape
• Summary and Status
24
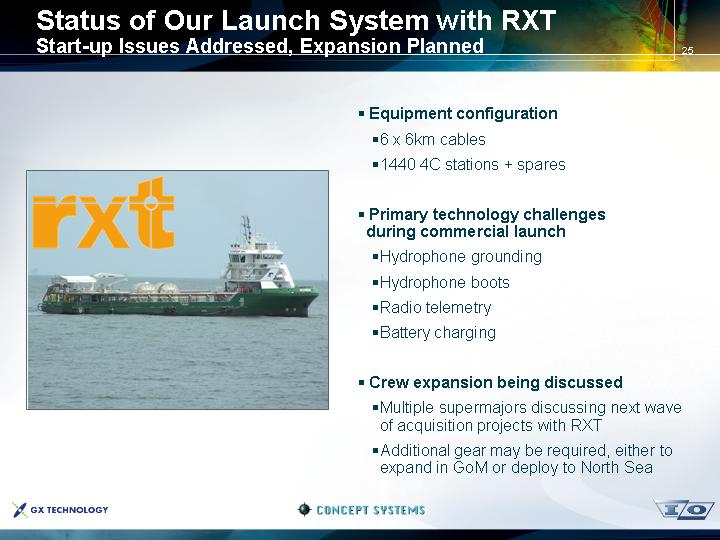
Status of Our Launch System with RXT
Start-up Issues Addressed, Expansion Planned
[GRAPHIC]
• Equipment configuration
• 6 x 6km cables
• 1440 4C stations + spares
• Primary technology challenges during commercial launch
• Hydrophone grounding
• Hydrophone boots
• Radio telemetry
• Battery charging
• Crew expansion being discussed
• Multiple supermajors discussing next wave of acquisition projects with RXT
• Additional gear may be required, either to expand in GoM or deploy to North Sea
25
Summary
I/O Poised to Drive Marine Full-wave Imaging Market
[GRAPHIC]
Growing Market
• Increased need for improved imaging
• Subsurface resolution
• Reservoir characterization
• Reduced operational cost with VectorSeis Ocean
I/O Leadership
• RXT crew 1 operating for major oil company in GoM
• Better imaging with VectorSeis full-wave sensorS
• Designed for cheaper, faster, safer operations
• Fully integrated solution (MISD + Concept Systems + GX Technology)
26
2004 Overview
Key Financial Focus:
• Strengthened balance sheet
• Delivered 25% “same store” revenue growth
• Launched System Four A/C and VectorSeis Ocean
• Delivered VectorSeis system sales $30 million
• Acquired GXT and Concept Systems
• Launched new strategic R&D initiatives
[LOGO] |
| [LOGO] |
| [LOGO] |
2
I/O Product Life Cycle Positioning
|
|
|
|
|
|
|
|
|
| Q1 Totals |
|
Revenues |
| 7.4 |
| 22.2 |
| 35.0 |
| 2.2 |
| 66.8 |
|
|
|
|
|
|
|
|
|
|
|
|
|
Operating Income |
| (6.1 | ) | (2.0 | ) | 5.3 |
| 0 |
| (2.8 | ) |
[GRAPHIC]
6
Cash Flow Projection
Consolidated Five Year Financial Model
|
| 2005-2009 |
| |
|
| Cash Flow |
| |
|
| (In Thousands) |
| |
|
|
|
| |
Net Income |
| $ | 300,000 |
|
Depreciation & Amortization |
| 220,000 |
| |
Working Capital |
| (130,000 | ) | |
|
|
|
| |
Operating Capital |
| 390,000 |
| |
|
|
|
| |
Capital Expenditures |
| (225,000 | ) | |
Notes Payable |
| (35,000 | ) | |
|
|
|
| |
Net Increase in Cash |
| $ | 130,000 |
|
9
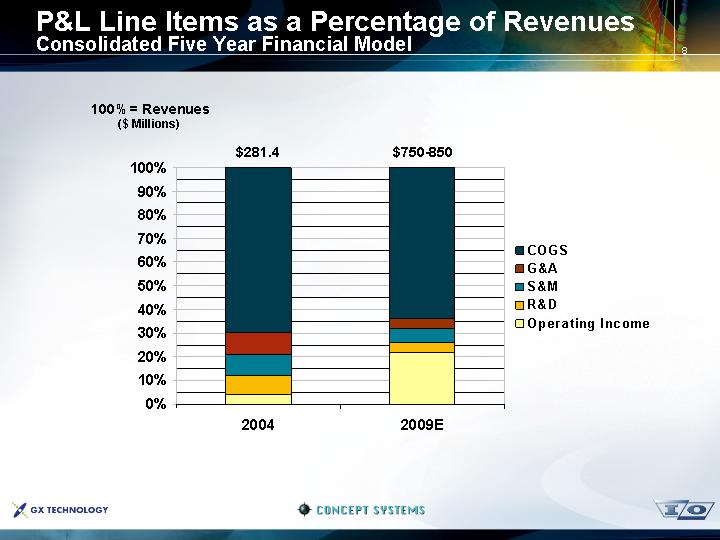
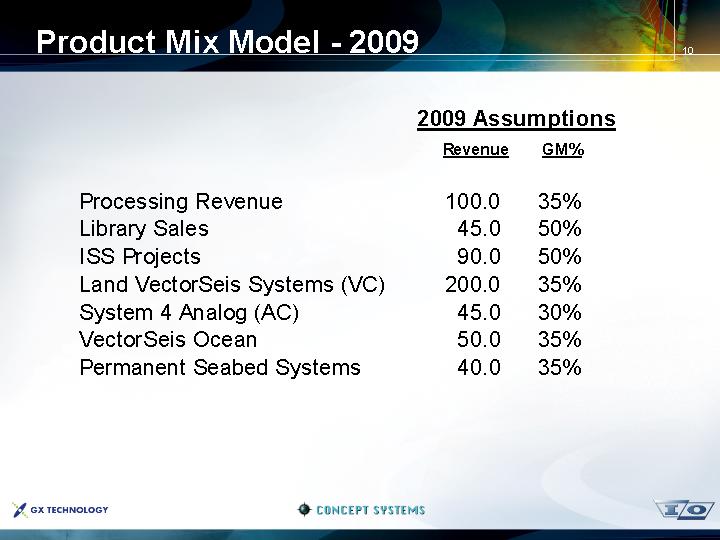
Product Mix Model - 2009
|
| 2009 Assumptions |
| ||
|
| Revenue |
| GM% |
|
|
|
|
|
|
|
Processing Revenue |
| 100.0 |
| 35 | % |
Library Sales |
| 45.0 |
| 50 | % |
ISS Projects |
| 90.0 |
| 50 | % |
Land VectorSeis Systems (VC) |
| 200.0 |
| 35 | % |
System 4 Analog (AC) |
| 45.0 |
| 30 | % |
VectorSeis Ocean |
| 50.0 |
| 35 | % |
Permanent Seabed Systems |
| 40.0 |
| 35 | % |
10
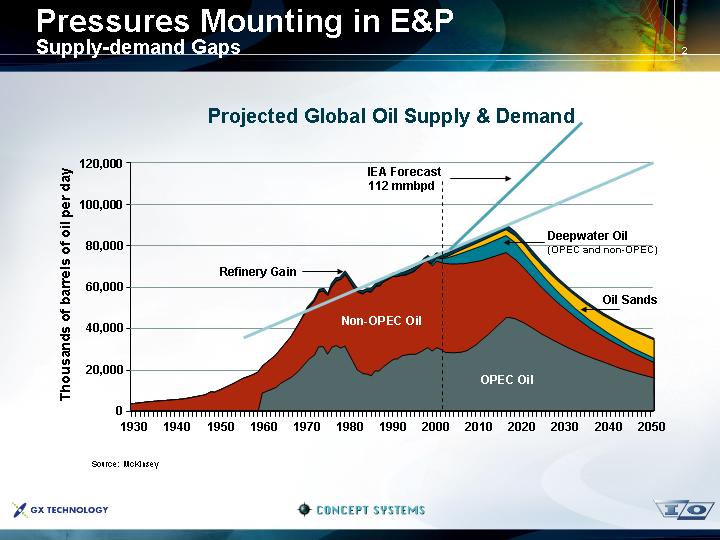
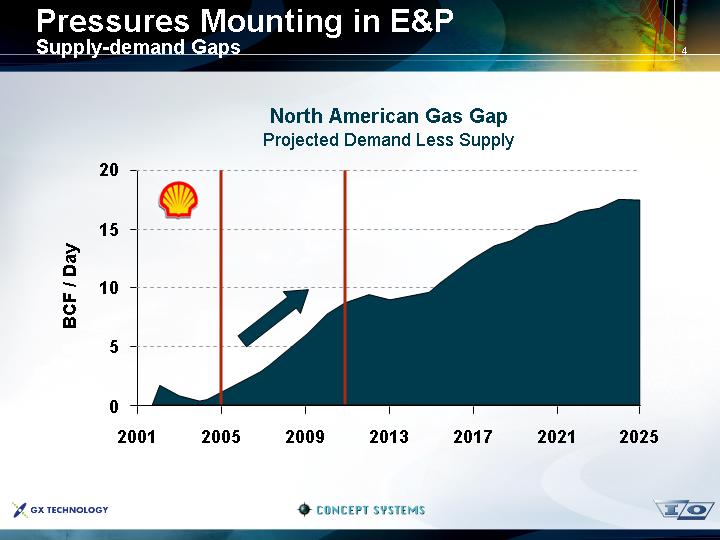
Pressures Mounting in E&P
Supply-demand Gaps
Projected Global Oil Supply & Demand
[CHART]
[LOGO] |
| [LOGO] |
| [LOGO] |
2
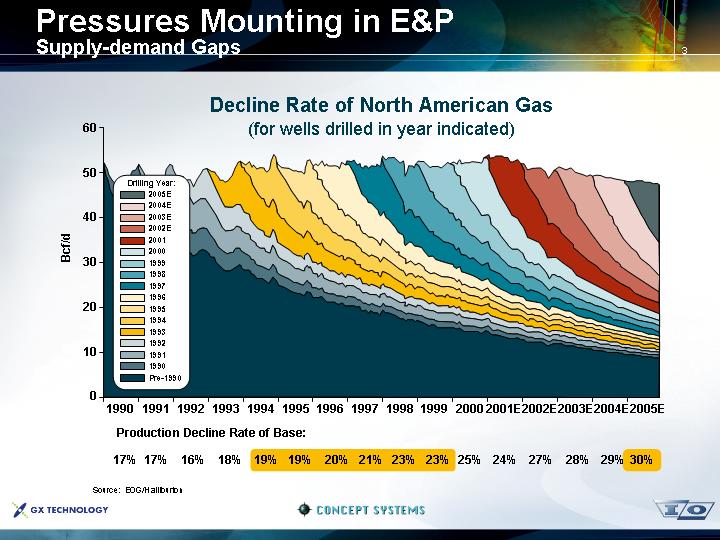
Decline Rate of North American Gas
(for wells drilled in year indicated)
[CHART]
Production Decline Rate of Base:
1990 |
| 1991 |
| 1992 |
| 1993 |
| 1994 |
| 1995 |
| 1996 |
| 1997 |
| 1998 |
| 1999 |
| 2000 |
| 2001E |
| 2002E |
| 2003E |
| 2004E |
| 2005E |
|
|
|
|
|
|
|
|
|
|
|
|
|
|
|
|
|
|
|
|
|
|
|
|
|
|
|
|
|
|
|
|
|
17 | % | 17 | % | 16 | % | 18 | % | 19 | % | 19 | % | 20 | % | 21 | % | 23 | % | 23 | % | 25 | % | 24 | % | 27 | % | 28 | % | 29 | % | 30 | % |
Source: EOG/Halliburton
3
Pressures Mounting in E&P
F&D Costs and Required CapEx
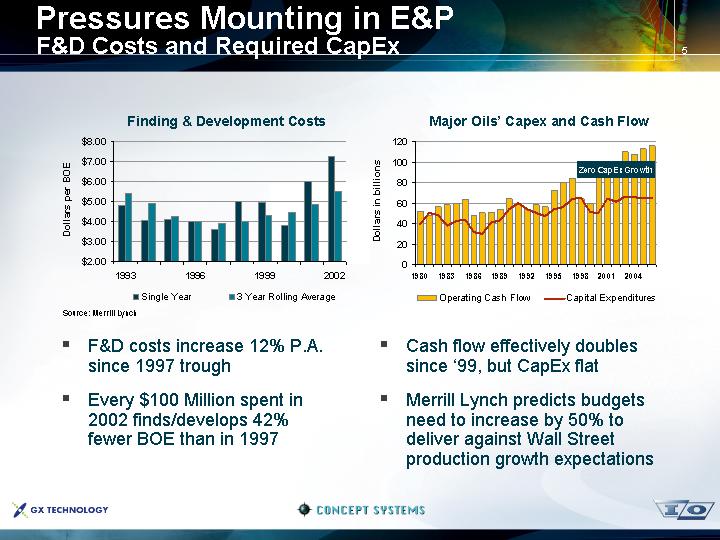
Finding & Development Costs
[CHART]
Major Oils’ Capex and Cash Flow
[CHART]
Source: Merrill Lynch
• F&D costs increase 12% P.A. since 1997 trough
• Every $100 Million spent in 2002 finds/develops 42% fewer BOE than in 1997
• Cash flow effectively doubles since ‘99, but CapEx flat
• Merrill Lynch predicts budgets need to increase by 50% to deliver against Wall Street production growth expectations
5
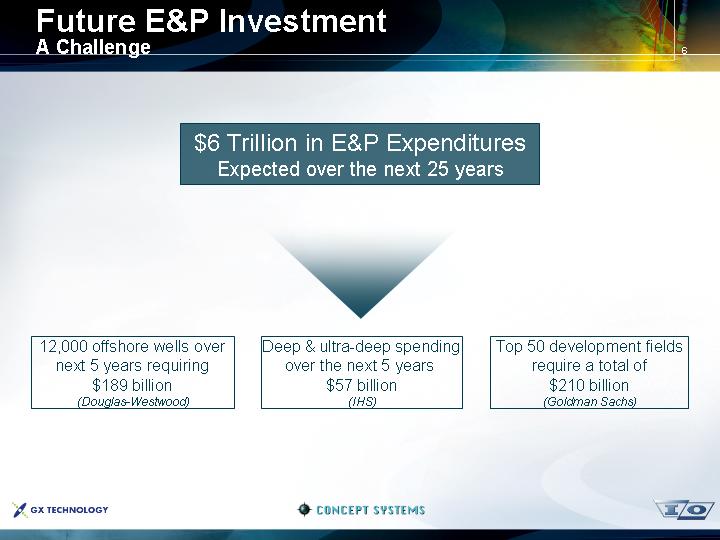
Future E&P Investment
A Challenge
$6 Trillion in E&P Expenditures
Expected over the next 25 years
12,000 offshore wells over next 5 years requiring $189 billion |
| Deep & ultra-deep spending over the next 5 years $57 billion |
| Top 50 development fields require a total of $210 billion |
(Douglas-Westwood) |
| (IHS) |
| (Goldman Sachs) |
6
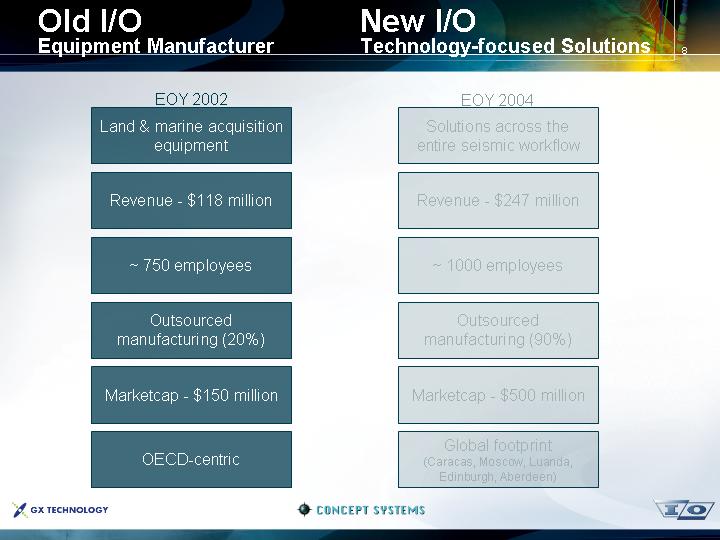
Old I/O |
| New I/O |
Equipment Manufacturer |
| Technology-focused Solutions |
|
|
|
|
|
|
EOY 2002 |
| EOY 2004 |
|
|
|
Land & marine acquisition |
| Solutions across the |
|
|
|
Revenue - $118 million |
| Revenue - $247 million |
|
|
|
~ 750 employees |
| ~ 1000 employees |
|
|
|
Outsourced |
| Outsourced |
|
|
|
Marketcap - $150 million |
| Marketcap - $500 million |
|
|
|
OECD-centric |
| Global footprint |
|
| (Caracas, Moscow, Luanda, |
8
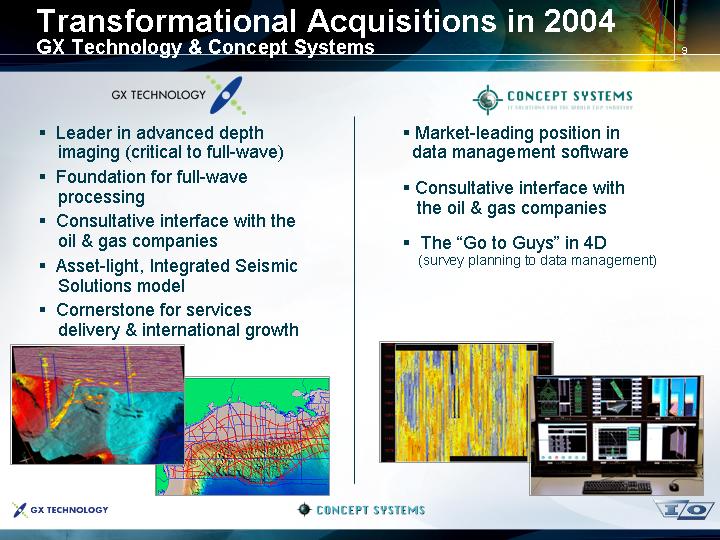
Transformational Acquisitions in 2004
GX Technology & Concept Systems
[LOGO] |
| [LOGO] |
|
|
|
• Leader in advanced depth imaging (critical to full-wave)
• Foundation for full-wave processing
• Consultative interface with the oil & gas companies
• Asset-light, Integrated Seismic Solutions model
• Cornerstone for services delivery & international growth |
| • Market-leading position in data management software
• Consultative interface with the oil & gas companies
• The “Go to Guys” in 4D |
|
|
|
[GRAPHIC] |
| [GRAPHIC] |
9
Old I/O |
| New I/O |
Equipment Manufacturer |
| Technology-focused Solutions |
|
|
|
|
|
|
EOY 2002 |
| EOY 2004 |
|
|
|
Land & marine acquisition |
| Solutions across the |
|
|
|
Revenue - $118 million |
| Revenue - $247 million |
|
|
|
~ 750 employees |
| ~ 1000 employees |
|
|
|
Outsourced |
| Outsourced |
|
|
|
Marketcap - $150 million |
| Marketcap - $500 million |
|
|
|
OECD-centric |
| Global footprint |
|
| (Caracas, Moscow, Luanda, |
10
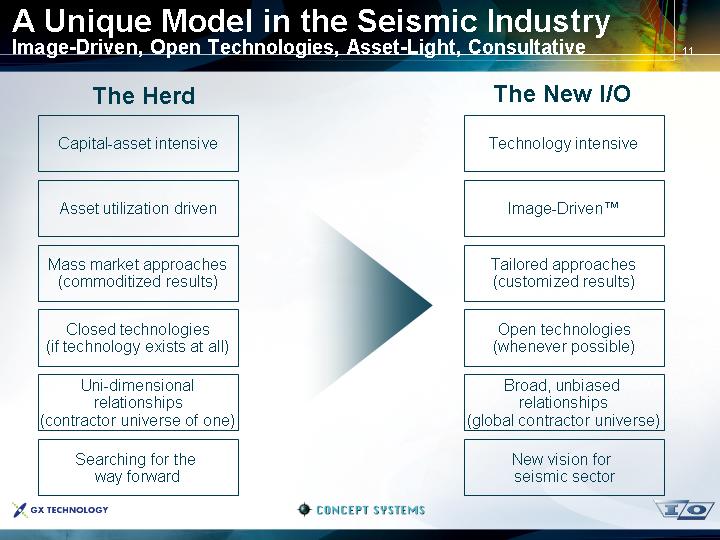
A Unique Model in the Seismic Industry
Image-Driven, Open Technologies, Asset-Light, Consultative
The Herd |
| The New I/O |
|
|
|
Capital-asset intensive |
| Technology intensive |
|
|
|
Asset utilization driven |
| Image-Driven™ |
|
|
|
Mass market approaches |
| Tailored approaches |
(commoditized results) |
| (customized results) |
|
|
|
Closed technologies |
| Open technologies |
(if technology exists at all) |
| (whenever possible) |
|
|
|
Uni-dimensional |
| Broad, unbiased |
relationships |
| relationships |
(contractor universe of one) |
| (global contractor universe) |
|
|
|
Searching for the |
| New vision for |
way forward |
| seismic sector |
11
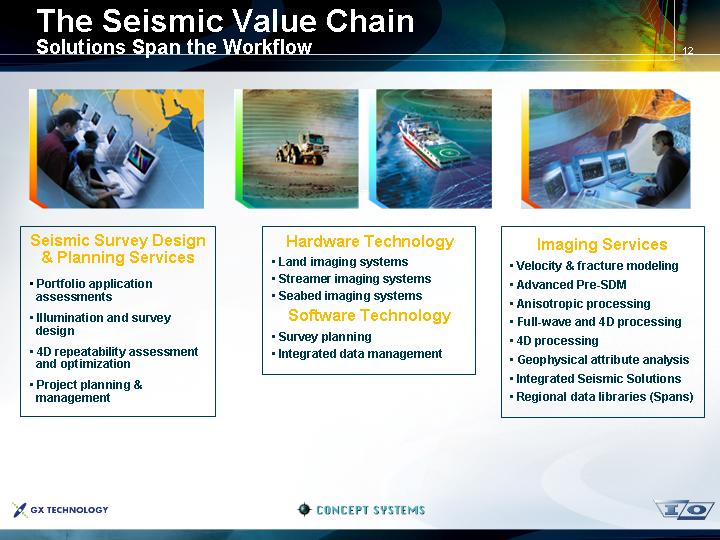
The Seismic Value Chain
Solutions Span the Workflow
[GRAPHIC] | [GRAPHIC] | [GRAPHIC] | [GRAPHIC] |
Seismic Survey Design & Planning Services
• Portfolio application assessments
• Illumination and survey design
• 4D repeatability assessment and optimization
• Project planning & management
Hardware Technology
• Land imaging systems
• Streamer imaging systems
• Seabed imaging systems
Software Technology
• Survey planning
• Integrated data management
Imaging Services
• Velocity & fracture modeling
• Advanced Pre-SDM
• Anisotropic processing
• Full-wave and 4D processing
• 4D processing
• Geophysical attribute analysis
• Integrated Seismic Solutions
• Regional data libraries (Spans)
12
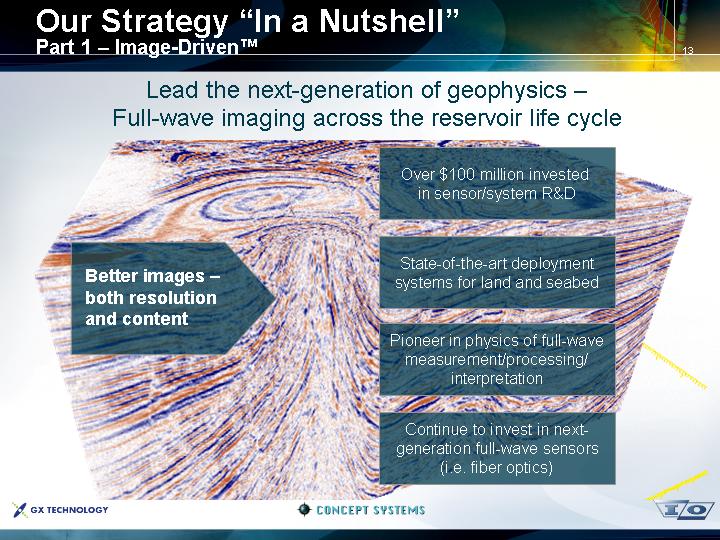
Our Strategy “In a Nutshell”
Part 1 – Image-Driven™
Lead the next-generation of geophysics –
Full-wave imaging across the reservoir life cycle
[GRAPHIC]
|
| Over $100 million invested in sensor/system R&D |
|
|
|
Better images – |
| State-of-the-art deployment systems for land and seabed |
both resolution |
|
|
and content |
| Pioneer in physics of full-wave measurement/processing/interpretation |
|
|
|
|
| Continue to invest in next-generation full-wave sensors (i.e. fiber optics) |
13
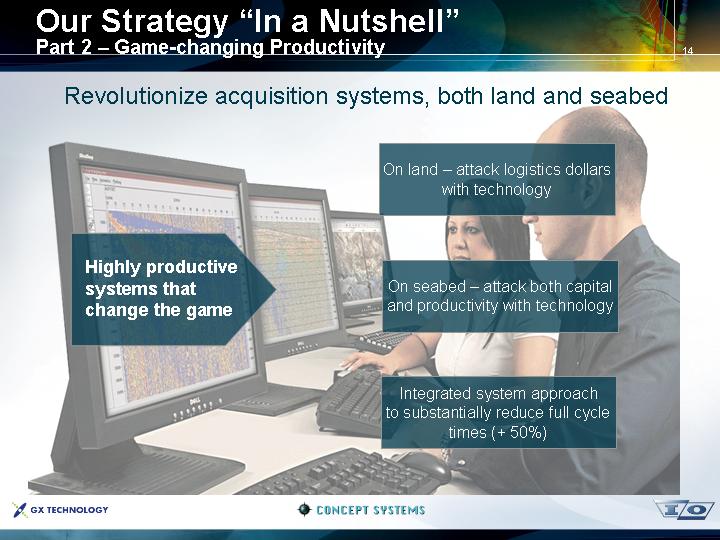
Our Strategy “In a Nutshell”
Part 2 – Game-changing Productivity
Revolutionize acquisition systems, both land and seabed
[GRAPHIC]
|
| On land – attack logistics dollars with technology |
Highly productive |
|
|
systems that |
| On seabed – attack both capital and productivity with technology |
change the game |
|
|
|
| Integrated system approach to substantially reduce full cycle times (+ 50%) |
14
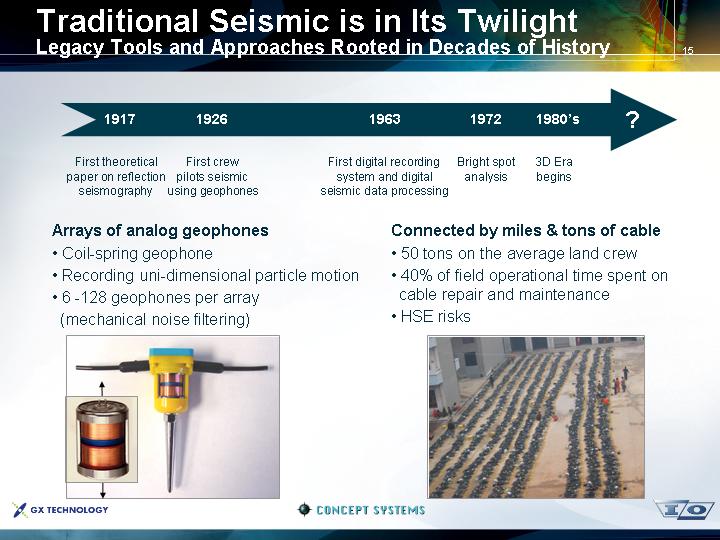
Traditional Seismic is in Its Twilight
Legacy Tools and Approaches Rooted in Decades of History
1917 |
| 1926 |
| 1963 |
| 1972 |
| 1980’s |
| ? |
|
|
|
|
|
|
|
|
|
|
|
First theoretical |
| First crew |
| First digital recording |
| Bright spot |
| 3D Era |
|
|
paper on reflection |
| pilots seismic |
| system and digital |
| analysis |
| begins |
|
|
seismography |
| using geophones |
| seismic data processing |
|
|
|
|
|
|
Arrays of analog geophones |
| Connected by miles & tons of cable |
|
|
|
• Coil-spring geophone |
| • 50 tons on the average land crew |
• Recording uni-dimensional particle motion |
| • 40% of field operational time spent on cable repair and maintenance |
• 6 - 128 geophones per array (mechanical noise filtering) |
| • HSE risks |
|
|
|
[GRAPHIC] |
| [GRAPHIC] |
15
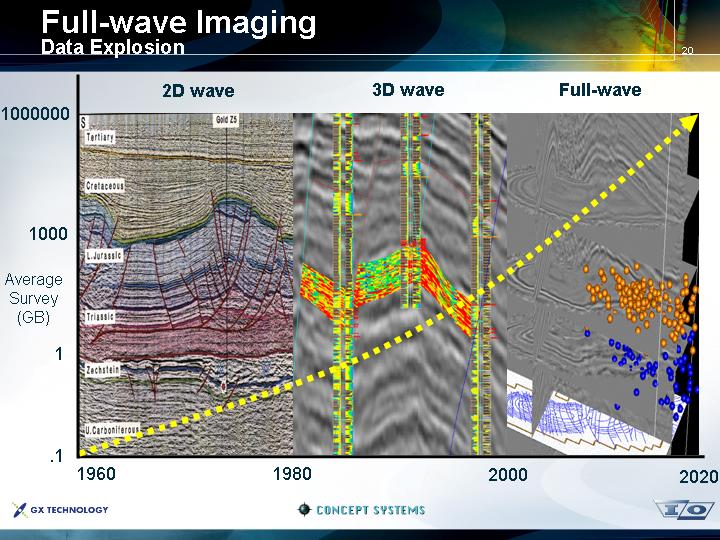
Full-wave Imaging
The Dawn of the Next Era in Seismic
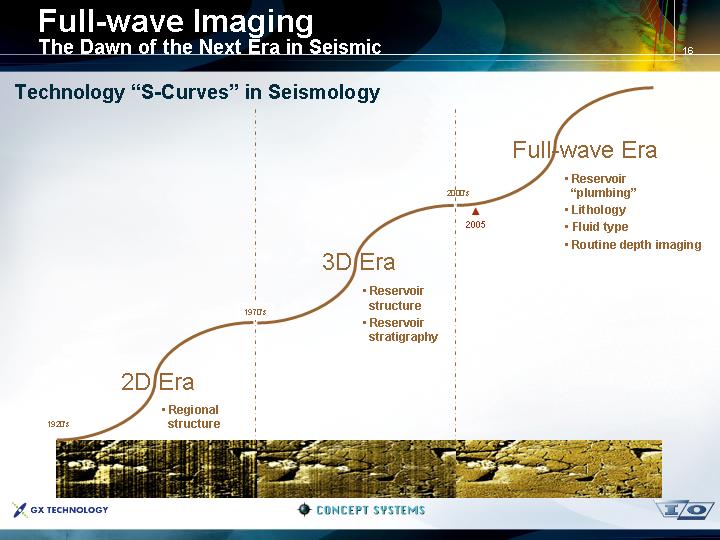
Technology “S-Curves” in Seismology
[GRAPHIC]
2D Era
• Regional structure
3D Era
• Reservoir structure
• Reservoir stratigraphy
Full-wave Era
• Reservoir “plumbing”
• Lithology
• Fluid type
• Routine depth imaging
16
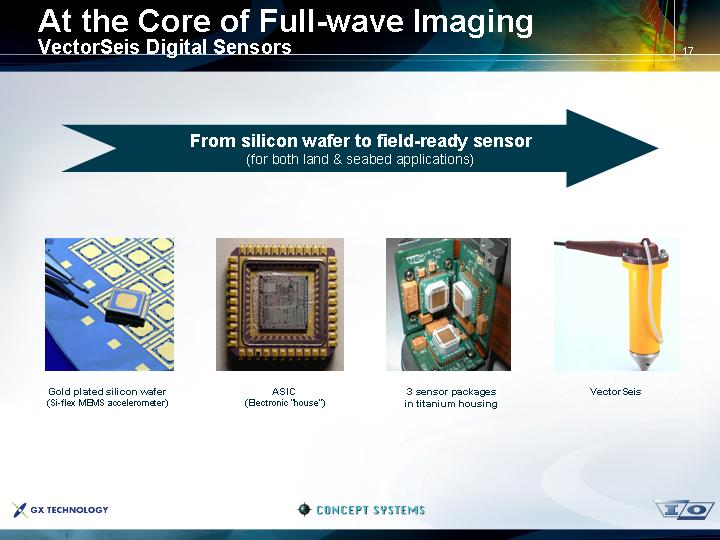
At the Core of Full-wave Imaging
VectorSeis Digital Sensors
From silicon wafer to field-ready sensor
(for both land & seabed applications)
[GRAPHIC] | [GRAPHIC] | [GRAPHIC] | [GRAPHIC] |
|
|
|
|
Gold plated silicon wafer | ASIC | 3 sensor packages | VectorSeis |
17
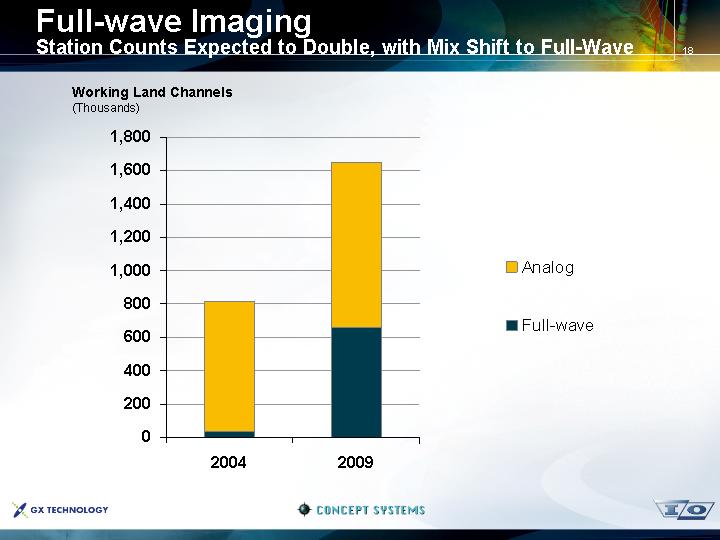
Full-wave Imaging
Station Counts Expected to Double, with Mix Shift to Full-Wave
Working Land Channels
(Thousands)
[CHART]
18
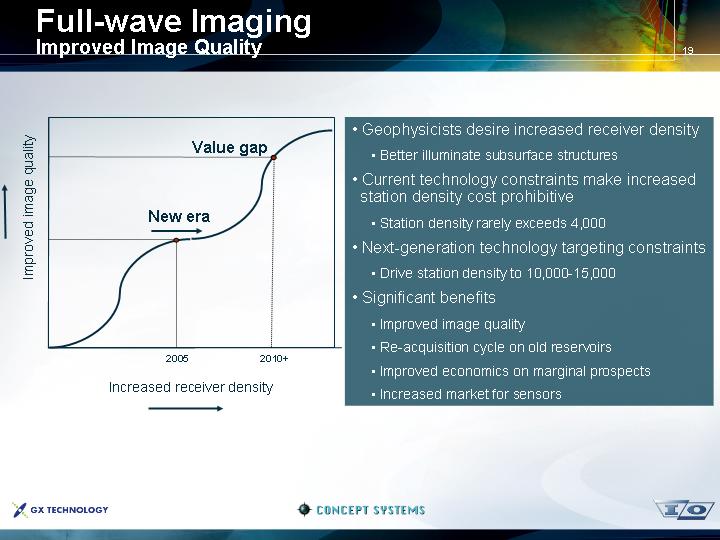
Full-wave Imaging
Improved Image Quality
[CHART]
• Geophysicists desire increased receiver density
• Better illuminate subsurface structures
• Current technology constraints make increased station density cost prohibitive
• Station density rarely exceeds 4,000
• Next-generation technology targeting constraints
• Drive station density to 10,000-15,000
• Significant benefits
• Improved image quality
• Re-acquisition cycle on old reservoirs
• Improved economics on marginal prospects
• Increased market for sensors
19
Market Take-up Summary
Growth Worldwide
[GRAPHIC]
Highlights
• 40 industry full-wave surveys in 2004
• Over 70% VectorSeis
• 100% growth expected in 2005
21
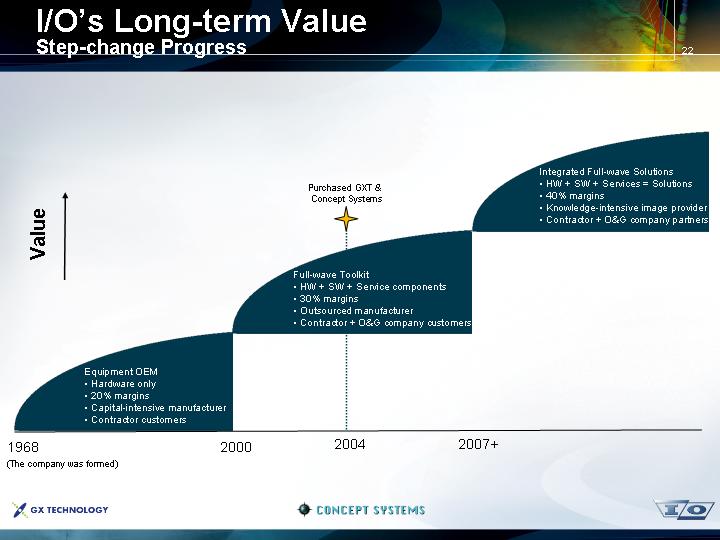
I/O’s Long-term Value
Step-change Progress
Purchased GXT &
Concept Systems
[GRAPHIC]
Equipment OEM
• Hardware only
• 20% margins
• Capital-intensive manufacturer
• Contractor customers
Full-wave Toolkit
• HW + SW + Service components
• 30% margins
• Outsourced manufacturer
• Contractor + O&G company customers
Integrated Full-wave Solutions
• HW + SW + Services = Solutions
• 40% margins
• Knowledge-intensive image provider
• Contractor + O&G company partners
22