 ION Earnings Call – Q4 2011 Earnings Call Presentation February 16, 2012 Exhibit 99.2 |
 Earnings Call Introduction Corporate Participants & Contact Information CONTACT INFORMATION If you have technical problems during the call, please contact DRG&L at 713 529 6600. If you would like to listen to a replay of today's call, it will be available via webcast in the Investor Relations section of the Company's website - www.iongeo.com for approximately 12 months. BRIAN HANSON Chief Executive Officer GREG HEINLEIN Chief Financial Officer 2 |
 Earnings Call Introduction FORWARD-LOOKING STATEMENTS The information included herein contains forward-looking statements within the meaning of Section 27A of the Securities Act of 1933 and Section 21E of the Securities Exchange Act of 1934. Actual results may vary fundamentally from those described in these forward-looking statements. All forward-looking statements reflect numerous assumptions and involve a number of risks and uncertainties. These risks and uncertainties include risk factors that are disclosed by ION from time to time in its filings with the Securities and Exchange Commission. 3 |
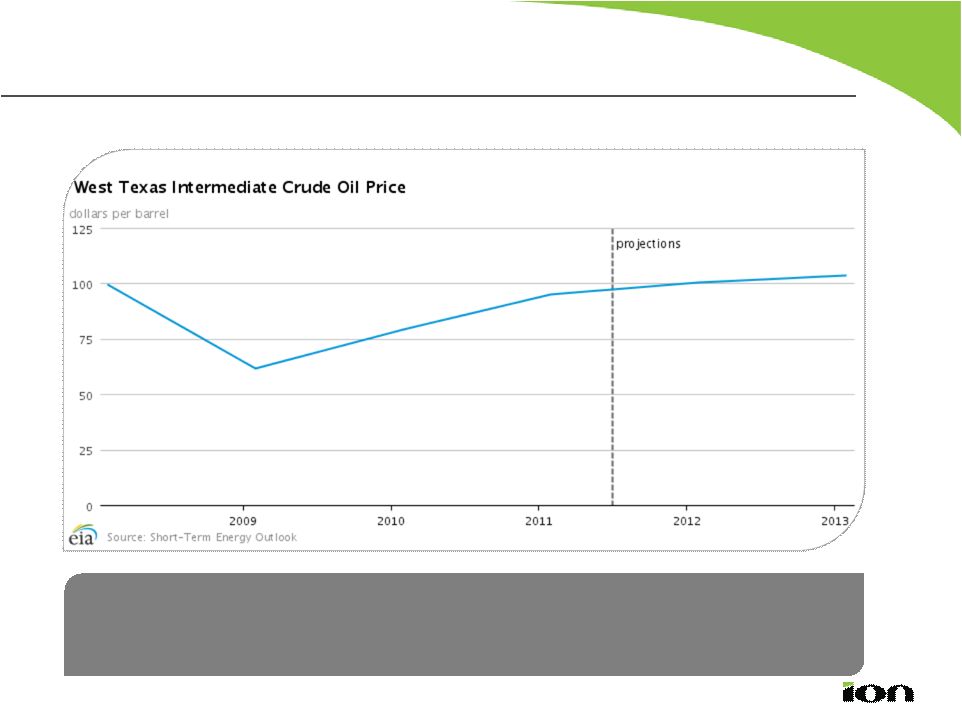 Market Outlook Oil Prices 4 • Expect oil prices to remain in the $80 - $100 range, supporting continued frontier exploration in challenging environments, including deepwater and Arctic. • Expect natural decline of large global oil reserves. |
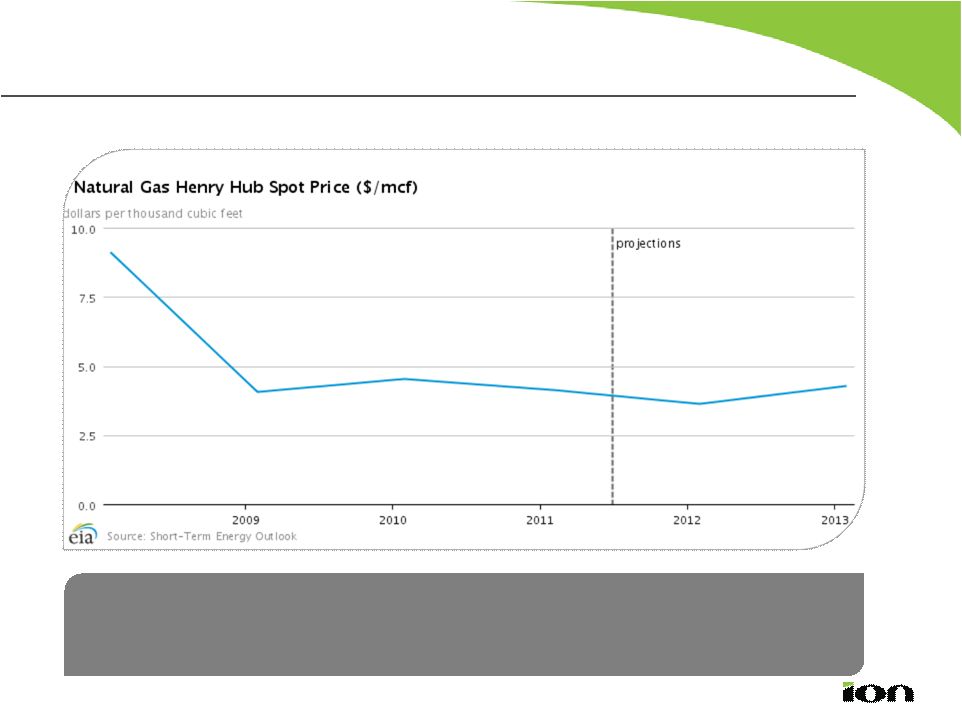 Market Outlook Natural Gas Prices 5 • Expect depressed natural gas prices to cause shift to liquids in North America. • Creating increased pressure on shale operators to locate, complete and produce shale gas more efficiently. |
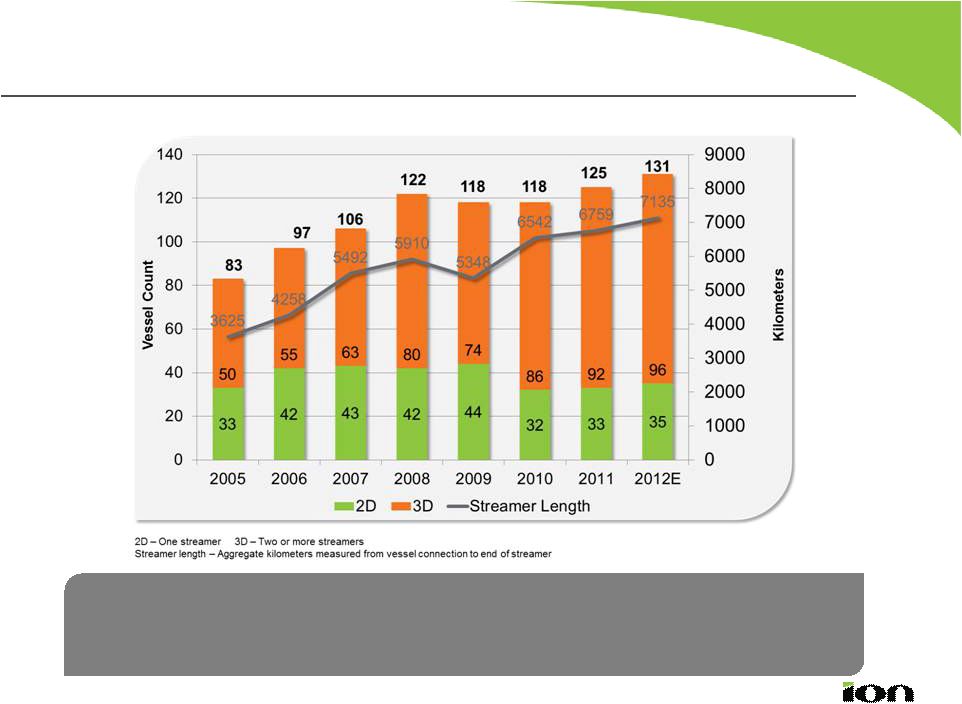 Market Outlook Marine Seismic -- Towed Streamer 6 Source: ODS Petrodata, Company Analysis • Seismic fleet expected to grow, with majority of new vessels 3D. • Expect streamer count and length to continue to increase with market move to higher-end 12- to 14-streamer vessels. |
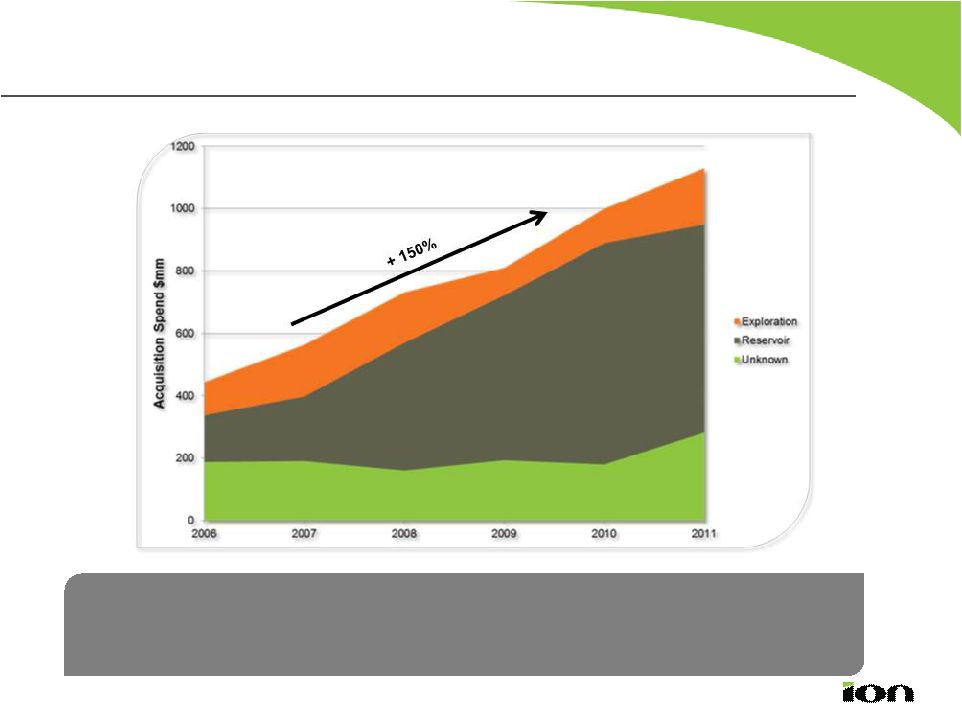 7 • Seabed spending has increased 150%, driven by need for higher resolution imaging. • Seeing increased OBC activity for 3D/4D surveys. Source: ODS Petrodata, Company Analysis Market Outlook Marine Seismic – Ocean Bottom Cable |
 Market Outlook Summary 8 • Land equipment spending slowly improving. • North American shale-based seismic equipment spending may be negatively impacted in 2012. • Trend toward larger land surveys and increased channel count, requiring higher resolution images in the Middle East. |
 Market Outlook Summary 9 • Expanding exploration cycle. • Continued growth in global shale exploration and production. • Continued E&P investment in frontier exploration. • Slow recovery of land seismic. |
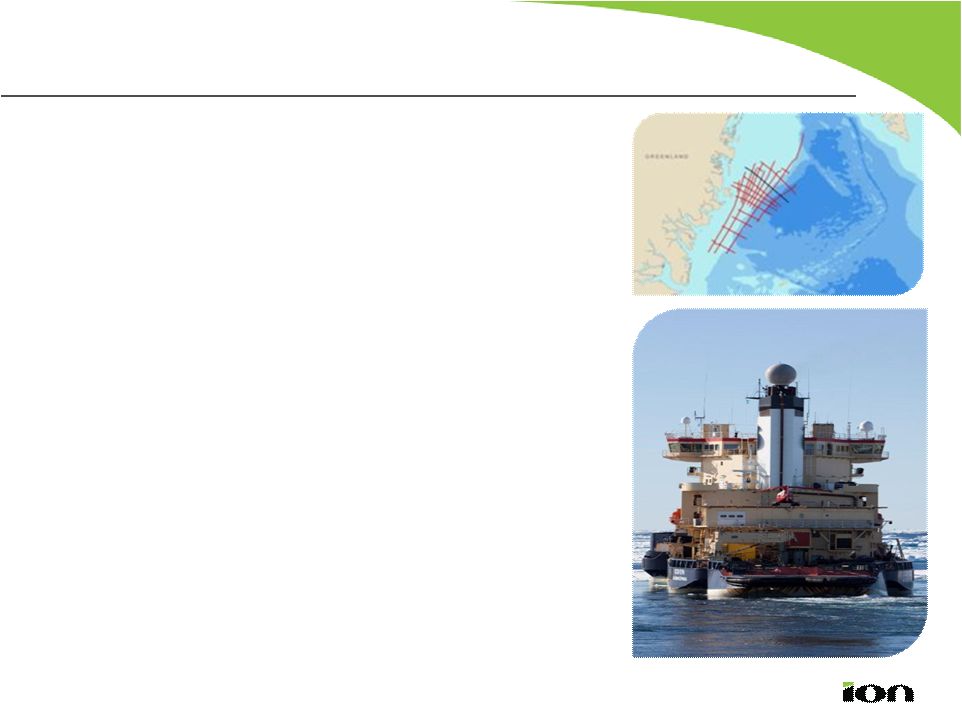
 ION Areas of Focus Challenging Environments Arctic, Shallow/Obstructed Water, Transition Zone and Desert Complex Geologies Subsalt, Sub Basalt, Thrust Belt and Carbonates Unconventional Reservoirs Shales, Tight Gas and Oil Sands Basin Exploration BasinSPAN™ Data Library 10 |
 2011 Highlights 11 • Systems segment revenues increased 34%, including 12-streamer sale to BGP. • Continued BasinSPAN traction in Arctic, Brazil, East and West Africa. • Good progress on ResSCAN TM 3D multi- client acquisitions in Marcellus shale. • Record Solutions backlog of $134M. • Record multi-client investment in 2011 - $144M. • Continued improving GOM trends. • Expect profitable INOVA Q4 results. |
 ION delivers fourth quarter diluted EPS of $0.15 on net income of $23 million (excluding special items). Consolidated revenues of $160 million for the fourth quarter consistent with the prior year period. Systems revenues of $67 million for Q4 increased 58% over the prior period due to continued strong demand for marine towed streamer equipment. Solutions revenues of $83 million for Q4 decreased 22% compared to the prior period. – New venture revenues increased more than 60% for Q4 related to projects in the North American shales, East Africa and the Arctic. – Data library revenues decreased 54% for Q4 compared to the prior-year, which included exceptionally strong data library sales in Q4 2010. – Data processing revenues decreased 10% for Q4 compared to the prior-year attributable to the lagging effects of the Gulf of Mexico oil spill. – Solutions backlog reached a record level of $134 million due to increased demand for data processing services. Software segment revenues of $9 million for Q4 were essentially flat compared to the prior-year period with a steady stream of software subscription sales. – Total of 51 Orca ® installations as of year end. Strong momentum heading into 2012. 12 Q4 2011 Highlights |
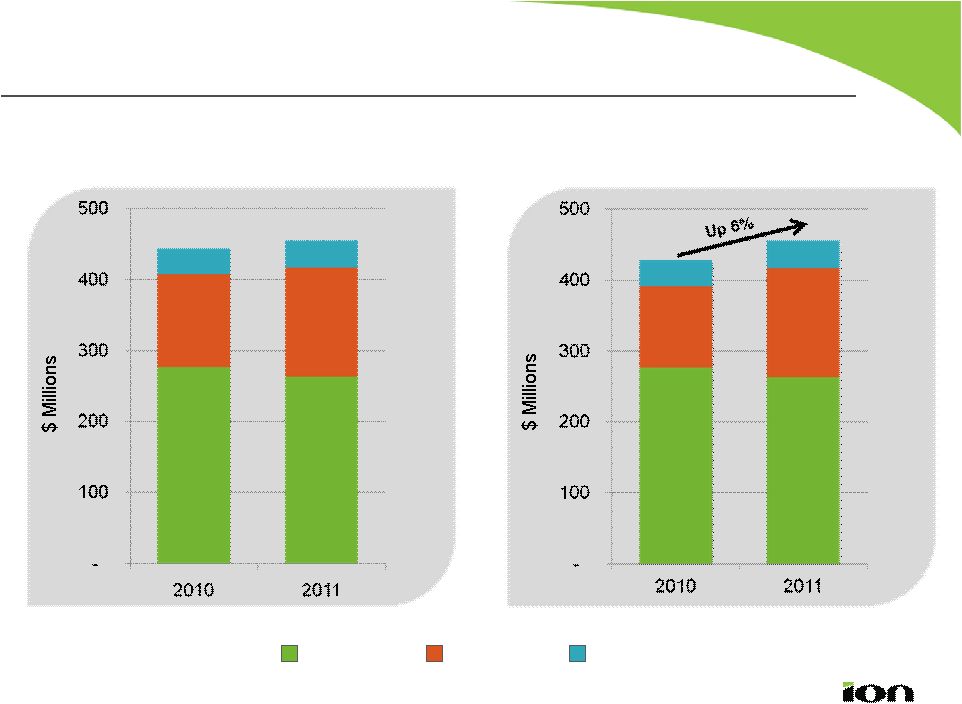 Financial Overview Year-over-Year Revenue Comparison Including Legacy Land Systems Excluding Legacy Land Systems Software Systems Solutions 13 |
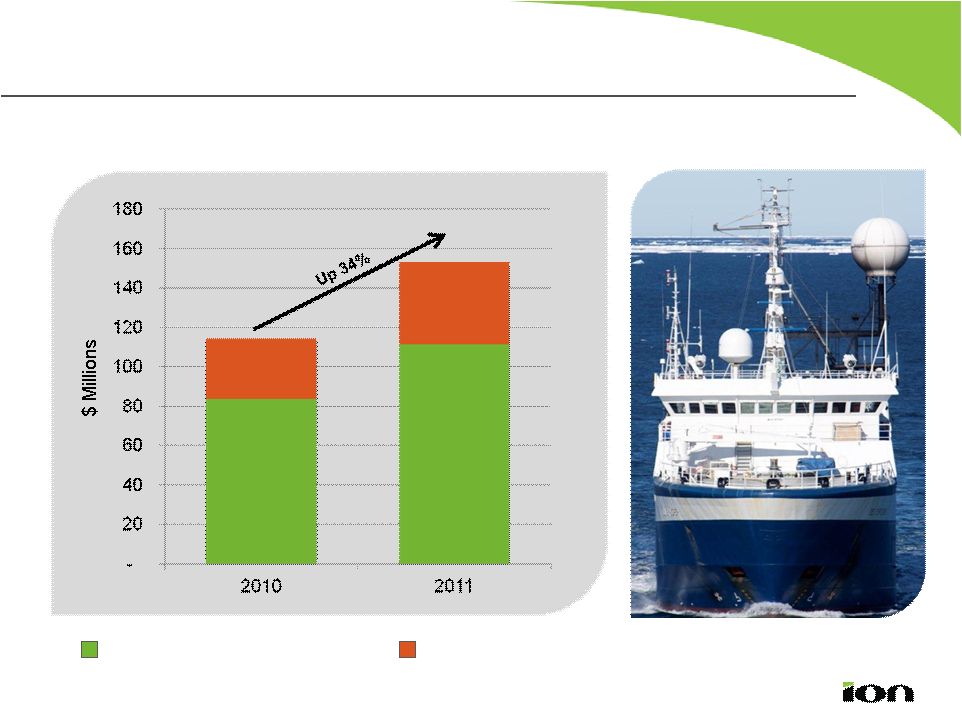 Systems Segment Financial Overview Revenue by Type Towed Streamer Equipment Other 14 |
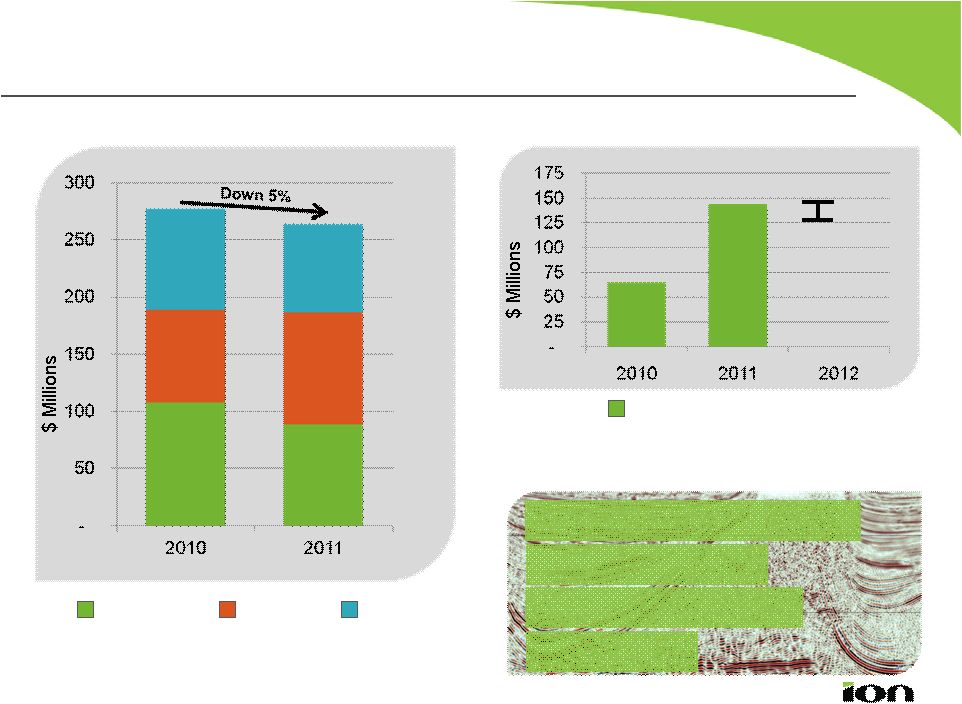 Solutions Segment Financial Overview Revenue by Type Multi-client Investments Solutions Backlog Q4 2011 $134 M Actual Investment Data Processing Data Libraries New Ventures Q2 2011 $117 M 15 Q3 2011 $106 M Q4 2010 $81 M $150 M $130 M |
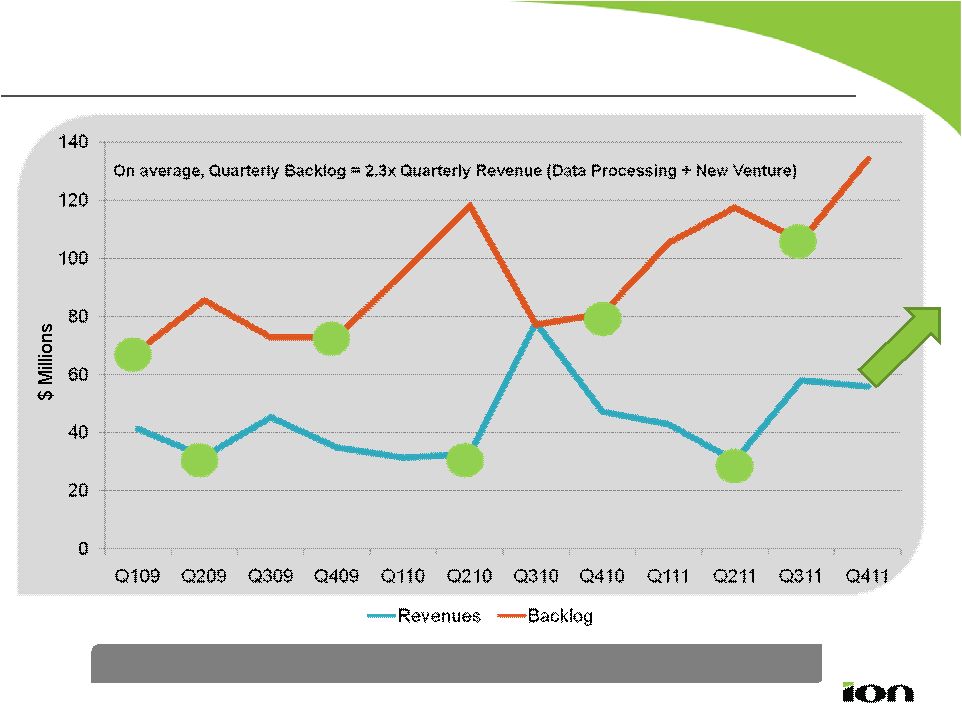 Solutions – Revenue vs Backlog Quarterly Trends 16 Solutions historically has a 1 – 2 quarter delay from backlog to revenue. |
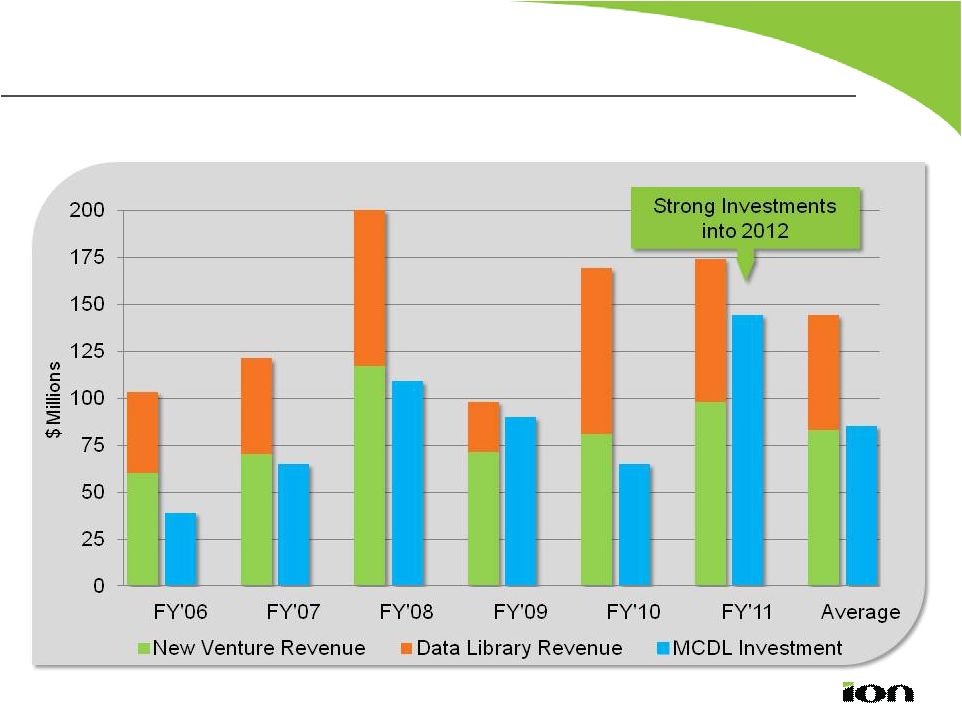 ION Data Library Investment Relative to Revenue Average Per Year 17 FY’06 - FY’11 MCDL Revenue vs MCDL Investment |
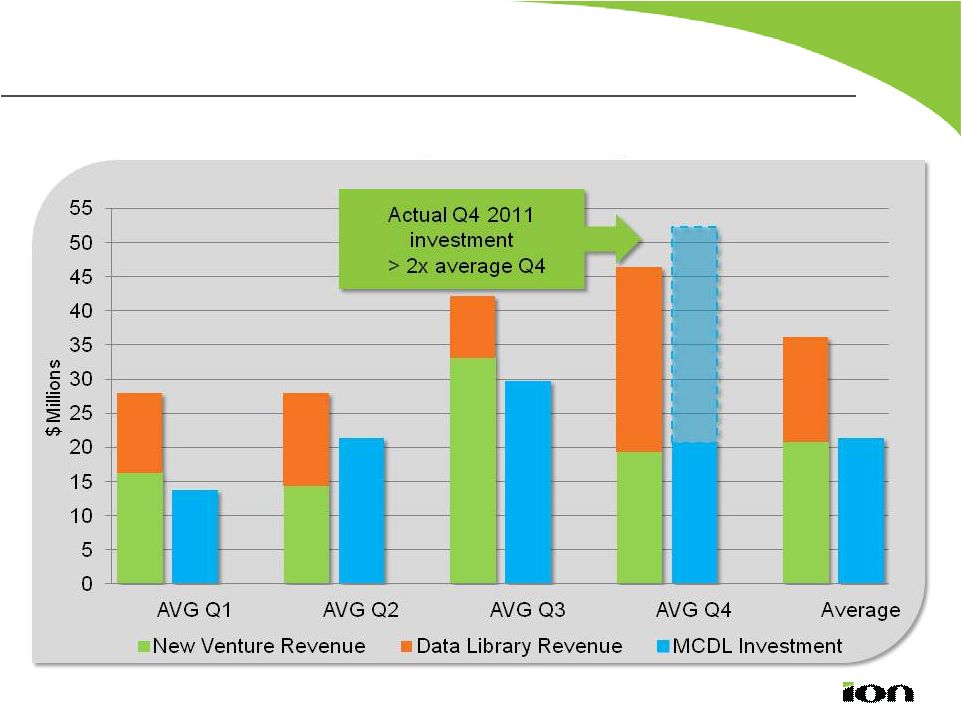 ION Data Library Investment Relative to Revenue Average Per Quarter (’06 – ’11) 18 Multi-Client Data Library Revenue vs. Average Investment |
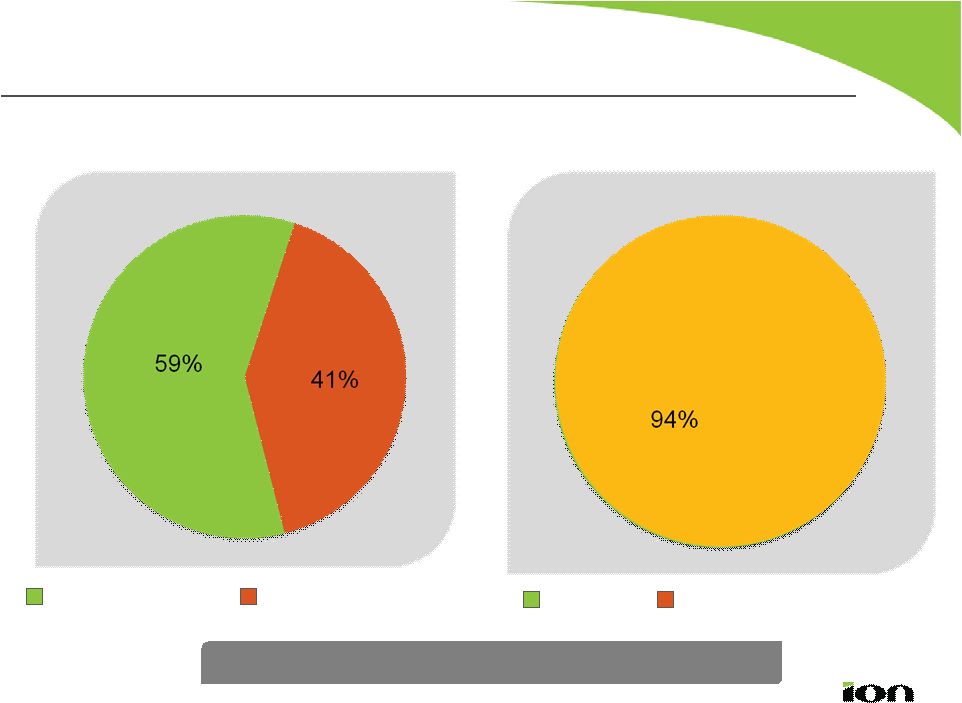
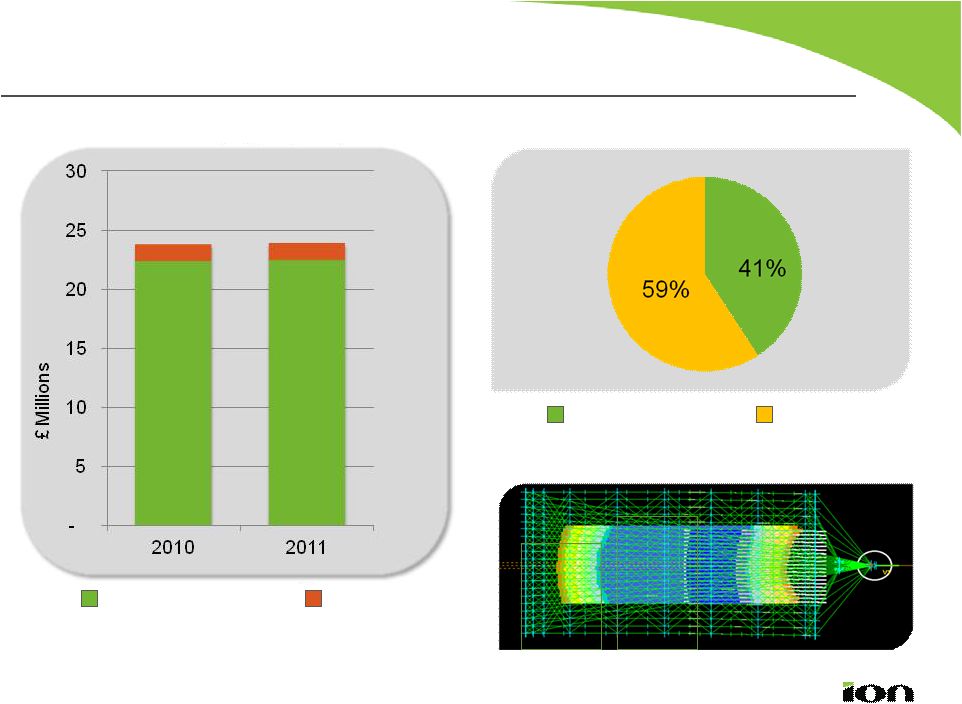       Software Segment Financial Overview Revenue by Type (GBP) Services Software Systems % of Seismic Vessels with Orca Orca Vessel Conversion 51 vessels 2011 Orca-Permanent Other 44 vessels 2010 19 |
 Financial Overview Adjustments in Q4 Results for 2011 include three special pre-tax items incurred in the fourth quarter: • The first item is a $7.7 million charge representing ION’s 49% share of a write-down of excess inventory by INOVA Geophysical; • The next item is a $2.9 million restructuring related our Sensor geophone business; and • The last item is a $1.3 million impairment on an investment. Total Q4 adjustments of approximately $0.07 per diluted share 20 EPS Reported $0.08 EPS Adjusted $0.15 |
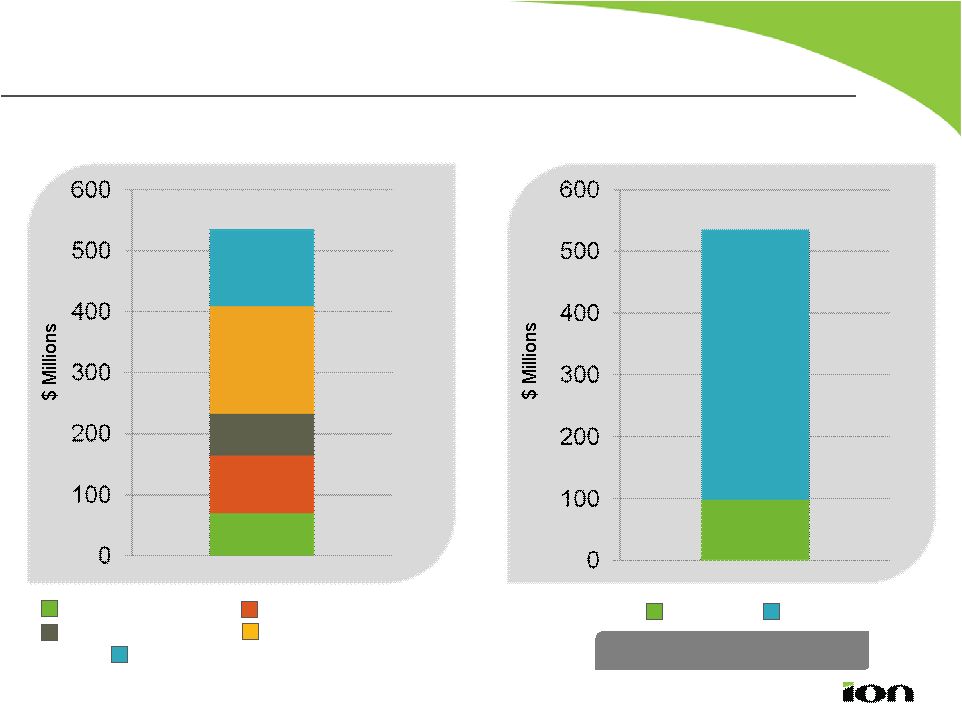 Financial Overview Balance Sheet as of December 31, 2011 Capital Employed Financing Cash & ST Investments Net Fixed Assets Multi-Client Data Library Goodwill & Equity in INOVA Equity LT Debt Net Debt of $35M* * Net Debt = Total Debt ($99M LT & $6M ST) less Cash & ST Investments $99M $176M $70M Remaining Working Capital 21 |
 Financial Overview Liquidity & LT Debt as of December 31, 2011 Liquidity of $170M LT Debt of $99M Cash & ST Investments Undrawn Revolver Term Loan Facility & Equipment Leases 6% Revolver and Term A both mature in March 2015 22 |
 Financial Overview Cash Flow Year Ended December 31, SUMMARIZED CASH FLOW 2011 2010 Cash from operations 135,307 181,490 Working capital (5,506) (48,050) Multi-client investment (143,782) (64,426) PP&E Capital Expenditures (11,060) (7,372) Free Cash Flow* (25,041) 61,642 • Cash from operations was impacted by $14 million higher tax payments in 2011 and $24.5 million of cash received from a legal settlement in 2010. • 2011 multi-client investment up $79 million over 2010. *Non-GAAP Measure 23 |
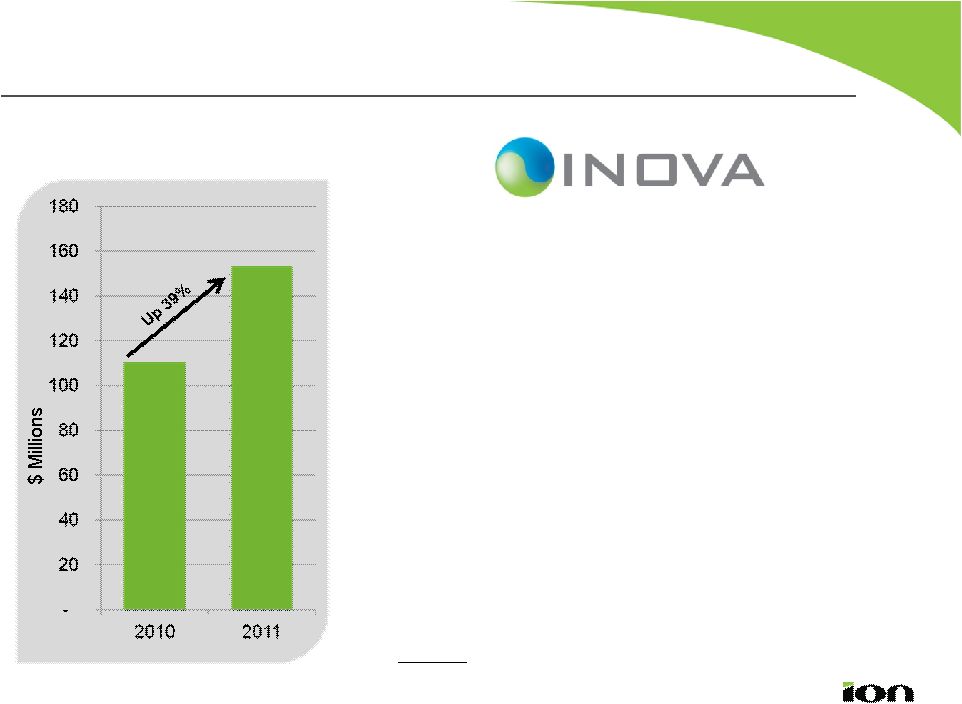 INOVA Geophysical Q4 2011 Financial Overview* FY10 vs FY11 Forecasted Revenues • Estimated Q4 revenues of $58 to $62 million with operating income of $5 to $8 million. • Revenue 39% ahead of the same period last year. • Inventory further reduced in Q4 to lowest level in a year. • Credit line capacity of $27 million in place to support 2012 growth. 24 * ION to share in 49% of these estimated results. These estimates are unaudited. |
 INOVA Geophysical General Market Observations/Operational Highlights • High vibrator sales in Q4 (70 units), including Saudi deliveries for BGP and the first 6 units built in China. • Strong ARIES ® sales in Q4 totaling $13 million. • Continued BGP purchases totaling $19 million for Q4. • 2 FireFly ® rental projects ongoing in the Marcellus: one with ION’s GeoVentures™ group. • 1,000 Km² FireFly project in Mexico also progressing with good production rates. • Field testing of new products in process to support 2012 sales opportunities. 25 |
 Solid Momentum Heading into 2012 26 Expect the following assumptions for 2012: • All business units to see year-over-year growth in 2012. • ¼ or more of annual earnings in the front half of the year. • Data processing business to benefit by largest backlog and grow at normal historical rates. • Annual data library investment to remain in the range of $130 to $150 million. • Marine to sell at least two large ticket systems (either towed streamer or OBC). • Continued progress at INOVA, resulting in break even full- year results for 2012. • Operating expenses to remain flat as a percentage of revenue. • Interest expense to be in the range of $4 to $7 million. • Effective tax rate to range from 22% to 25%. |
 27 |