                                  United States
                       Securities and Exchange Commission
                             Washington, D.C. 20549

                                   Form N-CSR
   Certified Shareholder Report of Registered Management Investment Companies


                                    811-6165

                      (Investment Company Act File Number)


                   Federated Municipal Securities Income Trust
         ---------------------------------------------------------------

               (Exact Name of Registrant as Specified in Charter)


                            Federated Investors Funds
                              5800 Corporate Drive
                       Pittsburgh, Pennsylvania 15237-7000


                                 (412) 288-1900
                         (Registrant's Telephone Number)


                           John W. McGonigle, Esquire
                            Federated Investors Tower
                               1001 Liberty Avenue
                       Pittsburgh, Pennsylvania 15222-3779
                     (Name and Address of Agent for Service)
                (Notices should be sent to the Agent for Service)


                        Date of Fiscal Year End: 8/31/04


               Date of Reporting Period: Fiscal year ended 8/31/04


Item 1.     Reports to Stockholders
Federated
World-Class Investment Manager
Federated California Municipal Income Fund
A Portfolio of Federated Municipal Securities Income Trust
ANNUAL SHAREHOLDER REPORT
August 31, 2004
Class A Shares
Class B Shares
FINANCIAL HIGHLIGHTS
SHAREHOLDER EXPENSE EXAMPLE
MANAGEMENT'S DISCUSSION OF FUND PERFORMANCE
PORTFOLIO OF INVESTMENTS SUMMARY TABLES
FINANCIAL STATEMENTS
REPORT OF INDEPENDENT REGISTERED PUBLIC ACCOUNTING FIRM
BOARD OF TRUSTEES AND TRUST OFFICERS
VOTING PROXIES ON FUND PORTFOLIO SECURITIES
QUARTERLY PORTFOLIO SCHEDULE
Not FDIC Insured * May Lose Value * No Bank Guarantee
Financial Highlights - Class A Shares
(For a Share Outstanding Throughout Each Period)
Year Ended August 31
|
| 2004
|
|
| 2003
|
|
| 2002
|
|
| 2001
|
|
| 2000
|
|
Net Asset Value, Beginning of Period
| | $10.70 | | | $11.00 | | | $11.08 | | | $10.65 | | | $10.49 | |
Income From Investment Operations:
| | | | | | | | | | | | | | | |
Net investment income
| | 0.52 | | | 0.52 | | | 0.52 | 1 | | 0.53 | | | 0.52 | |
Net realized and unrealized gain (loss) on investments, futures contracts and swap contracts
|
| 0.24
|
|
| (0.30
| )
|
| (0.08
| ) 1
|
| 0.43
|
|
| 0.16
|
|
TOTAL FROM INVESTMENT OPERATIONS
|
| 0.76
|
|
| 0.22
|
|
| 0.44
|
|
| 0.96
|
|
| 0.68
|
|
Less Distributions:
| | | | | | | | | | | | | | | |
Distributions from net investment income
|
| (0.52
| )
|
| (0.52
| )
|
| (0.52
| )
|
| (0.53
| )
|
| (0.52
| )
|
Net Asset Value, End of Period
|
| $10.94
|
|
| $10.70
|
|
| $11.00
|
|
| $11.08
|
|
| $10.65
|
|
Total Return 2
|
| 7.26
| %
|
| 1.98
| %
|
| 4.16
| %
|
| 9.27
| %
|
| 6.82
| %
|
| | | | | | | | | | | | | | | |
Ratios to Average Net Assets:
|
|
|
|
|
|
|
|
|
|
|
|
|
|
|
|
Expenses
|
| 0.50
| %
|
| 0.50
| %
|
| 0.50
| %
|
| 0.50
| %
|
| 0.50
| %
|
Net investment income
|
| 4.81
| %
|
| 4.72
| %
|
| 4.81
| % 1
|
| 4.91
| %
|
| 5.08
| %
|
Expense waiver/reimbursement 3
|
| 0.85
| %
|
| 0.80
| %
|
| 0.85
| %
|
| 0.91
| %
|
| 0.97
| %
|
Supplemental Data:
|
|
|
|
|
|
|
|
|
|
|
|
|
|
|
|
Net assets, end of period (000 omitted)
|
| $34,269
|
|
| $36,607
|
|
| $39,872
|
|
| $30,079
|
|
| $23,465
|
|
Portfolio turnover
|
| 13
| %
|
| 24
| %
|
| 21
| %
|
| 30
| %
|
| 57
| %
|
1 Effective September 1, 2001, the Fund adopted the provisions of the American Institute of Certified Public Accountants (AICPA) Audit and Accounting Guide for Investment Companies and began accreting discount on debt securities. For the year ended August 31, 2002, this change had no effect on the net investment income per share, net realized and unrealized gain (loss) on investments per share, or the ratio of net investment income to average net assets. Per share, ratios and supplemental data for the periods prior to September 1, 2001 have not been restated to reflect this change in presentation.
2 Based on net asset value, which does not reflect the sales charge, redemption fee or contingent deferred sales charge, if applicable. Total returns for periods of less than one year are not annualized.
3 This voluntary expense decrease is reflected in both the expense and the net investment income ratios shown above.
See Notes which are an integral part of the Financial Statements
Financial Highlights - Class B Shares
(For a Share Outstanding Throughout Each Period)
Year Ended August 31
|
| 2004
|
|
| 2003
|
|
| 2002
|
|
| 2001
|
|
| 2000
|
|
Net Asset Value, Beginning of Period
| | $10.70 | | | $11.00 | | | $11.08 | | | $10.65 | | | $10.49 | |
Income From Investment Operations:
| | | | | | | | | | | | | | | |
Net investment income
| | 0.44 | | | 0.44 | | | 0.44 | 1 | | 0.45 | | | 0.45 | |
Net realized and unrealized gain (loss) on investments, futures contracts and swap contracts
|
| 0.24
|
|
| (0.30
| )
|
| (0.08
| ) 1
|
| 0.43
|
|
| 0.16
|
|
TOTAL FROM INVESTMENT OPERATIONS
|
| 0.68
|
|
| 0.14
|
|
| 0.36
|
|
| 0.88
|
|
| 0.61
|
|
Less Distributions:
| | | | | | | | | | | | | | | |
Distributions from net investment income
|
| (0.44
| )
|
| (0.44
| )
|
| (0.44
| )
|
| (0.45
| )
|
| (0.45
| )
|
Net Asset Value, End of Period
|
| $10.94
|
|
| $10.70
|
|
| $11.00
|
|
| $11.08
|
|
| $10.65
|
|
Total Return 2
|
| 6.46
| %
|
| 1.22
| %
|
| 3.39
| %
|
| 8.46
| %
|
| 6.03
| %
|
| | | | | | | | | | | | | | | |
Ratios to Average Net Assets:
|
|
|
|
|
|
|
|
|
|
|
|
|
|
|
|
Expenses
|
| 1.25
| %
|
| 1.25
| %
|
| 1.25
| %
|
| 1.25
| %
|
| 1.25
| %
|
Net investment income
|
| 4.06
| %
|
| 3.97
| %
|
| 4.05
| % 1
|
| 4.16
| %
|
| 4.34
| %
|
Expense waiver/reimbursement 3
|
| 0.60
| %
|
| 0.55
| %
|
| 0.60
| %
|
| 0.66
| %
|
| 0.72
| %
|
Supplemental Data:
|
|
|
|
|
|
|
|
|
|
|
|
|
|
|
|
Net assets, end of period (000 omitted)
|
| $43,773
|
|
| $50,921
|
|
| $49,363
|
|
| $43,675
|
|
| $36,577
|
|
Portfolio turnover
|
| 13
| %
|
| 24
| %
|
| 21
| %
|
| 30
| %
|
| 57
| %
|
1 Effective September 1, 2001, the Fund adopted the provisions of the AICPA Audit and Accounting Guide for Investment Companies and began accreting discount on debt securities. For the year ended August 31, 2002, this change had no effect on the net investment income per share, net realized and unrealized gain (loss) on investments per share, or the ratio of net investment income to average net assets. Per share, ratios and supplemental data for the periods prior to September 1, 2001 have not been restated to reflect this change in presentation.
2 Based on net asset value, which does not reflect the sales charge, redemption fee or contingent deferred sales charge, if applicable. Total returns for periods of less than one year are not annualized.
3 This voluntary expense decrease is reflected in both the expense and the net investment income ratios shown above.
See Notes which are an integral part of the Financial Statements
Shareholder Expense Example
As a shareholder of the Fund, you incur two types of costs: (1) transaction costs, including sales charges (loads) on purchase payments (Class A Shares); and (2) ongoing costs, including management fees (Class A and Class B Shares), distribution (12b-1) fees (Class A and Class B Shares), shareholder services fees (Class A and Class B Shares) and other Fund expenses. This Example is intended to help you understand your ongoing costs (in dollars) of investing in the Fund and to compare these costs with the ongoing costs of investing in other mutual funds. It is based on an investment of $1,000 invested at the beginning of the period and held for the entire period from March 1, 2004 to August 31, 2004.
ACTUAL EXPENSES
The first section of the table below provides information about actual account values and actual expenses. You may use the information in this section, together with the amount you invested, to estimate the expenses that you incurred over the period. Simply divide your account value by $1,000 (for example, an $8,600 account value divided by $1,000 = 8.6), then multiply the result by the number in the first section under the heading entitled "Expenses Paid During Period" to estimate the expenses attributable to your investment during this period.
HYPOTHETICAL EXAMPLE FOR COMPARISON PURPOSES
The second section of the table below provides information about hypothetical account values and hypothetical expenses based on the Fund's actual expense ratio and an assumed rate of return of 5% per year before expenses, which is not the Fund's actual return. Thus, you should not use the hypothetical account values and expenses to estimate the actual ending account balance or your expenses for the period. Rather, these figures are provided to enable you to compare the ongoing costs of investing in the Fund and other funds. To do so, compare this 5% hypothetical example with the 5% hypothetical examples that appear in the shareholder reports of the other funds.
Please note that the expenses shown in the table are meant to highlight your ongoing costs only and do not reflect any transaction costs, such as sales charges (loads). Therefore, the second section of the table is useful in comparing ongoing costs only, and will not help you determine the relative total costs of owning different funds. In addition, if these transaction costs were included, your costs would have been higher.
|
| Beginning
Account Value
3/1/2004
|
| Ending
Account Value
8/31/2004
|
| Expenses Paid
During Period 1
|
Actual:
|
|
|
|
|
|
|
Class A Shares
|
| $1,000
|
| $1,004.40
|
| $2.52
|
Class B Shares
|
| $1,000
|
| $1,000.60
|
| $6.29
|
Hypothetical (assuming a 5% return before expenses):
|
|
|
|
|
|
|
Class A Shares
|
| $1,000
|
| $1,022.62
|
| $2.54
|
Class B Shares
|
| $1,000
|
| $1,018.85
|
| $6.34
|
1 Expenses are equal to the Federated California Municipal Income Fund Class A Shares and Class B Shares annualized expense ratios of 0.50% and 1.25%, respectively, multiplied by the average account value over the period, multiplied by184/366 (to reflect the one-half year period).
Management's Discussion of Fund Performance
The fund's total return based on net asset value for the 12-month reporting period was 7.26% for Class A Shares and 6.46% for Class B Shares. For Class A Shares the total return consisted of 5.02% of tax-exempt dividends, and 2.24% appreciation in net asset value of the shares. For Class B Shares the total return consisted of 4.22% of tax-exempt dividends, and 2.24% appreciation in net asset value of the shares. 1 The total return of the Lehman Brothers Municipal Bond Index, the fund's benchmark index (LBMB), was 7.11% during the 12-month reporting period. The fund's investment strategy focused on: (a) the selection of lower-quality, investment-grade securities; these securities typically have higher yields than higher-quality, investment-grade securities available in the market; (b) the selection of intermediate to long maturity bonds that yield more than short-term bonds on an upward sloping yield curve (the "yield curve" shows the relative yield of similar securities with different maturities); and (c) bonds with premium coupons (interest payments that are higher than current yields available in the market). The fund's strategy also focused on the effective duration of the fund's portfolio (which indicates the portfolio sensitivity to changes in interest rates). In addition, the fund's total return reflected actual cash flows, transaction cost and other expenses, which were not reflected in the total return of the LBMB.
1 Performance data quoted represents past performance which is no guarantee of future results. Investment return and principal value will fluctuate so that an investor's shares, when redeemed, may be worth more or less than their original cost. Mutual fund performance changes over time and current performance may be lower or higher than what is stated. For current to the most recent month-end performance, visit www.federatedinvestors.com or call 1-800-341-7400.
2 The LBMB is a broad market performance benchmark for the tax-exempt bond market. To be included in the LBMB, bonds must have a minimum credit rating of Baa, have an outstanding par value of at least $3 million and be issued as part of a transaction of at least $50 million. The LBMB includes both zero coupon bonds and bonds subject to the alternative minimum tax. The LBMB is not adjusted to reflect sales charges, expenses, or other fees that the Securities and Exchange Commission (SEC) requires to be reflected in the fund's performance. Indexes are unmanaged, and unlike the fund, are not affected by cashflows. It is not possible to invest directly in an index.
3 Investment-grade securities are securities that are rated at least "BBB" or unrated securities of a comparable quality. Credit ratings are an indication of the risk that a security will default. They do not protect a security from credit risk. Lower-rated bonds typically offer higher yields to help compensate investors for the increased risk associated with them. Among these risks are lower creditworthiness, greater price volatility, more risk to principal and income than with higher-rated securities and increased possibilities of default.
CREDIT QUALITY
Credit spreads, or the yield difference between the "AAA"-rated municipal bonds and bonds of lower credit quality and similar maturity, tightened during the reporting period (meaning that the yield on lower-rated, investment-grade debt improved to a greater extent, or declined to a lesser extent, than for higher-rated, investment-grade debt). Municipal Market Data (MMD) reported that, during the reporting period, spreads between "BBB"-rated general obligation bonds and "AAA"-rated general obligation bonds tightened by 16 basis points to 28 basis points. Credit spreads on California general obligation bonds when compared to national "AAA"-rated general obligation bonds tightened to less than 30 basis points at the end of the reporting period. The fund's holdings in lower-rated, investment-grade securities helped the fund's performance, because they generally outperformed higher-rated, investment-grade securities during the reporting period.
YIELD CURVE AND MATURITY
During the reporting period, the municipal bond market was characterized by a generally falling and flattening, although still upward sloping, yield curve. MMD reported that, during the reporting period, rates on "AAA"-rated general obligation bonds with maturities of four years or less rose by 2 basis points to 43 basis points, while similar bonds with maturities of five years and longer saw yields fall by up to 50 basis points. The overall effect, when coupled with tightening credit spreads, was that longer-maturity, lower-rated bonds tended to outperform shorter-maturity, higher-rated bonds. The fund's performance, therefore, benefited from its concentration in municipal bonds in the intermediate (generally five to ten year) and long (generally ten years and longer) parts of the yield curve.
COUPON AND SECURITY SELECTION
During the reporting period, the fund concentrated its portfolio purchases and holdings on premium coupon municipal bonds (municipal bonds with coupons or interest payments that were higher than then-current yields available in the market). The higher coupons on the fund's premium coupon municipal bond holdings made the fund less sensitive to interest rate changes, and helped the fund's performance as interest rates declined over a significant portion of the reporting period. The fund also increased its allocation to California state general obligation bonds during the reporting period. This benefited the fund's performance as California's credit quality improved and, as discussed above, credit spreads tightened during the reporting period.
DURATION 4
The fund's dollar-weighted average duration at the end of the reporting period was 5.11 years. Duration management is a significant component of the fund's investment strategy. As interest rates were expected to rise during the reporting period, the fund hedged the portfolio (adjusted the duration shorter) using forward settling municipal interest rate swaps and Treasury futures contracts. The fund's use of these instruments, however, hurt the fund's performance relative to the LBMB because these instruments did not perform as well given that longer-term and intermediate-term municipal interest rates declined over the reporting period.
4 Duration is a measure of a security's price sensitivity to changes in interest rates. Securities with longer durations are more sensitive to changes in interest rates than securities with shorter durations.
GROWTH OF A $10,000 INVESTMENT - CLASS A SHARES
The graph below illustrates the hypothetical investment of $10,000 1 in Federated California Municipal Income Fund (Class A Shares) (the "Fund") from August 31, 1994 to August 31, 2004, compared to the Lehman Brothers Municipal Bond Index (LBMB) 2 and Lipper California Municipal Debt Funds Average (LCAMDFA). 3
Average Annual Total Returns 4 for the Period Ended 8/31/2004
|
|
|
1 Year
|
| 2.47%
|
5 Years
|
| 4.91%
|
10 Years
|
| 5.66%
|

Performance data quoted represents past performance which is no guarantee of future results. Returns shown do not reflect the deduction of taxes that a shareholder would pay on Fund distributions or the redemption of Fund shares. For after-tax returns, visit www.federatedinvestors.com. Investment return and principal value will fluctuate so that an investor's shares, when redeemed, may be worth more or less than their original cost. Mutual fund performance changes over time and current performance may be lower or higher than what is stated. Mutual funds are not obligations of or guaranteed by any bank and are not federally insured.
1 Represents a hypothetical investment of $10,000 in the Fund after deducting the maximum sales charge of 1.00% ($10,000 investments minus $100 sales charge = $9,900) which was effective on December 2, 1992 (start of performance). Effective December 1, 1997, the maximum sales charge has been increased to 4.50%. The Fund's performance assumes the reinvestment of all dividends and distributions. The LBMB and the LCAMDFA have been adjusted to reflect reinvestment of dividends on securities in the index and average. Indexes are unmanaged, and unlike the Fund, are not affected by cashflows. It is not possible to invest directly in an index.
2 The LBMB is an unmanaged index compromising bonds with a minimum credit rating of at least Baa. They must have an outstanding par value of at least $3 million and be issued as part of a transaction of at least $50 million. The index includes both zero coupons bonds and bonds subject to the federal alternative minimum tax. It is not adjusted to reflect sales charges, expenses, or other fees that the Securities and Exchange Commission (SEC) requires to be reflected in the Fund's performance. The LBMB is unmanaged and, unlike the Fund, is not affected by cashflows.
3 The LCAMDFA represents the average of the total returns reported by all of the mutual funds designated Lipper, Inc. as falling into the respective category. These total returns are reported net of expenses and other fees that the SEC requires to be reflected in a mutual fund's performance.
4 Total return quoted reflects all applicable sales charges and contingent deferred sales charges.
GROWTH OF A $10,000 INVESTMENT - CLASS B SHARES
The graph below illustrates the hypothetical investment of $10,000 1 in Federated California Municipal Income Fund (Class B Shares) (the "Fund") from December 1, 1997 (start of performance) to August 31, 2004, compared to the Lehman Brothers Municipal Bond Index (LBMB) 2 and Lipper California Municipal Debt Funds Average (LCAMDFA). 3
Average Annual Total Returns 4 for the Period Ended 8/31/2004
|
|
|
1 Year
|
| 0.96%
|
5 Years
|
| 4.75%
|
Start of Performance (12/1/1997)
|
| 4.27%
|
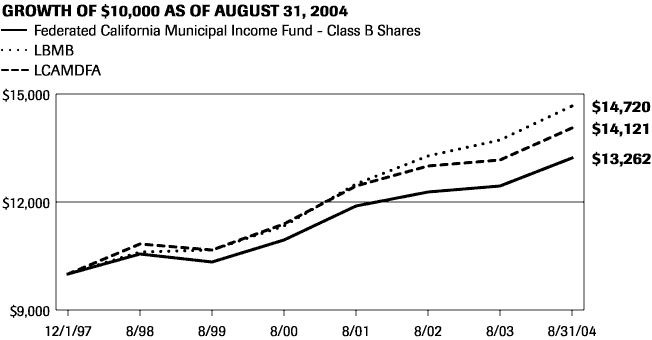
Performance data quoted represents past performance which is no guarantee of future results. Returns shown do not reflect the deduction of taxes that a shareholder would pay on Fund distributions or the redemption of Fund shares. For after-tax returns, visit www.federatedinvestors.com. Investment return and principal value will fluctuate so that an investor's shares, when redeemed, may be worth more or less than their original cost. Mutual fund performance changes over time and current performance may be lower or higher than what is stated. Mutual funds are not obligations of or guaranteed by any bank and are not federally insured.
1 Represents a hypothetical investment of $10,000 in the Fund. The ending value of the Fund does not reflect a contingent deferred sales charge on any redemptions over seven years from the purchase date. The maximum contingent deferral sales charge is 5.50% on any redemption less than one year from the purchase date. The Fund's performance assumes the reinvestment of all dividends and distributions. The LBMB and the LCAMDFA have been adjusted to reflect reinvestment of dividends on securities in the index and average. Indexes are unmanaged, and unlike the Fund, are not affected by cashflows. It is not possible to invest directly in an index.
2 The LBMB is an unmanaged index compromising bonds with a minimum credit rating of at least Baa. They must have an outstanding par value of at least $3 million and be issued as part of a transaction of at least $50 million. The index includes both zero coupons bonds and bonds subject to the federal alternative minimum tax. It is not adjusted to reflect sales charges, expenses, or other fees that the SEC requires to be reflected in the Fund's performance. The LBMB is unmanaged and, unlike the Fund, is not affected by cashflows.
3 The LCAMDFA represents the average of the total returns reported by all of the mutual funds designated Lipper, Inc. as falling into the respective category. These total returns are reported net of expenses and other fees that the SEC requires to be reflected in a mutual fund's performance.
4 Total return quoted reflects all applicable sales charges and contingent deferred sales charges.
Portfolio of Investments Summary Tables
At August 31, 2004, the fund's credit quality ratings composition 1 was as follows:
S&P Long-Term Ratings as
Percentage of Total Investments 2
| | Moody's Long-Term Ratings as
Percentage of Total Investments 2
|
AAA
|
| 33.6%
| | Aaa
|
| 34.7%
|
AA
|
| 2.8%
| | Aa
|
| 3.9%
|
A
|
| 22.3%
| | A
|
| 19.8%
|
BBB
|
| 11.6%
| | Baa
|
| 7.9%
|
BB
|
| 0.0%
| | Ba
|
| 0.9%
|
B
|
| 0.9%
| | B
|
| 0.0%
|
Not rated by S&P
|
| 28.8%
| | Not rated by Moody's
|
| 32.8%
|
TOTAL
|
| 100%
| | TOTAL
|
| 100%
|
1 These tables depict the long-term credit quality ratings assigned to the fund's portfolio holdings by Standard & Poor's and Moody's Investors Service, each of which is a Nationally Recognized Statistical Rating Organization (NRSRO). These credit-quality ratings are shown without regard to gradations within a given rating category. For example, securities rated "A-" have been included in the "A" rated category. Holdings that are rated only by a different NRSRO than the one identified have been included in the "Not rated by..." category. Rated securities that have been prerefunded, but not rated again by the NRSRO, also have been included in the "Not rated by..." category. Rated securities include a security with an obligor and /or credit enhancer that has received a rating from an NRSRO with respect to a class of debt obligations that is comparable in priority and security with the security held by the fund. Credit quality ratings are an assessment of the risk that a security will default in payment and do not address other risks presented by the security. Please see the description of credit quality ratings in the fund's Statement of Additional Information.
Each table depicts the long-term credit quality ratings as assigned only by the NRSRO identified in the table. Of the portfolio's total investments, 12.7% are not rated by either of these NRSROs.
2 Percentages are based on total investments, which may differ from total net assets.
Portfolio of Investments
August 31, 2004
Principal
Amount
|
|
|
| Credit
Rating
|
1
|
| Value
|
| | | LONG-TERM MUNICIPALS--98.6% | | | | | |
| | | California--96.1% | | | | | |
| $ | 1,500,000 | | ABAG Finance Authority for Non-Profit Corporations, Multifamily Housing Revenue Bonds (Series 1999A), 5.80% (Civic Center Drive Apartments Project)/(FSA INS), 9/1/2020
| | AAA/Aaa | | $ | 1,584,450 |
| 500,000 | | ABAG Finance Authority for Non-Profit Corporations, Revenue Bonds, 6.125% (Southern California Presbyterian Homes)/ (Original Issue Yield: 6.25%), 11/15/2032
| | BBB/NR | | | 508,670 |
| 500,000 | | Anaheim, CA Public Financing Authority, Lease Revenue Bonds (Series 1997C), 6.00% (Anaheim Public Improvements Project)/ (FSA INS), 9/1/2016
| | AAA/Aaa | | | 602,210 |
| 500,000 | | Bell Community Redevelopment Agency, CA, Refunding Tax Allocation Revenue Bonds, 5.50% (Radian Asset Assurance INS), 10/1/2023
| | AA/NR | | | 532,320 |
| 605,000 | | Blythe, CA Financing Authority, Sewer Revenue Bonds (Series 1998), 5.75%, 4/1/2028
| | NR | | | 610,850 |
| 750,000 | | Blythe, CA Redevelopment Agency, Tax Allocation Bonds (Series 2000A), 6.20% (Blythe, CA Redevelopment Project No. 1), 5/1/2031
| | BBB/NR | | | 803,835 |
| 500,000 | | California Educational Facilities Authority, Revenue Bonds (Series 2000A), 6.75% (Fresno Pacific University), 3/1/2019
| | NR/Baa3 | | | 552,405 |
| 1,000,000 | | California Educational Facilities Authority, Revenue Bonds (Series 2002A), 5.50% (Pepperdine University), 8/1/2032
| | NR/A1 | | | 1,038,220 |
| 600,000 | | California Educational Facilities Authority, Revenue Bonds, 6.70% (Southwestern University)/(U.S. Treasury PRF 11/1/2004 @ 102)/(Original Issue Yield: 6.838%), 11/1/2024
| | NR/A3 | | | 617,478 |
| 365,000 | | California Educational Facilities Authority, Student Loan Revenue Bonds (Series 1998), 5.55% (AMBAC INS), 4/1/2028
| | AAA/NR | | | 379,297 |
| 425,000 | | California Educational Facilities Authority, Student Loan Revenue Bonds (Series A), 5.40% (Cal Loan Program)/(MBIA Insurance Corp. INS), 3/1/2021
| | NR/Aaa | | | 447,338 |
| 710,000 | | California HFA, Home Mortgage Revenue Bonds (Series 1996Q), 5.85% (MBIA Insurance Corp. INS), 8/1/2016
| | AAA/Aaa | | | 749,206 |
| 425,000 | | California Health Facilities Financing Authority, Health Facility Revenue Bonds (Series 2004I), 4.95% TOBs (Catholic Healthcare West), 7/1/2014, Maturity 7/1/2026
| | BBB+/Baa1 | | | 432,926 |
| 1,000,000 | | California Health Facilities Financing Authority, Insured Health Facilities Refunding Revenue Bonds (Series 1997), 5.50% (Valley Care Hospital Corp.)/(California Mortgage Insurance INS)/(Original Issue Yield: 5.737%), 5/1/2020
| | A/NR | | | 1,044,750 |
| 1,000,000 | | California Health Facilities Financing Authority, Revenue Bonds (Series 1998), 5.40% (Northern California Presbyterian Homes, Inc.)/(Original Issue Yield: 5.417%), 7/1/2028
| | A-/NR | | | 1,013,550 |
Principal
Amount
|
|
|
| Credit
Rating
|
1
|
| Value
|
| | | LONG-TERM MUNICIPALS--continued | | | | | |
| | | California--continued | | | | | |
| $ | 1,500,000 | | California Health Facilities Financing Authority, Revenue Bonds (Series 1999A), 6.125% (Cedars-Sinai Medical Center), 12/1/2030
| | NR/A3 | | $ | 1,606,080 |
| 700,000 | | California Health Facilities Financing Authority, Revenue Refunding Bonds (1996 Series A), 6.00% (Catholic Healthcare West)/(MBIA Insurance Corp. INS)/(Original Issue Yield: 6.15%), 7/1/2017
| | AAA/Aaa | | | 760,781 |
| 500,000 | | California Infrastructure & Economic Development Bank, Revenue Bonds (Series 2000A), 5.75% (Scripps Research Institute)/(Original Issue Yield: 5.85%), 7/1/2030
| | NR/Aa3 | | | 524,070 |
| 1,000,000 | | California Infrastructure & Economic Development Bank, Revenue Bonds (Series 2001B), 5.50% (Kaiser Permanente), 8/1/2031
| | A/A2 | | | 1,024,010 |
| 1,000,000 | | California PCFA, Refunding Revenue Bonds (1996 Series A), 5.35% (Pacific Gas & Electric Co.)/(MBIA Insurance Corp. INS), 12/1/2016
| | AAA/Aaa | | | 1,083,920 |
| 900,000 | | California PCFA, Sewer & Solid Waste Disposal Revenue Bonds, 5.75% (Anheuser-Busch Cos. Inc.)/(Original Issue Yield: 5.818%), 12/1/2030
| | A+/A1 | | | 928,863 |
| 750,000 | 2,3 | California PCFA, Solid Waste Disposal Revenue Bonds, 5.125% TOBs (Waste Management, Inc.), 5/1/2014, Maturity 7/1/2031
| | BBB/NR | | | 778,493 |
| 700,000 | | California PCFA, Solid Waste Disposal Revenue Bonds, 6.875% (Browning-Ferris Industries, Inc.)/(Original Issue Yield: 6.95%), 11/1/2027
| | BB-/B2 | | | 703,500 |
| 1,000,000 | | California PCFA, Solid Waste Refunding Revenue Bonds (Series 1999A), 5.125% (West County Resource Recovery, Inc.)/(Comerica Bank - California LOC)/(Original Issue Yield: 5.323%), 1/1/2014
| | AA- | | | 1,013,880 |
| 135,000 | | California Rural Home Mortgage Finance Authority, SFM Revenue Bonds, (Series 1998 B-4), 6.35% (GNMA COL), 12/1/2029
| | AAA/NR | | | 136,519 |
| 500,000 | | California State Department of Water Resources Power Supply Program, Power Supply Revenue Bonds (Insured Series), 5.375% (AMBAC INS), 5/1/2018
| | AAA/Aaa | | | 551,285 |
| 1,500,000 | | California State Department of Water Resources Power Supply Program, Power Supply Revenue Bonds (Series A), 5.375% (Original Issue Yield: 5.48%), 5/1/2022
| | BBB+/A2 | | | 1,599,885 |
| 1,000,000 | | California State Public Works Board, Lease Revenue Bonds, 5.25% (California State Department of Corrections), 1/1/2013
| | A-/Baa1 | | | 1,097,070 |
| 870,000 | | California State, UT GO Bonds, 5.25% (Original Issue Yield: 5.375%), 12/1/2027
| | A/A3 | | | 897,205 |
| 1,000,000 | | California State, UT GO Bonds, 5.125% (Original Issue Yield: 5.40%), 6/1/2025
| | A/A3 | | | 1,026,300 |
| 20,000 | | California State, UT GO Bonds, 5.75% (Original Issue Yield: 6.25%), 3/1/2019
| | A/A3 | | | 20,555 |
Principal
Amount
|
|
|
| Credit
Rating
|
1
|
| Value
|
| | | LONG-TERM MUNICIPALS--continued | | | | | |
| | | California--continued | | | | | |
| $ | 1,000,000 | | California State, Various Purpose UT GO Bonds, 5.125% (Original Issue Yield: 5.16%), 4/1/2023
| | A/A3 | | $ | 1,045,410 |
| 1,000,000 | | California State, Various Purpose UT GO Bonds, 5.25%, 11/1/2021
| | A/A3 | | | 1,069,330 |
| 400,000 | | California Statewide Communities Development Authority, Certificates of Participation, 5.25% (St. Joseph Health System Group, CA)/(Original Issue Yield: 5.47%), 7/1/2021
| | AA-/Aa3 | | | 418,460 |
| 1,000,000 | | California Statewide Communities Development Authority, Certificates of Participation, 5.50% (Sutter Health)/ (FSA INS)/(Original Issue Yield: 5.77%), 8/15/2018
| | AAA/Aaa | | | 1,108,980 |
| 500,000 | 2 | California Statewide Communities Development Authority, Revenue Bonds (Series 2001), 6.75% (Saint Mark's School), 6/1/2028
| | NR | | | 509,730 |
| 400,000 | 2 | California Statewide Communities Development Authority, Revenue Bonds (Series 2002), 6.75% (Prospect Sierra School)/(Original Issue Yield: 6.85%), 9/1/2032
| | NR | | | 408,780 |
| 500,000 | 2 | California Statewide Communities Development Authority, Revenue Bonds, 6.50% (Turningpoint School), 11/1/2031
| | NR | | | 514,050 |
| 1,000,000 | | California Statewide Communities Development Authority, Revenue Bonds, 5.75% (Los Angeles Orthopedic Hospital Foundation)/(AMBAC INS), 6/1/2030
| | AAA/NR | | | 1,078,720 |
| 500,000 | | Capistrano Unified School District, CA Community Facilities District No. 90-2, Special Tax Bonds (Series 2003), 5.875% (Talega Ranch), 9/1/2023
| | NR | | | 515,855 |
| 450,000 | | Central Unified School District, CA, UT GO Bonds (Series 2004A), 5.50% (FGIC INS), 7/1/2022
| | AAA/NR | | | 501,116 |
| 455,000 | | Central Unified School District, CA, UT GO Bonds (Series 2004A), 5.50% (FGIC INS), 7/1/2024
| | AAA/NR | | | 500,486 |
| 250,000 | | Chula Vista, CA Community Facilities District No. 06-1, Special Tax Revenue Bonds (Series 2002A), 6.15% (Eastlake-Woods, Vistas & Land Swap), 9/1/2026
| | NR | | | 260,030 |
| 1,000,000 | | Daly City, CA HDFA, Mobile Home Park Senior Revenue Bonds (Series 2002A0), 5.85% (Franciscan Acquisition Project)/ (Original Issue Yield: 5.95%), 12/15/2032
| | A-/NR | | | 1,032,960 |
| 1,000,000 | | El Centro, CA Financing Authority, Insured Hospital Revenue Bonds (Series 2001), 5.25% (El Centro Regional Medical Center)/(California Mortgage Insurance LOC)/(Original Issue Yield: 5.32%), 3/1/2018
| | A/NR | | | 1,051,930 |
| 755,000 | | El Monte, CA Public Financing Authority, Tax Allocation Revenue Bonds (Series 1998), 5.75% (El Monte, CA Community Redevelopment Agency), 6/1/2028, PRF 1/1/2002 @100
| | BBB- | | | 766,166 |
| 700,000 | | Foothill/Eastern Transportation Corridor Agency, CA, (Series 1995A) Senior Lien Toll Road Revenue Bonds, 6.50% (U.S. Treasury PRF 1/1/2007 @100)/(Original Issue Yield: 6.78%), 1/1/2032
| | AAA/#Aaa | | | 776,272 |
Principal
Amount
|
|
|
| Credit
Rating
|
1
|
| Value
|
| | | LONG-TERM MUNICIPALS--continued | | | | | |
| | | California--continued | | | | | |
| $ | 1,000,000 | | Foothill/Eastern Transportation Corridor Agency, CA, Toll Road Refunding Revenue Bonds, 5.75% (Original Issue Yield: 5.774%), 1/15/2040
| | BBB-/Baa3 | | $ | 1,006,190 |
| 2,000,000 | | Golden State Tobacco Securitization Corp., CA, Tobacco Settlement Asset-Backed Revenue Bonds (Series 2003A-1), 6.75% (Original Issue Yield: 7.00%), 6/1/2039
| | BBB/Baa3 | | | 1,869,800 |
| 1,000,000 | | Inglewood, CA Public Financing Authority, Refunding Revenue Bonds (Series 1999A), 5.625% (AMBAC INS), 8/1/2016
| | AAA/Aaa | | | 1,128,800 |
| 500,000 | | Inland Empire Solid Waste Financing Authority, CA, Revenue Bonds (Series B), 6.25% (Escrowed to maturity U.S. Treasury COL), 8/1/2011
| | AAA/Aaa | | | 568,180 |
| 500,000 | | La Verne, CA, Revenue Certificates of Participation (Series 2003B), 6.625% (Brethren Hillcrest Homes)/(Original Issue Yield: 6.70%), 2/15/2025
| | BBB-/NR | | | 509,030 |
| 1,000,000 | | Long Beach, CA Bond Financing Authority, Plaza Parking Facility Lease Revenue Bonds, 5.25% (Original Issue Yield: 5.54%), 11/1/2021
| | A+/NR | | | 1,048,880 |
| 495,000 | | Los Angeles, CA Community Redevelopment Agency, Housing Revenue Refunding Bonds (Series A), 6.55% (AMBAC INS), 1/1/2027
| | AAA/Aaa | | | 505,484 |
| 255,000 | | Los Angeles, CA Department of Water & Power, Revenue Refunding Bonds, 6.125% (Los Angeles, CA Department of Water & Power (Electric/Power System)), 2/15/2019
| | AA-/Aa3 | | | 263,211 |
| 745,000 | | Los Angeles, CA Department of Water & Power, Revenue Refunding Bonds, 6.125% (Los Angeles, CA Department of Water & Power (Electric/Power System))/(U.S. Treasury PRF 2/15/2005 @101), 2/15/2019
| | AA-/#Aaa | | | 768,989 |
| 1,000,000 | | Oakland, CA Unified School District, UT GO (Series 2000F), 5.60% (MBIA Insurance Corp. INS)/(Original Issue Yield: 5.63%), 8/1/2019
| | AAA/Aaa | | | 1,120,680 |
| 500,000 | | Orange County, CA Community Facilities District No. 2000-1, Special Tax Bonds (Series 2000A), 6.25% (Ladera Ranch)/ (Original Issue Yield: 6.28%), 8/15/2030
| | NR | | | 516,825 |
| 400,000 | | Orange County, CA Community Facilities District No. 2000-1, Special Tax Bonds (Series 2002A), 6.00% (Ladera Ranch)/ (Original Issue Yield: 6.03%), 8/15/2032
| | NR | | | 410,604 |
| 500,000 | | Orange County, CA Community Facilities District No. 2000-1, Special Tax Bonds (Series 2004A), 5.625% (Ladera Ranch)/ (Original Issue Yield: 5.65%), 8/15/2034
| | NR | | | 508,070 |
| 1,000,000 | | Oxnard, CA Union High School District, Refunding UT GO Bonds (Series 2001A), 6.20% (MBIA Insurance Corp. INS), 8/1/2030
| | AAA/Aaa | | | 1,149,780 |
| 500,000 | | Perris, CA Public Financing Authority, Tax Allocation Revenue Bonds (Series 2001A), 5.75% (Original Issue Yield: 5.85%), 10/1/2031
| | A-/NR | | | 520,970 |
Principal
Amount
|
|
|
| Credit
Rating
|
1
|
| Value
|
| | | LONG-TERM MUNICIPALS--continued | | | | | |
| | | California--continued | | | | | |
| $ | 900,000 | | Port of Oakland, CA, Revenue Bonds (Series 1997G), 5.50% (MBIA Insurance Corp. INS)/(Original Issue Yield: 5.83%), 11/1/2017
| | AAA/Aaa | | $ | 971,658 |
| 1,000,000 | | Port of Oakland, CA, Revenue Bonds (Series 2000K), 5.75% (FGIC INS)/(Original Issue Yield: 5.78%), 11/1/2020
| | AAA/Aaa | | | 1,099,530 |
| 1,000,000 | | Rancho Mirage Joint Powers Financing Authority, CA, Revenue Bonds (Series 2004), 5.875% (Eisenhower Medical Center), 7/1/2026
| | NR/A3 | | | 1,053,730 |
| 2,000,000 | | Richmond, CA, Wastewater Revenue Bonds (Series 1999), 5.80% (FGIC INS), 8/1/2018
| | AAA/Aaa | | | 2,265,760 |
| 1,395,000 | | Sacramento, CA Unified School District, UT GO Bonds (Series A), 6.00% (U.S. Treasury PRF 7/1/2009 @102), 7/1/2025
| | NR/Aa3 | | | 1,643,826 |
| 1,000,000 | | San Bernardino County, CA Housing Authority, Multifamily Mortgage Revenue Bonds (Series 2001A), 6.70% (Glen Aire Park)/(GNMA GTD), 12/20/2041
| | NR/Aaa | | | 1,076,620 |
| 350,000 | | San Bernardino County, CA Housing Authority, Subordinated Revenue Bonds, 7.25% (Glen Aire Park & Pacific Palms), 4/15/2042
| | NR | | | 327,261 |
| 400,000 | | San Bernardino, CA Joint Powers Financing Authority, Tax Allocation Refunding Revenue Bonds, 6.625%, 4/1/2026
| | NR | | | 413,956 |
| 1,000,000 | | San Diego County, CA, Certificates of Participation, 5.25% (University of San Diego)/(Original Issue Yield: 5.47%), 10/1/2021
| | NR/A2 | | | 1,050,900 |
| 300,000 | | San Dimas, CA Housing Authority, Mobile Home Park Revenue Bonds (Series 1998A), 5.70% (Charter Oak Mobile Home Estates Acquisition Project)/(Original Issue Yield: 5.90%), 7/1/2028
| | NR | | | 294,417 |
| 300,000 | | San Francisco, CA City & County Airport Commission, (Second Series) Revenue Bonds (Issue 12A), 5.90% (San Francisco International Airport)/(Original Issue Yield: 5.97%), 5/1/2026
| | A/A1 | | | 308,193 |
| 400,000 | | San Francisco, CA City & County Redevelopment Agency Community Facilities District No. 6, Special Tax Revenue Bonds, 6.625% (Mission Bay South), 8/1/2027
| | NR | | | 420,040 |
| 1,000,000 | | San Jose, CA Unified School District, Certificates of Participation, 5.75% (MBIA Insurance Corp. INS)/(Original Issue Yield: 5.85%), 6/1/2020
| | AAA/Aaa | | | 1,092,600 |
| 500,000 | | San Mateo, CA Redevelopment Agency, Merged Area Tax Allocation Bonds (Series 2001A), 5.50% (Original Issue Yield: 5.55%), 8/1/2022
| | A-/Baa1 | | | 529,720 |
| 1,000,000 | | Santa Clara County, CA Housing Authority, Multifamily Housing Revenue Bonds (Series 2001A), 5.85% (River Town Apartments Project), 8/1/2031
| | NR/A3 | | | 1,013,660 |
| 1,000,000 | | Semitropic Improvement and Water Storage Districts, CA, Revenue Bonds (Series 2004A), 5.25% (XL Capital Assurance Inc. INS), 12/1/2024
| | AAA/Aaa | | | 1,066,480 |
Principal
Amount
|
|
|
| Credit
Rating
|
1
|
| Value
|
| | | LONG-TERM MUNICIPALS--continued | | | | | |
| | | California--continued | | | | | |
| $ | 1,500,000 | | Simi Valley, CA PFA, Lease Revenue Bonds (Series 1995), 5.75% (AMBAC INS), 9/1/2015
| | AAA/Aaa | | $ | 1,694,910 |
| 1,000,000 | | South Orange County, CA Public Financing Authority, 1999 Reassessment Revenue Bonds, 5.80% (FSA INS)/(Original Issue Yield: 5.85%), 9/2/2018
| | NR/Aaa | | | 1,132,060 |
| 400,000 | | Stockton, CA Community Facilities District No. 2001-1, Special Tax Revenue Bonds, 6.375% (Spanos Park West)/(Original Issue Yield: 6.43%), 9/1/2032
| | NR | | | 415,884 |
| 1,400,000 | | Stockton, CA, Certificates of Participation (Series 1999), 5.875% (Original Issue Yield: 5.90%), 8/1/2019
| | A/NR | | | 1,519,420 |
| 400,000 | | Stockton, CA, Health Facility Revenue Bonds (Series 1997A), 5.70% (Dameron Hospital Association), 12/1/2014
| | BBB+/NR | | | 420,708 |
| 1,000,000 | | Torrance, CA, Hospital Revenue Bonds (Series 2001 A), 5.50% (Torrance Memorial Medical Center)/(Original Issue Yield: 5.65%), 6/1/2031
| | A+/A1 | | | 1,031,390 |
| 1,000,000 | | Trustees of the California State University, Systemwide Revenue Bonds (Series 2002), 5.375% (AMBAC INS), 11/1/2018
| | AAA/Aaa | | | 1,113,500 |
| 1,000,000 | | Vallejo, CA Unified School District, UT GO Bonds, 5.90% (MBIA Insurance Corp. INS), 2/1/2021
| | AAA/Aaa | | | 1,199,220 |
| 1,000,000 | | Vista, CA Community Development Commission, Tax Allocation Bonds (Series 2001), 5.80% (Vista Redevelopment Project Area)/(Original Issue Yield: 5.85%), 9/1/2030
| | BBB+/NR | | | 1,035,320 |
| 965,000 | | Walnut, CA Public Financing Authority, Tax Allocation Revenue Bonds (Series 2002), 5.375% (Walnut Improvement Project)/ (AMBAC INS), 9/1/2019
| | AAA/Aaa | | | 1,049,853 |
| 500,000 | | Watsonville, CA, Insured Hospital Revenue Refunding Bonds (Series 1996A), 6.20% (Watsonville Community Hospital)/(Escrowed to maturity U.S. Treasury COL)/(Original Issue Yield: 6.225%), 7/1/2012
| | NR | | | 583,265 |
| 1,000,000 | | Whittier, CA, Health Facilities Revenue Bonds, 5.75% (Presbyterian Intercommunity Hospital)/(Original Issue Yield: 5.80%), 6/1/2031
|
| A/NR
|
|
| 1,036,530
|
| | | TOTAL
|
|
|
|
| 74,984,100
|
| | | Puerto Rico--2.5% | | | | | |
| 1,000,000 | 2,3 | Puerto Rico Electric Power Authority, Drivers (Series 266), 9.415% (FSA INS), 7/1/2015
| | AAA/NR | | | 1,339,280 |
| 595,000 | | Puerto Rico Industrial, Tourist, Educational, Medical & Environmental Control Facilities Financing Authority, Cogeneration Facility Revenue Bonds (Series 2000A), 6.625% (AES Puerto Rico Project)/(Original Issue Yield: 6.65%), 6/1/2026
|
| NR/Baa3
|
|
| 637,370
|
| | | TOTAL
|
|
|
|
| 1,976,650
|
| | | TOTAL LONG-TERM MUNICIPALS (IDENTIFIED COST $72,510,744)
|
|
|
|
| 76,960,750
|
Principal
Amount
|
|
|
| Credit
Rating
|
1
|
| Value
|
| | | SHORT-TERM MUNICIPALS--0.4% | | | | | |
| | | California--0.3% | | | | | |
| $ | 200,000 | | Metropolitan Water District of Southern California, (Series 2001 B-1) Weekly VRDNs (Dexia Credit Local LIQ)
|
| A-1+/VMIG1
|
| $
| 200,000
|
| | | Puerto Rico--0.1% | | | | | |
| 100,000 | | Puerto Rico Government Development Bank (GDB) Weekly VRDNs (MBIA Insurance Corp. INS)/(Credit Suisse First Boston LIQ)
|
| AAA/Aaa
|
|
| 100,000
|
| | | TOTAL SHORT-TERM MUNICIPALS (AT AMORTIZED COST)
|
|
|
|
| 300,000
|
| | | TOTAL INVESTMENTS--99.0%
(IDENTIFIED COST $72,810,744) 4
|
|
|
| $
| 77,260,750
|
| | | OTHER ASSETS AND LIABILITIES - NET--1.0%
|
|
|
|
| 781,135
|
| | | TOTAL NET ASSETS--100%
|
|
|
|
| 78,041,885
|
Securities that are subject to the federal alternative minimum tax (AMT) represent 15.1% of the Fund's portfolio as calculated based upon total portfolio market value (percentage is unaudited).
1 Please refer to the Statement of Additional Information for an explanation of the credit ratings. Current credit ratings are unaudited.
2 Denotes a restricted security, including securities purchased under Rule 144A of the Securities Act of 1933. These securities, unless registered under the Act or exempted from registration, may only be sold to qualified institutional investors. At August 31, 2004, these securities amounted to $3,550,333 which represents 4.5% of total net assets.
3 Denotes a restricted security, including securities purchased under Rule 144A that have been deemed liquid by criteria approved by the fund's Board of Trustees. At August 31, 2004, these securities amounted to $2,117,773 which represents 2.7% of total net assets.
4 The cost of investments for federal tax purposes amounts to $72,807,187.
Note: The categories of investments are shown as a percentage of total net assets at August 31, 2004.
The following acronyms are used throughout this portfolio:
| AMBAC | - --American Municipal Bond Assurance Corporation |
| COL | - --Collateralized |
| FGIC | - --Financial Guaranty Insurance Company |
| FSA | - --Financial Security Assurance |
| GNMA | - --Government National Mortgage Association |
| GO | - --General Obligation |
| GTD | - --Guaranty |
| HFA | - --Housing Finance Authority |
| HDFA | - --Housing Development Finance Authority |
| INS | - --Insured |
| LIQ | - --Liquidity Agreement |
| LOC | - --Letter of Credit |
| PFA | - --Public Facility Authority |
| PRF | - --Prerefunded |
| SFM | - --Single Family Mortgage |
| TOBs | - --Tender Option Bonds |
| UT | - --Unlimited Tax |
| VRDNs | - --Variable Rate Demand Notes |
See Notes which are an integral part of the Financial Statements
Statement of Assets and Liabilities
August 31, 2004
Assets:
| | | | | | |
Total investments in securities, at value (identified cost $72,810,744)
| | | | | $77,260,750 | |
Cash
| | | | | 29,695 | |
Income receivable
| | | | | 1,076,875 | |
Receivable for investments sold
| | | | | 1,671,018 | |
Receivable for shares sold
|
|
|
|
| 603,240
|
|
TOTAL ASSETS
|
|
|
|
| 80,641,578
|
|
Liabilities:
| | | | | | |
Payable for shares redeemed
| $ | | 2,398,086 | | | |
Income distribution payable
| | | 121,567 | | | |
Payable for distribution services fee (Note 5)
| | | 27,951 | | | |
Payable for shareholder services fee (Note 5)
| | | 16,849 | | | |
Payable for daily variation margin
| | | 22,635 | | | |
Accrued expenses
|
|
| 12,605
|
|
|
|
TOTAL LIABILITIES
|
|
|
|
| 2,599,693
|
|
Net assets for 7,130,548 shares outstanding
|
|
|
|
| $78,041,885
|
|
Net Assets Consist of:
| | | | | | |
Paid-in capital
| | | | | $77,209,349 | |
Net unrealized appreciation of investments and futures contracts
| | | | | 4,458,669 | |
Accumulated net realized loss on investments, futures contracts and swap contracts
| | | | | (3,626,068 | ) |
Distributions in excess of net investment income
|
|
|
|
| (65
| )
|
TOTAL NET ASSETS
|
|
|
|
| $78,041,885
|
|
Net Asset Value, Offering Price and Redemption Proceeds Per Share
| | | | | | |
Class A Shares:
| | | | | | |
Net asset value per share ($34,268,791 ÷ 3,131,102 shares outstanding), no par value, unlimited shares authorized
|
|
|
|
| $10.94
|
|
Offering price per share (100/95.50 of $10.94) 1
|
|
|
|
| $11.46
|
|
Redemption proceeds per share
|
|
|
|
| $10.94
|
|
Class B Shares:
| | | | | | |
Net asset value per share ($43,773,094 ÷ 3,999,446 shares outstanding), no par value, unlimited shares authorized
|
|
|
|
| $10.94
|
|
Offering price per share
|
|
|
|
| $10.94
|
|
Redemption proceeds per share (94.50/100 of $10.94) 1
|
|
|
|
| $10.34
|
|
1 See "What Do Shares Cost?" in the Prospectus.
See Notes which are an integral part of the Financial Statements
Statement of Operations
Year Ended August 31, 2004
Investment Income:
| | | | | | | | | | | | |
Interest
|
|
|
|
|
|
|
|
|
|
| $4,506,651
|
|
Expenses:
| | | | | | | | | | | | |
Investment adviser fee (Note 5)
| | | | | | $ | 339,084 | | | | | |
Administrative personnel and services fee (Note 5)
| | | | | | | 184,167 | | | | | |
Custodian fees
| | | | | | | 5,127 | | | | | |
Transfer and dividend disbursing agent fees and expenses (Note 5)
| | | | | | | 49,968 | | | | | |
Directors'/Trustees' fees
| | | | | | | 2,341 | | | | | |
Auditing fees
| | | | | | | 16,097 | | | | | |
Legal fees
| | | | | | | 6,043 | | | | | |
Portfolio accounting fees (Note 5)
| | | | | | | 65,603 | | | | | |
Distribution services fee--Class A Shares (Note 5)
| | | | | | | 91,999 | | | | | |
Distribution services fee--Class B Shares (Note 5)
| | | | | | | 359,786 | | | | | |
Shareholder services fee--Class A Shares (Note 5)
| | | | | | | 91,999 | | | | | |
Shareholder services fee--Class B Shares (Note 5)
| | | | | | | 119,928 | | | | | |
Share registration costs
| | | | | | | 25,794 | | | | | |
Printing and postage
| | | | | | | 20,090 | | | | | |
Insurance premiums
| | | | | | | 7,766 | | | | | |
Miscellaneous
|
|
|
|
|
|
| 1,670
|
|
|
|
|
|
TOTAL EXPENSES
|
|
|
|
|
|
| 1,387,462
|
|
|
|
|
|
Waivers and Reimbursement (Note 5):
| | | | | | | | | | | | |
Waiver of investment adviser fee
| | $ | (339,084 | ) | | | | | | | | |
Waiver of administrative personnel and services fee
| | | (28,465 | ) | | | | | | | | |
Waiver of transfer and dividend disbursing agent fees and expenses
| | | (2,278 | ) | | | | | | | | |
Waiver of distribution services fee--Class A Shares
| | | (91,999 | ) | | | | | | | | |
Reimbursement of other operating expenses
|
|
| (137,843
| )
|
|
|
|
|
|
|
|
|
TOTAL WAIVERS AND REIMBURSEMENT
|
|
|
|
|
|
| (599,669
| )
|
|
|
|
|
Net expenses
|
|
|
|
|
|
|
|
|
|
| 787,793
|
|
Net investment income
|
|
|
|
|
|
|
|
|
|
| 3,718,858
|
|
Realized and Unrealized Gain (Loss) on Investments, Futures Contracts and Swap Contracts:
|
| | | | | | | | | | | |
Net realized gain on investments
| | | | | | | | | | | 226,768 | |
Net realized loss on futures contracts
| | | | | | | | | | | (187,111 | ) |
Net realized loss on swap contracts
| | | | | | | | | | | (78,137 | ) |
Net change in unrealized appreciation of investments
|
|
|
|
|
|
|
|
|
|
| 1,900,235
|
|
Net realized and unrealized gain on investments, futures contracts and swap contracts
|
|
|
|
|
|
|
|
|
|
| 1,861,755
|
|
Change in net assets resulting from operations
|
|
|
|
|
|
|
|
|
|
| $5,580,613
|
|
See Notes which are an integral part of the Financial Statements
Statement of Changes in Net Assets
Year Ended August 31
|
|
| 2004
|
|
|
| 2003
|
|
Increase (Decrease) in Net Assets
| | | | | | | | |
Operations:
| | | | | | | | |
Net investment income
| | | $3,718,858 | | | | $3,884,686 | |
Net realized loss on investments, futures contracts and swap contracts
| | | (38,480 | ) | | | (359,282 | ) |
Net change in unrealized appreciation/depreciation of investments and futures contracts
|
|
| 1,900,235
|
|
|
| (2,045,845
| )
|
CHANGE IN NET ASSETS RESULTING FROM OPERATIONS
|
|
| 5,580,613
|
|
|
| 1,479,559
|
|
Distributions to Shareholders:
| | | | | | | | |
Distributions from net investment income
| | | | | | | | |
Class A Shares
| | | (1,770,023 | ) | | | (1,814,379 | ) |
Class B Shares
|
|
| (1,947,806
| )
|
|
| (2,068,626
| )
|
CHANGE IN NET ASSETS RESULTING FROM DISTRIBUTIONS TO SHAREHOLDERS
|
|
| (3,717,829
| )
|
|
| (3,883,005
| )
|
Share Transactions:
| | | | | | | | |
Proceeds from sale of shares
| | | 9,037,022 | | | | 33,733,681 | |
Net asset value of shares issued to shareholders in payment of distributions declared
| | | 2,186,350 | | | | 1,856,331 | |
Cost of shares redeemed
|
|
| (22,572,306
| )
|
|
| (34,893,556
| )
|
CHANGE IN NET ASSETS RESULTING FROM SHARE TRANSACTIONS
|
|
| (11,348,934
| )
|
|
| 696,456
|
|
Change in net assets
|
|
| (9,486,150
| )
|
|
| (1,706,990
| )
|
Net Assets:
| | | | | | | | |
Beginning of period
|
|
| 87,528,035
|
|
|
| 89,235,025
|
|
End of period (including distributions in excess of net investment income of $(65) and $(113), respectively)
|
|
| $78,041,885
|
|
|
| $87,528,035
|
|
See Notes which are an integral part of the Financial Statements
Notes to Financial Statements
August 31, 2004
1. ORGANIZATION
Federated Municipal Securities Income Trust (the "Trust") is registered under the Investment Company Act of 1940, as amended (the "Act"), as an open-end, management investment company. The Trust consists of seven portfolios. The financial statements included herein are only those of Federated California Municipal Income Fund (the "Fund"), a non-diversified portfolio. The financial statements of the other portfolios are presented separately. The assets of each portfolio are segregated and a shareholder's interest is limited to the portfolio in which shares are held. The investment objective of the Fund is to provide current income exempt from federal regular income tax (federal regular income tax does not include the federal alternative minimum tax) and the personal income taxes imposed by the state of California and California municipalities.
The Fund offers two classes of shares: Class A Shares and Class B Shares.
2. SIGNIFICANT ACCOUNTING POLICIES
The following is a summary of significant accounting policies consistently followed by the Fund in the preparation of its financial statements. These policies are in conformity with generally accepted accounting principles (GAAP) in the United States of America.
Investment Valuation
Municipal bonds are valued by an independent pricing service, taking into consideration yield, liquidity, risk, credit quality, coupon, maturity, type of issue, and any other factors or market data the pricing service deems relevant. Short-term securities are valued at the prices provided by an independent pricing service. However, short-term securities with remaining maturities of 60 days or less at the time of purchase may be valued at amortized cost, which approximates fair market value. Securities for which no quotations are readily available are valued at fair value as determined in accordance with procedures established by and under general supervision of the Board of Trustees (the "Trustees").
Investment Income, Gains and Losses, Expenses and Distributions
Interest income and expenses are accrued daily. Dividend income and distributions to shareholders are recorded on the ex-dividend date. Non-cash dividends included in dividend income, if any, are recorded at fair value. Investment income, realized and unrealized gains and losses, and certain fund-level expenses are allocated to each class based on relative average daily net assets, except that each class bears certain expenses unique to that class such as distribution fees. Dividends are declared separately for each class. No class has preferential dividends rights; differences in per share dividend rates are generally due to difference in separate class expenses.
Premium and Discount Amortization
All premiums and discounts on fixed-income securities are amortized/accreted for financial statement purposes.
Federal Taxes
It is the Fund's policy to comply with the Subchapter M provision of the Internal Revenue Code (the "Code") and to distribute to shareholders each year substantially all of its income. Accordingly, no provision for federal income tax is necessary.
When-Issued and Delayed Delivery Transactions
The Fund may engage in when-issued or delayed delivery transactions. The Fund records when-issued securities on the trade date and maintains security positions such that sufficient liquid assets will be available to make payment for the securities purchased. Securities purchased on a when-issued or delayed delivery basis are marked to market daily and begin earning interest on the settlement date. Losses may occur on these transactions due to changes in market conditions or the failure of counterparties to perform under the contract.
Swap Contracts
The Fund may enter into swap contracts. A swap is an exchange of cash payments between the Fund and another party, which is based on a specific financial index. The value of the swap is adjusted daily and the change in value is recorded as unrealized appreciation or depreciation. When a swap contract is closed, the Fund recognizes a realized gain or loss. The swap contracts entered into by the Fund are on a forward settling basis. For the year ended August 31, 2004, the Fund had realized losses on swap contracts of $78,137.
Risks may arise upon entering into these agreements from the potential inability of the counterparties to meet the terms of their contract and from unanticipated changes in the value of the financial index on which the swap agreement is based. The Fund uses swaps for hedging purposes to reduce its exposure to interest rate fluctuations.
At August 31, 2004, the Fund had no open swap contracts.
Futures Contracts
The Fund periodically may sell bond interest rate futures contracts to manage duration and to potentially reduce transaction costs. Upon entering into a bond interest rate futures contract with a broker, the Fund is required to deposit in a segregated account a specified amount of cash or U.S. government securities. Futures contracts are valued daily and unrealized gains or losses are recorded in a "variation margin" account. Daily, the Fund receives from or pays to the broker a specified amount of cash based upon changes in the variation margin account. When a contract is closed, the Fund recognizes a realized gain or loss. For the year ended August 31, 2004, the Fund had realized losses on futures contracts of $187,111.
Futures contracts have market risks, including the risk that the change in the value of the contract may not correlate with changes in the value of the underlying securities.
At August 31, 2004, the Fund had outstanding futures contracts as set forth below:
Expiration Date
|
| Contracts to Receive
|
|
Position
|
| Unrealized
Appreciation
|
December 2004
|
| 55 U.S. Treasury Note 10-Year Futures
|
| Short
|
| $8,663
|
Restricted Securities
Restricted securities are securities that may only be resold upon registration under federal securities laws or in transactions exempt from such registration. In some cases, the issuer of restricted securities has agreed to register such securities for resale, at the issuer's expense, either upon demand by the Fund or in connection with another registered offering of the securities. Many restricted securities may be resold in the secondary market in transactions exempt from registration. Such restricted securities may be determined to be liquid under criteria established by the Trustees. The Fund will not incur any registration costs upon such resales. The Fund's restricted securities are valued at the price provided by dealers in the secondary market or, if no market prices are available, at the fair value as determined in accordance with procedures established by and under general supervision of the Trustees.
Additional information on restricted securities, including securities purchased under Rule 144A that have not been deemed liquid by the Trustees, for each security held at August 31, 2004, is as follows:
Security
|
| Acquisition
Date
|
| Acquisition
Cost
|
California Statewide Communities Development Authority, Revenue Bonds (Series 2001), 6.75% (Saint Mark's School), 6/1/2028
|
| 7/03/2001
|
| $ 500,000
|
California Statewide Communities Development Authority, Revenue Bonds (Series 2002), 6.75% (Prospect Sierra School)/(Original Issue Yield: 6.85%), 9/1/2032
|
| 5/10/2002
|
| $ 394,864
|
California Statewide Communities Development Authority, Revenue Bonds, 6.50% (Turningpoint School), 11/1/2031
|
| 3/23/2001
|
| $ 500,000
|
Puerto Rico Electric Power Authority, Drivers (Series 266), 9.42% (Financial Security Assurance Inc. INS), 7/1/2015
|
| 6/27/2002
|
| $1,237,060
|
Use of Estimates
The preparation of financial statements in conformity with GAAP requires management to make estimates and assumptions that affect the amounts of assets, liabilities, expenses and revenues reported in the financial statements. Actual results could differ from those estimated.
Other
Investment transactions are accounted for on a trade date basis. Realized gains and losses from investment transactions are recorded on an identified cost basis.
3. SHARES OF BENEFICIAL INTEREST
The following table summarizes share activity:
Year Ended August 31
|
| 2004
|
| 2003
|
Class A Shares:
|
| Shares
|
|
|
| Amount
|
|
| Shares
|
|
|
| Amount
|
|
Shares sold
| | 667,738 | | | $ | 7,306,120 | | | 1,897,210 | | | $ | 20,793,050 | |
Shares issued to shareholders in payment of distributions declared
|
| 90,213 | | | | 984,973 |
|
| 72,904 | | | | 800,301 |
|
Shares redeemed
|
| (1,046,644
| )
|
|
| (11,414,259
| )
|
| (2,174,124
| )
|
|
| (23,956,861
| )
|
NET CHANGE RESULTING FROM CLASS A SHARE TRANSACTIONS
|
| (288,693
| )
|
| $
| (3,123,166
| )
|
| (204,010
| )
|
| $
| (2,363,510
| )
|
| | | | | | | | | | | | | | |
Year Ended August 31
|
| 2004
|
| 2003
|
Class B Shares:
|
| Shares
|
|
|
| Amount
|
|
| Shares
|
|
|
| Amount
|
|
Shares sold
| | 158,215 | | | $ | 1,730,902 | | | 1,172,170 | | | $ | 12,940,631 | |
Shares issued to shareholders in payment of distributions declared
|
| 109,957 | | | | 1,201,377 |
|
| 96,359 | | | | 1,056,030 |
|
Shares redeemed
|
| (1,025,938
| )
|
|
| (11,158,047
| )
|
| (997,658
| )
|
|
| (10,936,695
| )
|
NET CHANGE RESULTING FROM CLASS B SHARE TRANSACTIONS
|
| (757,766
| )
|
| $
| (8,225,768
| )
|
| 270,871
|
|
| $
| 3,059,966
|
|
NET CHANGE RESULTING FROM SHARE TRANSACTIONS
|
| (1,046,459
| )
|
| $
| (11,348,934
| )
|
|
66,861
|
|
|
$
|
696,456
|
|
4. FEDERAL TAX INFORMATION
The timing and character of income and capital gain distributions are determined in accordance with income tax regulations which may differ from GAAP. These differences are due in part to differing treatments for expiration of capital loss carryforward and discount accretion/premium amortization of debt securities. For the year ended August 31, 2004, permanent differences identified and reclassified among the components of net assets were as follows:
Increase (Decrease)
|
Paid-In Capital
|
| Undistributed
Net Investment
Income (Loss)
|
| Accumulated
Net Realized
Gains (Losses)
|
$(218,328)
|
| $(981)
|
| $219,309
|
Net investment income, net realized gain (losses) and net assets were not affected by this reclassification.
The tax character of distributions as reported on the Statement of Changes in Net Assets for the years ended August 31, 2004, and 2003, was as follows:
|
| 2004
|
| 2003
|
Tax-Exempt Income
|
| $3,717,829
|
| $3,883,005
|
As of August 31, 2004, the components of distributable earnings on a tax basis were as follows:
Undistributed tax-exempt income
|
| $
| 121,502
|
Unrealized appreciation
|
| $
| 4,453,563
|
Capital loss carryforward
|
| $
| 3,620,962
|
At August 31, 2004, the cost of investments for federal tax purposes was $72,807,187. The net unrealized appreciation of investments for federal tax purposes was $4,453,563. This consists of net unrealized appreciation from investments for those securities having an excess of value over cost of $4,585,251 and net unrealized depreciation from investments for those securities having an excess of cost over value of $131,688.
The difference between book-basis and tax-basis unrealized appreciation/depreciation is attributable to differing treatments for discount accretion/premium amortization of debt securities.
At August 31, 2004, the Fund had a capital loss carryforward of $3,620,962 which will reduce the Fund's taxable income arising from future net realized gain on investments, if any, to the extent permitted by the Code and thus will reduce the amount of distributions to shareholders which would otherwise be necessary to relieve the Fund of any liability for federal tax. Pursuant to the Code, such capital loss carryforward will expire as follows:
Expiration Year
|
| Expiration Amount
|
2008
|
| $1,047,161
|
2009
|
| $1,337,342
|
2010
|
| $ 166,229
|
2011
|
| $ 562,757
|
2012
|
| $ 507,473
|
5. INVESTMENT ADVISER FEE AND OTHER TRANSACTIONS WITH AFFILIATES
Investment Adviser Fee
Federated Investment Management Company, the Fund's investment adviser (the "Adviser"), receives for its services an annual investment adviser fee equal to 0.40% of the Fund's average daily net assets. The Adviser may voluntarily choose to waive any portion of its fee and/or reimburse certain operating expenses of the Fund. The Adviser can modify or terminate this voluntary waiver and/or reimbursement at any time at its sole discretion.
Administrative Fee
Federated Administrative Services (FAS), under the Administrative Services Agreement, provides the Fund with administrative personnel and services. The fee paid to FAS is based on the average aggregate daily net assets of all Federated funds as specified below:
Maximum
Administrative Fee
|
| Average Aggregate Daily
Net Assets of the Federated Funds
|
0.150%
|
| on the first $5 billion
|
0.125%
|
| on the next $5 billion
|
0.100%
|
| on the next $10 billion
|
0.075%
|
| on assets in excess of $20 billion
|
The administrative fee received during any fiscal year shall be at least $150,000 per portfolio and $40,000 per each additional class of Shares. FAS may voluntarily choose to waive any portion of its fee. FAS can modify or terminate this voluntary waiver at any time at its sole discretion.
Prior to November 1, 2003, Federated Services Company (FServ) provided the Fund with administrative personnel and services. The fee paid to FServ was based on the average aggregate daily net assets of all Federated funds as specified below:
Maximum
Administrative Fee
|
| Average Aggregate Daily
Net Assets of the Federated Funds
|
0.150%
|
| on the first $250 million
|
0.125%
|
| on the next $250 million
|
0.100%
|
| on the next $250 million
|
0.075%
|
| on assets in excess of $750 million
|
The administrative fee received during any fiscal year was at least $125,000 per portfolio and $30,000 per each additional class of Shares.
For the year ended August 31, 2004 the fees paid to FAS and FServ were $129,869 and $25,833, respectively, after voluntary waiver, if applicable.
Distribution Services Fee
The Fund has adopted a Distribution Plan (the "Plan") pursuant to Rule 12b-1 under the Act. Under the terms of the Plan, the Fund will compensate Federated Securities Corp. (FSC), the principal distributor, from the daily net assets of the Fund's Class A Shares and Class B Shares to finance activities intended to result in the sale of these shares. The Plan provides that the Fund may incur distribution expenses according to the following schedule annually, to compensate FSC.
Share Class Name
|
| Percentage of Average Daily
Net Assets of Class
|
Class A Shares
|
| 0.25%
|
Class B Shares
|
| 0.75%
|
FSC may voluntarily choose to waive any portion of its fee. FSC can modify or terminate this voluntary waiver at any time at its sole discretion.
Sales Charges
For the fiscal year ended August 31, 2004, FSC retained $4,184 in sales charges from the sale of Class A Shares. See "What Do Shares Cost?" in the Prospectus.
Shareholder Services Fee
Under the terms of a Shareholder Services Agreement with Federated Shareholder Services Company (FSSC), the Fund will pay FSSC up to 0.25% of the average daily net assets of the Fund's Class A Shares and Class B Shares for the period. The fee paid to FSSC is used to finance certain services for shareholders and to maintain shareholder accounts. FSSC may voluntarily choose to waive any portion of its fee. FSSC can modify or terminate this voluntary waiver at any time at its sole discretion.
Transfer and Dividend Disbursing Agent Fees and Expenses
Prior to July 1, 2004, FServ, through its subsidiary FSSC, served as transfer and dividend disbursing agent for the Fund. The fee paid to FSSC was based on the size, type and number of accounts and transactions made by shareholders. The fee paid to FSSC during the reporting period was $43,613, after voluntary waiver, if applicable.
Portfolio Accounting Fees
Prior to January 1, 2004, FServ maintained the Fund's accounting records for which it received a fee. The fee was based on the level of the Fund's average daily net assets for the period, plus out-of-pocket expenses. The fee paid to FServ during the reporting period was $22,904, after voluntary waiver, if applicable.
Interfund Transactions
During the year ended August 31, 2004 the Fund engaged in purchase and sale transactions with funds that have a common investment adviser (or affiliated investment advisers), common Directors/Trustees, and /or common Officers. These purchase and sale transactions complied with Rule 17a-7 under the Act and amounted to $16,100,000 and $16,400,000, respectively.
General
Certain of the Officers and Trustees of the Trust are Officers and Directors or Trustees of the above companies.
6. INVESTMENT TRANSACTIONS
Purchases and sales of investments, excluding long-term U.S. government securities and short-term obligations (and in-kind contributions), for the year ended August 31, 2004, were as follows:
Purchases
|
| $
| 10,579,095
|
Sales
|
| $
| 20,790,892
|
7. CONCENTRATION OF CREDIT RISK
Since the Fund invests a substantial portion of its assets in issuers located in one state, it will be more susceptible to factors adversely affecting issuers of that state than would be a comparable tax-exempt mutual fund that invests nationally. In order to reduce the credit risk associated with such factors, at August 31, 2004, 40.2% of the securities in the portfolio of investments are backed by letters of credit or bond insurance of various financial institutions and financial guaranty assurance agencies. The largest percentage of investments insured by or supported (backed) by a letter of credit from any one institution or agency was 11.2% of total investments.
8. LEGAL PROCEEDINGS
Beginning in October 2003, Federated Investors, Inc. and various subsidiaries thereof (including the advisers and distributor for various investment companies, collectively, "Federated"), along with various investment companies sponsored by Federated ("Funds") were named as defendants in several class action lawsuits now pending in the United States District Court for the District of Maryland seeking damages of unspecified amounts. The lawsuits were purportedly filed on behalf of people who purchased, owned and/or redeemed shares of Federated-sponsored mutual funds during specified periods beginning November 1, 1998. The suits are generally similar in alleging that Federated engaged in illegal and improper trading practices including market timing and late trading in concert with certain institutional traders, which allegedly caused financial injury to the mutual fund shareholders. Federated and various Funds have also been named as defendants in several additional lawsuits, the majority of which are now pending in the United States District Court for the Western District of Pennsylvania, alleging, among other things, excessive advisory and rule 12b-1 fees, and seeking damages of unspecified amounts. The Board of the Funds has retained the law firm of Dickstein Shapiro Morin & Oshinsky LLP to represent the Funds in these lawsuits. Federated and the Funds, and their respective counsel, are reviewing the allegations and will respond appropriately. Additional lawsuits based upon similar allegations may be filed in the future. The potential impact of these recent lawsuits and future potential similar suits is uncertain. Although we do not believe that these lawsuits will have a material adverse effect on the Funds, there can be no assurance that these suits, the ongoing adverse publicity and/or other developments resulting from the regulatory investigations will not result in increased Fund redemptions, reduced sales of Fund shares, or other adverse consequences for the Funds.
9. FEDERAL TAX INFORMATION (UNAUDITED)
At August 31, 2004, 100% of the distributions from net investment income is exempt from federal income tax, other than the federal AMT.
Report of Independent Registered Public Accounting Firm
TO THE BOARD OF TRUSTEES OF FEDERATED MUNICIPAL SECURITIES INCOME TRUST AND SHAREHOLDERS OF FEDERATED CALIFORNIA MUNICIPAL INCOME FUND:
We have audited the accompanying statement of assets and liabilities, including the portfolio of investments, of Federated California Municipal Income Fund (the "Fund") as of August 31, 2004, and the related statement of operations for the year then ended, the statement of changes in net assets for each of the two years in the period then ended, and the financial highlights for each of the five years in the period then ended. These financial statements and financial highlights are the responsibility of the Fund's management. Our responsibility is to express an opinion on these financial statements and financial highlights based on our audit.
We conducted our audit in accordance with standards of the Public Company Accounting Oversight Board (United States). Those standards require that we plan and perform the audit to provide reasonable assurance about whether the financial statements and financial highlights are free of material misstatement. An audit includes examining, on a test basis, evidence supporting the amounts and disclosures in the financial statements. Our procedures included confirmation of the securities owned at August 31, 2004, by correspondence with the custodian. An audit also includes assessing the accounting principles used and significant estimates made by management, as well as evaluating the overall financial statement presentation. We believe our audit provides a reasonable basis for our opinion.
In our opinion, such financial statements and financial highlights present fairly, in all material respects, the financial position of the Fund as of August 31, 2004, the results of its operations, the changes in its net assets and its financial highlights for the respective stated periods in conformity with accounting principles generally accepted in the United States of America.
Deloitte & Touche LLP
Boston, Massachusetts
October 20, 2004
Board of Trustees and Trust Officers
The Board is responsible for managing the Trust's business affairs and for exercising all the Trust's powers except those reserved for the shareholders. The following tables give information about each Board member and the senior officers of the Funds. Where required, the tables separately list Board members who are "interested persons" of the Fund ( i.e. , "Interested" Board members) and those who are not ( i.e. , "Independent" Board members). Unless otherwise noted, the address of each person listed is Federated Investors Tower, 1001 Liberty Avenue, Pittsburgh, PA. The Trust comprises seven portfolios and the Federated Fund Complex consists of 44 investment companies (comprising 136 portfolios). Unless otherwise noted, each Officer is elected annually. Unless otherwise noted, each Board member oversees all portfolios in the Federated Fund Complex and serves for an indefinite term. The Fund's Statement of Additional Information includes additional information about Trust Trustees and is available, without charge and upon request, by calling 1-800-341-7400.
INTERESTED TRUSTEES BACKGROUND
|
|
|
Name
Birth Date
Address
Positions Held with Trust
Date Service Began
|
| Principal Occupation(s) for Past Five Years,
Other Directorships Held and Previous Position(s)
|
John F. Donahue*
Birth Date: July 28, 1924
CHAIRMAN AND TRUSTEE
Began serving: August 1990 | | Principal Occupations : Chairman and Director or Trustee of the Federated Fund Complex; Chairman and Director, Federated Investors, Inc.
Previous Positions : Trustee, Federated Investment Management Company and Chairman and Director, Federated Investment Counseling. |
|
|
|
J. Christopher Donahue*
Birth Date: April 11, 1949
PRESIDENT AND TRUSTEE
Began serving: August 1990 | | Principal Occupations : Principal Executive Officer and President of the Federated Fund Complex; Director or Trustee of some of the Funds in the Federated Fund Complex; President, Chief Executive Officer and Director, Federated Investors, Inc.; Chairman and Trustee, Federated Investment Management Company; Trustee, Federated Investment Counseling; Chairman and Director, Federated Global Investment Management Corp.; Chairman, Passport Research, Ltd.; Trustee, Federated Shareholder Services Company; Director, Federated Services Company.
Previous Positions : President, Federated Investment Counseling; President and Chief Executive Officer, Federated Investment Management Company, Federated Global Investment Management Corp. and Passport Research, Ltd. |
|
|
|
|
|
|
Name
Birth Date
Address
Positions Held with Trust
Date Service Began
|
| Principal Occupation(s) for Past Five Years,
Other Directorships Held and Previous Position(s)
|
Lawrence D. Ellis, M.D.*
Birth Date: October 11, 1932
3471 Fifth Avenue
Suite 1111
Pittsburgh, PA
TRUSTEE
Began serving: August 1990 | | Principal Occupations : Director or Trustee of the Federated Fund Complex; Professor of Medicine, University of Pittsburgh; Medical Director, University of Pittsburgh Medical Center Downtown; Hematologist, Oncologist and Internist, University of Pittsburgh Medical Center.
Other Directorships Held : Member, National Board of Trustees, Leukemia Society of America.
Previous Positions : Trustee, University of Pittsburgh; Director, University of Pittsburgh Medical Center. |
|
|
|
* Family relationships and reasons for "interested" status: John F. Donahue is the father of J. Christopher Donahue; both are "interested" due to the positions they hold with Federated Investors, Inc. and its subsidiaries. Lawrence D. Ellis, M.D. is "interested" because his son-in-law is employed by the Fund's principal underwriter, Federated Securities Corp.
INDEPENDENT TRUSTEES BACKGROUND
|
|
|
Name
Birth Date
Address
Positions Held with Trust
Date Service Began
|
| Principal Occupation(s) for Past Five Years,
Other Directorships Held and Previous Position(s)
|
Thomas G. Bigley
Birth Date: February 3, 1934
15 Old Timber Trail
Pittsburgh, PA
TRUSTEE
Began serving: November 1994 | | Principal Occupation : Director or Trustee of the Federated Fund Complex.
Other Directorships Held : Director, Member of Executive Committee, Children's Hospital of Pittsburgh; Director, University of Pittsburgh.
Previous Position : Senior Partner, Ernst & Young LLP. |
|
|
|
John T. Conroy, Jr.
Birth Date: June 23, 1937
Grubb & Ellis/Investment
Properties Corporation
3838 North Tamiami Trail
Suite 402
Naples, FL
TRUSTEE
Began serving: August 1991 | | Principal Occupations : Director or Trustee of the Federated Fund Complex; Chairman of the Board, Investment Properties Corporation; Partner or Trustee in private real estate ventures in Southwest Florida.
Previous Positions : President, Investment Properties Corporation; Senior Vice President, John R. Wood and Associates, Inc., Realtors; President, Naples Property Management, Inc. and Northgate Village Development Corporation. |
|
|
|
|
|
|
Name
Birth Date
Address
Positions Held with Trust
Date Service Began
|
| Principal Occupation(s) for Past Five Years,
Other Directorships Held and Previous Position(s)
|
Nicholas P. Constantakis
Birth Date: September 3, 1939
175 Woodshire Drive
Pittsburgh, PA
TRUSTEE
Began serving: February 1998 | | Principal Occupations : Director or Trustee of the Federated Fund Complex.
Other Directorships Held : Director and Member of the Audit Committee, Michael Baker Corporation (engineering and energy services worldwide).
Previous Position : Partner, Andersen Worldwide SC. |
|
|
|
John F. Cunningham
Birth Date: March 5, 1943
353 El Brillo Way
Palm Beach, FL
TRUSTEE
Began serving: July 1999 | | Principal Occupation : Director or Trustee of the Federated Fund Complex.
Other Directorships Held : Chairman, President and Chief Executive Officer, Cunningham & Co., Inc. (strategic business consulting); Trustee Associate, Boston College.
Previous Positions : Director, Redgate Communications and EMC Corporation (computer storage systems); Chairman of the Board and Chief Executive Officer, Computer Consoles, Inc.; President and Chief Operating Officer, Wang Laboratories; Director, First National Bank of Boston; Director, Apollo Computer, Inc. |
|
|
|
Peter E. Madden
Birth Date: March 16, 1942
One Royal Palm Way
100 Royal Palm Way
Palm Beach, FL
TRUSTEE
Began serving: August 1991 | | Principal Occupation : Director or Trustee of the Federated Fund Complex; Management Consultant.
Other Directorships Held : Board of Overseers, Babson College.
Previous Positions : Representative, Commonwealth of Massachusetts General Court; President, State Street Bank and Trust Company and State Street Corporation (retired); Director, VISA USA and VISA International; Chairman and Director, Massachusetts Bankers Association; Director, Depository Trust Corporation; Director, The Boston Stock Exchange. |
|
|
|
Charles F. Mansfield, Jr.
Birth Date: April 10, 1945
80 South Road
Westhampton Beach, NY
TRUSTEE
Began serving: January 1999 | | Principal Occupations : Director or Trustee of the Federated Fund Complex; Management Consultant; Executive Vice President, DVC Group, Inc. (marketing communications and technology) (prior to 9/1/00).
Previous Positions : Chief Executive Officer, PBTC International Bank; Partner, Arthur Young & Company (now Ernst & Young LLP); Chief Financial Officer of Retail Banking Sector, Chase Manhattan Bank; Senior Vice President, HSBC Bank USA (formerly, Marine Midland Bank); Vice President, Citibank; Assistant Professor of Banking and Finance, Frank G. Zarb School of Business, Hofstra University. |
|
|
|
|
|
|
Name
Birth Date
Address
Positions Held with Trust
Date Service Began
|
| Principal Occupation(s) for Past Five Years,
Other Directorships Held and Previous Position(s)
|
John E. Murray, Jr., J.D., S.J.D.
Birth Date: December 20, 1932
Chancellor, Duquesne University
Pittsburgh, PA
TRUSTEE
Began serving: February 1995 | | Principal Occupations : Director or Trustee of the Federated Fund Complex; Chancellor and Law Professor, Duquesne University; Partner, Murray, Hogue and Lannis.
Other Directorships Held : Director, Michael Baker Corp. (engineering, construction, operations and technical services).
Previous Positions : President, Duquesne University; Dean and Professor of Law, University of Pittsburgh School of Law; Dean and Professor of Law, Villanova University School of Law. |
|
|
|
Marjorie P. Smuts
Birth Date: June 21, 1935
4905 Bayard Street
Pittsburgh, PA
TRUSTEE
Began serving: August 1990 | | Principal Occupations : Director or Trustee of the Federated Fund Complex; Public Relations/Marketing Consultant/ Conference Coordinator.
Previous Positions : National Spokesperson, Aluminum Company of America; television producer; President, Marj Palmer Assoc.; Owner, Scandia Bord. |
|
|
|
John S. Walsh
Birth Date: November 28, 1957
2604 William Drive
Valparaiso, IN
TRUSTEE
Began serving: July 1999 | | Principal Occupations : Director or Trustee of the Federated Fund Complex; President and Director, Heat Wagon, Inc. (manufacturer of construction temporary heaters); President and Director, Manufacturers Products, Inc. (distributor of portable construction heaters); President, Portable Heater Parts, a division of Manufacturers Products, Inc.
Previous Position : Vice President, Walsh & Kelly, Inc. |
|
|
|
OFFICERS
|
|
|
Name
Birth Date
Positions Held with Trust
Date Service Began
|
| Principal Occupation(s) for Past Five Years and Previous Position(s)
|
John W. McGonigle
Birth Date: October 26, 1938
EXECUTIVE VICE PRESIDENT
AND SECRETARY
Began serving: August 1990 | | Principal Occupations : Executive Vice President and Secretary of the Federated Fund Complex; Executive Vice President, Secretary and Director, Federated Investors, Inc. |
|
|
|
Richard J. Thomas
Birth Date: June 17, 1954
TREASURER
Began serving: November 1998 | | Principal Occupations : Principal Financial Officer and Treasurer of the Federated Fund Complex; Senior Vice President, Federated Administrative Services. |
|
|
|
|
|
|
Name
Birth Date
Positions Held with Trust
Date Service Began
|
| Principal Occupation(s) for Past Five Years and Previous Position(s)
|
Richard B. Fisher
Birth Date: May 17, 1923
VICE CHAIRMAN
Began serving: August 2002 | | Principal Occupations : Vice Chairman or President of some of the Funds in the Federated Fund Complex; Vice Chairman, Federated Investors, Inc.; Chairman, Federated Securities Corp.
Previous Positions : President and Director or Trustee of some of the Funds in the Federated Fund Complex; Executive Vice President, Federated Investors, Inc; and Director and Chief Executive Officer, Federated Securities Corp. |
|
|
|
Mary Jo Ochson
Birth Date: September 12, 1953
CHIEF INVESTMENT OFFICER
Began serving: May 2004 | | Principal Occupations: Mary Jo Ochson has been the Fund's Portfolio Manager since April 1997. Ms. Ochson was named Chief Investment Officer of tax-exempt, fixed-income products in 2004. She joined Federated in 1982 and has been a Senior Portfolio Manager and a Senior Vice President of the Fund's Adviser since 1996. Ms. Ochson is a Chartered Financial Analyst and received her M.B.A. in Finance from the University of Pittsburgh. |
|
|
|
J. Scott Albrecht
Birth Date: June 1, 1960
VICE PRESIDENT
Began serving: November 1998 | | J. Scott Albrecht has been the Fund's Portfolio Manager since March 1995. He is Vice President of the Trust. Mr. Albrecht joined Federated in 1989. He has been a Senior Portfolio Manager since 1997 and a Vice President of the Fund's Adviser since 1994. He was a Portfolio Manager from 1994 to 1996. Mr. Albrecht is a Chartered Financial Analyst and received his M.S. in Public Management from Carnegie Mellon University. |
|
|
|
Mutual funds are not bank deposits or obligations, are not guaranteed by any bank, and are not insured or guaranteed by the U.S. government, the Federal Deposit Insurance Corporation, the Federal Reserve Board or any other government agency. Investment in mutual funds involves investment risk, including the possible loss of principal.
This report is authorized for distribution to prospective investors only when preceded or accompanied by the fund's prospectus, which contains facts concerning its objective and policies, management fees, expenses and other information.
VOTING PROXIES ON FUND PORTFOLIO SECURITIES
A description of the policies and procedures that the Fund uses to determine how to vote proxies relating to securities held in the Fund's portfolio is available, without charge and upon request, by calling 1-800-341-7400. A report on "Form N-PX" of how the Fund voted any such proxies during the most recent 12-month period ended June 30 is available through Federated's website. Go to http://www.federatedinvestors.com, select "Products," select the "Prospectuses and Regulatory Reports" link, then select the Fund to access the link to Form N-PX. This information is also available from the EDGAR database on the SEC's website at http://www.sec.gov.
QUARTERLY PORTFOLIO SCHEDULE
The Fund files with the SEC a complete schedule of its portfolio holdings, as of the close of the first and third quarters of its fiscal year, on "Form N-Q." These filings are available on the SEC's website at http://www.sec.gov; and may be reviewed and copied at the SEC's Public Reference Room in Washington, DC. (Call 1-800-SEC-0330 for information on the operation of the Public Reference Room.) You may also access this information from the "Products" section of Federated's website at www.federatedinvestors.com by clicking on "Portfolio Holdings" and selecting the name of the Fund, or by selecting the name of the Fund and clicking on "Portfolio Holdings." You must register on the website the first time you wish to access this information.
Federated
World-Class Investment Manager
Federated California Municipal Income Fund
Federated Investors Funds
5800 Corporate Drive
Pittsburgh, PA 15237-7000
www.federatedinvestors.com
Contact us at 1-800-341-7400 or
www.federatedinvestors.com/contact
Federated Securities Corp., Distributor
Cusip 313923104
Cusip 313923203
28991 (10/04)
Federated is a registered mark of Federated Investors, Inc. 2004 (c)Federated Investors, Inc.
Federated
World-Class Investment Manager
Federated Michigan Intermediate Municipal Trust
A Portfolio of Federated Municipal Securities Income Trust
ANNUAL SHAREHOLDER REPORT
August 31, 2004
FINANCIAL HIGHLIGHTS
SHAREHOLDER EXPENSE EXAMPLE
MANAGEMENT'S DISCUSSION OF FUND PERFORMANCE
PORTFOLIO OF INVESTMENTS SUMMARY TABLES
FINANCIAL STATEMENTS
REPORT OF INDEPENDENT REGISTERED PUBLIC ACCOUNTING FIRM
BOARD OF TRUSTEES AND TRUST OFFICERS
VOTING PROXIES ON FUND PORTFOLIO SECURITIES
QUARTERLY PORTFOLIO SCHEDULE
Not FDIC Insured * May Lose Value * No Bank Guarantee
Financial Highlights
(For a Share Outstanding Throughout Each Period)
Year Ended August 31
|
| 2004
|
|
| 2003
|
|
| 2002
|
|
| 2001
|
|
| 2000
|
|
Net Asset Value, Beginning of Period
| | $11.17 | | | $11.22 | | | $11.06 | | | $10.64 | | | $10.62 | |
Income From Investment Operations:
| | | | | | | | | | | | | | | |
Net investment income
| | 0.43 | | | 0.45 | | | 0.50 | 1 | | 0.53 | | | 0.53 | |
Net realized and unrealized gain (loss) on investments, futures contracts and swap contracts
|
| 0.19
|
|
| (0.05
| )
|
| 0.16
| 1
|
| 0.42
|
|
| 0.02
|
|
TOTAL FROM INVESTMENT OPERATIONS
|
| 0.62
|
|
| 0.40
|
|
| 0.66
|
|
| 0.95
|
|
| 0.55
|
|
Less Distributions:
| | | | | | | | | | | | | | | |
Distributions from net investment income
|
| (0.43
| )
|
| (0.45
| )
|
| (0.50
| )
|
| (0.53
| )
|
| (0.53
| )
|
Net Asset Value, End of Period
|
| $11.36
|
|
| $11.17
|
|
| $11.22
|
|
| $11.06
|
|
| $10.64
|
|
Total Return 2
|
| 5.60
| %
|
| 3.58
| %
|
| 6.15
| %
|
| 9.12
| %
|
| 5.39
| %
|
| | | | | | | | | | | | | | | |
Ratios to Average Net Assets:
|
|
|
|
|
|
|
|
|
|
|
|
|
|
|
|
Expenses
|
| 0.50
| %
|
| 0.50
| %
|
| 0.50
| %
|
| 0.50
| %
|
| 0.50
| %
|
Net investment income
|
| 3.76
| %
|
| 3.96
| %
|
| 4.53
| % 1
|
| 4.86
| %
|
| 5.07
| %
|
Expense waiver 3
|
| 0.36
| %
|
| 0.36
| %
|
| 0.39
| %
|
| 0.42
| %
|
| 0.52
| %
|
Supplemental Data:
|
|
|
|
|
|
|
|
|
|
|
|
|
|
|
|
Net assets, end of period (000 omitted)
|
| $164,213
|
|
| $147,959
|
|
| $134,718
|
|
| $107,043
|
|
| $89,177
|
|
Portfolio turnover
|
| 20
| %
|
| 15
| %
|
| 19
| %
|
| 13
| %
|
| 40
| %
|
1 Effective September 1, 2001, the Fund adopted the provisions of the American Institute of Certified Public Accountants (AICPA) Audit and Accounting Guide for Investment Companies and began accreting discount on debt securities. For the year ended August 31, 2002, this change had no effect on the net investment income per share, net realized and unrealized gain (loss) on investments per share, or the ratio of net investment income to average net assets. Per share, ratios and supplemental data for the periods prior to September 1, 2001 have not been restated to reflect this change in presentation.
2 Based on net asset value, which does not reflect the sales charge, redemption fee or contingent deferred sales charge, if applicable. Total returns for periods of less than one year are not annualized.
3 This voluntary expense decrease is reflected in both the expense and the net investment income ratios shown above.
See Notes which are an integral part of the Financial Statements
Shareholder Expense Example
As a shareholder of the Fund, you incur two types of costs: (1) transaction costs, including sales charges (loads) on purchase payments; and (2) ongoing costs, including management fees, shareholder services fees and other Fund expenses. This Example is intended to help you understand your ongoing costs (in dollars) of investing in the Fund and to compare these costs with the ongoing costs of investing in other mutual funds. It is based on an investment of $1,000 invested at the beginning of the period and held for the entire period from March 1, 2004 to August 31, 2004.
ACTUAL EXPENSES
The first section of the table below provides information about actual account values and actual expenses. You may use the information in this section, together with the amount you invested, to estimate the expenses that you incurred over the period. Simply divide your account value by $1,000 (for example, an $8,600 account value divided by $1,000 = 8.6), then multiply the result by the number in the first section under the heading entitled "Expenses Paid During Period" to estimate the expenses attributable to your investment during this period.
HYPOTHETICAL EXAMPLE FOR COMPARISON PURPOSES
The second section of the table below provides information about hypothetical account values and hypothetical expenses based on the Fund's actual expense ratio and an assumed rate of return of 5% per year before expenses, which is not the Fund's actual return. Thus, you should not use the hypothetical account values and expenses to estimate the actual ending account balance or your expenses for the period. Rather, these figures are provided to enable you to compare the ongoing costs of investing in the Fund and other funds. To do so, compare this 5% hypothetical example with the 5% hypothetical examples that appear in the shareholder reports of the other funds.
Please note that the expenses shown in the table are meant to highlight your ongoing costs only and do not reflect any transaction costs, such as sales charges (loads). Therefore, the second section of the table is useful in comparing ongoing costs only, and will not help you determine the relative total costs of owning different funds. In addition, if these transaction costs were included, your costs would have been higher.
|
| Beginning
Account Value
3/1/04
|
| Ending
Account Value
8/31/04
|
| Expenses Paid
During Period 1
|
Actual
|
| $1,000
|
| $ 995.20
|
| $2.51
|
Hypothetical (assuming a 5% return before expenses)
|
| $1,000
|
| $1,022.62
|
| $2.54
|
1 Expenses are equal to the Federated Michigan Intermediate Municipal Trust annualized expense ratio of 0.50% multiplied by the average account value over the period, multiplied by 184/366 (to reflect the one-half year period).
Management's Discussion of Fund Performance
The fund's total return based on net asset value for the 12-month reporting period was 5.60%, consisting of 3.90% of tax-exempt dividends, and 1.70% appreciation in the net asset value of the shares. 1 The total return of the Lehman Brothers 7-Year General Obligation Municipal Bond Index, the fund's benchmark index (LB7GO), was 6.31% during the 12-month reporting period. 2
The fund's investment strategy focused on: (a) the selection of higher-rated, investment-grade quality securities; 3 (b) the selection of bonds with maturities between 4 to 12 years, which typically yield more than short-term bonds on an upward sloping yield curve (the "yield curve" shows the relative yield of similar securities with different maturities); and (c) the allocation of the portfolio to bonds with premium coupons (interest payments that are higher than current yields available in the market) and among securities with similar issuers (referred to as "sectors"). The fund's strategy also focused on the effective duration of the fund's portfolio (which indicates the portfolio sensitivity to changes in interest rates). In addition, the fund's total return reflected actual cash flows, transaction cost and other expenses, which were not reflected in the total return of the LB7GO.
1 Performance data quoted represents past performance which is no guarantee of future results. Investment return and principal value will fluctuate so that an investor's shares, when redeemed, may be worth more or less than their original cost. Mutual fund performance changes over time and current performance may be lower or higher than what is stated. For current to the most recent month end performance, visit www.federatedinvestors.com or call 1-800-341-7400.
Income may be subject to the federal alternative minimum tax.
2 The LB7GO is an unmanaged index of municipal bonds, issued after January 1, 1991, with a minimum credit rating of at least Baa, which have been issued as part of a transaction of at least $50 million, have a maturity value of at least $5 million and a maturity range of six to eight years. The LB7GO also includes zero coupon bonds and bonds subject to the federal alternative minimum tax. The LB7GO is not adjusted to reflect sales charges, expenses, or other fees that the Securities and Exchange Commission (SEC) requires to be reflected in the fund's performance. Indexes are unmanaged, and unlike the Fund, are not affected by cashflows. It is not possible to invest directly in an index.
3 Investment-grade securities are securities that are rated at least "BBB" or unrated securities of a comparable quality. Credit ratings are an indication of the risk that a security will default. They do not protect a security from credit risk. Lower-rated bonds typically offer higher yields to help compensate investors for the increased risk associated with them. Among these risks are lower creditworthiness, greater price volatility, more risk to principal and income than with higher-rated securities and increased possibilities of default.
CREDIT QUALITY
Credit spreads, or the yield difference between the "AAA"-rated municipal bonds and bonds of lower credit quality and similar maturity, tightened during the reporting period (meaning that the yield on lower-rated, investment-grade debt improved to a greater extent, or declined to a lesser extent, than for higher-rated, investment-grade debt). Municipal Market Data (MMD) reported that, during the reporting period, spreads between "BBB"-rated general obligation bonds and "AAA"-rated general obligation bonds tightened by 16 basis points to 28 basis points. Despite a downgrade in the state of Michigan's credit rating during the reporting period, MMD reported that spreads on Michigan general obligation bonds tightened by 2 basis points to 4 basis points, which appears to have occurred primarily because of a 14% decline in the supply of new Michigan bond issuances for the reporting period when compared to the prior 12-month reporting period. The fund's concentration in higher-rated, investment-grade bonds with maturities from 4 to 12 years benefited the fund's performance because these securities performed well as interest rates fell during the reporting period.
YIELD CURVE AND MATURITY
During the reporting period, the municipal bond market was characterized by a generally falling and flattening, although still upward sloping, yield curve. MMD reported that, during the reporting period, rates on "AAA"-rated general obligation bonds with maturities of 4 years or less rose by 2 basis points to 43 basis points, while similar bonds with maturities of 5 years and longer saw yields fall by up to 50 basis points. The overall effect, when coupled with tightening credit spreads, was that longer-maturity (five or more years), lower-rated bonds tended to outperform shorter-maturity (less than five years), higher-rated bonds. The fund's performance, therefore, benefited from its concentration in municipal bonds with maturities of 4 to 12 years.
COUPON AND SECURITY SELECTION
During the reporting period, the fund also concentrated its portfolio purchases and holdings on premium coupon municipal bonds (municipal bonds with coupons or interest payments that were higher than then-current yields available in the market). The higher coupons on the fund's premium coupon municipal bond holdings made the fund less sensitive to interest rate changes, and helped the fund's performance as interest rates declined over a significant portion of the reporting period. The fund's performance also was benefited by its holdings in the hospital, housing and industrial development bond sectors, all of which benefited from the tightening of credit spreads. The fund's performance also benefited, although to a lesser extent, by the performance of its holdings in the insured bond, water and sewer revenue bond, and general obligation bond sectors. During the reporting period, several of the fund's portfolio holdings were prerefunded, which also contributed to the fund's performance.
DURATION 4
The fund's dollar-weighted average duration at the end of the reporting period was 4.02 years. Duration management is a significant component of the fund's investment strategy. As interest rates were expected to rise during the reporting period, the fund hedged the portfolio (adjusted the duration shorter) using forward settling municipal interest rate swaps and Treasury futures contracts. The fund's use of these instruments, however, hurt the fund's performance relative to the LB7GO because these instruments did not perform as well given that longer-term and intermediate-term municipal interest rates declined over the reporting period.
4 Duration is a measure of a security's price sensitivity to changes in interest rates. Securities with longer durations are more sensitive to changes in interest rates than securities with shorter durations.
GROWTH OF A $10,000 INVESTMENT
The graph below illustrates the hypothetical investment of $10,000 1 in the Federated Michigan Intermediate Municipal Trust (the "Fund") from August 31, 1994 to August 31, 2004, compared to the Lehman Brothers 7-Year General Obligations Municipal Bond Index (LB7GO) and the Lehman Brothers Municipal Bond Index (LBMB). 2
Average Annual Total Return 3 for the Period Ended 8/31/2004
|
|
|
1 Year
|
| 2.40%
|
5 Years
|
| 5.31%
|
10 Years
|
| 5.22%
|
Performance data quoted represents past performance which is no guarantee of future results. Returns shown do not reflect the deduction of taxes that a shareholder would pay on Fund distributions or the redemption of Fund shares. For after-tax returns, visit www.federatedinvestors.com. Investment return and principal value will fluctuate so that an investor's shares, when redeemed, may be worth more or less than their original cost. Mutual fund performance changes over time and current performance may be lower or higher than what is stated. Mutual funds are not obligations of or guaranteed by any bank and are not federally insured.
1 Represents a hypothetical investment of $10,000 in the Fund after deducting the maximum sales charge of 3.00% ($10,000 investment minus $300 sales charge = $9,700). The Fund's performance assumes the reinvestment of all dividends and distributions. The LB7GO and the LBMB have been adjusted to reflect reinvestment of dividends on securities in the indexes.
2 The LB7GO and the LBMB are not adjusted to reflect sales charges, expenses, or other fees that the Securities and Exchange Commission requires to be reflected in the Fund's performance. These indexes are unmanaged, and, unlike the Fund, are not affected by cashflows. It is not possible to invest directly in an index.
3 Total return quoted reflects all applicable sales charges and contingent deferred sales charges.
Portfolio of Investments Summary Tables
At August 31, 2004, the fund's credit quality ratings composition 1 was as follows:
S&P Long-Term Ratings as
Percentage of Total Investments 2
| | Moody's Long-Term Ratings as
Percentage of Total Investments 2
|
AAA
|
| 50.1%
| | Aaa
|
| 51.2%
|
AA
|
| 41.9%
| | Aa
|
| 37.1%
|
A
|
| 4.2%
| | A
|
| 4.7%
|
BBB
|
| 1.7%
| | Baa
|
| 2.0%
|
BB
|
| 0.0%
| | Ba
|
| 0.0%
|
B
|
| 0.0%
| | B
|
| 0.0%
|
Not rated by S&P
|
| 2.1%
| | Not rated by Moody's
|
| 5.0%
|
TOTAL
|
| 100.0%
| | TOTAL
|
| 100.0%
|
1 These tables depict the long-term credit quality ratings assigned to the fund's portfolio holdings by Standard & Poor's and Moody's Investors Service, each of which is a Nationally Recognized Statistical Rating Organization (NRSRO). These credit-quality ratings are shown without regard to gradations within a given rating category. For example, securities rated "A-" have been included in the "A" rated category. Holdings that are rated only by a different NRSRO than the one identified have been included in the "Not rated by..." category. Rated securities that have been prerefunded, but not rated again by the NRSRO, also have been included in the "Not rated by..." category. Rated securities include a security with an obligor and/or credit enhancer that has received a rating from an NRSRO with respect to a class of debt obligations that is comparable in priority and security with the security held by the fund. Credit quality ratings are an assessment of the risk that a security will default in payment and do not address other risks presented by the security. Please see the description of credit quality ratings in the fund's Statement of Additional Information.
Each table depicts the long-term credit quality ratings as assigned only by the NRSRO identified in the table. Of the portfolio's total investments, 0.0% is not rated by either of these NRSROs.
2 Percentages are based on total investments, which may differ from total net assets.
Portfolio of Investments
August 31, 2004
Principal
Amount
|
|
|
| Credit
Rating
| 1
|
| Value
|
| | | LONG-TERM MUNICIPALS--98.4% | | | | | |
| | | Michigan--98.4% | | | | | |
| $ | 500,000 | | Anchor Bay, MI, School District, Refunding UT GO Bonds (Series III), 5.50% (Q-SBLF GTD), 5/1/2014
| | AA+/Aa1 | | $ | 567,785 |
| 1,000,000 | | Anchor Bay, MI, School District, Refunding UT GO Bonds (Series III), 5.50% (Q-SBLF GTD), 5/1/2017
| | AA+/Aa1 | | | 1,126,250 |
| 500,000 | | Anchor Bay, MI, School District, School Building & Site UT GO Bonds, 5.00% (Q-SBLF GTD), 5/1/2012
| | AA+/Aa1 | | | 555,890 |
| 1,070,000 | | Anchor Bay, MI, School District, UT GO Bonds (Series 1999I), 5.75% (U.S. Treasury PRF 5/1/2009 @ 100)/(Original Issue Yield: 5.80%), 5/1/2014
| | AAA/Aaa | | | 1,214,407 |
| 500,000 | | Ann Arbor, MI, Public School District, Refunding UT GO Bonds, 5.00% (Q-SBLF GTD), 5/1/2011
| | AA+/Aa1 | | | 554,735 |
| 500,000 | | Ann Arbor, MI, Water Supply System, Refunding Revenue Bonds (Series Y), 5.00% (MBIA Insurance Corp. INS), 2/1/2010
| | AAA/Aaa | | | 553,195 |
| 600,000 | | Avondale, MI, School District, School Building & Site UT GO Bonds, 5.00% (Q-SBLF GTD), 5/1/2009
| | AA+/Aa1 | | | 659,970 |
| 500,000 | | Avondale, MI, School District, School Building & Site UT GO Bonds, 5.00% (Q-SBLF GTD), 5/1/2010
| | AA+/Aa1 | | | 553,520 |
| 1,090,000 | | Boyne City, MI, Public School District, UT GO Bonds, 5.60% (FGIC INS)/(Original Issue Yield: 5.70%), 5/1/2014
| | AAA/Aaa | | | 1,217,792 |
| 1,215,000 | | Bridgeport Spaulding, MI, Community School District, UT GO Bonds, 5.50% (Q-SBLF GTD), 5/1/2015
| | AA+/Aa1 | | | 1,372,743 |
| 1,125,000 | | Brighton Township, MI, LT GO Sanitary Sewer Drainage District, 5.25% (FSA INS)/(Original Issue Yield: 5.68%), 10/1/2020
| | AAA/Aaa | | | 1,208,160 |
| 2,050,000 | | Caledonia, MI, Community Schools, UT GO Bonds, 5.40% (Q-SBLF GTD)/(Original Issue Yield: 5.48%), 5/1/2018
| | AA+/Aa1 | | | 2,260,166 |
| 1,775,000 | | Charles Stewart Mott Community College, MI, Building & Improvement UT GO Bonds, 5.50% (FGIC INS)/(Original Issue Yield: 5.63%), 5/1/2018
| | AAA/Aaa | | | 1,971,847 |
| 1,070,000 | | Charlevoix, MI, Public School District, Refunding UT GO Bonds, 5.25% (Q-SBLF GTD), 5/1/2014
| | AA+/Aa1 | | | 1,192,611 |
| 1,245,000 | | Charlevoix, MI, Public School District, Refunding UT GO Bonds, 5.25% (Q-SBLF GTD), 5/1/2016
| | AA+/Aa1 | | | 1,372,202 |
| 1,690,000 | | Chippewa Valley, MI, Schools, Refunding UT GO Bonds, 5.00% (Q-SBLF GTD), 5/1/2009
| | AA+/Aa1 | | | 1,858,915 |
| 1,775,000 | | Chippewa Valley, MI, Schools, School Building & Site Refunding Bonds, 5.50% (Q-SBLF GTD), 5/1/2015
| | AA+/Aa1 | | | 2,005,448 |
| 1,000,000 | | Cornell Township MI, Economic Development Corp., Refunding Revenue Bonds, 5.875% (MeadWestvaco Corp.), 5/1/2018
| | BBB/Baa2 | | | 1,042,150 |
| 1,070,000 | | Detroit, MI, Building Authority, Parking & Arena System Revenue Bonds (Series 1998A), 5.25% (MBIA Insurance Corp. INS), 7/1/2008
| | AAA/Aaa | | | 1,179,568 |
Principal
Amount
|
|
|
| Credit
Rating
| 1
|
| Value
|
| | | LONG-TERM MUNICIPALS--continued | | | | | |
| | | Michigan--continued | | | | | |
| $ | 2,665,000 | | Detroit, MI, City School District, UT GO Bonds (Series 2001A), 5.50% (Q-SBLF GTD), 5/1/2009
| | AA+/Aa1 | | $ | 2,989,384 |
| 1,000,000 | | Detroit, MI, Sewage Disposal System, Senior Lien Refunding Revenue Bonds (Series 2003A), 5.00% (FSA INS), 7/1/2009
| | AAA/Aaa | | | 1,100,910 |
| 1,000,000 | | Detroit, MI, Convention Facility Special Tax Refunding Revenue Bonds (Series 2003), 5.00% (Cobo Hall Project)/(MBIA Insurance Corp. INS), 9/30/2009
| | AAA/Aaa | | | 1,099,860 |
| 1,335,000 | | Detroit, MI, Refunding UT GO Bonds, 5.75% (FSA INS), 4/1/2010
| | AAA/Aaa | | | 1,502,676 |
| 1,000,000 | | Detroit, MI, UT GO Bonds (Series 1999A), 5.00% (FSA INS)/ (Original Issue Yield: 5.16%), 4/1/2019
| | AAA/Aaa | | | 1,059,600 |
| 1,000,000 | | Detroit, MI, UT GO Bonds (Series 2001A-1), 5.375% (MBIA Insurance Corp. INS), 4/1/2017
| | AAA/Aaa | | | 1,112,130 |
| 1,000,000 | | Detroit/Wayne County, MI, Stadium Authority, Revenue Bonds, 5.25% (FGIC INS)/(Original Issue Yield: 5.55%), 2/1/2011
| | AAA/Aaa | | | 1,090,380 |
| 1,000,000 | | Dickinson County, MI, EDC, Refunding Environmental Improvement Revenue Bonds (Series 2002A), 5.75% (International Paper Co.), 6/1/2016
| | BBB/Baa2 | | | 1,072,830 |
| 1,925,000 | | East Grand Rapids, MI, Public School District, Refunding UT GO Bonds (Series 2001), 5.50% (Q-SBLF GTD), 5/1/2019
| | AA+/Aa1 | | | 2,150,841 |
| 1,000,000 | | Ecorse, MI, Public School District, UT GO Bonds, 5.50% (Q-SBLF GTD)/(FGIC INS)/(Original Issue Yield: 5.59%), 5/1/2017
| | AAA/Aaa | | | 1,098,850 |
| 2,160,000 | | Ferndale, MI, School District, Refunding UT GO Bonds, 5.25% (Q-SBLF GTD), 5/1/2016
| | AA+/Aa1 | | | 2,380,687 |
| 1,120,000 | | Ferndale, MI, Refunding UT GO Bonds, 4.50% (FGIC INS), 4/1/2008
| | AAA/Aaa | | | 1,200,472 |
| 1,000,000 | | Forest Hills, MI, Public School, Refunding UT GO Bonds, 5.00%, 5/1/2012
| | AA/Aa2 | | | 1,113,210 |
| 2,000,000 | | Forest Hills, MI, Public School, UT GO Bonds, 5.25% (Original Issue Yield: 5.50%), 5/1/2019
| | NR/Aa2 | | | 2,180,320 |
| 1,075,000 | | Gibraltar, MI, School District, School Building & Site UT GO Bonds, 5.00% (Q-SBLF GTD)(FGIC INS), 5/1/2012
| | AAA/Aaa | | | 1,196,701 |
| 1,600,000 | | Grand Blanc, MI, Community Schools, School Building & Site UT GO Bonds, 5.00% (Q-SBLF GTD)(FSA INS), 5/1/2009
| | AAA/Aaa | | | 1,761,392 |
| 1,000,000 | | Harper Creek, MI, Community School District, UT GO Bonds, 5.125% (Q-SBLF GTD)/(Original Issue Yield: 5.21%), 5/1/2021
| | AA+/Aa1 | | | 1,064,190 |
| 1,000,000 | | Hartland, MI, Consolidated School District, Refunding UT GO Bonds, 5.375% (Q-SBLF GTD), 5/1/2016
| | AA+/Aa1 | | | 1,108,070 |
| 1,650,000 | | Hartland, MI, Consolidated School District, UT GO Bonds, 5.75% (Q-SBLF GTD), 5/1/2010
| | AA+/Aa1 | | | 1,890,784 |
| 1,315,000 | | Hazel Park, MI, School District, UT GO Bonds, 5.00% (Q-SBLF GTD), 5/1/2013
| | AA+/Aa1 | | | 1,446,382 |
| 1,660,000 | | Hemlock, MI, Public School District, UT GO Bonds, 5.50% (Q-SBLF GTD), 5/1/2018
| | AA+/Aa1 | | | 1,862,703 |
| 1,375,000 | | Howell, MI, Public Schools, Refunding UT GO Bonds (Series 2001), 5.25% (Q-SBLF GTD), 5/1/2014
| | AA+/Aa1 | | | 1,532,382 |
Principal
Amount
|
|
|
| Credit
Rating
| 1
|
| Value
|
| | | LONG-TERM MUNICIPALS--continued | | | | | |
| | | Michigan--continued | | | | | |
| $ | 2,000,000 | | Howell, MI, Public Schools, UT GO Bonds, 5.875% (U.S. Treasury PRF 5/1/2009 @ 100)/(Original Issue Yield: 5.95%), 5/1/2022
| | AAA/Aaa | | $ | 2,280,820 |
| 2,000,000 | | Jackson County, MI, Public Schools, UT GO Bonds, 5.60% (Q-SBLF GTD)/(FGIC INS)/(Original Issue Yield: 5.70%), 5/1/2019
| | AAA/Aaa | | | 2,232,040 |
| 1,350,000 | | Kalamazoo, MI, City School District, Building & Site UT GO Bonds, 5.00% (FSA INS), 5/1/2013
| | AAA/Aaa | | | 1,480,099 |
| 1,000,000 | | Kent Hospital Finance Authority, MI, Revenue Bonds, 5.50% (Spectrum Health), 1/15/2015
| | AA/Aa3 | | | 1,091,560 |
| 1,925,000 | | Lake Fenton, MI, Community Schools, UT GO Bonds, 5.50% (Q-SBLF GTD), 5/1/2017
| | AA+/Aa1 | | | 2,168,031 |
| 1,700,000 | | Lake Superior State University, MI, General Revenue Bonds, 5.50% (AMBAC INS), 11/15/2021
| | AAA/Aaa | | | 1,886,898 |
| 1,500,000 | | Lakeshore, MI, Public Schools, UT GO Bonds, 5.70% (U.S. Treasury PRF 5/1/2005 @ 101)/(Original Issue Yield: 5.92%), 5/1/2022
| | AAA/Aaa | | | 1,557,390 |
| 1,000,000 | | Lanse Creuse, MI, Public Schools, UT GO Bonds (Series 2000), 5.40% (Q-SBLF GTD)/(FGIC INS)/(Original Issue Yield: 5.50%), 5/1/2016
| | AAA/Aaa | | | 1,104,040 |
| 500,000 | | Lansing, MI, Sewer Disposal System, Refunding Revenue Bonds, 5.00% (FGIC INS), 5/1/2011
| | AAA/Aaa | | | 555,370 |
| 1,000,000 | | Madison, MI, District Public Schools, Refunding UT GO Bonds, 5.50% (Q-SBLF GTD)/(FGIC INS), 5/1/2015
| | AAA/Aaa | | | 1,105,270 |
| 1,000,000 | | Marquette, MI, Hospital Finance Authority, Hospital Revenue Refunding Bonds (1996 Series D), 5.30% (Marquette General Hospital, MI,)/(FSA INS), 4/1/2005
| | AAA/Aaa | | | 1,022,450 |
| 2,000,000 | | Mattawan, MI, Consolidated School District, UT GO Bonds, 5.65% (Q-SBLF GTD)/(FSA INS)/(Original Issue Yield: 5.67%), 5/1/2018
| | AAA/Aaa | | | 2,238,040 |
| 1,350,000 | | Michigan Higher Education Student Loan Authority, Student Loan Revenue Bonds, (Series XVII-A), 5.65% (AMBAC INS), 6/1/2010
| | AAA/Aaa | | | 1,416,784 |
| 1,500,000 | | Michigan Municipal Bond Authority, Refunding Revenue Bonds (Series 2002), 5.25% (Clean Water Revolving Fund), 10/1/2008
| | AAA/Aaa | | | 1,662,525 |
| 1,000,000 | | Michigan Municipal Bond Authority, Revenue Bonds (Series 2003C), 5.00% (Local Government Loan Program), 5/1/2008
| | AA+/Aa1 | | | 1,089,900 |
| 1,200,000 | | Michigan Municipal Bond Authority, Revenue Bonds, 5.25% (Clean Water Revolving Fund), 10/1/2009
| | AAA/Aaa | | | 1,342,296 |
| 1,000,000 | | Michigan Municipal Bond Authority, Revenue Bonds, 5.75% (Clean Water Revolving Fund), 10/1/2015
| | AAA/Aaa | | | 1,153,440 |
| 1,455,000 | | Michigan Municipal Bond Authority, Revenue Bonds, 5.25% (Drinking Water Revolving Fund), 10/1/2007
| | AAA/Aaa | | | 1,592,265 |
| 2,190,000 | | Michigan Municipal Bond Authority, Revenue Bonds, 5.625% (Drinking Water Revolving Fund), 10/1/2013
| | AAA/Aaa | | | 2,513,113 |
| 2,500,000 | | Michigan Public Power Agency, Belle River Project Refunding Revenue Bonds (Series 2002A), 5.25% (MBIA Insurance Corp. INS), 1/1/2010
| | AAA/Aaa | | | 2,791,550 |
Principal
Amount
|
|
|
| Credit
Rating
| 1
|
| Value
|
| | | LONG-TERM MUNICIPALS--continued | | | | | |
| | | Michigan--continued | | | | | |
| $ | 1,000,000 | | Michigan State Building Authority, Facilities Program Refunding Revenue Bonds (Series 2001I), 5.50%, 10/15/2019
| | AA/Aa2 | | $ | 1,121,860 |
| 1,000,000 | | Michigan State Building Authority, Revenue Bonds, 5.00% (State Police Communication System)/(MBIA Insurance Corp. INS), 10/1/2008
| | AAA/Aaa | | | 1,097,060 |
| 1,000,000 | | Michigan State Building Authority, State Police Communications Revenue Bonds, 5.50% (Escrowed to maturity U.S. Treasury COL), 10/1/2008
| | AA/Aa3 | | | 1,118,840 |
| 2,270,000 | | Michigan State Building Authority, State Police Communications Revenue Bonds, 5.50% (Escrowed to maturity U.S. Treasury COL), 10/1/2008
| | AA/Aa3 | | | 2,539,767 |
| 1,000,000 | | Michigan State Comprehensive Transportation Board, Revenue Bonds (Series 2002B), 5.00% (FSA INS), 5/15/2008
| | AAA/Aaa | | | 1,091,440 |
| 1,500,000 | | Michigan State Hospital Finance Authority, Hospital Refunding Revenue Bonds (Series 2003A), 5.50% (Henry Ford Health System, MI), 3/1/2013
| | A-/A1 | | | 1,648,530 |
| 1,000,000 | | Michigan State Hospital Finance Authority, Hospital Refunding Revenue Bonds, 5.75% (Sparrow Obligated Group, MI), 11/15/2016
| | A/A1 | | | 1,088,860 |
| 1,000,000 | | Michigan State Hospital Finance Authority, Refunding Revenue Bonds (Series 1998A), 4.90% (St. John Hospital, MI)/(AMBAC INS)/(Original Issue Yield: 5.05%), 5/15/2013
| | AAA /Aaa | | | 1,083,890 |
| 1,300,000 | | Michigan State Hospital Finance Authority, Refunding Revenue Bonds (Series 2002A), 5.50% (Crittenton Hospital, MI), 3/1/2016
| | A+/A2 | | | 1,400,321 |
| 1,175,000 | | Michigan State Hospital Finance Authority, Refunding Revenue Bonds (Series A), 6.00% (Trinity Healthcare Credit Group)/ (Original Issue Yield: 6.14%), 12/1/2020
| | AA-/Aa3 | | | 1,299,856 |
| 1,000,000 | | Michigan State Hospital Finance Authority, Revenue & Refunding Bonds (Series 1998A), 5.10% (McLaren Health Care Corp.)/(Original Issue Yield: 5.15%), 6/1/2013
| | NR/A1 | | | 1,045,160 |
| 2,000,000 | | Michigan State Hospital Finance Authority, Revenue Bonds (Series 1993P), 5.375% (Sisters of Mercy Health System)/(MBIA Insurance Corp. INS)/(Original Issue Yield: 5.55%), 8/15/2014
| | AAA/Aaa | | | 2,254,440 |
| 1,325,000 | | Michigan State Hospital Finance Authority, Revenue Bonds (Series 1997W), 5.00% (Mercy Health Services)/ (Escrowed to maturity U.S. Treasury COL)/(Original Issue Yield: 5.26%), 8/15/2011
| | NR/Aa2 | | | 1,443,468 |
| 2,000,000 | | Michigan State Hospital Finance Authority, Revenue Bonds (Series 1999A), 6.00% (Ascension Health Credit Group)/(MBIA Insurance Corp. INS), 11/15/2011
| | AAA/Aaa | | | 2,263,140 |
| 1,500,000 | | Michigan State Hospital Finance Authority, Revenue Bonds, 5.00% (Oakwood Obligated Group), 11/1/2010
| | A/A2 | | | 1,615,740 |
| 565,000 | | Michigan State Housing Development Authority, LO Multifamily Housing Revenue Refunding Bonds (Series 2000A), 6.30% (Oakbrook Villa Townhomes)/(GNMA GTD), 7/20/2019
| | NR/Aaa | | | 610,737 |
Principal
Amount
|
|
|
| Credit
Rating
| 1
|
| Value
|
| | | LONG-TERM MUNICIPALS--continued | | | | | |
| | | Michigan--continued | | | | | |
| $ | 1,000,000 | | Michigan State Housing Development Authority, Revenue Bonds (Series E), 5.55%, 12/1/2007
| | AA+/NR | | $ | 1,032,660 |
| 1,000,000 | | Michigan State Housing Development Authority, SFM Revenue Bonds (Series 2001A), 5.30% (MBIA Insurance Corp. INS), 12/1/2016
| | AAA/Aaa | | | 1,057,760 |
| 250,000 | | Michigan State Strategic Fund, LT Obligation Revenue Refunding Bonds (Series A), 7.10% (Ford Motor Co.)/(Original Issue Yield: 7.127%), 2/1/2006
| | BBB-/Baa1 | | | 265,765 |
| 820,000 | | Michigan State Strategic Fund, Revenue Bonds (Series 2004), 5.00% (NSF International), 8/1/2013
| | A-/NR | | | 883,517 |
| 175,000 | | Michigan State Strategic Fund, Revenue Bonds, 5.30% (Porter Hills Presbyterian Village, Inc.)/(Original Issue Yield: 5.422%), 7/1/2018
| | BBB+/NR | | | 177,968 |
| 325,000 | | Michigan State Strategic Fund, Revenue Bonds, 5.30% (Porter Hills Presbyterian Village, Inc.)/(U.S. Treasury PRF 7/1/2008 @ 101)/(Original Issue Yield: 5.422%), 7/1/2018
| | BBB+/NR | | | 361,959 |
| 950,000 | | Michigan State Trunk Line, Refunding Revenue Bonds (Series 1998A), 5.25%, 11/1/2012
| | AA/Aa3 | | | 1,076,607 |
| 1,000,000 | | Michigan State Trunk Line, Refunding Revenue Bonds, 5.25% (FSA INS), 11/1/2012
| | AAA/Aaa | | | 1,133,270 |
| 1,000,000 | | Michigan State Trunk Line, Refunding Revenue Bonds, 5.25% (FSA INS), 11/1/2013
| | AAA/Aaa | | | 1,134,320 |
| 1,000,000 | | Michigan State Trunk Line, Revenue Bonds (Series 2001A), 5.50% (FSA INS), 11/1/2018
| | AAA/Aaa | | | 1,146,760 |
| 1,000,000 | | Michigan State, Refunding UT GO Bonds, 5.00%, 12/1/2008
| | AA+/Aa1 | | | 1,101,060 |
| 3,000,000 | | Michigan State, Refunding UT GO Bonds, 5.00%, 12/1/2007
| | AA+/Aa1 | | | 3,269,370 |
| 1,250,000 | | Milan, MI, Area Schools, UT GO Bonds (Series 2000A), 5.75% (U.S. Treasury PRF 5/1/2010 @ 100)/(Original Issue Yield: 5.86%), 5/1/2020
| | AAA/Aaa | | | 1,435,925 |
| 4,250,000 | | Monroe County, MI, PCA, PCR Revenue Bonds (Series A), 6.35% (Detroit Edison Co.)/(AMBAC INS), 12/1/2004
| | AAA/Aaa | | | 4,301,170 |
| 1,200,000 | | Newaygo, MI, Public Schools, UT GO Bonds, 5.50% (Q-SBLF GTD), 5/1/2014
| | AA+/Aa1 | | | 1,348,236 |
| 1,765,000 | | Oakland County, MI, EDC, LO Revenue Bonds (Series 1997), 5.50% (Lutheran Social Services of Michigan)/(U.S. Treasury PRF 6/1/2007 @ 102), 6/1/2014
| | NR/Aa3 | | | 1,961,586 |
| 1,130,000 | | Oakland University, MI, Revenue Bonds, 5.75% (MBIA Insurance Corp. INS)/(Original Issue Yield: 5.835%), 5/15/2015
| | AAA/Aaa | | | 1,183,765 |
| 1,250,000 | | Orchard View, MI, Schools, School Building & Site Bonds (Series 2003), 5.00% (Q-SBLF GTD), 5/1/2010
| | AA+/Aa1 | | | 1,383,800 |
| 1,000,000 | | Paw, MI, Public School District, School Building & Site UT GO Bonds, 5.50% (Q-SBLF GTD)/(Original Issue Yield: 5.60%), 5/1/2020
| | AA+/Aa1 | | | 1,135,760 |
| 1,625,000 | | River Rouge, MI, School District, Refunding UT GO Bonds, 5.00% (Q-SBLF GTD)/(FGIC INS), 5/1/2009
| | AAA/Aaa | | | 1,788,914 |
Principal
Amount
|
|
|
| Credit
Rating
| 1
|
| Value
|
| | | LONG-TERM MUNICIPALS--continued | | | | | |
| | | Michigan--continued | | | | | |
| $ | 1,155,000 | | Romeo, MI, Community School District, Building & Site UT GO Bonds, 5.00% (Q-SBLF GTD)/(Original Issue Yield: 5.12%), 5/1/2012
| | AA+/Aa1 | | $ | 1,263,166 |
| 1,170,000 | | Romulus, MI, Community Schools, UT GO Bonds, 6.00% (Q-SBLF GTD) (U.S. Treasury PRF 5/1/2009 @ 100), 5/1/2011
| | AAA/Aaa | | | 1,340,668 |
| 1,000,000 | | Saginaw, MI, Hospital Finance Authority, Hospital Revenue Refunding Bonds (Series 2004G), 5.00% (Covenant Medical Center, Inc.), 7/1/2017
| | A/NR | | | 1,038,510 |
| 1,500,000 | | Saginaw, MI, Hospital Finance Authority, Refunding Revenue Bonds (Series 1999E), 5.625% (Covenant Medical Center, Inc.)/(MBIA Insurance Corp. INS), 7/1/2013
| | AAA/Aaa | | | 1,680,570 |
| 2,000,000 | | Saline, MI, Area Schools, UT GO Bonds (Series 2000A), 5.75% (U.S. Treasury PRF 5/1/2010 @ 100), 5/1/2018
| | AA+/Aa1 | | | 2,297,480 |
| 1,000,000 | | Sault Ste Marie, MI, Area Public Schools, UT GO Bonds, 5.375% (Q-SBLF GTD)/(FGIC INS)/(Original Issue Yield: 5.65%), 5/1/2019
| | AAA/Aaa | | | 1,089,430 |
| 675,000 | | South Lyon, MI, Community School District, UT GO Bonds, (Series A), 5.75% (Q-SBLF GTD)/(Original Issue Yield: 5.85%), 5/1/2019
| | AA+/Aa1 | | | 759,247 |
| 1,675,000 | | Southfield, MI, Public Schools, UT GO School Building and Site Bonds (Series B), 5.00% (Q-SBLF GTD)(FSA INS), 5/1/2012
| | AAA/Aaa | | | 1,864,627 |
| 1,000,000 | | Utica, MI, Community Schools, UT GO School Building & Site Refunding Bonds, 5.50% (Q-SBLF GTD), 5/1/2016
| | AA+/Aa1 | | | 1,126,250 |
| 500,000 | | Walled Lake, MI, Consolidated School District, School Building & Site UT GO Bonds, 5.00% (Q-SBLF GTD)(MBIA Insurance Corp. INS), 5/1/2012
| | AAA/Aaa | | | 556,605 |
| 1,000,000 | | Waverly, MI, Community Schools, School Building and Site UT GO Bonds (Series 2000), 5.75% (FGIC INS), 5/1/2015
| | AAA/Aaa | | | 1,129,770 |
| 1,000,000 | | Wayne County, MI, Building Authority, LT GO Capital Improvement Bonds, 5.35% (MBIA Insurance Corp. INS)/ (Original Issue Yield: 5.40%), 6/1/2009
| | AAA/Aaa | | | 1,077,350 |
| 1,775,000 | | West Bloomfield, MI, School District, Refunding UT GO Bonds, 5.50% (MBIA Insurance Corp. INS), 5/1/2015
| | AAA/Aaa | | | 1,991,089 |
| 1,000,000 | | West Branch Rose City, MI, Area School District, UT GO Bonds, 5.50% (Q-SBLF GTD)/(FGIC INS)/(Original Issue Yield: 5.60%), 5/1/2017
| | AAA/Aaa | | | 1,100,240 |
| 600,000 | | West Ottawa, MI, Public School District, UT GO Bonds (Series 2002A), 4.00% (Q-SBLF GTD), 5/1/2006
| | AA+/Aa1 | | | 622,362 |
| 800,000 | | West Ottawa, MI, Public School District, UT GO Bonds (Series 2002A), 4.00% (Q-SBLF GTD), 5/1/2007
| | AA+/Aa1 | | | 841,096 |
| 1,025,000 | | Whitehall, MI, District Schools, UT GO Bonds, 5.50% (Q-SBLF GTD), 5/1/2016
| | AA+/Aa1 | | | 1,153,207 |
Principal
Amount
|
|
|
| Credit
Rating
| 1
|
| Value
|
| | | LONG-TERM MUNICIPALS--continued | | | | | |
| | | Michigan--continued | | | | | |
| $ | 1,075,000 | | Whitmore Lake, MI, Public School District, UT GO Bonds, 5.00% (Q-SBLF GTD), 5/1/2009
| | AA+/Aa1 | | $ | 1,182,446 |
| 1,710,000 | | Woodhaven-Brownstown, MI, School District, UT GO Bonds, 5.375% (Q-SBLF GTD), 5/1/2016
|
| AA+/Aa1
|
|
| 1,907,813
|
| | | TOTAL LONG-TERM MUNICIPALS
(IDENTIFIED COST $151,903,273)
|
|
|
|
| 161,691,196
|
| | | SHORT-TERM MUNICIPALS-0.4% | | | | | |
| | | Puerto Rico-0.4% | | | | | |
| 600,000 | | Puerto Rico Government Development Bank (GDB) Weekly VRDNs (MBIA Insurance Corp. INS)/(Credit Suisse First Boston LIQ) (at amortized cost)
|
| AAA/Aaa
|
|
| 600,000
|
| | | TOTAL INVESTMENTS--98.8%
(IDENTIFIED COST $152,503,273) 2
|
|
|
|
| 162,291,196
|
| | | OTHER ASSETS AND LIABILITIES - NET--1.2%
|
|
|
|
| 1,921,972
|
| | | TOTAL NET ASSETS--100%
|
|
|
| $
| 164,213,168
|
Securities subject to the federal alternative minimum tax (AMT) represent 6.1% of the Fund's portfolio as calculated based upon total portfolio market value (percentage is unaudited).
1 Please refer to the Statement of Additional Information for an explanation of the credit ratings. Current credit ratings are unaudited.
2 The cost of investments for federal tax purposes amounts to $152,497,070.
Note: The categories of investments are shown as a percentage of total net assets at August 31, 2004.
The following acronyms are used throughout this portfolio:
| AMBAC | - --American Municipal Bond Assurance Corporation |
| COL | - --Collateralized |
| EDC | - --Economic Development Commission |
| FGIC | - --Financial Guaranty Insurance Company |
| FSA | - --Financial Security Assurance, Inc. |
| GNMA | - --Government National Mortgage Association |
| GO | - --General Obligation |
| GTD | - --Guaranteed |
| INS | - --Insured |
| LIQ | - --Liquidity Agreement |
| LO | - --Limited Obligation |
| LT | - --Limited Tax |
| PCA | - --Pollution Control Authority |
| PCR | - --Pollution Control Revenue |
| PRF | - --Prerefunded |
| Q-SBLF | - --Qualified State Bond Loan Fund |
| SFM | - --Single Family Mortgage |
| UT | - --Unlimited Tax |
| VRDNs | - --Variable Rate Demand Notes |
See Notes which are an integral part of the Financial Statements
Statement of Assets and Liabilities
August 31, 2004
Assets:
| | | | | | | |
Total investments in securities, at value (identified cost $152,503,273)
| | | | | $ | 162,291,196 | |
Cash
| | | | | | 23,530 | |
Income receivable
| | | | | | 2,474,659 | |
Receivable for shares sold
|
|
|
|
|
| 512,913
|
|
TOTAL ASSETS
|
|
|
|
|
| 165,302,298
|
|
Liabilities:
| | | | | | | |
Payable for shares redeemed
| | $ | 716,254 | | | | |
Income distribution payable
| | | 289,155 | | | | |
Payable for daily variation margin
| | | 53,500 | | | | |
Payable for shareholder services fee (Note 5)
| | | 9,704 | | | | |
Accrued expenses
|
|
| 20,517
|
|
|
|
|
TOTAL LIABILITIES
|
|
|
|
|
| 1,089,130
|
|
Net assets for 14,461,214 shares outstanding
|
|
|
|
| $
| 164,213,168
|
|
Net Assets Consist of:
| | | | | | | |
Paid-in capital
| | | | | $ | 156,816,795 | |
Net unrealized appreciation of investments and futures contracts
| | | | | | 9,808,400 | |
Accumulated net realized loss on investments, futures contracts and swap contracts
| | | | | | (2,411,968 | ) |
Distributions in excess of net investment income
|
|
|
|
|
| (59
| )
|
TOTAL NET ASSETS
|
|
|
|
| $
| 164,213,168
|
|
Net Asset Value, Offering Price and Redemption Proceeds Per Share:
| | | | | | | |
Net asset value per share ($164,213,168 ÷ 14,461,214 shares outstanding), no par value, unlimited shares authorized
|
|
|
|
|
| $11.36
|
|
Offering price per share (100/97.00 of $11.36) 1
|
|
|
|
|
| $11.71
|
|
Redemption proceeds per share
|
|
|
|
|
| $11.36
|
|
1 See "What Do Shares Cost?" in the Prospectus.
See Notes which are an integral part of the Financial Statements
Statement of Operations
Year Ended August 31, 2004
Investment Income:
| | | | | | | | | | | | |
Interest
|
|
|
|
|
|
|
|
|
| $
| 6,859,729
|
|
Expenses:
| | | | | | | | | | | | |
Investment adviser fee (Note 5)
| | | | | | $ | 641,552 | | | | | |
Administrative personnel and services fee (Note 5)
| | | | | | | 145,835 | | | | | |
Custodian fees
| | | | | | | 7,402 | | | | | |
Transfer and dividend disbursing agent fees and expenses (Note 5)
| | | | | | | 52,216 | | | | | |
Directors'/Trustees' fees
| | | | | | | 2,810 | | | | | |
Auditing fees
| | | | | | | 15,076 | | | | | |
Legal fees
| | | | | | | 6,830 | | | | | |
Portfolio accounting fees (Note 5)
| | | | | | | 60,191 | | | | | |
Shareholder services fee (Note 5)
| | | | | | | 400,970 | | | | | |
Share registration costs
| | | | | | | 25,542 | | | | | |
Printing and postage
| | | | | | | 19,537 | | | | | |
Insurance premiums
| | | | | | | 8,121 | | | | | |
Miscellaneous
|
|
|
|
|
|
| 3,564
|
|
|
|
|
|
TOTAL EXPENSES
|
|
|
|
|
|
| 1,389,646
|
|
|
|
|
|
Waivers (Note 5):
| | | | | | | | | | | | |
Waiver of investment adviser fee
| | $ | (263,812 | ) | | | | | | | | |
Waiver of administrative personnel and services fee
| | | (19,481 | ) | | | | | | | | |
Waiver of transfer and dividend disbursing agent fees and expenses
| | | (7,856 | ) | | | | | | | | |
Waiver of shareholder services fee
|
|
| (288,698
| )
|
|
|
|
|
|
|
|
|
TOTAL WAIVERS
|
|
|
|
|
|
| (579,847
| )
|
|
|
|
|
Net expenses
|
|
|
|
|
|
|
|
|
|
| 809,799
|
|
Net investment income
|
|
|
|
|
|
|
|
|
|
| 6,049,930
|
|
Realized and Unrealized Gain (Loss) on Investments, Futures Contracts and Swap Contracts:
| | | | | | | | | | | | |
Net realized loss on investments
| | | | | | | | | | | (988,331 | ) |
Net realized loss on futures contracts
| | | | | | | | | | | (544,922 | ) |
Net realized loss on swap contracts
| | | | | | | | | | | (78,137 | ) |
Net change in unrealized appreciation of investments
|
|
|
|
|
|
|
|
|
|
| 3,320,726
|
|
Net realized and unrealized gain on investments, futures contracts and swap contracts
|
|
|
|
|
|
|
|
|
|
| 1,709,336
|
|
Change in net assets resulting from operations
|
|
|
|
|
|
|
|
|
| $
| 7,759,266
|
|
See Notes which are an integral part of the Financial Statements
Statement of Changes in Net Assets
Year Ended August 31
|
|
| 2004
|
|
|
| 2003
|
|
Increase (Decrease) in Net Assets
| | | | | | | | |
Operations:
| | | | | | | | |
Net investment income
| | $ | 6,049,930 | | | $ | 5,759,327 | |
Net realized gain (loss) on investments, futures contracts and swap contracts
| | | (1,611,390 | ) | | | 307,593 | |
Net change in unrealized appreciation/depreciation of investments and futures contracts
|
|
| 3,320,726
|
|
|
| (1,352,960
| )
|
CHANGE IN NET ASSETS RESULTING FROM OPERATIONS
|
|
| 7,759,266
|
|
|
| 4,713,960
|
|
Distributions to Shareholders:
| | | | | | | | |
Distributions from net investment income
|
|
| (6,048,516
| )
|
|
| (5,757,724
| )
|
Share Transactions:
| | | | | | | | |
Proceeds from sale of shares
| | | 49,546,216 | | | | 59,592,314 | |
Net asset value of shares issued to shareholders in payment of distributions declared
| | | 2,705,245 | | | | 2,214,944 | |
Cost of shares redeemed
|
|
| (37,708,370
| )
|
|
| (47,522,583
| )
|
CHANGE IN NET ASSETS RESULTING FROM SHARE TRANSACTIONS
|
|
| 14,543,091
|
|
|
| 14,284,675
|
|
Change in net assets
|
|
| 16,253,841
|
|
|
| 13,240,911
|
|
Net Assets:
| | | | | | | | |
Beginning of period
|
|
| 147,959,327
|
|
|
| 134,718,416
|
|
End of period (including distributions in excess of net investment income of $(59) and $(25), respectively)
|
| $
| 164,213,168
|
|
| $
| 147,959,327
|
|
See Notes which are an integral part of the Financial Statements
Notes to Financial Statements
August 31, 2004
1. ORGANIZATION
Federated Municipal Securities Income Trust (the "Trust") is registered under the Investment Company Act of 1940, as amended (the "Act"), as an open-end, management investment company. The Trust consists of seven portfolios. The financial statements included herein are only those of Federated Michigan Intermediate Municipal Trust (the "Fund"), a non-diversified portfolio. The financial statements of the other portfolios are presented separately. The assets of each portfolio are segregated and a shareholder's interest is limited to the portfolio in which shares are held. The investment objective of the Fund is to provide current income exempt from federal regular income tax and the personal income taxes imposed by the state of Michigan and Michigan municipalities.
2. SIGNIFICANT ACCOUNTING POLICIES
The following is a summary of significant accounting policies consistently followed by the Fund in the preparation of its financial statements. These policies are in conformity with generally accepted accounting principles (GAAP) in the United States of America.
Investment Valuation
Municipal bonds are valued by an independent pricing service, taking into consideration yield, liquidity, risk, credit quality, coupon, maturity, type of issue, and any other factors or market data the pricing service deems relevant. Short-term securities are valued at the prices provided by an independent pricing service. However, short-term securities with remaining maturities of 60 days or less at the time of purchase may be valued at amortized cost, which approximates fair market value. Investments in other open-end registered investment companies are valued at net asset value. Securities for which no quotations are readily available are valued at fair value as determined in accordance with procedures established by and under general supervision of the Board of Trustees (the "Trustees").
Investment Income, Expenses and Distributions
Interest income and expenses are accrued daily. Distributions to shareholders are recorded on the ex-dividend date. Non-cash dividends included in dividend income, if any, are recorded at fair value.
Premium and Discount Amortization
All premiums and discounts on fixed-income securities are amortized/accreted for financial statement purposes.
Federal Taxes
It is the Fund's policy to comply with the Subchapter M provision of the Internal Revenue Code (the "Code") and to distribute to shareholders each year substantially all of its income. Accordingly, no provision for federal income tax is necessary.
When-Issued and Delayed Delivery Transactions
The Fund may engage in when-issued or delayed delivery transactions. The Fund records when-issued securities on the trade date and maintains security positions such that sufficient liquid assets will be available to make payment for the securities purchased. Securities purchased on a when-issued or delayed delivery basis are marked to market daily and begin earning interest on the settlement date. Losses may occur on these transactions due to changes in market conditions or the failure of counterparties to perform under the contract.
Swap Contracts
The Fund may enter into swap contracts. A swap is an exchange of cash payments between the Fund and another party, which is based on a specific financial index. The value of the swap is adjusted daily and the change in value is recorded as unrealized appreciation or depreciation. When a swap contract is closed, the Fund recognizes a realized gain or loss. The swap contracts entered into by the Fund are on a forward settling basis. For the year ended August 31, 2004, the Fund had net realized losses on swap contracts of $78,137.
Risks may arise upon entering into these agreements from the potential inability of the counterparties to meet the terms of their contract and from unanticipated changes in the value of the financial index on which the swap agreement is based. The Fund uses swaps for hedging purposes to reduce its exposure to interest rate fluctuations.
At August 31, 2004, the Fund had no open swap contracts.
Futures Contracts
The Fund periodically may sell bond interest rate futures contracts to manage duration and to potentially reduce transaction costs. Upon entering into a bond interest rate futures contract with a broker, the Fund is required to deposit in a segregated account a specified amount of cash or U.S. government securities. Futures contracts are valued daily and unrealized gains or losses are recorded in a "variation margin" account. Daily, the Fund receives from or pays to the broker a specified amount of cash based upon changes in the variation margin account. When a contract is closed, the Fund recognizes a realized gain or loss. For the year ended August 31, 2004, the Fund had realized losses on futures contracts of $544,922.
Futures contracts have market risks, including the risk that the change in the value of the contract may not correlate with changes in the value of the underlying securities.
At August 31, 2004, the Fund had outstanding futures contracts as set forth below:
Expiration Date
|
| Contracts to Receive
|
| Position
|
| Unrealized
Appreciation
|
December 2004
|
| 130 U.S. Treasury Notes 10 Year Futures
|
| Short
|
| $20,477
|
Use of Estimates
The preparation of financial statements in conformity with GAAP requires management to make estimates and assumptions that affect the amounts of assets, liabilities, expenses and revenues reported in the financial statements. Actual results could differ from those estimated.
Other
Investment transactions are accounted for on a trade date basis. Realized gains and losses from investment transactions are recorded on an identified cost basis.
3. SHARES OF BENEFICIAL INTEREST
The following table summarizes share activity:
Year Ended August 31
|
| 2004
|
|
| 2003
|
|
Shares sold
|
| 4,306,696
|
|
| 5,255,610
|
|
Shares issued to shareholders in payment of distributions declared
|
| 237,993
|
|
| 195,608
|
|
Shares redeemed
|
| (3,333,020
| )
|
| (4,210,355
| )
|
NET CHANGE RESULTING FROM SHARE TRANSACTIONS
|
| 1,211,669
|
|
| 1,240,863
|
|
4. FEDERAL TAX INFORMATION
The timing and character of income and capital gain distributions are determined in accordance with income tax regulations which may differ from GAAP. These differences are due in part to differing treatments for expiration of capital loss carryforward and discount accretion/premium amortization on debt securities.
For the year ended August 31, 2004, permanent differences identified and reclassified among the components of net assets were as follows:
Increase (Decrease)
|
Paid-In Capital
|
| Undistributed Net
Investment Income (Loss)
|
| Accumulated Net
Realized Gains (Losses)
|
$(95,079)
|
| $(1,448)
|
| $96,527
|
Net investment income, net realized gains (losses) and net assets were not affected by this reclassification.
The tax character of distributions as reported on the Statement of Changes in Net Assets for the years ended August 31, 2004 and 2003, was as follows:
|
| 2004
|
| 2003
|
Tax-exempt income
|
| $6,048,516
|
| $5,757,724
|
As of August 31, 2004, the components of distributable earnings on a tax basis were as follows:
Undistributed tax-exempt income
|
| $
| 289,096
|
Unrealized appreciation
|
| $
| 9,794,126
|
Capital loss carryforward
|
| $
| 822,865
|
At August 31, 2004, the cost of investments for federal tax purposes was $152,497,070. The net unrealized appreciation of investments for federal tax purposes was $9,794,126. This consists of net unrealized appreciation from investments for those securities having an excess of value over cost of $9,817,053 and net unrealized depreciation from investments for those securities having an excess of cost over value of $22,927.
The difference between book-basis and tax-basis unrealized appreciation/depreciation is attributed to differing treatments for discount accretion/premium amortization of debt securities.
At August 31, 2004 the Fund had a capital loss carryforward of $822,865 which will reduce the Fund's taxable income arising from future net realized gains on investments, if any, to the extent permitted by the Code and thus will reduce the amount of distributions to shareholders which would otherwise be necessary to relieve the Fund of any liability for federal tax. Pursuant to the Code, such capital loss carryforward will expire as follows:
Expiration Year
|
| Expiration Amount
|
2008
|
| $804,301
|
2009
|
| $ 2,481
|
2012
|
| $ 16,083
|
Under current tax regulations, capital losses realized after October 31 may be deferred and treated as occurring on the first day of the following fiscal year. As of August 31, 2004 for federal income tax purposes, post-October losses of $1,574,829 were deferred to September 1, 2004.
5. INVESTMENT ADVISER FEE AND OTHER TRANSACTIONS WITH AFFILIATES
Investment Adviser Fee
Federated Investment Management Company, the Fund's investment adviser (the "Adviser"), receives for its services an annual investment adviser fee equal to 0.40% of the Fund's average daily net assets. The Adviser may voluntarily choose to waive any portion of its fee. The Adviser can modify or terminate this voluntary waiver at any time at its sole discretion.
Administrative Fee
Federated Administrative Services (FAS), under the Administrative Services Agreement, provides the Fund with administrative personnel and services. The fee paid to FAS is based on the average aggregate daily net assets of all Federated funds as specified below:
Maximum
Administrative Fee
|
| Average Aggregate Daily Net Assets
of the Federated Funds
|
0.150%
|
| on the first $5 billion
|
0.125%
|
| on the next $5 billion
|
0.100%
|
| on the next $10 billion
|
0.075%
|
| on assets in excess of $20 billion
|
The administrative fee received during any fiscal year shall be at least $150,000 per portfolio and $40,000 per each additional class of Shares. FAS may voluntarily choose to waive any portion of its fee. FAS can modify or terminate this voluntary waiver at any time at its sole discretion.
Prior to November 1, 2003, Federated Services Company (FServ) provided the Fund with administrative personnel and services. The fee paid to FServ was based on the average aggregate daily net assets of all Federated funds as specified below:
Maximum
Administrative Fee
|
| Average Aggregate Daily Net Assets
of the Federated Funds
|
0.150%
|
| on the first $250 million
|
0.125%
|
| on the next $250 million
|
0.100%
|
| on the next $250 million
|
0.075%
|
| on assets in excess of $750 million
|
The administrative fee received during any fiscal year was at least $125,000 per portfolio and $30,000 per each additional class of Shares.
For the year ended August 31, 2004 the fees paid to FAS and FServ were $105,521 and $20,833, respectively, after voluntary waiver, if applicable.
Sales Charges
For the fiscal year ended August 31, 2004, Federated Securities Corp., the principal distributor, retained $7,450 of contingent deferred sales charges relating to redemptions of Fund shares. See "What Do Shares Cost?" in the prospectus.
Shareholder Services Fee
Under the terms of a Shareholder Services Agreement with Federated Shareholder Services Company (FSSC), the Fund will pay FSSC up to 0.25% of the average daily net assets of the Fund's Shares for the period. The fee paid to FSSC is used to finance certain services for shareholders and to maintain shareholder accounts. FSSC may voluntarily choose to waive any portion of its fee. FSSC can modify or terminate this voluntary waiver at any time at its sole discretion.
Transfer and Dividend Disbursing Agent Fees and Expenses
Prior to July 1, 2004, FServ, through its subsidiary FSSC, served as transfer and dividend disbursing agent for the Fund. The fee paid to FSSC was based on the size, type and number of accounts and transactions made by shareholders. The fee paid to FSSC during the reporting period was $37,914, after voluntary waiver, if applicable.
Portfolio Accounting Fees
Prior to January 1, 2004, FServ maintained the Fund's accounting records for which it received a fee. The fee was based on the level of the Fund's average daily net assets for the period, plus out-of-pocket expenses. The fee paid to FServ during the reporting period was $18,959, after voluntary waiver, if applicable.
Interfund Transactions
During the year ended August 31, 2004, the Fund engaged in purchase and sale transactions with funds that have a common investment adviser (or affiliated investment advisers), common Directors/Trustees, and/or common Officers. These purchase and sale transactions complied with Rule 17a-7 under the Act and amounted to $41,700,000 and $44,200,000, respectively.
General
Certain of the Officers and Trustees of the Trust are Officers and Directors or Trustees of the above companies.
6. INVESTMENT TRANSACTIONS
Purchases and sales of investments, excluding long-term U.S. government securities and short-term obligations (and in-kind contributions), for the year ended August 31, 2004, were as follows:
Purchases
|
| $
| 47,193,232
|
Sales
|
| $
| 31,127,196
|
7. CONCENTRATION OF CREDIT RISK
Since the Fund invests a substantial portion of its assets in issuers located in one state, it will be more susceptible to factors adversely affecting issuers of that state than would be a comparable tax-exempt mutual fund that invests nationally. In order to reduce the credit risk associated with such factors, at August 31, 2004, 58.9% of the securities in the portfolio of investments are backed by letters of credit or bond insurance of various financial institutions and financial guaranty assurance agencies. The largest percentage of investments insured by or supported (backed) by a letter of credit from any one institution or agency was 14.3% of total investments.
8. LEGAL PROCEEDINGS
Beginning in October 2003, Federated Investors, Inc. and various subsidiaries thereof (including the advisers and distributor for various investment companies, collectively, "Federated"), along with various investment companies sponsored by Federated ("Funds") were named as defendants in several class action lawsuits now pending in the United States District Court for the District of Maryland seeking damages of unspecified amounts. The lawsuits were purportedly filed on behalf of people who purchased, owned and/or redeemed shares of Federated-sponsored mutual funds during specified periods beginning November 1, 1998. The suits are generally similar in alleging that Federated engaged in illegal and improper trading practices including market timing and late trading in concert with certain institutional traders, which allegedly caused financial injury to the mutual fund shareholders. Federated and various Funds have also been named as defendants in several additional lawsuits, the majority of which are now pending in the United States District Court for the Western District of Pennsylvania, alleging, among other things, excessive advisory and Rule 12b-1 fees, and seeking damages of unspecified amounts. The Board of the Funds has retained the law firm of Dickstein Shapiro Morin & Oshinsky LLP to represent the Funds in these lawsuits. Federated and the Funds, and their respective counsel, are reviewing the allegations and will respond appropriately. Additional lawsuits based upon similar allegations may be filed in the future. The potential impact of these recent lawsuits and future potential similar suits is uncertain. Although we do not believe that these lawsuits will have a material adverse effect on the Funds, there can be no assurance that these suits, the ongoing adverse publicity and/or other developments resulting from related regulatory investigations will not result in increased Fund redemptions, reduced sales of Fund shares, or other adverse consequences for the Funds.
9. FEDERAL TAX INFORMATION (UNAUDITED)
At August 31, 2004, 100% of the distributions from net investment income is exempt from federal income tax, other than the federal AMT.
Report of Independent Registered Public Accounting Firm
TO THE BOARD OF TRUSTEES OF FEDERATED MUNICIPAL SECURITIES
INCOME TRUST AND SHAREHOLDERS OF FEDERATED MICHIGAN
INTERMEDIATE MUNICIPAL TRUST:
We have audited the accompanying statement of assets and liabilities, including the portfolio of investments, of Federated Michigan Intermediate Municipal Trust (the "Fund") as of August 31, 2004, and the related statement of operations for the year then ended, the statement of changes in net assets for each of the two years in the period then ended, and the financial highlights for each of the five years in the period then ended. These financial statements and financial highlights are the responsibility of the Fund's management. Our responsibility is to express an opinion on these financial statements and financial highlights based on our audit.
We conducted our audits in accordance with standards of the Public Company Accounting Oversight Board (United States). Those standards require that we plan and perform the audit to provide reasonable assurance about whether the financial statements and financial highlights are free of material misstatement. An audit includes examining, on a test basis, evidence supporting the amounts and disclosures in the financial statements. Our procedures included confirmation of the securities owned at August 31, 2004, by correspondence with the custodian. An audit also includes assessing the accounting principles used and significant estimates made by management, as well as evaluating the overall financial statement presentation. We believe our audit provides a reasonable basis for our opinion.
In our opinion, such financial statements and financial highlights present fairly, in all material respects, the financial position of the Fund as of August 31, 2004, the results of its operations, the changes in its net assets and its financial highlights for the respective stated periods in conformity with accounting principles generally accepted in the United States of America.
Deloitte & Touche LLP
Boston, Massachusetts
October 20, 2004
Board of Trustees and Trust Officers
The Board is responsible for managing the Trust's business affairs and for exercising all the Trust's powers except those reserved for the shareholders. The following tables give information about each Board member and the senior officers of the Funds. Where required, the tables separately list Board members who are "interested persons" of the Fund ( i.e. , "Interested" Board members) and those who are not ( i.e. , "Independent" Board members). Unless otherwise noted, the address of each person listed is Federated Investors Tower, 1001 Liberty Avenue, Pittsburgh, PA. The Trust comprises seven portfolios and the Federated Fund Complex consists of 44 investment companies (comprising 136 portfolios). Unless otherwise noted, each Officer is elected annually. Unless otherwise noted, each Board member oversees all portfolios in the Federated Fund Complex and serves for an indefinite term. The Fund's Statement of Additional Information includes additional information about Trust Trustees and is available, without charge and upon request, by calling 1-800-341-7400.
INTERESTED TRUSTEES BACKGROUND
|
|
|
Name
Birth Date
Address
Positions Held with Trust
Date Service Began
|
| Principal Occupation(s) for Past Five Years,
Other Directorships Held and Previous Position(s)
|
John F. Donahue*
Birth Date: July 28, 1924
CHAIRMAN AND TRUSTEE
Began serving: August 1990 | | Principal Occupations : Chairman and Director or Trustee of the Federated Fund Complex; Chairman and Director, Federated Investors, Inc.
Previous Positions : Trustee, Federated Investment Management Company and Chairman and Director, Federated Investment Counseling. |
|
|
|
J. Christopher Donahue*
Birth Date: April 11, 1949
PRESIDENT AND TRUSTEE
Began serving: August 1990 | | Principal Occupations : Principal Executive Officer and President of the Federated Fund Complex; Director or Trustee of some of the Funds in the Federated Fund Complex; President, Chief Executive Officer and Director, Federated Investors, Inc.; Chairman and Trustee, Federated Investment Management Company; Trustee, Federated Investment Counseling; Chairman and Director, Federated Global Investment Management Corp.; Chairman, Passport Research, Ltd.; Trustee, Federated Shareholder Services Company; Director, Federated Services Company.
Previous Positions : President, Federated Investment Counseling; President and Chief Executive Officer, Federated Investment Management Company, Federated Global Investment Management Corp. and Passport Research, Ltd. |
|
|
|
|
|
|
Name
Birth Date
Address
Positions Held with Trust
Date Service Began
|
| Principal Occupation(s) for Past Five Years,
Other Directorships Held and Previous Position(s)
|
Lawrence D. Ellis, M.D.*
Birth Date: October 11, 1932
3471 Fifth Avenue
Suite 1111
Pittsburgh, PA
TRUSTEE
Began serving: August 1990 | | Principal Occupations : Director or Trustee of the Federated Fund Complex; Professor of Medicine, University of Pittsburgh; Medical Director, University of Pittsburgh Medical Center Downtown; Hematologist, Oncologist and Internist, University of Pittsburgh Medical Center.
Other Directorships Held : Member, National Board of Trustees, Leukemia Society of America.
Previous Positions : Trustee, University of Pittsburgh; Director, University of Pittsburgh Medical Center. |
|
|
|
* Family relationships and reasons for "interested" status: John F. Donahue is the father of J. Christopher Donahue; both are "interested" due to the positions they hold with Federated Investors, Inc. and its subsidiaries. Lawrence D. Ellis, M.D. is "interested" because his son-in-law is employed by the Fund's principal underwriter, Federated Securities Corp.
INDEPENDENT TRUSTEES BACKGROUND
|
|
|
Name
Birth Date
Address
Positions Held with Trust
Date Service Began
|
| Principal Occupation(s) for Past Five Years,
Other Directorships Held and Previous Position(s)
|
Thomas G. Bigley
Birth Date: February 3, 1934
15 Old Timber Trail
Pittsburgh, PA
TRUSTEE
Began serving: November 1994 | | Principal Occupation : Director or Trustee of the Federated Fund Complex.
Other Directorships Held : Director, Member of Executive Committee, Children's Hospital of Pittsburgh; Director, University of Pittsburgh.
Previous Position : Senior Partner, Ernst & Young LLP. |
|
|
|
John T. Conroy, Jr.
Birth Date: June 23, 1937
Grubb & Ellis/Investment
Properties Corporation
3838 North Tamiami Trail
Suite 402
Naples, FL
TRUSTEE
Began serving: August 1991 | | Principal Occupations : Director or Trustee of the Federated Fund Complex; Chairman of the Board, Investment Properties Corporation; Partner or Trustee in private real estate ventures in Southwest Florida.
Previous Positions : President, Investment Properties Corporation; Senior Vice President, John R. Wood and Associates, Inc., Realtors; President, Naples Property Management, Inc. and Northgate Village Development Corporation.
|
|
|
|
|
|
|
Name
Birth Date
Address
Positions Held with Trust
Date Service Began
|
| Principal Occupation(s) for Past Five Years,
Other Directorships Held and Previous Position(s)
|
Nicholas P. Constantakis
Birth Date: September 3, 1939
175 Woodshire Drive
Pittsburgh, PA
TRUSTEE
Began serving: February 1998 | | Principal Occupations : Director or Trustee of the Federated Fund Complex.
Other Directorships Held : Director and Member of the Audit Committee, Michael Baker Corporation (engineering and energy services worldwide).
Previous Position : Partner, Andersen Worldwide SC. |
|
|
|
John F. Cunningham
Birth Date: March 5, 1943
353 El Brillo Way
Palm Beach, FL
TRUSTEE
Began serving: July 1999 | | Principal Occupation : Director or Trustee of the Federated Fund Complex.
Other Directorships Held : Chairman, President and Chief Executive Officer, Cunningham & Co., Inc. (strategic business consulting); Trustee Associate, Boston College.
Previous Positions : Director, Redgate Communications and EMC Corporation (computer storage systems); Chairman of the Board and Chief Executive Officer, Computer Consoles, Inc.; President and Chief Operating Officer, Wang Laboratories; Director, First National Bank of Boston; Director, Apollo Computer, Inc. |
|
|
|
Peter E. Madden
Birth Date: March 16, 1942
One Royal Palm Way
100 Royal Palm Way
Palm Beach, FL
TRUSTEE
Began serving: August 1991 | | Principal Occupation : Director or Trustee of the Federated Fund Complex; Management Consultant.
Other Directorships Held : Board of Overseers, Babson College.
Previous Positions : Representative, Commonwealth of Massachusetts General Court; President, State Street Bank and Trust Company and State Street Corporation (retired); Director, VISA USA and VISA International; Chairman and Director, Massachusetts Bankers Association; Director, Depository Trust Corporation; Director, The Boston Stock Exchange. |
|
|
|
Charles F. Mansfield, Jr.
Birth Date: April 10, 1945
80 South Road
Westhampton Beach, NY
TRUSTEE
Began serving: January 1999 | | Principal Occupations : Director or Trustee of the Federated Fund Complex; Management Consultant; Executive Vice President, DVC Group, Inc. (marketing communications and technology) (prior to 9/1/00).
Previous Positions : Chief Executive Officer, PBTC International Bank; Partner, Arthur Young & Company (now Ernst & Young LLP); Chief Financial Officer of Retail Banking Sector, Chase Manhattan Bank; Senior Vice President, HSBC Bank USA (formerly, Marine Midland Bank); Vice President, Citibank; Assistant Professor of Banking and Finance, Frank G. Zarb School of Business, Hofstra University. |
|
|
|
|
|
|
Name
Birth Date
Address
Positions Held with Trust
Date Service Began
|
| Principal Occupation(s) for Past Five Years,
Other Directorships Held and Previous Position(s)
|
John E. Murray, Jr., J.D., S.J.D.
Birth Date: December 20, 1932
Chancellor, Duquesne University
Pittsburgh, PA
TRUSTEE
Began serving: February 1995 | | Principal Occupations : Director or Trustee of the Federated Fund Complex; Chancellor and Law Professor, Duquesne University; Partner, Murray, Hogue and Lannis.
Other Directorships Held : Director, Michael Baker Corp. (engineering, construction, operations and technical services).
Previous Positions : President, Duquesne University; Dean and Professor of Law, University of Pittsburgh School of Law; Dean and Professor of Law, Villanova University School of Law. |
|
|
|
Marjorie P. Smuts
Birth Date: June 21, 1935
4905 Bayard Street
Pittsburgh, PA
TRUSTEE
Began serving: August 1990 | | Principal Occupations : Director or Trustee of the Federated Fund Complex; Public Relations/Marketing Consultant/Conference Coordinator.
Previous Positions : National Spokesperson, Aluminum Company of America; television producer; President, Marj Palmer Assoc.; Owner, Scandia Bord. |
|
|
|
John S. Walsh
Birth Date: November 28, 1957
2604 William Drive
Valparaiso, IN
TRUSTEE
Began serving: July 1999 | | Principal Occupations : Director or Trustee of the Federated Fund Complex; President and Director, Heat Wagon, Inc. (manufacturer of construction temporary heaters); President and Director, Manufacturers Products, Inc. (distributor of portable construction heaters); President, Portable Heater Parts, a division of Manufacturers Products, Inc.
Previous Position : Vice President, Walsh & Kelly, Inc. |
|
|
|
OFFICERS
|
|
|
Name
Birth Date
Positions Held with Trust
Date Service Began
|
| Principal Occupation(s) for Past Five Years and Previous Position(s)
|
John W. McGonigle
Birth Date: October 26, 1938
EXECUTIVE VICE PRESIDENT
AND SECRETARY
Began serving: August 1990 | | Principal Occupations : Executive Vice President and Secretary of the Federated Fund Complex; Executive Vice President, Secretary and Director, Federated Investors, Inc.
|
|
|
|
Richard J. Thomas
Birth Date: June 17, 1954
TREASURER
Began serving: November 1998 | | Principal Occupations : Principal Financial Officer and Treasurer of the Federated Fund Complex; Senior Vice President, Federated Administrative Services.
|
|
|
|
Richard B. Fisher
Birth Date: May 17, 1923
VICE CHAIRMAN
Began serving: August 2002 | | Principal Occupations : Vice Chairman or President of some of the Funds in the Federated Fund Complex; Vice Chairman, Federated Investors, Inc.; Chairman, Federated Securities Corp.
Previous Positions : President and Director or Trustee of some of the Funds in the Federated Fund Complex; Executive Vice President, Federated Investors, Inc. and Director and Chief Executive Officer, Federated Securities Corp. |
|
|
|
Mary Jo Ochson
Birth Date: September 12, 1953
CHIEF INVESTMENT OFFICER
Began serving: May 2004 | | Principal Occupations : Mary Jo Ochson was named Chief Investment Officer of tax-exempt, fixed-income products in 2004. She joined Federated in 1982 and has been a Senior Portfolio Manager and a Senior Vice President of the Fund's Adviser since 1996. Ms. Ochson is a Chartered Financial Analyst and received her M.B.A. in Finance from the University of Pittsburgh. |
|
|
|
J. Scott Albrecht
Birth Date: June 1, 1960
VICE PRESIDENT
Began serving: November 1998 | | J. Scott Albrecht has been the Fund's Portfolio Manager since April 1994. He is Vice President of the Trust. Mr. Albrecht joined Federated in 1989. He has been a Senior Portfolio Manager since 1997 and a Vice President of the Fund's Adviser since 1994. He was a Portfolio Manager from 1994 to 1996. Mr. Albrecht is a Chartered Financial Analyst and received his M.S. in Public Management from Carnegie Mellon University. |
|
|
|
Mutual funds are not bank deposits or obligations, are not guaranteed by any bank, and are not insured or guaranteed by the U.S. government, the Federal Deposit Insurance Corporation, the Federal Reserve Board, or any other government agency. Investment in mutual funds involves investment risk, including the possible loss of principal.
This report is authorized for distribution to prospective investors only when preceded or accompanied by the fund's prospectus, which contains facts concerning its objective and policies, management fees, expenses, and other information.
VOTING PROXIES ON FUND PORTFOLIO SECURITIES
A description of the policies and procedures that the Fund uses to determine how to vote proxies relating to securities held in the Fund's portfolio is available, without charge and upon request, by calling 1-800-341-7400. A report on "Form N-PX" of how the Fund voted any such proxies during the most recent 12-month period ended June 30 is available through Federated's website. Go to http://www.federatedinvestors.com, select "Products," select the "Prospectuses and Regulatory Reports" link, then select the Fund to access the link to Form N-PX. This information is also available from the EDGAR database on the SEC's website at http://www.sec.gov.
QUARTERLY PORTFOLIO SCHEDULE
The Fund files with the SEC a complete schedule of its portfolio holdings, as of the close of the first and third quarters of its fiscal year, on "Form N-Q." These filings are available on the SEC's website at http://www.sec.gov and may be reviewed and copied at the SEC's Public Reference Room in Washington, DC. (Call 1-800-SEC-0330 for information on the operation of the Public Reference Room.) You may also access this information from the "Products" section of Federated's website at www.federatedinvestors.com by clicking on "Portfolio Holdings" and selecting the name of the Fund, or by selecting the name of the Fund and clicking on "Portfolio Holdings." You must register on the website the first time you wish to access this information.
Federated
World-Class Investment Manager
Federated Michigan Intermediate Municipal Trust
Federated Investors Funds
5800 Corporate Drive
Pittsburgh, PA 15237-7000
www.federatedinvestors.com
Contact us at 1-800-341-7400 or
www.federatedinvestors.com/contact
Federated Securities Corp., Distributor
Cusip 313923302
G01106-03 (10/04)
Federated is a registered mark of Federated Investors, Inc. 2004 (c)Federated Investors, Inc.
Federated
World-Class Investment Manager
Federated New York Municipal Income Fund
A Portfolio of Federated Municipal Securities Income Trust
ANNUAL SHAREHOLDER REPORT
August 31, 2004
Class A Shares
Class B Shares
FINANCIAL HIGHLIGHTS
SHAREHOLDER EXPENSE EXAMPLE
MANAGEMENT'S DISCUSSION OF FUND PERFORMANCE
PORTFOLIO OF INVESTMENTS SUMMARY TABLES
FINANCIAL STATEMENTS
REPORT OF INDEPENDENT REGISTERED PUBLIC ACCOUNTING FIRM
BOARD OF TRUSTEES AND TRUST OFFICERS
VOTING PROXIES ON FUND PORTFOLIO SECURITIES
QUARTERLY PORTFOLIO SCHEDULE
Not FDIC Insured * May Lose Value * No Bank Guarantee
Financial Highlights - Class A Shares
(For a Share Outstanding Throughout Each Period)
Year Ended August 31
|
| 2004
|
|
| 2003
|
|
| 2002
|
|
| 2001
|
|
| 2000
|
|
Net Asset Value, Beginning of Period
| | $10.44 | | | $10.59 | | | $10.80 | | | $10.29 | | | $10.36 | |
Income From Investment Operations:
| | | | | | | | | | | | | | | |
Net investment income
| | 0.46 | | | 0.44 | | | 0.49 | 1 | | 0.52 | | | 0.53 | |
Net realized and unrealized gain (loss) on investments, futures contracts and swap contracts
|
| 0.21
|
|
| (0.15
| )
|
| (0.20
| ) 1
|
| 0.51
|
|
| (0.07
| )
|
TOTAL FROM INVESTMENT OPERATIONS
|
| 0.67
|
|
| 0.29
|
|
| 0.29
|
|
| 1.03
|
|
| 0.46
|
|
Less Distributions:
| | | | | | | | | | | | | | | |
Distributions from net investment income
|
| (0.46
| )
|
| (0.44
| )
|
| (0.50
| )
|
| (0.52
| )
|
| (0.53
| )
|
Net Asset Value, End of Period
|
| $10.65
|
|
| $10.44
|
|
| $10.59
|
|
| $10.80
|
|
| $10.29
|
|
Total Return 2
|
| 6.51
| %
|
| 2.81
| %
|
| 2.79
| %
|
| 10.29
| %
|
| 4.64
| %
|
| | | | | | | | | | | | | | | |
Ratios to Average Net Assets:
|
|
|
|
|
|
|
|
|
|
|
|
|
|
|
|
Expenses
|
| 0.61
| %
|
| 0.76
| %
|
| 0.91
| %
|
| 0.91
| %
|
| 0.84
| %
|
Net investment income
|
| 4.31
| %
|
| 4.19
| %
|
| 4.72
| % 1
|
| 4.97
| %
|
| 5.23
| %
|
Expense waiver/reimbursement 3
|
| 1.07
| %
|
| 1.16
| %
|
| 1.10
| %
|
| 1.39
| %
|
| 1.42
| %
|
Supplemental Data:
|
|
|
|
|
|
|
|
|
|
|
|
|
|
|
|
Net assets, end of period (000 omitted)
| $27,600
|
| $26,673
|
| $23,466
|
| $23,011
|
| $21,392
|
|
Portfolio turnover
|
| 15
| %
|
| 8
| %
|
| 35
| %
|
| 40
| %
|
| 31
| %
|
1 Effective September 1, 2001, the Fund adopted the provisions of the American Institute of Certified Public Accountants (AICPA) Audit and Accounting Guide for Investment Companies and began accreting discount on debt securities. For the year ended August 31, 2002, this change had no effect on the net investment income per share, the net realized and unrealized gain (loss) on investments per share, or the ratio of net investment income to average net assets. Per share, ratios and supplemental data for the periods prior to September 1, 2001 have not been restated to reflect this change in presentation.
2 Based on net asset value, which does not reflect the sales charge, redemption fee or contingent deferred sales charge, if applicable. Total returns for periods of less than one year are not annualized.
3 This voluntary expense decrease is reflected in both the expense and the net investment income ratios shown above.
See Notes which are an integral part of the Financial Statements
Financial Highlights - Class B Shares
(For a Share Outstanding Throughout Each Period)
| | Year Ended | | | Period
Ended | |
|
| 8/31/2004
|
|
| 8/31/2003
| 1
|
Net Asset Value, Beginning of Period
| | $10.44 | | | $10.65 | |
Income From Investment Operations:
| | | | | | |
Net investment income
| | 0.38 | | | 0.36 | |
Net realized and unrealized gain (loss) on investments, futures contracts and swap contracts
|
| 0.21
|
|
| (0.21
| )
|
TOTAL FROM INVESTMENT OPERATIONS
|
| 0.59
|
|
| 0.15
|
|
Less Distributions:
| | | | | | |
Distributions from net investment income
|
| (0.38
| )
|
| (0.36
| )
|
Net Asset Value, End of Period
|
| $10.65
|
|
| $10.44
|
|
Total Return 2
|
| 5.72
| %
|
| 1.42
| %
|
| | | | | | |
Ratios to Average Net Assets:
|
|
|
|
|
|
|
Expenses
|
| 1.36
| %
|
| 1.51
| % 3
|
Net investment income
|
| 3.56
| %
|
| 3.36
| % 3
|
Expense waiver/reimbursement 4
|
| 0.82
| %
|
| 0.91
| % 3
|
Supplemental Data:
|
|
|
|
|
|
|
Net assets, end of period (000 omitted)
| $21,802
|
| $19,000
|
|
Portfolio turnover
|
| 15
| %
|
| 8
| %
|
1 Reflects operations for the period from September 5, 2002 (date of initial public investment) to August 31, 2003.
2 Based on net asset value, which does not reflect the sales charge, redemption fee or contingent deferred sales charge, if applicable. Total returns for periods of less than one year are not annualized.
3 Computed on an annualized basis.
4 This voluntary expense decrease is reflected in both the expense and the net investment income ratios shown above.
See Notes which are an integral part of the Financial Statements
Shareholder Expense Example
As a shareholder of the Fund, you incur two types of costs: (1) transaction costs, including sales charges (loads) on purchase payments (Class A Shares); and (2) ongoing costs, including management fees, distribution (12b-1) fees, shareholder services fees and other Fund expenses (Class A Shares and Class B Shares). This Example is intended to help you to understand your ongoing costs (in dollars) of investing in the Fund and to compare these costs with the ongoing costs of investing in other mutual funds. It is based on an investment of $1,000 invested at the beginning of the period and held for the entire period from March 1, 2004 to August 31, 2004.
ACTUAL EXPENSES
The first section of the table below provides information about actual account values and actual expenses. You may use the information in this section, together with the amount you invested, to estimate the expenses that you incurred over the period. Simply divide your account value by $1,000 (for example, an $8,600 account value divided by $1,000 = 8.6), then multiply the result by the number in the first section under the heading entitled "Expenses Paid During Period" to estimate the expenses attributable to your investment during this period.
HYPOTHETICAL EXAMPLE FOR COMPARISON PURPOSES
The second section of the table below provides information about hypothetical account values and hypothetical expenses based on the Fund's actual expense ratio and an assumed rate of return of 5% per year before expenses, which is not the Fund's actual return. Thus, you should not use the hypothetical account values and expenses to estimate the actual ending account balance or your expenses for the period. Rather, these figures are provided to enable you to compare the ongoing costs of investing in the Fund and other funds. To do so, compare this 5% hypothetical example with the 5% hypothetical examples that appear in the shareholder reports of the other funds.
Please note that the expenses shown in the table are meant to highlight your ongoing costs only and do not reflect any transaction costs, such as sales charge (loads). Therefore, the second section of the table is useful in comparing ongoing costs only, and will not help you determine the relative total costs of owning different funds. In addition, if these transaction costs were included, your costs would have been higher.
|
| Beginning
Account Value
3/1/2004
|
| Ending
Account Value
8/31/2004
|
| Expenses Paid
During Period 1
|
Actual:
|
|
|
|
|
|
|
Class A Shares
|
| $1,000
|
| $ 999.50
|
| $3.07
|
Class B Shares
|
| $1,000
|
| $ 995.80
|
| $6.82
|
Hypothetical (assuming a 5% return before expenses):
|
|
|
|
|
|
|
Class A Shares
|
| $1,000
|
| $1,022.07
|
| $3.10
|
Class B Shares
|
| $1,000
|
| $1,018.30
|
| $6.90
|
1 Expenses are equal to the Federated New York Municipal Income Fund Class A Shares and Class B Shares annualized expense ratios of 0.61% and 1.36%, respectively, multiplied by the average account value over the period, multiplied by 184/366 (to reflect the one-half year period).
Management's Discussion of Fund Performance
The fund's total return, based on net asset value, for the 12-month reporting period was 6.51% for the fund's Class A Shares, and 5.72% for the fund's Class B Shares. The total return consisted of 4.50% (Class A Shares) and 3.71% (Class B Shares) of tax-exempt dividends, and 2.01% appreciation (Class A and Class B Shares) in the net asset value of the shares. 1 The total return of the Lehman Brothers Municipal Bond Index, the fund's benchmark index (LBMB), 2 was 7.11% during the 12-month reporting period.
The fund's investment strategy focused on: (a) the effective duration of its portfolio (which indicates the portfolio's sensitivity to changes in interest rates); (b) the selection of securities with different maturities (expressed by a "yield curve" showing the relative yield of similar securities with different maturities) and the coupon income provided by the portfolio securities (the coupon is the interest rate paid by a bond); (c) the allocation of the portfolio among securities of similar issuers (referred to as "sectors"); and (d) the credit ratings of portfolio securities (which indicates the risk that securities will default). These were the most significant factors affecting the fund's performance relative to the LBMB. In addition, the fund's total return reflected actual cash flows, transaction costs and other expenses, which were not reflected in the total return of the LBMB.
DURATION 3
The fund's dollar-weighted average duration at the end of the reporting period was 6.41 years. Duration management is a significant component of the fund's investment strategy. The fund maintained duration short of the index and the fund's peer group, as interest rates were expected to rise during the reporting period. In reality, interest rates declined over a significant portion of the reporting period and this hurt fund performance. The fund's use of forward settling municipal interest rate swaps and Treasury futures contacts, which did not perform well, to adjust portfolio duration contributed to the fund's performance being less than the LBMB.
1 Performance data quoted represents past performance which is no guarantee of future results. Investment return and principal value will fluctuate so that an investor's shares, when redeemed, may be worth more or less than their original cost. Mutual fund performance changes over time and current performance may be lower or higher than what is stated. For current to the most recent month-end performance, visit www.federatedinvestors.com or call 1-800-341-7400.
2 The LBMB is the broad-based securities market index for the fund, as disclosed in the fund's prospectus. The LBMB is a broad market performance benchmark for the tax-exempt bond market. To be included in the LBMB, bonds must have a minimum credit rating of Baa, have an outstanding par value of at least $3 million and be issued as part of a transaction of at least $50 million. The LBMB includes both zero coupon bonds and bonds subject to the alternative minimum tax. The LBMB is not adjusted to reflect sales charges, expenses, or other fees that the Securities and Exchange Commission (SEC) requires to be reflected in the fund's performance. Indexes are unmanaged, and unlike the fund, is not affected by cashflows. It is not possible to invest directly in an index.
3 Duration is a measure of a security's price sensitivity to changes in interest rates. Securities with longer durations are more sensitive to changes in interest rates than securities with shorter durations.
COUPON AND MATURITY
During the reporting period, the fund concentrated its portfolio purchases and holdings on premium coupon municipal bonds (municipal bonds with coupons or interest payments that are higher than current yields available in the market). The additional income provided by premium coupon securities, versus securities with coupons which are at or below current market yields, benefited the fund's performance versus the LBMB and the fund's peer group.
The fund concentrated on purchasing bonds with maturities of 10 to 20 years during the reporting period. These maturities provided the most attractive opportunities for yield because of the yield curves positively sloping shape. A yield curve is considered positively sloping when the yield progressively increases as you move into longer maturities. In addition, the relative dearth of municipal debt issued during the reporting period caused municipal bonds to increase in value and helped to improve the fund's performance versus most taxable bond alternatives.
SECTOR
During the reporting period, as compared to the LBMB, the fund allocated more of its portfolio to securities issued by hospitals, industrial development projects and higher education institutions. The fund also allocated less of the portfolio to general obligation bonds issued by cities, states and school districts. These allocations helped the fund's performance due to the higher yields available in the over- weighted sectors and the smaller increase in the price of general obligation bonds as compared to other sectors. A specific hospital bond holding (Staten Island University Hospital) did undergo significant price deterioration as a result of reported Medicare fraud which resulted in a restatement of the hospital's earnings.
CREDIT QUALITY
Credit spreads, or the yield difference between the "AAA"-rated municipal bonds and bonds of lower credit quality and similar maturity, decreased during the reporting period. This decrease in credit spreads was the result of both improving economic activity and the demand for securities with higher yields. The fund's overweight, relative to the Index, in "BBB"-rated (or comparable quality) debt benefited performance as credit spreads became tighter to a greater extent for "BBB" rated (or comparable quality) debt than for other investment-grade rated ("AAA", "AA", "A" or comparable quality) debt (meaning that the yield on the "BBB" rated debt improved to a greater extent, or declined to a lesser extent, than for other investment-grade rated debt). 4
4 Lower-rated bonds typically offer higher yields to help compensate investors for the increased risk associated with them. Among these risks are lower creditworthiness, greater price volatility, more risk to principal and income than with higher-rated securities and increased possibilities of default.
GROWTH OF A $10,000 INVESTMENT - CLASS A SHARES
The graph below illustrates the hypothetical investment of $10,000 1 in Federated New York Municipal Income Fund (Class A Shares) (the "Fund") from August 31, 1994 to August 31, 2004, compared to the Lehman Brothers Municipal Bond Index (LBMB), 2 and the Lipper New York Municipal Debt Funds Average (LNYMDFA). 3
Average Annual Total Return 4 for the Period Ended 8/31/2004
|
|
|
1 Year
|
| 1.73%
|
5 Years
|
| 4.40%
|
10 Years
|
| 5.20%
|
Performance data quoted represents past performance which is no guarantee of future results. Returns shown do not reflect the deduction of taxes that a shareholder would pay on the Fund distributions or redemption of Fund shares. For after-tax returns, visit www.federatedinvestors.com. Investment return and principal value will fluctuate so that an investor's shares, when redeemed, may be worth more or less than their original cost. Mutual fund performance changes over time and current performance may be lower or higher than what is stated. Mutual funds are not obligations of or guaranteed by any bank and are not federally insured.
1 Represents a hypothetical investment of $10,000 in the Fund after deducting the maximum sales charge of 4.50% ($10,000 investment minus $450 sales charge = $9,550). The Fund's performance assumes the reinvestment of all dividends and distributions. The LBMB and LNYMDFA have been adjusted to reflect reinvestment of dividends on securities in the index and average. Indexes are unmanaged, and unlike the Fund, are not affected by cash flows. It is not possible to invest directly in an index or an average.
2 The LBMB is an unmanaged index comprising bonds with a minimum credit rating of at least Baa. They must have an outstanding par value of at least $3 million and be issued as part of a transaction of at least $50 million. The index includes both zero coupon bonds and bonds subject to the federal alternative minimum tax. It is not adjusted to reflect sales charges, expenses, or other fees that the Securities and Exchange Commission (SEC) requires to be reflected in the Fund's performance.
3 The LNYMDFA represents the average of the total returns reported by all of the mutual funds designated by Lipper, Inc. as falling into the respective category. These total returns are reported net of expenses and other fees that the SEC requires to be reflected in a mutual fund's performance.
4 Total return quoted reflects all applicable sales charges.
GROWTH OF A $10,000 INVESTMENT - CLASS B SHARES
The graph below illustrates the hypothetical investment of $10,000 1 in Federated New York Municipal Income Fund (Class B Shares) (the "Fund") from September 5, 2002 (start of performance) to August 31, 2004, compared to the Lehman Brothers Municipal Bond Index (LBMB), and the Lipper New York Municipal Debt Funds Average (LNYMDFA).
Average Annual Total Return 4 for the Period Ended 8/31/2004
|
|
|
1 Year
|
| 0.22%
|
Start of Performance (9/5/2002)
|
| 1.23%
|
Performance data quoted represents past performance which is no guarantee of future results. Returns shown do not reflect the deduction of taxes that a shareholder would pay on the Fund distributions or redemption of Fund shares. For after-tax returns, visit www.federatedinvestors.com. Investment return and principal value will fluctuate so that an investor's shares, when redeemed, may be worth more or less than their original cost. Mutual fund performance changes over time and current performance may be lower or higher than what is stated. Mutual funds are not obligations of or guaranteed by any bank and are not federally insured.
1 Represents a hypothetical investment of $10,000 in the Fund. The ending value of the Fund does not reflect a contingent deferred sales charge on any redemptions over seven years from the purchase date. The maximum contingent deferred sales charge is 5.50% on any redemption less than one year from the purchase date. The Fund's performance assumes the reinvestment of all dividends and distributions. The LBMB and LNYMDA have been adjusted to reflect reinvestment of dividends on securities in the index and average. Indexes are unmanaged, and unlike the Fund, are not affected by cash flows. It is not possible to invest directly in an index or an average.
2 The LBMB is an unmanaged index comprising bonds with a minimum credit rating of at least Baa. They must have an outstanding par value of at least $3 million and be issued as part of a transaction of at least $50 million. The index includes both zero coupon bonds and bonds subject to the federal alternative minimum tax. It is not adjusted to reflect sales charges, expenses, or other fees that the Securities and Exchange Commission (SEC) requires to be reflected in the Fund's performance.
3 The LNYMDA represents the average of the total returns reported by all of the mutual funds designated by Lipper, Inc. as falling into the respective category. These total returns are reported net of expenses and other fees that the SEC requires to be reflected in a mutual fund's performance.
4 Total return quoted reflects all applicable sales charges and contingent deferred sales charges.
Portfolio of Investments Summary Tables
At August 31, 2004, the fund's credit quality ratings composition 1 was as follows:
S&P Long-Term Ratings as
Percentage of Total Investments 2
| | Moody's Long-Term Ratings as
Percentage of Total Investments 2
|
AAA
|
| 29.4%
| | Aaa
|
| 28.9%
|
AA
|
| 20.5%
| | Aa
|
| 8.3%
|
A
|
| 16.7%
| | A
|
| 14.0%
|
BBB
|
| 9.7%
| | Baa
|
| 17.3%
|
BB
|
| 2.3%
| | Ba
|
| 4.3%
|
B
|
| 0.0%
| | B
|
| 0.0%
|
Not rated by S&P
|
| 21.4%
| | Not rated by Moody's
|
| 27.2%
|
TOTAL
|
| 100.0%
| | TOTAL
|
| 100.0%
|
1 These tables depict the long-term credit quality ratings assigned to the fund's portfolio holdings by Standard & Poor's and Moody's Investors Service, each of which is a Nationally Recognized Statistical Rating Organization (NRSRO). These credit-quality ratings are shown without regard to gradations within a given rating category. For example, securities rated "A-" have been included in the "A" rated category. Holdings that are rated only by a different NRSRO than the one identified have been included in the "Not rated by..." category. Rated securities that have been pre-refunded, but not rated again by the NRSRO, also have been included in the "Not rated by..." category. Rated securities include a security with an obligor and/or credit enhancer that has received a rating from an NRSRO with respect to a class of debt obligations that is comparable in priority and security with the security held by the fund. Credit quality ratings are an assessment of the risk that a security will default in payment and do not address other risks presented by the security. Please see the description of credit quality ratings in the fund's Statement of Additional Information.
Each table depicts the long-term credit quality ratings as assigned only by the NRSRO identified in the table. Of the portfolio's total investments, 7.4% is not rated by either of these NRSROs.
2 Percentages are based on total investments, which may differ from total net assets.
Portfolio of Investments
August 31, 2004
Principal
Amount
|
|
|
| Credit
Rating
| 1
|
| Value
|
| | | LONG-TERM MUNICIPALS--96.6% | | | | | |
| | | New York--90.4% | | | | | |
| $ | 500,000 | | Albany, NY IDA, Civic Facility Revenue Bonds (Series A), 5.75% (Albany Law School)/(Radian Asset Assurance INS)/(Original Issue Yield: 5.83%), 10/1/2030
| | AA/NR/NR | | $ | 531,685 |
| 500,000 | | Amherst, NY, IDA, Civic Facility Revenue Bonds (Series 2000B), 5.75% (UBF Faculty-Student Housing Corp.)/(AMBAC INS)/(Original Issue Yield: 5.82%), 8/1/2025
| | AAA/Aaa/AAA | | | 557,860 |
| 300,000 | | Dutchess County, NY, IDA, Refunding Revenue Bonds (Series 2004A), 7.50% (St. Francis Hospital and Health Centers), 3/1/2029
| | NR | | | 297,048 |
| 785,000 | | Dutchess County, NY, IDA, Revenue Bonds (Series A), 5.00% (Marist College)/(Original Issue Yield: 5.15%), 7/1/2020
| | NR/Baa1/NR | | | 807,820 |
| 500,000 | | East Rochester, NY, Housing Authority, Revenue Bonds (Series 2002A), 5.375% (Rochester St. Mary's Residence Facility, LLC)/(GNMA GTD), 12/20/2022
| | AAA/NR/NR | | | 534,730 |
| 750,000 | | Erie County, NY, Public Improvement UT GO Bonds (Series 2003A), 5.25% (FGIC INS), 3/15/2020
| | NR/Aaa/AAA | | | 817,522 |
| 500,000 | | Essex County, NY, IDA, Solid Waste Disposal Revenue Bonds (Series A), 5.80% (International Paper Co.), 12/1/2019
| | BBB/Baa2/NR | | | 517,190 |
| 500,000 | | Hempstead Town, NY, IDA, Civic Facility Revenue Bonds, 5.00% (Hofstra University)/(Original Issue Yield: 5.10%), 7/1/2033
| | A/Baa1/NR | | | 503,695 |
| 220,000 | | Islip, NY, Resource Recovery Agency, Resource Recovery Revenue Bonds (Series 2001E), 5.75% (FSA INS), 7/1/2023
| | AAA/Aaa/AAA | | | 237,576 |
| 1,000,000 | | Long Island Power Authority, NY, Electric System General Revenue Bonds (Series 2003B), 5.25%, 12/1/2014
| | A-/Baa1/A- | | | 1,104,740 |
| 750,000 | | Long Island Power Authority, NY, Electric System Revenue Bonds (Series A), 5.50% (Escrowed In Treasuries COL), 12/1/2012
| | AAA/Aaa/AAA | | | 869,572 |
| 500,000 | | Madison County, NY, IDA, Civic Facility Revenue Bonds (Series 2003A), 5.00% (Colgate University), 7/1/2023
| | AA-/Aa3/NR | | | 520,805 |
| 750,000 | | Metropolitan Transportation Authority, NY, Refunding Revenue Bonds (Series 2002A), 5.50% (AMBAC INS), 11/15/2018
| | AAA/Aaa/AAA | | | 845,992 |
| 500,000 | | Monroe County, NY, IDA, Civic Center Revenue Bonds, 5.25% (St. John Fisher College)/(Radian Asset Assurance Insurance)/(Original Issue Yield: 5.25%), 6/1/2026
| | AA/NR/NR | | | 519,325 |
| 500,000 | | Monroe County, NY, IDA, Civic Facility Revenue Bond, 5.25% (Nazareth College)/(MBIA Insurance Corp. INS), 10/1/2021
| | NR/Aaa/AAA | | | 537,655 |
Principal
Amount
|
|
|
| Credit
Rating
| 1
|
| Value
|
| | | LONG-TERM MUNICIPALS--continued | | | | | |
| | | New York--continued | | | | | |
| $ | 210,000 | | Nassau County, NY, IDA, Civic Facility Refunding Revenue Bonds (Series 2001B), 5.875% (North Shore-Long Island Jewish Obligated Group)/(Original Issue Yield: 5.92%), 11/1/2011
| | NR/A3/A- | | $ | 231,657 |
| 305,000 | | Nassau County, NY, IDA, Civic Facility Revenue Bonds, 6.85% (Hofstra University)/(U.S. Treasury PRF 1/1/2005 @ 102), 1/1/2012
| | A/Baa1/NR | | | 316,617 |
| 330,000 | | Nassau County, NY, IDA, Civic Facility Revenue Bonds, 6.85% (Hofstra University)/(U.S. Treasury PRF 1/1/2005 @ 102), 1/1/2013
| | A/Baa1/NR | | | 342,570 |
| 500,000 | | Nassau County, NY, IDA, Industrial Development Revenue Bonds (Series 2003A), 5.25% (Keyspan-Glenwood Energy Center, LLC)/(KeySpan Corp. GTD), 6/1/2027
| | A/A3/NR | | | 507,705 |
| 625,000 | | New York City, NY, Health and Hospitals Corp., Health System Revenue Bonds (Series 2002A), 5.50% (FSA INS), 2/15/2019
| | AAA/Aaa/AAA | | | 694,569 |
| 440,000 | | New York City, NY, Health and Hospitals Corp., Health System Revenue Bonds (Series 2003A), 5.00% (AMBAC INS), 2/15/2011
| | AAA/Aaa/AAA | | | 485,936 |
| 500,000 | | New York City, NY, IDA (Series 1995) Civic Facility Revenue Bonds, 6.30% (College of New Rochelle)/(Original Issue Yield: 6.45%), 9/1/2015
| | NR/Baa2/NR | | | 519,445 |
| 250,000 | | New York City, NY, IDA, Civic Facilities Revenue Bonds, 5.375% (New York University)/(AMBAC INS), 7/1/2017
| | AAA/Aaa/AAA | | | 277,937 |
| 400,000 | | New York City, NY, IDA, Civic Facility Revenue Bonds (Series 2001A), 6.375% (Staten Island University Hospital), 7/1/2031
| | NR/Ba3/BB- | | | 374,908 |
| 300,000 | | New York City, NY, IDA, Civic Facility Revenue Bonds (Series 2002A), 5.375% (Lycee Francais de New York Project)/(American Capital Access INS)/(Original Issue Yield: 5.43%), 6/1/2023
| | A/NR/NR | | | 305,880 |
| 200,000 | | New York City, NY, IDA, Civic Facility Revenue Bonds (Series 2002C), 6.45% (Staten Island University Hospital), 7/1/2032
| | NR/Ba3/BB- | | | 189,142 |
| 1,000,000 | | New York City, NY, IDA, Civic Facility Revenue Bonds (Series 2003), 5.00% (Roundabout Theatre Co., Inc.)/(American Capital Access INS), 10/1/2023
| | A/NR/NR | | | 1,003,220 |
| 315,000 | | New York City, NY, IDA, Civic Facility Revenue Bonds, 7.00% (Mt. St. Vincent College, NY), 5/1/2008
| | NR | | | 321,697 |
| 500,000 | | New York City, NY, IDA, Industrial Development Empowerment Zone Revenue Bonds (Series 2004), 5.125% (General Motors Corp.), 12/30/2023
| | BBB/Baa1/BBB+ | | | 498,140 |
| 500,000 | | New York City, NY, IDA, Special Airport Facility Revenue Bonds (Series 2001A), 5.50% (Airis JFK I LLC Project at JFK International)/(Original Issue Yield: 5.65%), 7/1/2028
| | BBB-/Baa3/NR | | | 488,920 |
| 500,000 | | New York City, NY, IDA, Special Facilities Revenue Bonds, 5.25% (British Airways), 12/1/2032
| | BB+/Ba2/NR | | | 362,335 |
Principal
Amount
|
|
|
| Credit
Rating
| 1
|
| Value
|
| | | LONG-TERM MUNICIPALS--continued | | | | | |
| | | New York--continued | | | | | |
| $ | 500,000 | | New York City, NY, Municipal Water Finance Authority, Crossover Refunding Revenue Bonds (Series 2002B), 5.00% (Original Issue Yield: 5.14%), 6/15/2026
| | AA+/Aa2/AA | | $ | 508,745 |
| 500,000 | | New York City, NY, Transitional Finance Authority, Future Tax Secured Bonds (Series 2003), 5.25% (AMBAC INS), 8/1/2022
| | AAA/Aaa/AAA | | | 535,900 |
| 500,000 | | New York City, NY, Transitional Finance Authority, Future Tax Secured Revenue Bonds (Series 2001C), 5.375%, 2/1/2015
| | AA+/Aa2/AA+ | | | 550,330 |
| 500,000 | | New York City, NY, UT GO Bonds (Fiscal 2005 Series C), 5.25%, 8/15/2025
| | A/A2/A+ | | | 524,450 |
| 515,000 | | New York City, NY, UT GO Bonds (Series 2002C), 5.50%, 3/15/2015
| | A/A2/A+ | | | 563,616 |
| 500,000 | | New York City, NY, UT GO Bonds (Series 2003J), 5.50%, 6/1/2023
| | A/A2/NR | | | 539,740 |
| 500,000 | | New York Counties Tobacco Trust III, Revenue Bonds, 5.75% (Original Issue Yield: 5.93%), 6/1/2033
| | BBB/Ba1/NR | | | 471,520 |
| 500,000 | | New York State Dormitory Authority, Court Facilities Lease Revenue Bonds (Series 2003A), 5.375% (New York City, NY), 5/15/2023
| | A/A3/A | | | 532,490 |
| 500,000 | | New York State Dormitory Authority, Education Facilities Revenue Bonds (Series 2002A), 5.125% (State University of New York)/(FGIC INS), 5/15/2021
| | AAA/Aaa/AAA | | | 567,875 |
| 500,000 | | New York State Dormitory Authority, FHA-Insured Mortgage Hospital Revenue Bonds (Series 2003), 5.00% (Lutheran Medical Center)/(MBIA Insurance Corp. INS), 8/1/2016
| | AAA/Aaa/AAA | | | 539,680 |
| 500,000 | | New York State Dormitory Authority, FHA-Insured Mortgage Nursing Home Revenue Bonds (Series 2001), 6.10% (Norwegian Christian Home and Health Center)/(FHA and MBIA Insurance Corp. INS), 8/1/2041
| | AAA/Aaa/AAA | | | 552,860 |
| 1,000,000 | | New York State Dormitory Authority, Insured Revenue Bonds (Series 1999), 6.00% (Pratt Institute)/(Radian Asset Assurance INS), 7/1/2020
| | AA/NR/NR | | | 1,130,960 |
| 750,000 | | New York State Dormitory Authority, Revenue Bonds (2003 Series 1), 5.00% (Memorial Sloan-Kettering Cancer Center)/(MBIA Insurance Corp. INS), 7/1/2022
| | AAA/Aaa/AAA | | | 782,880 |
| 500,000 | | New York State Dormitory Authority, Revenue Bonds (Series 1993A), 5.75% (City University of New York)/(FSA INS)/(Original Issue Yield: 6.05%), 7/1/2018
| | AAA/Aaa/AAA | | | 592,065 |
| 250,000 | | New York State Dormitory Authority, Revenue Bonds (Series 2000B), 6.25% (Mt. Sinai NYU Health Obligated Group), 7/1/2022
| | BB/Ba1/BB+ | | | 251,548 |
| 750,000 | | New York State Dormitory Authority, Revenue Bonds (Series 2001A), 5.00% (NYSARC, Inc.)/(FSA INS), 7/1/2013
| | AAA/Aaa/AAA | | | 828,195 |
Principal
Amount
|
|
|
| Credit
Rating
| 1
|
| Value
|
| | | LONG-TERM MUNICIPALS--continued | | | | | |
| | | New York--continued | | | | | |
| $ | 500,000 | | New York State Dormitory Authority, Revenue Bonds (Series 2002), 5.00% (Fordham University)/(FGIC INS), 7/1/2022
| | AAA/Aaa/AAA | | $ | 523,550 |
| 500,000 | | New York State Dormitory Authority, Revenue Bonds (Series 2002D), 5.00% (School Districts Financing Program)/(MBIA Insurance Corp. INS), 10/1/2012
| | AAA/Aaa/AAA | | | 557,795 |
| 750,000 | | New York State Dormitory Authority, Revenue Bonds (Series 2003), 5.00% (Kateri Residence)/(Allied Irish Banks PLC LOC), 7/1/2022
| | NR/Aa3/NR | | | 766,883 |
| 250,000 | | New York State Dormitory Authority, Revenue Bonds (Series 2003), 5.375% (North Shore-Long Island Jewish Obligated Group)/(Original Issue Yield: 5.48%), 5/1/2023
| | NR/A3/A- | | | 259,987 |
| 500,000 | | New York State Dormitory Authority, Revenue Bonds (Series 2003A), 5.50% (Brooklyn Law School)/(Radian Asset Assurance INS), 7/1/2018
| | AA/NR/NR | | | 550,825 |
| 750,000 | | New York State Dormitory Authority, Revenue Bonds (Series 2003A), 5.50% (Winthrop-University Hospital Association)/(Original Issue Yield: 5.70%), 7/1/2023
| | NR/Baa1/BBB+ | | | 772,410 |
| 500,000 | | New York State Dormitory Authority, Revenue Bonds (Series 2004), 5.25% (New York Methodist Hospital), 7/1/2024
| | NR/A3/NR | | | 517,635 |
| 250,000 | | New York State Dormitory Authority, Revenue Bonds (Series 2004A), 5.25% (University of Rochester, NY), 7/1/2024
| | A+/A1/NR | | | 265,057 |
| 250,000 | | New York State Dormitory Authority, Revenue Bonds, 5.00% (Manhattan College)/(Radian Asset Assurance INS)/(Original Issue Yield: 5.30%), 7/1/2020
| | AA/ NR/NR | | | 262,653 |
| 500,000 | | New York State Dormitory Authority, Revenue Bonds, 5.25% (Cansius College)/(MBIA Insurance Corp. INS)/(Original Issue Yield: 5.28%), 7/1/2030
| | AAA/Aaa/AAA | | | 520,975 |
| 500,000 | | New York State Dormitory Authority, Revenue Bonds, 6.25% (Nyack Hospital)/(Original Issue Yield: 6.50%), 7/1/2013
| | NR/Ba3/B+ | | | 457,675 |
| 400,000 | | New York State Environmental Facilities Corp. State Clean Water and Drinking Water, Revenue Bonds (Series 2002B), 5.00% (Original Issue Yield: 5.07%), 6/15/2022
| | AAA/Aaa/AAA | | | 419,556 |
| 500,000 | | New York State Environmental Facilities Corp., Revenue Bonds (Series 2002A), 5.25% (New York State Personal Income Tax Revenue Bond Fund)/(FGIC INS), 1/1/2021
| | AAA/Aaa/AAA | | | 540,765 |
| 300,000 | | New York State Environmental Facilities Corp., Solid Waste Disposal Revenue Bonds (Series 2002A), 2.90% TOBs (Waste Management, Inc.), Mandatory Tender 5/1/2012
| | BBB/NR/NR | | | 300,906 |
| 500,000 | | New York State Environmental Facilities Corp., Solid Waste Disposal Revenue Bonds (Series 2004A), 4.45% TOBs (Waste Management, Inc.), Mandatory Tender 7/1/2017
| | BBB/NR/NR | | | 513,535 |
Principal
Amount
|
|
|
| Credit
Rating
| 1
|
| Value
|
| | | LONG-TERM MUNICIPALS--continued | | | | | |
| | | New York--continued | | | | | |
| $ | 500,000 | | New York State Environmental Facilities Corp., Solid Waste Disposal Revenue Bonds, 6.10% (Occidental Petroleum Corp.)/(Original Issue Yield: 6.214%), 11/1/2030
| | BBB+/Baa1/NR | | $ | 516,635 |
| 900,000 | | New York State Environmental Facilities Corp., Water Facilities Revenue Refunding Bonds (Series A), 6.30% (Spring Valley Water Co., NY)/(AMBAC INS), 8/1/2024
| | AAA/Aaa/AAA | | | 945,450 |
| 110,000 | | New York State HFA, Revenue Bond, 6.375% (U.S. Treasury PRF 9/15/2005 @ 102), 9/15/2015
| | AA-/A3/NR | | | 117,615 |
| 5,000 | | New York State HFA, Revenue Bond, 6.375%, 9/15/2015
| | AA-/A3/NR | | | 5,309 |
| 500,000 | | New York State HFA, Revenue Bonds (Series 2003A), 5.25% (New York State Personal Income Tax Revenue Bond Fund), 3/15/2021
| | AA/ NR/AA- | | | 536,780 |
| 925,000 | | New York State Medical Care Facilities Finance Agency, FHA-Mortgage Revenue Bonds (Series A), 6.50% (Lockport Memorial Hospital, NY)/(FHA GTD), 2/15/2035
| | AA/Aa2/NR | | | 961,288 |
| 190,000 | | New York State Medical Care Facilities Finance Agency, Revenue Bonds (Series B), 6.60% (FHA GTD)/(Original Issue Yield: 6.625%), 8/15/2034
| | AA/Aa2/NR | | | 194,558 |
| 500,000 | | New York State Power Authority, Revenue Bonds (Series 2002A), 5.00%, 11/15/2021
| | AA-/Aa2/AA | | | 526,605 |
| 500,000 | | New York State Thruway Authority (Series 2003A), 5.25% (New York State Thruway Authority - Highway and Bridge Trust Fund)/(MBIA Insurance Corp. INS), 4/1/2014
| | AAA/Aaa/AAA | | | 560,950 |
| 500,000 | | New York State Urban Development Corp., Correctional & Youth Facilities Service Contract Revenue Bonds (Series 2002A), 5.50% TOBs (New York State), Mandatory Tender 1/1/2017
| | AA-/A3/A+ | | | 555,590 |
| 750,000 | | New York State Urban Development Corp., Revenue Bonds (Series 2003B), 5.25% (New York State Personal Income Tax Revenue Bond Fund), 3/15/2019
| | AA/NR/AA- | | | 816,953 |
| 500,000 | | New York State Urban Development Corp., Revenue Bonds (Series A-1), 5.00% (New York State Personal Income Tax Revenue Bond Fund), 12/15/2013
| | AA/A1/AA- | | | 553,910 |
| 500,000 | | New York State Urban Development Corp., Subordinated Lien Revenue Bonds (Series 2004A), 5.125% (Empire State Development Corp.), 1/1/2022
| | A/A2/A | | | 519,945 |
| 500,000 | | Niagara County, NY, IDA, Solid Waste Disposal Facility Revenue Refunding Bonds (Series 2001D), 5.55% TOBs (American Ref-Fuel Co. of Niagara, L.P. Facility) 11/15/2015, Maturity 11/15/2024
| | BBB/Baa1/NR | | | 530,020 |
| 400,000 | | Niagara Falls, NY, City School District, COPs (Series 1998), 5.375% (Original Issue Yield: 5.42%), 6/15/2028
| | BBB-/Baa3/NR | | | 404,124 |
| 500,000 | | Port Authority of New York and New Jersey, Revenue Bonds (128th Series), 5.00% (FSA INS), 11/1/2019
| | AAA/Aaa/AAA | | | 534,705 |
Principal
Amount
|
|
|
| Credit
Rating
| 1
|
| Value
|
| | | LONG-TERM MUNICIPALS--continued | | | | | |
| | | New York--continued | | | | | |
| $ | 500,000 | | Suffolk County, NY, IDA, IDRBs (Series 1998), 5.50% (Nissequogue Cogen Partners Facility)/(Original Issue Yield: 5.528%), 1/1/2023
| | NR | | $ | 474,780 |
| 500,000 | | Tobacco Settlement Financing Corp., NY, Asset-Backed Revenue Bonds (Series 2003A-1), 5.50% (New York State), 6/1/2019
| | AA-/A3/A+ | | | 549,265 |
| 440,000 | | Tompkins County, NY, Industrial Development Agency, Continuing Care Retirement Community Revenue Bonds (Series 2003A), 5.375% (Kendal at Ithaca, Inc.)/(Original Issue Yield: 5.50%), 7/1/2018
| | BBB/NR/NR | | | 447,806 |
| 500,000 | | United Nations, NY Development Corp., Senior Lien Refunding Revenue Bonds (Series 2004A), 5.25%, 7/1/2022
| | NR/A3/A- | | | 531,455 |
| 300,000 | | Utica, NY, IDA, Civic Facility, Revenue Bonds (Series 2004A), 6.875% (Utica College), 12/1/2024
| | NR | | | 320,916 |
| 500,000 | | Westchester County, NY, IDA, Civic Facility Revenue Bonds (Series 2001), 5.20% (Windward School)/(Radian Asset Assurance INS)/(Original Issue Yield: 5.21%), 10/1/2021
| | AA/NR/NR | | | 526,365 |
| 175,000 | | Westchester County, NY, IDA, Continuing Care Retirement Mortgage Revenue Bonds (Series 2003A), 6.375% (Kendal on Hudson)/(Original Issue Yield: 6.55%), 1/1/2024
| | NR | | | 177,975 |
| 500,000 | | Yonkers, NY, IDA, Civic Facility Revenue Bonds (Series 2001B), 7.125% (St. John's Riverside Hospital), 7/1/2031
|
| BB/NR/NR
|
|
| 507,315
|
| | | TOTAL
|
|
|
|
| 44,643,268
|
| | | Puerto Rico--6.2% | | | | | |
| 500,000 | 2,3 | Puerto Rico Electric Power Authority, Drivers (Series 266), 9.415% (FSA INS), 7/1/2015
| | AAA/NR/NR | | | 669,640 |
| 1,000,000 | 2,3 | Puerto Rico Highway and Transportation Authority, Residual Interest Tax-Exempt Securities (Series PA 331A), 9.152% (AMBAC INS), 1/1/2010
| | NR | | | 1,320,540 |
| 500,000 | | Puerto Rico Highway and Transportation Authority, Transportation Revenue Bonds (Series G), 5.00% (Original Issue Yield: 5.10%), 7/1/2033
| | A/Baa1/NR | | | 505,305 |
| 135,000 | | Puerto Rico Public Building Authority, Revenue Bonds (Series 2002D), 5.25% (Original Issue Yield: 5.40%), 7/1/2027
| | A-/Baa1/NR | | | 139,658 |
| 365,000 | | Puerto Rico Public Building Authority, Revenue Bonds (Series 2002D), 5.25% (U.S. Treasury PRF 7/01/2012 @ 100)/(Original Issue Yield: 5.40%), 7/1/2027
|
| A-/Baa1/NR
|
|
| 414,166
|
| | | TOTAL
|
|
|
|
| 3,049,309
|
| | | TOTAL LONG-TERM MUNICIPALS (IDENTIFIED COST $46,333,899)
|
|
|
|
| 47,692,577
|
Principal
Amount
|
|
|
| Credit
Rating
| 1
|
| Value
|
| | | SHORT-TERM MUNICIPALS--1.6% | | | | | |
| | | Puerto Rico--1.6% | | | | | |
| $ | 800,000 | | Puerto Rico Government Development Bank (GDB) Weekly VRDNs (MBIA Insurance Corp. INS)/(Credit Suisse First Boston LIQ) (AT AMORTIZED COST)
|
| A-1/ VMIG1
|
| $
| 800,000
|
| | | TOTAL INVESTMENTS--98.2% (IDENTIFIED COST $47,133,899) 4
|
|
|
|
| 48,492,577
|
| | | OTHER ASSETS AND LIABILITIES - NET--1.8%
|
|
|
|
| 909,411
|
| | | TOTAL NET ASSETS--100%
|
|
|
| $
| 49,401,988
|
Securities that are subject to the federal alternative minimum tax (AMT) represent 11.1% of the fund's portfolio as calculated based upon total portfolio market value (percentage is unaudited).
1 Please refer to the Statement of Additional Information for an explanation of the credit ratings. Current credit ratings are unaudited.
2 Denotes a restricted security, including securities purchased under Rule 144A of the Securities Act of 1933. These securities, unless registered under the Act or exempted from registration, may only be sold to qualified institutional investors. At August 31, 2004, these securities amounted to $1,990,180 which represents 4.0% of total net assets.
3 Denotes a restricted security, including securities purchased under Rule 144A that have been deemed liquid by criteria approved by the Fund's Board of Trustees. At August 31, 2004, these securities amounted to $1,990,180 which represents 4.0% of total net assets.
4 The cost of investments for federal tax purposes amounts to $47,131,000.
Note: The categories of investments are shown as a percentage of total net assets at August 31, 2004.
The following acronyms are used throughout this portfolio:
| AMBAC | - --American Municipal Bond Assurance Corporation |
| COL | - --Collateralized |
| COPs | - --Certificate of Participation |
| FGIC | - --Financial Guaranty Insurance Company |
| FHA | - --Federal Housing Administration |
| FSA | - --Financial Security Assurance |
| GNMA | - --Government National Mortgage Association |
| GO | - --General Obligation |
| GTD | - --Guaranteed |
| HFA | - --Housing Finance Authority |
| IDA | - --Industrial Development Authority |
| IDRBs | - --Industrial Development Revenue Bonds |
| INS | - --Insured |
| LIQ | - --Liquidity Agreement |
| LOC | - --Letter of Credit |
| PRF | - --Prerefunded |
| TOBs | - --Tender Option Bonds |
| UT | - --Unlimited Tax |
| VRDNs | - --Variable Rate Demand Notes |
See Notes which are an integral part of the Financial Statements
Statement of Assets and Liabilities
August 31, 2004
Assets:
| | | | | | | |
Total investments in securities, at value (identified cost $47,133,899)
| | | | | $ | 48,492,577 | |
Cash
| | | | | | 3,159 | |
Income receivable
| | | | | | 567,685 | |
Receivable for investments sold
| | | | | | 505,000 | |
Receivable for shares sold
|
|
|
|
|
| 8,795
|
|
TOTAL ASSETS
|
|
|
|
|
| 49,577,216
|
|
Liabilities:
| | | | | | | |
Payable for shares redeemed
| | $ | 20,616 | | | | |
Income distribution payable
| | | 79,030 | | | | |
Payable for daily variation margin
| | | 38,740 | | | | |
Payable for distribution services fee (Note 5)
| | | 13,609 | | | | |
Payable for shareholder services fee (Note 5)
| | | 10,330 | | | | |
Accrued expenses
|
|
| 12,903
|
|
|
|
|
TOTAL LIABILITIES
|
|
|
|
|
| 175,228
|
|
Net assets for 4,640,691 shares outstanding
|
|
|
|
| $
| 49,401,988
|
|
Net Assets Consist of:
| | | | | | | |
Paid-in capital
| | | | | $ | 49,032,448 | |
Net unrealized appreciation of investments
| | | | | | 1,358,678 | |
Accumulated net realized loss on investments, futures contracts and swap contracts
| | | | | | (989,114 | ) |
Distributions in excess of net investment income
|
|
|
|
|
| (24
| )
|
TOTAL NET ASSETS
|
|
|
|
| $
| 49,401,988
|
|
Net Asset Value, Offering Price and Redemption Proceeds Per Share
| | | | | | | |
Class A Shares:
| | | | | | | |
Net asset value per share ($27,599,613 ÷ 2,592,646 shares outstanding), no par value, unlimited shares authorized
|
|
|
|
|
| $10.65
|
|
Offering price per share (100/95.50 of $10.65) 1
|
|
|
|
|
| $11.15
|
|
Redemption proceeds per share
|
|
|
|
|
| $10.65
|
|
Class B Shares:
| | | | | | | |
Net asset value per share ($21,802,375 ÷ 2,048,045 shares outstanding), no par value, unlimited shares authorized
|
|
|
|
|
| $10.65
|
|
Offering price per share
|
|
|
|
|
| $10.65
|
|
Redemption proceeds per share (94.50/100 of $10.65) 1
|
|
|
|
|
| $10.06
|
|
1 See "What Do Shares Cost?" in the Prospectus.
See Notes which are an integral part of the Financial Statements
Statement of Operations
Year Ended August 31, 2004
Investment Income:
| | | | | | | | | | | | |
Interest
|
|
|
|
|
|
|
|
|
| $
| 2,406,589
|
|
Expenses:
| | | | | | | | | | | | |
Investment adviser fee (Note 5)
| | | | | | $ | 194,916 | | | | | |
Administrative personnel and services fee (Note 5)
| | | | | | | 184,167 | | | | | |
Custodian fees
| | | | | | | 2,770 | | | | | |
Transfer and dividend disbursing agent fees and expenses (Note 5)
| | | | | | | 43,467 | | | | | |
Directors'/Trustees' fees
| | | | | | | 1,982 | | | | | |
Auditing fees
| | | | | | | 16,475 | | | | | |
Legal fees
| | | | | | | 5,845 | | | | | |
Portfolio accounting fees (Note 5)
| | | | | | | 64,496 | | | | | |
Distribution services fee--Class A Shares (Note 5)
| | | | | | | 68,620 | | | | | |
Distribution services fee--Class B Shares (Note 5)
| | | | | | | 159,606 | | | | | |
Shareholder services fee--Class A Shares (Note 5)
| | | | | | | 68,620 | | | | | |
Shareholder services fee--Class B Shares (Note 5)
| | | | | | | 53,202 | | | | | |
Share registration costs
| | | | | | | 33,493 | | | | | |
Printing and postage
| | | | | | | 19,809 | | | | | |
Insurance premiums
| | | | | | | 7,527 | | | | | |
Miscellaneous
|
|
|
|
|
|
| 1,378
|
|
|
|
|
|
TOTAL EXPENSES
|
|
|
|
|
|
| 926,373
|
|
|
|
|
|
Waivers and Reimbursement (Note 5):
| | | | | | | | | | | | |
Waiver of investment adviser fee
| | $ | (194,916 | ) | | | | | | | | |
Waiver of administrative personnel and services fee
| | | (28,758 | ) | | | | | | | | |
Waiver of transfer and dividend disbursing agent fees and expenses
| | | (1,502 | ) | | | | | | | | |
Waiver of distribution services fee--Class A Shares
| | | (68,620 | ) | | | | | | | | |
Reimbursement of other operating expenses
|
|
| (173,337
| )
|
|
|
|
|
|
|
|
|
TOTAL WAIVERS AND REIMBURSEMENT
|
|
|
|
|
|
| (467,133
| )
|
|
|
|
|
Net expenses
|
|
|
|
|
|
|
|
|
|
| 459,240
|
|
Net investment income
|
|
|
|
|
|
|
|
|
|
| 1,947,349
|
|
Realized and Unrealized Gain (Loss) on Investments, Futures Contracts and Swap Contracts:
| | | | | | | | | | | | |
Net realized gain on investments
| | | | | | | | | | | 49,536 | |
Net realized loss on futures contracts
| | | | | | | | | | | (220,857 | ) |
Net realized loss on swap contracts
| | | | | | | | | | | (160,000 | ) |
Net change in unrealized appreciation of investments
| | | | | | | | | | | 1,259,026 | |
Net change in unrealized appreciation on swap contracts
|
|
|
|
|
|
|
|
|
|
| (67,972
| )
|
Net realized and unrealized gain on investments, futures contracts and swap contracts
|
|
|
|
|
|
|
|
|
|
| 859,733
|
|
Change in net assets resulting from operations
|
|
|
|
|
|
|
|
|
| $
| 2,807,082
|
|
See Notes which are an integral part of the Financial Statements
Statement of Changes in Net Assets
Year Ended August 31
|
|
| 2004
|
|
|
| 2003
|
|
Increase (Decrease) in Net Assets
| | | | | | | | |
Operations:
| | | | | | | | |
Net investment income
| | $ | 1,947,349 | | | $ | 1,366,381 | |
Net realized loss on investments, futures contracts and swap contracts
| | | (331,321 | ) | | | (345,918 | ) |
Net change in unrealized appreciation/depreciation of investments and swap contracts
|
|
| 1,191,054
|
|
|
| (428,398
| )
|
CHANGE IN NET ASSETS RESULTING FROM OPERATIONS
|
|
| 2,807,082
|
|
|
| 592,065
|
|
Distributions to Shareholders:
| | | | | | | | |
Distributions from net investment income
| | | | | | | | |
Class A Shares
| | | (1,187,212 | ) | | | (1,035,187 | ) |
Class B Shares
|
|
| (759,679
| )
|
|
| (330,748
| )
|
CHANGE IN NET ASSETS RESULTING FROM DISTRIBUTIONS TO SHAREHOLDERS
|
|
| (1,946,891
| )
|
|
| (1,365,935
| )
|
Share Transactions:
| | | | | | | | |
Proceeds from sale of shares
| | | 10,782,409 | | | | 31,038,243 | |
Net asset value of shares issued to shareholders in payment of distributions declared
| | | 978,809 | | | | 604,599 | |
Cost of shares redeemed
|
|
| (8,891,672
| )
|
|
| (8,662,912
| )
|
CHANGE IN NET ASSETS RESULTING FROM SHARE TRANSACTIONS
|
|
| 2,869,546
|
|
|
| 22,979,930
|
|
Change in net assets
|
|
| 3,729,737
|
|
|
| 22,206,060
|
|
Net Assets:
| | | | | | | | |
Beginning of period
|
|
| 45,672,251
|
|
|
| 23,466,191
|
|
End of period (including distributions in excess of net investment income of $(24) and $(31), respectively)
|
| $
| 49,401,988
|
|
| $
| 45,672,251
|
|
See Notes which are an integral part of the Financial Statements
Notes to Financial Statements
August 31, 2004
1. ORGANIZATION
Federated Municipal Securities Income Trust (the "Trust") is registered under the Investment Company Act of 1940, as amended (the "Act"), as an open-end management investment company. The Trust consists of seven portfolios. The financial statements included herein are only those of Federated New York Municipal Income Fund (the "Fund"), a non-diversified portfolio. The financial statements of the other portfolios are presented separately. The assets of each portfolio are segregated and a shareholder's interest is limited to the portfolio in which shares are held. The investment objective of the Fund is to provide current income exempt from federal regular income tax (federal regular income tax does not include the federal AMT) and the personal income taxes imposed by the state of New York and New York municipalities. The Fund offers two classes of shares: Class A Shares and Class B Shares.
2. SIGNIFICANT ACCOUNTING POLICIES
The following is a summary of significant accounting policies consistently followed by the Fund in the preparation of its financial statements. These policies are in conformity with generally accepted accounting principles (GAAP) in the United States of America.
Investment Valuation
Municipal bonds are valued by an independent pricing service, taking into consideration yield, liquidity, risk, credit quality, coupon, maturity, type of issue, and any other factors or market data the pricing service deems relevant. Short-term securities are valued at the prices provided by an independent pricing service. However, short-term securities with remaining maturities of 60 days or less at the time of purchase may be valued at amortized cost, which approximates fair market value. Securities for which no quotations are readily available are valued at fair value as determined in accordance with procedures established by and under general supervision of the Board of Trustees (the "Trustees").
Investment Income, Gains and Losses, Expenses and Distributions
Interest income and expenses are accrued daily. Dividend income and distributions to shareholders are recorded on the ex-dividend date. Non-cash dividends included in dividend income, if any, are recorded at fair value. Investment income, realized and unrealized gains and losses, and certain fund-level expenses are allocated to each class based on relative average daily net assets, except that each class bears certain expenses unique to that class such as distribution and service fees. Dividends are declared separately for each class. No class has preferential dividend rights; differences in per share dividend rates are generally due to differences in separate class expenses.
Premium and Discount Amortization
All premiums and discounts on fixed-income securities are amortized/accreted for financial statement purposes.
Federal Taxes
It is the Fund's policy to comply with the Subchapter M provision of the Internal Revenue Code (the "Code") and to distribute to shareholders each year substantially all of its income. Accordingly, no provision for federal income tax is necessary.
When-Issued and Delayed Delivery Transactions
The Fund may engage in when-issued or delayed delivery transactions. The Fund records when-issued securities on the trade date and maintains security positions such that sufficient liquid assets will be available to make payment for the securities purchased. Securities purchased on a when-issued or delayed delivery basis are marked to market daily and begin earning interest on the settlement date. Losses may occur on these transactions due to changes in market conditions or the failure of counterparties to perform under the contract.
Swap Contracts
The Fund may enter into swap contracts. A swap is an exchange of cash payments between the Fund and another party, which is based on a specific financial index. The value of the swap is adjusted daily and the change in value is recorded as unrealized appreciation or depreciation. When a swap contract is closed, the Fund recognizes a realized gain or loss. The swap contracts entered into by the Fund are on a forward settling basis. For the year ended August 31, 2004, the Fund had realized losses on swap contracts of $160,000.
Risks may arise upon entering into these agreements from the potential inability of the counterparties to meet the terms of their contract and from unanticipated changes in the value of the financial index on which the swap agreement is based. The Fund uses swaps for hedging purposes to reduce its exposure to interest rate fluctuations.
At August 31, 2004, the Fund had no open swap contracts.
Futures Contracts
The Fund periodically may sell bond interest rate futures contracts to manage duration and to potentially reduce transaction costs. Upon entering into a bond interest rate futures contract with a broker, the Fund is required to deposit in a segregated account a specified amount of cash or U.S. government securities. Futures contracts are valued daily and unrealized gains or losses are recorded in a "variation margin" account. Daily, the Fund receives from or pays to the broker a specified amount of cash based upon changes in the variation margin account. When a contract is closed, the Fund recognizes a realized gain or loss. For the year ended August 31, 2004, the Fund had realized loss on futures contracts of $220,857.
Futures contracts have market risks, including the risk that the change in the value of the contract may not correlate with the changes in the value of the underlying securities.
At August 31, 2004, the Fund had no open futures contracts.
Restricted Securities
Restricted securities are securities that may only be resold upon registration under federal securities laws or in transactions exempt from such registration. In some cases, the issuer of restricted securities has agreed to register such securities for resale, at the issuer's expense either upon demand by the Fund or in connection with another registered offering of the securities. Many restricted securities may be resold in the secondary market in transactions exempt from registration. Such restricted securities may be determined to be liquid under criteria established by the Trustees. The Fund will not incur any registration costs upon such resales. The Fund's restricted securities are valued at the price provided by dealers in the secondary market or, if no market prices are available, at the fair value as determined in accordance with procedures established by and under general supervision of the Trustees.
Additional information on restricted securities, including securities purchased under Rule 144A that have not been deemed liquid by the Trustees, for each security held at August 31, 2004, is as follows:
Security
|
| Acquisition Date
|
| Acquisition Cost
|
Puerto Rico Electric Power Authority, Drivers (Series 266), 9.415% (FSA INS), 7/1/2015
|
| 6/27/2002
|
| $ 618,530
|
Puerto Rico Highway and Transportation Authority, Residual Interest Tax-Exempt Securities (Series PA 331A), 9.152% (AMBAC INS), 1/1/2010
|
| 7/22/2003
|
| $1,306,810
|
Use of Estimates
The preparation of financial statements in conformity with GAAP requires management to make estimates and assumptions that affect the amounts of assets, liabilities, expenses and revenues reported in the financial statements. Actual results could differ from those estimated.
Other
Investment transactions are accounted for on a trade date basis. Realized gains and losses from investment transactions are recorded on an identified cost basis.
3. SHARES OF BENEFICIAL INTEREST
The following table summarizes share activity:
Year Ended August 31
|
| 2004
|
| 2003
|
Class A Shares:
|
| Shares
|
|
|
| Amount
|
|
| Shares
|
|
| Amount
|
|
Shares sold
| | 469,545 | | | $ | 4,997,940 | | | 1,017,750 | | | $ | 10,815,492 | |
Shares issued to shareholders in payment of distributions declared
|
|
43,270 |
|
| |
459,837 |
|
|
36,996 | |
| |
391,735 |
|
Shares redeemed
|
| (475,773
| )
|
|
| (5,041,882
| )
|
| (716,057
| )
|
|
| (7,607,396
| )
|
NET CHANGE RESULTING FROM CLASS A SHARE TRANSACTIONS
|
|
37,042
|
|
|
$
|
415,895
|
|
|
338,689
|
|
|
$
|
3,599,831
|
|
| | | | | | | | | | | | | |
Year Ended August 31
|
| 2004
|
| 2003
|
Class B Shares:
|
| Shares
|
|
|
| Amount
|
|
| Shares
|
|
|
| Amount
|
|
Shares sold
| | 542,789 | | | $ | 5,784,469 | | | 1,899,717 | | | $ | 20,222,751 | |
Shares issued to shareholders in payment of distributions declared
|
|
48,825 |
|
|
|
518,972 |
|
|
20,138 |
|
|
|
212,864 |
|
Shares redeemed
|
| (363,901
| )
|
|
| (3,849,790
| )
|
| (99,523
| )
|
|
| (1,055,516
| )
|
NET CHANGE RESULTING FROM CLASS B SHARE TRANSACTIONS
|
|
227,713
|
|
|
$
|
2,453,651
|
|
|
1,820,332
|
|
|
$
|
19,380,099
|
|
NET CHANGE RESULTING FROM SHARE TRANSACTIONS
|
|
264,755
|
|
|
$
|
2,869,546
|
|
|
2,159,021
|
|
|
$
|
22,979,930
|
|
4. FEDERAL TAX INFORMATION
The timing and character of income and capital gain distributions are determined in accordance with income tax regulations, which may differ from GAAP. These differences are due in part to differing treatments for expiration of capital loss carryforward and discount accretion/premium amortization on debt securities.
For the year ended August 31, 2004, permanent differences identified and reclassified among the components of net assets were as follows:
Increase (Decrease)
|
Paid-In Capital
|
| Undistributed
Net Investment
Income (Loss)
|
| Accumulated
Net Realized
Gains (Losses)
|
$(561,297)
|
| $(451)
|
| $561,748
|
Net investment income (loss), net realized gains (losses), and net assets were not affected by this reclassification.
The tax character of distributions as reported on the Statement of Changes in Net Assets for the years ended August 31, 2004 and August 31, 2003, was as follows:
|
| 2004
|
| 2003
|
Tax-exempt income
|
| $1,946,891
|
| $1,365,935
|
As of August 31, 2004, the components of distributable earnings on a tax basis were as follows:
Undistributed tax-exempt income
|
| $
| 79,006
|
Unrealized appreciation
|
| $
| 1,361,577
|
Capital loss carry-forward
|
| $
| 665,450
|
At August 31, 2004, the cost of investments for federal tax purposes was $47,131,000. The net unrealized appreciation of investments for federal tax purposes was $1,361,577. This consists of net unrealized appreciation from investments for those securities having an excess of value over cost of $1,636,663 and net unrealized depreciation from investments for those securities having an excess of cost over value of $275,086.
The difference between book-basis and tax-basis net unrealized appreciation/depreciation is attributable primarily to the amortization/accretion tax elections on fixed-income securities.
At August 31, 2004, the Fund had a capital loss carry-forward of $665,450 which will reduce the Fund's taxable income arising from future net realized gains on investments, if any, to the extent permitted by the Code and thus will reduce the amount of distributions to shareholders which would otherwise be necessary to relieve the Fund of any liability for federal tax. Pursuant to the Code, such capital loss carry-forward will expire as follows:
Expiration Year
|
| Expiration Amount
|
2008
|
| $288,795
|
2011
|
| $371,903
|
2012
|
| $ 4,752
|
Under current tax regulations, capital losses realized after October 31 may be deferred and treated as occurring on the first day of the following fiscal year. As of August 31, 2004, for federal income tax purposes, post October losses of $326,564 were deferred to September 1, 2004.
5. INVESTMENT ADVISER FEE AND OTHER TRANSACTIONS WITH AFFILIATES
Investment Adviser Fee
Federated Investment Mangement Company, the Fund's investment adviser (the "Adviser"), receives for its services an annual investment adviser fee equal to 0.40% of the Fund's average daily net assets. The Adviser may voluntarily choose to waive any portion of its fee and/or reimburse certain operating expenses of the Fund. The Adviser can modify or terminate this voluntary waiver and/or reimbursement at any time at its sole discretion.
Administrative Fee
Federated Administrative Services (FAS), under the Administrative Services Agreement, provides the Fund with administrative personnel and services. The fee paid to FAS is based on the average aggregate daily net assets of all Federated funds as specified below:
Maximum
Administrative Fee
|
| Average Aggregate Daily Net Assets
of the Federated Funds
|
0.150%
|
| on the first $5 billion
|
0.125%
|
| on the next $5 billion
|
0.100%
|
| on the next $10 billion
|
0.075%
|
| on assets in excess of $20 billion
|
The administrative fee received during any fiscal year shall be at least $150,000 per portfolio and $40,000 per each additional class of Shares. FAS may voluntarily choose to waive any portion of its fee. FAS can modify or terminate this voluntary waiver at any time at its sole discretion.
Prior to November 1, 2003, Federated Services Company (FServ) provided the Fund with administrative personnel and services. The fee paid to FServ was based on the average aggregate daily net assets of all Federated funds as specified below:
Maximum
Administrative Fee
|
| Average Aggregate Daily Net Assets
of the Federated Funds
|
0.150%
|
| on the first $250 million
|
0.125%
|
| on the next $250 million
|
0.100%
|
| on the next $250 million
|
0.075%
|
| on assets in excess of $750 million
|
The administrative fee received during any fiscal year was at least $125,000 per portfolio and $30,000 per each additional class of Shares.
For the year ended August 31, 2004 the fees paid to FAS and FServ were $129,575 and $25,834, respectively, after voluntary waiver, if applicable.
Distribution Services Fee
The Fund has adopted a Distribution Plan (the "Plan") pursuant to Rule 12b-1 under the Act. Under the terms of the Plan, the Fund will compensate Federated Securities Corp. (FSC), the principal distributor, from the daily net assets of the Fund's Class A Shares and Class B Shares to finance activities intended to result in the sale of these shares. The Plan provides that the Fund may incur distribution expenses according to the following schedule annually, to compensate FSC.
Share Class Name
|
| Percentage of Average Daily
Net Assets of Class
|
Class A
|
| 0.25%
|
Class B
|
| 0.75%
|
FSC may voluntarily choose to waive any portion of its fee. FSC can modify or terminate this voluntary waiver at any time at its sole discretion.
Sales Charges
For the fiscal year ended August 31, 2004, FSC retained $5,933 in sales charges from the sale of Class A Shares. See "What do Shares Cost?" in the Prospectus.
Shareholder Services Fee
Under the terms of a Shareholder Services Agreement with Federated Shareholder Services Company (FSSC), the Fund will pay FSSC up to 0.25% of the average daily net assets of the Fund's Class A Shares and Class B Shares for the period. The fee paid to FSSC is used to finance certain services for shareholders and to maintain shareholder accounts. FSSC may voluntarily choose to waive any portion of its fee. FSSC can modify or terminate this voluntary waiver at any time at its sole discretion.
Transfer and Dividend Disbursing Agent Fees and Expenses
Prior to July 1, 2004, FServ, through its subsidiary FSSC, served as transfer and dividend disbursing agent for the Fund. The fee paid to FSSC was based on the size, type and number of accounts and transactions made by shareholders. The fee paid to FSSC during the reporting period was $33,634, after voluntary waiver, if applicable.
Portfolio Accounting Fees
Prior to January 1, 2004, FServ maintained the Fund's accounting records for which it received a fee. The fee was based on the level of the Fund's average daily net assets for the period, plus out-of-pocket expenses. The fee paid to FServ during the reporting period was $21,206, after voluntary waiver, if applicable.
Interfund Transactions
During the year ended August, 31, 2004, the Fund engaged in purchase and sale transactions with funds that have a common investment adviser (or affiliated investment advisers), common Directors/Trustees, and /or common Officers. These purchase and sale transactions complied with Rule 17a-7 under the Act and amounted to $13,500,000 and $13,400,000, respectively.
General
Certain of the Officers and Trustees of the Trust are Officers and Directors or Trustees of the above companies.
6. INVESTMENT TRANSACTIONS
Purchases and sales of investments, excluding long-term U.S. government securities and short-term obligations (and in-kind contributions), for the year ended August 31, 2004, were as follows:
Purchases
|
| $
| 8,827,331
|
Sales
|
| $
| 6,800,097
|
7. CONCENTRATION OF CREDIT RISK
Since the Fund invests a substantial portion of its assets in issuers located in one state, it will be more susceptible to factors adversely affecting issuers of that state than would be a comparable tax-exempt mutual fund that invests nationally. In order to reduce the credit risk associated with such factors, at August 31, 2004, 43.7% of the securities in the portfolio of investments are backed by letters of credit or bond insurance of various financial institutions and financial guaranty assurance agencies. The largest percentage of investments insured by or supported (backed) by a letter of credit from any one institution or agency was 10.3% of total investments.
8. LEGAL PROCEEDINGS
Beginning in October 2003, Federated Investors, Inc. and various subsidiaries thereof (including the advisers and distributor for various investment companies, collectively, "Federated"), along with various investment companies sponsored by Federated ("Funds") were named as defendants in several class action lawsuits now pending in the United States District Court for the District of Maryland seeking damages of unspecified amounts. The lawsuits were purportedly filed on behalf of people who purchased, owned and/or redeemed shares of Federated-sponsored mutual funds during specified periods beginning November 1, 1998. The suits are generally similar in alleging that Federated engaged in illegal and improper trading practices including market timing and late trading in concert with certain institutional traders, which allegedly caused financial injury to the mutual fund shareholders. Federated and various Funds have also been named as defendants in several additional lawsuits, now pending in the United States District Court for the Western District of Pennsylvania, alleging, among other things, excessive advisory and Rule 12b-1 fees, and seeking damages of unspecified amounts. The Board of the Funds has retained the law firm of Dickstein Shapiro Morin & Oshinsky LLP to represent the Funds in these lawsuits. Federated and the Funds, and their respective counsel, are reviewing the allegations and will respond appropriately. Additional lawsuits based upon similar allegations may be filed in the future. The potential impact of these recent lawsuits and future potential similar suits is uncertain. Although we do not believe that these lawsuits will have a material adverse effect on the Funds, there can be no assurance that these suits, the ongoing adverse publicity and/or other developments resulting from related regulatory investigations will not result in increased Fund redemptions, reduced sales of Fund shares, or other adverse consequences for the Funds.
9. FEDERAL TAX INFORMATION (UNAUDITED)
At August 31, 2004, 100% represents the portion of distributions from net investment income which is exempt from federal income tax, other than the federal AMT.
Report of Independent Registered Public Accounting Firm
TO THE BOARD OF TRUSTEES OF FEDERATED MUNICIPAL SECURITIES INCOME TRUST AND SHAREHOLDERS OF FEDERATED NEW YORK MUNICIPAL INCOME FUND:
We have audited the accompanying statement of assets and liabilities, including the portfolio of investments, of Federated New York Municipal Income Fund (the "Fund") as of August 31, 2004, and the related statement of operations for the year then ended, the statement of changes in net assets for each of the two years in the period then ended, and the financial highlights for each of the five years in the period then ended. These financial statements and financial highlights are the responsibility of the Fund's management. Our responsibility is to express an opinion on these financial statements and financial highlights based on our audit.
We conducted our audits in accordance with standards of the Public Company Accounting Oversight Board (United States). Those standards require that we plan and perform the audit to provide reasonable assurance about whether the financial statements and financial highlights are free of material misstatement. An audit includes examining, on a test basis, evidence supporting the amounts and disclosures in the financial statements. Our procedures included confirmation of the securities owned at August 31, 2004, by correspondence with the custodian. An audit also includes assessing the accounting principles used and significant estimates made by management, as well as evaluating the overall financial statement presentation. We believe our audit provides a reasonable basis for our opinion.
In our opinion, such financial statements and financial highlights present fairly, in all material respects, the financial position of the Fund as of August 31, 2004, the results of its operations, the changes in its net assets and its financial highlights for the respective stated periods in conformity with accounting principles generally accepted in the United States of America.
Deloitte & Touche LLP
Boston, Massachusetts
October 20, 2004
Board of Trustees and Trust Officers
The Board is responsible for managing the Trust's business affairs and for exercising all the Trust's powers except those reserved for the shareholders. The following tables give information about each Board member and the senior officers of the Funds. Where required, the tables separately list Board members who are "interested persons" of the Fund ( i.e. , "Interested" Board members) and those who are not ( i.e. , "Independent" Board members). Unless otherwise noted, the address of each person listed is Federated Investors Tower, 1001 Liberty Avenue, Pittsburgh, PA. The Trust comprises seven portfolios and the Federated Fund Complex consists of 44 investment companies (comprising 136 portfolios). Unless otherwise noted, each Officer is elected annually. Unless otherwise noted, each Board member oversees all portfolios in the Federated Fund Complex; and serves for an indefinite term. The Fund's Statement of Additional Information includes additional information about Trust Trustees and is available, without charge and upon request, by calling 1-800-341-7400.
INTERESTED TRUSTEES BACKGROUND
|
|
|
Name
Birth Date
Address
Positions Held with Trust
Date Service Began
|
| Principal Occupation(s) for Past Five Years,
Other Directorships Held and Previous Position(s)
|
John F. Donahue*
Birth Date: July 28, 1924
CHAIRMAN AND TRUSTEE
Began serving: August 1990 | | Principal Occupations : Chairman and Director or Trustee of the Federated Fund Complex; Chairman and Director, Federated Investors, Inc.
Previous Positions : Trustee, Federated Investment Management Company and Chairman and Director, Federated Investment Counseling. |
|
|
|
J. Christopher Donahue*
Birth Date: April 11, 1949
PRESIDENT AND TRUSTEE
Began serving: August 1990 | | Principal Occupations : Principal Executive Officer and President of the Federated Fund Complex; Director or Trustee of some of the Funds in the Federated Fund Complex; President, Chief Executive Officer and Director, Federated Investors, Inc.; Chairman and Trustee, Federated Investment Management Company; Trustee, Federated Investment Counseling; Chairman and Director, Federated Global Investment Management Corp.; Chairman, Passport Research, Ltd.; Trustee, Federated Shareholder Services Company; Director, Federated Services Company.
Previous Positions : President, Federated Investment Counseling; President and Chief Executive Officer, Federated Investment Management Company, Federated Global Investment Management Corp. and Passport Research, Ltd. |
|
|
|
Lawrence D. Ellis, M.D.*
Birth Date: October 11, 1932
3471 Fifth Avenue
Suite 1111
Pittsburgh, PA
TRUSTEE
Began serving: August 1990 | | Principal Occupations : Director or Trustee of the Federated Fund Complex; Professor of Medicine, University of Pittsburgh; Medical Director, University of Pittsburgh Medical Center Downtown; Hematologist, Oncologist and Internist, University of Pittsburgh Medical Center.
Other Directorships Held : Member, National Board of Trustees, Leukemia Society of America.
Previous Positions : Trustee, University of Pittsburgh; Director, University of Pittsburgh Medical Center. |
|
|
|
* Family relationships and reasons for "interested" status: John F. Donahue is the father of J. Christopher Donahue; both are "interested" due to the positions they hold with Federated Investors, Inc. and its subsidiaries. Lawrence D. Ellis, M.D. is "interested" because his son-in-law is employed by the Fund's principal underwriter, Federated Securities Corp.
INDEPENDENT TRUSTEES BACKGROUND
|
|
|
Name
Birth Date
Address
Positions Held with Trust
Date Service Began
|
| Principal Occupation(s) for Past Five Years,
Other Directorships Held and Previous Position(s)
|
Thomas G. Bigley
Birth Date: February 3, 1934
15 Old Timber Trail
Pittsburgh, PA
TRUSTEE
Began serving: November 1994 | | Principal Occupation : Director or Trustee of the Federated Fund Complex.
Other Directorships Held : Director, Member of Executive Committee, Children's Hospital of Pittsburgh; Director, University of Pittsburgh.
Previous Position : Senior Partner, Ernst & Young LLP. |
|
|
|
John T. Conroy, Jr.
Birth Date: June 23, 1937
Grubb & Ellis/Investment
Properties Corporation
3838 North Tamiami Trail
Suite 402
Naples, FL
TRUSTEE
Began serving: August 1991 | | Principal Occupations : Director or Trustee of the Federated Fund Complex; Chairman of the Board, Investment Properties Corporation; Partner or Trustee in private real estate ventures in Southwest Florida.
Previous Positions : President, Investment Properties Corporation; Senior Vice President, John R. Wood and Associates, Inc., Realtors; President, Naples Property Management, Inc. and Northgate Village Development Corporation. |
|
|
|
Nicholas P. Constantakis
Birth Date: September 3, 1939
175 Woodshire Drive
Pittsburgh, PA
TRUSTEE
Began serving: February 1998 | | Principal Occupations : Director or Trustee of the Federated Fund Complex.
Other Directorships Held : Director and Member of the Audit Committee, Michael Baker Corporation (engineering and energy services worldwide).
Previous Position : Partner, Andersen Worldwide SC. |
|
|
|
John F. Cunningham
Birth Date: March 5, 1943
353 El Brillo Way
Palm Beach, FL
TRUSTEE
Began serving: July 1999 | | Principal Occupation : Director or Trustee of the Federated Fund Complex.
Other Directorships Held : Chairman, President and Chief Executive Officer, Cunningham & Co., Inc. (strategic business consulting); Trustee Associate, Boston College.
Previous Positions : Director, Redgate Communications and EMC Corporation (computer storage systems); Chairman of the Board and Chief Executive Officer, Computer Consoles, Inc.; President and Chief Operating Officer, Wang Laboratories; Director, First National Bank of Boston; Director, Apollo Computer, Inc. |
|
|
|
|
|
|
Name
Birth Date
Address
Positions Held with Trust
Date Service Began
|
| Principal Occupation(s) for Past Five Years,
Other Directorships Held and Previous Position(s)
|
Peter E. Madden
Birth Date: March 16, 1942
One Royal Palm Way
100 Royal Palm Way
Palm Beach, FL
TRUSTEE
Began serving: August 1991 | | Principal Occupation : Director or Trustee of the Federated Fund Complex; Management Consultant.
Other Directorships Held : Board of Overseers, Babson College.
Previous Positions : Representative, Commonwealth of Massachusetts General Court; President, State Street Bank and Trust Company and State Street Corporation (retired); Director, VISA USA and VISA International; Chairman and Director, Massachusetts Bankers Association; Director, Depository Trust Corporation; Director, The Boston Stock Exchange. |
|
|
|
Charles F. Mansfield, Jr.
Birth Date: April 10, 1945
80 South Road
Westhampton Beach, NY
TRUSTEE
Began serving: January 1999 | | Principal Occupations : Director or Trustee of the Federated Fund Complex; Management Consultant; Executive Vice President, DVC Group, Inc. (marketing communications and technology) (prior to 9/1/00).
Previous Positions : Chief Executive Officer, PBTC International Bank; Partner, Arthur Young & Company (now Ernst & Young LLP); Chief Financial Officer of Retail Banking Sector, Chase Manhattan Bank; Senior Vice President, HSBC Bank USA (formerly, Marine Midland Bank); Vice President, Citibank; Assistant Professor of Banking and Finance, Frank G. Zarb School of Business, Hofstra University. |
|
|
|
John E. Murray, Jr., J.D., S.J.D.
Birth Date: December 20, 1932
Chancellor, Duquesne University
Pittsburgh, PA
TRUSTEE
Began serving: February 1995 | | Principal Occupations : Director or Trustee of the Federated Fund Complex; Chancellor and Law Professor, Duquesne University; Partner, Murray, Hogue and Lannis.
Other Directorships Held : Director, Michael Baker Corp. (engineering, construction, operations and technical services).
Previous Positions : President, Duquesne University; Dean and Professor of Law, University of Pittsburgh School of Law; Dean and Professor of Law, Villanova University School of Law. |
|
|
|
Marjorie P. Smuts
Birth Date: June 21, 1935
4905 Bayard Street
Pittsburgh, PA
TRUSTEE
Began serving: August 1990 | | Principal Occupations : Director or Trustee of the Federated Fund Complex; Public Relations/Marketing Consultant/Conference Coordinator.
Previous Positions : National Spokesperson, Aluminum Company of America; television producer; President, Marj Palmer Assoc.; Owner, Scandia Bord. |
|
|
|
John S. Walsh
Birth Date: November 28, 1957
2604 William Drive
Valparaiso, IN
TRUSTEE
Began serving: July 1999 | | Principal Occupations : Director or Trustee of the Federated Fund Complex; President and Director, Heat Wagon, Inc. (manufacturer of construction temporary heaters); President and Director, Manufacturers Products, Inc. (distributor of portable construction heaters); President, Portable Heater Parts, a division of Manufacturers Products, Inc.
Previous Position : Vice President, Walsh & Kelly, Inc. |
|
|
|
OFFICERS
|
|
|
Name
Birth Date
Positions Held with Trust
Date Service Began
|
| Principal Occupation(s) for Past Five Years and Previous Position(s)
|
John W. McGonigle
Birth Date: October 26, 1938
EXECUTIVE VICE PRESIDENT
AND SECRETARY
Began serving: August 1990 | | Principal Occupations : Executive Vice President and Secretary of the Federated Fund Complex; Executive Vice President, Secretary and Director, Federated Investors, Inc. |
|
|
|
Richard J. Thomas
Birth Date: June 17, 1954
TREASURER
Began serving: November 1998 | | Principal Occupations : Principal Financial Officer and Treasurer of the Federated Fund Complex; Senior Vice President, Federated Administrative Services. |
|
|
|
Richard B. Fisher
Birth Date: May 17, 1923
VICE CHAIRMAN
Began serving: August 2002 | | Principal Occupations : Vice Chairman or President of some of the Funds in the Federated Fund Complex; Vice Chairman, Federated Investors, Inc.; Chairman, Federated Securities Corp.
Previous Positions : President and Director or Trustee of some of the Funds in the Federated Fund Complex; Executive Vice President, Federated Investors, Inc.; and Director and Chief Executive Officer, Federated Securities Corp. |
|
|
|
Mary Jo Ochson
Birth Date: September 12, 1953
CHIEF INVESTMENT OFFICER
Began serving: May 2004 | | Principal Occupations: Mary Jo Ochson has been the Fund's Portfolio Manager since April 1997. Ms. Ochson was named Chief Investment Officer of tax-exempt, fixed- income products in 2004. She joined Federated in 1982 and has been a Senior Portfolio Manager and a Senior Vice President of the Fund's Adviser since 1996. Ms. Ochson is a Chartered Financial Analyst and received her M.B.A. in Finance from the University of Pittsburgh. |
|
|
|
J. Scott Albrecht
Birth Date: June 1, 1960
VICE PRESIDENT
Began serving: November 1998 | | J. Scott Albrecht has been the Fund's Portfolio Manager since March 1995. He is Vice President of the Trust. Mr. Albrecht joined Federated in 1989. He has been a Senior Portfolio Manager since 1997 and a Vice President of the Fund's Adviser since 1994. He was a Portfolio Manager from 1994 to 1996. Mr. Albrecht is a Chartered Financial Analyst and received his M.S. in Public Management from Carnegie Mellon University. |
|
|
|
Mutual funds are not bank deposits or obligations, are not guaranteed by any bank, and are not insured or guaranteed by the U.S. government, the Federal Deposit Insurance Corporation, the Federal Reserve Board, or any other government agency. Investment in mutual funds involves investment risk, including the possible loss of principal.
This report is authorized for distribution to prospective investors only when preceded or accompanied by the Fund's prospectus, which contains facts concerning its objective and policies, management fees, expenses, and other information.
VOTING PROXIES ON FUND PORTFOLIO SECURITIES
A description of the policies and procedures that the Fund uses to determine how to vote proxies relating to securities held in the Fund's portfolio is available, without charge and upon request, by calling 1-800-341-7400. A report on "Form N-PX" of how the Fund voted any such proxies during the most recent 12-month period ended June 30 is available through Federated's website. Go to http://www.federatedinvestors.com, select "Products," select the "Prospectuses and Regulatory Reports" link, then select the Fund to access the link to Form N-PX. This information is also available from the EDGAR database on the SEC's website at http://www.sec.gov.
QUARTERLY PORTFOLIO SCHEDULE
The Fund files with the SEC a complete schedule of its portfolio holdings, as of the close of the first and third quarters of its fiscal year, on "Form N-Q." These filings are available on the SEC's website at http://www.sec.gov and may be reviewed and copied at the SEC's Public Reference Room in Washington, DC. (Call 1-800-SEC-0330 for information on the operation of the Public Reference Room.) You may also access this information from the "Products" section of Federated's website at www.federatedinvestors.com by clicking on "Portfolio Holdings" and selecting the name of the Fund, or by selecting the name of the Fund and clicking on "Portfolio Holdings." You must register on the website the first time you wish to access this information.
Federated
World-Class Investment Manager
Federated New York Municipal Income Fund
Federated Investors Funds
5800 Corporate Drive
Pittsburgh, PA 15237-7000
www.federatedinvestors.com
Contact us at 1-800-341-7400 or
www.federatedinvestors.com/contact
Federated Securities Corp., Distributor
Cusip 313923401
Cusip 313923880
28992 (10/04)
Federated is a registered mark of Federated Investors, Inc. 2004 (c)Federated Investors, Inc.
Federated
World-Class Investment Manager
Federated North Carolina Municipal Income Fund
A Portfolio of Federated Municipal Securities Income Trust
ANNUAL SHAREHOLDER REPORT
August 31, 2004
FINANCIAL HIGHLIGHTS
SHAREHOLDER EXPENSE EXAMPLE
MANAGEMENT'S DISCUSSION OF FUND PERFORMANCE
PORTFOLIO OF INVESTMENTS SUMMARY TABLES
FINANCIAL STATEMENTS
REPORT OF INDEPENDENT REGISTERED PUBLIC ACCOUNTING FIRM
BOARD OF TRUSTEES AND TRUST OFFICERS
VOTING PROXIES ON FUND PORTFOLIO SECURITIES
QUARTERLY PORTFOLIO SCHEDULE
Not FDIC Insured * May Lose Value * No Bank Guarantee
Financial Highlights
(For a Share Outstanding Throughout Each Period)
| | Year Ended August 31,
|
|
| 2004
|
|
| 2003
|
|
| 2002
|
|
| 2001
|
|
| 2000
|
|
Net Asset Value, Beginning of Period
| | $10.92 | | | $11.07 | | | $10.99 | | | $10.45 | | | $10.44 | |
Income From Investment Operations:
| | | | | | | | | | | | | | | |
Net investment income
| | 0.48 | | | 0.48 | | | 0.50 | 1 | | 0.50 | | | 0.49 | |
Net realized and unrealized gain (loss) on investments, futures contracts and swap contracts
|
| 0.13
|
|
| (0.15
| )
|
| 0.08
| 1
|
| 0.54
|
|
| 0.02
|
|
TOTAL FROM INVESTMENT OPERATIONS
|
| 0.61
|
|
| 0.33
|
|
| 0.58
|
|
| 1.04
|
|
| 0.51
|
|
Less Distributions:
| | | | | | | | | | | | | | | |
Distributions from net investment income
| | (0.48 | ) | | (0.48 | ) | | (0.50 | ) | | (0.50 | ) | | (0.49 | ) |
Distributions from net realized gain on investments and futures contracts
|
| - --
|
|
|
--
|
|
|
--
|
|
|
--
|
|
|
(0.01
| )
|
TOTAL DISTRIBUTIONS
|
| (0.48
| )
|
| (0.48
| )
|
| (0.50
| )
|
| (0.50
| )
|
| (0.50
| )
|
Net Asset Value, End of Period
|
| $11.05
|
|
| $10.92
|
|
| $11.07
|
|
| $10.99
|
|
| $10.45
|
|
Total Return 2
|
| 5.61
| %
|
| 2.93
| %
|
| 5.48
| %
|
| 10.23
| %
|
| 5.14
| %
|
| | | | | | | | | | | | | | | |
Ratios to Average Net Assets:
|
|
|
|
|
|
|
|
|
|
|
|
|
|
|
|
Expenses
|
| 0.79
| %
|
| 0.79
| %
|
| 0.79
| %
|
| 0.79
| %
|
| 0.79
| %
|
Net investment income
|
| 4.26
| %
|
| 4.22
| %
|
| 4.62
| % 1
|
| 4.71
| %
|
| 4.77
| %
|
Expense waiver/reimbursement 3
|
| 0.56
| %
|
| 0.49
| %
|
| 0.61
| %
|
| 0.68
| %
|
| 0.79
| %
|
Supplemental Data:
|
|
|
|
|
|
|
|
|
|
|
|
|
|
|
|
Net assets, end of period (000 omitted)
|
| $56,289
|
|
| $82,430
|
|
| $55,261
|
|
| $47,235
|
|
| $41,449
|
|
Portfolio turnover
|
| 16
| %
|
| 16
| %
|
| 21
| %
|
| 28
| %
|
| 66
| %
|
1 Effective September 1, 2001, the Fund adopted the provisions of the American Institute of Certified Public Accountants (AICPA) Audit and Accounting Guide for Investment Companies and began accreting discount/amortizing premium on long-term debt securities. For the year ended August 31, 2002, this change had no effect on the net investment income per share or net realized and unrealized gain (loss) on investments per share, but increased the ratio of net investment income to average net assets from 4.61% to 4.62%. Per share, ratios and supplemental data for the periods prior to September 1, 2001 have not been restated to reflect this change in presentation.
2 Based on net asset value, which does not reflect the sales charge, redemption fee or contingent deferred sales charge, if applicable. Total returns for periods of less than one year are not annualized.
3 This voluntary expense decrease is reflected in both the expense and the net investment income ratios shown above.
See Notes which are an integral part of the Financial Statements
Shareholder Expense Example
As a shareholder of the Fund, you incur two types of costs: (1) transaction costs, including sales charges (load) on purchase payments; and (2) ongoing costs, including management fees, distribution (12b-1) fees, shareholder services fees, and other Fund expenses. This Example is intended to help you to understand your ongoing costs (in dollars) of investing in the Fund and to compare these costs with the ongoing costs of investing in other mutual funds. It is based on an investment of $1,000 invested at the beginning of the period and held for the entire period from March 1, 2004 to August 31, 2004.
ACTUAL EXPENSES
The first section of the table below provides information about actual account values and actual expenses. You may use the information in this section, together with the amount you invested, to estimate the expenses that you incurred over the period. Simply divide your account value by $1,000 (for example, an $8,600 account value divided by $1,000 = 8.6), then multiply the result by the number in the first section under the heading entitled "Expenses Paid During Period" to estimate the expenses attributable to your investment during this period.
HYPOTHETICAL EXAMPLE FOR COMPARISON PURPOSES
The second section of the table below provides information about hypothetical account values and hypothetical expenses based on the Fund's actual expense ratio and an assumed rate of return of 5% per year before expenses, which is not the Fund's actual return. Thus, you should not use the hypothetical account values and expenses to estimate the actual ending account balance or your expenses for the period. Rather, these figures are provided to enable you to compare the ongoing costs of investing in the Fund and other funds. To do so, compare this 5% hypothetical example with the 5% hypothetical examples that appear in the shareholder reports of the other funds.
Please note that the expenses shown in the table are meant to highlight your ongoing costs only and do not reflect any transaction costs, such as sales charges (loads). Therefore, the second section of the table is useful in comparing ongoing costs only, and will not help you determine the relative total costs of owning different funds. In addition, if these transaction costs were included, your costs would have been higher.
|
| Beginning
Account Value
3/1/2004
|
| Ending
Account Value
8/31/2004
|
| Expenses Paid
During Period 1
|
Actual:
|
| $1,000
|
| $ 990.80
|
| $3.95
|
Hypothetical (assuming a 5% return before expenses):
|
| $1,000
|
| $1,021.17
|
| $4.01
|
1 Expenses are equal to Federated North Carolina Municipal Income Fund's annualized expense ratio of 0.79%, multiplied by the average account value over the period, multiplied by 184/366 (to reflect the one-half year period).
Management's Discussion of Fund Performance
The fund's total return, based on net asset value, for the 12-month reporting period was 5.61% for the Class A Shares. The total return consisted of 4.42% tax-exempt dividends, and 1.19% appreciation in net asset value of the shares. 1 The total return of the Lipper North Carolina Municipal Debt Funds Average (Average), a performance benchmark for the fund, was 5.95% during the 12-month reporting period. 2 The fund underperformed the Average in terms of total return, but delivered a higher income stream than the Average. 3 The fund' total return reflected actual cash flows, transaction cost and other expenses, which may not have been reflected in, or could otherwise differ from, the Average.
The fund's investment objective is to seek to provide current income exempt from federal regular income tax and the personal income taxes imposed by the state of North Carolina. To accomplish this objective, the fund's investment strategy focused on: (a) the selection of medium and lower investment-grade quality securities; these securities typically have higher yields than higher-quality, investment-grade securities available in the market; 4 and (b) the selection of intermediate to long maturity bonds that yield more than short-term bonds on an upward sloping yield curve (the "yield curve" shows the relative yield of similar securities with different maturities). The fund's strategy also focused on the effective duration of the fund's portfolio (which indicates the portfolio sensitivity to changes in interest rates), and on bonds with premium coupons (interest payments that are higher than current yields available in the market).
1 Performance data quoted represents past performance which is no guarantee of future results. Investment return and principal value will fluctuate so that an investor's shares, when redeemed, may be worth more or less than their original cost. Mutual fund performance changes over time and current performance may be lower or higher than what is stated. For current to the most recent month-end performance, visit www.federatedinvestors.com or call 1-800-341-7400.
2 The Average is an average of funds with similar objectives, and represents the average of the total returns reported by all mutual funds designated by Lipper, Inc. as falling into the respective category. It is not possible to invest directly in an average. The broad-based securities market index for the fund, as disclosed in the fund's prospectus, is the Lehman Brothers Municipal Bond Index (LBMB). The total return for the LBMB was 7.11% during the 12-month reporting period. The LBMB is a broad market performance benchmark for the tax-exempt bond market. To be included in the LBMB, bonds must have a minimum credit rating of Baa, have an outstanding par value of at least $3 million and be issued as part of a transaction of at least $50 million. The LBMB includes both zero coupon bonds and bonds subject to the alternative minimum tax. The LBMB is not adjusted to reflect sales charges, expenses, or other fees that the Securities and Exchange Commission (SEC) requires to be reflected in the fund's performance. Indexes are unmanaged, and it is not possible to invest directly in an index. The fund's total return reflected actual cash flows, transaction costs and other expenses, which were not reflected in the total return of the LBMB.
3 Income may be subject to the federal alternative minimum tax.
4 Investment-grade securities are securities that are rated at least "BBB" or unrated securities of a comparable quality. Credit ratings are an indication of the risk that a security will default. They do not protect a security from credit risk. Lower-rated bonds typically offer higher yields to help compensate investors for the increased risk associated with them. Among these risks are lower creditworthiness, greater price volatility, more risk to principal and income than with higher-rated securities and increased possibilities of default.
CREDIT QUALITY
Credit spreads, or the yield difference between the "AAA"-rated municipal bonds and bonds of lower credit quality and similar maturity, tightened during the reporting period (meaning that the yield on lower-rated, investment-grade debt improved to a greater extent, or declined to a lesser extent, than for higher-rated, investment-grade debt). Municipal Market Data (MMD) reported that credit spreads between "BBB"-rated general obligation bonds and "AAA"-rated general obligation bonds tightened by 16 basis points to 28 basis points. The fund's holdings in medium- and lower-rated, investment-grade securities helped the fund's performance, because they generally outperformed higher-rated, investment-grade securities during the reporting period.
YIELD CURVE AND MATURITY
During the reporting period, the municipal bond market was characterized by a generally falling and flattening, although still upward sloping, yield curve. MMD reported that, during the reporting period, rates on "AAA"-rated general obligation bonds with maturities of four years or less rose by 2 basis points to 43 basis points, while similar bonds with maturities of five years and longer saw yields fall by up to 50 basis points. The overall effect was that longer-maturity, lower-rated bonds tended to outperform shorter-maturity, higher-rated bonds. The fund's performance, therefore, benefited from its concentration in municipal bonds in the intermediate (general five to ten year) and long (generally ten or longer) parts of the yield curve.
DURATION 5
The fund's dollar-weighted average duration at the end of the reporting period was 4.69 years. Duration management is a significant component of the fund's investment strategy. As interest rates were expected to rise during the reporting period, the fund hedged the portfolio (adjusted the duration shorter) using forward-settling municipal interest rate swaps and Treasury futures contracts. The fund's use of these instruments, however, hurt the fund's performance relative to the Average because these instruments did not perform as well given that longer-term and intermediate-term municipal interest rates declined over the reporting period.
5 Duration is a measure of a security's price sensitivity to changes in interest rates. Securities with longer durations are more sensitive to changes in interest rates than securities with shorter durations.
GROWTH OF A $10,000 INVESTMENT 1
The graph below illustrates the hypothetical investment of $10,000 2 in Federated North Carolina Municipal Income Fund (the "Fund") from August 31, 1994 to August 31, 2004, compared to the Lehman Brothers Municipal Bond Index (LBMB) 3 and the Lipper North Carolina Municipal Debt Funds Average (LNCMDFA). 4
Average Annual Total Return 5 for the Period Ended 8/31/2004
|
|
|
1 Year
|
| 0.90%
|
5 Years
|
| 4.88%
|
10 Years
|
| 5.18%
|

Performance data quoted represents past performance which is no guarantee of future results. Returns shown do not reflect the deduction of taxes that a shareholder may pay on Fund distributions or the redemption of Fund shares. For after-tax returns, visit www.federatedinvestors.com. Investment return and principal value will fluctuate so that an investor's shares, when redeemed, may be worth more or less than their original cost. Mutual fund performance changes over time and current performance may be lower or higher than what is stated. Mutual funds are not obligations of or guaranteed by any bank and are not federally insured.
1 Federated North Carolina Municipal Income Fund is the successor to CCB North Carolina Municipal Securities Fund. The quoted performance data includes performance of the CCB North Carolina Municipal Securities Fund for the period from July 22, 1992 when the CCB North Carolina Municipal Securities Fund first commenced operations, to July 23, 1999, as adjusted to reflect the Fund's expenses.
2 Represents a hypothetical investment of $10,000 in the Fund after deducting the maximum sales charge of 4.50% ($10,000 investment minus $450 sales charge=$9,550). The Fund's performance assumes the reinvestment of all dividends and distributions. The LBMB and the LNCMDFA have been adjusted to reflect reinvestment of dividends on securities in the index and the average. Indexes are unmanaged and it is not possible to invest directly in an index or an average.
3 The LBMB is an unmanaged index comprising bonds with a minimum credit rating of at least Baa. They must have an outstanding par value of at least $3 million and be issued as part of a transaction of at least $50 million. The index includes both zero coupon bonds and bonds subject to the federal alternative minimum tax. It is not adjusted to reflect sales charges, expenses, or other fees that the Securities and Exchange Commission (SEC) requires to be reflected in the Fund's performance.
4 The LNCMDFA represents the average of the total returns reported by all of the mutual funds designated by Lipper, Inc. as falling into the respective category. These total returns are reported net of expenses and other fees that the SEC requires to be reflected in a mutual fund's performance.
5 Total return quoted reflects all applicable sales charges.
Portfolio of Investments Summary Tables
At August 31, 2004, the fund's credit quality ratings composition 1 was as follows:
S&P Long-Term Ratings as
Percentage of Total Investments 2
| | Moody's Long-Term Ratings as
Percentage of Total Investments 2
|
AAA
|
| 33.0%
| | Aaa
|
| 47.6%
|
AA
|
| 25.2%
| | Aa
|
| 7.1%
|
A
|
| 7.5%
| | A
|
| 2.8%
|
BBB
|
| 12.4%
| | Baa
|
| 15.0%
|
Not rated by S&P
|
| 21.9%
| | Not rated by Moody's
|
| 27.5%
|
TOTAL
|
| 100%
| | TOTAL
|
| 100%
|
1 These tables depict the long-term credit quality ratings assigned to the fund's portfolio holdings by Standard & Poor's and Moody's Investors Service, each of which is a Nationally Recognized Statistical Rating Organization (NRSRO). These credit-quality ratings are shown without regard to gradations within a given rating category. For example, securities rated "A-" have been included in the "Not rated by..." category. Rated securities that have been prerefunded, but not rated again by the NRSRO, also have been included in the "Not-rated by..." category. Rated securities include a security with an obligor and/or credit enhancer that has received a rating from an NRSRO with respect to a class of debt obligations that is comparable in priority and security with the security held by the fund. Credit quality ratings are an assessment of the risk that a security will default in payment and do not address other risks presented by the security. Please see the description of credit quality ratings in the fund's Statement of Additional Information.
Each table depicts the long-term credit quality ratings as assigned only by the NRSRO identified in the table. Of the portfolio's total investments, 12.0% is not rated by either of these NRSROs.
2 Percentages are based on total investments, which may differ from total net assets.
Portfolio of Investments
August 31, 2004
Principal
Amount
|
|
|
| Credit
Rating
| 1
|
| Value
|
| | | LONG-TERM MUNICIPALS--96.6% | | | | | |
| | | North Carolina--86.2% | | | | | |
| $ | 1,190,000 | | Appalachian State University, NC, Parking System Revenue Bonds, 5.625% (FSA INS)/(Original Issue Yield: 5.65%), 7/15/2025
| | NR/Aaa | | $ | 1,306,501 |
| 945,000 | | Asheville, NC Housing Authority, Multifamily Housing Revenue Bonds, 5.625% TOBs (Oak Knoll Apartments Project)/(FNMA GTD) 9/1/2021
| | AAA/NR | | | 1,005,130 |
| 500,000 | | Broad River, NC Water Authority, Water System Revenue Bonds (Series 2000), 5.375% (MBIA Insurance Corp. INS)/(Original Issue Yield: 5.55%), 6/1/2026
| | NR/Aaa | | | 532,030 |
| 1,330,000 | | Cabarrus County, NC, COP (Series 2002), 5.25%, 2/1/2018
| | AA-/Aa3 | | | 1,449,261 |
| 2,000,000 | | Charlotte, NC Airport, Revenue Bonds (Series B), 5.875% (MBIA Insurance Corp. INS)/(Original Issue Yield: 5.95%), 7/1/2019
| | AAA/Aaa | | | 2,208,940 |
| 1,000,000 | | Charlotte, NC, COP, 5.50% (Charlotte Convention Facilities)/(Original Issue Yield: 5.70%), 12/1/2020
| | AA+/Aa2 | | | 1,110,590 |
| 1,000,000 | | Columbus County, NC Industrial Facilities & PCFA, Revenue Bonds (Series 1996A), 5.85% (International Paper Co.), 12/1/2020
| | BBB/Baa2 | | | 1,033,140 |
| 1,000,000 | | Cumberland County, NC, UT GO Bonds, 5.70% (Original Issue Yield: 5.78%), 9/15/2004
| | AA-/Aa3 | | | 1,134,840 |
| 1,000,000 | | Durham County, NC, Multifamily Housing Revenue Bonds, 5.65% TOBs (Alston Village Apartments)/(FNMA GTD) 3/1/2034
| | AAA/NR | | | 1,057,960 |
| 1,000,000 | | Fayetteville, NC Public Works Commission, Revenue Bonds (Series 1999), 5.70% (U.S. Treasury PRF 3/1/2010 @ 101)/ (Original Issue Yield: 5.79%), 3/1/2019
| | AAA/Aaa | | | 1,151,870 |
| 1,000,000 | | Forsyth County, NC, COP, 5.375%, 10/1/2022
| | AA+/Aa1 | | | 1,077,170 |
| 900,000 | | Gastonia, NC Combined Utilities System, Water & Sewer Revenue Bonds, 5.625% (MBIA Insurance Corp. INS)/(Original Issue Yield: 5.85%), 5/1/2019
| | AAA/Aaa | | | 1,011,204 |
| 750,000 | | Harnett County, NC, COP, 5.50% (FSA INS), 12/1/2015
| | AAA/Aaa | | | 845,400 |
| 1,000,000 | | Haywood County, NC Industrial Facilities & PCFA, Revenue Refunding Bonds, 6.40% (Champion International Corp.)/(Original Issue Yield: 6.42%), 11/1/2024
| | NR/Baa2 | | | 1,058,320 |
| 1,000,000 | | High Point, NC, Public Improvement UT GO Bonds (Series 2000B), 5.50% (Original Issue Yield: 5.67%), 6/1/2018
| | AA/Aa3 | | | 1,128,240 |
| 1,500,000 | | Martin County, NC IFA (Series 1995), Solid Waste Disposal Revenue Bonds, 6.00% (Weyerhaeuser Co.), 11/1/2025
| | BBB/Baa2 | | | 1,537,395 |
Principal
Amount
|
|
|
| Credit
Rating
| 1
|
| Value
|
| | | LONG-TERM MUNICIPALS--continued | | | | | |
| | | North Carolina--continued | | | | | |
| $ | 500,000 | | North Carolina Eastern Municipal Power Agency, Power Supply Revenue Refunding Bonds (Series D), 5.125% (Original Issue Yield: 5.33%), 1/1/2026
| | BBB/Baa2 | | $ | 501,645 |
| 500,000 | | North Carolina Eastern Municipal Power Agency, Power System Refunding Revenue Bonds (Series 2003C), 5.375% (Original Issue Yield: 5.57%), 1/1/2017
| | BBB/Baa2 | | | 532,775 |
| 500,000 | | North Carolina Eastern Municipal Power Agency, Power System Revenue Bonds (Series 1999D), 6.70%, 1/1/2019
| | BBB/Baa2 | | | 561,895 |
| 880,000 | | North Carolina HFA, Home Ownership Revenue Bonds (Series 5-A), 5.55%, 1/1/2019
| | AA/Aa2 | | | 919,635 |
| 780,000 | | North Carolina HFA, Home Ownership Revenue Bonds (Series 6-A), 6.10%, 1/1/2018
| | AA/Aa2 | | | 826,496 |
| 300,000 | | North Carolina Medical Care Commission, FHA INS Mortgage Revenue Bonds (Series 2003), 5.375% (Betsy Johnson Regional Hospital)/(FSA INS), 10/1/2024
| | AAA/Aaa | | | 322,977 |
| 500,000 | | North Carolina Medical Care Commission, Health Care Facilities First Mortgage Revenue Bonds (Series 2001), 6.625% (Moravian Homes, Inc.)/(Original Issue Yield: 7.00%), 4/1/2031
| | NR | | | 510,700 |
| 500,000 | | North Carolina Medical Care Commission, Health Care Facilities First Mortgage Revenue Bonds, 6.25% (Arbor Acres Community)/(Original Issue Yield: 6.40%), 3/1/2027
| | NR | | | 500,360 |
| 500,000 | | North Carolina Medical Care Commission, Health Care Facilities First Mortgage Revenue Bonds, 6.875% (Presbyterian Homes, Inc.)/(Original Issue Yield: 7.00%), 10/1/2021
| | NR | | | 534,430 |
| 500,000 | | North Carolina Medical Care Commission, Health Care Facilities First Mortgage Revenue Refunding Bonds (Series 2004A), 5.00% (Deerfield Episcopal Retirement Community), 11/1/2023
| | NR | | | 497,220 |
| 1,000,000 | | North Carolina Medical Care Commission, Health Care Facilities Revenue Bonds (Series 1999), 6.25% (Stanly Memorial Hospital Project)/(Original Issue Yield: 6.40%), 10/1/2019
| | A-/NR | | | 1,080,510 |
| 250,000 | | North Carolina Medical Care Commission, Health Care Facilities Revenue Bonds (Series 2002A), 5.25% (Union Regional Medical Center)/(Original Issue Yield: 5.33%), 1/1/2021
| | A/A2 | | | 258,037 |
| 200,000 | | North Carolina Medical Care Commission, Health Care Facilities Revenue Bonds (Series 2002A), 5.25% (Union Regional Medical Center)/(Original Issue Yield: 5.38%), 1/1/2022
| | A/A2 | | | 204,688 |
| 1,360,000 | | North Carolina Medical Care Commission, Health Care Facilities Revenue Bonds (Series 2003A), 5.00% (Novant Health Obligated Group), 11/1/2017
| | AA-/Aa3 | | | 1,445,190 |
Principal
Amount
|
|
|
| Credit
Rating
| 1
|
| Value
|
| | | LONG-TERM MUNICIPALS--continued | | | | | |
| | | North Carolina--continued | | | | | |
| $ | 1,205,000 | | North Carolina Medical Care Commission, Health Care Facilities Revenue Bonds (Series 2004A), 5.25% (Cleveland Community Healthcare)/(AMBAC INS), 7/1/2021
| | AAA/Aaa | | $ | 1,289,953 |
| 1,230,000 | | North Carolina Medical Care Commission, Health Care Facilities Revenue Bonds, 5.50% (Hugh Chatham Memorial Hospital)/ (Radian Asset Assurance INS), 10/1/2019
| | AA/NR | | | 1,338,043 |
| 625,000 | | North Carolina Medical Care Commission, Health Care Facilities Revenue Bonds, 5.50% (Scotland Memorial Hospital)/(Radian Asset Assurance INS)/(Original Issue Yield: 5.593%), 10/1/2019
| | AA/NR | | | 678,488 |
| 1,000,000 | | North Carolina Medical Care Commission, Health System Revenue Bonds, 5.25% (Mission Health, Inc.)/(Original Issue Yield: 5.48%), 10/1/2026
| | AA/Aa3 | | | 1,030,490 |
| 1,000,000 | | North Carolina Medical Care Commission, Hospital Revenue Bonds (Series 2000), 5.50% (Northeast Medical Center)/ (AMBAC INS)/(Original Issue Yield: 5.74%), 11/1/2025
| | AAA/Aaa | | | 1,068,610 |
| 1,000,000 | | North Carolina Medical Care Commission, Hospital Revenue Bonds (Series 2002A), 5.375% (Southeastern Regional Medical Center)/(Original Issue Yield: 5.48%), 6/1/2032
| | A/NR | | | 1,011,740 |
| 1,000,000 | | North Carolina Medical Care Commission, Hospital Revenue Bonds, 6.125% (Southeastern Regional Medical Center)/ (Original Issue Yield: 6.25%), 6/1/2019
| | A/A3 | | | 1,078,970 |
| 685,000 | | North Carolina Medical Care Commission, Hospital Revenue Bonds, 5.50% (Maria Parham Medical Center)/(Radian Asset Assurance INS), 10/1/2018
| | AA/NR | | | 748,938 |
| 250,000 | | North Carolina Medical Care Commission, Retirement Facilities First Mortgage Revenue Bonds (Series 2002), 6.25% (Forest at Duke)/(Original Issue Yield: 6.35%), 9/1/2021
| | NR | | | 260,823 |
| 500,000 | | North Carolina Medical Care Commission, Retirement Facilities First Mortgage Revenue Bonds (Series 2003A), 6.375% (Givens Estates)/(Original Issue Yield: 6.50%), 7/1/2023
| | NR | | | 504,850 |
| 550,000 | | North Carolina Medical Care Commission, Retirement Facilities First Mortgage Revenue Bonds (Series 2004C), 6.00% (Cypress Glen)/(Original Issue Yield: 6.092%), 10/1/2033
| | NR | | | 555,143 |
| 1,000,000 | | North Carolina Municipal Power Agency No. 1, Revenue Bonds (Series 1999B), 6.50% (Catawba Electric)/(Original Issue Yield: 6.73%), 1/1/2020
| | BBB+/Baa1 | | | 1,110,490 |
| 1,320,000 | | North Carolina Municipal Power Agency No. 1, Revenue Bonds, 10.50% (Catawba Electric)/(Escrowed In Treasuries COL), 1/1/2010
| | AAA/Aaa | | | 1,628,735 |
Principal
Amount
|
|
|
| Credit
Rating
| 1
|
| Value
|
| | | LONG-TERM MUNICIPALS--continued | | | | | |
| | | North Carolina--continued | | | | | |
| $ | 1,000,000 | | Northern Hospital District of Surry County, NC, Health Care Facilities Revenue Refunding Bonds (Series 2001), 5.10% (Northern Hospital of Surry County)/(Radian Asset Assurance INS)/(Original Issue Yield: 5.242%), 10/1/2021
| | AA/NR | | $ | 1,030,540 |
| 1,200,000 | | Piedmont Triad Airport Authority, NC, Airport Revenue Bonds (Series 1999A), 5.875% (FSA INS)/(Original Issue Yield: 6.02%), 7/1/2019
| | AAA/Aaa | | | 1,352,928 |
| 1,000,000 | | Pitt County, NC, COP (Series 2000B), 5.50% (FSA INS)/ (Original Issue Yield: 5.63%), 4/1/2025
| | AAA/Aaa | | | 1,078,210 |
| 1,500,000 | | Pitt County, NC, Refunding Bonds, 5.25% (Pitt County Memorial Hospital)/(Escrowed In Treasuries COL)/(Original Issue Yield: 5.85%), 12/1/2021
| | NR/Aaa | | | 1,586,265 |
| 2,000,000 | | Randolph County, NC, COP (Series 2000), 5.60% (FSA INS)/(Original Issue Yield: 5.77%), 6/1/2018
| | AAA/Aaa | | | 2,277,820 |
| 890,000 | | University of North Carolina System Pool, Revenue Bonds (Series A), 5.25% (University of North Carolina)/(AMBAC INS), 4/1/2021
| | AAA/Aaa | | | 966,415 |
| 500,000 | | Wilmington, NC Water & Sewer System, Revenue Bonds (Series 1999), 5.625% (FSA INS)/(Original Issue Yield: 5.76%), 6/1/2018
|
| NR/Aaa
|
|
| 562,450
|
| | | TOTAL
|
|
|
|
| 48,504,450
|
| | | Puerto Rico--9.5% | | | | | |
| 1,500,000 | 2,3 | Puerto Rico Electric Power Authority, Drivers (Series 266), 9.415% (FSA INS), 7/1/2015
| | AAA/NR | | | 2,008,920 |
| 1,000,000 | 2,3 | Puerto Rico Highway and Transportation Authority, Residual Interest Tax-Exempt Securities (Series PA 331A), 9.152% (AMBAC INS), 1/1/2010
| | NR | | | 1,320,540 |
| 500,000 | | Puerto Rico Highway and Transportation Authority, Transportation Revenue Bonds (Series G), 5.00% (Original Issue Yield: 5.10%), 7/1/2033
| | A/Baa1 | | | 505,305 |
| 395,000 | | Puerto Rico Industrial, Tourist, Educational, Medical & Environmental Control Facilities Financing Authority, Cogeneration Facility Revenue Bonds (Series 2000A), 6.625% (AES Puerto Rico Project)/(Original Issue Yield: 6.65%), 6/1/2026
| | NR/Baa3 | | | 423,128 |
| 1,000,000 | | Puerto Rico Public Finance Corp., Commonwealth Appropriation Bonds (Series 2001E), 5.75% (Original Issue Yield: 5.80%), 8/1/2030
|
| BBB+/Baa2
|
|
| 1,089,780
|
| | | TOTAL
|
|
|
|
| 5,347,673
|
| | | Virgin Islands--0.9% | | | | | |
| 500,000 | | University of the Virgin Islands, UT GO Bonds (Series A), 5.375% (Original Issue Yield: 5.43%), 6/1/2034
|
| BBB/NR
|
|
| 512,795
|
| | | TOTAL LONG-TERM MUNICIPALS
(IDENTIFIED COST $50,377,275)
|
|
|
|
| 54,364,918
|
Principal
Amount
|
|
|
| Credit
Rating
| 1
|
| Value
|
| | | SHORT-TERM MUNICIPALS--1.8% | | | | | |
| | | Puerto Rico--1.8% | | | | | |
| $ | 1,000,000 | | Puerto Rico Government Development Bank (GDB) Weekly VRDNs (MBIA Insurance Corp. INS)/(Credit Suisse First Boston LIQ)(AT AMORTIZED COST)
|
| AAA/Aaa
|
| $
| 1,000,000
|
| | | TOTAL INVESTMENTS--98.4%
(IDENTIFIED COST $51,377,275) 4
|
|
|
|
| 55,364,918
|
| | | OTHER ASSETS AND LIABILITIES - NET - 1.6%
|
|
|
|
| 923,956
|
| | | TOTAL NET ASSETS--100%
|
|
|
| $
| 56,288,874
|
Securities subject to the federal alternative minimum tax (AMT) represent 18.2% of the Fund's portfolio as calculated based upon total portfolio market value (percentage is unaudited).
1 Please refer to the Statement of Additional Information for an explanation of the credit ratings. Current credit ratings are unaudited.
2 Denotes a restricted security, including securities purchased under Rule 144A of the Securities Act of 1933. These securities, unless registered under the Act or exempted from registration, may only be sold to qualified institutional investors. At August 31, 2004, these securities amounted to $3,329,460 which represents 5.9% of total net assets.
3 Denotes a restricted security, including securities purchased under Rule 144A that have been deemed liquid by criteria approved by the Fund's Board of Trustees. At August 31, 2004, these securities amounted to $3,329,460 which represents 5.9% of total net assets.
4 The cost of investments for federal tax purposes amounts to $51,374,521.
Note: The categories of investments are shown as a percentage of total net assets at August 31, 2004.
The following acronyms are used throughout this portfolio:
| AMBAC | - --American Municipal Bond Assurance Corporation |
| COL | - --Collateralized |
| COP | - --Certificate of Participation |
| FHA | - --Federal Housing Administration |
| FNMA | - --Federal National Mortgage Association |
| FSA | - --Financial Security Assurance |
| GO | - --General Obligation |
| GTD | - --Guaranteed |
| HFA | - --Housing Finance Authority |
| IFA | - --Industrial Finance Authority |
| INS | - --Insured |
| LIQ | - --Liquidity Agreement |
| PCFA | - --Pollution Control Finance Authority |
| PRF | - --Prerefunded |
| TOBs | - --Tender Option Bonds |
| UT | - --Unlimited Tax |
| VRDNs | - --Variable Rate Demand Notes |
See Notes which are an integral part of the Financial Statements
Statement of Assets and Liabilities
August 31, 2004
Assets:
| | | | | | | |
Total investments in securities, at value (identified cost $51,377,275)
| | | | | $ | 55,364,918 | |
Cash
| | | | | | 63,393 | |
Income receivable
| | | | | | 821,743 | |
Receivable for investments sold
| | | | | | 130,000 | |
Receivable for shares sold
|
|
|
|
|
| 169,159
|
|
TOTAL ASSETS
|
|
|
|
|
| 56,549,213
|
|
Liabilities:
| | | | | | | |
Payable for shares redeemed
| | $ | 99,138 | | | | |
Income distribution payable
| | | 66,554 | | | | |
Payable for daily variation margin
| | | 72,373 | | | | |
Payable for shareholder services fees (Note 5)
| | | 11,937 | | | | |
Accrued expenses
|
|
| 10,337
|
|
|
|
|
TOTAL LIABILITIES
|
|
|
|
|
| 260,339
|
|
Net assets for 5,093,985 shares outstanding
|
|
|
|
| $
| 56,288,874
|
|
Net Assets Consist of:
| | | | | | | |
Paid-in capital
| | | | | $ | 53,522,392 | |
Net unrealized appreciation of investments and futures contracts
| | | | | | 3,999,456 | |
Accumulated net realized loss on investments, futures contracts and swap contracts
| | | | | | (1,232,992 | ) |
Undistributed net investment income
|
|
|
|
|
| 18
|
|
TOTAL NET ASSETS
|
|
|
|
| $
| 56,288,874
|
|
Net Asset Value, Offering Price and Redemption Proceeds Per Share:
| | | | | | | |
Net asset value per share ($56,288,874 ÷ 5,093,985 shares outstanding), no par value, unlimited shares authorized
|
|
|
|
|
| $11.05
|
|
Offering price per share (100/95.50 of $11.05) 1
|
|
|
|
|
| $11.57
|
|
Redemption proceeds per share
|
|
|
|
|
| $11.05
|
|
1 See "What Do Shares Cost?" in the Prospectus.
See Notes which are an integral part of the Financial Statements
Statement of Operations
Year Ended August 31, 2004
Investment Income:
| | | | | | | | | | | | |
Interest
|
|
|
|
|
|
|
|
|
| $
| 3,414,236
|
|
Expenses:
| | | | | | | | | | | | |
Investment adviser fee (Note 5)
| | | | | | $ | 270,316 | | | | | |
Administrative personnel and services fee (Note 5)
| | | | | | | 145,835 | | | | | |
Custodian fees
| | | | | | | 5,322 | | | | | |
Transfer and dividend disbursing agent fees and expenses (Note 5)
| | | | | | | 38,480 | | | | | |
Directors'/Trustees' fees
| | | | | | | 2,288 | | | | | |
Auditing fees
| | | | | | | 13,541 | | | | | |
Legal fees
| | | | | | | 6,707 | | | | | |
Portfolio accounting fees (Note 5)
| | | | | | | 50,259 | | | | | |
Distribution services fee (Note 5)
| | | | | | | 168,948 | | | | | |
Shareholder services fee (Note 5)
| | | | | | | 168,948 | | | | | |
Share registration costs
| | | | | | | 18,656 | | | | | |
Printing and postage
| | | | | | | 18,390 | | | | | |
Insurance premiums
| | | | | | | 7,738 | | | | | |
Miscellaneous
|
|
|
|
|
|
| 1,354
|
|
|
|
|
|
TOTAL EXPENSES
|
|
|
|
|
|
| 916,782
|
|
|
|
|
|
Waivers (Note 5):
| | | | | | | | | | | | |
Waiver of investment adviser fee
| | $ | (184,639 | ) | | | | | | | | |
Waiver of administrative personnel and services fee
| | | (20,298 | ) | | | | | | | | |
Waiver of transfer and dividend disbursing agent fees and expenses
| | | (5,711 | ) | | | | | | | | |
Waiver of distribution services fee
|
|
| (168,948
| )
|
|
|
|
|
|
|
|
|
TOTAL WAIVERS
|
|
|
|
|
|
| (379,596
| )
|
|
|
|
|
Net expenses
|
|
|
|
|
|
|
|
|
|
| 537,186
|
|
Net investment income
|
|
|
|
|
|
|
|
|
|
| 2,877,050
|
|
Realized and Unrealized Gain (Loss) on Investments, Futures Contracts, and Swap Contracts:
| | | | | | | | | | | | |
Net realized gain on investments
| | | | | | | | | | | 727,526 | |
Net realized loss on futures contracts
| | | | | | | | | | | (803,783 | ) |
Net realized loss on swap contracts
| | | | | | | | | | | (516,064 | ) |
Net change in unrealized appreciation of investments
| | | | | | | | | | | 2,180,340 | |
Net change in unrealized appreciation on futures contracts
| | | | | | | | | | | 11,813 | |
Net change in unrealized appreciation on swap contracts
|
|
|
|
|
|
|
|
|
|
| (67,450
| )
|
Net realized and unrealized gain on investments, futures contracts, and swap contracts
|
|
|
|
|
|
|
|
|
|
| 1,532,382
|
|
Change in net assets resulting from operations
|
|
|
|
|
|
|
|
|
| $
| 4,409,432
|
|
See Notes which are an integral part of the Financial Statements
Statement of Changes in Net Assets
Year Ended August 31
|
|
| 2004
|
|
|
| 2003
|
|
Increase (Decrease) in Net Assets
| | | | | | | | |
Operations:
| | | | | | | | |
Net investment income
| | $ | 2,877,050 | | | $ | 2,936,472 | |
Net realized loss on investments, futures contracts and swap contracts
| | | (592,321 | ) | | | (237,392 | ) |
Net change in unrealized appreciation/depreciation of investments, futures contracts, and swap contracts
|
|
| 2,124,703
|
|
|
| (1,365,873
| )
|
CHANGE IN NET ASSETS RESULTING FROM OPERATIONS
|
|
| 4,409,432
|
|
|
| 1,333,207
|
|
Distributions to Shareholders:
| | | | | | | | |
Distributions from net investment income
|
|
| (2,875,892
| )
|
|
| (2,934,354
| ) |
Share Transactions:
| | | | | | | | |
Proceeds from sale of shares
| | | 16,771,898 | | | | 39,633,760 | |
Net asset value of shares issued to shareholders in payment of distributions declared
| | | 1,582,277 | | | | 1,131,254 | |
Cost of shares redeemed
|
|
| (46,028,695
| )
|
|
| (11,995,218
| )
|
CHANGE IN NET ASSETS RESULTING FROM SHARE TRANSACTIONS
|
|
| (27,674,520
| )
|
|
| 28,769,796
|
|
Change in net assets
|
|
| (26,140,980
| )
|
|
| 27,168,649
|
|
Net Assets:
| | | | | | | | |
Beginning of period
|
|
| 82,429,854
|
|
|
| 55,261,205
|
|
End of period (including undistributed net investment income of $18 and $60, respectively)
|
| $
| 56,288,874
|
|
| $
| 82,429,854
|
|
See Notes which are an integral part of the Financial Statements
Notes to Financial Statements
August 31, 2004
1. ORGANIZATION
Federated Municipal Securities Income Trust (the "Trust") is registered under the Investment Company Act of 1940, as amended (the "Act"), as an open-end, management investment company. The Trust consists of seven portfolios. The financial statements included herein are only those of Federated North Carolina Municipal Income Fund (the "Fund"), a non-diversified portfolio. The financial statements of the other portfolios are presented separately. The assets of each portfolio are segregated and a shareholder's interest is limited to the portfolio in which shares are held. The investment objective of the Fund is to provide current income exempt from federal regular income tax and the personal income taxes imposed by the state of North Carolina. Interest from the Fund's investments may be subject to the federal AMT for individuals and corporations. The Fund offers one class of shares: Class A Shares.
2. SIGNIFICANT ACCOUNTING POLICIES
The following is a summary of significant accounting policies consistently followed by the Fund in the preparation of its financial statements. These policies are in conformity with generally accepted accounting principles (GAAP) in the United States of America.
Investment Valuation
Municipal bonds are valued by an independent pricing service, taking into consideration yield, liquidity, risk, credit quality, coupon, maturity, type of issue and any other factors or market data the pricing service deems relevant. Short-term securities are valued at the prices provided by an independent pricing service. However, short-term securities with remaining maturities of 60 days or less at the time of purchase may be valued at amortized cost, which approximates fair market value. Securities for which no quotations are readily available are valued at fair value as determined in accordance with procedures established by and under general supervision of the Board of Trustees (the "Trustees").
Investment Income, Expenses and Distributions
Interest income and expenses are accrued daily. Distributions to shareholders are recorded on the ex-dividend date. Non-cash dividends included in dividend income, if any, are recorded at fair value.
Premium and Discount Amortization
All premiums and discounts on fixed-income securities are amortized/accreted for financial statement purposes.
Federal Taxes
It is the Fund's policy to comply with the Subchapter M provision of the Internal Revenue Code (the "Code") and to distribute to shareholders each year substantially all of its income. Accordingly, no provision for federal income tax is necessary.
When-Issued and Delayed Delivery Transactions
The Fund may engage in when-issued or delayed delivery transactions. The Fund records when-issued securities on the trade date and maintains security positions such that sufficient liquid assets will be available to make payment for the securities purchased. Securities purchased on a when-issued or delayed delivery basis are marked to market daily and begin earning interest on the settlement date. Losses may occur on these transactions due to changes in market conditions or the failure of counterparties to perform under the contract.
Swap Contracts
The Fund may enter into swap contracts. A swap is an exchange of cash payments between the Fund and another party, which is based on a specific financial index. The value of the swap is adjusted daily and the change in value is recorded as unrealized appreciation or depreciation. When a swap contract is closed, the Fund recognizes a realized gain or loss. The swap contracts entered into by the Fund are on a forward settling basis. For the year ended August 31, 2004, the Fund had realized losses on swap contracts of $516,064.
Risks may arise upon entering into these agreements from the potential inability of the counterparties to meet the terms of their contract and from unanticipated changes in the value of the financial index on which the swap agreement is based. The Fund uses swaps for hedging purposes to reduce its exposure to interest rate fluctuations.
At August 31, 2004, the Fund had no open swap contracts.
Futures Contracts
The Fund periodically may sell bond interest rate futures contracts to manage duration, and to potentially reduce transaction costs. Upon entering into a bond interest rate futures contract with a broker, the Fund is required to deposit in a segregated account a specified amount of cash or U.S. government securities. Futures contracts are valued daily and unrealized gains or losses are recorded in a "variation margin" account. Daily, the Fund receives from or pays to the broker a specified amount of cash based upon changes in the variation margin account. When a contract is closed, the Fund recognizes a realized gain or loss. For the year end August 31, 2004, the Fund had realized losses on futures contracts of $803,783.
Futures contracts have market risks, including the risk that the change in the value of the contract may not correlate with changes in the value of the underlying securities.
At August 31, 2004, the Fund had outstanding futures contracts as set forth below:
Expiration Date
|
| Contracts
|
| Position
|
| Unrealized
Appreciation
|
December 2004
|
| 75 U.S. Treasury Note 10-Year Futures
|
| Short
|
| $11,813
|
Restricted Securities
Restricted securities are securities that may only be resold upon registration under federal securities laws or in transactions exempt from such registration. In some cases, the issuer of restricted securities has agreed to register such securities for resale, at the issuer's expense either upon demand by the Fund or in connection with another registered offering of the securities. Many restricted securities may be resold in the secondary market in transactions exempt from registration. Such restricted securities may be determined to be liquid under criteria established by the Trustees. The Fund will not incur any registration costs upon such resales. The Fund's restricted securities are valued at the price provided by dealers in the secondary market or, if no market prices are available, at the fair value as determined in accordance with procedures established by and under general supervision of the Trustees.
Additional information on restricted securities, including securities purchased under Rule 144A that have not been deemed liquid by the Trustees, for each security held at August 31, 2004, is as follows:
Security
|
| Acquisition Date
|
| Acquisition Cost
|
Puerto Rico Electric Power Authority, Drivers (Series 266), 9.415% (FSA INS), 7/1/2015
|
| 6/27/2003
|
| $1,813,581
|
Puerto Rico Highway and Transportation Authority, Residual Interest Tax-Exempt Securities (Series PA 331A), 9.152% (AMBAC INS), 1/1/2010
|
| 7/22/2003
|
| $1,256,096
|
Use of Estimates
The preparation of financial statements in conformity with GAAP requires management to make estimates and assumptions that affect the amounts of assets, liabilities, expenses and revenues reported in the financial statements. Actual results could differ from those estimated.
Other
Investment transactions are accounted for on a trade date basis. Realized gains and losses from investment transactions are recorded on an identified cost basis.
3. SHARES OF BENEFICIAL INTEREST
The following table summarizes share activity.
Year Ended August 31
|
| 2004
|
|
| 2003
|
|
Shares sold
|
| 1,509,133
|
|
| 3,537,083
|
|
Shares issued to shareholders in payment of distributions declared
|
| 142,350
|
|
| 101,455
|
|
Shares redeemed
|
| (4,108,095
| )
|
| (1,077,793
| )
|
NET CHANGE RESULTING FROM SHARE TRANSACTIONS
|
| (2,456,612
| )
|
| 2,560,745
|
|
4. FEDERAL TAX INFORMATION
The timing and character of income and capital gain distributions are determined in accordance with income tax regulations, which may differ from GAAP. These differences are due in part to differing treatments for discount accretion/premium amortization of debt securities.
For the year ended August 31, 2004, permanent differences identified and reclassified among the components of net assets were as follows:
Increase (Decrease)
|
Undistributed
Net Investment
Income (Loss)
|
| Accumulated
Net Realized
Gains (Losses)
|
$(1,200)
|
| $1,200
|
Net investment income (loss), net realized gains (losses), and net assets were not affected by this reclassification.
The tax character of distributions as reported on the Statement of Changes in Net Assets for the years ended August 31, 2004 and August 31, 2003, were as follows:
|
| 2004
|
| 2003
|
Tax-exempt income
|
| $2,875,892
|
| $2,934,354
|
As of August 31, 2004, the components of distributable earnings on a tax basis were as follows:
Undistributed tax-exempt income
|
| $
| 66,573
|
Unrealized appreciation
|
| $
| 4,002,210
|
Capital loss carryforward
|
| $
| 827,060
|
At August 31, 2004, the cost of investments for federal tax purposes was $51,374,521. The net unrealized appreciation of investments for federal tax purposes was $3,990,397. This consists of net unrealized appreciation from investments for those securities having an excess of value over cost of $3,993,177 and net unrealized depreciation from investments for those securities having an excess of cost over value of $2,780.
The difference between book-basis and tax-basis unrealized appreciation/depreciation is attributable to differing treatments for discount accretion/premium amortization of debt securities.
At August 31, 2004, the Fund had a capital loss carryforward of $827,060 which will reduce the Fund's taxable income arising from future net realized gains on investments, if any, to the extent permitted by the Code and thus will reduce the amount of distributions to shareholders which would otherwise be necessary to relieve the Fund of any liability for federal tax. Pursuant to the Code, such capital loss carryforward will expire as follows:
Expiration Year
|
| Expiration Amount
|
2008
|
| $332,559
|
2012
|
| $494,501
|
Under current tax regulations, capital losses realized after October 31 may be deferred and treated as occurring on the first day of the following fiscal year. As of August 31, 2004, for federal income tax purposes, post October losses of $396,875 were deferred to September 1, 2004.
5. INVESTMENT ADVISER FEE AND OTHER TRANSACTIONS WITH AFFILIATES
Investment Adviser Fee
Federated Investment Management Company, the Fund's investment adviser (the "Adviser"), receives for its services an annual investment adviser fee equal to 0.40% of the Fund's average daily net assets. The Adviser may voluntarily choose to waive any portion of its fee. The Adviser can modify or terminate this voluntary waiver at any time at its sole discretion.
Administrative Fee
Federated Administrative Services (FAS), under the Administrative Services Agreement, provides the Fund with administrative personnel and services. The fee paid to FServ is based on the average aggregate daily net assets of all Federated funds as specified below:
Maximum
Administrative Fee
|
| Average Aggregate Daily Net Assets
of the Federated Funds
|
0.150%
|
| on the first $5 billion
|
0.125%
|
| on the next $5 billion
|
0.100%
|
| on the next $10 billion
|
0.075%
|
| on assets in excess of $20 billion
|
The administrative fee received during any fiscal year shall be at least $150,000 per portfolio and $40,000 per each additional class of Shares. FAS may voluntarily chose to waive any portion of its fee. FAS can modify or terminate this voluntary waiver at any time at its sole discretion.
Prior to November 1, 2003, Federated Services Company (FServ) provided the Fund with administrative personnel and services. The fee paid to FServ was based on the average aggregate daily net assets of all Federated funds as specified below:
Maximum
Administrative Fee
|
| Average Aggregate Daily Net Assets
of the Federated Funds
|
0.150%
|
| on the first $250 million
|
0.125%
|
| on the next $250 million
|
0.100%
|
| on the next $250 million
|
0.075%
|
| on assets in excess of $750 million
|
The administrative fee received during any fiscal year was at least $125,000 per portfolio and $30,000 per each additional class of Shares.
For the year ended August 31, 2004 the fees paid to FAS and FServ were $104,704 and $20,833, respectively, after voluntary waiver, if applicable.
Distribution Services Fee
The Fund has adopted a Distribution Plan (the "Plan") pursuant to Rule 12b-1 under the Act. Under the terms of the Plan, the Fund will compensate Federated Securities Corp. (FSC), the principal distributor, from the net assets of the Fund's shares to finance activities intended to result in the sale of these shares. The Plan provides that the Fund may incur distribution expenses up to 0.25% of the average daily net assets, annually, to compensate FSC. FSC may voluntarily choose to waive any portion of its fee. FSC can modify or terminate this voluntary waiver at any time at its sole discretion.
Sales Charges
For the fiscal year ended August 31, 2004, FSC retained $20,803 in sales charges from the sale of the Fund's Shares. See "What Do shares Cost?" in the Prospectus.
Shareholder Services Fee
Under the terms of a Shareholder Services Agreement with Federated Shareholder Services Company (FSSC), the Fund will pay FSSC up to 0.25% of average daily net assets of the Fund's shares for the period. The fee paid to FSSC is used to finance certain services for shareholders and to maintain shareholder accounts. FSSC may voluntarily choose to waive any portion of its fee. FSSC can modify or terminate this voluntary waiver at any time at its sole discretion.
Transfer and Dividend Disbursing Agent Fees and Expenses
Prior to July 1, 2004, FServ, through its subsidiary FSSC, served as transfer and dividend disbursing agent for the Fund. The fee paid to FSSC was based on the size, type and number of accounts and transactions made by shareholders. The fee paid to FSSC during the reporting period was $26,828, after voluntary waiver, if applicable.
Portfolio Accounting Fees
Prior to January 1, 2004, FServ maintained the Fund's accounting records for which it received a fee. The fee was based on the level of the Fund's average daily net assets for the period, plus out-of-pocket expenses. The fee paid to FServ during the reporting period was $18,426, after voluntary waiver, if applicable.
Interfund Transactions
During the year ended August 31, 2004, the Fund engaged in purchase and sale transactions with funds that have a common investment adviser (or affiliated investment advisers), common Directors/Trustees, and/or common Officers. These purchase and sale transactions complied with Rule 17a-7 under the Act and amounted to $22,100,000 and $22,200,000, respectively.
General
Certain of the Officers and Trustees of the Trust are Officers and Directors or Trustees of the above companies.
6. INVESTMENT TRANSACTIONS
Purchases and sales of investments, excluding long-term U.S. government securities and short-term obligations (and in-kind contributions), for the year ended August 31, 2004, were as follows:
Purchases
|
| $
| 10,229,882
|
Sales
|
| $
| 38,709,259
|
7. CONCENTRATION OF CREDIT RISK
Since the Fund invests a substantial portion of its assets in issuers located in one state, it will be more susceptible to factors adversely affecting issuers of that state than would be a comparable tax-exempt mutual fund that invests nationally. In order to reduce the credit risk associated with such factors, at August 31, 2004, 41.5% of the securities in the portfolio of investments are backed by letters of credit or bond insurance of various financial institutions and financial guaranty assurance agencies. The largest percentage of investments insured by or supported (backed) by a letter of credit from any one institution or agency was 17.6% of total investments.
8. LEGAL PROCEEDINGS
In October 2003, Federated Investors, Inc. and various subsidiaries thereof (including the advisers and distributor for various investment companies, collectively, "Federated"), along with various investment companies sponsored by Federated ("Funds") were named as defendants in several class action lawsuits now pending in the United States District Court for the District of Maryland seeking damages of unspecified amounts. The lawsuits were purportedly filed on behalf of people who purchased, owned and/or redeemed shares of Federated-sponsored mutual funds during specified periods beginning November 1, 1998. The suits are generally similar in alleging that Federated engaged in illegal and improper trading practices including market timing and late trading in concert with certain institutional traders, which allegedly caused financial injury to the mutual fund shareholders. Federated and various Funds have also been named as defendants in several additional lawsuits, now pending in the United States District Court for the Western District of Pennsylvania, alleging, among other things, excessive advisory and Rule 12b-1 fees, and seeking damages of unspecified amounts. The Board of the Funds has retained the law firm of Dickstein Shapiro Morin & Oshinsky LLP to represent the Funds in these lawsuits. Federated and the Funds, and their respective counsel, are reviewing the allegations and will respond appropriately. Additional lawsuits based upon similar allegations may be filed in the future. The potential impact of these recent lawsuits and future potential similar suits is uncertain. Although we do not believe that these lawsuits will have a material adverse effect on the Funds, there can be no assurance that these suits, the ongoing adverse publicity and/or other developments resulting from related regulatory investigations will not result in increased Fund redemptions, reduced sales of Fund shares, or other adverse consequences for the Funds.
9. FEDERAL TAX INFORMATION (UNAUDITED)
At August 31, 2004, 100% of the distributions from net investment income is exempt from federal income tax, other than the federal AMT.
Report of Independent Registered Public Accounting Firm
TO THE BOARD OF TRUSTEES OF FEDERATED MUNICIPAL SECURITIES
INCOME TRUST AND SHAREHOLDERS OF FEDERATED NORTH CAROLINA
MUNICIPAL INCOME FUND:
We have audited the accompanying statement of assets and liabilities, including the portfolio of investments, of Federated North Carolina Municipal Income Fund (the "Fund") as of August 31,2004, and the related statement of operations for the year then ended, the statement of changes in net assets for each of the two years in the period then ended, and the financial highlights for each of the five years in the period then ended. These financial statements and financial highlights are the responsibility of the Fund's management. Our responsibility is to express an opinion on these financial statements and financial highlights based on our audit.
We conducted our audit in accordance with standards of the Public Company Accounting Oversight Board (United States). Those standards require that we plan and perform the audit to provide reasonable assurance about whether the financial statements and financial highlights are free of material misstatement. An audit includes examining, on a test basis, evidence supporting the amounts and disclosures in the financial statements. Our procedures included confirmation of the securities owned at August 31, 2004, by correspondence with the custodian. An audit also includes assessing the accounting principles used and significant estimates made by management, as well as evaluating the overall financial statement presentation. We believe our audits provide a reasonable basis for our opinion.
In our opinion, such financial statements and financial highlights present fairly, in all material respects, the financial position of Federated North Carolina Municipal Income Fund as of August 31, 2004, the results of its operations, the changes in its net assets and its financial highlights for the respective stated periods in conformity with accounting principles generally accepted in the United States of America.
Deloitte & Touche LLP
Boston, Massachusetts
October 20, 2004
Board of Trustees and Trust Officers
The Board is responsible for managing the Trust's business affairs and for exercising all the Trust's powers except those reserved for the shareholders. The following tables give information about each Board member and the senior officers of the Fund. Where required, the tables separately list Board members who are "interested persons" of the Fund ( i.e. , "Interested" Board members) and those who are not ( i.e. , "Independent" Board members). Unless otherwise noted, the address of each person listed is Federated Investors Tower, 1001 Liberty Avenue, Pittsburgh, PA. The Trust comprises seven portfolios and the Federated Fund Complex consists of 44 investment companies (comprising 136 portfolios). Unless otherwise noted, each Officer is elected annually. Unless otherwise noted, each Board member oversees all portfolios in the Federated Fund Complex and serves for an indefinite term. The Fund's Statement of Additional Information includes additional information about Trust Trustees and is available, without charge and upon request, by calling 1-800-341-7400.
INTERESTED TRUSTEES BACKGROUND
|
|
|
Name
Birth Date
Address
Positions Held with Trust
Date Service Began
|
| Principal Occupation(s) for Past Five Years,
Other Directorships Held and Previous Position(s)
|
John F. Donahue*
Birth Date: July 28, 1924
CHAIRMAN AND TRUSTEE
Began serving: August 1990 | | Principal Occupations : Chairman and Director or Trustee of the Federated Fund Complex; Chairman and Director, Federated Investors, Inc.
Previous Positions : Trustee, Federated Investment Management Company and Chairman and Director, Federated Investment Counseling. |
|
|
|
J. Christopher Donahue*
Birth Date: April 11, 1949
PRESIDENT AND TRUSTEE
Began serving: August 1990 | | Principal Occupations : Principal Executive Officer and President of the Federated Fund Complex; Director or Trustee of some of the Funds in the Federated Fund Complex; President, Chief Executive Officer and Director, Federated Investors, Inc.; Chairman and Trustee, Federated Investment Management Company; Trustee, Federated Investment Counseling; Chairman and Director, Federated Global Investment Management Corp.; Chairman, Passport Research, Ltd.; Trustee, Federated Shareholder Services Company; Director, Federated Services Company.
Previous Positions : President, Federated Investment Counseling; President and Chief Executive Officer, Federated Investment Management Company, Federated Global Investment Management Corp. and Passport Research, Ltd. |
|
|
|
|
|
|
Name
Birth Date
Address
Positions Held with Trust
Date Service Began
|
| Principal Occupation(s) for Past Five Years,
Other Directorships Held and Previous Position(s)
|
Lawrence D. Ellis, M.D.*
Birth Date: October 11, 1932
3471 Fifth Avenue
Suite 1111
Pittsburgh, PA
TRUSTEE
Began serving: August 1990 | | Principal Occupations : Director or Trustee of the Federated Fund Complex; Professor of Medicine, University of Pittsburgh; Medical Director, University of Pittsburgh Medical Center Downtown; Hematologist, Oncologist and Internist, University of Pittsburgh Medical Center.
Other Directorships Held : Member, National Board of Trustees, Leukemia Society of America.
Previous Positions : Trustee, University of Pittsburgh; Director, University of Pittsburgh Medical Center. |
|
|
|
* Family relationships and reasons for "interested" status: John F. Donahue is the father of J. Christopher Donahue; both are "interested" due to the positions they hold with Federated Investors, Inc. and its subsidiaries. Lawrence D. Ellis, M.D. is "interested" because his son-in-law is employed by the Fund's principal underwriter, Federated Securities Corp.
INDEPENDENT TRUSTEES BACKGROUND
|
|
|
Name
Birth Date
Address
Positions Held with Trust
Date Service Began
|
| Principal Occupation(s) for Past Five Years,
Other Directorships Held and Previous Position(s)
|
Thomas G. Bigley
Birth Date: February 3, 1934
15 Old Timber Trail
Pittsburgh, PA
TRUSTEE
Began serving: November 1994 | | Principal Occupation : Director or Trustee of the Federated Fund Complex.
Other Directorships Held : Director, Member of Executive Committee, Children's Hospital of Pittsburgh; Director, University of Pittsburgh.
Previous Position : Senior Partner, Ernst & Young LLP. |
|
|
|
John T. Conroy, Jr.
Birth Date: June 23, 1937
Grubb & Ellis/Investment
Properties Corporation
3838 North Tamiami Trail
Suite 402
Naples, FL
TRUSTEE
Began serving: August 1991 | | Principal Occupations : Director or Trustee of the Federated Fund Complex; Chairman of the Board, Investment Properties Corporation; Partner or Trustee in private real estate ventures in Southwest Florida.
Previous Positions : President, Investment Properties Corporation; Senior Vice President, John R. Wood and Associates, Inc., Realtors; President, Naples Property Management, Inc. and Northgate Village Development Corporation. |
|
|
|
|
|
|
Name
Birth Date
Address
Positions Held with Trust
Date Service Began
|
| Principal Occupation(s) for Past Five Years,
Other Directorships Held and Previous Position(s)
|
Nicholas P. Constantakis
Birth Date: September 3, 1939
175 Woodshire Drive
Pittsburgh, PA
TRUSTEE
Began serving: February 1998 | | Principal Occupations : Director or Trustee of the Federated Fund Complex.
Other Directorships Held : Director and Member of the Audit Committee, Michael Baker Corporation (engineering and energy services worldwide).
Previous Position : Partner, Andersen Worldwide SC. |
|
|
|
John F. Cunningham
Birth Date: March 5, 1943
353 El Brillo Way
Palm Beach, FL
TRUSTEE
Began serving: July 1999 | | Principal Occupation : Director or Trustee of the Federated Fund Complex.
Other Directorships Held : Chairman, President and Chief Executive Officer, Cunningham & Co., Inc. (strategic business consulting); Trustee Associate, Boston College.
Previous Positions : Director, Redgate Communications and EMC Corporation (computer storage systems); Chairman of the Board and Chief Executive Officer, Computer Consoles, Inc.; President and Chief Operating Officer, Wang Laboratories; Director, First National Bank of Boston; Director, Apollo Computer, Inc. |
|
|
|
Peter E. Madden
Birth Date: March 16, 1942
One Royal Palm Way
100 Royal Palm Way
Palm Beach, FL
TRUSTEE
Began serving: August 1991 | | Principal Occupation : Director or Trustee of the Federated Fund Complex; Management Consultant.
Other Directorships Held : Board of Overseers, Babson College.
Previous Positions : Representative, Commonwealth of Massachusetts General Court; President, State Street Bank and Trust Company and State Street Corporation (retired); Director, VISA USA and VISA International; Chairman and Director, Massachusetts Bankers Association; Director, Depository Trust Corporation; Director, The Boston Stock Exchange. |
|
|
|
Charles F. Mansfield, Jr.
Birth Date: April 10, 1945
80 South Road
Westhampton Beach, NY
TRUSTEE
Began serving: January 1999 | | Principal Occupations : Director or Trustee of the Federated Fund Complex; Management Consultant; Executive Vice President, DVC Group, Inc. (marketing communications and technology) (prior to 9/1/00).
Previous Positions : Chief Executive Officer, PBTC International Bank; Partner, Arthur Young & Company (now Ernst & Young LLP); Chief Financial Officer of Retail Banking Sector, Chase Manhattan Bank; Senior Vice President, HSBC Bank USA (formerly, Marine Midland Bank); Vice President, Citibank; Assistant Professor of Banking and Finance, Frank G. Zarb School of Business, Hofstra University. |
|
|
|
|
|
|
Name
Birth Date
Address
Positions Held with Trust
Date Service Began
|
| Principal Occupation(s) for Past Five Years,
Other Directorships Held and Previous Position(s)
|
John E. Murray, Jr., J.D., S.J.D.
Birth Date: December 20, 1932
Chancellor, Duquesne University
Pittsburgh, PA
TRUSTEE
Began serving: February 1995 | | Principal Occupations : Director or Trustee of the Federated Fund Complex; Chancellor and Law Professor, Duquesne University; Partner, Murray, Hogue and Lannis.
Other Directorships Held : Director, Michael Baker Corp. (engineering, construction, operations and technical services).
Previous Positions : President, Duquesne University; Dean and Professor of Law, University of Pittsburgh School of Law; Dean and Professor of Law, Villanova University School of Law. |
|
|
|
Marjorie P. Smuts
Birth Date: June 21, 1935
4905 Bayard Street
Pittsburgh, PA
TRUSTEE
Began serving: August 1990 | | Principal Occupations : Director or Trustee of the Federated Fund Complex; Public Relations/Marketing Consultant/Conference Coordinator.
Previous Positions : National Spokesperson, Aluminum Company of America; television producer; President, Marj Palmer Assoc.; Owner, Scandia Bord. |
|
|
|
John S. Walsh
Birth Date: November 28, 1957
2604 William Drive
Valparaiso, IN
TRUSTEE
Began serving: July 1999 | | Principal Occupations : Director or Trustee of the Federated Fund Complex; President and Director, Heat Wagon, Inc. (manufacturer of construction temporary heaters); President and Director, Manufacturers Products, Inc. (distributor of portable construction heaters); President, Portable Heater Parts, a division of Manufacturers Products, Inc.
Previous Position : Vice President, Walsh & Kelly, Inc. |
|
|
|
OFFICERS
|
|
|
Name
Birth Date
Positions Held with Trust
Date Service Began
|
| Principal Occupation(s) for Past Five Years and Previous Position(s)
|
John W. McGonigle
Birth Date: October 26, 1938
EXECUTIVE VICE PRESIDENT
AND SECRETARY
Began serving: June 1995 | | Principal Occupations : Executive Vice President and Secretary of the Federated Fund Complex; Executive Vice President, Secretary and Director, Federated Investors, Inc. |
|
|
|
Richard J. Thomas
Birth Date: June 17, 1954
TREASURER
Began serving: November 1998 | | Principal Occupations : Principal Financial Officer and Treasurer of the Federated Fund Complex; Senior Vice President, Federated Administrative Services. |
|
|
|
Richard B. Fisher
Birth Date: May 17, 1923
VICE CHAIRMAN
Began serving: August 2002 | | Principal Occupations : Vice Chairman or President of some of the Funds in the Federated Fund Complex; Vice Chairman, Federated Investors, Inc.; Chairman, Federated Securities Corp.
Previous Positions : President and Director or Trustee of some of the Funds in the Federated Fund Complex; Executive Vice President, Federated Investors, Inc. and Director and Chief Executive Officer, Federated Securities Corp. |
|
|
|
Mary Jo Ochson
Birth Date: September 12, 1953
CHIEF INVESTMENT OFFICER
Began serving: May 2004 | | Principal Occupations: Mary Jo Ochson has been the Fund's Portfolio Manager since June 1999. Ms. Ochson was named Chief Investment Officer of tax-exempt, fixed-income products in 2004. She joined Federated in 1982 and has been a Senior Portfolio Manager and a Senior Vice President of the Fund's Adviser since 1996. Ms. Ochson is a Chartered Financial Analyst and received her M.B.A. in Finance from the University of Pittsburgh. |
|
|
|
J. Scott Albrecht
Birth Date: June 1, 1960
VICE PRESIDENT
Began serving: November 1998 | | J. Scott Albrecht has been the Fund's Portfolio Manager since June 1999. He is Vice President of the Trust. Mr. Albrecht joined Federated in 1989. He has been a Senior Portfolio Manager since 1997 and a Vice President of the Fund's Adviser since 1994. He was a Portfolio Manager from 1994 to 1996. Mr. Albrecht is a Chartered Financial Analyst and received his M.S. in Public Management from Carnegie Mellon University. |
|
|
|
Mutual funds are not bank deposits or obligations, are not guaranteed by any bank, and are not insured or guaranteed by the U.S. government, the Federal Deposit Insurance Corporation, the Federal Reserve Board, or any other government agency. Investment in mutual funds involves investment risk, including the possible loss of principal.
This report is authorized for distribution to prospective investors only when preceded or accompanied by the Fund's prospectus, which contains facts concerning its objective and policies, management fees, expenses, and other information.
VOTING PROXIES ON FUND PORTFOLIO SECURITIES
A description of the policies and procedures that the Fund uses to determine how to vote proxies relating to securities held in the Fund's portfolio is available, without charge and upon request, by calling 1-800-341-7400. A report on "Form N-PX" of how the Fund voted any such proxies during the most recent 12-month period ended June 30 is available through Federated's website. Go to http://www.federatedinvestors.com, select "Products," select the "Prospectuses and Regulatory Reports" link, then select the Fund to access the link to Form N-PX. This information is also available from the EDGAR database on the SEC's website at http://www.sec.gov.
QUARTERLY PORTFOLIO SCHEDULE
The Fund files with the SEC a complete schedule of its portfolio holdings, as of the close of the first and third quarters of its fiscal year, on "Form N-Q." These filings are available on the SEC's website at http://www.sec.gov; and may be reviewed and copied at the SEC's Public Reference Room in Washington, DC. (Call 1-800-SEC-0330 for information on the operation of the Public Reference Room.) You may also access this information from the "Products" section of Federated's website at www.federatedinvestors.com by clicking on "Portfolio Holdings" and selecting the name of the Fund, or by selecting the name of the Fund and clicking on "Portfolio Holdings." You must register on the website the first time you wish to access this information.
Federated
World-Class Investment Manager
Federated North Carolina Municipal Income Fund
Federated Investors Funds
5800 Corporate Drive
Pittsburgh, PA 15237-7000
www.federatedinvestors.com
Contact us at 1-800-341-7400 or
www.federatedinvestors.com/contact
Federated Securities Corp., Distributor
Cusip 313923500
28993 (10/04)
Federated is a registered mark of Federated Investors, Inc. 2004 (c)Federated Investors, Inc.
Federated
World-Class Investment Manager
Federated Ohio Municipal Income Fund
A Portfolio of Federated Municipal Securities Income Trust
ANNUAL SHAREHOLDER REPORT
August 31, 2004
Class F Shares
FINANCIAL HIGHLIGHTS
SHAREHOLDER EXPENSE EXAMPLE
MANAGEMENT'S DISCUSSION OF FUND PERFORMANCE
PORTFOLIO OF INVESTMENTS SUMMARY TABLES
FINANCIAL STATEMENTS
REPORT OF INDEPENDENT REGISTERED PUBLIC ACCOUNTING FIRM
BOARD OF TRUSTEES AND TRUST OFFICERS
VOTING PROXIES ON FUND PORTFOLIO SECURITIES
QUARTERLY PORTFOLIO SCHEDULE
Not FDIC Insured * May Lose Value * No Bank Guarantee
Financial Highlights
(For a Share Outstanding Throughout Each Period)
Year Ended August 31
|
| 2004
|
|
| 2003
|
|
| 2002
|
|
| 2001
|
|
| 2000
|
|
Net Asset Value, Beginning of Period
| | $11.31 | | | $11.47 | | | $11.45 | | | $11.06 | | | $11.11 | |
Income From Investment Operations:
| | | | | | | | | | | | | | | |
Net investment income
| | 0.51 | | | 0.52 | | | 0.53 | 1 | | 0.55 | | | 0.55 | |
Net realized and unrealized gain (loss) on investments, futures contracts and swap contracts
|
| 0.20
|
|
| (0.16
| )
|
| 0.02
| 1
|
| 0.38
|
|
| (0.06
| )
|
TOTAL FROM INVESTMENT OPERATIONS
|
| 0.71
|
|
| 0.36
|
|
| 0.55
|
|
| 0.93
|
|
| 0.49
|
|
Less Distributions:
| | | | | | | | | | | | | | | |
Distributions from net investment income
|
| (0.51
| )
|
| (0.52
| )
|
| (0.53
| )
|
| (0.54
| )
|
| (0.54
| )
|
TOTAL DISTRIBUTIONS
|
| (0.51
| )
|
| (0.52
| )
|
| (0.53
| )
|
| (0.54
| )
|
| (0.54
| )
|
Net Asset Value, End of Period
|
| $11.51
|
|
| $11.31
|
|
| $11.47
|
|
| $11.45
|
|
| $11.06
|
|
Total Return 2
|
| 6.36
| %
|
| 3.17
| %
|
| 4.97
| %
|
| 8.69
| %
|
| 4.68
| %
|
| | | | | | | | | | | | | | | |
Ratios to Average Net Assets:
|
|
|
|
|
|
|
|
|
|
|
|
|
|
|
|
Expenses
|
| 0.90
| %
|
| 0.90
| %
|
| 0.90
| %
|
| 0.90
| %
|
| 0.90
| %
|
Net investment income
|
| 4.44
| %
|
| 4.51
| %
|
| 4.75
| % 1
|
| 4.90
| %
|
| 5.06
| %
|
Expense waiver/reimbursement 3
|
| 0.48
| %
|
| 0.45
| %
|
| 0.49
| %
|
| 0.51
| %
|
| 0.54
| %
|
Supplemental Data:
|
|
|
|
|
|
|
|
|
|
|
|
|
|
|
|
Net assets, end of period (000 omitted)
|
| $94,744
|
|
| $96,374
|
|
| $89,772
|
|
| $75,896
|
|
| $73,710
|
|
Portfolio turnover
|
| 19
| %
|
| 12
| %
|
| 21
| %
|
| 39
| %
|
| 37
| %
|
1 Effective September 1, 2001, the Fund adopted the provisions of the American Institute of Certified Public Accountants (AICPA) Audit and Accounting Guide for Investment Companies and began accreting discount on debt securities. For the year ended August 31, 2002, this change had no effect on the net investment income per share or the net realized and unrealized gain (loss) on investments per share, but increased the ratio of the net investment income to average net assets from 4.74% to 4.75%. Per share, ratios and supplemental data for the periods prior to September 1, 2001 have not been restated to reflect this change in presentation.
2 Based on net asset value, which does not reflect the sales charge, redemption fee or contingent deferred sales charge, if applicable.
3 This voluntary expense decrease is reflected in both the expense and the net investment income ratios shown above.
See Notes which are an integral part of the Financial Statements
Shareholder Expense Example
As a shareholder of the Fund, you incur two types of costs: (1) transaction costs, including sales charges (load) on purchase payments; and (2) ongoing costs, including management fees, distribution (12b-1) fees, shareholder services fees and other Fund expenses. This Example is intended to help you understand your ongoing costs (in dollars) of investing in the Fund and to compare these costs with the ongoing costs of investing in other mutual funds. It is based on an investment of $1,000 invested at the beginning of the period and held for the entire period from March 1, 2004 to August 31, 2004.
ACTUAL EXPENSES
The first section of the table below provides information about actual account values and actual expenses. You may use the information in this section, together with the amount you invested, to estimate the expenses that you incurred over the period. Simply divide your account value by $1,000 (for example, an $8,600 account value divided by $1,000 = 8.6), then multiply the result by the number in the first section under the heading entitled "Expenses Paid During Period" to estimate the expenses attributable to your investment during this period.
HYPOTHETICAL EXAMPLE FOR COMPARISON PURPOSES
The second section of the table below provides information about hypothetical account values and hypothetical expenses based on the Fund's actual expense ratio and an assumed rate of return of 5% per year before expenses, which is not the Fund's actual return. Thus, you should not use the hypothetical account values and expenses to estimate the actual ending account balance or your expenses for the period. Rather, these figures are provided to enable you to compare the ongoing costs of investing in the Fund and other funds. To do so, compare this 5% hypothetical example with the 5% hypothetical examples that appear in the shareholder reports of the other funds.
Please note that the expenses shown in the table are meant to highlight your ongoing costs only and do not reflect any transaction costs, such as sales charges (loads). Therefore, the second section of the table is useful in comparing ongoing costs only, and will not help you determine the relative total costs of owning different funds. In addition, if these transaction costs were included, your costs would have been higher.
|
| Beginning
Account Value
3/1/2004
|
| Ending
Account Value
8/31/2004
|
| Expenses Paid
During Period 1
|
Actual
|
| $1,000
|
| $999.70
|
| $4.52
|
Hypothetical (assuming a 5% return before expenses)
|
| $1,000
|
| $1,020.61
|
| $4.57
|
1 Expenses are equal to the Federated Ohio Municipal Income Fund's annualized expense ratio of 0.90%, multiplied by the average account value over the period, multiplied by 184/366 (to reflect the one-half year period).
Management's Discussion of Fund Performance
The fund's total return, based on net asset value, for the 12-month reporting period was 6.36% for the fund's Class F Shares. The total return consisted of 4.59% of tax-exempt dividends, and 1.77% appreciation in the net asset value of the shares. 1 The total return of the Lehman Brothers Municipal Bond Index, the fund's benchmark index (LBMB), 2 was 7.11% during the 12-month reporting period.
The fund's investment strategy focused on: (a) the effective duration of its portfolio (which indicates the portfolio's sensitivity to changes in interest rates); (b) the selection of securities with different maturities (expressed by a "yield curve" showing the relative yield of similar securities with different maturities) and the coupon income provided by the portfolio securities (the coupon is the interest rate paid by a bond); (c) the allocation of the portfolio among securities of similar issuers (referred to as "sectors"); and (d) the credit ratings of portfolio securities (which indicates the risk that securities will default). These were the most significant factors affecting the fund's performance relative to the LBMB. In addition, the fund's total return reflected actual cash flows, transaction costs and other expenses, which were not reflected in the total return of the LBMB.
DURATION 3
The fund's dollar-weighted average duration at the end of the reporting period was 6.25 years. Duration management is a significant component of the fund's investment strategy. The fund maintained duration short of the LBMB and the fund's peer group, as interest rates were expected to rise during the reporting period. In reality, interest rates declined over a significant portion of the reporting period and this hurt fund performance. The fund's use of forward settling municipal interest rate swaps and Treasury futures contacts, which did not perform well, to adjust portfolio duration contributed to the fund's performance being less than the LBMB.
1 Performance data quoted represents past performance which is no guarantee of future results. Investment return and principal value will fluctuate so that an investor's shares, when redeemed, may be worth more or less than their original cost. Mutual fund performance changes over time and current performance may be lower or higher that what is stated. For current to the most recent month end performance, visit www.federatedinvestors.com or call 1-800-341-7400.
2 The LBMB is the broad-based securities market index for the fund, as disclosed in the fund's prospectus. The LBMB is a broad market performance benchmark for the tax exempt bond market. To be included in the LBMB, bonds must have a minimum credit rating of Baa, have an outstanding par value of at least $3 million and be issued as part of a transaction of at least $50 million. The LBMB includes both zero coupon bonds and bonds subject to the alternative minimum tax. The Index is not adjusted to reflect sales charges, expenses, or other fees that the Securities and Exchange Commission (SEC) requires to be reflected in the fund's performance. Indexes are unmanaged, and unlike the fund, are unaffected by cash flows. It is not possible to invest directly in an index.
3 Duration is a measure of a security's price sensitivity to changes in interest rates. Securities with longer durations are more sensitive to changes in interest rates than securities with shorter durations.
COUPON AND MATURITY
During the reporting period, the fund concentrated its portfolio purchases and holdings on premium coupon municipal bonds (municipal bonds with coupons or interest payments that are higher than current yields available in the market). The higher coupons on the fund's premium coupon municipal bond holdings made the fund less sensitive to interest rate changes, and helped the fund's performance as interest rates declined over a significant portion of the reporting period. The higher coupon (or interest) payments helped the fund's performance versus the LBMB and the fund's peer group.
The fund concentrated on purchasing bonds with maturities of 10 to 20 years during the reporting period. These maturities provided the most attractive opportunities for yield. In addition, the relative dearth of municipal debt issued during the reporting period caused municipal bonds to increase in value and helped to improve the fund's performance versus most taxable bond alternatives. 4
SECTOR
During the reporting period, as compared to the LBMB, the fund allocated more of its portfolio to securities issued by hospitals, industrial development projects and higher education institutions. The fund also allocated less of the portfolio to general obligation bonds issued by cities, states, and school districts. These allocations helped the fund's performance due to the higher yields available in the over-weighted sectors and the smaller increase in the price of general obligation bonds as compared to other sectors.
CREDIT QUALITY
Credit spreads, or the yield difference between the "AAA" municipal bonds, and bonds of lower credit quality and similar maturity, decreased during the reporting period. This decrease in credit spreads was the result of both improving economic activity and the demand for securities with higher yields. The fund's overweight, relative to the LBMB, in "BBB" rated (or comparable quality) debt benefited the fund's performance as credit spreads became tighter to a greater extent for "BBB" rated (or comparable quality) debt than for other investment grade rated ("AAA," "AA," "A" or comparable quality) debt (meaning that the yield on the "BBB" rated debt improved to a greater extent, or decreased to a lesser extent, than for other investment grade rated debt). 4
4 Lower-rated bonds typically offer higher yields to help compensate investors for the increased risk associated with them. Among these risks are lower creditworthiness, greater price volatility, more risk to principal and income than with higher-rated securities and increased possibilities of default.
GROWTH OF A $10,000 INVESTMENT - CLASS F SHARES
The graph below illustrates the hypothetical investment of $10,000 1 in the Federated Ohio Municipal Income Fund (Class F Shares) (the "Fund") from August 31, 1994 to August 31, 2004, compared to the Lehman Brothers Municipal Bond Index (LBMB) 2 and the Lipper Ohio Municipal Debt Funds Average (LOMDFA). 3
Average Annual Total Return 4 for the Period Ended 8/31/2004
|
|
|
1 Year
|
| 4.35%
|
5 Years
|
| 5.35%
|
10 Years
|
| 5.52%
|
Performance data quoted represents past performance, which is no guarantee of future results. Returns shown do not reflect the deduction of taxes that a shareholder would pay on Fund distributions or the redemption of Fund shares. For after-tax returns, visit www.federatedinvestors.com. Investment return and principal value will fluctuate so that an investor's shares, when redeemed, may be worth more or less than their original cost. Mutual funds are not obligations of or guaranteed by any bank and are not federally insured. Mutual fund performance changes over time and current performance may be lower or higher than what is stated.
1 Represents a hypothetical investment of $10,000 in the Fund after deducting the maximum sales charge of 1.00% ($10,000 investment minus $100 sales charge = $9,900). The Fund's performance assumes the reinvestment of all dividends and distributions. The LBMB and LOMDFA have been adjusted to reflect reinvestment of dividends on securities in the index and average. Indexes are unmanaged and, unlike the Fund, is not affected by cash flows. It is not possible to invest directly in an index or an average.
2 The LBMB is an unmanaged index comprising bonds with a minimum credit rating of at least Baa. They must have an outstanding par value of at least $3 million and be issued as part of a transaction of at least $50 million. The index includes both zero coupon bonds and bonds subject to the federal alternative minimum tax. It is not adjusted to reflect sales charges, expenses, or other fees that the Securities and Exchange Commission (SEC) requires to be reflected in the Fund's performance.
3 The LOMDFA represents the average of the total returns reported by all of the mutual funds designated by Lipper, Inc. as falling into the respective category. These total returns are reported net of expenses and other fees that the SEC requires to be reflected in a mutual fund's performance.
4 Total return quoted reflects all applicable sales charges and contingent deferred sales charges.
Portfolio of Investments Summary Tables
At August 31, 2004, the fund's credit quality ratings composition 1 was as follows:
S&P Long-Term Ratings as
Percentage of Total Investments 2
| | Moody's Long-Term Ratings as
Percentage of Total Investments 2
|
AAA
|
| 26.8%
| | Aaa
|
| 37.8%
|
AA
|
| 16.4%
| | Aa
|
| 8.6%
|
A
|
| 8.8%
| | A
|
| 11.7%
|
BBB
|
| 8.8%
| | Baa
|
| 8.1%
|
BB
|
| 2.8%
| | Ba
|
| 0.0%
|
N/R
|
| 36.4%
| | N/R
|
| 33.8%
|
TOTAL
|
| 100%
| | TOTAL
|
| 100%
|
1 These tables depict the long-term, credit-quality ratings assigned to the fund's portfolio holdings by Standard & Poor's and Moody's Investor Service, each of which is a Nationally Recognized Statistical Rating Organization (NRSRO). These credit-quality ratings are shown without regard to gradations within a given rating category. For example, securities rated "A-" have been included in the "A" rated category. Holdings that are rated only by a different NRSRO than the one identified have been included in the "Not rated by..." category. Rated securities that have been pre-refunded, but not rated again by the NRSRO, also have been included in the "Not rated by..." category. Rated securities include a security with an obligor and/or credit enhancer that has received a rating from an NRSRO with respect to a class of debt obligations that is comparable in priority and security with the security held by the fund. Credit-quality ratings are an assessment of the risk that a security will default in payment and do not address other risks presented by the security. Please see the description of credit-quality ratings in the fund's Statement of Additional Information.
Each table depicts the long-term, credit-quality ratings as assigned only by the NRSRO identified in the table. Of the portfolio's total investments,13.4% is not rated by either of these NRSROs.
2 Percentages are based on total investments, which may differ from total net assets.
Portfolio of Investments
August 31, 2004
Principal
Amount
|
|
|
| Credit
Rating
|
1
|
| Value
|
| | | LONG-TERM MUNICIPALS--97.8% | | | | | |
| | | Ohio--90.5% | | | | | |
| $ | 1,750,000 | | Akron, Bath & Copley, OH Joint Township, Hospital Facilities Revenue Bonds (Series 2004A), 5.25% (Summa Health System)/(Radian Asset Assurance INS)/(Original Issue Yield: 5.47%), 11/15/2031
| | NR/Aa3/AA | | $ | 1,795,623 |
| 1,000,000 | | Akron, OH, LT GO Bonds, 5.80% (Original Issue Yield: 5.95%), 11/1/2020
| | AA-/A1/AA- | | | 1,140,450 |
| 1,000,000 | | Bay Village, OH City School District, School Improvement UT GO Bonds, 5.125% (Original Issue Yield: 5.16%), 12/1/2021
| | NR/Aa2/NR | | | 1,065,590 |
| 2,000,000 | | Cleveland, OH Public Power System, Revenue Bonds, First Mortgage (Series A), 7.00% (U.S. Treasury PRF 11/15/2004 @ 102)/(Original Issue Yield: 7.15%), 11/15/2024
| | AAA/#Aaa/AAA | | | 2,063,320 |
| 1,000,000 | | Cleveland, OH Waterworks, Revenue Bonds (Series 2002K), 5.25% (FGIC INS), 1/1/2021
| | AAA/Aaa/AAA | | | 1,128,480 |
| 475,000 | | Cleveland-Cuyahoga County, OH Port Authority, Development Revenue Bonds (Series 2001B), 6.50% (Port of Cleveland Bond Fund), 11/15/2021
| | NR/BB+ | | | 492,713 |
| 500,000 | | Cleveland-Cuyahoga County, OH Port Authority, Development Revenue Bonds (Series 2002C), 5.95% (Port of Cleveland Bond Fund), 5/15/2022
| | NR/BBB+ | | | 503,830 |
| 1,000,000 | | Cleveland-Cuyahoga County, OH Port Authority, Special Assessment Tax-Increment Revenue Bonds, 7.00% (University Heights, OH Public Parking Garage)/(Original Issue Yield: 7.20%), 12/1/2018
| | NR | | | 1,044,460 |
| 1,000,000 | | Columbus, OH City School District, School Facilities Construction & Improvement UT GO Bonds, 5.25% (FSA INS), 12/1/2024
| | AAA/Aaa/AAA | | | 1,072,440 |
| 1,610,000 | | Columbus, OH City School District, School Facilities Construction & Improvement UT GO Bonds, 5.00% (FGIC INS), 12/1/2024
| | AAA/Aaa/AAA | | | 1,671,711 |
| 500,000 | | Cuyahoga County, OH Health Care Facilities, Revenue Refunding Bonds, 5.50% (Benjamin Rose Institute)/(Original Issue Yield: 5.75%), 12/1/2028
| | NR/BBB- | | | 440,765 |
| 1,000,000 | | Delaware County, OH, Capital Facilities LT GO Bonds, 6.25%, 12/1/2020
| | AA+/Aa1/NR | | | 1,192,900 |
| 1,000,000 | | Erie County, OH, Hospital Facilities Revenue Bonds (Series 2002A), 5.50% (Firelands Regional Medical Center)/(Original Issue Yield: 5.66%), 8/15/2022
| | A/A2/NR | | | 1,030,550 |
Principal
Amount
|
|
|
| Credit
Rating
|
1
|
| Value
|
| | | LONG-TERM MUNICIPALS--continued | | | | | |
| | | Ohio--continued | | | | | |
| $ | 1,500,000 | | Fairfield, OH Hospital Facilities, Revenue Bonds, 5.00% (Radian Asset Assurance INS)/(Original Issue Yield: 5.05%), 6/15/2028
| | AA/NR/NR | | $ | 1,503,630 |
| 1,500,000 | | Franklin County, OH Health Care Facilities, Revenue Refunding Bonds, 5.50% (Ohio Presbyterian Retirement Services)/(Original Issue Yield: 5.69%), 7/1/2021
| | BBB/NR/NR | | | 1,459,770 |
| 750,000 | | Franklin County, OH, Revenue Refunding Bonds, 5.75% (Capitol South Community Urban Redevelopment Corp.), 6/1/2011
| | NR | | | 790,380 |
| 1,000,000 | | Greene County, OH, University Housing Revenue Bonds (Series 2002A), 5.375% (Marauder Development LLC at Central State University)/(American Capital Access INS)/(Original Issue Yield: 5.55%), 9/1/2022
| | A/NR/NR | | | 1,024,730 |
| 1,000,000 | | Greene County, OH, University Housing Revenue Bonds (Series 2002A), 5.50% (Marauder Development LLC at Central State University)/(American Capital Access INS)/(Original Issue Yield: 5.65%), 9/1/2027
| | A/NR/NR | | | 1,017,250 |
| 1,530,000 | | Hamilton County, OH Hospital Facilities Authority, Revenue Bonds (Series 2004J), 5.25% (Cincinnati Children's Hospital Medical Center)/(FGIC INS), 5/15/2023
| | AAA/Aaa/NR | | | 1,625,518 |
| 700,000 | | Hamilton County, OH Hospital Facilities Authority, Revenue Refunding & Improvement Bonds, 7.00% (Deaconess Hospital)/(Original Issue Yield: 7.046%), 1/1/2012
| | A-/A3/NR | | | 709,821 |
| 2,400,000 | | Hamilton County, OH Sewer System, Improvement Revenue Bonds (Series 2000A), 5.75% (Metropolitan Sewer District of Greater Cincinnati)/(MBIA Insurance Corp. INS (Original Issue Yield: 5.78%), 12/1/2025
| | AAA/Aaa/AAA | | | 2,669,904 |
| 2,000,000 | | Hamilton County, OH, Subordinated Sales Tax Revenue Bonds (Series B), 5.25% (AMBAC INS)/(Original Issue Yield: 5.62%), 12/1/2032
| | NR/Aaa/AAA | | | 2,092,880 |
| 2,000,000 | | Hamilton, OH City School District, School Improvement UT GO Bonds (Series 1999A), 5.50% (Original Issue Yield: 5.75%), 12/1/2024
| | AA-/NR/NR | | | 2,170,960 |
| 1,000,000 | | Heath, OH City School District, School Improvement UT GO Bonds (Series A), 5.50% (FGIC INS)/(Original Issue Yield: 5.635%), 12/1/2027
| | NR/Aaa/AAA | | | 1,073,640 |
| 1,010,000 | | Kent State University, OH, General Receipts Revenue Bonds, 6.00% (AMBAC INS)/(Original Issue Yield: 6.09%), 5/1/2024
| | AAA/Aaa/AAA | | | 1,155,804 |
| 1,500,000 | | Lake, OH Local School District, UT GO Bonds, 5.75% (FGIC INS)/(Original Issue Yield: 5.90%), 12/1/2021
| | AAA/Aaa/AAA | | | 1,699,590 |
| 2,000,000 | | Licking Heights, OH Local School District, School Facilities Construction & Improvement UT GO Bonds (Series 2000A), 5.50% (FGIC INS)/(Original Issue Yield: 5.58%), 12/1/2024
| | NR/Aaa/AAA | | | 2,171,340 |
Principal
Amount
|
|
|
| Credit
Rating
|
1
|
| Value
|
| | | LONG-TERM MUNICIPALS--continued | | | | | |
| | | Ohio--continued | | | | | |
| $ | 1,500,000 | | Lorain County, OH, Health Care Facilities Revenue Refunding Bonds (Series 1998A), 5.25% (Kendal at Oberlin)/(Original Issue Yield: 5.53%), 2/1/2021
| | BBB/NR/NR | | $ | 1,471,470 |
| 1,000,000 | | Lorain County, OH, Hospital Revenue Refunding & Improvement Bonds, 5.25% (Catholic Healthcare Partners)/(Original Issue Yield: 5.52%), 10/1/2033
| | AA-/A1/AA- | | | 1,009,660 |
| 1,000,000 | | Lorain, OH City School District, UT GO Classroom Facilities Improvement Bonds (Series 2002), 5.25% (MBIA Insurance Corp. INS), 12/1/2020
| | AAA/Aaa/AAA | | | 1,090,930 |
| 1,500,000 | | Lucas County, OH, Health Care Facilities Refunding & Improvement Revenue Bonds (Series 2000A), 6.625% (Sunset Retirement Community, Inc.)/(Original Issue Yield: 6.75%), 8/15/2030
| | NR/BBB+ | | | 1,562,040 |
| 1,000,000 | | Mahoning County, OH Hospital Facilities, Hospital Facilities Revenue Bonds (Series A), 6.00% (Forum Health Obligated Group)/(Original Issue Yield: 6.15%), 11/15/2032
| | A-/A3/NR | | | 1,052,240 |
| 1,000,000 | | Marion County, OH Health Care Facilities, Refunding & Improvement Revenue Bonds, 6.30% (United Church Homes, Inc.)/(Original Issue Yield: 6.45%), 11/15/2015
| | BBB-/NR/BBB- | | | 1,010,510 |
| 1,000,000 | | Marion County, OH Hospital Authority, Hospital Refunding & Improvement Revenue Bonds (Series 1996), 6.375% (Community Hospital of Springfield)/(Original Issue Yield: 6.52%), 5/15/2011
| | BBB+/NR/NR | | | 1,052,820 |
| 1,000,000 | | Medina County, OH Library District, UT GO Bonds, 5.25% (FGIC INS), 12/1/2023
| | AAA/Aaa/AAA | | | 1,071,410 |
| 1,000,000 | | Miami County, OH, Hospital Facilities Revenue Refunding & Improvement Bonds (Series 1996A), 6.375% (Upper Valley Medical Center, OH)/(Original Issue Yield: 6.62%), 5/15/2026
| | BBB+/Baa1/NR | | | 1,027,890 |
| 1,000,000 | | Moraine, OH Solid Waste Disposal Authority, Revenue Bonds, 6.75% (General Motors Corp.)/(Original Issue Yield: 6.80%), 7/1/2014
| | BBB/Baa1/NR | | | 1,139,550 |
| 1,950,000 | | Ohio HFA, Residential Mortgage Revenue Bonds (Series 2002 A-1), 5.30% (GNMA COL Home Mortgage Program GTD), 9/1/2022
| | NR/Aaa/NR | | | 2,028,429 |
| 560,000 | | Ohio HFA, Residential Mortgage Revenue Bonds (Series B-2), 6.70% (GNMA COL), 3/1/2025
| | AAA/Aaa/NR | | | 571,844 |
| 2,500,000 | | Ohio State Air Quality Development Authority, PCR Refunding Bonds (Series 2002A), 6.00% (Cleveland Electric Illuminating Co.), 12/1/2013
| | BB+/Baa3/BBB- | | | 2,579,650 |
| 3,000,000 | | Ohio State Air Quality Development Authority, Revenue Refunding Bonds, 6.375% (JMG Funding LP)/(AMBAC INS)/(Original Issue Yield: 6.493%), 1/1/2029
| | AAA/Aaa/AAA | | | 3,070,680 |
| 1,000,000 | | Ohio State Higher Educational Facilities Commission, Higher Educational Facility Revenue Bonds, 5.125% (Oberlin College), 10/1/2024
| | AA/NR/NR | | | 1,043,640 |
Principal
Amount
|
|
|
| Credit
Rating
|
1
|
| Value
|
| | | LONG-TERM MUNICIPALS--continued | | | | | |
| | | Ohio--continued | | | | | |
| $ | 1,000,000 | | Ohio State Higher Educational Facilities Commission, Revenue Bonds (Series 2002B), 5.50% (Case Western Reserve University, OH), 10/1/2022
| | AA-/A1/NR | | $ | 1,102,040 |
| 500,000 | | Ohio State Higher Educational Facilities Commission, Revenue Bonds, 5.50% (Baldwin-Wallace College), 12/1/2021
| | A-/NR/NR | | | 529,555 |
| 1,070,000 | | Ohio State Higher Educational Facilities Commission, Revenue Bonds, 5.50% (Baldwin-Wallace College)/(Original Issue Yield: 5.53%), 12/1/2023
| | A-/NR/NR | | | 1,122,162 |
| 610,000 | | Ohio State Higher Educational Facilities Commission, Revenue Bonds, 5.50% (Baldwin-Wallace College)/(Original Issue Yield: 5.61%), 12/1/2024
| | A-/NR/NR | | | 637,328 |
| 2,000,000 | | Ohio State Higher Educational Facilities Commission, Revenue Bonds, 5.85% (John Carroll University, OH)/(Original Issue Yield: 6.05%), 4/1/2020
| | NR/A2/NR | | | 2,171,200 |
| 2,000,000 | | Ohio State University, General Receipts Revenue Bonds (Series 2003B), 5.25%, 6/1/2023
| | AA/Aa2/AA | | | 2,130,440 |
| 2,000,000 | | Ohio State Water Development Authority, PCR Bonds, 5.10%, 12/1/2022
| | AAA/Aaa/NR | | | 2,099,000 |
| 910,000 | | Ohio State, Education Loan Revenue Bonds (Series 1997A-1), 5.85% (AMBAC INS), 12/1/2019
| | AAA/Aaa/NR | | | 956,847 |
| 1,000,000 | | Ohio Waste Development Authority Solid Waste, Revenue Bonds (Series 2002), 4.85% TOBs (Waste Management, Inc.), Mandatory Tender 11/1/2022
| | BBB/NR/NR | | | 1,043,720 |
| 1,620,000 | | Olentangy, OH Local School District, School Facilities Construction & Improvement UT GO Bonds (Series 2002A), 5.25%, 12/1/2021
| | AA/Aa2/NR | | | 1,745,064 |
| 1,255,000 | | Ottawa & Glandorf, OH Local School District, School Facilities Construction & Improvement UT GO Bonds, 5.25% (MBIA Insurance Corp. INS), 12/1/2020
| | NR/Aaa/AAA | | | 1,360,106 |
| 1,000,000 | | Parma, OH, Hospital Improvement and Refunding Revenue Bonds, 5.375% (Parma Community General Hospital Association)/(Original Issue Yield: 5.45%), 11/1/2029
| | A-/NR/A- | | | 1,007,740 |
| 500,000 | 2,3 | Port of Greater Cincinnati, OH Development Authority, Special Assessment Revenue Bonds, 6.30% (Cincinnati Mills), 2/15/2024
| | NR | | | 505,880 |
| 1,000,000 | | Portage County, OH Board of County Hospital Trustees, Hospital Revenue Bonds (Series 1999), 5.75% (Robinson Memorial Hospital)/(AMBAC INS)/(Original Issue Yield: 5.90%), 11/15/2019
| | AAA/Aaa/AAA | | | 1,128,320 |
| 1,500,000 | | Rickenbacker, OH Port Authority, Capital Funding Revenue Bonds (Series 2002A), 5.375% (OASBO Expanded Asset Pooled Financing Program)/(Original Issue Yield: 5.60%), 1/1/2032
| | NR/A2/NR | | | 1,554,705 |
Principal
Amount
|
|
|
| Credit
Rating
|
1
|
| Value
|
| | | LONG-TERM MUNICIPALS--continued | | | | | |
| | | Ohio--continued | | | | | |
| $ | 1,000,000 | | Steubenville, OH, Hospital Facilities Revenue Refunding & Improvement Bonds, 6.375% (Trinity Health System Obligated Group)/(Original Issue Yield: 6.55%), 10/1/2020
| | NR/A3/NR | | $ | 1,078,370 |
| 500,000 | | Toledo-Lucas County, OH Port Authority, Revenue Bonds (Series 2004C), 6.375% (Northwest Ohio Bond Fund), 11/15/2032
| | NR/BBB+ | | | 505,580 |
| 1,500,000 | | Toledo-Lucas County, OH Port Authority, Revenue Bonds, 6.45% (CSX Corp.), 12/15/2021
| | NR/Baa2/NR | | | 1,680,285 |
| 1,375,000 | | Toledo-Lucas County, OH Port Authority, Special Assessment Revenue Bonds, 5.25% (Crocker Park Public Improvement Project)/(Original Issue Yield: 5.37%), 12/1/2023
| | NR/A- | | | 1,402,417 |
| 2,000,000 | | Tuscarawas County, OH, Hospital Facilities Revenue Bonds, 5.75% (Union Hospital)/(Radian Asset Assurance INS), 10/1/2026
| | AA/NR/AA | | | 2,148,340 |
| 1,000,000 | | Warrensville Heights, OH School District, UT GO Bonds, 5.75% (FGIC INS)/(Original Issue Yield: 5.83%), 12/1/2024
| | AAA/Aaa/AAA | | | 1,114,940 |
| 1,995,000 | | Waynesville, OH Health Care Facilities, Revenue Bonds (Series 2001A), 5.70% (Quaker Heights Project)/(GNMA COL Home Mortgage Program GTD), 2/20/2043
|
| NR/Aaa/NR
|
|
| 2,082,062
|
| | | TOTAL
|
|
|
|
| 85,696,913
|
| | | Puerto Rico--6.7% | | | | | |
| 2,000,000 | 2,3 | Puerto Rico Electric Power Authority, Drivers (Series 266), 9.415% (FSA INS), 7/1/2015
| | AAA/NR/NR | | | 2,678,560 |
| 1,000,000 | 2,3 | Puerto Rico Highway and Transportation Authority, RITES (Series PA 331A), 9.152% (AMBAC INS), 1/1/2010
| | NR | | | 1,320,540 |
| 1,000,000 | 2,3 | Puerto Rico Highway and Transportation Authority, RITES (Series PA 331B), 9.152% (AMBAC INS), 1/1/2011
| | NR | | | 1,330,270 |
| 990,000 | | Puerto Rico Industrial, Tourist, Educational, Medical & Environmental Control Facilities Financing Authority, Cogeneration Facility Revenue Bonds (Series 2000A), 6.625% (AES Puerto Rico Project)/(Original Issue Yield: 6.65%), 6/1/2026
|
| NR/Baa3/BBB
|
|
| 1,060,498
|
| | | TOTAL
|
|
|
|
| 6,389,868
|
| | | Virgin Islands--0.6% | | | | | |
| 515,000 | | Virgin Islands HFA, SFM Revenue Refunding Bonds (Series A), 6.50% (GNMA COL)/(Original Issue Yield: 6.522%), 3/1/2025
|
| AAA/NR/NR
|
|
| 527,422
|
| | | TOTAL LONG-TERM MUNICIPALS (IDENTIFIED COST $86,914,314)
|
|
|
|
| 92,614,203
|
Principal
Amount
|
|
|
| Credit
Rating
|
1
|
| Value
|
| | | SHORT-TERM MUNICIPALS--0.1% | | | | | |
| | | Puerto Rico--0.1% | | | | | |
| $ | 100,000 | | Puerto Rico Government Development Bank (GDB) Weekly VRDNs (MBIA Insurance Corp. INS)/(Credit Suisse First Boston LIQ) (at amortized cost)
|
| A-1/VMIG1
|
| $
| 100,000
|
| | | TOTAL INVESTMENTS--97.9% (IDENTIFIED COST $87,014,314) 4
|
|
|
|
| 92,714,203
|
| | | OTHER ASSETS AND LIABILITIES - NET--2.1%
|
|
|
|
| 2,030,190
|
| | | TOTAL NET ASSETS--100%
|
|
|
| $
| 94,744,393
|
Securities that are subject to the federal alternative minimum tax (AMT) represent 12.3% of the fund's portfolio as calculated based upon total portfolio market value (percentage is unaudited).
1 Please refer to the Statement of Additional Information for an explanation of the credit ratings. Current credit ratings are unaudited.
2 Denotes a restricted security, including securities purchased under Rule 144A of the Securities Act of 1933. These securities, unless registered under the Act or exempted from registration, may only be sold to qualified institutional investors. At August 31, 2004, these securities amounted to $5,835,250 which represents 6.2% of total net assets.
3 Denotes a restricted security, including securities purchased under Rule 144A that have been deemed liquid based upon criteria approved by the Fund's Board of Trustees. At August 31, 2004, these securities amounted to $5,835,250 which represents 6.2% of total net assets.
4 The cost of investments for federal tax purposes amounts to $87,014,216.
Note: The categories of investments are shown as a percentage of total net assets at August 31, 2004.
The following acronyms are used throughout this portfolio:
| AMBAC | - --American Municipal Bond Assurance Corporation |
| COL | - --Collateralized |
| FGIC | - --Financial Guaranty Insurance Company |
| FSA | - --Financial Security Assurance |
| GNMA | - --Government National Mortgage Association |
| GO | - --General Obligation |
| GTD | - --Guaranteed |
| HFA | - --Housing Finance Authority |
| INS | - --Insured |
| LIQ | - --Liquidity Agreement |
| LT | - --Limited Tax |
| PCR | - --Pollution Control Revenue |
| PRF | - --Prerefunded |
| RITES | - --Residual Interest Tax-Exempt Securities |
| SFM | - --Single Family Mortgage |
| TOBs | - --Tender Option Bonds |
| UT | - --Unlimited Tax |
| VRDNs | - --Variable Rate Demand Notes |
See Notes which are an integral part of the Financial Statements
Statement of Assets and Liabilities
August 31, 2004
Assets:
| | | | | | | |
Total investments in securities, at value (identified cost $87,014,314)
| | | | | $ | 92,714,203 | |
Cash
| | | | | | 71,133 | |
Income receivable
| | | | | | 1,317,508 | |
Receivable for investments sold
| | | | | | 840,000 | |
Receivable for shares sold
|
|
|
|
|
| 217,990
|
|
TOTAL ASSETS
|
|
|
|
|
| 95,160,834
|
|
Liabilities:
| | | | | | | |
Payable for shares redeemed
| | $ | 116,201 | | | | |
Income distribution payable
| | | 169,390 | | | | |
Payable for daily variation margin
| | | 83,115 | | | | |
Payable for distribution services fee (Note 5)
| | | 11,975 | | | | |
Payable for shareholder services fee (Note 5)
| | | 19,960 | | | | |
Accrued expenses
|
|
| 15,800
|
|
|
|
|
TOTAL LIABILITIES
|
|
|
|
|
| 416,441
|
|
Net assets for 8,234,595 shares outstanding
|
|
|
|
| $
| 94,744,393
|
|
Net Assets Consist of:
| | | | | | | |
Paid-in capital
| | | | | $ | 91,292,549 | |
Net unrealized appreciation of investments
| | | | | | 5,699,889 | |
Accumulated net realized loss on investments, futures contracts and swap contracts
| | | | | | (2,247,004 | ) |
Distributions in excess of net investment income
|
|
|
|
|
| (1,041
| )
|
TOTAL NET ASSETS
|
|
|
|
| $
| 94,744,393
|
|
Net Asset Value, Offering Price and Redemption Proceeds Per Share:
| | | | | | | |
Net asset value per share ($94,744,393 ÷ 8,234,595 shares outstanding) no par value, unlimited shares authorized
|
|
|
|
|
| $11.51
|
|
Offering price per share (100/99.00 of $11.51) 1
|
|
|
|
|
| $11.63
|
|
Redemption proceeds per share (99.00/100 of $11.51) 1
|
|
|
|
|
| $11.39
|
|
1 See "What Do Shares Cost?" in the Prospectus.
See Notes which are an integral part of the Financial Statements
Statement of Operations
Year Ended August 31, 2004
Investment Income:
| | | | | | | | | | | | |
Interest
|
|
|
|
|
|
|
|
|
| $
| 5,166,518
|
|
Expenses:
| | | | | | | | | | | | |
Investment adviser fee (Note 5)
| | | | | | $ | 386,613 | | | | | |
Administrative personnel and services fee (Note 5)
| | | | | | | 145,835 | | | | | |
Custodian fees
| | | | | | | 5,182 | | | | | |
Transfer and dividend disbursing agent fees and expenses (Note 5)
| | | | | | | 49,677 | | | | | |
Directors'/Trustees' fees
| | | | | | | 2,438 | | | | | |
Auditing fees
| | | | | | | 15,076 | | | | | |
Legal fees
| | | | | | | 6,740 | | | | | |
Portfolio accounting fees (Note 5)
| | | | | | | 50,849 | | | | | |
Distribution services fee (Note 5)
| | | | | | | 386,613 | | | | | |
Shareholder services fee (Note 5)
| | | | | | | 241,633 | | | | | |
Share registration costs
| | | | | | | 19,974 | | | | | |
Printing and postage
| | | | | | | 21,862 | | | | | |
Insurance premiums
| | | | | | | 7,820 | | | | | |
Miscellaneous
|
|
|
|
|
|
| 1,637
|
|
|
|
|
|
TOTAL EXPENSES
|
|
|
|
|
|
| 1,341,949
|
|
|
|
|
|
Waivers (Note 5):
| | | | | | | | | | | | |
Waiver of investment adviser fee
| | $ | (199,217 | ) | | | | | | | | |
Waiver of administrative personnel and services fee
| | | (20,030 | ) | | | | | | | | |
Waiver of transfer and dividend disbursing agent fees and expenses
| | | (6,455 | ) | | | | | | | | |
Waiver of distribution services fee
|
|
| (241,633
| )
|
|
|
|
|
|
|
|
|
TOTAL WAIVERS
|
|
|
|
|
|
| (467,335
| )
|
|
|
|
|
Net expenses
|
|
|
|
|
|
|
|
|
|
| 874,614
|
|
Net investment income
|
|
|
|
|
|
|
|
|
|
| 4,291,904
|
|
Realized and Unrealized Gain (Loss) on Investments, Futures Contracts and Swap Contracts:
| | | | | | | | | | | | |
Net realized gain on investments
| | | | | | | | | | | 103,481 | |
Net realized loss on swap contracts
| | | | | | | | | | | (374,000 | ) |
Net realized loss on futures contracts
| | | | | | | | | | | (558,066 | ) |
Net change in unrealized appreciation of investments
| | | | | | | | | | | 2,599,045 | |
Net change in unrealized appreciation of swap contracts
|
|
|
|
|
|
|
|
|
|
| (179,789
| )
|
Net realized and unrealized gain on investments, futures contracts and swap contracts
|
|
|
|
|
|
|
|
|
|
| 1,590,671
|
|
Change in net assets resulting from operations
|
|
|
|
|
|
|
|
|
| $
| 5,882,575
|
|
See Notes which are an integral part of the Financial Statements
Statement of Changes in Net Assets
Year Ended August 31
|
|
| 2004
|
|
|
| 2003
|
|
Increase (Decrease) in Net Assets
| | | | | | | | |
Operations:
| | | | | | | | |
Net investment income
| | $ | 4,291,904 | | | $ | 4,319,720 | |
Net realized loss on investments, futures contracts, and swap contracts
| | | (828,585 | ) | | | (43,544 | ) |
Net change in unrealized appreciation/depreciation on investments, futures contracts and swap contracts
|
|
| 2,419,256
|
|
|
| (1,388,265
| )
|
CHANGE IN NET ASSETS RESULTING FROM OPERATIONS
|
|
| 5,882,575
|
|
|
| 2,887,911
|
|
Distributions to Shareholders:
| | | | | | | | |
Distributions from net investment income
|
|
| (4,263,196
| )
|
|
| (4,339,690
| )
|
Share Transactions:
| | | | | | | | |
Proceeds from sale of shares
| | | 12,734,977 | | | | 19,993,521 | |
Net asset value of shares issued to shareholders in payment of distributions declared
| | | 2,111,168 | | | | 1,958,548 | |
Cost of shares redeemed
|
|
| (18,095,309
| )
|
|
| (13,898,339
| )
|
CHANGE IN NET ASSETS RESULTING FROM SHARE TRANSACTIONS
|
|
| (3,249,164
| )
|
|
| 8,053,730
|
|
Change in net assets
|
|
| (1,629,785
| )
|
|
| 6,601,951
|
|
Net Assets:
| | | | | | | | |
Beginning of period
|
|
| 96,374,178
|
|
|
| 89,772,227
|
|
End of period (including distributions in excess of net investment income of $(1,041) and $(26,988), respectively)
|
| $
| 94,744,393
|
|
| $
| 96,374,178
|
|
See Notes which are an integral part of the Financial Statements
Notes to Financial Statements
August 31, 2004
1. ORGANIZATION
Federated Municipal Securities Income Trust (the "Trust") is registered under the Investment Company Act of 1940, as amended (the "Act"), as an open-end, management investment company. The Trust consists of seven portfolios. The financial statements included herein are only those of the Federated Ohio Municipal Income Fund (the "Fund"), a non-diversified portfolio. The financial statements of the other portfolios are presented separately. The assets of each portfolio are segregated and a shareholder's interest is limited to the portfolio in which shares are held. The investment objective of the Fund is to provide current income exempt from federal regular income tax (federal regular income tax does not include the federal AMT) and the personal income taxes imposed by the State of Ohio and Ohio municipalities. The Fund offers one class of Shares: Class F Shares.
2. SIGNIFICANT ACCOUNTING POLICIES
The following is a summary of significant accounting policies consistently followed by the Fund in the preparation of its financial statements. These policies are in conformity with generally accepted accounting principles (GAAP) in the United States of America.
Investment Valuation
Municipal bonds are valued by an independent pricing service, taking into consideration yield, liquidity, risk, credit quality, coupon, maturity, type of issue, and any other factors or market data the pricing service deems relevant. Short-term securities are valued at the prices provided by an independent pricing service. However, short-term securities with remaining maturities of 60 days or less at the time of purchase may be valued at amortized cost, which approximates fair market value. Securities for which no quotations are readily available are valued at fair value as determined in accordance with procedures established by and under general supervision of the Board of Trustees (the "Trustees").
Investment Income, Expenses and Distributions
Interest income and expenses are accrued daily. Distributions to shareholders are recorded on the ex-dividend date. Non-cash dividends included in dividend income, if any, are recorded at fair value.
Premium and Discount Amortization
All premiums and discounts on fixed-income securities are amortized/accreted for financial statement purposes.
Federal Taxes
It is the Fund's policy to comply with the Subchapter M provision of the Internal Revenue Code (the "Code") and to distribute to shareholders each year substantially all of its income. Accordingly, no provision for federal income tax is necessary.
When-Issued and Delayed Delivery Transactions
The Fund may engage in when-issued or delayed delivery transactions. The Fund records when-issued securities on the trade date and maintains security positions such that sufficient liquid assets will be available to make payment for the securities purchased. Securities purchased on a when-issued or delayed delivery basis are marked to market daily and begin earning interest on the settlement date. Losses may occur on these transactions due to changes in market conditions or the failure of counterparties to perform under the contract.
Restricted Securities
Restricted securities are securities that may only be resold upon registration under federal securities laws or in transactions exempt from such registration. In some cases, the issuer of restricted securities has agreed to register such securities for resale, at the issuer's expense either upon demand by the Fund or in connection with another registered offering of the securities. Many restricted securities may be resold in the secondary market in transactions exempt from registration. Such restricted securities may be determined to be liquid under criteria established by the Trustees. The Fund will not incur any registration costs upon such resales. The Fund's restricted securities are valued at the price provided by dealers in the secondary market or, if no market prices are available, at the fair value as determined in accordance with procedures established by and under general supervision of the Trustees.
Additional information on restricted securities, including securities purchased under Rule 144A that have not been deemed liquid by the Trustees, for each security held at August 31, 2004, is as follows:
Security
|
| Acquisition Date
|
| Acquisition Cost
|
Port of Greater Cincinnati, OH Development Authority, Special Assessment Revenue Bonds, 6.30% (Cincinnati Mills), 2/15/2024
|
| 2/11/2004
|
| $ 500,000
|
Puerto Rico Electric Power Authority, Drivers (Series 266), 9.415% (FSA INS), 7/1/2015
|
| 6/27/2002
|
| $2,474,120
|
Puerto Rico Highway and Transportation Authority, RITES (Series PA 331A), 9.152% (AMBAC INS), 1/1/2010
|
| 3/3/1998
|
| $1,163,520
|
Puerto Rico Highway and Transportation Authority, RITES (Series PA 331B), 9.152% (AMBAC INS), 1/1/2011
|
| 3/3/1998
|
| $1,158,780
|
Swap Contracts
The Fund may enter into swap contracts. A swap is an exchange of cash payments between the Fund and another party, which is based on a specific financial index. The value of the swap is adjusted daily and the change in value is recorded as unrealized appreciation or depreciation. When a swap contract is closed, the Fund recognizes a realized gain or loss. The swap contracts entered into by the Fund are on a forward settling basis. For the year ended August 31, 2004, the Fund had realized losses on swap contracts of $374,000.
Risks may arise upon entering into these agreements from the potential inability of the counterparties to meet the terms of their contract and from unanticipated changes in the value of the financial index on which the swap agreement is based. The Fund uses swaps for hedging purposes to reduce its exposure to interest rate fluctuations.
At August 31, 2004, the Fund had no open swap contracts.
Futures Contracts
The Fund periodically may sell bond interest rate futures contracts to manage duration and to potentially reduce transaction costs. Upon entering into a bond interest rate futures contract with a broker, the Fund is required to deposit in a segregated account a specified amount of cash or U.S. government securities. Futures contracts are valued daily and unrealized gains or losses are recorded in a "variation margin" account. Daily, the Fund receives from or pays to the broker a specified amount of cash based upon changes in the variation margin account. When a contract is closed, the Fund recognizes a realized gain or loss. For the year end August 31, 2004, the Fund had realized losses of $558,066 on futures contracts.
Futures contracts have market risks, including the risk that the change in the value of the contract may not correlate with changes in the value of the underlying securities.
At August 31, 2004, the Fund had no open futures contracts.
Use of Estimates
The preparation of financial statements in conformity with GAAP requires management to make estimates and assumptions that affect the amounts of assets, liabilities, expenses and revenues reported in the financial statements. Actual results could differ from those estimated.
Other
Investment transactions are accounted for on a trade date basis. Realized gains and losses from investment transactions are recorded on an identified cost basis.
3. SHARES OF BENEFICIAL INTEREST
The following table summarizes share activity:
Year Ended August 31
|
| 2004
|
|
| 2003
|
|
Shares sold
| | 1,102,382 | | | 1,736,443 | |
Shares issued to shareholders in payment of distributions declared
| | 183,888 | | | 170,484 | |
Shares redeemed
|
| (1,573,949
| )
|
| (1,210,128
| )
|
NET CHANGE RESULTING FROM SHARE TRANSACTIONS
|
| (287,679
| )
|
| 696,799
|
|
4. FEDERAL TAX INFORMATION
The timing and character of income and capital gain distributions are determined in accordance with income tax regulations, which may differ from GAAP. These differences are due to differing treatments for discount accretion/premium amortization on debt securities. For the year ended August 31, 2004, permanent differences identified and reclassified among the components of net assets were as follows:
Increase (Decrease)
|
Undistributed
Net Investment
Income (Loss)
|
|
|
| Accumulated
Net Realized
Gains (Losses)
|
$(2,761)
|
|
|
| $2,761
|
Net investment income, net realized gains (losses) and net assets were not affected by this reclassification.
The tax character of distributions as reported on the Statement of Changes in Net Assets for the years ended August 31, 2004 and 2003 was as follows:
|
| 2004
|
| 2003
|
Tax-exempt income
|
| $4,263,196
|
| $4,339,690
|
As of August 31, 2004, the components of distributable earnings on a tax basis were as follows:
Undistributed tax-exempt income
|
| $
| 343,733
|
Unrealized appreciation
|
| $
| 5,699,987
|
Capital loss carryforward
|
| $
| 1,627,306
|
At August 31, 2004, the cost of investments for federal tax purposes was $87,014,216. The net unrealized appreciation of investments for federal tax purposes was $5,699,987. This consists of net unrealized appreciation from investments for those securities having an excess of value over cost of $5,753,065 and net unrealized depreciation from investments for those securities having an excess of cost over value of $53,078.
The difference between book-basis and tax-basis unrealized appreciation/depreciation is attributable to differing treatments for discount accretion/premium amortization of debt securities.
At August 31, 2004, the Fund had a capital loss carryforward of $1,627,306 which will reduce the Fund's taxable income arising from future net realized gains on investments, if any, to the extent permitted by the Code, and thus will reduce the amount of distributions to shareholders which would otherwise be necessary to relieve the Fund of any liability for federal tax. Pursuant to the Code, such capital loss carryforward will expire as follows:
Expiration Year
|
| Expiration Amount
|
2008
|
| $695,145
|
2009
|
| $598,494
|
2010
|
| $ 69,375
|
2011
|
| $ 87,412
|
2012
|
| $176,880
|
Under current tax regulations, capital losses realized after October 31 may be deferred and treated as occurring on the first day of the following fiscal year. As of August 31, 2004, for federal income tax purposes, post October losses of $619,797 were deferred to September 1, 2004.
5. INVESTMENT ADVISER FEE AND OTHER TRANSACTIONS WITH AFFILIATES
Investment Adviser Fee
Federated Investment Management Company, the Fund's investment adviser (the "Adviser"), receives for its services an annual investment adviser fee equal to 0.40% of the Fund's average daily net assets. The Adviser may voluntarily choose to waive any portion of its fee. The Adviser can modify or terminate this voluntary waiver at any time at its sole discretion.
Administrative Fee
Federated Administrative Services (FAS), under the Administrative Services Agreement, provides the Fund with administrative personnel and services. The fee paid to FAS is based on the average aggregate daily net assets of all Federated funds as specified below:
Maximum
Administrative Fee
|
| Average Aggregate Daily Net Assets
of the Federated Funds
|
0.150%
|
| on the first $5 billion
|
0.125%
|
| on the next $5 billion
|
0.100%
|
| on the next $10 billion
|
0.075%
|
| on assets in excess of $20 billion
|
The administrative fee received during any fiscal year shall be at least $150,000 per portfolio and $40,000 per each additional class of Shares. FAS may voluntarily choose to waive any portion of its fee. FAS can modify or terminate this voluntary waiver at any time at its sole discretion.
Prior to November 1, 2003, Federated Services Company (FServ) provided the Fund with administrative personnel and services. The fee paid to FServ was based on the average aggregate daily net assets of all Federated funds as specified below:
Maximum
Administrative Fee
|
| Average Aggregate Daily Net Assets
of the Federated Funds
|
0.150%
|
| on the first $250 million
|
0.125%
|
| on the next $250 million
|
0.100%
|
| on the next $250 million
|
0.075%
|
| on assets in excess of $750 million
|
The administrative fee received during any fiscal year was at least $125,000 per portfolio and $30,000 per each additional class of Shares.
For the year ended August 31, 2004 the fees paid to FAS and FServ were $104,972 and $20,833, respectively, after voluntary waiver, if applicable.
Distribution Services Fee
The Fund has adopted a Distribution Plan (the "Plan") pursuant to Rule 12b-1 under the Act. Under the terms of the Plan, the Fund will compensate Federated Securities Corp. (FSC), the principal distributor, from the net assets of the Fund's shares to finance activities intended to result in the sale of these shares. The Plan provides that the Fund may incur distribution expenses of up to 0.40% of average daily net assets annually, to compensate FSC. FSC may voluntarily choose to waive any portion of its fee. FSC can modify or terminate this voluntary waiver at any time at its sole discretion.
Sales Charge
For the fiscal year ended August 31, 2004, FSC retained $8,788 of contingent deferred sales charges relating to redemptions of Class F Shares. See "What Do Shares Cost?" in the Prospectus.
Shareholder Services Fee
Under the terms of a Shareholder Services Agreement with Federated Shareholder Services Company (FSSC), the Fund will pay FSSC up to 0.25% of the average daily net assets of the Fund for the period. The fee paid to FSSC is used to finance certain services for shareholders and to maintain shareholder accounts. FSSC may voluntarily choose to waive any portion of its fee. FSSC can modify or terminate this voluntary waiver at any time at its sole discretion.
Transfer and Dividend Disbursing Agent Fees and Expenses
Prior to July 1, 2004, FServ, through its subsidiary FSSC, served as transfer and dividend disbursing agent for the Fund. The fee paid to FSSC was based on the size, type and number of accounts and transactions made by shareholders. The fee paid to FSSC during the reporting period was $36,501, after voluntary waiver, if applicable.
Portfolio Accounting Fees
Prior to January 1, 2004, FServ maintained the Fund's accounting records for which it received a fee. The fee was based on the level of the Fund's average daily net assets for the period, plus out-of-pocket expenses. The fee paid to FServ during the reporting period was $17,346, after voluntary waiver, if applicable.
Interfund Transactions
During the year ended August 31, 2004, the Fund engaged in purchase and sale transactions with funds that have a common investment adviser (or affiliated investment advisers), common Directors/Trustees, and /or common Officers. These purchase and sale transactions complied with Rule 17a-7 under the Act and amounted to $26,165,000 and $26,550,000, respectively.
General
Certain of the Officers and Trustees of the Trust are Officers and Directors or Trustees of the above companies.
6. INVESTMENT TRANSACTIONS
Purchases and sales of investments, excluding long-term U.S. government securities and short-term obligations (and in-kind contributions), for the year ended August 31, 2004, were as follows:
Purchases
|
| $
| 17,377,241
|
Sales
|
| $
| 24,100,974
|
7. CONCENTRATION OF CREDIT RISK
Since the Fund invests a substantial portion of its assets in issuers located in one state, it will be more susceptible to factors adversely affecting issuers of that state than would be a comparable tax-exempt mutual fund that invests nationally. In order to reduce the credit risk associated with such factors, at August 31, 2004, 42.1% of the securities in the portfolio of investments are backed by letters of credit or bond insurance of various financial institutions and financial guaranty assurance agencies. The largest percentage of investments insured by or supported (backed) by a letter of credit from any one institution or agency was 12.5% of total investments.
8. LEGAL PROCEEDINGS
Beginning in October 2003, Federated Investors, Inc. and various subsidiaries thereof (including the advisers and distributor for various investment companies, collectively, "Federated"), along with various investment companies sponsored by Federated ("Funds") were named as defendants in several class action lawsuits now pending in the United States District Court for the District of Maryland seeking damages of unspecified amounts. The lawsuits were purportedly filed on behalf of people who purchased, owned and/or redeemed shares of Federated-sponsored mutual funds during specified periods beginning November 1, 1998. The suits are generally similar in alleging that Federated engaged in illegal and improper trading practices including market timing and late trading in concert with certain institutional traders, which allegedly caused financial injury to the mutual fund shareholders. Federated and various Funds have also been named as defendants in several additional lawsuits, now pending in the United States District Court for the Western District of Pennsylvania, alleging, among other things, excessive advisory and Rule 12b-1 fees, and seeking damages of unspecified amounts. The Board of the Funds has retained the law firm of Dickstein Shapiro Morin & Oshinsky LLP to represent the Funds in these lawsuits. Federated and the Funds, and their respective counsel, are reviewing the allegations and will respond appropriately. Additional lawsuits based upon similar allegations may be filed in the future. The potential impact of these recent lawsuits and future potential similar law suits is uncertain. Although we do not believe that these lawsuits will have a material adverse effect on the Funds, there can be no assurance that these suits, the ongoing adverse publicity and/or other developments resulting from related regulatory investigations will not result in increased Fund redemptions, reduced sales of Fund shares, or other adverse consequences for the Funds.
9. FEDERAL TAX INFORMATION (UNAUDITED)
At August 31, 2004, 100% of the distributions from net investment income is exempt from federal income tax, other than the federal AMT.
Report of Independent Registered Public Accounting Firm
TO THE BOARD OF TRUSTEES OF FEDERATED MUNICIPAL SECURITIES INCOME TRUST AND SHAREHOLDERS OF FEDERATED OHIO MUNICIPAL INCOME FUND:
We have audited the accompanying statement of assets and liabilities, including the portfolio of investments, of Federated Ohio Municipal Income Fund (the "Fund") as of August 31, 2004, and the related statement of operations for the year then ended, the statement of changes in net assets for each of the two years in the period then ended, and the financial highlights for each of the five years in the period then ended. These financial statements and financial highlights are the responsibility of the Fund's management. Our responsibility is to express an opinion on these financial statements and financial highlights based on our audits.
We conducted our audits in accordance with standards of the Public Company Accounting Oversight Board (United States). Those standards require that we plan and perform the audits to provide reasonable assurance about whether the financial statements and financial highlights are free of material misstatement. An audit includes examining, on a test basis, evidence supporting the amounts and disclosures in the financial statements. Our procedures included confirmation of the securities owned as of August 31, 2004, by correspondence with the custodian. An audit also includes assessing the accounting principles used and significant estimates made by management, as well as evaluating the overall financial statement presentation. We believe our audits provide a reasonable basis for our opinion.
In our opinion, such financial statements and financial highlights referred to above present fairly, in all material respects, the financial position of the Fund as of August 31, 2004, the results of its operations for the year then ended, the changes in its net assets and its financial highlights for the respective stated periods in conformity with accounting principles generally accepted in the United States of America.
Deloitte & Touche LLP
Boston, Massachusetts
October 20, 2004
Board of Trustees and Trust Officers
The Board is responsible for managing the Trust's business affairs and for exercising all the Trust's powers except those reserved for the shareholders. The following tables give information about each Board member and the senior officers of the Funds. Where required, the tables separately list Board members who are "interested persons" of the Fund (i.e., "Interested" Board members) and those who are not (i.e., "Independent" Board members). Unless otherwise noted, the address of each person listed is Federated Investors Tower, 1001 Liberty Avenue, Pittsburgh, PA. The Trust comprises seven portfolios and the Federated Fund Complex consists of 44 investment companies (comprising 136 portfolios). Unless otherwise noted, each Officer is elected annually. Unless otherwise noted, each Board member oversees all portfolios in the Federated Fund Complex and serves for an indefinite term. The Fund's Statement of Additional Information includes additional information about Trust Trustees and is available, without charge and upon request, by calling 1-800-341-7400.
INTERESTED TRUSTEES BACKGROUND
|
|
|
Name
Birth Date
Address
Positions Held with Trust
Date Service Began
|
| Principal Occupation(s) for Past Five Years,
Other Directorships Held and Previous Position(s)
|
John F. Donahue*
Birth Date: July 28, 1924
CHAIRMAN AND TRUSTEE
Began serving: August 1990 | | Principal Occupations : Chairman and Director or Trustee of the Federated Fund Complex; Chairman and Director, Federated Investors, Inc.
Previous Positions : Trustee, Federated Investment Management Company and Chairman and Director, Federated Investment Counseling. |
|
|
|
J. Christopher Donahue*
Birth Date: April 11, 1949
PRESIDENT AND TRUSTEE
Began serving: August 1990 | | Principal Occupations : Principal Executive Officer and President of the Federated Fund Complex; Director or Trustee of some of the Funds in the Federated Fund Complex; President, Chief Executive Officer and Director, Federated Investors, Inc.; Chairman and Trustee, Federated Investment Management Company; Trustee, Federated Investment Counseling; Chairman and Director, Federated Global Investment Management Corp.; Chairman, Passport Research, Ltd.; Trustee, Federated Shareholder Services Company; Director, Federated Services Company.
Previous Positions : President, Federated Investment Counseling; President and Chief Executive Officer, Federated Investment Management Company, Federated Global Investment Management Corp. and Passport Research, Ltd. |
|
|
|
|
|
|
Name
Birth Date
Address
Positions Held with Trust
Date Service Began
|
| Principal Occupation(s) for Past Five Years,
Other Directorships Held and Previous Position(s)
|
Lawrence D. Ellis, M.D.*
Birth Date: October 11, 1932
3471 Fifth Avenue
Suite 1111
Pittsburgh, PA
TRUSTEE
Began serving: August 1990 | | Principal Occupations : Director or Trustee of the Federated Fund Complex; Professor of Medicine, University of Pittsburgh; Medical Director, University of Pittsburgh Medical Center Downtown; Hematologist, Oncologist and Internist, University of Pittsburgh Medical Center.
Other Directorships Held : Member, National Board of Trustees, Leukemia Society of America.
Previous Positions : Trustee, University of Pittsburgh; Director, University of Pittsburgh Medical Center. |
|
|
|
* Family relationships and reasons for "interested" status: John F. Donahue is the father of J. Christopher Donahue; both are "interested" due to the positions they hold with Federated Investors, Inc. and its subsidiaries. Lawrence D. Ellis, M.D. is "interested" because his son-in-law is employed by the Fund's principal underwriter, Federated Securities Corp.
INDEPENDENT TRUSTEES BACKGROUND
|
|
|
Name
Birth Date
Address
Positions Held with Trust
Date Service Began
|
| Principal Occupation(s) for Past Five Years,
Other Directorships Held and Previous Position(s)
|
Thomas G. Bigley
Birth Date: February 3, 1934
15 Old Timber Trail
Pittsburgh, PA
TRUSTEE
Began serving: November 1994 | | Principal Occupation : Director or Trustee of the Federated Fund Complex.
Other Directorships Held : Director, Member of Executive Committee, Children's Hospital of Pittsburgh; Director, University of Pittsburgh.
Previous Position : Senior Partner, Ernst & Young LLP. |
|
|
|
John T. Conroy, Jr.
Birth Date: June 23, 1937
Grubb & Ellis/Investment
Properties Corporation
3838 North Tamiami Trail
Suite 402
Naples, FL
TRUSTEE
Began serving: August 1991 | | Principal Occupations : Director or Trustee of the Federated Fund Complex; Chairman of the Board, Investment Properties Corporation; Partner or Trustee in private real estate ventures in Southwest Florida.
Previous Positions : President, Investment Properties Corporation; Senior Vice President, John R. Wood and Associates, Inc., Realtors; President, Naples Property Management, Inc. and Northgate Village Development Corporation. |
|
|
|
|
|
|
Name
Birth Date
Address
Positions Held with Trust
Date Service Began
|
| Principal Occupation(s) for Past Five Years,
Other Directorships Held and Previous Position(s)
|
Nicholas P. Constantakis
Birth Date: September 3, 1939
175 Woodshire Drive
Pittsburgh, PA
TRUSTEE
Began serving: February 1998 | | Principal Occupations : Director or Trustee of the Federated Fund Complex.
Other Directorships Held : Director and Member of the Audit Committee, Michael Baker Corporation (engineering and energy services worldwide).
Previous Position : Partner, Andersen Worldwide SC. |
|
|
|
John F. Cunningham
Birth Date: March 5, 1943
353 El Brillo Way
Palm Beach, FL
TRUSTEE
Began serving: July 1999 | | Principal Occupation : Director or Trustee of the Federated Fund Complex.
Other Directorships Held : Chairman, President and Chief Executive Officer, Cunningham & Co., Inc. (strategic business consulting); Trustee Associate, Boston College.
Previous Positions : Director, Redgate Communications and EMC Corporation (computer storage systems); Chairman of the Board and Chief Executive Officer, Computer Consoles, Inc.; President and Chief Operating Officer, Wang Laboratories; Director, First National Bank of Boston; Director, Apollo Computer, Inc. |
|
|
|
Peter E. Madden
Birth Date: March 16, 1942
One Royal Palm Way
100 Royal Palm Way
Palm Beach, FL
TRUSTEE
Began serving: August 1991 | | Principal Occupation : Director or Trustee of the Federated Fund Complex; Management Consultant.
Other Directorships Held : Board of Overseers, Babson College.
Previous Positions : Representative, Commonwealth of Massachusetts General Court; President, State Street Bank and Trust Company and State Street Corporation (retired); Director, VISA USA and VISA International; Chairman and Director, Massachusetts Bankers Association; Director, Depository Trust Corporation; Director, The Boston Stock Exchange. |
|
|
|
Charles F. Mansfield, Jr.
Birth Date: April 10, 1945
80 South Road
Westhampton Beach, NY
TRUSTEE
Began serving: January 1999 | | Principal Occupations : Director or Trustee of the Federated Fund Complex; Management Consultant; Executive Vice President, DVC Group, Inc. (marketing communications and technology) (prior to 9/1/00).
Previous Positions : Chief Executive Officer, PBTC International Bank; Partner, Arthur Young & Company (now Ernst & Young LLP); Chief Financial Officer of Retail Banking Sector, Chase Manhattan Bank; Senior Vice President, HSBC Bank USA (formerly, Marine Midland Bank); Vice President, Citibank; Assistant Professor of Banking and Finance, Frank G. Zarb School of Business, Hofstra University. |
|
|
|
|
|
|
Name
Birth Date
Address
Positions Held with Trust
Date Service Began
|
| Principal Occupation(s) for Past Five Years,
Other Directorships Held and Previous Position(s)
|
John E. Murray, Jr., J.D., S.J.D.
Birth Date: December 20, 1932
Chancellor, Duquesne University
Pittsburgh, PA
TRUSTEE
Began serving: February 1995 | | Principal Occupations : Director or Trustee of the Federated Fund Complex; Chancellor and Law Professor, Duquesne University; Partner, Murray, Hogue and Lannis.
Other Directorships Held : Director, Michael Baker Corp. (engineering, construction, operations and technical services).
Previous Positions : President, Duquesne University; Dean and Professor of Law, University of Pittsburgh School of Law; Dean and Professor of Law, Villanova University School of Law. |
|
|
|
Marjorie P. Smuts
Birth Date: June 21, 1935
4905 Bayard Street
Pittsburgh, PA
TRUSTEE
Began serving: August 1990 | | Principal Occupations : Director or Trustee of the Federated Fund Complex; Public Relations/Marketing Consultant/Conference Coordinator.
Previous Positions : National Spokesperson, Aluminum Company of America; television producer; President, Marj Palmer Assoc.; Owner, Scandia Bord. |
|
|
|
John S. Walsh
Birth Date: November 28, 1957
2604 William Drive
Valparaiso, IN
TRUSTEE
Began serving: July 1999 | | Principal Occupations : Director or Trustee of the Federated Fund Complex; President and Director, Heat Wagon, Inc. (manufacturer of construction temporary heaters); President and Director, Manufacturers Products, Inc. (distributor of portable construction heaters); President, Portable Heater Parts, a division of Manufacturers Products, Inc.
Previous Position : Vice President, Walsh & Kelly, Inc. |
|
|
|
OFFICERS
|
|
|
Name
Birth Date
Address
Positions Held with Trust
Date Service Began
|
| Principal Occupation(s) for Past Five Years and Previous Position(s)
|
John W. McGonigle
Birth Date: October 26, 1938
EXECUTIVE VICE PRESIDENT
AND SECRETARY
Began serving: August 1990 | | Principal Occupations : Executive Vice President and Secretary of the Federated Fund Complex; Executive Vice President, Secretary and Director, Federated Investors, Inc. |
|
|
|
Richard J. Thomas
Birth Date: June 17, 1954
TREASURER
Began serving: November 1998 | | Principal Occupations : Principal Financial Officer and Treasurer of the Federated Fund Complex; Senior Vice President, Federated Administrative Services. |
|
|
|
Richard B. Fisher
Birth Date: May 17, 1923
VICE CHAIRMAN
Began serving: August 2002 | | Principal Occupations : Vice Chairman or President of some of the Funds in the Federated Fund Complex; Vice Chairman, Federated Investors, Inc.; Chairman, Federated Securities Corp.
Previous Positions : President and Director or Trustee of some of the Funds in the Federated Fund Complex; Executive Vice President, Federated Investors, Inc. and Director and Chief Executive Officer, Federated Securities Corp. |
|
|
|
Mary Jo Ochson
Birth Date: September 12, 1953
CHIEF INVESTMENT OFFICER
Began serving: May 2004 | | Principal Occupations: Mary Jo Ochson has been the Fund's Portfolio Manager since April 1997. Ms. Ochson was named Chief Investment Officer of tax-exempt, fixed-income products in 2004. She joined Federated in 1982 and has been a Senior Portfolio Manager and a Senior Vice President of the Fund's Adviser since 1996. Ms. Ochson is a Chartered Financial Analyst and received her M.B.A. in Finance from the University of Pittsburgh. |
|
|
|
J. Scott Albrecht
Birth Date: June 1, 1960
VICE PRESIDENT
Began serving: November 1998 | | J. Scott Albrecht has been the Fund's Portfolio Manager since March 1995. He is Vice President of the Trust. Mr. Albrecht joined Federated in 1989. He has been a Senior Portfolio Manager since 1997 and a Vice President of the Fund's Adviser since 1994. He was a Portfolio Manager from 1994 to 1996. Mr. Albrecht is a Chartered Financial Analyst and received his M.S. in Public Management from Carnegie Mellon University. |
|
|
|
Mutual funds are not bank deposits or obligations, are not guaranteed by any bank, and are not insured or guaranteed by the U.S. government, the Federal Deposit Insurance Corporation, the Federal Reserve Board, or any other government agency. Investment in mutual funds involves investment risk, including the possible loss of principal.
This report is authorized for distribution to prospective investors only when preceded or accompanied by the Fund's prospectus, which contains facts concerning its objective and policies, management fees, expenses, and other information.
VOTING PROXIES ON FUND PORTFOLIO SECURITIES
A description of the policies and procedures that the Fund uses to determine how to vote proxies relating to securities held in the Fund's portfolio is available, without charge and upon request, by calling 1-800-341-7400. A report on "Form N-PX" of how the Fund voted any such proxies during the most recent 12-month period ended June 30 is available through Federated's website. Go to http://www.federatedinvestors.com, select "Products," select the "Prospectuses and Regulatory Reports" link, then select the Fund to access the link to Form N-PX. This information is also available from the EDGAR database on the SEC's website at http://www.sec.gov.
QUARTERLY PORTFOLIO SCHEDULE
The Fund files with the SEC a complete schedule of its portfolio holdings, as of the close of the first and third quarters of its fiscal year, on "Form N-Q." These filings are available on the SEC's website at http://www.sec.gov; and may be reviewed and copied at the SEC's Public Reference Room in Washington, DC. (Call 1-800-SEC-0330 for information on the operation of the Public Reference Room.) You may also access this information from the "Products" section of Federated's website at www.federatedinvestors.com by clicking on "Portfolio Holdings" and selecting the name of the Fund, or by selecting the name of the Fund and clicking on "Portfolio Holdings." You must register on the website the first time you wish to access this information.
Federated
World-Class Investment Manager
Federated Ohio Municipal Income Fund
Federated Investors Funds
5800 Corporate Drive
Pittsburgh, PA 15237-7000
www.federatedinvestors.com
Contact us at 1-800-341-7400 or
www.federatedinvestors.com/contact
Federated Securities Corp., Distributor
Cusip 313923609
28994 (10/04)
Federated is a registered mark of Federated Investors, Inc. 2004 (c)Federated Investors, Inc.
Federated
World-Class Investment Manager
Federated Pennsylvania Municipal Income Fund
A Portfolio of Federated Municipal Securities Income Trust
ANNUAL SHAREHOLDER REPORT
August 31, 2004
Class A Shares
Class B Shares
FINANCIAL HIGHLIGHTS
SHAREHOLDER EXPENSE EXAMPLE
MANAGEMENT'S DISCUSSION OF FUND PERFORMANCE
PORTFOLIO OF INVESTMENTS SUMMARY TABLE
FINANCIAL STATEMENTS
REPORT OF INDEPENDENT REGISTERED PUBLIC ACCOUNTING FIRM
BOARD OF TRUSTEES AND TRUST OFFICERS
VOTING PROXIES ON FUND PORTFOLIO SECURITIES
QUARTERLY PORTFOLIO SCHEDULE
Not FDIC Insured * May Lose Value * No Bank Guarantee
Financial Highlights - Class A Shares
(For a Share Outstanding Throughout Each Period)
Year Ended August 31
|
| 2004
|
|
| 2003
|
|
| 2002
|
|
| 2001
|
|
| 2000
|
|
Net Asset Value, Beginning of Period
| | $11.51 | | | $11.70 | | | $11.52 | | | $11.09 | | | $11.19 | |
Income From Investment Operations:
| | | | | | | | | | | | | | | |
Net investment income
| | 0.54 | | | 0.54 | | | 0.56 | 1 | | 0.57 | | | 0.55 | |
Net realized and unrealized gain (loss) on investments, futures contracts and swap contracts
|
| 0.19
|
|
| (0.19
| )
|
| 0.18
| 1
|
| 0.42
|
|
| (0.11
| )
|
TOTAL FROM INVESTMENT OPERATIONS
|
| 0.73
|
|
| 0.35
|
|
| 0.74
|
|
| 0.99
|
|
| 0.44
|
|
Less Distributions:
| | | | | | | | | | | | | | | |
Distributions from net investment income
|
| (0.53
| )
|
| (0.54
| )
|
| (0.56
| )
|
| (0.56
| )
|
| (0.54
| )
|
Net Asset Value, End of Period
|
| $11.71
|
|
| $11.51
|
|
| $11.70
|
|
| $11.52
|
|
| $11.09
|
|
Total Return 2
|
| 6.46
| %
|
| 3.04
| %
|
| 6.70
| %
|
| 9.18
| %
|
| 4.17
| %
|
| | | | | | | | | | | | | | | |
Ratios to Average Net Assets:
|
|
|
|
|
|
|
|
|
|
|
|
|
|
|
|
Expenses
|
| 0.75
| %
|
| 0.75
| %
|
| 0.75
| %
|
| 0.75
| %
|
| 0.75
| %
|
Net investment income
|
| 4.63
| %
|
| 4.58
| %
|
| 4.92
| % 1
|
| 5.09
| %
|
| 5.10
| %
|
Expense waiver/reimbursement 3
|
| 0.10
| %
|
| 0.09
| %
|
| 0.09
| %
|
| 0.10
| %
|
| 0.12
| %
|
Supplemental Data:
|
|
|
|
|
|
|
|
|
|
|
|
|
|
|
|
Net assets, end of period (000 omitted)
|
| $200,023
|
| $210,429
|
| $205,870
|
| $194,407
|
| $193,608
|
|
Portfolio turnover
|
| 9
| %
|
| 17
| %
|
| 18
| %
|
| 16
| %
|
| 23
| %
|
1 Effective September 1, 2001, the Fund adopted the provisions of the American Institute of Certified Public Accountants (AICPA) Audit and Accounting Guide for Investment Companies and began accreting discount on debt securities. For the year ended August 31, 2002, this change had no effect on the net investment income per share, the net realized and unrealized gain (loss) on investments per share, or the ratio of net investment income to average net assets. Per share, ratios and supplemental data for the periods prior to September 1, 2001 have not been restated to reflect this change in presentation.
2 Based on net asset value, which does not reflect the sales charge, redemption fee or contingent deferred sales charge, if applicable.
3 This voluntary expense decrease is reflected in both the expense and the net investment income ratios shown above.
See Notes which are an integral part of the Financial Statements
Financial Highlights - Class B Shares
(For a Share Outstanding Throughout Each Period)
Year Ended August 31
|
| 2004
|
|
| 2003
|
|
| 2002
|
|
| 2001
|
|
| 2000
|
|
Net Asset Value, Beginning of Period
| | $11.51 | | | $11.70 | | | $11.53 | | | $11.09 | | | $11.20 | |
Income From Investment Operations:
| | | | | | | | | | | | | | | |
Net investment income
| | 0.45 | | | 0.45 | | | 0.47 | 1 | | 0.48 | | | 0.47 | |
Net realized and unrealized gain (loss) on investments, futures contracts, and swap contracts
|
| 0.19
|
|
| (0.19
| )
|
| 0.18
| 1
|
| 0.43
|
|
| (0.12
| )
|
TOTAL FROM INVESTMENT OPERATIONS
|
| 0.64
|
|
| 0.26
|
|
| 0.65
|
|
| 0.91
|
|
| 0.35
|
|
Less Distributions:
| | | | | | | | | | | | | | | |
Distributions from net investment income
|
| (0.44
| )
|
| (0.45
| )
|
| (0.48
| )
|
| (0.47
| )
|
| (0.46
| )
|
Net Asset Value, End of Period
|
| $11.71
|
|
| $11.51
|
|
| $11.70
|
|
| $11.53
|
|
| $11.09
|
|
Total Return 2
|
| 5.65
| %
|
| 2.26
| %
|
| 5.79
| %
|
| 8.42
| %
|
| 3.29
| %
|
| | | | | | | | | | | | | | | |
Ratios to Average Net Assets:
|
|
|
|
|
|
|
|
|
|
|
|
|
|
|
|
Expenses
|
| 1.52
| %
|
| 1.52
| %
|
| 1.52
| %
|
| 1.52
| %
|
| 1.52
| %
|
Net investment income
|
| 3.85
| %
|
| 3.81
| %
|
| 4.15
| % 1
|
| 4.32
| %
|
| 4.34
| %
|
Expense waiver/reimbursement 3
|
| 0.08
| %
|
| 0.07
| %
|
| 0.07
| %
|
| 0.08
| %
|
| 0.10
| %
|
Supplemental Data:
|
|
|
|
|
|
|
|
|
|
|
|
|
|
|
|
Net assets, end of period (000 omitted)
|
| $65,748
|
|
| $70,339
|
|
| $61,535
|
|
| $51,468
|
|
| $43,249
|
|
Portfolio turnover
|
| 9
| %
|
| 17
| %
|
| 18
| %
|
| 16
| %
|
| 23
| %
|
1 Effective September 1, 2001, the Fund adopted the provisions of the AICPA Audit and Accounting Guide for Investment Companies and begin accreting discount on debt securities. For the year ended August 31, 2002, this change had no effect on the net investment income per share, the net realized and unrealized gain (loss) on investments per share, or the ratio of net investment income to average net assets. Per share, ratios and supplemental data for the periods prior to September 1, 2001 have not been restated to reflect this change in presentation.
2 Based on net asset value, which does not reflect the sales charge, redemption fee or contingent deferred sales charge, if applicable.
3 This voluntary expense decrease is reflected in both the expense and the net investment income ratios shown above.
See Notes which are an integral part of the Financial Statements
Shareholder Expense Example
As a shareholder of the Fund, you incur two types of costs: (1) transaction costs, including sales charges (load) on purchase payments (Class A Shares); and (2) ongoing costs, including management fees (Class A Shares and Class B Shares), distribution (12b-1) fees (Class A Shares and Class B Shares), shareholder services fees (Class A Shares and Class B Shares), and other Fund expenses. This Example is intended to help you to understand your ongoing costs (in dollars) of investing in the Fund and to compare these costs with the ongoing costs of investing in other mutual funds. It is based on an investment of $1,000 invested at the beginning of the period and held for the entire period from March 1, 2004 to August 31, 2004.
ACTUAL EXPENSES
The first section of the table below provides information about actual account values and actual expenses. You may use the information in this section, together with the amount you invested, to estimate the expenses that you incurred over the period. Simply divide your account value by $1,000 (for example, an $8,600 account value divided by $1,000 = 8.6), then multiply the result by the number in the first section under the heading entitled "Expenses Paid During Period" to estimate the expenses attributable to your investment during this period.
HYPOTHETICAL EXAMPLE FOR COMPARISON PURPOSES
The second section of the table below provides information about hypothetical account values and hypothetical expenses based on the Fund's actual expense ratio and an assumed rate of return of 5% per year before expenses, which is not the Fund's actual return. Thus, you should not use the hypothetical account values and expenses to estimate the actual ending account balance or your expenses for the period. Rather, these figures are provided to enable you to compare the ongoing costs of investing in the Fund and other funds. To do so, compare this 5% hypothetical example with the 5% hypothetical examples that appear in the shareholder reports of the other funds.
Please note that the expenses shown in the table are meant to highlight your ongoing costs only and do not reflect any transaction costs, such as sales charges (loads). Therefore, the second section of the table is useful in comparing ongoing costs only, and will not help you determine the relative total costs of owning different funds. In addition, if these transaction costs were included, your costs would have been higher.
|
| Beginning
Account Value
3/1/2004
|
| Ending
Account Value
8/31/2004
|
| Expenses Paid
During Period 1
|
Actual:
|
|
|
|
|
|
|
Class A Shares
|
| $1,000
|
| $1,000.30
|
| $3.77
|
Class B Shares
|
| $1,000
|
| $996.40
|
| $7.63
|
Hypothetical (assuming a 5% return before expenses):
|
|
|
|
|
|
|
Class A Shares
|
| $1,000
|
| $1021.37
|
| $3.81
|
Class B Shares
|
| $1,000
|
| $1,017.50
|
| $7.71
|
1 Expenses are equal to Federated Pennsylvania Municipal Income Fund's Class A Shares and Class B Shares annualized expense ratios of 0.75% and 1.52%, respectively, multiplied by the average account value over the period, multiplied by 184/366 (to reflect the one-half year period).
Management's Discussion of Fund Performance
The fund's total return, based on net asset value, for the 12-month reporting period was 6.46% for the fund's Class A Shares, and 5.65% for the fund's Class B Shares at NAV. The total return consisted of 4.72% (Class A Shares) and 3.91% (Class B Shares) of tax-exempt dividends, and 1.74% appreciation (Class A and Class B Shares) in the net asset value of the shares. 1 The total return of the Lehman Brothers Municipal Bond Index, the fund's benchmark index (LBMB), 2 was 7.11% during the 12-month reporting period.
The fund's investment strategy focused on: (a) the effective duration of its portfolio (which indicates the portfolio's sensitivity to changes in interest rates); (b) the selection of securities with different maturities (expressed by a "yield curve" showing the relative yield of similar securities with different maturities) and the coupon income provided by the portfolio securities (the coupon is the interest rate paid by a bond); (c) the allocation of the portfolio among securities of similar issuers (referred to as "sectors"); and (d) the credit ratings of portfolio securities (which indicates the risk that securities will default). These were the most significant factors affecting the fund's performance relative to the LBMB. In addition, the fund's total return reflected actual cash flows, transaction costs and other expenses, which were not reflected in the total return of the LBMB.
DURATION 3
The fund's dollar-weighted average duration at the end of the reporting period was 5.83 years. Duration management is a significant component of the fund's investment strategy. The fund maintained duration short of the LBMB and the fund's peer groups, as interest rates were expected to rise during the reporting period. In reality, interest rates declined over a significant portion of the reporting period and this hurt fund performance. The fund's use of forward settling municipal interest rate swaps and Treasury futures contacts, which did not perform well, to adjust portfolio duration contributed to the fund's performance being less than the LBMB.
1 Performance data quoted represents past performance which is no guarantee of future results. Investment return and principal value will fluctuate so that an investor's shares, when redeemed, may be worth more or less than their original cost. Mutual fund performance changes over time and current performance may be lower or higher than what is stated. For current to the most recent month end performance, visit www.federatedinvestors.com or call 1-800-341-7400.
Income may be subject to the federal alternative minimum tax.
2 The LBMB is the broad-based securities market index for the fund, as disclosed in the fund's prospectus. The LBMB is a broad market performance benchmark for the tax-exempt bond market. To be included in the LBMB, bonds must have a minimum credit rating of Baa, have an outstanding par value of at least $3 million and be issued as part of a transaction of at least $50 million. The LBMB includes both zero coupon bonds and bonds subject to the alternative minimum tax. The LBMB is not adjusted to reflect sales charges, expenses, or other fees that the Securities and Exchange Commission (SEC) requires to be reflected in the fund's performance. Indexes are unmanaged and, unlike the fund, is not affected by cash flows. It is not possible to invest directly in an index.
3 Duration is a measure of a security's price sensitivity to changes in interest rates. Securities with longer durations are more sensitive to changes in interest rates than securities with shorter durations.
COUPON AND MATURITY
During the reporting period, the fund concentrated its portfolio purchases and holdings on premium coupon municipal bonds (municipal bonds with coupons or interest payments that are higher than current yields available in the market). The higher coupons on the fund's premium coupon municipal bond holdings made the fund less sensitive to interest rate changes, and helped the fund's performance as interest rates declined over a significant portion of the reporting period. This benefited the fund's performance versus the LBMB and the fund's peer group.
The fund concentrated on purchasing bonds with maturities of 10 to 20 years during the reporting period. These maturities provided the most attractive opportunities for yield. In addition, the relative dearth of municipal debt issued during the reporting period caused municipal bonds to increase in value and helped to improve the fund's performance versus most taxable bond alternatives.
SECTOR
During the reporting period, as compared to the LBMB, the fund allocated more of its portfolio to securities issued by hospitals, industrial development projects and higher education institutions. The fund also allocated less of the portfolio to general obligation bonds issued by cities, states and school districts. These allocations helped the fund's performance due to the higher yields available in the over-weighted sectors and the smaller increase in the price of general obligation bonds as compared to other sectors.
CREDIT QUALITY
Credit spreads, or the yield difference between the "AAA" municipal bonds and bonds of lower credit quality and similar maturity, decreased during the reporting period. This decrease in credit spreads was the result of both improving economic activity and the demand for securities with higher yields. The fund's overweight, relative to the LBMB, in "BBB" rated (or comparable quality) debt benefited performance as credit spreads became tighter to a greater extent for "BBB" rated (or comparable quality) debt than for other investment-grade rated ("AAA", "AA", "A" or comparable quality) debt (meaning that the yield on the "BBB" rated debt improved to a greater extent, or decreased to a lesser extent, than for other investment grade rated debt). 4
4 Lower-rated bonds typically offer higher yields to help compensate investors for the increased risk associated with them. Among these risks are lower creditworthiness, greater price volatility, more risk to principal and income than with higher-rated securities and increased possibilities of default.
GROWTH OF A $10,000 INVESTMENT - CLASS A SHARES
The graph below illustrates the hypothetical investment of $10,000 1 in Federated Pennsylvania Municipal Income Fund (Class A Shares) (the "Fund") from August 31, 1994 to August 31, 2004, compared to the Lehman Brothers Municipal Bond Index (LBMB), 2 and the Lipper Pennsylvania Municipal Debt Funds Average (LPMDFA). 3
Average Annual Total Return 4 for the Period Ended 8/31/2004
|
|
|
1 Year
|
| 1.69%
|
5 Years
|
| 4.91%
|
10 Years
|
| 5.56%
|

Performance data quoted represents past performance which is no guarantee of future results. Returns shown do not reflect the deduction of taxes that a shareholder would pay on Fund distributions or the redemption of Fund shares. For after-tax returns, visit www.federatedinvestors.com. Investment return and principal value will fluctuate so that an investor's shares, when redeemed, may be worth more or less than their original cost. Mutual fund performance changes over time and current performance may be lower or higher than what is stated. Mutual funds are not obligations of or guaranteed by any bank and are not federally insured.
1 Represents a hypothetical investment of $10,000 in the Fund after deducting the maximum sales charge of 3.00% ($10,000 investment minus $300 sales charge = $9,700) that was effective prior to November 1, 1996. Effective November 1, 1996, the maximum sales charge has been increased to 4.50%. The Fund's performance assumes the reinvestment of all dividends and distributions. The LBMB and LPMDFA have been adjusted to reflect reinvestment of dividends on securities in the index and average. Indexes are unmanaged, and unlike the Fund, are unaffected by cash flows. It is not possible to invest directly in an index or an average.
2 The LBMB is an unmanaged index comprising bonds with a minimum credit rating of at least Baa. They must have an outstanding par value of at least $3 million and be issued as part of a transaction of at least $50 million. The index includes both zero coupon bonds and bonds subject to the federal alternative minimum tax. It is not adjusted to reflect sales charges, expenses, or other fees that the Securities and Exchange Commission (SEC) requires to be reflected in the Fund's performance.
3 The LPMDFA represents the average of the total returns reported by all of the mutual funds designated by Lipper, Inc. as falling into the respective category. These total returns are reported net of expenses and other fees that the SEC requires to be reflected in a mutual find's performance.
4 Total return quoted reflects all applicable sales charges.
GROWTH OF A $10,000 INVESTMENT - CLASS B SHARES
The graph below illustrates the hypothetical investment of $10,000 1 in the Federated Pennsylvania Municipal Income Fund (Class B Shares) (the "Fund") from March 4, 1997 (start of performance) to August 31, 2004, compared to the Lehman Brothers Municipal Bond Index (LBMB), 2 and the Lipper Pennsylvania Municipal Debt Funds Average (LPMDFA). 3
Average Annual Total Return 4 for the Period Ended 8/31/2004
|
|
|
1 Year
|
| 0.15%
|
5 Years
|
| 4.73%
|
Start of Performance (3/4/1997)
|
| 4.62%
|

Performance data quoted represents past performance which is no guarantee of future results. Returns shown do not reflect the deduction of taxes that a shareholder would pay on Fund distributions or the redemption of Fund shares. For after-tax returns, visit www.federatedinvestors.com. Investment return and principal value will fluctuate so that an investor's shares, when redeemed, may be worth more or less than their original cost. Mutual fund performance changes over time and current performance may be lower or higher than what is stated. Mutual funds are not obligations of or guaranteed by any bank and are not federally insured.
1 Represents a hypothetical investment of $10,000 in the Fund. The ending value of the Fund does not reflect a contingent deferred sales charge on any redemption over six years from the purchase date. The maximum contingent deferred sales charge is 5.50% of any redemption less than one year from the purchase date. The Fund's performance assumes the reinvestment of all dividends and distributions. The LBMB and LPMDFA have been adjusted to reflect reinvestment of dividends on securities in the index and average. Indexes are unmanaged and unlike the Fund, are not affected by cash flows. It is not possible to invest directly in an index or an average.
2 The LBMB is an unmanaged index comprising bonds with a minimum credit rating of at least Baa. They must have an outstanding par value of at least $3 million and be issued as part of a transaction of at least $50 million. The index includes both zero coupon bonds and bonds subject to the federal alternative minimum tax. It is not adjusted to reflect sales charges, expenses, or other fees that the SEC requires to be reflected in the Fund's performance.
3 The LPMDFA represents the average of the total returns reported by all of the mutual funds designated by Lipper, Inc. as falling into the respective category. These total returns are reported net of expenses and other fees that the SEC requires to be reflected in a mutual find's performance.
4 Total return quoted reflects all applicable sales charges and contingent deferred sales charges.
Portfolio of Investments Summary Tables
At August 31, 2004, the fund's credit-quality ratings composition 1 was as follows:
S&P Long-Term Ratings as
Percentage of Total Investments 2
|
| Moody's Long-Term Ratings as
Percentage of Total Investments 2
|
AAA
|
| 37.8%
| | Aaa
|
| 39.3%
|
AA
|
| 14.4%
| | Aa
|
| 7.7%
|
A
|
| 6.8%
| | A
|
| 2.0%
|
BBB
|
| 17.6%
| | Baa
|
| 7.1%
|
BB
|
| 1.6%
| | Ba
|
| 0.0%
|
B
|
| 1.0%
| | B
|
| 1.1%
|
Not rated by S&P
|
| 20.8%
| | Not rated by Moody's
|
| 42.8%
|
TOTAL
|
| 100%
|
| TOTAL
|
| 100%
|
1 These tables depict the long-term, credit-quality-ratings assigned to the fund's portfolio holdings by Standard & Poor's and Moody's Investors Service, each of which is a Nationally Recognized Statistical Rating Organization (NRSRO). These credit-quality ratings are shown without regard to gradations within a given rating category. For example, securities rated "A-" have been included in the "A" rated category. Holdings that are rated only by a different NRSRO than the one identified have been included in the "Not rated by..." category. Rated securities that have been prerefunded, but not rated again by the NRSRO, also have been included in the "Not rated by..." category. Rated securities include a security with an obligor and/or credit enhancer that has received a rating from an NRSRO with respect to a class of debt obligations that is comparable in priority and security with the security held by the fund. Credit-quality ratings are an assessment of the risk that a security will default in payment and do not address other risks presented by the security. Please see the description of credit quality ratings in the fund's Statement of Additional Information.
Each table depicts the long-term credit quality ratings as assigned only by the NRSRO identified in the table. Of the portfolio's total investments, 11.5% are not rated by either of these NRSROs.
2 Percentages are based on total investments, which may differ from total net assets.
Portfolio of Investments
August 31, 2004
Principal
Amount
|
|
|
| Credit
Rating
| 1
|
| Value
|
| | | LONG-TERM MUNICIPALS--98.9% | | | | | |
| | | Pennsylvania--96.9% | | | | | |
| $ | 1,500,000 | | Allegheny County Redevelopment Authority, Tax Increment Bonds (Series 2000A), 6.30% (Waterfront Project), 12/15/2018
| | NR/A- | | $ | 1,649,460 |
| 4,250,000 | | Allegheny County, PA Airport Authority, Airport Revenue Refunding Bonds (Series 1999), 6.125% (Pittsburgh International Airport)/(FGIC INS), 1/1/2017
| | AAA/Aaa/AAA | | | 4,738,962 |
| 2,500,000 | | Allegheny County, PA HDA, Health System Revenue Bonds (Series 2000B), 9.25% (West Penn Allegheny Health System)/(Original Issue Yield: 9.70%), 11/15/2030
| | B/B2/B+ | | | 2,846,650 |
| 2,000,000 | | Allegheny County, PA HDA, Refunding Revenue Bonds (Series 1998A), 5.125% (South Hills Health System)/ (Original Issue Yield: 5.34%), 5/1/2023
| | NR/Baa1/NR | | | 1,795,600 |
| 950,000 | | Allegheny County, PA HDA, Refunding Revenue Bonds, 6.625% (Allegheny General Hospital)/(Escrowed In Treasuries COL), 7/1/2009
| | AAA/Aaa/NR | | | 1,055,858 |
| 2,000,000 | | Allegheny County, PA HDA, Revenue Bonds, 5.50% (Catholic Health East)/(Original Issue Yield: 5.60%), 11/15/2032
| | A/A2/A+ | | | 2,022,840 |
| 1,500,000 | | Allegheny County, PA HDA, Revenue Bonds, 5.375% (Ohio Valley General Hospital, PA)/(Original Issue Yield: 5.50%), 1/1/2018
| | NR/Baa1/NR | | | 1,485,810 |
| 4,000,000 | | Allegheny County, PA HDA, Revenue Bonds, (Series 1997A), 5.60% (UPMC Health System)/(MBIA Insurance Corp. INS)/ (Original Issue Yield: 5.85%), 4/1/2017
| | AAA/Aaa/AAA | | | 4,371,640 |
| 1,000,000 | | Allegheny County, PA Higher Education Building Authority, Revenue Bonds (Series 2002A), 5.95% (Chatham College)/(Original Issue Yield: 5.97%), 3/1/2032
| | BBB/NR/NR | | | 1,028,840 |
| 1,000,000 | | Allegheny County, PA Higher Education Building Authority, Revenue Bonds (Series 2002B), 5.25% (Chatham College)/(Original Issue Yield: 5.35%), 11/15/2016
| | BBB/NR/NR | | | 1,023,590 |
| 575,000 | 2,3 | Allegheny County, PA IDA, Cargo Facilities Lease Revenue Bonds (Series 1999), 6.00% (AFCO Cargo PIT LLC Project), 9/1/2009
| | NR | | | 556,479 |
| 1,000,000 | 2,3 | Allegheny County, PA IDA, Cargo Facilities Lease Revenue Bonds (Series 1999), 6.625% (AFCO Cargo PIT LLC Project)/ (Original Issue Yield: 6.75%), 9/1/2024
| | NR | | | 932,550 |
Principal
Amount
|
|
|
| Credit
Rating
| 1
|
| Value
|
| | | LONG-TERM MUNICIPALS--continued | | | | | |
| | | Pennsylvania--continued | | | | | |
| $ | 3,185,000 | | Allegheny County, PA IDA, Environmental Improvement Refunding Revenue Bonds (Series 1998), 5.50% (Marathon Oil Corp.), 12/1/2029
| | BBB+/Baa1/NR | | $ | 3,201,403 |
| 1,250,000 | | Allegheny County, PA IDA, Environmental Improvement Refunding Revenue Bonds (Series 1998), 5.60% (Marathon Oil Corp.), 9/1/2030
| | BBB+/Baa1/NR | | | 1,259,400 |
| 1,500,000 | | Allegheny County, PA IDA, Health Care Facilities Revenue Refunding Bonds (Series 1998), 5.75% (Presbyterian SeniorCare-Westminister Place Project), 1/1/2023
| | NR | | | 1,329,030 |
| 1,000,000 | | Allegheny County, PA IDA, Lease Revenue Bonds (Series 2001), 6.60% (Residential Resources Inc. Project)/(Original Issue Yield: 6.75%), 9/1/2031
| | NR/BBB- | | | 971,820 |
| 3,000,000 | | Allegheny County, PA Port Authority, Special Revenue Transportation Bonds (Series 1999), 6.00% (MBIA Insurance Corp. INS)/(Original Issue Yield: 6.05%), 3/1/2019
| | AAA/Aaa/AAA | | | 3,452,970 |
| 515,000 | | Allegheny County, PA Residential Finance Agency, SFM Revenue Bonds (Series 2001KK-1), 5.375% (GNMA Collateralized Home Mortgage Program GTD), 5/1/2022
| | NR/Aaa/NR | | | 537,500 |
| 515,000 | | Allegheny County, PA Residential Finance Agency, SFM Revenue Bonds (Series FF-1), 5.90% (GNMA Collateralized Home Mortgage Program COL), 5/1/2020
| | NR/Aaa/NR | | | 548,609 |
| 1,835,000 | | Allentown, PA Area Hospital Authority, Revenue Bonds (Series B), 6.75% (Sacred Heart Hospital of Allentown), 11/15/2015
| | BB+/Baa3/NR | | | 1,847,019 |
| 2,000,000 | | Bethlehem, PA Area Vocational-Technical School Authority, GTD Lease Revenue Bonds (Series 1999), 5.50% (Bethlehem Area Vocational-Technical School)/ (U.S. Treasury PRF 9/1/2009@100)/(Original Issue Yield: 5.55%), 9/1/2020
| | NR/Aaa/AAA | | | 2,260,780 |
| 4,250,000 | | Bradford County, PA IDA, Solid Waste Disposal Revenue Bonds (Series A), 6.60% (International Paper Co.), 3/1/2019
| | BBB/Baa2/NR | | | 4,407,505 |
| 1,000,000 | | Bucks County, PA Community College Authority, College Building Revenue Bonds (Series 1996), 5.50% (Original Issue Yield: 5.70%), 6/15/2017
| | NR/Aa2/NR | | | 1,078,330 |
| 750,000 | | Bucks County, PA IDA, Revenue Bonds (Series 2002A), 6.00% (Pennswood Village)/ (Original Issue Yield: 6.12%), 10/1/2027
| | BBB+/NR/NR | | | 775,297 |
| 500,000 | | Bucks County, PA IDA, Revenue Bonds (Series 2002A), 6.00% (Pennswood Village)/ (Original Issue Yield: 6.16%), 10/1/2034
| | BBB+/NR/NR | | | 515,965 |
| 1,000,000 | | Bucks County, PA IDA, Solid Waste Revenue Bonds, 4.90% TOBs (Waste Management, Inc.), Mandatory Tender 12/1/2022
| | BBB/NR/NR | | | 1,039,650 |
Principal
Amount
|
|
|
| Credit
Rating
| 1
|
| Value
|
| | | LONG-TERM MUNICIPALS--continued | | | | | |
| | | Pennsylvania--continued | | | | | |
| $ | 1,750,000 | | Carbon County, PA IDA, Refunding Revenue Bonds, 6.65% (Panther Creek Partners Project)/(BNP Paribas SA and Union Bank of California LOCs), 5/1/2010
| | BBB-/NR/BBB- | | $ | 1,893,762 |
| 1,100,000 | | Chester County, PA HEFA, Mortgage Refunding Revenue Bonds, 5.50% (Tel Hai Obligated Group Project)/(Original Issue Yield: 5.60%), 6/1/2025
| | BBB-/NR/NR | | | 989,373 |
| 1,500,000 | | Clarion County, PA Hospital Authority, Revenue Refunding Bonds, (Series 1997), 5.75% (Clarion County Hospital)/ (Original Issue Yield: 5.95%), 7/1/2017
| | BBB-/NR/NR | | | 1,454,250 |
| 1,575,000 | | Commonwealth of Pennsylvania, GO UT Bonds, 6.00% (Original Issue Yield: 6.15%), 7/1/2007
| | AA/Aa2/NR | | | 1,746,502 |
| 1,000,000 | | Crawford County, PA Hospital Authority, Senior Living Facilities Revenue Bonds (Series 1999), 6.125% (Wesbury United Methodist Community Obligated Group)/(Original Issue Yield: 6.32%), 8/15/2019
| | NR/BBB- | | | 1,009,870 |
| 1,250,000 | | Cumberland County, PA Municipal Authority, College Revenue Bonds (Series A), 5.50% (Dickinson College)/ (AMBAC INS)/(Original Issue Yield: 5.70%), 11/1/2025
| | NR/Aaa/AAA | | | 1,352,925 |
| 1,000,000 | | Cumberland County, PA Municipal Authority, Retirement Community Revenue Bonds (Series 2002A), 7.125% (Wesley Affiliated Services, Inc. Obligated Group)/ (Original Issue Yield: 7.40%), 1/1/2025
| | NR | | | 1,014,130 |
| 2,800,000 | | Delaware County, PA Authority, College Revenue Bonds (Series 1999), 5.75% (Cabrini College)/(Radian Asset Assurance INS)/(Original Issue Yield: 5.95%), 7/1/2019
| | AA/NR/NR | | | 3,027,948 |
| 2,650,000 | | Delaware County, PA Authority, College Revenue Refunding Bonds (Series 1998A), 5.375% (Neumann College)/(Original Issue Yield: 5.48%), 10/1/2018
| | BBB-/NR/NR | | | 2,717,628 |
| 1,000,000 | | Delaware River Joint Toll Bridge Commission, Pennsylvania-New Jersey Bridge System Revenue Bonds (Series 2003), 5.25%, 7/1/2020
| | A-/A2/NR | | | 1,070,670 |
| 1,500,000 | | Delaware River Port Authority, Revenue Bonds (Series 1999), 6.00% (FSA INS), 1/1/2019
| | AAA/Aaa/AAA | | | 1,701,600 |
| 2,000,000 | | Delaware River Port Authority, Revenue Bonds, 6.00% (FSA INS), 1/1/2018
| | AAA/Aaa/AAA | | | 2,268,800 |
| 10,000,000 | | Delaware Valley, PA Regional Finance Authority, Local Government Revenue Bonds (Series 1997D), 5.60% (AMBAC INS), 7/1/2017
| | AAA/Aaa/NR | | | 11,620,600 |
| 1,000,000 | 2,3 | Delaware Valley, PA Regional Finance Authority, RITES (PA-1029R), 9.975%, 7/1/2017
| | NR | | | 1,349,630 |
| 4,100,000 | | Erie County, PA Hospital Authority, Health Facilities Revenue Bonds (Series 1999), 5.90% (St. Mary's Home of Erie)/(Radian Asset Assurance INS)/(Original Issue Yield: 6.05%), 8/15/2019
| | AA/NR/AA | | | 4,481,423 |
Principal
Amount
|
|
|
| Credit
Rating
| 1
|
| Value
|
| | | LONG-TERM MUNICIPALS--continued | | | | | |
| | | Pennsylvania--continued | | | | | |
| $ | 2,660,000 | | Greater Nanticoke, PA Area School District, UT GO Bonds, 5.50% (MBIA Insurance Corp. INS)/(Original Issue Yield: 5.62%), (U.S. Treasury PRF 10/15/2005 @100), 10/15/2025
| | AAA/Aaa/AAA | | $ | 2,779,115 |
| 2,000,000 | | Indiana County, PA IDA, Refunding Revenue Bonds, 5.00% (Indiana University of PA)/(AMBAC INS), 11/1/2029
| | AAA/NR/AAA | | | 2,037,400 |
| 800,000 | | Jeannette Health Services Authority, PA, Hospital Revenue Bonds (Series A of 1996), 6.00% (Jeannette District Memorial Hospital)/(Original Issue Yield: 6.15%), 11/1/2018
| | BB-/NR/NR | | | 765,168 |
| 1,000,000 | | Lancaster County, PA Hospital Authority, Health Center Revenue Bonds (Series 2001), 5.875% (Willow Valley Retirement Communities)/(Original Issue Yield: 5.95%), 6/1/2031
| | A-/NR/A- | | | 1,036,280 |
| 1,000,000 | | Lancaster County, PA Hospital Authority, Revenue Bonds, 5.50% (Lancaster General Hospital)/(Original Issue Yield: 5.63%), 3/15/2026
| | A-/NR/NR | | | 1,016,560 |
| 2,000,000 | | Lancaster County, PA, UT GO Bonds, (Series A), 5.80% (FGIC INS)/(Original Issue Yield: 5.84%), 5/1/2015
| | NR/Aaa/NR | | | 2,302,680 |
| 250,000 | | Lancaster, PA IDA, Revenue Bonds (Series 2000A), 7.60% (Garden Spot Village Project)/(Original Issue Yield: 7.70%), 5/1/2022
| | NR | | | 258,517 |
| 1,000,000 | | Lawrence County, PA IDA, Senior Health and Housing Facilities Revenue Bonds (Series B), 7.50% (Shenango Presbyterian SeniorCare Obligated Group)/(Original Issue Yield: 7.75%), 11/15/2031
| | NR | | | 991,240 |
| 1,000,000 | | Lebanon County, PA Health Facilities Authority, Hospital Revenue Bonds, 5.80% (Good Samaritan Hospital)/ (Original Issue Yield: 5.92%), 11/15/2022
| | BBB+/Baa1/NR | | | 1,036,700 |
| 2,000,000 | | Lehigh County, PA General Purpose Authority, Hospital Revenue Bonds (Series A), 5.25% (St. Lukes Hospital of Bethlehem)/(Original Issue Yield: 5.42%), 8/15/2023
| | BBB/Baa2/NR | | | 1,933,540 |
| 1,000,000 | | Lehigh-Northampton Airport Authority, Revenue Bonds (Series A), 6.00% (Lehigh Valley Airport System)/ (MBIA Insurance Corp. INS)/(Original Issue Yield: 6.02%), 5/15/2025
| | NR/Aaa/AAA | | | 1,108,690 |
| 2,500,000 | | Luzerne County, PA IDA, Revenue Refunding Bonds (Series A), 7.00% (Pennsylvania Gas & Water Co.)/ (AMBAC INS), 12/1/2017
| | AAA/Aaa/NR | | | 2,582,100 |
| 1,000,000 | | Luzerne County, PA, UT GO Bonds, 5.625% (FGIC INS)/ (Original Issue Yield: 5.78%), 12/15/2021
| | AAA/Aaa | | | 1,109,160 |
| 945,000 | | Lycoming County PA Authority, Hospital Lease Revenue Bonds (Series B), 6.50% (Divine Providence Hospital, PA)/ (Original Issue Yield: 6.70%), 7/1/2022
| | NR | | | 947,060 |
Principal
Amount
|
|
|
| Credit
Rating
| 1
|
| Value
|
| | | LONG-TERM MUNICIPALS--continued | | | | | |
| | | Pennsylvania--continued | | | | | |
| $ | 1,000,000 | | Lycoming County PA Authority, Hospital Revenue Bonds, 5.50% (Divine Providence Hospital, PA)/(AMBAC INS)/ (Original Issue Yield: 5.90%), 11/15/2022
| | AAA/NR/NR | | $ | 1,054,770 |
| 1,000,000 | | Monroe County, PA Hospital Authority, Hospital Revenue Bonds (Series 2002A), 5.50% (Pocono Medical Center)/ (Radian Asset Assurance INS)/(Original Issue Yield: 5.60%), 1/1/2022
| | AA/NR/NR | | | 1,059,250 |
| 2,360,000 | | Monroe County, PA Hospital Authority, Hospital Revenue Bonds (Series A), 5.125% (Pocono Medical Center)/ (U.S. Treasury PRF 7/1/2007@100)/(Original Issue Yield: 5.40%), 7/1/2015
| | AAA/Aaa/NR | | | 2,590,926 |
| 1,000,000 | | Monroe County, PA Hospital Authority, Revenue Bonds, 6.00% (Pocono Medical Center)/(Original Issue Yield: 6.17%), 1/1/2043
| | BBB+/NR/BBB+ | | | 1,022,480 |
| 1,250,000 | | Montgomery County, PA Higher Education & Health Authority Hospital, Revenue Bonds, 7.25% (Philadelphia Geriatric Center)/(Original Issue Yield: 7.472%), 12/1/2024
| | NR | | | 1,274,800 |
| 2,250,000 | | Montgomery County, PA IDA, Retirement Community Revenue Bonds (Series 1996B), 5.75% (Adult Communities Total Services, Inc.)/(Original Issue Yield: 5.98%), 11/15/2017
| | BBB+/NR/BBB+ | | | 2,299,073 |
| 1,000,000 | | Montgomery County, PA IDA, Retirement Community Revenue Refunding Bonds (Series 1996A), 5.875% (Adult Communities Total Services, Inc.)/(Original Issue Yield: 6.125%), 11/15/2022
| | BBB+/NR/BBB+ | | | 1,013,660 |
| 1,000,000 | | Mount Lebanon, PA Hospital Authority, Revenue Bonds (Series 2002A), 5.625% (St. Clair Memorial Hospital)/ (Original Issue Yield: 5.75%), 7/1/2032
| | A-/NR/A | | | 1,020,210 |
| 500,000 | | Mt. Pleasant Borough, PA Business District Authority, Hospital Revenue Bonds (Series 1997), 5.75% (Frick Hospital)/(Original Issue Yield: 5.85%), 12/1/2017
| | BBB/NR/ NR | | | 510,975 |
| 1,300,000 | | Mt. Pleasant Borough, PA Business District Authority, Hospital Revenue Bonds (Series 1997), 5.75% (Frick Hospital)/(Original Issue Yield: 5.90%), 12/1/2027
| | BBB/NR/ NR | | | 1,273,116 |
| 1,000,000 | | North Hills, PA School District, GO Bonds, (Series 2000), 5.50% (FGIC INS)/(Original Issue Yield: 5.576%), 7/15/2024
| | AAA/Aaa/AAA | | | 1,140,580 |
| 1,075,000 | | North Penn, PA School District, Refunding Revenue Bonds, 6.20% (Escrowed In Treasuries COL), 3/1/2007
| | NR/Aaa/NR | | | 1,150,476 |
| 1,000,000 | | Northumberland County PA IDA, Facilities Revenue Bonds (Series 2002B), 5.50% (NHS Youth Service, Inc.)/ (American Capital Access INS)/(Original Issue Yield: 5.80%), 2/15/2033
| | A/NR/ NR | | | 1,010,270 |
| 3,000,000 | | Norwin, PA School District, UT GO Bonds, 6.00% (FGIC INS)/(Original Issue Yield: 6.12%), 4/1/2024
| | AAA/Aaa/AAA | | | 3,480,330 |
Principal
Amount
|
|
|
| Credit
Rating
| 1
|
| Value
|
| | | LONG-TERM MUNICIPALS--continued | | | | | |
| | | Pennsylvania--continued | | | | | |
| $ | 115,000 | | Pennsylvania Convention Center Authority, Refunding Revenue Bonds (Series A), 6.25%, 9/1/2004
| | BBB/Baa2/A- | | $ | 115,000 |
| 1,000,000 | | Pennsylvania Convention Center Authority, Revenue Bonds, 6.70% (Escrowed In Treasuries COL)/(Original Issue Yield: 6.843%), 9/1/2016
| | AAA/Aaa/AAA | | | 1,236,330 |
| 1,000,000 | | Pennsylvania EDFA, Exempt Facilities Revenue Bonds (Series 1997B), 6.125% (National Gypsum Co.), 11/1/2027
| | NR | | | 1,000,910 |
| 1,500,000 | | Pennsylvania EDFA, Exempt Facilities Revenue Bonds (Series 2001A), 6.25% (Amtrak)/(Original Issue Yield: 6.40%), 11/1/2031
| | BBB/A3/NR | | | 1,532,415 |
| 2,500,000 | | Pennsylvania EDFA, Resource Recovery Revenue Bonds (Series A), 6.40% (Northampton Generating), 1/1/2009
| | BBB-/NR/BBB- | | | 2,553,000 |
| 2,000,000 | | Pennsylvania EDFA, Revenue Bonds (Series 1998A), 5.25% (Northwestern Human Services, Inc.)/(Original Issue Yield: 5.668%), 6/1/2028
| | BB+/NR/NR | | | 1,464,020 |
| 1,000,000 | | Pennsylvania EDFA, Revenue Bonds (Series 2000), 5.90% (Dr. Gertrude A. Barber Center, Inc.)/(Radian Asset Assurance INS), 12/1/2030
| | AA/NR/NR | | | 1,070,170 |
| 150,000 | | Pennsylvania HFA, Revenue Bonds (Series 1996-52B), 5.55% (FHA/VA mortgage GTD), 10/1/2012
| | AA+/Aa2/NR | | | 150,480 |
| 1,000,000 | | Pennsylvania HFA, SFM Revenue Bonds (Series 2001-72A), 5.25%, 4/1/2021
| | AA+/Aa2/NR | | | 1,037,060 |
| 100,000 | | Pennsylvania HFA, SFM Revenue Bonds (Series 41-B), 5.90%, 10/1/2005
| | AA+/Aa2/NR | | | 102,269 |
| 100,000 | | Pennsylvania HFA, SFM Revenue Bonds (Series 42), 5.90%, 10/1/2004
| | AA+/Aa2/NR | | | 100,293 |
| 975,000 | | Pennsylvania HFA, SFM Revenue Bonds, (Series 62A), 5.50%, 10/1/2022
| | AA+/Aa2/NR | | | 1,016,018 |
| 3,000,000 | | Pennsylvania HFA, SFM Revenue Bonds (Series 67A), 5.85%, 10/1/2018
| | AA+/Aa2/NR | | | 3,146,550 |
| 2,590,000 | | Pennsylvania State Higher Education Assistance Agency, Capital Acquisition Revenue Bonds, 6.125% (MBIA Insurance Corp. INS), 12/15/2019
| | AAA/Aaa/AAA | | | 3,050,424 |
| 2,000,000 | | Pennsylvania State Higher Education Facilities Authority, College and University Revenue Bonds, 5.625% (University of the Arts)/(Radian Asset Assurance INS)/ (Original Issue Yield: 5.78%), 3/15/2025
| | AA/NR/NR | | | 2,096,000 |
| 1,000,000 | | Pennsylvania State Higher Education Facilities Authority, Refunding Revenue Bonds, 5.25% (St. Joseph's University)/(Radian Asset Assurance INS), 12/15/2017
| | AA/NR/NR | | | 1,074,920 |
| 1,705,000 | | Pennsylvania State Higher Education Facilities Authority, Refunding Revenue Bonds, 5.375% (St. Joseph's University)/(Radian Asset Assurance INS), 12/15/2016
| | AA/NR/NR | | | 1,863,957 |
Principal
Amount
|
|
|
| Credit
Rating
| 1
|
| Value
|
| | | LONG-TERM MUNICIPALS--continued | | | | | |
| | | Pennsylvania--continued | | | | | |
| $ | 1,940,000 | | Pennsylvania State Higher Education Facilities Authority, Refunding Revenue Bonds, 5.50% (St. Joseph's University)/(Radian Asset Assurance INS), 12/15/2015
| | AA/NR/NR | | $ | 2,138,617 |
| 2,000,000 | | Pennsylvania State Higher Education Facilities Authority, Revenue Bonds (Series 1996), 7.20% (Thiel College)/ (U.S. Treasury PRF 5/16/2006@102), 5/15/2026
| | NR | | | 2,213,920 |
| 1,500,000 | | Pennsylvania State Higher Education Facilities Authority, Revenue Bonds (Series 2001A), 6.00% (UPMC Health System)/(Original Issue Yield: 6.10%), 1/15/2022
| | A/NR/A | | | 1,597,335 |
| 1,330,000 | | Pennsylvania State Higher Education Facilities Authority, Revenue Bonds (Series 2003A), 5.25% (Clarion University Foundation, Inc.)/(XL Capital Assurance Inc. INS), 7/1/2018
| | AAA/Aaa/AAA | | | 1,446,934 |
| 1,490,000 | | Pennsylvania State Higher Education Facilities Authority, Revenue Bonds (Series 2003AA1), 5.25% (Dickinson College)/(Radian Asset Assurance INS), 11/1/2018
| | AA/NR/AA | | | 1,591,558 |
| 1,160,000 | | Pennsylvania State Higher Education Facilities Authority, Revenue Bonds (Series AA2), 5.25% (Lycoming College)/ (Radian Asset Assurance INS), 11/1/2024
| | AA/NR/AA | | | 1,203,500 |
| 2,000,000 | | Pennsylvania State Higher Education Facilities Authority, Revenue Bonds (Series N), 5.875% (MBIA Insurance Corp. INS)/(Original Issue Yield: 5.913%), 6/15/2021
| | AAA/Aaa/AAA | | | 2,145,340 |
| 1,000,000 | | Pennsylvania State Higher Education Facilities Authority, Revenue Bonds, 5.25% (Widener University)/(Original Issue Yield: 5.42%), 7/15/2024
| | BBB+/NR/A- | | | 1,021,630 |
| 3,400,000 | | Pennsylvania State Higher Education Facilities Authority, Revenue Bonds, 4.65% (Philadelphia College of Osteopathic Medicine)/(Original Issue Yield: 4.77%), 12/1/2028
| | A/NR/NR | | | 3,260,838 |
| 2,000,000 | | Pennsylvania State Higher Education Facilities Authority, Revenue Bonds, 5.25% (St. Joseph's University)/(Radian Asset Assurance INS), 12/15/2018
| | AA/NR/NR | | | 2,139,220 |
| 1,250,000 | | Pennsylvania State Higher Education Facilities Authority, Revenue Bonds, 5.25% (Ursinus College)/(Radian Asset Assurance INS), 1/1/2027
| | AA/NR/AA | | | 1,283,688 |
| 2,495,000 | | Pennsylvania State Higher Education Facilities Authority, Revenue Bonds, 6.25% (Philadelphia University)/(Radian Asset Assurance INS), 6/1/2024
| | AA/NR/NR | | | 2,838,262 |
| 1,500,000 | | Pennsylvania State Higher Education Facilities Authority, Revenue Bonds, (Series A), 6.00% (UPMC Health System)/(Original Issue Yield: 6.16%), 1/15/2031
| | A/NR/A | | | 1,583,400 |
| 1,500,000 | | Pennsylvania State Higher Education Facilities Authority, Student Housing Revenue Bonds (Series 2003A), 5.00% (California University of Pennsylvania)/(American Capital Access INS)/(Original Issue Yield: 5.08%), 7/1/2023
| | A/NR/NR | | | 1,487,250 |
Principal
Amount
|
|
|
| Credit
Rating
| 1
|
| Value
|
| | | LONG-TERM MUNICIPALS--continued | | | | | |
| | | Pennsylvania--continued | | | | | |
| $ | 1,500,000 | | Pennsylvania State Higher Education Facilities Authority, University Revenue Bonds (Series 1997), 5.45% (University of the Arts)/(Radian Asset Assurance INS)/ (Original Issue Yield: 5.58%), 3/15/2017
| | AA/NR/NR | | $ | 1,545,195 |
| 1,500,000 | | Pennsylvania State IDA, EDRBs (Series 2002), 5.50% (AMBAC INS), 7/1/2020
| | AAA/Aaa/AAA | | | 1,665,750 |
| 3,000,000 | | Pennsylvania State IDA, EDRBs, 5.50% (AMBAC INS), 7/1/2013
| | AAA/Aaa/AAA | | | 3,435,120 |
| 650,000 | | Pennsylvania State Public School Building Authority, Revenue Bonds, 5.00% (Lehigh Career & Technical Institute)/(FGIC INS), 10/1/2022
| | NR/Aaa/AAA | | | 681,636 |
| 2,120,000 | | Philadelphia, PA Authority for Industrial Development, Lease Revenue Bonds (Series 2001B), 5.50% (FSA INS), 10/1/2021
| | AAA/Aaa/AAA | | | 2,336,070 |
| 3,000,000 | | Philadelphia, PA Authority for Industrial Development, Revenue Bonds (Series 2001B), 5.25% (Philadelphia Corporation for Aging Project)/(AMBAC INS)/(Original Issue Yield: 5.43%), 7/1/2023
| | AAA/Aaa/AAA | | | 3,165,720 |
| 1,655,000 | | Philadelphia, PA Hospitals & Higher Education Facilities Authority, Hospital Revenue Bonds (Series 1997), 5.75% (Jeanes Hospital, PA)/(Original Issue Yield: 5.80%), 7/1/2008
| | BBB/Baa2/NR | | | 1,734,407 |
| 1,120,000 | | Philadelphia, PA Redevelopment Authority, Multifamily Housing Refunding Revenue Bonds (Series 1998), 5.45% (Woodstock Mutual Homes, Inc.)/(FHA INS)/(Original Issue Yield: 5.468%), 2/1/2023
| | NR/Aa2/NR | | | 1,153,723 |
| 2,000,000 | | Philadelphia, PA Redevelopment Authority, Revenue Bonds (Series 2002A), 5.50% (FGIC INS), 4/15/2018
| | AAA/Aaa/AAA | | | 2,243,880 |
| 950,000 | | Philadelphia, PA Redevelopment Authority, Revenue Bonds (Series 2002A), 5.50% (FGIC INS), 4/15/2019
| | AAA/Aaa/AAA | | | 1,063,098 |
| 1,250,000 | | Philadelphia, PA Redevelopment Authority, Revenue Bonds (Series 2003A), 5.50% (Beech Student Housing Complex)/(American Capital Access INS), 7/1/2019
| | A/NR/NR | | | 1,313,863 |
| 1,000,000 | | Philadelphia, PA Redevelopment Authority, Revenue Bonds (Series 2003A), 5.625% (Beech Student Housing Complex)/(American Capital Access INS), 7/1/2023
| | A/NR/NR | | | 1,042,480 |
| 1,000,000 | | Philadelphia, PA School District, UT GO Bonds (Series 2002B), 5.625% (FGIC INS), 8/1/2022
| | AAA/Aaa/AAA | | | 1,094,040 |
| 9,500,000 | | Philadelphia, PA, Airport Revenue Bonds (Series 1997B), 5.50% (Philadelphia Airport System)/(AMBAC INS)/ (Original Issue Yield: 5.65%), 6/15/2017
| | AAA/Aaa/AAA | | | 10,205,090 |
| 480,000 | | Philadelphia, PA, Revenue Bonds, 10.875% (United States Treasury PRF), 7/1/2008 (@100)
| | NR/Aaa/NR | | | 515,798 |
Principal
Amount
|
|
|
| Credit
Rating
| 1
|
| Value
|
| | | LONG-TERM MUNICIPALS--continued | | | | | |
| | | Pennsylvania--continued | | | | | |
| $ | 2,880,000 | | Pittsburgh, PA Public Parking Authority, Parking Revenue Bonds (Series 2000), 6.00% (AMBAC INS)/(Original Issue Yield: 6.02%), 12/1/2020
| | AAA/Aaa/AAA | | $ | 3,280,838 |
| 765,000 | | Pittsburgh, PA Urban Redevelopment Authority, Mortgage Revenue Bonds (Series 1997A), 6.15%, 10/1/2016
| | AAA/Aa1/NR | | | 806,203 |
| 355,000 | | Pittsburgh, PA Urban Redevelopment Authority, Mortgage Revenue Bonds (Series 1997C), 5.35%, 10/1/2009
| | AAA/Aa1/NR | | | 378,132 |
| 1,075,000 | | Pittsburgh, PA Urban Redevelopment Authority, Mortgage Revenue Bonds (Series 1997C), 5.90%, 10/1/2022
| | AAA/Aa1/NR | | | 1,125,117 |
| 2,855,000 | | Pittsburgh, PA, LT GO Bonds (Series 1999A), 5.75% (FGIC INS)/(Original Issue Yield: 5.852%), 9/1/2019
| | AAA/Aaa/AAA | | | 3,234,744 |
| 5,000,000 | 2,3 | Pittsburgh, PA, RITES (Series PA 961), 9.426% (AMBAC INS), 9/1/2015
| | NR | | | 6,018,150 |
| 1,500,000 | | Pittsburgh, PA, UT GO Bonds (Series 1999A), 5.75% (FGIC INS)/(Original Issue Yield: 5.94%), 9/1/2024
| | AAA/Aaa/AAA | | | 1,699,515 |
| 3,950,000 | | Pottsville, PA Hospital Authority, Hospital Revenue Bonds, 5.625% (Pottsville Hospital and Warne Clinic)/(Original Issue Yield: 5.75%), 7/1/2024
| | BBB-/NR/NR | | | 3,527,034 |
| 2,165,000 | | Radnor Township, PA, UT GO Bonds (Series 2004AA), 5.125%, 7/15/2027
| | NR/Aa1/NR | | | 2,253,917 |
| 2,040,000 | | Riverside, PA School District, UT GO Bonds, 5.50% (FGIC INS)/(Original Issue Yield: 5.57%), 10/15/2020
| | AAA/Aaa/AAA | | | 2,329,721 |
| 1,500,000 | | Sayre, PA, Health Care Facilities Authority, Revenue Bonds (Series 2002A), 5.75% (Guthrie Healthcare System, PA)/ (Original Issue Yield: 5.90%), 12/1/2021
| | A-/NR/BBB+ | | | 1,573,710 |
| 1,000,000 | | Sayre, PA, Health Care Facilities Authority, Revenue Bonds (Series 2002A), 5.875% (Guthrie Healthcare System, PA)/ (Original Issue Yield: 6.00%), 12/1/2031
| | A-/NR/BBB+ | | | 1,034,890 |
| 1,000,000 | | Scranton, PA, UT GO Bonds (Series 2001C), 7.10% (U. S. Treasury PRF 9/1/2011@100)/(Original Issue Yield: 7.35% 9/1/2011), 9/1/2031
| | NR | | | 1,226,810 |
| 935,000 | | Shaler, PA School District Authority, UT GO Bonds, 6.25% (Escrowed In Treasuries COL), 4/15/2008
| | AAA/NR/NR | | | 1,009,884 |
| 2,000,000 | | Somerset County, PA Hospital Authority, Hospital Refunding Revenue Bonds (Series 1997B), 5.375% (Somerset Community Hospital)/(Radian Asset Assurance INS)/(Original Issue Yield: 5.68%), 3/1/2017
| | AA/NR/NR | | | 2,090,780 |
| 3,000,000 | | Southcentral Pennsylvania General Authority, Revenue Bonds (Series 2001), 5.625% (Wellspan Health Obligated Group), 5/15/2026
| | NR/Aa3/AA- | | | 3,142,860 |
| 2,000,000 | | Southeastern, PA Transportation Authority, Special Revenue Bonds, 5.375% (FGIC INS)/(Original Issue Yield: 5.70%), 3/1/2017
| | AAA/Aaa/AAA | | | 2,172,840 |
Principal
Amount
|
|
|
| Credit
Rating
| 1
|
| Value
|
| | | LONG-TERM MUNICIPALS--continued | | | | | |
| | | Pennsylvania--continued | | | | | |
| $ | 500,000 | | St. Mary Hospital Authority, PA, Health System Revenue Bonds (Series 2004A), 5.00% (Catholic Health East)/ (Original Issue Yield: 5.15%), 11/15/2021
| | A/A2/A+ | | $ | 507,395 |
| 805,000 | | State Public School Building Authority, PA, Revenue Bonds, 5.25% (U.S. Treasury PRF)(Conneaut School District Project)/(Escrowed In Treasuries COL), 11/1/2011
| | AAA/Aaa/NR | | | 912,001 |
| 455,000 | | State Public School Building Authority, PA, Unrefunded Balance, 5.25% (Conneaut School District Project)/ (FGIC INS), 11/1/2011
| | AAA/Aaa/AAA | | | 514,946 |
| 1,000,000 | 2,3 | Susquehanna, PA Area Regional Airport Authority, Airport Facilities Revenue Bonds (Series 1999), 5.50% (Aero Harrisburg)/(Original Issue Yield: 5.85%), 1/1/2024
| | NR | | | 873,820 |
| 1,245,000 | | Union County, PA Higher Educational Facilities Financing Authority, Revenue Bonds (Series 2002A), 5.25% (Bucknell University), 4/1/2021
| | NR/Aa3/NR | | | 1,343,467 |
| 1,665,000 | | Union County, PA Higher Educational Facilities Financing Authority, Revenue Bonds (Series 2002A), 5.25% (Bucknell University), 4/1/2022
| | NR/Aa3/NR | | | 1,786,728 |
| 1,250,000 | | Union County, PA Hospital Authority, Revenue Bonds, 5.25% (Evangelical Community Hospital)/(Radian Asset Assurance INS), 8/1/2024
| | AA/NR/NR | | | 1,295,413 |
| 1,000,000 | | Warren County, PA Hospital Authority, Revenue Bonds (Series A), 7.00% (Warren General Hospital, PA)/(Original Issue Yield: 7.101%), 4/1/2019
| | BBB/NR/NR | | | 1,017,130 |
| 400,000 | | Washington County, PA Authority, Lease Revenue Bonds, 7.875% (Escrowed In Treasuries COL), 12/15/2018
| | AAA/Aaa/NR | | | 563,372 |
| 1,885,000 | | West Shore, PA Area Hospital Authority, Revenue Bonds, 6.15% (Holy Spirit Hospital), 1/1/2020
| | BBB+/NR/NR | | | 1,983,133 |
| 1,000,000 | | West Shore, PA Area Hospital Authority, Revenue Bonds, 6.25% (Holy Spirit Hospital)/(Original Issue Yield: 6.30%), 1/1/2032
| | BBB+/NR/NR | | | 1,030,990 |
| 1,000,000 | | West View, PA Municipal Authority, Special Obligation Bonds, 9.50% (Escrowed In Treasuries COL), 11/15/2014
| | AAA/Aaa/NR | | | 1,368,660 |
| 1,000,000 | | Westmoreland County, PA IDA, Health Care Facility Revenue Bonds (Series 2000B), 8.00% (Redstone Presbyterian Senior Care Obligated Group)/(Original Issue Yield: 8.25%), 11/15/2023
| | NR | | | 1,075,290 |
| 235,000 | | Westmoreland County, PA Municipal Authority, Special Obligation Bonds, 9.125% (Escrowed In Treasuries COL), 7/1/2010
|
| AAA/Aaa/NR
|
|
| 269,026
|
| | | TOTAL
|
|
|
|
| 257,441,488
|
Principal
Amount
|
|
|
| Credit
Rating
| 1
|
| Value
|
| | | LONG-TERM MUNICIPALS--continued | | | | | |
| | | Puerto Rico--2.0% | | | | | |
| $ | 2,000,000 | 2,3 | Puerto Rico Electric Power Authority, Drivers (Series 266), 9.486% (FSA INS), 7/1/2015
| | AAA/NR/NR | | $ | 2,678,560 |
| 1,000,000 | 2,3 | Puerto Rico Highway and Transportation Authority, RITES (Series PA 331A), 9.485% (AMBAC INS), 1/1/2010
| | NR | | | 1,320,540 |
| 1,000,000 | 2,3 | Puerto Rico Highway and Transportation Authority, RITES (Series PA 331B), 9.482% (AMBAC INS), 1/1/2011
|
| NR
|
|
| 1,330,270
|
| | | TOTAL
|
|
|
|
| 5,329,370
|
| | | Virgin Islands--0.0% | | | | | |
| 50,000 | | Virgin Islands HFA, SFM Revenue Refunding Bonds (Series A), 5.80% (GNMA COL), 3/1/2005
|
| AAA/NR/NR
|
|
| 50,782
|
| | | TOTAL LONG-TERM MUNICIPALS (IDENTIFIED COST $247,186,929)
|
|
|
|
| 262,821,640
|
| | | SHORT-TERM MUNICIPAL--0.3% | | | | | |
| | | Puerto Rico--0.3% | | | | | |
| 900,000 | | Puerto Rico Government Development Bank (GDB) Weekly VRDNs (MBIA Insurance Corp. INS)/(Credit Suisse First Boston LIQ) (AT AMORTIZED COST)
|
| AAA/Aaa/AAA
|
|
| 900,000
|
| | | TOTAL INVESTMENTS--99.2%
(IDENTIFIED COST $248,086,929) 4
|
|
|
|
| 263,721,640
|
| | | OTHER ASSETS AND LIABILITIES - NET--0.8%
|
|
|
|
| 2,049,469
|
| | | TOTAL NET ASSETS--100%
|
|
|
| $
| 265,771,109
|
Securities that are subject to the federal alternative minimum tax (AMT) represent 16.1% of the Fund's portfolio as calculated based upon total portfolio market value, (percentage is unaudited).
1 Please refer to the Statement of Additional Information for an explanation of the credit ratings. Current credit ratings are unaudited.
2 Denotes a restricted security, including securities purchased under Rule 144A of the Securities Act of 1933. These securities, unless registered under the Act or exempted from registration, may only be sold to qualified institutional investors. At August 31, 2004, these securities amounted to $15,059,999 which represents 5.7% of total net assets.
3 Denotes a restricted security, including securities purchased under Rule 144A that have been deemed liquid by criteria approved by the Fund's Board of Trustees. At August 31, 2004, these securities amounted to $15,059,999 which represents 5.7% of total net assets.
4 The cost of investments for federal tax purposes amounts to $248,063,707.
Note: The categories of investments are shown as a percentage of total net assets at August 31, 2004.
The following acronyms are used throughout this portfolio:
| AMBAC | - --American Municipal Bond Assurance Corporation |
| COL | - --Collateralized |
| EDFA | - --Economic Development Financing Authority |
| EDRBs | - --Economic Development Revenue Bonds |
| FGIC | - --Financial Guaranty Insurance Company |
| FHA | - --Federal Housing Administration |
| FHA/VA | - --Federal Housing Administration/Veterans Administration |
| FSA | - --Financial Security Assurance |
| GNMA | - --Government National Mortgage Association |
| GO | - --General Obligation |
| GTD | - --Guaranteed |
| HDA | - --Hospital Development Authority |
| HEFA | - --Health and Education Facilities Authority |
| HFA | - --Housing Finance Authority |
| IDA | - --Industrial Development Authority |
| INS | - --Insured |
| LIQ | - --Liquidity Agreement |
| LOC(s) | - --Letter(s) of Credit |
| LT | - --Limited Tax |
| PRF | - --Prerefunded |
| RITES | - --Residual Interest Tax-Exempt Securities |
| SFM | - --Single Family Mortgage |
| TOBs | - --Tender Option Bonds |
| UT | - --Unlimited Tax |
| VRDNs | - --Variable Rate Demand Notes |
See Notes which are an integral part of the Financial Statements
Statement of Assets and Liabilities
August 31, 2004
Assets:
| | | | | | | | |
Total investments in securities, at value (identified cost $248,086,929)
| | | | | | $ | 263,721,640 | |
Cash
| | | | | | | 88,533 | |
Income receivable
| | | | | | | 4,079,180 | |
Receivable for investments sold
| | | | | | | 95,000 | |
Receivable for shares sold
|
|
|
|
|
|
| 557,798
|
|
TOTAL ASSETS
|
|
|
|
|
|
| 268,542,151
|
|
Liabilities:
| | | | | | | | |
Payable for investments purchased
| | $ | 2,017,624 | | | | | |
Payable for shares redeemed
| | | 47,833 | | | | | |
Income distribution payable
| | | 452,750 | | | | | |
Payable for distribution services fee (Note 5)
| | | 41,637 | | | | | |
Payable for shareholder services fee (Note 5)
| | | 52,603 | | | | | |
Payable for daily variation margin
| | | 110,685 | | | | | |
Accrued expenses
|
|
| 47,910
|
|
|
|
|
|
TOTAL LIABILITIES
|
|
|
|
|
|
| 2,771,042
|
|
Net assets for 22,694,251 shares outstanding
|
|
|
|
|
| $
| 265,771,109
|
|
Net Assets Consist of:
| | | | | | | | |
Paid-in capital
| | | | | | $ | 258,694,761 | |
Net unrealized appreciation of investments
| | | | | | | 15,634,711 | |
Accumulated net realized loss on investments, futures contracts and swap contracts
| | | | | | | (8,583,522 | ) |
Undistributed net investment income
|
|
|
|
|
|
| 25,159
|
|
TOTAL NET ASSETS
|
|
|
|
|
| $
| 265,771,109
|
|
Net Asset Value, Offering Price and Redemption Proceeds Per Share
| | | | | | | | |
Class A Shares:
| | | | | | | | |
Net asset value per share ($200,022,723 ÷ 17,079,556 shares outstanding), no par value, unlimited shares authorized
|
|
|
|
|
|
| $11.71
|
|
Offering price per share (100/95.50 of $11.71) 1
|
|
|
|
|
|
| $12.26
|
|
Redemption proceeds per share
|
|
|
|
|
|
| $11.71
|
|
Class B Shares:
| | | | | | | | |
Net asset value per share ($65,748,386 ÷ 5,614,695 shares outstanding), no par value, unlimited shares authorized
|
|
|
|
|
|
| $11.71
|
|
Offering price per share
|
|
|
|
|
|
| $11.71
|
|
Redemption proceeds per share (94.50/100 of $11.71) 1
|
|
|
|
|
|
| $11.07
|
|
1 See "What Do Shares Cost?" in the Prospectus.
See Notes which are an integral part of the Financial Statements
Statement of Operations
Year Ended August 31, 2004
Investment Income:
| | | | | | | | | | | | |
Interest
|
|
|
|
|
|
|
|
|
| $
| 14,800,832
|
|
Expenses:
| | | | | | | | | | | | |
Investment adviser fee (Note 5)
| | | | | | $ | 1,100,076 | | | | | |
Administrative personnel and services fee (Note 5)
| | | | | | | 217,744 | | | | | |
Custodian fees
| | | | | | | 13,606 | | | | | |
Transfer and dividend disbursing agent fees and expenses (Note 5)
| | | | | | | 118,380 | | | | | |
Directors'/Trustees' fees
| | | | | | | 3,775 | | | | | |
Auditing fees
| | | | | | | 15,976 | | | | | |
Legal fees
| | | | | | | 7,098 | | | | | |
Portfolio accounting fees (Note 5)
| | | | | | | 99,709 | | | | | |
Distribution services fee-- Class B Shares (Note 5)
| | | | | | | 520,592 | | | | | |
Shareholder services fee-- Class A Shares (Note 5)
| | | | | | | 514,017 | | | | | |
Shareholder services fee-- Class B Shares (Note 5)
| | | | | | | 173,531 | | | | | |
Share registration costs
| | | | | | | 45,822 | | | | | |
Printing and postage
| | | | | | | 34,032 | | | | | |
Insurance premiums
| | | | | | | 8,899 | | | | | |
Miscellaneous
|
|
|
|
|
|
| 5,128
|
|
|
|
|
|
TOTAL EXPENSES
|
|
|
|
|
|
| 2,878,385
|
|
|
|
|
|
Waivers (Note 5):
| | | | | | | | | | | | |
Waiver of investment adviser fee
| | $ | (214,431 | ) | | | | | | | | |
Waiver of administrative personnel and services fee
| | | (8,651 | ) | | | | | | | | |
Waiver of transfer and dividend disbursing agent fees and expenses
| | | (3,590 | ) | | | | | | | | |
Waiver of shareholder services fee--Class A Shares
|
|
| (41,121
| )
|
|
|
|
|
|
|
|
|
TOTAL WAIVERS
|
|
|
|
|
|
| (267,793
| )
|
|
|
|
|
Net expenses
|
|
|
|
|
|
|
|
|
|
| 2,610,592
|
|
Net investment income
|
|
|
|
|
|
|
|
|
|
| 12,190,240
|
|
Realized and Unrealized Gain (Loss) on Investments, Futures Contracts and Swap Contracts:
| | | | | | | | | | | | |
Net realized loss on investments
| | | | | | | | | | | (69,465 | ) |
Net realized loss on futures contracts
| | | | | | | | | | | (672,369 | ) |
Net realized loss on swaps contracts
| | | | | | | | | | | (1,720,213 | ) |
Net change in unrealized appreciation of investments
| | | | | | | | | | | 7,379,124 | |
Net change in unrealized appreciation of swap contracts
|
|
|
|
|
|
|
|
|
|
| (224,832
| )
|
Net realized and unrealized gain on investments, futures contracts and swap contracts
|
|
|
|
|
|
|
|
|
|
| 4,692,245
|
|
Change in net assets resulting from operations
|
|
|
|
|
|
|
|
|
| $
| 16,882,485
|
|
See Notes which are an integral part of the Financial Statements
statement of Changes in Net Assets
Year Ended August 31
|
|
| 2004
|
|
|
| 2003
|
|
Increase (Decrease) in Net Assets
| | | | | | | | |
Operations:
| | | | | | | | |
Net investment income
| | $ | 12,190,240 | | | $ | 12,417,747 | |
Net realized gain (loss) on investments, futures contracts and swap contracts
| | | (2,462,047 | ) | | | 452,109 | |
Net change in unrealized appreciation/depreciation of investments, futures contracts, and swap contracts
|
|
| 7,154,292
|
|
|
| (5,568,484
| )
|
CHANGE IN NET ASSETS RESULTING FROM OPERATIONS
|
|
| 16,882,485
|
|
|
| 7,301,372
|
|
Distributions to Shareholders:
| | | | | | | | |
Distributions from net investment income
| | | | | | | | |
Class A Shares
| | | (9,314,438 | ) | | | (9,930,586 | ) |
Class B Shares
|
|
| (2,613,590
| )
|
|
| (2,643,371
| )
|
CHANGE IN NET ASSETS RESULTING FROM DISTRIBUTIONS TO SHAREHOLDERS
|
|
| (11,928,028
| )
|
|
| (12,573,957
| )
|
Share Transactions:
| | | | | | | | |
Proceeds from sale of shares
| | | 45,948,540 | | | | 80,577,115 | |
Net asset value of shares issued to shareholders in payment of distributions declared
| | | 6,331,273 | | | | 6,421,390 | |
Cost of shares redeemed
|
|
| (72,231,286
| )
|
|
| (68,362,899
| )
|
CHANGE IN NET ASSETS RESULTING FROM SHARE TRANSACTIONS
|
|
| (19,951,473
| )
|
|
| 18,635,606
|
|
Change in net assets
|
|
| (14,997,016
| )
|
|
| 13,363,021
|
|
Net Assets:
| | | | | | | | |
Beginning of period
|
|
| 280,768,125
|
|
|
| 267,405,104
|
|
End of period (including undistributed (distributions in excess of) net investment income of $25,159 and $(233,167), respectively)
|
| $
| 265,771,109
|
|
| $
| 280,768,125
|
|
See Notes which are an integral part of the Financial Statements
Notes to Financial Statements
August 31, 2004
1. ORGANIZATION
Federated Municipal Securities Income Trust (the "Trust") is registered under the Investment Company Act of 1940, as amended (the "Act"), as an open-end, management investment company. The Trust consists of seven portfolios. The financial statements included herein are only those of Federated Pennsylvania Municipal Income Fund (the "Fund"), a non-diversified portfolio. The financial statements of the other portfolios are presented separately. The assets of each portfolio are segregated and a shareholder's interest is limited to the portfolio in which shares are held. The investment objective of the Fund is to provide current income exempt from federal regular income tax (federal regular income tax does not include the federal AMT) and the personal income taxes imposed by the state of Pennsylvania and Pennsylvania municipalities. The Fund offers two classes of shares: Class A Shares and Class B Shares.
2. SIGNIFICANT ACCOUNTING POLICIES
The following is a summary of significant accounting policies consistently followed by the Fund in the preparation of its financial statements. These policies are in conformity with generally accepted accounting principles (GAAP) in the United States of America.
Investment Valuation
Municipal bonds are valued by an independent pricing service, taking into consideration yield, liquidity, risk, credit quality, coupon, maturity, type of issue, and any other factors or market data the pricing service deems relevant. Short-term securities are valued at the prices provided by an independent pricing service. However, short-term securities with remaining maturities of 60 days or less at the time of purchase may be valued at amortized cost, which approximates fair market value. Securities for which no quotations are readily available are valued at fair value as determined in accordance with procedures established by and under general supervision of the Board of Trustees (the "Trustees").
Investment Income, Gains and Losses, Expenses and Distributions
Interest income and expenses are accrued daily. Dividend income and distributions to shareholders are recorded on the ex-dividend date. Non-cash dividends included in dividend income, if any, are recorded at fair value. Investment income, realized and unrealized gains and losses and certain fund-level expenses are allocated to each class based on relative average daily net assets, except that each class bears certain expenses unique to that class such as distribution and shareholder services fees. Dividends are declared separately for each class. No class has preferential dividend rights; differences in per share dividend rates are generally due to differences in separate class expenses.
Premium and Discount Amortization
All premiums and discounts on fixed-income securities are amortized/accreted for financial statement purposes.
Federal Taxes
It is the Fund's policy to comply with the Subchapter M provision of the Internal Revenue Code (the "Code") and to distribute to shareholders each year substantially all of its income. Accordingly, no provision for federal income tax is necessary.
When-Issued and Delayed Delivery Transactions
The Fund may engage in when-issued or delayed delivery transactions. The Fund records when-issued securities on the trade date and maintains security positions such that sufficient liquid assets will be available to make payment for the securities purchased. Securities purchased on a when-issued or delayed delivery basis are marked to market daily and begin earning interest on the settlement date. Losses may occur on these transactions due to changes in market conditions or the failure of counterparties to perform under the contract.
Swap Contracts
The Fund may enter into swap contracts. A swap is an exchange of cash payments between the Fund and another party, which is based on a specific financial index. The value of the swap is adjusted daily and the change in value is recorded as unrealized appreciation or depreciation. When a swap contract is closed, the Fund recognizes a realized gain or loss. The swap contracts entered into by the Fund are on a forward settling basis. For the year ended August 31, 2004, the Fund had realized losses on swap contracts of $1,720,213.
Risks may arise upon entering into these agreements from the potential inability of the counterparties to meet the terms of their contract and from unanticipated changes in the value of the financial index on which the swap agreement is based. The Fund uses swaps for hedging purposes to reduce its exposure to interest rate fluctuations.
At August 31, 2004, the Fund has no open swap contracts.
Futures Contracts
The Fund periodically may sell bond interest rate futures contracts to manage duration, and to potentially reduce transaction costs. Upon entering into a bond interest rate futures contract with a broker, the Fund is required to deposit in a segregated account a specified amount of cash or U.S. government securities. Futures contracts are valued daily and unrealized gains or losses are recorded in a "variation margin" account. Daily, the Fund receives from or pays to the broker a specified amount of cash based upon changes in the variation margin account. When a contract is closed, the Fund recognizes a realized gain or loss. Futures contracts have market risks, including the risk that the change in the value of the contract may not correlate with changes in the value of the underlying securities. For the year ended August 31, 2004, the Fund had realized losses on futures contracts of $672,369.
At August 31, 2004, the Fund has no open futures contracts.
Restricted Securities
Restricted securities are securities that may only be resold upon registration under federal securities laws or in transactions exempt from such registration. In some cases, the issuer of restricted securities has agreed to register such securities for resale, at the issuer's expense either upon demand by the Fund or in connection with another registered offering of the securities. Many restricted securities may be resold in the secondary market in transactions exempt from registration. Such restricted securities may be determined to be liquid under criteria established by the Trustees. The Fund will not incur any registration costs upon such resales. The Fund's restricted securities are valued at the price provided by dealers in the secondary market or, if no market prices are available, at the fair value as determined in accordance with procedures established by and under general supervision of the Trustees.
Additional information on restricted securities, including securities purchased under Rule 144A that have not been deemed liquid by the Trustees, for each security held at August 31, 2004, is as follows:
Security
|
| Acquisition Date
|
| Acquisition Cost
|
Alleghany County, PA IDA, Cargo Facilities Lease Revenue Bonds (Series 1999), 6.00% (AFCO Cargo PIT LLC Project), 9/1/2009
|
| 9/23/1999
|
| $ 575,000
|
Alleghany County, PA IDA, Cargo Facilities Lease Revenue Bonds (Series 1999), 6.625% (AFCO Cargo PIT LLC Project)/(Original Issue Yield: 6.75%), 9/1/2024
|
| 9/23/1999
|
| $ 984,950
|
Delaware Valley, PA Regional Finance Authority, RITES (PA-1029R), 9.975%, 7/1/2017
|
| 6/18/2002
|
| $1,226,540
|
Pittsburgh, PA, RITES (Series PA 961), 9.426% (AMBAC INS), 9/1/2015
|
| 1/16/2002
|
| $5,849,200
|
Puerto Rico Electric Power Authority, Drivers (Series 266), 9.486% (FSA INS), 7/1/2015
|
| 6/27/2002
|
| $2,418,108
|
Puerto Rico Highway and Transportation Authority, RITES (Series PA 331A), 9.485% (AMBAC INS), 1/1/2010
|
| 3/03/1998
|
| $1,128,337
|
Puerto Rico Highway and Transportation Authority, RITES (Series PA 331B), 9.482% (AMBAC INS), 1/1/2011
|
| 3/03/1998
|
| $1,127,896
|
Susquehanna, PA Area Regional Airport Authority, Airport Facilities Revenue Bonds (Series 1999), 5.50% (Aero Harrisburg)/(Original Issue Yield: 5.85%), 1/1/2024
|
| 04/14/1999
|
| $ 954,500
|
Use of Estimates
The preparation of financial statements in conformity with GAAP requires management to make estimates and assumptions that affect the amounts of assets, liabilities, expenses and revenues reported in the financial statements. Actual results could differ from those estimated.
Other
Investment transactions are accounted for on a trade date basis. Realized gains and losses from investment transactions are recorded on an identified cost basis.
3. SHARES OF BENEFICIAL INTEREST
The following table summarizes share activity:
Year Ended August 31
|
| 2004
|
| 2003
|
Class A Shares:
|
| Shares
|
|
|
| Amount
|
|
| Shares
|
|
|
| Amount
|
|
Shares sold
| | 3,429,994 | | | $ | 40,251,587 | | | 4,978,863 | | | $ | 58,514,269 | |
Shares issued to shareholders in payment of distributions declared
|
| 405,085 | | | | 4,737,780 | |
|
417,027 | |
| |
4,887,159 | |
Shares redeemed
|
| (5,042,726
| )
|
|
| (59,139,421
| )
|
| (4,697,457
| )
|
|
| (54,935,845
| )
|
NET CHANGE RESULTING FROM CLASS A SHARE TRANSACTIONS
|
| (1,207,647
| )
|
| $
| (14,150,054
| )
|
|
698,433
|
|
|
$
|
8,465,583
|
|
| | | | | | | | | | | | | | |
Year Ended August 31
|
| 2004
|
| 2003
|
Class B Shares:
|
| Shares
|
|
|
| Amount
|
|
| Shares
|
|
|
| Amount
|
|
Shares sold
| | 485,452 | | | $ | 5,696,953 | | | 1,871,222 | | | $ | 22,062,846 | |
Shares issued to shareholders in payment of distributions declared
|
| 136,271 | | | | 1,593,493 | |
|
130,940 | |
|
|
1,534,231 | |
Shares redeemed
|
| (1,120,327
| )
|
|
| (13,091,865
| )
|
| (1,146,167
| )
|
|
| (13,427,054
| )
|
NET CHANGE RESULTING FROM CLASS B SHARE TRANSACTIONS
|
| (498,604
| )
|
| $
| (5,801,419
| )
|
|
855,995
|
|
|
$
|
10,170,023
|
|
NET CHANGE RESULTING FROM SHARE TRANSACTIONS
|
| (1,706,251
| )
|
|
$
|
(19,951,473
| )
|
|
1,554,428
|
|
|
$
|
18,635,606
|
|
4. FEDERAL TAX INFORMATION
The timing and character of income and capital gain distributions are determined in accordance with income tax regulations which may differ from GAAP. These differences are due in part to differing treatments for discount accretion/premium amortization of debt securities. For the year ended August 31, 2004, permanent differences identified and reclassified among the components of net assets were as follows:
Increase (Decrease)
|
Undistributed Net
Investment Income (Loss)
|
| Accumulated Net
Realized Gains (Losses)
|
$(3,886)
|
| $3,886
|
Net investment income (loss), net realized gain (losses) and net assets were not affected by this reclassification.
The tax character of distributions as reported on the Statement of Changes in Net Assets for the years ended August 31, 2004, and 2003, was as follows:
|
| 2004
|
| 2003
|
Tax-exempt income
|
| $11,928,028
|
| $12,573,957
|
As of August 31, 2004, the components of distributable earnings on a tax basis were as follows:
Undistributed tax-exempt income
|
| $
| 1,003,756
|
Unrealized appreciation
|
| $
| 15,657,933
|
Capital loss carryforward
|
| $
| 6,383,165
|
At August 31, 2004, the cost of investments for federal tax purposes was $248,063,707. The net unrealized appreciation of investments for federal tax purposes was $15,657,933. This consists of net unrealized appreciation from investments for those securities having an excess of value over cost of $17,282,293 and net unrealized depreciation from investments for those securities having an excess of cost over value of $1,624,360.
The difference between book-basis and tax-basis unrealized appreciation/depreciation is attributable to differing treatments for discount accretion/premium amortization of debt securities.
At August 31, 2004, the Fund had a capital loss carry-forward of $6,383,165 which will reduce the Fund's taxable income arising from future net realized gains on investments, if any, to the extent permitted by the Code and thus will reduce the amount of distributions to shareholders which would otherwise be necessary to relieve the Fund of any liability for federal tax. Pursuant to the Code, such capital loss carryforward will expire as follows:
Expiration Year
|
| Expiration Amount
|
2008
|
| $1,170,431
|
2009
|
| $2,804,527
|
2010
|
| $2,171,230
|
2012
|
| $ 236,977
|
Under current tax regulations, capital losses realized after October 31 may be deferred and treated as occurring on the first day of the following fiscal year. As of August 31, 2004, for federal income tax purposes, post October losses of $2,223,580 were deferred to September 1, 2004.
5. INVESTMENT ADVISER FEE AND OTHER TRANSACTIONS WITH AFFILIATES
Investment Adviser Fee
Federated Investment Management Company, the Fund's investment adviser (the "Adviser"), receives for its services an annual investment adviser fee equal to 0.40% of the Fund's average daily net assets. The Adviser may voluntarily choose to waive any portion of its fee. The Adviser can modify or terminate this voluntary waiver at any time at its sole discretion.
Administrative Fee
Federated Administrative Services (FAS), under the Administrative Services Agreement, provides the Fund with administrative personnel and services. The fee paid to FAS is based on the average aggregate daily net assets of all Federated funds as specified below:
Maximum
Administrative Fee
|
| Average Aggregate Daily Net Assets
of the Federated Funds
|
0.150%
|
| on the first $5 billion
|
0.125%
|
| on the next $5 billion
|
0.100%
|
| on the next $10 billion
|
0.075%
|
| on assets in excess of $20 billion
|
The administrative fee received during any fiscal year shall be at least $150,000 per portfolio and $40,000 per each additional class of Shares. FAS may voluntarily choose to waive any portion of its fee. FAS can modify or terminate this voluntary waiver at any time at its sole discretion.
Prior to November 1, 2003, Federated Services Company (FServ) provided the Fund with administrative personnel and services. The fee paid to FServ was based on the average aggregate daily net assets of all Federated funds as specified below:
Maximum
Administrative Fee
|
| Average Aggregate Daily Net Assets
of the Federated Funds
|
0.150%
|
| on the first $250 million
|
0.125%
|
| on the next $250 million
|
0.100%
|
| on the next $250 million
|
0.075%
|
| on assets in excess of $750 million
|
The administrative fee received during any fiscal year was at least $125,000 per portfolio and $30,000 per each additional class of Shares.
For the year ended August 31, 2004, the fees paid to FAS and FServ were $173,608 and $35,485, respectively, after voluntary waiver, if applicable.
Distribution Services Fee
The Fund has adopted a Distribution Plan (the "Plan") pursuant to Rule 12b-1 under the Act. Under the terms of the Plan, the Fund will compensate Federated Securities Corp. (FSC), the principal distributor, from the daily net assets of the Fund's Class A Shares and Class B Shares to finance activities intended to result in the sale of these shares. The Plan provides that the Fund may incur distribution expenses according to the following schedule annually to compensate FSC.
Share Class Name
|
| Percentage of Average Daily
Net Assets of Class
|
Class A Shares
|
| 0.40%
|
Class B Shares
|
| 0.75%
|
FSC may voluntarily choose to waive any portion of its fee. FSC can modify or terminate this voluntary waiver at any time at its sole discretion.
Class A Shares did not incur a distribution services fee for the year ended August 31, 2004.
Sales Charges
For the fiscal year ended August 31, 2004, FSC retained $18,779 in sales charges from the sale of Class A Shares. See "What Do Shares Cost?" in the Prospectus.
Shareholder Services Fee
Under the terms of a Shareholder Services Agreement with Federated Shareholder Services Company (FSSC), the Fund will pay FSSC up to 0.25% of the average daily net assets of the Fund's Class A Shares and Class B Shares for the period. The fee paid to FSSC is used to finance certain services for shareholders and to maintain shareholder accounts. FSSC may voluntarily choose to waive any portion of its fee. FSSC can modify or terminate this voluntary waiver at any time at its sole discretion.
Transfer and Dividend Disbursing Agent Fees and Expenses
Prior to July 1, 2004, FServ, through its subsidiary FSSC, served as transfer and dividend disbursing agent for the Fund. The fee paid to FSSC was based on the size, type and number of accounts and transactions made by shareholders. The fee paid to FSSC during the reporting period was $96,391 after voluntary waiver, if applicable.
Portfolio Accounting Fees
Prior to January 1, 2004, FServ maintained the Fund's accounting records for which it received a fee. The fee was based on the level of the Fund's average daily net assets for the period, plus out-of-pocket expenses. The fee paid to FServ during the reporting period was $33,289, after voluntary waiver, if applicable.
Interfund Transactions
During the year ended August 31, 2004, the Fund engaged in purchase and sale transactions with funds that have a common investment adviser (or affiliated investment advisers), common Directors/Trustees, and /or common Officers. These purchase and sale transactions complied with Rule 17a-7 under the Act and amounted to $48,080,000 and $48,980,000, respectively.
General
Certain of the Officers and Trustees of the Fund are Officers and Directors or Trustees of the above companies.
6. INVESTMENT TRANSACTIONS
Purchases and sales of investments, excluding long-term U.S. government securities and short-term obligations (and in-kind contributions), for the year ended August 31, 2004, were as follows:
Purchases
|
| $
| 24,039,499
|
Sales
|
| $
| 44,507,119
|
7. CONCENTRATION OF CREDIT RISK
Since the Fund invests a substantial portion of its assets in issuers located in one state, it will be more susceptible to factors adversely affecting issuers of that state than would be a comparable tax-exempt mutual fund that invests nationally. In order to reduce the credit risk associated with such factors, at August 31, 2004, 54.5% of the securities in the portfolio of investments are backed by letters of credit or bond insurance of various financial institutions and financial guaranty assurance agencies. The largest percentage of investments insured by or supported (backed) by a letter of credit from any one institution or agency was 18.6% of total investments.
8. LEGAL PROCEEDINGS
Beginning in October 2003, Federated Investors, Inc. and various subsidiaries thereof (including the advisers and distributor for various investment companies, collectively, "Federated"), along with various investment companies sponsored by Federated ("Funds") were named as defendants in several class action lawsuits now pending in the United States District Court for the District of Maryland seeking damages of unspecified amounts. The lawsuits were purportedly filed on behalf of people who purchased, owned and/or redeemed shares of Federated-sponsored mutual funds during specified periods beginning November 1, 1998. The suits are generally similar in alleging that Federated engaged in illegal and improper trading practices including market timing and late trading in concert with certain institutional traders, which allegedly caused financial injury to the mutual fund shareholders. Federated and various Funds have also been named as defendants in several additional lawsuits, now pending in the United States District Court for the Western District of Pennsylvania, alleging, among other things, excessive advisory and Rule 12b-1 fees, and seeking damages of unspecified amounts. The Board of the Funds has retained the law firm of Dickstein Shapiro Morin & Oshinsky LLP to represent the Funds in these lawsuits. Federated and the Funds, and their respective counsel, are reviewing the allegations and will respond appropriately. Additional lawsuits based upon similar allegations may be filed in the future. The potential impact of these recent lawsuits and future potential similar suits is uncertain. Although we do not believe that these lawsuits will have a material adverse effect on the Funds, there can be no assurance that these suits, the ongoing adverse publicity and/or other developments resulting from related regulatory investigations will not result in increased Fund redemptions, reduced sales of Fund shares, or other adverse consequences for the Funds.
9. FEDERAL TAX INFORMATION (UNAUDITED)
At August 31, 2004, 100% of the distributions from net investment income is exempt from federal income tax, other than the federal AMT.
Report of Independent Registered Public Accounting Firm
TO THE BOARD OF TRUSTEES OF FEDERATED MUNICIPAL SECURITIES INCOME TRUST AND SHAREHOLDERS OF FEDERATED PENNSYLVANIA MUNICIPAL INCOME FUND:
We have audited the accompanying statement of assets and liabilities, including the portfolio of investments, of Federated Pennsylvania Municipal Income Fund (the "Fund") as of August 31, 2004, and the related statement of operations for the year then ended, the statement of changes in net assets for each of the two years in the period then ended, and the financial highlights for each of the five years in the period then ended. These financial statements and financial highlights are the responsibility of the Fund's management. Our responsibility is to express an opinion on these financial statements and financial highlights based on our audit.
We conducted our audit in accordance with standards of the Public Company Accounting Oversight Board (United States). Those standards require that we plan and perform the audits to provide reasonable assurance about whether the financial statements and financial highlights are free of material misstatement. An audit includes examining, on a test basis, evidence supporting the amounts and disclosures in the financial statements. Our procedures included confirmation of the securities owned as of August 31, 2004, by correspondence with the custodian. An audit also includes assessing the accounting principles used and significant estimates made by management, as well as evaluating the overall financial statement presentation. We believe our audit provide a reasonable basis for our opinion.
In our opinion, such financial statements and financial highlights referred to above present fairly, in all material respects, the financial position of the Fund as of August 31, 2004, the results of its operations for the year then ended, the changes in its net assets and its financial highlights for the respective stated periods in conformity with accounting principles generally accepted in the United States of America.
Deloitte & Touche LLP
Boston, Massachusetts
October 20, 2004
Board of Trustees and Trust Officers
The Board is responsible for managing the Trust's business affairs and for exercising all the Trust's powers except those reserved for the shareholders. The following tables give information about each Board member and the senior officers of the Funds. Where required, the tables separately list Board members who are "interested persons" of the Fund (i.e., "Interested" Board members) and those who are not (i.e., "Independent" Board members). Unless otherwise noted, the address of each person listed is Federated Investors Tower, 1001 Liberty Avenue, Pittsburgh, PA. The Trust comprises seven portfolios and the Federated Fund Complex consists of 44 investment companies (comprising 136 portfolios). Unless otherwise noted, each Officer is elected annually. Unless otherwise noted, each Board member oversees all portfolios in the Federated Fund Complex and serves for an indefinite term. The Fund's Statement of Additional Information includes additional information about Trust Trustees and is available, without charge and upon request, by calling 1-800-341-7400.
INTERESTED TRUSTEES BACKGROUND
|
|
|
Name
Birth Date
Address
Positions Held with Trust
Date Service Began
|
| Principal Occupation(s) for Past Five Years,
Other Directorships Held and Previous Position(s)
|
John F. Donahue*
Birth Date: July 28, 1924
CHAIRMAN AND TRUSTEE
Began serving: August 1990 | | Principal Occupations : Chairman and Director or Trustee of the Federated Fund Complex; Chairman and Director, Federated Investors, Inc.
Previous Positions : Trustee, Federated Investment Management Company and Chairman and Director, Federated Investment Counseling. |
|
|
|
J. Christopher Donahue*
Birth Date: April 11, 1949
PRESIDENT AND TRUSTEE
Began serving: August 1990 | | Principal Occupations : Principal Executive Officer and President of the Federated Fund Complex; Director or Trustee of some of the Funds in the Federated Fund Complex; President, Chief Executive Officer and Director, Federated Investors, Inc.; Chairman and Trustee, Federated Investment Management Company; Trustee, Federated Investment Counseling; Chairman and Director, Federated Global Investment Management Corp.; Chairman, Passport Research, Ltd.; Trustee, Federated Shareholder Services Company; Director, Federated Services Company.
Previous Positions : President, Federated Investment Counseling; President and Chief Executive Officer, Federated Investment Management Company, Federated Global Investment Management Corp. and Passport Research, Ltd. |
|
|
|
|
|
|
Name
Birth Date
Address
Positions Held with Trust
Date Service Began
|
| Principal Occupation(s) for Past Five Years,
Other Directorships Held and Previous Position(s)
|
Lawrence D. Ellis, M.D.*
Birth Date: October 11, 1932
3471 Fifth Avenue
Suite 1111
Pittsburgh, PA
TRUSTEE
Began serving: August 1990 | | Principal Occupations : Director or Trustee of the Federated Fund Complex; Professor of Medicine, University of Pittsburgh; Medical Director, University of Pittsburgh Medical Center Downtown; Hematologist, Oncologist and Internist, University of Pittsburgh Medical Center.
Other Directorships Held : Member, National Board of Trustees, Leukemia Society of America.
Previous Positions : Trustee, University of Pittsburgh; Director, University of Pittsburgh Medical Center. |
|
|
|
* Family relationships and reasons for "interested" status: John F. Donahue is the father of J. Christopher Donahue; both are "interested" due to the positions they hold with Federated Investors, Inc. and its subsidiaries. Lawrence D. Ellis, M.D. is "interested" because his son-in-law is employed by the Fund's principal underwriter, Federated Securities Corp.
INDEPENDENT TRUSTEES BACKGROUND
|
|
|
Name
Birth Date
Address
Positions Held with Trust
Date Service Began
|
| Principal Occupation(s) for Past Five Years,
Other Directorships Held and Previous Position(s)
|
Thomas G. Bigley
Birth Date: February 3, 1934
15 Old Timber Trail
Pittsburgh, PA
TRUSTEE
Began serving: November 1994 | | Principal Occupation : Director or Trustee of the Federated Fund Complex.
Other Directorships Held : Director, Member of Executive Committee, Children's Hospital of Pittsburgh; Director, University of Pittsburgh.
Previous Position : Senior Partner, Ernst & Young LLP. |
|
|
|
John T. Conroy, Jr.
Birth Date: June 23, 1937
Grubb & Ellis/Investment
Properties Corporation
3838 North Tamiami Trail
Suite 402
Naples, FL
TRUSTEE
Began serving: August 1991 | | Principal Occupations : Director or Trustee of the Federated Fund Complex; Chairman of the Board, Investment Properties Corporation; Partner or Trustee in private real estate ventures in Southwest Florida.
Previous Positions : President, Investment Properties Corporation; Senior Vice President, John R. Wood and Associates, Inc., Realtors; President, Naples Property Management, Inc. and Northgate Village Development Corporation. |
|
|
|
|
|
|
Name
Birth Date
Address
Positions Held with Trust
Date Service Began
|
| Principal Occupation(s) for Past Five Years,
Other Directorships Held and Previous Position(s)
|
Nicholas P. Constantakis
Birth Date: September 3, 1939
175 Woodshire Drive
Pittsburgh, PA
TRUSTEE
Began serving: February 1998 | | Principal Occupations : Director or Trustee of the Federated Fund Complex.
Other Directorships Held : Director and Member of the Audit Committee, Michael Baker Corporation (engineering and energy services worldwide).
Previous Position : Partner, Andersen Worldwide SC. |
|
|
|
John F. Cunningham
Birth Date: March 5, 1943
353 El Brillo Way
Palm Beach, FL
TRUSTEE
Began serving: July 1999 | | Principal Occupation : Director or Trustee of the Federated Fund Complex.
Other Directorships Held : Chairman, President and Chief Executive Officer, Cunningham & Co., Inc. (strategic business consulting); Trustee Associate, Boston College.
Previous Positions : Director, Redgate Communications and EMC Corporation (computer storage systems); Chairman of the Board and Chief Executive Officer, Computer Consoles, Inc.; President and Chief Operating Officer, Wang Laboratories; Director, First National Bank of Boston; Director, Apollo Computer, Inc. |
|
|
|
Peter E. Madden
Birth Date: March 16, 1942
One Royal Palm Way
100 Royal Palm Way
Palm Beach, FL
TRUSTEE
Began serving: August 1991 | | Principal Occupation : Director or Trustee of the Federated Fund Complex; Management Consultant.
Other Directorships Held : Board of Overseers, Babson College.
Previous Positions : Representative, Commonwealth of Massachusetts General Court; President, State Street Bank and Trust Company and State Street Corporation (retired); Director, VISA USA and VISA International; Chairman and Director, Massachusetts Bankers Association; Director, Depository Trust Corporation; Director, The Boston Stock Exchange. |
|
|
|
Charles F. Mansfield, Jr.
Birth Date: April 10, 1945
80 South Road
Westhampton Beach, NY
TRUSTEE
Began serving: January 1999 | | Principal Occupations : Director or Trustee of the Federated Fund Complex; Management Consultant; Executive Vice President, DVC Group, Inc. (marketing communications and technology) (prior to 9/1/00).
Previous Positions : Chief Executive Officer, PBTC International Bank; Partner, Arthur Young & Company (now Ernst & Young LLP); Chief Financial Officer of Retail Banking Sector, Chase Manhattan Bank; Senior Vice President, HSBC Bank USA (formerly, Marine Midland Bank); Vice President, Citibank; Assistant Professor of Banking and Finance, Frank G. Zarb School of Business, Hofstra University. |
|
|
|
|
|
|
Name
Birth Date
Address
Positions Held with Trust
Date Service Began
|
| Principal Occupation(s) for Past Five Years,
Other Directorships Held and Previous Position(s)
|
John E. Murray, Jr., J.D., S.J.D.
Birth Date: December 20, 1932
Chancellor, Duquesne University
Pittsburgh, PA
TRUSTEE
Began serving: February 1995 | | Principal Occupations : Director or Trustee of the Federated Fund Complex; Chancellor and Law Professor, Duquesne University; Partner, Murray, Hogue and Lannis.
Other Directorships Held : Director, Michael Baker Corp. (engineering, construction, operations and technical services).
Previous Positions : President, Duquesne University; Dean and Professor of Law, University of Pittsburgh School of Law; Dean and Professor of Law, Villanova University School of Law. |
|
|
|
Marjorie P. Smuts
Birth Date: June 21, 1935
4905 Bayard Street
Pittsburgh, PA
TRUSTEE
Began serving: August 1990 | | Principal Occupations : Director or Trustee of the Federated Fund Complex; Public Relations/Marketing Consultant/Conference Coordinator.
Previous Positions : National Spokesperson, Aluminum Company of America; television producer; President, Marj Palmer Assoc.; Owner, Scandia Bord. |
|
|
|
John S. Walsh
Birth Date: November 28, 1957
2604 William Drive
Valparaiso, IN
TRUSTEE
Began serving: July 1999 | | Principal Occupations : Director or Trustee of the Federated Fund Complex; President and Director, Heat Wagon, Inc. (manufacturer of construction temporary heaters); President and Director, Manufacturers Products, Inc. (distributor of portable construction heaters); President, Portable Heater Parts, a division of Manufacturers Products, Inc.
Previous Position : Vice President, Walsh & Kelly, Inc. |
|
|
|
OFFICERS
|
|
|
Name
Birth Date
Positions Held with Trust
Date Service Began
|
| Principal Occupation(s) for Past Five Years and Previous Position(s)
|
John W. McGonigle
Birth Date: October 26, 1938
EXECUTIVE VICE PRESIDENT
AND SECRETARY
Began serving: August 1990 | | Principal Occupations : Executive Vice President and Secretary of the Federated Fund Complex; Executive Vice President, Secretary and Director, Federated Investors, Inc. |
|
|
|
Richard J. Thomas
Birth Date: June 17, 1954
TREASURER
Began serving: November 1998 | | Principal Occupations : Principal Financial Officer and Treasurer of the Federated Fund Complex; Senior Vice President, Federated Administrative Services. |
|
|
|
Richard B. Fisher
Birth Date: May 17, 1923
VICE CHAIRMAN
Began serving: August 2002 | | Principal Occupations : Vice Chairman or President of some of the Funds in the Federated Fund Complex; Vice Chairman, Federated Investors, Inc.; Chairman, Federated Securities Corp.
Previous Positions : President and Director or Trustee of some of the Funds in the Federated Fund Complex; Executive Vice President, Federated Investors, Inc. and Director and Chief Executive Officer, Federated Securities Corp. |
|
|
|
Mary Jo Ochson
Birth Date: September 12, 1953
CHIEF INVESTMENT OFFICER
Began serving: May 2004 | | Principal Occupations: Mary Jo Ochson has been the Fund's Portfolio Manager since April 1997. Ms. Ochson was named Chief Investment Officer of tax-exempt, fixed-income products in 2004. She joined Federated in 1982 and has been a Senior Portfolio Manager and a Senior Vice President of the Fund's Adviser since 1996. Ms. Ochson is a Chartered Financial Analyst and received her M.B.A. in Finance from the University of Pittsburgh. |
|
|
|
J. Scott Albrecht
Birth Date: June 1, 1960
VICE PRESIDENT
Began serving: November 1998 | | J. Scott Albrecht has been the Fund's Portfolio Manager since March 1995. He is Vice President of the Trust. Mr. Albrecht joined Federated in 1989. He has been a Senior Portfolio Manager since 1997 and a Vice President of the Fund's Adviser since 1994. He was a Portfolio Manager from 1994 to 1996. Mr. Albrecht is a Chartered Financial Analyst and received his M.S. in Public Management from Carnegie Mellon University. |
|
|
|
Mutual funds are not bank deposits or obligations, are not guaranteed by any bank, and are not insured or guaranteed by the U.S. government, the Federal Deposit Insurance Corporation, the Federal Reserve Board, or any other government agency. Investment in mutual funds involves investment risk, including the possible loss of principal.
This report is authorized for distribution to prospective investors only when preceded or accompanied by the Fund's prospectus, which contains facts concerning its objective and policies, management fees, expenses, and other information.
VOTING PROXIES ON FUND PORTFOLIO SECURITIES
A description of the policies and procedures that the Fund uses to determine how to vote proxies relating to securities held in the Fund's portfolio is available, without charge and upon request, by calling 1-800-341-7400. A report on "Form N-PX" of how the Fund voted any such proxies during the most recent 12-month period ended June 30 is available through Federated's website site. Go to http://www.federatedinvestors.com, select "Products," select the "Prospectuses and Regulatory Reports" link, then select the Fund to access the link to Form N-PX. This information is also available from the EDGAR database on the SEC's website at http://www.sec.gov.
QUARTERLY PORTFOLIO SCHEDULE
The Fund files with the SEC a complete schedule of its portfolio holdings, as of the close of the first and third quarters of its fiscal year, on "Form N-Q." These filings are available on the SEC's website at http://www.sec.gov; and may be reviewed and copied at the SEC's Public Reference Room in Washington, DC. (Call 1-800-SEC-0330 for information on the operation of the Public Reference Room.) You may also access this information from the "Products" section of the Federated's website at www.federatedinvestors.com by clicking on "Portfolio Holdings" and selecting the name of the Fund, or by selecting the name of the Fund and clicking on "Portfolio Holdings." You must register on the website the first time you wish to access this information.
Federated
World-Class Investment Manager
Federated Pennsylvania Municipal Income Fund
Federated Investors Funds
5800 Corporate Drive
Pittsburgh, PA 15237-7000
www.federatedinvestors.com
Contact us at 1-800-341-7400 or
www.federatedinvestors.com/contact
Federated Securities Corp., Distributor
Cusip 313923708
Cusip 313923807
28995 (10/04)
Federated is a registered mark of Federated Investors, Inc. 2004 (c)Federated Investors, Inc.
Federated
World-Class Investment Manager
Federated Vermont Municipal Income Fund
A Portfolio of Federated Municipal Securities Income Trust
ANNUAL SHAREHOLDER REPORT
August 31, 2004
Class A Shares
FINANCIAL HIGHLIGHTS
SHAREHOLDER EXPENSE EXAMPLE
MANAGEMENT'S DISCUSSION OF FUND PERFORMANCE
PORTFOLIO OF INVESTMENTS SUMMARY TABLES
FINANCIAL STATEMENTS
REPORT OF INDEPENDENT REGISTERED PUBLIC ACCOUNTING FIRM
BOARD OF TRUSTEES AND TRUST OFFICERS
VOTING PROXIES ON FUND PORTFOLIO SECURITIES
QUARTERLY PORTFOLIO SCHEDULE
Not FDIC Insured * May Lose Value * No Bank Guarantee
Financial Highlights
(For a Share Outstanding Throughout Each Period)
Year Ended August 31
|
| 2004
| 1
|
| 2003
| 1
|
| 2002
| 1
|
| 2001
| 1,2
|
Net Asset Value, Beginning of Period
| | $10.10 | | | $10.27 | | | $10.22 | | | $10.00 | |
Income From Investment Operations:
| | | | | | | | | | | | |
Net investment income
| | 0.32 | | | 0.34 | | | 0.38 | | | 0.37 | |
Net realized and unrealized gain (loss) on investments
|
| 0.06
|
|
| (0.17
| )
|
| 0.05
|
|
| 0.22
|
|
TOTAL FROM INVESTMENT OPERATIONS
|
| 0.38
|
|
| 0.17
|
|
| 0.43
|
|
| 0.59
|
|
Less Distributions:
| | | | | | | | | | | | |
Distributions from net investment income
| | (0.32 | ) | | (0.34 | ) | | (0.38 | ) | | (0.37 | ) |
Distributions from net realized gain on investments
|
| (0.01
| )
|
| - --
|
|
| - --
|
|
| - --
|
|
TOTAL DISTRIBUTIONS
|
| (0.33
| )
|
| (0.34
| )
|
| (0.38
| )
|
| (0.37
| )
|
Net Asset Value, End of Period
|
| $10.15
|
|
| $10.10
|
|
| $10.27
|
|
| $10.22
|
|
Total Return 3
|
| 3.75
| %
|
| 1.74
| %
|
| 4.33
| %
|
| 6.00
| %
|
| | | | | | | | | | | | |
Ratios to Average Net Assets:
|
|
|
|
|
|
|
|
|
|
|
|
|
Expenses
|
| 0.78
| %
|
| 0.84
| %
|
| 0.81
| %
|
| 0.91
| % 4
|
Net investment income
|
| 3.14
| %
|
| 3.30
| %
|
| 3.75
| %
|
| 3.96
| % 4
|
Expense waiver/reimbursement 5
|
| 0.43
| %
|
| 0.26
| %
|
| 0.30
| %
|
| 0.46
| % 4
|
Supplemental Data:
|
|
|
|
|
|
|
|
|
|
|
|
|
Net assets, end of period (000 omitted)
|
| $71,015
|
|
| $80,497
|
|
| $82,132
|
|
| $86,924
|
|
Portfolio turnover
|
| 25
| %
|
| 20
| %
|
| 7
| %
|
| 11
| %
|
1 Note that the Fund is a newly created portfolio of Federated Municipal Securities Income Trust (Trust), and is the successor to the Banknorth Vermont Municipal Bond Fund (Former Fund). The Former Fund was reorganized into the Fund on August 27, 2004. The Fund had no investment operations prior to the date of the reorganization. The Former Fund was established on October 2, 2000. The Former Fund was the successor to a portfolio of assets of CF Vermont Tax Exempt Fund (Common Trust Fund), a common trust fund managed by the Former Fund's investment adviser, Banknorth Investment Advisors. The Common Trust Fund's portfolio of assets was transferred to the Former Fund on October 2, 2000 in exchange for the Former Fund's shares. Please see the Fund's prospectus, statement of additional information and annual report for further information regarding the reorganization, Former Fund and Common Trust Fund.
2 Reflects operations for the period from October 2, 2000 (date of initial public investment) to August 31, 2001.
3 Based on net asset value, which does not reflect the sales charge, redemption fee or contingent deferred sales charge, if applicable. Total returns for periods of less than one year are not annualized.
4 Computed on an annualized basis.
5 This voluntary expense decrease is reflected in both the expense and the net investment income ratios shown above.
See Notes which are an integral part of the Financial Statements
Shareholder Expense Example
As a shareholder of the Fund, you incur two types of costs: (1) transaction costs, including sales charges (loads) on purchase payments; and (2) ongoing costs, including management fees, distribution (12b-1) fees, shareholder services fees and other Fund expenses. This Example is intended to help you to understand your ongoing costs (in dollars) of investing in the Fund and to compare these costs with the ongoing costs of investing in other mutual funds. It is based on an investment of $1,000 invested at the beginning of the period and held for the entire period from March 1, 2004 to August 31, 2004.
ACTUAL EXPENSES
The first section of the table below provides information about actual account values and actual expenses. You may use the information in this section, together with the amount you invested, to estimate the expenses that you incurred over the period. Simply divide your account value by $1,000 (for example, an $8,600 account value divided by $1,000 = 8.6), then multiply the result by the number in the first section under the heading entitled "Expenses Paid During Period" to estimate the expenses attributable to your investment during this period.
HYPOTHETICAL EXAMPLE FOR COMPARISON PURPOSES
The second section of the table below provides information about hypothetical account values and hypothetical expenses based on the Fund's actual expense ratio and an assumed rate of return of 5% per year before expenses, which is not the Fund's actual return. Thus, you should not use the hypothetical account values and expenses to estimate the actual ending account balance or your expenses for the period. Rather, these figures are provided to enable you to compare the ongoing costs of investing in the Fund and other funds. To do so, compare this 5% hypothetical example with the 5% hypothetical examples that appear in the shareholder reports of the other funds.
Please note that the expenses shown in the table are meant to highlight your ongoing costs only and do not reflect any transaction costs, such as sales charges (loads). Therefore, the second section of the table is useful in comparing ongoing costs only, and will not help you determine the relative total costs of owning different funds. In addition, if these transaction costs were included, your costs would have been higher.
|
| Beginning
Account Value
3/1/2004
|
| Ending
Account Value
8/31/2004
|
| Expenses Paid
During Period 1,2
|
Actual:
|
| $1,000
|
| $1,001.10
|
| $3.92
|
Hypothetical (assuming a 5% return before expenses):
|
| $1,000
|
| $1,021.22
|
| $3.96
|
1 Expenses are equal to the Federated Vermont Municipal Income Fund's annualized expense ratio of 0.78% multiplied by the average account value over the period, multiplied by 184/366 (to reflect the one-half year period).
2 Note that the Fund is a newly created portfolio of Federated Municipal Securities Income Trust (Trust), and is the successor to the Banknorth Vermont Municipal Bond Fund (Former Fund). The Former Fund was reorganized into the Fund on August 27, 2004. The Fund had no investment operations prior to the date of the reorganization. The Former Fund was established on October 2, 2000. The Former Fund was the successor to a portfolio of assets of CF Vermont Tax Exempt Fund (Common Trust Fund), a common trust fund managed by the Former Fund's investment adviser, Banknorth Investment Advisors. The Common Trust Fund's portfolio of assets was transferred to the Former Fund on October 2, 2000 in exchange for the Former Fund's shares. Please see the Fund's prospectus, statement of additional information and annual report for further information regarding the reorganization, Former Fund and Common Trust Fund.
Management's Discussion of Fund Performance
The Fund is a newly created portfolio of Federated Municipal Securities Income Trust (Trust), and is the successor to the Banknorth Vermont Municipal Bond Fund (Former Fund). 1 The Former Fund was reorganized into the Fund on August 27, 2004, three days prior to the end of the 12-month reporting period. As a result of the reorganization, Federated Investment Management Company (Adviser) is the investment adviser to the Fund. The Former Fund's investment adviser was Banknorth Investment Advisors ("Former Advisor"). Given the timing of the reorganization, the following discussion, as it relates to periods of time prior to August 27, 2004, is based solely on information provided by the Former Advisor.
The Fund's total return based on net asset value for the 12-month reporting period was 3.75%. The total return consisted of 3.35% of tax-exempt dividends, and 0.40% appreciation in the net asset value of the shares. 2 The Former Fund's benchmark index prior to the reorganization was the Lehman Brothers 5-Year Municipal Bond Index ("Index"). 3 The total return of the Index was 4.49% during the 12-month reporting period.
1 The Former Fund was established on October 2, 2000. The Former Fund was the successor to a portfolio of assets of CF Vermont Tax Exempt Fund (Common Trust Fund), a common trust fund managed by the Former Fund's investment adviser, Banknorth Investment Advisors. The Common Trust Fund's portfolio of assets was transferred to the Former Fund on October 2, 2000 in exchange for the Former Fund's shares. The Common Trust Fund was not registered under the Investment Company Act of 1940 (1940 Act) and, therefore, was not subject to certain investment restrictions that are imposed by the 1940 Act. Regarding the prior performance of the Common Trust Fund, if the Common Trust Fund had been registered under the 1940 Act, performance may have been adversely affected.
2 Performance data quoted represents past performance which is no guarantee of future results. Investment return and principal value will fluctuate so that an investor's shares, when redeemed, may be worth more or less than their original cost. Mutual fund performance changes over time and current performance for the Fund may be lower or higher than what is stated. For current to the most recent month end performance for the fund, visit www.federatedinvestors.com or call 1-800-341-7400.
3 The Index is an unmanaged index of municipal bonds, issued after December 31, 1990, with minimum credit ratings of at least BAA3, which have been issued as part of a deal of at least $50 million, have an amount outstanding of at least $5 million, and have a maturity range of 4 to 6 years. The Fund has elected to use the Lehman Brothers Municipal Bond Index (LBMB), rather than the Index, as its benchmark index after the reorganization because the Fund believes that the LBMB is more representative of the securities that the Fund held as of the reorganization and will hold after the reorganization. The LBMB is an unmanaged index of municipal bonds, with a minimum credit rating of at least Baa, which have been issued as part of a deal of at least $50 million and has an amount outstanding of at least $3 million. The LBMB includes both zero coupon bonds and bonds subject to the alternative minimum tax. The total return of the LBMB was 7.11% during the 12-month reporting period. The Fund's total return reflected actual cash flows, transaction costs and other expenses, which were not reflected in the LBMB or the Index. The Index and LBMB are unmanaged, and it is not possible to invest directly in these indices.
The investment strategy employed by the Former Adviser focused on attempting to maximize tax-exempt income by allocating securities among maturities and securities of similar issuers (referred to as "sectors"), and keeping the effective duration of the portfolio in the four-to seven-year range. According to the Former Advisor, these were the significant factors that affected the Fund's performance relative to the Index. The Fund also maintained the overall credit rating of the portfolio in the A+ to AA range. 4 In addition, the Fund's total return reflected actual cash flows, transaction costs and other expenses, which were not reflected in the total return of the Index.
MATURITY AND DURATION 5
During the reporting period, the allocation of securities among maturities was the most significant factor affecting the Fund's performance relative to the Index according to the Former Advisor. During the reporting period, the Fund generally maintained an effective duration and average maturity slightly longer than the Index. The Fund's dollar-weighted average duration during the reporting period was 4.46 years. According to the Former Advisor, these factors were expected to be favorable for performance; however, it appears that the Index's higher yield to maturity position, and its shortening duration, during a time of declining interest rates resulted in the fund slightly underperforming when compared against the Index.
4 During the reporting period, the Fund maintained an average credit rating of AA. Credit ratings do not provide protection against default. Credit ratings are an assessment of the risk that a security will default in payment and do not address other risks presented by the security.
5 Duration is a measure of a security's price sensitivity to changes in interest rates. Securities with longer durations are more sensitive to changes in interest rates than securities with shorter durations.
SECTOR ALLOCATION
During the reporting period, according to the Former Advisor, the Fund allocated more of its portfolio to revenue bonds. The Fund also continued purchasing short-term private placement securities with higher negotiated yields as an alternative to low yielding money market alternatives. According to the Former Advisor, these factors hurt the Fund's performance.
GROWTH OF A $10,000 INVESTMENT 1
The graph below illustrates the hypothetical investment of $10,000 2 in Federated Vermont Municipal Income Fund (the "Fund") from August 31, 1994 to August 31, 2004, compared to the Lehman Brothers Municipal Bond Index (LBMB) 3 and the Lehman Brothers 5-Year Municipal Bond Index (LB5MB). 4
Average Annual Total Return 5 for the Period Ended 8/31/2004
|
|
|
1 Year
|
| (0.95)%
|
5 Years
|
| 2.61%
|
10 Years
|
| 3.49%
|
Performance data quoted represents past performance which is no guarantee of future results. Returns shown do not reflect the deduction of taxes that a shareholder would pay on Fund distributions or the redemption of Fund shares. For after-tax returns, visit www.federatedinvestors.com. Investment return and principal value will fluctuate so that an investor's shares, when redeemed, may be worth more or less than their original cost. Mutual fund performance changes over time and current performance may be lower or higher than what is stated. Mutual funds are not obligations of or guaranteed by any bank and are not federally insured.
1 Federated Vermont Municipal Income Fund is the successor to Banknorth Vermont Municipal Bond Fund (the "Former Fund"). The Former Fund was established on October 2, 2000, and was reorganized into the Fund on August 27, 2004. The Former Fund was the successor to a portfolio of assets of CF Vermont Tax Exempt Fund (Common Trust Fund), a common trust fund managed by the Former Fund's adviser, Banknorth Investment Advisers, which were transferred to the Former Fund on October 2, 2000 in exchange for the Former Fund's shares. The quoted returns are the returns of the Common Trust Fund for periods before October 2, 2000, adjusted to reflect the Fund's expenses. The Common Trust Fund was not registered under the Investment Company Act of 1940 ("1940 Act") and therefore was not subject to certain investment restrictions that are imposed by the 1940 Act, If the Common Trust Fund had been registered under the 1940 Act, performance may have been adversely affected.
2 Represents a hypothetical investment of $10,000 in the Fund after deducting the maximum sales charge of 3.75% ($10,000 investment minus $375 sales charge=$9,625) which was effective on 10/2/2000. From 12/1/2003 through 8/26/2004, the Fund imposed no sales charge. Effective 8/27/2004 the maximum sales charge has been increased to 4.50%. The Fund's performance assumes the reinvestment of all dividends and distributions. The LBMB and LB5MB have been adjusted to reflect reinvestment of dividends on securities in the indexes. The indexes are unmanaged, and unlike the Fund, are not affected by cashflows. It is not possible to invest directly in an index.
3 The LBMB is an unmanaged index of municipal bonds, with a minimum credit rating of at least Baa, which have been issued as part of a deal of at least $50 million, and have an amount outstanding of at least $3 million. The index includes both zero coupons and bonds subject to the alternative minimum tax. The Fund has elected to use LBMB, rather than LB5MB, as its broad-based market index because the Fund believes that the LBMB is more representative of the securities that the Fund held as of, and will hold after, the reorganization described in footnote 1 above. It is not adjusted to reflect sales charges, expenses, or other fees that the Securities and Exchange Commission (SEC) requires to be reflected in the Fund's performance.
4 The LB5MB is an unmanaged index comprising bonds with a minimum credit rating of at least Baa. They must have an outstanding par value of at least $3 million and be issued as part of a transaction of at least $50 million. The index includes both zero coupon bonds and bonds subject to the federal alternative minimum tax. It is not adjusted to reflect sales charges, expenses, or other fees that the SEC requires to be reflected in the Fund's performance.
5 Total return quoted reflects all applicable sales charges.
Portfolio of Investments Summary Tables
At August 31, 2004, the Fund's credit-quality ratings composition 1 was as follows:
S&P Long-Term Ratings as
Percentage of Total Investments 2
| | Moody's Long-Term Ratings as
Percentage of Total Investments 2
|
AAA
|
| 35.6%
| | Aaa
|
| 49.9%
|
AA
|
| 14.7%
| | Aa
|
| 20.7%
|
A
|
| 6.3%
| | A
|
| 4.5%
|
BBB
|
| 0.0%
| | Baa
|
| 0.0%
|
BB
|
| 0.0%
| | Ba
|
| 0.0%
|
B
|
| 0.0%
| | B
|
| 0.0%
|
Not rated by S&P
|
| 43.4%
| | Not rated by Moody's
|
| 24.9%
|
TOTAL
|
| 100%
| | TOTAL
|
| 100%
|
1 These tables depict the long-term, credit-quality ratings assigned to the Fund's portfolio holdings by Standard & Poor's and Moody's Investors Service, each of which is a Nationally Recognized Statistical Rating Organization (NRSRO). These credit-quality ratings are shown without regard to gradations within a given rating category. For example, securities rated "A-" have been included in the "A" rated category. Holdings that are rated only by a different NRSRO than the one identified have been included in the "Not rated by..." category. Rated securities include a security with an obligor and/or credit enhancer that has received a rating from an NRSRO with respect to a class of debt obligations that is comparable in priority and security with the security held by the Fund. Credit-quality ratings are an assessment of the risk that a security will default in payment and do not address other risks presented by the security. Please see the description of quality ratings in the Fund's Statement of Additional Information.
Each table depicts the long-term quality ratings as assigned only by the NRSRO identified in the table. Of the portfolio's total investments, 22.1% is not rated by either of these NRSROs.
2 Percentages are based on total investments, which may differ from total net assets. Please see the description of credit ratings in the Fund's Statement of Additional Information.
Portfolio of Investments
August 31, 2004
Principal
Amount
|
|
|
| Credit
Rating
|
1
|
| Value
|
| | | LONG-TERM MUNICIPALS--98.2% | | | | | |
| | | Louisiana--0.5% | | | | | |
| $ | 184,000 | | Jefferson Parish, LA, U.S. Home Mortgage Authority, SFM Revenue Bonds, 7.100% (Escrowed In U.S. Treasuries PRF), 8/1/2010
| | AAA/Aaa | | $ | 223,223 |
| 135,000 | | Monroe-West Monroe, LA, Public Trust Finance Authority, SFM Revenue Bonds, 7.200% (Escrowed In U.S. Treasuries PRF), 8/1/2010
|
| AAA
|
|
| 153,300
|
| | | TOTAL
|
|
|
|
| 376,523
|
| | | Puerto Rico--6.3% | | | | | |
| 2,000,000 | | Commonwealth of Puerto Rico, UT GO Bonds, 5.500% (MBIA Insurance Corp. INS), 7/1/2009
| | AAA/Aaa | | | 2,264,200 |
| 1,000,000 | | Puerto Rico Electric Power Authority, Refunding Revenue Bonds (Series 00), 5.000% (CDC IXIS Financial Guaranty N.A. INS), 7/1/2014
| | AAA/Aaa | | | 1,113,270 |
| 1,000,000 | | Puerto Rico Electric Power Authority, Refunding Revenue Bonds (Series 00), 5.000% (FGIC INS), 7/1/2015
|
| AAA/Aaa
|
|
| 1,115,470
|
| | | TOTAL
|
|
|
|
| 4,492,940
|
| | | Vermont--91.4% | | | | | |
| 565,000 | | Burlington, VT, Airport, Revenue Bonds (Series A), 3.625% (MBIA Insurance Corp. INS)/(Original Issue Yield: 3.76%), 7/1/2017
| | NR/Aaa | | | 534,993 |
| 1,250,000 | | Burlington, VT, Airport, Revenue Bonds (Series A), 5.000% (MBIA Insurance Corp. INS), 7/1/2023
| | NR/Aaa | | | 1,300,150 |
| 490,000 | | Burlington, VT, Electric Authority, Revenue Bonds (Series A), 4.000% (FSA INS), 7/1/2015
| | NR/Aaa | | | 495,748 |
| 510,000 | | Burlington, VT, Electric Authority, Revenue Bonds (Series A), 4.000% (FSA INS), 7/1/2016
| | NR/Aaa | | | 511,005 |
| 300,000 | | Burlington, VT, Waterworks System, Refunding Revenue Bonds (Series A), 4.650% (FGIC INS)/(Original Issue Yield: 4.70%), 7/1/2006
| | AAA/Aaa | | | 315,594 |
| 150,000 | | Burlington, VT, Waterworks System, Refunding Revenue Bonds (Series A), 4.750% (FGIC INS)/(Original Issue Yield: 4.80%), 7/1/2007
| | AAA/Aaa | | | 161,111 |
| 300,000 | | Burlington, VT, Waterworks System, Refunding Revenue Bonds (Series A), 4.800% (FGIC INS)/(Original Issue Yield: 4.85%), 7/1/2008
| | AAA/Aaa | | | 319,302 |
| 800,000 | | Burlington, VT (Series A), 5.100%, 12/1/2005
| | NR/Aa3 | | | 835,288 |
| 210,000 | | Burlington, VT, UT GO Bonds (Series A), 4.000% (Original Issue Yield: 4.13%), 11/1/2017
| | NR/Aa3 | | | 211,520 |
| 785,000 | | Burlington, VT, UT GO Bonds 5.200%, 12/1/2006
| | NR/Aa3 | | | 817,405 |
| 185,000 | | Burlington, VT, UT GO Bonds (Series A), 3.750% (Original Issue Yield: 3.83%), 11/1/2014
| | NR/Aa3 | | | 186,902 |
Principal
Amount
|
|
|
| Credit
Rating
|
1
|
| Value
|
| | | LONG-TERM MUNICIPALS--continued | | | | | |
| | | Vermont--continued | | | | | |
| $ | 190,000 | | Burlington, VT, UT GO Bonds (Series A), 3.750% (Original Issue Yield: 3.93%), 11/1/2015
| | NR/Aa3 | | $ | 189,734 |
| 200,000 | | Burlington, VT, UT GO Bonds (Series A), 4.000% (Original Issue Yield: 4.03%), 11/1/2016
| | NR/Aa3 | | | 202,708 |
| 220,000 | | Burlington, VT, UT GO Bonds (Series A), 4.000% (Original Issue Yield: 4.22%), 11/1/2018
| | NR/Aa3 | | | 219,872 |
| 170,000 | | Burlington, VT, UT GO Public Improvement Bonds (Series A), 3.500% (Original Issue Yield: 3.60%), 11/1/2012
| | NR/Aa3 | | | 171,816 |
| 155,000 | | Burlington, VT, UT GO Public Improvement Bonds (Series A), 3.500%, 11/1/2010
| | NR/Aa3 | | | 160,044 |
| 90,000 | | Burlington, VT, UT GO Public Improvement Bonds (Series A), 3.500%, 11/1/2011
| | NR/Aa3 | | | 92,010 |
| 125,000 | | Burlington, VT, UT GO Public Improvement Bonds (Series A), 3.600% (Original Issue Yield: 3.72%), 11/1/2013
| | NR/Aa3 | | | 125,682 |
| 110,000 | | Chittenden, VT, Solid Waste District, UT GO Bonds (Series A), 2.500% (AMBAC INS), 1/1/2007
| | AAA/Aaa | | | 111,360 |
| 100,000 | | Chittenden, VT, Solid Waste District, UT GO Refunding Bonds (Series A), 3.300% (AMBAC INS)/(Original Issue Yield: 3.32%), 1/1/2010
| | AAA/Aaa | | | 102,234 |
| 310,000 | | Chittenden, VT, Solid Waste District, UT GO Refunding Bonds (Series A), 3.400% (AMBAC INS)/(Original Issue Yield: 3.52%), 1/1/2011
| | AAA/Aaa | | | 315,750 |
| 205,000 | | Chittenden, VT, Solid Waste District, UT GO Refunding Bonds (Series A), 3.500% (AMBAC INS)/(Original Issue Yield: 3.62%), 1/1/2012
| | AAA/Aaa | | | 208,516 |
| 90,000 | | Fair Haven, VT, Union High School District, UT GO Bonds, 4.950% (AMBAC INS), 12/1/2004
| | AAA/Aaa | | | 90,793 |
| 90,000 | | Fair Haven, VT, Union High School District, UT GO Bonds, 5.000% (AMBAC INS)/(Original Issue Yield: 5.05%), 12/1/2005
| | AAA/Aaa | | | 93,793 |
| 90,000 | | Fair Haven, VT, Union High School District, UT GO Bonds, 5.050% (AMBAC INS)/(Original Issue Yield: 5.15%), 12/1/2006
| | AAA/Aaa | | | 93,549 |
| 25,000 | | Norwich, VT, School District, UT GO Bonds, 4.500% (AMBAC INS), 7/15/2009
| | AAA/Aaa | | | 27,055 |
| 120,000 | | Pawlett/Rupert Union Elementary School District No. 47, UT GO Bonds, 5.000% (MBIA Insurance Corp. INS), 11/1/2004
| | AAA/Aaa | | | 120,715 |
| 520,000 | | St. Johnsbury, VT, School District, UT GO Bonds, 4.550% (AMBAC INS), 9/1/2006
| | NR/Aaa | | | 548,517 |
| 500,000 | | St. Johnsbury, VT, School District, UT GO Bonds, 4.500% (AMBAC INS), 9/1/2005
| | NR/Aaa | | | 514,845 |
| 515,000 | | St. Johnsbury, VT, School District, UT GO Bonds, 4.650% (AMBAC INS), 9/1/2007
| | NR/Aaa | | | 553,177 |
Principal
Amount
|
|
|
| Credit
Rating
|
1
|
| Value
|
| | | LONG-TERM MUNICIPALS--continued | | | | | |
| | | Vermont--continued | | | | | |
| $ | 520,000 | | St. Johnsbury, VT, School District, UT GO Bonds, 4.800% (AMBAC INS), 9/1/2008
| | NR/Aaa | | $ | 566,956 |
| 340,000 | | Swanton Village, VT, Electric System, Refunding Revenue Bonds, 5.750% (MBIA Insurance Corp. INS)/(Original Issue Yield: 5.85%), 12/1/2019
| | AAA/Aaa | | | 381,718 |
| 205,000 | | University of Vermont & State Agricultural College, Revenue Bonds, 4.100% (AMBAC INS)/(Original Issue Yield: 4.17%), 10/1/2011
| | AAA/Aaa | | | 216,740 |
| 500,000 | | University of Vermont & State Agricultural College, Revenue Bonds, 4.200% (AMBAC INS)/(Original Issue Yield: 4.25%), 10/1/2012
| | AAA/Aaa | | | 529,505 |
| 1,150,000 | | University of Vermont & State Agricultural College, Revenue Bonds, 5.250% (AMBAC INS), 10/1/2012 (@100)
| | AAA/Aaa | | | 1,222,680 |
| 250,000 | | University of Vermont & State Agricultural College, Revenue Bonds, 5.250% (AMBAC INS), 10/1/2012 (@100)
| | AAA/Aaa | | | 268,622 |
| 500,000 | | University of Vermont & State Agricultural College, Revenue Bonds, 5.500% (AMBAC INS), 10/1/2018
| | AAA/Aaa | | | 563,635 |
| 500,000 | | University of Vermont & State Agricultural College, Revenue Bonds, 5.500% (AMBAC INS), 10/1/2019
| | AAA/Aaa | | | 562,070 |
| 41,676 | 2 | Vermont Economic Development Authority, Revenue Bonds (Series A), 6.180% (Vermont Tubbs), 8/31/2006
| | NR | | | 41,634 |
| 3,000 | | Vermont Educational and Health Buildings Financing Agency, Revenue Bonds, 1.100% TOBs (Middlebury College), Optional Tender 11/1/2027
| | AA/NR | | | 2,999 |
| 50,000 | | Vermont Educational and Health Buildings Financing Agency, Revenue Bonds, 3.250% (St. Michael's College)/(Original Issue Yield: 3.33%), 10/1/2009
| | A-/A3 | | | 50,443 |
| 100,000 | | Vermont Educational and Health Buildings Financing Agency, Revenue Bonds, 3.600% (St. Michael's College)/(Original Issue Yield: 3.68%), 10/1/2010
| | A-/A3 | | | 101,849 |
| 140,000 | | Vermont Educational and Health Buildings Financing Agency, Revenue Bonds, 3.875% (St. Michael's College)/(Original Issue Yield: 3.93%), 10/1/2011
| | A-/A3 | | | 143,531 |
| 195,000 | | Vermont Educational and Health Buildings Financing Agency, Revenue Bonds, 4.000% (St. Michael's College)/(Original Issue Yield: 4.10%), 10/1/2012
| | A-/A3 | | | 199,598 |
| 125,000 | | Vermont Educational and Health Buildings Financing Agency, Revenue Bonds, 4.125% (St. Michael's College)/(Original Issue Yield: 4.23%), 10/1/2013
| | A-/A3 | | | 127,706 |
| 385,000 | | Vermont Educational and Health Buildings Financing Agency, Revenue Bonds, 4.250% (St. Michael's College)/(Original Issue Yield: 4.35%), 10/1/2014
| | A-/A3 | | | 393,231 |
Principal
Amount
|
|
|
| Credit
Rating
|
1
|
| Value
|
| | | LONG-TERM MUNICIPALS--continued | | | | | |
| | | Vermont--continued | | | | | |
| $ | 370,000 | | Vermont Educational and Health Buildings Financing Agency, Revenue Bonds, 4.375% (St. Michael's College)/(Original Issue Yield: 4.45%), 10/1/2015
| | A-/A3 | | $ | 379,335 |
| 770,000 | | Vermont Educational and Health Buildings Financing Agency, Revenue Bonds, 5.300% (Middlebury College)/(Original Issue Yield: 5.45%), 11/1/2006 (@102)
| | AA/Aa3 | | | 836,982 |
| 190,000 | | Vermont Educational and Health Buildings Financing Agency, Revenue Bonds, 5.375% (Middlebury College)/(Original Issue Yield: 5.93%), 11/1/2006 (@102)
| | AA/Aa3 | | | 200,600 |
| 140,000 | | Vermont Educational and Health Buildings Financing Agency, Revenue Bonds, 5.400% (St. Michael's College)/(Escrowed to Maturity)/(Original Issue Yield: 5.45%), 4/1/2005
| | A-/NR | | | 143,244 |
| 90,000 | | Vermont Educational and Health Buildings Financing Agency, Revenue Bonds, 5.600% (Champlain College)/(Merchants Bancorp, Inc. LOC), 10/1/2004
| | NR | | | 90,243 |
| 20,000 | | Vermont Educational and Health Buildings Financing Agency, Revenue Bonds, 5.750% (St. Michael's College)/(Escrowed to Maturity), 10/1/2004
| | A-/NR | | | 20,075 |
| 100,000 | | Vermont Educational and Health Buildings Financing Agency, Revenue Bonds, 5.900% (St. Michael's College)/(U.S. Treasury PRF 10/1/2004 @102), 10/1/2006
| | A-/NR | | | 102,383 |
| 1,190,000 | | Vermont Educational and Health Buildings Financing Agency, Revenue Bonds, 6.500% (St. Michael's College)/(U.S. Treasury PRF 10/1/2004 @102), 10/1/2014
| | A-/NR | | | 1,218,953 |
| 190,000 | | Vermont Educational and Health Buildings Financing Agency, Revenue Bonds, 7.150% (Landmark College, Inc.), 11/1/2014
| | NR | | | 195,518 |
| 1,218,000 | 2 | Vermont Educational and Health Buildings Financing Agency, Revenue Bonds (Series 1996), 2.504% VRN (North Country Hospital and Nursing Home), 10/1/2011
| | NR | | | 1,230,375 |
| 400,000 | | Vermont Educational and Health Buildings Financing Agency, Revenue Bonds (Series A), 4.000% (Middlebury College)/(Original Issue Yield: 4.13%), 11/1/2012 (@100)
| | AA/Aa3 | | | 416,336 |
| 65,000 | | Vermont Educational and Health Buildings Financing Agency, Revenue Bonds (Series A), 5.300% (Fletcher Allen Healthcare)/ (AMBAC INS)/(Original Issue Yield: 5.32%), 12/1/2008
| | AAA/Aaa | | | 71,701 |
| 55,000 | | Vermont Educational and Health Buildings Financing Agency, Revenue Bonds (Series A), 5.300% (Fletcher Allen Healthcare)/ (AMBAC INS)/(Original Issue Yield: 5.38%), 12/1/2009
| | AAA/Aaa | | | 61,032 |
| 4,575,000 | 2 | Vermont Educational and Health Buildings Financing Agency, Revenue Bonds (Series 1999 A), 3.570% (Marlboro College), 4/1/2019
| | NR | | | 4,575,000 |
Principal
Amount
|
|
|
| Credit
Rating
|
1
|
| Value
|
| | | LONG-TERM MUNICIPALS--continued | | | | | |
| | | Vermont--continued | | | | | |
| $ | 60,000 | | Vermont Educational and Health Buildings Financing Agency, Refunding Revenue Bonds, 4.400% (Central Vermont Hospital & Nursing Home)/(AMBAC INS)/(Original Issue Yield: 4.55%), 11/15/2005
| | AAA/Aaa | | $ | 61,986 |
| 555,000 | | Vermont Educational and Health Buildings Financing Agency, Refunding Revenue Bonds (Series 1996), 4.375% (Central Vermont Hospital & Nursing Home)/(AMBAC INS)/(Original Issue Yield: 4.45%), 11/15/2004
| | AAA/Aaa | | | 558,430 |
| 605,000 | | Vermont Educational and Health Buildings Financing Agency, Refunding Revenue Bonds (Series 1996), 4.500% (Central Vermont Hospital & Nursing Home)/(AMBAC INS)/(Original Issue Yield: 4.65%), 11/15/2006
| | AAA/Aaa | | | 637,876 |
| 200,000 | | Vermont Educational and Health Buildings Financing Agency, Refunding Revenue Bonds (Series 1996), 4.625% (Central Vermont Hospital & Nursing Home)/(AMBAC INS)/(Original Issue Yield: 4.75%), 11/15/2006 (@102)
| | AAA/Aaa | | | 213,742 |
| 1,100,000 | 2,3 | Vermont HFA, Revenue Bonds, 64 School Street Limited Partnership, 2.400% (Vermont HFA MFH), 10/30/2004
| | NR | | | 1,100,154 |
| 760,000 | 2,3 | Vermont HFA, Revenue Bonds, Cabot Commons Limited Partnership, 2.750% (Vermont HFA MFH), 3/15/2005
| | NR | | | 760,137 |
| 225,000 | 2,3 | Vermont HFA, Revenue Bonds, Colonial West Limited Partnership, 2.750% (Vermont HFA MFH), 5/30/2005
| | NR | | | 224,973 |
| 2,123,000 | 2,3 | Vermont HFA, Revenue Bonds, Mountainview Street Jay Housing Limited Partnership, 2.750% (Vermont HFA MFH), 4/30/2005
| | NR | | | 2,121,705 |
| 130,000 | | Vermont HFA, Revenue Bonds (Series 11A), 4.600% (Vermont HFA SFM)/(FSA INS), 11/1/2004
| | AAA/Aaa | | | 130,537 |
| 125,000 | | Vermont HFA, Revenue Bonds (Series 11A), 4.700% (Vermont HFA SFM)/(FSA INS), 11/1/2005
| | AAA/Aaa | | | 128,277 |
| 175,000 | | Vermont HFA, Revenue Bonds (Series 11A), 4.850% (Vermont HFA SFM)/(FSA INS), 11/1/2006
| | AAA/Aaa | | | 177,576 |
| 130,000 | | Vermont HFA, Revenue Bonds (Series 11A), 4.950% (Vermont HFA SFM)/(FSA INS), 11/1/2007
| | AAA/Aaa | | | 131,995 |
| 175,000 | | Vermont HFA, Revenue Bonds (Series 11A), 5.050% (Vermont HFA SFM)/(FSA INS), 11/1/2008
| | AAA/Aaa | | | 177,872 |
| 230,000 | | Vermont HFA, Revenue Bonds (Series 11A), 5.150% (Vermont HFA SFM)/(FSA INS), 11/1/2009
| | AAA/Aaa | | | 233,871 |
| 150,000 | | Vermont HFA, Revenue Bonds (Series 12B), 5.500% (Vermont HFA SFM)/(FSA INS), 11/1/2008
| | AAA/Aaa | | | 150,823 |
| 190,000 | | Vermont HFA, Revenue Bonds (Series 12B), 5.600% (Vermont HFA SFM)/(FSA INS), 11/1/2009
| | AAA/Aaa | | | 191,100 |
Principal
Amount
|
|
|
| Credit
Rating
|
1
|
| Value
|
| | | LONG-TERM MUNICIPALS--continued | | | | | |
| | | Vermont--continued | | | | | |
| $ | 50,000 | | Vermont HFA, Revenue Bonds (Series 5), 5.900% (Vermont HFA SFM), 11/1/2004
| | A+/A1 | | $ | 50,029 |
| 75,000 | | Vermont HFA, Revenue Bonds (Series 5), 6.875% (Vermont HFA SFM), 11/1/2004 (@102)
| | A+/A1 | | | 76,026 |
| 110,000 | | Vermont HFA, Revenue Bonds (Series 9), 4.550% (Vermont HFA SFM)/(MBIA Insurance Corp. INS), 6/1/2007 (@101.5)
| | AAA/Aaa | | | 115,796 |
| 50,000 | | Vermont HFA, Revenue Bonds (Series 9), 5.000% (Vermont HFA SFM)/(MBIA Insurance Corp. INS), 5/1/2005
| | AAA/Aaa | | | 50,854 |
| 20,000 | | Vermont HFA, Revenue Bonds (Series 9), 5.100% (Vermont HFA SFM)/(MBIA Insurance Corp. INS), 5/1/2006
| | AAA/Aaa | | | 20,700 |
| 205,000 | | Vermont HFA, Revenue Bonds (Series A), 4.450% (Vermont HFA MFH), 2/15/2008
| | AA-/NR | | | 213,249 |
| 130,000 | | Vermont HFA, Revenue Bonds (Series A), 4.550% (Vermont HFA MFH), 2/15/2009
| | AA-/NR | | | 135,459 |
| 2,230,000 | 2,3 | Vermont HFA, Revenue Bonds Smallest City Housing LTD, 2.500% (Vermont HFA MFH), 12/31/2004
| | NR | | | 2,228,997 |
| 1,650,000 | 2,3 | Vermont HFA, Revenue Bonds Wall Street Housing Limited Partnership, 2.450% (Vermont HFA MFH), 11/10/2004
| | NR | | | 1,649,423 |
| 1,350,000 | 2,3 | Vermont HFA, Revenue Bonds Whetsone Housing Limited Partnership, 2.500% (Vermont HFA MFH), 11/30/2004
| | NR | | | 1,349,892 |
| 1,000,000 | | Vermont Municipal Bond Bank, Revenue Bonds (Series 1), 4.400% (FSA INS)/(Original Issue Yield: 4.45%), 12/1/2007
| | AAA/Aaa | | | 1,070,400 |
| 1,500,000 | | Vermont Municipal Bond Bank, Revenue Bonds (Series 1), 4.300% (FSA INS)/(Original Issue Yield: 4.40%), 12/1/2006
| | AAA/Aaa | | | 1,580,520 |
| 860,000 | | Vermont Municipal Bond Bank, Revenue Bonds (Series 1), 4.600% (MBIA Insurance Corp. INS)/(Original Issue Yield: 4.65%), 12/1/2007
| | NR/Aaa | | | 925,351 |
| 100,000 | | Vermont Municipal Bond Bank, Revenue Bonds (Series 1), 4.800% (MBIA Insurance Corp. INS)/(Original Issue Yield: 4.95%), 12/1/2008
| | AAA/Aaa | | | 108,577 |
| 30,000 | | Vermont Municipal Bond Bank, Revenue Bonds (Series 1), 5.100% (AMBAC INS)/(Original Issue Yield: 5.20%), 12/1/2004
| | AAA/Aaa | | | 30,284 |
| 2,000,000 | | Vermont Municipal Bond Bank, Revenue Bonds (Series 1), 5.375% (MBIA Insurance Corp. INS)/(Original Issue Yield: 5.44%), 12/1/2010
| | AAA/Aaa | | | 2,222,400 |
| 80,000 | | Vermont Municipal Bond Bank, Revenue Bonds (Series 1), 5.700% (Escrowed to Maturity), 12/1/2004
| | A+/Aa3 | | | 80,843 |
| 1,000,000 | | Vermont Municipal Bond Bank, Revenue Bonds (Series 2), 5.000% (MBIA Insurance Corp. INS), 12/1/2017
| | NR/Aaa | | | 1,084,270 |
Principal
Amount
|
|
|
| Credit
Rating
|
1
|
| Value
|
| | | LONG-TERM MUNICIPALS--continued | | | | | |
| | | Vermont--continued | | | | | |
| $ | 1,000,000 | | Vermont Municipal Bond Bank, Revenue Bonds (Series 2), 5.000% (MBIA Insurance Corp. INS), 12/1/2018
| | NR/Aaa | | $ | 1,077,020 |
| 750,000 | | Vermont Municipal Bond Bank, Revenue Bonds (Series 2), 6.000% (AMBAC INS), 12/1/2004
| | AAA/Aaa | | | 758,783 |
| 250,000 | | Vermont Municipal Bond Bank, Revenue Bonds (Series I), 3.000% (Original Issue Yield: 3.01%), 12/1/2007
| | A+/Aa3 | | | 256,670 |
| 250,000 | | Vermont Municipal Bond Bank, Revenue Bonds (Series I), 3.300% (Original Issue Yield: 3.32%), 12/1/2008
| | A+/Aa3 | | | 257,817 |
| 250,000 | | Vermont Municipal Bond Bank, Revenue Bonds (Series I), 3.500% (Original Issue Yield: 3.53%), 12/1/2009
| | A+/Aa3 | | | 258,457 |
| 250,000 | | Vermont Municipal Bond Bank, Revenue Bonds (Series I), 3.700% (Original Issue Yield: 3.75%), 12/1/2010
| | A+/Aa3 | | | 260,230 |
| 250,000 | | Vermont Municipal Bond Bank, Revenue Bonds (Series I), 3.800% (Original Issue Yield: 3.86%), 12/1/2011
| | A+/Aa3 | | | 259,843 |
| 250,000 | | Vermont Municipal Bond Bank, Revenue Bonds (Series I), 3.900% (AMBAC INS)/(Original Issue Yield: 3.96%), 12/1/2012
| | AAA/Aaa | | | 259,335 |
| 250,000 | | Vermont Municipal Bond Bank, Revenue Bonds (Series I), 4.000% (AMBAC INS)/(Original Issue Yield: 4.07%), 12/1/2013
| | AAA/Aaa | | | 257,108 |
| 340,000 | | Vermont Municipal Bond Bank, Revenue Bonds (Series A), 4.800% (MBIA Insurance Corp. INS)/(Original Issue Yield: 4.85%), 6/1/2009
| | NR/Aaa | | | 372,762 |
| 500,000 | | Vermont Municipal Bond Bank, Refunding Revenue Bonds (Series 1), 3.900% (MBIA Insurance Corp. INS)/(Original Issue Yield: 3.92%), 12/1/2013
| | NR/Aaa | | | 512,905 |
| 165,000 | | Vermont Municipal Bond Bank, Refunding Revenue Bonds (Series 2), 4.300% (FSA INS)/(Original Issue Yield: 4.40%), 12/1/2006
| | AAA/Aaa | | | 173,857 |
| 665,000 | | Vermont Municipal Bond Bank, Refunding Revenue Bonds (Series 2), 4.400% (FSA INS)/(Original Issue Yield: 4.45%), 12/1/2007
| | AAA/Aaa | | | 711,816 |
| 500,000 | | Vermont Municipal Bond Bank, Refunding Revenue Bonds (Series 2), 5.200% (AMBAC INS)/(Original Issue Yield: 5.30%), 12/1/2007
| | AAA/Aaa | | | 531,255 |
| 50,000 | | Vermont Municipal Bond Bank, Refunding Revenue Bonds (Series I), 3.300% (MBIA Insurance Corp. INS)/(Original Issue Yield: 3.42%), 12/1/2010
| | NR/Aaa | | | 50,876 |
| 520,000 | | Vermont Municipal Bond Bank, Refunding Revenue Bonds (Series I), 3.600% (MBIA Insurance Corp. INS)/(Original Issue Yield: 3.66%), 12/1/2011
| | NR/Aaa | | | 533,109 |
Principal
Amount
|
|
|
| Credit
Rating
|
1
|
| Value
|
| | | LONG-TERM MUNICIPALS--continued | | | | | |
| | | Vermont--continued | | | | | |
| $ | 550,000 | | Vermont Municipal Bond Bank, Refunding Revenue Bonds (Series I), 3.750% (MBIA Insurance Corp. INS)/(Original Issue Yield: 3.80%), 12/1/2012
| | NR/Aaa | | $ | 564,641 |
| 1,000,000 | | Vermont Public Power Supply Authority, Refunding Revenue Bonds (Series D), 4.500% (McNeil Project)/(AMBAC INS), 7/1/2005
| | AAA/Aaa | | | 1,025,030 |
| 840,000 | | Vermont Public Power Supply Authority, Refunding Revenue Bonds (Series E), 5.000% (McNeil Project)/(MBIA Insurance Corp. INS), 7/1/2011
| | AAA/Aaa | | | 934,013 |
| 500,000 | | Vermont Public Power Supply Authority, Refunding Revenue Bonds (Series E), 5.250% (McNeil Project)/(MBIA Insurance Corp. INS), 7/1/2015
| | AAA/Aaa | | | 566,005 |
| 500,000 | | Vermont State Colleges, Revenue Bonds, 2.250% (FGIC INS), 7/1/2006
| | AAA/Aaa | | | 504,215 |
| 945,000 | | Vermont State Student Assistance Corp., Revenue Bonds, 5.000% (Original Issue Yield: 5.08%), 3/1/2034
| | NR/A2 | | | 945,520 |
| 665,000 | | Vermont State Student Assistance Corp., Revenue Bonds, 5.000% (Original Issue Yield: 5.03%), 3/1/2026
| | NR/A2 | | | 670,041 |
| 500,000 | | Vermont State, UT GO Bonds (Series A), 4.400% (Original Issue Yield: 4.45%), 1/15/2007
| | AA+/Aa1 | | | 529,200 |
| 250,000 | | Vermont State, UT GO Bonds (Series A), 4.750% (Original Issue Yield: 4.87%), 8/1/2020
| | AA+/Aa1 | | | 259,923 |
| 1,600,000 | | Vermont State, UT GO Bonds (Series A), 5.000% (U.S. Treasury PRF 1/15/2006 @102), 1/15/2008
| | AA+/Aa1 | | | 1,703,888 |
| 1,300,000 | | Vermont State, UT GO Bonds (Series A), 5.000% (Original Issue Yield: 5.10%), (U.S. Treasury PRF 1/15/2006 @102), 1/15/2010
| | AA+/Aa1 | | | 1,384,409 |
| 1,065,000 | | Vermont State, UT GO Bonds (Series A), 5.000%, 1/15/2005
| | AA+/Aa1 | | | 1,079,697 |
| 1,100,000 | | Vermont State, UT GO Bonds (Series B), 4.300% (Original Issue Yield: 4.40%), 10/15/2004
| | AA+/Aa1 | | | 1,104,081 |
| 500,000 | | Vermont State, UT GO Bonds (Series C), 4.600% (Original Issue Yield: 4.75%), 1/15/2009 (@101)
| | AA+/Aa1 | | | 534,505 |
| 1,000,000 | | Vermont State, UT GO Refunding Bonds (Series A), 2.000%, 2/1/2007
| | AA+/Aa1 | | | 1,002,130 |
| 1,000,000 | | Vermont State, UT GO Refunding Bonds (Series A), 2.125% (Original Issue Yield: 2.17%), 2/1/2008
|
| AA+/Aa1
|
|
| 990,310
|
| | | TOTAL
|
|
|
|
| 64,869,457
|
| | | TOTAL LONG-TERM MUNICIPALS (IDENTIFIED COST $67,836,010)
|
|
|
|
| 69,738,920
|
Principal
Amount
|
|
|
| Credit
Rating
|
1
|
| Value
|
| | | SHORT-TERM MUNICIPALS--1.0% | | | | | |
| | | Puerto Rico--1.0% | | | | | |
| $ | 700,000 | | Puerto Rico GDB, Weekly VRDNs (MBIA Insurance Corp. INS)/(Credit Suisse First Boston LIQ) (AT AMORTIZED COST)
|
| A-1/VMIG1
|
| $
| 700,000
|
| | | TOTAL INVESTMENTS--99.2% (IDENTIFIED COST $68,536,010) 4
|
|
|
|
| 70,438,920
|
| | | OTHER ASSETS AND LIABILITIES - NET--0.8%
|
|
|
|
| 576,408
|
| | | TOTAL NET ASSETS--100%
|
|
|
| $
| 71,015,328
|
Securities that are subject to the federal alternative minimum tax (AMT) represent 16.3% of the Fund's portfolio as calculated based upon total portfolio market value (percentage is unaudited).
1 Please refer to the Statement of Additional Information for an explanation of the credit ratings. Current credit ratings are unaudited.
2 Denotes a restricted security, including securities purchased under Rule 144A of the Securities Act of 1933. These securities, unless registered under the Act or exempted from registration, may only be sold to qualified institutional investors. At August 31, 2004, these securities amounted to $15,282,290 which represents 21.5% of total net assets.
3 Denotes a restricted security, including securities purchased under Rule 144A that have been deemed liquid by criteria approved by the Fund's Board of Trustees. At August 31, 2004, these securities amounted to $9,435,281 which represents 13.3% of total net assets.
4 The cost of investments for federal tax purposes amounts to $68,536,010.
Note: The categories of investments are shown as a percentage of total net assets at August 31, 2004.
The following acronyms are used throughout this portfolio:
| AMBAC | - --American Municipal Bond Assurance Corporation |
| FGIC | - --Financial Guaranty Insurance Company |
| FSA | - --Financial Security Assurance, Inc. |
| GDB | - --Government Development Bank |
| GO | - --General Obligation |
| HFA | - --Housing Finance Authority |
| INS | - --Insured |
| LIQ | - --Liquidity Agreement |
| LOC | - --Letter of Credit |
| MFH | - --Multi Family Housing |
| PRF | - --Prerefunded |
| SFM | - --Single Family Mortgage |
| TOBs | - --Tender Option Bonds |
| UT | - --Unlimited Tax |
| VRDNs | - --Variable Rate Demand Notes |
| VRNs | - --Variable Rate Notes |
See Notes which are an integral part of the Financial Statements
Statement of Assets and Liabilities
August 31, 2004
Assets:
| | | | | | | |
Total investments in securities, at value (identified cost $68,536,010)
| | | | | $ | 70,438,920 | |
Income receivable
| | | | | | 760,560 | |
Receivable for investments sold
|
|
|
|
|
| 522,500
|
|
TOTAL ASSETS
|
|
|
|
|
| 71,721,980
|
|
Liabilities:
| | | | | | | |
Payable for shares redeemed
| | $ | 250,359 | | | | |
Income distribution payable
| | | 10,386 | | | | |
Payable to bank
| | | 442,813 | | | | |
Payable for shareholder services fee (Note 5)
| | | 971 | | | | |
Accrued expenses
|
|
| 2,123
|
|
|
|
|
TOTAL LIABILITIES
|
|
|
|
|
| 706,652
|
|
Net assets for 6,999,463 shares outstanding
|
|
|
|
| $
| 71,015,328
|
|
Net Assets Consist of:
| | | | | | | |
Paid-in capital
| | | | | $ | 69,011,765 | |
Net unrealized appreciation of investments
| | | | | | 1,902,910 | |
Accumulated net realized gain on investments
| | | | | | 102,450 | |
Distributions in excess of net investment income
|
|
|
|
|
| (1,797
| )
|
TOTAL NET ASSETS
|
|
|
|
| $
| 71,015,328
|
|
Net Asset Value, Offering Price and Redemption Proceeds Per Share:
| | | | | | | |
Net asset value per share ($71,015,328 ÷ 6,999,463 shares outstanding), no par value, unlimited shares authorized
|
|
|
|
|
| $10.15
|
|
Offering price per share (100/95.50 of $10.15) 1
|
|
|
|
|
| $10.63
|
|
Redemption proceeds per share
|
|
|
|
|
| $10.15
|
|
1 See "What Do Shares Cost?" in the Prospectus.
See Notes which are an integral part of the Financial Statements
Statement of Operations
Year Ended August 31, 2004
Investment Income:
| | | | | | | | | | | |
Interest
|
|
| | | | | | | | $ | 2,991,849 |
Dividends
|
|
|
|
|
|
|
|
|
|
| 14,450
|
TOTAL INCOME
|
|
|
|
|
|
|
|
|
|
| 3,006,299
|
Expenses:
| | | | | | | | | | | |
Investment adviser fee (Note 5)
| | | | | | $ | 382,833 | | | | |
Administrative personnel and services fee (Note 5)
| | | | | | | 115,204 | | | | |
Custodian fees (Note 5)
| | | | | | | 15,984 | | | | |
Transfer and dividend disbursing agent fees and expenses (Note 5)
| | | | | | | 23,349 | | | | |
Directors'/Trustees' fees
| | | | | | | 7,833 | | | | |
Auditing fees
| | | | | | | 18,338 | | | | |
Legal fees
| | | | | | | 24,518 | | | | |
Portfolio accounting fees
| | | | | | | 73,444 | | | | |
Distribution services fee (Note 5)
| | | | | | | 51,011 | | | | |
Shareholder services fee (Note 5)
| | | | | | | 191,610 | | | | |
Share registration costs
| | | | | | | 13,403 | | | | |
Printing and postage
| | | | | | | 4,022 | | | | |
Insurance premiums
| | | | | | | 3,398 | | | | |
Miscellaneous
|
|
|
|
|
|
| 2,662
|
|
|
|
|
TOTAL EXPENSES
|
|
|
|
|
|
| 927,609
|
|
|
|
|
Waivers and Reimbursement (Note 5):
| | | | | | | | | | | |
Waiver of investment adviser fee
| | $ | (258,986 | ) | | | | | | | |
Waiver of administrative personnel and services fee
| | | (133 | ) | | | | | | | |
Waiver of distribution services fee
| | | (51,011 | ) | | | | | | | |
Reimbursement of legal expenses
|
|
| (18,621
| )
|
|
|
|
|
|
|
|
TOTAL WAIVERS AND REIMBURSEMENT
|
|
|
|
|
|
| (328,751
| )
|
|
|
|
Net expenses
|
|
|
|
|
|
|
|
|
|
| 598,858
|
Net investment income
|
|
|
|
|
|
|
|
|
|
| 2,407,441
|
Realized and Unrealized Gain (Loss) on Investments:
| | | | | | | | | | | |
Net realized gain on investments
| | | | | | | | | | | 242,028 |
Net change in unrealized appreciation of investments
|
|
|
|
|
|
|
|
|
|
| 229,527
|
Net realized and unrealized gain on investments
|
|
|
|
|
|
|
|
|
|
| 471,555
|
Change in net assets resulting from operations
|
|
|
|
|
|
|
|
|
| $
| 2,878,996
|
See Notes which are an integral part of the Financial Statements
Statement of Changes in Net Assets
Year Ended August 31
|
|
| 2004
|
|
|
| 2003
|
|
Increase (Decrease) in Net Assets
| | | | | | | | |
Operations:
| | | | | | | | |
Net investment income
| | $ | 2,407,441 | | | $ | 2,745,529 | |
Net realized gain on investments
| | | 242,028 | | | | 15,633 | |
Net change in unrealized appreciation/depreciation of investments
|
|
| 229,527
|
|
|
| (1,386,452
| )
|
CHANGE IN NET ASSETS RESULTING FROM OPERATIONS
|
|
| 2,878,996
|
|
|
| 1,374,710
|
|
Distributions to Shareholders:
| | | | | | | | |
Distributions from net investment income
| | | (2,415,172 | ) | | | (2,743,633 | ) |
Distributions from net realized gains
|
|
| (93,477
| )
|
|
| - --
|
|
CHANGE IN NET ASSETS RESULTING FROM DISTRIBUTIONS TO SHAREHOLDERS
|
|
| (2,508,649
| )
|
|
| (2,743,633
| )
|
Share Transactions:
| | | | | | | | |
Proceeds from sale of shares
| | | 5,732,692 | | | | 10,906,820 | |
Net asset value of shares issued to shareholders in payment of distributions declared
| | | 943 | | | | 456 | |
Cost of shares redeemed
|
|
| (15,585,894
| )
|
|
| (11,173,115
| )
|
CHANGE IN NET ASSETS RESULTING FROM SHARE TRANSACTIONS
|
|
| (9,852,259
| )
|
|
| (265,839
| )
|
Change in net assets
|
|
| (9,481,912
| )
|
|
| (1,634,762
| )
|
Net Assets:
| | | | | | | | |
Beginning of period
|
|
| 80,497,240
|
|
|
| 82,132,002
|
|
End of period (including undistributed (distributions in excess of) net investment income of $(1,797) and $5,934, respectively)
|
| $
| 71,015,328
|
|
| $
| 80,497,240
|
|
See Notes which are an integral part of the Financial Statements
Notes to Financial Statements
August 31, 2004
1. ORGANIZATION
Federated Municipal Securities Income Trust (the "Trust") is registered under the Investment Company Act of 1940, as amended (the "Act"), as an open-end, management investment company. The Trust consists of seven portfolios. The financial statements included herein are only those of Federated Vermont Municipal Income Fund (the "Fund"), a non-diversified portfolio. The financial statements of the other portfolios are presented separately. The assets of each portfolio are segregated and a shareholder's interest is limited to the portfolio in which shares are held. The investment objective of the Fund is to provide current income exempt from federal regular income tax and the personal income taxes imposed by the state of Vermont and Vermont municipalities.
The Fund is a newly created portfolio of the Trust, and is the successor to the Banknorth Vermont Municipal Bond Fund (the "Former Fund"). The Former Fund was established on October 2, 2000, and was reorganized into the Fund on August 27, 2004. The Former Fund was the successor to a portfolio of assets of CF Vermont Tax Exempt Fund (the "Common Trust Fund"), a common trust fund, which were transferred to the Former Fund on October 2, 2000 in exchange for the Former Fund's shares. The Common Trust Fund was not registered under the Act and, therefore, was not subject to certain investment restrictions that are imposed by the Act. If the Common Trust Fund had been registered under the Act, performance may be adversely affected.
2. SIGNIFICANT ACCOUNTING POLICIES
The following is a summary of significant accounting policies consistently followed by the Fund in the preparation of its financial statements. These policies are in conformity with generally accepted accounting principles (GAAP) in the United States of America.
Investment Valuation
Municipal bonds are valued by an independent pricing service, taking into consideration yield, liquidity, risk, credit quality, coupon, maturity, type of issue, and any other factors or market data the pricing service deems relevant. Short-term securities are valued at the prices provided by an independent pricing service. However, short-term securities with remaining maturities of 60 days or less at the time of purchase may be valued at amortized cost, which approximates fair market value. Investments in other open-end regulated investment companies are valued at net asset value. Securities for which no quotations are readily available are valued at fair value as determined in accordance with procedures established by and under general supervision of the Board of Trustees (the "Trustees").
Investment Income, Expenses and Distributions
Interest income and expenses are accrued daily. Dividend income and distributions to shareholders are recorded on the ex-dividend date. Non-cash dividends included in dividend income, if any, are recorded at fair value.
Premium and Discount Amortization
All premiums and discounts on fixed income securities are amortized/accreted.
Federal Taxes
It is the Fund's policy to comply with the Subchapter M provision of the Internal Revenue Code (the "Code") and to distribute to shareholders each year substantially all of its income. Accordingly, no provision for federal income tax is necessary.
When-Issued and Delayed Delivery Transactions
The Fund may engage in when-issued or delayed delivery transactions. The Fund records when-issued securities on the trade date and maintains security positions such that sufficient liquid assets will be available to make payment for the securities purchased. Securities purchased on a when-issued or delayed delivery basis are marked to market daily and begin earning interest on the settlement date. Losses may occur on these transactions due to changes in market conditions or the failure of counterparties to perform under the contract.
Restricted Securities
Restricted securities are securities that may only be resold upon registration under federal securities laws or in transactions exempt from such registration. In some cases, the issuer of restricted securities has agreed to register such securities for resale, at the issuer's expense, either upon demand by the Fund or in connection with another registered offering of the securities. Many restricted securities may be resold in the secondary market in transactions exempt from registration. Such restricted securities may be determined to be liquid under criteria established by the Trustees. The Fund will not incur any registration costs upon such resales. The Fund's restricted securities are valued at the price provided by dealers in the secondary market or, if no market prices are available, at the fair value as determined in accordance with procedures established by and under general supervision of the Trustees.
Additional information on restricted securities, including securities purchased under Rule 144A that have not been deemed liquid by the Trustees, for each security held at August 31, 2004, is as follows:
Security
|
| Acquisition Date
|
| Acquisition Cost
|
Vermont Economic Development Authority, Revenue Bonds (Series A), 6.180% (Vermont Tubbs), 8/31/2006
|
| 9/18/1996
|
| $ 41,676
|
Vermont Educational and Health Buildings Financing Agency, Revenue Bonds (Series 1996), VRNs, (North Country Hospital and Nursing Home), 10/1/2011
|
| 11/7/1996
|
| 1,218,000
|
Vermont Educational and Health Buildings Financing Agency, Revenue Bonds (Series 1999 A), 3.570% (Marlboro College), 4/1/2019
|
| 3/22/1999
|
| 4,575,000
|
Vermont HFA, Revenue Bonds, 64 School Street Limited Partnership, 2.400% (Vermont HFA MFH), 10/30/2004
|
| 11/13/2003
|
| 1,100,000
|
Vermont HFA, Revenue Bonds, Cabot Commons Limited Partnership, 2.750% (Vermont HFA MFH), 3/15/2005
|
| 7/7/2004
|
| 760,000
|
Vermont HFA, Revenue Bonds, Colonial West Limited Partnership, 2.750% (Vermont HFA MFH), 5/30/2005
|
| 5/5/2004
|
| 225,000
|
Vermont HFA, Revenue Bonds, Mountainview Street Jay Housing Limited Partnership, 2.750% (Vermont HFA MFH), 4/30/2005
|
| 10/15/2003
|
| 2,123,000
|
Vermont HFA, Revenue Bonds Smallest City Housing LTD, 2.500% (Vermont HFA MFH), 12/31/2004
|
| 12/1/2003
|
| 2,230,000
|
Vermont HFA, Revenue Bonds Wall Street Housing Limited Partnership, 2.450% (Vermont HFA MFH), 11/10/2004
|
| 10/15/2003
|
| 1,650,000
|
Vermont HFA, Revenue Bonds Whetsone Housing Limited Partnership, 2.500% (Vermont HFA MFH), 11/30/2004
|
| 2/4/2004
|
| 1,350,000
|
Use of Estimates
The preparation of financial statements in conformity with GAAP requires management to make estimates and assumptions that affect the amounts of assets, liabilities, expenses and revenues reported in the financial statements. Actual results could differ from those estimated.
Other
Investment transactions are accounted for on a trade date basis. Realized gains and losses from investment transactions are recorded on an identified cost basis.
3. SHARES OF BENEFICIAL INTEREST
The following table summarizes share activity:
Year Ended August 31
|
| 2004
|
|
| 2003
|
|
Shares sold
| | 561,431 | | | 1,057,592 | |
Shares issued to shareholders in payment of distributions declared
| | 93 | | | 44 | |
Shares redeemed
|
| (1,529,255
| )
|
| (1,091,335
| )
|
NET CHANGE RESULTING FROM SHARE TRANSACTIONS
|
| (967,731
| )
|
| (33,699
| )
|
4. FEDERAL TAX INFORMATION
The tax character of distributions as reported on the Statement of Changes in Net Assets for the years ended August 31, 2004 and 2003 was as follows:
|
|
| 2004
|
|
| 2003
|
Tax-exempt income
|
| $
| 2,413,600
|
| $
| 2,735,844
|
Ordinary income 1
|
| $
| 1,572
|
| $
| 7,789
|
Long-term capital gains
|
| $
| 93,477
|
|
| - --
|
1 For tax purposes short-term capital gain distributions are considered ordinary income distributions.
As of August 31, 2004, the components of distributable earnings on a tax basis were as follows:
Undistributed tax-exempt income
|
| $
| 8,589
|
Undistributed long-term capital gain
|
| $
| 102,450
|
Unrealized appreciation
|
| $
| 1,902,910
|
At August 31, 2004, the cost of investments for federal tax purposes was $68,536,010. The net unrealized appreciation of investments for federal tax purposes was $1,902,910. This consists of net unrealized appreciation from investments for those securities having an excess of value over cost of $1,946,360 and net unrealized depreciation from investments for those securities having an excess of cost over value of $43,450.
5. INVESTMENT ADVISER FEE AND OTHER TRANSACTIONS WITH AFFILIATES
Investment Adviser Fee
Federated Investment Management Company, the Fund's investment adviser (the "Adviser"), receives for its services an annual investment adviser fee equal to 0.40% of the Fund's average daily net assets. The Adviser may voluntarily choose to waive any portion of its fee and/or reimburse certain operating expenses of the Fund. The Adviser can modify or terminate this voluntary waiver and/or reimbursement at any time at its sole discretion. Prior to the reorganization the Fund was advised by Banknorth Investment Advisers (Banknorth), who received an annual investment adviser fee equal to 0.50% of the Fund's average daily net assets. The fees paid to the Adviser and Banknorth for the year ended August 31, 2004 were $593 and $123,254, respectively, after voluntary waiver, if applicable.
Administrative Fee
Federated Administrative Services (FAS), under the Administrative Services Agreement, provides the Fund with administrative personnel and services. The fee paid to FAS is based on the average aggregate daily net assets of all Federated funds as specified below:
Maximum
Administrative Fee
|
| Average Aggregate Daily Net Assets
of the Federated Funds
|
0.150%
|
| on the first $5 billion
|
0.125%
|
| on the next $5 billion
|
0.100%
|
| on the next $10 billion
|
0.075%
|
| on assets in excess of $20 billion
|
The administrative fee received during any fiscal year shall be at least $150,000 per portfolio and $40,000 per each additional class of Shares. FAS may voluntarily choose to waive any portion of its fee. FAS can modify or terminate this voluntary waiver at any time at its sole discretion.
Prior to the reorganization, Federated Services Company (FServ) provided the Fund with administrative personnel and services. The fee paid to FServ was based on a scale that ranged from 0.15% to 0.10% of the Fund's average aggregate daily net assets, subject to a $75,000 annual minimum. For the year ended August 31, 2004, the fees paid to FAS and FServ were $1,269 and $113,802, respectively, after voluntary waiver, if applicable.
Distribution Services Fee
The Fund has adopted a Distribution Plan (the "Plan") pursuant to Rule 12b-1 under the Act. Under the terms of the Plan, the Fund will compensate Federated Securities Corp. (FSC), the principal distributor, from the daily net assets of the Fund's shares to finance activities intended to result in the sale of these shares. The Plan provides that the Fund may incur distribution expenses of up to 0.25% of average daily net assets, annually, to compensate FSC. Prior to the reorganization, Edgewood Services, Inc. ("Edgewood") was the principal distributor.
For the reporting period ended August 31, 2004, FSC and Edgewood contractually waived their distribution (12b-1) fees.
Shareholder Services Fee
Under the terms of a Shareholder Services Agreement with Federated Shareholder Services Company (FSSC), the Fund will pay FSSC up to 0.25% of the average daily net assets of the Fund's Shares for the period. The fee paid to FSSC is used to finance certain services for shareholders and to maintain shareholder accounts. FSSC may voluntarily choose to waive any portion of its fee. FSSC can modify or terminate this voluntary waiver at any time at its sole discretion.
Transfer and Dividend Disbursing Agent Fees and Expenses
Prior to July 1, 2004, FServ served as transfer and dividend disbursing agent for the Fund. The fee paid to FServ was based on the size, type and number of accounts and transactions made by shareholders. The fee paid to FServ during the reporting period was $23,029.
General
Certain of the Officers and Trustees of the Trust are Officers and Directors or Trustees of the above companies.
6. INVESTMENT TRANSACTIONS
Purchases and sales of investments, excluding long-term U.S. government securities and short-term obligations (and in-kind contributions), for the year ended August 31, 2004, were as follows:
Purchases
|
| $
| 18,177,161
|
Sales
|
| $
| 26,610,988
|
7. CONCENTRATION OF CREDIT RISK
Since the Fund invests a substantial portion of its assets in issuers located in one state, it will be more susceptible to factors adversely affecting issuers of that state than would be a comparable tax-exempt mutual fund that invests nationally. In order to reduce the credit risk associated with such factors, at August 31, 2004, 50.2% of the securities in the portfolio of investments are backed by letters of credit or bond insurance of various financial institutions and financial guaranty assurance agencies. The largest percentage of investments insured by or supported (backed) by a letter of credit from any one institution or agency was 20.5% of total investments.
8. LEGAL PROCEEDINGS
Beginning in October 2003, Federated Investors, Inc. and various subsidiaries thereof (including the advisers and distributor for various investment companies, collectively, "Federated"), along with various investment companies sponsored by Federated ("Funds") were named as defendants in several class action lawsuits now pending in the United States District Court for the District of Maryland seeking damages of unspecified amounts. The lawsuits were purportedly filed on behalf of people who purchased, owned and/or redeemed shares of Federated-sponsored mutual funds during specified periods beginning November 1, 1998. The suits are generally similar in alleging that Federated engaged in illegal and improper trading practices including market timing and late trading in concert with certain institutional traders, which allegedly caused financial injury to the mutual fund shareholders. Federated and various Funds have also been named as defendants in several additional lawsuits, the majority of which are now pending in the United States District Court for the Western District of Pennsylvania, alleging, among other things, excessive advisory and Rule 12b-1 fees, and seeking damages of unspecified amounts. The Board of the Funds has retained the law firm of Dickstein Shapiro Morin & Oshinsky LLP to represent the Funds in these lawsuits. Federated and the Funds, and their respective counsel, are reviewing the allegations and will respond appropriately. Additional lawsuits based upon similar allegations may be filed in the future. The potential impact of these recent lawsuits and future potential similar suits is uncertain. Although we do not believe that these lawsuits will have a material adverse effect on the Funds, there can be no assurance that these suits, the ongoing adverse publicity and/or other developments resulting from the related regulatory investigations will not result in increased Fund redemptions, reduced sales of Fund shares, or other adverse consequences for the Funds.
9. FEDERAL TAX INFORMATION (UNAUDITED)
For the year ended August 31, 2004, the amount of long-term capital gain designated by the Fund was $93,477.
At August 31, 2004, 99.93% of the distributions from net investment income is exempt from federal income tax, other than the federal AMT.
Report of Independent Registered Public Accounting Firm
TO THE BOARD OF TRUSTEES OF FEDERATED MUNICIPAL SECURITIES INCOME TRUST AND SHAREHOLDERS OF FEDERATED VERMONT MUNICIPAL INCOME FUND:
We have audited the accompanying statement of assets and liabilities, including the portfolio of investments, of Federated Vermont Municipal Income Fund (the "Fund") as of August 31, 2004, and the related statement of operations for the year then ended, the statement of changes in net assets for each of the two years in the period then ended, and the financial highlights for each of the four years in the period then ended. These financial statements and financial highlights are the responsibility of the Fund's management. Our responsibility is to express an opinion on these financial statements and financial highlights based on our audits.
We conducted our audit in accordance with standards of the Public Company Accounting Oversight Board (United States). Those standards require that we plan and perform the audit to provide reasonable assurance about whether the financial statements and financial highlights are free of material misstatement. An audit includes examining, on a test basis, evidence supporting the amounts and disclosures in the financial statements. Our procedures included confirmation of the securities owned at August 31, 2004, by correspondence with the custodian. An audit also includes assessing the accounting principles used and significant estimates made by management, as well as evaluating the overall financial statement presentation. We believe our audits provide a reasonable basis for our opinion.
In our opinion, such financial statements and financial highlights present fairly, in all material respects, the financial position of the Fund as of August 31, 2004, the results of its operations, the changes in its net assets and its financial highlights for the respective stated periods, in conformity with accounting principles generally accepted in the United States of America.
Deloitte & Touche LLP
Boston, Massachusetts
October 20, 2004
Board of Trustees and Trust Officers
The Board is responsible for managing the Trust's business affairs and for exercising all the Trust's powers except those reserved for the shareholders. The following tables give information about each Board member and the senior officers of the Fund. Where required, the tables separately list Board members who are "interested persons" of the Fund ( i.e. , "Interested" Board members) and those who are not ( i.e. , "Independent" Board members). Unless otherwise noted, the address of each person listed is Federated Investors Tower, 1001 Liberty Avenue, Pittsburgh, PA. The Trust comprises seven portfolios and the Federated Fund Complex consists of 44 investment companies (comprising 136 portfolios). Unless otherwise noted, each Officer is elected annually. Unless otherwise noted, each Board member oversees all portfolios in the Federated Fund Complex and serves for an indefinite term. The Fund's Statement of Additional Information includes additional information about Trust Trustees and is available, without charge and upon request, by calling 1-800-341-7400.
INTERESTED TRUSTEES BACKGROUND
|
|
|
Name
Birth Date
Address
Positions Held with Trust
Date Service Began
|
| Principal Occupation(s) for Past Five Years,
Other Directorships Held and Previous Position(s)
|
John F. Donahue*
Birth Date: July 28, 1924
CHAIRMAN AND TRUSTEE
Began serving: August 1990 | | Principal Occupations : Chairman and Director or Trustee of the Federated Fund Complex; Chairman and Director, Federated Investors, Inc.
Previous Positions : Trustee, Federated Investment Management Company and Chairman and Director, Federated Investment Counseling. |
|
|
|
J. Christopher Donahue*
Birth Date: April 11, 1949
PRESIDENT AND TRUSTEE
Began serving: August 1990 | | Principal Occupations : Principal Executive Officer and President of the Federated Fund Complex; Director or Trustee of some of the Funds in the Federated Fund Complex; President, Chief Executive Officer and Director, Federated Investors, Inc.; Chairman and Trustee, Federated Investment Management Company; Trustee, Federated Investment Counseling; Chairman and Director, Federated Global Investment Management Corp.; Chairman, Passport Research, Ltd.; Trustee, Federated Shareholder Services Company; Director, Federated Services Company.
Previous Positions : President, Federated Investment Counseling; President and Chief Executive Officer, Federated Investment Management Company, Federated Global Investment Management Corp. and Passport Research, Ltd. |
|
|
|
|
|
|
Name
Birth Date
Address
Positions Held with Trust
Date Service Began
|
| Principal Occupation(s) for Past Five Years,
Other Directorships Held and Previous Position(s)
|
Lawrence D. Ellis, M.D.*
Birth Date: October 11, 1932
3471 Fifth Avenue
Suite 1111
Pittsburgh, PA
TRUSTEE
Began serving: August 1990 | | Principal Occupations : Director or Trustee of the Federated Fund Complex; Professor of Medicine, University of Pittsburgh; Medical Director, University of Pittsburgh Medical Center Downtown; Hematologist, Oncologist and Internist, University of Pittsburgh Medical Center.
Other Directorships Held : Member, National Board of Trustees, Leukemia Society of America.
Previous Positions : Trustee, University of Pittsburgh; Director, University of Pittsburgh Medical Center. |
|
|
|
* Family relationships and reasons for "interested" status: John F. Donahue is the father of J. Christopher Donahue; both are "interested" due to the positions they hold with Federated Investors, Inc. and its subsidiaries. Lawrence D. Ellis, M.D. is "interested" because his son-in-law is employed by the Fund's principal underwriter, Federated Securities Corp.
INDEPENDENT TRUSTEES BACKGROUND
|
|
|
Name
Birth Date
Address
Positions Held with Trust
Date Service Began
|
| Principal Occupation(s) for Past Five Years,
Other Directorships Held and Previous Position(s)
|
Thomas G. Bigley
Birth Date: February 3, 1934
15 Old Timber Trail
Pittsburgh, PA
TRUSTEE
Began serving: November 1994 | | Principal Occupation : Director or Trustee of the Federated Fund Complex.
Other Directorships Held : Director, Member of Executive Committee, Children's Hospital of Pittsburgh; Director, University of Pittsburgh.
Previous Position : Senior Partner, Ernst & Young LLP. |
|
|
|
John T. Conroy, Jr.
Birth Date: June 23, 1937
Grubb & Ellis/Investment
Properties Corporation
3838 North Tamiami Trail
Suite 402
Naples, FL
TRUSTEE
Began serving: August 1991 | | Principal Occupations : Director or Trustee of the Federated Fund Complex; Chairman of the Board, Investment Properties Corporation; Partner or Trustee in private real estate ventures in Southwest Florida.
Previous Positions : President, Investment Properties Corporation; Senior Vice President, John R. Wood and Associates, Inc., Realtors; President, Naples Property Management, Inc. and Northgate Village Development Corporation. |
|
|
|
|
|
|
Name
Birth Date
Address
Positions Held with Trust
Date Service Began
|
| Principal Occupation(s) for Past Five Years,
Other Directorships Held and Previous Position(s)
|
Nicholas P. Constantakis
Birth Date: September 3, 1939
175 Woodshire Drive
Pittsburgh, PA
TRUSTEE
Began serving: February 1998 | | Principal Occupations : Director or Trustee of the Federated Fund Complex.
Other Directorships Held : Director and Member of the Audit Committee, Michael Baker Corporation (engineering and energy services worldwide).
Previous Position : Partner, Andersen Worldwide SC. |
|
|
|
John F. Cunningham
Birth Date: March 5, 1943
353 El Brillo Way
Palm Beach, FL
TRUSTEE
Began serving: July 1999 | | Principal Occupation : Director or Trustee of the Federated Fund Complex.
Other Directorships Held : Chairman, President and Chief Executive Officer, Cunningham & Co., Inc. (strategic business consulting); Trustee Associate, Boston College.
Previous Positions : Director, Redgate Communications and EMC Corporation (computer storage systems); Chairman of the Board and Chief Executive Officer, Computer Consoles, Inc.; President and Chief Operating Officer, Wang Laboratories; Director, First National Bank of Boston; Director, Apollo Computer, Inc. |
|
|
|
Peter E. Madden
Birth Date: March 16, 1942
One Royal Palm Way
100 Royal Palm Way
Palm Beach, FL
TRUSTEE
Began serving: August 1991 | | Principal Occupation : Director or Trustee of the Federated Fund Complex; Management Consultant.
Other Directorships Held : Board of Overseers, Babson College.
Previous Positions : Representative, Commonwealth of Massachusetts General Court; President, State Street Bank and Trust Company and State Street Corporation (retired); Director, VISA USA and VISA International; Chairman and Director, Massachusetts Bankers Association; Director, Depository Trust Corporation; Director, The Boston Stock Exchange. |
|
|
|
Charles F. Mansfield, Jr.
Birth Date: April 10, 1945
80 South Road
Westhampton Beach, NY
TRUSTEE
Began serving: January 1999 | | Principal Occupations : Director or Trustee of the Federated Fund Complex; Management Consultant; Executive Vice President, DVC Group, Inc. (marketing communications and technology) (prior to 9/1/00).
Previous Positions : Chief Executive Officer, PBTC International Bank; Partner, Arthur Young & Company (now Ernst & Young LLP); Chief Financial Officer of Retail Banking Sector, Chase Manhattan Bank; Senior Vice President, HSBC Bank USA (formerly, Marine Midland Bank); Vice President, Citibank; Assistant Professor of Banking and Finance, Frank G. Zarb School of Business, Hofstra University. |
|
|
|
|
|
|
Name
Birth Date
Address
Positions Held with Trust
Date Service Began
|
| Principal Occupation(s) for Past Five Years,
Other Directorships Held and Previous Position(s)
|
John E. Murray, Jr., J.D., S.J.D.
Birth Date: December 20, 1932
Chancellor, Duquesne University
Pittsburgh, PA
TRUSTEE
Began serving: February 1995 | | Principal Occupations : Director or Trustee of the Federated Fund Complex; Chancellor and Law Professor, Duquesne University; Partner, Murray, Hogue and Lannis.
Other Directorships Held : Director, Michael Baker Corp. (engineering, construction, operations and technical services).
Previous Positions : President, Duquesne University; Dean and Professor of Law, University of Pittsburgh School of Law; Dean and Professor of Law, Villanova University School of Law. |
|
|
|
Marjorie P. Smuts
Birth Date: June 21, 1935
4905 Bayard Street
Pittsburgh, PA
TRUSTEE
Began serving: August 1990 | | Principal Occupations : Director or Trustee of the Federated Fund Complex; Public Relations/Marketing Consultant/Conference Coordinator.
Previous Positions : National Spokesperson, Aluminum Company of America; television producer; President, Marj Palmer Assoc.; Owner, Scandia Bord. |
|
|
|
John S. Walsh
Birth Date: November 28, 1957
2604 William Drive
Valparaiso, IN
TRUSTEE
Began serving: July 1999 | | Principal Occupations : Director or Trustee of the Federated Fund Complex; President and Director, Heat Wagon, Inc. (manufacturer of construction temporary heaters); President and Director, Manufacturers Products, Inc. (distributor of portable construction heaters); President, Portable Heater Parts, a division of Manufacturers Products, Inc.
Previous Position : Vice President, Walsh & Kelly, Inc. |
|
|
|
OFFICERS
|
|
|
Name
Birth Date
Positions Held with Trust
Date Service Began
|
| Principal Occupation(s) for Past Five Years and Previous Position(s)
|
John W. McGonigle
Birth Date: October 26, 1938
EXECUTIVE VICE PRESIDENT
AND SECRETARY
Began serving: August 1990 | | Principal Occupations : Executive Vice President and Secretary of the Federated Fund Complex; Executive Vice President, Secretary and Director, Federated Investors, Inc. |
|
|
|
Richard J. Thomas
Birth Date: June 17, 1954
TREASURER
Began serving: November 1998 | | Principal Occupations : Principal Financial Officer and Treasurer of the Federated Fund Complex; Senior Vice President, Federated Administrative Services. |
|
|
|
Richard B. Fisher
Birth Date: May 17, 1923
VICE CHAIRMAN
Began serving: August 2002 | | Principal Occupations : Vice Chairman or President of some of the Funds in the Federated Fund Complex; Vice Chairman, Federated Investors, Inc.; Chairman, Federated Securities Corp.
Previous Positions : President and Director or Trustee of some of the Funds in the Federated Fund Complex; Executive Vice President, Federated Investors, Inc. and Director and Chief Executive Officer, Federated Securities Corp. |
|
|
|
Mary Jo Ochson
Birth Date: September 12, 1953
CHIEF INVESTMENT OFFICER
Began serving: May 2004 | | Principal Occupations: Mary Jo Ochson has been the Fund's Portfolio Manager since July 2004. Ms. Ochson was named Chief Investment Officer of tax-exempt, fixed-income products in 2004. She joined Federated in 1982 and has been a Senior Portfolio Manager and a Senior Vice President of the Fund's Adviser since 1996. Ms. Ochson is a Chartered Financial Analyst and received her M.B.A. in Finance from the University of Pittsburgh. |
|
|
|
J. Scott Albrecht
Birth Date: June 1, 1960
VICE PRESIDENT
Began serving: November 1998 | | J. Scott Albrecht is Vice President of the Trust. Mr. Albrecht joined Federated in 1989. He has been a Senior Portfolio Manager since 1997 and a Vice President of the Fund's Adviser since 1994. He was a Portfolio Manager from 1994 to 1996. Mr. Albrecht is a Chartered Financial Analyst and received his M.S. in Public Management from Carnegie Mellon University. |
|
|
|
Mutual funds are not bank deposits or obligations, are not guaranteed by any bank, and are not insured or guaranteed by the U.S. government, the Federal Deposit Insurance Corporation, the Federal Reserve Board, or any other government agency. Investment in mutual funds involves investment risk, including the possible loss of principal.
This report is authorized for distribution to prospective investors only when preceded or accompanied by the Fund's prospectus, which contains facts concerning its objective and policies, management fees, expenses, and other information.
VOTING PROXIES ON FUND PORTFOLIO SECURITIES
A description of the policies and procedures that the Fund uses to determine how to vote proxies relating to securities held in the Fund's portfolio is available, without charge and upon request, by calling 1-800-341-7400. A report on "Form N-PX" of how the Fund voted any such proxies during the most recent 12-month period ended June 30 is available through Federated's website. Go to http://www.federatedinvestors.com, select "Products," select the "Prospectuses and Regulatory Reports" link, then select the Fund to access the link to Form N-PX. This information is also available from the EDGAR database on the SEC's website at http://www.sec.gov.
QUARTERLY PORTFOLIO SCHEDULE
The Fund files with the SEC a complete schedule of its portfolio holdings, as of the close of the first and third quarters of its fiscal year, on "Form N-Q." These filings are available on the SEC's website at http://www.sec.gov and may be reviewed and copied at the SEC's Public Reference Room in Washington, DC. (Call 1-800-SEC-0330 for information on the operation of the Public Reference Room.) You may also access this information from the "Products" section of Federated's website at www.federatedinvestors.com by clicking on "Portfolio Holdings" and selecting the name of the Fund, or by selecting the name of the Fund and clicking on "Portfolio Holdings." You must register on the website the first time you wish to access this information.
Federated
World-Class Investment Manager
Federated Vermont Municipal Income Fund
Federated Investors Funds
5800 Corporate Drive
Pittsburgh, PA 15237-7000
www.federatedinvestors.com
Contact us at 1-800-341-7400 or
www.federatedinvestors.com/contact
Federated Securities Corp., Distributor
Cusip 313923872
31280 (10/04)
Federated is a registered mark of Federated Investors, Inc. 2004 (c)Federated Investors, Inc.
Federated
World-Class Investment Manager
Federated North Carolina Municipal Income Fund
A Portfolio of Federated Municipal Securities Income Trust
ANNUAL SHAREHOLDER REPORT
August 31, 2004
FINANCIAL HIGHLIGHTS
SHAREHOLDER EXPENSE EXAMPLE
MANAGEMENT'S DISCUSSION OF FUND PERFORMANCE
PORTFOLIO OF INVESTMENTS SUMMARY TABLES
FINANCIAL STATEMENTS
REPORT OF INDEPENDENT REGISTERED PUBLIC ACCOUNTING FIRM
BOARD OF TRUSTEES AND TRUST OFFICERS
VOTING PROXIES ON FUND PORTFOLIO SECURITIES
QUARTERLY PORTFOLIO SCHEDULE
Not FDIC Insured * May Lose Value * No Bank Guarantee
Financial Highlights
(For a Share Outstanding Throughout Each Period)
| | Year Ended August 31,
|
|
| 2004
|
|
| 2003
|
|
| 2002
|
|
| 2001
|
|
| 2000
|
|
Net Asset Value, Beginning of Period
| | $10.92 | | | $11.07 | | | $10.99 | | | $10.45 | | | $10.44 | |
Income From Investment Operations:
| | | | | | | | | | | | | | | |
Net investment income
| | 0.48 | | | 0.48 | | | 0.50 | 1 | | 0.50 | | | 0.49 | |
Net realized and unrealized gain (loss) on investments, futures contracts and swap contracts
|
| 0.13
|
|
| (0.15
| )
|
| 0.08
| 1
|
| 0.54
|
|
| 0.02
|
|
TOTAL FROM INVESTMENT OPERATIONS
|
| 0.61
|
|
| 0.33
|
|
| 0.58
|
|
| 1.04
|
|
| 0.51
|
|
Less Distributions:
| | | | | | | | | | | | | | | |
Distributions from net investment income
| | (0.48 | ) | | (0.48 | ) | | (0.50 | ) | | (0.50 | ) | | (0.49 | ) |
Distributions from net realized gain on investments and futures contracts
|
| - --
|
|
|
--
|
|
|
--
|
|
|
--
|
|
|
(0.01
| )
|
TOTAL DISTRIBUTIONS
|
| (0.48
| )
|
| (0.48
| )
|
| (0.50
| )
|
| (0.50
| )
|
| (0.50
| )
|
Net Asset Value, End of Period
|
| $11.05
|
|
| $10.92
|
|
| $11.07
|
|
| $10.99
|
|
| $10.45
|
|
Total Return 2
|
| 5.61
| %
|
| 2.93
| %
|
| 5.48
| %
|
| 10.23
| %
|
| 5.14
| %
|
| | | | | | | | | | | | | | | |
Ratios to Average Net Assets:
|
|
|
|
|
|
|
|
|
|
|
|
|
|
|
|
Expenses
|
| 0.79
| %
|
| 0.79
| %
|
| 0.79
| %
|
| 0.79
| %
|
| 0.79
| %
|
Net investment income
|
| 4.26
| %
|
| 4.22
| %
|
| 4.62
| % 1
|
| 4.71
| %
|
| 4.77
| %
|
Expense waiver/reimbursement 3
|
| 0.56
| %
|
| 0.49
| %
|
| 0.61
| %
|
| 0.68
| %
|
| 0.79
| %
|
Supplemental Data:
|
|
|
|
|
|
|
|
|
|
|
|
|
|
|
|
Net assets, end of period (000 omitted)
|
| $56,289
|
|
| $82,430
|
|
| $55,261
|
|
| $47,235
|
|
| $41,449
|
|
Portfolio turnover
|
| 16
| %
|
| 16
| %
|
| 21
| %
|
| 28
| %
|
| 66
| %
|
1 Effective September 1, 2001, the Fund adopted the provisions of the American Institute of Certified Public Accountants (AICPA) Audit and Accounting Guide for Investment Companies and began accreting discount/amortizing premium on long-term debt securities. For the year ended August 31, 2002, this change had no effect on the net investment income per share or net realized and unrealized gain (loss) on investments per share, but increased the ratio of net investment income to average net assets from 4.61% to 4.62%. Per share, ratios and supplemental data for the periods prior to September 1, 2001 have not been restated to reflect this change in presentation.
2 Based on net asset value, which does not reflect the sales charge, redemption fee or contingent deferred sales charge, if applicable. Total returns for periods of less than one year are not annualized.
3 This voluntary expense decrease is reflected in both the expense and the net investment income ratios shown above.
See Notes which are an integral part of the Financial Statements
Shareholder Expense Example
As a shareholder of the Fund, you incur two types of costs: (1) transaction costs, including sales charges (load) on purchase payments; and (2) ongoing costs, including management fees, distribution (12b-1) fees, shareholder services fees, and other Fund expenses. This Example is intended to help you to understand your ongoing costs (in dollars) of investing in the Fund and to compare these costs with the ongoing costs of investing in other mutual funds. It is based on an investment of $1,000 invested at the beginning of the period and held for the entire period from March 1, 2004 to August 31, 2004.
ACTUAL EXPENSES
The first section of the table below provides information about actual account values and actual expenses. You may use the information in this section, together with the amount you invested, to estimate the expenses that you incurred over the period. Simply divide your account value by $1,000 (for example, an $8,600 account value divided by $1,000 = 8.6), then multiply the result by the number in the first section under the heading entitled "Expenses Paid During Period" to estimate the expenses attributable to your investment during this period.
HYPOTHETICAL EXAMPLE FOR COMPARISON PURPOSES
The second section of the table below provides information about hypothetical account values and hypothetical expenses based on the Fund's actual expense ratio and an assumed rate of return of 5% per year before expenses, which is not the Fund's actual return. Thus, you should not use the hypothetical account values and expenses to estimate the actual ending account balance or your expenses for the period. Rather, these figures are provided to enable you to compare the ongoing costs of investing in the Fund and other funds. To do so, compare this 5% hypothetical example with the 5% hypothetical examples that appear in the shareholder reports of the other funds.
Please note that the expenses shown in the table are meant to highlight your ongoing costs only and do not reflect any transaction costs, such as sales charges (loads). Therefore, the second section of the table is useful in comparing ongoing costs only, and will not help you determine the relative total costs of owning different funds. In addition, if these transaction costs were included, your costs would have been higher.
|
| Beginning
Account Value
3/1/2004
|
| Ending
Account Value
8/31/2004
|
| Expenses Paid
During Period 1
|
Actual:
|
| $1,000
|
| $ 990.80
|
| $3.95
|
Hypothetical (assuming a 5% return before expenses):
|
| $1,000
|
| $1,021.17
|
| $4.01
|
1 Expenses are equal to Federated North Carolina Municipal Income Fund's annualized expense ratio of 0.79%, multiplied by the average account value over the period, multiplied by 184/366 (to reflect the one-half year period).
Management's Discussion of Fund Performance
The fund's total return, based on net asset value, for the 12-month reporting period was 5.61% for the Class A Shares. The total return consisted of 4.42% tax-exempt dividends, and 1.19% appreciation in net asset value of the shares. 1 The total return of the Lipper North Carolina Municipal Debt Funds Average (Average), a performance benchmark for the fund, was 5.95% during the 12-month reporting period. 2 The fund underperformed the Average in terms of total return, but delivered a higher income stream than the Average. 3 The fund' total return reflected actual cash flows, transaction cost and other expenses, which may not have been reflected in, or could otherwise differ from, the Average.
The fund's investment objective is to seek to provide current income exempt from federal regular income tax and the personal income taxes imposed by the state of North Carolina. To accomplish this objective, the fund's investment strategy focused on: (a) the selection of medium and lower investment-grade quality securities; these securities typically have higher yields than higher-quality, investment-grade securities available in the market; 4 and (b) the selection of intermediate to long maturity bonds that yield more than short-term bonds on an upward sloping yield curve (the "yield curve" shows the relative yield of similar securities with different maturities). The fund's strategy also focused on the effective duration of the fund's portfolio (which indicates the portfolio sensitivity to changes in interest rates), and on bonds with premium coupons (interest payments that are higher than current yields available in the market).
1 Performance data quoted represents past performance which is no guarantee of future results. Investment return and principal value will fluctuate so that an investor's shares, when redeemed, may be worth more or less than their original cost. Mutual fund performance changes over time and current performance may be lower or higher than what is stated. For current to the most recent month-end performance, visit www.federatedinvestors.com or call 1-800-341-7400.
2 The Average is an average of funds with similar objectives, and represents the average of the total returns reported by all mutual funds designated by Lipper, Inc. as falling into the respective category. It is not possible to invest directly in an average. The broad-based securities market index for the fund, as disclosed in the fund's prospectus, is the Lehman Brothers Municipal Bond Index (LBMB). The total return for the LBMB was 7.11% during the 12-month reporting period. The LBMB is a broad market performance benchmark for the tax-exempt bond market. To be included in the LBMB, bonds must have a minimum credit rating of Baa, have an outstanding par value of at least $3 million and be issued as part of a transaction of at least $50 million. The LBMB includes both zero coupon bonds and bonds subject to the alternative minimum tax. The LBMB is not adjusted to reflect sales charges, expenses, or other fees that the Securities and Exchange Commission (SEC) requires to be reflected in the fund's performance. Indexes are unmanaged, and it is not possible to invest directly in an index. The fund's total return reflected actual cash flows, transaction costs and other expenses, which were not reflected in the total return of the LBMB.
3 Income may be subject to the federal alternative minimum tax.
4 Investment-grade securities are securities that are rated at least "BBB" or unrated securities of a comparable quality. Credit ratings are an indication of the risk that a security will default. They do not protect a security from credit risk. Lower-rated bonds typically offer higher yields to help compensate investors for the increased risk associated with them. Among these risks are lower creditworthiness, greater price volatility, more risk to principal and income than with higher-rated securities and increased possibilities of default.
CREDIT QUALITY
Credit spreads, or the yield difference between the "AAA"-rated municipal bonds and bonds of lower credit quality and similar maturity, tightened during the reporting period (meaning that the yield on lower-rated, investment-grade debt improved to a greater extent, or declined to a lesser extent, than for higher-rated, investment-grade debt). Municipal Market Data (MMD) reported that credit spreads between "BBB"-rated general obligation bonds and "AAA"-rated general obligation bonds tightened by 16 basis points to 28 basis points. The fund's holdings in medium- and lower-rated, investment-grade securities helped the fund's performance, because they generally outperformed higher-rated, investment-grade securities during the reporting period.
YIELD CURVE AND MATURITY
During the reporting period, the municipal bond market was characterized by a generally falling and flattening, although still upward sloping, yield curve. MMD reported that, during the reporting period, rates on "AAA"-rated general obligation bonds with maturities of four years or less rose by 2 basis points to 43 basis points, while similar bonds with maturities of five years and longer saw yields fall by up to 50 basis points. The overall effect was that longer-maturity, lower-rated bonds tended to outperform shorter-maturity, higher-rated bonds. The fund's performance, therefore, benefited from its concentration in municipal bonds in the intermediate (general five to ten year) and long (generally ten or longer) parts of the yield curve.
DURATION 5
The fund's dollar-weighted average duration at the end of the reporting period was 4.69 years. Duration management is a significant component of the fund's investment strategy. As interest rates were expected to rise during the reporting period, the fund hedged the portfolio (adjusted the duration shorter) using forward-settling municipal interest rate swaps and Treasury futures contracts. The fund's use of these instruments, however, hurt the fund's performance relative to the Average because these instruments did not perform as well given that longer-term and intermediate-term municipal interest rates declined over the reporting period.
5 Duration is a measure of a security's price sensitivity to changes in interest rates. Securities with longer durations are more sensitive to changes in interest rates than securities with shorter durations.
GROWTH OF A $10,000 INVESTMENT 1
The graph below illustrates the hypothetical investment of $10,000 2 in Federated North Carolina Municipal Income Fund (the "Fund") from August 31, 1994 to August 31, 2004, compared to the Lehman Brothers Municipal Bond Index (LBMB) 3 and the Lipper North Carolina Municipal Debt Funds Average (LNCMDFA). 4
Average Annual Total Return 5 for the Period Ended 8/31/2004
|
|
|
1 Year
|
| 0.90%
|
5 Years
|
| 4.88%
|
10 Years
|
| 5.18%
|
Performance data quoted represents past performance which is no guarantee of future results. Returns shown do not reflect the deduction of taxes that a shareholder may pay on Fund distributions or the redemption of Fund shares. For after-tax returns, visit www.federatedinvestors.com. Investment return and principal value will fluctuate so that an investor's shares, when redeemed, may be worth more or less than their original cost. Mutual fund performance changes over time and current performance may be lower or higher than what is stated. Mutual funds are not obligations of or guaranteed by any bank and are not federally insured.
1 Federated North Carolina Municipal Income Fund is the successor to CCB North Carolina Municipal Securities Fund. The quoted performance data includes performance of the CCB North Carolina Municipal Securities Fund for the period from July 22, 1992 when the CCB North Carolina Municipal Securities Fund first commenced operations, to July 23, 1999, as adjusted to reflect the Fund's expenses.
2 Represents a hypothetical investment of $10,000 in the Fund after deducting the maximum sales charge of 4.50% ($10,000 investment minus $450 sales charge=$9,550). The Fund's performance assumes the reinvestment of all dividends and distributions. The LBMB and the LNCMDFA have been adjusted to reflect reinvestment of dividends on securities in the index and the average. Indexes are unmanaged and it is not possible to invest directly in an index or an average.
3 The LBMB is an unmanaged index comprising bonds with a minimum credit rating of at least Baa. They must have an outstanding par value of at least $3 million and be issued as part of a transaction of at least $50 million. The index includes both zero coupon bonds and bonds subject to the federal alternative minimum tax. It is not adjusted to reflect sales charges, expenses, or other fees that the Securities and Exchange Commission (SEC) requires to be reflected in the Fund's performance.
4 The LNCMDFA represents the average of the total returns reported by all of the mutual funds designated by Lipper, Inc. as falling into the respective category. These total returns are reported net of expenses and other fees that the SEC requires to be reflected in a mutual fund's performance.
5 Total return quoted reflects all applicable sales charges.
Portfolio of Investments Summary Tables
At August 31, 2004, the fund's credit quality ratings composition 1 was as follows:
S&P Long-Term Ratings as
Percentage of Total Investments 2
| | Moody's Long-Term Ratings as
Percentage of Total Investments 2
|
AAA
|
| 33.0%
| | Aaa
|
| 47.6%
|
AA
|
| 25.2%
| | Aa
|
| 7.1%
|
A
|
| 7.5%
| | A
|
| 2.8%
|
BBB
|
| 12.4%
| | Baa
|
| 15.0%
|
Not rated by S&P
|
| 21.9%
| | Not rated by Moody's
|
| 27.5%
|
TOTAL
|
| 100%
| | TOTAL
|
| 100%
|
1 These tables depict the long-term credit quality ratings assigned to the fund's portfolio holdings by Standard & Poor's and Moody's Investors Service, each of which is a Nationally Recognized Statistical Rating Organization (NRSRO). These credit-quality ratings are shown without regard to gradations within a given rating category. For example, securities rated "A-" have been included in the "Not rated by..." category. Rated securities that have been prerefunded, but not rated again by the NRSRO, also have been included in the "Not-rated by..." category. Rated securities include a security with an obligor and/or credit enhancer that has received a rating from an NRSRO with respect to a class of debt obligations that is comparable in priority and security with the security held by the fund. Credit quality ratings are an assessment of the risk that a security will default in payment and do not address other risks presented by the security. Please see the description of credit quality ratings in the fund's Statement of Additional Information.
Each table depicts the long-term credit quality ratings as assigned only by the NRSRO identified in the table. Of the portfolio's total investments, 12.0% is not rated by either of these NRSROs.
2 Percentages are based on total investments, which may differ from total net assets.
Portfolio of Investments
August 31, 2004
Principal
Amount
|
|
|
| Credit
Rating
| 1
|
| Value
|
| | | LONG-TERM MUNICIPALS--96.6% | | | | | |
| | | North Carolina--86.2% | | | | | |
| $ | 1,190,000 | | Appalachian State University, NC, Parking System Revenue Bonds, 5.625% (FSA INS)/(Original Issue Yield: 5.65%), 7/15/2025
| | NR/Aaa | | $ | 1,306,501 |
| 945,000 | | Asheville, NC Housing Authority, Multifamily Housing Revenue Bonds, 5.625% TOBs (Oak Knoll Apartments Project)/(FNMA GTD) 9/1/2021
| | AAA/NR | | | 1,005,130 |
| 500,000 | | Broad River, NC Water Authority, Water System Revenue Bonds (Series 2000), 5.375% (MBIA Insurance Corp. INS)/(Original Issue Yield: 5.55%), 6/1/2026
| | NR/Aaa | | | 532,030 |
| 1,330,000 | | Cabarrus County, NC, COP (Series 2002), 5.25%, 2/1/2018
| | AA-/Aa3 | | | 1,449,261 |
| 2,000,000 | | Charlotte, NC Airport, Revenue Bonds (Series B), 5.875% (MBIA Insurance Corp. INS)/(Original Issue Yield: 5.95%), 7/1/2019
| | AAA/Aaa | | | 2,208,940 |
| 1,000,000 | | Charlotte, NC, COP, 5.50% (Charlotte Convention Facilities)/(Original Issue Yield: 5.70%), 12/1/2020
| | AA+/Aa2 | | | 1,110,590 |
| 1,000,000 | | Columbus County, NC Industrial Facilities & PCFA, Revenue Bonds (Series 1996A), 5.85% (International Paper Co.), 12/1/2020
| | BBB/Baa2 | | | 1,033,140 |
| 1,000,000 | | Cumberland County, NC, UT GO Bonds, 5.70% (Original Issue Yield: 5.78%), 9/15/2004
| | AA-/Aa3 | | | 1,134,840 |
| 1,000,000 | | Durham County, NC, Multifamily Housing Revenue Bonds, 5.65% TOBs (Alston Village Apartments)/(FNMA GTD) 3/1/2034
| | AAA/NR | | | 1,057,960 |
| 1,000,000 | | Fayetteville, NC Public Works Commission, Revenue Bonds (Series 1999), 5.70% (U.S. Treasury PRF 3/1/2010 @ 101)/ (Original Issue Yield: 5.79%), 3/1/2019
| | AAA/Aaa | | | 1,151,870 |
| 1,000,000 | | Forsyth County, NC, COP, 5.375%, 10/1/2022
| | AA+/Aa1 | | | 1,077,170 |
| 900,000 | | Gastonia, NC Combined Utilities System, Water & Sewer Revenue Bonds, 5.625% (MBIA Insurance Corp. INS)/(Original Issue Yield: 5.85%), 5/1/2019
| | AAA/Aaa | | | 1,011,204 |
| 750,000 | | Harnett County, NC, COP, 5.50% (FSA INS), 12/1/2015
| | AAA/Aaa | | | 845,400 |
| 1,000,000 | | Haywood County, NC Industrial Facilities & PCFA, Revenue Refunding Bonds, 6.40% (Champion International Corp.)/(Original Issue Yield: 6.42%), 11/1/2024
| | NR/Baa2 | | | 1,058,320 |
| 1,000,000 | | High Point, NC, Public Improvement UT GO Bonds (Series 2000B), 5.50% (Original Issue Yield: 5.67%), 6/1/2018
| | AA/Aa3 | | | 1,128,240 |
| 1,500,000 | | Martin County, NC IFA (Series 1995), Solid Waste Disposal Revenue Bonds, 6.00% (Weyerhaeuser Co.), 11/1/2025
| | BBB/Baa2 | | | 1,537,395 |
Principal
Amount
|
|
|
| Credit
Rating
| 1
|
| Value
|
| | | LONG-TERM MUNICIPALS--continued | | | | | |
| | | North Carolina--continued | | | | | |
| $ | 500,000 | | North Carolina Eastern Municipal Power Agency, Power Supply Revenue Refunding Bonds (Series D), 5.125% (Original Issue Yield: 5.33%), 1/1/2026
| | BBB/Baa2 | | $ | 501,645 |
| 500,000 | | North Carolina Eastern Municipal Power Agency, Power System Refunding Revenue Bonds (Series 2003C), 5.375% (Original Issue Yield: 5.57%), 1/1/2017
| | BBB/Baa2 | | | 532,775 |
| 500,000 | | North Carolina Eastern Municipal Power Agency, Power System Revenue Bonds (Series 1999D), 6.70%, 1/1/2019
| | BBB/Baa2 | | | 561,895 |
| 880,000 | | North Carolina HFA, Home Ownership Revenue Bonds (Series 5-A), 5.55%, 1/1/2019
| | AA/Aa2 | | | 919,635 |
| 780,000 | | North Carolina HFA, Home Ownership Revenue Bonds (Series 6-A), 6.10%, 1/1/2018
| | AA/Aa2 | | | 826,496 |
| 300,000 | | North Carolina Medical Care Commission, FHA INS Mortgage Revenue Bonds (Series 2003), 5.375% (Betsy Johnson Regional Hospital)/(FSA INS), 10/1/2024
| | AAA/Aaa | | | 322,977 |
| 500,000 | | North Carolina Medical Care Commission, Health Care Facilities First Mortgage Revenue Bonds (Series 2001), 6.625% (Moravian Homes, Inc.)/(Original Issue Yield: 7.00%), 4/1/2031
| | NR | | | 510,700 |
| 500,000 | | North Carolina Medical Care Commission, Health Care Facilities First Mortgage Revenue Bonds, 6.25% (Arbor Acres Community)/(Original Issue Yield: 6.40%), 3/1/2027
| | NR | | | 500,360 |
| 500,000 | | North Carolina Medical Care Commission, Health Care Facilities First Mortgage Revenue Bonds, 6.875% (Presbyterian Homes, Inc.)/(Original Issue Yield: 7.00%), 10/1/2021
| | NR | | | 534,430 |
| 500,000 | | North Carolina Medical Care Commission, Health Care Facilities First Mortgage Revenue Refunding Bonds (Series 2004A), 5.00% (Deerfield Episcopal Retirement Community), 11/1/2023
| | NR | | | 497,220 |
| 1,000,000 | | North Carolina Medical Care Commission, Health Care Facilities Revenue Bonds (Series 1999), 6.25% (Stanly Memorial Hospital Project)/(Original Issue Yield: 6.40%), 10/1/2019
| | A-/NR | | | 1,080,510 |
| 250,000 | | North Carolina Medical Care Commission, Health Care Facilities Revenue Bonds (Series 2002A), 5.25% (Union Regional Medical Center)/(Original Issue Yield: 5.33%), 1/1/2021
| | A/A2 | | | 258,037 |
| 200,000 | | North Carolina Medical Care Commission, Health Care Facilities Revenue Bonds (Series 2002A), 5.25% (Union Regional Medical Center)/(Original Issue Yield: 5.38%), 1/1/2022
| | A/A2 | | | 204,688 |
| 1,360,000 | | North Carolina Medical Care Commission, Health Care Facilities Revenue Bonds (Series 2003A), 5.00% (Novant Health Obligated Group), 11/1/2017
| | AA-/Aa3 | | | 1,445,190 |
Principal
Amount
|
|
|
| Credit
Rating
| 1
|
| Value
|
| | | LONG-TERM MUNICIPALS--continued | | | | | |
| | | North Carolina--continued | | | | | |
| $ | 1,205,000 | | North Carolina Medical Care Commission, Health Care Facilities Revenue Bonds (Series 2004A), 5.25% (Cleveland Community Healthcare)/(AMBAC INS), 7/1/2021
| | AAA/Aaa | | $ | 1,289,953 |
| 1,230,000 | | North Carolina Medical Care Commission, Health Care Facilities Revenue Bonds, 5.50% (Hugh Chatham Memorial Hospital)/ (Radian Asset Assurance INS), 10/1/2019
| | AA/NR | | | 1,338,043 |
| 625,000 | | North Carolina Medical Care Commission, Health Care Facilities Revenue Bonds, 5.50% (Scotland Memorial Hospital)/(Radian Asset Assurance INS)/(Original Issue Yield: 5.593%), 10/1/2019
| | AA/NR | | | 678,488 |
| 1,000,000 | | North Carolina Medical Care Commission, Health System Revenue Bonds, 5.25% (Mission Health, Inc.)/(Original Issue Yield: 5.48%), 10/1/2026
| | AA/Aa3 | | | 1,030,490 |
| 1,000,000 | | North Carolina Medical Care Commission, Hospital Revenue Bonds (Series 2000), 5.50% (Northeast Medical Center)/ (AMBAC INS)/(Original Issue Yield: 5.74%), 11/1/2025
| | AAA/Aaa | | | 1,068,610 |
| 1,000,000 | | North Carolina Medical Care Commission, Hospital Revenue Bonds (Series 2002A), 5.375% (Southeastern Regional Medical Center)/(Original Issue Yield: 5.48%), 6/1/2032
| | A/NR | | | 1,011,740 |
| 1,000,000 | | North Carolina Medical Care Commission, Hospital Revenue Bonds, 6.125% (Southeastern Regional Medical Center)/ (Original Issue Yield: 6.25%), 6/1/2019
| | A/A3 | | | 1,078,970 |
| 685,000 | | North Carolina Medical Care Commission, Hospital Revenue Bonds, 5.50% (Maria Parham Medical Center)/(Radian Asset Assurance INS), 10/1/2018
| | AA/NR | | | 748,938 |
| 250,000 | | North Carolina Medical Care Commission, Retirement Facilities First Mortgage Revenue Bonds (Series 2002), 6.25% (Forest at Duke)/(Original Issue Yield: 6.35%), 9/1/2021
| | NR | | | 260,823 |
| 500,000 | | North Carolina Medical Care Commission, Retirement Facilities First Mortgage Revenue Bonds (Series 2003A), 6.375% (Givens Estates)/(Original Issue Yield: 6.50%), 7/1/2023
| | NR | | | 504,850 |
| 550,000 | | North Carolina Medical Care Commission, Retirement Facilities First Mortgage Revenue Bonds (Series 2004C), 6.00% (Cypress Glen)/(Original Issue Yield: 6.092%), 10/1/2033
| | NR | | | 555,143 |
| 1,000,000 | | North Carolina Municipal Power Agency No. 1, Revenue Bonds (Series 1999B), 6.50% (Catawba Electric)/(Original Issue Yield: 6.73%), 1/1/2020
| | BBB+/Baa1 | | | 1,110,490 |
| 1,320,000 | | North Carolina Municipal Power Agency No. 1, Revenue Bonds, 10.50% (Catawba Electric)/(Escrowed In Treasuries COL), 1/1/2010
| | AAA/Aaa | | | 1,628,735 |
Principal
Amount
|
|
|
| Credit
Rating
| 1
|
| Value
|
| | | LONG-TERM MUNICIPALS--continued | | | | | |
| | | North Carolina--continued | | | | | |
| $ | 1,000,000 | | Northern Hospital District of Surry County, NC, Health Care Facilities Revenue Refunding Bonds (Series 2001), 5.10% (Northern Hospital of Surry County)/(Radian Asset Assurance INS)/(Original Issue Yield: 5.242%), 10/1/2021
| | AA/NR | | $ | 1,030,540 |
| 1,200,000 | | Piedmont Triad Airport Authority, NC, Airport Revenue Bonds (Series 1999A), 5.875% (FSA INS)/(Original Issue Yield: 6.02%), 7/1/2019
| | AAA/Aaa | | | 1,352,928 |
| 1,000,000 | | Pitt County, NC, COP (Series 2000B), 5.50% (FSA INS)/ (Original Issue Yield: 5.63%), 4/1/2025
| | AAA/Aaa | | | 1,078,210 |
| 1,500,000 | | Pitt County, NC, Refunding Bonds, 5.25% (Pitt County Memorial Hospital)/(Escrowed In Treasuries COL)/(Original Issue Yield: 5.85%), 12/1/2021
| | NR/Aaa | | | 1,586,265 |
| 2,000,000 | | Randolph County, NC, COP (Series 2000), 5.60% (FSA INS)/(Original Issue Yield: 5.77%), 6/1/2018
| | AAA/Aaa | | | 2,277,820 |
| 890,000 | | University of North Carolina System Pool, Revenue Bonds (Series A), 5.25% (University of North Carolina)/(AMBAC INS), 4/1/2021
| | AAA/Aaa | | | 966,415 |
| 500,000 | | Wilmington, NC Water & Sewer System, Revenue Bonds (Series 1999), 5.625% (FSA INS)/(Original Issue Yield: 5.76%), 6/1/2018
|
| NR/Aaa
|
|
| 562,450
|
| | | TOTAL
|
|
|
|
| 48,504,450
|
| | | Puerto Rico--9.5% | | | | | |
| 1,500,000 | 2,3 | Puerto Rico Electric Power Authority, Drivers (Series 266), 9.415% (FSA INS), 7/1/2015
| | AAA/NR | | | 2,008,920 |
| 1,000,000 | 2,3 | Puerto Rico Highway and Transportation Authority, Residual Interest Tax-Exempt Securities (Series PA 331A), 9.152% (AMBAC INS), 1/1/2010
| | NR | | | 1,320,540 |
| 500,000 | | Puerto Rico Highway and Transportation Authority, Transportation Revenue Bonds (Series G), 5.00% (Original Issue Yield: 5.10%), 7/1/2033
| | A/Baa1 | | | 505,305 |
| 395,000 | | Puerto Rico Industrial, Tourist, Educational, Medical & Environmental Control Facilities Financing Authority, Cogeneration Facility Revenue Bonds (Series 2000A), 6.625% (AES Puerto Rico Project)/(Original Issue Yield: 6.65%), 6/1/2026
| | NR/Baa3 | | | 423,128 |
| 1,000,000 | | Puerto Rico Public Finance Corp., Commonwealth Appropriation Bonds (Series 2001E), 5.75% (Original Issue Yield: 5.80%), 8/1/2030
|
| BBB+/Baa2
|
|
| 1,089,780
|
| | | TOTAL
|
|
|
|
| 5,347,673
|
| | | Virgin Islands--0.9% | | | | | |
| 500,000 | | University of the Virgin Islands, UT GO Bonds (Series A), 5.375% (Original Issue Yield: 5.43%), 6/1/2034
|
| BBB/NR
|
|
| 512,795
|
| | | TOTAL LONG-TERM MUNICIPALS
(IDENTIFIED COST $50,377,275)
|
|
|
|
| 54,364,918
|
Principal
Amount
|
|
|
| Credit
Rating
| 1
|
| Value
|
| | | SHORT-TERM MUNICIPALS--1.8% | | | | | |
| | | Puerto Rico--1.8% | | | | | |
| $ | 1,000,000 | | Puerto Rico Government Development Bank (GDB) Weekly VRDNs (MBIA Insurance Corp. INS)/(Credit Suisse First Boston LIQ)(AT AMORTIZED COST)
|
| AAA/Aaa
|
| $
| 1,000,000
|
| | | TOTAL INVESTMENTS--98.4%
(IDENTIFIED COST $51,377,275) 4
|
|
|
|
| 55,364,918
|
| | | OTHER ASSETS AND LIABILITIES - NET - 1.6%
|
|
|
|
| 923,956
|
| | | TOTAL NET ASSETS--100%
|
|
|
| $
| 56,288,874
|
Securities subject to the federal alternative minimum tax (AMT) represent 18.2% of the Fund's portfolio as calculated based upon total portfolio market value (percentage is unaudited).
1 Please refer to the Statement of Additional Information for an explanation of the credit ratings. Current credit ratings are unaudited.
2 Denotes a restricted security, including securities purchased under Rule 144A of the Securities Act of 1933. These securities, unless registered under the Act or exempted from registration, may only be sold to qualified institutional investors. At August 31, 2004, these securities amounted to $3,329,460 which represents 5.9% of total net assets.
3 Denotes a restricted security, including securities purchased under Rule 144A that have been deemed liquid by criteria approved by the Fund's Board of Trustees. At August 31, 2004, these securities amounted to $3,329,460 which represents 5.9% of total net assets.
4 The cost of investments for federal tax purposes amounts to $51,374,521.
Note: The categories of investments are shown as a percentage of total net assets at August 31, 2004.
The following acronyms are used throughout this portfolio:
| AMBAC | - --American Municipal Bond Assurance Corporation |
| COL | - --Collateralized |
| COP | - --Certificate of Participation |
| FHA | - --Federal Housing Administration |
| FNMA | - --Federal National Mortgage Association |
| FSA | - --Financial Security Assurance |
| GO | - --General Obligation |
| GTD | - --Guaranteed |
| HFA | - --Housing Finance Authority |
| IFA | - --Industrial Finance Authority |
| INS | - --Insured |
| LIQ | - --Liquidity Agreement |
| PCFA | - --Pollution Control Finance Authority |
| PRF | - --Prerefunded |
| TOBs | - --Tender Option Bonds |
| UT | - --Unlimited Tax |
| VRDNs | - --Variable Rate Demand Notes |
See Notes which are an integral part of the Financial Statements
Statement of Assets and Liabilities
August 31, 2004
Assets:
| | | | | | | |
Total investments in securities, at value (identified cost $51,377,275)
| | | | | $ | 55,364,918 | |
Cash
| | | | | | 63,393 | |
Income receivable
| | | | | | 821,743 | |
Receivable for investments sold
| | | | | | 130,000 | |
Receivable for shares sold
|
|
|
|
|
| 169,159
|
|
TOTAL ASSETS
|
|
|
|
|
| 56,549,213
|
|
Liabilities:
| | | | | | | |
Payable for shares redeemed
| | $ | 99,138 | | | | |
Income distribution payable
| | | 66,554 | | | | |
Payable for daily variation margin
| | | 72,373 | | | | |
Payable for shareholder services fees (Note 5)
| | | 11,937 | | | | |
Accrued expenses
|
|
| 10,337
|
|
|
|
|
TOTAL LIABILITIES
|
|
|
|
|
| 260,339
|
|
Net assets for 5,093,985 shares outstanding
|
|
|
|
| $
| 56,288,874
|
|
Net Assets Consist of:
| | | | | | | |
Paid-in capital
| | | | | $ | 53,522,392 | |
Net unrealized appreciation of investments and futures contracts
| | | | | | 3,999,456 | |
Accumulated net realized loss on investments, futures contracts and swap contracts
| | | | | | (1,232,992 | ) |
Undistributed net investment income
|
|
|
|
|
| 18
|
|
TOTAL NET ASSETS
|
|
|
|
| $
| 56,288,874
|
|
Net Asset Value, Offering Price and Redemption Proceeds Per Share:
| | | | | | | |
Net asset value per share ($56,288,874 ÷ 5,093,985 shares outstanding), no par value, unlimited shares authorized
|
|
|
|
|
| $11.05
|
|
Offering price per share (100/95.50 of $11.05) 1
|
|
|
|
|
| $11.57
|
|
Redemption proceeds per share
|
|
|
|
|
| $11.05
|
|
1 See "What Do Shares Cost?" in the Prospectus.
See Notes which are an integral part of the Financial Statements
Statement of Operations
Year Ended August 31, 2004
Investment Income:
| | | | | | | | | | | | |
Interest
|
|
|
|
|
|
|
|
|
| $
| 3,414,236
|
|
Expenses:
| | | | | | | | | | | | |
Investment adviser fee (Note 5)
| | | | | | $ | 270,316 | | | | | |
Administrative personnel and services fee (Note 5)
| | | | | | | 145,835 | | | | | |
Custodian fees
| | | | | | | 5,322 | | | | | |
Transfer and dividend disbursing agent fees and expenses (Note 5)
| | | | | | | 38,480 | | | | | |
Directors'/Trustees' fees
| | | | | | | 2,288 | | | | | |
Auditing fees
| | | | | | | 13,541 | | | | | |
Legal fees
| | | | | | | 6,707 | | | | | |
Portfolio accounting fees (Note 5)
| | | | | | | 50,259 | | | | | |
Distribution services fee (Note 5)
| | | | | | | 168,948 | | | | | |
Shareholder services fee (Note 5)
| | | | | | | 168,948 | | | | | |
Share registration costs
| | | | | | | 18,656 | | | | | |
Printing and postage
| | | | | | | 18,390 | | | | | |
Insurance premiums
| | | | | | | 7,738 | | | | | |
Miscellaneous
|
|
|
|
|
|
| 1,354
|
|
|
|
|
|
TOTAL EXPENSES
|
|
|
|
|
|
| 916,782
|
|
|
|
|
|
Waivers (Note 5):
| | | | | | | | | | | | |
Waiver of investment adviser fee
| | $ | (184,639 | ) | | | | | | | | |
Waiver of administrative personnel and services fee
| | | (20,298 | ) | | | | | | | | |
Waiver of transfer and dividend disbursing agent fees and expenses
| | | (5,711 | ) | | | | | | | | |
Waiver of distribution services fee
|
|
| (168,948
| )
|
|
|
|
|
|
|
|
|
TOTAL WAIVERS
|
|
|
|
|
|
| (379,596
| )
|
|
|
|
|
Net expenses
|
|
|
|
|
|
|
|
|
|
| 537,186
|
|
Net investment income
|
|
|
|
|
|
|
|
|
|
| 2,877,050
|
|
Realized and Unrealized Gain (Loss) on Investments, Futures Contracts, and Swap Contracts:
| | | | | | | | | | | | |
Net realized gain on investments
| | | | | | | | | | | 727,526 | |
Net realized loss on futures contracts
| | | | | | | | | | | (803,783 | ) |
Net realized loss on swap contracts
| | | | | | | | | | | (516,064 | ) |
Net change in unrealized appreciation of investments
| | | | | | | | | | | 2,180,340 | |
Net change in unrealized appreciation on futures contracts
| | | | | | | | | | | 11,813 | |
Net change in unrealized appreciation on swap contracts
|
|
|
|
|
|
|
|
|
|
| (67,450
| )
|
Net realized and unrealized gain on investments, futures contracts, and swap contracts
|
|
|
|
|
|
|
|
|
|
| 1,532,382
|
|
Change in net assets resulting from operations
|
|
|
|
|
|
|
|
|
| $
| 4,409,432
|
|
See Notes which are an integral part of the Financial Statements
Statement of Changes in Net Assets
Year Ended August 31
|
|
| 2004
|
|
|
| 2003
|
|
Increase (Decrease) in Net Assets
| | | | | | | | |
Operations:
| | | | | | | | |
Net investment income
| | $ | 2,877,050 | | | $ | 2,936,472 | |
Net realized loss on investments, futures contracts and swap contracts
| | | (592,321 | ) | | | (237,392 | ) |
Net change in unrealized appreciation/depreciation of investments, futures contracts, and swap contracts
|
|
| 2,124,703
|
|
|
| (1,365,873
| )
|
CHANGE IN NET ASSETS RESULTING FROM OPERATIONS
|
|
| 4,409,432
|
|
|
| 1,333,207
|
|
Distributions to Shareholders:
| | | | | | | | |
Distributions from net investment income
|
|
| (2,875,892
| )
|
|
| (2,934,354
| ) |
Share Transactions:
| | | | | | | | |
Proceeds from sale of shares
| | | 16,771,898 | | | | 39,633,760 | |
Net asset value of shares issued to shareholders in payment of distributions declared
| | | 1,582,277 | | | | 1,131,254 | |
Cost of shares redeemed
|
|
| (46,028,695
| )
|
|
| (11,995,218
| )
|
CHANGE IN NET ASSETS RESULTING FROM SHARE TRANSACTIONS
|
|
| (27,674,520
| )
|
|
| 28,769,796
|
|
Change in net assets
|
|
| (26,140,980
| )
|
|
| 27,168,649
|
|
Net Assets:
| | | | | | | | |
Beginning of period
|
|
| 82,429,854
|
|
|
| 55,261,205
|
|
End of period (including undistributed net investment income of $18 and $60, respectively)
|
| $
| 56,288,874
|
|
| $
| 82,429,854
|
|
See Notes which are an integral part of the Financial Statements
Notes to Financial Statements
August 31, 2004
1. ORGANIZATION
Federated Municipal Securities Income Trust (the "Trust") is registered under the Investment Company Act of 1940, as amended (the "Act"), as an open-end, management investment company. The Trust consists of seven portfolios. The financial statements included herein are only those of Federated North Carolina Municipal Income Fund (the "Fund"), a non-diversified portfolio. The financial statements of the other portfolios are presented separately. The assets of each portfolio are segregated and a shareholder's interest is limited to the portfolio in which shares are held. The investment objective of the Fund is to provide current income exempt from federal regular income tax and the personal income taxes imposed by the state of North Carolina. Interest from the Fund's investments may be subject to the federal AMT for individuals and corporations. The Fund offers one class of shares: Class A Shares.
2. SIGNIFICANT ACCOUNTING POLICIES
The following is a summary of significant accounting policies consistently followed by the Fund in the preparation of its financial statements. These policies are in conformity with generally accepted accounting principles (GAAP) in the United States of America.
Investment Valuation
Municipal bonds are valued by an independent pricing service, taking into consideration yield, liquidity, risk, credit quality, coupon, maturity, type of issue and any other factors or market data the pricing service deems relevant. Short-term securities are valued at the prices provided by an independent pricing service. However, short-term securities with remaining maturities of 60 days or less at the time of purchase may be valued at amortized cost, which approximates fair market value. Securities for which no quotations are readily available are valued at fair value as determined in accordance with procedures established by and under general supervision of the Board of Trustees (the "Trustees").
Investment Income, Expenses and Distributions
Interest income and expenses are accrued daily. Distributions to shareholders are recorded on the ex-dividend date. Non-cash dividends included in dividend income, if any, are recorded at fair value.
Premium and Discount Amortization
All premiums and discounts on fixed-income securities are amortized/accreted for financial statement purposes.
Federal Taxes
It is the Fund's policy to comply with the Subchapter M provision of the Internal Revenue Code (the "Code") and to distribute to shareholders each year substantially all of its income. Accordingly, no provision for federal income tax is necessary.
When-Issued and Delayed Delivery Transactions
The Fund may engage in when-issued or delayed delivery transactions. The Fund records when-issued securities on the trade date and maintains security positions such that sufficient liquid assets will be available to make payment for the securities purchased. Securities purchased on a when-issued or delayed delivery basis are marked to market daily and begin earning interest on the settlement date. Losses may occur on these transactions due to changes in market conditions or the failure of counterparties to perform under the contract.
Swap Contracts
The Fund may enter into swap contracts. A swap is an exchange of cash payments between the Fund and another party, which is based on a specific financial index. The value of the swap is adjusted daily and the change in value is recorded as unrealized appreciation or depreciation. When a swap contract is closed, the Fund recognizes a realized gain or loss. The swap contracts entered into by the Fund are on a forward settling basis. For the year ended August 31, 2004, the Fund had realized losses on swap contracts of $516,064.
Risks may arise upon entering into these agreements from the potential inability of the counterparties to meet the terms of their contract and from unanticipated changes in the value of the financial index on which the swap agreement is based. The Fund uses swaps for hedging purposes to reduce its exposure to interest rate fluctuations.
At August 31, 2004, the Fund had no open swap contracts.
Futures Contracts
The Fund periodically may sell bond interest rate futures contracts to manage duration, and to potentially reduce transaction costs. Upon entering into a bond interest rate futures contract with a broker, the Fund is required to deposit in a segregated account a specified amount of cash or U.S. government securities. Futures contracts are valued daily and unrealized gains or losses are recorded in a "variation margin" account. Daily, the Fund receives from or pays to the broker a specified amount of cash based upon changes in the variation margin account. When a contract is closed, the Fund recognizes a realized gain or loss. For the year end August 31, 2004, the Fund had realized losses on futures contracts of $803,783.
Futures contracts have market risks, including the risk that the change in the value of the contract may not correlate with changes in the value of the underlying securities.
At August 31, 2004, the Fund had outstanding futures contracts as set forth below:
Expiration Date
|
| Contracts
|
| Position
|
| Unrealized
Appreciation
|
December 2004
|
| 75 U.S. Treasury Note 10-Year Futures
|
| Short
|
| $11,813
|
Restricted Securities
Restricted securities are securities that may only be resold upon registration under federal securities laws or in transactions exempt from such registration. In some cases, the issuer of restricted securities has agreed to register such securities for resale, at the issuer's expense either upon demand by the Fund or in connection with another registered offering of the securities. Many restricted securities may be resold in the secondary market in transactions exempt from registration. Such restricted securities may be determined to be liquid under criteria established by the Trustees. The Fund will not incur any registration costs upon such resales. The Fund's restricted securities are valued at the price provided by dealers in the secondary market or, if no market prices are available, at the fair value as determined in accordance with procedures established by and under general supervision of the Trustees.
Additional information on restricted securities, including securities purchased under Rule 144A that have not been deemed liquid by the Trustees, for each security held at August 31, 2004, is as follows:
Security
|
| Acquisition Date
|
| Acquisition Cost
|
Puerto Rico Electric Power Authority, Drivers (Series 266), 9.415% (FSA INS), 7/1/2015
|
| 6/27/2003
|
| $1,813,581
|
Puerto Rico Highway and Transportation Authority, Residual Interest Tax-Exempt Securities (Series PA 331A), 9.152% (AMBAC INS), 1/1/2010
|
| 7/22/2003
|
| $1,256,096
|
Use of Estimates
The preparation of financial statements in conformity with GAAP requires management to make estimates and assumptions that affect the amounts of assets, liabilities, expenses and revenues reported in the financial statements. Actual results could differ from those estimated.
Other
Investment transactions are accounted for on a trade date basis. Realized gains and losses from investment transactions are recorded on an identified cost basis.
3. SHARES OF BENEFICIAL INTEREST
The following table summarizes share activity.
Year Ended August 31
|
| 2004
|
|
| 2003
|
|
Shares sold
|
| 1,509,133
|
|
| 3,537,083
|
|
Shares issued to shareholders in payment of distributions declared
|
| 142,350
|
|
| 101,455
|
|
Shares redeemed
|
| (4,108,095
| )
|
| (1,077,793
| )
|
NET CHANGE RESULTING FROM SHARE TRANSACTIONS
|
| (2,456,612
| )
|
| 2,560,745
|
|
4. FEDERAL TAX INFORMATION
The timing and character of income and capital gain distributions are determined in accordance with income tax regulations, which may differ from GAAP. These differences are due in part to differing treatments for discount accretion/premium amortization of debt securities.
For the year ended August 31, 2004, permanent differences identified and reclassified among the components of net assets were as follows:
Increase (Decrease)
|
Undistributed
Net Investment
Income (Loss)
|
| Accumulated
Net Realized
Gains (Losses)
|
$(1,200)
|
| $1,200
|
Net investment income (loss), net realized gains (losses), and net assets were not affected by this reclassification.
The tax character of distributions as reported on the Statement of Changes in Net Assets for the years ended August 31, 2004 and August 31, 2003, were as follows:
|
| 2004
|
| 2003
|
Tax-exempt income
|
| $2,875,892
|
| $2,934,354
|
As of August 31, 2004, the components of distributable earnings on a tax basis were as follows:
Undistributed tax-exempt income
|
| $
| 66,573
|
Unrealized appreciation
|
| $
| 4,002,210
|
Capital loss carryforward
|
| $
| 827,060
|
At August 31, 2004, the cost of investments for federal tax purposes was $51,374,521. The net unrealized appreciation of investments for federal tax purposes was $3,990,397. This consists of net unrealized appreciation from investments for those securities having an excess of value over cost of $3,993,177 and net unrealized depreciation from investments for those securities having an excess of cost over value of $2,780.
The difference between book-basis and tax-basis unrealized appreciation/depreciation is attributable to differing treatments for discount accretion/premium amortization of debt securities.
At August 31, 2004, the Fund had a capital loss carryforward of $827,060 which will reduce the Fund's taxable income arising from future net realized gains on investments, if any, to the extent permitted by the Code and thus will reduce the amount of distributions to shareholders which would otherwise be necessary to relieve the Fund of any liability for federal tax. Pursuant to the Code, such capital loss carryforward will expire as follows:
Expiration Year
|
| Expiration Amount
|
2008
|
| $332,559
|
2012
|
| $494,501
|
Under current tax regulations, capital losses realized after October 31 may be deferred and treated as occurring on the first day of the following fiscal year. As of August 31, 2004, for federal income tax purposes, post October losses of $396,875 were deferred to September 1, 2004.
5. INVESTMENT ADVISER FEE AND OTHER TRANSACTIONS WITH AFFILIATES
Investment Adviser Fee
Federated Investment Management Company, the Fund's investment adviser (the "Adviser"), receives for its services an annual investment adviser fee equal to 0.40% of the Fund's average daily net assets. The Adviser may voluntarily choose to waive any portion of its fee. The Adviser can modify or terminate this voluntary waiver at any time at its sole discretion.
Administrative Fee
Federated Administrative Services (FAS), under the Administrative Services Agreement, provides the Fund with administrative personnel and services. The fee paid to FServ is based on the average aggregate daily net assets of all Federated funds as specified below:
Maximum
Administrative Fee
|
| Average Aggregate Daily Net Assets
of the Federated Funds
|
0.150%
|
| on the first $5 billion
|
0.125%
|
| on the next $5 billion
|
0.100%
|
| on the next $10 billion
|
0.075%
|
| on assets in excess of $20 billion
|
The administrative fee received during any fiscal year shall be at least $150,000 per portfolio and $40,000 per each additional class of Shares. FAS may voluntarily chose to waive any portion of its fee. FAS can modify or terminate this voluntary waiver at any time at its sole discretion.
Prior to November 1, 2003, Federated Services Company (FServ) provided the Fund with administrative personnel and services. The fee paid to FServ was based on the average aggregate daily net assets of all Federated funds as specified below:
Maximum
Administrative Fee
|
| Average Aggregate Daily Net Assets
of the Federated Funds
|
0.150%
|
| on the first $250 million
|
0.125%
|
| on the next $250 million
|
0.100%
|
| on the next $250 million
|
0.075%
|
| on assets in excess of $750 million
|
The administrative fee received during any fiscal year was at least $125,000 per portfolio and $30,000 per each additional class of Shares.
For the year ended August 31, 2004 the fees paid to FAS and FServ were $104,704 and $20,833, respectively, after voluntary waiver, if applicable.
Distribution Services Fee
The Fund has adopted a Distribution Plan (the "Plan") pursuant to Rule 12b-1 under the Act. Under the terms of the Plan, the Fund will compensate Federated Securities Corp. (FSC), the principal distributor, from the net assets of the Fund's shares to finance activities intended to result in the sale of these shares. The Plan provides that the Fund may incur distribution expenses up to 0.25% of the average daily net assets, annually, to compensate FSC. FSC may voluntarily choose to waive any portion of its fee. FSC can modify or terminate this voluntary waiver at any time at its sole discretion.
Sales Charges
For the fiscal year ended August 31, 2004, FSC retained $20,803 in sales charges from the sale of the Fund's Shares. See "What Do shares Cost?" in the Prospectus.
Shareholder Services Fee
Under the terms of a Shareholder Services Agreement with Federated Shareholder Services Company (FSSC), the Fund will pay FSSC up to 0.25% of average daily net assets of the Fund's shares for the period. The fee paid to FSSC is used to finance certain services for shareholders and to maintain shareholder accounts. FSSC may voluntarily choose to waive any portion of its fee. FSSC can modify or terminate this voluntary waiver at any time at its sole discretion.
Transfer and Dividend Disbursing Agent Fees and Expenses
Prior to July 1, 2004, FServ, through its subsidiary FSSC, served as transfer and dividend disbursing agent for the Fund. The fee paid to FSSC was based on the size, type and number of accounts and transactions made by shareholders. The fee paid to FSSC during the reporting period was $26,828, after voluntary waiver, if applicable.
Portfolio Accounting Fees
Prior to January 1, 2004, FServ maintained the Fund's accounting records for which it received a fee. The fee was based on the level of the Fund's average daily net assets for the period, plus out-of-pocket expenses. The fee paid to FServ during the reporting period was $18,426, after voluntary waiver, if applicable.
Interfund Transactions
During the year ended August 31, 2004, the Fund engaged in purchase and sale transactions with funds that have a common investment adviser (or affiliated investment advisers), common Directors/Trustees, and/or common Officers. These purchase and sale transactions complied with Rule 17a-7 under the Act and amounted to $22,100,000 and $22,200,000, respectively.
General
Certain of the Officers and Trustees of the Trust are Officers and Directors or Trustees of the above companies.
6. INVESTMENT TRANSACTIONS
Purchases and sales of investments, excluding long-term U.S. government securities and short-term obligations (and in-kind contributions), for the year ended August 31, 2004, were as follows:
Purchases
|
| $
| 10,229,882
|
Sales
|
| $
| 38,709,259
|
7. CONCENTRATION OF CREDIT RISK
Since the Fund invests a substantial portion of its assets in issuers located in one state, it will be more susceptible to factors adversely affecting issuers of that state than would be a comparable tax-exempt mutual fund that invests nationally. In order to reduce the credit risk associated with such factors, at August 31, 2004, 41.5% of the securities in the portfolio of investments are backed by letters of credit or bond insurance of various financial institutions and financial guaranty assurance agencies. The largest percentage of investments insured by or supported (backed) by a letter of credit from any one institution or agency was 17.6% of total investments.
8. LEGAL PROCEEDINGS
In October 2003, Federated Investors, Inc. and various subsidiaries thereof (including the advisers and distributor for various investment companies, collectively, "Federated"), along with various investment companies sponsored by Federated ("Funds") were named as defendants in several class action lawsuits now pending in the United States District Court for the District of Maryland seeking damages of unspecified amounts. The lawsuits were purportedly filed on behalf of people who purchased, owned and/or redeemed shares of Federated-sponsored mutual funds during specified periods beginning November 1, 1998. The suits are generally similar in alleging that Federated engaged in illegal and improper trading practices including market timing and late trading in concert with certain institutional traders, which allegedly caused financial injury to the mutual fund shareholders. Federated and various Funds have also been named as defendants in several additional lawsuits, now pending in the United States District Court for the Western District of Pennsylvania, alleging, among other things, excessive advisory and Rule 12b-1 fees, and seeking damages of unspecified amounts. The Board of the Funds has retained the law firm of Dickstein Shapiro Morin & Oshinsky LLP to represent the Funds in these lawsuits. Federated and the Funds, and their respective counsel, are reviewing the allegations and will respond appropriately. Additional lawsuits based upon similar allegations may be filed in the future. The potential impact of these recent lawsuits and future potential similar suits is uncertain. Although we do not believe that these lawsuits will have a material adverse effect on the Funds, there can be no assurance that these suits, the ongoing adverse publicity and/or other developments resulting from related regulatory investigations will not result in increased Fund redemptions, reduced sales of Fund shares, or other adverse consequences for the Funds.
9. FEDERAL TAX INFORMATION (UNAUDITED)
At August 31, 2004, 100% of the distributions from net investment income is exempt from federal income tax, other than the federal AMT.
Report of Independent Registered Public Accounting Firm
TO THE BOARD OF TRUSTEES OF FEDERATED MUNICIPAL SECURITIES
INCOME TRUST AND SHAREHOLDERS OF FEDERATED NORTH CAROLINA
MUNICIPAL INCOME FUND:
We have audited the accompanying statement of assets and liabilities, including the portfolio of investments, of Federated North Carolina Municipal Income Fund (the "Fund") as of August 31,2004, and the related statement of operations for the year then ended, the statement of changes in net assets for each of the two years in the period then ended, and the financial highlights for each of the five years in the period then ended. These financial statements and financial highlights are the responsibility of the Fund's management. Our responsibility is to express an opinion on these financial statements and financial highlights based on our audit.
We conducted our audit in accordance with standards of the Public Company Accounting Oversight Board (United States). Those standards require that we plan and perform the audit to provide reasonable assurance about whether the financial statements and financial highlights are free of material misstatement. An audit includes examining, on a test basis, evidence supporting the amounts and disclosures in the financial statements. Our procedures included confirmation of the securities owned at August 31, 2004, by correspondence with the custodian. An audit also includes assessing the accounting principles used and significant estimates made by management, as well as evaluating the overall financial statement presentation. We believe our audits provide a reasonable basis for our opinion.
In our opinion, such financial statements and financial highlights present fairly, in all material respects, the financial position of Federated North Carolina Municipal Income Fund as of August 31, 2004, the results of its operations, the changes in its net assets and its financial highlights for the respective stated periods in conformity with accounting principles generally accepted in the United States of America.
Deloitte & Touche LLP
Boston, Massachusetts
October 20, 2004
Board of Trustees and Trust Officers
The Board is responsible for managing the Trust's business affairs and for exercising all the Trust's powers except those reserved for the shareholders. The following tables give information about each Board member and the senior officers of the Fund. Where required, the tables separately list Board members who are "interested persons" of the Fund ( i.e. , "Interested" Board members) and those who are not ( i.e. , "Independent" Board members). Unless otherwise noted, the address of each person listed is Federated Investors Tower, 1001 Liberty Avenue, Pittsburgh, PA. The Trust comprises seven portfolios and the Federated Fund Complex consists of 44 investment companies (comprising 136 portfolios). Unless otherwise noted, each Officer is elected annually. Unless otherwise noted, each Board member oversees all portfolios in the Federated Fund Complex and serves for an indefinite term. The Fund's Statement of Additional Information includes additional information about Trust Trustees and is available, without charge and upon request, by calling 1-800-341-7400.
INTERESTED TRUSTEES BACKGROUND
|
|
|
Name
Birth Date
Address
Positions Held with Trust
Date Service Began
|
| Principal Occupation(s) for Past Five Years,
Other Directorships Held and Previous Position(s)
|
John F. Donahue*
Birth Date: July 28, 1924
CHAIRMAN AND TRUSTEE
Began serving: August 1990 | | Principal Occupations : Chairman and Director or Trustee of the Federated Fund Complex; Chairman and Director, Federated Investors, Inc.
Previous Positions : Trustee, Federated Investment Management Company and Chairman and Director, Federated Investment Counseling. |
|
|
|
J. Christopher Donahue*
Birth Date: April 11, 1949
PRESIDENT AND TRUSTEE
Began serving: August 1990 | | Principal Occupations : Principal Executive Officer and President of the Federated Fund Complex; Director or Trustee of some of the Funds in the Federated Fund Complex; President, Chief Executive Officer and Director, Federated Investors, Inc.; Chairman and Trustee, Federated Investment Management Company; Trustee, Federated Investment Counseling; Chairman and Director, Federated Global Investment Management Corp.; Chairman, Passport Research, Ltd.; Trustee, Federated Shareholder Services Company; Director, Federated Services Company.
Previous Positions : President, Federated Investment Counseling; President and Chief Executive Officer, Federated Investment Management Company, Federated Global Investment Management Corp. and Passport Research, Ltd. |
|
|
|
|
|
|
Name
Birth Date
Address
Positions Held with Trust
Date Service Began
|
| Principal Occupation(s) for Past Five Years,
Other Directorships Held and Previous Position(s)
|
Lawrence D. Ellis, M.D.*
Birth Date: October 11, 1932
3471 Fifth Avenue
Suite 1111
Pittsburgh, PA
TRUSTEE
Began serving: August 1990 | | Principal Occupations : Director or Trustee of the Federated Fund Complex; Professor of Medicine, University of Pittsburgh; Medical Director, University of Pittsburgh Medical Center Downtown; Hematologist, Oncologist and Internist, University of Pittsburgh Medical Center.
Other Directorships Held : Member, National Board of Trustees, Leukemia Society of America.
Previous Positions : Trustee, University of Pittsburgh; Director, University of Pittsburgh Medical Center. |
|
|
|
* Family relationships and reasons for "interested" status: John F. Donahue is the father of J. Christopher Donahue; both are "interested" due to the positions they hold with Federated Investors, Inc. and its subsidiaries. Lawrence D. Ellis, M.D. is "interested" because his son-in-law is employed by the Fund's principal underwriter, Federated Securities Corp.
INDEPENDENT TRUSTEES BACKGROUND
|
|
|
Name
Birth Date
Address
Positions Held with Trust
Date Service Began
|
| Principal Occupation(s) for Past Five Years,
Other Directorships Held and Previous Position(s)
|
Thomas G. Bigley
Birth Date: February 3, 1934
15 Old Timber Trail
Pittsburgh, PA
TRUSTEE
Began serving: November 1994 | | Principal Occupation : Director or Trustee of the Federated Fund Complex.
Other Directorships Held : Director, Member of Executive Committee, Children's Hospital of Pittsburgh; Director, University of Pittsburgh.
Previous Position : Senior Partner, Ernst & Young LLP. |
|
|
|
John T. Conroy, Jr.
Birth Date: June 23, 1937
Grubb & Ellis/Investment
Properties Corporation
3838 North Tamiami Trail
Suite 402
Naples, FL
TRUSTEE
Began serving: August 1991 | | Principal Occupations : Director or Trustee of the Federated Fund Complex; Chairman of the Board, Investment Properties Corporation; Partner or Trustee in private real estate ventures in Southwest Florida.
Previous Positions : President, Investment Properties Corporation; Senior Vice President, John R. Wood and Associates, Inc., Realtors; President, Naples Property Management, Inc. and Northgate Village Development Corporation. |
|
|
|
|
|
|
Name
Birth Date
Address
Positions Held with Trust
Date Service Began
|
| Principal Occupation(s) for Past Five Years,
Other Directorships Held and Previous Position(s)
|
Nicholas P. Constantakis
Birth Date: September 3, 1939
175 Woodshire Drive
Pittsburgh, PA
TRUSTEE
Began serving: February 1998 | | Principal Occupations : Director or Trustee of the Federated Fund Complex.
Other Directorships Held : Director and Member of the Audit Committee, Michael Baker Corporation (engineering and energy services worldwide).
Previous Position : Partner, Andersen Worldwide SC. |
|
|
|
John F. Cunningham
Birth Date: March 5, 1943
353 El Brillo Way
Palm Beach, FL
TRUSTEE
Began serving: July 1999 | | Principal Occupation : Director or Trustee of the Federated Fund Complex.
Other Directorships Held : Chairman, President and Chief Executive Officer, Cunningham & Co., Inc. (strategic business consulting); Trustee Associate, Boston College.
Previous Positions : Director, Redgate Communications and EMC Corporation (computer storage systems); Chairman of the Board and Chief Executive Officer, Computer Consoles, Inc.; President and Chief Operating Officer, Wang Laboratories; Director, First National Bank of Boston; Director, Apollo Computer, Inc. |
|
|
|
Peter E. Madden
Birth Date: March 16, 1942
One Royal Palm Way
100 Royal Palm Way
Palm Beach, FL
TRUSTEE
Began serving: August 1991 | | Principal Occupation : Director or Trustee of the Federated Fund Complex; Management Consultant.
Other Directorships Held : Board of Overseers, Babson College.
Previous Positions : Representative, Commonwealth of Massachusetts General Court; President, State Street Bank and Trust Company and State Street Corporation (retired); Director, VISA USA and VISA International; Chairman and Director, Massachusetts Bankers Association; Director, Depository Trust Corporation; Director, The Boston Stock Exchange. |
|
|
|
Charles F. Mansfield, Jr.
Birth Date: April 10, 1945
80 South Road
Westhampton Beach, NY
TRUSTEE
Began serving: January 1999 | | Principal Occupations : Director or Trustee of the Federated Fund Complex; Management Consultant; Executive Vice President, DVC Group, Inc. (marketing communications and technology) (prior to 9/1/00).
Previous Positions : Chief Executive Officer, PBTC International Bank; Partner, Arthur Young & Company (now Ernst & Young LLP); Chief Financial Officer of Retail Banking Sector, Chase Manhattan Bank; Senior Vice President, HSBC Bank USA (formerly, Marine Midland Bank); Vice President, Citibank; Assistant Professor of Banking and Finance, Frank G. Zarb School of Business, Hofstra University. |
|
|
|
|
|
|
Name
Birth Date
Address
Positions Held with Trust
Date Service Began
|
| Principal Occupation(s) for Past Five Years,
Other Directorships Held and Previous Position(s)
|
John E. Murray, Jr., J.D., S.J.D.
Birth Date: December 20, 1932
Chancellor, Duquesne University
Pittsburgh, PA
TRUSTEE
Began serving: February 1995 | | Principal Occupations : Director or Trustee of the Federated Fund Complex; Chancellor and Law Professor, Duquesne University; Partner, Murray, Hogue and Lannis.
Other Directorships Held : Director, Michael Baker Corp. (engineering, construction, operations and technical services).
Previous Positions : President, Duquesne University; Dean and Professor of Law, University of Pittsburgh School of Law; Dean and Professor of Law, Villanova University School of Law. |
|
|
|
Marjorie P. Smuts
Birth Date: June 21, 1935
4905 Bayard Street
Pittsburgh, PA
TRUSTEE
Began serving: August 1990 | | Principal Occupations : Director or Trustee of the Federated Fund Complex; Public Relations/Marketing Consultant/Conference Coordinator.
Previous Positions : National Spokesperson, Aluminum Company of America; television producer; President, Marj Palmer Assoc.; Owner, Scandia Bord. |
|
|
|
John S. Walsh
Birth Date: November 28, 1957
2604 William Drive
Valparaiso, IN
TRUSTEE
Began serving: July 1999 | | Principal Occupations : Director or Trustee of the Federated Fund Complex; President and Director, Heat Wagon, Inc. (manufacturer of construction temporary heaters); President and Director, Manufacturers Products, Inc. (distributor of portable construction heaters); President, Portable Heater Parts, a division of Manufacturers Products, Inc.
Previous Position : Vice President, Walsh & Kelly, Inc. |
|
|
|
OFFICERS
|
|
|
Name
Birth Date
Positions Held with Trust
Date Service Began
|
| Principal Occupation(s) for Past Five Years and Previous Position(s)
|
John W. McGonigle
Birth Date: October 26, 1938
EXECUTIVE VICE PRESIDENT
AND SECRETARY
Began serving: June 1995 | | Principal Occupations : Executive Vice President and Secretary of the Federated Fund Complex; Executive Vice President, Secretary and Director, Federated Investors, Inc. |
|
|
|
Richard J. Thomas
Birth Date: June 17, 1954
TREASURER
Began serving: November 1998 | | Principal Occupations : Principal Financial Officer and Treasurer of the Federated Fund Complex; Senior Vice President, Federated Administrative Services. |
|
|
|
Richard B. Fisher
Birth Date: May 17, 1923
VICE CHAIRMAN
Began serving: August 2002 | | Principal Occupations : Vice Chairman or President of some of the Funds in the Federated Fund Complex; Vice Chairman, Federated Investors, Inc.; Chairman, Federated Securities Corp.
Previous Positions : President and Director or Trustee of some of the Funds in the Federated Fund Complex; Executive Vice President, Federated Investors, Inc. and Director and Chief Executive Officer, Federated Securities Corp. |
|
|
|
Mary Jo Ochson
Birth Date: September 12, 1953
CHIEF INVESTMENT OFFICER
Began serving: May 2004 | | Principal Occupations: Mary Jo Ochson has been the Fund's Portfolio Manager since June 1999. Ms. Ochson was named Chief Investment Officer of tax-exempt, fixed-income products in 2004. She joined Federated in 1982 and has been a Senior Portfolio Manager and a Senior Vice President of the Fund's Adviser since 1996. Ms. Ochson is a Chartered Financial Analyst and received her M.B.A. in Finance from the University of Pittsburgh. |
|
|
|
J. Scott Albrecht
Birth Date: June 1, 1960
VICE PRESIDENT
Began serving: November 1998 | | J. Scott Albrecht has been the Fund's Portfolio Manager since June 1999. He is Vice President of the Trust. Mr. Albrecht joined Federated in 1989. He has been a Senior Portfolio Manager since 1997 and a Vice President of the Fund's Adviser since 1994. He was a Portfolio Manager from 1994 to 1996. Mr. Albrecht is a Chartered Financial Analyst and received his M.S. in Public Management from Carnegie Mellon University. |
|
|
|
Mutual funds are not bank deposits or obligations, are not guaranteed by any bank, and are not insured or guaranteed by the U.S. government, the Federal Deposit Insurance Corporation, the Federal Reserve Board, or any other government agency. Investment in mutual funds involves investment risk, including the possible loss of principal.
This report is authorized for distribution to prospective investors only when preceded or accompanied by the Fund's prospectus, which contains facts concerning its objective and policies, management fees, expenses, and other information.
VOTING PROXIES ON FUND PORTFOLIO SECURITIES
A description of the policies and procedures that the Fund uses to determine how to vote proxies relating to securities held in the Fund's portfolio is available, without charge and upon request, by calling 1-800-341-7400. A report on "Form N-PX" of how the Fund voted any such proxies during the most recent 12-month period ended June 30 is available through Federated's website. Go to http://www.federatedinvestors.com, select "Products," select the "Prospectuses and Regulatory Reports" link, then select the Fund to access the link to Form N-PX. This information is also available from the EDGAR database on the SEC's website at http://www.sec.gov.
QUARTERLY PORTFOLIO SCHEDULE
The Fund files with the SEC a complete schedule of its portfolio holdings, as of the close of the first and third quarters of its fiscal year, on "Form N-Q." These filings are available on the SEC's website at http://www.sec.gov; and may be reviewed and copied at the SEC's Public Reference Room in Washington, DC. (Call 1-800-SEC-0330 for information on the operation of the Public Reference Room.) You may also access this information from the "Products" section of Federated's website at www.federatedinvestors.com by clicking on "Portfolio Holdings" and selecting the name of the Fund, or by selecting the name of the Fund and clicking on "Portfolio Holdings." You must register on the website the first time you wish to access this information.
Federated
World-Class Investment Manager
Federated North Carolina Municipal Income Fund
Federated Investors Funds
5800 Corporate Drive
Pittsburgh, PA 15237-7000
www.federatedinvestors.com
Contact us at 1-800-341-7400 or
www.federatedinvestors.com/contact
Federated Securities Corp., Distributor
Cusip 313923500
28993 (10/04)
Federated is a registered mark of Federated Investors, Inc. 2004 (c)Federated Investors, Inc.
Item 2.     Code of Ethics

(a)  As of the end of the period  covered by this  report,  the  registrant  has
     adopted  a code of  ethics  (the  "Section  406  Standards  for  Investment
     Companies  -  Ethical  Standards  for  Principal  Executive  and  Financial
     Officers") that applies to the registrant's Principal Executive Officer and
     Principal Financial Officer;  the registrant's  Principal Financial Officer
     also serves as the Principal Accounting Officer.

(c) Not Applicable

(d) Not Applicable

(e) Not Applicable

f)(3)The registrant  hereby  undertakes to provide any person,  without  charge,
     upon request,  a copy of the code of ethics.  To request a copy of the code
     of ethics, contact the registrant at 1-800-341-7400,  and ask for a copy of
     the Section 406 Standards for Investment  Companies - Ethical Standards for
     Principal Executive and Financial Officers.


Item 3.     Audit Committee Financial Expert

The  registrant's  Board has  determined  that each member of the Board's  Audit
Committee is an "audit committee financial expert," and that each such member is
"independent,"  for purposes of this Item. The Audit  Committee  consists of the
following  Board members:  Thomas G. Bigley,  John T. Conroy,  Jr.,  Nicholas P.
Constantakis and Charles F. Mansfield, Jr.


Item 4.     Principal Accountant Fees and Services


(a)         Audit Fees billed to the registrant for the two most recent
            fiscal years:

                  Fiscal year ended 2004 - $131,812

                  Fiscal year ended 2003 - $85,000


(b)         Audit-Related Fees billed to the registrant for the two most
            recent fiscal years:

                  Fiscal year ended 2004 - $586

                  Fiscal year ended 2003 - $2,375

                  Transfer Agent Service Auditors Report

     Amount requiring  approval of the registrant's  audit committee pursuant to
     paragraph  (c)(7)(ii) of Rule 2-01 of Regulation  S-X,  $85,526 and $16,493
     respectively. Fiscal year ended 2004 - Attestation services relating to the
     review of fund share  transactions,  Transfer Agent Service Auditors report
     and fees for  review of N-14  merger  documents.  Fiscal  year ended 2003 -
     Design of Sarbanes Oxley sec. 302 procedures.


(c)          Tax Fees billed to the registrant for the two most recent
             fiscal years:

                  Fiscal year ended 2004 - $0

                  Fiscal year ended 2003 - $0

     Amount requiring  approval of the registrant's  audit committee pursuant to
     paragraph  (c)(7)(ii) of Rule 2-01 of Regulation S-X,  $65,000 and $140,000
     respectively.

     Analysis regarding the realignment of advisory companies.


(d)         All Other Fees billed to the registrant for the two most recent
            fiscal years:

                  Fiscal year ended 2004 - $0

                  Fiscal year ended 2003 - $0

     Amount requiring  approval of the registrant's  audit committee pursuant to
     paragraph  (c)(7)(ii) of Rule 2-01 of Regulation S-X,  $125,143 and $38,999
     respectively.  Fiscal year ended 2004 - Consultation  regarding information
     requests by regulatory agencies and executive compensation analysis. Fiscal
     year ended 2003 - Executive compensation analysis.


(e)(1)      Audit Committee Policies regarding Pre-approval of Services.

     The Audit Committee is required to pre-approve audit and non-audit services
performed by the  independent  auditor in order to assure that the  provision of
such services do not impair the auditor's independence. Unless a type of service
to be provided by the independent auditor has received general pre-approval,  it
will require specific pre-approval by the Audit Committee. Any proposed services
exceeding  pre-approved  cost levels will require  specific  pre-approval by the
Audit Committee.

     Certain services have the general pre-approval of the Audit Committee.  The
term of the general  pre-approval  is 12 months  from the date of  pre-approval,
unless the Audit Committee  specifically  provides for a different  period.  The
Audit  Committee  will annually  review the services that may be provided by the
independent  auditor  without  obtaining  specific  pre-approval  from the Audit
Committee  and may  grant  general  pre-approval  for such  services.  The Audit
Committee  will revise the list of general  pre-approved  services  from time to
time, based on subsequent determinations.  The Audit Committee will not delegate
its  responsibilities  to  pre-approve  services  performed  by the  independent
auditor to management.

     The Audit Committee has delegated  pre-approval  authority to its Chairman.
The Chairman will report any  pre-approval  decisions to the Audit  Committee at
its next scheduled  meeting.  The Committee  will designate  another member with
such pre-approval authority when the Chairman is unavailable.


AUDIT SERVICES

     The annual Audit services  engagement terms and fees will be subject to the
specific  pre-approval of the Audit Committee.  The Audit Committee must approve
any changes in terms, conditions and fees resulting from changes in audit scope,
registered investment company (RIC) structure or other matters.

     In addition to the annual Audit services engagement  specifically  approved
by the Audit Committee,  the Audit Committee may grant general  pre-approval for
other Audit Services, which are those services that only the independent auditor
reasonably  can provide.  The Audit  Committee  has  pre-approved  certain Audit
services,  all other Audit  services must be  specifically  pre-approved  by the
Audit Committee.


AUDIT-RELATED SERVICES

     Audit-related   services  are  assurance  and  related  services  that  are
reasonably  related to the  performance  of the audit or review of the Company's
financial  statements  or that are  traditionally  performed by the  independent
auditor.  The Audit  Committee  believes  that the  provision  of  Audit-related
services does not impair the  independence of the auditor,  and has pre-approved
certain  Audit-related  services,  all  other  Audit-related  services  must  be
specifically pre-approved by the Audit Committee.


TAX SERVICES

     The Audit Committee  believes that the independent  auditor can provide Tax
services to the Company  such as tax  compliance,  tax  planning  and tax advice
without impairing the auditor's independence.  However, the Audit Committee will
not  permit the  retention  of the  independent  auditor  in  connection  with a
transaction  initially  recommended by the independent  auditor,  the purpose of
which may be tax  avoidance  and the tax treatment of which may not be supported
in the Internal  Revenue Code and related  regulations.  The Audit Committee has
pre-approved certain Tax services,  all Tax services involving large and complex
transactions must be specifically pre-approved by the Audit Committee.


ALL OTHER SERVICES

     With  respect to the  provision  of services  other than  audit,  review or
attest services the pre-approval requirement is waived if:


(1)  The aggregate amount of all such services provided constitutes no more than
     five percent of the total amount of revenues  paid by the  registrant,  the
     registrant's adviser (not including any sub-adviser whose role is primarily
     portfolio  management  and is  subcontracted  with or  overseen  by another
     investment  adviser),  and any entity controlling,  controlled by, or under
     common control with the investment  adviser that provides  ongoing services
     to the  registrant  to its  accountant  during the fiscal year in which the
     services are provided;

(2)  Such  services  were not  recognized by the  registrant,  the  registrant's
     adviser (not including any  sub-adviser  whose role is primarily  portfolio
     management  and is  subcontracted  with or overseen  by another  investment
     adviser),  and any  entity  controlling,  controlled  by,  or under  common
     control with the investment  adviser that provides  ongoing services to the
     registrant at the time of the engagement to be non-audit services; and

(3)  Such services are promptly  brought to the attention of the Audit Committee
     of the  issuer and  approved  prior to the  completion  of the audit by the
     Audit  Committee or by one or more members of the Audit  Committee  who are
     members of the board of directors to whom authority to grant such approvals
     has been delegated by the Audit Committee.


     The Audit  Committee may grant general  pre-approval  to those  permissible
non-audit services classified as All Other services that it believes are routine
and recurring services, and would not impair the independence of the auditor.


     The SEC's rules and relevant  guidance should be consulted to determine the
precise  definitions of prohibited  non-audit  services and the applicability of
exceptions to certain of the prohibitions.


PRE-APPROVAL FEE LEVELS

     Pre-approval  fee levels for all services to be provided by the independent
auditor  will be  established  annually  by the Audit  Committee.  Any  proposed
services exceeding these levels will require specific  pre-approval by the Audit
Committee.


PROCEDURES

     Requests or applications to provide services that require specific approval
by the Audit  Committee  will be  submitted  to the Audit  Committee by both the
independent  auditor  and  the  Principal  Accounting  Officer  and/or  Internal
Auditor,  and must include a joint  statement as to whether,  in their view, the
request  or  application   is  consistent   with  the  SEC's  rules  on  auditor
independence.


(e)(2) Percentage  of services  identified  in items 4(b) through 4(d) that were
     approved  by  the  registrants   audit  committee   pursuant  to  paragraph
     (c)(7)(i)(C) of Rule 2-01 of Regulation S-X:

                  4(b)

                  Fiscal year ended 2004 - 0%

                  Fiscal year ended 2003 - 0%

          Percentage of services provided to the registrants  investment adviser
          and any entity  controlling,  controlled  by, or under common  control
          with the  investment  adviser that  provides  ongoing  services to the
          registrant  that were  approved  by the  registrants  audit  committee
          pursuant to paragraph  (c)(7)(i)(C) of Rule 2-01 of Regulation S-X, 0%
          and 0% respectively.


            4(c)

            Fiscal year ended 2004 - 0%

            Fiscal year ended 2003 - 0%

          Percentage of services provided to the registrants  investment adviser
          and any entity  controlling,  controlled  by, or under common  control
          with the  investment  adviser that  provides  ongoing  services to the
          registrant  that were  approved  by the  registrants  audit  committee
          pursuant to paragraph  (c)(7)(i)(C) of Rule 2-01 of Regulation S-X, 0%
          and 0% respectively.


            4(d)

            Fiscal year ended 2004 - 0%

            Fiscal year ended 2003 - 0%

          Percentage of services provided to the registrants  investment adviser
          and any entity  controlling,  controlled  by, or under common  control
          with the  investment  adviser that  provides  ongoing  services to the
          registrant  that were  approved  by the  registrants  audit  committee
          pursuant to paragraph  (c)(7)(i)(C) of Rule 2-01 of Regulation S-X, 0%
          and 0% respectively.


(f)   NA


(g)  Non-Audit  Fees  billed  to the  registrant,  the  registrant's  investment
     adviser,  and certain entities  controlling,  controlled by or under common
     control with the investment adviser:

            Fiscal year ended 2004 - $342,076

            Fiscal year ended 2003 - $245,501


(h)  The  registrant's  Audit  Committee  has  considered  that the provision of
     non-audit  services  that were  rendered to the  registrant's  adviser (not
     including any sub-adviser whose role is primarily portfolio  management and
     is subcontracted with or overseen by another investment  adviser),  and any
     entity  controlling,  controlled  by,  or  under  common  control  with the
     investment  adviser that provides  ongoing  services to the registrant that
     were not  pre-approved  pursuant to  paragraph  (c)(7)(ii)  of Rule 2-01 of
     Regulation S-X is compatible with  maintaining  the principal  accountant's
     independence.

Item 5.     Audit Committee of Listed Registrants

            Not Applicable

Item 6.     Schedule of Investments

            Not Applicable

Item 7.     Disclosure of Proxy Voting Policies and Procedures for Closed-End
            Management Investment Companies

            Not Applicable

Item 8.     Portfolio Managers of Closed-End Management Investment Companies

            Not Applicable

Item 9.     Purchases of Equity Securities by Closed-End Management Investment
            Company and Affiliated Purchasers

            Not Applicable

Item 10.    Submission of Matters to a Vote of Security Holders

            Not Applicable

Item 11.   Controls and Procedures

(a)  The   registrant's   President  and  Treasurer   have  concluded  that  the
     registrant's  disclosure  controls  and  procedures  (as  defined  in  rule
     30a-3(c)  under the Act) are  effective  in design  and  operation  and are
     sufficient to form the basis of the certifications required by Rule 30a-(2)
     under the Act, based on their evaluation of these  disclosure  controls and
     procedures within 90 days of the filing date of this report on Form N-CSR.

(b)  There were no changes in the  registrant's  internal control over financial
     reporting  (as  defined  in rule  30a-3(d)  under the Act)  during the last
     fiscal half year (the  registrant's  second fiscal half year in the case of
     an annual report) that have materially  affected,  or are reasonably likely
     to materially  affect,  the  registrant's  internal  control over financial
     reporting.

Item 12.    Exhibits


SIGNATURES

Pursuant to the  requirements  of the  Securities  Exchange  Act of 1934 and the
Investment Company Act of 1940, the registrant has duly caused this report to be
signed on its behalf by the undersigned, thereunto duly authorized.

Registrant  Federated Municipal Securities Income Trust


By          /S/ Richard J. Thomas, Principal Financial Officer
            (insert name and title)

Date        October 25, 2004


Pursuant to the  requirements  of the  Securities  Exchange  Act of 1934 and the
Investment  Company  Act of  1940,  this  report  has been  signed  below by the
following  persons on behalf of the  registrant and in the capacities and on the
dates indicated.


By          /S/ J. Christopher Donahue, Principal Executive Officer
Date        October 25, 2004


By          /S/ Richard J. Thomas, Principal Financial Officer
Date        October 25, 2004