1
February 24, 2011
Fourth Quarter 2010 Conference Call
1
Forward-Looking Statements
2
This presentation contains forward-looking statements within the meaning of Section 27A of the Securities Act of
1933 and Section 21E of the Securities Exchange Act of 1934. All such statements, other than statements of
historical fact, are “forward-looking statements” within the meaning of the Private Securities Litigation Reform Act of
1995, including, without limitation, any projections of financial items; projections of contracting services activity; future
production volumes, results of exploration, exploitation, development, acquisition and operations expenditures, and
prospective reserve levels of properties or wells; projections of utilization; any statements of the plans, strategies and
objectives of management for future operations; any statements concerning developments; and any statements of
assumptions underlying any of the foregoing. These statements involve certain assumptions we made based on our
experience and perception of historical trends, current conditions, expected future developments and other factors
we believe are reasonable and appropriate under the circumstances. The forward-looking statements are subject to
a number of known and unknown risks, uncertainties and other factors that could cause our actual results to differ
materially. The risks, uncertainties and assumptions referred to above include the performance of contracts by
suppliers, customers and partners; actions by governmental and regulatory authorities; operating hazards and
delays; employee management issues; local, national and worldwide economic conditions; uncertainties inherent in
the exploration for and development of oil and gas and in estimating reserves; complexities of global political and
economic developments; geologic risks, volatility of oil and gas prices and other risks described from time to time in
our reports filed with the Securities and Exchange Commission (“SEC”), including the Company’s most recently filed
Annual Report on Form 10-K and in the Company’s other filings with the SEC. Free copies of the reports can be
found at the SEC’s website, www.SEC.gov. You should not place undue reliance on these forward-looking
statements which speak only as of the date of this presentation and the associated press release. We assume no
obligation or duty and do not intend to update these forward-looking statements except as required by the securities
laws.
References to quantities of oil or gas include amounts we believe will ultimately be produced, and may include
“proved reserves” and quantities of oil or gas that are not yet classified as “proved reserves” under SEC definitions.
Statements of oil and gas reserves are estimates based on assumptions and may be imprecise. Investors are urged
to consider closely the disclosure regarding reserves in our most recently filed Annual Report on Form 10-K and any
subsequent Quarterly Reports on Form 10-Q.
Presentation Outline
3
• Executive Summary
Summary of Q4 2010 Results (pg. 4)
• Operational Highlights by Segment
Contracting Services (pg. 9)
Oil & Gas (pg. 16)
• Key Balance Sheet Metrics (pg. 19)
• 2011 Outlook (pg. 21)
• Non-GAAP Reconciliations (pg. 26)
• Questions & Answers
Caesar installing EOG Toucan pipeline offshore Trinidad
4
Executive
Summary
Summary
Executive Summary
5
($ in millions, except per share data)
(A) Results of Cal Dive, our former Shelf Contracting business, were consolidated through June 10, 2009, at which time our ownership interest dropped below 50%; thereafter, our remaining
interest was accounted for under the equity method of accounting until September 23, 2009, when we sold substantially all of our remaining interest in Cal Dive. Revenues from our Shelf
Contracting business totaled $404.7 million.
interest was accounted for under the equity method of accounting until September 23, 2009, when we sold substantially all of our remaining interest in Cal Dive. Revenues from our Shelf
Contracting business totaled $404.7 million.
(B) Included revenues in first quarter 2009 of $73.5 million of previously disputed Oil and Gas accrued royalties.
(C) Included a $16.7 million non-cash charge to write off goodwill associated with our Southeast Asia well operations subsidiary in fourth quarter 2010.
(D) Included a $7.1 million deferred tax asset valuation allowance associated with our Southeast Asia well operations subsidiary in fourth quarter 2010.
(E) Included a $17.5 million ($11.5 million after income taxes) charge related to settlement of litigation regarding a 2007 international construction contract in first quarter 2010 as well as a $7.1
million deferred tax asset valuation allowance associated with our Southeast Asia well operations subsidiary in fourth quarter 2010.
(F) After $53.4 million of non-cash charges related to convertible preferred stock in first quarter 2009.
(G) See non-GAAP reconciliations on slides 27-28.
(H) EBITDAX excludes Cal Dive contribution in all periods presented.
(B)
(F)
(A)
(E)
(C)
(D)
(C)
Executive Summary
6
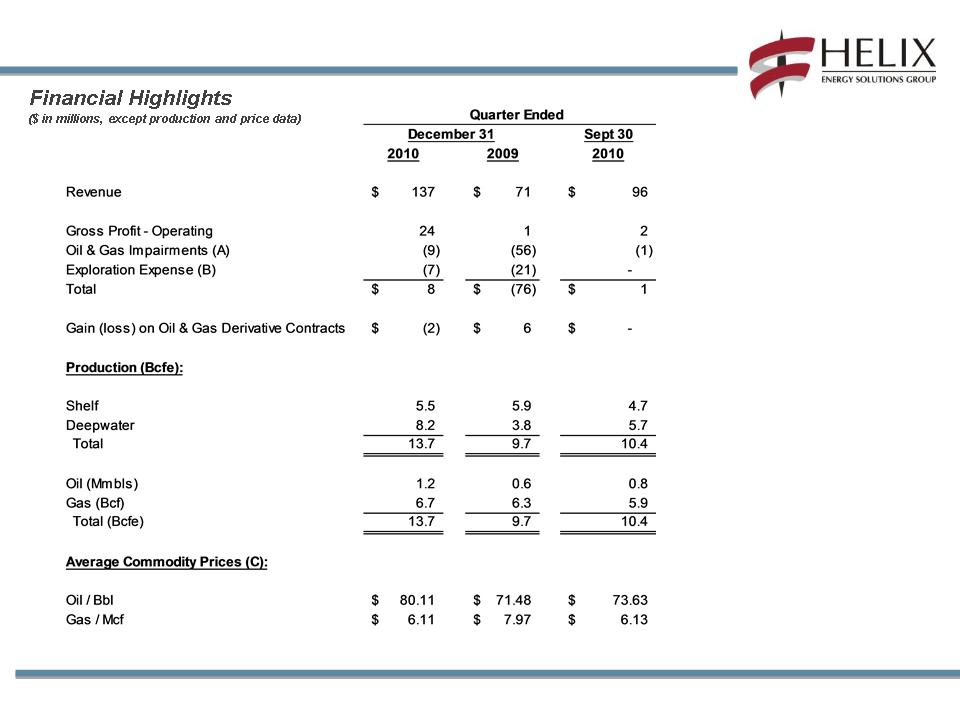
• Q4 2010 as reported EPS of $(0.48) per share
o Non-cash impairment charge of $16.7 million to write-off the carrying value of goodwill and a $7.1
million deferred tax asset valuation allowance attributable to our Southeast Asia well operations
subsidiary (total of $23.9 million after-tax)
million deferred tax asset valuation allowance attributable to our Southeast Asia well operations
subsidiary (total of $23.9 million after-tax)
o Impairment charges totaling $9.2 million primarily associated with a reduction in carrying values of
certain oil and gas properties and $6.4 million related to expiring offshore leases ($10.2 million
after-tax)
certain oil and gas properties and $6.4 million related to expiring offshore leases ($10.2 million
after-tax)
o Loss associated with the Lufeng project offshore China of $21.4 million ($22.4 million after-tax)
related to weather, downhole and mechanical issues
o Above three items totaled $53.8 million pre-tax ($56.5 million after-tax), or a loss of $(0.54) per
share
share
• Balance sheet continues to improve
o Cash increased to $391 million at 12/31/2010 from $325 million at 9/30/2010
o Liquidity* increased to $787 million at 12/31/2010 from $700 million at 9/30/2010
o Net debt decreased to $967 million at 12/31/2010 from $1.03 billion at 9/30/2010
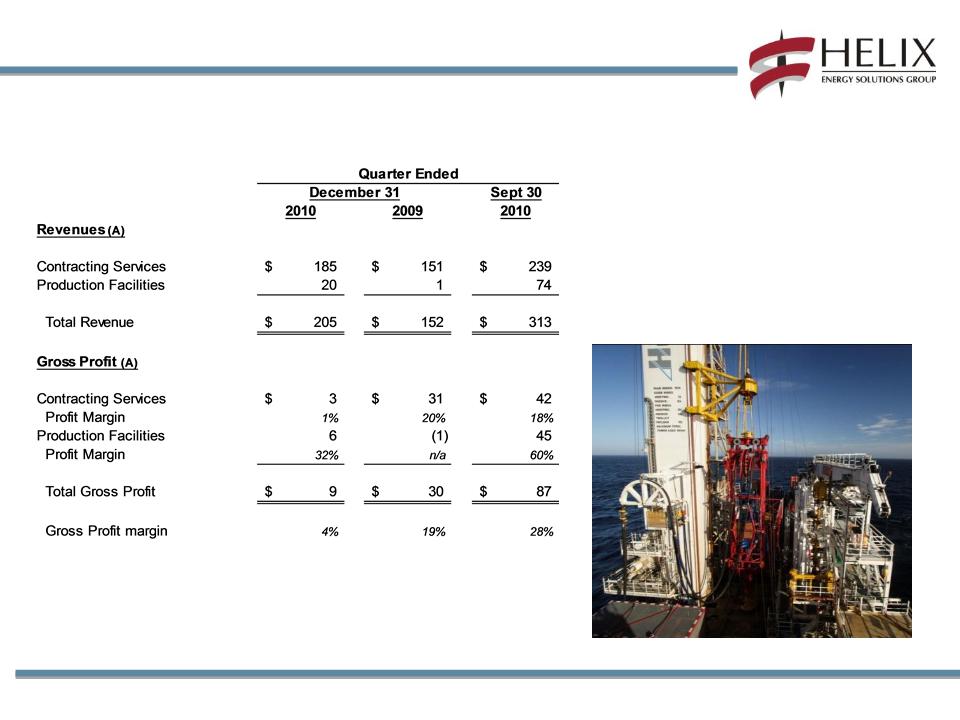
• Contracting Services and Production Facilities
o Helix Producer I (HP I) began to process Phoenix field production in October
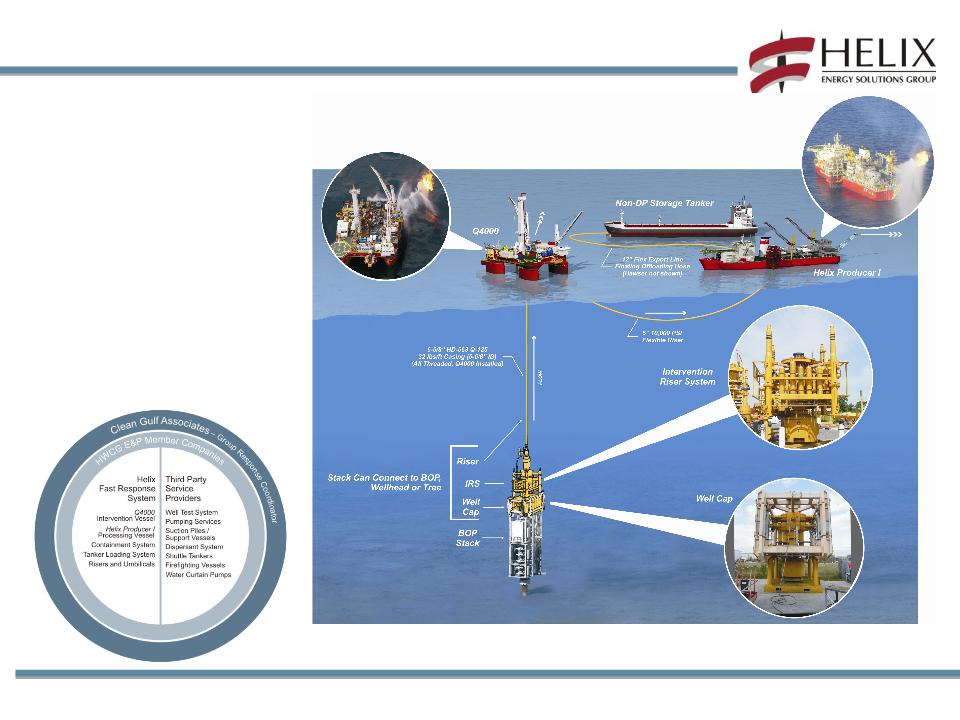
o Helix Fast Response System (HFRS) utilization agreements signed with 20 independent E&P
operators in the GOM (Q1 2011)
*Liquidity as we define it is equal to cash and cash equivalents ($391 million), plus available capacity under our revolving credit facility ($396 million).
Executive Summary
7
• Oil and Gas
o Fourth quarter average production rate of approximately 149 Mmcfe/d (51% oil)
o Phoenix production commenced on 10/19/2010 after HP I returned from BP spill containment
operations
operations
o Q1 production through February 22 averaged approximately 162 Mmcfe/d (63% oil)
§ Phoenix production averaged 72 Mmcfe/d for the same period
§ Little Burn completion permit secured (now pending rig)
• Oil and gas production totaled 13.7 Bcfe in Q4 2010 versus 10.4 Bcfe in Q3 2010
o Avg realized price for oil of $80.11 / bbl ($73.63 / bbl in Q3 2010), inclusive of hedges
o Avg realized price for gas of $6.11 / Mcf ($6.13 / Mcf in Q3 2010), inclusive of hedges
8
Operational
Highlights
Highlights
9
($ in millions, except percentages)
(A) See non-GAAP reconciliation on slides 27-28. Amounts are prior to intercompany
eliminations.
eliminations.
Contracting Services
• Gross margins adversely impacted
by losses on lump sum Lufeng field
abandonment project offshore China
($21.4 million in Q4)
by losses on lump sum Lufeng field
abandonment project offshore China
($21.4 million in Q4)
• Strong contribution from Robotics
business
business
• Caesar returned to GOM for
upgrades in December
Coiled Tubing being deployed into North Sea well from Well Enhancer
10
($ in millions)
Equity in Earnings of Equity Investments
(A) Results of Cal Dive, our former Shelf Contracting business, were consolidated through June 10, 2009, at which time our ownership interest dropped below 50%; thereafter, our
remaining interest was accounted for under the equity method of accounting until September 23, 2009, when we sold substantially all of our remaining interest in Cal Dive.
11
Contracting Services - Well Ops
GOM
• Q4000 worked for Noble, Newfield and Mariner in the fourth
quarter
quarter
• Strong outlook for 2011
North Sea
• Seawell and Well Enhancer enjoyed 85% utilization in the
fourth quarter; a delay in completing the coiled tubing unit on
the Well Enhancer prevented full utilization for the quarter
fourth quarter; a delay in completing the coiled tubing unit on
the Well Enhancer prevented full utilization for the quarter
• Well Enhancer commenced coiled tubing operations
• Completed the Statoil Cat B FEED study for a new well
intervention semi-submersible for offshore Norway and are
currently bidding for the supply and services contract
intervention semi-submersible for offshore Norway and are
currently bidding for the supply and services contract
• Strong outlook anticipated for both vessels in 2011
Asia Pacific
• Deployed the Normand Clough on the CNOOC Lufeng field
abandonment contract in South China Sea
• Project loss due to weather, downhole and mechanical
issues
issues
• Normand Clough now deployed on COOEC (offshore China)
construction work through Q3
The Compensated Coiled Tubing Lift Frame on the
Well Enhancer during its first coiled tubing operation
12
Contracting Services - Robotics
• Enjoyed good utilization for five chartered
ROV support vessels
ROV support vessels
• Island Pioneer and Deep Cygnus with Canyon
trenchers T750 and iTrencher active in
GOM/North Sea with prospects for West
Africa and backlog for the iTrencher
trenchers T750 and iTrencher active in
GOM/North Sea with prospects for West
Africa and backlog for the iTrencher
• Olympic Canyon enjoyed full utilization
working on India Reliance project
• Olympic Triton currently off hire for crane
upgrades; backlog of work when vessel
returns to service
upgrades; backlog of work when vessel
returns to service
• Generated non-oilfield revenues of $36.5
million on power cable burial projects in 2010
Canyon ROV working on Jubilee project offshore Ghana
13
Contracting Services - Subsea Construction
• Caesar completed EOG Toucan pipelay
operation in Trinidad; then entered shipyard
for planned maintenance and upgrades
operation in Trinidad; then entered shipyard
for planned maintenance and upgrades
• Intrepid performed pipelay operations in
Trinidad and the GOM
• Express completed pipelay operations for
BP’s Calisto, Mariner’s Balboa and Newfield’s
Gladden projects in the GOM
BP’s Calisto, Mariner’s Balboa and Newfield’s
Gladden projects in the GOM
• Deep Cygnus retained on short-term charter
to perform umbilical installation for BP’s
Calisto project
to perform umbilical installation for BP’s
Calisto project
Caesar deploying pipeline for EOG Toucan project
Helix Fast Response System (HFRS)
14
• Utilizes vessels and subsea
systems proven in Macondo
spill response
systems proven in Macondo
spill response
• Interim system is ready for
deployment
deployment
• Enhanced system will capture
and process up to 55,000 bpd
in water depths to 8,000 feet
(ready in Q2 2011)
and process up to 55,000 bpd
in water depths to 8,000 feet
(ready in Q2 2011)
• 20 independent E&P
operators have signed on to
include HFRS in future drilling
permits
operators have signed on to
include HFRS in future drilling
permits
Contracting Services Utilization
15
• Express
• Caesar (in service 5/31/10)
• Island Pioneer (1)
• Deep Cygnus (1)
• Normand Fortress (1)
• Olympic Triton (thru 10/23/2010) (1)
• Well Enhancer
• Q4000
• Normand Clough (1)
• 2 ROVDrill Units
• 5 Trenchers
(1) Chartered vessels.
16
(A) Fourth quarter 2010 and 2009
impairments primarily associated
with the reduction in carrying
values of certain oil and gas
properties due to year-end
revisions in reserves.
impairments primarily associated
with the reduction in carrying
values of certain oil and gas
properties due to year-end
revisions in reserves.
(B) Primarily consisted of $6.4
million and $20.1 million of costs
associated with expiring offshore
leases in the fourth quarters of
2010 and 2009, respectively.
million and $20.1 million of costs
associated with expiring offshore
leases in the fourth quarters of
2010 and 2009, respectively.
(C) Including effect of settled hedges
and mark-to-market derivative
contracts.
and mark-to-market derivative
contracts.
Oil & Gas
Oil & Gas
17
(A) Included accretion expense.
(B) Excluded exploration expenses of $6.5, $21.5 and $0.4 million (of which $6.4, $20.1 and $0.0 million related to unproved property write-offs), and abandonment
costs of $(0.3), $0.0 and $0.2 million for the quarters ended December 31, 2010, December 31, 2009 and September 30, 2010, respectively. Included $2.3,
$2.5 and $9.4 million related to a weather derivative contract for the quarters ended December 31, 2010, December 31, 2009 and September 30, 2010,
respectively.
Operating Costs ($ in millions, except per Mcfe data)
Oil & Gas - Reserve Report Highlights
18
Proved Developed | Proved Undeveloped | Total | |
Total Reserves (Bcfe) | 146 | 230 | 376 |
Shelf | 87 | 79 | 166 |
Deepwater | 59 | 151 | 210 |
Oil (mmbbls) | 12 | 13 | 25 |
Gas (Bcf) | 76 | 151 | 227 |
SEC Case PV-10 (pre-tax, in millions) | $ 490 | $ 840 | $ 1,330 |
PV-10 Forward Strip Price* (pre-tax, in millions) | $ 681 | $ 1,032 | $ 1,713 |
At December 31, 2010
* Based on NYMEX Henry Hub gas and WTI oil forward strip prices at December 31, 2010.
19
Key Balance
Sheet Metrics
Sheet Metrics
Debt and Liquidity Profile
20
Liquidity of approximately $787 million at 12/31/2010
(A) Includes impact of unamortized debt discount under our Convertible Senior Notes.
(B) Liquidity as we define it is equal to cash and cash equivalents ($391 million), plus available
capacity under our revolving credit facility ($396 million).
($ amounts in millions)
21
2011 Outlook
2011 Outlook
22
Broad Metrics | 2011 Forecast | 2010 Actual |
Oil and Gas Production | 49 Bcfe | 47 Bcfe |
EBITDAX | $475 million | $430 million |
CAPEX | $225 million | $179 million |
Commodity Price Deck | 2011 Forecast | 2010 Actual | |
Hedged | Oil | $87.11 / bbl | $75.27 / bbl |
Gas | $4.80/ mcf | $6.01 / mcf |
We expect to continue to improve our liquidity position in 2011.
2011 Outlook
23
• Contracting Services
o Strong backlog for the Q4000, Well Enhancer and Seawell in 2011
o Reduced visibility for Robotics utilization in first half of 2011
o Current regulatory environment in the GOM limits short-term opportunities in Subsea
Construction and Robotics businesses
o Continued focus on trenching/cable burial business
• Production Facilities
o HP I continues Phoenix field production and upgrades for spill response capabilities
• Oil and Gas
o Forecasted 2011 overall production up slightly from 2010 levels
§ ~ 60% oil and 65% deepwater
§ Assumes no significant storm disruptions
§ Assumes Little Burn completed and producing by late Q2 (completion permit
received, rig pending)
2011 Outlook
24
• Capital Expenditures
o Contracting Services ($65 million)
§ No major vessel projects or dry docks planned for 2011
§ Completion of HFRS upgrades in Q1
§ Incremental investment in Robotics business
§ Additional capital expenditures required if awarded Statoil Cat B project
o Oil and Gas ($160 million)
§ Focus capital investment on fast payback projects funded with operating cash
flow
flow
§ Little Burn completion by late Q2 (completion permit received, rig pending)
§ Drill two wells in the 2nd half of the year (subject to permitting)
§ Kathleen in the Bushwood field
§ Wang in the Phoenix field
§ Shelf platform construction and opportunistic workovers
Summary of Hedging Positions *
25
* As of February 23, 2011
26
Non-GAAP
Reconciliations
Reconciliations
Non-GAAP Reconciliations
27
Adjusted EBITDAX ($ in millions)
We calculate Adjusted EBITDAX as earnings before net interest expense, taxes, depreciation and amortization and exploration expense. Further,
we do not include earnings from our interest in Cal Dive in any periods presented in our Adjusted EBITDAX calculation. These non-GAAP
measures are useful to investors and other internal and external users of our financial statements in evaluating our operating performance
because they are widely used by investors in our industry to measure a company’s operating performance without regard to items which can vary
substantially from company to company, and help investors meaningfully compare our results from period to period. Adjusted EBITDAX should not
be considered in isolation or as a substitute for, but instead is supplemental to, income from operations, net income or other income data prepared
in accordance with GAAP. Non-GAAP financial measures should be viewed in addition to, and not as an alternative to our reported results
prepared in accordance with GAAP. Users of this financial information should consider the types of events and transactions which are excluded.
Revenue and Gross Profit As Reported ($ in millions)
28
Non-GAAP Reconciliations
29