EXHIBIT 99.2
| Owen Kratz - Chief Executive Officer Martin Ferron - President Wade Pursell - Chief Financial Officer Third Quarter 2005 Earnings Conference Call November 2, 2005 |

| FORWARD-LOOKING STATEMENTS This presentation contains forward-looking statements that involve risks, uncertainties and assumptions that could cause our results to differ materially from those expressed or implied by such forward- looking statements. All statements, other than statements of historical fact, are statements that could be deemed "forward- looking statements" within the meaning of the Private Securities Litigation Reform Act of 1995, including, without limitation, any projections of revenue, gross margin, expenses, earnings or losses from operations, or other financial items; any statements of the plans, strategies and objectives of management for future operations; any statement concerning developments, performance or industry rankings relating to services; any statements regarding future economic conditions or performance; any statements of expectation or belief; and any statements of assumptions underlying any of the foregoing. The risks, uncertainties and assumptions referred to above include the performance of contracts by suppliers, customers and partners; employee management issues; complexities of global political and economic developments, and other risks described from time to time in our reports filed with the Securities and Exchange Commission, including the Company's Annual Report on Form 10-K for the year ending December 31, 2004. We assume no obligation and do not intend to update these forward-looking statements. 2 |
| Presentation Outline I. Summary of Results II. Operational Highlights by Segment A. Marine Contracting i. Shelf Contracting ii. Deepwater & Robotics iii. Well Operations B. Production Facilities C. Oil & Gas Production III. Strategic Overview and Outlook IV. Questions & Answers 3 |
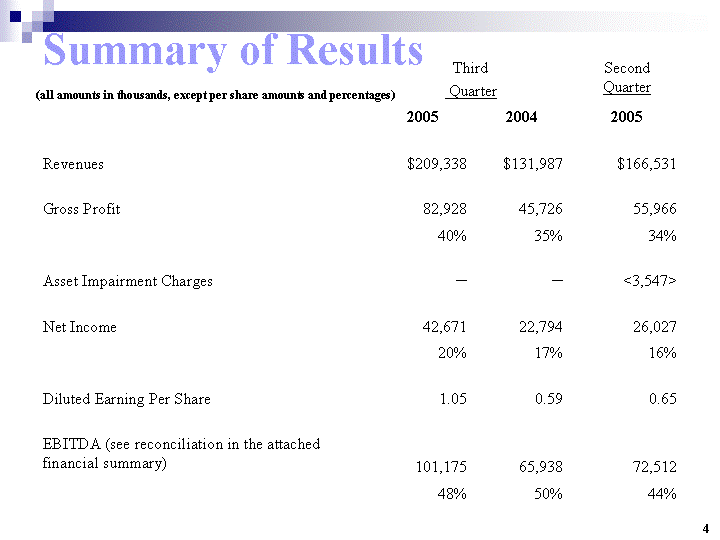
| Summary of Results (all amounts in thousands, except per share amounts and percentages) 4 Third Quarter Third Quarter Second Quarter 2005 2004 2005 Revenues $209,338 $131,987 $166,531 Gross Profit 82,928 45,726 55,966 40% 35% 34% Asset Impairment Charges ^ ^ <3,547> Net Income 42,671 22,794 26,027 20% 17% 16% Diluted Earning Per Share 1.05 0.59 0.65 EBITDA (see reconciliation in the attached financial summary) 101,175 65,938 72,512 48% 50% 44% |
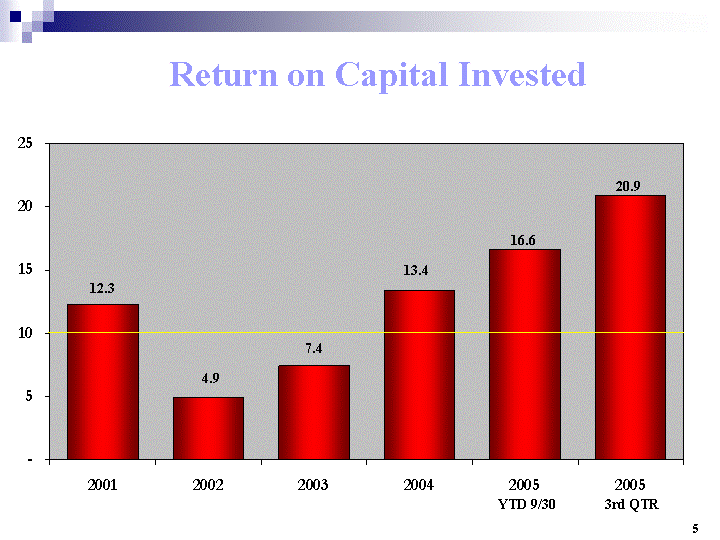
| 2001 2002 2003 2004 2005 2005 12.3 4.9 7.4 13.4 16.6 20.9 5 Return on Capital Invested YTD 9/30 3rd QTR 12.3 4.9 7.4 13.4 16.6 20.9 |
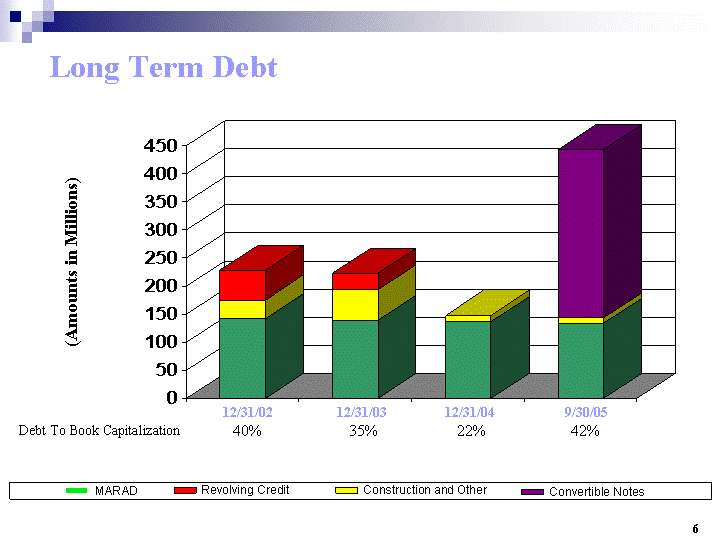
| MARAD Construction and Other Long Term Debt Revolving Credit 6 (Amounts in Millions) 9/30/05 12/31/04 12/31/03 12/31/02 Debt To Book Capitalization 40% 35% 22% 42% Convertible Notes |
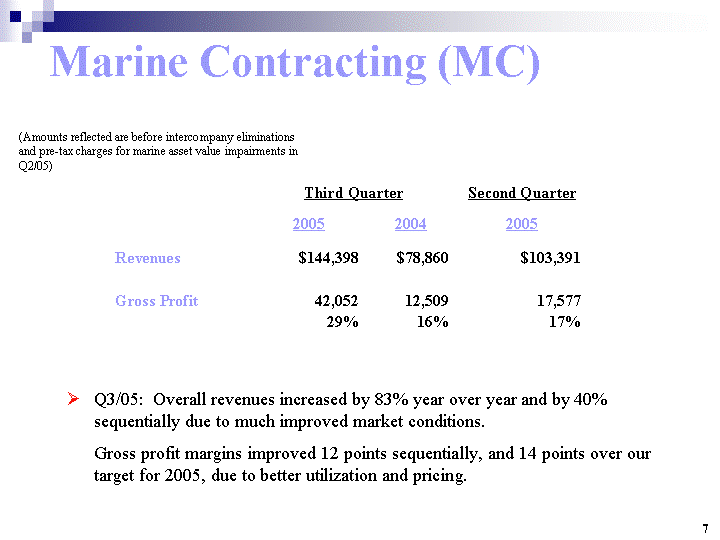
| Marine Contracting (MC) Third Quarter Third Quarter Second Quarter 2005 2004 2005 Revenues $144,398 $78,860 $103,391 Gross Profit 42,052 12,509 17,577 29% 16% 17% 7 (Amounts reflected are before intercompany eliminations and pre-tax charges for marine asset value impairments in Q2/05) Q3/05: Overall revenues increased by 83% year over year and by 40% sequentially due to much improved market conditions. Gross profit margins improved 12 points sequentially, and 14 points over our target for 2005, due to better utilization and pricing. |
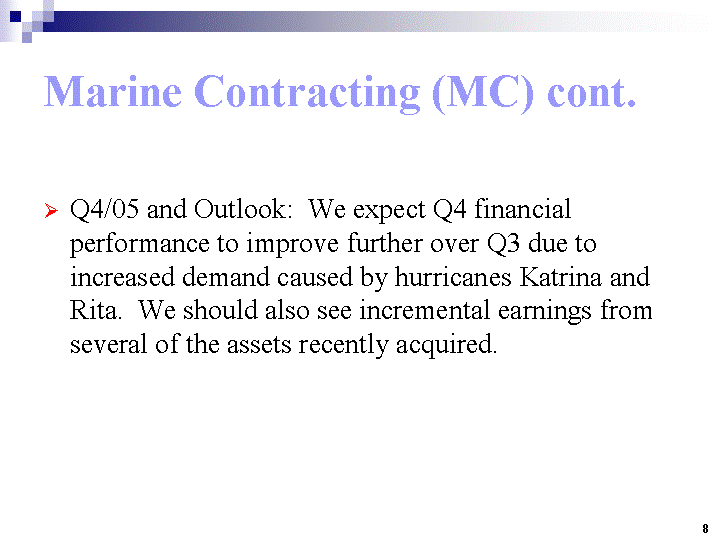
| Marine Contracting (MC) cont. Q4/05 and Outlook: We expect Q4 financial performance to improve further over Q3 due to increased demand caused by hurricanes Katrina and Rita. We should also see incremental earnings from several of the assets recently acquired. 8 |
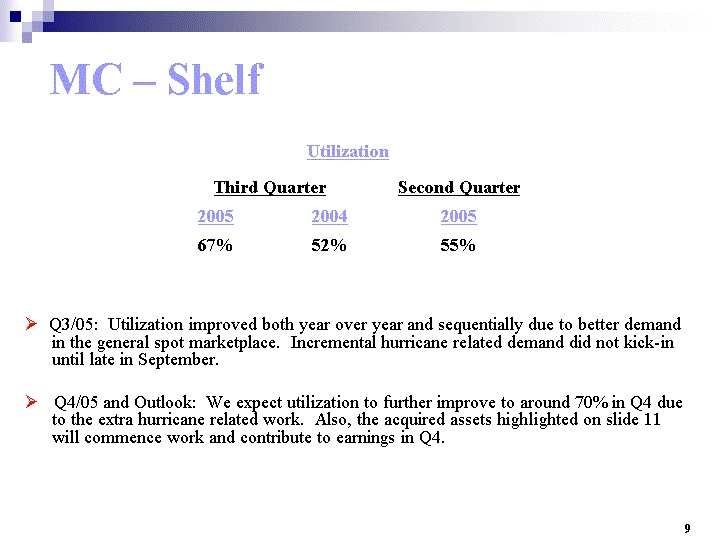
| MC - Shelf Third Quarter Third Quarter Second Quarter 2005 2004 2005 67% 52% 55% Utilization Q3/05: Utilization improved both year over year and sequentially due to better demand in the general spot marketplace. Incremental hurricane related demand did not kick-in until late in September. Q4/05 and Outlook: We expect utilization to further improve to around 70% in Q4 due to the extra hurricane related work. Also, the acquired assets highlighted on slide 11 will commence work and contribute to earnings in Q4. 9 |
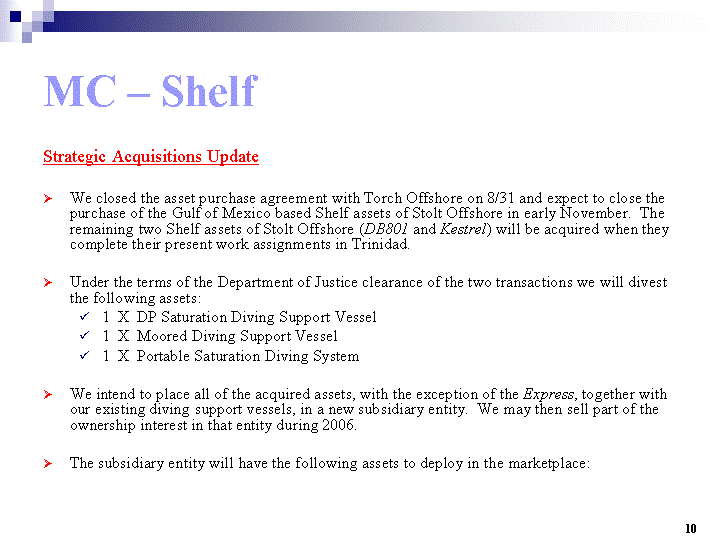
| MC - Shelf Strategic Acquisitions Update We closed the asset purchase agreement with Torch Offshore on 8/31 and expect to close the purchase of the Gulf of Mexico based Shelf assets of Stolt Offshore in early November. The remaining two Shelf assets of Stolt Offshore (DB801 and Kestrel) will be acquired when they complete their present work assignments in Trinidad. Under the terms of the Department of Justice clearance of the two transactions we will divest the following assets: 1 X DP Saturation Diving Support Vessel 1 X Moored Diving Support Vessel 1 X Portable Saturation Diving System We intend to place all of the acquired assets, with the exception of the Express, together with our existing diving support vessels, in a new subsidiary entity. We may then sell part of the ownership interest in that entity during 2006. The subsidiary entity will have the following assets to deploy in the marketplace: 10 |
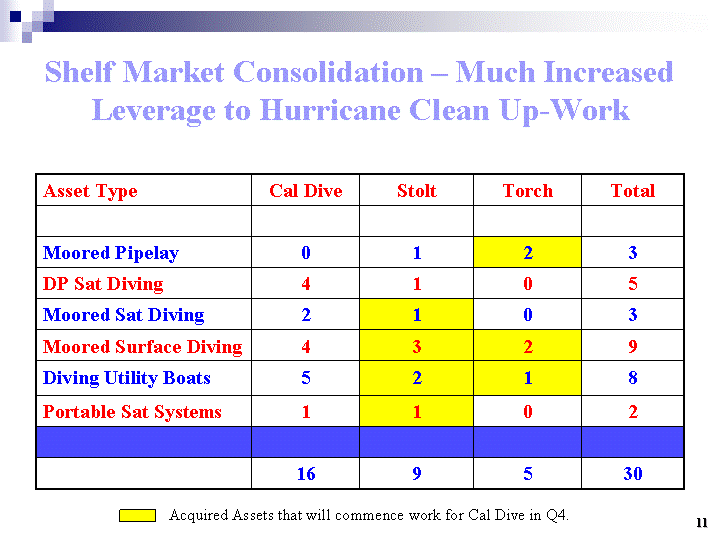
| Shelf Market Consolidation - Much Increased Leverage to Hurricane Clean Up-Work Asset Type Cal Dive Stolt Torch Total Moored Pipelay 0 1 2 3 DP Sat Diving 4 1 0 5 Moored Sat Diving 2 1 0 3 Moored Surface Diving 4 3 2 9 Diving Utility Boats 5 2 1 8 Portable Sat Systems 1 1 0 2 16 9 5 30 11 Acquired Assets that will commence work for Cal Dive in Q4. |
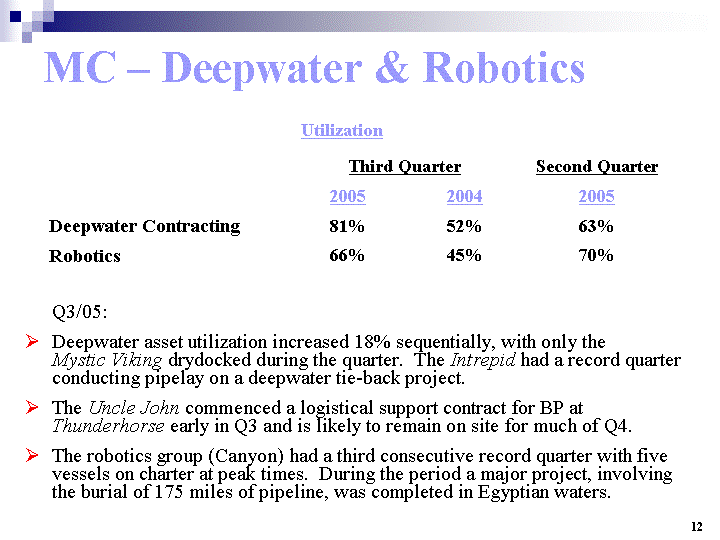
| MC - Deepwater & Robotics Third Quarter Third Quarter Second Quarter 2005 2004 2005 Deepwater Contracting 81% 52% 63% Robotics 66% 45% 70% Utilization Q3/05: Deepwater asset utilization increased 18% sequentially, with only the Mystic Viking drydocked during the quarter. The Intrepid had a record quarter conducting pipelay on a deepwater tie-back project. The Uncle John commenced a logistical support contract for BP at Thunderhorse early in Q3 and is likely to remain on site for much of Q4. The robotics group (Canyon) had a third consecutive record quarter with five vessels on charter at peak times. During the period a major project, involving the burial of 175 miles of pipeline, was completed in Egyptian waters. 12 |
| MC - Deepwater & Robotics cont. Q4/05 and Outlook: All of the assets of the Deepwater Group are fully booked for Q4 and the outlook is good for 2006. Also the Express will commence work in Q4 and will perform light construction and hurricane repair work prior to an upgrade of the pipelay system in Q3 next year. The outlook is similarly bright for Canyon, although we expect a seasonal drop in pipe burial activity in Q4. ROV activity is anticipated to remain strong in all regions with new projects starting in the Gulf of Mexico, Australia, Vietnam and West Africa. We also recently ordered five new high specification work class vehicles to cater to increased internal and external demand. 13 |
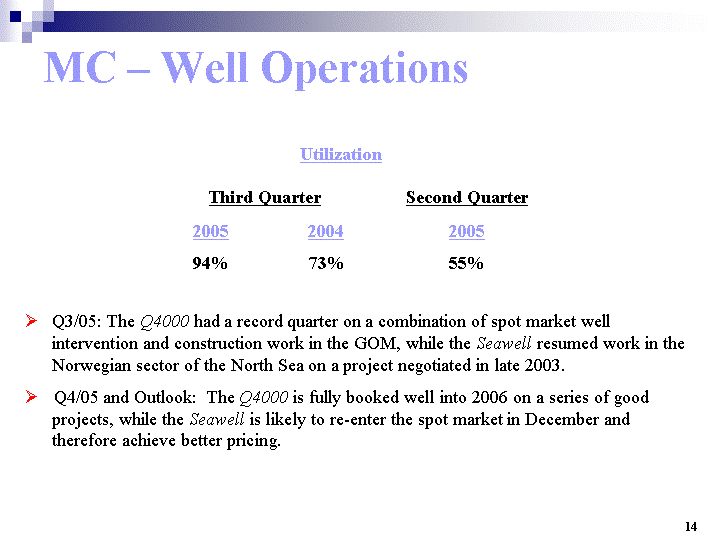
| MC - Well Operations Third Quarter Third Quarter Second Quarter 2005 2004 2005 94% 73% 55% Utilization Q3/05: The Q4000 had a record quarter on a combination of spot market well intervention and construction work in the GOM, while the Seawell resumed work in the Norwegian sector of the North Sea on a project negotiated in late 2003. Q4/05 and Outlook: The Q4000 is fully booked well into 2006 on a series of good projects, while the Seawell is likely to re-enter the spot market in December and therefore achieve better pricing. 14 |
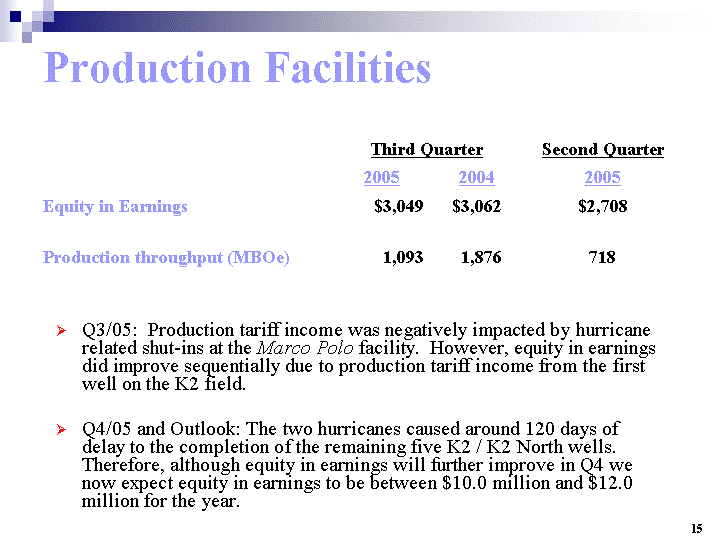
| Production Facilities Third Quarter Third Quarter Second Quarter 2005 2004 2005 Equity in Earnings $3,049 $3,062 $2,708 Production throughput (MBOe) 1,093 1,876 718 15 Q3/05: Production tariff income was negatively impacted by hurricane related shut-ins at the Marco Polo facility. However, equity in earnings did improve sequentially due to production tariff income from the first well on the K2 field. Q4/05 and Outlook: The two hurricanes caused around 120 days of delay to the completion of the remaining five K2 / K2 North wells. Therefore, although equity in earnings will further improve in Q4 we now expect equity in earnings to be between $10.0 million and $12.0 million for the year. |

| Oil & Gas Production Third Quarter Third Quarter Second Quarter 2005 2004 2005 Revenues $75,463 $59,999 $67,590 Gross Profit 40,877 33,277 38,389 54% 55% 57% Production (BCFe): Shelf 6.1 7.7 6.7 Gunnison 2.3 2.3 2.2 Average Commodity Prices (net of hedging impact): Oil/Bbl $54.30 $36.79 $45.96 Gas/Mcf 8.66 5.84 7.32 16 (Amounts reflected are before pre-tax charges for asset impairments in Q2/05 - see slide 4) |

| Oil & Gas Production Q3/05: Shelf: Production of 6.1 Bcfe was 9% less than last quarter due to shut-ins from Hurricanes Katrina (approximately five days) and Rita (last 10 days of the quarter). Realized commodity prices were 18% higher overall than last quarter and 48% higher than those achieved in last year's third quarter. Natural gas made up 62% of the third quarter production. We recorded a $2.7 million reduction in revenue in the third quarter resulting from ERT's projected inability to deliver contractual oil and gas production in the fourth quarter 2005 due to the effects of Hurricanes Katrina and Rita. Gunnison: Production of 2.3 BCFe was relatively flat with last quarter's levels despite hurricane shut-ins. Oil made up 52% of Gunnison production in Q3. Outlook: Due to the hurricane shut-ins and particularly the delays in getting production back on line because of pipeline and refinery issues, we estimate our total production for 2005 will be between 33 to 34 Bcfe. 17 |
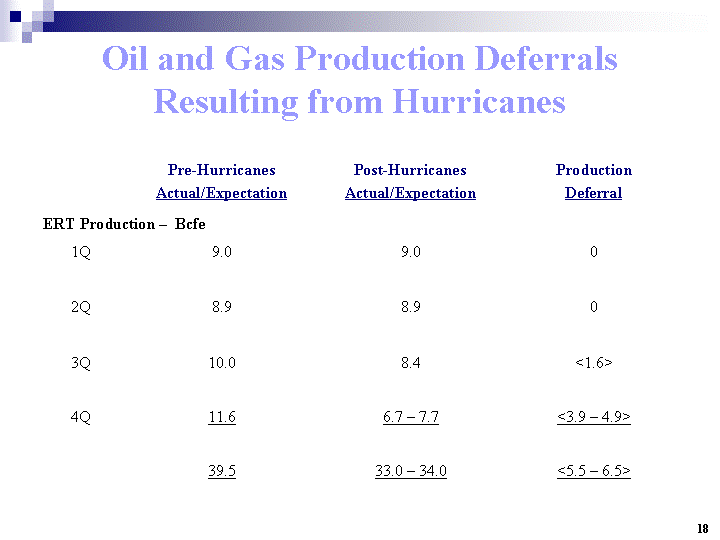
| Oil and Gas Production Deferrals Resulting from Hurricanes Pre-Hurricanes Actual/Expectation Post-Hurricanes Actual/Expectation Production Deferral ERT Production - Bcfe ERT Production - Bcfe 1Q 9.0 9.0 0 2Q 8.9 8.9 0 3Q 10.0 8.4 <1.6> 4Q 11.6 6.7 - 7.7 <3.9 - 4.9> 39.5 33.0 - 34.0 <5.5 - 6.5> 18 |
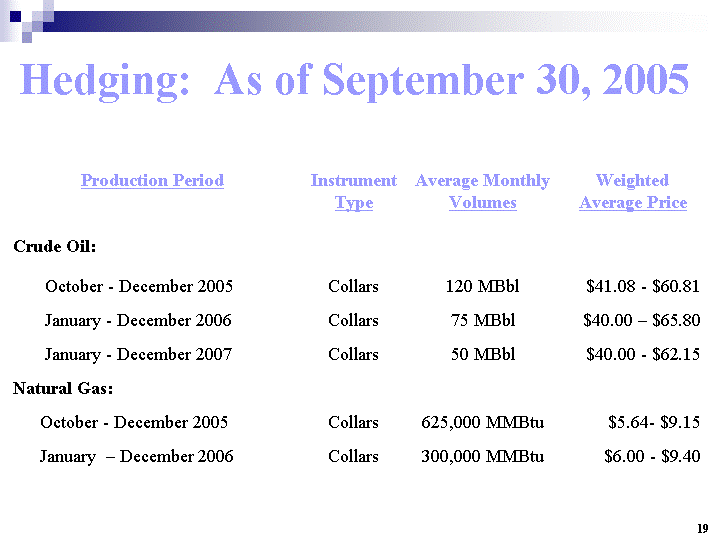
| Hedging: As of September 30, 2005 Production Period Instrument Type Average Monthly Volumes Weighted Average Price Crude Oil: October - December 2005 Collars 120 MBbl $41.08 - $60.81 January - December 2006 Collars 75 MBbl $40.00 - $65.80 January - December 2007 Collars 50 MBbl $40.00 - $62.15 Natural Gas: October - December 2005 Collars 625,000 MMBtu $5.64- $9.15 January - December 2006 Collars 300,000 MMBtu $6.00 - $9.40 19 |
| 2005 Objectives Marine Contracting Revenues: $300 - 330 million Margins: 13% - 15% Oil and Gas 40 - 45 BCFe of production PUD acquisition Mature property acquisition Production Facilities Equity earnings: $22 - 27 million Start up of production from K2/K2N Identify and progress next opportunity Financial Earnings in range $2.00 - $2.70/share (Revised - $3.15 - $3.35) No equity dilution Safety TRIR below 1.8 20 Goals |