N-CSR
UNITED STATES
SECURITIES AND EXCHANGE COMMISSION
Washington, D.C. 20549
FORM N-CSR
CERTIFIED SHAREHOLDER REPORT OF REGISTERED
MANAGEMENT INVESTMENT COMPANIES
Investment Company Act file number: 811-06153
Integrity Managed Portfolios
(Exact name of registrant as specified in charter)
1 Main Street North, Minot, ND | | 58703 |
(Address of principal offices) | | (Zip code) |
Brent Wheeler and/or Kevin Flagstad, PO Box 500, Minot, ND 58702
(Name and address of agent for service)
Registrant’s telephone number, including area code: 701-852-5292
Date of fiscal year end: July 31
Date of reporting period: July 31, 2017
Item 1. REPORTS TO STOCKHOLDERS.

INTEGRITY MANAGED PORTFOLIOS
Kansas Municipal Fund
Nebraska Municipal Fund
Oklahoma Municipal Fund
Maine Municipal Fund
New Hampshire Municipal Fund
Annual Report
July 31, 2017
| |
Investment Adviser
Viking Fund Management, LLC
PO Box 500
Minot, ND 58702 | Principal Underwriter
Integrity Funds Distributor, LLC*
PO Box 500
Minot, ND 58702 |
Transfer Agent
Integrity Fund Services, LLC
PO Box 759
Minot, ND 58702 | Custodian
Wells Fargo Bank, N.A.
Trust & Custody Solutions
801 Nicollet Mall, Suite 700
Minneapolis, MN 55479 |
Independent Registered Public Accounting Firm
Cohen & Company, Ltd.
1350 Euclid Avenue, Suite 800
Cleveland, OH 44115 |
|
*The Funds are distributed through Integrity Funds Distributor, LLC. Member FINRA |
|
|
Enclosed is the report of the operations for the Kansas Municipal Fund, Nebraska Municipal Fund, Oklahoma Municipal Fund, Maine Municipal Fund, and New Hampshire Municipal Fund (each a “Fund”, and collectively the “Funds”) for the year ended July 31, 2017. Each Fund’s portfolio and related financial statements are presented within for your review.
Economic Recap
The Federal Open Market Committee’s (“FOMC” or “Committee”) statement in mid-September noted that the labor market had continued to strengthen and growth of economic activity had picked up from the modest pace seen in the first half of 2016. Although the unemployment rate was little changed, job gains had been solid and household spending had been growing strongly. The Committee decided to maintain the target range for the federal funds rate at 1/4 to 1/2 percent. The Committee judged that the case for an increase in the federal funds rate had strengthened but decided, for the time being, to wait for further evidence of continued progress. In the mid-December statement the FOMC believed that the continued strength in the labor market and continued growth of economic activity since mid-year justified an increase in the federal funds rate to 1/2 to 3/4 percent and maintained that rate in January.
The Committee’s statement in mid-March noted that the labor market had continued to strengthen and that economic activity had continued to expand at a moderate pace. The Committee also noted that job gains remained solid and the unemployment rate was little changed. Household spending continued to rise moderately while business fixed investment appeared to have firmed somewhat. The Committee decided to raise the target range for the federal funds rate to 3/4 to 1 percent. From an economic perspective, the second quarter of 2017 was more of the same, as the Committee’s statement in mid-June again noted that the labor market continued to strengthen and that economic activity had been rising moderately so far this year. The Committee also noted that job gains have moderated but have been solid, on average, since the beginning of the year, and the unemployment rate had declined. Household spending picked up in recent months, and business fixed investment continued to expand. The Committee continues to expect that, with gradual adjustments in the stance of monetary policy, economic activity will expand at a moderate pace and labor market conditions will strengthen somewhat further. In view of realized and expected labor market conditions and inflation, the Committee decided to raise the target range for the federal funds rate to 1 to 1-1/4 percent. The Committee expects that economic conditions will evolve in a manner that will warrant only gradual increases in the federal funds rate; the federal funds rate is likely to remain, for some time, below levels that are expected to prevail in the longer run. However, the actual path of the federal funds rate will depend on the economic outlook as informed by incoming data.
Municipal Bond Market Recap
Returns were negative for the municipal bond market in the second half of 2016, breaking a streak of four consecutive quarters of positive returns and posting two consecutive quarters of negative returns to finish the year. Interest rates rose throughout the yield curve in the third quarter as the labor market continued to strengthen and economic activity picked up from the first half of the year. Rates continued to rise in October and more drastically in November on the heels of the Presidential Election, prospects of a higher growth rate for the economy and the possibility of tax reform from a new administration and unified government. November was the municipal market’s worst performance month since the 2008 financial crisis. However, the market did get a bit of a reprieve in December and January as bond prices recovered some of the prior month’s losses. The dramatic increase in rates from August through January resulted in negative returns for the Funds in the semi-annual period ending January 31.
Returns were positive for the municipal market in the first quarter of 2017. The Fed’s increase in the funds rate in mid-March had no net impact on bond market performance in the first quarter as it was highly anticipated. Municipal market yields rose and then declined in the first quarter, ending the period marginally lower than on December 30. The municipal market began to have its doubts about the Trump Administration’s ability to pass its growth initiatives in the near term. Favorable factors remained at the end of the first quarter with light supply and a muni/Treasury ratio that was attractive. Returns were again positive for the municipal market in the second quarter. The municipal bond market continued to perform well as the Trump agenda continued to lose momentum. The municipal market’s strength came as investors see it ever more unlikely that the current administration can accomplish meaningful tax reform this year. The lack of tax reform, as well as limited municipal supply and pent-up-demand propelled positive returns for the Funds in the first half of the year and into July. However, the strong performance in early 2017 was not enough to offset the pullback in the latter half of 2016.
Yields increased throughout the curve during the annual period, up 55 basis points on the 10 year AAA GO, and 58 and 62 basis points on the 20 and 30 year AAA GO, respectively. The increase during the period resulted in negative returns for the Funds in the annual period ending July 31. Issuance during the year came in at $368.9 billion nationally, a 3.64% increase over the same period last year due to a surge in issuance in late 2016. Since January national issuance is down 15.7% through July vs the same period last year. The 10-year muni/Treasury yield ratio was 85.2% on 7/31/17, down from 94.7% on 1/31/17, and down from 96.1% on 7/29/16.
Fund Performance and Outlook
We continue to follow a disciplined strategy of investing to maximize tax-exempt income while seeking value in the municipal market. Recent market activity and the possibility of rising rates has lead us to favor high quality, higher coupon bonds. As interest rates fluctuate, the portfolio becomes diversified with a broad range of securities that help us achieve a high level of current tax-free income for shareholders. All else equal, the shorter maturity structure and higher coupons will be more defensive, mitigating some negative impact to each Fund’s share price should a rise in rates occur.
The Kansas Municipal Fund began the period at $11.13 per share and ended the period at $10.78 per share for a total return of -0.42%*. The Maine Municipal Fund began the period at $11.31 per share and ended the period at $10.88 per share for a total return of -1.55%*. The Nebraska Municipal Fund began the period at $10.82 per share and ended the period at $10.46 per share for a total return of -1.01%*. The New Hampshire Municipal Fund began the period at $11.07 per share and ended the period at $10.55 per share for a total return of -2.73%* The Oklahoma Municipal Fund began the period at $12.10 per share and ended the period at $11.74 per share for a total return of -0.71%*. The returns of each Fund compare to the Barclays Capital Municipal Index’s return of 0.26%.
Income exempt from federal income taxes and each Fund's respective state tax (interest and dividend tax with respect to New Hampshire) with preservation of capital remains the primary objective of the Funds.
If you would like more frequent updates, please visit the Funds’ website at www.integrityvikingfunds.com for daily prices along with pertinent Fund information.
Sincerely,
The Portfolio Management Team
The views expressed are those of The Portfolio Management Team of Viking Fund Management, LLC (“Viking Fund Management”, “VFM”, or the “Adviser”). The views are subject to change at any time in response to changing circumstances in the market and are not intended to predict or guarantee the future performance of any individual security, market sector, the markets generally, or any of the funds in the Integrity Viking family of funds.
*Performance does not include applicable front-end or contingent deferred sales charges, which would have reduced the performance. For Kansas Municipal Fund, Nebraska Municipal Fund, Oklahoma Municipal Fund, Maine Municipal Fund, and New Hampshire Municipal Fund, the total annual fund operating expense ratio (before expense waivers and reimbursements and including acquired fund fees and expenses) as of the most recent fiscal year-end was 1.15%, 1.18%, 1.16%, 1.25%, and 1.53%, respectively. The net annual fund operating expense ratio (after expense waivers and reimbursements and excluding acquired fund fees and expenses) as of the most recent fiscal year-end was 0.98%, 0.98%, 0.98%, 0.98%, and 0.98%, respectively. The Fund’s investment adviser has contractually agreed to waive fees and reimburse expenses through November 29, 2017 so that total annual fund operating expenses after fee waivers and expense reimbursements (excluding taxes, brokerage fees, commissions, extraordinary and non-recurring expenses, and acquired fund fees and expenses) do not exceed 0.98% of average daily net assets. This expense limitation agreement may only be terminated or modified prior to November 29, 2017 with the approval of the Fund’s Board of Trustees.
Performance data quoted above is historical. Past performance is no guarantee of future results. Current performance may be higher or lower than the performance data quoted. The principal value and investment return of an investment will fluctuate so that your shares, when redeemed, may be worth more or less than the original cost. You can obtain performance data current to the most recent month end (available within seven business days of the most recent month end) by calling 800-276-1262.
You should consider each Fund’s investment objectives, risks, charges, and expenses carefully before investing. For this and other important information, please obtain a Fund prospectus at no cost from your financial adviser and read it carefully before investing.
Bond prices and therefore the value of bond funds decline as interest rates rise. Because each Fund invests in securities of a single state, the Funds are more susceptible to factors adversely impacting the respective state than a municipal bond fund that does not concentrate its securities in a single state.
For investors subject to the alternative minimum tax, a portion of the each Fund’s dividends may be taxable. Distributions of capital gains are generally taxable.
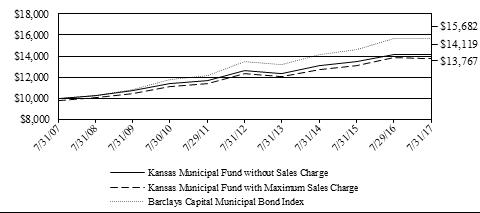
KANSAS MUNICIPAL FUND
PERFORMANCE (unaudited)
Comparison of change in value of a $10,000 investment
Average Annual Total Returns for the periods ended July 31, 2017
| | | | | | Since Inception |
| | 1 year | 3 year | 5 year | 10 year | (November 15, 1990) |
Without sales charge | -0.42% | 2.61% | 2.22% | 3.51% | 4.15% |
With sales charge (2.5%) | -2.94% | 1.74% | 1.69% | 3.25% | 4.05% |
The total annual fund operating expense ratio (before expense waivers and reimbursements and including acquired fund fees and expenses) as of the most recent fiscal year-end was 1.15%. The net annual fund operating expense ratio (after expense waivers and reimbursements and excluding acquired fund fees and expenses) as of the most recent fiscal year-end was 0.98%. The Fund’s investment adviser has contractually agreed to waive fees and reimburse expenses through November 29, 2017 so that total annual fund operating expenses after fee waivers and expense reimbursements (excluding taxes, brokerage fees, commissions, extraordinary and non-recurring expenses, and acquired fund fees and expenses) do not exceed 0.98% of average daily net assets. This expense limitation agreement may only be terminated or modified prior to November 29, 2017 with the approval of the Fund’s Board of Trustees.
Performance data quoted above is historical. Past performance is no guarantee of future results. Current performance may be higher or lower than the performance data quoted. The principal value and investment return of an investment will fluctuate so that your shares, when redeemed, may be worth more or less than the original cost. You can obtain performance data current to the most recent month end (available within seven business days of the most recent month end) by calling 800-276-1262.
The table and graph above do not reflect the deduction of taxes that a shareholder would pay on Fund distributions and redemptions of Fund shares.
The graph comparing the Fund’s performance to a benchmark index provides you with a general sense of how the Fund performed. To put this information in context, it may be helpful to understand the special differences between the two. The Fund’s total return for the period shown appears with and without sales charges and includes Fund expenses and management fees. A securities index measures the performance of a theoretical portfolio. Unlike a fund, the index is unmanaged; there are no expenses that affect the results. In addition, few investors could purchase all of the securities to match the index. If they could, transaction costs and other expenses would be incurred. All Fund and benchmark returns include reinvested dividends. The results prior to August 1, 2009 were achieved while the Fund was managed by a different investment adviser. The current investment adviser may produce different investment results than those achieved by the previous investment adviser.
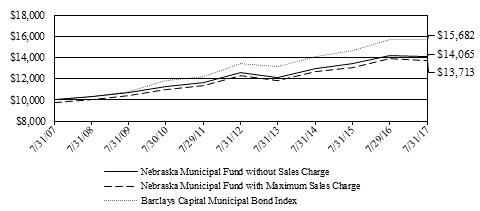
NEBRASKA MUNICIPAL FUND
PERFORMANCE (unaudited)
Comparison of change in value of a $10,000 investment
Average Annual Total Returns for the periods ended July 31, 2017
| | | | | | Since Inception |
| | 1 year | 3 year | 5 year | 10 year | (November 17, 1993) |
Without sales charge | -1.01% | 2.78% | 2.24% | 3.47% | 3.67% |
With sales charge (2.5%) | -3.51% | 1.91% | 1.73% | 3.21% | 3.56% |
The total annual fund operating expense ratio (before expense waivers and reimbursements and including acquired fund fees and expenses) as of the most recent fiscal year-end was 1.18%. The net annual fund operating expense ratio (after expense waivers and reimbursements and excluding acquired fund fees and expenses) as of the most recent fiscal year-end was 0.98%. The Fund’s investment adviser has contractually agreed to waive fees and reimburse expenses through November 29, 2017 so that total annual fund operating expenses after fee waivers and expense reimbursements (excluding taxes, brokerage fees, commissions, extraordinary and non-recurring expenses, and acquired fund fees and expenses) do not exceed 0.98% of average daily net assets. This expense limitation agreement may only be terminated or modified prior to November 29, 2017 with the approval of the Fund’s Board of Trustees.
Performance data quoted above is historical. Past performance is no guarantee of future results. Current performance may be higher or lower than the performance data quoted. The principal value and investment return of an investment will fluctuate so that your shares, when redeemed, may be worth more or less than the original cost. You can obtain performance data current to the most recent month end (available within seven business days of the most recent month end) by calling 800-276-1262.
The table and graph above do not reflect the deduction of taxes that a shareholder would pay on Fund distributions and redemptions of Fund shares.
The graph comparing the Fund’s performance to a benchmark index provides you with a general sense of how the Fund performed. To put this information in context, it may be helpful to understand the special differences between the two. The Fund’s total return for the period shown appears with and without sales charges and includes Fund expenses and management fees. A securities index measures the performance of a theoretical portfolio. Unlike a fund, the index is unmanaged; there are no expenses that affect the results. In addition, few investors could purchase all of the securities to match the index. If they could, transaction costs and other expenses would be incurred. All Fund and benchmark returns include reinvested dividends. The results prior to August 1, 2009 were achieved while the Fund was managed by a different investment adviser. The current investment adviser may produce different investment results than those achieved by the previous investment adviser.
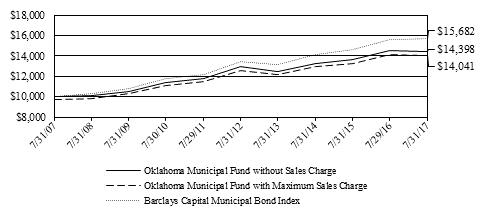
OKLAHOMA MUNICIPAL FUND
PERFORMANCE (unaudited)
Comparison of change in value of a $10,000 investment
Average Annual Total Returns for the periods ended July 31, 2017
| | | | | | Since Inception |
| | 1 year | 3 year | 5 year | 10 year | (September 25, 1996) |
Without sales charge | -0.71% | 2.82% | 2.21% | 3.71% | 3.94% |
With sales charge (2.5%) | -3.19% | 1.95% | 1.69% | 3.45% | 3.81% |
The total annual fund operating expense ratio (before expense waivers and reimbursements and including acquired fund fees and expenses) as of the most recent fiscal year-end was 1.16%. The net annual fund operating expense ratio (after expense waivers and reimbursements and excluding acquired fund fees and expenses) as of the most recent fiscal year-end was 0.98%. The Fund’s investment adviser has contractually agreed to waive fees and reimburse expenses through November 29, 2017 so that total annual fund operating expenses after fee waivers and expense reimbursements (excluding taxes, brokerage fees, commissions, extraordinary and non-recurring expenses, and acquired fund fees and expenses) do not exceed 0.98% of average daily net assets. This expense limitation agreement may only be terminated or modified prior to November 29, 2017 with the approval of the Fund’s Board of Trustees.
Performance data quoted above is historical. Past performance is no guarantee of future results. Current performance may be higher or lower than the performance data quoted. The principal value and investment return of an investment will fluctuate so that your shares, when redeemed, may be worth more or less than the original cost. You can obtain performance data current to the most recent month end (available within seven business days of the most recent month end) by calling 800-276-1262.
The table and graph above do not reflect the deduction of taxes that a shareholder would pay on Fund distributions and redemptions of Fund shares.
The graph comparing the Fund’s performance to a benchmark index provides you with a general sense of how the Fund performed. To put this information in context, it may be helpful to understand the special differences between the two. The Fund’s total return for the period shown appears with and without sales charges and includes Fund expenses and management fees. A securities index measures the performance of a theoretical portfolio. Unlike a fund, the index is unmanaged; there are no expenses that affect the results. In addition, few investors could purchase all of the securities to match the index. If they could, transaction costs and other expenses would be incurred. All Fund and benchmark returns include reinvested dividends. The results prior to August 1, 2009 were achieved while the Fund was managed by a different investment adviser. The current investment adviser may produce different investment results than those achieved by the previous investment adviser.
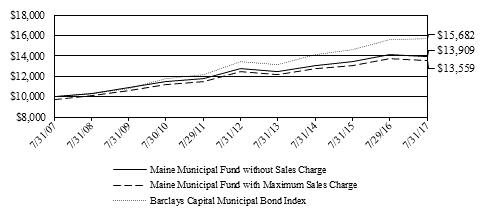
MAINE MUNICIPAL FUND
PERFORMANCE (unaudited)
Comparison of change in value of a $10,000 investment
Average Annual Total Returns for the periods ended July 31, 2017
| | | | | | Since Inception |
| | 1 year | 3 year | 5 year | 10 year | (December 5, 1991) |
Without sales charge | -1.55% | 2.05% | 1.67% | 3.35% | 4.28% |
With sales charge (2.5%) | -4.01% | 1.20% | 1.16% | 3.09% | 4.18% |
The total annual fund operating expense ratio (before expense waivers and reimbursements and including acquired fund fees and expenses) as of the most recent fiscal year-end was 1.25%. The net annual fund operating expense ratio (after expense waivers and reimbursements and excluding acquired fund fees and expenses) as of the most recent fiscal year-end was 0.98%. The Fund’s investment adviser has contractually agreed to waive fees and reimburse expenses through November 29, 2017 so that total annual fund operating expenses after fee waivers and expense reimbursements (excluding taxes, brokerage fees, commissions, extraordinary and non-recurring expenses, and acquired fund fees and expenses) do not exceed 0.98% of average daily net assets. This expense limitation agreement may only be terminated or modified prior to November 29, 2017 with the approval of the Fund’s Board of Trustees.
Performance data quoted above is historical. Past performance is no guarantee of future results. Current performance may be higher or lower than the performance data quoted. The principal value and investment return of an investment will fluctuate so that your shares, when redeemed, may be worth more or less than the original cost. You can obtain performance data current to the most recent month end (available within seven business days of the most recent month end) by calling 800-276-1262.
The table and graph above do not reflect the deduction of taxes that a shareholder would pay on Fund distributions and redemptions of Fund shares.
The graph comparing the Fund’s performance to a benchmark index provides you with a general sense of how the Fund performed. To put this information in context, it may be helpful to understand the special differences between the two. The Fund’s total return for the period shown appears with and without sales charges and includes Fund expenses and management fees. A securities index measures the performance of a theoretical portfolio. Unlike a fund, the index is unmanaged; there are no expenses that affect the results. In addition, few investors could purchase all of the securities to match the index. If they could, transaction costs and other expenses would be incurred. All Fund and benchmark returns include reinvested dividends. The results prior to August 1, 2009 were achieved while the Fund was managed by a different investment adviser. The current investment adviser may produce different investment results than those achieved by the previous investment adviser.
NEW HAMPSHIRE MUNICIPAL FUND
PERFORMANCE (unaudited)
Comparison of change in value of a $10,000 investment
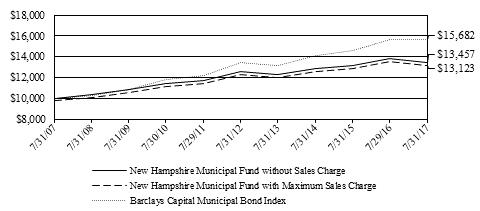
Average Annual Total Returns for the periods ended July 31, 2017
| | | | | | Since Inception |
| | 1 year | 3 year | 5 year | 10 year | (December 31, 1992) |
Without sales charge | -2.73% | 1.56% | 1.38% | 3.01% | 3.88% |
With sales charge (2.5%) | -5.13% | 0.69% | 0.87% | 2.75% | 3.77% |
The total annual fund operating expense ratio (before expense waivers and reimbursements and including acquired fund fees and expenses) as of the most recent fiscal year-end was 1.53%. The net annual fund operating expense ratio (after expense waivers and reimbursements and excluding acquired fund fees and expenses) as of the most recent fiscal year-end was 0.98%. The Fund’s investment adviser has contractually agreed to waive fees and reimburse expenses through November 29, 2017 so that total annual fund operating expenses after fee waivers and expense reimbursements (excluding taxes, brokerage fees, commissions, extraordinary and non-recurring expenses, and acquired fund fees and expenses) do not exceed 0.98% of average daily net assets. This expense limitation agreement may only be terminated or modified prior to November 29, 2017 with the approval of the Fund’s Board of Trustees.
Performance data quoted above is historical. Past performance is no guarantee of future results. Current performance may be higher or lower than the performance data quoted. The principal value and investment return of an investment will fluctuate so that your shares, when redeemed, may be worth more or less than the original cost. You can obtain performance data current to the most recent month end (available within seven business days of the most recent month end) by calling 800-276-1262.
The table and graph above do not reflect the deduction of taxes that a shareholder would pay on Fund distributions and redemptions of Fund shares.
The graph comparing the Fund’s performance to a benchmark index provides you with a general sense of how the Fund performed. To put this information in context, it may be helpful to understand the special differences between the two. The Fund’s total return for the period shown appears with and without sales charges and includes Fund expenses and management fees. A securities index measures the performance of a theoretical portfolio. Unlike a fund, the index is unmanaged; there are no expenses that affect the results. In addition, few investors could purchase all of the securities to match the index. If they could, transaction costs and other expenses would be incurred. All Fund and benchmark returns include reinvested dividends. The results prior to August 1, 2009 were achieved while the Fund was managed by a different investment adviser. The current investment adviser may produce different investment results than those achieved by the previous investment adviser.
KANSAS MUNICIPAL FUND
PORTFOLIO MARKET SECTORS July 31, 2017
General Obligation | 46.5% |
Health Care | 20.8% |
Other Revenue | 14.0% |
Utilities | 11.1% |
Other Assets Less Liabilities | 3.4% |
Transportation | 2.8% |
Education | 1.4% |
| 100.0% |
Market sectors are breakdowns of the Fund’s portfolio holdings into specific investment classes.
These percentages are based on net assets and are subject to change.
SCHEDULE OF INVESTMENTS July 31, 2017
| | | Principal | | | Fair |
| | | Amount | | | Value |
MUNICIPAL BONDS (96.6%) | | | | | |
| | | | | | |
Education (1.4%) | | | | | |
KS Dev-K-L1-St Olathe 5.000% 09/01/39 | $ | 200,000 | | $ | 212,258 |
KS Dev Fin-F-1 5.000% 06/01/27 | | 250,000 | | | 277,778 |
Sedgwick Sd 266-Prerf 5.250% 09/01/20 | | 345,000 | | | 361,343 |
Sedgwick Sd 266-Unref 5.250% 09/01/20 | | 15,000 | | | 15,700 |
| | | | | | 867,079 |
General Obligation (46.5%) | | | | | |
Bourbon Usd #234 5.000% 09/01/27 | | 250,000 | | | 295,115 |
Bourbon Usd #234 5.000% 09/01/28 | | 250,000 | | | 291,243 |
Bourbon Usd #234 5.000% 09/01/29 | | 250,000 | | | 287,923 |
Bourbon Usd #234 5.000% 09/01/30 | | 250,000 | | | 286,390 |
Bourbon Usd #234 5.000% 09/01/31 | | 500,000 | | | 570,360 |
Butler Usd #402-A 5.250% 09/01/21 | | 560,000 | | | 586,387 |
Butler Sd #402-Ref 4.000% 09/01/30 | | 250,000 | | | 281,458 |
Butler Usd #385 Ref 5.000% 09/01/18 | | 500,000 | | | 522,605 |
Clay Co-Ref 4.000% 10/01/36 | | 500,000 | | | 523,025 |
Cowley Usd #470-A 5.500% 09/01/21 | | 100,000 | | | 104,803 |
Cowley Usd #470-A 4.750% 09/01/27 | | 490,000 | | | 512,584 |
Dickinson Sd #473 Bdg 5.000% 09/01/27 | | 325,000 | | | 352,453 |
Dickinson Usd #473-Rf 4.400% 09/01/29 | | 100,000 | | | 107,212 |
Douglas Usd #348-Ref 4.000% 09/01/30 | | 250,000 | | | 279,890 |
Douglas Usd #491-A-Sc 5.500% 09/01/24 | | 250,000 | | | 262,515 |
Douglas Usd #491-A 5.000% 09/01/23 | | 375,000 | | | 406,432 |
Douglas Usd #491-A 5.125% 09/01/29 | | 250,000 | | | 271,600 |
*Franklin Sd #290-A 5.000% 09/01/40 | | 3,000,000 | | | 3,386,040 |
Harvey Sd 373-Ref-Imp 4.000% 09/01/18 | | 250,000 | | | 259,545 |
Harvey Sd 373-Ref-Imp 5.000% 09/01/23 | | 200,000 | | | 209,514 |
Harvey Sd 373-Ref-Imp 5.000% 09/01/25 | | 1,000,000 | | | 1,047,570 |
Jackson Usd 336-Prerf 5.000% 09/01/29 | | 135,000 | | | 159,411 |
Jackson Usd 336-Prerf 5.000% 09/01/34 | | 140,000 | | | 165,315 |
Jackson Usd 336-Unref 5.000% 09/01/29 | | 115,000 | | | 131,190 |
Jackson Usd 336-Unref 5.000% 09/01/34 | | 110,000 | | | 123,318 |
Johnson Sd #230-B 4.000% 09/01/36 | | 500,000 | | | 528,805 |
Johnson Usd 231-A-Ref 5.000% 10/01/25 | | 250,000 | | | 296,537 |
Johnson Usd 233-C-Ref 4.000% 09/01/29 | | 500,000 | | | 558,110 |
Johnson Usd #233-A 4.000% 09/01/18 | | 150,000 | | | 155,965 |
Junction City-Preref 5.000% 09/01/25 | | 245,000 | | | 245,843 |
Junction City-Unref 5.000% 09/01/25 | | 5,000 | | | 5,019 |
Jct City Ser Du 4.250% 09/01/21 | | 100,000 | | | 106,860 |
Jct City Ser Du 4.400% 09/01/22 | | 100,000 | | | 107,169 |
Jct City Ser Du 4.500% 09/01/23 | | 100,000 | | | 107,375 |
Leavenworth Sd #453-A 5.250% 03/01/24 | | 200,000 | | | 218,622 |
Leavenworth Sd #453-A 4.750% 09/01/25 | | 300,000 | | | 326,142 |
*Leavenworth Sd #453-A 5.125% 03/01/29 | | 1,000,000 | | | 1,092,500 |
Leavenworth Usd #458 5.000% 09/01/29 | | 500,000 | | | 575,675 |
Leavenworth Sd#469-Rf 4.000% 09/01/30 | | 320,000 | | | 346,656 |
Leavenworth Sd#469-Rf 4.000% 09/01/32 | | 500,000 | | | 533,240 |
Leoti Usd #467 Bldg 5.000% 10/01/18 | | 100,000 | | | 105,109 |
Manhattan-C 5.000% 11/01/28 | | 130,000 | | | 135,814 |
Miami Usd #368-Preref 5.000% 09/01/27 | | 135,000 | | | 155,046 |
Miami Usd #368-Preref 5.000% 09/01/27 | | 105,000 | | | 120,637 |
Miami Usd #368-Unref 5.000% 09/01/27 | | 10,000 | | | 11,283 |
Montgomery Sd 446 5.000% 09/01/33 | | 250,000 | | | 250,872 |
Neosho Cnty Sd#413-Rf 4.000% 09/01/31 | | 250,000 | | | 265,575 |
Newton-Ref/Impt-A 5.000% 09/01/21 | | 100,000 | | | 108,382 |
Newton-Ref/Impt-A 4.750% 09/01/29 | | 435,000 | | | 469,226 |
Park City-A 5.100% 12/01/20 | | 200,000 | | | 219,544 |
Park City-A 5.500% 12/01/24 | | 100,000 | | | 110,694 |
Park City-A 6.000% 12/01/29 | | 500,000 | | | 559,235 |
Park City-A-Preref 5.375% 12/01/25 | | 250,000 | | | 275,220 |
Salina-Internal-A 4.625% 10/01/27 | | 200,000 | | | 201,252 |
Scott Co-Ref 5.000% 04/01/32 | | 500,000 | | | 585,500 |
Sedgwick Sd 261-Prerf 5.000% 11/01/21 | | 245,000 | | | 247,560 |
Sedgwick Sd 261-Unref 5.000% 11/01/21 | | 5,000 | | | 5,059 |
Sedgwick Usd #262 Ref 5.000% 09/01/18 | | 100,000 | | | 104,834 |
Sedgwick Cnty Sd#262 5.000% 09/01/28 | | 485,000 | | | 508,445 |
Sedgwick Cnty Sd#262 5.000% 09/01/28 | | 15,000 | | | 15,562 |
Sedgwick Sd 262-Prerf 5.000% 09/01/24 | | 245,000 | | | 255,947 |
Sedgwick Sd 262-Unref 5.000% 09/01/24 | | 5,000 | | | 5,221 |
Sedgwick Co Usd #262 5.000% 09/01/35 | | 1,000,000 | | | 1,145,100 |
Sedgwick Usd #265-Bld 4.250% 10/01/20 | | 750,000 | | | 783,255 |
Sedgwick Usd #265-Bld 4.500% 10/01/26 | | 250,000 | | | 261,360 |
Sedgwick Sd 266-Prerf 5.250% 09/01/19 | | 215,000 | | | 225,185 |
Sedgwick Sd 266-Unref 5.250% 09/01/19 | | 10,000 | | | 10,475 |
Seward Co-Preref 5.000% 08/01/34 | | 260,000 | | | 290,659 |
Seward Co-Unref 5.000% 08/01/34 | | 240,000 | | | 261,962 |
Seward Usd #480-Ref 5.000% 09/01/34 | | 500,000 | | | 592,300 |
Seward Usd #480-Ref 4.250% 09/01/39 | | 500,000 | | | 526,315 |
Seward Usd 480-Preref 5.000% 09/01/33 | | 85,000 | | | 100,491 |
Seward Usd #480-Unref 5.000% 09/01/33 | | 415,000 | | | 467,307 |
Wichita-Ser 790a 4.500% 09/01/22 | | 150,000 | | | 151,920 |
Wichita-Ser 790a 4.750% 09/01/27 | | 180,000 | | | 182,254 |
Wyandotte Govt-Impt-A 5.000% 08/01/25 | | 250,000 | | | 250,000 |
Wyandotte Govt-Impt-A 5.000% 08/01/27 | | 500,000 | | | 500,000 |
Wyandotte Sd 2-Rf-A 5.250% 09/01/18 | | 100,000 | | | 105,211 |
Wyandotte Usd #2 5.000% 09/01/25 | | 250,000 | | | 296,155 |
Wyandotte Co Sd#500-A 5.000% 09/01/26 | | 1,000,000 | | | 1,210,780 |
| | | | | | 28,705,162 |
Health Care (20.8%) | | | | | |
Ashland Pub Bldg 5.000% 09/01/30 | | 1,020,000 | | | 1,097,010 |
Ashland Pub Bldg 5.000% 09/01/35 | | 500,000 | | | 531,975 |
Ashland Pub Bldg 5.000% 09/01/32 | | 550,000 | | | 594,709 |
KS Dev-O-Univ KS Hsp 5.000% 06/15/39 | | 1,000,000 | | | 1,047,720 |
KS Dev Fin Auth-Prerf 5.000% 01/01/40 | | 435,000 | | | 478,883 |
KS Dev Fin Auth-Unref 5.000% 01/01/40 | | 65,000 | | | 68,663 |
KS St Dev Hosp-Advent 5.150% 11/15/23 | | 250,000 | | | 272,192 |
KS St Dev Hosp-Advent 5.250% 11/15/24 | | 250,000 | | | 272,535 |
KS St Dev Hosp-Advent 5.500% 11/15/29 | | 100,000 | | | 109,448 |
KS Hlth-Stormont-Vail 5.125% 11/15/32 | | 410,000 | | | 415,039 |
KS Hlth-Stormont-Vail 5.125% 11/15/36 | | 500,000 | | | 506,145 |
KS Hlth-Q-Hays Med Ct 5.000% 05/15/25 | | 250,000 | | | 267,722 |
KS Hlth-Q-Hays Med Ct 5.000% 05/15/35 | | 1,000,000 | | | 1,071,080 |
KS Dev Fin-H 5.000% 03/01/28 | | 755,000 | | | 811,414 |
KS Dev Fin-J-Stormont 4.125% 11/15/27 | | 100,000 | | | 107,806 |
Lincoln Bldg-Lincoln 5.500% 03/01/35 | | 500,000 | | | 513,495 |
Manhattan Hosp-Ref 5.000% 11/15/23 | | 250,000 | | | 289,382 |
Manhattan Hosp-Ref 5.000% 11/15/24 | | 250,000 | | | 287,287 |
Manhattan Hosp-Ref 5.000% 11/15/29 | | 500,000 | | | 554,580 |
Olathe Hlth-A 5.000% 09/01/30 | | 250,000 | | | 264,825 |
Olathe Hlth-A-Olathe 4.000% 09/01/28 | | 250,000 | | | 263,090 |
Olathe Hlth-A-Olathe 4.000% 09/01/30 | | 445,000 | | | 464,829 |
Olathe Hlth-Preref 5.000% 09/01/29 | | 195,000 | | | 195,671 |
Olathe Hlth-Unref 5.000% 09/01/29 | | 305,000 | | | 306,165 |
Univ KS Hosp-Ref-Impt 4.000% 09/01/40 | | 500,000 | | | 520,615 |
Univ KS Hosp-Ref-Impt 5.000% 09/01/35 | | 500,000 | | | 567,355 |
Univ KS Hosp-A-Ref 5.000% 03/01/31 | | 500,000 | | | 586,790 |
Wichita Hosp Fac-Iv-A 5.000% 11/15/29 | | 300,000 | | | 351,960 |
| | | | | | 12,818,385 |
Other Revenue (14.0%) | | | | | |
Butler Bldg Ref-Facs 4.500% 10/01/21 | | 160,000 | | | 160,235 |
Dodge City S/Tax 5.000% 06/01/21 | | 310,000 | | | 332,965 |
Dodge City S/Tax 4.400% 06/01/25 | | 350,000 | | | 372,186 |
Dodge City S/Tax 4.500% 06/01/28 | | 100,000 | | | 106,520 |
*Dodge City S/Tax 5.250% 06/01/31 | | 1,000,000 | | | 1,078,620 |
KS Dev Fin-B 4.125% 05/01/31 | | 500,000 | | | 525,085 |
KS Dev-W-Unref-KS Prj 5.000% 10/01/17 | | 20,000 | | | 20,014 |
KS Dev Ser M-1 5.000% 11/01/34 | | 500,000 | | | 531,830 |
KS St Dev-K-Projs 5.250% 11/01/25 | | 350,000 | | | 353,832 |
KS Dev-Rf-A-KS Dept A 5.000% 05/01/35 | | 250,000 | | | 261,890 |
Lincoln Bldg-Lincoln 5.000% 03/01/28 | | 250,000 | | | 256,037 |
Manhattan S/Tax Pj-1 5.250% 12/01/26 | | 35,000 | | | 37,050 |
Manhattan Rev-A 5.000% 12/01/26 | | 500,000 | | | 514,800 |
Manhattan 4.500% 12/01/25 | | 500,000 | | | 541,555 |
*Manhattan 5.000% 12/01/32 | | 1,000,000 | | | 1,104,760 |
Neosho Sales Tax Rev 4.000% 10/01/23 | | 500,000 | | | 529,790 |
Topeka Bldg-B-Rf-Dept 5.000% 06/01/22 | | 255,000 | | | 268,630 |
Washington Pub Bldg 4.000% 09/01/28 | | 600,000 | | | 648,378 |
Washington Pub Bldg 5.000% 09/01/32 | | 500,000 | | | 558,420 |
Washington Pub Bldg 5.000% 09/01/37 | | 400,000 | | | 442,380 |
| | | | | | 8,644,977 |
Transportation (2.8%) | | | | | |
Kansas St Dept Of Tra 5.000% 09/01/33 | | 500,000 | | | 593,605 |
Kansas St Dept Of Tra 5.000% 09/01/34 | | 500,000 | | | 590,060 |
Kansas St Dept Of Tra 5.000% 09/01/35 | | 250,000 | | | 295,430 |
KS Dev-Trn Revolving 4.625% 10/01/26 | | 250,000 | | | 259,217 |
| | | | | | 1,738,312 |
Utilities (11.1%) | | | | | |
Chisholm Creek Util 4.000% 09/01/29 | | 250,000 | | | 274,860 |
*KS Muni Energy Agy 5.750% 07/01/38 | | 1,000,000 | | | 1,169,400 |
Kansas Pwr Pool Elec 4.500% 12/01/28 | | 500,000 | | | 529,415 |
Kansas Pwr Pool Elec 5.000% 12/01/31 | | 750,000 | | | 800,565 |
Kansas Pwr-A-Dogwood 4.000% 12/01/31 | | 500,000 | | | 537,620 |
Wyandotte Govt-A 5.000% 09/01/24 | | 200,000 | | | 212,492 |
Wyandotte Govt-A 5.000% 09/01/29 | | 500,000 | | | 531,230 |
Wyandotte-Ref-A-Utils 5.000% 09/01/36 | | 250,000 | | | 276,965 |
*Wyandotte Govt-Ref-A 5.000% 09/01/32 | | 1,250,000 | | | 1,393,525 |
Wyandotte Unif Govt-A 5.000% 09/01/35 | | 500,000 | | | 565,830 |
Wyandotte Unif Govt-B 5.000% 09/01/28 | | 500,000 | | | 588,610 |
| | | | | | 6,880,512 |
| | | | | |
TOTAL MUNICIPAL BONDS (COST: $56,946,992) | | | | $ | 59,654,427 |
| | | | | |
OTHER ASSETS LESS LIABILITIES (3.4%) | | | | | 2,120,855 |
| | | | | |
NET ASSETS (100.0%) | | | | $ | 61,775,282 |
| | | | | |
*Indicates all or a portion of bonds are segregated by the custodian to cover when-issued or delayed-delivery purchases. |
|
|
The accompanying notes are an integral part of these financial statements. |
NEBRASKA MUNICIPAL FUND
PORTFOLIO MARKET SECTORS July 31, 2017
Utilities | 32.7% |
General Obligation | 26.9% |
Education | 20.2% |
Health Care | 6.9% |
Other Revenue | 6.0% |
Other Assets Less Liabilities | 3.4% |
Transportation | 2.3% |
Housing | 1.6% |
| 100.0% |
Market sectors are breakdowns of the Fund’s portfolio holdings into specific investment classes.
These percentages are based on net assets and are subject to change.
SCHEDULE OF INVESTMENTS July 31, 2017
| | | Principal | | | Fair |
| | | Amount | | | Value |
MUNICIPAL BONDS (96.6%) | | | | | |
| | | | | |
Education (20.2%) | | | | | |
Douglas Cnty NE Edl 5.500% 07/01/30 | $ | 350,000 | | $ | 384,818 |
*Douglas Cnty NE Edl 5.875% 07/01/40 | | 1,500,000 | | | 1,658,985 |
Douglas Hosp-Boys Twn 4.750% 09/01/28 | | 200,000 | | | 206,060 |
NE Edl-Clarkson-Ref 5.050% 09/01/30 | | 250,000 | | | 277,715 |
NE Elem Sch-Boys Twn 4.750% 09/01/28 | | 250,000 | | | 258,120 |
Univ Of NE Facs Corp 5.000% 12/15/25 | | 1,500,000 | | | 1,859,625 |
Univ Of Nebraska NE 5.000% 07/01/35 | | 1,500,000 | | | 1,738,875 |
Univ Of Nebraska Brd 5.000% 05/15/35 | | 500,000 | | | 580,895 |
Univ Of NE-Ref 5.000% 05/15/33 | | 250,000 | | | 294,522 |
Univ NE Omaha Hlth 5.000% 05/15/33 | | 600,000 | | | 619,530 |
Univ NE Univ-B1 4.000% 07/01/24 | | 250,000 | | | 262,225 |
Univ NE-B-Std Hsg 4.500% 05/15/30 | | 250,000 | | | 266,085 |
Univ NE-B-Std Hsg 5.000% 05/15/35 | | 275,000 | | | 298,326 |
Univ Of Nebraska 5.000% 07/01/42 | | 1,000,000 | | | 1,112,830 |
Univ Of Nebraska-Ref 5.000% 07/01/38 | | 250,000 | | | 283,340 |
| | | | | | 10,101,951 |
General Obligation (26.9%) | | | | | |
Douglas Cnty NE Sch D 5.000% 12/15/29 | | 1,630,000 | | | 2,004,704 |
Douglas Co Sd #10 4.000% 12/15/34 | | 300,000 | | | 320,652 |
Douglas Co Sd #10-Ref 4.000% 12/15/30 | | 500,000 | | | 545,000 |
Hall Co Arpt-A-Amt 5.000% 07/15/30 | | 410,000 | | | 447,060 |
Hall Co Arpt-A-Amt 5.000% 07/15/31 | | 435,000 | | | 473,354 |
Hall Co Sd #2 5.000% 12/15/33 | | 500,000 | | | 575,360 |
Hall Co Sd #2 5.000% 12/15/39 | | 500,000 | | | 570,030 |
Lincoln Etc Bldg-Rf 4.000% 10/15/30 | | 100,000 | | | 100,072 |
*Omaha-Ref-Convntn/Are 5.250% 04/01/27 | | 1,000,000 | | | 1,288,370 |
Omaha-A-Ref 5.000% 04/15/25 | | 750,000 | | | 919,672 |
Omaha-A-Ref 5.000% 04/15/27 | | 955,000 | | | 1,171,183 |
Omaha-A-Ref 5.000% 04/15/28 | | 500,000 | | | 606,730 |
Omaha-Preref-Ref 5.000% 10/15/25 | | 45,000 | | | 48,876 |
Omaha-Unref-Ref 5.000% 10/15/25 | | 205,000 | | | 222,496 |
Papillion Sd 27-Pub 5.000% 12/01/28 | | 250,000 | | | 263,140 |
Papio-Mo Rvr Res Dist 4.000% 12/15/24 | | 250,000 | | | 254,253 |
Papio-Mo Rvr Res Dist 5.000% 12/15/26 | | 250,000 | | | 261,885 |
Papio-Missouri Rvr 4.000% 12/15/30 | | 1,000,000 | | | 1,041,690 |
Ralston-A-Arena 4.500% 09/15/31 | | 500,000 | | | 453,945 |
Sarpy Co Sd#37-Ref 5.000% 12/15/35 | | 250,000 | | | 288,543 |
Scotts Bluff Cnty Sd 5.000% 12/01/31 | | 250,000 | | | 293,590 |
Sidney NE-Ref 4.000% 12/15/36 | | 1,250,000 | | | 1,314,588 |
| | | | | | 13,465,193 |
Health Care (6.9%) | | | | | |
Adams Hsp #1-Mary Lan 5.250% 12/15/33 | | 250,000 | | | 259,535 |
Douglas Hsp-Immanuel 5.500% 01/01/30 | | 500,000 | | | 538,400 |
Douglas Hosp Auth #2 5.000% 05/15/27 | | 200,000 | | | 239,422 |
Douglas Hosp #3 Ref 5.500% 11/01/38 | | 795,000 | | | 839,393 |
Douglas Hsp #3-Rf-Met 5.500% 11/01/38 | | 415,000 | | | 438,174 |
Lincoln Hosp Auth#1 5.000% 11/01/23 | | 250,000 | | | 282,798 |
Lincoln Hosp Auth#1 5.000% 11/01/24 | | 250,000 | | | 281,323 |
Lincoln Hosp Auth#1 5.000% 11/01/25 | | 250,000 | | | 280,725 |
Lincoln Hosp Auth#1 5.000% 11/01/32 | | 250,000 | | | 272,457 |
| | | | | | 3,432,227 |
Housing (1.6%) | | | | | |
Lancaster Hsp #1-Imma 5.500% 01/01/30 | | 250,000 | | | 269,200 |
Sarpy Hsp #1-Immanuel 5.500% 01/01/30 | | 500,000 | | | 538,400 |
| | | | | | 807,600 |
Other Revenue (6.0%) | | | | | |
Lincoln Etc Jt Pub 5.000% 12/15/42 | | 750,000 | | | 844,147 |
NE Coop-A 5.125% 12/15/33 | | 250,000 | | | 262,118 |
NE Coop-A 5.000% 12/15/38 | | 160,000 | | | 167,507 |
NE Coop-Ref 4.000% 12/15/26 | | 250,000 | | | 266,668 |
Omaha Pub Facs Corp 4.000% 11/15/31 | | 115,000 | | | 117,701 |
*Omaha Spec Tax-Ref 5.000% 02/01/27 | | 1,000,000 | | | 1,137,480 |
Upper Republican Nat 4.000% 12/15/24 | | 200,000 | | | 207,470 |
| | | | | | 3,003,091 |
Transportation (2.3%) | | | | | |
Lincoln Pkg Rev-Ref 5.500% 08/15/31 | | 500,000 | | | 560,900 |
Omaha Airport Auth-A 5.000% 12/15/27 | | 500,000 | | | 601,130 |
| | | | | | 1,162,030 |
Utilities (32.7%) | | | | | |
*Central Plains Energy 5.000% 09/01/27 | | 2,000,000 | | | 2,225,000 |
Central Plains Energy 5.250% 09/01/37 | | 500,000 | | | 545,475 |
Central Plains Energy 5.000% 09/01/42 | | 500,000 | | | 539,180 |
Columbus Rev-Ref 4.000% 12/15/32 | | 100,000 | | | 108,008 |
Grand Island Swr 5.000% 09/15/26 | | 250,000 | | | 292,263 |
Hastings Util Rev-Ref 4.000% 10/15/32 | | 500,000 | | | 533,045 |
*Lincoln Elec Sys-Ref 5.000% 09/01/37 | | 1,000,000 | | | 1,125,150 |
Lincoln San Swr 4.500% 06/15/29 | | 250,000 | | | 250,303 |
Lincoln Sol Wst-Ref 4.000% 08/01/25 | | 275,000 | | | 311,597 |
Lincoln Sol Wst-Ref 4.000% 08/01/27 | | 400,000 | | | 445,732 |
Lincoln Wtrwks 4.000% 08/15/25 | | 250,000 | | | 263,710 |
Lincoln Wtrwks 4.500% 08/15/34 | | 250,000 | | | 261,293 |
Met Utils Dist 4.000% 12/15/24 | | 750,000 | | | 831,150 |
Met Utils Dist 4.000% 12/15/26 | | 250,000 | | | 275,798 |
Mun Energy-Ref-A 5.125% 04/01/24 | | 195,000 | | | 208,595 |
NE Muni Energy Agy-A 5.000% 04/01/30 | | 500,000 | | | 558,220 |
NE Muni Energy Agy-A 5.000% 04/01/32 | | 100,000 | | | 111,472 |
Nebraska Public Pwr 5.000% 01/01/41 | | 250,000 | | | 284,780 |
*NE Pub Pwr Dist-C 5.000% 01/01/36 | | 2,355,000 | | | 2,693,083 |
NE Pub Pwr Dist-A 5.000% 01/01/28 | | 250,000 | | | 284,563 |
NE Pub Pwr Dt-A-Ref 5.000% 01/01/30 | | 500,000 | | | 565,410 |
Omaha Pub Pwr Sys-A 5.250% 02/01/23 | | 250,000 | | | 255,540 |
Omaha Pub Pwr Sys-A 5.500% 02/01/33 | | 100,000 | | | 102,341 |
Omaha Sans Swr 5.000% 11/15/29 | | 250,000 | | | 295,303 |
Omaha Sans Swr 5.000% 11/15/30 | | 250,000 | | | 293,577 |
Omaha Sans Swr 5.000% 11/15/31 | | 500,000 | | | 584,600 |
Omaha Sanit Swr-Ref 4.000% 04/01/35 | | 250,000 | | | 266,780 |
Omaha Pub Pwr-A-Ref 5.000% 02/01/32 | | 250,000 | | | 288,707 |
Omaha Pub Pwr Dist-A 5.000% 02/01/31 | | 445,000 | | | 521,344 |
Omaha Pub Pwr Dist-A 4.000% 02/01/32 | | 400,000 | | | 428,104 |
Omaha Pub Pwr Dist-A 4.000% 02/01/35 | | 365,000 | | | 387,976 |
Sthrn NE Pub Pwr 5.000% 12/15/23 | | 250,000 | | | 264,675 |
| | | | | | 16,402,774 |
| | | | | |
TOTAL MUNICIPAL BONDS (COST: $46,519,919) | | | | $ | 48,374,866 |
| | | | | |
OTHER ASSETS LESS LIABILITIES (3.4%) | | | | | 1,719,807 |
| | | | | |
NET ASSETS (100.0%) | | | | $ | 50,094,673 |
| | | | | |
*Indicates all or a portion of bonds are segregated by the custodian to cover when-issued or delayed-delivery purchases. |
|
|
The accompanying notes are an integral part of these financial statements. |
OKLAHOMA MUNICIPAL FUND
PORTFOLIO MARKET SECTORS July 31, 2017
Utilities | 36.9% |
Other Revenue | 23.6% |
Education | 19.0% |
Transportation | 7.5% |
Other Assets Less Liabilities | 6.1% |
General Obligation | 3.7% |
Health Care | 3.2% |
Housing | 0.0% |
| 100.0% |
Market sectors are breakdowns of the Fund’s portfolio holdings into specific investment classes.
These percentages are based on net assets and are subject to change.
SCHEDULE OF INVESTMENTS July 31, 2017
| | | Principal | | | Fair |
| | | Amount | | | Value |
MUNICIPAL BONDS (93.9%) | | | | | |
| | | | | |
Education (19.0%) | | | | | |
Okarche Eco Dev Auth 5.000% 09/01/23 | $ | 250,000 | | $ | 288,460 |
OK Agric-Gen Rev 5.000% 07/01/39 | | 140,000 | | | 150,623 |
OK A&M Clgs-C 4.400% 08/01/39 | | 740,000 | | | 782,594 |
*Oklahoma City Clg 4.375% 07/01/30 | | 750,000 | | | 789,465 |
OK Dev-B-Master OK Hg 4.400% 12/01/29 | | 250,000 | | | 262,960 |
OK Dev Fin Auth-E 5.000% 06/01/39 | | 500,000 | | | 564,425 |
OK Dev Fin Auth-G 5.000% 06/01/29 | | 250,000 | | | 293,280 |
OK Dev Fin Auth-G 5.000% 06/01/34 | | 500,000 | | | 575,285 |
OK Dev Fin Auth-G 5.000% 06/01/39 | | 500,000 | | | 565,415 |
OK Dev Fin Auth-Ref 4.000% 08/01/30 | | 280,000 | | | 301,591 |
OK Dev Fin Auth-Ref 4.000% 08/01/31 | | 290,000 | | | 311,216 |
OK Dev Fin Auth-Ref 4.000% 08/01/32 | | 305,000 | | | 325,914 |
OK Dev Fin Auth-Ref 4.000% 08/01/33 | | 315,000 | | | 335,368 |
Univ OK Revs-A 5.000% 07/01/36 | | 1,000,000 | | | 1,036,960 |
Univ OK-A 5.000% 07/01/37 | | 290,000 | | | 326,363 |
Univ OK-A 5.000% 07/01/41 | | 250,000 | | | 276,440 |
Univ OK-C-Gen 5.000% 07/01/36 | | 500,000 | | | 568,950 |
Univ OK-C-Gen 4.000% 07/01/40 | | 650,000 | | | 684,314 |
Univ OK-C-Gen 5.000% 07/01/38 | | 500,000 | | | 567,410 |
| | | | | | 9,007,033 |
General Obligation (3.7%) | | | | | |
Broken Arrow-A 4.125% 08/01/31 | | 180,000 | | | 192,128 |
OK City 5.000% 03/01/27 | | 400,000 | | | 409,636 |
*Oklahoma City 4.000% 03/01/24 | | 1,000,000 | | | 1,140,100 |
| | | | | | 1,741,864 |
Health Care (3.2%) | | | | | |
Oklahoma Dev Fin Auth 5.000% 08/15/25 | | 350,000 | | | 429,751 |
Oklahoma Dev Fin Auth 5.000% 08/15/29 | | 250,000 | | | 294,388 |
Oklahoma Dev Fin Auth 4.000% 08/15/38 | | 250,000 | | | 259,743 |
OK Dev Fin-St Johns 5.000% 02/15/42 | | 250,000 | | | 269,078 |
Tulsa Hlth Facs Rev 4.600% 02/01/35 | | 250,000 | | | 261,378 |
| | | | | | 1,514,338 |
Housing (0.0%) | | | | | |
OK Hsg-Sfm-Amt-A 5.100% 09/01/17 | | 10,000 | | | 10,008 |
| | | | | |
Other Revenue (23.6%) | | | | | |
Collinsville S/Tax 5.000% 03/01/35 | | 275,000 | | | 305,349 |
Collinsville S/Tax 5.000% 03/01/40 | | 250,000 | | | 277,590 |
Oklahoma City Econ-B 5.000% 03/01/32 | | 250,000 | | | 269,305 |
Oklahoma City Econ-B 5.000% 03/01/34 | | 500,000 | | | 541,270 |
Oklahoma City Econ-B 5.000% 03/01/33 | | 250,000 | | | 268,820 |
OK City Ppty-Ser A 4.500% 10/01/31 | | 155,000 | | | 155,525 |
Oklahoma Ppty Auth 5.000% 10/01/27 | | 350,000 | | | 414,771 |
Oklahoma Ppty Auth 5.000% 10/01/28 | | 400,000 | | | 469,988 |
Oklahoma Ppty Auth 5.000% 10/01/29 | | 625,000 | | | 727,450 |
Oklahoma Ppty Auth 5.000% 10/01/36 | | 230,000 | | | 259,829 |
Oklahoma Ppty Auth 5.000% 10/01/39 | | 835,000 | | | 938,181 |
Oklahoma St Wtr Res B 5.000% 10/01/29 | | 250,000 | | | 296,258 |
Oklahoma St Wtr Res B 5.000% 10/01/33 | | 500,000 | | | 582,305 |
OK Wtr Res Brd-A 5.000% 10/01/29 | | 250,000 | | | 303,530 |
Okmulgee Govt-Ref 4.250% 12/01/35 | | 500,000 | | | 526,925 |
Paunee S/Tax 4.875% 02/01/30 | | 145,000 | | | 158,894 |
*Rogers Indl Dev Auth 4.900% 04/01/35 | | 500,000 | | | 550,480 |
Sand Springs Mun Auth 4.250% 01/01/35 | | 250,000 | | | 275,650 |
Sand Springs Mun Auth 4.000% 01/01/36 | | 500,000 | | | 526,795 |
Tahlequah Pub Fac-A 4.000% 04/01/23 | | 550,000 | | | 608,526 |
Tulsa Indl Auth-Sub 3.000% 09/01/27 | | 245,000 | | | 250,091 |
Tulsa Co Pub Facs 3.000% 11/01/22 | | 500,000 | | | 535,095 |
Tulsa Arpts-C-Amt-Rf 5.000% 06/01/23 | | 420,000 | | | 469,106 |
Tulsa Arpts-C-Amt-Rf 5.000% 06/01/24 | | 230,000 | | | 255,148 |
Tulsa Arpts-C-Amt-Rf 5.250% 06/01/25 | | 245,000 | | | 272,440 |
Tulsa Arpts-C-Amt-Rf 5.250% 06/01/26 | | 360,000 | | | 398,689 |
Tulsa Pkg Auth-Ref 4.000% 07/01/25 | | 500,000 | | | 537,965 |
| | | | | | 11,175,975 |
Transportation (7.5%) | | | | | |
OK City Arpt Ref-B 5.000% 07/01/19 | | 250,000 | | | 250,680 |
OK City Arpt Ref-B 5.000% 07/01/21 | | 250,000 | | | 250,678 |
OK Cap Impt 4.000% 10/01/24 | | 800,000 | | | 882,504 |
OK Cap Impt 4.000% 10/01/25 | | 1,000,000 | | | 1,096,050 |
OK St Turnpike-A-Ref 5.000% 01/01/28 | | 250,000 | | | 276,878 |
OK Turnpike Auth-B 4.000% 01/01/31 | | 500,000 | | | 527,780 |
OK Turnpike Auth-B 5.000% 01/01/30 | | 250,000 | | | 276,410 |
| | | | | | 3,560,980 |
Utilities (36.9%) | | | | | |
Clinton Pub Wks Auth 4.000% 12/01/34 | | 750,000 | | | 794,452 |
Clinton Pub Wks Auth 4.000% 12/01/39 | | 500,000 | | | 524,050 |
Coweta Pub Wrks-A 5.000% 08/01/34 | | 100,000 | | | 107,528 |
Coweta OK Public Wks 4.000% 08/01/32 | | 1,000,000 | | | 1,056,510 |
Glenpool Util-Rf-A 5.100% 12/01/35 | | 250,000 | | | 274,947 |
Grand Rvr Dam Ser A 5.000% 06/01/27 | | 1,000,000 | | | 1,034,380 |
Grand Rvr Dam Ser A 4.800% 06/01/33 | | 200,000 | | | 206,544 |
*Grand Rvr Dam Auth-A 5.250% 06/01/40 | | 2,000,000 | | | 2,192,820 |
Grand Rvr Dam Auth-A 5.000% 06/01/33 | | 500,000 | | | 574,660 |
Miami Spl Util-Ref 4.000% 12/01/36 | | 500,000 | | | 529,685 |
*Midwest Muni Auth-A 5.000% 03/01/25 | | 2,000,000 | | | 2,236,940 |
Oklahoma City Wtr-A 4.000% 07/01/34 | | 250,000 | | | 264,828 |
OK City Wtr/Swr-Ref 5.000% 07/01/31 | | 250,000 | | | 280,075 |
OK City Wtr Util-Ref 5.000% 07/01/29 | | 1,000,000 | | | 1,183,020 |
OK Wtr Utl Trust-Ref 5.000% 07/01/34 | | 100,000 | | | 116,712 |
OK Wtr Utl Trust-Ref 4.000% 07/01/39 | | 175,000 | | | 185,745 |
Oklahoma City Wtr 5.000% 07/01/34 | | 250,000 | | | 295,812 |
*OK Mun Pwr Ser B 5.750% 01/01/24 | | 1,550,000 | | | 1,714,687 |
OK Muni Pwr Auth-A 5.000% 01/01/38 | | 575,000 | | | 651,831 |
Oklahoma Wtr Res Bd 5.000% 04/01/28 | | 500,000 | | | 534,260 |
OK Wtr Resource Brd-A 5.000% 04/01/32 | | 140,000 | | | 158,441 |
Oklahoma Wtr Res Bd-B 4.000% 04/01/25 | | 150,000 | | | 166,072 |
Sallisaw Util-Ref 4.450% 01/01/28 | | 100,000 | | | 105,182 |
Sapulpa Muni Auth-Ref 5.000% 04/01/28 | | 750,000 | | | 852,420 |
Seminole Util-A-Ref 3.000% 09/01/24 | | 100,000 | | | 104,025 |
Seminole Util-A-Ref 3.150% 09/01/25 | | 380,000 | | | 391,818 |
Seminole Util-A-Ref 3.300% 09/01/26 | | 315,000 | | | 328,507 |
Tulsa OK Met Utility 5.000% 10/01/25 | | 500,000 | | | 625,430 |
| | | | | | 17,491,381 |
| | | | | |
TOTAL MUNICIPAL BONDS (COST: $42,719,397) | | | | $ | 44,501,579 |
| | | | | |
OTHER ASSETS LESS LIABILITIES (6.1%) | | | | | 2,872,456 |
| | | | | |
NET ASSETS (100.0%) | | | | $ | 47,374,035 |
| | | | | |
*Indicates all or a portion of bonds are segregated by the custodian to cover when-issued or delayed-delivery purchases. |
|
|
The accompanying notes are an integral part of these financial statements. |
MAINE MUNICIPAL FUND
PORTFOLIO MARKET SECTORS July 31, 2017
General Obligation | 26.8% |
Health Care | 23.0% |
Education | 22.1% |
Transportation | 11.2% |
Other Revenue | 5.8% |
Utilities | 5.1% |
Housing | 3.3% |
Other Assets Less Liabilities | 2.7% |
| 100.0% |
Market sectors are breakdowns of the Fund’s portfolio holdings into specific investment classes.
These percentages are based on net assets.
SCHEDULE OF INVESTMENTS July 31, 2017
| | | Principal | | | Fair |
| | | Amount | | | Value |
MUNICIPAL BONDS (97.3%) | | | | | |
| | | | | |
Education (22.1%) | | | | | |
ME Edl Std Ln-Cl A-A3 5.875% 12/01/39 | $ | 120,000 | | $ | 126,972 |
ME Edl-Suppl Ed-A-A1 4.450% 12/01/25 | | 100,000 | | | 107,145 |
*ME Hlth/Hgr Ed-Ser A 5.125% 07/01/39 | | 715,000 | | | 757,099 |
ME Hlth & Hgr Ed-A 5.000% 07/01/39 | | 500,000 | | | 572,835 |
ME Hlth & Hgr Ed-A 5.000% 07/01/34 | | 250,000 | | | 287,140 |
ME Hlth/Ed-Unref-B 5.000% 07/01/37 | | 185,000 | | | 187,172 |
ME Hlth & Hgr-C 4.750% 07/01/31 | | 250,000 | | | 269,555 |
ME Hlth & Hgr Ed 4.000% 07/01/24 | | 270,000 | | | 301,269 |
ME Hlth & Hgr-A 5.000% 07/01/26 | | 940,000 | | | 1,135,360 |
Regl Sch Unit #1 5.000% 02/01/26 | | 100,000 | | | 112,381 |
Univ Of ME Sys-Ref 5.000% 03/01/19 | | 500,000 | | | 530,970 |
| | | | | | 4,387,898 |
General Obligation (26.8%) | | | | | |
Auburn-A 4.500% 09/01/22 | | 100,000 | | | 115,032 |
Bangor-Ser A 4.000% 09/01/24 | | 155,000 | | | 159,852 |
Biddeford 4.000% 10/01/26 | | 250,000 | | | 291,105 |
Gorham 4.000% 10/01/23 | | 100,000 | | | 109,935 |
Gray 4.000% 10/15/26 | | 280,000 | | | 298,220 |
Gray 4.000% 10/15/27 | | 280,000 | | | 298,220 |
Maine St-B 4.000% 06/01/20 | | 150,000 | | | 164,787 |
Maine St-B 5.000% 06/01/25 | | 500,000 | | | 621,745 |
Maine St-B 5.000% 06/01/26 | | 250,000 | | | 313,580 |
ME Hsg-Ser 1 5.000% 06/15/24 | | 250,000 | | | 273,138 |
Portland-A 4.250% 05/01/29 | | 150,000 | | | 156,769 |
Portland-Ser B 4.125% 10/01/29 | | 100,000 | | | 104,644 |
Portland-Ref 5.000% 08/01/21 | | 125,000 | | | 145,196 |
Portland-Ref 5.000% 08/01/22 | | 125,000 | | | 145,196 |
Portland 5.000% 04/01/28 | | 250,000 | | | 313,942 |
Saco 4.000% 04/01/28 | | 100,000 | | | 105,575 |
Scarborough-Ref 4.000% 11/01/28 | | 100,000 | | | 109,549 |
ME Sch Admin Dist #15 4.000% 11/01/26 | | 145,000 | | | 170,072 |
ME Sch Admin Dist #15 4.000% 11/01/27 | | 145,000 | | | 170,534 |
Sch Admin #51 4.250% 10/15/29 | | 250,000 | | | 267,570 |
Maine Sd #51 4.000% 10/15/29 | | 100,000 | | | 112,650 |
Waterville-A 4.000% 07/01/25 | | 135,000 | | | 148,030 |
Wells-Ogunquit Sd 4.000% 11/01/24 | | 100,000 | | | 117,596 |
Westbrook 5.000% 10/15/26 | | 490,000 | | | 600,255 |
| | | | | | 5,313,192 |
Health Care (23.0%) | | | | | |
ME Hlth & Hgr-A-Prerf 5.000% 07/01/20 | | 50,000 | | | 55,699 |
ME Hlth & Hgr-A-Unref 5.000% 07/01/20 | | 130,000 | | | 144,161 |
ME Hlth & Hgr-B-Prerf 4.500% 07/01/31 | | 10,000 | | | 10,997 |
ME Hlth & Hgr-B-Prerf 5.250% 07/01/23 | | 10,000 | | | 11,215 |
ME Hlth & Hgr-B-Unref 4.500% 07/01/31 | | 190,000 | | | 198,362 |
ME Hlth & Hgr-B-Unref 5.250% 07/01/23 | | 190,000 | | | 210,852 |
*Maine Hlth & Hgr Ed 5.000% 07/01/39 | | 610,000 | | | 641,891 |
Maine Hlth & Hgr Ed 5.000% 07/01/26 | | 115,000 | | | 122,807 |
ME H/E Auth 5.000% 07/01/20 | | 250,000 | | | 276,547 |
ME H/E Auth 5.000% 07/01/40 | | 250,000 | | | 269,385 |
*ME Hlth & Hgr Ed 5.000% 07/01/29 | | 1,000,000 | | | 1,127,930 |
ME Hlth & Hgr Ed 5.000% 07/01/30 | | 500,000 | | | 567,955 |
ME Hlth & Hgr Ed 5.000% 07/01/31 | | 500,000 | | | 559,235 |
ME Hlth & Hgr-A-Prerf 5.000% 07/01/23 | | 15,000 | | | 18,085 |
ME Hlth & Hgr-A-Unref 5.000% 07/01/23 | | 235,000 | | | 281,011 |
ME Hlth &Hgr Ed-Unref 5.000% 07/01/22 | | 55,000 | | | 55,167 |
| | | | | | 4,551,299 |
Housing (3.3%) | | | | | |
Maine St Hsg Auth Mtg 4.000% 11/15/35 | | 435,000 | | | 445,923 |
ME Hsg Auth-E-1-Ref 4.000% 11/15/30 | | 205,000 | | | 210,432 |
| | | | | | 656,355 |
Other Revenue (5.8%) | | | | | |
ME Govtl Facs Auth-A 4.000% 10/01/24 | | 200,000 | | | 216,992 |
ME Mun Bd Bk-A 4.000% 11/01/38 | | 125,000 | | | 130,994 |
ME Mun Bd Bk-B-Ref 5.000% 11/01/25 | | 125,000 | | | 146,039 |
ME Muni Bond Bk-C 5.000% 11/01/27 | | 100,000 | | | 120,503 |
ME Bd Bk-C-Unref 4.900% 11/01/24 | | 5,000 | | | 5,012 |
*PR Fin Comwlth-Ser A 5.375% 06/01/18 | | 515,000 | | | 532,330 |
| | | | | | 1,151,870 |
Transportation (11.2%) | | | | | |
*Maine Mun Bd Bk 5.000% 09/01/24 | | 1,000,000 | | | 1,082,090 |
ME Muni Bond Bk-A-Ref 5.000% 09/01/24 | | 210,000 | | | 256,131 |
ME Tpk Auth-Spl Obl 4.000% 07/01/32 | | 250,000 | | | 262,405 |
Portland Arpt-Gen 5.250% 01/01/35 | | 250,000 | | | 263,835 |
Portland Arpt Rev-Ref 5.000% 07/01/22 | | 100,000 | | | 115,700 |
Portland Arpt Rev-Ref 5.000% 07/01/23 | | 100,000 | | | 117,307 |
Portland Arpt Rev-Ref 5.000% 07/01/24 | | 100,000 | | | 116,142 |
| | | | | | 2,213,610 |
Utilities (5.1%) | | | | | |
*Kennebunk Lt/Pwr Dist 5.000% 08/01/22 | | 500,000 | | | 500,000 |
Portland Wtr 4.250% 11/01/27 | | 500,000 | | | 504,230 |
| | | | | | 1,004,230 |
| | | | | | |
TOTAL MUNICIPAL BONDS (COST: $18,538,830) | | | | $ | 19,278,454 |
| | | | | |
OTHER ASSETS LESS LIABILITIES (2.7%) | | | | | 533,005 |
| | | | | |
NET ASSETS (100.0%) | | | | $ | 19,811,459 |
| | | | | |
*Indicates all or a portion of bonds are segregated by the custodian to cover when-issued or delayed-delivery purchases. |
|
|
The accompanying notes are an integral part of these financial statements. |
NEW HAMPSHIRE MUNICIPAL FUND
PORTFOLIO MARKET SECTORS July 31, 2017
General Obligation | 51.2% |
Health Care | 17.0% |
Education | 13.8% |
Housing | 6.1% |
Other Assets Less Liabilities | 4.7% |
Utilities | 3.8% |
Transportation | 3.4% |
| 100.0% |
Market sectors are breakdowns of the Fund’s portfolio holdings into specific investment classes.
These percentages are based on net assets.
SCHEDULE OF INVESTMENTS July 31, 2017
| | | Principal | | | Fair |
| | | Amount | | | Value |
MUNICIPAL BONDS (95.3%) | | | | | |
| | | | | |
Education (13.8%) | | | | | |
New Hampshire Hlth 5.000% 07/01/27 | $ | 120,000 | | $ | 143,634 |
New Hampshire St Hlth 5.000% 07/01/28 | | 175,000 | | | 210,850 |
NH H/E-C-Pinkerton Ac 4.625% 06/01/30 | | 175,000 | | | 181,431 |
NH H/E-C-Pinkerton Ac 4.875% 06/01/35 | | 70,000 | | | 73,194 |
NH Hlth & Edu 5.000% 01/01/20 | | 100,000 | | | 109,303 |
NH Hlth Univ Sys 5.250% 06/01/39 | | 100,000 | | | 107,785 |
| | | | | | 826,197 |
General Obligation (51.2%) | | | | | |
Concord-Cap Impt 4.000% 01/15/28 | | 225,000 | | | 262,967 |
Concord-Cap Impt 4.000% 01/15/30 | | 175,000 | | | 197,433 |
Concord Sd 5.000% 03/01/26 | | 250,000 | | | 309,908 |
*Concord Sd 5.000% 03/01/27 | | 250,000 | | | 317,658 |
Dover-Ref 5.000% 06/15/25 | | 75,000 | | | 93,491 |
Dover 4.000% 06/15/28 | | 100,000 | | | 108,253 |
*Grafton Co-Ref 5.000% 07/01/28 | | 250,000 | | | 309,128 |
Hillsborough 4.000% 11/01/20 | | 100,000 | | | 100,183 |
Hillsborough 4.000% 11/01/21 | | 100,000 | | | 100,212 |
Keene-B-Ref 4.000% 07/01/27 | | 75,000 | | | 86,693 |
Merrimack Cnty 4.250% 12/01/19 | | 100,000 | | | 101,142 |
Merrimack Cnty 4.500% 12/01/27 | | 100,000 | | | 101,218 |
Merrimack Cnty NH 5.000% 11/15/26 | | 70,000 | | | 85,644 |
*NH Mun Bd Bk-D 4.000% 07/15/25 | | 175,000 | �� | | 185,154 |
New Hampshire St 5.000% 12/01/28 | | 75,000 | | | 90,918 |
NH St-Ser B 4.750% 03/01/27 | | 100,000 | | | 102,317 |
Portsmouth-Cap Impt 4.000% 12/01/30 | | 100,000 | | | 106,530 |
Salem NH Sch Dist 5.000% 11/15/24 | | 100,000 | | | 123,437 |
*Salem Sd 4.000% 12/01/27 | | 250,000 | | | 282,183 |
| | | | | | 3,064,469 |
Health Care (17.0%) | | | | | |
NH Hlth & Edu-Preref 5.250% 10/01/23 | | 80,000 | | | 80,583 |
NH Hlth & Edu-Unref 5.250% 10/01/23 | | 20,000 | | | 20,150 |
NH H/E-A-Wentworth Do 5.500% 01/01/26 | | 100,000 | | | 111,442 |
NH H/E-Covenant-B 5.000% 07/01/24 | | 100,000 | | | 103,140 |
*NH H/E-Covenant-B 5.000% 07/01/31 | | 150,000 | | | 153,383 |
NH St Hlth & Edu Facs 5.000% 07/01/24 | | 100,000 | | | 112,315 |
*NH St Ed Facs Auth-A 5.000% 10/01/26 | | 100,000 | | | 113,251 |
NH Hlth & Ed 5.000% 07/01/42 | | 50,000 | | | 53,108 |
New Hampshire Hlth 5.000% 06/01/20 | | 125,000 | | | 133,515 |
New Hampshire Hlth 5.250% 06/01/26 | | 125,000 | | | 138,746 |
| | | | | | 1,019,633 |
Housing (6.1%) | | | | | |
NH Sfm-Amt-A-Aquis 5.350% 07/01/40 | | 55,000 | | | 55,342 |
NH Hsg-Sfm-B-Non Amt 4.625% 07/01/25 | | 135,000 | | | 138,799 |
NH Hsg Fin-Sfm-C 4.875% 07/01/28 | | 60,000 | | | 63,102 |
NH Hsg Fin-Non Amt-A 5.200% 07/01/31 | | 100,000 | | | 107,117 |
| | | | | | 364,360 |
Transportation (3.4%) | | | | | |
Manchester Arpt-A 5.000% 01/01/23 | | 75,000 | | | 85,445 |
NH St Tpk Sys-Ser C 5.000% 08/01/25 | | 100,000 | | | 116,797 |
| | | | | | 202,242 |
Utilities (3.8%) | | | | | |
NH Bus Fin Auth-Amt-A 5.000% 01/01/29 | | 100,000 | | | 113,621 |
NH Bus Fin Auth-Amt-A 5.000% 01/01/30 | | 100,000 | | | 113,295 |
| | | | | | 226,916 |
| | | | | |
TOTAL MUNICIPAL BONDS (COST: $5,522,819) | | | | $ | 5,703,817 |
| | | | | |
OTHER ASSETS LESS LIABILITIES (4.7%) | | | | | 283,071 |
| | | | | |
NET ASSETS (100.0%) | | | | $ | 5,986,888 |
| | | | | |
*Indicates all or a portion of bonds are segregated by the custodian to cover when-issued or delayed delivery purchases. |
|
|
The accompanying notes are an integral part of these financial statements. |
Statements of Assets and Liabilities July 31, 2017
| | | | | | | | | | | New |
| | | Kansas | | Nebraska | | Oklahoma | | Maine | | Hampshire |
| | | Municipal | | Municipal | | Municipal | | Municipal | | Municipal |
| | | Fund | | Fund | | Fund | | Fund | | Fund |
ASSETS | | | | | | | | | | | | | | | |
Investments in securities, at cost | | $ | 56,946,992 | | $ | 46,519,919 | | $ | 42,719,397 | | $ | 18,538,830 | | $ | 5,522,819 |
| | | | | | | | | | | | | | | |
Investments in securities, at fair value | | $ | 59,654,427 | | $ | 48,374,866 | | $ | 44,501,579 | | $ | 19,278,454 | | $ | 5,703,817 |
Cash | | | 1,265,855 | | | 1,233,098 | | | 2,521,169 | | | 413,495 | | | 274,090 |
Receivable for Fund shares sold | | | 11,209 | | | 39,263 | | | 1,992 | | | 0 | | | 0 |
Accrued interest receivable | | | 928,862 | | | 497,670 | | | 475,683 | | | 161,917 | | | 40,325 |
Prepaid expenses | | | 2,422 | | | 5,523 | | | 2,003 | | | 2,116 | | | 865 |
Total assets | | $ | 61,862,775 | | $ | 50,150,420 | | $ | 47,502,426 | | $ | 19,855,982 | | $ | 6,019,097 |
| | | | | | | | | | | | | | | |
LIABILITIES | | | | | | | | | | | | | | | |
Payable for Fund shares redeemed | | $ | 20,645 | | $ | 5,358 | | $ | 77,019 | | $ | 27,642 | | $ | 23,835 |
Dividends payable | | | 41,790 | | | 30,164 | | | 32,774 | | | 6,490 | | | 3,324 |
Trustees' fees payable | | | 2,486 | | | 2,065 | | | 1,904 | | | 819 | | | 265 |
Payable to affiliates | | | 1,392 | | | 1,090 | | | 384 | | | 882 | | | 311 |
Accrued expenses | | | 21,180 | | | 17,070 | | | 16,310 | | | 8,690 | | | 4,474 |
Total liabilities | | $ | 87,493 | | $ | 55,747 | | $ | 128,391 | | $ | 44,523 | | $ | 32,209 |
| | | | | | | | | | | | | | | |
NET ASSETS | | $ | 61,775,282 | | $ | 50,094,673 | | $ | 47,374,035 | | $ | 19,811,459 | | $ | 5,986,888 |
| | | | | | | | | | | | | | | |
NET ASSETS ARE REPRESENTED BY: | | | | | | | | | | | | | | | |
Capital stock outstanding, no par value, unlimited shares authorized | | $ | 59,537,765 | | $ | 48,992,090 | | $ | 46,036,706 | | $ | 19,445,780 | | $ | 6,067,228 |
Accumulated net realized gain (loss) on investments | | | (477,240) | | | (753,473) | | | (444,800) | | | (390,463) | | | (264,759) |
Accumulated undistributed net investment income (loss) | | | 7,322 | | | 1,109 | | | (53) | | | 16,518 | | | 3,421 |
Unrealized appreciation (depreciation) on investments | | | 2,707,435 | | | 1,854,947 | | | 1,782,182 | | | 739,624 | | | 180,998 |
| | | | | | | | | | | | | | | |
NET ASSETS | | $ | 61,775,282 | | $ | 50,094,673 | | $ | 47,374,035 | | $ | 19,811,459 | | $ | 5,986,888 |
| | | | | | | | | | | | | | | |
Shares outstanding | | | 5,728,015 | | | 4,790,576 | | | 4,036,368 | | | 1,820,116 | | | 567,228 |
Net asset value per share* | | $ | 10.78 | | $ | 10.46 | | $ | 11.74 | | $ | 10.88 | | $ | 10.55 |
Public offering price (sales charge of 2.50%) | | $ | 11.06 | | $ | 10.73 | | $ | 12.04 | | $ | 11.16 | | $ | 10.82 |
| | | | | | | | | | | | | | | |
* Redemption price per share is equal to net asset value less any applicable contingent deferred sales charge. |
|
|
The accompanying notes are an integral part of these financial statements. |
Statements of Operations For the year ended July 31, 2017
| | | | | | | | | | | New |
| | | Kansas | | Nebraska | | Oklahoma | | Maine | | Hampshire |
| | | Municipal | | Municipal | | Municipal | | Municipal | | Municipal |
| | | Fund | | Fund | | Fund | | Fund | | Fund |
INVESTMENT INCOME | | | | | | | | | | | | | | | |
Interest | | $ | 2,277,921 | | $ | 1,653,969 | | $ | 1,531,636 | | $ | 666,044 | | $ | 198,485 |
Total investment income | | $ | 2,277,921 | | $ | 1,653,969 | | $ | 1,531,636 | | $ | 666,044 | | $ | 198,485 |
| | | | | | | | | | | | | | | |
EXPENSES | | | | | | | | | | | | | | | |
Investment advisory fees | | $ | 304,169 | | $ | 248,224 | | $ | 233,658 | | $ | 101,124 | | $ | 32,895 |
Distribution (12b-1) fees | | | 152,085 | | | 124,112 | | | 116,829 | | | 50,562 | | | 16,448 |
Transfer agent fees | | | 76,064 | | | 61,939 | | | 58,443 | | | 25,308 | | | 8,237 |
Administrative service fees | | | 109,294 | | | 93,630 | | | 89,551 | | | 52,442 | | | 33,338 |
Professional fees | | | 13,951 | | | 11,726 | | | 11,284 | | | 6,352 | | | 3,705 |
Reports to shareholders | | | 3,397 | | | 2,455 | | | 1,980 | | | 1,174 | | | 358 |
License, fees, and registrations | | | 3,807 | | | 13,074 | | | 4,783 | | | 2,707 | | | 1,248 |
Audit fees | | | 13,009 | | | 10,832 | | | 10,071 | | | 4,372 | | | 1,571 |
Trustees’ fees | | | 5,001 | | | 4,045 | | | 3,854 | | | 1,669 | | | 544 |
Transfer agent out-of-pockets | | | 4,639 | | | 3,797 | | | 2,774 | | | 1,984 | | | 649 |
Custodian fees | | | 6,002 | | | 4,784 | | | 4,682 | | | 2,185 | | | 1,094 |
Legal fees | | | 6,061 | | | 4,940 | | | 4,699 | | | 1,965 | | | 673 |
Insurance expense | | | 1,841 | | | 1,387 | | | 1,380 | | | 593 | | | 173 |
Total expenses | | $ | 699,320 | | $ | 584,945 | | $ | 543,988 | | $ | 252,437 | | $ | 100,933 |
Less expenses waived or reimbursed
(See Note 7) | | | (103,150) | | | (98,428) | | | (86,019) | | | (54,234) | | | (36,459) |
Total net expenses | | $ | 596,170 | | $ | 486,517 | | $ | 457,969 | | $ | 198,203 | | $ | 64,474 |
| | | | | | | | | | | | | | | |
NET INVESTMENT INCOME (LOSS) | | $ | 1,681,751 | | $ | 1,167,452 | | $ | 1,073,667 | | $ | 467,841 | | $ | 134,011 |
| | | | | | | | | | | | | | | |
REALIZED AND UNREALIZED GAIN (LOSS) ON INVESTMENTS | | | | | | | | | | | | | | | |
Net realized gain (loss) from investment transactions | | $ | (253,811) | | $ | (492,161) | | $ | (87,991) | | $ | (390,463) | | $ | (249,029) |
Net change in unrealized appreciation (depreciation) on investments | | | (1,626,406) | | | (1,124,529) | | | (1,368,876) | | | (401,692) | | | (72,824) |
Net realized and unrealized gain (loss) on investments | | $ | (1,880,217) | | $ | (1,616,690) | | $ | (1,456,867) | | $ | (792,155) | | $ | (321,853) |
| | | | | | | | | | | | | | | |
NET INCREASE (DECREASE) IN NET ASSETS RESULTING FROM OPERATIONS | | $ | (198,466) | | $ | (449,238) | | $ | (383,200) | | $ | (324,314) | | $ | (187,842) |
| | | | | | | | | | | | | | | |
|
The accompanying notes are an integral part of these financial statements. |
Statements of Changes in Net Assets For the year ended July 31, 2017
| | | | | | | | | | | New |
| | | Kansas | | Nebraska | | Oklahoma | | Maine | | Hampshire |
| | | Municipal | | Municipal | | Municipal | | Municipal | | Municipal |
| | | Fund | | Fund | | Fund | | Fund | | Fund |
INCREASE (DECREASE) IN NET ASSETS FROM OPERATIONS | | | | | | | | | | | | | | | |
Net investment income (loss) | | $ | 1,681,751 | | $ | 1,167,452 | | $ | 1,073,667 | | $ | 467,841 | | $ | 134,011 |
Net realized gain (loss) from investment transactions | | | (253,811) | | | (492,161) | | | (87,991) | | | (390,463) | | | (249,029) |
Net change in unrealized appreciation (depreciation) on investments | | | (1,626,406) | | | (1,124,529) | | | (1,368,876) | | | (401,692) | | | (72,824) |
Net increase (decrease) in net assets resulting from operations | | $ | (198,466) | | $ | (449,238) | | $ | (383,200) | | $ | (324,314) | | $ | (187,842) |
| | | | | | | | | | | | | | | |
DISTRIBUTIONS TO SHAREHOLDERS FROM | | | | | | | | | | | | | | | |
Net investment income | | $ | (1,680,455) | | $ | (1,167,219) | | $ | (1,073,720) | | $ | (466,098) | | $ | (133,449) |
Total distributions | | $ | (1,680,455) | | $ | (1,167,219) | | $ | (1,073,720) | | $ | (466,098) | | $ | (133,449) |
| | | | | | | | | | | | | | | |
CAPITAL SHARE TRANSACTIONS | | | | | | | | | | | | | | | |
Proceeds from sale of shares | | $ | 6,369,077 | | $ | 9,282,002 | | $ | 9,051,600 | | $ | 3,536,640 | | $ | 694,646 |
Proceeds from reinvested dividends | | | 1,186,586 | | | 800,377 | | | 673,134 | | | 371,287 | | | 88,683 |
Cost of shares redeemed | | | (4,390,351) | | | (4,588,291) | | | (7,611,812) | | | (3,519,043) | | | (1,229,478) |
Net increase (decrease) in net assets resulting from capital share transactions | | $ | 3,165,312 | | $ | 5,494,088 | | $ | 2,112,922 | | $ | 388,884 | | $ | (446,149) |
| | | | | | | | | | | | | | | |
TOTAL INCREASE (DECREASE) IN NET ASSETS | | $ | 1,286,391 | | $ | 3,877,631 | | $ | 656,002 | | $ | (401,528) | | $ | (767,440) |
NET ASSETS, BEGINNING OF PERIOD | | $ | 60,488,891 | | $ | 46,217,042 | | $ | 46,718,033 | | $ | 20,212,987 | | $ | 6,754,328 |
NET ASSETS, END OF PERIOD | | $ | 61,775,282 | | $ | 50,094,673 | | $ | 47,374,035 | | $ | 19,811,459 | | $ | 5,986,888 |
| | | | | | | | | | | | | | | |
Accumulated undistributed net investment income (loss) | | $ | 7,322 | | $ | 1,109 | | $ | (53) | | $ | 16,517 | | $ | 3,421 |
| | | | | | | | | | | | | | | |
|
The accompanying notes are an integral part of these financial statements. |
Statements of Changes in Net Assets For the year ended July 29, 2016
| | | | | | | | | | | New |
| | | Kansas | | Nebraska | | Oklahoma | | Maine | | Hampshire |
| | | Municipal | | Municipal | | Municipal | | Municipal | | Municipal |
| | | Fund | | Fund | | Fund | | Fund | | Fund |
INCREASE (DECREASE) IN NET ASSETS FROM OPERATIONS | | | | | | | | | | | | | | | |
Net investment income | | $ | 1,642,271 | | $ | 1,109,244 | | $ | 1,051,348 | | $ | 437,720 | | $ | 114,413 |
Net realized gain (loss) from investment transactions | | | 39,118 | | | 6,667 | | | 52,357 | | | 30 | | | (2,287) |
Net change in unrealized appreciation (depreciation) on investments | | | 1,334,412 | | | 1,377,841 | | | 1,655,184 | | | 536,043 | | | 145,181 |
Net increase (decrease) in net assets resulting from operations | | $ | 3,015,801 | | $ | 2,493,752 | | $ | 2,758,889 | | $ | 973,793 | | $ | 257,307 |
| | | | | | | | | | | | | | | |
DISTRIBUTIONS TO SHAREHOLDERS FROM | | | | | | | | | | | | | | | |
Net investment income | | $ | (1,641,358) | | $ | (1,108,961) | | $ | (1,051,277) | | $ | (436,128) | | $ | (112,772) |
Net realized gain on investments | | | 0 | | | 0 | | | 0 | | | (8,442) | | | 0 |
Total distributions | | $ | (1,641,358) | | $ | (1,108,961) | | $ | (1,051,277) | | $ | (444,570) | | $ | (112,772) |
| | | | | | | | | | | | | | | |
CAPITAL SHARE TRANSACTIONS | | | | | | | | | | | | | | | |
Proceeds from sale of shares | | $ | 5,676,711 | | $ | 6,523,495 | | $ | 7,816,620 | | $ | 3,302,647 | | $ | 2,298,225 |
Proceeds from reinvested dividends | | | 1,165,076 | | | 746,962 | | | 665,587 | | | 349,320 | | | 71,416 |
Cost of shares redeemed | | | (6,305,595) | | | (3,627,437) | | | (5,899,274) | | | (1,442,995) | | | (924,067) |
Net increase (decrease) in net assets resulting from capital share transactions | | $ | 536,192 | | $ | 3,643,020 | | $ | 2,582,933 | | $ | 2,208,972 | | $ | 1,445,574 |
| | | | | | | | | | | | | | | |
TOTAL INCREASE (DECREASE) IN NET ASSETS | | $ | 1,910,635 | | $ | 5,027,811 | | $ | 4,290,545 | | $ | 2,738,195 | | $ | 1,590,109 |
NET ASSETS, BEGINNING OF PERIOD | | $ | 58,578,256 | | | 41,189,231 | | $ | 42,427,488 | | $ | 17,474,792 | | $ | 5,164,219 |
NET ASSETS, END OF PERIOD | | $ | 60,488,891 | | $ | 46,217,042 | | $ | 46,718,033 | | $ | 20,212,987 | | $ | 6,754,328 |
| | | | | | | | | | | | | | | |
Accumulated undistributed net investment income | | $ | 6,024 | | $ | 1,205 | | $ | 0 | | $ | 14,745 | | $ | 2,871 |
| | | | | | | | | | | | | | | |
|
The accompanying notes are an integral part of these financial statements. |
NOTES TO FINANCIAL STATEMENTS
NOTE 1: Organization
Integrity Managed Portfolios (the “Trust”) was organized as a Massachusetts business trust on August 10, 1990 and commenced operations on November 15, 1990. The Trust is registered under the Investment Company Act of 1940 as an open-end management investment company and consists of five series (the “Funds”).
The Kansas Municipal Fund (“KS Muni Fund”), Nebraska Municipal Fund (“NE Muni Fund”), and Oklahoma Municipal Fund (“OK Muni Fund”), each a non-diversified Fund, seek the highest level of current income that is exempt from both federal income tax and each Fund’s respective state income tax as is consistent with preservation of capital. The Maine Municipal Fund (“ME Muni Fund”) and New Hampshire Municipal Fund (“NH Muni Fund”), each a non-diversified Fund, seek the highest level of current income that is exempt from both federal income tax and each Fund’s respective state income tax (interest and dividend tax with respect to New Hampshire) without assuming undue risk.
Each Fund is an investment company and, accordingly, follows the investment company accounting and reporting guidance of the Financial Accounting Standards Board (FASB) Accounting Standard Codification Topic 946 Financial Services – Investment Companies.
NOTE 2: Summary of Significant Accounting Policies
Investment security valuation—Securities for which quotations are not readily available are valued using a matrix system at fair value as determined by the Funds’ administrative services agent, Integrity Fund Services, LLC (“Integrity Fund Services” or “IFS”). The matrix system has been developed based on procedures approved by the Board of Trustees and includes consideration of the following: yields or prices of municipal bonds of comparable quality; type of issue, coupon, maturity, and rating; indications as to value from dealers; indications as to value from municipal bond market activity; and general market conditions. Because the market value of securities can only be established by agreement between parties in a sales transaction, and because of the uncertainty inherent in the valuation process, the fair values as determined may differ from the values that would have been used had a ready market for the securities existed. Refer to Note 3 for further disclosures related to the inputs used to value the Funds’ investments. Shares of a registered investment company, including money market funds that are not traded on an exchange are valued at the investment company’s net asset value per share.
When-issued securities—The Funds may purchase securities on a when-issued basis. Payment and delivery may take place after the customary settlement period for that security. The price of the underlying securities and the date when the securities will be delivered and paid for are fixed at the time the transaction is negotiated. The values of the securities purchased on a when-issued basis are identified as such in the Funds’ Schedule of Investments. With respect to purchase commitments, the Fund identifies securities as segregated in its custodial records with a value at least equal to the amount of the commitment. Losses may arise due to changes in the value of the underlying securities, if the counterparty does not perform under the contract’s terms, or if the issuer does not issue the securities due to political, economic, or other factors. There were no when-issued securities as of July 31, 2017.
Contingent deferred sales charge—In the case of investments into the Funds of $500,000 or more, a 1.00% contingent deferred sales charge (“CDSC”) may be assessed on shares redeemed within 24 months of purchase (excluding shares purchased with reinvested dividends and/or distributions).
Federal and state income taxes—Each Fund is a separate taxpayer for federal income tax purposes. Each Fund’s policy is to comply with the requirements of the Internal Revenue Code that are applicable to regulated investment companies and to distribute substantially all of its net investment income and any net realized gain on investments to its shareholders; therefore, no provision for income taxes is required.
As of and during the year ended July 31, 2017, the Funds did not have a liability for any unrecognized tax benefits. The Funds recognize interest and penalties, if any, related to unrecognized tax benefits as income tax expense in the Statements of Operations. During the year, the Funds did not incur any interest or penalties.
For all open tax years and all major taxing jurisdictions, management of the Funds has concluded that there are no significant uncertain tax positions that would require recognition in the financial statements. Open tax years are those that are open for examination by taxing authorities. Furthermore, management of the Funds is also not aware of any tax positions for which it is reasonably possible that the total amounts of unrecognized tax benefits will significantly change in the next twelve months.
Premiums and discounts—Premiums and discounts on municipal securities are accreted and amortized using the effective yield method over the lives of the respective securities.
Security transactions, investment income, expenses and distributions—Income and expenses are recorded on an accrual basis. Investment transactions are accounted for on the trade date. Realized gains and losses are reported on the specific identification basis. Interest income and estimated expenses are accrued daily. The Funds declare dividends from net investment income daily and pay such dividends monthly. Capital gains, when available, are distributed at least annually. Dividends are reinvested in additional shares of the Funds at net asset value or paid in cash. Distributions are recorded on the ex-dividend date. Income and capital gain distributions are determined in accordance with federal income tax regulations and may differ from net investment income and realized gains determined in accordance with accounting principles generally accepted in the United States of America. These differences are primarily due to differing treatment for market discount and capital loss carryforwards. In addition, other amounts have been reclassified within the composition of net assets to more appropriately conform financial accounting to tax basis treatment.
Use of estimates—The financial statements have been prepared in accordance with accounting principles generally accepted in the United States of America (“GAAP”), which requires management to make estimates and assumptions that affect the reported amounts of assets and liabilities and disclosure of contingent assets and liabilities at the date of the financial statements and the reported amounts of revenues and expenses during the reporting period. Actual results could differ from those estimates.
Common expenses—Common expenses of the Trust are allocated among the Funds within the Trust based on relative net assets of each Fund or the nature of the services performed and the relative applicability to each Fund.
NOTE 3: Fair Value Measurements
Various inputs are used in determining the value of the Funds’ investments. These inputs are summarized in three broad levels: Level 1 inputs are based on quoted prices in active markets for identical securities. Level 2 inputs are based on significant observable inputs (including quoted prices for similar securities, interest rates, prepayment speeds, credit risk, etc.). Level 3 inputs are based on significant unobservable inputs (including the Fund’s own assumptions in determining the fair value of investments). The following is a summary of the inputs used to value the Funds’ investments as of July 31, 2017:
| | | | Level 1 | | Level 2 | | Level 3 | | Total |
KS Muni Fund | Municipal Bonds | | $ | 0 | | $ | 59,654,427 | | $ | 0 | | $ | 59,654,427 |
| | Total | | $ | 0 | | $ | 59,654,427 | | $ | 0 | | $ | 59,654,427 |
| | | | | | | | | | | | | |
NE Muni Fund | Municipal Bonds | | $ | 0 | | $ | 48,374,866 | | $ | 0 | | $ | 48,374,866 |
| | Total | | $ | 0 | | $ | 48,374,866 | | $ | 0 | | $ | 48,374,866 |
| | | | | | | | | | | | | |
OK Muni Fund | Municipal Bonds | | $ | 0 | | $ | 44,501,579 | | $ | 0 | | $ | 44,501,579 |
| | Total | | $ | 0 | | $ | 44,501,579 | | $ | 0 | | $ | 44,501,579 |
| | | | | | | | | | | | | |
ME Muni Fund | Municipal Bonds | | $ | 0 | | $ | 19,278,454 | | $ | 0 | | $ | 19,278,454 |
| | Total | | $ | 0 | | $ | 19,278,454 | | $ | 0 | | $ | 19,278,454 |
| | | | | | | | | | | | | |
NH Muni Fund | Municipal Bonds | | $ | 0 | | $ | 5,703,817 | | $ | 0 | | $ | 5,703,817 |
| | Total | | $ | 0 | | $ | 5,703,817 | | $ | 0 | | $ | 5,703,817 |
See Schedule of Investments to view by type of obligation. The Funds did not hold any Level 3 assets during the year ended July 31, 2017. There were no transfers into or out of Level 1 or Level 2 during the year ended July 31, 2017. The Funds consider transfers into or out of Level 1 and Level 2 as of the end of the reporting period. The Funds did not hold any derivative instruments at any time during the year ended July 31, 2017.
NOTE 4: Investment Transactions
Purchases and sales of investment securities (excluding short-term securities) for the year ended July 31, 2017, were as follows:
| | KS Muni | | NE Muni | | OK Muni | | ME Muni | | NH Muni |
| | Fund | | Fund | | Fund | | Fund | | Fund |
Purchases | $ | 7,408,777 | | $ | 15,472,743 | | $ | 4,327,498 | | $ | 4,644,215 | | $ | 3,403,005 |
Sales | $ | 4,057,274 | | $ | 10,965,598 | | $ | 2,395,482 | | $ | 4,266,972 | | $ | 3,358,619 |
NOTE 5: Capital Share Transactions
Transactions in capital shares were as follows:
| | | KS Muni | | NE Muni | | OK Muni | | ME Muni | | NH Muni |
Year Ended 7/31/17: | | Fund | | Fund | | Fund | | Fund | | Fund |
Shares sold | | 588,008 | | 884,199 | | 769,237 | | 323,622 | | 65,738 |
Shares issued from reinvestments | | 110,018 | | 76,788 | | 57,561 | | 34,094 | | 8,390 |
Shares redeemed | | (406,064) | | (441,003) | | (651,227) | | (324,669) | | (116,826) |
Net increase (decrease) | | 291,962 | | 519,984 | | 175,571 | | 33,047 | | (42,698) |
| | | | | | | | | | |
| | | KS Muni | | NE Muni | | OK Muni | | ME Muni | | NH Muni |
Year Ended 7/29/16: | | Fund | | Fund | | Fund | | Fund | | Fund |
Shares sold | | 515,596 | | 610,955 | | 656,299 | | 294,264 | | 208,450 |
Shares issued from reinvestments | | 105,988 | | 70,178 | | 56,033 | | 31,317 | | 6,539 |
Shares redeemed | | (574,747) | | (340,869) | | (496,094) | | (129,061) | | (85,209) |
Net increase (decrease) | | 46,837 | | 340,264 | | 216,238 | | 196,520 | | 129,780 |
NOTE 6: Income Tax Information
At July 31, 2017, the net unrealized appreciation (depreciation) based on the cost of investments for federal income tax purposes was as follows:
| | KS Muni | | NE Muni | | OK Muni | | ME Muni | | NH Muni |
| | Fund | | Fund | | Fund | | Fund | | Fund |
Investments at cost | $ | 56,939,675 | | $ | 46,518,812 | | $ | 42,719,450 | | $ | 18,522,344 | | $ | 5,519,398 |
Unrealized appreciation | $ | 2,816,494 | | $ | 1,932,194 | | $ | 1,884,294 | | $ | 759,739 | | $ | 186,290 |
Unrealized depreciation | | (101,742) | | | (76,140) | | | (102,165) | | | (3,629) | | | (1,871) |
Net unrealized appreciation* | $ | 2,714,752 | | $ | 1,856,054 | | $ | 1,782,129 | | $ | 756,110 | | $ | 184,419 |
| | | | | | | | | | | | | | |
*Differences between financial reporting-basis and tax-basis are due to differing treatment of market discount. |
The tax character of distributions accrued were as follows:
Year Ended 7/31/17: | KS Muni Fund | | NE Muni Fund | | OK Muni Fund | | ME Muni Fund | | NH Muni Fund |
Tax-exempt income | $ | 1,680,455 | | $ | 1,167,219 | | $ | 1,073,720 | | $ | 466,068 | | $ | 133,449 |
Capital gains | $ | 0 | | $ | 0 | | $ | 0 | | $ | 30 | | $ | 0 |
Year Ended 7/29/16: | KS Muni Fund | | NE Muni Fund | | OK Muni Fund | | ME Muni Fund | | NH Muni Fund |
Tax-exempt income | $ | 1,641,358 | | $ | 1,108,961 | | $ | 1,051,277 | | $ | 436,128 | | $ | 112,772 |
Capital gains | $ | 0 | | $ | 0 | | $ | 0 | | $ | 8,442 | | $ | 0 |
As of July 31, 2017, the components of accumulated earnings/(deficit) on a tax basis were as follows:
| | KS Muni | | NE Muni | | OK Muni | | ME Muni | | NH Muni |
| | Fund | | Fund | | Fund | | Fund | | Fund |
Undistributed tax-exempt income | $ | 41,795 | | $ | 30,166 | | $ | 32,774 | | $ | 6,522 | | $ | 3,324 |
Accumulated capital and other losses | | (223,429) | | | (253,939) | | | (357,662) | | | 0 | | | (18,989) |
Post-October losses deferred | | (253,811) | | | (499,534) | | | (87,138) | | | (390,463) | | | (245,770) |
Unrealized appreciation/(depreciation)* | | 2,714,752 | | | 1,856,054 | | | 1,782,129 | | | 756,110 | | | 184,419 |
Total accumulated earnings/(deficit) | $ | 2,279,307 | | $ | 1,132,747 | | $ | 1,370,103 | | $ | 372,169 | | $ | (77,016) |
| | | | | | | | | | | | | | |
*Differences between financial reporting-basis and tax-basis are due to differing treatment of market discount. |
Under the Regulated Investment Company Modernization Act of 2010 (“Act”), funds are permitted to carry forward capital losses incurred in taxable years beginning after December 22, 2010 for an unlimited period of time. The short-term and long-term character of such losses are retained rather than being treated as short-term as under previous law. Pre-enactment losses are eligible to be carried forward for a maximum period of eight years. Pursuant to the Act, post-enactment capital losses must be utilized before pre-enactment capital losses. As a result, pre-enactment capital loss carryforwards may be more likely to expire unused. The Funds’ capital loss carryforward amounts as of July 31, 2017 are as follows:
| | KS Muni
Fund | | | NE Muni
Fund | | | OK Muni
Fund | | | NH Muni
Fund |
Expires in 2018 | $ | - | | $ | - | | $ | 260,308 | | $ | - |
Non-expiring S-T losses | | 133,526 | | | 177,427 | | | 53,381 | | | 18,990 |
Non-expiring L-T losses | | 89,901 | | | 76,513 | | | 43,974 | | | - |
Total | $ | 223,427 | | $ | 253,940 | | $ | 357,663 | | $ | 18,990 |
For the year ended July 31, 2017, NE Muni Fund utilized capital loss carryforwards of $7,702. For the year ended July 31, 2017, NE Muni Fund and NH Muni Fund reclassified accumulated net investment income of $329 and $12, respectively, to accumulated realized gain due to market discount on bonds sold. ME Muni Fund reclassified realized gain of $30 to accumulated net investment income due to distribution adjustment.
NOTE 7: Investment Advisory Fees and Other Transactions with Affiliates
Viking Fund Management (“VFM”), the Funds’ investment adviser; Integrity Funds Distributor, LLC (“Integrity Funds Distributor” or “IFD”), the Funds’ underwriter and distributor; and IFS, the Funds’ transfer, accounting, and administrative services agent; are subsidiaries of Corridor Investors, LLC (“Corridor Investors” or “Corridor”), the Funds’ sponsor. A Trustee of the Funds is also a Governor of Corridor.
VFM provides investment advisory and management services to the Funds. The Investment Advisory Agreement (the “Advisory Agreement”) provides for fees to be computed at an annual rate of 0.50% of each Fund’s average daily net assets. VFM has contractually agreed to waive its management fee and to reimburse expenses for the Funds, other than extraordinary or non-recurring expenses and acquired fund fees and expenses, until November 29, 2017 so that the net annual operating expenses do not exceed 0.98%. After November 29, 2017, the expense limitation may be terminated or revised. VFM and affiliated service providers may also voluntarily waive fees or reimburse expenses not required under the advisory or other contracts from time to time. There are no recoupment provisions in place for waived/reimbursed fees. An expense limitation lowers expense ratios and increases returns to investors. Certain Officers of the Funds are also Officers and Governors of VFM.
| | Year Ended 7/31/17 | | Payable at 7/31/17 |
| | Advisory Fees* | | Advisory Fees Waived | | Advisory Fees* |
KS Muni Fund | $ | 242,024 | | $ | 62,145 | | $ | 0 |
NE Muni Fund | $ | 188,809 | | $ | 59,415 | | $ | 0 |
OK Muni Fund | $ | 182,497 | | $ | 51,161 | | $ | 0 |
ME Muni Fund | $ | 69,551 | | $ | 31,573 | | $ | 0 |
NH Muni Fund | $ | 13,788 | | $ | 19,107 | | $ | 0 |
| | | | | | | | |
*After waivers. |
IFD serves as the principal underwriter and distributor for the Funds and receives sales charges deducted from Fund share sales proceeds and CDSC from applicable Fund share redemptions. Also, the Funds have adopted a distribution plan for each class of shares as allowed by Rule 12b-1 of the 1940 Act. Distribution plans permit the Funds to reimburse their principal underwriter for costs related to selling shares of the Funds and for various other services. These costs, which consist primarily of commissions and service fees to broker-dealers who sell shares of the Funds, are paid by shareholders through expenses called “Distribution Plan expenses.” The Funds currently pay an annual distribution fee of up to 0.25% of the average daily net assets. Certain Officers of the Funds are also Officers and Governors of IFD.
| | Year Ended 7/31/17 | | Payable at 7/31/17 |
| | Sales | | Distribution | Distribution | | Sales | | Distribution |
| | Charges | CDSC | Fees* | Fees Waived | | Charges | CDSC | Fees* |
KS Muni Fund | $ | 95,234 | $ | 0 | $ | 133,689 | $ | 18,396 | | $ | 0 | $ | 0 | $ | 0 |
NE Muni Fund | $ | 70,672 | $ | 0 | $ | 106,870 | $ | 17,242 | | $ | 0 | $ | 0 | $ | 0 |
OK Muni Fund | $ | 94,033 | $ | 0 | $ | 101,510 | $ | 15,319 | | $ | 0 | $ | 0 | $ | 0 |
ME Muni Fund | $ | 29,477 | $ | 0 | $ | 41,659 | $ | 8,903 | | $ | 0 | $ | 0 | $ | 0 |
NH Muni Fund | $ | 9,882 | $ | 0 | $ | 11,513 | $ | 4,935 | | $ | 0 | $ | 0 | $ | 0 |
| | | | | | | | | | | | | | | |
*After waivers. |
IFS acts as the Funds’ transfer agent for a monthly variable fee equal to 0.14% through October 31, 2016 and 0.12% starting November 1, 2016 of the Funds’ average daily net assets on an annual basis for the Funds’ first $200 million and at a lower rate on the average daily net assets in excess of $200 million plus reimbursement of out-of-pocket expenses and sub-transfer agent out-of-pocket expenses. Sub-transfer agent out-of-pocket expenses are included in the transfer agent fees below and in the transfer agent out-of-pocket balance on the Statements of Operations. IFS also acts as the Funds’ administrative services agent for a monthly fee equal to the sum of a fixed fee of $2,000 and a variable fee equal to 0.14% of the Funds’ average daily net assets on an annual basis for the Funds’ first $200 million and at a lower rate on the average daily net assets in excess of $200 million plus reimbursement of out-of-pocket expenses. Certain Officers of the Funds are also Officers and Governors of IFS.
| | Year Ended 7/31/17 | | Payable at 7/31/17 |
| | Transfer | Transfer | Admin. | Admin. | | Transfer | Admin. |
| | Agency | Agency | Service | Service | | Agency | Service |
| | Fees* | Fees Waived | Fees* | Fees Waived | | Fees* | Fees* |
KS Muni Fund | $ | 71,328 | $ | 9,375 | $ | 96,060 | $ | 13,234 | | $ | 1,392 | $ | 0 |
NE Muni Fund | $ | 56,994 | $ | 8,742 | $ | 80,601 | $ | 13,029 | | $ | 1,090 | $ | 0 |
OK Muni Fund | $ | 53,415 | $ | 7,802 | $ | 77,814 | $ | 11,737 | | $ | 384 | $ | 0 |
ME Muni Fund | $ | 22,764 | $ | 4,528 | $ | 43,212 | $ | 9,230 | | $ | 882 | $ | 0 |
NH Muni Fund | $ | 6,380 | $ | 2,506 | $ | 23,427 | $ | 9,911 | | $ | 311 | $ | 0 |
| | | | | | | | | | | | | | |
*After waivers. |
NOTE 8: Principal Risks
The Funds invest primarily in municipal securities from a specific state. The Funds may also invest in municipal securities of U.S. territories and possessions (such as Puerto Rico, the U.S. Virgin Islands, and Guam). Each Fund is therefore more susceptible to political, economic, legislative, or regulatory factors adversely affecting issuers of municipal securities in its specific state or U.S. territories and possessions.
Interest rate risk is the risk that bond prices will decline in value because of changes in interest rates. There is normally an inverse relationship between the fair value of securities sensitive to prevailing interest rates and actual changes in interest rates. The longer the average maturity of a Fund’s portfolio, the greater its interest rate risk.
NOTE 9: Subsequent Events
On May 18, 2017, the Board of Trustees approved the reorganization of each Fund into the corresponding series of Viking Mutual Funds and the addition of I shares to each corresponding series. The reorganization was also approved by each Fund’s shareholders at a special meeting held on September 21, 2017. The reorganization is expected to occur at the close of business on or about October 31, 2017 and I shares will be available following the reorganization on a date not yet determined.
KANSAS MUNICIPAL FUND
Selected per share data and ratios for the periods indicated
| | | Year | | Year | | Year | | Year | | Year |
| | | Ended | | Ended | | Ended | | Ended | | Ended |
| | | 7/31/17 | | 7/29/16 | | 7/31/15 | | 7/31/14 | | 7/31/13 |
NET ASSET VALUE, BEGINNING OF PERIOD | | $ | 11.13 | | $ | 10.87 | | $ | 10.85 | | $ | 10.56 | | $ | 11.12 |
| | | | | | | | | | | | | | | |
Income (loss) from investment operations: | | | | | | | | | | | | | | | |
Net investment income (loss) | | $ | 0.30 | | $ | 0.31 | | $ | 0.31 | | $ | 0.32 | | $ | 0.30 |
Net realized and unrealized gain (loss) on investments2 | | | (0.35) | | | 0.26 | | | 0.02 | | | 0.29 | | | (0.56) |
Total from investment operations | | $ | (0.05) | | $ | 0.57 | | $ | 0.33 | | $ | 0.61 | | $ | (0.26) |
| | | | | | | | | | | | | | | |
Distributions from net investment income | | $ | (0.30) | | $ | (0.31) | | $ | (0.31) | | $ | (0.32) | | $ | (0.30) |
| | | | | | | | | | | | | | | |
NET ASSET VALUE, END OF PERIOD | | $ | 10.78 | | $ | 11.13 | | $ | 10.87 | | $ | 10.85 | | $ | 10.56 |
| | | | | | | | | | | | | | | |
Total Return (excludes any applicable sales charge) | | (0.42%) | | 5.30% | | 3.03% | | 5.81% | | (2.37%) |
| | | | | | | | | | |
RATIOS/SUPPLEMENTAL DATA | | | | | | | | | | |
Net assets, end of period (in thousands) | | $61,775 | | $60,489 | | $58,578 | | $59,516 | | $64,405 |
Ratio of expenses to average net assets after waivers1 | | 0.98% | | 0.98% | | 0.98% | | 1.01% | | 1.08% |
Ratio of expenses to average net assets before waivers | | 1.15% | | 1.18% | | 1.16% | | 1.16% | | 1.17% |
Ratio of net investment income to average net assets1 | | 2.76% | | 2.81% | | 2.80% | | 2.95% | | 2.75% |
Portfolio turnover rate | | 6.85% | | 12.10% | | 10.87% | | 6.63% | | 13.40% |
1 | Reflects the impact, if any, of fee waivers or reimbursements by the Adviser and/or affiliated service providers. |
| |
2 | Realized and unrealized gains (losses) per share are balancing amounts necessary to reconcile the change in net asset value per share for the period, and may not reconcile with the aggregate gains and losses in the Statement of Operations due to share transactions for the period. |
|
Total return represents the rate that an investor would have earned or lost on an investment in the Fund assuming reinvestment of all dividends and distributions. |
|
|
The accompanying notes are an integral part of these financial statements. |
NEBRASKA MUNICIPAL FUND
Selected per share data and ratios for the periods indicated
| | | Year | | Year | | Year | | Year | | Year |
| | | Ended | | Ended | | Ended | | Ended | | Ended |
| | | 7/31/17 | | 7/29/16 | | 7/31/15 | | 7/31/14 | | 7/31/13 |
NET ASSET VALUE, BEGINNING OF PERIOD | | $ | 10.82 | | $ | 10.48 | | $ | 10.40 | | $ | 9.99 | | $ | 10.69 |
| | | | | | | | | | | | | | | |
Income (loss) from investment operations: | | | | | | | | | | | | | | | |
Net investment income (loss) | | $ | 0.25 | | $ | 0.27 | | $ | 0.29 | | $ | 0.29 | | $ | 0.29 |
Net realized and unrealized gain (loss) on investments2 | | | (0.36) | | | 0.34 | | | 0.08 | | | 0.41 | | | (0.70) |
Total from investment operations | | $ | (0.11) | | $ | 0.61 | | $ | 0.37 | | $ | 0.70 | | $ | (0.41) |
| | | | | | | | | | | | | | | |
Distributions from net investment income | | $ | (0.25) | | $ | (0.27) | | $ | (0.29) | | $ | (0.29) | | $ | (0.29) |
| | | | | | | | | | | | | | | |
NET ASSET VALUE, END OF PERIOD | | $ | 10.46 | | $ | 10.82 | | $ | 10.48 | | $ | 10.40 | | $ | 9.99 |
| | | | | | | | | | | | | | | |
Total Return (excludes any applicable sales charge) | | (1.01%) | | 5.94% | | 3.54% | | 7.14% | | (3.96%) |
| | | | | | | | | | |
RATIOS/SUPPLEMENTAL DATA | | | | | | | | | | |
Net assets, end of period (in thousands) | | $50,095 | | $46,217 | | $41,189 | | $39,734 | | $41,633 |
Ratio of expenses to average net assets after waivers1 | | 0.98% | | 0.98% | | 0.98% | | 1.01% | | 1.08% |
Ratio of expenses to average net assets before waivers | | 1.18% | | 1.20% | | 1.19% | | 1.20% | | 1.20% |
Ratio of net investment income to average net assets1 | | 2.35% | | 2.58% | | 2.72% | | 2.89% | | 2.72% |
Portfolio turnover rate | | 22.92% | | 7.47% | | 11.76% | | 3.88% | | 23.65% |
1 | Reflects the impact, if any, of fee waivers or reimbursements by the Adviser and/or affiliated service providers. |
| |
2 | Realized and unrealized gains (losses) per share are balancing amounts necessary to reconcile the change in net asset value per share for the period, and may not reconcile with the aggregate gains and losses in the Statement of Operations due to share transactions for the period. |
|
Total return represents the rate that an investor would have earned or lost on an investment in the Fund assuming reinvestment of all dividends and distributions. |
|
|
The accompanying notes are an integral part of these financial statements. |
OKLAHOMA MUNICIPAL FUND
Selected per share data and ratios for the periods indicated
| | | Year | | Year | | Year | | Year | | Year |
| | | Ended | | Ended | | Ended | | Ended | | Ended |
| | | 7/31/17 | | 7/29/16 | | 7/31/15 | | 7/31/14 | | 7/31/13 |
NET ASSET VALUE, BEGINNING OF PERIOD | | $ | 12.10 | | $ | 11.64 | | $ | 11.60 | | $ | 11.20 | | $ | 11.93 |
| | | | | | | | | | | | | | | |
Income (loss) from investment operations: | | | | | | | | | | | | | | | |
Net investment income (loss) | | $ | 0.27 | | $ | 0.28 | | $ | 0.29 | | $ | 0.31 | | $ | 0.32 |
Net realized and unrealized gain (loss) on investments2 | | | (0.36) | | | 0.46 | | | 0.04 | | | 0.40 | | | (0.73) |
Total from investment operations | | $ | (0.09) | | $ | 0.74 | | $ | 0.33 | | $ | 0.71 | | $ | (0.41) |
| | | | | | | | | | | | | | | |
Distributions from net investment income | | $ | (0.27) | | $ | (0.28) | | $ | (0.29) | | $ | (0.31) | | $ | (0.32) |
| | | | | | | | | | | | | | | |
NET ASSET VALUE, END OF PERIOD | | $ | 11.74 | | $ | 12.10 | | $ | 11.64 | | $ | 11.60 | | $ | 11.20 |
| | | | | | | | | | | | | | | |
Total Return (excludes any applicable sales charge) | | (0.71%) | | 6.47% | | 2.82% | | 6.42% | | (3.54%) |
| | | | | | | | | | |
RATIOS/SUPPLEMENTAL DATA | | | | | | | | | | |
Net assets, end of period (in thousands) | | $47,374 | | $46,718 | | $42,427 | | $38,795 | | $41,551 |
Ratio of expenses to average net assets after waivers1 | | 0.98% | | 0.98% | | 0.98% | | 1.01% | | 1.08% |
Ratio of expenses to average net assets before waivers | | 1.16% | | 1.19% | | 1.18% | | 1.19% | | 1.18% |
Ratio of net investment income to average net assets1 | | 2.30% | | 2.40% | | 2.44% | | 2.72% | | 2.70% |
Portfolio turnover rate | | 5.30% | | 10.58% | | 14.53% | | 1.41% | | 9.54% |
1 | Reflects the impact, if any, of fee waivers or reimbursements by the Adviser and/or affiliated service providers. |
| |
2 | Realized and unrealized gains (losses) per share are balancing amounts necessary to reconcile the change in net asset value per share for the period, and may not reconcile with the aggregate gains and losses in the Statement of Operations due to share transactions for the period. |
|
Total return represents the rate that an investor would have earned or lost on an investment in the Fund assuming reinvestment of all dividends and distributions. |
|
|
The accompanying notes are an integral part of these financial statements. |
MAINE MUNICIPAL FUND
Selected per share data and ratios for the periods indicated
| | | Year | | Year | | Year | | Year | | Year |
| | | Ended | | Ended | | Ended | | Ended | | Ended |
| | | 7/31/17 | | 7/29/16 | | 7/31/15 | | 7/31/14 | | 7/31/13 |
NET ASSET VALUE, BEGINNING OF PERIOD | | $ | 11.31 | | $ | 10.99 | | $ | 11.00 | | $ | 10.79 | | $ | 11.36 |
| | | | | | | | | | | | | | | |
Income (loss) from investment operations: | | | | | | | | | | | | | | | |
Net investment income (loss) | | $ | 0.25 | | $ | 0.27 | | $ | 0.27 | | $ | 0.29 | | $ | 0.31 |
Net realized and unrealized gain (loss) on investments2 | | | (0.43) | | | 0.33 | | | (0.01) | | | 0.21 | | | (0.57) |
Total from investment operations | | $ | (0.18) | | $ | 0.60 | | $ | 0.26 | | $ | 0.50 | | $ | (0.26) |
| | | | | | | | | | | | | | | |
Less Distributions: | | | | | | | | | | | | | | | |
Distributions from net investment income | | $ | (0.25) | | $ | (0.27) | | $ | (0.27) | | $ | (0.29) | | $ | (0.31) |
Distributions from net realized gains | | | 0.00 | | | (0.01) | | | 0.00 | | | 0.00 | | | 0.00 |
Total distributions | | $ | (0.25) | | $ | (0.28) | | $ | (0.27) | | $ | (0.29) | | $ | (0.31) |
| | | | | | | | | | | | | | | |
NET ASSET VALUE, END OF PERIOD | | $ | 10.88 | | $ | 11.31 | | $ | 10.99 | | $ | 11.00 | | $ | 10.79 |
| | | | | | | | | | | | | | | |
Total Return (excludes any applicable sales charge) | | (1.55%) | | 5.44% | | 2.37% | | 4.72% | | (2.37%) |
| | | | | | | | | | |
RATIOS/SUPPLEMENTAL DATA | | | | | | | | | | |
Net assets, end of period (in thousands) | | $19,811 | | $20,213 | | $17,475 | | $17,451 | | $17,702 |
Ratio of expenses to average net assets after waivers1 | | 0.98% | | 0.98% | | 0.98% | | 1.01% | | 1.08% |
Ratio of expenses to average net assets before waivers | | 1.25% | | 1.29% | | 1.28% | | 1.28% | | 1.27% |
Ratio of net investment income to average net assets1 | | 2.31% | | 2.39% | | 2.45% | | 2.70% | | 2.76% |
Portfolio turnover rate | | 21.81% | | 1.88% | | 16.18% | | 11.27% | | 11.52% |
1 | Reflects the impact, if any, of fee waivers or reimbursements by the Adviser and/or affiliated service providers. |
| |
2 | Realized and unrealized gains (losses) per share are balancing amounts necessary to reconcile the change in net asset value per share for the period, and may not reconcile with the aggregate gains and losses in the Statement of Operations due to share transactions for the period. |
|
Total return represents the rate that an investor would have earned or lost on an investment in the Fund assuming reinvestment of all dividends and distributions. |
|
|
The accompanying notes are an integral part of these financial statements. |
NEW HAMPSHIRE MUNICIPAL FUND
Selected per share data and ratios for the periods indicated
| | | Year | | Year | | Year | | Year | | Year |
| | | Ended | | Ended | | Ended | | Ended | | Ended |
| | | 7/31/17 | | 7/29/16 | | 7/31/15 | | 7/31/14 | | 7/31/13 |
NET ASSET VALUE, BEGINNING OF PERIOD | | $ | 11.07 | | $ | 10.76 | | $ | 10.74 | | $ | 10.55 | | $ | 11.07 |
| | | | | | | | | | | | | | | |
Income (loss) from investment operations: | | | | | | | | | | | | | | | |
Net investment income (loss) | | $ | 0.22 | | $ | 0.24 | | $ | 0.24 | | $ | 0.28 | | $ | 0.28 |
Net realized and unrealized gain (loss) on investments2 | | | (0.52) | | | 0.31 | | | 0.02 | | | 0.19 | | | (0.52) |
Total from investment operations | | $ | (0.30) | | $ | 0.55 | | $ | 0.26 | | $ | 0.47 | | $ | (0.24) |
| | | | | | | | | | | | | | | |
Distributions from net investment income | | $ | (0.22) | | $ | (0.24) | | $ | (0.24) | | $ | (0.28) | | $ | (0.28) |
| | | | | | | | | | | | | | | |
NET ASSET VALUE, END OF PERIOD | | $ | 10.55 | | $ | 11.07 | | $ | 10.76 | | $ | 10.74 | | $ | 10.55 |
| | | | | | | | | | | | | | | |
Total Return (excludes any applicable sales charge) | | (2.73%) | | 5.12% | | 2.45% | | 4.53% | | (2.19%) |
| | | | | | | | | | |
RATIOS/SUPPLEMENTAL DATA | | | | | | | | | | |
Net assets, end of period (in thousands) | | $5,987 | | $6,754 | | $5,164 | | $4,684 | | $5,173 |
Ratio of expenses to average net assets after waivers1 | | 0.98% | | 0.98% | | 0.98% | | 1.01% | | 1.08% |
Ratio of expenses to average net assets before waivers | | 1.53% | | 1.67% | | 1.71% | | 1.71% | | 1.67% |
Ratio of net investment income to average net assets1 | | 2.04% | | 2.17% | | 2.27% | | 2.68% | | 2.62% |
Portfolio turnover rate | | 53.14% | | 23.42% | | 13.08% | | 4.85% | | 10.57% |
1 | Reflects the impact, if any, of fee waivers or reimbursements by the Adviser and/or affiliated service providers. |
| |
2 | Realized and unrealized gains (losses) per share are balancing amounts necessary to reconcile the change in net asset value per share for the period, and may not reconcile with the aggregate gains and losses in the Statement of Operations due to share transactions for the period. |
|
Total return represents the rate that an investor would have earned or lost on an investment in the Fund assuming reinvestment of all dividends and distributions. |
|
|
The accompanying notes are an integral part of these financial statements. |
REPORT OF INDEPENDENT REGISTERED PUBLIC ACCOUNTING FIRM
To the Shareholders and Board of Trustees of
Integrity Managed Portfolios
We have audited the accompanying statements of assets and liabilities, including the schedules of investments, of Integrity Managed Portfolios, comprising Kansas Municipal Fund, Nebraska Municipal Fund, Oklahoma Municipal Fund, Maine Municipal Fund, and New Hampshire Municipal Fund (the “Funds”), as of July 31, 2017, and the related statements of operations for the year then ended, the statements of changes in net assets for each of the two years in the period then ended, and the financial highlights for each of the five years in the period then ended. These financial statements and financial highlights are the responsibility of the Funds’ management. Our responsibility is to express an opinion on these financial statements and financial highlights based on our audits.
We conducted our audits in accordance with the standards of the Public Company Accounting Oversight Board (United States). Those standards require that we plan and perform the audit to obtain reasonable assurance about whether the financial statements and financial highlights are free of material misstatement. An audit includes examining, on a test basis, evidence supporting the amounts and disclosures in the financial statements. Our procedures included confirmation of securities owned as of July 31, 2017, by correspondence with the custodian. An audit also includes assessing the accounting principles used and significant estimates made by management, as well as evaluating the overall financial statement presentation. We believe that our audits provide a reasonable basis for our opinion.
In our opinion, the financial statements and financial highlights referred to above present fairly, in all material respects, the financial position of each of the Funds constituting Integrity Managed Portfolios as of July 31, 2017, the results of their operations for the year then ended, the changes in their net assets for each of the two years in the period then ended, and the financial highlights for each of the five years in the period then ended, in conformity with accounting principles generally accepted in the United States of America.

COHEN & COMPANY, LTD.
Cleveland, Ohio
September 29, 2017
EXPENSE EXAMPLE (unaudited)
As a shareholder of the Funds, you incur two types of costs: (1) transaction costs, including sales charges (loads), redemption fees and exchange fees; and (2) ongoing costs, including management fees, distribution (12b-1) fees and other Fund expenses. This example is intended to help you understand your ongoing costs (in dollars) of investing in the Fund and to compare these costs with the ongoing costs of investing in other mutual funds. The example is based on an investment of $1,000 invested at the beginning of the one-half year period shown below and held for the entire one-half year period.
Actual expenses - The section in the table under the heading “Actual” provides information about actual account values and actual expenses. You may use the information in these columns together with the amount you invested to estimate the expenses that you paid over the period. Simply divide your account value by $1,000 (for example, an account value of $8,600 divided by $1,000 equals 8.6), then multiply the result by the number in the appropriate column for your share class in the column entitled “Expenses Paid During Period” to estimate the expenses you paid on your account during this period.
Hypothetical example for comparison purposes - The section in the table under the heading “Hypothetical (5% return before expenses)” provides information about hypothetical account values and hypothetical expenses based on the Fund’s actual expense ratio and an assumed rate of return of 5% per year before expenses, which is not the Fund’s actual return. The hypothetical account values and expenses may not be used to estimate the actual ending account balance or expenses you paid for the period. You may use this information to compare the ongoing costs of investing in the Fund and other funds. To do so, compare this 5% hypothetical example with the 5% hypothetical examples that appear in the shareholder reports of the other funds.
Please note that the expenses shown in the table are meant to highlight your ongoing costs only and do not reflect any transactional costs, such as sales charges (loads), redemption fees, or exchange fees. Therefore, the section in the table under the heading “Hypothetical (5% return before expenses)” is useful in comparing ongoing costs only, and will not help you determine the relative total costs of owning different funds. In addition, if these transactional costs were included, your costs would have been higher.
| | Beginning | Ending | Expenses | |
| | Account | Account | Paid | Annualized |
| | Value | Value | During | Expense |
| 1/31/2017 | 7/31/2017 | Period* | Ratio |
Kansas Municipal Fund | | | | |
Actual | $1,000.00 | $1,024.38 | $4.98 | 0.98% |
Hypothetical (5% return before expenses) | $1,000.00 | $1,019.74 | $4.97 | 0.98% |
Nebraska Municipal Fund | | | | |
Actual | $1,000.00 | $1,032.40 | $5.00 | 0.98% |
Hypothetical (5% return before expenses) | $1,000.00 | $1,019.74 | $4.97 | 0.98% |
Oklahoma Municipal Fund | | | | |
Actual | $1,000.00 | $1,030.06 | $5.00 | 0.98% |
Hypothetical (5% return before expenses) | $1,000.00 | $1,019.74 | $4.97 | 0.98% |
Maine Municipal Fund | | | | |
Actual | $1,000.00 | $1,024.51 | $4.98 | 0.98% |
Hypothetical (5% return before expenses) | $1,000.00 | $1,019.74 | $4.97 | 0.98% |
New Hampshire Municipal Fund | | | | |
Actual | $1,000.00 | $1,026.73 | $4.99 | 0.98% |
Hypothetical (5% return before expenses) | $1,000.00 | $1,019.74 | $4.97 | 0.98% |
| | | | |
* | Expenses are equal to the annualized expense ratio, multiplied by the average account value over the period, multiplied by 181 days in one-half year period, and dividend by 365 days (to reflect the one-half year period). |
| | | | | | |
BOARD APPROVAL OF INVESTMENT ADVISORY AGREEMENT (unaudited)
Viking Fund Management, LLC (“Viking” or “Adviser”), the Fund’s investment adviser; Integrity Funds Distributor, LLC (“IFD”), the Fund’s underwriter; and Integrity Fund Services, LLC (“IFS”), the Fund’s transfer, accounting, and administrative services agent; are subsidiaries of Corridor Investors, LLC (“Corridor”), the Fund’s sponsor.
The approval and the continuation of a fund’s investment advisory agreement must be specifically approved at least annually (1) by a vote of the trustees or by a vote of the shareholders of the fund, and (2) by the vote of a majority of the trustees who are not parties to the investment advisory agreement or “Interested Persons” of any party (“Independent Trustees”), cast in person at a meeting called for the purpose of voting on such approval. In preparation for the meeting, the Board requests and reviews a wide variety of materials provided by the Fund’s adviser. The Independent Trustees also received advice from their independent counsel on the issues to focus on during contract renewals. At a meeting held on October 31, 2016, the Board of Trustees, including a majority of the Independent Trustees of the Fund, renewed the Management and Investment Advisory Agreement (“Advisory Agreement”) between the Funds and Viking.
The Trustees, including a majority of Trustees who are neither party to the Advisory Agreement nor “interested persons” of any such party (as such term is defined for regulatory purposes), unanimously renewed the Advisory Agreement. In determining whether it was appropriate to renew the Advisory Agreement, the Trustees requested information, provided by the Investment Adviser that it believed to be reasonably necessary to reach its conclusion. In connection with the renewal of the Advisory Agreement, the Board reviewed factors set out in judicial decisions and Securities Exchange Commission directives relating to the renewal of advisory contracts, which include but are not limited to, the following:
| | |
| (a) | the nature and quality of services to be provided by the adviser to the fund; |
| | |
| (b) | the various personnel furnishing such services and their duties and qualifications; |
| | |
| (c) | the relevant fund’s investment performance as compared to standardized industry performance data; |
| | |
| (d) | the adviser’s costs and profitability of furnishing the investment management services to the fund; |
| | |
| (e) | the extent to which the adviser realizes economies of scale as the fund grows larger and the sharing thereof with the fund; |
| | |
| (f) | an analysis of the rates charged by other investment advisers of similar funds; |
| | |
| (g) | the expense ratios of the applicable fund as compared to data for comparable funds; and |
| | |
| (h) | information with respect to all benefits to the adviser associated with the fund, including an analysis of so-called “fallout” benefits or indirect profits to the adviser from its relationship to the funds. |
In evaluating the Adviser’s services and its fees, the Trustees reviewed information concerning the performance of each Fund, the recent financial statements of the Adviser and its parent, and the proposed advisory fee and other fund expenses compared to the level of advisory fees and expenses paid by other similar funds. In reviewing the Advisory Agreement with the foregoing Funds, the Trustees considered, among other things, the fees, the Fund’s past performance, the nature and quality of the services provided, the profitability of the Adviser and its parent (estimated costs and estimated profits from furnishing the proposed services to each Fund), and the expense waivers by the Adviser. The Trustees also considered any ancillary benefits to the Adviser and its affiliates for services provided to each Fund. In this regard, the Trustees noted that there were no soft dollar arrangements involving the Adviser and the only benefits to affiliates were the fees earned for services provided. The Trustees did not identify any single factor discussed above as all-important or controlling. The Trustees also considered the Adviser’s commitment to voluntarily limit Fund expenses and the skills and capabilities of the Adviser.
The following paragraphs summarize the material information and factors considered by the Board, including the Independent Trustees, as well as their conclusions relative to such factors in considering the renewal of the Advisory Agreement:
Nature, extent and quality of services: The Investment Adviser currently provides services to eleven funds with investment strategies ranging from non-diversified sector funds to broad-based equity funds. The experience and expertise of the Investment Adviser is attributable to the long-term focus on managing investment companies and has the potential to enhance the Funds’ future performance. They have a strong culture of compliance and provide quality services. The overall nature and quality of the services provided by the Investment Adviser had historically been, and continues to be, adequate and appropriate.
Various personnel furnishing such services and their duties and qualifications: The Portfolio Manager of the Fund has numerous years of experience in the advisory and money management area adding significant expertise to the Adviser of the Fund. A detailed biography of the portfolio manager was presented to the Trustees. This information is disclosed in the prospectus and/or SAI of the Fund.
Investment performance: Upon a review of the total return history and category rankings of each Fund, the Trustees deemed the performance of each Fund to be satisfactory. In addition, each of the Funds has been meeting its investment objective.
As of July 31, 2016, the risk for: (1) Kansas Municipal Fund was average for the 3 and 5-year time periods. It had a below average risk for the 10-year period; (2) Nebraska Municipal Fund was above average for the 3 and 5-year time periods. It had average risk for the 10-year period; (3) Oklahoma Municipal Fund was above average for the 3 and 5-year periods, and high for the 10-year time period; (4) New Hampshire Municipal Fund was low for the 3, 5, and 10-year time periods; (5) Maine Municipal Fund was average for the 3 and 5–year time periods. It had below average risk for the 10-year period.
As of July 31, 2016, the Fund return rating for: (1) Kansas Municipal Fund was average for the 3, 5, and 10-year time periods; (2) Nebraska Municipal Fund was average for the 3, 5, and 10-year time periods; (3) Oklahoma Municipal Fund was average for the 3, 5 and 10-year periods; (4) New Hampshire Municipal Fund was below average for the 3 and 5-year periods, and low for the 10-year time period; (5) Maine Municipal Fund was below average for the 3, 5, and 10-year time periods.
As of July 31, 2016, the Fund performance for: (1) Kansas Municipal Fund returns for the 1, 3, 5 and 10-year periods were below its index. The returns for the 1, 3, and 5-year periods were above its median classification, and at its median classification for the 10-year period; (2) Nebraska Municipal Fund returns for the 1, 3, 5, and 10-year periods were below its index. The returns for the 1, 3, 5, and 10-year periods were above its median classification; (3) Oklahoma Municipal Fund returns for the 1, 3, 5, and 10-year periods were below its index. Its returns for the 1, 3, 5, and 10-year periods were above its median classification; (4) New Hampshire Municipal Fund returns for the 1, 3, 5, and 10-year periods were below its index and the returns for the 1, 3, 5, and 10-year periods were at or near its median classification; (5) Maine Municipal Fund returns for the 1, 3, 5, and 10-year periods were below its index, and the returns for the 1, 3, 5, and 10-year periods were at or near its median classification.
Profitability: In connection with its review of fees, the Board also considered the profitability of Viking for its advisory activities. In this regard, the Board reviewed information regarding the finances of Corridor and Viking. Based on the information provided, the Board concluded that the level of profitability was reasonable in light of the services provided.
Economies of scale: The Board discussed the benefits for the Funds as the Adviser could realize economies of scale as each of the Funds grow larger, but the size of the Funds has not reached an asset level to benefit from economies of scale. The advisory fees are structured appropriately based on the size of the Fund. The Adviser has indicated that a new advisory fee structure may be looked at if a Fund reaches an asset level where it could benefit from economies of scale.
Analysis of the rates charged by other investment advisers of similar funds: A comparison of the management fees charged by the Advisor seemed reasonable to the Trustees when compared to similar funds in objective and size. The Adviser is voluntarily waiving advisory fees to a certain degree due to the small size of the Funds.
Expense ratios of the applicable fund as compared to data for comparable funds: Each of the Fund’s net expense ratios of 0.98% was comparable to slightly above the average expense ratio of other funds of similar objective and size.
Information with respect to all benefits to the adviser associated with the fund, including an analysis of so-called “fallout” benefits or indirect profits to the adviser from its relationship to the funds: The Board noted that the Adviser does not realize material direct benefits from its relationship with the Fund. The Adviser does not participate in any soft dollar arrangements from securities trading in the Integrity Managed Portfolios.
In voting unanimously to renew the Advisory Agreement, the Trustees did not identify any single factor as being of paramount importance. The Trustees noted that their discussion in this regard was premised on numerous factors including the nature, quality and resources of Viking, the strategic plan involving the Funds, and the potential for increased distribution and growth of the Funds. They determined that, after considering all relevant factors, the renewal of the Advisory Agreement would be in the best interest of each of the Funds and its shareholders.
Potential Conflicts of Interest –Investment Adviser
Actual or apparent conflicts of interest may arise when a portfolio manager has day-to-day management responsibilities with respect to more than one fund or other account. More specifically, portfolio managers who manage multiple funds are presented with the following potential conflicts:
The management of multiple funds may result in a portfolio manager devoting unequal time and attention to the management of each fund. The management of multiple funds and accounts also may give rise to potential conflicts of interest if the funds and accounts have different objectives, benchmarks, time horizons, and fees as the portfolio manager must allocate his time and investment ideas across multiple funds and accounts.
| Ÿ | The appearance of a conflict of interest may arise where the Investment Adviser has an incentive, such as a performance-based management fee, which relates to the management of one fund but not all funds with respect to which a portfolio manager has day-to-day management responsibilities. The management of personal accounts may give rise to potential conflicts of interest; there is no assurance that the Funds' code of ethics will adequately address such conflicts. One of the portfolio manager's numerous responsibilities is to assist in the sale of Fund shares. The compensation of Monte Avery, Shannon Radke, and Josh Larson (the “Portfolio Manager” of the Funds), is based on salary paid every other week. The Portfolio Managers are not compensated for client retention. In addition, Corridor sponsors a 401(K) plan for all its employees. This plan is funded by employee elective deferrals and a match up to 6% by Corridor of the employees gross pay. |
| | |
| Ÿ | With respect to securities transactions for the Funds, the Investment Adviser determines which broker to use to execute each order, consistent with the duty to seek best execution of the transaction. The portfolio manager may execute transactions for another fund or account that may adversely impact the value of securities held by the Funds. Securities selected for funds or accounts other than the Funds may outperform the securities selected for the Funds. |
| | |
| Ÿ | Although the Portfolio Manager generally does not trade securities in his own personal account, each of the Funds has adopted a code of ethics that, among other things, permits personal trading by employees under conditions where it has been determined that such trades would not adversely impact client accounts. Nevertheless, the management of personal accounts may give rise to potential conflicts of interest, and there is no assurance that these codes of ethics will adequately address such conflicts. |
| | |
| Ÿ | Shannon D. Radke is a Governor, President, and Chief Executive Officer of Corridor. He owns membership interests of approximately 9.8% in Corridor. He initially received membership interests, without a cash investment, in exchange for contributions to Corridor (including experience in the mutual fund industry and personal guaranties of bank financing) and, in addition, in exchange for his interest in Viking. Mr. Radke also purchased a portion of his membership interests in Corridor. Certain other current employees of Corridor own, in the aggregate, approximately 29%-30% of the total membership interests in Corridor, with those employees individually owning an interest of 0.01% to 2.02%. They initially received their membership interests in exchange for their experience and role in the operations of Corridor; some have since purchased a portion of their membership interests. |
The Investment Adviser and the Funds have adopted certain compliance procedures, which are designed to address these types of conflicts. However, there is no guarantee that such procedures will detect each and every situation in which a conflict arises.
BOARD OF TRUSTEES AND OFFICERS (unaudited)
The Board of Trustees (“Board”) of the Funds consists of four Trustees (the “Trustees”). These same individuals, unless otherwise noted, also serve as Trustees for the five series of Integrity Managed Portfolios, the four series of The Integrity Funds, and the two series of Viking Mutual Funds. Three Trustees are not “interested persons” (75% of the total) as defined under the 1940 Act (the “Independent Trustees”). The remaining Trustee is “interested” (the “Interested Trustees”) by virtue of his affiliation with Viking Fund Management, LLC and its affiliates.”
For the purposes of this section, the “Fund Complex” consists of the five series of Integrity Managed Portfolios, the five series of The Integrity Funds, and the two series of Viking Mutual Funds.
Each Trustee serves a Fund until its termination; or until the Trustee’s retirement, resignation, or death; or otherwise as specified in the Funds’ organizational documents. Each Officer serves an annual term. The tables that follow show information for each Trustee and Officer of the Funds.
INDEPENDENT TRUSTEES |
Name, Date of Birth, Date Service Began, and Number of Funds Overseen in Fund Complex | Principal Occupations for Past Five Years
and Directorships Held During Past Five Years |
Jerry M. Stai
Birth date: March 31, 1952
Began serving: January 2006
Funds overseen: 12 funds | Principal occupation(s): Minot State University (1999 to present); Non-Profit Specialist, Bremer Bank (2006 to 2014); Director/Trustee: Integrity Fund of Funds, Inc. (2006 to 2012), The Integrity Funds and Integrity Managed Portfolios (2006 to present), and Viking Mutual Funds (2009 to present) Other Directorships Held: Not Applicable |
R. James Maxson
Birth date: December 12, 1947
Began serving: January 1999
Funds overseen: 12 funds | Principal occupation(s): Attorney: Maxson Law Office P.C. (2002 to present); Director/Trustee: Integrity Fund of Funds, Inc. (1999 to 2012), Integrity Managed Portfolios (1999 to present), The Integrity Funds (2003 to present), and Viking Mutual Funds (2009 to present) Other Directorships Held: Peoples State Bank of Velva, St. Joseph’s Community Health Foundation and St. Joseph’s Foundation, Minot Community Land Trust |
Wade A. Dokken
Birth date: March 3, 1960
Began serving: February 2016
Funds overseen: 12 funds | Principal occupation(s): Member, WealthVest Financial Partners (2009 to present); Co-President, WealthVest Marketing (2009 to present), Trustee: Integrity Managed Portfolios (2016 to present), The Integrity Funds (2016 to present), and Viking Mutual Funds (2016 to present) Other Directorships Held: Not Applicable |
The Statement of Additional Information (“SAI”) contains more information about the Funds’ Trustees and is available without charge upon request, by calling Integrity Funds Distributor at 800-276-1262.
INTERESTED TRUSTEE |
Name, Position with Trust, Date of Birth, Date Service Began, and Number of Funds Overseen in Fund Complex | Principal Occupations for Past Five Years
and Directorships Held During Past Five Years |
Robert E. Walstad(1)
Trustee, and Chairman
Birth date: August 16, 1944
Began serving: January 1996
Funds overseen: 12 funds | Principal occupation(s): Governor (2009 to present): Corridor Investors, LLC; Portfolio Manager (2010 to 2013): Viking Fund Management, LLC; Director and Chairman: Integrity Fund of Funds, Inc. (1994 to 2012); Trustee and Chairman: Integrity Managed Portfolios (1996 to present), The Integrity Funds (2003 to present), and Viking Mutual Funds (2009 to present) Other Directorships Held: Governor: Mainstream Investors, LLC (2012) |
|
(1) Trustee who is an “interested person” of the Funds as defined in the Investment Company Act of 1940, as amended (the “1940 Act”). Mr. Walstad is an interested person by virtue of being an Officer of the Funds and ownership in Corridor Investors the parent company of Viking Fund Management, Integrity Fund Services and Integrity Funds Distributor. |
OTHER OFFICERS |
Name, Position with Trust, Date of Birth, and Date Service Began | Principal Occupations for Past Five Years
and Directorships Held During Past Five Years |
Shannon D. Radke
President
Birth date: September 7, 1966
Began serving: August 2009 | Principal occupation(s): Governor, CEO, and President (2009 to present): Corridor Investors, LLC; Governor and President (1998 to present) and Senior Portfolio Manager (1999 to present): Viking Fund Management, LLC; Governor and President (2009 to present): Integrity Fund Services, LLC and Integrity Funds Distributor, LLC; President: Viking Mutual Funds (1999 to present), Integrity Fund of Funds, Inc. (2009 to 2012), The Integrity Funds (2009 to present), and Integrity Managed Portfolios (2009 to present) Other Directorships Held: Minot Chamber of Commerce |
Peter A. Quist
Vice President
Birth date: February 23, 1934
Began serving: January 1996 | Principal occupation(s): Governor (2009 to present): Corridor Investors, LLC; Attorney (inactive); Vice President (1994 to 2012): Integrity Fund of Funds, Inc.; Vice President: Integrity Managed Portfolios (1996 to present); The Integrity Funds (2003 to present); and Viking Mutual Funds (2009 to present) Other Directorships Held: Not applicable |
Adam C. Forthun
Treasurer
Birth date: June 30, 1976
Began serving: May 2008 | Principal occupation(s): Fund Accounting Manager (2008 to present) and Chief Operating Officer (2013 to present): Integrity Fund Services, LLC; Treasurer: Integrity Fund of Funds, Inc. (2008 to 2012), Integrity Managed Portfolios and The Integrity Funds (2008 to present), and Viking Mutual Funds (2009 to present) Other Directorships Held: Not applicable |
Brent M. Wheeler
Secretary and Mutual Fund
Chief Compliance Officer
Birth date: October 9, 1970
Began serving: MF CCO: October 2005
Secretary: October 2009 | Principal occupation(s): Mutual Fund Chief Compliance Officer: Integrity Fund of Funds, Inc. (2005 to 2012), Integrity Managed Portfolios and The Integrity Funds, (2005 to present), and Viking Mutual Funds (2009 to present); Secretary (2009 to 2012): Integrity Fund of Funds, Inc.; Secretary (2009 to present): Integrity Managed Portfolios, The Integrity Funds, and Viking Mutual Funds Other Directorships Held: Not applicable |
The SAI contains more information about the Funds’ Trustees and is available without charge upon request, by calling Integrity Funds Distributor at 800-276-1262.
Rev. 12/2012
| |
FACTS | WHAT DOES INTEGRITY VIKING FUNDS DO WITH YOUR PERSONAL INFORMATION? |
| |
| |
| |
Why? | Financial companies choose how they share your personal information. Federal law gives consumers the right to limit some but not all sharing. Federal law also requires us to tell you how we collect, share, and protect your personal information. Please read this notice carefully to understand what we do. |
| |
| |
What? | The types of personal information we collect and share depend on the product or service you have with us. This information can include: |
| |
Ÿ | Social Security number, name, address |
| |
Ÿ | Account balance, transaction history, account transactions |
| |
Ÿ | Investment experience, wire transfer instructions |
| |
When you are no longer our customer, we continue to share your information as described in this notice. |
| |
| |
How? | All financial companies need to share customers’ personal information to run their everyday business. In the section below, we list the reasons financial companies can share their customers’ personal information; the reasons Integrity Viking Funds chooses to share; and whether you can limit this sharing. |
| |
| | |
Reasons we can share your personal information | Does Integrity Viking Funds share? | Can you limit this sharing? |
| | |
| | |
For our everyday business purposes— | Yes | No |
| such as to process your transactions, maintain your account(s), respond to court orders and legal investigations, or report to credit bureaus |
| | |
| | |
For our marketing purposes— | Yes | No |
| to offer our products and services to you |
| | |
| | |
For joint marketing with other financial companies | No | We don’t share |
| | |
| | |
For our affiliates’ everyday business purposes— | Yes | No |
| information about your transactions and experiences |
| | |
For our affiliates’ everyday business purposes— | No | We don’t share |
| information about your creditworthiness |
| | |
For non-affiliates to market to you | No | We don’t share |
| | |
| |
Questions? | Call 1-800-601-5593 or go to www.integrityvikingfunds.com |
| |
PRIVACY POLICY (Continued)
|
Who we are |
|
| |
Who is providing this notice? | Integrity Viking Funds (a family of investment companies) |
| |
|
What we do |
|
| |
How does Integrity Viking Funds protect my personal information? | To protect your personal information from unauthorized access and use, we use security measures that comply with federal law. These measures include computer safeguards and secured files and buildings. We |
| |
Ÿ | train employees on privacy, information security and protection of client information. |
| |
Ÿ | limit access to nonpublic personal information to those employees requiring such information in performing their job functions. |
| |
| |
How does Integrity Viking Funds collect my personal information? | We collect your personal information, for example, when you: |
| |
Ÿ | open an account or seek financial or tax advice |
| |
Ÿ | provide account information or give us your contact information |
| |
Ÿ | make a wire transfer |
| |
We also collect your personal information from other companies. |
| |
| |
Why can’t I limit all sharing? | Federal law gives you the right to limit only: |
| |
Ÿ | sharing for affiliates’ everyday business purposes—information about your creditworthiness |
| |
Ÿ | affiliates from using your information to market to you |
| |
Ÿ | sharing for non-affiliates to market to you |
|
State laws and individual companies may give you additional rights to limit sharing. |
| |
| | | | | |
|
Definitions |
|
| |
Affiliates | Companies related by common ownership or control. They can be financial and nonfinancial companies |
| |
Ÿ | The Integrity Funds |
| |
Ÿ | Viking Mutual Funds |
| |
Ÿ | Integrity Managed Portfolios |
| |
Ÿ | Corridor Investors, LLC |
| |
Ÿ | Viking Fund Management, LLC |
| |
Ÿ | Integrity Funds Distributor, LLC |
| |
Ÿ | Integrity Fund Services, LLC |
|
| |
Non-affiliates | Companies not related by common ownership or control. They can be financial and nonfinancial companies. |
|
Integrity Viking Funds does not share with non-affiliates so they can market to you. |
| |
| |
Joint marketing | A formal agreement between non-affiliated financial companies that together market financial products or services to you. |
|
Integrity Viking Funds doesn’t jointly market. |
| |
Integrity Viking Funds includes: |
| |
Ÿ | The Integrity Funds |
| |
Ÿ | Viking Mutual Funds |
| |
Ÿ | Integrity Managed Portfolios |
PROXY VOTING OF FUND PORTFOLIO SECURITIES
A description of the policies and procedures that the Funds use to determine how to vote proxies relating to securities held in each Fund’s portfolio is available, without charge and upon request, by calling 800-276-1262. A report on Form N-PX of how the Funds voted any such proxies during the most recent 12-month period ended June 30 is available through the Funds’ website at www.integrityvikingfunds.com. The information is also available from the Electronic Data Gathering Analysis and Retrieval (“EDGAR”) database on the website of the Securities and Exchange Commission (“SEC”) at www.sec.gov.
QUARTERLY PORTFOLIO SCHEDULE
Within 60 days of the end of its second and fourth fiscal quarters, the Funds provide a complete schedule of portfolio holdings in their semi-annual and annual reports on the Form N-CSR(S). These reports are filed electronically with the SEC and are delivered to the shareholders of the Funds. The Funds also file their complete schedule of portfolio holdings with the SEC for the first and third quarters of each fiscal year on Form N-Q. The Fund’s Forms N-Q and N-CSR(S) are available on the SEC’s website at www.sec.gov. The Funds’ Forms N-Q and N-CSR(S) may be reviewed and copied at the SEC’s Public Reference Room in Washington, D.C. Information on the operation of the Public Reference Room may be obtained by calling 202-551-8090. You may also access this information from the Funds’ website at www.integrityvikingfunds.com.
SHAREHOLDER INQUIRIES AND MAILINGS
Direct inquiries regarding the Funds to:
Integrity Funds Distributor, LLC
PO Box 500
Minot, ND 58702
Phone: 800-276-1262 | Direct inquiries regarding account information to:
Integrity Fund Services, LLC
PO Box 759
Minot, ND 58702
Phone: 800-601-5593 |
To reduce their expenses, the Funds may mail only one copy of its prospectus and each annual and semi-annual report to those addresses shared by two or more accounts. If you wish to receive additional copies of these documents, please call Integrity Funds Distributor at 800-276-1262 or contact your financial institution. Integrity Funds Distributor will begin sending you individual copies 30 days after receiving your request.
Integrity Viking Funds are sold by prospectus only. An investor should consider the investment objectives, risks, and charges and expenses of the investment company carefully before investing. The prospectus contains this and other information about the investment company. You may obtain a prospectus at no cost from your financial adviser or at www.integrityvikingfunds.com. Please read the prospectus carefully before investing.

Equity Funds
Integrity Dividend Harvest Fund
Integrity Energized Dividend Fund
Integrity Growth & Income Fund
Williston Basin/Mid-North America Stock Fund
Corporate Bond Fund
Integrity High Income Fund
State-Specific Tax-Exempt Bond Funds
Viking Tax-Free Fund for Montana
Viking Tax-Free Fund for North Dakota
Kansas Municipal Fund
Maine Municipal Fund
Nebraska Municipal Fund
New Hampshire Municipal Fund
Oklahoma Municipal Fund
Item 2. CODE OF ETHICS.
At the end of the period covered by this report, the registrant has adopted a code of ethics as defined in Item 2 of Form N-CSR that applies to the registrant’s principal executive officer and principal financial officer (herein referred to as the “Code”). There were no amendments to the Code during the period covered by this report. The registrant did not grant any waivers, including implicit waivers, from any provisions of the Code during the period of this report. The Code is available on the Integrity Viking Funds website at http://www.integrityvikingfunds.com. A copy of the Code is also available, without charge, upon request by calling 800-601-5593. The Code is filed herewith pursuant to Item 12(a)(1) as EX-99.CODE ETH.
Item 3. AUDIT COMMITTEE FINANCIAL EXPERT.
The Board of Trustees has determined that Jerry Stai is an audit committee financial expert, as defined in Item 3 of Form N-CSR. Mr. Stai is “independent” for purposes of Item 3 of Form N-CSR.
Item 4. PRINCIPAL ACCOUNTANT FEES AND SERVICES.
| (a) | Audit Fees: The aggregate fees billed for each of the last two fiscal years for professional services rendered by Cohen Fund Audit Services, Ltd. (“Cohen”), the principal accountants for the audit of the registrant’s annual financial statements, for services that are normally provided by the accountant in connection with statutory and regulatory filings or engagements for those fiscal years were $40,500 for the year ended July 31, 2017 and $39,750 for the year ended July 29, 2016. |
| | |
| (b) | Audit-Related Fees: The aggregate fees billed in each of the last two fiscal years for assurance and related services by Cohen that are reasonably related to the performance of the audit of the registrant’s financial statements and are not reported under paragraph (a) of this Item were $0 for the year ended July 31, 2017 and $0 for the year ended July 29, 2016. |
| | |
| (c) | Tax Fees: The aggregate fees billed in each of the last two fiscal years for professional services rendered by Cohen for tax compliance, tax advice, and tax planning were $12,500 for the year ended July 31, 2017 and $12,500 for the year ended July 29, 2016. Such services included review of excise distribution calculations (if applicable), preparation of the Trust’s federal, state, and excise tax returns, tax services related to mergers, and routine counseling. |
| | |
| (d) | All Other Fees: The aggregate fees billed in each of the last two fiscal years for products and services provided by Cohen other than the services reported in paragraphs (a) through (c) of this Item: None. |
| | |
| (e) | (1) | Audit Committee Pre-Approval Policies and Procedures |
| | | |
| | | | The registrant’s audit committee has adopted policies and procedures that require the audit committee to pre-approve all audit and non-audit services provided to the registrant by the principal accountant. |
| | | |
| | (2) | Percentage of services referred to in 4(b) through 4(d) that were approved by the audit committee pursuant to paragraph (c)(7)(i)(C) of Rule 2-01 of Regulation S-X |
| | | |
| | | | 0% of the services described in paragraphs (b) through (d) of Item 4 were not pre-approved by the audit committee. |
| | |
| (f) | All services performed on the engagement to audit the registrant’s financial statements for the most recent fiscal year-end were performed by Cohen’s full-time permanent employees. |
| | |
| (g) | Non-Audit Fees: None. |
| | |
| (h) | Principal Accountant’s Independence: The registrant’s auditor did not provide any non-audit services to the registrant’s investment adviser or any entity controlling, controlled by, or controlled with the registrant’s investment adviser that provides ongoing services to the registrant. |
Item 5. AUDIT COMMITTEE OF LISTED REGISTRANTS.
Not applicable
Item 6. INVESTMENTS.
The Schedule of Investments is included as part of the report to shareholders filed under Item 1 of this Form.
Item 7. DISCLOSURE OF PROXY VOTING POLICIES AND PROCEDURES FOR CLOSED-END MANAGEMENT INVESTMENT COMPANIES.
Not applicable
Item 8. PORTFOLIO MANAGERS OF CLOSED-END MANAGEMENT INVESTMENT COMPANIES.
Not applicable
Item 9. PURCHASES OF EQUITY SECURITIES BY CLOSED-END MANAGEMENT INVESTMENT COMPANY AND AFFILIATED PURCHASERS.
Not applicable
Item 10. SUBMISSION OF MATTERS TO A VOTE OF SECURITY HOLDERS.
There have been no material changes to the procedures by which shareholders may recommend nominees to the registrant’s board of trustees in the last fiscal half year.
Item 11. CONTROLS AND PROCEDURES.
| (a) | Based on their evaluation of the registrant’s disclosure controls and procedures as of a date within 90 days of the filing date of this Form N-CSR (the “Report”), the registrant’s principal executive officer and principal financial officer believe that the disclosure controls and procedures (as defined in Rule 30a-3(c) under the Investment Company Act of 1940, as amended) are effectively designed to ensure that information required to be disclosed by the registrant in the Report is recorded, processed, summarized and reported by the filing date, including ensuring that information required to be disclosed in the Report is accumulated and communicated to the registrant’s principal executive officer and principal financial officer who are making certifications in the Report, as appropriate, to allow timely decisions regarding required disclosure. |
| | |
| (b) | There were no changes in the registrant’s internal control over financial reporting (as defined in Rule 30a-3(d) under the Investment Company Act of 1940) that occurred during the registrant’s most recent fiscal half-year that have materially affected, or are reasonably likely to materially affect, the registrant's internal control over financial reporting. |
Item 12. EXHIBITS.
| (a) | (1) | Code of ethics pursuant to Item 2 of Form N-CSR is filed and attached hereto as EX-99. CODE ETH. |
| | | |
| | (2) | A separate certification for each principal executive officer and principal financial officer of the registrant as required by Rule 30a-2 under the 1940 Act (17 CFR 270.30a-2) is filed and attached hereto as EX-99. CERT. |
| | | |
| | (3) | Not applicable. |
| | |
| (b) | Certifications pursuant to Section 906 of the Sarbanes-Oxley Act of 2002 is filed and attached hereto. |
Pursuant to the requirements of the Securities Exchange Act of 1934 and the Investment Company Act of 1940, the registrant has duly caused this report to be signed on its behalf by the undersigned, thereunto duly authorized.
Integrity Managed Portfolios
By: /s/ Shannon D. Radke
Shannon D. Radke
President
October 5, 2017
Pursuant to the requirements of the Securities Exchange Act of 1934 and the Investment Company Act of 1940, this report has been signed below by the following persons on behalf of the registrant and in the capacities and on the dates indicated.
By: /s/ Shannon D. Radke
Shannon D. Radke
President
October 5, 2017
By: /s/ Adam Forthun
Adam Forthun
Treasurer
October 5, 2017