ADP Reports First Quarter Fiscal 2019 Results
| |
| • | Revenues increased 8% to $3.3 billion in the first quarter, 7% organic constant currency; raising fiscal 2019 growth forecast to 6% to 7%, compared to prior forecast of 5% to 7% |
| |
| • | Employer Services New Business Bookings increased 8% in the quarter |
| |
| • | PEO average Worksite Employees grew 9% in the quarter; raising fiscal 2019 growth forecast to 8% to 9%, compared to prior forecast of 7% to 8% |
| |
| • | Diluted earnings per share ("EPS") increased 24% to $1.15 for the quarter; adjusted diluted EPS increased 28% to $1.20 |
| |
| • | Raising fiscal 2019 adjusted diluted EPS growth forecast to 15% to 17%, compared to prior forecast of 13% to 15% |
ROSELAND, N.J. – October 31, 2018 – ADP® (Nasdaq: ADP), a leading global provider of Human Capital Management (HCM) solutions, today announced its first quarter fiscal 2019 financial results and updated its fiscal 2019 outlook.
First Quarter Fiscal 2019 Consolidated Results
Compared to last year’s first quarter, revenues grew 8% to $3.3 billion, 7% organic constant currency. Net earnings increased 22% to $505 million. Earnings before income taxes increased 14% to $647 million. Adjusted EBIT increased 18% to $687 million, representing adjusted EBIT margin expansion of about 180 basis points in the quarter to 20.7% including approximately 50 basis points of pressure from acquisitions, and was driven by benefits from operational efficiencies and transformation initiatives. ADP’s effective tax rate for the quarter was 21.9%, and 22.2% on an adjusted basis. Diluted EPS increased 24% to $1.15, and adjusted diluted EPS increased 28% to $1.20, and included $0.05 in unplanned tax benefits related to stock-based compensation.
“We are pleased with our strong start to the fiscal year and with the continued momentum by our sales force as it delivered another solid quarter of New Business Bookings growth,” said Carlos Rodriguez, President and Chief Executive Officer, ADP. “We also continue to execute well on our transformation initiatives, and remain focused on enhancing our product, service, and operations to maximize value for our clients and shareholders alike.”
“We continue to see clear positive results from the investments we have made in recent years,” said Jan Siegmund, Chief Financial Officer, ADP. “Our Service Alignment Initiative, client migrations, and transformation initiatives are yielding improvements in our client satisfaction scores and gains in productivity, keeping us firmly on a path of delivering balanced revenue and profit growth over the long term.”
Adjusted EBIT, adjusted EBIT margin, adjusted diluted earnings per share, adjusted effective tax rate, constant currency, and organic constant currency are all non-GAAP financial measures. Please refer to the accompanying financial tables at the end of this release for a discussion of why ADP believes these measures are important and for a reconciliation of non-GAAP financial measures to their comparable GAAP financial measures.
First Quarter Fiscal 2019 Segment Results
Employer Services – Employer Services offers a comprehensive range of HCM and human resources outsourcing solutions.
| |
| • | Employer Services New Business Bookings increased 8% compared to last year's first quarter. |
| |
| • | Employer Services revenues increased 7% compared to last year’s first quarter, 6% organic constant currency. |
| |
| • | Pays per control increased 2.4% for the first quarter. |
| |
| • | Employer Services segment margin increased 260 basis points compared to last year’s first quarter, including approximately 90 basis points of pressure from acquisitions. |
PEO Services – PEO Services provides comprehensive employment administration outsourcing solutions.
| |
| • | PEO Services revenues increased 10% compared to last year’s first quarter. |
| |
| • | PEO Services revenues excluding zero-margin benefits pass-throughs increased 10% compared to last year's first quarter. |
| |
| • | Average Worksite Employees paid by PEO Services were about 528,000 for the first quarter, up 9% compared to last year's first quarter. |
| |
| • | PEO Services segment margin increased approximately 110 basis points compared to last year’s first quarter. |
Interest on Funds Held for Clients – The safety, liquidity and diversification of ADP clients’ funds are the foremost objectives of the Company’s investment strategy. Client funds are invested in accordance with ADP’s prudent and conservative investment guidelines and the credit quality of the investment portfolio is predominantly AAA/AA.
| |
| • | For the first quarter, interest on funds held for clients increased 19% to $119 million. |
| |
| • | Average client funds balances increased 5% in the first quarter to $22.2 billion. |
| |
| • | For the first quarter, the average interest yield on client funds was 2.1%, which was up 30 basis points compared to a year ago. |
Fiscal 2019 Outlook
Comparisons to fiscal 2018 results reflect the adoption of ASC 606 and previously disclosed segment reporting changes. Please see the included bridge of as-reported fiscal 2018 results to as-adjusted fiscal 2018 results.
Certain components of ADP’s fiscal 2019 outlook and related growth comparisons exclude the impact of the following items and are discussed on an adjusted basis where applicable. Please refer to the accompanying financial tables for a reconciliation of these adjusted amounts to their closest comparable GAAP measure.
| |
| • | Fiscal 2018 pre-tax proxy contest charges of about $33 million. |
| |
| • | Fiscal 2018 one-time net tax benefit of about $184 million from the Tax Cuts and Jobs Act. |
| |
| • | Fiscal 2018 pre-tax charges of about $405 million related to the Voluntary Early Retirement Program, the Service Alignment Initiative, and other transformation initiatives. |
| |
| • | Fiscal 2019 pre-tax charges of about $95 million related to the Voluntary Early Retirement Program, the Service Alignment Initiative and other transformation initiatives. |
| |
| • | Fiscal 2019 one-time transition benefit of about $1 million from the Tax Cuts and Jobs Act. |
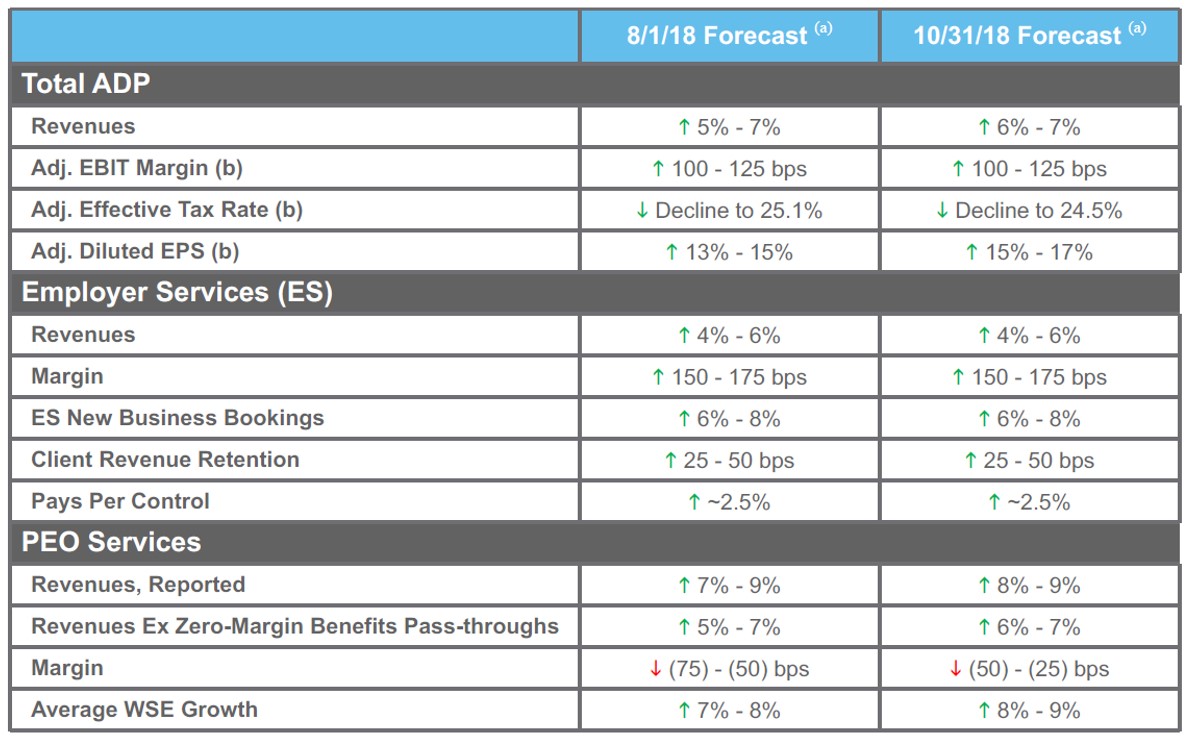
Consolidated Fiscal 2019 Forecast
| |
| • | Revenue growth of 6% to 7%, compared to prior forecast of 5% to 7%. |
| |
| • | Adjusted EBIT margin up 100 to 125 basis points from 20.7% in fiscal 2018. |
| |
| • | Diluted EPS up 18% to 20% from $4.25 in fiscal 2018, compared to prior forecast of up 19% to 21%; decrease mainly due to higher anticipated transformation-related charges. |
| |
| • | Adjusted diluted EPS up 15% to 17% from $4.53 in fiscal 2018, compared to prior forecast of up 13% to 15%. |
| |
| • | Adjusted effective tax rate of 24.5%, compared to prior forecasted rate of 25.1%. |
Reportable Segments Fiscal 2019 Forecast
| |
| • | Employer Services revenue growth of 4% to 6%. |
| |
| • | Employer Services margins up 150 to 175 basis points. |
| |
| • | Employer Services New Business Bookings growth of 6% to 8%. |
| |
| • | Employer Services client revenue retention up 25 to 50 basis points. |
| |
| • | Increase in pays per control of 2.5%. |
| |
| • | PEO average Worksite Employee growth of 8% to 9%, compared to our prior forecast of 7% to 8%. |
| |
| • | PEO revenue growth of 8% to 9%, compared to prior forecast of 7% to 9%. |
| |
| • | PEO revenue growth excluding zero-margin benefits pass-throughs of 6% to 7%, compared to prior forecast of 5% to 7%. |
| |
| • | PEO margins down 50 to 25 basis points, compared to prior forecast of down 75 to 50 basis points. This forecast reflects approximately 50 basis points of anticipated grow-over pressure related to fiscal 2018 worker’s compensation reserve reductions at ADP Indemnity. |
Client Funds Extended Investment Strategy Fiscal 2019 Forecast
The interest assumptions in our forecasts are based on Fed Funds futures contracts and forward yield curves as of October 30, 2018. The Fed Funds futures contracts used in the client short and corporate cash interest income forecasts assume increases in the Fed Funds rate in December 2018 and March 2019. The three-and-a-half and five-year U.S. government agency rates based on the forward yield curves as of October 30, 2018 were used to forecast new purchase rates for the client and corporate extended, and client long portfolios, respectively.
| |
| • | Interest on funds held for clients up $90 to $100 million, compared to prior forecast of up $80 to $90 million. This is based on anticipated growth in average client funds balances of 3% to 4% from $24.3 billion in fiscal 2018, and an average yield which is anticipated to increase about 30 basis points to 2.2% compared to the fiscal 2018 average yield of 1.9%. |
| |
| • | Total contribution from the client funds extended investment strategy up $70 to $80 million, compared to prior forecast of up $60 to $70 million. |
Fiscal 2019 Outlook History
| |
| a. | Forecast contemplates the impact of prior fiscal year acquisitions and anticipated impact of current year acquisition of Celergo and foreign currency in revenue and operating results. |
Investor Webcast Today
As previously announced, ADP will host a conference call for financial analysts today, Wednesday, October 31, 2018 at 8:30 a.m. ET. The conference call will be webcast live on ADP’s website at investors.adp.com and will be available for replay following the call. A slide presentation accompanying the webcast is also available at investors.adp.com/events-and-presentations.
Supplemental financial information including schedules of quarterly and full year reportable segment revenues and earnings for fiscal years 2017 and 2018, as well as quarterly details of the fiscal 2019 results from the client funds extended investment strategy, are posted to ADP’s website at investors.adp.com. ADP news releases, current financial information, SEC filings and Investor Relations presentations are accessible at the same website.
About ADP (Nasdaq: ADP)
Powerful technology plus a human touch. Companies of all types and sizes around the world rely on ADP’s cloud software and expert insights to help unlock the potential of their people. HR. Talent. Benefits. Payroll. Compliance. Working together to build a better workforce. For more information, visit ADP.com.
|
| | | | | | | | | | | |
| Automatic Data Processing, Inc. and Subsidiaries |
| Statements of Consolidated Earnings |
| (In millions, except per share amounts) |
| (Unaudited) |
| | | | | | Three Months Ended |
| | | | | | September 30, |
| | | | | | 2018 | | 2017 |
| Revenues: | | | | |
| | | Revenues, other than interest on funds held for clients and PEO revenues | | $ | 2,218.6 |
| | $ | 2,078.9 |
|
| | | Interest on funds held for clients | | 118.5 |
| | 99.4 |
|
| | | PEO revenues (A) (B) (C) | | 986.1 |
| | 898.9 |
|
| | | | Total revenues | | 3,323.2 |
| | 3,077.2 |
|
| | | | | | | | |
| Expenses: | | | | |
| | Costs of revenues: | | | | |
| | | Operating expenses (B) (C) | | 1,709.9 |
| | 1,630.7 |
|
| | | Systems development and programming costs | | 158.0 |
| | 158.2 |
|
| | | Depreciation and amortization | | 72.6 |
| | 62.6 |
|
| | | | Total costs of revenues | | 1,940.5 |
| | 1,851.5 |
|
| | | | | | | | |
| | Selling, general and administrative expenses | | 713.9 |
| | 675.4 |
|
| | Interest expense | | 35.9 |
| | 28.0 |
|
| | | | Total expenses | | 2,690.3 |
| | 2,554.9 |
|
| | | | | | | | |
| | Other income, net | | (13.9 | ) | | (42.6 | ) |
| | | | | | | | |
| Earnings before income taxes | | 646.8 |
| | 564.9 |
|
| | | | | | | | |
| | Provision for income taxes | | 141.4 |
| | 152.3 |
|
| | | | | | | | |
| Net earnings | | $ | 505.4 |
| | $ | 412.6 |
|
| | | | | | | | |
| | Basic earnings per share | | $ | 1.16 |
| | $ | 0.93 |
|
| | | | | | | | |
| | Diluted earnings per share | | $ | 1.15 |
| | $ | 0.93 |
|
| | | | | | | | |
| | Dividends declared per common share | | $ | 0.69 |
| | $ | 0.57 |
|
| | | | | | | | |
| Components of Other income, net: | | | | |
| | Interest income on corporate funds | | $ | (28.5 | ) | | $ | (25.8 | ) |
| | Realized gains on available-for-sale securities | | (0.4 | ) | | (0.3 | ) |
| | Realized losses on available-for-sale securities | | 1.3 |
| | 0.3 |
|
| | Impairment of intangible assets | | 12.1 |
| | — |
|
| | Gain on sale of assets | | — |
| | (0.4 | ) |
| | Non-service components of pension expense, net (D) | | 1.6 |
| | (16.4 | ) |
| | Other income, net | | $ | (13.9 | ) | | $ | (42.6 | ) |
(A) Professional Employer Organization (“PEO”) revenues are net of direct pass-through costs, primarily consisting of payroll wages and payroll taxes of $9,629.4 million and $8,738.5 million for the three months ended September 30, 2018 and 2017, respectively.
(B) PEO revenues and operating expenses include benefits pass-through costs of $653.4 million and $595.3 million for the three months ended September 30, 2018 and 2017, respectively.
(C) PEO revenues and operating expenses include costs related to workers' compensation coverage and state unemployment taxes for worksite employees of $89.5 million and $91.2 million for the three months ended September 30, 2018 and 2017, respectively.
(D) The charges within non-service components of pension expense, net include $14.0 million of non-cash settlement charges and $1.3 million of special termination benefits related to the Voluntary Early Retirement Program ("VERP"), partially offset by $13.7 million related to other components of net periodic pension cost.
|
| | | | | | | |
| Automatic Data Processing, Inc. and Subsidiaries | | | |
| Consolidated Balance Sheets | | | |
| (In millions) | | | |
| (Unaudited) | | | |
| | September 30, | | June 30, |
| | 2018 | | 2018 |
| Assets | | | |
| Current assets: | | | |
| Cash and cash equivalents | $ | 1,490.3 |
| | $ | 2,170.0 |
|
| Accounts receivable, net of allowance for doubtful accounts of $52.2 and $51.3, respectively | 2,216.4 |
| | 1,984.2 |
|
| Other current assets | 846.5 |
| | 531.3 |
|
| Total current assets before funds held for clients | 4,553.2 |
| | 4,685.5 |
|
| Funds held for clients | 25,402.7 |
| | 27,137.8 |
|
| Total current assets | 29,955.9 |
| | 31,823.3 |
|
| Long-term receivables, net of allowance for doubtful accounts of $0.6 and $0.5, respectively | 25.2 |
| | 25.5 |
|
| Property, plant and equipment, net | 787.7 |
| | 793.7 |
|
| Deferred contract costs | 2,352.3 |
| | 2,377.4 |
|
| Other assets | 1,053.4 |
| | 699.3 |
|
| Goodwill | 2,325.0 |
| | 2,243.5 |
|
| Intangible assets, net | 917.2 |
| | 886.4 |
|
| Total assets | $ | 37,416.7 |
| | $ | 38,849.1 |
|
| | | | |
| Liabilities and Stockholders' Equity | | | |
| Current liabilities: | | | |
| Accounts payable | $ | 131.8 |
| | $ | 135.4 |
|
| Accrued expenses and other current liabilities | 1,603.5 |
| | 1,547.6 |
|
| Accrued payroll and payroll-related expenses | 446.9 |
| | 667.7 |
|
| Dividends payable | 298.8 |
| | 298.9 |
|
| Short-term deferred revenues | 229.0 |
| | 225.7 |
|
| Obligations under reverse repurchase agreements (A) | 453.0 |
| | — |
|
| Income taxes payable | 75.4 |
| | 43.9 |
|
| Total current liabilities before client funds obligations | 3,238.4 |
| | 2,919.2 |
|
| Client funds obligations | 25,798.9 |
| | 27,493.5 |
|
| Total current liabilities | 29,037.3 |
| | 30,412.7 |
|
| Long-term debt | 2,002.4 |
| | 2,002.4 |
|
| Other liabilities | 736.4 |
| | 728.0 |
|
| Deferred income taxes | 533.2 |
| | 522.0 |
|
| Long-term deferred revenues | 428.6 |
| | 448.1 |
|
| Total liabilities | 32,737.9 |
| | 34,113.2 |
|
| | | | |
| Stockholders' equity: | | | |
| Preferred stock, $1.00 par value: authorized, 0.3 shares; issued, none | — |
| | — |
|
| Common stock, $0.10 par value: authorized, 1,000.0 shares; issued, 638.7 shares at September 30, 2018 and June 30, 2018; outstanding, 438.2 and 438.8 shares at September 30, 2018 and June 30, 2018, respectively | 63.9 |
| | 63.9 |
|
| Capital in excess of par value | 1,035.1 |
| | 1,014.8 |
|
| Retained earnings | 16,741.1 |
| | 16,546.6 |
|
| Treasury stock - at cost: 200.5 and 199.9 shares at September 30, 2018 and June 30, 2018, respectively | (12,421.2 | ) | | (12,209.6 | ) |
| Accumulated other comprehensive loss | (740.1 | ) | | (679.8 | ) |
| Total stockholders’ equity | 4,678.8 |
| | 4,735.9 |
|
| Total liabilities and stockholders’ equity | $ | 37,416.7 |
| | $ | 38,849.1 |
|
(A) As of September 30, 2018, $123.8 million of short-term marketable securities, $328.6 million of long-term marketable securities and $0.6 million of cash and cash equivalents have been pledged as collateral under the Company's reverse repurchase agreements.
|
| | | | | | | |
| Automatic Data Processing, Inc. and Subsidiaries | | | |
| Statements of Consolidated Cash Flows | | | |
| (In millions) | | | |
| (Unaudited) | Three Months Ended |
| | September 30, |
| | 2018 | | 2017 |
| Cash Flows from Operating Activities: | | | |
| Net earnings | $ | 505.4 |
| | $ | 412.6 |
|
| Adjustments to reconcile net earnings to cash flows provided by operating activities: | | | |
| Depreciation and amortization | 99.0 |
| | 87.2 |
|
| Amortization of deferred contract costs | 216.9 |
| | 204.7 |
|
| Deferred income taxes | 26.4 |
| | 55.4 |
|
| Stock-based compensation expense | 38.4 |
| | 39.0 |
|
| Net pension expense | 17.1 |
| | 2.7 |
|
| Net amortization of premiums and accretion of discounts on available-for-sale securities | 14.3 |
| | 19.4 |
|
| Impairment of intangible assets | 12.1 |
| | — |
|
| Other | 10.1 |
| | 9.6 |
|
| Changes in operating assets and liabilities, net of effects from acquisitions: | | | |
| Increase in accounts receivable | (239.2 | ) | | (81.7 | ) |
| Increase in other assets | (471.2 | ) | | (460.7 | ) |
| Decrease in accounts payable | (2.3 | ) | | (24.5 | ) |
| Decrease in accrued expenses and other liabilities | (77.8 | ) | | (19.0 | ) |
| Net cash flows provided by operating activities | 149.2 |
| | 244.7 |
|
| | | | |
| Cash Flows from Investing Activities: | | | |
| Purchases of corporate and client funds marketable securities | (755.8 | ) | | (1,157.3 | ) |
| Proceeds from the sales and maturities of corporate and client funds marketable securities | 539.8 |
| | 1,007.7 |
|
| Capital expenditures | (43.2 | ) | | (73.3 | ) |
| Additions to intangibles | (73.8 | ) | | (69.7 | ) |
| Acquisitions of businesses, net of cash acquired | (119.7 | ) | | — |
|
| Net cash flows used in investing activities | (452.7 | ) | | (292.6 | ) |
| | | | |
| Cash Flows from Financing Activities: | | | |
| Net decrease in client funds obligations | (1,711.5 | ) | | (1,674.3 | ) |
| Payments of debt | (0.5 | ) | | (0.9 | ) |
| Repurchases of common stock | (227.1 | ) | | (250.1 | ) |
| Net proceeds from stock purchase plan and stock-based compensation plans | (24.4 | ) | | (15.1 | ) |
| Dividends paid | (302.6 | ) | | (253.7 | ) |
| Net proceeds from reverse repurchase agreements | 448.4 |
| | 129.4 |
|
| Net cash flows used in financing activities | (1,817.7 | ) | | (2,064.7 | ) |
| | | | |
| Effect of exchange rate changes on cash, cash equivalents, restricted cash, and restricted cash equivalents | (12.6 | ) | | 14.2 |
|
| | | | |
| Net change in cash, cash equivalents, restricted cash, and restricted cash equivalents | (2,133.8 | ) | | (2,098.4 | ) |
| | | | |
| Cash, cash equivalents, restricted cash, and restricted cash equivalents, beginning of period | 6,542.1 |
| | 8,181.6 |
|
| Cash, cash equivalents, restricted cash, and restricted cash equivalents, end of period | $ | 4,408.3 |
| | $ | 6,083.2 |
|
| | | | |
| Reconciliation of cash, cash equivalents, restricted cash, and restricted cash equivalents to the Consolidated Balance Sheets | | | |
| Cash and cash equivalents | 1,490.3 |
| | 2,363.6 |
|
| Restricted cash and restricted cash equivalents included in funds held for clients | 2,918.0 |
| | 3,719.6 |
|
| Total cash, cash equivalents, restricted cash, and restricted cash equivalents | $ | 4,408.3 |
| | $ | 6,083.2 |
|
| | | | |
| Supplemental disclosures of cash flow information: | | | |
| Cash paid for interest | $ | 49.4 |
| | $ | 41.4 |
|
| Cash paid for income taxes, net of income tax refunds | $ | 39.3 |
| | $ | 41.9 |
|
|
| | | | | | | | | | |
| Automatic Data Processing, Inc. and Subsidiaries | | | | | |
| Other Selected Financial Data | | | | | |
| (Dollars in millions, except per share amounts) | | | | | |
| (Unaudited) | Three Months Ended | | |
| | September 30, | | |
| | 2018 | | 2017 | | % Change |
| Revenues | | | | | |
| Employer Services | $ | 2,338.2 |
| | $ | 2,179.4 |
| | 7 | % |
| PEO Services | 987.8 |
| | 899.8 |
| | 10 | % |
| Other | (2.8 | ) | | (2.0 | ) | | n/m |
|
| Total revenues | $ | 3,323.2 |
| | $ | 3,077.2 |
| | 8 | % |
| | | | | | |
| Segment earnings | | | | | |
| Employer Services | $ | 637.6 |
| | $ | 537.2 |
| | 19 | % |
| PEO Services | 145.9 |
| | 123.3 |
| | 18 | % |
| Other | (136.7 | ) | | (95.6 | ) | | n/m |
|
| Total pretax earnings | $ | 646.8 |
| | $ | 564.9 |
| | 14 | % |
| | | | | | |
| | | | | | |
| | Three Months Ended | | |
| | September 30, | | |
| Segment margin | 2018 | | 2017 | | % Change |
| Employer Services | 27.3 | % | | 24.7 | % | | 2.6 | % |
| PEO Services | 14.8 | % | | 13.7 | % | | 1.1 | % |
| Other | n/m |
| | n/m |
| | n/m |
|
| Total pretax margin | 19.5 | % | | 18.4 | % | | 1.1 | % |
| | | | | | |
| | | | |
| | Three Months Ended | | |
| | September 30, | | |
| Earnings per share information: | 2018 | | 2017 | | % Change |
| Net earnings | $ | 505.4 |
| | $ | 412.6 |
| | 22 | % |
| | | | | | |
| Basic weighted average shares outstanding | 436.8 |
| | 442.2 |
| | (1 | )% |
| Basic earnings per share | $ | 1.16 |
| | $ | 0.93 |
| | 25 | % |
| | | | | | |
| Diluted weighted average shares outstanding | 439.9 |
| | 445.0 |
| | (1 | )% |
| Diluted earnings per share | $ | 1.15 |
| | $ | 0.93 |
| | 24 | % |
| | | | | | |
| | | | | | |
| | Three Months Ended | | |
| | September 30, | | |
| | 2018 | | 2017 | | |
| Key Statistics: | | | | | |
| Employer Services: | | | | | |
| Change in pays per control - U.S. (A) | 2.4 | % | | 2.4 | % | | |
| Employer Services New Business Bookings growth | 8 | % | | (3 | )% | | |
| | | | | | |
| PEO Services: | | | | | |
| Paid PEO worksite employees at end of period | 532,000 |
| | 486,000 |
| | |
| Average paid PEO worksite employees during the period | 528,000 |
| | 484,000 |
| | |
| Significant PEO expenses included within Operating expenses | | | | | |
| Benefits pass-through costs | $ | 653.4 |
| | $ | 595.3 |
| | |
| Worker's compensation and state unemployment taxes | $ | 89.5 |
| | $ | 91.2 |
| | |
| | | | | | |
| (A) Pays per control represents the number of employees on ADP clients' payrolls in the United States when measured on a same-store-sales basis for a subset of clients ranging from small to large businesses. |
|
| | | | | | | | | | | | | | | |
| Automatic Data Processing, Inc. and Subsidiaries | |
| Other Selected Financial Data, Continued | |
| (Dollars in millions, except per share amounts or where otherwise stated) | |
| (Unaudited) | | | | | | |
| | Three Months Ended | | | | | |
| | September 30, | | | | | |
| | 2018 | | 2017 | | Change | | % Change | |
| Average investment balances at cost (in billions): | | | | | | | | |
| Corporate, other than corporate extended | $ | 1.7 |
| | $ | 2.3 |
| | $ | (0.6 | ) | | (25 | )% | |
| Corporate extended | 4.2 |
| | 4.3 |
| | (0.1 | ) | | (3 | )% | |
| Total corporate | 5.9 |
| | 6.6 |
| | (0.7 | ) | | (11 | )% | |
| Funds held for clients | 22.2 |
| | 21.2 |
| | 1.0 |
| | 5 | % | |
| Total | $ | 28.1 |
| | $ | 27.8 |
| | $ | 0.3 |
| | 1 | % | |
| | | | | | | | | |
| Average interest rates earned exclusive of realized losses (gains) on: | | | | | | | | |
| Corporate, other than corporate extended | 1.8 | % | | 1.1 | % | | | | | |
| Corporate extended | 2.0 | % | | 1.8 | % | | | | | |
| Total corporate | 1.9 | % | | 1.6 | % | | | | | |
| Funds held for clients | 2.1 | % | | 1.9 | % | | | | | |
| Total | 2.1 | % | | 1.8 | % | | | | | |
| | | | | | | | | |
| Net unrealized (loss)/gain position at end of period | $ | (405.2 | ) | | $ | 89.6 |
| | | | | |
| | | | | | | | | |
| Average short-term financing (in billions): | | | | | | | | |
| U.S. commercial paper borrowings | $ | 3.7 |
| | $ | 3.8 |
| | | | | |
| U.S., Canadian & U.K. reverse repurchase agreement borrowings | 0.5 |
| | 0.5 |
| | | | | |
| | $ | 4.2 |
| | $ | 4.3 |
| | | | | |
| | | | | | | | | |
| Average interest rates paid on: | | | | | | | | |
| U.S. commercial paper borrowings | 2.0 | % | | 1.2 | % | | | | | |
| U.S., Canadian & U.K. reverse repurchase agreement borrowings | 1.7 | % | | 1.1 | % | | | | | |
| | | | | |
| | | |
| Interest on funds held for clients | $ | 118.5 |
| | $ | 99.4 |
| | $ | 19.2 |
| | 19 | % | |
| Corporate extended interest income (A) | 20.9 |
| | 19.6 |
| | 1.3 |
| | 7 | % | |
| Corporate interest expense-short-term financing (A) | (20.9 | ) | | (13.0 | ) | | (7.9 | ) | | (60 | )% | |
| Net Impact from Client Fund Strategy | $ | 118.6 |
| | $ | 105.9 |
| | $ | 12.7 |
| | 12 | % | |
| | | | | | | | | |
(A) While “Corporate extended interest income” and “Corporate interest expense-short-term financing,” related to our client funds investment strategy, are non-GAAP measures, management believes this information is beneficial to reviewing the financial statements of ADP. Management believes this information is beneficial as it allows the reader to understand the extended investment strategy for ADP's client funds assets, corporate investments, and short-term borrowings. A reconciliation of the non-GAAP measures to GAAP measures is as follows:
|
| | | | | | | |
| | Three Months Ended |
| | September 30, |
| | 2018 | | 2017 |
| Corporate extended interest income | $ | 20.9 |
| | $ | 19.6 |
|
| All other interest income | 7.6 |
| | 6.3 |
|
| Total interest income on corporate funds | $ | 28.5 |
| | $ | 25.8 |
|
| | | | |
| Corporate interest expense-short-term financing | $ | 20.9 |
| | $ | 13.0 |
|
| All other interest expense | 15.0 |
| | 15.0 |
|
| Total interest expense | $ | 35.9 |
| | $ | 28.0 |
|
|
| | | | | | | | | | | | | | | | |
| Automatic Data Processing, Inc. and Subsidiaries | | |
| Consolidated Statement of Adjusted / Non-GAAP Financial Information | | |
| (in millions, except per share amounts) | | |
| (Unaudited) | | |
| | | | | | | | | | | | | | | | | |
| In addition to our GAAP results, we use the adjusted results and other non-GAAP metrics set forth in the table below to evaluate our operating performance in the absence of certain items and for planning and forecasting of future periods: |
| | | | | | | | | | | | | | | | | |
| Adjusted Financial Measure | U.S. GAAP Measures |
| Adjusted EBIT | Net earnings |
| Adjusted provision for income taxes | Provision for income taxes |
| Adjusted net earnings | Net earnings |
| Adjusted diluted earnings per share | Diluted earnings per share |
| Adjusted effective tax rate | Effective tax rate |
| Constant Currency Basis | U.S. GAAP P&L line items |
| Organic constant currency (see footnote "h") | Revenues |
| Corporate extended interest income (see prior page) | Interest income |
| Corporate interest expense-short-term financing (see prior page) | Interest expense |
| | | | | | | | | | | | | |
| We believe that the exclusion of the identified items below helps us reflect the fundamentals of our underlying business model and analyze results against our expectations and against prior period, and to plan for future periods by focusing on our underlying operations. We believe that the adjusted results provide relevant and useful information for investors because it allows investors to view performance in a manner similar to the method used by management and improves their ability to understand and assess our operating performance. The nature of these exclusions are for specific items that are not fundamental to our underlying business operations. Since these adjusted financial measures and other non-GAAP metrics are not measures of performance calculated in accordance with U.S. GAAP, they should not be considered in isolation from, as a substitute for, or superior to their corresponding U.S. GAAP measures, and they may not be comparable to similarly titled measures at other companies. |
|
| | | | | | | | | | | | | | |
| | | Three Months Ended | | | | |
| | | September 30, | | % Change |
| | | 2018 | | 2017 | | As Reported | | Constant Currency Basis (g) |
| Net earnings | | $ | 505.4 |
| | $ | 412.6 |
| | 22 | % | | 22 | % |
| Adjustments: | | | | | | | | |
| Provision for income taxes | | 141.4 |
| | 152.3 |
| | | | |
| All other interest expense (a) | | 15.0 |
| | 15.0 |
| | | | |
| All other interest income (a) | | (7.6 | ) | | (6.3 | ) | | | | |
| Transformation initiatives (b) | | 32.5 |
| | (3.3 | ) | | | | |
| Proxy contest matters (c) | | — |
| | 10.5 |
| | | | |
| Adjusted EBIT | | $ | 686.7 |
| | $ | 580.8 |
| | 18 | % | | 18 | % |
| Adjusted EBIT Margin | | 20.7 | % | | 18.9 | % | | | | |
| | | | | | | | | |
| Provision for income taxes | | $ | 141.4 |
| | $ | 152.3 |
| | (7 | )% | | (8 | )% |
| Adjustments: | | | | | | | | |
| Income tax benefit/(provision) for transformation initiatives (d) | | 8.0 |
| | (1.3 | ) | | | | |
| Income tax benefit for proxy contest matters (d) | | — |
| | 4.1 |
| | | | |
| Tax Cuts and Jobs Act (e) | | 1.1 |
| | — |
| | | | |
| Adjusted provision for income taxes | | $ | 150.5 |
| | $ | 155.1 |
| | (3 | )% | | (3 | )% |
| Adjusted effective tax rate (f) | | 22.2 | % | | 27.1 | % | | | | |
| | | | | | | | | |
| Net earnings | | $ | 505.4 |
| | $ | 412.6 |
| | 22 | % | | 22 | % |
| Adjustments: | | | | | | | | |
| Transformation initiatives (b) | | 32.5 |
| | (3.3 | ) | | | | |
| Income tax benefit/(provision) for transformation initiatives (d) | | (8.0 | ) | | 1.3 |
| | | | |
| Proxy contest matters (c) | | — |
| | 10.5 |
| | | | |
| Income tax benefit for proxy contest matters (d) | | — |
| | (4.1 | ) | | | | |
| Tax Cuts and Jobs Act (e) | | (1.1 | ) | | — |
| | | | |
| Adjusted net earnings | | $ | 528.8 |
| | $ | 417.0 |
| | 27 | % | | 26 | % |
| | | | | | | | | |
| Diluted EPS | | $ | 1.15 |
| | $ | 0.93 |
| | 24 | % | | 24 | % |
| Adjustments: | | | | | | | | |
| Transformation initiatives (b) (d) | | 0.06 |
| | — |
| | | | |
| Proxy contest matters (c) (d) | | — |
| | 0.01 |
| | | | |
| Tax Cuts and Jobs Act (e) | | — |
| | — |
| | | | |
| Adjusted diluted EPS | | $ | 1.20 |
| | $ | 0.94 |
| | 28 | % | | 28 | % |
|
| | | | | | | | |
| (a) We continue to include the interest income earned on investments associated with our client funds extended investment strategy and interest expense on borrowings related to our client funds extended investment strategy as we believe these amounts to be fundamental to the underlying operations of our business model. The adjustments in the table above represent the interest income and interest expense that is not related to our client funds extended investment strategy and are labeled as "All other interest expense" and "All other interest income." |
| | | | | | | | | |
| (b) The charges within transformation initiatives are comprised of charges for our Voluntary Early Retirement Program ("VERP"), Service Alignment Initiative and other transformation initiatives. Charges related to our VERP in the three months ended September 30, 2018 include $14.0 million for a non-cash pension settlement charge, $1.3 million of charges for special termination benefits included within Other income, net and $9.3 million of expenses related to the continuing health coverage included within selling, general and administrative expenses. Also, within selling, general and administrative expenses we recorded charges of $12.3 million related to our other transformation initiatives, partially offset by net reversals of charges related to our Service Alignment Initiative of $4.4 million. Unlike other severance charges which are not included as an adjustment to get to adjusted results, these specific charges relate to actions that are part of our broad-based, company-wide transformation initiative. |
| | | | | | | | | |
| (c) Represents non-operational costs relating to proxy contest matters included within Selling, general and administrative expenses. |
| | | | | | | | | |
| (d) The tax benefit/provision on the transformation initiatives and non-operational charges related to proxy contest matters was calculated based on the annualized marginal rate in effect during the quarter of the adjustment. |
| | | | | | | | | |
| (e) The net benefit from the enactment of the Tax Cuts and Jobs Act is comprised of a one-time transition tax on the earnings and profits of our foreign subsidiaries, and the recording of a valuation allowance against our foreign tax credits which may not be realized. |
| | | | | | | | | |
| (f) The Adjusted effective tax rate is calculated as our Adjusted provision for income taxes divided by our Adjusted net earnings plus our Adjusted provision for income taxes. |
| | | | | | | | | |
| (g) "Constant currency basis" provides information that isolates the actual growth of our operations and is determined by calculating the current year result using foreign exchange rates consistent with the prior year. |
| | | | | | | | | |
| (h) The following table reconciles our reported growth rates to the non-GAAP measure of organic revenue, which excludes the impact of acquisitions, the impact of dispositions, and the impact of foreign currency. The impact of acquisitions and dispositions is calculated by excluding the current year revenues of acquisitions until the one year anniversary of the transaction and by excluding the prior year revenues of divestitures for the one year period preceding the transaction. The impact of foreign currency is determined by calculating the current year result using foreign exchange rates consistent with the prior year. The PEO segment is not impacted by acquisitions, dispositions or foreign currency. |
|
| | | | | | |
| | | Three Months Ended |
| | | September 30, |
| Revenue growth consolidated: | | 2018 | | 2017 |
| | | | | |
| Employer Services | | 7 | % | | 2 | % |
| PEO Services | | 10 | % | | 13 | % |
| Consolidated revenue growth as reported | | 8 | % | | 5 | % |
| Adjustments: | | | | |
| Impact of acquisitions | | (1 | )% | | — | % |
| Impact of dispositions | | — | % | | 1 | % |
| Impact of foreign currency | | — | % | | — | % |
| Consolidated revenue growth, organic constant currency | | 7 | % | | 6 | % |
| | | | | |
| Segment: | | | | |
| | | | | |
| Employer Services revenue growth as reported | | 7 | % | | 2 | % |
| Adjustments: | | | | |
| Impact of acquisitions | | (2 | )% | | — | % |
| Impact of dispositions | | — | % | | 1 | % |
| Impact of foreign currency | | 1 | % | | (1) | % |
| Employer Services revenue growth, organic constant currency | | 6 | % | | 3 | % |
|
| | | | | | | | | | |
| Automatic Data Processing, Inc. and Subsidiaries |
| Fiscal 2018 to Fiscal 2019 Non-GAAP Guidance Reconciliation |
| (Unaudited) | | | | | |
| | | Fiscal 2018 | | Fiscal 2019 |
| | | As-adjusted (a) | | Forecast |
| Earnings before income taxes / margin (GAAP) | | $ | 2,282.6 |
| 17.1 | % | | 365 - 390 bps |
|
| All other interest expense (b) | | 59.4 |
| 45 bps |
| | (5) bps |
|
| All other interest income (b) | | (25.5) |
| (20) bps |
| | 5 bps |
|
| Proxy contest matters - F18 (c) | | 33.3 |
| 25 bps |
| | (25) bps |
|
| Transformation initiatives - F18 (d) | | 404.8 |
| 305 bps |
| | (305) bps |
|
| Transformation initiatives - F19 (d) | | - |
| - |
| | 70 bps |
|
| Adjusted EBIT margin (Non-GAAP) | | $ | 2,754.6 |
| 20.7 | % | | 100 - 125 bps |
|
| | | | | | |
| Effective tax rate (GAAP) | | | 17.4% |
| | 24.5 | % |
| Proxy contest matters - F18 (c) | | | 0.1% |
| | - |
|
| Transformation initiatives - F18 (d) | | | 1.3% |
| | - |
|
| Tax Cuts and Jobs Act - F18 (e) | | | 7.4% |
| | - |
|
| Transformation initiatives - F19 (d) | | | - |
| | - |
|
| Tax Cuts and Jobs Act - F19 (e) | | | - |
| | - |
|
| Adjusted effective tax rate (Non-GAAP) | | | 26.2% |
| | 24.5 | % |
| | | | | | |
| Diluted earnings per share (GAAP) | | | $ | 4.25 |
| | 18% - 20% |
|
| Proxy contest matters - F18 (c) | | | 0.05 |
| | ~ (1%) |
|
| Transformation initiatives - F18 (d) | | | 0.64 |
| | ~ (15%) |
|
| Tax Cuts and Jobs Act - F18 (e) | | | (0.41 | ) | | ~ 9% |
|
| Transformation initiatives - F19 (d) | | | - |
| | ~ 4% |
|
| Tax Cuts and Jobs Act - F19 (e) | | | | | - |
|
| Adjusted diluted earnings per share (Non-GAAP) | | | $ | 4.53 |
| | 15 - 17% |
|
| | | | | | |
| a) As-adjusted financials reflect the impact of ASC 606 on prior year results. See included bridge. |
| b) We continue to include the interest income earned on investments associated with our client funds extended investment strategy and interest expense on borrowings related to our client funds extended investment strategy as we believe these amounts to be fundamental to the underlying operations of our business model. These adjustments in the table above represent the interest income and interest expense that is not related to our client funds extended investment strategy and are labeled as “All other interest expense” and “All other interest income.” |
| c) Impact of fiscal 2018 charges in connection with proxy contest matters. |
| d) We recorded a charge of $404.8 million related to transformation initiatives in fiscal 2018. The charges within transformation initiatives in fiscal 2018 includes $319.6 million related to the special termination benefit charges and $17.5 million of other charges related to our Voluntary Early Retirement Program ("VERP"), severance charges related to our Service Alignment Initiative of $20.5 million, and other transformation initiatives of $47.2 million which primarily consist of severance charges totaling $41.9 million for fiscal 2018. Unlike other severance charges which are not included as an adjustment to get to adjusted results, these specific charges relate to actions that are part of our broad-based, company-wide transformation initiative. Expected fiscal 2019 charges within transformation initiatives represent expected severance and other one-time charges related to our Service Alignment Initiative and other transformation initiatives. |
| e) The one-time net benefit from the enactment of the Tax Cuts and Jobs Act is comprised of application of the newly enacted rates to our U.S. deferred tax balances, partially offset by foreign withholding taxes on future distributions, the one-time transition tax and the recording of a valuation allowance against our foreign tax credits which may not be realized. |
|
| | | | | | | | | | | | | | | | | | | | | | | | | | | | | | | | | | | | | | | | | | | | | | |
| Automatic Data Processing, Inc. and Subsidiaries | | | | | | | | | | | | | | | | | | | | | |
| As-adjusted / Non-GAAP Financial Information | | | | | | | | | | | | | | | | | | | | | |
| (in millions, except per share amounts) | | | | | | | | | | | | | | | | | | | | | |
| (Unaudited) | | | | | | | | | | | | | | | | | | | | | |
| | | | Q1 FY2018 | | | Q2 FY2018 | | | Q3 FY2018 | | | Q4 FY2018 | | | FY2018 |
| | | | As Reported | ASC 606 Adj. | Other Adj. (a) | As Adjusted | | | As Reported | ASC 606 Adj. | Other Adj. (a) | As Adjusted | | | As Reported | ASC 606 Adj. | Other Adj. (a) | As Adjusted | | | As Reported | ASC 606 Adj. | Other Adj. (a) | As Adjusted | | | As Reported | ASC 606 Adj. | Other Adj. (a) | As Adjusted |
| Segment Revenues | | | | | | | | | | | | | | | | | | | | | | | | | | | | |
| | Employer Services | 2,316.3 | (2.0) | (134.9) | 2,179.4 | | | 2,437.6 | 1.5 | (141.3) | 2,297.8 | | | 2,804.1 | 2.4 | (178.0) | 2,628.5 | | | 2,499.7 | (3.6) | (147.1) | 2,349.0 | | | 10,057.8 | (1.7) | (601.3) | 9,454.8 |
| | PEO Services | 903.6 | 0.4 | (4.2) | 899.8 | | | 945.3 | 1.4 | (4.3) | 942.4 | | | 1,071.1 | 0.6 | (4.4) | 1,067.3 | | | 976.7 | 1.2 | (5.0) | 972.9 | | | 3,896.6 | 3.6 | (17.9) | 3,882.3 |
| | Other | (141.1) | — |
| 139.1 | (2.0) | | | (147.5) | — |
| 145.6 | (1.9) | | | (182.2) | — |
| 182.4 |
| 0.2 | | | (157.8) | — |
| 152.1 | (5.7) | | | (628.6) | — |
| 619.2 | (9.4) |
| Segment Earnings | | | | | | | | | | | | | | | | | | | | | | | | | | | | |
| | Employer Services | 646.6 | 20.2 | (129.6) | 537.2 | | | 706.4 | 20.7 | (146.0) | 581.1 | | | 1,022.5 | 19.0 | (171.4) | 870.1 | | | 711.9 | 42.3 | (144.5) | 609.7 | | | 3,087.4 | 102.2 | (591.5) | 2,598.1 |
| | PEO Services | 116.8 | (3.5) | 10.0 | 123.3 | | | 128.2 | 1.2 | 3.8 | 133.2 | | | 136.3 | 3.6 | 7.2 | 147.1 | | | 122.9 | 8.1 | 10.0 | 141.0 | | | 504.2 | 9.3 | 31.1 | 544.6 |
| | Other | (215.2) | — |
| 119.6 | (95.6) | | | (268.9) | — |
| 142.2 | (126.7) | | | (306.2) | — |
| 164.2 | (142.0) | | | (630.3) | — |
| 134.5 | (495.8) | | | (1,420.5) | — |
| 560.4 | (860.1) |
| Segment Margin | | | | | | | | | |
| | | | | | | | | | | | | | | | | | |
| | Employer Services | 27.9 | % | | | 24.7 | % | | | 29.0 | % | | | 25.3 | % | | | 36.5 | % | | | 33.1 | % | | | 28.5 | % | | | 26.0 | % | | | 30.7 | % | | | 27.5 | % |
| | PEO Services | 12.9 | % | | | 13.7 | % | | | 13.6 | % | | | 14.1 | % | | | 12.7 | % | | | 13.8 | % | | | 12.6 | % | | | 14.5 | % | | | 12.9 | % | | | 14.0 | % |
| | | | | | | | | | | |
|
| | | | | | | | | | | | | | | | | | |
| Segment Revenue Growth | | | | | | | | | |
| | | | | | | | | | | | | | | | | | |
| | Employer Services, as reported | 2 | % | | | 2 | % | | | 6 | % | | | 6 | % | | | 7 | % | | | 8 | % | | | 7 | % | | | 8 | % | | | 5 | % | | | 6 | % |
| | Adjustments: | | | | | | | | | | | | | | | | | | | | | | | | | | | | |
| | | Impact of acquisitions | — | % | | | — | % | | | (1 | )% | | | (1 | )% | | | (1 | )% | | | (1 | )% | | | (1 | )% | | | (2 | )% | | | (1 | )% | | | (1 | )% |
| | | Impact of dispositions | 1 | % | | | 1 | % | | | 1 | % | | | 1 | % | | | — | % | | | — | % | | | — | % | | | — | % | | | — | % | | | — | % |
| | | Impact of foreign currency | (1 | )% | | | (1 | )% | | | (1 | )% | | | (1 | )% | | | (2 | )% | | | (2 | )% | | | (1 | )% | | | (1 | )% | | | (1 | )% | | | (1 | )% |
| | Employer Services, organic constant currency | 3 | % | | | 3 | % | | | 4 | % | | | 4 | % | | | 4 | % | | | 5 | % | | | 4 | % | | | 5 | % | | | 4 | % | | | 4 | % |
| | PEO Services | 14 | % | | | 13 | % | | | 15 | % | | | 15 | % | | | 10 | % | | | 10 | % | | | 10 | % | | | 10 | % | | | 12 | % | | | 12 | % |
| | | | | | | | | | | | | | | | | | | | | | | | | | | | | | | |
| Other Segment metrics | | | | | | | | | | | | | | | | | | | | | | | | | | | | |
| | Employer Services Bookings Growth | | | | (3 | )% | | | | | | 5 | % | | | | | | 13 | % | | | | | | 19 | % | | | | | | 9 | % |
| | Employer Services New Business Bookings | | | |
| | | | | |
| | | | | |
| | | | | |
| | | | | $1.5 Billion | |
| | PEO benefits pass-through revenue | | | | 595.3 | | | | | | 607.1 | | | | | | 626.4 | | | | | | 634.4 | | | | | | 2,463.1 |
| | PEO revenue ex benefits pass-throughs | | | | 304.6 | | | | | | 335.3 | | | | | | 440.9 | | | | | | 338.5 | | | | | | 1,419.2 |
| | | | | | | | | | | | | | | | | | | | | | | | | | | | | | | |
| (a) Other adjustments include the inclusion of client fund interest in our segments at actual interest rates, the inclusion of ADP Indemnity in the PEO segment, and changes to certain corporate allocations. |
| Note: Numbers may not foot due to rounding. | | | | | | | | | | | | | | | | | | | | | | | | |
|
| | | | | | | | | | | | | | | | | | | | | | | | | | | | | | | | | | | | | | | | | | | | | | | | | | | | | | | | | | | | | | | | | | | | | | |
| | | | Q1 FY2018 | | | Q2 FY2018 | | | Q3 FY2018 | | | Q4 FY2018 | | | FY2018 |
| | | | As Reported | ASC 606 Adj. | ASU 2017-07 Adj. (a) | As Adjusted | | | As Reported | ASC 606 Adj. | ASU 2017-07 Adj. (a) | As Adjusted | | | As Reported | ASC 606 Adj. | ASU 2017-07 Adj. (a) | As Adjusted | | | As Reported | ASC 606 Adj. | ASU 2017-07 Adj. (a) | As Adjusted | | | As Reported | ASC 606 Adj. | ASU 2017-07 Adj. (a) | As Adjusted |
| Statement of Consolidated Earnings | | | | | | | | | | | | | | | | | | | | | | | | | | | | |
| | Revenues, other than interest on funds held for clients and PEO revenues | 2,080.9 | (2.0) | — |
| 2,078.9 | | | 2,188.8 | 1.5 | — |
| 2,190.3 | | | 2,492.9 | 2.3 | — |
| 2,495.2 | | | 2,222.5 | (3.6) | — |
| 2,218.9 | | | 8,985.2 | (1.8) | — |
| 8,983.4 |
| | Interest on funds held for clients | 99.4 | — |
| — |
| 99.4 | | | 106.7 | — |
| — |
| 106.7 | | | 134.8 | — |
| — |
| 134.8 | | | 125.6 | — |
| — |
| 125.6 | | | 466.5 | — |
| — |
| 466.5 |
| | PEO revenues | 898.5 | 0.4 | — |
| 898.9 | | | 939.9 | 1.4 | — |
| 941.3 | | | 1,065.3 | 0.6 | — |
| 1,065.9 | | | 970.5 | 1.1 | — |
| 971.6 | | | 3,874.1 | 3.5 | — |
| 3,877.6 |
| | | Total revenues | 3,078.8 | (1.6) | — |
| 3,077.2 | | | 3,235.4 | 2.9 | — |
| 3,238.3 | | | 3,693.0 | 2.9 | — |
| 3,695.9 | | | 3,318.6 | (2.5) | — |
| 3,316.1 | | | 13,325.8 | 1.7 | — |
| 13,327.5 |
| | | | | | | | | | | | | | | | | | | | | | | | | | | | | | | |
| | Operating expenses | 1,646.9 | (25.3) | 9.3 | 1,630.7 | | | 1,719.3 | (19.4) | 9.3 | 1,709.2 | | | 1,844.7 | (8.8) | 9.3 | 1,845.2 | | | 1,727.2 | (20.4) | 9.3 | 1,716.1 | | | 6,937.9 | (74.0) | 37.2 | 6,901.1 |
| | Systems development & programming costs | 156.9 | — |
| 1.3 | 158.2 | | | 158.1 | — |
| 1.3 | 159.4 | | | 162.5 | — |
| 1.3 | 163.9 | | | 152.6 | — |
| 1.3 | 153.9 | | | 630.2 | — |
| 5.2 | 635.4 |
| | Depreciation & amortization | 62.6 | — |
| — |
| 62.6 | | | 69.3 | — |
| — |
| 69.3 | | | 70.2 | — |
| — |
| 70.2 | | | 72.4 | — |
| — |
| 72.4 | | | 274.5 | — |
| — |
| 274.5 |
| | Selling, general & administrative expenses | 662.4 | 7.0 | 5.9 | 675.4 | | | 717.2 | 0.5 | 5.9 | 723.6 | | | 755.1 | (10.8) | 5.9 | 750.1 | | | 836.9 | (32.5) | 5.9 | 810.4 | | | 2,971.5 | (35.8) | 23.6 | 2,959.4 |
| | Interest expense | 28.0 | — |
| — |
| 28.0 | | | 27.5 | — |
| — |
| 27.5 | | | 18.6 | — |
| — |
| 18.6 | | | 28.5 | — |
| — |
| 28.5 | | | 102.7 | — |
| — |
| 102.7 |
| | | Total expenses | 2,556.8 | (18.3) | 16.5 | 2,554.9 | | | 2,691.4 | (18.9) | 16.5 | 2,689.0 | | | 2,851.1 | (19.6) | 16.5 | 2,848.0 | | | 2,817.6 | (52.9) | 16.5 | 2,781.3 | | | 10,916.8 | (109.8) | 66.0 | 10,873.1 |
| | | | | | | | | | | | | | | | | | | | | | | | | | | | | | | |
| | Other income, net | (26.2) | — |
| (16.5) | (42.6) | | | (21.7) | — |
| (16.5) | (38.2) | | | (10.7) | — |
| (16.5) | (27.2) | | | 296.5 | — |
| (16.5) | 280.0 | | | 237.9 | — |
| (66.0) | 171.9 |
| | Earnings before income taxes | 548.2 | 16.7 | — |
| 564.9 | | | 565.7 | 21.8 | — |
| 587.5 | | | 852.6 | 22.5 | — |
| 875.1 | | | 204.5 | 50.4 | — |
| 254.9 | | | 2,171.1 | 111.5 | — |
| 2,282.6 |
| | Provision for income taxes | 146.7 | 5.6 | — |
| 152.3 | | | 98.2 | (181.0) | — |
| (82.9) | | | 209.5 | 4.8 | — |
| 214.2 | | | 95.8 | 18.1 | — |
| 114.0 | | | 550.3 | (152.5) | — |
| 397.7 |
| | Net earnings | 401.5 | 11.1 | — |
| 412.6 | | | 467.5 | 202.8 | — |
| 670.4 | | | 643.1 | 17.7 | — |
| 660.9 | | | 108.7 | 32.3 | — |
| 141.0 | | | 1,620.8 | 264.0 | — |
| 1,884.9 |
| | | | | | | | | | | | | | | | | | | | | | | | | | | | | | |
| | Diluted earnings per share | $ | 0.90 |
| $ | 0.02 |
| $ | — |
| $ | 0.93 |
| | | $ | 1.05 |
| $ | 0.46 |
| $ | — |
| $ | 1.51 |
| | | $ | 1.45 |
| $ | 0.04 |
| $ | — |
| $ | 1.49 |
| | | $ | 0.25 |
| $ | 0.07 |
| $ | — |
| $ | 0.32 |
| | | $ | 3.66 |
| $ | 0.60 |
| $ | — |
| $ | 4.25 |
|
| | | | | | | | | | | | | | | | | | | | | | | | | | | | | | | |
| | Adjusted EBIT (b) | 564.1 | 16.7 | — |
| 580.8 | | | 602.5 | 21.8 | — |
| 624.3 | | | 901.0 | 22.5 | — |
| 923.5 | | | 575.6 | 50.4 | — |
| 626.0 | | | 2,643.1 | 111.5 | — |
| 2,754.6 |
| | | Adjusted EBIT Margin | 18.3 | % | | | 18.9 | % | | | 18.6 | % | | | 19.3 | % | | | 24.4 | % | | | 25.0 | % | | | 17.3 | % | | | 18.9 | % | | | 19.8 | % | | | 20.7 | % |
| | | | | | | | | | | | | | | | | | | | | | | | | | | | | | | |
| | Adjusted Provision for income taxes (b) | 149.5 | 5.6 | — |
| 155.1 | | | 151.5 | 5.9 | — |
| 157.4 | | | 216.4 | 3.0 | — |
| 219.3 | | | 163.8 | 17.8 | — |
| 181.5 | | | 681.1 | 32.5 | — |
| 713.6 |
| | | Adjusted Effective Tax Rate | 26.9 | % | 33.5 | % | — | % | 27.1 | % | | | 25.6 | % | 27.1 | % | — | % | 25.7 | % | | | 24.3 | % | 13.3 | % | — | % | 24.0 | % | | | 28.7 | % | 35.3 | % | — | % | 29.3 | % | | | 26.1 | % | 29.1 | % | — | % | 26.2 | % |
| | | | | | | | | | | | | | | | | | | | | | | | | | | | | | | |
| | Adjusted net earnings (b) | 405.9 | 11.1 | — |
| 416.9 | | | 440.4 | 15.9 | — |
| 456.2 | | | 675.9 | 19.5 | — |
| 695.5 | | | 406.0 | 32.6 | — |
| 438.7 | | | 1,928.1 | 79.0 | — |
| 2,007.1 |
| | Adjusted diluted earnings per share (b) | $ | 0.91 |
| $ | 0.02 |
| $ | — |
| $ | 0.94 |
| | | $ | 0.99 |
| $ | 0.04 |
| $ | — |
| $ | 1.03 |
| | | $ | 1.52 |
| $ | 0.04 |
| $ | — |
| $ | 1.57 |
| | | $ | 0.92 |
| $ | 0.07 |
| $ | — |
| $ | 0.99 |
| | | $ | 4.35 |
| $ | 0.18 |
| $ | — |
| $ | 4.53 |
|
| | | | | | | | | | | | | | | | | | | | | | | | | | | | | | | |
| (a) ASU 2017-17 has no impact on earnings, margin, or EPS. |
| (b) The items are non-GAAP financial measures. Please see the following table for a reconciliation to the closest financial GAAP measure. |
| Note: Numbers may not foot due to rounding. | | | | | | | | | | | | | | | | | | | | | | |
|
| | | | | | | | | | | | | | | | | | | | |
| Automatic Data Processing, Inc. and Subsidiaries | | |
| As Adjusted / Non-GAAP Financial Information | | |
| (in millions, except per share amounts) | | |
| (Unaudited) | | |
| | | | | | | | | | | |
| | | 1Q FY18 | | 2Q FY18 | | 3Q FY18 | | 4Q FY18 | | FY18 |
| As Adjusted Net earnings | | $ | 412.6 |
| | $ | 670.4 |
| | $ | 660.9 |
| | $ | 141.0 |
| | $ | 1,884.9 |
|
| Provision for income taxes | | 152.3 |
| | (82.9 | ) | | 214.2 |
| | 114.0 |
| | 397.7 |
|
| All other interest expense (a) | | 15.0 |
| | 15.0 |
| | 14.8 |
| | 14.6 |
| | 59.4 |
|
| All other interest income (a) | | (6.3 | ) | | (4.4 | ) | | (6.1 | ) | | (8.8 | ) | | (25.5 | ) |
| Transformation initiatives (b) | | (3.3 | ) | | 3.3 |
| | 39.7 |
| | 365.3 |
| | 404.8 |
|
| Proxy contest matters (c) | | 10.5 |
| | 22.9 |
| | — |
| | — |
| | 33.3 |
|
| As Adjusted - Adjusted EBIT | | $ | 580.8 |
| | $ | 624.3 |
| | $ | 923.5 |
| | $ | 626.0 |
| | $ | 2,754.6 |
|
| Adjusted EBIT Margin | | 18.9 | % | | 19.3 | % | | 25.0 | % | | 18.9 | % | | 20.7 | % |
| | | | | | | | | | | |
| As Adjusted - Diluted EPS | | $ | 0.93 |
| | $ | 1.51 |
| | $ | 1.49 |
| | $ | 0.32 |
| | $ | 4.25 |
|
| Transformation initiatives (b) | | — |
| | — |
| | 0.07 |
| | 0.57 |
| | 0.64 |
|
| Proxy contest matters (c) | | 0.01 |
| | 0.04 |
| | — |
| | — |
| | 0.05 |
|
| Tax Cuts and Jobs Act (d) | | — |
| | (0.52 | ) | | 0.01 |
| | 0.10 |
| | (0.41 | ) |
| As Adjusted - Adjusted diluted EPS | | $ | 0.94 |
| | $ | 1.03 |
| | $ | 1.57 |
| | $ | 0.99 |
| | $ | 4.53 |
|
(a) We continue to include the interest income earned on investments associated with our client funds extended investment strategy and interest expense on borrowings related to our client funds extended investment strategy as we believe these amounts to be fundamental to the underlying operations of our business model. These adjustments in the table above represent the interest income and interest expenses that is not related to our client funds extended investment strategy and are labeled as "All other interest expense" and "All other interest income".
(b) We recorded a charge of $404.8 million related to transformation initiatives in fiscal 2018. The charges within transformation initiatives in fiscal 2018 includes $319.6 million related to the special termination benefit charges and $17.5 million of other charges related to our Voluntary Early Retirement Program ("VERP"), severance charges related to our Service Alignment Initiative of $20.5 million, and other transformation initiatives of $47.2 million which primarily consist of severance charges totaling $41.9 million for fiscal 2018. Unlike other severance charges which are not included as an adjustment to get to adjusted results, these specific charges relate to actions that are part of our broad-based, company-wide transformation initiative.
(c) Represents non-operational costs related to proxy contest matters.
(d) The one-time net benefit from the enactment of the Tax Cuts and Jobs Act (the "Act") is comprised of application of the newly enacted rates to our U.S. deferred tax balances, partially offset by foreign withholding taxes on future distributions, the one-time transition tax and the recording of a valuation allowance against our foreign tax credits which may not be realized.
Safe Harbor Statement
This document and other written or oral statements made from time to time by ADP may contain “forward-looking statements” within the meaning of the Private Securities Litigation Reform Act of 1995. Statements that are not historical in nature and which may be identified by the use of words like “expects,” “assumes,” “projects,” “anticipates,” “estimates,” “we believe,” “could” “is designed to” and other words of similar meaning, are forward-looking statements. These statements are based on management’s expectations and assumptions and depend upon or refer to future events or conditions and are subject to risks and uncertainties that may cause actual results to differ materially from those expressed. Factors that could cause actual results to differ materially from those contemplated by the forward-looking statements or that could contribute to such difference include: ADP's success in obtaining, and retaining, clients, and selling additional services to clients; the pricing of products and services; the success of our new solutions; compliance with existing or new legislation or regulations; changes in, or interpretations of, existing legislation or regulations; overall market, political and economic conditions, including interest rate and foreign currency trends; competitive conditions; our ability to maintain our current credit ratings and the impact on our funding costs and profitability; security or cyber breaches, fraudulent acts, and system interruptions and failures; employment and wage levels; changes in technology; availability of skilled technical associates; the impact of new acquisitions and divestitures; and the adequacy, effectiveness and success of our business transformation initiatives. ADP disclaims any obligation to update any forward-looking statements, whether as a result of new information, future events or otherwise, except as required by law. These risks and uncertainties, along with the risk factors discussed under “Item 1A. Risk Factors,” and in other written or oral statements made from time to time by ADP, should be considered in evaluating any forward-looking statements contained herein.
ADP and the ADP logo are registered trademarks of ADP, LLC. ADP A more human resource. is a service mark of ADP, LLC. All other marks are the property of their respective owners. Copyright © 2018 ADP, LLC. All rights reserved.
ADP - Investor Relations
Investor Relations Contacts:
Christian Greyenbuhl
973.974.7835
Christian.Greyenbuhl@adp.com
Danyal Hussain
973.974.7836
Danyal.Hussain@adp.com
ADP - Media
Media Contacts:
Michael Schneider
973.974.5678
Michael.Schneider@adp.com
Allyce Hackmann
201.400.4583
Allyce.Hackmann@adp.com