Exhibit 99.1
The information presented herein may contain predictions, estimates and other forward-looking statements within the meaning of Section 27A of the
Securities Act of 1933 and Section 21E of the Securities Exchange Act of 1934. Although the Company believes that its expectations are based on
reasonable assumptions, it can give no assurance that its goals will be achieved. Important factors that could cause actual results to differ materially
from those included in the forward-looking statements include the timing and extent of changes in commodity prices for oil and gas, the need to develop
and replace reserves, environmental risks, competition, government regulation and the ability of the Company to meet its stated business goals.
Energize 2008
January 8-10
San Francisco
1
AMEX: ABP
2
Company Overview
Abraxas Petroleum Corporation
AMEX:ABP
Market capitalization ~ $160 million
Total enterprise value ~ $143 million
$0 debt & $17 million in cash
Options: CBOE and PCX
Fully diluted shares outstanding ~ 50 million
Ownership ~ 15% insider
~ 28% institutional
Average trading volume (3 mos) ~ 200,000 shares per day
2

Closed: May 25, 2007
MASTER LIMITED PARTNERSHIP (Abraxas Energy Partners, L.P.)
Contributed 65 Bcfe of proved reserves
ABP Ownership = 47% interest
AMEX: ABP
3
Recent Transactions
$ 157.5
TOTAL USES:
$ 157.5
TOTAL SOURCES:
7.0
Excess cash (ABP):
Fees & expenses:
Repay credit facility:
Redeem existing notes: (1)
USES:
10.3
0.9
$ 139.3
(millions)
35.0
22.5
$ 100.0
(millions)
SOURCES:
Société Générale credit facility:
5.9 million shares of ABP stock:
53% MLP to institutional investors:
(1) Includes call premium and interest
3
AMEX: ABP
4
Transaction Results
Results:
Debt-free Abraxas Corp.
(interest payments = $16 million/yr)
Retained control of the properties
Significant cash-flow stream to Abraxas Corp.
Accelerate drilling activities
4
Abraxas Energy Partners, L.P.
Purchase & Sale Agreement: December 11, 2007
Seller: St. Mary Land & Exploration Company
$140 million
Rockies & Mid-Continent
~1,500 gross (240 net) wells
Net Reserves: ~10,250 MBOE
82% PDP
52% Oil
Net Production: ~2,050 BOE per day
R/P Ratio: ~14 years
Swaptions: $80.00 / $8.00
Closing: Q1 2008
AMEX: ABP
5
Recent Events
5
AMEX: ABP
6
‘Do the Math’
Cash Distributions / Unit
Transaction Value / Mcfe
R/P Ratio
% Oil
% PDP
?
Accretive
$1.50
~$3.00
$2.28
$3.43
12 years
14 years
10 years
32%
52%
10%
73%
82%
63%
MLP pro-forma
St. Mary
Acquisition
MLP today
6
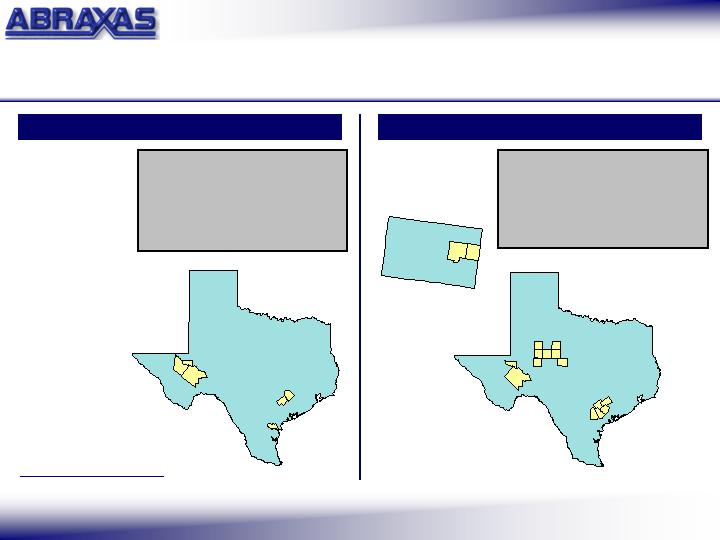
Distribution of Assets
Assets Contributed to MLP
Highlights (1)
Proved Reserves (Bcfe): 65.4
-Percent Proved Developed: 58%
-Percent Natural Gas 91%
Q3 07 Net Production (Mcfepd): 14,800
Gross Acres: 16,400
Net Acres : 13,500
Delaware Basin
Cherry Canyon
EOG Montoya
Other Delaware Basin ~85%
Oates SW – 4 PDP / 5 PUD
Gulf Coast Basin
Edwards
Portilla
AMEX: ABP
7
Delaware Basin
Other Delaware Basin ~15%
Oates SW – 4 wells plus
Woodford/Barnett
“Resource Play”
Eastern Shelf
IRA / Martin
Highlights (1)
Proved Reserves (Bcfe): 33.4
-Percent Proved Developed: 29%
-Percent Natural Gas: 67%
Q3 07 Net Production (Mcfepd): 3,600
Gross Acres: 88,200
Net Acres: 76,200
Powder River Basin
Mowry Shale
“Resource Play”
Assets Retained at ABP
Gulf Coast Basin
Edwards – 2 PUD
Wilcox
(1) Pro forma as of 12/31/06, unless noted otherwise,
excludes effect of recent re-classification of reserves
7
Quality assets
High ownership interest (79% WI)
Operational control (99%)
Large acreage positions
Substantial upside
Natural gas (67%)
Operations in Texas and Wyoming
> 10 year inventory of projects
on existing leasehold
High impact projects
AMEX: ABP
8
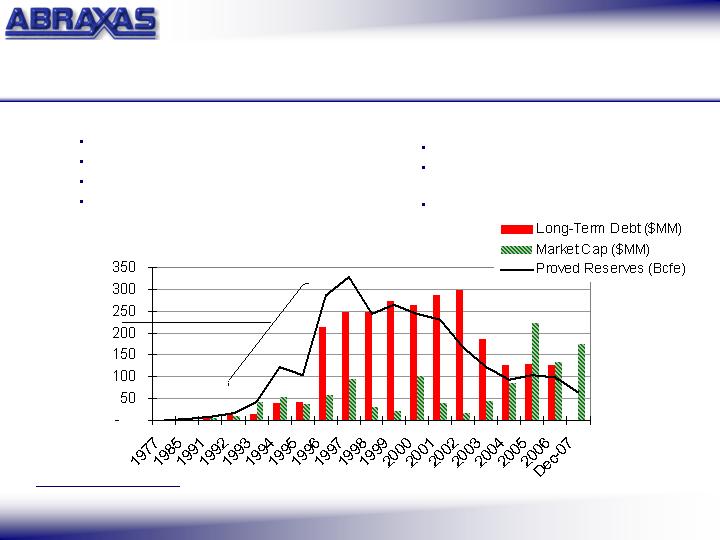
Retained Asset Base
Dec-07 reflects the transactions announced on May 25, 2007
and includes 47% of the proved reserves contributed to the MLP,
but excludes the effect of recent re-classification of reserves
Dec 31,
Acquisitions:
< $0.65 / Mcfe
8

AMEX: ABP
9
ABP (Stand-Alone) Valuation
$ 89
$ 89
$ 16.66
5.36
Abraxas MLP units (MM)
$ 237
$ 208 – $ 266
Total ABP Equity Value:
Price Per Unit
Price Per Acre
Undeveloped Acreage:
$ 237
$ 208 – $ 266
Total Value:
$ 0
$ 0
Less: Debt
49.0
Shares Outstanding (MM)
$ 25
$ 25
Cash and other assets (1)
In-Ground Value
46,500
15,000
2,500
33.4
Value Per Share
$ 300 - $ 700
$ 800 - $ 1,200
$ 400 - $ 700
$ 2.00 - $3.00
Multiple Range
$ 4.85
$ 4.24 - $ 5.44
$ 23
$ 15
$ 1
$ 14 – $ 33
$ 12 – $ 18
$ 1 – $ 2
- Mowry Shale
- Woodford Shale
- Wilcox Exploratory
$ 84
$ 67 - $ 100
Proved Reserves (Bcfe):
Valuation
Midpoint ($MM)
Valuation Range
($MM)
ABP Assets
(1)
Cash, GWE common stock
workover rigs, vehicles, and
surface acreage / yards
9

AMEX: ABP
10
Upside Potential
$ 96
$ 64
$ 32
64
59
Probable & Possible (3)
$ 38
$ 25
$ 13
Upside Potential
Value per Share
$ 1,884
$ 1,256
$ 628
1,256
559
Total
$ 37
$ 600
$ 555
$1.00 per Mcfe
($MM)
$ 19
$ 300
$ 277
$0.50 per Mcfe
($MM)
$1.50 per Mcfe
($MM)
Potential
Bcfe (2)
Number of potential /
identified projects (1)
15
300
185
Exploratory Wilcox Plays
Mowry Shale Oil Play
Woodford Shale Play
$ 56
37
$ 900
600
$ 832
555
(1) Woodford Shale on 80 acre spacing and Mowry Shale on 160 acre spacing
(2) Capital required $1.8 billion – volumes and resultant values are mid-point of range
(3) Net of reserves in specific plays
10

Drill Bit Growth
targeting Conventional Reservoirs
& emerging Resource Plays
Increase Shareholder Value
through……
AMEX: ABP
11
Operational Goals
Reserve Ratio Improvement
by converting
proved undeveloped and un-booked reserves
to the proved developed category
11
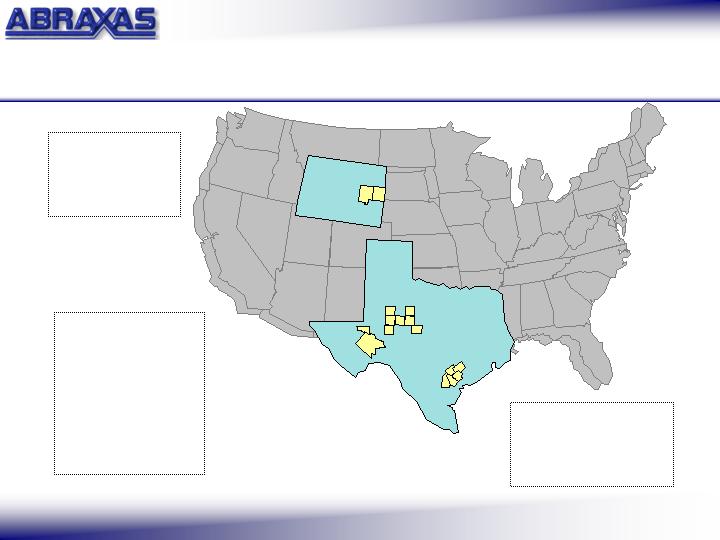
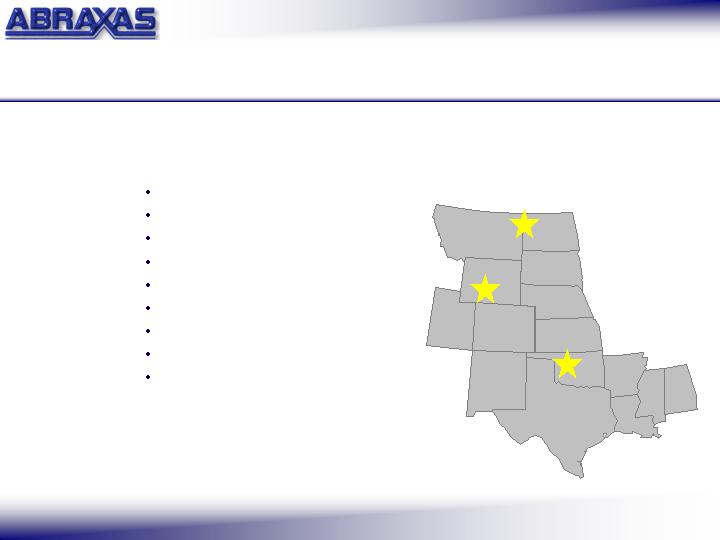
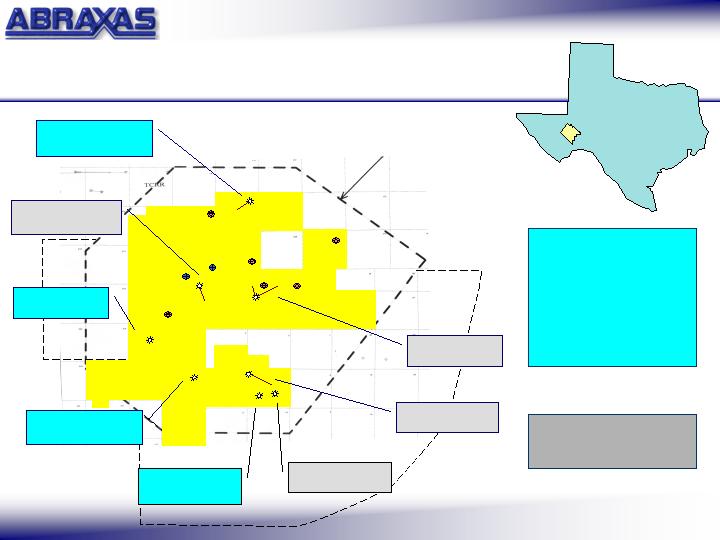
SOUTH TEXAS
Gulf Coast Basin
Bee, DeWitt, Goliad,
Karnes & Live Oak Counties
WEST TEXAS
Delaware Basin
Pecos & Ward
Counties
••••
Eastern Shelf
Coke, Dawson, Howard,
Martin, Midland, Mitchell
& Scurry Counties
WYOMING
Powder River Basin
Converse & Niobrara
Counties
AMEX: ABP
12
Abraxas Corp. Properties
12
Proved Reserves – 33.4 Bcfe (1)
(1) Pro forma as of 12/31/06, excludes
effect of recent re-classification of reserves
AMEX: ABP
13
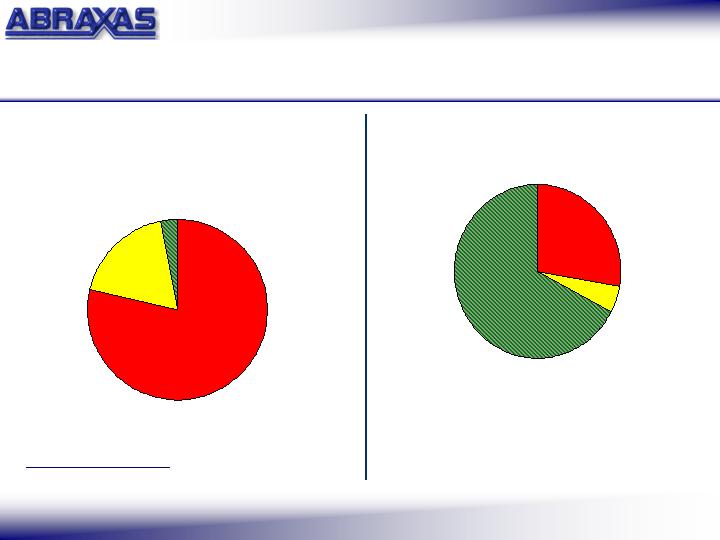
Reserves / Acreage
West Texas
28%
South Texas
5%
Wyoming
67%
Net Undeveloped Acres ~ 63,500 (1)
West Texas
79%
South Texas
18%
Wyoming
3%
13

AMEX: ABP
14
Conventional Reservoirs
Developing Existing Proved Reserves
Projects for 2008 and beyond…
“the low hanging fruit”
Edwards
Wilcox
Delaware
Mississippian / Devonian / Montoya
IRA
Clearfork / Spraberry / Strawn Reef
Oates SW
Devonian
14
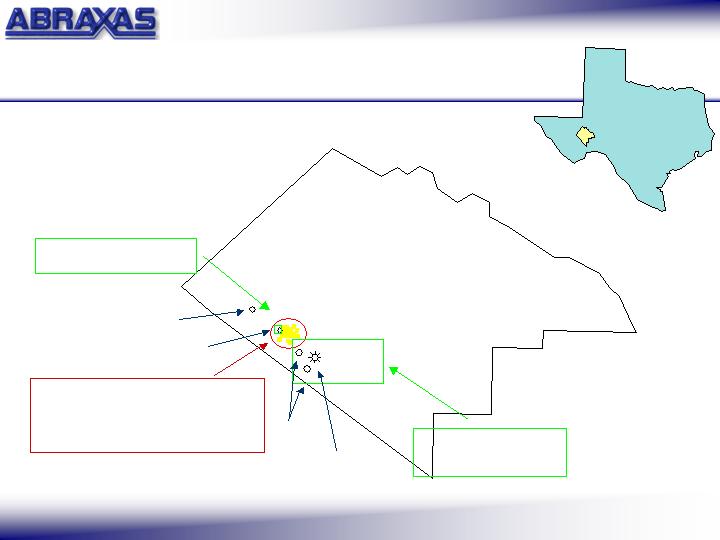
Oates SW Field
Wellbores available for re-entry
Pecos Co.
~15,000 acres
AMEX: ABP
15
> 75 sq. miles of 3-D
Hudgins 11-1:
Woodford
La Escalera 5-1:
Lower Wolfcamp
Manzanita 1H:
2007 Devonian
La Escalera 2:
Atoka
ABP retained wells
ABP retained the following:
Surface rights
Mineral rights
Executive rights
All formations from MLP
wells w/o proved reserves
Hudgins 37-1H:
Devonian
Elsinore Cattle 56:
Devonian
Hudgins 34-2H:
Devonian
La Escalera 1AH:
Devonian
Wells contributed to MLP
(plus 3 Devonian PUDs &
2 Montoya PUD completions)
15
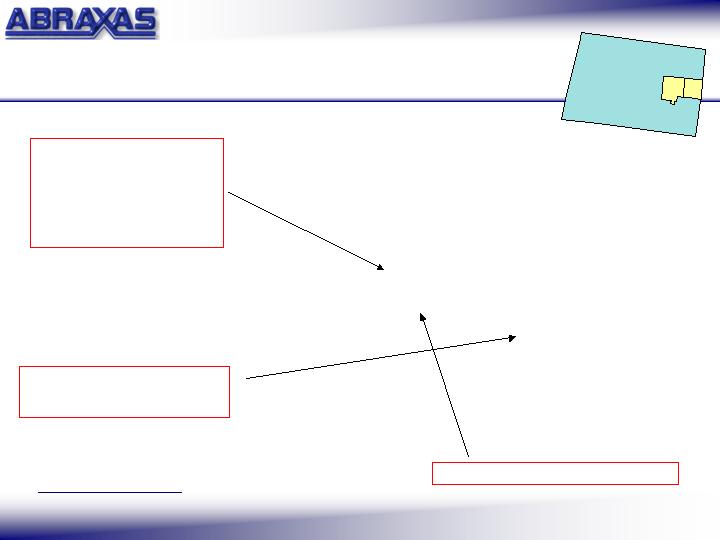
Pecos
ABP: Oates SW Field
~ 15,000 acres
(gained valuable reservoir knowledge &
producing small amount of dry gas from
the Woodford)
CHK 50% / Petro-Hunt 50%
~100,000 acres
3-D seismic swap
1 flowing gas)
Petro-Hunt
(2 permitted &
Reliance / CHK / PXD
3-D seismic & data swap
PXD
(1 drilled &
1 permitted)
AMEX: ABP
16
Woodford Shale Play
16

Delaware Basin Shale Players:
ABP, COP, CHK, CRZO, CWEI,
DVN, ECA, EOG, FST, KWK,
PPP, PXD, RRC, SWN, XTO,
Reliance and Petro-Hunt
Barnett Shale Players:
BEXP, COP, CHK, CRZO,
DNR, DVN, ECA, EOG, IFNY,
KWK, PLLL, RRC, XTO
4 (+)
?
100 – 1,000
Barnett: 500 – 1,000
Woodford: 100 – 400
9,000 – 16,000
0.7 – 3.0
1.0 – 9.0
Mississippian /
Devonian
Delaware Basin Shale
(Barnett / Woodford) (1)
10 – 26
Recovery factor (%)
2 (+)
Average well cost ($MM)
50 – 150
Gas-in-place (Bcf / 640 acres)
50 – 1,000
Thickness (feet)
0.5 – 1.9
Thermal maturity (Ro)
6,500 – 8,500
Depth (feet)
Mississippian
Geologic age
~ 4.5
Total organic content (%)
Ft. Worth Barnett
Shale (2)
AMEX: ABP
17
Gas Shale Play Comparison
(1) Natexis Bleichroeder Inc., CHK and internal estimates
(2) Pickering Energy Partners
17
AMEX: ABP
18
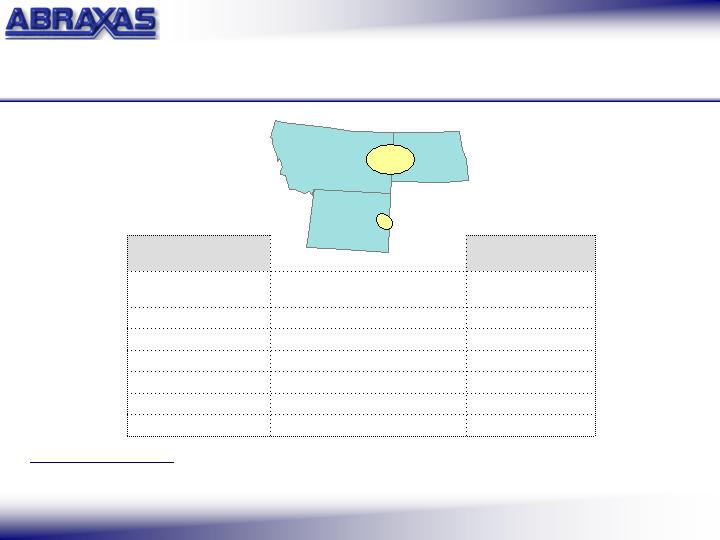
Mowry Shale Oil Play
10 wells
(5 horizontal / 5 vertical)
4 vertical wells producing from
Mowry
(commingled with other zones)
23 sq. miles proprietary 3-D seismic survey
(1) Gross acres (>92% MI), >12,000 HBP
AEZ/BEXP: Krejci
Horizontal Mowry Shale
~ 15 to the SE of Brooks Draw
Brooks Draw
~50,000 acres (1)
Converse & Niobrara Counties, Wyoming
Map of leasehold in Converse & Niobrara Counties, Wyoming
18
Mowry Shale Players:
ABP, AEZ, BEXP
Bakken Shale Players:
BBG, BEXP, COP, EOG,
MRO, SM, WLL and several
privately-held companies
Dolomitic siltstone
Reservoir Rock
Siliceous silty shale
640
Well spacing (acres)
160
2.0 – 3.0
150 - 500
110’ - 175’
7,500’ – 10,000’
Lower Cretaceous
Mowry Shale (1)
3.0 – 4.5
Average well cost ($MM)
200 - 500
Potential EUR (MBOE) per well
10’ - 50’
Thickness (feet)
10,000’ - 11,000’
Depth (feet)
Upper Devonian /
Lower Mississippian
Geologic age
Bakken Shale (2)
AMEX: ABP
19
Oil Shale Play Comparison
(1) AEZ/BEXP, Powder River Energy Partners, R.P. Nixon paper and internal estimates
(2) EOG, BEXP, OG Journal, Landmark, F.F. Meissner paper
19
AMEX: ABP
20
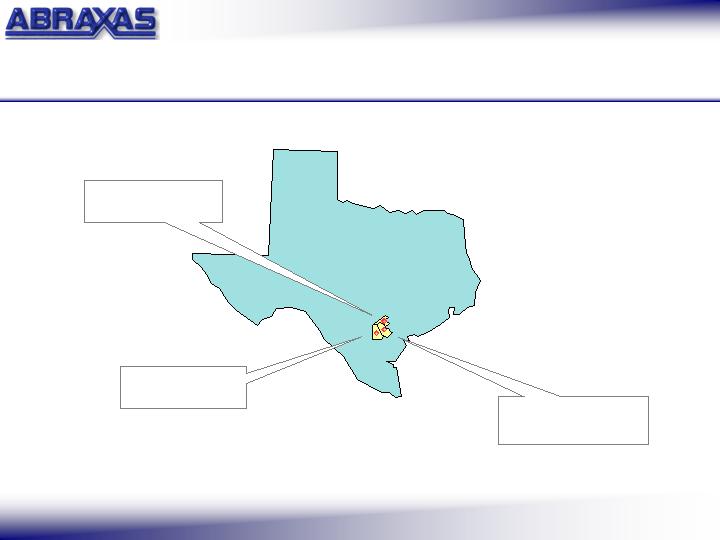
Exploratory Plays
Potentially High Impact
Targeting the Wilcox Formation
Plummer & Tuleta
Prospects,
Bee County
Janssen Prospect,
Karnes County
Goebel Prospect,
Live Oak County
20

Capital Expenditure Budget $35 million *
Single well impact to guidance !
Historically, $4,500 of capital expended = 1 Mcfepd
AMEX: ABP
21
2008
* excludes Abraxas Energy Partners, L.P. capital expenditures
21
Maintain financial flexibility and liquidity
Prioritize opportunity set
AMEX: ABP
22
Capture the Upside
Increase shareholder value
22

Niche exploration and production company
High quality assets with substantial upside
Goals:
Drill Bit Growth
Reserve Ratio Improvement
AMEX: ABP
23
Summary
CONTINUE TO INCREASE SHAREHOLDER VALUE
23
www.abraxaspetroleum.com
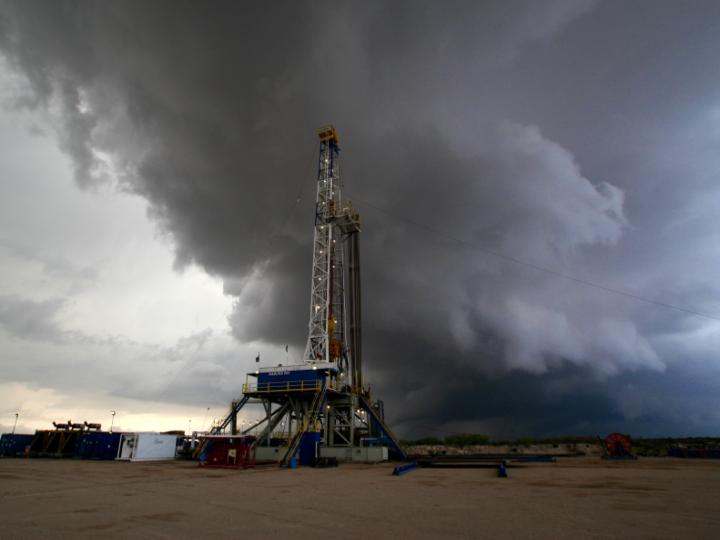
Manzanita 1H
Hudgins Ranch,
Delaware Basin,
West Texas
24