Exhibit 99.3

Third Quarter 2010 Earnings Supplementary Slides
November 11, 2010

Safe Harbor Statement
2

Strong Business Performance
§ Beat Q3 forecast in both segments
§ Met cost reduction plan in fab and field
§ Demand greater than supply - record backlog
§ Strong Q3 Execution
– Record cell outs, OEE, average efficiency and yields in Fabs 1 and 2
– 22+% Gen 2 cells on first production run in Fab 3
– Installed more than 70 MW* of power plants
– Closed sale of Montalto 28 MW ac solar park
3
* Power plant capacity in MW ac

Q4 Confidence / 2011 Visibility
§ High confidence in Q4 execution
– R&C: Fully booked
– UPP: On plan to monetize Italian solar parks
§ Strong growth and high visibility for 2011
– Volume and price established for Commercial business and UPP
– ~70% booked in Commercial for 2011
– 95% booked in North American UPP for 2011
– On plan for $1.08/W Q4 11 efficiency adjusted panel cost v. 14% panels
4
Vertical Integration Strategy
Poly
Ingot
Wafer
Cell
Panel
Upstream
§ World’s highest efficiency panels
§ Sustainable differentiated advantage
§ Drive for scale and cost reduction
Install
Services
Downstream
§ Adjust rapidly to market conditions
§ Integrated cost reduction
§ Premium brand / superior service
BOS
5
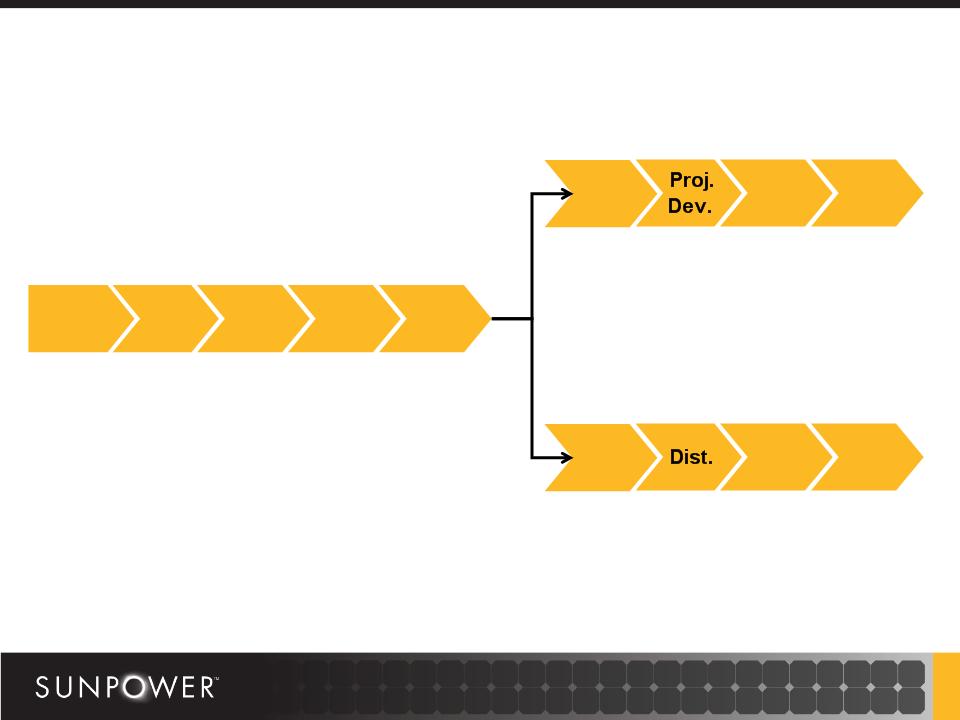
SPWR Downstream Strategy
§ World’s highest efficiency panels
§ Sustainable differentiated advantage
§ Drive for scale and cost reduction
§ Multi-year fixed price contracts
§ NA, EMEA, emerging markets
§ Integrated cost reduction
§ NAC: Multi-Qtr fixed price contracts
§ RLC: global dealer/partner network
§ Integrated cost reduction
EPC
Services
UPP Segment
BOS
Sales/
Install
Services
R&C Segment
BOS
Poly
Ingot
Wafer
Cell
Panel
Upstream
6
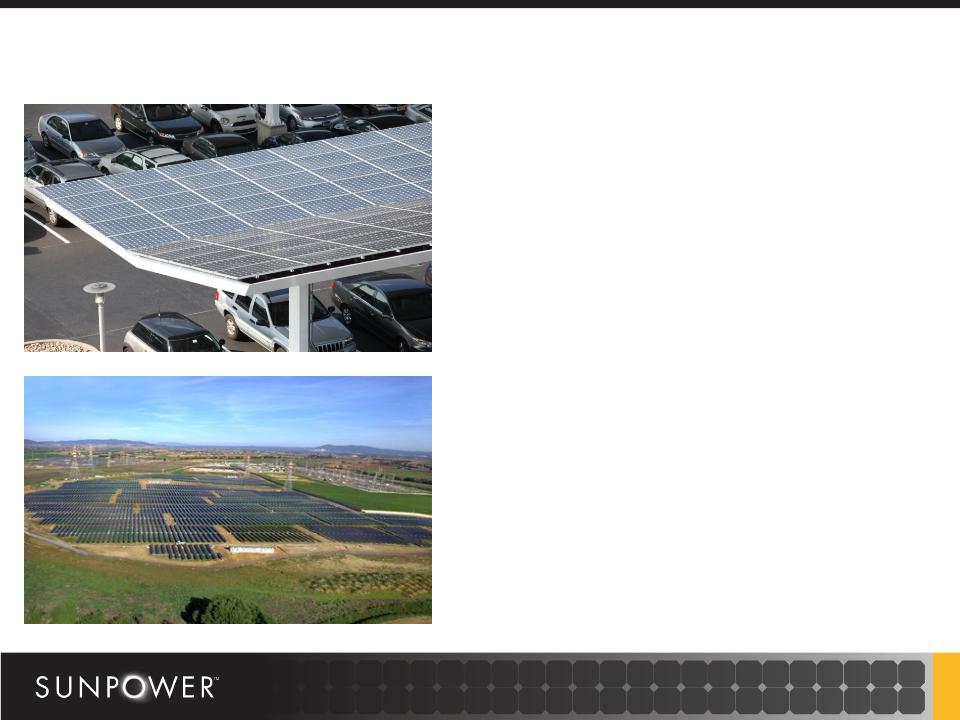
Diversified Channel / Portfolio
§R&C Market Position
− Global footprint, #1 in US
− Residential: 8 countries
− Commercial: Direct sales force
− #1 in NA, expanding to EU
− T5 driving wins: 3.5 MW Macy’s
§UPP Market Position
− Global reach / direct sales force
− 5 GW pipeline (~1/3 in EMEA)
− Customers buy energy (¢/kWh)
− High energy density = low LCOE
7
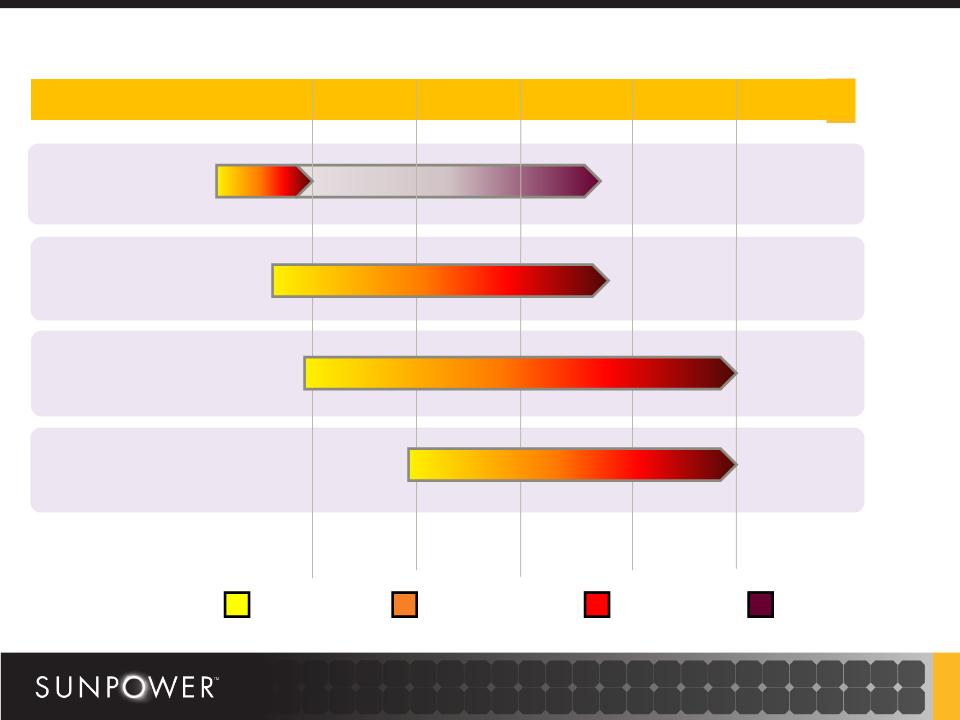
Italy Project Overview
2009 | Q1 ’10 | Q2 ’10 | Q3 ’10 | Q4 ’10 | Q1 ’11 |
Montalto 20
Montalto 8
Montalto 44
Solare Roma 13
Permitting
Construction
Financing
Sale
* MW’s in chart are listed in ac
8

Note: Illustrative 100 GWh / year power plant, Phoenix, AZ
SunPower LCOE Advantages
SunPower | 11% TF Fixed | |
GWh/yr | 100 | 100 |
MW | 37 | 46 |
Acres | 191 | 351 |
Inverters | 74 | 92 |
SunPower delivers
the same GWh using
far fewer acres and
less BOS leading to
lower O&M costs
the same GWh using
far fewer acres and
less BOS leading to
lower O&M costs
SunPower
Thin Film
9
SunPower LCOE Advantages
SunPower | 11% TF Fixed | |
GWh/yr | 100 | 100 |
Total $ | $200 MM | $200 MM |
$/Wp DC | $4.37 | $3.50 |
SunPower delivers
the same LCOE with
a 25% $/Wp price
premium
the same LCOE with
a 25% $/Wp price
premium
SunPower
Thin Film
Economically equivalent to customer
10
Note: Illustrative 100 GWh / year power plant, Phoenix, AZ
Efficiency Adjusted Cost/Watt*
Q4’09 | Q4’10 | Q4’11 | |
SunPower 19% Panel Cost / Watt** | $1.91 | $1.71 | $1.48 |
Efficiency Adjusted (vs. 14%) | $1.47 | $1.36 | $1.08 |
Efficiency Adjusted (vs. 11%) | $1.01 | $0.92 | $0.71 |
11
*Efficiency adjustments consider the BOS/tracking benefits of high efficiency panels.
**Base Cost/Watt excludes freight and pre-op expenses.
Comparison: 14% panel on T20 tracking system, 11% panel on fixed tilt.
§ Cost reduction drivers
− Fab 3 JV with AUO
− Leveraging R+D investments
− Improved manufacturing efficiency
− Increased ramp, yield and OEE
($ Millions except per share data) | Quarter Ending 10/3/10 | Quarter Ending 9/27/09 | Quarter Ending 7/4/10 |
Non-GAAP Revenues | $553.8 | $465.4 | $392.1 |
R+C | $292.8 | $270.2 | $264.2 |
UPP | $261.0 | $195.1 | $127.9 |
Gross Margin % (Non-GAAP) | 22.3% | 23.1% | 26.3% |
R+C | 24.3% | 19.6% | 26.5% |
UPP | 20.0% | 27.9% | 26.1% |
Tax Rate (non-GAAP) | 15.4% | 25.3% | 20.3% |
Net Income (Loss) (GAAP) | $20.1 | $19.5 | ($6.2) |
Net Income (Loss) (Non- GAAP) | $26.3 | $47.0 | $14.4 |
Diluted Wtg. Avg. Shares Out. | 105.6** | 105.0** | 96.8* |
EPS (GAAP) | $0.21 | $0.21 | ($0.07) |
EPS (Non-GAAP) | $0.26 | $0.46 | $0.15 |
Note: Non-GAAP figures are reconciled to comparable GAAP figures in appendix on company website
*not converted method **if converted method
Current and historical figures reflect Q2’10 change to new business unit segmentation
12

Balance Sheet and Financial Outlook
§ Liquidity
– Ended Q310 with $438 million in cash and investments
– Repaid $177 million in convertible debt and bank loans
– $145 million of additional liquidity available
– Shares in Woongjin Energy ~$360 million market value
§ Capital Expenditures of $4.3 million in Q3; 2010 plan of $125-$150 million
§ Q3 Free Cash Flow* of $78 million
§ Q4 FX exposure fully hedged at $1.37 to 1 Euro
§ Q3 production of 152 MW; 2010 on track to exceed 550 MW
*Free Cash Flow is net cash provided by (used in) operating activities less net cash provided by (used in) investing activities.
13

Italian Projects Update
§ On track to assemble, finance and monetize Italian projects in Q4
– Expect to complete and sell more than 80 MW in 2010
§ Montalto 44 MW
– Currently marketing €200 million in debt financing
– Industry’s first solar bond
– Provisional investment grade rating on both tranches of debt
– Debt transfers to new owner on sale
– Equity sale in negotiation for Q4 close
– On schedule for connection to grid in mid-December 2010
§ Solare Roma - 13 MW
– On schedule to connect and monetize project in December 2010
14
2010 Guidance
Q4 | FY 2010 | |
Revenue $MM | $870-$970 | $2,150-2,250 |
Gross Margin (Non-GAAP) | 20-22% | 22-23% |
EPS $/Share (Non-GAAP) | $0.95-$1.15 | $1.45-$1.65 |
EPS $/Share (GAAP) | $0.45-$0.60 | $0.75-$0.90 |
15

Third Quarter 2010 Earnings Supplementary Slides
November 11, 2010
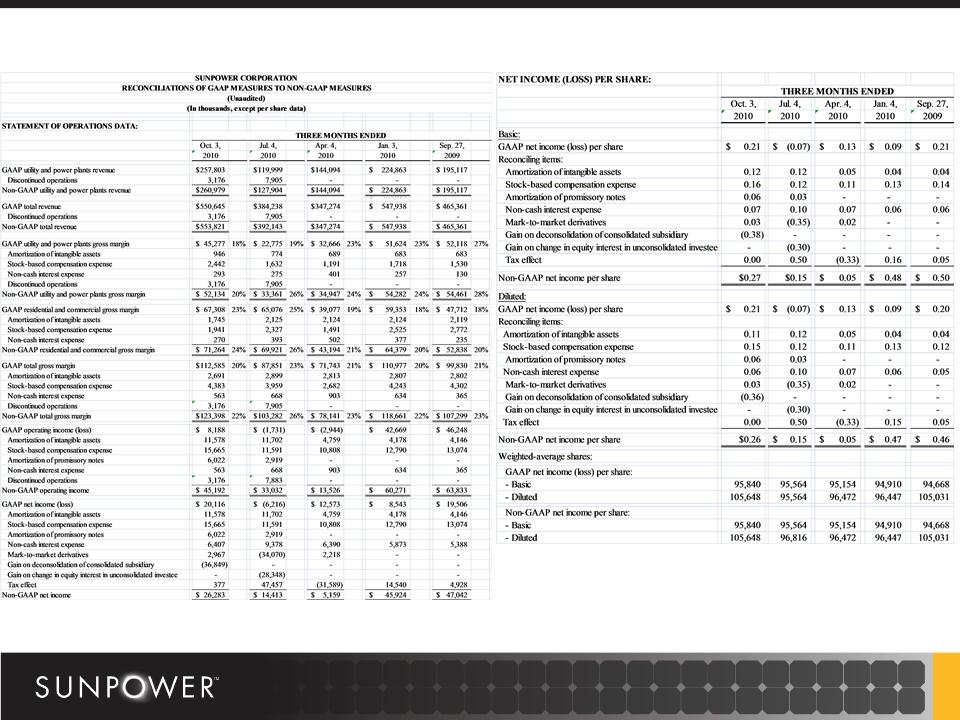
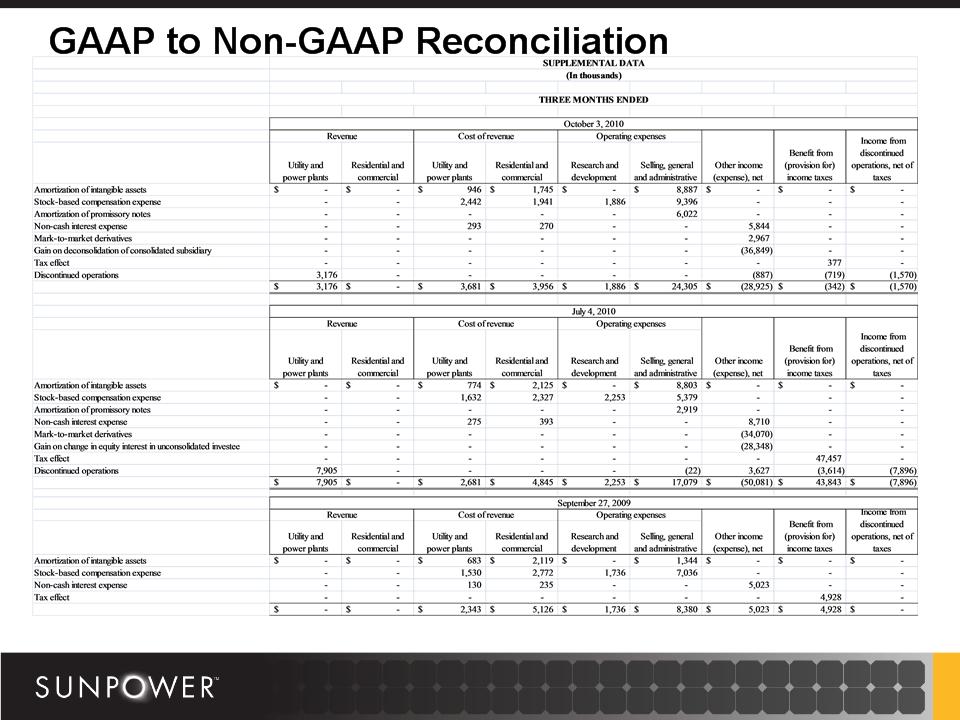
GAAP to Non-GAAP Reconciliation
17
18
Earnings Per Share Calculation
19
Three Months Ended October 3, 2010
GAAP
Non-GAAP
(in thousands)
If Converted Method
Not Converted
Method
Method
If Converted Method
Not Converted
Method
Method
Net income
$ 20,116
$ 20,116
$ 26,283
$ 26,283
Net income allocated to unvested restricted stock awards
(24)
(24)
(31)
(31)
Net income allocated to class A and class B common stock
20,092
20,092
26,252
26,252
Basic weighted-average shares
95,840
95,840
95,840
95,840
Net income per share - basic
$ 0.21
$ 0.21
$ 0.27
$ 0.27
Net income
$ 20,116
$ 20,116
$ 26,283
$ 26,283
(A)
Interest expense on 4.75% debentures, net of tax
1,666
-
1,666
-
Net income allocated to unvested restricted stock awards
(23)
(24)
(30)
(31)
Net income allocated to class A and class B common stock
21,759
20,092
27,919
26,252
Diluted weighted-average shares before consideration of 4.5% debentures
96,936
96,936
96,936
96,936
Shares issued if 100% of 4.5% Debentures are converted to equity
8,712
-
8,712
-
Diluted weighted-average shares
105,648
96,936
105,648
96,936
Net income per share - diluted
$ 0.21
$ 0.21
$ 0.26
$ 0.27
(A)
Under the "If Converted Method" we calculated diluted earnings per share using the more dilutive of the following two methods:
Method One:
Numerator = Income Available to Common Shareholders + Interest on 4.5% Debentures, Net of Tax
Denominator = Stock Outstanding + Common Shares Issued if 100% Coversion of 4.5% Debentures
Method Two:
Numerator = Income Available to Common Shareholders
Denominator = Stock Outstanding