| UNITED STATES SECURITIES AND EXCHANGE COMMISSION | ||
| Washington, D.C. 20549 | ||
FORM N-CSR | ||
| CERTIFIED SHAREHOLDER REPORT OF REGISTERED MANAGEMENT INVESTMENT COMPANIES | ||
| Investment Company Act file number: | (811-05989) |
| Exact name of registrant as specified in charter: | Putnam Global Utilities Fund |
| Address of principal executive offices: | One Post Office Square, Boston, Massachusetts 02109 |
| Name and address of agent for service: | Robert T. Burns, Vice President One Post Office Square Boston, Massachusetts 02109 |
| Copy to: | Bryan Chegwidden, Esq. Ropes & Gray LLP 1211 Avenue of the Americas New York, New York 10036 |
| Registrant's telephone number, including area code: | (617) 292-1000 |
| Date of fiscal year end: | August 31, 2016 |
| Date of reporting period: | September 1, 2015 — February 29, 2016 |
Item 1. Report to Stockholders: |
| The following is a copy of the report transmitted to stockholders pursuant to Rule 30e-1 under the Investment Company Act of 1940: | |||
Putnam
Global Utilities
Fund
Semiannual report
2 | 29 | 16
| Message from the Trustees | 1 | |
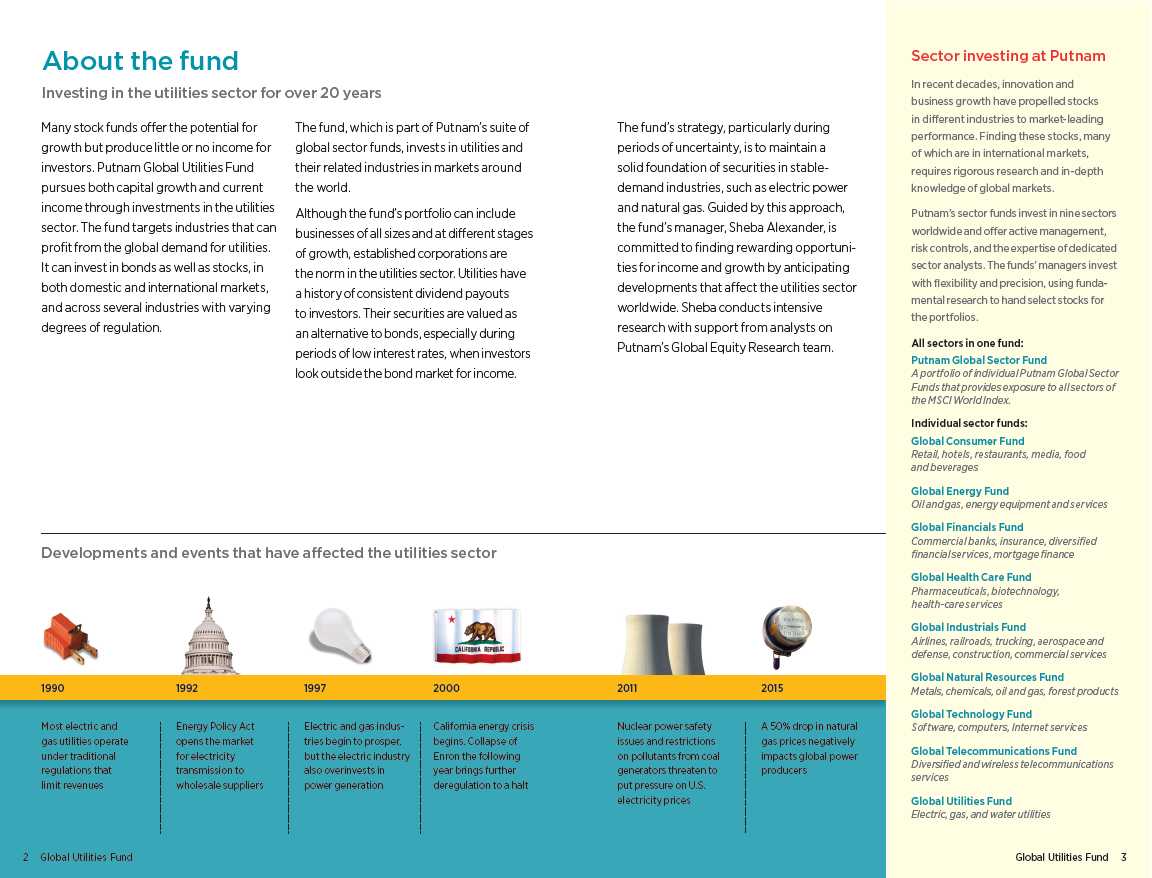
| About the fund | 2 | |
| Performance snapshot | 4 | |
| Interview with your fund’s portfolio manager | 5 | |
| Your fund’s performance | 10 | |
| Your fund’s expenses | 12 | |
| Terms and definitions | 14 | |
| Other information for shareholders | 15 | |
| Financial statements | 16 | |
Consider these risks before investing: International investing involves currency, economic, and political risks. Emerging-market securities carry illiquidity and volatility risks. Investments in small and/or midsize companies increase the risk of greater price fluctuations. The utilities industries may be affected by increases in fuel costs, technological obsolescence, changes in regulatory policies, and deregulation. The fund concentrates on a limited group of industries and is non-diversified. Because the fund may invest in fewer issuers, it is vulnerable to common economic forces and may result in greater losses and volatility. Growth stocks may be more susceptible to earnings disappointments, and value stocks may fail to rebound. The use of short selling may result in losses if the securities appreciate in value. Risks associated with derivatives include increased investment exposure (which may be considered leverage) and, in the case of over-the-counter instruments, the potential inability to terminate or sell derivatives positions and the potential failure of the other party to the instrument to meet its obligations. Stock prices may fall or fail to rise over time for several reasons, including general financial market conditions and factors related to a specific issuer or industry. You can lose money by investing in the fund.
Message from the Trustees
Dear Fellow Shareholder:
Since the start of the year, stock markets around the world have experienced heightened volatility in response to a challenging investment environment. Many factors have fueled the market swings, including record low oil prices, fears of a global recession, China’s continued economic slowdown, and divergent monetary policies from central banks. Recently, within fixed-income markets, investors have generally sought traditional “safe havens” of higher-quality bonds.
In the United States, economic growth is positive, but remains tepid compared with past recoveries. Unemployment continues to fall, consumer spending is showing strength, and the housing market has been recovering. Moreover, the Federal Reserve has stated that its pace of interest-rate increases will be “gradual.” Although today’s conditions may seem challenging, Putnam’s portfolio managers are positioned to maneuver in all types of markets with active investment strategies and support from a team of global equity research analysts. The interview on the following pages provides an overview of your fund’s performance for the reporting period ended February 29, 2016, as well as an outlook for the coming months.
In today’s market environment, it may be helpful for you to consult your financial advisor to ensure that your portfolio is aligned with your investment goals, time horizon, and risk tolerance.
As always, thank you for investing with Putnam.

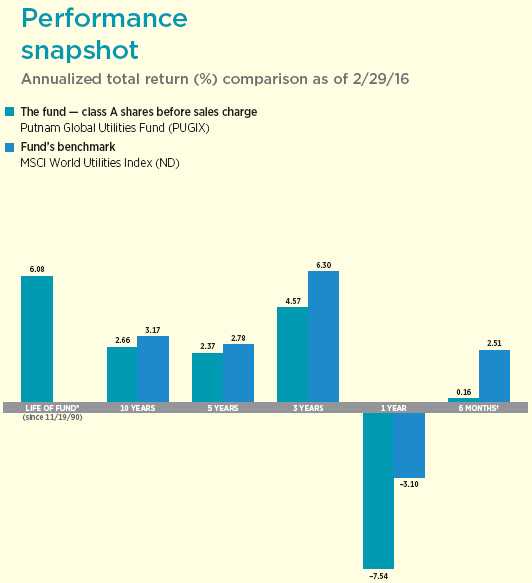
Current performance may be lower or higher than the quoted past performance, which cannot guarantee future results. Share price, principal value, and return will fluctuate, and you may have a gain or a loss when you sell your shares. Performance of class A shares assumes reinvestment of distributions and does not account for taxes. Fund returns in the bar chart do not reflect a sales charge of 5.75%; had they, returns would have been lower. See pages 5 and 10–12 for additional performance information. For a portion of the periods, the fund had expense limitations, without which returns would have been lower. To obtain the most recent month-end performance, visit putnam.com.
* The fund’s benchmark, the MSCI World Utilities Index (ND), was introduced on 1/1/01, which post-dates the inception of the fund’s class A shares.
† Returns for the six-month period are not annualized, but cumulative.
| 4 | Global Utilities Fund |
Interview with your fund’s portfolio manager

What factors influenced global utility stock prices during the six-month reporting period?
For much of the period, the greatest influence was investor anticipation of the Federal Reserve’s interest-rate hike. The Fed announced that it would raise short-term interest rates by 0.25% on December 16, 2015 — the first rate hike in nearly 10 years. Investors had long expected an increase, but the uncertainty of its timing and magnitude made investors anxious. Rate hikes are important because utility stocks are owned for their dividend yields. In fact, utility stock prices tend to have a reaction similar to bonds when it comes to interest-rate changes — as interest rates rise, bond prices fall, and vice versa.
While the anticipated rate hike weighed on the utility stock environment for much of the reporting period, ultimately interest rates fell, giving utility prices a lift. The new year opened with growing concerns about a global recession, as well as ongoing weakness in commodities. Investors became increasingly risk averse, causing demand to soar for the safety and liquidity of U.S. Treasuries. As a result, U.S. Treasury yields fell and prices moved higher. In fact, the yield of the U.S. Treasury 10-year note fell from 2.21%, on August 31, 2015, to 1.74% on February 29, 2016. The drop in U.S. Treasury yields and the flight to quality also benefited utility stocks.
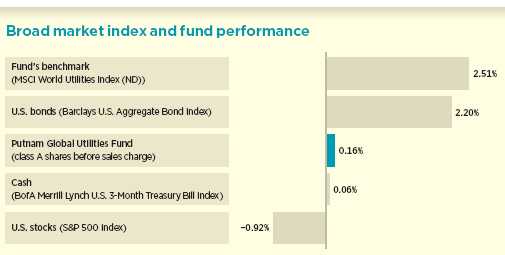
This comparison shows your fund’s performance in the context of broad market indexes for the six months ended 2/29/16. See pages 4 and 10–12 for additional fund performance information. Index descriptions can be found on page 14.
| Global Utilities Fund | 5 |
Demand was strong as investors turned to utilities for their attractive yields and perceived safety.
How did the utilities sector perform during the reporting period?
Regulated utility companies turned in a strong performance in the last two months of the period; however, a key component of the utilities sector — independent power producers [IPPs] — experienced difficulties. In addition to interest-rate concerns, the oil market remained weak, and unusually mild summer and winter weather dampened consumer demand for energy. As a result, natural gas inventories climbed and prices plunged.
Why did the fund underperform its benchmark?
The fund’s return lagged because of its position in IPPs, which were the greatest detractors from performance. Specifically, these detractors were NRG Energy, Calpine, and Dynegy. As a group, IPPs were hurt by macroeconomic factors, but NRG, Calpine, and Dynegy also had some leverage, and investors stepped away from leveraged companies, in general, and instead gravitated toward quality. That sentiment hurt the performance of NRG, Calpine, and Dynegy stocks on a relative basis.
We continue to hold positions in NRG, Calpine, and Dynegy, despite the sharp price declines in all three stocks. We constantly monitor the fund’s holdings, and looking out 18 to 24 months, our assessment of all three companies remains positive. We believe that with their lower share prices, they represent attractive value. In addition to other factors, the companies have hedged much of their natural gas positions and are trading at high free cash flow yields.
Allocations are shown as a percentage of the fund’s net assets as of 2/29/16. Cash and net other assets, if any, represent the market value weights of cash, derivatives, short-term securities, and other unclassified assets in the portfolio. Summary information may differ from the information in the portfolio schedule notes included in the financial statements due to the inclusion of derivative securities, any interest accruals, and the exclusion of as-of trades, if any. Holdings and allocations may vary over time.
| 6 | Global Utilities Fund |
What strategies contributed to fund performance for the period?
Relative performance benefited from our strategy of maintaining a slight overweight position in the United States and underweight positions in Japan and Europe. The biggest contributors were regulated utility companies. We expect to continue this overweight/underweight strategy, as we believe that U.S. utilities offer better value than their global counterparts.
Individual holdings that supported performance include American Water Works Company, PG&E, and Edison International. American Water Works received approval for new rate increases, and its senior management issued guidance for the company’s growth prospects that was well received by investors. PG&E and Edison International — which are located in California’s favorable regulatory environment — were involved in rate cases during the period.
The fund also benefited from avoiding several stocks that declined during the period and were held in the benchmark. These included E.ON SE, which is a European power company; Tokyo Electric; and Enel Green Power, a company that develops and manages energy generation from renewable sources with a presence in Europe and the Americas.
How did the fund use derivatives during the reporting period?
We used forward currency contracts to hedge portions of our foreign currency exposures. Currency forwards allow us to pursue
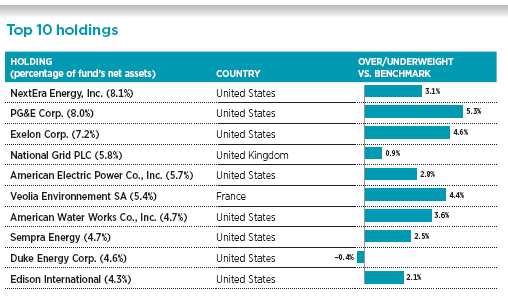
This table shows the fund’s top 10 holdings by percentage of the fund’s net assets as of 2/29/16. Short-term investments and derivatives, if any, are excluded. Holdings may vary over time.
| Global Utilities Fund | 7 |
strategies that can help protect the fund from adverse movements in exchange rates. The use of these derivatives had a positive impact on fund performance.
What is your outlook for global utilities as we head further into 2016?
Overall, our outlook is positive — particularly for IPPs — though we believe that the market still needs to work out some near-term issues. We believe the overall price drop for IPPs was excessive, and it appears that investor negativity toward higher-leveraged companies spilled over to IPPs.
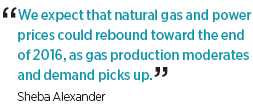
Also, many investors believe that the decline in prompt natural gas prices is a long-term situation, and we disagree with that opinion. Prompt natural gas prices are the prices paid for the nearest delivery month of the standard natural gas futures contract traded on the New York Mercantile Exchange. We expect that natural gas and power prices could rebound toward the end of 2016, as gas production moderates and demand picks up later this summer and fall. In our view, this could bring the market into better balance.
In contrast, we are less constructive on regulated utility stocks as, in our opinion, their valuations have become fully priced and perhaps even overvalued. We also believe that the low level of the U.S. Treasury 10-year yield could limit any further appreciation of these stocks.
As the period closed, investors seemed to be focused on extremes. At one extreme were near-term worries about weaker demand on the back of mild weather, and the level to which natural gas prices can sink. At the other extreme were longer-term issues, such as the development of various renewable sources. While, in our view, the long-term concerns are valid, we believe they may be overblown. In our view, the risk/reward relationship for
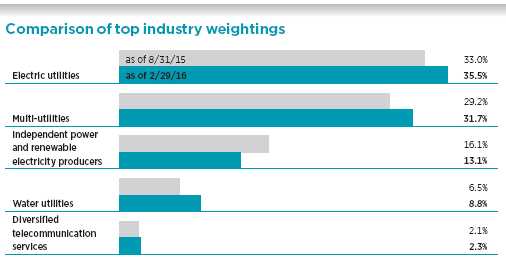
This chart shows how the fund’s top weightings have changed over the past six months. Allocations are shown as a percentage of the fund’s net assets. Current period summary information may differ from the portfolio schedule included in the financial statements due to the inclusion of derivative securities, any interest accruals, the exclusion of as-of trades, if any, and the use of different classifications of securities for presentation purposes. Holdings and allocations may vary over time.
| 8 | Global Utilities Fund |
U.S. power stocks will be favorable once the near-term issues are resolved.
Thanks for your time and insights, Sheba.
The views expressed in this report are exclusively those of Putnam Management and are subject to change. They are not meant as investment advice.
Please note that the holdings discussed in this report may not have been held by the fund for the entire period. Portfolio composition is subject to review in accordance with the fund’s investment strategy and may vary in the future. Current and future portfolio holdings are subject to risk.
Portfolio Manager Sheba M. Alexander has an M.B.A. from the Tuck School of Business at Dartmouth College, a Master of Finance and Control from the University of Delhi, and a B.A. from the University of Delhi. She joined Putnam in 1999 and has been in the investment industry since 1995.
IN THE NEWS
To remain in the European Union or to leave the European Union? That is the question British voters will answer when they head to polls on June 23. After months of debate, the question of a “Brexit,” shorthand for Britain’s possible exit from the 28-nation European Union (EU), will go before British voters in a referendum vote. Brexit supporters believe that departure from the Brussels-based partnership will help better serve Britain’s national interests on financial issues, immigration, and other matters. Brexit opponents argue that Britain’s EU membership affords the country certain benefits, including bargaining powers on issues of trade and defense. They also warn of dire economic consequences for Britain if a departure takes place, including negative effects on both the country’s currency and its credit rating. For the EU, the loss of Britain — the EU’s second-largest economy — would potentially weaken the union at a time when it is struggling with various issues, including slowing economic growth and an ongoing refugee crisis.
| Global Utilities Fund | 9 |
Your fund’s performance
This section shows your fund’s performance, price, and distribution information for periods ended February 29, 2016, the end of the first half of its current fiscal year. In accordance with regulatory requirements for mutual funds, we also include performance information as of the most recent calendar quarter-end and expense information taken from the fund’s current prospectus. Performance should always be considered in light of a fund’s investment strategy. Data represent past performance. Past performance does not guarantee future results. More recent returns may be less or more than those shown. Investment return and principal value will fluctuate, and you may have a gain or a loss when you sell your shares. Performance information does not reflect any deduction for taxes a shareholder may owe on fund distributions or on the redemption of fund shares. For the most recent month-end performance, please visit the Individual Investors section at putnam.com or call Putnam at 1-800-225-1581. Class R and Y shares are not available to all investors. See the Terms and Definitions section in this report for definitions of the share classes offered by your fund.
Fund performance Total return for periods ended 2/29/16
| Class A | Class B | Class C | Class M | Class R | Class Y | |||||
| (inception dates) | (11/19/90) | (4/27/92) | (7/26/99) | (3/1/95) | (12/1/03) | (10/4/05) | ||||
| Before | After | Before | After | Net | Net | |||||
| sales | sales | Before | After | Before | After | sales | sales | asset | asset | |
| charge | charge | CDSC | CDSC | CDSC | CDSC | charge | charge | value | value | |
| Annual average | ||||||||||
| (life of fund) | 6.08% | 5.83% | 5.82% | 5.82% | 5.28% | 5.28% | 5.55% | 5.41% | 5.81% | 6.19% |
| 10 years | 30.00 | 22.52 | 22.39 | 22.39 | 20.58 | 20.58 | 23.67 | 19.34 | 26.85 | 33.23 |
| Annual average | 2.66 | 2.05 | 2.04 | 2.04 | 1.89 | 1.89 | 2.15 | 1.78 | 2.41 | 2.91 |
| 5 years | 12.41 | 5.95 | 8.32 | 6.32 | 8.37 | 8.37 | 9.69 | 5.85 | 11.08 | 13.85 |
| Annual average | 2.37 | 1.16 | 1.61 | 1.23 | 1.62 | 1.62 | 1.87 | 1.14 | 2.12 | 2.63 |
| 3 years | 14.36 | 7.79 | 11.90 | 8.90 | 11.94 | 11.94 | 12.75 | 8.80 | 13.57 | 15.23 |
| Annual average | 4.57 | 2.53 | 3.82 | 2.88 | 3.83 | 3.83 | 4.08 | 2.85 | 4.33 | 4.84 |
| 1 year | –7.54 | –12.85 | –8.16 | –12.71 | –8.17 | –9.08 | –7.96 | –11.18 | –7.71 | –7.29 |
| 6 months | 0.16 | –5.60 | –0.17 | –5.13 | –0.16 | –1.15 | –0.10 | –3.60 | 0.05 | 0.29 |
Current performance may be lower or higher than the quoted past performance, which cannot guarantee future results. After-sales-charge returns for class A and M shares reflect the deduction of the maximum 5.75% and 3.50% sales charge, respectively, levied at the time of purchase. Class B share returns after contingent deferred sales charge (CDSC) reflect the applicable CDSC, which is 5% in the first year, declining over time to 1% in the sixth year, and is eliminated thereafter. Class C share returns after CDSC reflect a 1% CDSC for the first year that is eliminated thereafter. Class R and Y shares have no initial sales charge or CDSC. Performance for class B, C, M, R, and Y shares before their inception is derived from the historical performance of class A shares, adjusted for the applicable sales charge (or CDSC) and the higher operating expenses for such shares, except for class Y shares, for which 12b-1 fees are not applicable.
For a portion of the periods, the fund had expense limitations, without which returns would have been lower.
Class B share performance reflects conversion to class A shares after eight years.
| 10 Global Utilities Fund |
Comparative index returns For periods ended 2/29/16
| MSCI World Utilities Index (ND) | |
| Annual average (life of fund) | —* |
| 10 years | 36.63% |
| Annual average | 3.17 |
| 5 years | 14.69 |
| Annual average | 2.78 |
| 3 years | 20.10 |
| Annual average | 6.30 |
| 1 year | –3.10 |
| 6 months | 2.51 |
Index results should be compared with fund performance before sales charge, before CDSC, or at net asset value.
* The fund’s benchmark, the MSCI World Utilities Index (ND), was introduced on 1/1/01, which post-dates the inception of the fund’s class A shares.
Fund price and distribution information For the six-month period ended 2/29/16
| Distributions | Class A | Class B | Class C | Class M | Class R | Class Y | ||
| Number | 2 | 2 | 2 | 2 | 2 | 2 | ||
| Income | $0.106 | $0.060 | $0.061 | $0.077 | $0.055 | $0.121 | ||
| Capital gains | — | — | — | — | — | — | ||
| Total | $0.106 | $0.060 | $0.061 | $0.077 | $0.055 | $0.121 | ||
| Before | After | Net | Net | Before | After | Net | Net | |
| sales | sales | asset | asset | sales | sales | asset | asset | |
| Share value | charge | charge | value | value | charge | charge | value | value |
| 8/31/15 | $11.55 | $12.25 | $11.50 | $11.45 | $11.54 | $11.96 | $11.51 | $11.55 |
| 2/29/16 | 11.46 | 12.16 | 11.42 | 11.37 | 11.45 | 11.87 | 11.46 | 11.46 |
The classification of distributions, if any, is an estimate. Before-sales-charge share value and current dividend rate for class A and M shares, if applicable, do not take into account any sales charge levied at the time of purchase. After-sales-charge share value, current dividend rate, and current 30-day SEC yield, if applicable, are calculated assuming that the maximum sales charge (5.75% for class A shares and 3.50% for class M shares) was levied at the time of purchase. Final distribution information will appear on your year-end tax forms.
| Global Utilities Fund | 11 |
Fund performance as of most recent calendar quarter
Total return for periods ended 3/31/16
| Class A | Class B | Class C | Class M | Class R | Class Y | |||||
| (inception dates) | (11/19/90) | (4/27/92) | (7/26/99) | (3/1/95) | (12/1/03) | (10/4/05) | ||||
| Before | After | Before | After | Net | Net | |||||
| sales | sales | Before | After | Before | After | sales | sales | asset | asset | |
| charge | charge | CDSC | CDSC | CDSC | CDSC | charge | charge | value | value | |
| Annual average | ||||||||||
| (life of fund) | 6.39% | 6.14% | 6.13% | 6.13% | 5.59% | 5.59% | 5.86% | 5.71% | 6.12% | 6.50% |
| 10 years | 44.26 | 35.96 | 35.74 | 35.74 | 33.85 | 33.85 | 37.12 | 32.32 | 40.61 | 47.85 |
| Annual average | 3.73 | 3.12 | 3.10 | 3.10 | 2.96 | 2.96 | 3.21 | 2.84 | 3.47 | 3.99 |
| 5 years | 28.65 | 21.26 | 23.83 | 21.83 | 23.98 | 23.98 | 25.44 | 21.05 | 27.03 | 30.19 |
| Annual average | 5.17 | 3.93 | 4.37 | 4.03 | 4.39 | 4.39 | 4.64 | 3.89 | 4.90 | 5.42 |
| 3 years | 17.83 | 11.05 | 15.10 | 12.10 | 15.18 | 15.18 | 15.95 | 11.89 | 16.87 | 18.63 |
| Annual average | 5.62 | 3.56 | 4.80 | 3.88 | 4.82 | 4.82 | 5.06 | 3.82 | 5.33 | 5.86 |
| 1 year | 1.83 | –4.03 | 1.04 | –3.96 | 1.09 | 0.09 | 1.30 | –2.24 | 1.55 | 2.09 |
| 6 months | 9.51 | 3.21 | 9.05 | 4.05 | 9.11 | 8.11 | 9.15 | 5.33 | 9.36 | 9.55 |
See the discussion following the fund performance table on page 10 for information about the calculation of fund performance.
Your fund’s expenses
As a mutual fund investor, you pay ongoing expenses, such as management fees, distribution fees (12b-1 fees), and other expenses. Using the following information, you can estimate how these expenses affect your investment and compare them with the expenses of other funds. You may also pay one-time transaction expenses, including sales charges (loads) and redemption fees, which are not shown in this section and would have resulted in higher total expenses. For more information, see your fund’s prospectus or talk to your financial representative.
Expense ratios
| Class A | Class B | Class C | Class M | Class R | Class Y | |
| Total annual operating expenses | ||||||
| for the fiscal year ended 8/31/15 | 1.19% | 1.94% | 1.94% | 1.69% | 1.44% | 0.94% |
| Annualized expense ratio for the | ||||||
| six-month period ended 2/29/16 | 1.22% | 1.97% | 1.97% | 1.72% | 1.47% | 0.97% |
Fiscal-year expense information in this table is taken from the most recent prospectus, is subject to change, and may differ from that shown for the annualized expense ratio and in the financial highlights of this report.
Expenses are shown as a percentage of average net assets.
| 12 Global Utilities Fund |
Expenses per $1,000
The following table shows the expenses you would have paid on a $1,000 investment in each class of the fund from 9/1/15 to 2/29/16. It also shows how much a $1,000 investment would be worth at the close of the period, assuming actual returns and expenses.
| Class A | Class B | Class C | Class M | Class R | Class Y | |
| Expenses paid per $1,000*† | $6.07 | $9.79 | $9.79 | $8.55 | $7.31 | $4.83 |
| Ending value (after expenses) | $1,001.60 | $998.30 | $998.40 | $999.00 | $1,000.50 | $1,002.90 |
* Expenses for each share class are calculated using the fund’s annualized expense ratio for each class, which represents the ongoing expenses as a percentage of average net assets for the six months ended 2/29/16. The expense ratio may differ for each share class.
† Expenses are calculated by multiplying the expense ratio by the average account value for the period; then multiplying the result by the number of days in the period; and then dividing that result by the number of days in the year.
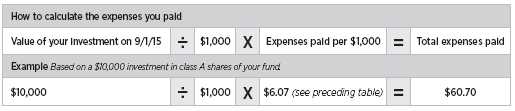
Estimate the expenses you paid
To estimate the ongoing expenses you paid for the six months ended 2/29/16, use the following calculation method. To find the value of your investment on 9/1/15, call Putnam at 1-800-225-1581.
Compare expenses using the SEC’s method
The Securities and Exchange Commission (SEC) has established guidelines to help investors assess fund expenses. Per these guidelines, the following table shows your fund’s expenses based on a $1,000 investment, assuming a hypothetical 5% annualized return . You can use this information to compare the ongoing expenses (but not transaction expenses or total costs) of investing in the fund with those of other funds. All mutual fund shareholder reports will provide this information to help you make this comparison. Please note that you cannot use this information to estimate your actual ending account balance and expenses paid during the period.
| Class A | Class B | Class C | Class M | Class R | Class Y | |
| Expenses paid per $1,000*† | $6.12 | $9.87 | $9.87 | $8.62 | $7.37 | $4.87 |
| Ending value (after expenses) | $1,018.80 | $1,015.07 | $1,015.07 | $1,016.31 | $1,017.55 | $1,020.04 |
* Expenses for each share class are calculated using the fund’s annualized expense ratio for each class, which represents the ongoing expenses as a percentage of average net assets for the six months ended 2/29/16. The expense ratio may differ for each share class.
† Expenses are calculated by multiplying the expense ratio by the average account value for the six-month period; then multiplying the result by the number of days in the six-month period; and then dividing that result by the number of days in the year.
| Global Utilities Fund 13 |
Terms and definitions
Important terms
Total return shows how the value of the fund’s shares changed over time, assuming you held the shares through the entire period and reinvested all distributions in the fund.
Before sales charge , or net asset value, is the price, or value, of one share of a mutual fund, without a sales charge. Before-sales-charge figures fluctuate with market conditions, and are calculated by dividing the net assets of each class of shares by the number of outstanding shares in the class.
After sales charge is the price of a mutual fund share plus the maximum sales charge levied at the time of purchase. After-sales-charge performance figures shown here assume the 5.75% maximum sales charge for class A shares and 3.50% for class M shares.
Contingent deferred sales charge (CDSC) is generally a charge applied at the time of the redemption of class B or C shares and assumes redemption at the end of the period. Your fund’s class B CDSC declines over time from a 5% maximum during the first year to 1% during the sixth year. After the sixth year, the CDSC no longer applies. The CDSC for class C shares is 1% for one year after purchase.
Share classes
Class A shares are generally subject to an initial sales charge and no CDSC (except on certain redemptions of shares bought without an initial sales charge).
Class B shares are not subject to an initial sales charge and may be subject to a CDSC.
Class C shares are not subject to an initial sales charge and are subject to a CDSC only if the shares are redeemed during the first year.
Class M shares have a lower initial sales charge and a higher 12b-1 fee than class A shares and no CDSC.
Class R shares are not subject to an initial sales charge or CDSC and are available only to employer-sponsored retirement plans.
Class Y shares are not subject to an initial sales charge or CDSC, and carry no 12b-1 fee. They are generally only available to corporate and institutional clients and clients in other approved programs.
Comparative indexes
Barclays U.S. Aggregate Bond Index is an unmanaged index of U.S. investment-grade fixed-income securities.
BofA Merrill Lynch U.S. 3-Month Treasury Bill Index is an unmanaged index that seeks to measure the performance of U.S. Treasury bills available in the marketplace.
MSCI World Utilities Index (ND) is a free float-adjusted market capitalization weighted index that is designed to measure the equity market performance of developed markets in the utilities sector.
S&P 500 Index is an unmanaged index of common stock performance.
Indexes assume reinvestment of all distributions and do not account for fees. Securities and performance of a fund and an index will differ. You cannot invest directly in an index.
| 14 Global Utilities Fund |
Other information for shareholders
Important notice regarding delivery of shareholder documents
In accordance with Securities and Exchange Commission (SEC) regulations, Putnam sends a single copy of annual and semiannual shareholder reports, prospectuses, and proxy statements to Putnam shareholders who share the same address, unless a shareholder requests otherwise. If you prefer to receive your own copy of these documents, please call Putnam at 1-800-225-1581, and Putnam will begin sending individual copies within 30 days.
Proxy voting
Putnam is committed to managing our mutual funds in the best interests of our shareholders. The Putnam funds’ proxy voting guidelines and procedures, as well as information regarding how your fund voted proxies relating to portfolio securities during the 12-month period ended June 30, 2015, are available in the Individual Investors section of putnam.com, and on the SEC’s website, www.sec.gov. If you have questions about finding forms on the SEC’s website, you may call the SEC at 1-800-SEC-0330. You may also obtain the Putnam funds’ proxy voting guidelines and procedures at no charge by calling Putnam’s Shareholder Services at 1-800-225-1581.
Fund portfolio holdings
The fund will file a complete schedule of its portfolio holdings with the SEC for the first and third quarters of each fiscal year on Form N-Q. Shareholders may obtain the fund’s Form N-Q on the SEC’s website at www.sec.gov. In addition, the fund’s Form N-Q may be reviewed and copied at the SEC’s Public Reference Room in Washington, D.C. You may call the SEC at 1-800-SEC-0330 for information about the SEC’s website or the operation of the Public Reference Room.
Trustee and employee fund ownership
Putnam employees and members of the Board of Trustees place their faith, confidence, and, most importantly, investment dollars in Putnam mutual funds. As of February 29, 2016, Putnam employees had approximately $457,000,000 and the Trustees had approximately $123,000,000 invested in Putnam mutual funds. These amounts include investments by the Trustees’ and employees’ immediate family members as well as investments through retirement and deferred compensation plans.
| Global Utilities Fund 15 |
Financial statements
A guide to financial statements
These sections of the report, as well as the accompanying Notes, constitute the fund’s financial statements.
The fund’s portfolio lists all the fund’s investments and their values as of the last day of the reporting period. Holdings are organized by asset type and industry sector, country, or state to show areas of concentration and diversification.
Statement of assets and liabilities shows how the fund’s net assets and share price are determined. All investment and non-investment assets are added together. Any unpaid expenses and other liabilities are subtracted from this total. The result is divided by the number of shares to determine the net asset value per share, which is calculated separately for each class of shares. (For funds with preferred shares, the amount subtracted from total assets includes the liquidation preference of preferred shares.)
Statement of operations shows the fund’s net investment gain or loss. This is done by first adding up all the fund’s earnings — from dividends and interest income — and subtracting its operating expenses to determine net investment income (or loss). Then, any net gain or loss the fund realized on the sales of its holdings — as well as any unrealized gains or losses over the period — is added to or subtracted from the net investment result to determine the fund’s net gain or loss for the fiscal period.
Statement of changes in net assets shows how the fund’s net assets were affected by the fund’s net investment gain or loss, by distributions to shareholders, and by changes in the number of the fund’s shares. It lists distributions and their sources (net investment income or realized capital gains) over the current reporting period and the most recent fiscal year-end. The distributions listed here may not match the sources listed in the Statement of operations because the distributions are determined on a tax basis and may be paid in a different period from the one in which they were earned. Dividend sources are estimated at the time of declaration. Actual results may vary. Any non-taxable return of capital cannot be determined until final tax calculations are completed after the end of the fund’s fiscal year.
Financial highlights provide an overview of the fund’s investment results, per-share distributions, expense ratios, net investment income ratios, and portfolio turnover in one summary table, reflecting the five most recent reporting periods. In a semiannual report, the highlights table also includes the current reporting period.
| 16 Global Utilities Fund |
The fund’s portfolio 2/29/16 (Unaudited)
| COMMON STOCKS (94.0%)* | Shares | Value | ||||||||
| Diversified telecommunication services (2.2%) | ||||||||||
| Com Hem Holding AB (Sweden) | 445,870 | $3,884,757 | ||||||||
| 3,884,757 | ||||||||||
| Electric utilities (35.6%) | ||||||||||
| American Electric Power Co., Inc. | 157,750 | 9,741,063 | ||||||||
| Duke Energy Corp. | 105,000 | 7,799,400 | ||||||||
| Edison International | 107,235 | 7,309,138 | ||||||||
| Entergy Corp. | 11,507 | 830,920 | ||||||||
| Exelon Corp. | 393,700 | 12,397,613 | ||||||||
| Iberdrola SA (Spain) | 449,993 | 2,908,223 | ||||||||
| NextEra Energy, Inc. | 122,500 | 13,820,450 | ||||||||
| SSE PLC (United Kingdom) | 320,278 | 6,132,551 | ||||||||
| 60,939,358 | ||||||||||
| Gas utilities (1.2%) | ||||||||||
| Snam SpA (Italy) | 388,155 | 2,087,185 | ||||||||
| 2,087,185 | ||||||||||
| Independent power and renewable electricity producers (13.1%) | ||||||||||
| Calpine Corp. † | 554,984 | 6,970,599 | ||||||||
| Dynegy, Inc. † | 94,984 | 957,439 | ||||||||
| EDP Renovaveis SA (Spain) | 983,946 | 7,074,951 | ||||||||
| Electric Power Development Co., Ltd. (Japan) | 92,900 | 2,860,017 | ||||||||
| NextEra Energy Partners LP | 7,000 | 181,580 | ||||||||
| NRG Energy, Inc. | 410,900 | 4,429,502 | ||||||||
| 22,474,088 | ||||||||||
| Media (1.4%) | ||||||||||
| Comcast Corp. Class A | 16,000 | 923,680 | ||||||||
| Numericable Sfr SA (France) | 40,414 | 1,463,862 | ||||||||
| 2,387,542 | ||||||||||
| Multi-utilities (31.7%) | ||||||||||
| Centrica PLC (United Kingdom) | 1,709,897 | 4,909,934 | ||||||||
| Dominion Resources, Inc. | 24,700 | 1,727,024 | ||||||||
| ENGIE SA (France) | 140,853 | 2,182,909 | ||||||||
| National Grid PLC (United Kingdom) | 746,726 | 9,969,270 | ||||||||
| PG&E Corp. | 240,756 | 13,658,088 | ||||||||
| Public Service Enterprise Group, Inc. | 56,900 | 2,427,354 | ||||||||
| RWE AG (Germany) | 59,695 | 685,322 | ||||||||
| Sempra Energy | 83,543 | 8,062,735 | ||||||||
| Veolia Environnement SA (France) | 407,155 | 9,224,493 | ||||||||
| WEC Energy Group, Inc. | 27,056 | 1,524,606 | ||||||||
| 54,371,735 | ||||||||||
| Water utilities (8.8%) | ||||||||||
| American Water Works Co., Inc. | 124,868 | 8,093,944 | ||||||||
| Severn Trent PLC (United Kingdom) | 90,063 | 2,663,945 | ||||||||
| United Utilities Group PLC (United Kingdom) | 332,328 | 4,260,154 | ||||||||
| 15,018,043 | ||||||||||
| Total common stocks (cost $141,110,894) | $161,162,708 | |||||||||
| Global Utilities Fund 17 |
| U.S. TREASURY OBLIGATIONS (0.3%)* | Principal amount | Value | ||||||||
| U.S. Treasury Notes | ||||||||||
| 1.750%, April 30, 2022 i | $281,000 | $287,488 | ||||||||
| 2.125%, August 15, 2021 i | 120,000 | 124,930 | ||||||||
| 1.875%, October 31, 2022 i | 71,000 | 73,124 | ||||||||
| Total U.S. treasury obligations (cost $485,542) | $485,542 | |||||||||
| SHORT-TERM INVESTMENTS (5.0%)* | Principal amount/shares | Value | ||||||||
| Putnam Short Term Investment Fund 0.41% L | Shares | 8,177,028 | $8,177,028 | |||||||
| SSgA Prime Money Market fund Class N 0.37% P | Shares | 230,000 | 230,000 | |||||||
| U.S. Treasury Bills 0.26%, April 21, 2016 | $109,000 | 108,956 | ||||||||
| U.S. Treasury Bills 0.07%, April 7, 2016 | 81,000 | 80,980 | ||||||||
| Total short-term investments (cost $8,596,983) | $8,596,964 | |||||||||
| TOTAL INVESTMENTS | ||||||||||
| Total investments (cost $150,193,419) | $170,245,214 | |||||||||
Notes to the fund’s portfolio
Unless noted otherwise, the notes to the fund’s portfolio are for the close of the fund’s reporting period, which ran from September 1, 2015 through February 29, 2016 (the reporting period). Within the following notes to the portfolio, references to “ASC 820” represent Accounting Standards Codification 820 Fair Value Measurements and Disclosures and references to “OTC”, if any, represent over-the-counter.
* Percentages indicated are based on net assets of $171,365,072.
† This security is non-income-producing.
i This security was pledged, or purchased with cash that was pledged, to the fund for collateral on certain derivative contracts (Note 1).
L Affiliated company (Note 5). The rate quoted in the security description is the annualized 7-day yield of the fund at the close of the reporting period.
P This security was pledged, or purchased with cash that was pledged, to the fund for collateral on certain derivative contracts. The rate quoted in the security description is the annualized 7-day yield of the fund at the close of the reporting period (Note 1).
At the close of the reporting period, the fund maintained liquid assets totaling $27,713 to cover certain derivative contracts.
Unless otherwise noted, the rates quoted in Short-term investments security descriptions represent the weighted average yield to maturity.
Debt obligations are considered secured unless otherwise indicated.
The dates shown on debt obligations are the original maturity dates.
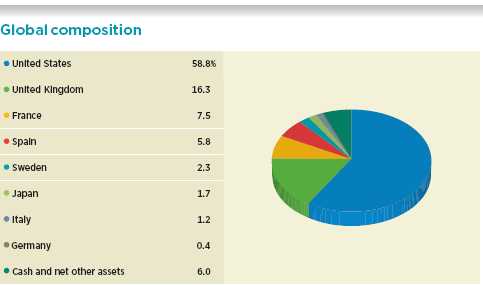
| DIVERSIFICATION BY COUNTRY ⌂ |
| United States | 64.4% | Japan | 1.7% | |
| United Kingdom | 16.5 | Italy | 1.2 | |
| France | 7.6 | Germany | 0.4 | |
| Spain | 5.9 | Total | 100.0% | |
| Sweden | 2.3 | |||
⌂ Methodology differs from that used for purposes of complying with the fund’s policy regarding investments in securities of foreign issuers, as discussed further in the fund’s prospectus.
| 18 Global Utilities Fund |
| FORWARD CURRENCY CONTRACTS at 2/29/16 (aggregate face value $50,418,705) (Unaudited) | ||||||
| Unrealized | ||||||
| Contract | Delivery | Aggregate | appreciation/ | |||
| Counterparty | Currency | type | date | Value | face value | (depreciation) |
| Bank of America N.A. | ||||||
| Euro | Buy | 3/16/16 | $428,236 | $430,102 | $(1,866) | |
| Euro | Sell | 3/16/16 | 428,236 | 427,472 | (764) | |
| Barclays Bank PLC | ||||||
| Canadian Dollar | Buy | 4/20/16 | 46,344 | 45,100 | 1,244 | |
| Hong Kong Dollar | Buy | 5/18/16 | 8,129,030 | 8,127,671 | 1,359 | |
| Japanese Yen | Buy | 5/18/16 | 186,055 | 173,415 | 12,640 | |
| Citibank, N.A. | ||||||
| Australian Dollar | Buy | 4/20/16 | 390,121 | 391,540 | (1,419) | |
| Euro | Buy | 3/16/16 | 1,398,650 | 1,369,181 | 29,469 | |
| Japanese Yen | Buy | 5/18/16 | 144,922 | 135,053 | 9,869 | |
| Credit Suisse International | ||||||
| Canadian Dollar | Sell | 4/20/16 | 427,146 | 415,914 | (11,232) | |
| Euro | Buy | 3/16/16 | 69,758 | 68,296 | 1,462 | |
| New Zealand Dollar | Buy | 4/20/16 | 856,348 | 872,672 | (16,324) | |
| Deutsche Bank AG | ||||||
| Australian Dollar | Buy | 4/20/16 | 430,002 | 431,620 | (1,618) | |
| Euro | Buy | 3/16/16 | 1,386,135 | 1,301,402 | 84,733 | |
| Goldman Sachs International | ||||||
| Euro | Buy | 3/16/16 | 1,616,849 | 1,639,431 | (22,582) | |
| Japanese Yen | Buy | 5/18/16 | 3,987,604 | 3,715,087 | 272,517 | |
| HSBC Bank USA, National Association | ||||||
| Australian Dollar | Buy | 4/20/16 | 768,634 | 771,430 | (2,796) | |
| Canadian Dollar | Sell | 4/20/16 | 471,568 | 458,963 | (12,605) | |
| Euro | Buy | 3/16/16 | 1,333,463 | 1,305,520 | 27,943 | |
| JPMorgan Chase Bank N.A. | ||||||
| Canadian Dollar | Buy | 4/20/16 | 2,857,052 | 2,781,398 | 75,654 | |
| Japanese Yen | Buy | 5/18/16 | 1,850,366 | 1,724,768 | 125,598 | |
| Swedish Krona | Sell | 3/16/16 | 3,013,964 | 2,975,302 | (38,662) | |
| State Street Bank and Trust Co. | ||||||
| British Pound | Sell | 3/16/16 | 6,738,357 | 7,286,036 | 547,679 | |
| Euro | Buy | 3/16/16 | 1,516,946 | 1,523,687 | (6,741) | |
| Euro | Sell | 3/16/16 | 1,516,946 | 1,529,454 | 12,508 | |
| Japanese Yen | Buy | 5/18/16 | 470,855 | 442,275 | 28,580 | |
| Swedish Krona | Sell | 3/16/16 | 615,273 | 607,347 | (7,926) | |
| UBS AG | ||||||
| Australian Dollar | Buy | 4/20/16 | 1,854,820 | 1,861,879 | (7,059) | |
| British Pound | Sell | 3/16/16 | 4,892,968 | 5,302,232 | 409,264 | |
| Japanese Yen | Buy | 5/18/16 | 2,086,403 | 1,946,605 | 139,798 | |
| WestPac Banking Corp. | ||||||
| Euro | Buy | 3/16/16 | 365,660 | 357,853 | 7,807 | |
| Total | $1,656,530 | |||||
| Global Utilities Fund 19 |
ASC 820 establishes a three-level hierarchy for disclosure of fair value measurements. The valuation hierarchy is based upon the transparency of inputs to the valuation of the fund’s investments. The three levels are defined as follows:
Level 1: Valuations based on quoted prices for identical securities in active markets.
Level 2: Valuations based on quoted prices in markets that are not active or for which all significant inputs are observable, either directly or indirectly.
Level 3: Valuations based on inputs that are unobservable and significant to the fair value measurement.
The following is a summary of the inputs used to value the fund’s net assets as of the close of the reporting period:
| Valuation inputs | |||
| Investments in securities: | Level 1 | Level 2 | Level 3 |
| Common stocks*: | |||
| Consumer discretionary | $923,680 | $1,463,862 | $— |
| Telecommunication services | — | 3,884,757 | — |
| Utilities | 99,931,455 | 54,958,954 | — |
| Total common stocks | 100,855,135 | 60,307,573 | — |
| U.S. treasury obligations | — | 485,542 | — |
| Short-term investments | 8,407,028 | 189,936 | — |
| Totals by level | $109,262,163 | $60,983,051 | $— |
| Valuation inputs | |||
| Other financial instruments: | Level 1 | Level 2 | Level 3 |
| Forward currency contracts | $— | $1,656,530 | $— |
| Totals by level | $— | $1,656,530 | $— |
* Common stock classifications are presented at the sector level, which may differ from the fund’s portfolio presentation.
During the reporting period, transfers within the fair value hierarchy, if any (other than certain transfers involving non-U.S. equity securities as described in Note 1), did not represent, in the aggregate, more than 1% of the fund’s net assets measured as of the end of the period. Transfers are accounted for using the end of period pricing valuation method.
The accompanying notes are an integral part of these financial statements.
| 20 Global Utilities Fund |
Statement of assets and liabilities 2/29/16 (Unaudited)
| ASSETS | |
| Investment in securities, at value (Note 1): | |
| Unaffiliated issuers (identified cost $142,016,391) | $162,068,186 |
| Affiliated issuers (identified cost $8,177,028) (Notes 1 and 5) | 8,177,028 |
| Cash | 63 |
| Dividends, interest and other receivables | 699,317 |
| Receivable for shares of the fund sold | 79,872 |
| Unrealized appreciation on forward currency contracts (Note 1) | 1,788,124 |
| Prepaid assets | 43,048 |
| Total assets | 172,855,638 |
| LIABILITIES | |
| Payable for shares of the fund repurchased | 176,722 |
| Payable for compensation of Manager (Note 2) | 85,776 |
| Payable for investor servicing fees (Note 2) | 53,074 |
| Payable for custodian fees (Note 2) | 5,026 |
| Payable for Trustee compensation and expenses (Note 2) | 172,530 |
| Payable for administrative services (Note 2) | 630 |
| Payable for distribution fees (Note 2) | 71,923 |
| Unrealized depreciation on forward currency contracts (Note 1) | 131,594 |
| Collateral on certain derivative contracts, at value (Note 1) | 715,542 |
| Other accrued expenses | 77,749 |
| Total liabilities | 1,490,566 |
| Net assets | $171,365,072 |
| REPRESENTED BY | |
| Paid-in capital (Unlimited shares authorized) (Notes 1 and 4) | $158,420,949 |
| Distributions in excess of net investment income (Note 1) | (312,103) |
| Accumulated net realized loss on investments and foreign currency transactions (Note 1) | (8,449,867) |
| Net unrealized appreciation of investments and assets and liabilities in foreign currencies | 21,706,093 |
| Total — Representing net assets applicable to capital shares outstanding | $171,365,072 |
| (Continued on next page) |
| Global Utilities Fund 21 |
Statement of assets and liabilities (Continued)
| COMPUTATION OF NET ASSET VALUE AND OFFERING PRICE | |
| Net asset value and redemption price per class A share | |
| ($156,521,527 divided by 13,652,196 shares) | $11.46 |
| Offering price per class A share (100/94.25 of $11.46)* | $12.16 |
| Net asset value and offering price per class B share ($3,944,982 divided by 345,379 shares)** | $11.42 |
| Net asset value and offering price per class C share ($5,348,881 divided by 470,439 shares)** | $11.37 |
| Net asset value and redemption price per class M share ($935,678 divided by 81,709 shares) | $11.45 |
| Offering price per class M share (100/96.50 of $11.45)* | $11.87 |
| Net asset value, offering price and redemption price per class R share | |
| ($216,398 divided by 18,881 shares) | $11.46 |
| Net asset value, offering price and redemption price per class Y share | |
| ($4,397,606 divided by 383,639 shares) | $11.46 |
* On single retail sales of less than $50,000. On sales of $50,000 or more the offering price is reduced.
** Redemption price per share is equal to net asset value less any applicable contingent deferred sales charge.
The accompanying notes are an integral part of these financial statements.
| 22 Global Utilities Fund |
Statement of operations Six months ended 2/29/16 (Unaudited)
| INVESTMENT INCOME | |
| Dividends (net of foreign tax of $32,059) | $2,511,300 |
| Interest (including interest income of $10,462 from investments in affiliated issuers) (Note 5) | 10,635 |
| Total investment income | 2,521,935 |
| EXPENSES | |
| Compensation of Manager (Note 2) | 536,205 |
| Investor servicing fees (Note 2) | 174,513 |
| Custodian fees (Note 2) | 8,498 |
| Trustee compensation and expenses (Note 2) | 7,218 |
| Distribution fees (Note 2) | 246,888 |
| Administrative services (Note 2) | 2,805 |
| Other | 108,052 |
| Total expenses | 1,084,179 |
| Expense reduction (Note 2) | (7,360) |
| Net expenses | 1,076,819 |
| Net investment income | 1,445,116 |
| Net realized gain on investments (Notes 1 and 3) | 1,878,405 |
| Net realized loss on foreign currency transactions (Note 1) | (226,855) |
| Net unrealized appreciation of assets and liabilities in foreign currencies during the period | 1,482,133 |
| Net unrealized depreciation of investments during the period | (4,484,727) |
| Net loss on investments | (1,351,044) |
| Net increase in net assets resulting from operations | $94,072 |
The accompanying notes are an integral part of these financial statements.
| Global Utilities Fund 23 |
Statement of changes in net assets
| DECREASE IN NET ASSETS | Six months ended 2/29/16* | Year ended 8/31/15 |
| Operations: | ||
| Net investment income | $1,445,116 | $3,286,708 |
| Net realized gain (loss) on investments | ||
| and foreign currency transactions | 1,651,550 | (906,887) |
| Net unrealized depreciation of investments and assets | ||
| and liabilities in foreign currencies | (3,002,594) | (18,542,056) |
| Net increase (decrease) in net assets resulting | ||
| from operations | 94,072 | (16,162,235) |
| Distributions to shareholders (Note 1): | ||
| From ordinary income | ||
| Net investment income | ||
| Class A | (1,490,089) | (3,275,268) |
| Class B | (21,986) | (49,978) |
| Class C | (24,843) | (49,894) |
| Class M | (6,787) | (14,752) |
| Class R | (1,276) | (20,061) |
| Class Y | (38,921) | (76,203) |
| Decrease from capital share transactions (Note 4) | (8,967,056) | (22,503,276) |
| Total decrease in net assets | (10,456,886) | (42,151,667) |
| NET ASSETS | ||
| Beginning of period | 181,821,958 | 223,973,625 |
| End of period (including distributions in excess of net | ||
| investment income of $312,103 and $173,317, respectively) | $171,365,072 | $181,821,958 |
* Unaudited.
The accompanying notes are an integral part of these financial statements.
| 24 Global Utilities Fund |
| This page left blank intentionally. |
| Global Utilities Fund 25 |
Financial highlights (For a common share outstanding throughout the period)
| INVESTMENT OPERATIONS: | LESS DISTRIBUTIONS: | RATIOS AND SUPPLEMENTAL DATA: | ||||||||||||
| Ratio | Ratio | |||||||||||||
| Net realized | of expenses | of net investment | ||||||||||||
| Net asset value, | and unrealized | Total from | From | Total return | Net assets, | to average | income (loss) | Portfolio | ||||||
| beginning | Net investment | gain (loss) | investment | net investment | Total | Redemption | Non-recurring | Net asset value, | at net asset | end of period | net assets | to average | turnover | |
| Period ended | of period | income (loss) a | on investments | operations | income | distributions | fees | reimbursements | end of period | value (%) b | (in thousands) | (%) c | net assets (%) | (%) |
| Class A | ||||||||||||||
| February 29, 2016** | $11.55 | .10 | (.08) | .02 | (.11) | (.11) | — | — | $11.46 | .16* | $156,522 | .61* | .85* | 6* |
| August 31, 2015 | 12.75 | .20 | (1.19) | (.99) | (.21) | (.21) | — | — | 11.55 | (7.85) | 166,801 | 1.19 | 1.61 | 15 |
| August 31, 2014 | 11.08 | .33 | 1.59 | 1.92 | (.25) | (.25) | — | — | 12.75 | 17.56 | 206,305 | 1.21 | 2.79 | 27 |
| August 31, 2013 | 10.35 | .25 | .75 | 1.00 | (.27) | (.27) | — d | — | 11.08 | 9.76 | 188,648 | 1.25 | 2.33 | 36 |
| August 31, 2012 | 10.30 | .29 | .08 | .37 | (.32) | (.32) | — d | — | 10.35 | 3.73 | 197,503 | 1.32 | 2.89 | 44 |
| August 31, 2011 | 10.63 | .36 | (.36) | — d | (.34) | (.34) | — d | .01 e | 10.30 | (.04) | 219,844 | 1.28 | 3.27 | 42 |
| Class B | ||||||||||||||
| February 29, 2016** | $11.50 | .05 | (.07) | (.02) | (.06) | (.06) | — | — | $11.42 | (.17)* | $3,945 | .98* | .47* | 6* |
| August 31, 2015 | 12.70 | .11 | (1.19) | (1.08) | (.12) | (.12) | — | — | 11.50 | (8.60) | 4,657 | 1.94 | .88 | 15 |
| August 31, 2014 | 11.04 | .24 | 1.58 | 1.82 | (.16) | (.16) | — | — | 12.70 | 16.65 | 5,505 | 1.96 | 2.04 | 27 |
| August 31, 2013 | 10.31 | .17 | .75 | .92 | (.19) | (.19) | — d | — | 11.04 | 8.98 | 5,291 | 2.00 | 1.58 | 36 |
| August 31, 2012 | 10.26 | .22 | .08 | .30 | (.25) | (.25) | — d | — | 10.31 | 2.97 | 5,753 | 2.07 | 2.14 | 44 |
| August 31, 2011 | 10.58 | .27 | (.35) | (.08) | (.25) | (.25) | — d | .01 e | 10.26 | (.75) | 5,889 | 2.03 | 2.50 | 42 |
| Class C | ||||||||||||||
| February 29, 2016** | $11.45 | .05 | (.07) | (.02) | (.06) | (.06) | — | — | $11.37 | (.16)* | $5,349 | .98* | .48* | 6* |
| August 31, 2015 | 12.65 | .11 | (1.19) | (1.08) | (.12) | (.12) | — | — | 11.45 | (8.61) | 4,841 | 1.94 | .89 | 15 |
| August 31, 2014 | 10.99 | .24 | 1.59 | 1.83 | (.17) | (.17) | — | — | 12.65 | 16.76 | 4,851 | 1.96 | 2.04 | 27 |
| August 31, 2013 | 10.27 | .17 | .74 | .91 | (.19) | (.19) | — d | — | 10.99 | 8.93 | 3,743 | 2.00 | 1.59 | 36 |
| August 31, 2012 | 10.23 | .22 | .07 | .29 | (.25) | (.25) | — d | — | 10.27 | 2.89 | 3,452 | 2.07 | 2.14 | 44 |
| August 31, 2011 | 10.55 | .28 | (.35) | (.07) | (.26) | (.26) | — d | .01 e | 10.23 | (.70) | 3,698 | 2.03 | 2.54 | 42 |
| Class M | ||||||||||||||
| February 29, 2016** | $11.54 | .07 | (.08) | (.01) | (.08) | (.08) | — | — | $11.45 | (.10)* | $936 | .86* | .61* | 6* |
| August 31, 2015 | 12.74 | .14 | (1.19) | (1.05) | (.15) | (.15) | — | — | 11.54 | (8.34) | 1,040 | 1.69 | 1.12 | 15 |
| August 31, 2014 | 11.07 | .27 | 1.60 | 1.87 | (.20) | (.20) | — | — | 12.74 | 17.00 | 1,319 | 1.71 | 2.30 | 27 |
| August 31, 2013 | 10.34 | .20 | .74 | .94 | (.21) | (.21) | — d | — | 11.07 | 9.21 | 1,259 | 1.75 | 1.83 | 36 |
| August 31, 2012 | 10.29 | .24 | .08 | .32 | (.27) | (.27) | — d | — | 10.34 | 3.20 | 1,284 | 1.82 | 2.38 | 44 |
| August 31, 2011 | 10.61 | .30 | (.35) | (.05) | (.28) | (.28) | — d | .01 e | 10.29 | (.45) | 1,440 | 1.78 | 2.78 | 42 |
| Class R | ||||||||||||||
| February 29, 2016** | $11.51 | .06 f | (.05) | .01 | (.06) | (.06) | — | — | $11.46 | .05* | $216 | .73* | .54* f | 6* |
| August 31, 2015 | 12.71 | .17 | (1.19) | (1.02) | (.18) | (.18) | — | — | 11.51 | (8.12) | 1,099 | 1.44 | 1.37 | 15 |
| August 31, 2014 | 11.04 | .30 | 1.59 | 1.89 | (.22) | (.22) | — | — | 12.71 | 17.33 | 1,430 | 1.46 | 2.52 | 27 |
| August 31, 2013 | 10.32 | .23 | .73 | .96 | (.24) | (.24) | — d | — | 11.04 | 9.43 | 1,349 | 1.50 | 2.09 | 36 |
| August 31, 2012 | 10.27 | .27 | .08 | .35 | (.30) | (.30) | — d | — | 10.32 | 3.48 | 1,269 | 1.57 | 2.63 | 44 |
| August 31, 2011 | 10.60 | .33 | (.36) | (.03) | (.31) | (.31) | — d | .01 e | 10.27 | (.28) | 1,205 | 1.53 | 3.05 | 42 |
| Class Y | ||||||||||||||
| February 29, 2016** | $11.55 | .11 | (.08) | .03 | (.12) | (.12) | — | — | $11.46 | .29* | $4,398 | .48* | 1.00* | 6* |
| August 31, 2015 | 12.75 | .23 | (1.19) | (.96) | (.24) | (.24) | — | — | 11.55 | (7.62) | 3,384 | .94 | 1.85 | 15 |
| August 31, 2014 | 11.08 | .37 | 1.58 | 1.95 | (.28) | (.28) | — | — | 12.75 | 17.84 | 4,564 | .96 | 3.10 | 27 |
| August 31, 2013 | 10.36 | .29 | .73 | 1.02 | (.30) | (.30) | — d | — | 11.08 | 9.94 | 3,520 | 1.00 | 2.61 | 36 |
| August 31, 2012 | 10.30 | .32 | .09 | .41 | (.35) | (.35) | — d | — | 10.36 | 4.08 | 2,799 | 1.07 | 3.13 | 44 |
| August 31, 2011 | 10.63 | .39 | (.36) | .03 | (.37) | (.37) | — d | .01 e | 10.30 | .22 | 3,082 | 1.03 | 3.53 | 42 |
See notes to financial highlights at the end of this section.
The accompanying notes are an integral part of these financial statements.
| 26 Global Utilities Fund | Global Utilities Fund 27 |
Financial highlights (Continued)
* Not annualized.
** Unaudited.
a Per share net investment income (loss) has been determined on the basis of the weighted average number of shares outstanding during the period.
b Total return assumes dividend reinvestment and does not reflect the effect of sales charges.
c Includes amounts paid through expense offset and brokerage/service arrangements, if any (Note 2). Also excludes acquired fund fees and expenses, if any.
d Amount represents less than $0.01 per share.
e Reflects a non-recurring reimbursement related to restitution amounts in connection with a distribution plan approved by the Securities and Exchange Commission (SEC) which amounted to $0.01 per share outstanding on July 21, 2011. Also reflects a non-recurring reimbursement related to short-term trading related lawsuits, which amounted to less than $0.01 per share outstanding on May 11, 2011.
f The net investment income ratio and per share amount shown for the period ending February 29, 2016 may not correspond with the expected class specific differences for the period due to the timing of redemptions out of the class.
The accompanying notes are an integral part of these financial statements.
| 28 Global Utilities Fund |
Notes to financial statements 2/29/16 (Unaudited)
Within the following Notes to financial statements, references to “State Street” represent State Street Bank and Trust Company, references to “the SEC” represent the Securities and Exchange Commission, references to “Putnam Management” represent Putnam Investment Management, LLC, the fund’s manager, an indirect wholly-owned subsidiary of Putnam Investments, LLC and references to “OTC”, if any, represent over-the-counter. Unless otherwise noted, the “reporting period” represents the period from September 1, 2015 through February 29, 2016.
Putnam Global Utilities Fund (the fund) is a Massachusetts business trust, which is registered under the Investment Company Act of 1940, as amended, as a non-diversified, open-end management investment company. The goal of the fund is to seek capital growth and current income. The fund concentrates in the utilities industries and invests mainly in common stocks (growth or value stocks or both) of large and midsize companies worldwide that Putnam Management believes have favorable investment potential. Under normal circumstances, the fund invests at least 80% of its net assets in securities of companies worldwide in the utilities industries. This policy may be changed only after 60 days’ notice to shareholders. Potential investments include electric, gas or water utilities and companies that operate as independent producers and/or distributors of power. The fund may purchase stocks of companies with stock prices that reflect a value lower than that which Putnam Management places on the company. Putnam Management may also consider other factors that it believes will cause the stock price to rise. Putnam Management may consider, among other factors, a company’s valuation, financial strength, growth potential, competitive position in its industry, projected future earnings, cash flows and dividends when deciding whether to buy or sell investments.
The fund offers class A, class B, class C, class M, class R and class Y shares. Class A and class M shares are sold with a maximum front-end sales charge of 5.75% and 3.50%, respectively. Class A shares generally are not subject to a contingent deferred sales charge, and effective November 1, 2015, class M shares are not subject to a contingent deferred sales charge. Class B shares, which convert to class A shares after approximately eight years, do not pay a front-end sales charge and are subject to a contingent deferred sales charge if those shares are redeemed within six years of purchase. Class C shares have a one-year 1.00% contingent deferred sales charge and do not convert to class A shares. Class R shares, which are not available to all investors, are sold at net asset value. The expenses for class A, class B, class C, class M and class R shares may differ based on the distribution fee of each class, which is identified in Note 2. Class Y shares, which are sold at net asset value, are generally subject to the same expenses as class A, class B, class C, class M and class R shares, but do not bear a distribution fee. Class Y shares are not available to all investors.
In the normal course of business, the fund enters into contracts that may include agreements to indemnify another party under given circumstances. The fund’s maximum exposure under these arrangements is unknown as this would involve future claims that may be, but have not yet been, made against the fund. However, the fund’s management team expects the risk of material loss to be remote.
Note 1: Significant accounting policies
The following is a summary of significant accounting policies consistently followed by the fund in the preparation of its financial statements. The preparation of financial statements is in conformity with accounting principles generally accepted in the United States of America and requires management to make estimates and assumptions that affect the reported amounts of assets and liabilities in the financial statements and the reported amounts of increases and decreases in net assets from operations. Actual results could differ from those estimates. Subsequent events after the Statement of assets and liabilities date through the date that the financial statements were issued have been evaluated in the preparation of the financial statements.
Investment income, realized and unrealized gains and losses and expenses of the fund are borne pro-rata based on the relative net assets of each class to the total net assets of the fund, except that each class bears expenses unique to that class (including the distribution fees applicable to such classes). Each class votes as a class only with respect to its own distribution plan or other matters on which a class vote is required by law or determined by the Trustees. If the fund were liquidated, shares of each class would receive their pro-rata share of the net assets of the fund. In addition, the Trustees declare separate dividends on each class of shares.
Security valuation Portfolio securities and other investments are valued using policies and procedures adopted by the Board of Trustees. The Trustees have formed a Pricing Committee to oversee the implementation of these procedures and have delegated responsibility for valuing the fund’s assets in accordance with these procedures to Putnam Management. Putnam Management has established an internal Valuation Committee that is responsible
| Global Utilities Fund 29 |
for making fair value determinations, evaluating the effectiveness of the pricing policies of the fund and reporting to the Pricing Committee.
Investments for which market quotations are readily available are valued at the last reported sales price on their principal exchange, or official closing price for certain markets, and are classified as Level 1 securities under Accounting Standards Codification 820 Fair Value Measurements and Disclosures (ASC 820). If no sales are reported, as in the case of some securities that are traded OTC, a security is valued at its last reported bid price and is generally categorized as a Level 2 security.
Investments in open-end investment companies (excluding exchange-traded funds), if any, which can be classified as Level 1 or Level 2 securities, are valued based on their net asset value. The net asset value of such investment companies equals the total value of their assets less their liabilities and divided by the number of their outstanding shares.
Market quotations are not considered to be readily available for certain debt obligations and other investments; such investments are valued on the basis of valuations furnished by an independent pricing service approved by the Trustees or dealers selected by Putnam Management. Such services or dealers determine valuations for normal institutional-size trading units of such securities using methods based on market transactions for comparable securities and various relationships, generally recognized by institutional traders, between securities (which consider such factors as security prices, yields, maturities and ratings). These securities will generally be categorized as Level 2. Short-term securities with remaining maturities of 60 days or less may be valued at amortized cost, which approximates fair value, and are classified as Level 2 securities.
Many securities markets and exchanges outside the U.S. close prior to the close of the New York Stock Exchange and therefore the closing prices for securities in such markets or on such exchanges may not fully reflect events that occur after such close but before the close of the New York Stock Exchange. Accordingly, on certain days, the fund will fair value foreign equity securities taking into account multiple factors including movements in the U.S. securities markets, currency valuations and comparisons to the valuation of American Depository Receipts, exchange-traded funds and futures contracts. These securities, which would generally be classified as Level 1 securities, will be transferred to Level 2 of the fair value hierarchy when they are valued at fair value. The number of days on which fair value prices will be used will depend on market activity and it is possible that fair value prices will be used by the fund to a significant extent. At the close of the reporting period, fair value pricing was used for certain foreign securities in the portfolio. Securities quoted in foreign currencies, if any, are translated into U.S. dollars at the current exchange rate.
To the extent a pricing service or dealer is unable to value a security or provides a valuation that Putnam Management does not believe accurately reflects the security’s fair value, the security will be valued at fair value by Putnam Management in accordance with policies and procedures approved by the Trustees. Certain investments, including certain restricted and illiquid securities and derivatives, are also valued at fair value following procedures approved by the Trustees. These valuations consider such factors as significant market or specific security events such as interest rate or credit quality changes, various relationships with other securities, discount rates, U.S. Treasury, U.S. swap and credit yields, index levels, convexity exposures, recovery rates, sales and other multiples and resale restrictions. These securities are classified as Level 2 or as Level 3 depending on the priority of the significant inputs.
To assess the continuing appropriateness of fair valuations, the Valuation Committee reviews and affirms the reasonableness of such valuations on a regular basis after considering all relevant information that is reasonably available. Such valuations and procedures are reviewed periodically by the Trustees. The fair value of securities is generally determined as the amount that the fund could reasonably expect to realize from an orderly disposition of such securities over a reasonable period of time. By its nature, a fair value price is a good faith estimate of the value of a security in a current sale and does not reflect an actual market price, which may be different by a material amount.
Security transactions and related investment income Security transactions are recorded on the trade date (the date the order to buy or sell is executed). Gains or losses on securities sold are determined on the identified cost basis.
Interest income, net of any applicable withholding taxes, is recorded on the accrual basis. Dividend income, net of any applicable withholding taxes, is recognized on the ex-dividend date except that certain dividends from foreign securities, if any, are recognized as soon as the fund is informed of the ex-dividend date. Non-cash dividends, if any, are recorded at the fair value of the securities received. Dividends representing a return of capital or capital gains, if any, are reflected as a reduction of cost and/or as a realized gain. All premiums/discounts are amortized/accreted on a yield-to-maturity basis.
| 30 Global Utilities Fund |
Foreign currency translation The accounting records of the fund are maintained in U.S. dollars. The fair value of foreign securities, currency holdings, and other assets and liabilities is recorded in the books and records of the fund after translation to U.S. dollars based on the exchange rates on that day. The cost of each security is determined using historical exchange rates. Income and withholding taxes are translated at prevailing exchange rates when earned or incurred. The fund does not isolate that portion of realized or unrealized gains or losses resulting from changes in the foreign exchange rate on investments from fluctuations arising from changes in the market prices of the securities. Such gains and losses are included with the net realized and unrealized gain or loss on investments. Net realized gains and losses on foreign currency transactions represent net realized exchange gains or losses on closed forward currency contracts, disposition of foreign currencies, currency gains and losses realized between the trade and settlement dates on securities transactions and the difference between the amount of investment income and foreign withholding taxes recorded on the fund’s books and the U.S. dollar equivalent amounts actually received or paid. Net unrealized appreciation and depreciation of assets and liabilities in foreign currencies arise from changes in the value of open forward currency contracts and assets and liabilities other than investments at the period end, resulting from changes in the exchange rate.
Forward currency contracts The fund buys and sells forward currency contracts, which are agreements between two parties to buy and sell currencies at a set price on a future date. These contracts are used to hedge foreign exchange risk.
The U.S. dollar value of forward currency contracts is determined using current forward currency exchange rates supplied by a quotation service. The fair value of the contract will fluctuate with changes in currency exchange rates. The contract is marked to market daily and the change in fair value is recorded as an unrealized gain or loss. The fund records a realized gain or loss equal to the difference between the value of the contract at the time it was opened and the value at the time it was closed when the contract matures or by delivery of the currency. The fund could be exposed to risk if the value of the currency changes unfavorably, if the counterparties to the contracts are unable to meet the terms of their contracts or if the fund is unable to enter into a closing position. Risks may exceed amounts recognized on the Statement of assets and liabilities.
Forward currency contracts outstanding at period end, if any, are listed after the fund’s portfolio.
Master agreements The fund is a party to ISDA (International Swaps and Derivatives Association, Inc.) Master Agreements (Master Agreements) with certain counterparties that govern OTC derivative and foreign exchange contracts entered into from time to time. The Master Agreements may contain provisions regarding, among other things, the parties’ general obligations, representations, agreements, collateral requirements, events of default and early termination. With respect to certain counterparties, in accordance with the terms of the Master Agreements, collateral posted to the fund is held in a segregated account by the fund’s custodian and, with respect to those amounts which can be sold or repledged, is presented in the fund’s portfolio. Collateral posted to the fund which cannot be sold or repledged totaled $821,605 at the close of the reporting period.
Collateral pledged by the fund is segregated by the fund’s custodian and identified in the fund’s portfolio. Collateral can be in the form of cash or debt securities issued by the U.S. Government or related agencies or other securities as agreed to by the fund and the applicable counterparty. Collateral requirements are determined based on the fund’s net position with each counterparty.
Termination events applicable to the fund may occur upon a decline in the fund’s net assets below a specified threshold over a certain period of time. Termination events applicable to counterparties may occur upon a decline in the counterparty’s long-term and short-term credit ratings below a specified level. In each case, upon occurrence, the other party may elect to terminate early and cause settlement of all derivative and foreign exchange contracts outstanding, including the payment of any losses and costs resulting from such early termination, as reasonably determined by the terminating party. Any decision by one or more of the fund’s counterparties to elect early termination could impact the fund’s future derivative activity.
At the close of the reporting period, the fund had a net liability position of $28,724 on open derivative contracts subject to the Master Agreements. There was no collateral posted by the fund at period end for these agreements.
Interfund lending The fund, along with other Putnam funds, may participate in an interfund lending program pursuant to an exemptive order issued by the SEC. This program allows the fund to borrow from or lend to other Putnam funds that permit such transactions. Interfund lending transactions are subject to each fund’s investment policies and borrowing and lending limits. Interest earned or paid on the interfund lending transaction will be based on the average of certain current market rates. During the reporting period, the fund did not utilize the program.
| Global Utilities Fund 31 |
Lines of credit The fund participates, along with other Putnam funds, in a $392.5 million syndicated unsecured committed line of credit provided by State Street ($292.5 million) and Northern Trust Company ($100 million) and a $235.5 million unsecured uncommitted line of credit provided by State Street. Borrowings may be made for temporary or emergency purposes, including the funding of shareholder redemption requests and trade settlements. Interest is charged to the fund based on the fund’s borrowing at a rate equal to the higher of (1) the Federal Funds rate and (2) the overnight LIBOR plus 1.25% for the committed line of credit and the Federal Funds rate plus 1.30% for the uncommitted line of credit. A closing fee equal to 0.04% of the committed line of credit and 0.04% of the uncommitted line of credit has been paid by the participating funds. In addition, a commitment fee of 0.16% per annum on any unutilized portion of the committed line of credit is allocated to the participating funds based on their relative net assets and paid quarterly. During the reporting period, the fund had no borrowings against these arrangements.
Federal taxes It is the policy of the fund to distribute all of its taxable income within the prescribed time period and otherwise comply with the provisions of the Internal Revenue Code of 1986, as amended (the Code), applicable to regulated investment companies. It is also the intention of the fund to distribute an amount sufficient to avoid imposition of any excise tax under Section 4982 of the Code.
The fund is subject to the provisions of Accounting Standards Codification 740 Income Taxes (ASC 740). ASC 740 sets forth a minimum threshold for financial statement recognition of the benefit of a tax position taken or expected to be taken in a tax return. The fund did not have a liability to record for any unrecognized tax benefits in the accompanying financial statements. No provision has been made for federal taxes on income, capital gains or unrealized appreciation on securities held nor for excise tax on income and capital gains. Each of the fund’s federal tax returns for the prior three fiscal years remains subject to examination by the Internal Revenue Service.
The fund may also be subject to taxes imposed by governments of countries in which it invests. Such taxes are generally based on either income or gains earned or repatriated. The fund accrues and applies such taxes to net investment income, net realized gains and net unrealized gains as income and/or capital gains are earned. In some cases, the fund may be entitled to reclaim all or a portion of such taxes, and such reclaim amounts, if any, are reflected as an asset on the fund’s books. In many cases, however, the fund may not receive such amounts for an extended period of time, depending on the country of investment.
At August 31, 2015, the fund had a capital loss carryover of $10,077,248 available to the extent allowed by the Code to offset future net capital gain, if any. The amounts of the carryovers and the expiration dates are:
| Loss carryover | |||
| Short-term | Long-term | Total | Expiration |
| $10,077,248 | N/A | $10,077,248 | August 31, 2017 |
Under the Regulated Investment Company Modernization Act of 2010, the fund will be permitted to carry forward capital losses incurred in taxable years beginning after December 22, 2010 for an unlimited period. However, any losses incurred will be required to be utilized prior to the losses incurred in pre-enactment tax years. As a result of this ordering rule, pre-enactment capital loss carryforwards may be more likely to expire unused. Additionally, post-enactment capital losses that are carried forward will retain their character as either short-term or long-term capital losses rather than being considered all short-term as under previous law.
The aggregate identified cost on a tax basis is $150,217,588, resulting in gross unrealized appreciation and depreciation of $38,457,352 and $18,429,726, respectively, or net unrealized appreciation of $20,027,626.
Distributions to shareholders Distributions to shareholders from net investment income are recorded by the fund on the ex-dividend date. Distributions from capital gains, if any, are recorded on the ex-dividend date and paid at least annually. The amount and character of income and gains to be distributed are determined in accordance with income tax regulations, which may differ from generally accepted accounting principles. Dividend sources are estimated at the time of declaration. Actual results may vary. Any non-taxable return of capital cannot be determined until final tax calculations are completed after the end of the fund’s fiscal year. Reclassifications are made to the fund’s capital accounts to reflect income and gains available for distribution (or available capital loss carryovers) under income tax regulations.
| 32 Global Utilities Fund |
Note 2: Management fee, administrative services and other transactions
The fund pays Putnam Management a management fee (based on the fund’s average net assets and computed and paid monthly) at annual rates that may vary based on the average of the aggregate net assets of most open-end funds, as defined in the fund’s management contract, sponsored by Putnam Management. Such annual rates may vary as follows:
| 0.780% | of the first $5 billion, | 0.580% | of the next $50 billion, | |
| 0.730% | of the next $5 billion, | 0.560% | of the next $50 billion, | |
| 0.680% | of the next $10 billion, | 0.550% | of the next $100 billion and | |
| 0.630% | of the next $10 billion, | 0.545% | of any excess thereafter. | |
Putnam Management has contractually agreed, through December 30, 2016, to waive fees or reimburse the fund’s expenses to the extent necessary to limit the cumulative expenses of the fund, exclusive of brokerage, interest, taxes, investment-related expenses, extraordinary expenses, acquired fund fees and expenses and payments under the fund’s investor servicing contract, investment management contract and distribution plans, on a fiscal year-to-date basis to an annual rate of 0.20% of the fund’s average net assets over such fiscal year-to-date period. During the reporting period, the fund’s expenses were not reduced as a result of this limit.
Putnam Investments Limited (PIL), an affiliate of Putnam Management, is authorized by the Trustees to manage a separate portion of the assets of the fund as determined by Putnam Management from time to time. Putnam Management pays a quarterly sub-management fee to PIL for its services at an annual rate of 0.35% of the average net assets of the portion of the fund managed by PIL.
The Putnam Advisory Company, LLC (PAC), an affiliate of Putnam Management, is authorized by the Trustees to manage a separate portion of the assets of the fund, as designated from time to time by Putnam Management or PIL. Putnam Management or PIL, as applicable, pays a quarterly sub-advisory fee to PAC for its services at the annual rate of 0.35% of the average net assets of the portion of the fund’s assets for which PAC is engaged as sub-adviser.
The fund reimburses Putnam Management an allocated amount for the compensation and related expenses of certain officers of the fund and their staff who provide administrative services to the fund. The aggregate amount of all such reimbursements is determined annually by the Trustees.
Custodial functions for the fund’s assets are provided by State Street. Custody fees are based on the fund’s asset level, the number of its security holdings and transaction volumes.
Putnam Investor Services, Inc., an affiliate of Putnam Management, provides investor servicing agent functions to the fund. Putnam Investor Services, Inc. received fees for investor servicing that included (1) a per account fee for each direct and underlying non-defined contribution account (“retail account”) of the fund and each of the other funds in its specified category, which was totaled and then allocated to each fund in the category based on its average daily net assets; (2) a specified rate of the fund’s assets attributable to defined contribution plan accounts; and (3) a specified rate based on the average net assets in retail accounts. Putnam Investor Services has agreed that the aggregate investor servicing fees for each fund’s retail and defined contribution accounts will not exceed an annual rate of 0.320% of the fund’s average assets attributable to such accounts. During the reporting period, the expenses for each class of shares related to investor servicing fees were as follows:
| Class A | $160,454 | Class R | 322 | |
| Class B | 4,140 | Class Y | 3,824 | |
| Class C | 4,775 | Total | $174,513 | |
| Class M | 998 | |||
The fund has entered into expense offset arrangements with Putnam Investor Services, Inc. and State Street whereby Putnam Investor Services, Inc.’s and State Street’s fees are reduced by credits allowed on cash balances. The fund also reduced expenses through brokerage/service arrangements. For the reporting period, the fund’s expenses were reduced by $176 under the expense offset arrangements and by $7,184 under the brokerage/ service arrangements.
| Global Utilities Fund 33 |
Each Independent Trustee of the fund receives an annual Trustee fee, of which $118, as a quarterly retainer, has been allocated to the fund, and an additional fee for each Trustees meeting attended. Trustees also are reimbursed for expenses they incur relating to their services as Trustees.
The fund has adopted a Trustee Fee Deferral Plan (the Deferral Plan) which allows the Trustees to defer the receipt of all or a portion of Trustees fees payable on or after July 1, 1995. The deferred fees remain invested in certain Putnam funds until distribution in accordance with the Deferral Plan.
The fund has adopted an unfunded noncontributory defined benefit pension plan (the Pension Plan) covering all Trustees of the fund who have served as a Trustee for at least five years and were first elected prior to 2004. Benefits under the Pension Plan are equal to 50% of the Trustee’s average annual attendance and retainer fees for the three years ended December 31, 2005. The retirement benefit is payable during a Trustee’s lifetime, beginning the year following retirement, for the number of years of service through December 31, 2006. Pension expense for the fund is included in Trustee compensation and expenses in the Statement of operations. Accrued pension liability is included in Payable for Trustee compensation and expenses in the Statement of assets and liabilities. The Trustees have terminated the Pension Plan with respect to any Trustee first elected after 2003.
The fund has adopted distribution plans (the Plans) with respect to its class A, class B, class C, class M and class R shares pursuant to Rule 12b–1 under the Investment Company Act of 1940. The purpose of the Plans is to compensate Putnam Retail Management Limited Partnership, an indirect wholly-owned subsidiary of Putnam Investments, LLC, for services provided and expenses incurred in distributing shares of the fund. The Plans provide for payments by the fund to Putnam Retail Management Limited Partnership at an annual rate of up to 0.35%, 1.00%, 1.00%, 1.00% and 1.00% of the average net assets attributable to class A, class B, class C, class M and class R shares, respectively. The Trustees have approved payment by the fund at an annual rate of 0.25%, 1.00%, 1.00%, 0.75% and 0.50% of the average net assets attributable to class A, class B, class C, class M and class R shares, respectively. During the reporting period, the class specific expenses related to distribution fees were as follows:
| Class A | $198,387 | Class M | 3,708 | |
| Class B | 20,486 | Class R | 807 | |
| Class C | 23,500 | Total | $246,888 | |
For the reporting period, Putnam Retail Management Limited Partnership, acting as underwriter, received net commissions of $4,804 and $38 from the sale of class A and class M shares, respectively, and received $814 and no monies in contingent deferred sales charges from redemptions of class B and class C shares, respectively.
A deferred sales charge of up to 1.00% and 0.65% (no longer applicable effective November 1, 2015) is assessed on certain redemptions of class A and class M shares, respectively. For the reporting period, Putnam Retail Management Limited Partnership, acting as underwriter, received $30 and no monies on class A and class M redemptions, respectively.
Note 3: Purchases and sales of securities
During the reporting period, the cost of purchases and the proceeds from sales, excluding short-term investments, were as follows:
| Cost of purchases | Proceeds from sales | |
| Investments in securities (Long-term) | $9,294,046 | $18,618,337 |
| U.S. government securities (Long-term) | — | — |
| Total | $9,294,046 | $18,618,337 |
The fund may purchase or sell investments from or to other Putnam funds in the ordinary course of business, which can reduce the fund’s transaction costs, at prices determined in accordance with SEC requirements and policies approved by the Trustees. During the reporting period, purchases or sales from or to other Putnam funds, if any, did not represent more than 5% of the fund’s total cost of purchases and/or total proceeds from sales.
| 34 Global Utilities Fund |
Note 4: Capital shares
At the close of the reporting period, there were an unlimited number of shares of beneficial interest authorized. Transactions in capital shares were as follows:
| Six months ended 2/29/16 | Year ended 8/31/15 | |||
| Class A | Shares | Amount | Shares | Amount |
| Shares sold | 342,649 | $3,883,526 | 808,305 | $10,142,497 |
| Shares issued in connection with | ||||
| reinvestment of distributions | 121,677 | 1,372,829 | 242,798 | 3,012,076 |
| 464,326 | 5,256,355 | 1,051,103 | 13,154,573 | |
| Shares repurchased | (1,252,095) | (14,195,064) | (2,787,195) | (34,664,266) |
| Net decrease | (787,769) | $(8,938,709) | (1,736,092) | $(21,509,693) |
| Six months ended 2/29/16 | Year ended 8/31/15 | |||
| Class B | Shares | Amount | Shares | Amount |
| Shares sold | 14,371 | $162,674 | 80,168 | $1,003,404 |
| Shares issued in connection with | ||||
| reinvestment of distributions | 1,850 | 20,834 | 3,807 | 47,126 |
| 16,221 | 183,508 | 83,975 | 1,050,530 | |
| Shares repurchased | (75,645) | (854,945) | (112,646) | (1,393,266) |
| Net decrease | (59,424) | $(671,437) | (28,671) | $(342,736) |
| Six months ended 2/29/16 | Year ended 8/31/15 | |||
| Class C | Shares | Amount | Shares | Amount |
| Shares sold | 108,586 | $1,239,318 | 128,487 | $1,616,653 |
| Shares issued in connection with | ||||
| reinvestment of distributions | 2,029 | 22,743 | 3,688 | 45,396 |
| 110,615 | 1,262,061 | 132,175 | 1,662,049 | |
| Shares repurchased | (62,830) | (700,957) | (93,097) | (1,149,674) |
| Net increase | 47,785 | $561,104 | 39,078 | $512,375 |
| Six months ended 2/29/16 | Year ended 8/31/15 | |||
| Class M | Shares | Amount | Shares | Amount |
| Shares sold | 2,157 | $24,498 | 5,944 | $74,089 |
| Shares issued in connection with | ||||
| reinvestment of distributions | 601 | 6,778 | 1,139 | 14,123 |
| 2,758 | 31,276 | 7,083 | 88,212 | |
| Shares repurchased | (11,175) | (126,543) | (20,533) | (252,688) |
| Net decrease | (8,417) | $(95,267) | (13,450) | $(164,476) |
| Six months ended 2/29/16 | Year ended 8/31/15 | |||
| Class R | Shares | Amount | Shares | Amount |
| Shares sold | 2,426 | $27,513 | 30,591 | $378,761 |
| Shares issued in connection with | ||||
| reinvestment of distributions | 74 | 835 | 1,479 | 18,287 |
| 2,500 | 28,348 | 32,070 | 397,048 | |
| Shares repurchased | (79,114) | (891,250) | (49,068) | (599,801) |
| Net decrease | (76,614) | $(862,902) | (16,998) | $(202,753) |
| Global Utilities Fund 35 |
| Six months ended 2/29/16 | Year ended 8/31/15 | |||
| Class Y | Shares | Amount | Shares | Amount |
| Shares sold | 129,898 | $1,488,271 | 119,018 | $1,494,364 |
| Shares issued in connection with | ||||
| reinvestment of distributions | 3,377 | 38,100 | 5,737 | 71,142 |
| 133,275 | 1,526,371 | 124,755 | 1,565,506 | |
| Shares repurchased | (42,625) | (486,216) | (189,600) | (2,361,499) |
| Net increase (decrease) | 90,650 | $1,040,155 | (64,845) | $(795,993) |
Note 5: Affiliated transactions
Transactions during the reporting period with Putnam Short Term Investment Fund, which is under common ownership and control, were as follows:
| Fair value at the | Fair value at | ||||
| beginning of | the end of | ||||
| the reporting | Investment | the reporting | |||
| Name of affiliate | period | Purchase cost | Sale proceeds | income | period |
| Putnam Short Term | |||||
| Investment Fund* | $6,932,658 | $20,334,888 | $19,090,518 | $10,462 | $8,177,028 |
| Totals | $6,932,658 | $20,334,888 | $19,090,518 | $10,462 | $8,177,028 |
* Management fees charged to Putnam Short Term Investment Fund have been waived by Putnam Management.
Note 6: Market, credit and other risks
In the normal course of business, the fund trades financial instruments and enters into financial transactions where risk of potential loss exists due to changes in the market (market risk) or failure of the contracting party to the transaction to perform (credit risk). The fund may be exposed to additional credit risk that an institution or other entity with which the fund has unsettled or open transactions will default. Investments in foreign securities involve certain risks, including those related to economic instability, unfavorable political developments, and currency fluctuations. The fund concentrates a majority of its investments in the utilities sector, which involves more risk than a fund that invests more broadly.
Note 7: Summary of derivative activity
The volume of activity for the reporting period for any derivative type that was held during the period is listed below and was based on an average of the holdings at the end of each fiscal quarter:
| Forward currency contracts (contract amount) | $76,500,000 |
The following is a summary of the fair value of derivative instruments as of the close of the reporting period:
Fair value of derivative instruments as of the close of the reporting period
| Asset derivatives | Liability derivatives | |||
| Derivatives not | ||||
| accounted for as | Statement of | Statement of | ||
| hedging instruments | assets and | assets and | ||
| under ASC 815 | liabilities location | Fair value | liabilities location | Fair value |
| Foreign exchange | ||||
| contracts | Receivables | $1,788,124 | Payables | $131,594 |
| Total | $1,788,124 | $131,594 | ||
| 36 Global Utilities Fund |
The following is a summary of realized and change in unrealized gains or losses of derivative instruments in the Statement of operations for the reporting period (see Note 1):
Amount of realized gain or (loss) on derivatives recognized in net gain or (loss) on investments
| Derivatives not accounted for as hedging | Forward currency | |
| instruments under ASC 815 | contracts | Total |
| Foreign exchange contracts | $(200,275) | $(200,275) |
| Total | $(200,275) | $(200,275) |
| Change in unrealized appreciation or (depreciation) on derivatives recognized in net gain or (loss) on investments | ||
| Derivatives not accounted for as hedging | Forward currency | |
| instruments under ASC 815 | contracts | Total |
| Foreign exchange contracts | $1,480,390 | $1,480,390 |
| Total | $1,480,390 | $1,480,390 |
| Global Utilities Fund 37 |
Note 8: Offsetting of financial and derivative assets and liabilities
The following table summarizes any derivatives, repurchase agreements and reverse repurchase agreements, at the end of the reporting period, that are subject to an enforceable master netting agreement or similar agreement. For securities lending transactions or borrowing transactions associated with securities sold short, if any, see Note 1. For financial reporting purposes, the fund does not offset financial assets and financial liabilities that are subject to the master netting agreements in the Statement of assets and liabilities.
| Bank of America N.A. | Barclays Bank PLC | Citibank, N.A. | Credit Suisse International | Deutsche Bank AG | Goldman Sachs International | HSBC Bank USA, National Association | JPMorgan Chase Bank N.A. | State Street Bank and Trust Co. | UBS AG | WestPac Banking Corp. | Total | |
| Assets: | ||||||||||||
| Forward currency contracts# | $— | $15,243 | $39,338 | $1,462 | $84,733 | $272,517 | $27,943 | $201,252 | $588,767 | $549,062 | $7,807 | $1,788,124 |
| Total Assets | $— | $15,243 | $39,338 | $1,462 | $84,733 | $272,517 | $27,943 | $201,252 | $588,767 | $549,062 | $7,807 | $1,788,124 |
| Liabilities: | ||||||||||||
| Forward currency contracts# | 2,630 | — | 1,419 | 27,556 | 1,618 | 22,582 | 15,401 | 38,662 | 14,667 | 7,059 | — | 131,594 |
| Total Liabilities | $2,630 | $— | $1,419 | $27,556 | $1,618 | $22,582 | $15,401 | $38,662 | $14,667 | $7,059 | $— | $131,594 |
| Total Financial and Derivative Net Assets | $(2,630) | $15,243 | $37,919 | $(26,094) | $83,115 | $249,935 | $12,542 | $162,590 | $574,100 | $542,003 | $7,807 | $1,656,530 |
| Total collateral received (pledged)†## | $— | $— | $— | $— | $83,115 | $249,935 | $— | $110,000 | $485,542 | $501,859 | $— | |
| Net amount | $(2,630) | $15,243 | $37,919 | $(26,094) | $— | $— | $12,542 | $52,590 | $88,558 | $40,144 | $7,807 | |
† Additional collateral may be required from certain brokers based on individual agreements.
# Covered by master netting agreement (Note 1).
## Any over-collateralization of total financial and derivative net assets is not shown. Collateral may include amounts related to unsettled agreements.
| 38 Global Utilities Fund | Global Utilities Fund 39 |
Putnam family of funds
The following is a list of Putnam’s open-end mutual funds offered to the public. Investors should carefully consider the investment objective, risks, charges, and expenses of a fund before investing. For a prospectus, or a summary prospectus if available, containing this and other information for any Putnam fund or product, contact your financial advisor or call Putnam Investor Services at 1-800-225-1581. Please read the prospectus carefully before investing.
| Growth | International Value Fund |
| Growth Opportunities Fund | Multi-Cap Value Fund |
| International Growth Fund | Small Cap Value Fund |
| Multi-Cap Growth Fund | |
| Small Cap Growth Fund | Income |
| Voyager Fund | American Government Income Fund |
| Diversified Income Trust | |
| Blend | Emerging Markets Income Fund |
| Asia Pacific Equity Fund | Floating Rate Income Fund |
| Capital Opportunities Fund | Global Income Trust |
| Capital Spectrum Fund | High Yield Advantage Fund |
| Emerging Markets Equity Fund | High Yield Trust |
| Equity Spectrum Fund | Income Fund |
| Europe Equity Fund | Money Market Fund* |
| Global Equity Fund | Short Duration Income Fund |
| International Capital Opportunities Fund | U.S. Government Income Trust |
| International Equity Fund | |
| Investors Fund | Tax-free Income |
| Low Volatility Equity Fund | AMT-Free Municipal Fund |
| Multi-Cap Core Fund | Intermediate-Term Municipal Income Fund |
| Research Fund | Short-Term Municipal Income Fund |
| Strategic Volatility Equity Fund | Tax Exempt Income Fund |
| Tax-Free High Yield Fund | |
| Value | |
| Convertible Securities Fund | State tax-free income funds†: |
| Equity Income Fund | Arizona, California, Massachusetts, Michigan, |
| Global Dividend Fund | Minnesota, New Jersey, New York, Ohio, |
| The Putnam Fund for Growth and Income | and Pennsylvania. |
| 40 Global Utilities Fund |
| Absolute Return | Retirement Income Lifestyle Funds — |
| Absolute Return 100 Fund® | portfolios with managed allocations to |
| Absolute Return 300 Fund® | stocks, bonds, and money market |
| Absolute Return 500 Fund® | investments to generate retirement income. |
| Absolute Return 700 Fund® | |
| Retirement Income Fund Lifestyle 1 | |
| Global Sector | Retirement Income Fund Lifestyle 2 |
| Global Consumer Fund | Retirement Income Fund Lifestyle 3 |
| Global Energy Fund | |
| Global Financials Fund | RetirementReady® Funds — portfolios with |
| Global Health Care Fund | adjusting allocations to stocks, bonds, and |
| Global Industrials Fund | money market instruments, becoming more |
| Global Natural Resources Fund | conservative over time. |
| Global Sector Fund | |
| Global Technology Fund | RetirementReady® 2060 Fund |
| Global Telecommunications Fund | RetirementReady® 2055 Fund |
| Global Utilities Fund | RetirementReady® 2050 Fund |
| RetirementReady® 2045 Fund | |
| Asset Allocation | RetirementReady® 2040 Fund |
| George Putnam Balanced Fund | RetirementReady® 2035 Fund |
| Global Asset Allocation Funds — four | RetirementReady® 2030 Fund |
| investment portfolios that spread your | RetirementReady® 2025 Fund |
| money across a variety of stocks, bonds, and | RetirementReady® 2020 Fund |
| money market instruments. | |
| Dynamic Asset Allocation Balanced Fund | |
| Dynamic Asset Allocation Conservative Fund | |
| Dynamic Asset Allocation Growth Fund | |
| Dynamic Risk Allocation Fund |
* An investment in a money market fund is not insured or guaranteed by the Federal Deposit Insurance Corporation or any other government agency. Although the fund seeks to preserve the value of your investment at $1.00 per share, it is possible to lose money by investing in the fund.
† Not available in all states.
Check your account balances and the most recent month-end performance in the Individual Investors section at putnam.com.
| Global Utilities Fund 41 |
Services for shareholders
Investor services
Systematic investment plan Tell us how much you wish to invest regularly — weekly, semimonthly, or monthly — and the amount you choose will be transferred automatically from your checking or savings account. There’s no additional fee for this service, and you can suspend it at any time. This plan may be a great way to save for college expenses or to plan for your retirement.
Please note that regular investing does not guarantee a profit or protect against loss in a declining market. Before arranging a systematic investment plan, consider your financial ability to continue making purchases in periods when prices are low.
Systematic exchange You can make regular transfers from one Putnam fund to another Putnam fund. There are no additional fees for this service, and you can cancel or change your options at any time.
Dividends PLUS You can choose to have the dividend distributions from one of your Putnam funds automatically reinvested in another Putnam fund at no additional charge.
Free exchange privilege You can exchange money between Putnam funds free of charge, as long as they are the same class of shares. A signature guarantee is required if you are exchanging more than $500,000. The fund reserves the right to revise or terminate the exchange privilege.
Reinstatement privilege If you’ve sold Putnam shares or received a check for a dividend or capital gain, you may reinvest the proceeds with Putnam within 90 days of the transaction and they will be reinvested at the fund’s current net asset value — with no sales charge. However, reinstatement of class B shares may have special tax consequences. Ask your financial or tax representative for details.
Check-writing service You have ready access to many Putnam accounts. It’s as simple as writing a check, and there are no special fees or service charges. For more information about the check-writing service, call Putnam or visit our website.
Dollar cost averaging When you’re investing for long-term goals, it’s time, not timing, that counts. Investing on a systematic basis is a better strategy than trying to figure out when the markets will go up or down. This means investing the same amount of money regularly over a long period. This method of investing is called dollar cost averaging. When a fund’s share price declines, your investment dollars buy more shares at lower prices. When it increases, they buy fewer shares. Over time, you will pay a lower average price per share.
For more information
Visit the Individual Investors section at putnam.com A secure section of our website contains complete information on your account, including balances and transactions, updated daily. You may also conduct transactions, such as exchanges, additional investments, and address changes. Log on today to get your password.
Call us toll free at 1-800-225-1581 Ask a helpful Putnam representative or your financial advisor for details about any of these or other services, or see your prospectus.
| 42 Global Utilities Fund |
Putnam’s commitment to confidentiality
In order to conduct business with our shareholders, we must obtain certain personal information such as account holders’ names, addresses, Social Security numbers, and dates of birth. Using this information, we are able to maintain accurate records of accounts and transactions.
It is our policy to protect the confidentiality of our shareholder information, whether or not a shareholder currently owns shares of our funds. In particular, it is our policy not to sell information about you or your accounts to outside marketing firms. We have safeguards in place designed to prevent unauthorized access to our computer systems and procedures to protect personal information from unauthorized use.
Within the Putnam organization, your information is shared with those who need it to service your account or provide you with information about other Putnam products or services. Under certain circumstances, we must also share account information with outside vendors who provide services to us, such as mailings and proxy solicitations. In these cases, the service providers enter into confidentiality agreements with us, and we provide only the information necessary to process transactions and perform other services related to your account. It is also our policy to share account information with your financial advisor, if you've provided us with information about your advisor and that person is listed on your Putnam account.
If you would like clarification about our confidentiality policies or have any questions or concerns, please don't hesitate to contact us at 1-800-225-1581, Monday through Friday, 8:00 a.m. to 8:00 p.m. Eastern Time.
| Global Utilities Fund 43 |
Fund information
Founded over 75 years ago, Putnam Investments was built around the concept that a balance between risk and reward is the hallmark of a well-rounded financial program. We manage over 100 funds across income, value, blend, growth, asset allocation, absolute return, and global sector categories.
| Investment Manager | Trustees | Robert T. Burns |
| Putnam Investment | Jameson A. Baxter, Chair | Vice President and |
| Management, LLC | Liaquat Ahamed | Chief Legal Officer |
| One Post Office Square | Ravi Akhoury | |
| Boston, MA 02109 | Barbara M. Baumann | James F. Clark |
| Robert J. Darretta | Chief Compliance Officer | |
| Investment Sub-Manager | Katinka Domotorffy | |
| Putnam Investments Limited | John A. Hill | Michael J. Higgins |
| 57–59 St James’s Street | Paul L. Joskow | Vice President, Treasurer, |
| London, England SW1A 1LD | Kenneth R. Leibler | and Clerk |
| Robert E. Patterson | ||
| Investment Sub-Advisor | George Putnam, III | Janet C. Smith |
| The Putnam Advisory | Robert L. Reynolds | Vice President, |
| Company, LLC | W. Thomas Stephens | Principal Accounting Officer, |
| One Post Office Square | and Assistant Treasurer | |
| Boston, MA 02109 | Officers | |
| Robert L. Reynolds | Susan G. Malloy | |
| Marketing Services | President | Vice President and |
| Putnam Retail Management | Assistant Treasurer | |
| One Post Office Square | Jonathan S. Horwitz | |
| Boston, MA 02109 | Executive Vice President, | James P. Pappas |
| Principal Executive Officer, and | Vice President | |
| Custodian | Compliance Liaison | |
| State Street Bank | Mark C. Trenchard | |
| and Trust Company | Steven D. Krichmar | Vice President and |
| Vice President and | BSA Compliance Officer | |
| Legal Counsel | Principal Financial Officer | |
| Ropes & Gray LLP | Nancy E. Florek | |
| Vice President, Director of | ||
| Proxy Voting and Corporate | ||
| Governance, Assistant Clerk, | ||
| and Associate Treasurer |
| 44 Global Utilities Fund |
This report is for the information of shareholders of Putnam Global Utilities Fund. It may also be used as sales literature when preceded or accompanied by the current prospectus, the most recent copy of Putnam’s Quarterly Performance Summary, and Putnam’s Quarterly Ranking Summary. For more recent performance, please visit putnam.com. Investors should carefully consider the investment objectives, risks, charges, and expenses of a fund, which are described in its prospectus. For this and other information or to request a prospectus or summary prospectus, call 1-800-225-1581 toll free. Please read the prospectus carefully before investing. The fund’s Statement of Additional Information contains additional information about the fund’s Trustees and is available without charge upon request by calling 1-800-225-1581.
| Item 2. Code of Ethics: |
| Not applicable |
| Item 3. Audit Committee Financial Expert: |
| Not applicable |
| Item 4. Principal Accountant Fees and Services: |
| Not applicable |
| Item 5. Audit Committee of Listed Registrants |
| Not applicable |
| Item 6. Schedule of Investments: |
| The registrant's schedule of investments in unaffiliated issuers is included in the report to shareholders in Item 1 above. |
| Item 7. Disclosure of Proxy Voting Policies and Procedures For Closed-End Management Investment Companies: |
| Not applicable |
| Item 8. Portfolio Managers of Closed-End Investment Companies |
| Not Applicable |
| Item 9. Purchases of Equity Securities by Closed-End Management Investment Companies and Affiliated Purchasers: |
| Not applicable |
| Item 10. Submission of Matters to a Vote of Security Holders: |
| Not applicable |
| Item 11. Controls and Procedures: |
| (a) The registrant's principal executive officer and principal financial officer have concluded, based on their evaluation of the effectiveness of the design and operation of the registrant's disclosure controls and procedures as of a date within 90 days of the filing date of this report, that the design and operation of such procedures are generally effective to provide reasonable assurance that information required to be disclosed by the registrant in this report is recorded, processed, summarized and reported within the time periods specified in the Commission's rules and forms. |
| (b) Changes in internal control over financial reporting: Not applicable |
| Item 12. Exhibits: |
| (a)(1) Not applicable |
| (a)(2) Separate certifications for the principal executive officer and principal financial officer of the registrant as required by Rule 30a-2(a) under the Investment Company Act of 1940, as amended, are filed herewith. |
| (b) The certifications required by Rule 30a-2(b) under the Investment Company Act of 1940, as amended, are filed herewith. |
| Putnam Global Utilities Fund |
| By (Signature and Title): |
| /s/ Janet C. Smith Janet C. Smith Principal Accounting Officer |
| Date: April 28, 2016 |
| Pursuant to the requirements of the Securities Exchange Act of 1934 and the Investment Company Act of 1940, this report has been signed below by the following persons on behalf of the registrant and in the capacities and on the dates indicated. |
| By (Signature and Title): |
| /s/ Jonathan S. Horwitz Jonathan S. Horwitz Principal Executive Officer |
| Date: April 28, 2016 |
| By (Signature and Title): |
| /s/ Steven D. Krichmar Steven D. Krichmar Principal Financial Officer |
| Date: April 28, 2016 |