Table of Contents
UNITED STATES
SECURITIES AND EXCHANGE COMMISSION
Washington, D.C. 20549
FORM N-CSR
CERTIFIED SHAREHOLDER REPORT OF
REGISTERED MANAGEMENT INVESTMENT COMPANIES
Investment Company Act file number 811-06174
MFS INSTITUTIONAL TRUST
(Exact name of registrant as specified in charter)
111 Huntington Avenue, Boston, Massachusetts 02199
(Address of principal executive offices) (Zip code)
Kristin V. Collins
Massachusetts Financial Services Company
111 Huntington Avenue
Boston, Massachusetts 02199
(Name and address of agents for service)
Registrant’s telephone number, including area code: (617) 954-5000
Date of fiscal year end: June 30
Date of reporting period: December 31, 2015
Table of Contents
| ITEM 1. | REPORTS TO STOCKHOLDERS. |
Table of Contents
SEMIANNUAL REPORT
December 31, 2015

MFS® INSTITUTIONAL INTERNATIONAL EQUITY FUND

IIE-SEM
Table of Contents
MFS® INSTITUTIONAL INTERNATIONAL EQUITY FUND
The report is prepared for the general information of shareholders.
It is authorized for distribution to prospective investors only when preceded or accompanied by a current prospectus.
NOT FDIC INSURED • MAY LOSE VALUE • NO BANK GUARANTEE
Table of Contents

Dear Shareholders:
Central bank policies remain center stage as the U.S. Federal Reserve made good on its pledge to raise policy rates for the first time in over nine years at its December meeting.
The Fed’s actions stand in stark contrast to those of the European Central Bank and Bank of Japan, which modestly extended their quantitative easing programs in December.
In the United States, auto sales remain a source of economic strength, but housing demand has slowed of late. The U.S. economic expansion remains moderate but uneven, with a strong dollar crimping demand for U.S. goods abroad. China’s shift to a consumer-led economy continues to weigh on its manufacturing and exports, as does weak global demand. Slackening demand from China continues to undermine commodity markets, with oil particularly impacted amid a global supply glut.
As markets have become more focused on short-term trends in recent years, we believe it’s important for investors to lengthen their investment time horizon. At MFS®, we don’t trade on headlines or trends; we invest for the long term.
We believe that this approach, coupled with the professional guidance of a financial advisor, will help you reach your investment goals.
Respectfully,

Robert J. Manning
Chairman
MFS Investment Management
February 16, 2016
The opinions expressed in this letter are subject to change and may not be relied upon for investment advice. No forecasts can be guaranteed.
1
Table of Contents
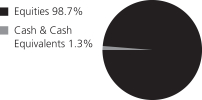
Portfolio structure
| Top ten holdings | ||||
| Bayer AG | 3.6% | |||
| Nestle S.A. | 3.6% | |||
| Compass Group PLC | 3.4% | |||
| WPP Group PLC | 3.2% | |||
| Roche Holding AG | 3.1% | |||
| Hoya Corp. | 2.7% | |||
| UBS Group AG | 2.5% | |||
| Taiwan Semiconductor Manufacturing Co. Ltd., ADR | 2.4% | |||
| Reckitt Benckiser Group PLC | 2.3% | |||
| Danone S.A. | 2.3% | |||
| Equity sectors | ||||
| Consumer Staples | 17.4% | |||
| Financial Services | 15.4% | |||
| Health Care | 12.5% | |||
| Technology | 10.6% | |||
| Special Products & Services | 7.8% | |||
| Leisure | 7.5% | |||
| Basic Materials | 6.5% | |||
| Autos & Housing | 5.0% | |||
| Industrial Goods & Services | 4.9% | |||
| Retailing | 4.9% | |||
| Energy | 2.5% | |||
| Transportation | 2.0% | |||
| Utilities & Communications | 1.7% | |||
| Issuer country weightings (x) | ||||
| United Kingdom | 19.3% | |||
| France | 13.9% | |||
| Japan | 13.6% | |||
| Switzerland | 13.2% | |||
| Germany | 11.2% | |||
| Netherlands | 5.2% | |||
| Canada | 4.2% | |||
| United States | 3.8% | |||
| Hong Kong | 3.5% | |||
| Other Countries | 12.1% | |||
| Currency exposure weightings (y) | ||||
| Euro | 32.0% | |||
| British Pound Sterling | 19.3% | |||
| Japanese Yen | 13.6% | |||
| Swiss Franc | 13.2% | |||
| United States Dollar | 6.7% | |||
| Hong Kong Dollar | 3.5% | |||
| Taiwan Dollar | 2.8% | |||
| Canadian Dollar | 2.1% | |||
| Singapore Dollar | 1.9% | |||
| Other Currencies | 4.9% | |||
2
Table of Contents
Portfolio Composition – continued
| (x) | Represents the portfolio’s exposure to issuer countries as a percentage of a portfolio’s net assets. For purposes of this presentation, United States includes Cash & Cash Equivalents. |
| (y) | Represents the portfolio’s exposure to a particular currency as a percentage of a portfolio’s net assets. For purposes of this presentation, United States Dollar includes Cash & Cash Equivalents. |
Cash & Cash Equivalents includes any cash, investments in money market funds, short-term securities, and other assets less liabilities. Please see the Statement of Assets and Liabilities for additional information related to the fund’s cash position and other assets and liabilities.
Percentages are based on net assets as of 12/31/15.
The portfolio is actively managed and current holdings may be different.
3
Table of Contents
Fund expenses borne by the shareholders during the period, July 1, 2015 through December 31, 2015
As a shareholder of the fund, you incur ongoing costs, including management fees and other fund expenses. This example is intended to help you understand your ongoing costs (in dollars) of investing in the fund and to compare these costs with the ongoing costs of investing in other mutual funds.
The example is based on an investment of $1,000 invested at the beginning of the period and held for the entire period July 1, 2015 through December 31, 2015.
Actual Expenses
The first line of the following table provides information about actual account values and actual expenses. You may use the information in this line, together with the amount you invested, to estimate the expenses that you paid over the period. Simply divide your account value by $1,000 (for example, an $8,600 account value divided by $1,000 = 8.6), then multiply the result by the number in the first line under the heading entitled “Expenses Paid During Period” to estimate the expenses you paid on your account during this period.
Hypothetical Example for Comparison Purposes
The second line of the following table provides information about hypothetical account values and hypothetical expenses based on the fund’s actual expense ratio and an assumed rate of return of 5% per year before expenses, which is not the fund’s actual return. The hypothetical account values and expenses may not be used to estimate the actual ending account balance or expenses you paid for the period. You may use this information to compare the ongoing costs of investing in the fund and other funds. To do so, compare this 5% hypothetical example with the 5% hypothetical examples that appear in the shareholder reports of the other funds.
Please note that the expenses shown in the table are meant to highlight your ongoing costs only and do not reflect any transactional costs, such as sales charges (loads). Therefore, the second line of the table is useful in comparing ongoing costs only, and will not help you determine the relative total costs of owning different funds. In addition, if these transactional costs were included, your costs would have been higher.
Annualized Ratio | Beginning Account Value 7/01/15 | Ending Account Value | Expenses Paid During Period (p) 7/01/15-12/31/15 | |||||
| Actual | 0.70% | $1,000.00 | $932.80 | $3.40 | ||||
| Hypothetical (h) | 0.70% | $1,000.00 | $1,021.62 | $3.56 |
| (h) | 5% fund return per year before expenses. |
| (p) | “Expenses Paid During Period” are equal to the fund’s annualized expense ratio, as shown above, multiplied by the average account value over the period, multiplied by 184/366 (to reflect the one-half year period). |
4
Table of Contents
12/31/15 (unaudited)
The Portfolio of Investments is a complete list of all securities owned by your fund. It is categorized by broad-based asset classes.
| COMMON STOCKS – 98.7% | ||||||||
| Issuer | Shares/Par | Value ($) | ||||||
| Aerospace – 1.2% | ||||||||
| MTU Aero Engines AG | 353,750 | $ | 34,483,641 | |||||
| Rolls-Royce Holdings PLC | 6,633,726 | 56,231,773 | ||||||
|
| |||||||
| $ | 90,715,414 | |||||||
| Alcoholic Beverages – 5.2% | ||||||||
| AmBev S.A., ADR | 7,334,359 | $ | 32,711,241 | |||||
| Carlsberg Group | 518,213 | 45,817,787 | ||||||
| Diageo PLC | 4,200,189 | 114,541,205 | ||||||
| Heineken N.V. | 382,557 | 32,650,649 | ||||||
| Pernod Ricard S.A. | 1,458,741 | 165,845,747 | ||||||
|
| |||||||
| $ | 391,566,629 | |||||||
| Apparel Manufacturers – 2.8% | ||||||||
| Global Brands Group Holding Ltd. (a) | 211,597,429 | $ | 39,969,186 | |||||
| Li & Fung Ltd. | 73,884,429 | 49,858,302 | ||||||
| LVMH Moet Hennessy Louis Vuitton S.A. | 771,272 | 120,570,393 | ||||||
|
| |||||||
| $ | 210,397,881 | |||||||
| Automotive – 5.0% | ||||||||
| Delphi Automotive PLC | 635,803 | $ | 54,507,391 | |||||
| DENSO Corp. | 3,538,500 | 168,713,486 | ||||||
| Honda Motor Co. Ltd. | 4,713,000 | 151,011,770 | ||||||
|
| |||||||
| $ | 374,232,647 | |||||||
| Broadcasting – 4.0% | ||||||||
| ProSiebenSat.1 Media SE | 1,196,082 | $ | 60,502,632 | |||||
| WPP Group PLC | 10,569,876 | 243,294,375 | ||||||
|
| |||||||
| $ | 303,797,007 | |||||||
| Business Services – 7.0% | ||||||||
| Amadeus IT Holding S.A. | 1,866,911 | $ | 82,206,209 | |||||
| Bureau Veritas S.A. | 1,902,873 | 37,867,924 | ||||||
| Compass Group PLC | 14,739,586 | 255,316,895 | ||||||
| Randstad Holding N.V. | 1,792,089 | 111,476,441 | ||||||
| Tata Consultancy Services Ltd. | 1,069,765 | 39,260,717 | ||||||
|
| |||||||
| $ | 526,128,186 | |||||||
| Cable TV – 1.8% | ||||||||
| Sky PLC | 8,197,579 | $ | 134,120,108 | |||||
5
Table of Contents
Portfolio of Investments (unaudited) – continued
| Issuer | Shares/Par | Value ($) | ||||||
| COMMON STOCKS – continued | ||||||||
| Chemicals – 0.5% | ||||||||
| Orica Ltd. (l) | 3,030,851 | $ | 33,903,513 | |||||
| Computer Software – 3.5% | ||||||||
| Check Point Software Technologies Ltd. (a) | 680,848 | $ | 55,407,410 | |||||
| Dassault Systemes S.A. | 670,468 | 53,643,237 | ||||||
| SAP SE | 1,974,835 | 157,484,626 | ||||||
|
| |||||||
| $ | 266,535,273 | |||||||
| Computer Software – Systems – 0.5% | ||||||||
| Hon Hai Precision Industry Co. Ltd. | 14,103,106 | $ | 34,493,578 | |||||
| Conglomerates – 0.9% | ||||||||
| Smiths Group PLC | 4,760,166 | $ | 65,928,817 | |||||
| Consumer Products – 4.7% | ||||||||
| Beiersdorf AG | 1,619,000 | $ | 147,280,739 | |||||
| L’Oréal S.A. | 198,173 | 33,340,752 | ||||||
| Reckitt Benckiser Group PLC | 1,922,438 | 176,958,367 | ||||||
|
| |||||||
| $ | 357,579,858 | |||||||
| Electrical Equipment – 2.6% | ||||||||
| Legrand S.A. | 1,116,322 | $ | 63,006,162 | |||||
| Schneider Electric S.A. | 2,356,457 | 134,166,959 | ||||||
|
| |||||||
| $ | 197,173,121 | |||||||
| Electronics – 6.1% | ||||||||
| Hoya Corp. | 4,931,600 | $ | 201,054,894 | |||||
| Kyocera Corp. | 1,689,400 | 78,302,348 | ||||||
| Taiwan Semiconductor Manufacturing Co. Ltd., ADR | 7,891,188 | 179,524,527 | ||||||
|
| |||||||
| $ | 458,881,769 | |||||||
| Energy – Independent – 0.9% | ||||||||
| INPEX Corp. | 7,228,300 | $ | 71,293,728 | |||||
| Energy – Integrated – 1.5% | ||||||||
| BG Group PLC | 3,717,168 | $ | 53,903,806 | |||||
| Suncor Energy, Inc. | 2,439,344 | 62,971,285 | ||||||
|
| |||||||
| $ | 116,875,091 | |||||||
| Food & Beverages – 6.0% | ||||||||
| Danone S.A. | 2,605,650 | $ | 175,848,515 | |||||
| Nestle S.A. | 3,691,018 | 273,591,764 | ||||||
|
| |||||||
| $ | 449,440,279 | |||||||
6
Table of Contents
Portfolio of Investments (unaudited) – continued
| Issuer | Shares/Par | Value ($) | ||||||
| COMMON STOCKS – continued | ||||||||
| Food & Drug Stores – 0.6% | ||||||||
| Loblaw Cos. Ltd. | 950,220 | $ | 44,870,546 | |||||
| Insurance – 3.2% | ||||||||
| AIA Group Ltd. | 28,701,089 | $ | 170,988,405 | |||||
| Prudential PLC | 3,280,081 | 73,434,149 | ||||||
|
| |||||||
| $ | 244,422,554 | |||||||
| Internet – 0.5% | ||||||||
| Alibaba Group Holding Ltd., ADR (a) | 473,896 | $ | 38,513,528 | |||||
| Machinery & Tools – 1.1% | ||||||||
| Fanuc Ltd. | 475,400 | $ | 81,954,795 | |||||
| Major Banks – 3.1% | ||||||||
| Barclays PLC | 23,131,297 | $ | 74,868,567 | |||||
| HSBC Holdings PLC | 16,195,342 | 127,804,493 | ||||||
| Standard Chartered PLC | 3,492,664 | 29,024,266 | ||||||
|
| |||||||
| $ | 231,697,326 | |||||||
| Medical Equipment – 2.1% | ||||||||
| Sonova Holding AG | 297,626 | $ | 37,827,266 | |||||
| Terumo Corp. | 4,008,200 | 124,063,331 | ||||||
|
| |||||||
| $ | 161,890,597 | |||||||
| Metals & Mining – 0.7% | ||||||||
| Rio Tinto PLC | 1,866,395 | $ | 54,464,744 | |||||
| Natural Gas – Distribution – 1.2% | ||||||||
| Engie | 5,283,712 | $ | 93,509,599 | |||||
| Other Banks & Diversified Financials – 9.1% | ||||||||
| DBS Group Holdings Ltd. | 9,127,551 | $ | 106,860,763 | |||||
| Element Financial Corp. | 3,875,081 | 46,768,702 | ||||||
| Housing Development Finance Corp. Ltd. | 4,380,327 | 83,220,019 | ||||||
| ING Groep N.V. | 9,485,529 | 127,685,153 | ||||||
| Julius Baer Group Ltd. | 1,719,825 | 82,454,779 | ||||||
| KBC Group N.V. | 860,591 | 53,809,122 | ||||||
| UBS Group AG | 9,782,817 | 188,259,569 | ||||||
|
| |||||||
| $ | 689,058,107 | |||||||
| Pharmaceuticals – 10.3% | ||||||||
| Bayer AG | 2,189,523 | $ | 274,700,435 | |||||
| Merck KGaA | 812,200 | 78,891,072 | ||||||
| Novartis AG | 1,769,459 | 151,247,329 | ||||||
7
Table of Contents
Portfolio of Investments (unaudited) – continued
| Issuer | Shares/Par | Value ($) | ||||||
| COMMON STOCKS – continued | ||||||||
| Pharmaceuticals – continued | ||||||||
| Roche Holding AG | 839,654 | $ | 231,398,676 | |||||
| Valeant Pharmaceuticals International, Inc. (a) | 439,437 | 44,668,771 | ||||||
|
| |||||||
| $ | 780,906,283 | |||||||
| Railroad & Shipping – 2.0% | ||||||||
| Canadian National Railway Co. | 2,141,017 | $ | 119,640,030 | |||||
| Kuehne + Nagel International AG | 241,867 | 33,163,525 | ||||||
|
| |||||||
| $ | 152,803,555 | |||||||
| Restaurants – 1.8% | ||||||||
| YUM! Brands, Inc. | 1,814,226 | $ | 132,529,209 | |||||
| Specialty Chemicals – 5.3% | ||||||||
| Akzo Nobel N.V. | 1,858,516 | $ | 124,136,819 | |||||
| L’Air Liquide S.A. | 1,375,019 | 154,433,676 | ||||||
| Linde AG | 607,253 | 88,144,803 | ||||||
| Shin-Etsu Chemical Co. Ltd. | 682,500 | 37,070,666 | ||||||
|
| |||||||
| $ | 403,785,964 | |||||||
| Specialty Stores – 1.5% | ||||||||
| Hennes & Mauritz AB, “B” | 2,731,024 | $ | 97,250,018 | |||||
| Hermes International | 41,690 | 14,056,284 | ||||||
|
| |||||||
| $ | 111,306,302 | |||||||
| Telephone Services – 0.4% | ||||||||
| Singapore Telecommunications Ltd. | 12,767,889 | $ | 32,859,138 | |||||
| Tobacco – 1.5% | ||||||||
| Japan Tobacco, Inc. | 3,047,900 | $ | 111,910,175 | |||||
| Total Common Stocks (Identified Cost, $6,680,090,174) | $ | 7,449,545,321 | ||||||
| MONEY MARKET FUNDS – 1.0% | ||||||||
| MFS Institutional Money Market Portfolio, 0.19%, at Cost and Net Asset Value (v) | 75,325,288 | $ | 75,325,288 | |||||
| COLLATERAL FOR SECURITIES LOANED – 0.1% | ||||||||
| JPMorgan Prime Money Market Fund, 0.25%, at Cost and Net Asset Value (j) | 4,436,201 | $ | 4,436,201 | |||||
| Total Investments (Identified Cost, $6,759,851,663) | $ | 7,529,306,810 | ||||||
| OTHER ASSETS, LESS LIABILITIES – 0.2% | 21,619,042 | |||||||
| NET ASSETS – 100.0% | $ | 7,550,925,852 | ||||||
| (a) | Non-income producing security. |
| (j) | The rate quoted is the annualized seven-day yield of the fund at period end. |
8
Table of Contents
Portfolio of Investments (unaudited) – continued
| (l) | A portion of this security is on loan. |
| (v) | Underlying affiliated fund that is available only to investment companies managed by MFS. The rate quoted for the MFS Institutional Money Market Portfolio is the annualized seven-day yield of the fund at period end. |
The following abbreviations are used in this report and are defined:
| ADR | American Depositary Receipt |
| PLC | Public Limited Company |
See Notes to Financial Statements
9
Table of Contents
Financial Statements
STATEMENT OF ASSETS AND LIABILITIES
At 12/31/15 (unaudited)
This statement represents your fund’s balance sheet, which details the assets and liabilities comprising the total value of the fund.
| Assets | ||||
Investments | ||||
Non-affiliated issuers, at value (identified cost, $6,684,526,375) | $7,453,981,522 | |||
Underlying affiliated funds, at cost and value | 75,325,288 | |||
Total investments, at value, including $4,204,045 of securities on loan | $7,529,306,810 | |||
Receivables for | ||||
Investments sold | 897,271 | |||
Fund shares sold | 21,692,120 | |||
Interest and dividends | 11,194,281 | |||
Other assets | 42,780 | |||
Total assets | $7,563,133,262 | |||
| Liabilities | ||||
Payable to custodian | $157,373 | |||
Payable for fund shares reacquired | 6,744,835 | |||
Collateral for securities loaned, at value | 4,436,201 | |||
Payable to affiliates | ||||
Investment adviser | 281,952 | |||
Shareholder servicing costs | 2,028 | |||
Payable for independent Trustees’ compensation | 101 | |||
| Accrued expenses and other liabilities | 584,920 | |||
Total liabilities | $12,207,410 | |||
Net assets | $7,550,925,852 | |||
| Net assets consist of | ||||
Paid-in capital | $6,857,677,474 | |||
Unrealized appreciation (depreciation) on investments and translation of assets and liabilities in foreign currencies | 768,733,095 | |||
Accumulated distributions in excess of net realized gain on investments and | (79,387,472 | ) | ||
Undistributed net investment income | 3,902,755 | |||
Net assets | $7,550,925,852 | |||
Shares of beneficial interest outstanding | 367,269,221 | |||
Net asset value per share (net assets of $7,550,925,852 / 367,269,221 shares of beneficial interest outstanding) | $20.56 |
See Notes to Financial Statements
10
Table of Contents
Financial Statements
Six months ended 12/31/15 (unaudited)
This statement describes how much your fund earned in investment income and accrued in expenses. It also describes any gains and/or losses generated by fund operations.
| Net investment income | ||||
Income | ||||
Dividends | $58,252,450 | |||
Interest | 998,063 | |||
Dividends from underlying affiliated funds | 45,371 | |||
Foreign taxes withheld | (3,254,170 | ) | ||
Total investment income | $56,041,714 | |||
Expenses | ||||
Management fee | $25,827,286 | |||
Shareholder servicing costs | 86,159 | |||
Administrative services fee | 316,400 | |||
Independent Trustees’ compensation | 50,370 | |||
Custodian fee | 584,914 | |||
Shareholder communications | 77,472 | |||
Audit and tax fees | 40,336 | |||
Legal fees | 30,814 | |||
Miscellaneous | 154,666 | |||
Total expenses | $27,168,417 | |||
Fees paid indirectly | (44 | ) | ||
Reduction of expenses by investment adviser | (279,817 | ) | ||
Net expenses | $26,888,556 | |||
Net investment income | $29,153,158 | |||
| Realized and unrealized gain (loss) on investments and foreign currency | ||||
Realized gain (loss) (identified cost basis) | ||||
Investments | $(25,314,652 | ) | ||
Foreign currency | 93,216 | |||
Net realized gain (loss) on investments and foreign currency | $(25,221,436 | ) | ||
Change in unrealized appreciation (depreciation) | ||||
Investments (net of $79,471 decrease in deferred country tax) | $(530,683,222 | ) | ||
Translation of assets and liabilities in foreign currencies | (1,101,572 | ) | ||
Net unrealized gain (loss) on investments and foreign currency translation | $(531,784,794 | ) | ||
Net realized and unrealized gain (loss) on investments and foreign currency | $(557,006,230 | ) | ||
Change in net assets from operations | $(527,853,072 | ) |
See Notes to Financial Statements
11
Table of Contents
Financial Statements
STATEMENTS OF CHANGES IN NET ASSETS
These statements describe the increases and/or decreases in net assets resulting from operations, any distributions, and any shareholder transactions.
Six months 12/31/15 | Year ended | |||||||
| Change in net assets | ||||||||
| From operations | ||||||||
Net investment income | $29,153,158 | $139,998,759 | ||||||
Net realized gain (loss) on investments and foreign currency | (25,221,436 | ) | 14,828,158 | |||||
Net unrealized gain (loss) on investments and foreign currency translation | (531,784,794 | ) | (188,206,664 | ) | ||||
Change in net assets from operations | $(527,853,072 | ) | $(33,379,747 | ) | ||||
| Distributions declared to shareholders | ||||||||
From net investment income | $(121,491,191 | ) | $(146,320,778 | ) | ||||
From net realized gain on investments | (4,365,619 | ) | (35,803,363 | ) | ||||
Total distributions declared to shareholders | $(125,856,810 | ) | $(182,124,141 | ) | ||||
Change in net assets from fund share transactions | $370,734,948 | $694,771,620 | ||||||
Total change in net assets | $(282,974,934 | ) | $479,267,732 | |||||
| Net assets | ||||||||
At beginning of period | 7,833,900,786 | 7,354,633,054 | ||||||
At end of period (including undistributed net investment income of $3,902,755 and $96,240,788, respectively) | $7,550,925,852 | $7,833,900,786 | ||||||
See Notes to Financial Statements
12
Table of Contents
Financial Statements
The financial highlights table is intended to help you understand the fund’s financial performance for the semiannual period and the past 5 fiscal years. Certain information reflects financial results for a single fund share. The total returns in the table represent the rate by which an investor would have earned (or lost) on an investment in the fund share class (assuming reinvestment of all distributions) held for the entire period.
| Six months ended 12/31/15 | Years ended 6/30 | |||||||||||||||||||||||
| 2015 | 2014 | 2013 | 2012 | 2011 | ||||||||||||||||||||
| (unaudited) | ||||||||||||||||||||||||
Net asset value, beginning of | $22.42 | $23.13 | $19.56 | $16.92 | $19.21 | $14.53 | ||||||||||||||||||
| Income (loss) from investment operations | ||||||||||||||||||||||||
Net investment income (d) | $0.08 | $0.43 | $0.34 | $0.36 | $0.33 | $0.32 | ||||||||||||||||||
Net realized and unrealized | (1.59 | ) | (0.57 | ) | 3.61 | 2.53 | (2.32 | ) | 4.60 | |||||||||||||||
Total from investment | $(1.51 | ) | $(0.14 | ) | $3.95 | $2.89 | $(1.99 | ) | $4.92 | |||||||||||||||
| Less distributions declared to shareholders | ||||||||||||||||||||||||
From net investment income | $(0.34 | ) | $(0.46 | ) | $(0.31 | ) | $(0.25 | ) | $(0.30 | ) | $(0.24 | ) | ||||||||||||
From net realized gain on | (0.01 | ) | (0.11 | ) | (0.07 | ) | — | — | — | |||||||||||||||
Total distributions declared to | $(0.35 | ) | $(0.57 | ) | $(0.38 | ) | $(0.25 | ) | $(0.30 | ) | $(0.24 | ) | ||||||||||||
Net asset value, end of | $20.56 | $22.42 | $23.13 | $19.56 | $16.92 | $19.21 | ||||||||||||||||||
Total return (%) (r)(s)(x) | (6.72 | )(n) | (0.40 | ) | 20.33 | 17.16 | (10.23 | ) | 34.03 | |||||||||||||||
| Ratios (%) (to average net assets) and Supplemental data: | ||||||||||||||||||||||||
Expenses before expense | 0.71 | (a) | 0.71 | 0.71 | 0.74 | 0.77 | 0.78 | |||||||||||||||||
Expenses after expense | 0.70 | (a) | 0.71 | 0.71 | 0.74 | 0.75 | 0.75 | |||||||||||||||||
Net investment income | 0.76 | (a)(l) | 1.92 | 1.57 | 1.91 | 1.97 | 1.83 | |||||||||||||||||
Portfolio turnover | 4 | (n) | 18 | 14 | 18 | 22 | 29 | |||||||||||||||||
Net assets at end of period | $7,550,926 | $7,833,901 | $7,354,633 | $5,786,886 | $3,456,602 | $3,311,273 | ||||||||||||||||||
13
Table of Contents
Financial Highlights – continued
| (a) | Annualized. |
| (d) | Per share data is based on average shares outstanding. |
| (f) | Ratios do not reflect reductions from fees paid indirectly. |
| (l) | Recognition of net investment income by the fund may be affected by the timing of the declaration of dividends by companies in which the fund invests and the actual annual net investment income ratio may differ. |
| (n) | Not annualized. |
| (r) | Certain expenses have been reduced without which performance would have been lower. |
| (s) | From time to time the fund may receive proceeds from litigation settlements, without which performance would be lower. |
| (x) | The net asset values and total returns have been calculated on net assets which include adjustments made in accordance with U.S. generally accepted accounting principles required at period end for financial reporting purposes. |
See Notes to Financial Statements
14
Table of Contents
(unaudited)
(1) Business and Organization
MFS Institutional International Equity Fund (the fund) is a diversified series of MFS Institutional Trust (the trust). The trust is organized as a Massachusetts business trust and is registered under the Investment Company Act of 1940, as amended, as an open-end management investment company.
The fund is an investment company and accordingly follows the investment company accounting and reporting guidance of the Financial Accounting Standards Board (FASB) Accounting Standards Codification Topic 946 Financial Services – Investment Companies.
(2) Significant Accounting Policies
General – The preparation of financial statements in conformity with U.S. generally accepted accounting principles requires management to make estimates and assumptions that affect the reported amounts of assets and liabilities, and disclosure of contingent assets and liabilities at the date of the financial statements and the reported amounts of increases and decreases in net assets from operations during the reporting period. Actual results could differ from those estimates. In the preparation of these financial statements, management has evaluated subsequent events occurring after the date of the fund’s Statement of Assets and Liabilities through the date that the financial statements were issued. The fund invests in foreign securities, including securities of emerging market issuers. Investments in foreign securities are vulnerable to the effects of changes in the relative values of the local currency and the U.S. dollar and to the effects of changes in each country’s legal, political, and economic environment. The markets of emerging markets countries are generally more volatile than the markets of developed countries with more mature economies. All of the risks of investing in foreign securities previously described are heightened when investing in emerging markets countries.
In January 2016, FASB issued Accounting Standards Update 2016-01, Financial Instruments – Overall (Subtopic 825-10) – Recognition and Measurement of Financial Assets and Financial Liabilities (“ASU 2016-01”) which would first be effective for annual reporting periods beginning after December 15, 2017, and interim periods therein. ASU 2016-01, which changes the accounting for equity investments and for certain financial liabilities, also modifies the presentation and disclosure requirements for financial instruments. Investment companies are specifically exempted from ASU 2016-01’s equity investment accounting provisions and will continue to follow the industry specific guidance for investment accounting under ASC 946. Although still evaluating the potential impacts of ASU 2016-01 to the fund, management expects that the impact of the fund’s adoption will be limited to additional financial statement disclosures.
Balance Sheet Offsetting – The fund’s accounting policy with respect to balance sheet offsetting is that, absent an event of default by the counterparty or a termination of the agreement, the International Swaps and Derivatives Association (ISDA) Master Agreement does not result in an offset of reported amounts of financial assets and financial liabilities in the Statement of Assets and Liabilities across transactions between the fund and the applicable counterparty. The fund’s right to setoff may be restricted
15
Table of Contents
Notes to Financial Statements (unaudited) – continued
or prohibited by the bankruptcy or insolvency laws of the particular jurisdiction to which a specific master netting agreement counterparty is subject. Balance sheet offsetting disclosures, to the extent applicable to the fund, have been included in the fund’s Significant Accounting Policies note under the captions for each of the fund’s in-scope financial instruments and transactions.
Investment Valuations – Equity securities, including restricted equity securities, are generally valued at the last sale or official closing price on their primary market or exchange as provided by a third-party pricing service. Equity securities, for which there were no sales reported that day, are generally valued at the last quoted daily bid quotation on their primary market or exchange as provided by a third-party pricing service. Short-term instruments with a maturity at issuance of 60 days or less may be valued at amortized cost, which approximates market value. Open-end investment companies are generally valued at net asset value per share. Securities and other assets generally valued on the basis of information from a third-party pricing service may also be valued at a broker/dealer bid quotation. Values obtained from third-party pricing services can utilize both transaction data and market information such as yield, quality, coupon rate, maturity, type of issue, trading characteristics, and other market data. The values of foreign securities and other assets and liabilities expressed in foreign currencies are converted to U.S. dollars using the mean of bid and asked prices for rates provided by a third-party pricing service.
The Board of Trustees has delegated primary responsibility for determining or causing to be determined the value of the fund’s investments (including any fair valuation) to the adviser pursuant to valuation policies and procedures approved by the Board. If the adviser determines that reliable market quotations are not readily available, investments are valued at fair value as determined in good faith by the adviser in accordance with such procedures under the oversight of the Board of Trustees. Under the fund’s valuation policies and procedures, market quotations are not considered to be readily available for most types of debt instruments and floating rate loans and many types of derivatives. These investments are generally valued at fair value based on information from third-party pricing services. In addition, investments may be valued at fair value if the adviser determines that an investment’s value has been materially affected by events occurring after the close of the exchange or market on which the investment is principally traded (such as foreign exchange or market) and prior to the determination of the fund’s net asset value, or after the halting of trading of a specific security where trading does not resume prior to the close of the exchange or market on which the security is principally traded. Events that occur on a frequent basis after foreign markets close (such as developments in foreign markets and significant movements in the U.S. markets) and prior to the determination of the fund’s net asset value may be deemed to have a material effect on the value of securities traded in foreign markets. Accordingly, the fund’s foreign equity securities may often be valued at fair value. The adviser generally relies on third-party pricing services or other information (such as the correlation with price movements of similar securities in the same or other markets; the type, cost and investment characteristics of the security; the business and financial condition of the issuer; and trading and other market data) to assist in determining whether to fair value and at what value to fair value an investment. The value of an investment for purposes of calculating the fund’s net asset value can differ depending
16
Table of Contents
Notes to Financial Statements (unaudited) – continued
on the source and method used to determine value. When fair valuation is used, the value of an investment used to determine the fund’s net asset value may differ from quoted or published prices for the same investment. There can be no assurance that the fund could obtain the fair value assigned to an investment if it were to sell the investment at the same time at which the fund determines its net asset value per share.
Various inputs are used in determining the value of the fund’s assets or liabilities. These inputs are categorized into three broad levels. In certain cases, the inputs used to measure fair value may fall into different levels of the fair value hierarchy. In such cases, an investment’s level within the fair value hierarchy is based on the lowest level of input that is significant to the fair value measurement. The fund’s assessment of the significance of a particular input to the fair value measurement in its entirety requires judgment, and considers factors specific to the investment. Level 1 includes unadjusted quoted prices in active markets for identical assets or liabilities. Level 2 includes other significant observable market-based inputs (including quoted prices for similar securities, interest rates, prepayment speed, and credit risk). Level 3 includes unobservable inputs, which may include the adviser’s own assumptions in determining the fair value of investments. The following is a summary of the levels used as of December 31, 2015 in valuing the fund’s assets or liabilities:
| Investments at Value | Level 1 | Level 2 | Level 3 | Total | ||||||||||||
| Equity Securities: | ||||||||||||||||
United Kingdom | $460,966,495 | $998,925,070 | $— | $1,459,891,565 | ||||||||||||
France | — | 1,046,289,248 | — | 1,046,289,248 | ||||||||||||
Japan | 71,293,728 | 954,081,465 | — | 1,025,375,193 | ||||||||||||
Switzerland | 37,827,266 | 960,115,642 | — | 997,942,908 | ||||||||||||
Germany | 157,484,626 | 684,003,322 | — | 841,487,948 | ||||||||||||
Netherlands | — | 395,949,062 | — | 395,949,062 | ||||||||||||
Canada | 318,919,334 | — | — | 318,919,334 | ||||||||||||
Hong Kong | — | 260,815,893 | — | 260,815,893 | ||||||||||||
Taiwan | 179,524,527 | 34,493,578 | — | 214,018,105 | ||||||||||||
Other Countries | 313,668,779 | 575,187,286 | — | 888,856,065 | ||||||||||||
| Mutual Funds | 79,761,489 | — | — | 79,761,489 | ||||||||||||
| Total Investments | $1,619,446,244 | $5,909,860,566 | $— | $7,529,306,810 | ||||||||||||
For further information regarding security characteristics, see the Portfolio of Investments.
Of the level 2 investments presented above, equity investments amounting to $5,837,259,095 would have been considered level 1 investments at the beginning of the period. The primary reason for changes in the classifications between levels 1 and 2 occurs when foreign equity securities are fair valued using other observable market-based inputs in place of the closing exchange price due to events occurring after the close of the exchange or market on which the investment is principally traded. The fund’s foreign equity securities may often be valued at fair value. The fund’s policy is to recognize transfers between the levels as of the end of the period.
Foreign Currency Translation – Purchases and sales of foreign investments, income, and expenses are converted into U.S. dollars based upon currency exchange rates prevailing on the respective dates of such transactions or on the reporting date for
17
Table of Contents
Notes to Financial Statements (unaudited) – continued
foreign denominated receivables and payables. Gains and losses attributable to foreign currency exchange rates on sales of securities are recorded for financial statement purposes as net realized gains and losses on investments. Gains and losses attributable to foreign exchange rate movements on receivables, payables, income and expenses are recorded for financial statement purposes as foreign currency transaction gains and losses. That portion of both realized and unrealized gains and losses on investments that results from fluctuations in foreign currency exchange rates is not separately disclosed.
Security Loans – Under its Securities Lending Agency Agreement with the fund, JPMorgan Chase and Co. (“Chase”), as lending agent, loans the securities of the fund to certain qualified institutions (the “Borrowers”) approved by the fund. Security loans can be terminated at the discretion of either the lending agent or the fund and the related securities must be returned within the earlier of the standard trade settlement period for such securities or within three business days. The loans are collateralized by cash and/or U.S. Treasury and federal agency obligations in an amount typically at least equal to the market value of the securities loaned. On loans collateralized by cash, the cash collateral is invested in a money market fund. The market value of the loaned securities is determined at the close of business of the fund and any additional required collateral is delivered to the fund on the next business day. Chase provides the fund with indemnification against Borrower default. In the event of Borrower default, Chase will, for the benefit of the fund, either purchase securities identical to those loaned or, when such purchase is commercially impracticable, pay the fund the market value of the loaned securities. In return, Chase assumes the fund’s rights to the related collateral. If the collateral value is less than the cost to purchase identical securities, Chase is responsible for the shortfall, but only to the extent that such shortfall is not due to a decline in collateral value resulting from collateral reinvestment for which the fund bears the risk of loss. At period end, the fund had investment securities on loan, all of which were classified as equity securities in the fund’s Portfolio of Investments, with a fair value of $4,204,045. The fair value of the fund’s investment securities on loan and a related liability of $4,436,201 for cash collateral received on securities loaned are both presented gross in the Statement of Assets and Liabilities. The collateral received on securities loaned exceeded the value of securities on loan at period end. The liability for cash collateral for securities loaned is carried at fair value, which is categorized as level 2 within the fair value hierarchy. A portion of the income generated upon investment of the collateral is remitted to the Borrowers, and the remainder is allocated between the fund and the lending agent. On loans collateralized by U.S. Treasury and/or federal agency obligations, a fee is received from the Borrower, and is allocated between the fund and the lending agent. Income from securities lending is included in “Interest” income, in the Statement of Operations. The dividend and interest income earned on the securities loaned is accounted for in the same manner as other dividend and interest income.
Indemnifications – Under the fund’s organizational documents, its officers and Trustees may be indemnified against certain liabilities and expenses arising out of the performance of their duties to the fund. Additionally, in the normal course of business, the fund enters into agreements with service providers that may contain
18
Table of Contents
Notes to Financial Statements (unaudited) – continued
indemnification clauses. The fund’s maximum exposure under these agreements is unknown as this would involve future claims that may be made against the fund that have not yet occurred.
Investment Transactions and Income – Investment transactions are recorded on the trade date. Interest income is recorded on the accrual basis. Dividends received in cash are recorded on the ex-dividend date. Certain dividends from foreign securities will be recorded when the fund is informed of the dividend if such information is obtained subsequent to the ex-dividend date. Dividend payments received in additional securities are recorded on the ex-dividend date in an amount equal to the value of the security on such date.
The fund may receive proceeds from litigation settlements. Any proceeds received from litigation involving portfolio holdings are reflected in the Statement of Operations in realized gain/loss if the security has been disposed of by the fund or in unrealized gain/loss if the security is still held by the fund. Any other proceeds from litigation not related to portfolio holdings are reflected as other income in the Statement of Operations.
Fees Paid Indirectly – The fund’s custody fee may be reduced by a credit earned under an arrangement that measures the value of U.S. dollars deposited with the custodian by the fund. The amount of the credit, for the six months ended December 31, 2015, is shown as a reduction of total expenses in the Statement of Operations.
Tax Matters and Distributions – The fund intends to qualify as a regulated investment company, as defined under Subchapter M of the Internal Revenue Code, and to distribute all of its taxable income, including realized capital gains. As a result, no provision for federal income tax is required. The fund’s federal tax returns, when filed, will remain subject to examination by the Internal Revenue Service for a three year period. Management has analyzed the fund’s tax positions taken on federal and state tax returns for all open tax years and does not believe that there are any uncertain tax positions that require recognition of a tax liability. Foreign taxes, if any, have been accrued by the fund in the accompanying financial statements in accordance with the applicable foreign tax law. Foreign income taxes may be withheld by certain countries in which the fund invests. Additionally, capital gains realized by the fund on securities issued in or by certain foreign countries may be subject to capital gains tax imposed by those countries.
Distributions to shareholders are recorded on the ex-dividend date. Income and capital gain distributions are determined in accordance with income tax regulations, which may differ from U.S. generally accepted accounting principles. Certain capital accounts in the financial statements are periodically adjusted for permanent differences in order to reflect their tax character. These adjustments have no impact on net assets or net asset value per share. Temporary differences which arise from recognizing certain items of income, expense, gain or loss in different periods for financial statement and tax purposes will reverse at some time in the future. Distributions in excess of net investment income or net realized gains are temporary overdistributions for financial statement purposes resulting from differences in the recognition or classification of income or distributions for financial statement and tax purposes.
19
Table of Contents
Notes to Financial Statements (unaudited) – continued
Book/tax differences primarily relate to passive foreign investment companies and wash sale loss deferrals.
The tax character of distributions made during the current period will be determined at fiscal year end. The tax character of distributions declared to shareholders for the last fiscal year is as follows:
| 6/30/15 | ||||
| Ordinary income (including any short-term capital gains) | $158,772,585 | |||
| Long-term capital gains | 23,351,556 | |||
| Total distributions | $182,124,141 | |||
The federal tax cost and the tax basis components of distributable earnings were as follows:
| As of 12/31/15 | ||||
| Cost of investments | $6,801,281,283 | |||
| Gross appreciation | 1,208,488,347 | |||
| Gross depreciation | (480,462,820 | ) | ||
| Net unrealized appreciation (depreciation) | $728,025,527 | |||
| As of 6/30/15 | ||||
| Undistributed ordinary income | 100,854,365 | |||
| Post-October capital loss deferral | (12,734,887 | ) | ||
| Other temporary differences | 51,362 | |||
| Net unrealized appreciation (depreciation) | 1,258,787,420 | |||
The aggregate cost above includes prior fiscal year end tax adjustments, if applicable.
(3) Transactions with Affiliates
Investment Adviser – The fund has an investment advisory agreement with MFS to provide overall investment management and related administrative services and facilities to the fund. The management fee is computed daily and paid monthly at the following annual rates:
| First $1 billion of average daily net assets | 0.75% | |||
| Next $1.5 billion of average daily net assets | 0.70% | |||
| Average daily net assets in excess of $2.5 billion | 0.65% |
The investment adviser has agreed in writing to reduce its management fee to 0.60% of average daily net assets in excess of $10 billion. This written agreement will continue until modified by the fund’s Board of Trustees, but such agreement will continue at least until October 31, 2016. For the six months ended December 31, 2015, the fund’s average daily net assets did not exceed $10 billion and therefore, the management fee was not reduced. MFS has also agreed in writing to reduce its management fee by a specified amount if certain MFS mutual fund assets exceed thresholds agreed to by MFS and the fund’s Board of Trustees. For the six months ended December 31, 2015, this management fee reduction amounted to $279,817, which is included in the reduction of total expenses in the Statement of Operations. The management fee
20
Table of Contents
Notes to Financial Statements (unaudited) – continued
incurred for the six months ended December 31, 2015 was equivalent to an annual effective rate of 0.67% of the fund’s average daily net assets.
The investment adviser has agreed in writing to pay all of the fund’s total annual operating expenses, excluding interest, taxes, extraordinary expenses, brokerage and transaction costs and investment-related expenses such that total annual fund operating expenses do not exceed 0.75% of the fund’s average daily net assets. This written agreement will continue until modified by the fund’s Board of Trustees, but such agreement will continue at least until October 31, 2016. For the six months ended December 31, 2015, the fund’s actual operating expenses did not exceed the limit and therefore, the investment adviser did not pay any portion of the fund’s expenses related to this agreement.
Shareholder Servicing Agent – MFS Service Center, Inc. (MFSC), a wholly-owned subsidiary of MFS, receives a fee from the fund, for its services as shareholder servicing agent. For the six months ended December 31, 2015, the fee was $83,402, which equated to 0.0022% annually of the fund’s average daily net assets. MFSC also receives payment from the fund for out-of-pocket expenses paid by MFSC on behalf of the fund. For the six months ended December 31, 2015, these costs amounted to $2,757.
Administrator – MFS provides certain financial, legal, shareholder communications, compliance, and other administrative services to the fund. Under an administrative services agreement, the fund reimburses MFS the costs incurred to provide these services. The fund is charged an annual fixed amount of $17,500 plus a fee based on average daily net assets. The administrative services fee incurred for the six months ended December 31, 2015 was equivalent to an annual effective rate of 0.0083% of the fund’s average daily net assets.
Trustees’ and Officers’ Compensation – The fund pays compensation to independent Trustees in the form of a retainer, attendance fees, and additional compensation to Board and Committee chairpersons. The fund does not pay compensation directly to Trustees or to officers of the fund who are also officers of the investment adviser, all of whom receive remuneration for their services to the fund from MFS. Certain officers and Trustees of the fund are officers or directors of MFS, MFS Fund Distributors, Inc. (MFD), and MFSC.
Other –This fund and certain other funds managed by MFS (the funds) have entered into a service agreement (the ISO Agreement) which provides for payment of fees solely by the funds to Tarantino LLC in return for the provision of services of an Independent Senior Officer (ISO) for the funds. Frank L. Tarantino serves as the ISO and is an officer of the funds and the sole member of Tarantino LLC. The funds can terminate the ISO Agreement with Tarantino LLC at any time under the terms of the ISO Agreement. For the six months ended December 31, 2015, the fee paid by the fund under this agreement was $8,897 and is included in “Miscellaneous” expense in the Statement of Operations. MFS has agreed to bear all expenses associated with office space, other administrative support, and supplies provided to the ISO.
The fund invests in the MFS Institutional Money Market Portfolio which is managed by MFS and seeks current income consistent with preservation of capital and liquidity.
21
Table of Contents
Notes to Financial Statements (unaudited) – continued
Income earned on this investment is included in “Dividends from underlying affiliated funds” in the Statement of Operations. This money market fund does not pay a management fee to MFS.
(4) Portfolio Securities
For the six months ended December 31, 2015, purchases and sales of investments, other than short-term obligations, aggregated $538,009,231 and $299,962,855, respectively.
(5) Shares of Beneficial Interest
The fund’s Declaration of Trust permits the Trustees to issue an unlimited number of full and fractional shares of beneficial interest. Transactions in fund shares were as follows:
| Six months ended 12/31/15 | Year ended 6/30/15 | |||||||||||||||
| Shares | Amount | Shares | Amount | |||||||||||||
| Shares sold | 35,771,419 | $759,263,204 | 72,476,354 | $1,621,224,661 | ||||||||||||
| Shares issued to shareholders in reinvestment of distributions | 5,773,256 | 117,832,153 | 8,186,470 | 168,395,684 | ||||||||||||
| Shares reacquired | (23,643,019 | ) | (506,360,409 | ) | (49,212,663 | ) | (1,094,848,725 | ) | ||||||||
| Net change | 17,901,656 | $370,734,948 | 31,450,161 | $694,771,620 | ||||||||||||
The fund is one of several mutual funds in which certain MFS funds may invest. The MFS funds do not invest in the underlying funds for the purpose of exercising management or control. At the end of the period, the MFS Managed Wealth Fund was the owner of record of less than 1% of the value of outstanding voting shares of the fund.
(6) Line of Credit
The fund and certain other funds managed by MFS participate in a $1.25 billion unsecured committed line of credit, subject to a $1 billion sublimit, provided by a syndication of banks under a credit agreement. Borrowings may be made for temporary financing needs. Interest is charged to each fund, based on its borrowings, generally at a rate equal to the higher of the Overnight Federal Reserve funds rate or daily one month LIBOR plus an agreed upon spread. A commitment fee, based on the average daily, unused portion of the committed line of credit, is allocated among the participating funds at the end of each calendar quarter. In addition, the fund and other funds managed by MFS have established unsecured uncommitted borrowing arrangements with certain banks for temporary financing needs. Interest is charged to each fund, based on its borrowings, at a rate equal to the Overnight Federal Reserve funds rate plus an agreed upon spread. For the six months ended December 31, 2015, the fund’s commitment fee and interest expense were $12,600 and $0, respectively, and are included in “Miscellaneous” expense in the Statement of Operations.
22
Table of Contents
Notes to Financial Statements (unaudited) – continued
(7) Transactions in Underlying Affiliated Funds – Affiliated Issuers
An affiliated issuer may be considered one in which the fund owns 5% or more of the outstanding voting securities, or a company which is under common control. For the purposes of this report, the fund assumes the following to be an affiliated issuer:
| Underlying Affiliated Fund | Beginning Shares/Par Amount | Acquisitions Shares/Par Amount | Dispositions Shares/Par Amount | Ending Shares/Par Amount | ||||||||||||
| MFS Institutional Money Market Portfolio | 325,221,510 | 342,128,954 | (592,025,176 | ) | 75,325,288 | |||||||||||
| Underlying Affiliated Fund | Realized Gain (Loss) | Capital Gain Distributions | Dividend Income | Ending Value | ||||||||||||
| MFS Institutional Money Market Portfolio | $— | $— | $45,371 | $75,325,288 | ||||||||||||
23
Table of Contents
BOARD REVIEW OF INVESTMENT ADVISORY AGREEMENT
The Investment Company Act of 1940 requires that both the full Board of Trustees and a majority of the non-interested (“independent”) Trustees, voting separately, annually approve the continuation of the Fund’s investment advisory agreement with MFS. The Trustees consider matters bearing on the Fund and its advisory arrangements at their meetings throughout the year, including a review of performance data at each regular meeting. In addition, the independent Trustees met several times over the course of three months beginning in May and ending in July, 2015 (“contract review meetings”) for the specific purpose of considering whether to approve the continuation of the investment advisory agreement for the Fund and the other investment companies that the Board oversees (the “MFS Funds”). The independent Trustees were assisted in their evaluation of the Fund’s investment advisory agreement by independent legal counsel, from whom they received separate legal advice and with whom they met separately from MFS during various contract review meetings. The independent Trustees were also assisted in this process by the MFS Funds’ Independent Senior Officer, a senior officer appointed by and reporting to the independent Trustees.
In connection with their deliberations regarding the continuation of the investment advisory agreement, the Trustees, including the independent Trustees, considered such information and factors as they believed, in light of the legal advice furnished to them and their own business judgment, to be relevant. The investment advisory agreement for the Fund was considered separately, although the Trustees also took into account the common interests of all MFS Funds in their review. As described below, the Trustees considered the nature, quality, and extent of the various investment advisory, administrative, and shareholder services performed by MFS under the existing investment advisory agreement and other arrangements with the Fund.
In connection with their contract review meetings, the Trustees received and relied upon materials that included, among other items: (i) information provided by Lipper Inc., an independent third party, on the investment performance of the Fund for various time periods ended December 31, 2014 and the investment performance of a group of funds with substantially similar investment classifications/objectives (the “Lipper performance universe”), (ii) information provided by Lipper Inc. on the Fund’s advisory fees and other expenses and the advisory fees and other expenses of comparable funds identified by Lipper Inc. (the “Lipper expense group”), (iii) information provided by MFS on the advisory fees of comparable portfolios of other clients of MFS, including institutional separate accounts and other clients, (iv) information as to whether and to what extent applicable expense waivers, reimbursements or fee “breakpoints” are observed for the Fund, (v) information regarding MFS’ financial results and financial condition, including MFS’ and certain of its affiliates’ estimated profitability from services performed for the Fund and the MFS Funds as a whole, and compared to MFS’ institutional business, (vi) MFS’ views regarding the outlook for the mutual fund industry and the strategic business plans of MFS, (vii) descriptions of various functions performed by MFS for the Funds, such as compliance monitoring and portfolio trading practices, and (viii) information regarding the overall organization of MFS, including information about MFS’ senior management and other personnel providing investment advisory, administrative and other services to
24
Table of Contents
Board Review of Investment Advisory Agreement – continued
the Fund and the other MFS Funds. The comparative performance, fee and expense information prepared and provided by Lipper Inc. was not independently verified and the independent Trustees did not independently verify any information provided to them by MFS.
The Trustees’ conclusion as to the continuation of the investment advisory agreement was based on a comprehensive consideration of all information provided to the Trustees and not the result of any single factor. Some of the factors that figured particularly in the Trustees’ deliberations are described below, although individual Trustees may have evaluated the information presented differently from one another, giving different weights to various factors. It is also important to recognize that the fee arrangements for the Fund and other MFS Funds are the result of years of review and discussion between the independent Trustees and MFS, that certain aspects of such arrangements may receive greater scrutiny in some years than in others, and that the Trustees’ conclusions may be based, in part, on their consideration of these same arrangements during the course of the year and in prior years.
Based on information provided by Lipper Inc. and MFS, the Trustees reviewed the Fund’s total return investment performance as well as the performance of peer groups of funds over various time periods. The Trustees placed particular emphasis on the Fund’s total return performance in comparison to the performance of funds in its Lipper performance universe over the three-year period ended December 31, 2014, which the Trustees believed was a long enough period to reflect differing market conditions. The total return performance of the Fund’s shares was in the 2nd quintile relative to the other funds in the universe for this three-year period (the 1st quintile being the best performers and the 5th quintile being the worst performers). The total return performance of the Fund’s shares was in the 3rd quintile for the one-year period and the 2nd quintile for the five-year period ended December 31, 2014 relative to the Lipper performance universe. Because of the passage of time, these performance results may differ from the performance results for more recent periods, including those shown elsewhere in this report.
In the course of their deliberations, the Trustees took into account information provided by MFS in connection with the contract review meetings, as well as during investment review meetings conducted with portfolio management personnel during the course of the year regarding the Fund’s performance. After reviewing these and related factors, the Trustees concluded, within the context of their overall conclusions regarding the investment advisory agreement, that they were satisfied with MFS’ responses and efforts relating to investment performance.
In assessing the reasonableness of the Fund’s advisory fee, the Trustees considered, among other information, the Fund’s advisory fee and the total expense ratio as a percentage of average daily net assets and the advisory fee and total expense ratios of peer groups of funds based on information provided by Lipper Inc. The Trustees considered that MFS currently observes an expense limitation for the Fund, which may not be changed without the Trustees’ approval. The Trustees also considered that, according to the Lipper data (which takes into account any fee reductions or expense limitations that were in effect during the Fund’s last fiscal year), the Fund’s effective advisory fee rate and total expense ratio were each lower than the Lipper expense group median.
25
Table of Contents
Board Review of Investment Advisory Agreement – continued
The Trustees also considered the advisory fees charged by MFS to any institutional separate accounts advised by MFS (“separate accounts”) and unaffiliated investment companies for which MFS serves as subadviser (“subadvised funds”) that have comparable investment strategies to the Fund. In comparing these fees, the Trustees considered information provided by MFS as to the generally broader scope of services provided by MFS to the Fund, as well as the more extensive regulatory burdens imposed on MFS in managing the Fund, in comparison to separate accounts and subadvised funds. The Trustees also considered the higher demands placed on MFS’ investment personnel and trading infrastructure as a result of the daily cash in-flows and out-flows of the Fund in comparison to separate accounts.
The Trustees also considered whether the Fund may benefit from any economies of scale in the management of the Fund in the event of growth in assets of the Fund and/or growth in assets of the MFS Funds as a whole. They noted that the Fund’s advisory fee rate schedule is subject to contractual breakpoints that reduce the Fund’s advisory fee rate on average daily net assets over $1 billion and $2.5 billion, and that MFS has agreed in writing to further reduce its advisory fee rate on the Fund’s average daily net assets over $10 billion, which may not be changed without the Trustees’ approval. The Trustees also noted that MFS has agreed in writing to waive a portion of the management fees of certain MFS Funds, including the Fund, if the total combined assets of certain funds within the MFS Funds’ complex increase above agreed upon thresholds (the “group fee waiver”), enabling the Fund’s shareholders to share in the benefits from any economies of scale at the complex level. The group fee waiver is reviewed and renewed annually between the Board and MFS. The Trustees concluded that the breakpoints and the group fee waiver were sufficient to allow the Fund to benefit from economies of scale as its assets and overall complex assets grow.
The Trustees also considered information prepared by MFS relating to MFS’ costs and profits with respect to the Fund, the MFS Funds considered as a group, and other investment companies and accounts advised by MFS, as well as MFS’ methodologies used to determine and allocate its costs to the MFS Funds, the Fund and other accounts and products for purposes of estimating profitability.
After reviewing these and other factors described herein, the Trustees concluded, within the context of their overall conclusions regarding the investment advisory agreement, that the advisory fees charged to the Fund represent reasonable compensation in light of the services being provided by MFS to the Fund.
In addition, the Trustees considered MFS’ resources and related efforts to continue to retain, attract and motivate capable personnel to serve the Fund. The Trustees also considered current and developing conditions in the financial services industry, including the presence of large and well-capitalized companies which are spending, and appear to be prepared to continue to spend, substantial sums to engage personnel and to provide services to competing investment companies. In this regard, the Trustees also considered the financial resources of MFS and its ultimate parent, Sun Life Financial Inc. The Trustees also considered the advantages and possible disadvantages to the Fund of having an adviser that also serves other investment companies as well as other accounts.
26
Table of Contents
Board Review of Investment Advisory Agreement – continued
The Trustees also considered the nature, quality, cost, and extent of administrative, transfer agency, and distribution services provided to the Fund by MFS and its affiliates under agreements and plans other than the investment advisory agreement. The Trustees also considered the nature, extent and quality of certain other services MFS performs or arranges for on the Fund’s behalf, which may include securities lending programs, directed expense payment programs, class action recovery programs, and MFS’ interaction with third-party service providers, principally custodians and sub-custodians. The Trustees concluded that the various non-advisory services provided by MFS and its affiliates on behalf of the Fund were satisfactory.
The Trustees also considered benefits to MFS from the use of the Fund’s portfolio brokerage commissions, if applicable, to pay for investment research and various other factors. Additionally, the Trustees considered so-called “fall-out benefits” to MFS such as reputational value derived from serving as investment manager to the Fund.
Based on their evaluation of factors that they deemed to be material, including those factors described above, the Board of Trustees, including the independent Trustees, concluded that the Fund’s investment advisory agreement with MFS should be continued for an additional one-year period, commencing August 1, 2015.
27
Table of Contents
PROXY VOTING POLICIES AND INFORMATION
MFS votes proxies on behalf of the fund pursuant to proxy voting policies and procedures that are available without charge, upon request, by calling 1-800-225-2606, by visiting the Proxy Voting section of mfs.com or by visiting the SEC’s Web site at http://www.sec.gov.
Information regarding how the fund voted proxies relating to portfolio securities during the most recent twelve-month period ended June 30 is available without charge by visiting the Proxy Voting section of mfs.com or by visiting the SEC’s Web site at http://www.sec.gov.
QUARTERLY PORTFOLIO DISCLOSURE
The fund will file a complete schedule of portfolio holdings with the Securities and Exchange Commission (the Commission) for the first and third quarters of each fiscal year on Form N-Q. A shareholder can obtain the quarterly portfolio holdings report at mfs.com. The fund’s Form N-Q is also available on the EDGAR database on the Commission’s Internet Web site at http://www.sec.gov, and may be reviewed and copied at the:
Public Reference Room
Securities and Exchange Commission
100 F Street, NE, Room 1580
Washington, D.C. 20549
Information on the operation of the Public Reference Room may be obtained by calling the Commission at 1-800-SEC-0330. Copies of the fund’s Form N-Q also may be obtained, upon payment of a duplicating fee, by electronic request at the following e-mail address: publicinfo@sec.gov or by writing the Public Reference Section at the above address.
From time to time, MFS may post important information about the fund or the MFS funds on the MFS web site (mfs.com). This information is available by clicking on the “Institutions & Consultants” role, then choosing the United States, and then either viewing the “Commentary & Announcements” section or clicking on “Research & Commentary” or the fund’s name under “US Institutional Trust” in the “US Institutional Trust & Reports” section.
28
Table of Contents
WEBSITE
mfs.com
CALL
1-800-637-2262
WRITE
MFS Investment Management®
111 Huntington Avenue
Boston, MA 02199-7618
Table of Contents
SEMIANNUAL REPORT
December 31, 2015

MFS® INSTITUTIONAL LARGE CAP VALUE FUND

ILV-SEM
Table of Contents
MFS® INSTITUTIONAL LARGE CAP VALUE FUND
The report is prepared for the general information of shareholders.
It is authorized for distribution to prospective investors only when preceded or accompanied by a current prospectus.
NOT FDIC INSURED • MAY LOSE VALUE • NO BANK GUARANTEE
Table of Contents

Dear Shareholders:
Central bank policies remain center stage as the U.S. Federal Reserve made good on its pledge to raise policy rates for the first time in over nine years at its December meeting.
The Fed’s actions stand in stark contrast to those of the European Central Bank and Bank of Japan, which modestly extended their quantitative easing programs in December.
In the United States, auto sales remain a source of economic strength, but housing demand has slowed of late. The U.S. economic expansion remains moderate but uneven, with a strong dollar crimping demand for U.S. goods abroad. China’s shift to a consumer-led economy continues to weigh on its manufacturing and exports, as does weak global demand. Slackening demand from China continues to undermine commodity markets, with oil particularly impacted amid a global supply glut.
As markets have become more focused on short-term trends in recent years, we believe it’s important for investors to lengthen their investment time horizon. At MFS®, we don’t trade on headlines or trends; we invest for the long term.
We believe that this approach, coupled with the professional guidance of a financial advisor, will help you reach your investment goals.
Respectfully,

Robert J. Manning
Chairman
MFS Investment Management
February 16, 2016
The opinions expressed in this letter are subject to change and may not be relied upon for investment advice. No forecasts can be guaranteed.
1
Table of Contents
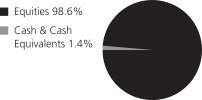
Portfolio structure
| Top ten holdings | ||||
| JPMorgan Chase & Co. | 4.7% | |||
| Johnson & Johnson | 3.5% | |||
| Philip Morris International, Inc. | 3.4% | |||
| Wells Fargo & Co. | 3.3% | |||
| Accenture PLC, “A” | 2.6% | |||
| Pfizer, Inc. | 2.5% | |||
| Travelers Cos., Inc. | 2.1% | |||
| Medtronic PLC | 2.0% | |||
| Honeywell International, Inc. | 2.0% | |||
| PPG Industries, Inc. | 2.0% |
| Equity sectors | ||||
| Financial Services | 27.6% | |||
| Health Care | 14.1% | |||
| Industrial Goods & Services | 12.1% | |||
| Consumer Staples | 10.4% | |||
| Energy | 6.2% | |||
| Basic Materials | 5.7% | |||
| Leisure | 4.2% | |||
| Special Products & Services | 4.1% | |||
| Technology | 3.5% | |||
| Retailing | 3.1% | |||
| Utilities & Communications | 2.9% | |||
| Autos & Housing | 2.5% | |||
| Transportation | 2.2% |
Cash & Cash Equivalents includes any cash, investments in money market funds, short-term securities, and other assets less liabilities. Please see the Statement of Assets and Liabilities for additional information related to the fund’s cash position and other assets and liabilities.
Percentages are based on net assets as of 12/31/15.
The portfolio is actively managed and current holdings may be different.
2
Table of Contents
Fund expenses borne by the shareholders during the period, July 1, 2015 through December 31, 2015
As a shareholder of the fund, you incur ongoing costs, including management fees and other fund expenses. This example is intended to help you understand your ongoing costs (in dollars) of investing in the fund and to compare these costs with the ongoing costs of investing in other mutual funds.
The example is based on an investment of $1,000 invested at the beginning of the period and held for the entire period July 1, 2015 through December 31, 2015.
Actual Expenses
The first line of the following table provides information about actual account values and actual expenses. You may use the information in this line, together with the amount you invested, to estimate the expenses that you paid over the period. Simply divide your account value by $1,000 (for example, an $8,600 account value divided by $1,000 = 8.6), then multiply the result by the number in the first line under the heading entitled “Expenses Paid During Period” to estimate the expenses you paid on your account during this period.
Hypothetical Example for Comparison Purposes
The second line of the following table provides information about hypothetical account values and hypothetical expenses based on the fund’s actual expense ratio and an assumed rate of return of 5% per year before expenses, which is not the fund’s actual return. The hypothetical account values and expenses may not be used to estimate the actual ending account balance or expenses you paid for the period. You may use this information to compare the ongoing costs of investing in the fund and other funds. To do so, compare this 5% hypothetical example with the 5% hypothetical examples that appear in the shareholder reports of the other funds.
Please note that the expenses shown in the table are meant to highlight your ongoing costs only and do not reflect any transactional costs, such as sales charges (loads). Therefore, the second line of the table is useful in comparing ongoing costs only, and will not help you determine the relative total costs of owning different funds. In addition, if these transactional costs were included, your costs would have been higher.
Annualized Ratio | Beginning Account Value 7/01/15 | Ending Account Value | Expenses Paid During Period (p) 7/01/15-12/31/15 | |||||
| Actual | 0.65% | $1,000.00 | $981.81 | $3.24 | ||||
| Hypothetical (h) | 0.65% | $1,000.00 | $1,021.87 | $3.30 |
| (h) | 5% fund return per year before expenses. |
| (p) | “Expenses Paid During Period” are equal to the fund’s annualized expense ratio, as shown above, multiplied by the average account value over the period, multiplied by 184/366 (to reflect the one-half year period). |
3
Table of Contents
12/31/15 (unaudited)
The Portfolio of Investments is a complete list of all securities owned by your fund. It is categorized by broad-based asset classes.
| COMMON STOCKS – 98.6% | ||||||||
| Issuer | Shares/Par | Value ($) | ||||||
| Aerospace – 6.7% | ||||||||
| Honeywell International, Inc. | 17,734 | $ | 1,836,706 | |||||
| Lockheed Martin Corp. | 7,170 | 1,556,966 | ||||||
| Northrop Grumman Corp. | 5,065 | 956,323 | ||||||
| United Technologies Corp. | 18,564 | 1,783,443 | ||||||
|
| |||||||
| $ | 6,133,438 | |||||||
| Alcoholic Beverages – 1.3% | ||||||||
| Diageo PLC, ADR | 10,732 | $ | 1,170,539 | |||||
| Automotive – 2.0% | ||||||||
| Delphi Automotive PLC | 8,042 | $ | 689,441 | |||||
| Harley-Davidson, Inc. | 8,933 | 405,469 | ||||||
| Johnson Controls, Inc. | 18,441 | 728,235 | ||||||
|
| |||||||
| $ | 1,823,145 | |||||||
| Broadcasting – 2.9% | ||||||||
| Omnicom Group, Inc. | 17,732 | $ | 1,341,603 | |||||
| Time Warner, Inc. | 10,868 | 702,834 | ||||||
| Viacom, Inc., “B” | 8,207 | 337,800 | ||||||
| Walt Disney Co. | 2,453 | 257,761 | ||||||
|
| |||||||
| $ | 2,639,998 | |||||||
| Brokerage & Asset Managers – 2.8% | ||||||||
| BlackRock, Inc. | 2,556 | $ | 870,369 | |||||
| Franklin Resources, Inc. | 22,994 | 846,639 | ||||||
| NASDAQ, Inc. | 14,973 | 870,979 | ||||||
|
| |||||||
| $ | 2,587,987 | |||||||
| Business Services – 4.1% | ||||||||
| Accenture PLC, “A” | 22,946 | $ | 2,397,857 | |||||
| Equifax, Inc. | 1,786 | 198,907 | ||||||
| Fidelity National Information Services, Inc. | 12,188 | 738,593 | ||||||
| Fiserv, Inc. (a) | 4,889 | 447,148 | ||||||
|
| |||||||
| $ | 3,782,505 | |||||||
| Cable TV – 1.2% | ||||||||
| Comcast Corp., “A” | 18,912 | $ | 1,067,204 | |||||
| Chemicals – 5.2% | ||||||||
| 3M Co. | 11,714 | $ | 1,764,597 | |||||
| E.I. du Pont de Nemours & Co. | 11,746 | 782,284 | ||||||
4
Table of Contents
Portfolio of Investments (unaudited) – continued
| Issuer | Shares/Par | Value ($) | ||||||
| COMMON STOCKS – continued | ||||||||
| Chemicals – continued | ||||||||
| Monsanto Co. | 3,733 | $ | 367,775 | |||||
| PPG Industries, Inc. | 18,547 | 1,832,815 | ||||||
|
| |||||||
| $ | 4,747,471 | |||||||
| Computer Software – 0.8% | ||||||||
| Oracle Corp. | 20,983 | $ | 766,509 | |||||
| Computer Software – Systems – 1.2% | ||||||||
| International Business Machines Corp. | 7,902 | $ | 1,087,473 | |||||
| Construction – 0.5% | ||||||||
| Stanley Black & Decker, Inc. | 4,496 | $ | 479,858 | |||||
| Consumer Products – 0.7% | ||||||||
| Newell Rubbermaid, Inc. | 5,371 | $ | 236,754 | |||||
| Procter & Gamble Co. | 5,577 | 442,870 | ||||||
|
| |||||||
| $ | 679,624 | |||||||
| Containers – 0.5% | ||||||||
| Crown Holdings, Inc. (a) | 9,131 | $ | 462,942 | |||||
| Electrical Equipment – 3.0% | ||||||||
| Danaher Corp. | 14,472 | $ | 1,344,159 | |||||
| Pentair PLC | 7,321 | 362,609 | ||||||
| Tyco International PLC | 31,852 | 1,015,760 | ||||||
|
| |||||||
| $ | 2,722,528 | |||||||
| Electronics – 1.5% | ||||||||
| Analog Devices, Inc. | 3,404 | $ | 188,309 | |||||
| Texas Instruments, Inc. | 21,773 | 1,193,378 | ||||||
|
| |||||||
| $ | 1,381,687 | |||||||
| Energy – Independent – 1.7% | ||||||||
| EOG Resources, Inc. | 10,568 | $ | 748,109 | |||||
| Occidental Petroleum Corp. | 12,486 | 844,178 | ||||||
|
| |||||||
| $ | 1,592,287 | |||||||
| Energy – Integrated – 2.8% | ||||||||
| Chevron Corp. | 12,144 | $ | 1,092,474 | |||||
| Exxon Mobil Corp. | 19,267 | 1,501,863 | ||||||
|
| |||||||
| $ | 2,594,337 | |||||||
| Food & Beverages – 4.4% | ||||||||
| Archer Daniels Midland Co. | 12,994 | $ | 476,620 | |||||
| DANONE S.A., ADR | 49,652 | 675,764 | ||||||
5
Table of Contents
Portfolio of Investments (unaudited) – continued
| Issuer | Shares/Par | Value ($) | ||||||
| COMMON STOCKS – continued | ||||||||
| Food & Beverages – continued | ||||||||
| General Mills, Inc. | 23,983 | $ | 1,382,860 | |||||
| Nestle S.A., ADR | 19,926 | 1,482,893 | ||||||
|
| |||||||
| $ | 4,018,137 | |||||||
| Food & Drug Stores – 1.7% | ||||||||
| CVS Health Corp. | 16,370 | $ | 1,600,495 | |||||
| General Merchandise – 0.9% | ||||||||
| Target Corp. | 11,787 | $ | 855,854 | |||||
| Insurance – 8.1% | ||||||||
| ACE Ltd. | 9,187 | $ | 1,073,501 | |||||
| Aon PLC | 12,542 | 1,156,498 | ||||||
| Chubb Corp. | 6,929 | 919,063 | ||||||
| MetLife, Inc. | 31,920 | 1,538,863 | ||||||
| Prudential Financial, Inc. | 10,328 | 840,802 | ||||||
| Travelers Cos., Inc. | 17,124 | 1,932,615 | ||||||
|
| |||||||
| $ | 7,461,342 | |||||||
| Machinery & Tools – 2.5% | ||||||||
| Caterpillar, Inc. | 3,946 | $ | 268,170 | |||||
| Cummins, Inc. | 2,054 | 180,773 | ||||||
| Deere & Co. | 3,092 | 235,827 | ||||||
| Eaton Corp. PLC | 13,331 | 693,745 | ||||||
| Illinois Tool Works, Inc. | 7,678 | 711,597 | ||||||
| Parker Hannifin Corp. | 2,159 | 209,380 | ||||||
|
| |||||||
| $ | 2,299,492 | |||||||
| Major Banks – 12.7% | ||||||||
| Bank of New York Mellon Corp. | 25,510 | $ | 1,051,522 | |||||
| Goldman Sachs Group, Inc. | 9,300 | 1,676,139 | ||||||
| JPMorgan Chase & Co. | 65,935 | 4,353,688 | ||||||
| PNC Financial Services Group, Inc. | 8,326 | 793,551 | ||||||
| State Street Corp. | 11,379 | 755,110 | ||||||
| Wells Fargo & Co. | 56,435 | 3,067,807 | ||||||
|
| |||||||
| $ | 11,697,817 | |||||||
| Medical & Health Technology & Services – 1.1% | ||||||||
| Express Scripts Holding Co. (a) | 11,583 | $ | 1,012,470 | |||||
| Medical Equipment – 5.0% | ||||||||
| Abbott Laboratories | 23,286 | $ | 1,045,774 | |||||
| Medtronic PLC | 23,933 | 1,840,926 | ||||||
| St. Jude Medical, Inc. | 9,741 | 601,702 | ||||||
6
Table of Contents
Portfolio of Investments (unaudited) – continued
| Issuer | Shares/Par | Value ($) | ||||||
| COMMON STOCKS – continued | ||||||||
| Medical Equipment – continued | ||||||||
| Thermo Fisher Scientific, Inc. | 7,977 | $ | 1,131,537 | |||||
|
| |||||||
| $ | 4,619,939 | |||||||
| Oil Services – 1.6% | ||||||||
| Baker Hughes, Inc. | 1,385 | $ | 63,918 | |||||
| National Oilwell Varco, Inc. | 13,866 | 464,372 | ||||||
| Schlumberger Ltd. | 13,926 | 971,339 | ||||||
|
| |||||||
| $ | 1,499,629 | |||||||
| Other Banks & Diversified Financials – 4.0% | ||||||||
| American Express Co. | 13,005 | $ | 904,498 | |||||
| BB&T Corp. | 11,055 | 417,990 | ||||||
| Citigroup, Inc. | 11,529 | 596,626 | ||||||
| U.S. Bancorp | 40,401 | 1,723,911 | ||||||
|
| |||||||
| $ | 3,643,025 | |||||||
| Pharmaceuticals – 8.0% | ||||||||
| Johnson & Johnson | 31,193 | $ | 3,204,145 | |||||
| Merck & Co., Inc. | 24,855 | 1,312,841 | ||||||
| Novartis AG, ADR | 3,170 | 272,747 | ||||||
| Pfizer, Inc. | 71,457 | 2,306,632 | ||||||
| Roche Holding Ltd., ADR | 7,259 | 250,218 | ||||||
|
| |||||||
| $ | 7,346,583 | |||||||
| Printing & Publishing – 0.2% | ||||||||
| McGraw-Hill Cos., Inc. | 1,809 | $ | 178,331 | |||||
| Time, Inc. | 995 | 15,592 | ||||||
|
| |||||||
| $ | 193,923 | |||||||
| Railroad & Shipping – 0.9% | ||||||||
| Canadian National Railway Co. | 8,098 | $ | 452,516 | |||||
| Union Pacific Corp. | 4,302 | 336,416 | ||||||
|
| |||||||
| $ | 788,932 | |||||||
| Specialty Stores – 0.5% | ||||||||
| Advance Auto Parts, Inc. | 1,871 | $ | 281,604 | |||||
| Bed Bath & Beyond, Inc. (a) | 3,266 | 157,585 | ||||||
|
| |||||||
| $ | 439,189 | |||||||
| Telecommunications – Wireless – 0.2% | ||||||||
| Vodafone Group PLC, ADR | 7,056 | $ | 227,627 | |||||
| Telephone Services – 1.7% | ||||||||
| Verizon Communications, Inc. | 32,968 | $ | 1,523,781 | |||||
7
Table of Contents
Portfolio of Investments (unaudited) – continued
| Issuer | Shares/Par | Value ($) | ||||||
| COMMON STOCKS – continued | ||||||||
| Tobacco – 4.0% | ||||||||
| Altria Group, Inc. | 9,332 | $ | 543,216 | |||||
| Philip Morris International, Inc. | 35,641 | 3,133,200 | ||||||
|
| |||||||
| $ | 3,676,416 | |||||||
| Trucking – 1.3% | ||||||||
| United Parcel Service, Inc., “B” | 12,746 | $ | 1,226,548 | |||||
| Utilities – Electric Power – 0.9% | ||||||||
| Duke Energy Corp. | 9,592 | $ | 684,773 | |||||
| Xcel Energy, Inc. | 5,267 | 189,138 | ||||||
|
| |||||||
| $ | 873,911 | |||||||
| Total Common Stocks (Identified Cost, $58,910,437) | $ | 90,724,642 | ||||||
| MONEY MARKET FUNDS – 1.2% | ||||||||
| MFS Institutional Money Market Portfolio, 0.19%, at Cost and Net Asset Value (v) | 1,092,692 | $ | 1,092,692 | |||||
| Total Investments (Identified Cost, $60,003,129) | $ | 91,817,334 | ||||||
| OTHER ASSETS, LESS LIABILITIES – 0.2% | 166,513 | |||||||
| NET ASSETS – 100.0% | $ | 91,983,847 | ||||||
| (a) | Non-income producing security. |
| (v) | Underlying affiliated fund that is available only to investment companies managed by MFS. The rate quoted for the MFS Institutional Money Market Portfolio is the annualized seven-day yield of the fund at period end. |
The following abbreviations are used in this report and are defined:
| ADR | American Depositary Receipt |
| PLC | Public Limited Company |
See Notes to Financial Statements
8
Table of Contents
Financial Statements
STATEMENT OF ASSETS AND LIABILITIES
At 12/31/15 (unaudited)
This statement represents your fund’s balance sheet, which details the assets and liabilities comprising the total value of the fund.
| Assets | ||||
Investments | ||||
Non-affiliated issuers, at value (identified cost, $58,910,437) | $90,724,642 | |||
Underlying affiliated funds, at cost and value | 1,092,692 | |||
Total investments, at value (identified cost, $60,003,129) | $91,817,334 | |||
Receivables for | ||||
Fund shares sold | 51,000 | |||
Dividends | 146,299 | |||
| Receivable from investment adviser | 280 | |||
Other assets | 777 | |||
Total assets | $92,015,690 | |||
| Liabilities | ||||
Payable to custodian | $597 | |||
Payable for fund shares reacquired | 169 | |||
Payable for shareholder servicing costs | 219 | |||
Payable for independent Trustees’ compensation | 55 | |||
Accrued expenses and other liabilities | 30,803 | |||
Total liabilities | $31,843 | |||
Net assets | $91,983,847 | |||
| Net assets consist of | ||||
Paid-in capital | $59,731,626 | |||
Unrealized appreciation (depreciation) on investments | 31,814,205 | |||
Accumulated net realized gain (loss) on investments | 389,576 | |||
Undistributed net investment income | 48,440 | |||
Net assets | $91,983,847 | |||
Shares of beneficial interest outstanding | 12,053,969 | |||
Net asset value per share (net assets of $91,983,847 / 12,053,969 shares of beneficial interest outstanding) | $7.63 |
See Notes to Financial Statements
9
Table of Contents
Financial Statements
Six months ended 12/31/15 (unaudited)
This statement describes how much your fund earned in investment income and accrued in expenses. It also describes any gains and/or losses generated by fund operations.
| Net investment income | ||||
Income | ||||
Dividends | $1,107,803 | |||
Dividends from underlying affiliated funds | 823 | |||
Foreign taxes withheld | (531 | ) | ||
Total investment income | $1,108,095 | |||
Expenses | ||||
Management fee | $253,698 | |||
Shareholder servicing costs | 3,521 | |||
Administrative services fee | 12,057 | |||
Independent Trustees’ compensation | 2,330 | |||
Custodian fee | 7,964 | |||
Shareholder communications | 3,246 | |||
Audit and tax fees | 24,334 | |||
Legal fees | 561 | |||
Miscellaneous | 15,443 | |||
Total expenses | $323,154 | |||
Reduction of expenses by investment adviser | (23,254 | ) | ||
Net expenses | $299,900 | |||
Net investment income | $808,195 | |||
| Realized and unrealized gain (loss) on investments | ||||
Realized gain (loss) on investments (identified cost basis) | $2,478,630 | |||
Change in unrealized appreciation (depreciation) on investments | $(4,957,252 | ) | ||
Net realized and unrealized gain (loss) on investments | $(2,478,622 | ) | ||
Change in net assets from operations | $(1,670,427 | ) | ||
See Notes to Financial Statements
10
Table of Contents
Financial Statements
STATEMENTS OF CHANGES IN NET ASSETS
These statements describe the increases and/or decreases in net assets resulting from operations, any distributions, and any shareholder transactions.
Six months ended (unaudited) | Year ended 6/30/15 | |||||||
| Change in net assets | ||||||||
| From operations | ||||||||
Net investment income | $808,195 | $2,693,153 | ||||||
Net realized gain (loss) on investments | 2,478,630 | 36,063,731 | ||||||
Net unrealized gain (loss) on investments | (4,957,252 | ) | (27,844,660 | ) | ||||
Change in net assets from operations | $(1,670,427 | ) | $10,912,224 | |||||
| Distributions declared to shareholders | ||||||||
From net investment income | $(1,870,052 | ) | $(4,245,037 | ) | ||||
From net realized gain on investments | (34,610,053 | ) | (7,546,156 | ) | ||||
Total distributions declared to shareholders | $(36,480,105 | ) | $(11,791,193 | ) | ||||
Change in net assets from fund share transactions | $37,028,665 | $(89,526,951 | ) | |||||
Total change in net assets | $(1,121,867 | ) | $(90,405,920 | ) | ||||
| Net assets | ||||||||
At beginning of period | 93,105,714 | 183,511,634 | ||||||
At end of period (including undistributed net investment income of $48,440 and $1,110,297, respectively) | $91,983,847 | $93,105,714 | ||||||
See Notes to Financial Statements
11
Table of Contents
Financial Statements
The financial highlights table is intended to help you understand the fund’s financial performance for the semiannual period and the past 5 fiscal years. Certain information reflects financial results for a single fund share. The total returns in the table represent the rate by which an investor would have earned (or lost) on an investment in the fund share class (assuming reinvestment of all distributions) held for the entire period.
Six months 12/31/15 | Years ended 6/30 | |||||||||||||||||||||||
| 2015 | 2014 | 2013 | 2012 | 2011 | ||||||||||||||||||||
| (unaudited) | ||||||||||||||||||||||||
Net asset value, beginning of period | $12.89 | $12.94 | $11.33 | $9.40 | $9.65 | $7.69 | ||||||||||||||||||
| Income (loss) from investment operations | ||||||||||||||||||||||||
Net investment income (d) | $0.11 | $0.25 | $0.29 | $0.21 | $0.19 | $0.16 | ||||||||||||||||||
Net realized and unrealized gain (loss) | (0.34 | ) | 0.56 | 2.14 | 2.13 | (0.03 | ) | 1.92 | ||||||||||||||||
Total from investment operations | $(0.23 | ) | $0.81 | $2.43 | $2.34 | $0.16 | $2.08 | |||||||||||||||||
| Less distributions declared to shareholders | ||||||||||||||||||||||||
From net investment income | $(0.26 | ) | $(0.31 | ) | $(0.22 | ) | $(0.21 | ) | $(0.19 | ) | $(0.12 | ) | ||||||||||||
From net realized gain on investments | (4.77 | ) | (0.55 | ) | (0.60 | ) | (0.20 | ) | (0.22 | ) | — | |||||||||||||
Total distributions declared to shareholders | $(5.03 | ) | �� | $(0.86 | ) | $(0.82 | ) | $(0.41 | ) | $(0.41 | ) | $(0.12 | ) | |||||||||||
Net asset value, end of period (x) | $7.63 | $12.89 | $12.94 | $11.33 | $9.40 | $9.65 | ||||||||||||||||||
Total return (%) (r)(s)(x) | (1.82 | )(n) | 6.63 | 22.15 | 25.60 | 2.14 | 27.12 | |||||||||||||||||
| Ratios (%) (to average net assets) and Supplemental data: | ||||||||||||||||||||||||
Expenses before expense reductions (f) | 0.70 | (a) | 0.66 | 0.64 | 0.65 | 0.67 | 0.67 | |||||||||||||||||
Expenses after expense reductions (f) | 0.65 | (a) | 0.65 | 0.64 | 0.65 | 0.65 | 0.65 | |||||||||||||||||
Net investment income | 1.75 | (a) | 1.90 | 2.35 | 2.04 | 2.13 | 1.75 | |||||||||||||||||
Portfolio turnover | 7 | (n) | 11 | 18 | 19 | 18 | 28 | |||||||||||||||||
Net assets at end of period (000 omitted) | $91,984 | $93,106 | $183,512 | $171,882 | $136,901 | $152,715 | ||||||||||||||||||
| (a) | Annualized. |
| (d) | Per share data is based on average shares outstanding. |
| (f) | Ratios do not reflect reductions from fees paid indirectly, if applicable. |
| (n) | Not annualized. |
| (r) | Certain expenses have been reduced without which performance would have been lower. |
| (s) | From time to time the fund may receive proceeds from litigation settlements, without which performance would be lower. |
| (x) | The net asset values and total returns have been calculated on net assets which include adjustments made in accordance with U.S. generally accepted accounting principles required at period end for financial reporting purposes. |
See Notes to Financial Statements
12
Table of Contents
(unaudited)
(1) Business and Organization
MFS Institutional Large Cap Value Fund (the fund) is a diversified series of MFS Institutional Trust (the trust). The trust is organized as a Massachusetts business trust and is registered under the Investment Company Act of 1940, as amended, as an open-end management investment company.
The fund is an investment company and accordingly follows the investment company accounting and reporting guidance of the Financial Accounting Standards Board (FASB) Accounting Standards Codification Topic 946 Financial Services – Investment Companies.
(2) Significant Accounting Policies
General – The preparation of financial statements in conformity with U.S. generally accepted accounting principles requires management to make estimates and assumptions that affect the reported amounts of assets and liabilities, and disclosure of contingent assets and liabilities at the date of the financial statements and the reported amounts of increases and decreases in net assets from operations during the reporting period. Actual results could differ from those estimates. In the preparation of these financial statements, management has evaluated subsequent events occurring after the date of the fund’s Statement of Assets and Liabilities through the date that the financial statements were issued.
In January 2016, FASB issued Accounting Standards Update 2016-01, Financial Instruments – Overall (Subtopic 825-10) – Recognition and Measurement of Financial Assets and Financial Liabilities (“ASU 2016-01”) which would first be effective for annual reporting periods beginning after December 15, 2017, and interim periods therein. ASU 2016-01, which changes the accounting for equity investments and for certain financial liabilities, also modifies the presentation and disclosure requirements for financial instruments. Investment companies are specifically exempted from ASU 2016-01’s equity investment accounting provisions and will continue to follow the industry specific guidance for investment accounting under ASC 946. Although still evaluating the potential impacts of ASU 2016-01 to the fund, management expects that the impact of the fund’s adoption will be limited to additional financial statement disclosures.
Balance Sheet Offsetting – The fund’s accounting policy with respect to balance sheet offsetting is that, absent an event of default by the counterparty or a termination of the agreement, the International Swaps and Derivatives Association (ISDA) Master Agreement does not result in an offset of reported amounts of financial assets and financial liabilities in the Statement of Assets and Liabilities across transactions between the fund and the applicable counterparty. The fund’s right to setoff may be restricted or prohibited by the bankruptcy or insolvency laws of the particular jurisdiction to which a specific master netting agreement counterparty is subject. Balance sheet offsetting disclosures, to the extent applicable to the fund, have been included in the fund’s Significant Accounting Policies note under the captions for each of the fund’s in-scope financial instruments and transactions.
13
Table of Contents
Notes to Financial Statements (unaudited) – continued
Investment Valuations – Equity securities, including restricted equity securities, are generally valued at the last sale or official closing price on their primary market or exchange as provided by a third-party pricing service. Equity securities, for which there were no sales reported that day, are generally valued at the last quoted daily bid quotation on their primary market or exchange as provided by a third-party pricing service. Short-term instruments with a maturity at issuance of 60 days or less may be valued at amortized cost, which approximates market value. Open-end investment companies are generally valued at net asset value per share. Securities and other assets generally valued on the basis of information from a third-party pricing service may also be valued at a broker/dealer bid quotation. Values obtained from third-party pricing services can utilize both transaction data and market information such as yield, quality, coupon rate, maturity, type of issue, trading characteristics, and other market data. The values of foreign securities and other assets and liabilities expressed in foreign currencies are converted to U.S. dollars using the mean of bid and asked prices for rates provided by a third-party pricing service.
The Board of Trustees has delegated primary responsibility for determining or causing to be determined the value of the fund’s investments (including any fair valuation) to the adviser pursuant to valuation policies and procedures approved by the Board. If the adviser determines that reliable market quotations are not readily available, investments are valued at fair value as determined in good faith by the adviser in accordance with such procedures under the oversight of the Board of Trustees. Under the fund’s valuation policies and procedures, market quotations are not considered to be readily available for most types of debt instruments and floating rate loans and many types of derivatives. These investments are generally valued at fair value based on information from third-party pricing services. In addition, investments may be valued at fair value if the adviser determines that an investment’s value has been materially affected by events occurring after the close of the exchange or market on which the investment is principally traded (such as foreign exchange or market) and prior to the determination of the fund’s net asset value, or after the halting of trading of a specific security where trading does not resume prior to the close of the exchange or market on which the security is principally traded. Events that occur on a frequent basis after foreign markets close (such as developments in foreign markets and significant movements in the U.S. markets) and prior to the determination of the fund’s net asset value may be deemed to have a material effect on the value of securities traded in foreign markets. Accordingly, the fund’s foreign equity securities may often be valued at fair value. The adviser generally relies on third-party pricing services or other information (such as the correlation with price movements of similar securities in the same or other markets; the type, cost and investment characteristics of the security; the business and financial condition of the issuer; and trading and other market data) to assist in determining whether to fair value and at what value to fair value an investment. The value of an investment for purposes of calculating the fund’s net asset value can differ depending on the source and method used to determine value. When fair valuation is used, the value of an investment used to determine the fund’s net asset value may differ from quoted or published prices for the same investment. There can be no assurance that the fund could obtain the fair value assigned to an investment if it were to sell the investment at the same time at which the fund determines its net asset value per share.
14
Table of Contents
Notes to Financial Statements (unaudited) – continued
Various inputs are used in determining the value of the fund’s assets or liabilities. These inputs are categorized into three broad levels. In certain cases, the inputs used to measure fair value may fall into different levels of the fair value hierarchy. In such cases, an investment’s level within the fair value hierarchy is based on the lowest level of input that is significant to the fair value measurement. The fund’s assessment of the significance of a particular input to the fair value measurement in its entirety requires judgment, and considers factors specific to the investment. Level 1 includes unadjusted quoted prices in active markets for identical assets or liabilities. Level 2 includes other significant observable market-based inputs (including quoted prices for similar securities, interest rates, prepayment speed, and credit risk). Level 3 includes unobservable inputs, which may include the adviser’s own assumptions in determining the fair value of investments. The following is a summary of the levels used as of December 31, 2015 in valuing the fund’s assets or liabilities:
| Investments at Value | Level 1 | Level 2 | Level 3 | Total | ||||||||||||
| Equity Securities | $90,724,642 | $— | $— | $90,724,642 | ||||||||||||
| Mutual Funds | 1,092,692 | — | — | 1,092,692 | ||||||||||||
| Total Investments | $91,817,334 | $— | $— | $91,817,334 | ||||||||||||
For further information regarding security characteristics, see the Portfolio of Investments.
Indemnifications – Under the fund’s organizational documents, its officers and Trustees may be indemnified against certain liabilities and expenses arising out of the performance of their duties to the fund. Additionally, in the normal course of business, the fund enters into agreements with service providers that may contain indemnification clauses. The fund’s maximum exposure under these agreements is unknown as this would involve future claims that may be made against the fund that have not yet occurred.
Investment Transactions and Income – Investment transactions are recorded on the trade date. Dividends received in cash are recorded on the ex-dividend date. Certain dividends from foreign securities will be recorded when the fund is informed of the dividend if such information is obtained subsequent to the ex-dividend date. Dividend payments received in additional securities are recorded on the ex-dividend date in an amount equal to the value of the security on such date.
The fund may receive proceeds from litigation settlements. Any proceeds received from litigation involving portfolio holdings are reflected in the Statement of Operations in realized gain/loss if the security has been disposed of by the fund or in unrealized gain/loss if the security is still held by the fund. Any other proceeds from litigation not related to portfolio holdings are reflected as other income in the Statement of Operations.
Fees Paid Indirectly – The fund’s custody fee may be reduced by a credit earned under an arrangement that measures the value of U.S. dollars deposited with the custodian by the fund. For the six months ended December 31, 2015, custody fees were not reduced.
Tax Matters and Distributions – The fund intends to qualify as a regulated investment company, as defined under Subchapter M of the Internal Revenue Code, and to distribute all of its taxable income, including realized capital gains. As a result,
15
Table of Contents
Notes to Financial Statements (unaudited) – continued
no provision for federal income tax is required. The fund’s federal tax returns, when filed, will remain subject to examination by the Internal Revenue Service for a three year period. Management has analyzed the fund’s tax positions taken on federal and state tax returns for all open tax years and does not believe that there are any uncertain tax positions that require recognition of a tax liability. Foreign taxes, if any, have been accrued by the fund in the accompanying financial statements in accordance with the applicable foreign tax law. Foreign income taxes may be withheld by certain countries in which the fund invests. Additionally, capital gains realized by the fund on securities issued in or by certain foreign countries may be subject to capital gains tax imposed by those countries.
Distributions to shareholders are recorded on the ex-dividend date. Income and capital gain distributions are determined in accordance with income tax regulations, which may differ from U.S. generally accepted accounting principles. Certain capital accounts in the financial statements are periodically adjusted for permanent differences in order to reflect their tax character. These adjustments have no impact on net assets or net asset value per share. Temporary differences which arise from recognizing certain items of income, expense, gain or loss in different periods for financial statement and tax purposes will reverse at some time in the future. Distributions in excess of net investment income or net realized gains are temporary overdistributions for financial statement purposes resulting from differences in the recognition or classification of income or distributions for financial statement and tax purposes.
Book/tax differences primarily relate to wash sale loss deferrals.
The tax character of distributions made during the current period will be determined at fiscal year end. The tax character of distributions declared to shareholders for the last fiscal year is as follows:
| 6/30/15 | ||||
| Ordinary income (including any short-term capital gains) | $4,424,155 | |||
| Long-term capital gains | 7,367,038 | |||
| Total distributions | $11,791,193 | |||
The federal tax cost and the tax basis components of distributable earnings were as follows:
| As of 12/31/15 | ||||
| Cost of investments | $60,484,549 | |||
| Gross appreciation | 32,227,255 | |||
| Gross depreciation | (894,470 | ) | ||
| Net unrealized appreciation (depreciation) | $31,332,785 | |||
| As of 6/30/15 | ||||
| Undistributed ordinary income | 1,681,593 | |||
| Undistributed long-term capital gain | 32,431,123 | |||
| Net unrealized appreciation (depreciation) | 36,290,037 | |||
The aggregate cost above includes prior fiscal year tax adjustments, if applicable.
16
Table of Contents
Notes to Financial Statements (unaudited) – continued
(3) Transactions with Affiliates
Investment Adviser – The fund has an investment advisory agreement with MFS to provide overall investment management and related administrative services and facilities to the fund. The management fee is computed daily and paid monthly at an annual rate of 0.55% of the fund’s average daily net assets. MFS has agreed in writing to reduce its management fee by a specified amount if certain MFS mutual fund assets exceed thresholds agreed to by MFS and the fund’s Board of Trustees. For the six months ended December 31, 2015, this management fee reduction amounted to $3,373, which is included in the reduction of total expenses in the Statement of Operations. The management fee incurred for the six months ended December 31, 2015 was equivalent to an annual effective rate of 0.54% of the fund’s average daily net assets.
The investment adviser has agreed in writing to pay a portion of the fund’s total annual operating expenses, excluding interest, taxes, extraordinary expenses, brokerage and transaction costs, and investment-related expenses, such that total fund operating expenses do not exceed 0.65% annually of the fund’s average daily net assets. This written agreement will continue until modified by the fund’s Board of Trustees, but such agreement will continue at least until October 31, 2016. For the six months ended December 31, 2015, this reduction amounted to $19,881, which is included in the reduction of total expenses in the Statement of Operations.
Shareholder Servicing Agent – MFS Service Center, Inc. (MFSC), a wholly-owned subsidiary of MFS, receives a fee from the fund, for its services as shareholder servicing agent. For the six months ended December 31, 2015, the fee was $3,370, which equated to 0.0073% annually of the fund’s average daily net assets. MFSC also receives payment from the fund for out-of-pocket expenses paid by MFSC on behalf of the fund. For the six months ended December 31, 2015, these costs amounted to $151.
Administrator – MFS provides certain financial, legal, shareholder communications, compliance, and other administrative services to the fund. Under an administrative services agreement, the fund reimburses MFS the costs incurred to provide these services. The fund is charged an annual fixed amount of $17,500 plus a fee based on average daily net assets. The administrative services fee incurred for the six months ended December 31, 2015 was equivalent to an annual effective rate of 0.0261% of the fund’s average daily net assets.
Trustees’ and Officers’ Compensation – The fund pays compensation to independent Trustees in the form of a retainer, attendance fees, and additional compensation to Board and Committee chairpersons. The fund does not pay compensation directly to Trustees or to officers of the fund who are also officers of the investment adviser, all of whom receive remuneration for their services to the fund from MFS. Certain officers and Trustees of the fund are officers or directors of MFS, MFS Fund Distributors, Inc. (MFD), and MFSC.
Other – This fund and certain other funds managed by MFS (the funds) have entered into a service agreement (the ISO Agreement) which provides for payment of fees solely by the funds to Tarantino LLC in return for the provision of services of an Independent Senior Officer (ISO) for the funds. Frank L. Tarantino serves as the ISO and
17
Table of Contents
Notes to Financial Statements (unaudited) – continued
is an officer of the funds and the sole member of Tarantino LLC. The funds can terminate the ISO Agreement with Tarantino LLC at any time under the terms of the ISO Agreement. For the six months ended December 31, 2015, the fee paid by the fund under this agreement was $107 and is included in “Miscellaneous” expense in the Statement of Operations. MFS has agreed to bear all expenses associated with office space, other administrative support, and supplies provided to the ISO.
The fund invests in the MFS Institutional Money Market Portfolio which is managed by MFS and seeks current income consistent with preservation of capital and liquidity. Income earned on this investment is included in “Dividends from underlying affiliated funds” in the Statement of Operations. This money market fund does not pay a management fee to MFS.
(4) Portfolio Securities
For the six months ended December 31, 2015, purchases and sales of investments, other than short-term obligations, aggregated $7,750,951 and $6,116,008, respectively.
(5) Shares of Beneficial Interest
The fund’s Declaration of Trust permits the Trustees to issue an unlimited number of full and fractional shares of beneficial interest. Transactions in fund shares were as follows:
| Six months ended 12/31/15 | Year ended 6/30/15 | |||||||||||||||
| Shares | Amount | Shares | Amount | |||||||||||||
| Shares sold | 56,026 | $625,000 | 1,054,163 | $13,335,287 | ||||||||||||
| Shares issued to shareholders in reinvestment of distributions | 4,781,090 | 36,479,714 | 536,297 | 6,580,367 | ||||||||||||
| Shares reacquired | (7,958 | ) | (76,049 | ) | (8,548,069 | ) | (109,442,605 | ) | ||||||||
| Net change | 4,829,158 | $37,028,665 | (6,957,609 | ) | $(89,526,951 | ) | ||||||||||
(6) Line of Credit
The fund and certain other funds managed by MFS participate in a $1.25 billion unsecured committed line of credit, subject to a $1 billion sublimit, provided by a syndication of banks under a credit agreement. Borrowings may be made for temporary financing needs. Interest is charged to each fund, based on its borrowings, generally at a rate equal to the higher of the Overnight Federal Reserve funds rate or daily one month LIBOR plus an agreed upon spread. A commitment fee, based on the average daily, unused portion of the committed line of credit, is allocated among the participating funds at the end of each calendar quarter. In addition, the fund and other funds managed by MFS have established unsecured uncommitted borrowing arrangements with certain banks for temporary financing needs. Interest is charged to each fund, based on its borrowings, at a rate equal to the Overnight Federal Reserve funds rate plus an agreed upon spread. For the six months ended December 31, 2015, the fund’s commitment fee and interest expense were $130 and $0, respectively, and are included in “Miscellaneous” expense in the Statement of Operations.
18
Table of Contents
Notes to Financial Statements (unaudited) – continued
(7) Transactions in Underlying Affiliated Funds – Affiliated Issuers
An affiliated issuer may be considered one in which the fund owns 5% or more of the outstanding voting securities, or a company which is under common control. For the purposes of this report, the fund assumes the following to be an affiliated issuer:
| Underlying Affiliated Fund | Beginning Shares/Par Amount | Acquisitions Shares/Par Amount | Dispositions Shares/Par Amount | Ending Shares/Par Amount | ||||||||||||
MFS Institutional Money Market Portfolio | 1,498,006 | 3,175,330 | (3,580,644 | ) | 1,092,692 | |||||||||||
| Underlying Affiliated Fund | Realized Gain (Loss) | Capital Gain Distributions | Dividend Income | Ending Value | ||||||||||||
MFS Institutional Money Market Portfolio | $— | $— | $823 | $1,092,692 | ||||||||||||
19
Table of Contents
BOARD REVIEW OF INVESTMENT ADVISORY AGREEMENT
The Investment Company Act of 1940 requires that both the full Board of Trustees and a majority of the non-interested (“independent”) Trustees, voting separately, annually approve the continuation of the Fund’s investment advisory agreement with MFS. The Trustees consider matters bearing on the Fund and its advisory arrangements at their meetings throughout the year, including a review of performance data at each regular meeting. In addition, the independent Trustees met several times over the course of three months beginning in May and ending in July, 2015 (“contract review meetings”) for the specific purpose of considering whether to approve the continuation of the investment advisory agreement for the Fund and the other investment companies that the Board oversees (the “MFS Funds”). The independent Trustees were assisted in their evaluation of the Fund’s investment advisory agreement by independent legal counsel, from whom they received separate legal advice and with whom they met separately from MFS during various contract review meetings. The independent Trustees were also assisted in this process by the MFS Funds’ Independent Senior Officer, a senior officer appointed by and reporting to the independent Trustees.
In connection with their deliberations regarding the continuation of the investment advisory agreement, the Trustees, including the independent Trustees, considered such information and factors as they believed, in light of the legal advice furnished to them and their own business judgment, to be relevant. The investment advisory agreement for the Fund was considered separately, although the Trustees also took into account the common interests of all MFS Funds in their review. As described below, the Trustees considered the nature, quality, and extent of the various investment advisory, administrative, and shareholder services performed by MFS under the existing investment advisory agreement and other arrangements with the Fund.
In connection with their contract review meetings, the Trustees received and relied upon materials that included, among other items: (i) information provided by Lipper Inc., an independent third party, on the investment performance of the Fund for various time periods ended December 31, 2014 and the investment performance of a group of funds with substantially similar investment classifications/objectives (the “Lipper performance universe”), (ii) information provided by Lipper Inc. on the Fund’s advisory fees and other expenses and the advisory fees and other expenses of comparable funds identified by Lipper Inc. (the “Lipper expense group”), (iii) information provided by MFS on the advisory fees of comparable portfolios of other clients of MFS, including institutional separate accounts and other clients, (iv) information as to whether and to what extent applicable expense waivers, reimbursements or fee “breakpoints” are observed for the Fund, (v) information regarding MFS’ financial results and financial condition, including MFS’ and certain of its affiliates’ estimated profitability from services performed for the Fund and the MFS Funds as a whole, and compared to MFS’ institutional business, (vi) MFS’ views regarding the outlook for the mutual fund industry and the strategic business plans of MFS, (vii) descriptions of various functions performed by MFS for the Funds, such as compliance monitoring and portfolio trading practices, and (viii) information regarding the overall organization of MFS, including information about MFS’ senior management and other personnel providing investment advisory, administrative and other services to
20
Table of Contents
Board Review of Investment Advisory Agreement – continued
the Fund and the other MFS Funds. The comparative performance, fee and expense information prepared and provided by Lipper Inc. was not independently verified and the independent Trustees did not independently verify any information provided to them by MFS.
The Trustees’ conclusion as to the continuation of the investment advisory agreement was based on a comprehensive consideration of all information provided to the Trustees and not the result of any single factor. Some of the factors that figured particularly in the Trustees’ deliberations are described below, although individual Trustees may have evaluated the information presented differently from one another, giving different weights to various factors. It is also important to recognize that the fee arrangements for the Fund and other MFS Funds are the result of years of review and discussion between the independent Trustees and MFS, that certain aspects of such arrangements may receive greater scrutiny in some years than in others, and that the Trustees’ conclusions may be based, in part, on their consideration of these same arrangements during the course of the year and in prior years.
Based on information provided by Lipper Inc. and MFS, the Trustees reviewed the Fund’s total return investment performance as well as the performance of peer groups of funds over various time periods. The Trustees placed particular emphasis on the Fund’s total return performance in comparison to the performance of funds in its Lipper performance universe over the three-year period ended December 31, 2014, which the Trustees believed was a long enough period to reflect differing market conditions. The total return performance of the Fund’s shares was in the 2nd quintile relative to the other funds in the universe for this three-year period (the 1st quintile being the best performers and the 5th quintile being the worst performers). The total return performance of the Fund’s shares was in the 4th quintile for the one-year period and the 3rd quintile for the five-year period ended December 31, 2014 relative to the Lipper performance universe. Because of the passage of time, these performance results may differ from the performance results for more recent periods, including those shown elsewhere in this report.
In the course of their deliberations, the Trustees took into account information provided by MFS in connection with the contract review meetings, as well as during investment review meetings conducted with portfolio management personnel during the course of the year, regarding the Fund’s performance. After reviewing these and related factors, the Trustees concluded, within the context of their overall conclusions regarding the investment advisory agreement, that they were satisfied with MFS’ responses and efforts relating to investment performance.
In assessing the reasonableness of the Fund’s advisory fee, the Trustees considered, among other information, the Fund’s advisory fee and the total expense ratio as a percentage of average daily net assets and the advisory fee and total expense ratios of peer groups of funds based on information provided by Lipper Inc. The Trustees considered that MFS currently observes an expense limitation for the Fund, which may not be changed without the Trustees’ approval. The Trustees also considered that, according to the Lipper data (which takes into account any fee reductions or expense limitations that were in effect during the Fund’s last fiscal year), the Fund’s effective advisory fee rate and total expense ratio were each lower than the Lipper expense group median.
21
Table of Contents
Board Review of Investment Advisory Agreement – continued
The Trustees also considered the advisory fees charged by MFS to any institutional separate accounts advised by MFS (“separate accounts”) and unaffiliated investment companies for which MFS serves as subadviser (“subadvised funds”) that have comparable investment strategies to the Fund. In comparing these fees, the Trustees considered information provided by MFS as to the generally broader scope of services provided by MFS to the Fund, as well as the more extensive regulatory burdens imposed on MFS in managing the Fund, in comparison to separate accounts and subadvised funds. The Trustees also considered the higher demands placed on MFS’ investment personnel and trading infrastructure as a result of the daily cash in-flows and out-flows of the Fund in comparison to separate accounts.
The Trustees also considered whether the Fund may benefit from any economies of scale in the management of the Fund in the event of growth in assets of the Fund and/or growth in assets of the MFS Funds as a whole. They noted that the Fund’s advisory fee rate schedule is not subject to any breakpoints. Taking into account the expense limitation noted above, the Trustees determined not to recommend any advisory fee breakpoints for the Fund at this time. The Trustees also noted that MFS has agreed in writing to waive a portion of the management fees of certain MFS Funds, including the Fund, if the total combined assets of certain funds within the MFS Funds’ complex increase above agreed upon thresholds (the “group fee waiver”), enabling the Fund’s shareholders to share in the benefits from any economies of scale at the complex level. The group fee waiver is reviewed and renewed annually between the Board and MFS. The Trustees concluded that the group fee waiver was sufficient to allow the Fund to benefit from economies of scale as its assets and overall complex assets grow.
The Trustees also considered information prepared by MFS relating to MFS’ costs and profits with respect to the Fund, the MFS Funds considered as a group, and other investment companies and accounts advised by MFS, as well as MFS’ methodologies used to determine and allocate its costs to the MFS Funds, the Fund and other accounts and products for purposes of estimating profitability.
After reviewing these and other factors described herein, the Trustees concluded, within the context of their overall conclusions regarding the investment advisory agreement, that the advisory fees charged to the Fund represent reasonable compensation in light of the services being provided by MFS to the Fund.
In addition, the Trustees considered MFS’ resources and related efforts to continue to retain, attract and motivate capable personnel to serve the Fund. The Trustees also considered current and developing conditions in the financial services industry, including the presence of large and well-capitalized companies which are spending, and appear to be prepared to continue to spend, substantial sums to engage personnel and to provide services to competing investment companies. In this regard, the Trustees also considered the financial resources of MFS and its ultimate parent, Sun Life Financial Inc. The Trustees also considered the advantages and possible disadvantages to the Fund of having an adviser that also serves other investment companies as well as other accounts.
The Trustees also considered the nature, quality, cost, and extent of administrative, transfer agency, and distribution services provided to the Fund by MFS and its affiliates
22
Table of Contents
Board Review of Investment Advisory Agreement – continued
under agreements and plans other than the investment advisory agreement. The Trustees also considered the nature, extent and quality of certain other services MFS performs or arranges for on the Fund’s behalf, which may include securities lending programs, directed expense payment programs, class action recovery programs, and MFS’ interaction with third-party service providers, principally custodians and sub-custodians. The Trustees concluded that the various non-advisory services provided by MFS and its affiliates on behalf of the Fund were satisfactory.
The Trustees also considered benefits to MFS from the use of the Fund’s portfolio brokerage commissions, if applicable, to pay for investment research and various other factors. Additionally, the Trustees considered so-called “fall-out benefits” to MFS such as reputational value derived from serving as investment manager to the Fund.
Based on their evaluation of factors that they deemed to be material, including those factors described above, the Board of Trustees, including the independent Trustees, concluded that the Fund’s investment advisory agreement with MFS should be continued for an additional one-year period, commencing August 1, 2015.
23
Table of Contents
PROXY VOTING POLICIES AND INFORMATION
MFS votes proxies on behalf of the fund pursuant to proxy voting policies and procedures that are available without charge, upon request, by calling 1-800-225-2606, by visiting the Proxy Voting section of mfs.com or by visiting the SEC’s Web site at http://www.sec.gov.
Information regarding how the fund voted proxies relating to portfolio securities during the most recent twelve-month period ended June 30 is available without charge by visiting the Proxy Voting section of mfs.com or by visiting the SEC’s Web site at http://www.sec.gov.
QUARTERLY PORTFOLIO DISCLOSURE
The fund will file a complete schedule of portfolio holdings with the Securities and Exchange Commission (the Commission) for the first and third quarters of each fiscal year on Form N-Q. A shareholder can obtain the quarterly portfolio holdings report at mfs.com. The fund’s Form N-Q is also available on the EDGAR database on the Commission’s Internet Web site at http://www.sec.gov, and may be reviewed and copied at the:
Public Reference Room
Securities and Exchange Commission
100 F Street, NE, Room 1580
Washington, D.C. 20549
Information on the operation of the Public Reference Room may be obtained by calling the Commission at 1-800-SEC-0330. Copies of the fund’s Form N-Q also may be obtained, upon payment of a duplicating fee, by electronic request at the following e-mail address: publicinfo@sec.gov or by writing the Public Reference Section at the above address.
From time to time, MFS may post important information about the fund or the MFS funds on the MFS web site (mfs.com). This information is available by clicking on the “Institutions & Consultants” role, then choosing the United States, and then either viewing the “Commentary & Announcements” section or clicking on “Research & Commentary” or the fund’s name under “US Institutional Trust” in the “US Institutional Trust & Reports” section.
24
Table of Contents
WEBSITE
mfs.com
CALL
1-800-637-2262
WRITE
MFS Investment Management®
111 Huntington Avenue
Boston, MA 02199-7618
Table of Contents
| ITEM 2. | CODE OF ETHICS. |
During the period covered by this report, the Registrant has not amended any provision in its Code of Ethics (the “Code”) that relates to any element of the Code’s definition enumerated in paragraph (b) of Item 2 of this Form N-CSR. During the period covered by this report, the Registrant did not grant a waiver, including an implicit waiver, from any provision of the Code.
| ITEM 3. | AUDIT COMMITTEE FINANCIAL EXPERT. |
Not applicable for semi-annual reports.
| ITEM 4. | PRINCIPAL ACCOUNTANT FEES AND SERVICES. |
Not applicable for semi-annual reports.
| ITEM 5. | AUDIT COMMITTEE OF LISTED REGISTRANTS. |
Not applicable to the Registrant.
| ITEM 6. | INVESTMENTS |
A schedule of investments for each series of the Registrant is included as part of the report to shareholders of such series under Item 1 of this Form N-CSR.
| ITEM 7. | DISCLOSURE OF PROXY VOTING POLICIES AND PROCEDURES FOR CLOSED-END MANAGEMENT INVESTMENT COMPANIES. |
Not applicable to the Registrant.
| ITEM 8. | PORTFOLIO MANAGERS OF CLOSED-END MANAGEMENT INVESTMENT COMPANIES. |
Not applicable to the Registrant.
| ITEM 9. | PURCHASES OF EQUITY SECURITIES BY CLOSED-END MANAGEMENT INVESTMENT COMPANY AND AFFILIATED PURCHASERS. |
Not applicable to the Registrant.
| ITEM 10. | SUBMISSION OF MATTERS TO A VOTE OF SECURITY HOLDERS. |
There were no material changes to the procedures by which shareholders may send recommendations to the Board for nominees to the Registrant’s Board since the Registrant last provided disclosure as to such procedures in response to the requirements of Item 407 (c)(2)(iv) of Regulation S-K or this Item.
Table of Contents
| ITEM 11. | CONTROLS AND PROCEDURES. |
| (a) | Based upon their evaluation of the effectiveness of the registrant’s disclosure controls and procedures (as defined in Rule 30a-3(c) under the Investment Company Act of 1940 (the “Act”)) as conducted within 90 days of the filing date of this report on Form N-CSR, the registrant’s principal financial officer and principal executive officer have concluded that those disclosure controls and procedures provide reasonable assurance that the material information required to be disclosed by the registrant on this report is recorded, processed, summarized and reported within the time periods specified in the Securities and Exchange Commission’s rules and forms. |
| (b) | There were no changes in the registrant’s internal controls over financial reporting (as defined in Rule 30a-3(d) under the Act) that occurred during the second fiscal quarter of the period covered by the report that have materially affected, or are reasonably likely to materially affect, the registrant’s internal control over financial reporting. |
| ITEM 12. | EXHIBITS. |
| (a) | File the exhibits listed below as part of this form. Letter or number the exhibits in the sequence indicated. |
| (1) | Any code of ethics, or amendment thereto, that is the subject of the disclosure required by Item 2, to the extent that the registrant intends to satisfy the Item 2 requirements through filing of an exhibit. |
| (2) | A separate certification for each principal executive officer and principal financial officer of the registrant as required by Rule 30a-2(a) under the Act (17 CFR 270.30a-2): Attached hereto. |
| (b) | If the report is filed under Section 13(a) or 15(d) of the Exchange Act, provide the certifications required by Rule 30a-2(b) under the Act (17 CFR 270.30a-2(b)), Rule 13a-14(b) or Rule 15d-14(b) under the Exchange Act (17 CFR 240.13a-14(b) or 240.15d-14(b)) and Section 1350 of Chapter 63 of Title 18 of the United States Code (18 U.S.C. 1350) as an exhibit. A certification furnished pursuant to this paragraph will not be deemed “filed” for the purposes of Section 18 of the Exchange Act (15 U.S.C. 78r), or otherwise subject to the liability of that section. Such certification will not be deemed to be incorporated by reference into any filing under the Securities Act of 1933 or the Exchange Act, except to the extent that the registrant specifically incorporates it by reference: Attached hereto. |
Table of Contents
Notice
A copy of the Amended and Restated Declaration of Trust, as amended, of the Registrant is on file with the Secretary of State of The Commonwealth of Massachusetts and notice is hereby given that this instrument is executed on behalf of the Registrant by an officer of the Registrant as an officer and not individually and the obligations of or arising out of this instrument are not binding upon any of the Trustees or shareholders individually, but are binding only upon the assets and property of the respective constituent series of the Registrant.
Table of Contents
SIGNATURES
Pursuant to the requirements of the Securities Exchange Act of 1934 and the Investment Company Act of 1940, the registrant has duly caused this report to be signed on its behalf by the undersigned, thereunto duly authorized.
(Registrant) MFS INSTITUTIONAL TRUST
| By (Signature and Title)* | ROBIN A. STELMACH | |
| Robin A. Stelmach, President |
Date: February 16, 2016
Pursuant to the requirements of the Securities Exchange Act of 1934 and the Investment Company Act of 1940, this report has been signed below by the following persons on behalf of the registrant and in the capacities and on the dates indicated.
| By (Signature and Title)* | ROBIN A. STELMACH | |
| Robin A. Stelmach, President (Principal Executive Officer) |
Date: February 16, 2016
| By (Signature and Title)* | DAVID L. DILORENZO | |
| David L. DiLorenzo, Treasurer (Principal Financial Officer and Accounting Officer) |
Date: February 16, 2016
| * | Print name and title of each signing officer under his or her signature. |