Exhibit (a)(5)

March 10, 2005
Everflow Eastern Partners, L.P.
585 West Main Street
Canfield, OH 44406
ATTENTION: Mr. William A. Siskovic
Gentlemen:
SUBJECT: SUMMARY REPORT
Evaluation of Oil and Gas Reserves
To the Interests of Everflow Eastern Partners, L.P.
In Certain Appalachian Basin Properties
Pursuant to the Requirements of the
Securities and Exchange Commission
Effective December 31, 2004
Job 04.815
Wright & Company, Inc. has performed an evaluation to estimate proved reserves and cash flow from certain oil and gas properties to the subject interests. This evaluation was authorized by Mr. William A. Siskovic of Everflow Eastern Partners, L.P. (Everflow). Projections of the reserves and cash flow to the evaluated interests were based on economic parameters and operating conditions considered to be applicable as of December 31, 2004, and are pursuant to the financial reporting requirements of the Securities and Exchange Commission (SEC). The following is a summary of the results of the evaluation effective December 31, 2004:
| | | | | | | | | | | | |
| | | Proved | | | Proved | | | | |
| | | Developed | | | Developed | | | | |
| | | Producing | | | Nonproducing | | | Total | |
| | | (PDP) | | | (PDNP) | | | Proved | |
| |
Net Reserves to the Evaluated Interests Oil, Mbbl: | | | 742.730 | | | | 39.004 | | | | 781.734 | |
Gas, Mmcf: | | | 46,573.446 | | | | 2,776.808 | | | | 49,350.254 | |
Cash Flow (BTAX), M$ Undiscounted: | | | 233,497.571 | | | | 14,308.208 | | | | 247,805.779 | |
Discounted at 10% Per Annum: | | | 114,847.912 | | | | 8,616.804 | | | | 123,464.716 | |
| | | |
| 52OO Maryland Way • Suite 100 | | 18 Augusta Pines Drive • Suite 151W, No.1 |
| Brentwood, Tennessee 37027 | | Spring, Texas 77389 |
| (615) 370-0753 Fax (615) 370-0756 | | (832) 381-1220 Fax (832) 381-1225 |
mail@wrightandcompany.com
Mr. William A. Siskovic
Everflow Eastern Partners, L.P.
March 10, 2005
Page 2
The attached Definitions of Oil and Gas Reserves describe all categories of reserves, and the Discussion describes the bases of this evaluation.
It has been a pleasure to serve you by preparing this evaluation. All related data will be retained in our files and are available for your review.
| | | |
| | Yours very truly, |
| | | |
| |  |
| | Wright & Company, Inc. |
CONTENTS
DEFINITIONS OF RESERVES
DISCUSSION
| | | | | |
| | | PAGE | |
| INTRODUCTION | | | 1 | |
| DATA SOURCES | | | 3 | |
| METHODS OF RESERVES DETERMINATION | | | 3 | |
| OIL PRICING | | | 4 | |
| GAS PRICING | | | 4 | |
| PRICING STATEMENT | | | 5 | |
| OPERATING EXPENSES | | | 5 | |
| SEVERANCE AND AD VALOREM TAXES | | | 5 | |
| SALVAGE AND PROPERTY ABANDONMENT | | | 6 | |
| ENVIRONMENTAL CONSIDERATIONS | | | 6 | |
| AREAS OF SIGNIFICANT INTERESTS | | | 6 | |
| Introduction | | | 6 | |
| Proved Developed Reserves | | | 6 | |
| LOCATION OF EVALUATED INTERESTS | | | 7 | |
| Map — Appalachian Basin Properties | | | | |
| CHARTS | | | 7 | |
| Net Oil Reserves (Mbbl) — by Reserves Category | | | | |
| Net Gas Reserves (Mmcf) — by Reserves Category | | | | |
| 10.00 PCT Cum. Disc. (BTAX) — by Reserves Category | | | | |
| | | | | |
SUMMARIES | | | | |
| Total Proved Developed (PDP and PDNP) | | | | |
| Proved Developed Producing (PDP) | | | | |
| Proved Developed Nonproducing (PDNP) | | | | |
| | | | | |
LIST OF PROPERTIES | | | | |

DEFINITIONS OF OIL AND GAS RESERVES1
PURSUANT TO THE REQUIREMENTS OF THE
SECURITIES EXCHANGE ACT
I. PROVED OIL AND GAS RESERVES
Proved oil and gas reserves are the estimated quantities of crude oil, natural gas, and natural gas liquids which geological and engineering data demonstrate with reasonable certainty to be recoverable in future years from known reservoirs under existing economic and operating conditions, i.e., prices and costs as of the date the estimate is made. Prices include consideration of changes in existing prices provided only by contractual arrangements, but not on escalations based upon future conditions.
| | A. | Reservoirs are considered proved if economic producibility is supported by either actual production or conclusive formation test. The area of a reservoir considered proved includes: |
| | 1. | that portion delineated by drilling and defined by gas-oil and/or oil-water contacts, if any; and |
| |
| | 2. | the immediately adjoining portions not yet drilled, but which can be reasonably judged as economically productive on the basis of available geological and engineering data. In the absence of information on fluid contacts, the lowest known structural occurrence of hydrocarbons controls the lower proved limit of the reservoir. |
| | B. | Reserves which can be produced economically through application of improved recovery techniques (such as fluid injection) are included in the “proved” classification when successful testing by a pilot project, or the operation of an installed program in the reservoir, provides support for the engineering analysis on which the project or program was based. |
| | C. | Estimates of proved reserves do not include the following: |
| | 1. | oil that may become available from known reservoirs but is classified separately as “indicated additional reserves”; |
| |
| | 2. | crude oil, natural gas, and natural gas liquids, the recovery of which is subject to reasonable doubt because of uncertainty as to geology, reservoir characteristics, or economic factors: |
| |
| | 3. | crude oil, natural gas, and natural gas liquids, that may occur in undrilled prospects; nor those quantities being held in underground or surface storage. |
| |
| | 4. | crude oil, natural gas, and natural gas liquids, that may be recovered from oil shales, coal and other such sources. |
II. PROVED DEVELOPED OIL AND GAS RESERVES*
Proved developed oil and gas reserves are reserves that can be expected to be recovered through existing wells with existing equipment and operating methods. Additional oil and gas expected to be obtained through the application of fluid injection or other improved recovery techniques for supplementing the natural forces and mechanisms of primary recovery should be included as “proved developed reserves” only after testing by a pilot project or after the operation of an installed program has confirmed through production response that increased recovery will be achieved.
III. PROVED UNDEVELOPED OIL AND GAS RESERVES
Proved undeveloped oil and gas reserves are reserves that are expected to be recovered from new wells on undrilled acreage, or from existing wells where a relatively major expenditure is required for recompletion. Reserves on undrilled acreage shall be limited to those drilling units offsetting productive units that are reasonably certain of production when drilled. Proved reserves for other undrilled units can be claimed only where it can be demonstrated with certainty that there is continuity of production from the existing productive formation. Under no circumstances should estimates for proved undeveloped reserves be attributable to any acreage for which an application of fluid injection or other improved recovery technique is contemplated, unless such techniques have been proved effective by actual tests in the area and in the same reservoir.
1SEC Accounting Rules, Commerce Clearing House, Inc. October 1981, Paragraph 290, Regulation 210.4-10, p. 329
2Wright & Company, Inc. may separate proved developed reserves into proved developed producing and proved developed nonproducing reserves. This is to identify proved developed producing reserves as those to be recovered from actively producing wells. Proved developed nonproducing reserves are those to be recovered from wells or intervals within wells, which are completed but shut-in waiting on equipment or pipeline connections, or wells where a relatively minor expenditure is required for recompletion to another zone.

DISCUSSION
INTRODUCTION
Wright & Company, Inc. (Wright) has performed an evaluation to estimate proved developed reserves and cash flow from certain oil and gas properties to the interests of Everflow Eastern Partners, L.P. (Everflow). This evaluation was authorized by Mr. William A. Siskovic of Everflow. The results of the evaluation are summarized in the cover letter and are presented in detail in the summary tables.
The individual projections of lease reserves and economics were generated using certain data that describe the production forecasts and all associated evaluation parameters such as interests, severance and ad valorem taxes, product prices, operating expenses, investments, salvage values, and abandonment costs, as applicable. These data reports are not presented individually, but are a part of Wright’s work product and are retained in our files. This report is aSUMMARY REPORTas requested by Everflow.
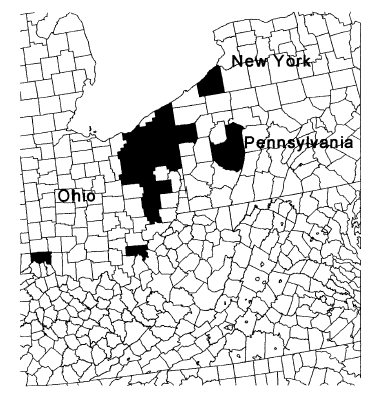
The properties evaluated in this report are located in the states of New York, Ohio and Pennsylvania. A list of properties evaluated can be found in the appropriate Summaries section of this report. A map showing the states and counties in which the properties are located can be found at the end of the Location of Evaluated Interests section of this Discussion.
Projections of the reserves and cash flow to the evaluated interests were based on economic parameters and operating conditions considered to be applicable as of December 31, 2004, and are pursuant to the financial reporting requirements of the United States Securities and Exchange Commission (SEC).
Net income to the evaluated interests is the cash flow after consideration of royalty revenue payable to others, standard state and county taxes, operating expenses, investments, salvage values, and abandonment costs, as applicable. The cash flow is before federal income tax (BTAX) and excludes consideration of any encumbrances against the properties if such exist.
The Cash Flow (BTAX) values presented in the Summaries section of this report and summarized in the cover letter were based on projections of annual oil and gas production. It was assumed there would be no significant delay between the date of oil and gas production and the receipt of the associated revenue for this production.
Unless specifically identified and documented by Everflow as having curtailment problems, gas production trends have been assumed to be a function of well

productivity and not of market conditions. The effect of “take or pay” clauses in any gas contracts, if there are such clauses, was not considered for this evaluation.
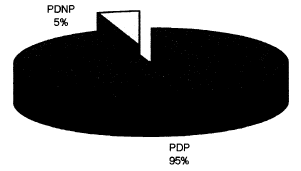
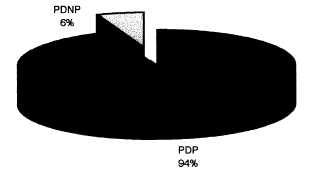
Oil and gas reserves were evaluated for the proved developed producing (PDP) and proved developed nonproducing (PDNP) categories. The summary classification of total proved developed reserves combines the PDP and PDNP categories. For the PDP category, reserves were based primarily on decline curve analysis projections where sufficient production history was available. For reserves assigned to the PDNP category, the production start dates for wells drilled during 2004 that were not producing at the effective date were estimated by Everflow and were used according to their instructions. In preparing this evaluation, no attempt has been made to quantify the element of uncertainty associated with any reserves category. Reserves were assigned to each category as warranted. The attached Definitions of Oil and Gas Reserves describe all categories of proved reserves. The charts found at the end of this Discussion indicate the percent allocation of total proved developed net oil and gas by reserves category.
Oil reserves are expressed in thousands of United States (U.S.) barrels (Mbbl) of 42 U.S. gallons. Gas volumes are expressed in millions of standard cubic feet (Mmcf) at 60 degrees Fahrenheit and at the legal pressure base that prevails in the state in which the reserves are located. No adjustment of the individual gas volumes to a common pressure base has been made.
No investigation was made of potential gas volume and/or value imbalances which may have resulted from over/under delivery to the evaluated interests. Therefore, the estimates of reserves and Cash Flow (BTAX) do not include adjustments for the settlement of any such imbalances.
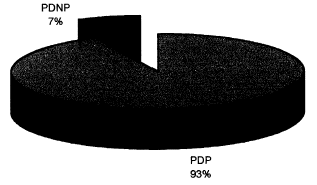
The Cash Flow (BTAX) was discounted at an annual rate of 10.00 percent (10.00 PCT) as requested by Everflow and in accordance with the reporting requirements of the SEC. Future cash flow was also discounted at several secondary rates as indicated on each reserves and economics page. These additional discounted amounts are displayed as totals only. The cash flow was discounted at the midpoint of the period, compounded annually. It should be noted that no opinion is expressed by Wright as to the fair market value of the evaluated properties. The charts found at the end of this Discussion indicate the percent allocation of the 10.00 PCT cumulative discount (Cum. Disc.) Cash Flow by reserves category.
This report includes only those costs and revenues which were provided by Everflow that are directly attributable to individual leases and areas. There could exist other revenues, overhead costs, or other costs associated with Everflow which are not included in this report. Such additional costs and revenues are outside the scope of

- 2 -
this report. This report is not a financial statement for Everflow and should not be used as the sole basis for any transaction concerning Everflow or the evaluated properties.
Wright is an independent consulting firm and does not own any interests in the oil and gas properties covered by this report. No employee, officer, or director of Wright is an employee, officer, or director of Everflow. Neither the employment of nor the compensation received by Wright is contingent upon the values assigned to the properties covered by this report.
DATA SOURCES
All data utilized in the preparation of this report with respect to ownership interests, oil and gas prices, gas contract terms, operating expenses, investments, salvage values, abandonment costs, well information, and current operating conditions, as applicable, were provided by Everflow. Data obtained after the effective date of the report, but prior to the completion of the report, were used only if such data were applied consistently. If such data were used, the reserves category assignments reflect the status of the wells as of the effective date. Production data provided by Everflow were utilized. All data have been reviewed for reasonableness and, unless obvious errors were detected, have been accepted as correct. It should be emphasized that revisions to the projections of reserves and economics included in this report may be required if the provided data are revised for any reason. No inspection of the properties was made, as this was not considered to be within the scope of this evaluation.
METHODS OF RESERVES DETERMINATION
The estimates of reserves contained in this report were determined by accepted industry methods and in accordance with the attached Definitions of Oil and Gas Reserves. Methods utilized in this report include extrapolation of historical production trends and analogy to similar producing properties.
Where sufficient production history and other data were available, reserves for producing properties were determined by extrapolation of historical production and sales trends. Analogy to similar producing properties was used for those properties which lacked sufficient production history and other data to yield a definitive estimate of reserves. Subsequent production performance trends may cause the need for revisions to the estimates of reserves. Reserves projections based on analogy are subject to change due to subsequent changes in the analogous properties or subsequent production from the evaluated properties. On newer producing properties with limited production history, field chart readings may have been utilized to establish the estimated performance trends.

- 3 -
When observing the historical production on some of the wells, it can be seen that various gas purchase contracts have different restrictions and adjustments. The contracts may provide that certain wells can be shut-in for a period of time and limits the obligation of the gas purchaser to purchase gas. These production restrictions result in frequent fluctuations in production. Wright did not attempt to project the continuation of these fluctuations on a monthly basis, but instead based the initial production rates and estimated produced volumes on an average annual production schedule. Therefore, the actual production at the effective date may be more or less than the initial rate estimated by Wright.
There are significant uncertainties inherent in estimating reserves, future rates of production, and the timing and amount of future costs. Oil and gas reserves estimates must be recognized as a subjective process that cannot be measured in an exact way and estimates of others might differ materially from those of Wright. The accuracy of any reserves estimate is a function of the quality of available data and of subjective interpretations and judgments. It should be emphasized that production data subsequent to the date of these estimates or changes in the analogous properties may warrant revisions of such estimates. Accordingly, reserves estimates are often different from the quantities of oil and gas that ultimately are recovered.
OIL PRICING
For this evaluation, Everflow provided Wright an oil price of $39.75 per barrel. According to Everflow, this was the Ergon Oil purchasing price posted for December 31, 2004, for New York, Ohio, and Pennsylvania. It should be noted that the Ergon oil price is $3.71 less than the NYMEX posted price of $43.46 per barrel for West Texas Intermediate (WTI). After the effective date, the price was held constant for the life of the properties. No attempt has been made to account for oil price fluctuations that have occurred in the market subsequent to the effective date of this report.
GAS PRICING
All effective date gas prices and calculations were provided by Everflow and were used in accordance with their instructions. According to Everflow, the average price for natural gas, based on existing contracts in place, is $5.83 per Mcf through 2005. Also, according to Everflow certain contracts with various purchasers provide for pricing at the closing NYMEX price, plus a basis adjustment for area. The December 31, 2004, NYMEX spot market price of $6.18 per Mmbtu, adjusted for basis, was used for 2006 and beyond in accordance with the instructions of Everflow. Fixed prices according to contracts were used until the contract expired, then reverted to the applicable NYMEX price. Hedged prices were not considered. For wells subject to life

- 4 -
of lease contracts, the contract price was used as the effective date price. Charges and fees represented by Everflow as actual costs for transportation, compression, and dehydration specific to each well were deducted from the gas price where applicable. All gas purchase contracts were interpreted by Everflow. Wright did not review any contracts.
All gas prices were applied to projected sales volumes. No attempt has been made to account for gas price fluctuations that have occurred in the market subsequent to the effective date of this report. After the effective date, gas prices were held constant for the life of the properties except where adjusted by contract.
PRICING STATEMENT
It should be emphasized that with the current economic uncertainties, fluctuations in market conditions could significantly change the economics in this report.
OPERATING EXPENSES
Operating expenses were provided by Everflow and were used in accordance with their instructions. These expenses were based upon actual costs from December 2003 through November 2004, and included, but were not limited to, all direct operating expenses, field level overhead costs and any ad valorem taxes not deducted separately. Expenses for workovers, well stimulations, and other maintenance were not included in the operating expenses unless such work was expected on a recurring basis. Judgments for the exclusion of the nonrecurring expenses were made by Everflow. Any internal indirect overhead costs (general and administrative) which are not billable to the working interest owners were not included. For new and developing properties where data were unavailable, operating expenses were estimated by Everflow based on analogy with similar properties. After the effective date, the operating expenses were held constant for the life of the properties.
SEVERANCE AND AD VALOREM TAXES
Standard state severance have been deducted as appropriate. All taxes were based on current published rates and were used in accordance with the instructions of Everflow. Ad valorem taxes, if applicable, were assumed to be included in the operating expenses.

- 5 -
SALVAGE AND PROPERTY ABANDONMENT
In accordance with the instructions of Everflow, neither salvage values nor abandonment costs were included in the projections of reserves and economics. It was assumed that any salvage value would be directly offset by the cost to abandon the property. Wright has not performed a detailed study of the abandonment costs nor the salvage values and offers no opinion as to Everflow’s assumption.
ENVIRONMENTAL CONSIDERATIONS
No consideration was given in this report to potential environmental liabilities which may exist concerning the properties evaluated. There are no costs included in this evaluation for potential liability for restoration and to clean up damages, if any, caused by past or future operating practices.
AREAS OF SIGNIFICANT INTERESTS
Introduction
Everflow’s operations are focused in the Appalachian Basin, specifically in eastern Ohio and western Pennsylvania. Historically, Everflow has focused its activities on the Clinton Sandstone formation. Production in this formation occurs at depths ranging from 3,500 to 6,000 feet. These reserves are found in relatively tight reservoirs and “typically” follow a hyperbolic decline with a flattening steady decline in subsequent years.
Proved Developed Reserves
At the request of Everflow, Wright evaluated approximately 1,165 proved developed properties. These developed properties are situated in approximately 22 counties in the Appalachian Basin and are shown on a map in the Location of Evaluated Interests section at the end of this Discussion. According to Everflow, they operate most of the wells in which they own working interests.
The majority of the value of the properties evaluated in this report are found in Ohio and are assigned to the PDP reserves category. The PDP 10.00 PCT Cum. Disc. (BTAX) of 114,847.912 M$ represents approximately 93 percent of the Total Proved 10.00 PCT Cum. Disc. (BTAX) of 123,464.716 M$. Most of the PDP wells have production histories of five to ten years or longer. There are 70 wells assigned to the PDNP reserves category that have a 10.00 PCT Cum. Disc. (BTAX) of 8,616.804 M$,

- 6 -
or approximately seven percent of the Total Proved 10.00 PCT Cum. Disc. (BTAX) value.
LOCATION OF EVALUATED INTERESTS
The following map depicts the states and counties in which the evaluated properties are located.
CHARTS
The following charts depict the relative percentages of net oil and gas reserves and the allocation of 10.00 PCT Cum. Disc. (BTAX) Cash Flow by reserves category.

- 7 -
Location of Evaluated Interests
EVERFLOW EASTERN PARTNERS, L.P.
Appalachian Basin Properties
Job 04.815

| | | |
| State | | Counties |
| New York | | Chautauqua |
| | | |
| Ohio | | Ashtabula, Columbiana, Cuyahoga, Geauga, Guernsey, Hamilton, Harrison, Holmes, Mahoning, Medina, Meigs, Noble, Portage, Stark, Summit, Trumbull, Tuscarawas, Wayne |
| | | |
| Pennsylvania | | Armstrong, Indiana, Jefferson, Mercer |

EVERFLOW EASTERN PARTNERS, L.P.
Total Proved
Certain Properties Located in Various States
Job 04.815
Net Oil Reserves (Mbbl)
By Reserves Category

Net Gas Reserves (Mmcf)
By Reserves Category

10.00 PCT Cum. Disc. (BTAX), M$
By Reserves Category


