UNITED STATES
SECURITIES AND EXCHANGE COMMISSION
Washington, D.C. 20549
FORM N-CSR
CERTIFIED SHAREHOLDER REPORT OF REGISTERED
MANAGEMENT INVESTMENT COMPANIES
Investment Company Act file number 811-6178
Nuveen New York Investment Quality Municipal Fund, Inc.
(Exact name of registrant as specified in charter)
Nuveen Investments
333 West Wacker Drive
Chicago, IL 60606
(Address of principal executive offices) (Zip code)
Kevin J. McCarthy
Nuveen Investments
333 West Wacker Drive
Chicago, IL 60606
(Name and address of agent for service)
Registrant's telephone number, including area code: (312) 917-7700
Date of fiscal year end: September 30
Date of reporting period: March 31, 2011
Form N-CSR is to be used by management investment companies to file reports with the Commission not later than 10 days after the transmission to stockholders of any report that is required to be transmitted to stockholders under Rule 30e-1 under the Investment Company Act of 1940 (17 CFR 270.30e-1). The Commission may use the information provided on Form N-CSR in its regulatory, disclosure review, inspection, and policymaking roles.
A registrant is required to disclose the information specified by Form N-CSR, and the Commission will make this information public. A registrant is not required to respond to the collection of information contained in Form N-CSR unless the Form displays a currently valid Office of Management and Budget ("OMB") control number. Please direct comments concerning the accuracy of the information collection burden estimate and any suggestions for reducing the burden to Secretary, Securities and Exchange Commission, 450 Fifth Street, NW, Washington, DC 20549-0609. The OMB has reviewed this collection of information under the clearance requirements of 44 U.S.C. ss. 3507.
ITEM 1. REPORTS TO STOCKHOLDERS.
INVESTMENT ADVISER NAME CHANGE
Effective January 1, 2011, Nuveen Asset Management, the Funds’ investment adviser, changed its name to Nuveen Fund Advisors, Inc. (“Nuveen Fund Advisors”). Concurrently, Nuveen Fund Advisors formed a wholly-owned subsidiary, Nuveen Asset Management, LLC, to house its portfolio management capabilities.
NUVEEN INVESTMENTS COMPLETES STRATEGIC COMBINATION WITH FAF ADVISORS
On December 31, 2010, Nuveen Investments completed the strategic combination between Nuveen Asset Management, LLC, the largest investment affiliate of Nuveen Investments, and FAF Advisors. As part of this transaction, U.S. Bancorp – the parent of FAF Advisors – received cash consideration and a 9.5% stake in Nuveen Investments in exchange for the long term investment business of FAF Advisors, including investment management responsibilities for the non-money market mutual funds of the First American Funds family.
The approximately $27 billion of mutual fund and institutional assets managed by FAF Advisors, along with the investment professionals managing these assets and other key personnel, have become part of Nuveen Asset Management, LLC. With these additions to Nuveen Asset Management, LLC, this affiliate now manages more than $100 billion of assets across a broad range of strategies from municipal and taxable fixed income to traditional and specialized equity investments.
This combination does not affect the investment objectives or strategies of the Funds in this report. Over time, Nuveen Investments expects that the combination will provide even more ways to meet the needs of investors who work with financial advisors and consultants by enhancing the multi-boutique model of Nuveen Investments, which also includes highly respected investment teams at HydePark, NWQ Investment Management, Santa Barbara Asset Management, Symphony Asset Management, Tradewinds Global Investors and Winslow Capital. Nuveen Investments managed approximately $206 billion of assets as of March 31, 2011.
Table of Contents
| | | |
| Chairman’s Letter to Shareholders | | 4 |
| Portfolio Manager’s Comments | | 5 |
| Common Share Dividend and Share Price Information | | 12 |
| Performance Overviews | | 14 |
| Portfolios of Investments | | 20 |
| Statement of Assets and Liabilities | | 57 |
| Statement of Operations | | 59 |
| Statement of Changes in Net Assets | | 60 |
| Statement of Cash Flows | | 62 |
| Financial Highlights | | 64 |
| Notes to Financial Statements | | 70 |
| Board Approval of Sub-Advisory Arrangements | | 83 |
| Reinvest Automatically, Easily and Conveniently | | 84 |
| Glossary of Terms Used in this Report | | 86 |
| Other Useful Information | | 91 |
Chairman’s
Letter to Shareholders
Dear Shareholders,
In 2010, the global economy recorded another year of recovery from the financial and economic crises of 2008, but many of the factors that caused the downturn still weigh on the prospects for continued improvement. In the U.S., ongoing weakness in housing values has put pressure on homeowners and mortgage lenders. Similarly, the strong earnings recovery for corporations and banks is only slowly being translated into increased hiring or more active lending. Globally, deleveraging by private and public borrowers has inhibited economic growth and that process is far from complete.
Encouragingly, constructive actions are being taken by governments around the world to deal with economic issues. In the U.S., the recent passage of a stimulatory tax bill relieved some of the pressure on the Federal Reserve to promote economic expansion through quantitative easing and offers the promise of sustained economic growth. A number of European governments are undertaking programs that could significantly reduce their budget deficits. Governments across the emerging markets are implementing various steps to deal with global capital flows without undermining international trade and investment.
The success of these government actions could determine whether 2011 brings further economic recovery and financial market progress. One risk associated with the extraordinary efforts to strengthen U.S. economic growth is that the debt of the U.S. government will continue to grow to unprecedented levels. Another risk is that over time there could be inflationary pressures on asset values in the U.S. and abroad, because what happens in the U.S. impacts the rest of the world economy. Also, these various actions are being taken in a setting of heightened global economic uncertainty, primarily about the supplies of energy and other critical commodities. In this challenging environment, your Nuveen investment team continues to seek sustainable investment opportunities and to remain alert to potential risks in a recovery still facing many headwinds. On your behalf, we monitor their activities to assure they maintain their investment disciplines.
As you will note elsewhere in this report, on December 31, 2010, Nuveen Investments completed a strategic combination with FAF Advisors, Inc., the manager of the First American Funds. The combination adds highly respected and distinct investment teams to meet the needs of investors and their advisors and is designed to benefit all fund shareholders by creating a fund organization with the potential for further economies of scale and the ability to draw from even greater talent and expertise to meet those investor needs.
As of the end of April, 2011, Nuveen Investments had completed the refinancing of all of the Auction Rate Preferred Securities issued by its taxable closed-end funds and 89% of the MuniPreferred shares issued by its tax-exempt closed-end funds. Please consult the Nuveen Investments web site, www.Nuveen.com, for the current status of this important refinancing program.
As always, I encourage you to contact your financial consultant if you have any questions about your investment in a Nuveen Fund. On behalf of the other members of your Fund Board, we look forward to continuing to earn your trust in the months and years ahead.
Sincerely,
Robert P. Bremner
Chairman of the Board
May 19, 2011
Portfolio Manager’s Comments
Nuveen New York Investment Quality Municipal Fund, Inc. (NQN)
Nuveen New York Select Quality Municipal Fund, Inc. (NVN)
Nuveen New York Quality Income Municipal Fund, Inc. (NUN)
Nuveen Insured New York Premium Income Municipal Fund, Inc. (NNF)
Nuveen Insured New York Dividend Advantage Municipal Fund (NKO)
Nuveen Insured New York Tax-Free Advantage Municipal Fund (NRK)
Portfolio manager Scott Romans discusses key investment strategies and the six-month performance of the Funds. Scott, who joined Nuveen in 2000, assumed portfolio management responsibility for the New York Funds in January 2011 from Cathryn Steeves, who managed these six Funds from 2006 to December 2010.
What key strategies were used to manage the New York Funds during the six-month reporting period ended March 31, 2011?
After rallying through most of 2010, municipal bond prices generally declined during this six-month period, impacted by investor concerns about inflation, the federal deficit, and the deficits impact on demand for U.S. Treasuries. Adding to this situation was media coverage of the strained finances of many state and local governments. As a result, money began to flow out of municipal funds, yields rose and valuations declined. Toward the end of this period, we saw the environment in the municipal market improve, as crossover buyers were attracted by municipal bond prices and tax-exempt yields, resulting in decreased outflows, declining yields and rising valuations.
The municipal bond market also was affected by a significant decline in new tax-exempt issuance during this period. One reason for this decrease was the heavy issuance of taxable municipal debt under the Build America Bond (BAB) program, which was created as part of the American Recovery and Reinvestment Act of February 2009 and which expired December 31, 2010. During the fourth quarter of 2010, taxable Build America Bonds issuance nationwide totaled $44.1 billion, accounting for 33% of new bonds in the municipal market. This program also meaningfully impacted the availability of tax-exempt bonds in New York, which ranked second (after California) in terms of dollar amount of BABs issued during this period. For the three months ended December 31, 2010, taxable Build America Bond issuance in New York totaled $5.7 billion, representing approximately 37% of new bonds issued in the municipal marketplace. Since interest payments from Build America Bonds represent taxable income, we did not view these bonds as good investment opportunities for these Funds. Further compounding the supply situation was the decline in new municipal issuance during the first three months of 2011, when issuance in New York declined 16% from that of the same period in 2010.
In addition, because of the continued severe decline in the issuance of AAA rated insured bonds, this was an especially difficult period for Funds with an insured mandate, such as
Certain statements in this report are forward-looking statements. Discussions of specific investments are for illustration only and are not intended as recommendations of individual investments. The forward-looking statements and other views expressed herein are those of the portfolio manager as of the date of this report. Actual future results or occurrences may differ significantly from those anticipated in any forward-looking statements and the views expressed herein are subject to change at any time, due to numerous market and other factors. The Funds disclaim any obligation to update publicly or revise any forward-looking statements or views expressed herein.
Any reference to credit ratings for portfolio holdings denotes the highest rating assigned by a Nationally Recognized Statistical Rating Organization (NRSRO) such as Standard & Poor’s (S&P), Moody’s or Fitch. AAA, AA, A and BBB ratings are investment grade; BB, B, CCC, CC, C and D ratings are below investment grade. Holdings and ratings may change over time.
these six New York Funds. Over the six-month period, new insured issuance accounted for only about 6% of national issuance, down approximately 30% from the levels of a year earlier. Even though these Funds may now invest up to 20% of their net assets in uninsured investment-grade credits rated BBB- or higher, the combination of constrained tax-exempt supply and little insured issuance meant that the insured Funds were, for the most part, less active than their non-insured counterparts during this period.
In this environment, we continued to seek individual credits with the potential to perform well over the long term. Overall, the Funds focused on purchasing higher-grade issues. To find bonds that fit our investment parameters, we took an opportunistic approach, monitoring the Funds’ cash levels and watching for attractive deals in both the primary and secondary markets.
Cash for new purchases during this period was generated primarily by the proceeds from bond calls and maturing bonds, which we worked to redeploy to keep the Funds as fully invested as possible. The Funds also sold a few holdings during this period, but overall, selling was very minimal because of the difficulty in finding adequate replacement securities.
As of March 31, 2011, all six Funds continued to use inverse floating rate securities. We employ inverse floaters as a form of leverage for a variety of reasons, including duration management, income enhancement and total return enhancement.
How did the Funds perform?
Individual results for the Nuveen New York Funds, as well as relevant index and peer group information, are presented in the accompanying table.
Average Annual Total Returns on Common Share Net Asset Value*
For periods ended 3/31/11
| Fund | 6-Month | 1-Year | 5-Year | 10-Year |
| NQN | -5.68% | 1.43% | 4.03% | 5.42% |
| NVN | -6.56% | 0.39% | 3.80% | 5.39% |
| NUN | -5.91% | 0.81% | 3.83% | 5.24% |
| NNF | -5.51% | 1.36% | 3.89% | 5.14% |
| NKO | -4.45% | 1.57% | 4.04% | N/A |
| NRK | -5.83% | -0.47% | 4.10% | N/A |
| | | | | |
Standard & Poor’s (S&P) New York Municipal Bond Index1 | -3.53% | 1.47% | 4.10% | 4.72% |
Standard & Poor’s (S&P) Insured National Municipal Bond Index2 | -4.61% | 0.90% | 3.67% | 4.62% |
Lipper Single-State Insured Municipal Debt Funds Average3 | -7.64% | -0.69% | 3.40% | 4.85% |
For the six months ended March 31, 2011, the cumulative returns on common share net asset value (NAV) for these New York Funds underperformed the return for the Standard & Poor’s (S&P) New York Municipal Bond Index. NKO exceeded the return for the Standard & Poor’s (S&P) Insured National Municipal Bond Index, while the remaining five Funds lagged this measure. All six of the New York Funds outperformed the average return for the Lipper Single-State Insured Municipal Debt Funds Average.
Key management factors that influenced the Funds’ returns during this period included duration and yield curve positioning, credit exposure, and sector allocation. The use of financial leverage also factored into the Funds’ performance. Leverage is discussed in more detail below.
| * | Six-month returns are cumulative; all other returns are annualized. |
| | |
| | Past performance is not predictive of future results. Current performance may be higher or lower than the data shown. Returns do not reflect the deduction of taxes that shareholders may have to pay on Fund distributions or upon the sale of Fund shares. |
| | |
| | For additional information, see the individual Performance Overview for your Fund in this report. |
| | |
| 1 | The Standard & Poor’s (S&P) New York Municipal Bond Index is an unleveraged, market value-weighted index designed to measure the performance of the tax-exempt, investment-grade New York municipal bond market. This index does not reflect any initial or ongoing expenses and is not available for direct investment. |
| | |
| 2 | The Standard & Poor’s (S&P) Insured National Municipal Bond Index is a national unleveraged, market value-weighted index designed to measure the performance of the tax-exempt insured U.S. municipal bond market. This index does not reflect any initial or ongoing expenses and is not available for direct investment. |
| | |
| 3 | The Lipper Single-State Insured Municipal Debt Funds Average is calculated using the returns of all leveraged and unleveraged closed-end funds in this category for each period as follows: 6-month, funds, 1-year, 44 funds; 5-year, 44 funds; and 10-year, 24 funds. The performance of the Lipper Single-State Insured Municipal Debt Funds Average represents the overall average of returns for funds from eight different states with a wide variety of municipal market conditions. Lipper returns account for the effects of management fees and assume reinvestment of dividends, but do not reflect any applicable sales charges. The Lipper average is not available for direct investment. |
During this period, municipal bonds with shorter maturities generally outperformed other maturity categories, with credits at the longest end of the yield curve posting the weakest returns. Among these six Funds, NKO was the most advantageously positioned in terms of duration and yield curve positioning, with more exposure to the outperforming shorter part of the curve. Duration and yield curve positioning also was a modestly positive contributor to the performance of NQN, NUN, NNF and NRK. NVN, on the other hand, had the longest duration among these six Funds, and its greater exposure to the underperforming long end of the curve detracted from its performance.
Credit exposure also played an important role in performance. During the market reversal of late 2010, as the redemption activity in high-yield funds increased, lower-rated credits were negatively impacted. For the period as a whole, bonds rated BBB typically underperformed those rated AAA. Overall, the credit exposure of these Funds had a positive to neutral impact on their performance.
Holdings that generally helped the Funds’ returns included resource recovery bonds, housing credits, and general obligation and other tax-supported bonds. The health care sector of the New York market also was a modest outperformer. In general, these Funds tended to be overweighted in housing and health care bonds, which enhanced their returns. In addition, pre-refunded bonds, which are typically backed by U.S. Treasury securities, were among the stronger performers during this period, primarily due to their shorter effective maturities and higher credit quality.
In contrast, the industrial development revenue (IDR), transportation, and “other revenue” sectors turned in relatively weaker performance and zero coupon bonds were among the poorest performers. The insured segment as a whole also failed to keep pace with the general municipal market return for the six months. These Funds were generally underweighted in transportation and “other revenue,” which lessened the negative impact of these sectors.
IMPACT OF THE FUNDS’ LEVERAGE STRATEGIES ON PERFORMANCE
One important factor impacting the returns of most of these Funds relative to the comparative indexes was the Funds’ use of structural leverage. The Funds use leverage because their managers believe that, over time, leveraging provides opportunities for additional income and total return for common shareholders. However, use of leverage also can expose common shareholders to additional volatility. For example, as the prices of securities held by a Fund decline, the negative impact of these valuation changes on common share net asset value and common shareholder total return is magnified by the use of leverage. This is what happened in these Funds during this period, and the use of structural leverage hurt their overall performance.
RECENT DEVELOPMENTS REGARDING THE FUNDS’ REDEMPTION OF AUCTION RATE PREFERRED SHARES
Shortly after their respective inception, each of the Funds issued auction rate preferred shares (ARPS) to create structural leverage. As noted in past shareholder reports, the ARPS issued by many closed-end funds, including these Funds, have been hampered by a lack of liquidity since February 2008. Since that time, more ARPS have been submitted for sale in each of their regularly scheduled auctions than there have been offers to buy. In fact, offers to buy have been almost completely nonexistent since late February 2008. This means that these auctions have “failed to clear,” and that many, or all, of the ARPS shareholders who wanted to sell their shares in these auctions were unable to do so. This lack of liquidity in ARPS did not lower the credit quality of these shares, and ARPS shareholders unable to sell their shares continued to receive distributions at the “maximum rate” applicable to failed auctions, as calculated in accordance with the pre-established terms of the ARPS. In the recent market, with short term rates at multi-generational lows, those maximum rates also have been low.
One continuing implication for common shareholders from the auction failures is that each Fund’s cost of leverage likely has been incrementally higher at times than it otherwise might have been had the auctions continued to be successful. As a result, each Fund’s common share earnings likely have been incrementally lower at times than they otherwise might have been.
As noted in past shareholder reports, the Nuveen funds’ Board of Directors/Trustees authorized several methods that can be used separately or in combination to refinance a portion of the Nuveen funds’ outstanding ARPS. Some funds have utilized tender option bonds (TOBs), also known as inverse floating rate securities, for leverage purposes. The amount of TOBs that a fund may use varies according to the composition of each fund’s portfolio. Some funds have a greater ability to use TOBs than others. Some funds have issued Variable Rate Demand Preferred (VRDP) Shares as well as Variable MuniFund Term Preferred (VMTP) Shares, which are a floating rate form of preferred stock with a mandatory term redemption. Some funds have issued MuniFund Term Preferred (MTP) Shares, a fixed rate form of preferred stock with a mandatory redemption period of three to five years.
While all these efforts have reduced the total amount of outstanding ARPS issued by the Nuveen funds, the funds cannot provide any assurance on when the remaining outstanding ARPS might be redeemed.
During 2010 and 2011, certain Nuveen leveraged closed-end funds (including NVN and NUN) received a demand letter from a law firm on behalf of purported holders of common shares of each such fund, alleging that Nuveen and the funds’ officers and
Board of Directors/Trustees breached their fiduciary duties related to the redemption at par of the funds’ ARPS. In response, the Board established an ad hoc Demand Committee consisting of certain of its disinterested and independent Board members to investigate the claims. The Demand Committee retained independent counsel to assist it in conducting an extensive investigation. Based upon its investigation, the Demand Committee found that it was not in the best interests of each fund or its shareholders to take the actions suggested in the demand letters, and recommended that the full Board reject the demands made in the demand letters. After reviewing the findings and recommendation of the Demand Committee, the full Board of each fund unanimously adopted the Demand Committee’s recommendation.
Subsequently, the funds that received demand letters (including NUN) were named in a consolidated complaint as nominal defendants in a putative shareholder derivative action captioned Martin Safier, et al. v. Nuveen Asset Management, et al. that was filed in the Circuit Court of Cook County, Illinois, Chancery Division (the “Cook County Chancery Court”) on February 18, 2011 (the “Complaint”). The Complaint, filed on behalf of purported holders of each fund’s common shares, also name Nuveen Fund Advisors, Inc. as a defendant, together with current and former Officers and interested Director/Trustees of each of the funds (together with the nominal defendants, collectively, the “Defendants”). The Complaint contains the same basic allegations contained in the demand letters. The suits seek a declaration that the Defendants have breached their fiduciary duties, an order directing the Defendants not to redeem any ARPS at their liquidation value using fund assets, indeterminate monetary damages in favor of the funds and an award of plaintiffs’ costs and disbursements in pursuing the action. Nuveen Fund Advisors, Inc. believes that the Complaint is without merit, and is defending vigorously against these charges.
As of March 31, 2011, the amount of ARPS redeemed by the Funds is shown in the accompanying table.
| Fund | | ARPS Redeemed | | % of Original ARPS |
| NQN | | $ | 144,000,000 | | | 100.0 | % |
| NVN | | $ | 193,000,000 | | | 100.0 | % |
| NUN | | $ | 197,000,000 | | | 100.0 | % |
| NNF | | $ | 14,650,000 | | | 22.5 | % |
| NKO | | $ | 61,000,000 | | | 100.0 | % |
| NRK | | $ | 27,000,000 | | | 100.0 | % |
MTP
As noted in previous shareholder reports, as of March 31, 2011, the following Fund has issued and outstanding MTP Shares, at liquidation value, as shown in the accompanying table.
| | MTP Shares |
| Fund | at Liquidation Value |
| NRK | 27,680,000 |
VRDP
As noted in previous shareholder reports, as of March 31, 2011, the following Fund has issued and outstanding VRDP Shares, at liquidation value, as shown in the accompanying table.
| | VRDP Shares |
| Fund | at Liquidation Value |
| NQN | 112,300,000 |
| NVN | 164,800,000 |
| NKO | 50,000,000 |
During the current reporting period, NUN issued $161.7 million of VRDP to redeem at par its remaining outstanding ARPS. As noted previously, VRDP is a newly-developed instrument that essentially replaces all or a portion of the ARPS used as leverage and potentially could be used to refinance all or a portion of the ARPS of other funds. VRDP shares include a liquidity feature that allows holders of VRDP to have their shares purchased by a liquidity provider in the event that sell orders have not been matched with purchase orders and successfully settled in a remarketing. VRDP is offered only to qualified institutional buyers, defined pursuant to Rule 144A under the Securities Act of 1933.
(Refer to Notes to Financial Statements, Footnote 1 – General Information and Significant Accounting Policies and Footnote 4 – Fund Shares for further details on MTP and VRDP Shares.)
At the time this report was prepared, all 84 of the Nuveen closed-end municipal funds that had issued ARPS have redeemed at par all or a portion of these shares. These redemptions bring the total amount of Nuveen’s municipal closed-end funds’ ARPS redemptions to approximately $8.8 billion of the approximately $11.0 billion originally outstanding.
For up-to-date information, please visit the Nuveen CEF Auction Rate Preferred Resource Center at: http://www.nuveen.com/arps.
Regulatory Matter
During May 2011, Nuveen Securities, LLC (Nuveen) entered into a settlement with the Financial Industry Regulatory Authority (FINRA) with respect to certain allegations regarding Nuveen-sponsored closed-end fund Auction Rate Preferred Securities (ARPS) marketing brochures. As part of this settlement, Nuveen neither admitted to nor denied FINRA’s allegations. Nuveen is the broker-dealer subsidiary of Nuveen Investments, Inc.
The settlement with FINRA concludes an investigation that followed the widespread failure of auctions for ARPS and other auction rate securities, which generally began in mid-February 2008. In the settlement, FINRA alleged that certain marketing materials provided by Nuveen were false and misleading. Nuveen agreed to a censure and the payment of a $3 million fine.
Common Share Dividend
and Share Price Information
The dividends of NQN, NVN, NUN, NNF, NKO and NRK remained stable throughout the six-month period ended March 31, 2011.
Due to normal portfolio activity, common shareholders of the following Funds received capital gains distributions in December 2010 as follows:
| | | Long-Term Capital Gains | |
| Fund | | (per share) | |
| NQN | | $ | 0.0507 | |
| NVN | | $ | 0.0292 | |
| NUN | | $ | 0.0044 | |
All of the Funds in this report seek to pay stable dividends at rates that reflect each Fund’s past results and projected future performance. During certain periods, each Fund may pay dividends at a rate that may be more or less than the amount of net investment income actually earned by the Fund during the period. If a Fund has cumulatively earned more than it has paid in dividends, it holds the excess in reserve as undistributed net investment income (UNII) as part of the Fund’s NAV. Conversely, if a Fund has cumulatively paid dividends in excess of its earnings, the excess constitutes negative UNII that is likewise reflected in the Fund’s NAV. Each Fund will, over time, pay all of its net investment income as dividends to shareholders. As of March 31, 2011, all of the Funds in this report had positive UNII balances, based upon our best estimate, for both tax and financial reporting purposes.
COMMON SHARE REPURCHASES AND SHARE PRICE INFORMATION
As of March 31, 2011, and since the inception of the Funds’ repurchase program, the Funds have cumulatively repurchased and retired their common shares as shown in the accompanying table.
| | | |
| Fund | Common Shares Repurchased and Retired | % of Outstanding Common Shares |
| NQN | 105,600 | 0.6% |
| NVN | 118,000 | 0.5% |
| NUN | 159,800 | 0.7% |
| NNF | 85,700 | 1.0% |
| NKO | 27,000 | 0.3% |
| NRK | 6,800 | 0.2% |
During the six-month reporting period, the Funds did not repurchase any of their outstanding common shares.
As of March 31, 2011 and during the six-month reporting period, the Funds’ share prices were trading at (-) discounts to their NAVs as shown in the accompanying table.
| | 3/31/11 | Six-Month Average |
| Fund | (-)Discount | (-)Discount |
| NQN | (-)7.11% | (-)6.49% |
| NVN | (-)5.38% | (-)5.46% |
| NUN | (-)5.36% | (-)4.90% |
| NNF | (-)4.21% | (-)5.96% |
| NKO | (-)5.51% | (-)6.97% |
| NRK | (-)6.95% | (-)6.57% |
| NQN | | Nuveen New York |
| Performance | | Investment Quality |
| OVERVIEW | | Municipal Fund, Inc. |
| Fund Snapshot | | | | |
| Common Share Price | | $ | 13.19 | |
| Common Share Net Asset Value (NAV) | | $ | 14.20 | |
| Premium/(Discount) to NAV | | | -7.11 | % |
| Market Yield | | | 6.10 | % |
Taxable-Equivalent Yield3 | | | 9.09 | % |
| Net Assets Applicable to Common Shares ($000) | | $ | 248,829 | |
| Average Annual Total Return | | | | | | | |
| (Inception 11/20/90) | | | | | |
| | | On Share Price | | On NAV | |
| 6-Month (Cumulative) | | | -8.69 | % | | -5.68 | % |
| 1-Year | | | -1.27 | % | | 1.43 | % |
| 5-Year | | | 3.84 | % | | 4.03 | % |
| 10-Year | | | 5.53 | % | | 5.42 | % |
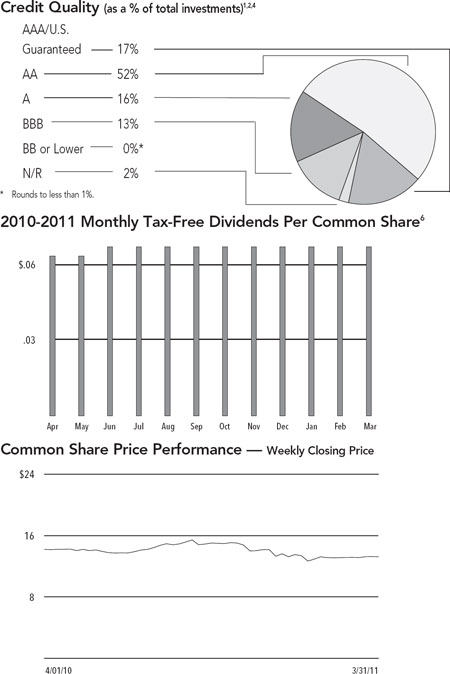
Portfolio Composition4 | | | | |
| (as a % of total investments) | | | | |
| Tax Obligation/Limited | | | 37.4 | % |
| Education and Civic Organizations | | | 15.8 | % |
| Health Care | | | 12.7 | % |
| Transportation | | | 8.3 | % |
| Tax Obligation/General | | | 7.8 | % |
| Utilities | | | 6.6 | % |
| Water and Sewer | | | 5.8 | % |
| Other | | | 5.6 | % |
Insurers4 | | | | |
| (as a % of total Insured investments) | | | | |
NPFG5 | | | 29.5 | % |
| AMBAC | | | 26.0 | % |
| FGIC | | | 18.2 | % |
| AGM | | | 18.2 | % |
| Other | | | 8.1 | % |
| | Refer to the Glossary of Terms Used in this Report for further definition of the terms used within this Fund’s Performance Overview page. |
| 1 | The Fund intends to invest at least 80% of its managed assets in municipal securities that are covered by insurance guaranteeing the timely payment of principal and interest. See Notes to Financial Statements, Footnote 1 – General Information and Significant Accounting Policies, Insurance for more information. At the end of the reporting period, 90% of the Fund’s total investments are invested in Insured securities. |
| 2 | Ratings shown are the highest of Standard & Poor’s Group, Moody’s Investor Service, Inc. or Fitch, Inc. AAA includes bonds with an implied AAA rating since they are backed by U.S. Government or agency securities. AAA, AA, A and BBB ratings are investment grade; BB, B, CCC, CC, C and D ratings are below-investment grade. Holdings designated N/R are not rated by any of these national rating agencies. |
| 3 | Taxable-Equivalent Yield represents the yield that must be earned on a fully taxable investment in order to equal the yield of the Fund on an after-tax basis. It is based on a combined federal and state income tax rate of 32.9%. When comparing this Fund to investments that generate qualified dividend income, the Taxable-Equivalent Yield is lower. |
| 4 | Holdings are subject to change. |
| 5 | MBIA’s public finance subsidiary. |
| 6 | The Fund paid shareholders a capital gains distribution in December 2010 of $0.0507 per share. |
| NVN | | Nuveen New York |
| Performance | | Select Quality |
| OVERVIEW | | Municipal Fund, Inc. |
as of March 31, 2011
| Fund Snapshot | | | | |
| Common Share Price | | $ | 13.54 | |
| Common Share Net Asset Value (NAV) | | $ | 14.31 | |
| Premium/(Discount) to NAV | | | -5.38 | % |
| Market Yield | | | 6.20 | % |
Taxable-Equivalent Yield3 | | | 9.24 | % |
| Net Assets Applicable to Common Shares ($000) | | $ | 331,896 | |
| Average Annual Total Return | | | | | |
| (Inception 5/22/91) | | | | | |
| | | On Share Price | | On NAV | |
| 6-Month (Cumulative) | | | -9.20 | % | | -6.56 | % |
| 1-Year | | | 3.27 | % | | 0.39 | % |
| 5-Year | | | 3.91 | % | | 3.80 | % |
| 10-Year | | | 5.53 | % | | 5.39 | % |
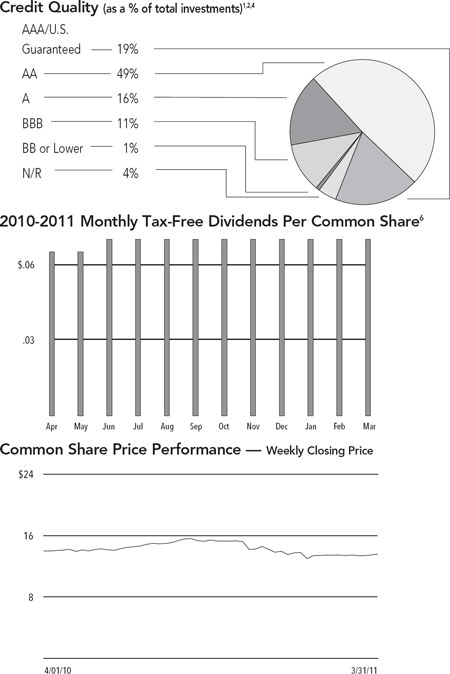
Portfolio Composition4 | | | | |
| (as a % of total investments) | | | | |
| Tax Obligation/Limited | | | 35.0 | % |
| Education and Civic Organizations | | | 15.3 | % |
| Health Care | | | 10.5 | % |
| Utilities | | | 8.6 | % |
| U.S. Guaranteed | | | 8.1 | % |
| Transportation | | | 7.0 | % |
| Water and Sewer | | | 6.3 | % |
| Tax Obligation/General | | | 5.4 | % |
| Other | | | 3.8 | % |
Insurers4 | | | |
| (as a % of total Insured investments) | | | |
NPFG5 | | 30.5 | % |
| AMBAC | | 26.7 | % |
| FGIC | | 18.7 | % |
| AGM | | 18.5 | % |
| Other | | 5.6 | % |
| | Refer to the Glossary of Terms Used in this Report for further definition of the terms used within this Fund’s Performance Overview page. |
| 1 | The Fund intends to invest at least 80% of its managed assets in municipal securities that are covered by insurance guaranteeing the timely payment of principal and interest. See Notes to Financial Statements, Footnote 1 – General Information and Significant Accounting Policies, Insurance for more information. At the end of the reporting period, 89% of the Fund’s total investments are invested in Insured securities. |
| 2 | Ratings shown are the highest of Standard & Poor’s Group, Moody’s Investor Service, Inc. or Fitch, Inc. AAA includes bonds with an implied AAA rating since they are backed by U.S. Government or agency securities. AAA, AA, A and BBB ratings are investment grade; BB, B, CCC, CC, C and D ratings are below-investment grade. Holdings designated N/R are not rated by any of these national rating agencies. |
| 3 | Taxable-Equivalent Yield represents the yield that must be earned on a fully taxable investment in order to equal the yield of the Fund on an after-tax basis. It is based on a combined federal and state income tax rate of 32.9%. When comparing this Fund to investments that generate qualified dividend income, the Taxable-Equivalent Yield is lower. |
| 4 | Holdings are subject to change. |
| 5 | MBIA’s public finance subsidiary. |
| 6 | The Fund paid shareholders a capital gains distribution in December 2010 of $0.0292 per share. |
| NUN | | Nuveen New York |
| Performance | | Quality Income |
| OVERVIEW | | Municipal Fund, Inc. |
| Fund Snapshot | | | | |
| Common Share Price | | $ | 13.42 | |
| Common Share Net Asset Value (NAV) | | $ | 14.18 | |
| Premium/(Discount) to NAV | | | -5.36 | % |
| Market Yield | | | 6.17 | % |
Taxable-Equivalent Yield3 | | | 9.20 | % |
| Net Assets Applicable to Common Shares ($000) | | $ | 336,770 | |
| Average Annual Total Return | | | | | |
| (Inception 11/20/91) | | | | | |
| | | On Share Price | | On NAV | |
| 6-Month (Cumulative) | | | -8.41 | % | | -5.91 | % |
| 1-Year | | | 2.86 | % | | 0.81 | % |
| 5-Year | | | 3.76 | % | | 3.83 | % |
| 10-Year | | | 5.26 | % | | 5.24 | % |
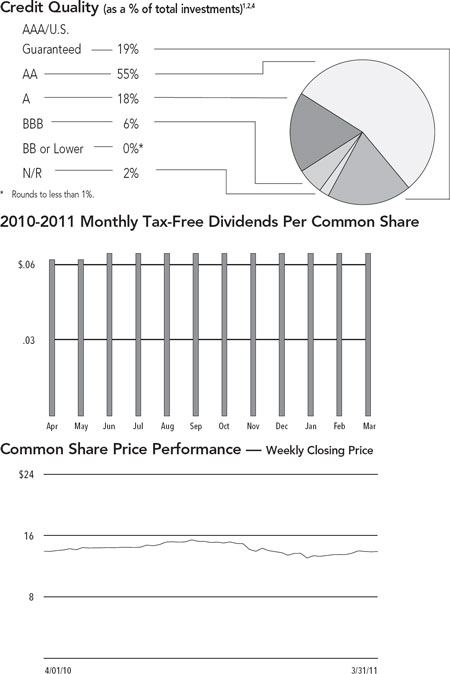
Portfolio Composition4 | | | | |
| (as a % of total investments) | | | | |
| Tax Obligation/Limited | | | 34.6 | % |
| Education and Civic Organizations | | | 15.6 | % |
| U.S. Guaranteed | | | 11.0 | % |
| Transportation | | | 10.0 | % |
| Health Care | | | 9.7 | % |
| Utilities | | | 7.3 | % |
| Water and Sewer | | | 5.3 | % |
| Other | | | 6.5 | % |
Insurers4 | | | | |
| (as a % of total Insured investments) | | | | |
NPFG5 | | | 28.3 | % |
| AGM | | | 26.0 | % |
| AMBAC | | | 21.1 | % |
| FGIC | | | 20.7 | % |
| Other | | | 3.9 | % |
| | Refer to the Glossary of Terms Used in this Report for further definition of the terms used within this Fund’s Performance Overview page. |
| 1 | The Fund intends to invest at least 80% of its managed assets in municipal securities that are covered by insurance guaranteeing the timely payment of principal and interest. See Notes to Financial Statements, Footnote 1 – General Information and Significant Accounting Policies, Insurance for more information. At the end of the reporting period, 92% of the Fund’s total investments are invested in Insured securities. |
| 2 | Ratings shown are the highest of Standard & Poor’s Group, Moody’s Investor Service, Inc. or Fitch, Inc. AAA includes bonds with an implied AAA rating since they are backed by U.S. Government or agency securities. AAA, AA, A and BBB ratings are investment grade; BB, B, CCC, CC, C and D ratings are below-investment grade. Holdings designated N/R are not rated by any of these national rating agencies. |
| 3 | Taxable-Equivalent Yield represents the yield that must be earned on a fully taxable investment in order to equal the yield of the Fund on an after-tax basis. It is based on a combined federal and state income tax rate of 32.9%. When comparing this Fund to investments that generate qualified dividend income, the Taxable-Equivalent Yield is lower. |
| 4 | Holdings are subject to change. |
| 5 | MBIA’s public finance subsidiary. |
| 6 | The Fund paid shareholders a capital gains distribution in December 2010 of $0.0044 per share. |
| NNF | | Nuveen Insured New York |
| Performance | | Premium Income |
| OVERVIEW | | Municipal Fund, Inc. |
| Fund Snapshot | | | |
| Common Share Price | | $ | 13.87 | |
| Common Share Net Asset Value (NAV) | | $ | 14.48 | |
| Premium/(Discount) to NAV | | | -4.21 | % |
| Market Yield | | | 5.58 | % |
Taxable-Equivalent Yield3 | | | 8.32 | % |
| Net Assets Applicable to Common Shares ($000) | | $ | 119,406 | |
| Average Annual Total Return | | | | | | | |
| (Inception 12/17/92) | | | | | | | |
| | | On Share Price | | On NAV | |
| 6-Month (Cumulative) | | | -6.06 | % | | -5.51 | % |
| 1-Year | | | 5.51 | % | | 1.36 | % |
| 5-Year | | | 4.55 | % | | 3.89 | % |
| 10-Year | | | 5.55 | % | | 5.14 | % |
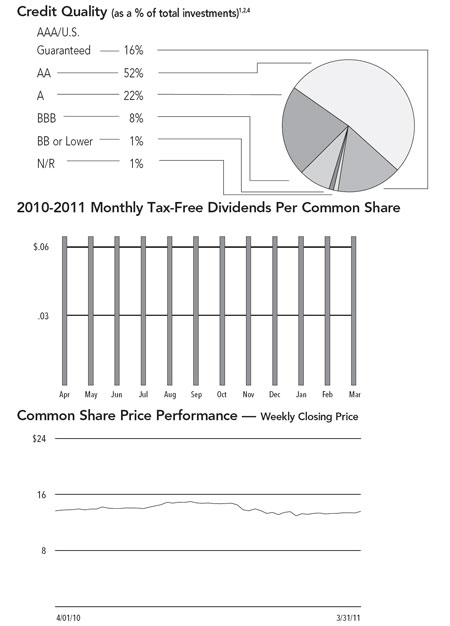
Portfolio Composition4 | | | |
| (as a % of total investments) | | | |
| Tax Obligation/Limited | | | 39.3 | % |
| Education and Civic Organizations | | | 14.3 | % |
| Health Care | | | 12.9 | % |
| Transportation | | | 9.9 | % |
| Water and Sewer | | | 6.4 | % |
| U.S. Guaranteed | | | 5.3 | % |
| Other | | | 11.9 | % |
Insurers4 | | | |
| (as a % of total Insured investments) | | | | |
| AMBAC | | | 27.5 | % |
NPFG5 | | | 25.2 | % |
| AGM | | | 23.8 | % |
| FGIC | | | 16.3 | % |
| Other | | | 7.2 | % |
| | Refer to the Glossary of Terms Used in this Report for further definition of the terms used within this Fund’s Performance Overview page. |
| 1 | The Fund intends to invest at least 80% of its managed assets in municipal securities that are covered by insurance guaranteeing the timely payment of principal and interest. See Notes to Financial Statements, Footnote 1 – General Information and Significant Accounting Policies, Insurance for more information. At the end of the reporting period, 92% of the Fund’s total investments are invested in Insured securities. |
| 2 | Ratings shown are the highest of Standard & Poor’s Group, Moody’s Investor Service, Inc. or Fitch, Inc. AAA includes bonds with an implied AAA rating since they are backed by U.S. Government or agency securities. AAA, AA, A and BBB ratings are investment grade; BB, B, CCC, CC, C and D ratings are below-investment grade. Holdings designated N/R are not rated by any of these national rating agencies. |
| 3 | Taxable-Equivalent Yield represents the yield that must be earned on a fully taxable investment in order to equal the yield of the Fund on an after-tax basis. It is based on a combined federal and state income tax rate of 32.9%. When comparing this Fund to investments that generate qualified dividend income, the Taxable-Equivalent Yield is lower. |
| 4 | Holdings are subject to change. |
| 5 | MBIA’s public finance subsidiary. |
| NKO | | Nuveen Insured New York |
| Performance | | Dividend Advantage |
| OVERVIEW | | Municipal Fund |
| Fund Snapshot | | | |
| Common Share Price | | $ | 13.54 | |
| Common Share Net Asset Value (NAV) | | $ | 14.33 | |
| Premium/(Discount) to NAV | | | -5.51 | % |
| Market Yield | | | 5.72 | % |
Taxable-Equivalent Yield3 | | | 8.52 | % |
| Net Assets Applicable to Common Shares ($000) | | $ | 113,766 | |
| Average Annual Total Return | | | | | |
| (Inception 3/25/02) | | | | | |
| | | On Share Price | | On NAV | |
| 6-Month (Cumulative) | | | -5.38 | % | | -4.45 | % |
| 1-Year | | | 5.20 | % | | 1.57 | % |
| 5-Year | | | 3.22 | % | | 4.04 | % |
| Since Inception | | | 4.94 | % | | 5.75 | % |
Portfolio Composition4 | | | |
| (as a % of total investments) | | | |
| Tax Obligation/Limited | | | 32.3 | % |
| Education and Civic Organizations | | | 15.5 | % |
| Transportation | | | 11.7 | % |
| Health Care | | | 9.9 | % |
| Utilities | | | 8.6 | % |
| U.S Guaranteed | | | 6.9 | % |
| Tax Obligation/General | | | 5.3 | % |
| Other | | | 9.8 | % |
Insurers4 | | | |
| (as a % of total Insured investments) | | | |
| AGM | | | 28.4 | % |
NPFG5 | | | 27.7 | % |
| AMBAC | | | 19.2 | % |
| FGIC | | | 18.6 | % |
| Other | | | 6.1 | % |
| | Refer to the Glossary of Terms Used in this Report for further definition of the terms used within this Fund’s Performance Overview page. |
| 1 | The Fund intends to invest at least 80% of its managed assets in municipal securities that are covered by insurance guaranteeing the timely payment of principal and interest. See Notes to Financial Statements, Footnote 1 – General Information and Significant Accounting Policies, Insurance for more information. At the end of the reporting period, 88% of the Fund’s total investments are invested in Insured securities. |
| 2 | Ratings shown are the highest of Standard & Poor’s Group, Moody’s Investor Service, Inc. or Fitch, Inc. AAA includes bonds with an implied AAA rating since they are backed by U.S. Government or agency securities. AAA, AA, A and BBB ratings are investment grade; BB, B, CCC, CC, C and D ratings are below-investment grade. Holdings designated N/R are not rated by any of these national rating agencies. |
| 3 | Taxable-Equivalent Yield represents the yield that must be earned on a fully taxable investment in order to equal the yield of the Fund on an after-tax basis. It is based on a combined federal and state income tax rate of 32.9%. When comparing this Fund to investments that generate qualified dividend income, the Taxable-Equivalent Yield is lower. |
| 4 | Holdings are subject to change. |
| 5 | MBIA’s public finance subsidiary. |
| NRK | | Nuveen Insured New York |
| Performance | | Tax-Free Advantage |
| OVERVIEW | | Municipal Fund |
| Fund Snapshot | | | |
| Common Share Price | | $ | 13.12 | |
| Common Share Net Asset Value (NAV) | | $ | 14.10 | |
| Premium/(Discount) to NAV | | | -6.95 | % |
| Market Yield | | | 5.63 | % |
Taxable-Equivalent Yield3 | | | 8.39 | % |
| Net Assets Applicable to Common Shares ($000) | | $ | 49,436 | |
| Average Annual Total Return | | | | | |
| (Inception 11/21/02) | | | | | |
| | | On Share Price | | On NAV | |
| 6-Month (Cumulative) | | | -8.59 | % | | -5.83 | % |
| 1-Year | | | -1.42 | % | | -0.47 | % |
| 5-Year | | | 3.96 | % | | 4.10 | % |
| Since Inception | | | 3.84 | % | | 4.97 | % |
Portfolio Composition4 | | | |
| (as a % of total investments) | | | |
| Tax Obligation/Limited | | | 29.4 | % |
| U.S. Guaranteed | | | 21.5 | % |
| Education and Civic Organizations | | | 14.8 | % |
| Health Care | | | 14.2 | % |
| Transportation | | | 8.8 | % |
| Other | | | 11.3 | % |
Insurers4 | | | | |
| (as a % of total Insured investments) | | | | |
| AMBAC | | | 28.9 | % |
NPFG5 | | | 28.8 | % |
| FGIC | | | 16.5 | % |
| AGM | | | 12.2 | % |
| AGC | | | 6.2 | % |
| Other | | | 7.4 | % |
| | Refer to the Glossary of Terms Used in this Report for further definition of the terms used within this Fund’s Performance Overview page. |
| 1 | The Fund intends to invest at least 80% of its managed assets in municipal securities that are covered by insurance guaranteeing the timely payment of principal and interest. See Notes to Financial Statements, Footnote 1 – General Information and Significant Accounting Policies, Insurance for more information. At the end of the reporting period, 90% of the Fund’s total investments are invested in Insured securities. |
| 2 | Ratings shown are the highest of Standard & Poor’s Group, Moody’s Investor Service, Inc. or Fitch, Inc. AAA includes bonds with an implied AAA rating since they are backed by U.S. Government or agency securities. AAA, AA, A and BBB ratings are investment grade; BB, B, CCC, CC, C and D ratings are below-investment grade. Holdings designated N/R are not rated by any of these national rating agencies. |
| 3 | Taxable-Equivalent Yield represents the yield that must be earned on a fully taxable investment in order to equal the yield of the Fund on an after-tax basis. It is based on a combined federal and state income tax rate of 32.9%. When comparing this Fund to investments that generate qualified dividend income, the Taxable-Equivalent Yield is lower. |
| 4 | Holdings are subject to change. |
| 5 | MBIA’s public finance subsidiary. |
| | | Nuveen New York Investment Quality Municipal Fund, Inc. |
| NQN | | Portfolio of Investments |
March 31, 2011 (Unaudited)
| | Principal | | | Optional Call | | | | |
| | Amount (000) | | Description (1) | Provisions (2) | Ratings (3) | | Value | |
| | | | Education and Civic Organizations – 24.9% (15.8% of Total Investments) | | | | | |
| $ | 3,500 | | Dormitory Authority of the State of New York, Insured Revenue Bonds, Culinary Institute of America, Series 1999, 5.000%, 7/01/22 – NPFG Insured | 7/11 at 100.00 | Baa1 | $ | 3,501,225 | |
| | 1,880 | | Dormitory Authority of the State of New York, 853 Schools Program Insured Revenue Bonds, St. Anne Institute, Issue 2, Series 1998E, 5.000%, | 7/11 at 100.00 | N/R | | 1,885,114 | |
| | | | 7/01/18 – AMBAC Insured | | | | | |
| | 935 | | Dormitory Authority of the State of New York, Housing Revenue Bonds, Fashion Institute of Technology, Series 2007, 5.250%, 7/01/34 – FGIC Insured | No Opt. Call | BBB | | 840,584 | |
| | 6,500 | | Dormitory Authority of the State of New York, Insured Revenue Bonds, | 7/11 at 100.00 | Baa1 | | 6,517,225 | |
| | | | New York Medical College, Series 1998, 5.000%, 7/01/21 – NPFG Insured | | | | | |
| | 2,000 | | Dormitory Authority of the State of New York, Insured Revenue Bonds, Yeshiva University, Series 2001, 5.000%, 7/01/18 – AMBAC Insured | 7/11 at 100.00 | Aa3 | | 2,008,000 | |
| | 3,000 | | Dormitory Authority of the State of New York, Lease Revenue Bonds, State University Dormitory Facilities, Series 2003B, 5.250%, 7/01/32 (Mandatory put 7/01/13) – SYNCORA GTY Insured | No Opt. Call | Aa2 | | 3,238,530 | |
| | 1,730 | | Dormitory Authority of the State of New York, Lease Revenue Bonds, State University Dormitory Facilities, Series 2004A, 5.000%, 7/01/29 – NPFG Insured | 7/15 at 100.00 | Aa2 | | 1,743,702 | |
| | 2,080 | | Dormitory Authority of the State of New York, Lease Revenue Bonds, State University Dormitory Facilities, Series 2006A, 5.000%, 7/01/31 – NPFG Insured | 7/16 at 100.00 | Aa2 | | 2,074,592 | |
| | 550 | | Dormitory Authority of the State of New York, Revenue Bonds, Barnard College, Series 2007A, 5.000%, 7/01/37 – FGIC Insured | 7/17 at 100.00 | BBB | | 509,113 | |
| | 1,150 | | Dormitory Authority of the State of New York, Revenue Bonds, Canisius College, Series 2005, 5.000%, 7/01/21 – NPFG Insured | 7/15 at 100.00 | Baa1 | | 1,133,153 | |
| | 1,980 | | Dormitory Authority of the State of New York, Revenue Bonds, Convent of the Sacred Heart, Series 2011, 5.750%, 11/01/40 – AGM Insured | 5/21 at 100.00 | AA+ | | 2,002,532 | |
| | 740 | | Dormitory Authority of the State of New York, Revenue Bonds, New York University, Series 2007, 5.000%, 7/01/32 – AMBAC Insured | 7/17 at 100.00 | AA– | | 740,141 | |
| | 2,400 | | Dormitory Authority of the State of New York, Revenue Bonds, New York University, Series 2009A, 5.250%, 7/01/34 | 7/19 at 100.00 | AA– | | 2,410,152 | |
| | 3,000 | | Dormitory Authority of the State of New York, Revenue Bonds, New York University, Series 2009B, 5.000%, 7/01/39 | 7/19 at 100.00 | AA– | | 2,883,540 | |
| | 1,200 | | Dormitory Authority of the State of New York, Revenue Bonds, Non State Supported Debt, Cornell University, Series 2008C, 5.000%, 7/01/37 | 7/20 at 100.00 | Aa1 | | 1,200,348 | |
| | | | Dormitory Authority of the State of New York, Revenue Bonds, Non State Supported Debt, Cornell University, Series 2010A: | | | | | |
| | 5,000 | | 5.000%, 7/01/35 | 7/20 at 100.00 | Aa1 | | 5,030,900 | |
| | 5,000 | | 5.000%, 7/01/40 | 7/20 at 100.00 | Aa1 | | 4,995,800 | |
| | | | Dormitory Authority of the State of New York, Revenue Bonds, Rochester Institute of Technology, Series 2006A: | | | | | |
| | 575 | | 5.250%, 7/01/20 – AMBAC Insured | No Opt. Call | A1 | | 624,289 | |
| | 460 | | 5.250%, 7/01/21 – AMBAC Insured | No Opt. Call | A1 | | 497,076 | |
| | 4,500 | | Dormitory Authority of the State of New York, State and Local Appropriation Lease Bonds, Upstate Community Colleges, Series 2005A, 5.000%, | 7/15 at 100.00 | AA– | | 4,770,360 | |
| | | | 7/01/19 – FGIC Insured | | | | | |
| | 2,390 | | New York City Industrial Development Agency, New York, PILOT Revenue Bonds, Queens Baseball Stadium Project, Series 2006, 5.000%, 1/01/46 – AMBAC Insured | 1/17 at 100.00 | BB+ | | 1,915,800 | |
| | | | New York City Industrial Development Authority, New York, PILOT Revenue Bonds, Yankee Stadium Project, Series 2006: | | | | | |
| | 890 | | 5.000%, 3/01/31 – FGIC Insured | 9/16 at 100.00 | BBB– | | 817,830 | |
| | 6,080 | | 5.000%, 3/01/36 – NPFG Insured | 9/16 at 100.00 | Baa1 | | 5,225,152 | |
| | 3,685 | | 4.500%, 3/01/39 – FGIC Insured | 9/16 at 100.00 | BBB– | | 2,858,970 | |
| | 2,000 | | New York City Trust for Cultural Resources, New York, Revenue Bonds, American Museum of Natural History, Series 2004A, 5.000%, 7/01/36 – NPFG Insured | 7/14 at 100.00 | AA | | 1,945,320 | |
| | 800 | | Troy Capital Resource Corporation, New York, Revenue Bonds, Rensselaer Polytechnic Institute, Series 2010A, 5.125%, 9/01/40 | 9/20 at 100.00 | A | | 732,584 | |
| | 64,025 | | Total Education and Civic Organizations | | | | 62,102,032 | |
| | Principal | | | Optional Call | | | | |
| | Amount (000) | | Description (1) | Provisions (2) | Ratings (3) | | Value | |
| | | | Health Care – 20.1% (12.7% of Total Investments) | | | | | |
| $ | 590 | | Dormitory Authority of the State of New York, FHA-Insured Mortgage Hospital Revenue Bonds, Hospital for Special Surgery, Series 2009, 6.250%, 8/15/34 | 8/19 at 100.00 | AAA | $ | 652,870 | |
| | | | Dormitory Authority of the State of New York, FHA-Insured Mortgage Hospital Revenue Bonds, Montefiore Medical Center, Series 1999: | | | | | |
| | 530 | | 5.250%, 8/01/19 – AMBAC Insured | 8/11 at 100.00 | N/R | | 531,532 | |
| | 4,000 | | 5.500%, 8/01/38 – AMBAC Insured | 8/11 at 100.00 | N/R | | 3,938,520 | |
| | 1,715 | | Dormitory Authority of the State of New York, FHA-Insured Mortgage Revenue Bonds, Hudson Valley Hospital Center, Series 2007, 5.000%, 8/15/27 – AGM Insured | 8/17 at 100.00 | AA+ | | 1,740,125 | |
| | 2,575 | | Dormitory Authority of the State of New York, FHA-Insured Mortgage Revenue Bonds, Montefiore Hospital, Series 2004, 5.000%, 8/01/29 – FGIC Insured | 2/15 at 100.00 | BBB | | 2,544,383 | |
| | 3,535 | | Dormitory Authority of the State of New York, FHA-Insured Revenue Bonds, Montefiore Medical Center, Series 2005, 5.000%, 2/01/22 – FGIC Insured | 2/15 at 100.00 | BBB | | 3,598,383 | |
| | 1,500 | | Dormitory Authority of the State of New York, Hospital Revenue Bonds, Catholic Health Services of Long Island Obligated Group – St. Francis Hospital, Series 1999A, 5.500%, 7/01/22 – NPFG Insured | 7/11 at 100.00 | A3 | | 1,501,935 | |
| | 8,000 | | Dormitory Authority of the State of New York, Revenue Bonds, Catholic Health Services of Long Island Obligated Group – St. Charles Hospital and Rehabilitation Center, Series 1999A, 5.500%, 7/01/22 – NPFG Insured | 7/11 at 100.00 | A3 | | 8,010,318 | |
| | 1,325 | | Dormitory Authority of the State of New York, Revenue Bonds, Health Quest System Inc., Series 2007B, 5.250%, 7/01/27 – AGC Insured | 7/17 at 100.00 | AA+ | | 1,334,712 | |
| | 6,000 | | Dormitory Authority of the State of New York, Revenue Bonds, Memorial Sloan-Kettering Cancer Center, Series 2003-1, 5.000%, 7/01/21 – NPFG Insured | 7/13 at 100.00 | AA | | 6,160,800 | |
| | 1,955 | | Dormitory Authority of the State of New York, Revenue Bonds, New York and Presbyterian Hospital, Series 2004A, 5.250%, 8/15/15 – AGM Insured | 8/14 at 100.00 | AA+ | | 2,090,931 | |
| | 1,805 | | Dormitory Authority of the State of New York, Revenue Bonds, North Shore Health System Obligated Group, Series 1998, 5.000%, 11/01/23 – NPFG Insured | 5/11 at 100.00 | Baa1 | | 1,804,874 | |
| | 1,585 | | Dormitory Authority of the State of New York, Revenue Bonds, The New York and Presbyterian Hospital Project, Series 2007, 5.000%, 8/15/36 – AGM Insured | 8/14 at 100.00 | AA+ | | 1,506,257 | |
| | 8,525 | | Dormitory Authority of the State of New York, Revenue Bonds, Winthrop South Nassau University Health System Obligated Group, Series 2001B, 5.250%, 7/01/26 – AMBAC Insured | 7/11 at 101.00 | Baa1 | | 8,233,614 | |
| | | | New York City Health and Hospitals Corporation, New York, Health System Revenue Bonds, Series 2003A: | | | | | |
| | 3,150 | | 5.250%, 2/15/21 – AMBAC Insured | 2/13 at 100.00 | Aa3 | | 3,242,012 | |
| | 2,100 | | 5.250%, 2/15/22 – AMBAC Insured | 2/13 at 100.00 | Aa3 | | 2,174,949 | |
| | 935 | | Westchester County Health Care Corporation, New York, Senior Lien Revenue Bonds, Series 2010-C2, 6.125%, 11/01/37 | 11/20 at 100.00 | A3 | | 913,963 | |
| | 49,825 | | Total Health Care | | | | 49,980,178 | |
| | | | Housing/Multifamily – 4.6% (2.9% of Total Investments) | | | | | |
| | | | New York City Housing Development Corporation, New York, Capital Fund Program Revenue Bonds, Series 2005A: | | | | | |
| | 1,230 | | 5.000%, 7/01/14 – FGIC Insured | No Opt. Call | AA+ | | 1,344,095 | |
| | 1,230 | | 5.000%, 7/01/16 – FGIC Insured | 7/15 at 100.00 | AA+ | | 1,339,470 | |
| | 5,740 | | New York City Housing Development Corporation, New York, Capital Fund Program Revenue Bonds, Series 2005A, 5.000%, 7/01/25 – NPFG Insured (UB) | 7/15 at 100.00 | AA+ | | 5,841,713 | |
| | 420 | | New York City Housing Development Corporation, New York, Multifamily Housing Revenue Bonds, Seaview Towers, Series 2006A, 4.750%, 7/15/39 – AMBAC Insured (Alternative Minimum Tax) | 1/17 at 100.00 | AAA | | 373,388 | |
| | 2,000 | | New York State Housing Finance Agency, Affordable Housing Revenue Bonds, Series 2007B, 5.300%, 11/01/37 (Alternative Minimum Tax) | 11/17 at 100.00 | Aa2 | | 1,875,480 | |
| | 450 | | New York State Housing Finance Agency, Affordable Housing Revenue Bonds, Series 2009B, 4.500%, 11/01/29 | 5/19 at 100.00 | Aa2 | | 416,786 | |
| | | | New York State Housing Finance Agency, Mortgage Revenue Refunding Bonds, Housing Project, Series 1996A: | | | | | |
| | 110 | | 6.100%, 11/01/15 – AGM Insured | 5/11 at 100.00 | AA+ | | 110,466 | |
| | 150 | | 6.125%, 11/01/20 – AGM Insured | 5/11 at 100.00 | AA+ | | 150,164 | |
| | 11,330 | | Total Housing/Multifamily | | | | 11,451,562 | |
| | | Nuveen New York Investment Quality Municipal Fund, Inc. (continued) |
| NQN | | Portfolio of Investments |
March 31, 2011 (Unaudited)
| | Principal | | | Optional Call | | | | |
| | Amount (000) | | Description (1) | Provisions (2) | Ratings (3) | | Value | |
| | | | Tax Obligation/General – 12.4% (7.8% of Total Investments) | | | | | |
| $ | 3,000 | | Dormitory Authority of the State of New York, School Districts Revenue Bond Financing Program, Peekskill City School District, Series 2005D, 5.000%, 10/01/33 – NPFG Insured | 10/15 at 100.00 | Aa3 | $ | 2,878,710 | |
| | 1,200 | | Erie County, New York, General Obligation Bonds, Series 2003A, 5.250%, 3/15/16 – NPFG Insured | 3/13 at 100.00 | A2 | | 1,271,892 | |
| | 635 | | Erie County, New York, General Obligation Bonds, Series 2004B, 5.250%, 4/01/13 – NPFG Insured | No Opt. Call | A2 | | 676,466 | |
| | 1,000 | | Monroe County, New York, General Obligation Public Improvement Bonds, Series 2002, 5.000%, 3/01/16 – FGIC Insured | 3/12 at 100.00 | A3 | | 1,019,020 | |
| | 400 | | New York City, New York, General Obligation Bonds, Fiscal 2009 Series E, 5.000%, 8/01/28 | 8/19 at 100.00 | AA | | 409,416 | |
| | 3,000 | | New York City, New York, General Obligation Bonds, Fiscal 2010 Series C, 5.000%, 8/01/23 | 8/19 at 100.00 | AA | | 3,182,940 | |
| | 2,300 | | New York City, New York, General Obligation Bonds, Fiscal Series 2005J, 5.000%, 3/01/19 – FGIC Insured | 3/15 at 100.00 | AA | | 2,438,230 | |
| | | | New York City, New York, General Obligation Bonds: | | | | | |
| | 3,000 | | 5.000%, 11/01/19 – AGM Insured (UB) | 11/14 at 100.00 | AA+ | | 3,156,840 | |
| | 2,300 | | 5.000%, 11/01/20 – AGM Insured (UB) | 11/14 at 100.00 | AA+ | | 2,406,490 | |
| | | | Pavilion Central School District, Genesee County, New York, General Obligation Bonds, Series 2005: | | | | | |
| | 1,650 | | 5.000%, 6/15/16 – AGM Insured | 6/15 at 100.00 | AA+ | | 1,807,014 | |
| | 1,815 | | 5.000%, 6/15/18 – AGM Insured | 6/15 at 100.00 | AA+ | | 1,954,592 | |
| | 1,145 | | Three Village Central School District, Brookhaven and Smithtown, Suffolk County, New York, General Obligation Bonds, Series 2005, 5.000%, | No Opt. Call | Aa2 | | 1,301,922 | |
| | | | 6/01/18 – FGIC Insured | | | | | |
| | 1,620 | | West Islip Union Free School District, Suffolk County, New York, General Obligation Bonds, Series 2005, 5.000%, 10/01/16 – AGM Insured | 10/15 at 100.00 | Aa3 | | 1,821,091 | |
| | 6,110 | | Yonkers, New York, General Obligation Bonds, Series 2005A, 5.000%, 8/01/16 – NPFG Insured | 8/15 at 100.00 | A2 | | 6,542,771 | |
| | 29,175 | | Total Tax Obligation/General | | | | 30,867,394 | |
| | | | Tax Obligation/Limited – 57.2% (36.1% of Total Investments) | | | | | |
| | 1,575 | | Dormitory Authority of the State of New York, Department of Health Revenue Bonds, Series 2005A, 5.250%, 7/01/24 – CIFG Insured | 7/15 at 100.00 | AA– | | 1,632,440 | |
| | 1,340 | | Dormitory Authority of the State of New York, Insured Revenue Bonds, 853 Schools Program – Anderson School, Series 1999E, Issue 2, 5.750%, 7/01/19 – AMBAC Insured | 7/11 at 100.00 | N/R | | 1,351,283 | |
| | 2,000 | | Dormitory Authority of the State of New York, Insured Revenue Bonds, Special Act School District Program, Series 1999, 5.750%, 7/01/19 – NPFG Insured | 7/11 at 100.00 | Baa1 | | 2,016,700 | |
| | 1,000 | | Dormitory Authority of the State of New York, Lease Revenue Bonds, Nassau County Board of Cooperative Educational Services, Series 2001A, 5.250%, | 8/11 at 100.00 | AA+ | | 1,013,730 | |
| | | | 8/15/21 – AGM Insured | | | | | |
| | 1,500 | | Dormitory Authority of the State of New York, Lease Revenue Bonds, Wayne-Finger Lakes Board of Cooperative Education Services, Series 2004, 5.000%, 8/15/23 – AGM Insured | 8/14 at 100.00 | AA+ | | 1,531,575 | |
| | 2,410 | | Dormitory Authority of the State of New York, Revenue Bonds, Department of Health, Series 2004-2, 5.000%, 7/01/20 – FGIC Insured | 7/14 at 100.00 | AA– | | 2,520,402 | |
| | | | Dormitory Authority of the State of New York, Revenue Bonds, Mental Health Services Facilities Improvements, Series 2005D-1: | | | | | |
| | 2,120 | | 5.000%, 2/15/15 – FGIC Insured | No Opt. Call | AA– | | 2,334,247 | |
| | 1,200 | | 5.000%, 8/15/23 – FGIC Insured | 2/15 at 100.00 | AA– | | 1,228,704 | |
| | 4,600 | | Dormitory Authority of the State of New York, Revenue Bonds, School Districts Financing Program, Series 2002D, 5.250%, 10/01/23 – NPFG Insured | 10/12 at 100.00 | A+ | | 4,755,572 | |
| | 3,135 | | Dormitory Authority of the State of New York, Secured Hospital Insured Revenue Bonds, Southside Hospital, Series 1998, 5.000%, 2/15/25 – NPFG Insured | 8/11 at 100.00 | Aa3 | | 3,064,306 | |
| | 375 | | Dormitory Authority of the State of New York, State Personal Income Tax Revenue Bonds, Series 2005F, 5.000%, 3/15/21 – AGM Insured | 3/15 at 100.00 | AAA | | 392,651 | |
| | 2,400 | | Erie County Industrial Development Agency, New York, School Facility Revenue Bonds, Buffalo City School District Project, Series 2009A, 5.000%, 5/01/31 | No Opt. Call | AA– | | 2,393,856 | |
| | | | Erie County Industrial Development Agency, New York, School Facility Revenue Bonds, Buffalo City School District, Series 2003: | | | | | |
| | 1,000 | | 5.750%, 5/01/20 – AGM Insured | 5/12 at 100.00 | AA+ | | 1,038,250 | |
| | 1,200 | | 5.750%, 5/01/22 – AGM Insured | 5/12 at 100.00 | AA+ | | 1,240,872 | |
| | Principal | | | Optional Call | | | | |
| | Amount (000) | | Description (1) | Provisions (2) | Ratings (3) | | Value | |
| | | | Tax Obligation/Limited (continued) | | | | | |
| | | | Erie County Industrial Development Agency, New York, School Facility Revenue Bonds, Buffalo City School District, Series 2004: | | | | | |
| $ | 1,290 | | 5.750%, 5/01/26 – AGM Insured (UB) | 5/14 at 100.00 | AA+ | $ | 1,314,910 | |
| | 1,780 | | 5.750%, 5/01/27 – AGM Insured (UB) | 5/18 at 100.00 | AA+ | | 1,925,373 | |
| | 5,630 | | Erie County Industrial Development Agency, New York, School Facility Revenue Bonds, Buffalo City School District, Series 2007A, 5.750%, | 5/17 at 100.00 | AA+ | | 6,008,336 | |
| | | | 5/01/28 – AGM Insured (UB) | | | | | |
| | 10,735 | | Hudson Yards Infrastructure Corporation, New York, Revenue Bonds, Series 2006A, 5.000%, 2/15/47 – FGIC Insured | 2/17 at 100.00 | A | | 8,808,921 | |
| | 6,000 | | Metropolitan Transportation Authority, New York, Dedicated Tax Fund Bonds, Series 2002A, 5.250%, 11/15/25 – AGM Insured | 11/12 at 100.00 | AA+ | | 6,175,740 | |
| | 2,760 | | Metropolitan Transportation Authority, New York, State Service Contract Bonds, Series 2002B, 5.500%, 7/01/18 – NPFG Insured | 7/12 at 100.00 | AA– | | 2,895,268 | |
| | | | Metropolitan Transportation Authority, New York, State Service Contract Refunding Bonds, Series 2002A: | | | | | |
| | 1,250 | | 5.500%, 1/01/19 – NPFG Insured | 7/12 at 100.00 | AA– | | 1,309,738 | |
| | 2,000 | | 5.500%, 1/01/20 – NPFG Insured | 7/12 at 100.00 | AA– | | 2,094,180 | |
| | 2,000 | | 5.000%, 7/01/25 – FGIC Insured | 7/12 at 100.00 | AA– | | 2,003,440 | |
| | 4,095 | | 5.000%, 7/01/30 – AMBAC Insured | 7/12 at 100.00 | AA– | | 3,957,121 | |
| | 4,500 | | Metropolitan Transportation Authority, New York, State Service Contract Refunding Bonds, Series 2002A, 5.750%, 7/01/18 – AGM Insured (UB) | No Opt. Call | AA+ | | 5,176,080 | |
| | 4,820 | | Nassau County Interim Finance Authority, New York, Sales and Use Tax Revenue Bonds, Series 2004H, 5.250%, 11/15/13 – AMBAC Insured | No Opt. Call | AAA | | 5,366,106 | |
| | | | Nassau County Interim Finance Authority, New York, Sales Tax Secured Revenue Bonds, Series 2003A: | | | | | |
| | 2,115 | | 5.000%, 11/15/18 – AMBAC Insured | 11/13 at 100.00 | AAA | | 2,264,086 | |
| | 1,305 | | 4.750%, 11/15/21 – AMBAC Insured | 11/13 at 100.00 | AAA | | 1,344,659 | |
| | 1,305 | | 4.750%, 11/15/22 – AMBAC Insured | 11/13 at 100.00 | AAA | | 1,340,235 | |
| | | | New York City Sales Tax Asset Receivable Corporation, New York, Dedicated Revenue Bonds, Local Government Assistance Corporation, Series 2008, Trust 2901: | | | | | |
| | 2,200 | | 5.000%, 10/15/25 – NPFG Insured (UB) | 10/14 at 100.00 | AAA | | 2,294,754 | |
| | 1,600 | | 5.000%, 10/15/26 – NPFG Insured (UB) | 10/14 at 100.00 | AAA | | 1,673,568 | |
| | 6,640 | | 5.000%, 10/15/29 – AMBAC Insured (UB) | 10/14 at 100.00 | AAA | | 6,752,814 | |
| | 1,500 | | 5.000%, 10/15/32 – AMBAC Insured (UB) | 10/14 at 100.00 | AAA | | 1,512,300 | |
| | 1,660 | | New York City Transitional Finance Authority, New York, Future Tax Secured Bonds, Fiscal Series 2003E, 5.250%, 2/01/22 – NPFG Insured | 2/13 at 100.00 | AAA | | 1,742,170 | |
| | 2,000 | | New York City Transitional Finance Authority, New York, Future Tax Secured Bonds, Fiscal Series 2004C, 5.000%, 2/01/19 – SYNCORA GTY Insured | 2/14 at 100.00 | AAA | | 2,154,500 | |
| | 3,910 | | New York City Transitional Finance Authority, New York, Future Tax Secured Refunding Bonds, Fiscal Series 2003D, 5.000%, 2/01/22 – NPFG Insured | 2/13 at 100.00 | AAA | | 4,094,005 | |
| | | | New York City, New York, Educational Construction Fund, Revenue Bonds, Series 2011A: | | | | | |
| | 3,785 | | 5.750%, 4/01/33 – AGM Insured | 4/21 at 100.00 | AA+ | | 3,936,741 | |
| | 1,000 | | 5.750%, 4/01/41 | 4/21 at 100.00 | AA– | | 1,012,130 | |
| | | | New York Convention Center Development Corporation, Hotel Fee Revenue Bonds, Tender Option Bonds Trust 3095: | | | | | |
| | 700 | | 13.359%, 11/15/30 – AMBAC Insured (IF) | 11/15 at 100.00 | AA+ | | 732,319 | |
| | 3,195 | | 13.345%, 11/15/44 – AMBAC Insured (IF) | 11/15 at 100.00 | AA+ | | 2,988,252 | |
| | 3,000 | | New York State Local Government Assistance Corporation, Revenue Bonds, Series 1993E, 5.250%, 4/01/16 – AGM Insured (UB) | No Opt. Call | AAA | | 3,401,490 | |
| | | | New York State Thruway Authority, Highway and Bridge Trust Fund Bonds, Second General, Series 2005B: | | | | | |
| | 7,350 | | 5.500%, 4/01/20 – AMBAC Insured | No Opt. Call | AA | | 8,420,305 | |
| | 1,500 | | 5.000%, 4/01/21 – AMBAC Insured | 10/15 at 100.00 | AA | | 1,555,965 | |
| | 1,750 | | New York State Thruway Authority, State Personal Income Tax Revenue Bonds, Series 2004A, 5.000%, 3/15/24 – AMBAC Insured | 9/14 at 100.00 | AAA | | 1,835,173 | |
| | | Nuveen New York Investment Quality Municipal Fund, Inc. (continued) |
| NQN | | Portfolio of Investments |
March 31, 2011 (Unaudited)
| | Principal | | | Optional Call | | | | |
| | Amount (000) | | Description (1) | Provisions (2) | Ratings (3) | | Value | |
| | | | Tax Obligation/Limited (continued) | | | | | |
| | | | New York State Tobacco Settlement Financing Corporation, Tobacco Settlement Asset-Backed and State Contingency Contract-Backed Bonds, Series 2003A-1: | | | | | |
| $ | 6,300 | | 5.250%, 6/01/20 – AMBAC Insured | 6/13 at 100.00 | AA– | $ | 6,579,844 | |
| | 1,000 | | 5.250%, 6/01/21 – AMBAC Insured | 6/13 at 100.00 | AA– | | 1,024,370 | |
| | 4,500 | | 5.250%, 6/01/22 – AMBAC Insured | 6/13 at 100.00 | AA– | | 4,640,670 | |
| | 1,000 | | New York State Urban Development Corporation, State Personal Income Tax Revenue Bonds, Series 2005B, 5.000%, 3/15/30 – AGM Insured | 3/15 at 100.00 | AAA | | 1,011,950 | |
| | 1,000 | | Niagara Falls City School District, Niagara County, New York, Certificates of Participation, High School Facility, Series 2005, 5.000%, 6/15/28 – AGM Insured | 6/15 at 100.00 | AA+ | | 980,150 | |
| | 2,000 | | Puerto Rico Sales Tax Financing Corporation, Sales Tax Revenue Bonds, First Subordinate Series 2010A, 5.000%, 8/01/40 – AGM Insured | 2/20 at 100.00 | AA+ | | 1,817,300 | |
| | 295 | | Puerto Rico Sales Tax Financing Corporation, Sales Tax Revenue Bonds, First Subordinate Series 2010C, 5.125%, 8/01/42 – AGM Insured | 8/20 at 100.00 | AA+ | | 271,539 | |
| | 1,325 | | Suffolk County Industrial Development Agency, New York, Revenue Bonds, Hampton Bays Public Library, Series 1999A, 6.000%, 10/01/19 – NPFG Insured | 10/11 at 101.00 | Baa1 | | 1,354,190 | |
| | 2,770 | | Syracuse Industrial Development Authority, New York, PILOT Mortgage Revenue Bonds, Carousel Center Project, Series 2007A, 5.000%, 1/01/36 – SYNCORA GTY Insured (Alternative Minimum Tax) | 1/17 at 100.00 | BBB– | | 2,031,934 | |
| | 139,420 | | Total Tax Obligation/Limited | | | | 142,317,214 | |
| | | | Transportation – 13.1% (8.3% of Total Investments) | | | | | |
| | | | Metropolitan Transportation Authority, New York, Transportation Revenue Bonds, Series 2005A: | | | | | |
| | 700 | | 4.750%, 11/15/27 – NPFG Insured | 11/15 at 100.00 | AA+ | | 685,783 | |
| | 3,000 | | 4.750%, 11/15/30 – AMBAC Insured | 11/15 at 100.00 | A | | 2,777,610 | |
| | 2,000 | | Metropolitan Transportation Authority, New York, Transportation Revenue Refunding Bonds, Series 2002A, 5.500%, 11/15/19 – AMBAC Insured | 11/12 at 100.00 | A | | 2,108,200 | |
| | 710 | | New York State Thruway Authority, General Revenue Bonds, Refunding Series 2007H, 5.000%, 1/01/25 – FGIC Insured | 1/18 at 100.00 | A+ | | 731,463 | |
| | | | New York State Thruway Authority, General Revenue Bonds, Series 2005F: | | | | | |
| | 1,955 | | 5.000%, 1/01/20 – AMBAC Insured | 1/15 at 100.00 | A+ | | 2,021,235 | |
| | 5,360 | | 5.000%, 1/01/30 – AMBAC Insured | 1/15 at 100.00 | A+ | | 5,343,438 | |
| | 1,500 | | New York State Thruway Authority, General Revenue Bonds, Series 2005G, 5.000%, 1/01/30 – AGM Insured (UB) | 7/15 at 100.00 | AA+ | | 1,503,015 | |
| | 2,300 | | Niagara Frontier Airport Authority, New York, Airport Revenue Bonds, Buffalo Niagara International Airport, Series 1999A, 5.625%, 4/01/29 – NPFG Insured (Alternative Minimum Tax) | 10/11 at 100.00 | Baa1 | | 2,239,142 | |
| | | | Port Authority of New York and New Jersey, Consolidated Revenue Bonds, One Hundred Fortieth Series 2005: | | | | | |
| | 2,080 | | 5.000%, 12/01/19 – AGM Insured | 6/15 at 101.00 | AA+ | | 2,241,408 | |
| | 2,625 | | 5.000%, 12/01/28 – SYNCORA GTY Insured | 6/15 at 101.00 | Aa2 | | 2,667,263 | |
| | 1,475 | | 5.000%, 12/01/31 – SYNCORA GTY Insured | 6/15 at 101.00 | Aa2 | | 1,478,393 | |
| | 870 | | Port Authority of New York and New Jersey, Consolidated Revenue Bonds, One Hundred Forty Eighth Series 2008, Trust 2920, 17.512%, 8/15/32 – AGM Insured (IF) | 8/17 at 100.00 | AA+ | | 858,481 | |
| | 5,025 | | Port Authority of New York and New Jersey, Special Project Bonds, JFK International Air Terminal LLC, Sixth Series 1997, 5.750%, 12/01/25 – NPFG Insured (Alternative Minimum Tax) | 6/11 at 100.00 | Baa1 | | 4,716,716 | |
| | | | Triborough Bridge and Tunnel Authority, New York, Subordinate Lien General Purpose Revenue Refunding Bonds, Series 2002E: | | | | | |
| | 780 | | 5.500%, 11/15/20 – NPFG Insured | No Opt. Call | Aa3 | | 885,932 | |
| | 2,300 | | 5.250%, 11/15/22 – NPFG Insured | 11/12 at 100.00 | Aa3 | | 2,377,832 | |
| | 32,680 | | Total Transportation | | | | 32,635,911 | |
| | Principal | | | Optional Call | | | | |
| | Amount (000) | | Description (1) | Provisions (2) | Ratings (3) | | Value | |
| | | | U.S. Guaranteed – 4.2% (2.7% of Total Investments) (4) | | | | | |
| | | | Dormitory Authority of the State of New York, Improvement Revenue Bonds, Mental Health Services Facilities, Series 2001B: | | | | | |
| $ | 75 | | 5.500%, 8/15/19 (Pre-refunded 8/15/11) – NPFG Insured | 8/11 at 100.00 | AA– (4) | $ | 76,457 | |
| | 25 | | 5.500%, 8/15/19 (Pre-refunded 8/15/11) – NPFG Insured | 8/11 at 100.00 | AA– (4) | | 25,486 | |
| | 685 | | Dormitory Authority of the State of New York, Judicial Facilities Lease Revenue Bonds, Suffolk County Issue, Series 1986, 7.375%, 7/01/16 – BIGI Insured (ETM) | No Opt. Call | Aaa | | 793,299 | |
| | 945 | | Metropolitan Transportation Authority, New York, Commuter Facilities Revenue Bonds, Series 1997B, 5.000%, 7/01/20 – AMBAC Insured (ETM) | 6/11 at 100.00 | N/R (4) | | 984,454 | |
| | 5,090 | | Metropolitan Transportation Authority, New York, Dedicated Tax Fund Bonds, Series 1998A, 5.000%, 4/01/23 (Pre-refunded 10/01/15) – FGIC Insured | 10/15 at 100.00 | AAA | | 5,894,882 | |
| | 1,000 | | Metropolitan Transportation Authority, New York, Dedicated Tax Fund Bonds, Series 1999A, 5.000%, 4/01/29 (Pre-refunded 10/01/14) – AGM Insured | 10/14 at 100.00 | AAA | | 1,138,720 | |
| | 1,435 | | New York City Transitional Finance Authority, New York, Future Tax Secured Bonds, Fiscal Series 2003C, 5.250%, 8/01/20 (Pre-refunded 8/01/12) – AMBAC Insured | 8/12 at 100.00 | AAA | | 1,527,156 | |
| | 9,255 | | Total U.S. Guaranteed | | | | 10,440,454 | |
| | | | Utilities – 10.5% (6.6% of Total Investments) | | | | | |
| | 2,500 | | Long Island Power Authority, New York, Electric System General Revenue Bonds, Series 2001A, 5.000%, 9/01/27 – AGM Insured | 9/11 at 100.00 | AA+ | | 2,500,700 | |
| | 2,620 | | Long Island Power Authority, New York, Electric System General Revenue Bonds, Series 2003C, 5.000%, 9/01/16 – CIFG Insured | 9/13 at 100.00 | A3 | | 2,797,191 | |
| | | | Long Island Power Authority, New York, Electric System General Revenue Bonds, Series 2006A: | | | | | |
| | 4,540 | | 5.000%, 12/01/23 – FGIC Insured | 6/16 at 100.00 | A– | | 4,669,481 | |
| | 6,160 | | 5.000%, 12/01/25 – FGIC Insured | 6/16 at 100.00 | A– | | 6,280,305 | |
| | 3,000 | | 5.000%, 12/01/26 – AGC Insured | 6/16 at 100.00 | AA+ | | 3,042,030 | |
| | 625 | | Long Island Power Authority, New York, Electric System General Revenue Bonds, Series 2006B, 5.000%, 12/01/35 – CIFG Insured | 6/16 at 100.00 | A– | | 591,913 | |
| | 3,310 | | Long Island Power Authority, New York, Electric System Revenue Bonds, Series 2008A, 5.500%, 5/01/33 – BHAC Insured | 5/19 at 100.00 | AA+ | | 3,452,330 | |
| | 2,000 | | New York State Energy Research and Development Authority, Pollution Control Revenue Bonds, Rochester Gas and Electric Corporation, Series 1998A, 5.950%, 9/01/33 – NPFG Insured (Alternative Minimum Tax) | 9/11 at 100.00 | Baa1 | | 1,919,900 | |
| | 760 | | Power Authority of the State of New York, General Revenue Bonds, Series 2006A, 5.000%, 11/15/19 – FGIC Insured | 11/15 at 100.00 | Aa2 | | 805,737 | |
| | 25,515 | | Total Utilities | | | | 26,059,587 | |
| | | | Water and Sewer – 9.2% (5.8% of Total Investments) | | | | | |
| | 3,000 | | New York City Municipal Water Finance Authority, New York, Water and Sewerage System Revenue Bonds, Second Generation Resolution, Fiscal 2010 Series 2009BB, 5.000%, 6/15/27 | 6/19 at 100.00 | AA+ | | 3,130,020 | |
| | 5,030 | | New York City Municipal Water Finance Authority, New York, Water and Sewerage System Revenue Bonds, Fiscal Series 2005C, 5.000%, 6/15/27 – NPFG Insured (UB) | 6/15 at 100.00 | AAA | | 5,158,969 | |
| | 2,575 | | New York City Municipal Water Finance Authority, New York, Water and Sewerage System Revenue Bonds, Fiscal Series 2006B, 5.000%, 6/15/36 – NPFG Insured (UB) | 6/16 at 100.00 | AAA | | 2,504,677 | |
| | 3,000 | | New York City Municipal Water Finance Authority, New York, Water and Sewerage System Revenue Bonds, Fiscal Series 2004C, 5.000%, 6/15/35 – AMBAC Insured | 6/14 at 100.00 | AAA | | 2,931,810 | |
| | | Nuveen New York Investment Quality Municipal Fund, Inc. (continued) |
| NQN | | Portfolio of Investments |
March 31, 2011 (Unaudited)
| | Principal | | | Optional Call | | | | |
| | Amount (000) | | Description (1) | Provisions (2) | Ratings (3) | | Value | |
| | | | Water and Sewer (continued) | | | | | |
| $ | 3,845 | | New York State Environmental Facilities Corporation, Revenue Bonds, State Revolving Funds Master Financing, Series 2010C, 5.000%, 10/15/35 | 4/20 at 100.00 | AAA | $ | 3,849,078 | |
| | 5,200 | | Suffolk County Water Authority, New York, Waterworks Revenue Bonds, Series 2005C, 5.000%, 6/01/28 – NPFG Insured (UB) | 6/15 at 100.00 | AAA | | 5,322,252 | |
| | 22,650 | | Total Water and Sewer | | | | 22,896,806 | |
| $ | 383,875 | | Total Long-Term Investments (cost $390,606,703) – 156.2% (98.7% of Total Investments) | | | | 388,751,138 | |
| | | | Short-Term Investments – 2.0% (1.3% of Total Investments) | | | | | |
| | | | Tax Obligation/Limited – 2.0% (1.3% of Total Investments) | | | | | |
| $ | 4,950 | | Metropolitan Transportation Authority, New York, Dedicated Tax Fund Bonds, Variable Rate Demand Revenue Obligations, Series 2008A, 0.330%, | 7/11 at 100.00 | A-1 | | 4,950,000 | |
| | | | 11/01/31 – AGM Insured (5) | | | | | |
| | | | Total Short-Term Investments (cost $4,950,000) | | | | 4,950,000 | |
| | | | Total Investments (cost $395,556,703) – 158.2% | | | | 393,701,138 | |
| | | | Floating Rate Obligations – (14.9)% | | | | (37,145,000 | ) |
| | | | Variable Rate Demand Preferred Shares, at Liquidation Value – (45.1)% (6) | | | | (112,300,000 | ) |
| | | | Other Assets Less Liabilities – 1.8% | | | | 4,572,554 | |
| | | | Net Assets Applicable to Common Shares – 100% | | | $ | 248,828,692 | |
| | | The Fund intends to invest at least 80% of its managed assets in municipal securities that are covered by insurance guaranteeing the timely payment of principal and interest. See Notes to Financial Statements, Footnote 1 – General Information and Significant Accounting Policies, Insurance for more information. |
| (1) | | All percentages shown in the Portfolio of Investments are based on net assets applicable to Common shares unless otherwise noted. |
| (2) | | Optional Call Provisions: Dates (month and year) and prices of the earliest optional call or redemption. There may be other call provisions at varying prices at later dates. Certain mortgage-backed securities may be subject to periodic principal paydowns. |
| (3) | | Ratings: Using the highest of Standard & Poor’s Group (“Standard & Poor’s”), Moody’s Investor Service, Inc. (“Moody’s”) or Fitch, Inc. (“Fitch”) rating. Ratings below BBB by Standard & Poor’s, Baa by Moody’s or BBB by Fitch are considered to be below investment grade. Holdings designated N/R are not rated by any of these national rating agencies. |
| (4) | | Backed by an escrow or trust containing sufficient U.S. Government or U.S. Government agency securities, which ensure the timely payment of principal and interest. Such investments are normally considered to be equivalent to AAA rated securities. |
| (5) | | Investment has a maturity of more than one year, but has variable rate and demand features which qualify it as a short- term investment. The rate disclosed is that in effect at the end of the reporting period. This rate changes periodically based on market conditions or a specified market index. |
| (6) | | Variable Rate Demand Preferred Shares, at Liquidation Value as a percentage of Total Investments is 28.5%. |
| N/R | | Not rated. |
| (ETM) | | Escrowed to maturity. |
| (IF) | | Inverse floating rate investment. |
| (UB) | | Underlying bond of an inverse floating rate trust reflected as a financing transaction. See Notes to Financial Statements, Footnote 1 – General Information and Significant Accounting Policies, Inverse Floating Rate Securities for more information. |
See accompanying notes to financial statements.
| | | Nuveen New York Select Quality Municipal Fund, Inc. |
| NVN | | Portfolio of Investments |
March 31, 2011 (Unaudited)
| | Principal | | | Optional Call | | | | |
| | Amount (000) | | Description (1) | Provisions (2) | Ratings (3) | | Value | |
| | | | Education and Civic Organizations – 24.2% (15.3% of Total Investments) | | | | | |
| $ | 2,500 | | Dormitory Authority of the State of New York, General Revenue Bonds, | No Opt. Call | AA– | $ | 2,593,050 | |
| | | | New York University, Series 2001-1, 5.500%, 7/01/40 – AMBAC Insured | | | | | |
| | 1,235 | | Dormitory Authority of the State of New York, Housing Revenue Bonds, Fashion Institute of Technology, Series 2007, 5.250%, 7/01/34 – FGIC Insured | No Opt. Call | BBB | | 1,110,290 | |
| | 695 | | Dormitory Authority of the State of New York, Insured Revenue Bonds, Fordham University, Series 2002, 5.000%, 7/01/18 – FGIC Insured | 7/12 at 100.00 | A2 | | 709,366 | |
| | | | Dormitory Authority of the State of New York, Insured Revenue Bonds, | | | | | |
| | | | New York University, Series 2001-2: | | | | | |
| | 1,350 | | 5.500%, 7/01/18 – AMBAC Insured | 7/11 at 100.00 | AA– | | 1,362,704 | |
| | 800 | | 5.500%, 7/01/20 – AMBAC Insured | 7/11 at 100.00 | AA– | | 808,360 | |
| | 600 | | 5.500%, 7/01/21 – AMBAC Insured | 7/11 at 100.00 | AA– | | 606,270 | |
| | 2,125 | | Dormitory Authority of the State of New York, Insured Revenue Bonds, Yeshiva University, Series 2001, 5.000%, 7/01/19 – AMBAC Insured | 7/11 at 100.00 | Aa3 | | 2,131,928 | |
| | 2,000 | | Dormitory Authority of the State of New York, Lease Revenue Bonds, State University Dormitory Facilities, Series 2003B, 5.250%, 7/01/32 (Mandatory put 7/01/13) – SYNCORA GTY Insured | No Opt. Call | Aa2 | | 2,159,020 | |
| | 1,835 | | Dormitory Authority of the State of New York, Lease Revenue Bonds, State University Dormitory Facilities, Series 2004A, 5.000%, 7/01/29 – NPFG Insured | 7/15 at 100.00 | Aa2 | | 1,849,533 | |
| | 2,790 | | Dormitory Authority of the State of New York, Lease Revenue Bonds, State University Dormitory Facilities, Series 2006A, 5.000%, 7/01/31 – NPFG Insured | 7/16 at 100.00 | Aa2 | | 2,782,746 | |
| | 6,215 | | Dormitory Authority of the State of New York, Lease Revenue Bonds, State University Dormitory Facilities, Series 2009A, 5.000%, 7/01/39 | 7/19 at 100.00 | Aa2 | | 5,973,734 | |
| | 735 | | Dormitory Authority of the State of New York, Revenue Bonds, Barnard College, Series 2007A, 5.000%, 7/01/37 – FGIC Insured | 7/17 at 100.00 | BBB | | 680,360 | |
| | | | Dormitory Authority of the State of New York, Revenue Bonds, Canisius College, Series 2000: | | | | | |
| | 1,000 | | 5.100%, 7/01/20 – NPFG Insured | 7/11 at 101.00 | Baa1 | | 1,005,570 | |
| | 2,875 | | 5.250%, 7/01/30 – NPFG Insured | 7/11 at 101.00 | Baa1 | | 2,713,483 | |
| | | | Dormitory Authority of the State of New York, Revenue Bonds, Convent of the Sacred Heart, Series 2011: | | | | | |
| | 1,000 | | 5.625%, 11/01/35 – AGM Insured | 5/21 at 100.00 | AA+ | | 1,006,450 | |
| | 1,020 | | 5.750%, 11/01/40 – AGM Insured | 5/21 at 100.00 | AA+ | | 1,031,608 | |
| | 995 | | Dormitory Authority of the State of New York, Revenue Bonds, New York University, Series 2007, 5.000%, 7/01/32 – AMBAC Insured | 7/17 at 100.00 | AA– | | 995,189 | |
| | | | Dormitory Authority of the State of New York, Revenue Bonds, New York University, Series 2009A: | | | | | |
| | 3,300 | | 5.250%, 7/01/34 | 7/19 at 100.00 | AA– | | 3,313,959 | |
| | 3,890 | | 5.000%, 7/01/39 | 7/19 at 100.00 | AA– | | 3,738,990 | |
| | 3,750 | | Dormitory Authority of the State of New York, Revenue Bonds, New York University, Series 2009B, 5.000%, 7/01/39 | 7/19 at 100.00 | AA– | | 3,604,425 | |
| | 1,600 | | Dormitory Authority of the State of New York, Revenue Bonds, Non State Supported Debt, Cornell University, Series 2008C, 5.000%, 7/01/37 | 7/20 at 100.00 | Aa1 | | 1,600,464 | |
| | | | Dormitory Authority of the State of New York, Revenue Bonds, Rochester Institute of Technology, Series 2006A: | | | | | |
| | 775 | | 5.250%, 7/01/20 – AMBAC Insured | No Opt. Call | A1 | | 841,433 | |
| | 620 | | 5.250%, 7/01/21 – AMBAC Insured | No Opt. Call | A1 | | 669,972 | |
| | 3,545 | | Madison County Industrial Development Agency, New York, Civic Facility Revenue Bonds, Colgate University, Tender Option Bond Trust 3127, 13.041%, 1/01/14 – AMBAC Insured (IF) | No Opt. Call | AA+ | | 3,430,213 | |
| | 1,000 | | Nassau County Industrial Development Agency, New York, Revenue Refunding Bonds, Hofstra University, Series 1998, 5.000%, 7/01/23 – NPFG Insured | 7/11 at 100.00 | A | | 1,001,770 | |
| | 7,250 | | New York City Industrial Development Agency, New York, Civic Facility Revenue Bonds, Horace Mann School, Series 1998, 5.000%, 7/01/28 – NPFG Insured | 7/11 at 100.00 | Baa1 | | 7,195,625 | |
| | | Nuveen New York Select Quality Municipal Fund, Inc. (continued) |
| NVN | | Portfolio of Investments |
March 31, 2011 (Unaudited)
| | Principal | | | Optional Call | | | | |
| | Amount (000) | | Description (1) | Provisions (2) | Ratings (3) | | Value | |
| | | | Education and Civic Organizations (continued) | | | | | |
| $ | 800 | | New York City Industrial Development Agency, New York, Payment in Lieu of Taxes Revenue Bonds, Queens Baseball Stadium Project, Series 2009, 6.375%, 1/01/39 – AGC Insured | 1/19 at 100.00 | AA+ | $ | 821,520 | |
| | | | New York City Industrial Development Agency, New York, PILOT Revenue Bonds, Queens Baseball Stadium Project, Series 2006: | | | | | |
| | 2,000 | | 5.000%, 1/01/36 – AMBAC Insured | 1/17 at 100.00 | BB+ | | 1,661,860 | |
| | 3,200 | | 5.000%, 1/01/46 – AMBAC Insured | 1/17 at 100.00 | BB+ | | 2,565,088 | |
| | 1,905 | | New York City Industrial Development Agency, New York, Revenue Bonds, Yankee Stadium Project PILOT, Series 2009A, 7.000%, 3/01/49 – AGC Insured | 3/19 at 100.00 | AA+ | | 2,046,980 | |
| | | | New York City Industrial Development Authority, New York, PILOT Revenue Bonds, Yankee Stadium Project, Series 2006: | | | | | |
| | 1,195 | | 5.000%, 3/01/31 – FGIC Insured | 9/16 at 100.00 | BBB– | | 1,098,097 | |
| | 9,735 | | 5.000%, 3/01/36 – NPFG Insured | 9/16 at 100.00 | Baa1 | | 8,366,259 | |
| | 5,830 | | 4.500%, 3/01/39 – FGIC Insured | 9/16 at 100.00 | BBB– | | 4,523,147 | |
| | 2,000 | | New York City Trust for Cultural Resources, New York, Revenue Bonds, American Museum of Natural History, Series 2004A, 5.000%, 7/01/36 – NPFG Insured | 7/14 at 100.00 | AA | | 1,945,320 | |
| | 1,390 | | Tompkins County Development Corporation, New York, Revenue Bonds, Ithaca College, Series 2011, 5.500%, 7/01/33 (WI/DD, Settling 4/07/11) – AGM Insured | 1/21 at 100.00 | A2 | | 1,422,526 | |
| | 1,100 | | Troy Capital Resource Corporation, New York, Revenue Bonds, Rensselaer Polytechnic Institute, Series 2010A, 5.125%, 9/01/40 | 9/20 at 100.00 | A | | 1,007,303 | |
| | 84,655 | | Total Education and Civic Organizations | | | | 80,374,612 | |
| | | | Health Care – 16.6% (10.5% of Total Investments) | | | | | |
| | 2,660 | | Albany Capital Resource Corporation, New York, St. Peter’s Hospital Project, Series 2011, 6.125%, 11/15/30 | 11/20 at 100.00 | BBB+ | | 2,655,265 | |
| | 810 | | Dormitory Authority of the State of New York, FHA-Insured Mortgage Hospital Revenue Bonds, Hospital for Special Surgery, Series 2009, 6.250%, 8/15/34 | 8/19 at 100.00 | AAA | | 896,314 | |
| | 5,730 | | Dormitory Authority of the State of New York, FHA-Insured Mortgage Hospital Revenue Bonds, Montefiore Medical Center, Series 1999, 5.500%, 8/01/38 – AMBAC Insured | 8/11 at 100.00 | N/R | | 5,641,930 | |
| | 2,300 | | Dormitory Authority of the State of New York, FHA-Insured Mortgage Revenue Bonds, Hudson Valley Hospital Center, Series 2007, 5.000%, 8/15/27 – AGM Insured | 8/17 at 100.00 | AA+ | | 2,333,695 | |
| | 2,655 | | Dormitory Authority of the State of New York, FHA-Insured Mortgage Revenue Bonds, Montefiore Hospital, Series 2004, 5.000%, 8/01/29 – FGIC Insured | 2/15 at 100.00 | BBB | | 2,623,432 | |
| | 1,000 | | Dormitory Authority of the State of New York, FHA-Insured Revenue Bonds, Montefiore Medical Center, Series 2005, 5.000%, 2/01/22 – FGIC Insured | 2/15 at 100.00 | BBB | | 1,017,930 | |
| | 6,430 | | Dormitory Authority of the State of New York, Hospital Revenue Bonds, Catholic Health Services of Long Island Obligated Group – St. Francis Hospital, Series 1999A, 5.500%, 7/01/24 – NPFG Insured | 7/11 at 100.00 | A3 | | 6,433,922 | |
| | | | Dormitory Authority of the State of New York, Revenue Bonds, Health Quest System Inc., Series 2007B: | | | | | |
| | 1,000 | | 5.250%, 7/01/27 – AGC Insured | 7/17 at 100.00 | AA+ | | 1,007,330 | |
| | 825 | | 5.125%, 7/01/37 – AGC Insured | 7/17 at 100.00 | AA+ | | 777,851 | |
| | | | Dormitory Authority of the State of New York, Revenue Bonds, Memorial Sloan-Kettering Cancer Center, Series 2003-1: | | | | | |
| | 2,500 | | 5.000%, 7/01/21 – NPFG Insured | 7/13 at 100.00 | AA | | 2,567,000 | |
| | 3,210 | | 5.000%, 7/01/22 – NPFG Insured | 7/13 at 100.00 | AA | | 3,338,015 | |
| | 2,705 | | Dormitory Authority of the State of New York, Revenue Bonds, New York and Presbyterian Hospital, Series 2004A, 5.250%, 8/15/15 – AGM Insured | 8/14 at 100.00 | AA+ | | 2,893,079 | |
| | 2,120 | | Dormitory Authority of the State of New York, Revenue Bonds, The New York and Presbyterian Hospital Project, Series 2007, 5.000%, 8/15/36 – AGM Insured | 8/14 at 100.00 | AA+ | | 2,014,678 | |
| | 12,020 | | Dormitory Authority of the State of New York, Revenue Bonds, Winthrop South Nassau University Health System Obligated Group, Series 2001A, 5.250%, 7/01/26 – AMBAC Insured | 7/11 at 101.00 | N/R | | 11,609,155 | |
| | 2,025 | | Dormitory Authority of the State of New York, Revenue Bonds, Winthrop South Nassau University Health System Obligated Group, Series 2001B, 5.250%, 7/01/31 – AMBAC Insured | 7/11 at 101.00 | Baa1 | | 1,881,731 | |
| | Principal | | | Optional Call | | | | |
| | Amount (000) | | Description (1) | Provisions (2) | Ratings (3) | | Value | |
| | | | Health Care (continued) | | | | | |
| | | | New York City Health and Hospitals Corporation, New York, Health System Revenue Bonds, Series 2003A: | | | | | |
| $ | 2,800 | | 5.250%, 2/15/21 – AMBAC Insured | 2/13 at 100.00 | Aa3 | $ | 2,881,788 | |
| | 3,065 | | 5.250%, 2/15/22 – AMBAC Insured | 2/13 at 100.00 | Aa3 | | 3,174,390 | |
| | 1,320 | | Westchester County Health Care Corporation, New York, Senior Lien Revenue Bonds, Series 2010-C2, 6.125%, 11/01/37 | 11/20 at 100.00 | A3 | | 1,290,300 | |
| | 55,175 | | Total Health Care | | | | 55,037,805 | |
| | | | Housing/Multifamily – 4.2% (2.7% of Total Investments) | | | | | |
| | | | New York City Housing Development Corporation, New York, Capital Fund Program Revenue Bonds, Series 2005A: | | | | | |
| | 1,470 | | 5.000%, 7/01/14 – FGIC Insured | No Opt. Call | AA+ | | 1,606,357 | |
| | 1,470 | | 5.000%, 7/01/16 – FGIC Insured | 7/15 at 100.00 | AA+ | | 1,600,830 | |
| | 5,445 | | 5.000%, 7/01/25 – NPFG Insured (UB) | 7/15 at 100.00 | AA+ | | 5,541,485 | |
| | 1,421 | | New York City Housing Development Corporation, New York, Multifamily Housing Revenue Bonds, Pass-Through Certificates, Series 1991C, 6.500%, 2/20/19 – AMBAC Insured | 4/11 at 105.00 | N/R | | 1,495,391 | |
| | 540 | | New York City Housing Development Corporation, New York, Multifamily Housing Revenue Bonds, Seaview Towers, Series 2006A, 4.750%, 7/15/39 – AMBAC Insured (Alternative Minimum Tax) | 1/17 at 100.00 | AAA | | 480,071 | |
| | 3,000 | | New York State Housing Finance Agency, Affordable Housing Revenue Bonds, Series 2007B, 5.300%, 11/01/37 (Alternative Minimum Tax) | 11/17 at 100.00 | Aa2 | | 2,813,220 | |
| | | | New York State Housing Finance Agency, Mortgage Revenue Refunding Bonds, Housing Project, Series 1996A: | | | | | |
| | 55 | | 6.100%, 11/01/15 – AGM Insured | 5/11 at 100.00 | AA+ | | 55,233 | |
| | 200 | | 6.125%, 11/01/20 – AGM Insured | 5/11 at 100.00 | AA+ | | 200,218 | |
| | 13,601 | | Total Housing/Multifamily | | | | 13,792,805 | |
| | | | Long-Term Care – 1.8% (1.1% of Total Investments) | | | | | |
| | | | Dormitory Authority of the State of New York, FHA-Insured Nursing Home Mortgage Revenue Bonds, Norwegian Christian Home and Health Center, Series 2001: | | | | | |
| | 5,085 | | 5.200%, 8/01/36 – NPFG Insured | 8/11 at 101.00 | Baa1 | | 4,824,190 | |
| | 1,000 | | 6.100%, 8/01/41 – NPFG Insured | 8/11 at 105.00 | Baa1 | | 1,062,400 | |
| | 6,085 | | Total Long-Term Care | | | | 5,886,590 | |
| | | | Tax Obligation/General – 8.5% (5.4% of Total Investments) | | | | | |
| | 1,500 | | Erie County, New York, General Obligation Bonds, Series 2003A, 5.250%, 3/15/16 – NPFG Insured | 3/13 at 100.00 | A2 | | 1,589,865 | |
| | 745 | | Erie County, New York, General Obligation Bonds, Series 2004B, 5.250%, 4/01/13 – NPFG Insured | No Opt. Call | A2 | | 793,649 | |
| | 2,000 | | Erie County, New York, General Obligation Bonds, Series 2005A, 5.000%, 12/01/18 – NPFG Insured | 12/15 at 100.00 | A2 | | 2,106,460 | |
| | 600 | | New York City, New York, General Obligation Bonds, Fiscal 2009 Series E, 5.000%, 8/01/28 | 8/19 at 100.00 | AA | | 614,124 | |
| | | | New York City, New York, General Obligation Bonds, Fiscal Series 1998H: | | | | | |
| | 85 | | 5.125%, 8/01/25 – NPFG Insured | 6/11 at 100.00 | AA | | 85,217 | |
| | 70 | | 5.375%, 8/01/27 – NPFG Insured | 6/11 at 100.00 | AA | | 70,158 | |
| | 2,900 | | New York City, New York, General Obligation Bonds, Fiscal Series 2005J, 5.000%, 3/01/19 – FGIC Insured | 3/15 at 100.00 | AA | | 3,074,290 | |
| | | | New York City, New York, General Obligation Bonds: | | | | | |
| | 3,250 | | 5.000%, 11/01/19 – AGM Insured (UB) | 11/14 at 100.00 | AA+ | | 3,419,910 | |
| | 1,650 | | 5.000%, 11/01/20 – AGM Insured (UB) | 11/14 at 100.00 | AA+ | | 1,726,395 | |
| | | | Rensselaer County, New York, General Obligation Bonds, Series 1991: | | | | | |
| | 960 | | 6.700%, 2/15/16 – AMBAC Insured | No Opt. Call | AA– | | 1,147,738 | |
| | 960 | | 6.700%, 2/15/17 – AMBAC Insured | No Opt. Call | AA– | | 1,167,082 | |
| | 960 | | 6.700%, 2/15/18 – AMBAC Insured | No Opt. Call | AA– | | 1,179,264 | |
| | 960 | | 6.700%, 2/15/19 – AMBAC Insured | No Opt. Call | AA– | | 1,194,566 | |
| | 960 | | 6.700%, 2/15/20 – AMBAC Insured | No Opt. Call | AA– | | 1,196,746 | |
| | 747 | | 6.700%, 2/15/21 – AMBAC Insured | No Opt. Call | AA– | | 939,704 | |
| | | Nuveen New York Select Quality Municipal Fund, Inc. (continued) |
| NVN | | Portfolio of Investments |
March 31, 2011 (Unaudited)
| | Principal | | | Optional Call | | | | |
| | Amount (000) | | Description (1) | Provisions (2) | Ratings (3) | | Value | |
| | | | Tax Obligation/General (continued) | | | | | |
| | | | Rochester, New York, General Obligation Bonds, Series 1999: | | | | | |
| $ | 735 | | 5.250%, 10/01/20 – NPFG Insured | No Opt. Call | Aa3 | $ | 817,585 | |
| | 735 | | 5.250%, 10/01/21 – NPFG Insured | No Opt. Call | Aa3 | | 815,806 | |
| | 730 | | 5.250%, 10/01/22 – NPFG Insured | No Opt. Call | Aa3 | | 807,920 | |
| | 730 | | 5.250%, 10/01/23 – NPFG Insured | No Opt. Call | Aa3 | | 799,708 | |
| | 730 | | 5.250%, 10/01/24 – NPFG Insured | No Opt. Call | Aa3 | | 797,102 | |
| | 730 | | 5.250%, 10/01/25 – NPFG Insured | No Opt. Call | Aa3 | | 793,379 | |
| | 725 | | 5.250%, 10/01/26 – NPFG Insured | No Opt. Call | Aa3 | | 785,632 | |
| | 2,190 | | Yonkers, New York, General Obligation Bonds, Series 2005B, 5.000%, 8/01/19 – NPFG Insured | 8/15 at 100.00 | A2 | | 2,259,686 | |
| | 25,652 | | Total Tax Obligation/General | | | | 28,181,986 | |
| | | | Tax Obligation/Limited – 53.9% (34.1% of Total Investments) | | | | | |
| | 7,145 | | Dormitory Authority of the State of New York, Insured Revenue Bonds, Special Act School District Program, Series 1999, 5.750%, 7/01/19 – NPFG Insured | 7/11 at 100.00 | Baa1 | | 7,204,661 | |
| | 3,610 | | Dormitory Authority of the State of New York, Revenue Bonds, Department of Health, Series 2004-2, 5.000%, 7/01/20 – FGIC Insured | 7/14 at 100.00 | AA– | | 3,775,374 | |
| | | | Dormitory Authority of the State of New York, Revenue Bonds, Mental Health Services Facilities Improvements, Series 2005D-1: | | | | | |
| | 670 | | 5.000%, 2/15/15 – FGIC Insured | No Opt. Call | AA– | | 737,710 | |
| | 1,715 | | 5.000%, 8/15/23 – FGIC Insured | 2/15 at 100.00 | AA– | | 1,756,023 | |
| | 7,925 | | Dormitory Authority of the State of New York, Revenue Bonds, School Districts Financing Program, Series 2002D, 5.250%, 10/01/23 – NPFG Insured | 10/12 at 100.00 | A+ | | 8,193,024 | |
| | 1,090 | | Dormitory Authority of the State of New York, State Personal Income Tax Revenue Bonds, Series 2005F, 5.000%, 3/15/21 – AGM Insured | 3/15 at 100.00 | AAA | | 1,141,306 | |
| | 3,300 | | Erie County Industrial Development Agency, New York, School Facility Revenue Bonds, Buffalo City School District Project, Series 2009A, 5.000%, 5/01/31 | No Opt. Call | AA– | | 3,291,552 | |
| | | | Erie County Industrial Development Agency, New York, School Facility Revenue Bonds, Buffalo City School District, Series 2003: | | | | | |
| | 1,230 | | 5.750%, 5/01/20 – AGM Insured | 5/12 at 100.00 | AA+ | | 1,277,048 | |
| | 1,225 | | 5.750%, 5/01/22 – AGM Insured | 5/12 at 100.00 | AA+ | | 1,266,724 | |
| | 1,700 | | Erie county Industrial Development Agency, New York, School Facility Revenue Bonds, Buffalo City School District Project, Series 2004, 5.750%, 5/01/26 – AGM Insured (UB) | 5/14 at 100.00 | AA+ | | 1,732,827 | |
| | 2,390 | | Erie county Industrial Development Agency, New York, School Facility Revenue Bonds, Buffalo City School District Project, Series 2008A, 5.750%, 5/01/28 – AGM Insured (UB) | 5/18 at 100.00 | AA+ | | 2,573,146 | |
| | 7,545 | | Erie County Industrial Development Agency, New York, School Facility Revenue Bonds, Buffalo City School District, 5.750%, 5/01/28 – AGM Insured (UB) | 5/17 at 100.00 | AA+ | | 8,052,024 | |
| | 14,405 | | Hudson Yards Infrastructure Corporation, New York, Revenue Bonds, Series 2006A, 5.000%, 2/15/47 – FGIC Insured | 2/17 at 100.00 | A | | 11,820,454 | |
| | 7,500 | | Metropolitan Transportation Authority, New York, Dedicated Tax Fund Bonds, Series 2002A, 5.250%, 11/15/25 – AGM Insured | 11/12 at 100.00 | AA+ | | 7,719,675 | |
| | 4,600 | | Metropolitan Transportation Authority, New York, State Service Contract Bonds, Series 2002B, 5.500%, 7/01/18 – NPFG Insured | 7/12 at 100.00 | AA– | | 4,825,446 | |
| | | | Metropolitan Transportation Authority, New York, State Service Contract Refunding Bonds, Series 2002A: | | | | | |
| | 3,000 | | 5.500%, 1/01/19 – NPFG Insured | 7/12 at 100.00 | AA– | | 3,143,370 | |
| | 5,000 | | 5.500%, 1/01/20 – NPFG Insured | 7/12 at 100.00 | AA– | | 5,235,450 | |
| | 2,375 | | 5.000%, 7/01/25 – FGIC Insured | 7/12 at 100.00 | AA– | | 2,379,085 | |
| | 4,050 | | 5.000%, 7/01/30 – AMBAC Insured | 7/12 at 100.00 | AA– | | 3,913,637 | |
| | 2,000 | | Metropolitan Transportation Authority, New York, State Service Contract Refunding Bonds, Series 2008, 5.750%, 7/01/18 – AGM Insured (UB) | No Opt. Call | AA+ | | 2,300,480 | |
| | Principal | | | Optional Call | | | | |
| | Amount (000) | | Description (1) | Provisions (2) | Ratings (3) | | Value | |
| | | | Tax Obligation/Limited (continued) | | | | | |
| | | | Nassau County Interim Finance Authority, New York, Sales Tax Secured Revenue Bonds, Series 2003A: | | | | | |
| $ | 4,000 | | 5.000%, 11/15/18 – AMBAC Insured | 11/13 at 100.00 | AAA | $ | 4,281,960 | |
| | 1,560 | | 4.750%, 11/15/21 – AMBAC Insured | 11/13 at 100.00 | AAA | | 1,607,408 | |
| | 1,560 | | 4.750%, 11/15/22 – AMBAC Insured | 11/13 at 100.00 | AAA | | 1,602,120 | |
| | | | New York City Sales Tax Asset Receivable Corporation, New York, Dedicated Revenue Bonds, Local Government Assistance Corporation, Series 2004A: | | | | | |
| | 3,640 | | 5.000%, 10/15/25 – NPFG Insured (UB) | 10/14 at 100.00 | AAA | | 3,796,775 | |
| | 1,960 | | 5.000%, 10/15/26 – NPFG Insured (UB) | 10/14 at 100.00 | AAA | | 2,050,121 | |
| | 5,420 | | 5.000%, 10/15/29 – AMBAC Insured (UB) | 10/14 at 100.00 | AAA | | 5,512,086 | |
| | 1,500 | | 5.000%, 10/15/32 – AMBAC Insured (UB) | 10/14 at 100.00 | AAA | | 1,512,300 | |
| | 5,600 | | New York City Transitional Finance Authority, New York, Building Aid Revenue Bonds, Fiscal Series 2007S-2, 5.000%, 1/15/28 – FGIC Insured | 1/17 at 100.00 | AA– | | 5,659,864 | |
| | 3,160 | | New York City Transitional Finance Authority, New York, Future Tax Secured Bonds, Fiscal Series 2003E, 5.250%, 2/01/22 – NPFG Insured | 2/13 at 100.00 | AAA | | 3,316,420 | |
| | 2,000 | | New York City Transitional Finance Authority, New York, Future Tax Secured Bonds, Fiscal Series 2004C, 5.000%, 2/01/19 – SYNCORA GTY Insured | 2/14 at 100.00 | AAA | | 2,154,500 | |
| | 3,800 | | New York City Transitional Finance Authority, New York, Future Tax Secured Bonds, Fiscal Series 2007B, 5.000%, 11/01/30 | 5/17 at 100.00 | AAA | | 3,846,512 | |
| | 3,500 | | New York City Transitional Finance Authority, New York, Future Tax Secured Refunding Bonds, Fiscal Series 2003D, 5.000%, 2/01/22 – NPFG Insured | 2/13 at 100.00 | AAA | | 3,664,710 | |
| | 4,000 | | New York City Transitional Finance Authority, New York, Future Tax Secured Revenue Bonds, Subordinate Lien Series 2011C, 5.500%, 11/01/35 | 11/20 at 100.00 | AAA | | 4,186,280 | |
| | 1,660 | | New York City, New York, Educational Construction Fund, Revenue Bonds, Series 2011A, 5.750%, 4/01/33 – AGM Insured | 4/21 at 100.00 | AA+ | | 1,726,549 | |
| | | | New York Convention Center Development Corporation, Hotel Fee Revenue Bonds, Tender Option Bonds Trust 3095: | | | | | |
| | 835 | | 13.359%, 11/15/30 – AMBAC Insured (IF) | 11/15 at 100.00 | AA+ | | 873,552 | |
| | 3,955 | | 13.345%, 11/15/44 – AMBAC Insured (IF) | 11/15 at 100.00 | AA+ | | 3,699,072 | |
| | | | New York State Municipal Bond Bank Agency, Buffalo, Special Program Revenue Bonds, Series 2001A: | | | | | |
| | 875 | | 5.125%, 5/15/19 – AMBAC Insured | 5/11 at 100.00 | A1 | | 878,308 | |
| | 920 | | 5.125%, 5/15/20 – AMBAC Insured | 5/11 at 100.00 | A1 | | 923,312 | |
| | 965 | | 5.250%, 5/15/21 – AMBAC Insured | 5/11 at 100.00 | A1 | | 969,613 | |
| | 1,015 | | 5.250%, 5/15/22 – AMBAC Insured | 5/11 at 100.00 | A1 | | 1,018,816 | |
| | 1,000 | | New York State Thruway Authority, Highway and Bridge Trust Fund Bonds, Second General, Series 2004A, 5.000%, 4/01/22 – NPFG Insured | 4/14 at 100.00 | AA | | 1,062,620 | |
| | | | New York State Thruway Authority, Highway and Bridge Trust Fund Bonds, Second General, Series 2005B: | | | | | |
| | 8,455 | | 5.500%, 4/01/20 – AMBAC Insured | No Opt. Call | AA | | 9,686,216 | |
| | 1,500 | | 5.000%, 4/01/21 – AMBAC Insured | 10/15 at 100.00 | AA | | 1,555,965 | |
| | 1,000 | | New York State Thruway Authority, State Personal Income Tax Revenue Bonds, Series 2004A, 5.000%, 3/15/24 – AMBAC Insured | 9/14 at 100.00 | AAA | | 1,048,670 | |
| | 1,600 | | New York State Thruway Authority, State Personal Income Tax Revenue Bonds, Series 2010A, 5.000%, 3/15/29 | 9/20 at 100.00 | AAA | | 1,647,968 | |
| | | | New York State Tobacco Settlement Financing Corporation, Tobacco Settlement Asset-Backed and State Contingency Contract-Backed Bonds, Series 2003A-1: | | | | | |
| | 11,100 | | 5.250%, 6/01/20 – AMBAC Insured | 6/13 at 100.00 | AA– | | 11,593,061 | |
| | 1,000 | | 5.250%, 6/01/21 – AMBAC Insured | 6/13 at 100.00 | AA– | | 1,024,370 | |
| | 4,565 | | 5.250%, 6/01/22 – AMBAC Insured | 6/13 at 100.00 | AA– | | 4,707,702 | |
| | 500 | | New York State Urban Development Corporation, State Personal Income Tax Revenue Bonds, Series 2005B, 5.000%, 3/15/30 – AGM Insured | 3/15 at 100.00 | AAA | | 505,975 | |
| | | Nuveen New York Select Quality Municipal Fund, Inc. (continued) |
| NVN | | Portfolio of Investments |
March 31, 2011 (Unaudited)
| | Principal | | | Optional Call | | | | |
| | Amount (000) | | Description (1) | Provisions (2) | Ratings (3) | | Value | |
| | | | Tax Obligation/Limited (continued) | | | | | |
| $ | 4,000 | | Puerto Rico Highway and Transportation Authority, Highway Revenue Refunding Bonds, Series 2002E, 5.500%, 7/01/18 – AGM Insured | No Opt. Call | AA+ | $ | 4,305,000 | |
| | 2,500 | | Puerto Rico Sales Tax Financing Corporation, Sales Tax Revenue Bonds, First Subordinate Series 2010A, 5.000%, 8/01/40 – AGM Insured | 2/20 at 100.00 | AA+ | | 2,271,625 | |
| | 1,175 | | Puerto Rico Sales Tax Financing Corporation, Sales Tax Revenue Bonds, First Subordinate Series 2010C, 5.125%, 8/01/42 – AGM Insured | 8/20 at 100.00 | AA+ | | 1,081,552 | |
| | 3,715 | | Syracuse Industrial Development Authority, New York, PILOT Mortgage Revenue Bonds, Carousel Center Project, Series 2007A, 5.000%, 1/01/36 – SYNCORA GTY Insured (Alternative Minimum Tax) | 1/17 at 100.00 | BBB– | | 2,725,138 | |
| | 176,510 | | Total Tax Obligation/Limited | | | | 178,835,156 | |
| | | | Transportation – 11.0% (7.0% of Total Investments) | | | | | |
| | | | Metropolitan Transportation Authority, New York, Transportation Revenue Bonds, Series 2005A: | | | | | |
| | 1,900 | | 4.750%, 11/15/27 – NPFG Insured | 11/15 at 100.00 | AA+ | | 1,861,411 | |
| | 4,000 | | 4.750%, 11/15/30 – AMBAC Insured | 11/15 at 100.00 | A | | 3,703,480 | |
| | | | Metropolitan Transportation Authority, New York, Transportation Revenue Refunding Bonds, Series 2002A: | | | | | |
| | 6,000 | | 5.500%, 11/15/18 – AMBAC Insured | 11/12 at 100.00 | A | | 6,336,300 | |
| | 2,000 | | 5.125%, 11/15/22 – FGIC Insured | 11/12 at 100.00 | A | | 2,047,460 | |
| | | | Metropolitan Transportation Authority, New York, Transportation Revenue Refunding Bonds, Series 2002E: | | | | | |
| | 1,335 | | 5.500%, 11/15/21 – NPFG Insured | 11/12 at 100.00 | A | | 1,389,935 | |
| | 4,575 | | 5.000%, 11/15/25 – NPFG Insured | 11/12 at 100.00 | A | | 4,581,085 | |
| | 955 | | New York State Thruway Authority, General Revenue Bonds, Refunding Series 2007H, 5.000%, 1/01/25 – FGIC Insured | 1/18 at 100.00 | A+ | | 983,870 | |
| | | | New York State Thruway Authority, General Revenue Bonds, Series 2005F: | | | | | |
| | 2,625 | | 5.000%, 1/01/20 – AMBAC Insured | 1/15 at 100.00 | A+ | | 2,713,935 | |
| | 425 | | 5.000%, 1/01/30 – AMBAC Insured | 1/15 at 100.00 | A+ | | 423,687 | |
| | 1,650 | | New York State Thruway Authority, General Revenue Bonds, Series 2005G, 5.000%, 1/01/30 – AGM Insured (UB) | 7/15 at 100.00 | AA+ | | 1,653,317 | |
| | 2,500 | | Niagara Frontier Airport Authority, New York, Airport Revenue Bonds, Buffalo Niagara International Airport, Series 1999A, 5.625%, 4/01/29 – NPFG Insured (Alternative Minimum Tax) | 10/11 at 100.00 | Baa1 | | 2,433,850 | |
| | 1,675 | | Port Authority of New York and New Jersey, Consolidated Revenue Bonds, One Hundred Fortieth Series 2005, 5.000%, 12/01/31 – SYNCORA GTY Insured | 6/15 at 101.00 | Aa2 | | 1,678,853 | |
| | 1,170 | | Port Authority of New York and New Jersey, Consolidated Revenue Bonds, One Hundred Forty Eighth Series 2008, Trust 2920, 17.512%, 8/15/32 – AGM Insured (IF) | 8/17 at 100.00 | AA+ | | 1,154,509 | |
| | | | Triborough Bridge and Tunnel Authority, New York, Subordinate Lien General Purpose Revenue Refunding Bonds, Series 2002E: | | | | | |
| | 1,570 | | 5.500%, 11/15/20 – NPFG Insured | No Opt. Call | Aa3 | | 1,783,222 | |
| | 3,800 | | 5.250%, 11/15/22 – NPFG Insured | 11/12 at 100.00 | Aa3 | | 3,928,592 | |
| | 36,180 | | Total Transportation | | | | 36,673,506 | |
| | | | U.S. Guaranteed – 12.8% (8.1% of Total Investments) (4) | | | | | |
| | 505 | | Dormitory Authority of the State of New York, Suffolk County, Lease Revenue Bonds, Judicial Facilities, Series 1991A, 9.500%, 4/15/14 – FGIC Insured (ETM) | 4/11 at 104.42 | Baa1 (4) | | 617,953 | |
| | | | Longwood Central School District, Suffolk County, New York, Series 2000: | | | | | |
| | 1,000 | | 5.750%, 6/15/19 (Pre-refunded 6/15/11) – FGIC Insured | 6/11 at 101.00 | A1 (4) | | 1,020,360 | |
| | 1,000 | | 5.750%, 6/15/20 (Pre-refunded 6/15/11) – FGIC Insured | 6/11 at 101.00 | A1 (4) | | 1,020,360 | |
| | 4,695 | | Metropolitan Transportation Authority, New York, Commuter Facilities Revenue Bonds, Series 1998A, 5.250%, 7/01/28 (Pre-refunded 7/01/11) – FGIC Insured | 7/11 at 100.00 | N/R (4) | | 4,753,312 | |
| | 11,000 | | Metropolitan Transportation Authority, New York, Dedicated Tax Fund Bonds, Series 1998A, 4.750%, 4/01/28 (Pre-refunded 10/01/15) – FGIC Insured | 10/15 at 100.00 | AAA | | 12,619,747 | |
| | Principal | | | Optional Call | | | | |
| | Amount (000) | | Description (1) | Provisions (2) | Ratings (3) | | Value | |
| | | | U.S. Guaranteed (4) (continued) | | | | | |
| | | | Metropolitan Transportation Authority, New York, Dedicated Tax Fund Bonds, Series 1999A: | | | | | |
| $ | 4,000 | | 5.000%, 4/01/17 (Pre-refunded 10/01/14) – AGM Insured | 10/14 at 100.00 | AAA | $ | 4,554,880 | |
| | 3,250 | | 5.000%, 4/01/29 (Pre-refunded 10/01/14) – AGM Insured | 10/14 at 100.00 | AAA | | 3,700,840 | |
| | | | New York City Transitional Finance Authority, New York, Future Tax Secured Bonds, Fiscal Series 2002B: | | | | | |
| | 2,820 | | 5.250%, 5/01/16 (Pre-refunded 11/01/11) – NPFG Insured | 11/11 at 101.00 | AAA | | 2,928,880 | |
| | 1,000 | | 5.250%, 5/01/17 (Pre-refunded 11/01/11) – NPFG Insured | 11/11 at 101.00 | Aaa | | 1,038,610 | |
| | 6,750 | | New York City Transitional Finance Authority, New York, Future Tax Secured Bonds, Fiscal Series 2003C, 5.250%, 8/01/21 (Pre-refunded 8/01/12) – AMBAC Insured | 8/12 at 100.00 | AAA | | 7,183,485 | |
| | 3,000 | | New York State Thruway Authority, Highway and Bridge Trust Fund Bonds, Series 2002A, 5.250%, 4/01/19 (Pre-refunded 4/01/12) – AGM Insured | 4/12 at 100.00 | AAA | | 3,147,090 | |
| | 39,020 | | Total U.S. Guaranteed | | | | 42,585,517 | |
| | | | Utilities – 13.6% (8.6% of Total Investments) | | | | | |
| | 900 | | Guam Power Authority, Revenue Bonds, Series 2010A, 5.000%, 10/01/37 – AGM Insured | 10/20 at 100.00 | AA+ | | 791,568 | |
| | | | Long Island Power Authority, New York, Electric System General Revenue Bonds, Series 2000A: | | | | | |
| | 4,000 | | 0.000%, 6/01/24 – AGM Insured | No Opt. Call | AA+ | | 2,243,040 | |
| | 4,000 | | 0.000%, 6/01/25 – AGM Insured | No Opt. Call | AA+ | | 2,094,920 | |
| | 15,000 | | 0.000%, 6/01/26 – AGM Insured | No Opt. Call | AA+ | | 7,349,100 | |
| | 3,000 | | 0.000%, 6/01/27 – AGM Insured | No Opt. Call | AA+ | | 1,373,790 | |
| | 4,500 | | 0.000%, 6/01/28 – AGM Insured | No Opt. Call | AA+ | | 1,917,990 | |
| | 3,000 | | 0.000%, 6/01/29 – AGM Insured | No Opt. Call | AA+ | | 1,193,190 | |
| | 3,000 | | Long Island Power Authority, New York, Electric System General Revenue Bonds, Series 2001A, 5.000%, 9/01/27 – AGM Insured | 9/11 at 100.00 | AA+ | | 3,000,840 | |
| | | | Long Island Power Authority, New York, Electric System General Revenue Bonds, Series 2006A: | | | | | |
| | 6,010 | | 5.000%, 12/01/23 – FGIC Insured | 6/16 at 100.00 | A– | | 6,181,405 | |
| | 7,735 | | 5.000%, 12/01/25 – FGIC Insured | 6/16 at 100.00 | A– | | 7,886,065 | |
| | 4,000 | | 5.000%, 12/01/26 – AGC Insured | 6/16 at 100.00 | AA+ | | 4,056,040 | |
| | 750 | | Long Island Power Authority, New York, Electric System General Revenue Bonds, Series 2006B, 5.000%, 12/01/35 – CIFG Insured | 6/16 at 100.00 | A– | | 710,295 | |
| | 6,000 | | New York State Energy Research and Development Authority, Pollution Control Revenue Bonds, Rochester Gas and Electric Corporation, Series 1998A, 5.950%, 9/01/33 – NPFG Insured (Alternative Minimum Tax) | 9/11 at 100.00 | Baa1 | | 5,759,700 | |
| | 650 | | Power Authority of the State of New York, General Revenue Bonds, Series 2006A, 5.000%, 11/15/19 – FGIC Insured | 11/15 at 100.00 | Aa2 | | 689,117 | |
| | 62,545 | | Total Utilities | | | | 45,247,060 | |
| | | | Water and Sewer – 9.9% (6.3% of Total Investments) | | | | | |
| | 5,000 | | New York City Municipal Water Finance Authority, New York, Water and Sewer System Revenue Bonds, Second Generation Resolution, Fiscal 2010 Series 2009BB, 5.000%, 6/15/27 | 6/19 at 100.00 | AA+ | | 5,216,700 | |
| | 2,000 | | New York City Municipal Water Finance Authority, New York, Water and Sewer System Revenue Bonds, Second Generation Resolution, Series 2007AA, 5.000%, 6/15/37 | 6/17 at 100.00 | AA+ | | 1,933,240 | |
| | 5,920 | | New York City Municipal Water Finance Authority, New York, Water and Sewerage System Revenue Bonds, Fiscal Series 2005C, 5.000%, 6/15/27 – NPFG Insured (UB) | 6/15 at 100.00 | AAA | | 6,071,789 | |
| | 3,455 | | New York City Municipal Water Finance Authority, New York, Water and Sewerage System Revenue Bonds, Fiscal Series 2006B, 5.000%, 6/15/36 – NPFG Insured (UB) | 6/16 at 100.00 | AAA | | 3,360,644 | |
| | 3,000 | | New York City Municipal Water Finance Authority, New York, Water and Sewerage System Revenue Bonds, Fiscal Series 2004C, 5.000%, 6/15/35 – AMBAC Insured | 6/14 at 100.00 | AAA | | 2,931,810 | |
| | 5,000 | | New York City Municipal Water Finance Authority, New York, Water and Sewerage System Revenue Refunding Bonds, Fiscal Series 2003E, 5.000%, 6/15/34 | 6/13 at 100.00 | AAA | | 4,915,350 | |
| | | Nuveen New York Select Quality Municipal Fund, Inc. (continued) |
| NVN | | Portfolio of Investments |
March 31, 2011 (Unaudited)
| | Principal | | | Optional Call | | | | |
| | Amount (000) | | Description (1) | Provisions (2) | Ratings (3) | | Value | |
| | | | Water and Sewer (continued) | | | | | |
| $ | 7,100 | | Suffolk County Water Authority, New York, Waterworks Revenue Bonds, Series 2005C, 5.000%, 6/01/28 – NPFG Insured | 6/15 at 100.00 | AA+ | $ | 7,266,921 | |
| | 2,230 | | Upper Mohawk Valley Regional Water Finance Authority, New York, Water System Revenue Bonds, Series 2000, 0.000%, 4/01/23 – AMBAC Insured | No Opt. Call | A1 | | 1,239,435 | |
| | 33,705 | | Total Water and Sewer | | | | 32,935,889 | |
| $ | 533,128 | | Total Long-Term Investments (cost $517,540,792) – 156.5% (99.1% of Total Investments) | | | | 519,550,926 | |
| | | | Short-Term Investments – 1.5% (0.9% of Total Investments) | | | | | |
| | | | Tax Obligation/Limited – 1.5% (0.9% of Total Investments) | | | | | |
| $ | 4,950 | | Metropolitan Transportation Authority, New York, Dedicated Tax Fund Bonds, Variable Rate Demand Revenue Obligations, Series 2008A, 0.330%, 11/01/31 – AGM Insured (5) | 7/11 at 100.00 | A-1 | | 4,950,000 | |
| | | | Total Short-Term Investments (cost $4,950,000) | | | | 4,950,000 | |
| | | | Total Investments (cost $522,490,792) – 158.0% | | | | 524,500,926 | |
| | | | Floating Rate Obligation – (10.1)% | | | | (33,510,000 | ) |
| | | | Variable Rate Demand Preferred Shares, at Liquidation Value – (49.7)% (6) | | | | (164,800,000 | ) |
| | | | Other Assets Less Liabilities – 1.8% | | | | 5,705,193 | |
| | | | Net Assets Applicable to Common Shares – 100% | | | $ | 331,896,119 | |
| | | The Fund intends to invest at least 80% of its managed assets in municipal securities that are covered by insurance guaranteeing the timely payment of principal and interest. See Notes to Financial Statements, Footnote 1 – General Information and Significant Accounting Policies, Insurance for more information. |
| (1) | | All percentages shown in the Portfolio of Investments are based on net assets applicable to Common shares unless otherwise noted. |
| (2) | | Optional Call Provisions: Dates (month and year) and prices of the earliest optional call or redemption. There may be other call provisions at varying prices at later dates. Certain mortgage-backed securities may be subject to periodic principal paydowns. |
| (3) | | Ratings: Using the highest of Standard & Poor’s Group (“Standard & Poor’s”), Moody’s Investor Service, Inc. (“Moody’s”) or Fitch, Inc. (“Fitch”) rating. Ratings below BBB by Standard & Poor’s, Baa by Moody’s or BBB by Fitch are considered to be below investment grade. Holdings designated N/R are not rated by any of these national rating agencies. |
| (4) | | Backed by an escrow or trust containing sufficient U.S. Government or U.S. Government agency securities, which ensure the timely payment of principal and interest. Such investments are normally considered to be equivalent to AAA rated securities. |
| (5) | | Investment has a maturity of more than one year, but has variable rate and demand features which qualify it as a short- term investment. The rate disclosed is that in effect at the end of the reporting period. This rate changes periodically based on market conditions or a specified market index. |
| (6) | | Variable Rate Demand Preferred Shares, at Liquidation Value as a percentage of Total Investments is 31.4%. |
| N/R | | Not rated. |
| WI/DD | | Purchased on a when-issued or delayed delivery basis. |
| (ETM) | | Escrowed to maturity. |
| (IF) | | Inverse floating rate investment. |
| (UB) | | Underlying bond of an inverse floating rate trust reflected as a financing transaction. See Notes to Financial Statements, Footnote 1 – General Information and Significant Accounting Policies, Inverse Floating Rate Securities for more information. |
See accompanying notes to financial statements.
| | | Nuveen New York Quality Income Municipal Fund, Inc. |
| NUN | | Portfolio of Investments |
March 31, 2011 (Unaudited)
| | Principal | | | Optional Call | | | | |
| | Amount (000) | | Description (1) | Provisions (2) | Ratings (3) | | Value | |
| | | | Education and Civic Organizations – 24.7% (15.6% of Total Investments) | | | | | |
| $ | 4,815 | | Dormitory Authority of the State of New York, Consolidated Revenue Bonds, City University System, Series 1993A, 5.750%, 7/01/13 – NPFG Insured | No Opt. Call | Aa3 | $ | 5,051,320 | |
| | 1,000 | | Dormitory Authority of the State of New York, General Revenue Bonds, | No Opt. Call | AA– | | 1,037,220 | |
| | | | New York University, Series 2001-1, 5.500%, 7/01/40 – AMBAC Insured | | | | | |
| | 1,265 | | Dormitory Authority of the State of New York, Housing Revenue Bonds, Fashion Institute of Technology, Series 2007, 5.250%, 7/01/34 – FGIC Insured | No Opt. Call | BBB | | 1,137,260 | |
| | 670 | | Dormitory Authority of the State of New York, Insured Revenue Bonds, Fordham University, Series 2002, 5.000%, 7/01/19 – FGIC Insured | 7/12 at 100.00 | A2 | | 681,330 | |
| | 2,750 | | Dormitory Authority of the State of New York, Insured Revenue Bonds, Yeshiva University, Series 2001, 5.000%, 7/01/26 – AMBAC Insured | 7/11 at 100.00 | Aa3 | | 2,751,375 | |
| | 2,000 | | Dormitory Authority of the State of New York, Lease Revenue Bonds, State University Dormitory Facilities, Series 2003B, 5.250%, 7/01/32 (Mandatory put 7/01/13) – SYNCORA GTY Insured | No Opt. Call | Aa2 | | 2,159,020 | |
| | 2,320 | | Dormitory Authority of the State of New York, Lease Revenue Bonds, State University Dormitory Facilities, Series 2004A, 5.000%, 7/01/29 – NPFG Insured | 7/15 at 100.00 | Aa2 | | 2,338,374 | |
| | 2,830 | | Dormitory Authority of the State of New York, Lease Revenue Bonds, State University Dormitory Facilities, Series 2006A, 5.000%, 7/01/31 – NPFG Insured | 7/16 at 100.00 | Aa2 | | 2,822,642 | |
| | | | Dormitory Authority of the State of New York, Revenue Bonds, Barnard College, Series 2007A: | | | | | |
| | 1,000 | | 5.000%, 7/01/25 – FGIC Insured | 7/17 at 100.00 | BBB | | 1,017,640 | |
| | 745 | | 5.000%, 7/01/37 – FGIC Insured | 7/17 at 100.00 | BBB | | 689,617 | |
| | 1,800 | | Dormitory Authority of the State of New York, Revenue Bonds, Convent of the Sacred Heart, Series 2011, 5.750%, 11/01/40 – AGM Insured | 5/21 at 100.00 | AA+ | | 1,820,484 | |
| | 3,000 | | Dormitory Authority of the State of New York, Revenue Bonds, Fordham University, Series 2008B, 5.000%, 7/01/38 – AGC Insured | 7/18 at 100.00 | Aa3 | | 2,889,600 | |
| | 875 | | Dormitory Authority of the State of New York, Revenue Bonds, New School University, Series 2010, 5.250%, 7/01/30 | 7/20 at 100.00 | A– | | 878,430 | |
| | 1,005 | | Dormitory Authority of the State of New York, Revenue Bonds, New York University, Series 2007, 5.000%, 7/01/32 – AMBAC Insured | 7/17 at 100.00 | AA– | | 1,005,191 | |
| | 3,300 | | Dormitory Authority of the State of New York, Revenue Bonds, New York University, Series 2009A, 5.250%, 7/01/34 | 7/19 at 100.00 | AA– | | 3,313,959 | |
| | 3,750 | | Dormitory Authority of the State of New York, Revenue Bonds, New York University, Series 2009B, 5.000%, 7/01/39 | 7/19 at 100.00 | AA– | | 3,604,425 | |
| | | | Dormitory Authority of the State of New York, Revenue Bonds, Rochester Institute of Technology, Series 2006A: | | | | | |
| | 800 | | 5.250%, 7/01/20 – AMBAC Insured | No Opt. Call | A1 | | 868,576 | |
| | 640 | | 5.250%, 7/01/21 – AMBAC Insured | No Opt. Call | A1 | | 691,584 | |
| | 4,000 | | Dormitory Authority of the State of New York, Revenue Bonds, State University Educational Facilities, 1989 Resolution, Series 2000C, 5.750%, 5/15/16 – AGM Insured | No Opt. Call | AA+ | | 4,667,520 | |
| | 1,915 | | Dormitory Authority of the State of New York, Second General Resolution Consolidated Revenue Bonds, City University System, Series 1993A, 5.750%, 7/01/18 – AGM Insured | No Opt. Call | AA+ | | 2,181,721 | |
| | 705 | | Madison County Industrial Development Agency, New York, Civic Facility Revenue Bonds, Colgate University, Tender Option Bond Trust 3127, 13.041%, 1/01/14 – AMBAC Insured (IF) | No Opt. Call | AA+ | | 682,172 | |
| | 6,415 | | Nassau County Industrial Development Agency, New York, Revenue Refunding Bonds, Hofstra University, Series 1998, 5.000%, 7/01/23 – NPFG Insured | 7/11 at 100.00 | A | | 6,426,355 | |
| | 4,775 | | New York City Industrial Development Agency, New York, Civic Facility Revenue Bonds, Trinity Episcopal School, Series 1997, 5.250%, 6/15/27 – NPFG Insured | 6/11 at 100.00 | Baa1 | | 4,677,686 | |
| | | | New York City Industrial Development Agency, New York, PILOT Revenue Bonds, Queens Baseball Stadium Project, Series 2006: | | | | | |
| | 2,000 | | 5.000%, 1/01/36 – AMBAC Insured | 1/17 at 100.00 | BB+ | | 1,661,860 | |
| | 3,240 | | 5.000%, 1/01/46 – AMBAC Insured | 1/17 at 100.00 | BB+ | | 2,597,152 | |
| | | | New York City Industrial Development Authority, New York, PILOT Revenue Bonds, Yankee Stadium Project, Series 2006: | | | | | |
| | 1,215 | | 5.000%, 3/01/31 – FGIC Insured | 9/16 at 100.00 | BBB– | | 1,116,476 | |
| | 9,840 | | 5.000%, 3/01/36 – NPFG Insured | 9/16 at 100.00 | Baa1 | | 8,456,496 | |
| | 5,910 | | 4.500%, 3/01/39 – FGIC Insured | 9/16 at 100.00 | BBB– | | 4,585,214 | |
| | | Nuveen New York Quality Income Municipal Fund, Inc. (continued) |
| NUN | | Portfolio of Investments |
March 31, 2011 (Unaudited)
| | Principal | | | Optional Call | | | | |
| | Amount (000) | | Description (1) | Provisions (2) | Ratings (3) | | Value | |
| | | | Education and Civic Organizations (continued) | | | | | |
| $ | 6,250 | | New York City Trust for Cultural Resources, New York, Revenue Refunding Bonds, Museum of Modern Art, Series 1996A, 5.500%, 1/01/21 – AMBAC Insured | 7/11 at 100.00 | Aa2 | $ | 6,395,375 | |
| | 4,000 | | Tompkins County Development Corporation, New York, Revenue Bonds, Ithaca College, Series 2011, 5.375%, 7/01/41 (WI/DD, Settling 4/07/11) – AGM Insured | 1/21 at 100.00 | A2 | | 3,926,320 | |
| | 1,100 | | Troy Capital Resource Corporation, New York, Revenue Bonds, Rensselaer Polytechnic Institute, Series 2010A, 5.125%, 9/01/40 | 9/20 at 100.00 | A | | 1,007,303 | |
| | 85,930 | | Total Education and Civic Organizations | | | | 83,139,697 | |
| | | | Health Care – 15.3% (9.7% of Total Investments) | | | | | |
| | 2,655 | | Albany Capital Resource Corporation, New York, St. Peter’s Hospital Project, Series 2011, 6.125%, 11/15/30 | 11/20 at 100.00 | BBB+ | | 2,650,274 | |
| | 820 | | Dormitory Authority of the State of New York, FHA-Insured Mortgage Hospital Revenue Bonds, Hospital for Special Surgery, Series 2009, 6.250%, 8/15/34 | 8/19 at 100.00 | AAA | | 907,379 | |
| | 2,335 | | Dormitory Authority of the State of New York, FHA-Insured Mortgage Revenue Bonds, Hudson Valley Hospital Center, Series 2007, 5.000%, 8/15/27 – AGM Insured | 8/17 at 100.00 | AA+ | | 2,369,208 | |
| | 2,695 | | Dormitory Authority of the State of New York, FHA-Insured Mortgage Revenue Bonds, Montefiore Hospital, Series 2004, 5.000%, 8/01/29 – FGIC Insured | 2/15 at 100.00 | BBB | | 2,662,956 | |
| | 1,000 | | Dormitory Authority of the State of New York, FHA-Insured Revenue Bonds, Montefiore Medical Center, Series 2005, 5.000%, 2/01/22 – FGIC Insured | 2/15 at 100.00 | BBB | | 1,017,930 | |
| | 2,250 | | Dormitory Authority of the State of New York, FHA-Insured Revenue Bonds, St. Lukes Roosevelt Hospital, Series 2005, 4.900%, 8/15/31 | 8/15 at 100.00 | N/R | | 2,047,185 | |
| | 9,000 | | Dormitory Authority of the State of New York, Hospital Revenue Bonds, Catholic Health Services of Long Island Obligated Group – St. Francis Hospital, Series 1999A, 5.500%, 7/01/24 – NPFG Insured | 7/11 at 100.00 | A3 | | 9,005,490 | |
| | 1,800 | | Dormitory Authority of the State of New York, Revenue Bonds, Health Quest System Inc., Series 2007B, 5.125%, 7/01/37 – AGC Insured | 7/17 at 100.00 | AA+ | | 1,697,130 | |
| | | | Dormitory Authority of the State of New York, Revenue Bonds, Memorial Sloan-Kettering Cancer Center, Series 2003-1: | | | | | |
| | 2,500 | | 5.000%, 7/01/21 – NPFG Insured | 7/13 at 100.00 | AA | | 2,567,000 | |
| | 3,300 | | 5.000%, 7/01/22 – NPFG Insured | 7/13 at 100.00 | AA | | 3,431,604 | |
| | 2,525 | | Dormitory Authority of the State of New York, Revenue Bonds, New York and Presbyterian Hospital, Series 2004A, 5.250%, 8/15/15 – AGM Insured | 8/14 at 100.00 | AA+ | | 2,700,563 | |
| | 2,150 | | Dormitory Authority of the State of New York, Revenue Bonds, The New York and Presbyterian Hospital Project, Series 2007, 5.000%, 8/15/36 – AGM Insured | 8/14 at 100.00 | AA+ | | 2,043,188 | |
| | 9,000 | | Dormitory Authority of the State of New York, Revenue Bonds, Winthrop South Nassau University Health System Obligated Group, Series 2001B, 5.250%, 7/01/31 – AMBAC Insured | 7/11 at 101.00 | Baa1 | | 8,363,250 | |
| | 900 | | Dutchess County Local Development Corporation, New York, Revenue Bonds, Health Quest System Inc, Series 2010A, 5.750%, 7/01/40 – AGM Insured | 7/20 at 100.00 | A– | | 861,894 | |
| | 1,875 | | Monroe County Industrial Development Corporation, New York, FHA Insured Mortgage Revenue Bonds, Unity Hospital of Rochestor Project, Series 2010, 5.750%, 8/15/35 | 2/21 at 100.00 | Aa2 | | 1,996,781 | |
| | | | New York City Health and Hospitals Corporation, New York, Health System Revenue Bonds, Series 2003A: | | | | | |
| | 2,800 | | 5.250%, 2/15/21 – AMBAC Insured | 2/13 at 100.00 | Aa3 | | 2,881,788 | |
| | 3,065 | | 5.250%, 2/15/22 – AMBAC Insured | 2/13 at 100.00 | Aa3 | | 3,174,390 | |
| | 1,320 | | Westchester County Health Care Corporation, New York, Senior Lien Revenue Bonds, Series 2010-C2, 6.125%, 11/01/37 | 11/20 at 100.00 | A3 | | 1,290,300 | |
| | 51,990 | | Total Health Care | | | | 51,668,310 | |
| | | | Housing/Multifamily – 3.8% (2.4% of Total Investments) | | | | | |
| | | | New York City Housing Development Corporation, New York, Capital Fund Program Revenue Bonds, Series 2005A: | | | | | |
| | 1,500 | | 5.000%, 7/01/14 – FGIC Insured | No Opt. Call | AA+ | | 1,639,140 | |
| | 1,500 | | 5.000%, 7/01/16 – FGIC Insured | 7/15 at 100.00 | AA+ | | 1,633,500 | |
| | 5,515 | | 5.000%, 7/01/25 – NPFG Insured (UB) | 7/15 at 100.00 | AA+ | | 5,612,726 | |
| | Principal | | | Optional Call | | | | |
| | Amount (000) | | Description (1) | Provisions (2) | Ratings (3) | | Value | |
| | | | Housing/Multifamily (continued) | | | | | |
| $ | 1,182 | | New York City Housing Development Corporation, New York, Multifamily Housing Revenue Bonds, Pass-Through Certificates, Series 1991C, 6.500%, 2/20/19 – AMBAC Insured | 4/11 at 105.00 | N/R | $ | 1,243,667 | |
| | 560 | | New York City Housing Development Corporation, New York, Multifamily Housing Revenue Bonds, Seaview Towers, Series 2006A, 4.750%, 7/15/39 – AMBAC Insured (Alternative Minimum Tax) | 1/17 at 100.00 | AAA | | 497,851 | |
| | 675 | | New York City Housing Development Corporation, New York, Multifamily Housing Revenue Bonds, Series 2010-D1A, 5.000%, 11/01/42 | 5/20 at 100.00 | AA | | 638,165 | |
| | 1,685 | | New York State Housing Finance Agency, Affordable Housing Revenue Bonds, Series 2007B, 5.300%, 11/01/37 (Alternative Minimum Tax) | 11/17 at 100.00 | Aa2 | | 1,580,092 | |
| | 85 | | New York State Housing Finance Agency, Mortgage Revenue Refunding Bonds, Housing Project, Series 1996A, 6.125%, 11/01/20 – AGM Insured | 5/11 at 100.00 | AA+ | | 85,093 | |
| | 12,702 | | Total Housing/Multifamily | | | | 12,930,234 | |
| | | | Tax Obligation/General – 6.4% (4.1% of Total Investments) | | | | | |
| | 1,500 | | Erie County, New York, General Obligation Bonds, Series 2003A, 5.250%, 3/15/16 – NPFG Insured | 3/13 at 100.00 | A2 | | 1,589,865 | |
| | 805 | | Erie County, New York, General Obligation Bonds, Series 2004B, 5.250%, 4/01/13 – NPFG Insured | No Opt. Call | A2 | | 857,567 | |
| | | | Monroe County, New York, General Obligation Public Improvement Bonds, Series 2002: | | | | | |
| | 2,250 | | 5.000%, 3/01/15 – FGIC Insured | 3/12 at 100.00 | A3 | | 2,299,703 | |
| | 1,000 | | 5.000%, 3/01/17 – FGIC Insured | 3/12 at 100.00 | A3 | | 1,016,000 | |
| | | | New York City, New York, General Obligation Bonds, Fiscal Series 2001D: | | | | | |
| | 5 | | 5.250%, 8/01/15 – AGM Insured | 8/11 at 100.00 | AA+ | | 5,068 | |
| | 5 | | 5.000%, 8/01/16 – FGIC Insured | 8/11 at 100.00 | AA | | 5,067 | |
| | 4,130 | | New York City, New York, General Obligation Bonds, Fiscal Series 2005J, 5.000%, 3/01/19 – FGIC Insured | 3/15 at 100.00 | AA | | 4,378,213 | |
| | | | New York City, New York, General Obligation Bonds, Tender Option Bond Trust 1198: | | | | | |
| | 1,700 | | 5.000%, 11/01/19 – AGM Insured (UB) | 11/14 at 100.00 | AA+ | | 1,778,710 | |
| | 3,350 | | 5.000%, 11/01/20 – AGM Insured (UB) | 11/14 at 100.00 | AA+ | | 3,525,138 | |
| | | | Peru Central School District, Clinton County, New York, General Obligation Refunding Bonds, Series 2002B: | | | | | |
| | 1,845 | | 4.000%, 6/15/18 – FGIC Insured | 6/12 at 100.00 | A | | 1,859,908 | |
| | 1,915 | | 4.000%, 6/15/19 – FGIC Insured | 6/12 at 100.00 | A | | 1,923,847 | |
| | 2,305 | | Yonkers, New York, General Obligation Bonds, Series 2005B, 5.000%, 8/01/20 – NPFG Insured | 8/15 at 100.00 | A2 | | 2,356,056 | |
| | 20,810 | | Total Tax Obligation/General | | | | 21,595,142 | |
| | | | Tax Obligation/Limited – 54.6% (34.6% of Total Investments) | | | | | |
| | 3,045 | | Dormitory Authority of the State of New York, 853 Schools Program Insured Revenue Bonds, Harmony Heights School, Issue 1, Series 1999C, 5.500%, 7/01/18 – AMBAC Insured | 7/11 at 100.00 | N/R | | 3,069,999 | |
| | 130 | | Dormitory Authority of the State of New York, Improvement Revenue Bonds, Mental Health Services Facilities, Series 2000D, 5.250%, 8/15/30 – AGM Insured | 6/11 at 100.00 | AA+ | | 130,003 | |
| | | | Dormitory Authority of the State of New York, Lease Revenue Bonds, Madison-Oneida Board of Cooperative Educational Services, Series 2002: | | | | | |
| | 1,045 | | 5.250%, 8/15/20 – AGM Insured | 8/12 at 100.00 | AA+ | | 1,089,109 | |
| | 1,100 | | 5.250%, 8/15/21 – AGM Insured | 8/12 at 100.00 | AA+ | | 1,146,431 | |
| | 1,135 | | 5.250%, 8/15/22 – AGM Insured | 8/12 at 100.00 | AA+ | | 1,175,860 | |
| | 3,610 | | Dormitory Authority of the State of New York, Revenue Bonds, Department of Health, Series 2004-2, 5.000%, 7/01/20 – FGIC Insured | 7/14 at 100.00 | AA– | | 3,775,374 | |
| | | | Dormitory Authority of the State of New York, Revenue Bonds, Mental Health Services Facilities Improvements, Series 2005D-1: | | | | | |
| | 2,300 | | 5.000%, 2/15/15 – FGIC Insured | No Opt. Call | AA– | | 2,532,438 | |
| | 1,200 | | 5.000%, 8/15/23 – FGIC Insured | 2/15 at 100.00 | AA– | | 1,228,704 | |
| | 7,900 | | Dormitory Authority of the State of New York, Revenue Bonds, School Districts Financing Program, Series 2002D, 5.250%, 10/01/23 – NPFG Insured | 10/12 at 100.00 | A+ | | 8,167,178 | |
| | 1,040 | | Dormitory Authority of the State of New York, State Personal Income Tax Revenue Bonds, Series 2005F, 5.000%, 3/15/21 – AGM Insured | 3/15 at 100.00 | AAA | | 1,088,953 | |
| | 3,300 | | Erie County Industrial Development Agency, New York, School Facility Revenue Bonds, Buffalo City School District Project, Series 2009A, 5.000%, 5/01/31 | No Opt. Call | AA– | | 3,291,552 | |
| | | Nuveen New York Quality Income Municipal Fund, Inc. (continued) |
| NUN | | Portfolio of Investments |
March 31, 2011 (Unaudited)
| | Principal | | | Optional Call | | | | |
| | Amount (000) | | Description (1) | Provisions (2) | Ratings (3) | | Value | |
| | | | Tax Obligation/Limited (continued) | | | | | |
| | | | Erie County Industrial Development Agency, New York, School Facility Revenue Bonds, Buffalo City School District, Series 2003: | | | | | |
| $ | 1,200 | | 5.750%, 5/01/20 – AGM Insured | 5/12 at 100.00 | AA+ | $ | 1,245,900 | |
| | 1,000 | | 5.750%, 5/01/22 – AGM Insured | 5/12 at 100.00 | AA+ | | 1,034,060 | |
| | 1,710 | | Erie county Industrial Development Agency, New York, School Facility Revenue Bonds, Buffalo City School District Project, Series 2004, 5.750%, 5/01/26 – AGM Insured (UB) | 5/14 at 100.00 | AA+ | | 1,743,020 | |
| | 2,420 | | Erie county Industrial Development Agency, New York, School Facility Revenue Bonds, Buffalo City School District Project, Series 2008A, 5.750%, 5/01/28 – AGM Insured (UB) | 5/18 at 100.00 | AA+ | | 2,605,445 | |
| | | | Erie county Industrial Development Agency, New York, School Facility Revenue Bonds, Buffalo City School District Project, Series 2007A: | | | | | |
| | 5,980 | | 5.750%, 5/01/27 – AGM Insured (UB) | 5/17 at 100.00 | AA+ | | 6,408,168 | |
| | 1,670 | | 5.750%, 5/01/28 – AGM Insured (UB) | 5/17 at 100.00 | AA+ | | 1,782,224 | |
| | 14,635 | | Hudson Yards Infrastructure Corporation, New York, Revenue Bonds, Series 2006A, 5.000%, 2/15/47 – FGIC Insured | 2/17 at 100.00 | A | | 12,009,188 | |
| | 7,500 | | Metropolitan Transportation Authority, New York, Dedicated Tax Fund Bonds, Series 2002A, 5.250%, 11/15/25 – AGM Insured | 11/12 at 100.00 | AA+ | | 7,719,675 | |
| | 4,600 | | Metropolitan Transportation Authority, New York, State Service Contract Bonds, Series 2002B, 5.500%, 7/01/18 – NPFG Insured | 7/12 at 100.00 | AA– | | 4,825,446 | |
| | | | Metropolitan Transportation Authority, New York, State Service Contract Refunding Bonds, Series 2002A: | | | | | |
| | 1,000 | | 5.750%, 7/01/18 – AGM Insured | No Opt. Call | AA+ | | 1,150,240 | |
| | 1,000 | | 5.750%, 7/01/18 – AGM Insured (UB) | No Opt. Call | AA+ | | 1,150,240 | |
| | 3,000 | | 5.500%, 1/01/19 – NPFG Insured | 7/12 at 100.00 | AA– | | 3,143,370 | |
| | 6,000 | | 5.500%, 1/01/20 – NPFG Insured | 7/12 at 100.00 | AA– | | 6,282,540 | |
| | 3,000 | | 5.000%, 7/01/25 – FGIC Insured | 7/12 at 100.00 | AA– | | 3,005,160 | |
| | 8,000 | | 5.000%, 7/01/30 – AMBAC Insured | 7/12 at 100.00 | AA– | | 7,730,640 | |
| | | | Nassau County Interim Finance Authority, New York, Sales Tax Secured Revenue Bonds, Series 2003A: | | | | | |
| | 1,555 | | 4.750%, 11/15/21 – AMBAC Insured | 11/13 at 100.00 | AAA | | 1,602,256 | |
| | 1,555 | | 4.750%, 11/15/22 – AMBAC Insured | 11/13 at 100.00 | AAA | | 1,596,985 | |
| | | | New York City Sales Tax Asset Receivable Corporation, New York, Dedicated Revenue Bonds, Local Government Assistance Corporation, Series 2002A: | | | | | |
| | 2,720 | | 5.000%, 10/15/25 – NPFG Insured (UB) | 10/14 at 100.00 | AAA | | 2,837,150 | |
| | 1,990 | | 5.000%, 10/15/26 – NPFG Insured (UB) | 10/14 at 100.00 | AAA | | 2,081,500 | |
| | 4,960 | | 5.000%, 10/15/29 – AMBAC Insured (UB) | 10/14 at 100.00 | AAA | | 5,044,270 | |
| | 1,500 | | 5.000%, 10/15/32 – AMBAC Insured (UB) | 10/14 at 100.00 | AAA | | 1,512,300 | |
| | 1,600 | | New York City Transitional Finance Authority, New York, Building Aid Revenue Bonds, Fiscal Series 2007S-2, 5.000%, 1/15/28 – FGIC Insured | 1/17 at 100.00 | AA– | | 1,617,104 | |
| | | | New York City Transitional Finance Authority, New York, Future Tax Secured Bonds, Fiscal Series 2002B: | | | | | |
| | 5 | | 5.250%, 5/01/12 – NPFG Insured | 11/11 at 101.00 | AAA | | 5,190 | |
| | 970 | | 5.000%, 5/01/30 – NPFG Insured | 11/11 at 101.00 | AAA | | 973,395 | |
| | 1,995 | | New York City Transitional Finance Authority, New York, Future Tax Secured Bonds, Fiscal Series 2003E, 5.250%, 2/01/22 – NPFG Insured | 2/13 at 100.00 | AAA | | 2,093,753 | |
| | 1,845 | | New York City Transitional Finance Authority, New York, Future Tax Secured Bonds, Fiscal Series 2004C, 5.000%, 2/01/19 – SYNCORA GTY Insured | 2/14 at 100.00 | AAA | | 1,987,526 | |
| | 3,500 | | New York City Transitional Finance Authority, New York, Future Tax Secured Refunding Bonds, Fiscal Series 2003D, 5.000%, 2/01/22 – NPFG Insured | 2/13 at 100.00 | AAA | | 3,664,710 | |
| | 4,000 | | New York City Transitional Finance Authority, New York, Future Tax Secured Revenue Bonds, Subordinate Lien Series 2011C, 5.500%, 11/01/35 | 11/20 at 100.00 | AAA | | 4,186,280 | |
| | 1,660 | | New York City, New York, Educational Construction Fund, Revenue Bonds, Series 2011A, 5.750%, 4/01/33 – AGM Insured | 4/21 at 100.00 | AA+ | | 1,726,549 | |
| | | | New York Convention Center Development Corporation, Hotel Fee Revenue Bonds, Tender Option Bonds Trust 3095: | | | | | |
| | 845 | | 13.359%, 11/15/30 – AMBAC Insured (IF) | 11/15 at 100.00 | AA+ | | 884,014 | |
| | 4,005 | | 13.445%, 11/15/44 – AMBAC Insured (IF) | 11/15 at 100.00 | AA+ | | 3,745,836 | |
| | Principal | | | Optional Call | | | | |
| | Amount (000) | | Description (1) | Provisions (2) | Ratings (3) | | Value | |
| | | | Tax Obligation/Limited (continued) | | | | | |
| $ | 3,750 | | New York State Local Government Assistance Corporation, Revenue Bonds, Series 1993E, 5.250%, 4/01/16 – AGM Insured (UB) | No Opt. Call | AAA | $ | 4,251,863 | |
| | 1,000 | | New York State Thruway Authority, Highway and Bridge Trust Fund Bonds, Second General, Series 2004A, 5.000%, 4/01/22 – NPFG Insured | 4/14 at 100.00 | AA | | 1,062,620 | |
| | | | New York State Thruway Authority, Highway and Bridge Trust Fund Bonds, Second General, Series 2005B: | | | | | |
| | 8,455 | | 5.500%, 4/01/20 – AMBAC Insured | No Opt. Call | AA | | 9,686,217 | |
| | 2,600 | | 5.000%, 4/01/21 – AMBAC Insured | 10/15 at 100.00 | AA | | 2,697,006 | |
| | 1,000 | | New York State Thruway Authority, State Personal Income Tax Revenue Bonds, Series 2004A, 5.000%, 3/15/24 – AMBAC Insured | 9/14 at 100.00 | AAA | | 1,048,670 | |
| | 3,195 | | New York State Thruway Authority, State Personal Income Tax Revenue Bonds, Series 2010A, 5.000%, 3/15/30 | 9/20 at 100.00 | AAA | | 3,263,756 | |
| | | | New York State Tobacco Settlement Financing Corporation, Tobacco Settlement Asset-Backed and State Contingency Contract-Backed Bonds, Series 2003A-1: | | | | | |
| | 12,400 | | 5.250%, 6/01/20 – AMBAC Insured | 6/13 at 100.00 | AA– | | 12,950,806 | |
| | 1,000 | | 5.250%, 6/01/22 – AMBAC Insured | 6/13 at 100.00 | AA– | | 1,031,260 | |
| | 3,190 | | New York State Urban Development Corporation, Revenue Refunding Bonds, State Facilities, Series 1995, 5.600%, 4/01/15 – NPFG Insured | No Opt. Call | Aa3 | | 3,461,469 | |
| | 500 | | New York State Urban Development Corporation, State Personal Income Tax Revenue Bonds, Series 2005B, 5.000%, 3/15/30 – AGM Insured | 3/15 at 100.00 | AAA | | 505,975 | |
| | 1,980 | | Niagara Falls City School District, Niagara County, New York, Certificates of Participation, High School Facility, Series 2005, 5.000%, 6/15/28 – AGM Insured | 6/15 at 100.00 | AA+ | | 1,940,697 | |
| | | | Puerto Rico Highway and Transportation Authority, Highway Revenue Refunding Bonds, Series 2002E: | | | | | |
| | 3,000 | | 5.500%, 7/01/14 – AGM Insured | No Opt. Call | AA+ | | 3,269,430 | |
| | 6,000 | | 5.500%, 7/01/18 – AGM Insured | No Opt. Call | AA+ | | 6,457,500 | |
| | 2,500 | | Puerto Rico Sales Tax Financing Corporation, Sales Tax Revenue Bonds, First Subordinate Series 2010A, 5.000%, 8/01/40 – AGM Insured | 2/20 at 100.00 | AA+ | | 2,271,625 | |
| | 3,235 | | Puerto Rico Sales Tax Financing Corporation, Sales Tax Revenue Bonds, First Subordinate Series 2010C, 5.125%, 8/01/42 – AGM Insured | 8/20 at 100.00 | AA+ | | 2,977,720 | |
| | 3,765 | | Syracuse Industrial Development Authority, New York, PILOT Mortgage Revenue Bonds, Carousel Center Project, Series 2007A, 5.000%, 1/01/36 – SYNCORA GTY Insured (Alternative Minimum Tax) | 1/17 at 100.00 | BBB– | | 2,761,816 | |
| | 180,795 | | Total Tax Obligation/Limited | | | | 183,728,165 | |
| | | | Transportation – 15.9% (10.0% of Total Investments) | | | | | |
| | | | Metropolitan Transportation Authority, New York, Transportation Revenue Bonds, Series 2005A: | | | | | |
| | 900 | | 4.750%, 11/15/27 – NPFG Insured | 11/15 at 100.00 | AA+ | | 881,721 | |
| | 1,000 | | 4.750%, 11/15/30 – AMBAC Insured | 11/15 at 100.00 | A | | 925,870 | |
| | 7,575 | | Metropolitan Transportation Authority, New York, Transportation Revenue Bonds, Series 2006B, 4.500%, 11/15/36 – AGM Insured | 11/16 at 100.00 | AA+ | | 6,558,965 | |
| | | | Metropolitan Transportation Authority, New York, Transportation Revenue Refunding Bonds, Series 2002A: | | | | | |
| | 3,815 | | 5.500%, 11/15/19 – AMBAC Insured | 11/12 at 100.00 | A | | 4,021,392 | |
| | 4,000 | | 5.125%, 11/15/22 – FGIC Insured | 11/12 at 100.00 | A | | 4,094,920 | |
| | | | Metropolitan Transportation Authority, New York, Transportation Revenue Refunding Bonds, Series 2002E: | | | | | |
| | 2,665 | | 5.500%, 11/15/21 – NPFG Insured | 11/12 at 100.00 | A | | 2,774,665 | |
| | 8,500 | | 5.000%, 11/15/25 – NPFG Insured | 11/12 at 100.00 | A | | 8,511,305 | |
| | 970 | | New York State Thruway Authority, General Revenue Bonds, Refunding Series 2007H, 5.000%, 1/01/25 – FGIC Insured | 1/18 at 100.00 | A+ | | 999,323 | |
| | | | New York State Thruway Authority, General Revenue Bonds, Series 2005F: | | | | | |
| | 2,665 | | 5.000%, 1/01/20 – AMBAC Insured | 1/15 at 100.00 | A+ | | 2,755,290 | |
| | 4,075 | | 5.000%, 1/01/30 – AMBAC Insured | 1/15 at 100.00 | A+ | | 4,062,408 | |
| | 1,700 | | New York State Thruway Authority, General Revenue Bonds, Series 2005G, 5.000%, 1/01/30 – AGM Insured (UB) | 7/15 at 100.00 | AA+ | | 1,703,417 | |
| | 2,500 | | Niagara Frontier Airport Authority, New York, Airport Revenue Bonds, Buffalo Niagara International Airport, Series 1999A, 5.625%, 4/01/29 – NPFG Insured (Alternative Minimum Tax) | 10/11 at 100.00 | Baa1 | | 2,433,850 | |
| | | Nuveen New York Quality Income Municipal Fund, Inc. (continued) |
| NUN | | Portfolio of Investments |
March 31, 2011 (Unaudited)
| | Principal | | | Optional Call | | | | |
| | Amount (000) | | Description (1) | Provisions (2) | Ratings (3) | | Value | |
| | | | Transportation (continued) | | | | | |
| $ | 1,700 | | Port Authority of New York and New Jersey, Consolidated Revenue Bonds, One Hundred Fortieth Series 2005, 5.000%, 12/01/31 – SYNCORA GTY Insured | 6/15 at 101.00 | Aa2 | $ | 1,703,910 | |
| | 1,175 | | Port Authority of New York and New Jersey, Consolidated Revenue Bonds, One Hundred Forty Eighth Series 2008, Trust 2920, 17.512%, 8/15/32 – AGM Insured (IF) | 8/17 at 100.00 | AA+ | | 1,159,443 | |
| | 5,000 | | Triborough Bridge and Tunnel Authority, New York, General Purpose Revenue Bonds, Series 2002A, 5.250%, 1/01/20 – FGIC Insured | 1/12 at 100.00 | Aa2 | | 5,136,900 | |
| | | | Triborough Bridge and Tunnel Authority, New York, Subordinate Lien General Purpose Revenue Refunding Bonds, Series 2002E: | | | | | |
| | 1,570 | | 5.500%, 11/15/20 – NPFG Insured | No Opt. Call | Aa3 | | 1,783,222 | |
| | 3,800 | | 5.250%, 11/15/22 – NPFG Insured | 11/12 at 100.00 | Aa3 | | 3,928,592 | |
| | 53,610 | | Total Transportation | | | | 53,435,193 | |
| | | | U.S. Guaranteed – 17.4% (11.0% of Total Investments) (4) | | | | | |
| | 1,990 | | Dormitory Authority of the State of New York, Judicial Facilities Lease Revenue Bonds, Suffolk County Issue, Series 1986, 7.375%, 7/01/16 (ETM) | No Opt. Call | AAA | | 2,307,783 | |
| | 1,410 | | Dormitory Authority of the State of New York, Lease Revenue Bonds, State University Dormitory Facilities, Series 2001, 5.500%, 7/01/20 (Pre-refunded 7/01/11) – FGIC Insured | 7/11 at 100.00 | AA– (4) | | 1,428,386 | |
| | | | Longwood Central School District, Suffolk County, New York, Series 2000: | | | | | |
| | 910 | | 5.750%, 6/15/19 (Pre-refunded 6/15/11) – FGIC Insured | 6/11 at 101.00 | A1 (4) | | 928,528 | |
| | 1,410 | | 5.750%, 6/15/20 (Pre-refunded 6/15/11) – FGIC Insured | 6/11 at 101.00 | A1 (4) | | 1,438,708 | |
| | | | Metropolitan Transportation Authority, New York, Dedicated Tax Fund Bonds, Series 1999A: | | | | | |
| | 4,000 | | 5.000%, 4/01/17 (Pre-refunded 10/01/14) – AGM Insured | 10/14 at 100.00 | AAA | | 4,554,880 | |
| | 1,000 | | 5.000%, 4/01/29 (Pre-refunded 10/01/14) – AGM Insured | 10/14 at 100.00 | AAA | | 1,138,720 | |
| | | | Metropolitan Transportation Authority, New York, Transit Facilities Revenue Bonds, Series 1998B: | | | | | |
| | 10,000 | | 4.875%, 7/01/18 – FGIC Insured (ETM) | 7/11 at 100.00 | AAA | | 10,172,800 | |
| | 4,500 | | 4.750%, 7/01/26 – FGIC Insured (ETM) | 7/11 at 100.00 | AAA | | 4,656,825 | |
| | | | New York City Transitional Finance Authority, New York, Future Tax Secured Bonds, Fiscal Series 2002B: | | | | | |
| | 10,165 | | 5.250%, 5/01/12 (Pre-refunded 11/01/11) – NPFG Insured | 11/11 at 101.00 | AAA | | 10,557,471 | |
| | 2,420 | | 5.250%, 5/01/17 (Pre-refunded 11/01/11) – NPFG Insured | 11/11 at 101.00 | Aaa | | 2,513,436 | |
| | 30 | | 5.000%, 5/01/30 (Pre-refunded 11/01/11) – NPFG Insured | 11/11 at 101.00 | AAA | | 31,115 | |
| | 6,000 | | New York City Transitional Finance Authority, New York, Future Tax Secured Bonds, Fiscal Series 2003C, 5.250%, 8/01/21 (Pre-refunded 8/01/12) – AMBAC Insured | 8/12 at 100.00 | AAA | | 6,385,320 | |
| | 5,000 | | New York City, New York, General Obligation Bonds, Fiscal Series 2002C, 5.125%, 3/15/25 (Pre-refunded 3/15/12) – AGM Insured | 3/12 at 100.00 | AA+ (4) | | 5,226,750 | |
| | 6,965 | | New York State Thruway Authority, Highway and Bridge Trust Fund Bonds, Series 2002A, 5.250%, 4/01/20 (Pre-refunded 4/01/12) – AGM Insured | 4/12 at 100.00 | AAA | | 7,306,494 | |
| | 55,800 | | Total U.S. Guaranteed | | | | 58,647,216 | |
| | | | Utilities – 11.6% (7.3% of Total Investments) | | | | | |
| | 1,560 | | Guam Power Authority, Revenue Bonds, Series 2010A, 5.000%, 10/01/37 – AGM Insured | 10/20 at 100.00 | AA+ | | 1,372,051 | |
| | 1,650 | | Islip Resource Recovery Agency, New York, Revenue Bonds, Series 1994B, 7.250%, 7/01/11 – AMBAC Insured (Alternative Minimum Tax) | No Opt. Call | A1 | | 1,675,064 | |
| | | | Long Island Power Authority, New York, Electric System General Revenue Bonds, Series 2000A: | | | | | |
| | 4,000 | | 0.000%, 6/01/24 – AGM Insured | No Opt. Call | AA+ | | 2,243,040 | |
| | 4,000 | | 0.000%, 6/01/25 – AGM Insured | No Opt. Call | AA+ | | 2,094,920 | |
| | 5,000 | | 0.000%, 6/01/26 – AGM Insured | No Opt. Call | AA+ | | 2,449,700 | |
| | 7,000 | | 0.000%, 6/01/27 – AGM Insured | No Opt. Call | AA+ | | 3,205,510 | |
| | 10,500 | | 0.000%, 6/01/28 – AGM Insured | No Opt. Call | AA+ | | 4,475,310 | |
| | 7,000 | | 0.000%, 6/01/29 – AGM Insured | No Opt. Call | AA+ | | 2,784,110 | |
| | 2,500 | | Long Island Power Authority, New York, Electric System General Revenue Bonds, Series 2001A, 5.000%, 9/01/27 – AGM Insured | 9/11 at 100.00 | AA+ | | 2,500,700 | |
| | | | Long Island Power Authority, New York, Electric System General Revenue Bonds, Series 2006A: | | | | | |
| | 6,180 | | 5.000%, 12/01/23 – FGIC Insured | 6/16 at 100.00 | A– | | 6,356,254 | |
| | 8,020 | | 5.000%, 12/01/25 – FGIC Insured | 6/16 at 100.00 | A– | | 8,176,631 | |
| | Principal | | | Optional Call | | | | |
| | Amount (000) | | Description (1) | Provisions (2) | Ratings (3) | | Value | |
| | | | Utilities (continued) | | | | | |
| $ | 750 | | Long Island Power Authority, New York, Electric System General Revenue Bonds, Series 2006B, 5.000%, 12/01/35 – CIFG Insured | 6/16 at 100.00 | A– | $ | 710,295 | |
| | 865 | | Power Authority of the State of New York, General Revenue Bonds, Series 2006A, 5.000%, 11/15/19 – FGIC Insured | 11/15 at 100.00 | Aa2 | | 917,056 | |
| | 59,025 | | Total Utilities | | | | 38,960,641 | |
| | | | Water and Sewer – 8.3% (5.3% of Total Investments) | | | | | |
| | 3,000 | | New York City Municipal Water Finance Authority, New York, Water and Sewerage System Revenue Bonds, Second Generation Resolution, Series 2007AA, 5.000%, 6/15/37 | 6/17 at 100.00 | AA+ | | 2,899,860 | |
| | 3,500 | | New York City Municipal Water Finance Authority, New York, Water and Sewerage System Revenue Bonds, Fiscal Series 2005C, 5.000%, 6/15/27 – NPFG Insured (UB) | 6/15 at 100.00 | AAA | | 3,404,415 | |
| | 6,525 | | New York City Municipal Water Finance Authority, New York, Water and Sewerage System Revenue Bonds, Fiscal Series 2006B, 5.000%, 6/15/36 – NPFG Insured (UB) | 6/16 at 100.00 | AAA | | 6,692,301 | |
| | 3,000 | | New York City Municipal Water Finance Authority, New York, Water and Sewerage System Revenue Bonds, Fiscal Series 2004C, 5.000%, 6/15/35 – AMBAC Insured | 6/14 at 100.00 | AAA | | 2,931,810 | |
| | 5,000 | | New York City Municipal Water Finance Authority, New York, Water and Sewerage System Revenue Refunding Bonds, Fiscal Series 2003E, 5.000%, 6/15/34 | 6/13 at 100.00 | AAA | | 4,915,350 | |
| | 7,000 | | Suffolk County Water Authority, New York, Waterworks Revenue Bonds, Series 2005C, 5.000%, 6/01/28 – NPFG Insured (UB) | 6/15 at 100.00 | AA+ | | 7,164,570 | |
| | 28,025 | | Total Water and Sewer | | | | 28,008,306 | |
| $ | 548,687 | | Total Investments (cost $531,389,009) – 158.0% | | | | 532,112,904 | |
| | | | Floating Rate Obligation – (12.0)% | | | | (40,245,000 | ) |
| | | | Variable Rate Demand Preferred Shares, at Liquidation Value – (48.0)% (5) | | | | (161,700,000 | ) |
| | | | Other Assets Less Liabilities – 2.0% | | | | 6,602,062 | |
| | | | Net Assets Applicable to Common Shares – 100% | | | $ | 336,769,966 | |
| | | The Fund intends to invest at least 80% of its managed assets in municipal securities that are covered by insurance guaranteeing the timely payment of principal and interest. See Notes to Financial Statements, Footnote 1 – General Information and Significant Accounting Policies, Insurance for more information. |
| (1) | | All percentages shown in the Portfolio of Investments are based on net assets applicable to Common shares unless otherwise noted. |
| (2) | | Optional Call Provisions: Dates (month and year) and prices of the earliest optional call or redemption. There may be other call provisions at varying prices at later dates. Certain mortgage-backed securities may be subject to periodic principal paydowns. |
| (3) | | Ratings: Using the highest of Standard & Poor’s Group (“Standard & Poor’s”), Moody’s Investor Service, Inc. (“Moody’s”) or Fitch, Inc. (“Fitch”) rating. Ratings below BBB by Standard & Poor’s, Baa by Moody’s or BBB by Fitch are considered to be below investment grade. Holdings designated N/R are not rated by any of these national rating agencies. |
| (4) | | Backed by an escrow or trust containing sufficient U.S. Government or U.S. Government agency securities, which ensure the timely payment of principal and interest. Such investments are normally considered to be equivalent to AAA rated securities. |
| (5) | | Variable Rate Demand Preferred Shares, at Liquidation Value as a percentage of Total Investments is 30.4%. |
| N/R | | Not rated. |
| WI/DD | | Purchased on a when-issued or delayed delivery basis. |
| (ETM) | | Escrowed to maturity. |
| (IF) | | Inverse floating rate investment. |
| (UB) | | Underlying bond of an inverse floating rate trust reflected as a financing transaction. See Notes to Financial Statements, Footnote 1 – General Information and Significant Accounting Policies, Inverse Floating Rate Securities for more information. |
See accompanying notes to financial statements.
| | | Nuveen Insured New York Premium Income Municipal Fund, Inc. |
| NNF | | Portfolio of Investments |
March 31, 2011 (Unaudited)
| | Principal | | | Optional Call | | | | |
| | Amount (000) | | Description (1) | Provisions (2) | Ratings (3) | | Value | |
| | | | Education and Civic Organizations – 22.2% (14.3% of Total Investments) | | | | | |
| | | | Dormitory Authority of the State of New York, General Revenue Bonds, | | | | | |
| | | | New York University, Series 2001-1: | | | | | |
| $ | 1,500 | | 5.500%, 7/01/24 – AMBAC Insured | No Opt. Call | AA– | $ | 1,712,940 | |
| | 500 | | 5.500%, 7/01/40 – AMBAC Insured | No Opt. Call | AA– | | 518,610 | |
| | 435 | | Dormitory Authority of the State of New York, Housing Revenue Bonds, Fashion Institute of Technology, Series 2007, 5.250%, 7/01/34 – FGIC Insured | No Opt. Call | BBB | | 391,074 | |
| | 810 | | Dormitory Authority of the State of New York, Insured Revenue Bonds, Yeshiva University, Series 2001, 5.000%, 7/01/20 – AMBAC Insured | 7/11 at 100.00 | Aa3 | | 812,122 | |
| | 1,000 | | Dormitory Authority of the State of New York, Lease Revenue Bonds, State University Dormitory Facilities, Series 2003B, 5.250%, 7/01/32 (Mandatory put 7/01/13) – SYNCORA GTY Insured | No Opt. Call | Aa2 | | 1,079,510 | |
| | 635 | | Dormitory Authority of the State of New York, Lease Revenue Bonds, State University Dormitory Facilities, Series 2004A, 5.000%, 7/01/29 – NPFG Insured | 7/15 at 100.00 | Aa2 | | 640,029 | |
| | 970 | | Dormitory Authority of the State of New York, Lease Revenue Bonds, State University Dormitory Facilities, Series 2006A, 5.000%, 7/01/31 – NPFG Insured | 7/16 at 100.00 | Aa2 | | 967,478 | |
| | 255 | | Dormitory Authority of the State of New York, Revenue Bonds, Barnard College, Series 2007A, 5.000%, 7/01/37 – FGIC Insured | 7/17 at 100.00 | BBB | | 236,043 | |
| | 600 | | Dormitory Authority of the State of New York, Revenue Bonds, Convent of the Sacred Heart, Series 2011, 5.750%, 11/01/40 – AGM Insured | 5/21 at 100.00 | AA+ | | 606,828 | |
| | 345 | | Dormitory Authority of the State of New York, Revenue Bonds, New York University, Series 2007, 5.000%, 7/01/32 – AMBAC Insured | 7/17 at 100.00 | AA– | | 345,066 | |
| | 1,000 | | Dormitory Authority of the State of New York, Revenue Bonds, New York University, Series 2009A, 5.250%, 7/01/34 | 7/19 at 100.00 | AA– | | 1,004,230 | |
| | 3,000 | | Dormitory Authority of the State of New York, Revenue Bonds, New York University, Series 2009B, 5.000%, 7/01/39 | 7/19 at 100.00 | AA– | | 2,883,540 | |
| | | | Dormitory Authority of the State of New York, Revenue Bonds, Rochester Institute of Technology, Series 2006A: | | | | | |
| | 250 | | 5.250%, 7/01/20 – AMBAC Insured | No Opt. Call | A1 | | 271,430 | |
| | 200 | | 5.250%, 7/01/21 – AMBAC Insured | No Opt. Call | A1 | | 216,120 | |
| | 1,000 | | Dormitory Authority of the State of New York, Revenue Bonds, State University Educational Facilities, Series 1993A, 5.500%, 5/15/19 – AMBAC Insured | No Opt. Call | Aa3 | | 1,126,060 | |
| | 2,200 | | Dormitory Authority of the State of New York, Second General Resolution Consolidated Revenue Bonds, City University System, Series 1993A, 5.750%, 7/01/18 – AGM Insured | No Opt. Call | AA+ | | 2,506,416 | |
| | 1,935 | | Dormitory Authority of the State of New York, State and Local Appropriation Lease Bonds, Upstate Community Colleges, Series 2005A, 5.000%, | 7/15 at 100.00 | AA– | | 2,051,255 | |
| | | | 7/01/19 – FGIC Insured | | | | | |
| | 535 | | Madison County Industrial Development Agency, New York, Civic Facility Revenue Bonds, Colgate University, Tender Option Bond Trust 3127, 13.041%, 1/01/14 – AMBAC Insured (IF) | No Opt. Call | AA+ | | 517,677 | |
| | | | New York City Industrial Development Agency, New York, Payment in Lieu of Taxes Revenue Bonds, Queens Baseball Stadium Project, Series 2009: | | | | | |
| | 400 | | 6.125%, 1/01/29 – AGC Insured | 1/19 at 100.00 | AA+ | | 420,840 | |
| | 200 | | 6.375%, 1/01/39 – AGC Insured | 1/19 at 100.00 | AA+ | | 205,380 | |
| | 1,110 | | New York City Industrial Development Agency, New York, PILOT Revenue Bonds, Queens Baseball Stadium Project, Series 2006, 5.000%, 1/01/46 – AMBAC Insured | 1/17 at 100.00 | BB+ | | 889,765 | |
| | 1,445 | | New York City Industrial Development Agency, New York, Revenue Bonds, Yankee Stadium Project PILOT, Series 2009A, 7.000%, 3/01/49 – AGC Insured | 3/19 at 100.00 | AA+ | | 1,552,696 | |
| | | | New York City Industrial Development Authority, New York, PILOT Revenue Bonds, Yankee Stadium Project, Series 2006: | | | | | |
| | 415 | | 5.000%, 3/01/31 – FGIC Insured | 9/16 at 100.00 | BBB– | | 381,348 | |
| | 2,360 | | 5.000%, 3/01/36 – NPFG Insured | 9/16 at 100.00 | Baa1 | | 2,028,184 | |
| | 2,025 | | 4.500%, 3/01/39 – FGIC Insured | 9/16 at 100.00 | BBB– | | 1,571,076 | |
| | 1,250 | | New York City Trust for Cultural Resources, New York, Revenue Refunding Bonds, Museum of Modern Art, Series 1996A, 5.500%, 1/01/21 – AMBAC Insured | 7/11 at 100.00 | Aa2 | | 1,279,075 | |
| | 350 | | Troy Capital Resource Corporation, New York, Revenue Bonds, Rensselaer Polytechnic Institute, Series 2010A, 5.125%, 9/01/40 | 9/20 at 100.00 | A | | 320,506 | |
| | 26,725 | | Total Education and Civic Organizations | | | | 26,535,298 | |
| | Principal | | | Optional Call | | | | |
| | Amount (000) | | Description (1) | Provisions (2) | Ratings (3) | | Value | |
| | | | Health Care – 20.0% (12.9% of Total Investments) | | | | | |
| $ | 3,000 | | Dormitory Authority of the State of New York, FHA-Insured Mortgage Hospital Revenue Bonds, Ellis Hospital, Series 1995, 5.600%, 8/01/25 – NPFG Insured | 8/11 at 100.00 | Baa1 | $ | 3,001,620 | |
| | 280 | | Dormitory Authority of the State of New York, FHA-Insured Mortgage Hospital Revenue Bonds, Hospital for Special Surgery, Series 2009, 6.250%, 8/15/34 | 8/19 at 100.00 | AAA | | 309,837 | |
| | 1,400 | | Dormitory Authority of the State of New York, FHA-Insured Mortgage Hospital Revenue Bonds, St. Barnabas Hospital, Series 2002A, 5.125%, 2/01/22 – AMBAC Insured | 8/12 at 100.00 | N/R | | 1,411,396 | |
| | 805 | | Dormitory Authority of the State of New York, FHA-Insured Mortgage Revenue Bonds, Hudson Valley Hospital Center, Series 2007, 5.000%, 8/15/27 – AGM Insured | 8/17 at 100.00 | AA+ | | 816,793 | |
| | 1,405 | | Dormitory Authority of the State of New York, FHA-Insured Mortgage Revenue Bonds, Montefiore Hospital, Series 2004, 5.000%, 8/01/29 – FGIC Insured | 2/15 at 100.00 | BBB | | 1,388,295 | |
| | 3,000 | | Dormitory Authority of the State of New York, Revenue Bonds, Catholic Health Services of Long Island Obligated Group – St. Charles Hospital and Rehabilitation Center, Series 1999A, 5.500%, 7/01/22 – NPFG Insured | 7/11 at 100.00 | A3 | | 3,003,870 | |
| | 620 | | Dormitory Authority of the State of New York, Revenue Bonds, Health Quest System Inc., Series 2007B, 5.125%, 7/01/37 – AGC Insured | 7/17 at 100.00 | AA+ | | 584,567 | |
| | 2,740 | | Dormitory Authority of the State of New York, Revenue Bonds, Memorial Sloan-Kettering Cancer Center, Series 2003-1, 5.000%, 7/01/21 – NPFG Insured | 7/13 at 100.00 | AA | | 2,813,432 | |
| | 1,835 | | Dormitory Authority of the State of New York, Revenue Bonds, New York and Presbyterian Hospital, Series 2004A, 5.250%, 8/15/15 – AGM Insured | 8/14 at 100.00 | AA+ | | 1,962,588 | |
| | 740 | | Dormitory Authority of the State of New York, Revenue Bonds, The New York and Presbyterian Hospital Project, Series 2007, 5.000%, 8/15/36 – AGM Insured | 8/14 at 100.00 | AA+ | | 703,237 | |
| | 1,500 | | Dormitory Authority of the State of New York, Revenue Bonds, Vassar Brothers Hospital, Series 1997, 5.250%, 7/01/17 – AGM Insured | 7/11 at 100.00 | AA+ | | 1,520,250 | |
| | 3,450 | | Dormitory Authority of the State of New York, Revenue Bonds, Winthrop South Nassau University Health System Obligated Group, Series 2001A, 5.250%, 7/01/31 – AMBAC Insured | 7/11 at 101.00 | N/R | | 3,205,913 | |
| | | | New York City Health and Hospitals Corporation, New York, Health System Revenue Bonds, Series 2003A: | | | | | |
| | 1,625 | | 5.250%, 2/15/21 – AMBAC Insured | 2/13 at 100.00 | Aa3 | | 1,672,466 | |
| | 1,000 | | 5.250%, 2/15/22 – AMBAC Insured | 2/13 at 100.00 | Aa3 | | 1,035,690 | |
| | 425 | | Westchester County Health Care Corporation, New York, Senior Lien Revenue Bonds, Series 2010-C2, 6.125%, 11/01/37 | 11/20 at 100.00 | A3 | | 415,438 | |
| | 23,825 | | Total Health Care | | | | 23,845,392 | |
| | | | Housing/Multifamily – 3.9% (2.5% of Total Investments) | | | | | |
| | | | New York City Housing Development Corporation, New York, Capital Fund Program Revenue Bonds, Series 2005A: | | | | | |
| | 400 | | 5.000%, 7/01/14 – FGIC Insured | No Opt. Call | AA+ | | 437,104 | |
| | 400 | | 5.000%, 7/01/16 – FGIC Insured | 7/15 at 100.00 | AA+ | | 435,600 | |
| | 2,165 | | 5.000%, 7/01/25 – NPFG Insured (UB) | 7/15 at 100.00 | AA+ | | 2,203,364 | |
| | 200 | | New York City Housing Development Corporation, New York, Multifamily Housing Revenue Bonds, Seaview Towers, Series 2006A, 4.750%, 7/15/39 – AMBAC Insured (Alternative Minimum Tax) | 1/17 at 100.00 | AAA | | 177,804 | |
| | 365 | | New York City Housing Development Corporation, New York, Multifamily Housing Revenue Bonds, Series 2010-D1A, 5.000%, 11/01/42 | 5/20 at 100.00 | AA | | 345,082 | |
| | 1,000 | | New York State Housing Finance Agency, Affordable Housing Revenue Bonds, Series 2007B, 5.300%, 11/01/37 (Alternative Minimum Tax) | 11/17 at 100.00 | Aa2 | | 937,740 | |
| | 110 | | New York State Housing Finance Agency, Mortgage Revenue Refunding Bonds, Housing Project, Series 1996A, 6.125%, 11/01/20 – AGM Insured | 5/11 at 100.00 | AA+ | | 110,120 | |
| | 4,640 | | Total Housing/Multifamily | | | | 4,646,814 | |
| | | | Long-Term Care – 0.7% (0.5% of Total Investments) | | | | | |
| | 850 | | Dormitory Authority of the State of New York, Insured Revenue Bonds, NYSARC Inc., Series 2001A, 5.000%, 7/01/26 – AGM Insured | 7/11 at 102.00 | AA+ | | 848,139 | |
| | | | Tax Obligation/General – 6.7% (4.4% of Total Investments) | | | | | |
| | 500 | | Erie County, New York, General Obligation Bonds, Series 2003A, 5.250%, 3/15/16 – NPFG Insured | 3/13 at 100.00 | A2 | | 529,955 | |
| | 315 | | Erie County, New York, General Obligation Bonds, Series 2004B, 5.250%, 4/01/13 – NPFG Insured | No Opt. Call | A2 | | 335,570 | |
| | | Nuveen Insured New York Premium Income Municipal Fund, Inc. (continued) |
| NNF | | Portfolio of Investments |
March 31, 2011 (Unaudited)
| | Principal | | | Optional Call | | | | |
| | Amount (000) | | Description (1) | Provisions (2) | Ratings (3) | | Value | |
| | | | Tax Obligation/General (continued) | | | | | |
| $ | 210 | | Nassau County, New York, General Obligation Improvement Bonds, Series 1993H, 5.500%, 6/15/16 – NPFG Insured | No Opt. Call | A+ | $ | 235,807 | |
| | 5 | | New York City, New York, General Obligation Bonds, Fiscal Series 1998F, 5.250%, 8/01/16 – FGIC Insured | 8/11 at 100.00 | AA | | 5,018 | |
| | 1,000 | | New York City, New York, General Obligation Bonds, Fiscal Series 2005J, 5.000%, 3/01/19 – FGIC Insured | 3/15 at 100.00 | AA | | 1,060,100 | |
| | | | New York City, New York, General Obligation Bonds, Tender Option Bond Trust 1198: | | | | | |
| | 1,100 | | 5.000%, 11/01/19 – AGM Insured (UB) | 11/14 at 100.00 | AA+ | | 1,150,930 | |
| | 1,000 | | 5.000%, 11/01/20 – AGM Insured (UB) | 11/14 at 100.00 | AA+ | | 1,052,280 | |
| | 915 | | Niagara Falls, New York, General Obligation Bonds, Series 1994, 7.500%, 3/01/13 – NPFG Insured | No Opt. Call | A2 | | 1,008,760 | |
| | 1,000 | | Red Hook Central School District, Dutchess County, New York, General Obligation Refunding Bonds, Series 2002, 5.125%, 6/15/18 – AGM Insured | 6/12 at 100.00 | Aa3 | | 1,041,250 | |
| | 1,525 | | Yonkers, New York, General Obligation Bonds, Series 2005A, 5.000%, 8/01/16 – NPFG Insured | 8/15 at 100.00 | A2 | | 1,633,016 | |
| | 7,570 | | Total Tax Obligation/General | | | | 8,052,686 | |
| | | | Tax Obligation/Limited – 60.9% (39.3% of Total Investments) | | | | | |
| | 690 | | Dormitory Authority of the State of New York, Department of Health Revenue Bonds, Series 2005A, 5.250%, 7/01/24 – CIFG Insured | 7/15 at 100.00 | AA– | | 715,164 | |
| | 50 | | Dormitory Authority of the State of New York, Improvement Revenue Bonds, Mental Health Services Facilities, Series 2000D, 5.250%, 8/15/30 – AGM Insured | 6/11 at 100.00 | AA+ | | 50,001 | |
| | 500 | | Dormitory Authority of the State of New York, Lease Revenue Bonds, Wayne-Finger Lakes Board of Cooperative Education Services, Series 2004, 5.000%, 8/15/23 – AGM Insured | 8/14 at 100.00 | AA+ | | 510,525 | |
| | 1,210 | | Dormitory Authority of the State of New York, Revenue Bonds, Department of Health, Series 2004-2, 5.000%, 7/01/20 – FGIC Insured | 7/14 at 100.00 | AA– | | 1,265,430 | |
| | | | Dormitory Authority of the State of New York, Revenue Bonds, Mental Health Services Facilities Improvements, Series 2005D-1: | | | | | |
| | 225 | | 5.000%, 2/15/15 – FGIC Insured | No Opt. Call | AA– | | 247,739 | |
| | 600 | | 5.000%, 8/15/23 – FGIC Insured | 2/15 at 100.00 | AA– | | 614,352 | |
| | | | Dormitory Authority of the State of New York, Revenue Bonds, School Districts Financing Program, Series 2002D: | | | | | |
| | 4,300 | | 5.250%, 10/01/23 – NPFG Insured | 10/12 at 100.00 | A+ | | 4,445,425 | |
| | 875 | | 5.000%, 10/01/30 – NPFG Insured | 10/12 at 100.00 | A+ | | 871,763 | |
| | 375 | | Dormitory Authority of the State of New York, State Personal Income Tax Revenue Bonds, Series 2005F, 5.000%, 3/15/21 – AGM Insured | 3/15 at 100.00 | AAA | | 392,651 | |
| | 1,000 | | Erie County Industrial Development Agency, New York, School Facility Revenue Bonds, Buffalo City School District Project, Series 2009A, 5.000%, 5/01/31 | No Opt. Call | AA– | | 997,440 | |
| | 750 | | Erie County Industrial Development Agency, New York, School Facility Revenue Bonds, Buffalo City School District, Series 2003, 5.750%, | 5/12 at 100.00 | AA+ | | 778,688 | |
| | | | 5/01/19 – AGM Insured | | | | | |
| | 500 | | Erie county Industrial Development Agency, New York, School Facility Revenue Bonds, Buffalo City School District Project, Series 2004, 5.750%, 5/01/26 – AGM Insured (UB) | 5/14 at 100.00 | AA+ | | 509,655 | |
| | 2,615 | | Erie county Industrial Development Agency, New York, School Facility Revenue Bonds, Buffalo City School District Project, Series 2007A, 5.750%, 5/01/28 – AGM Insured (UB) | 5/17 at 100.00 | AA+ | | 2,790,728 | |
| | 830 | | Erie county Industrial Development Agency, New York, School Facility Revenue Bonds, Buffalo City School District Project, Series 2008A, 5.750%, 5/01/27 – AGM Insured (UB) | 5/18 at 100.00 | AA+ | | 897,786 | |
| | 5,000 | | Hudson Yards Infrastructure Corporation, New York, Revenue Bonds, Series 2006A, 5.000%, 2/15/47 – FGIC Insured | 2/17 at 100.00 | A | | 4,102,899 | |
| | 2,500 | | Metropolitan Transportation Authority, New York, Dedicated Tax Fund Bonds, Series 2002A, 5.250%, 11/15/25 – AGM Insured | 11/12 at 100.00 | AA+ | | 2,573,225 | |
| | 1,350 | | Metropolitan Transportation Authority, New York, State Service Contract Bonds, Series 2002B, 5.500%, 7/01/18 – NPFG Insured | 7/12 at 100.00 | AA– | | 1,416,164 | |
| | | | Metropolitan Transportation Authority, New York, State Service Contract Refunding Bonds, Series 2002A: | | | | | |
| | 1,500 | | 5.750%, 7/01/18 – AGM Insured (UB) | No Opt. Call | AA+ | | 1,725,360 | |
| | 1,500 | | 5.500%, 1/01/20 – NPFG Insured | 7/12 at 100.00 | AA– | | 1,570,635 | |
| | 2,000 | | 5.000%, 7/01/30 – AMBAC Insured | 7/12 at 100.00 | AA– | | 1,932,660 | |
| | Principal | | | Optional Call | | | | |
| | Amount (000) | | Description (1) | Provisions (2) | Ratings (3) | | Value | |
| | | | Tax Obligation/Limited (continued) | | | | | |
| | | | Nassau County Interim Finance Authority, New York, Sales Tax Secured Revenue Bonds, Series 2003A: | | | | | |
| $ | 1,000 | | 5.000%, 11/15/18 – AMBAC Insured | 11/13 at 100.00 | AAA | $ | 1,070,490 | |
| | 580 | | 4.750%, 11/15/21 – AMBAC Insured | 11/13 at 100.00 | AAA | | 597,626 | |
| | 580 | | 4.750%, 11/15/22 – AMBAC Insured | 11/13 at 100.00 | AAA | | 595,660 | |
| | | | New York City Sales Tax Asset Receivable Corporation, New York, Dedicated Revenue Bonds, Local Government Assistance Corporation, Series 2004A: | | | | | |
| | 920 | | 5.000%, 10/15/25 – NPFG Insured (UB) | 10/14 at 100.00 | AAA | | 959,624 | |
| | 680 | | 5.000%, 10/15/26 – NPFG Insured (UB) | 10/14 at 100.00 | AAA | | 711,266 | |
| | 4,590 | | 5.000%, 10/15/29 – AMBAC Insured (UB) | 10/14 at 100.00 | AAA | | 4,667,984 | |
| | 1,000 | | New York City Transitional Finance Authority, New York, Future Tax Secured Bonds, Fiscal Series 2003E, 5.250%, 2/01/22 – NPFG Insured | 2/13 at 100.00 | AAA | | 1,049,500 | |
| | 1,000 | | New York City Transitional Finance Authority, New York, Future Tax Secured Bonds, Fiscal Series 2004C, 5.000%, 2/01/19 – SYNCORA GTY Insured | 2/14 at 100.00 | AAA | | 1,077,250 | |
| | 1,500 | | New York City Transitional Finance Authority, New York, Future Tax Secured Refunding Bonds, Fiscal Series 2003D, 5.000%, 2/01/22 – NPFG Insured | 2/13 at 100.00 | AAA | | 1,570,590 | |
| | 2,000 | | New York City Transitional Finance Authority, New York, Future Tax Secured Revenue Bonds, Subordinate Lien Series 2011C, 5.500%, 11/01/35 | 11/20 at 100.00 | AAA | | 2,093,140 | |
| | | | New York City, New York, Educational Construction Fund, Revenue Bonds, Series 2011A: | | | | | |
| | 5,340 | | 5.750%, 4/01/33 – AGM Insured | 4/21 at 100.00 | AA+ | | 5,554,078 | |
| | 2,000 | | 5.750%, 4/01/41 | 4/21 at 100.00 | AA– | | 2,024,260 | |
| | | | New York Convention Center Development Corporation, Hotel Fee Revenue Bonds, Tender Option Bonds Trust 3095: | | | | | |
| | 345 | | 13.359%, 11/15/30 – AMBAC Insured (IF) | 11/15 at 100.00 | AA+ | | 360,929 | |
| | 1,365 | | 13.345%, 11/15/44 – AMBAC Insured (IF) | 11/15 at 100.00 | AA+ | | 1,276,671 | |
| | 1,500 | | New York State Local Government Assistance Corporation, Revenue Bonds, Series 1993E, 5.250%, 4/01/16 – AGM Insured (UB) | No Opt. Call | AAA | | 1,700,745 | |
| | 1,000 | | New York State Thruway Authority, Highway and Bridge Trust Fund Bonds, Second General, Series 2004A, 5.000%, 4/01/23 – NPFG Insured | 4/14 at 100.00 | AA | | 1,045,910 | |
| | | | New York State Thruway Authority, Highway and Bridge Trust Fund Bonds, Second General, Series 2005B: | | | | | |
| | 2,960 | | 5.500%, 4/01/20 – AMBAC Insured | No Opt. Call | AA | | 3,391,034 | |
| | 500 | | 5.000%, 4/01/21 – AMBAC Insured | 10/15 at 100.00 | AA | | 518,655 | |
| | 750 | | New York State Thruway Authority, State Personal Income Tax Revenue Bonds, Series 2004A, 5.000%, 3/15/24 – AMBAC Insured | 9/14 at 100.00 | AAA | | 786,503 | |
| | | | New York State Tobacco Settlement Financing Corporation, Tobacco Settlement Asset-Backed and State Contingency Contract-Backed Bonds, Series 2003A-1: | | | | | |
| | 2,100 | | 5.250%, 6/01/20 – AMBAC Insured | 6/13 at 100.00 | AA– | | 2,193,282 | |
| | 3,800 | | 5.250%, 6/01/22 – AMBAC Insured | 6/13 at 100.00 | AA– | | 3,918,787 | |
| | 1,900 | | New York State Urban Development Corporation, Revenue Bonds, Correctional Facilities, Series 1994A, 5.250%, 1/01/14 – AGM Insured | No Opt. Call | AA+ | | 2,024,640 | |
| | 500 | | New York State Urban Development Corporation, State Personal Income Tax Revenue Bonds, Series 2005B, 5.000%, 3/15/30 – AGM Insured | 3/15 at 100.00 | AAA | | 505,975 | |
| | 345 | | Niagara Falls City School District, Niagara County, New York, Certificates of Participation, High School Facility, Series 2005, 5.000%, 6/15/28 – AGM Insured | 6/15 at 100.00 | AA+ | | 338,152 | |
| | 1,000 | | Puerto Rico Highway and Transportation Authority, Highway Revenue Refunding Bonds, Series 2002E, 5.500%, 7/01/18 – AGM Insured | No Opt. Call | AA+ | | 1,076,250 | |
| | 975 | | Puerto Rico Sales Tax Financing Corporation, Sales Tax Revenue Bonds, First Subordinate Series 2010A, 5.500%, 8/01/42 | 2/20 at 100.00 | A+ | | 897,410 | |
| | 1,470 | | Puerto Rico Sales Tax Financing Corporation, Sales Tax Revenue Bonds, First Subordinate Series 2010C, 5.125%, 8/01/42 – AGM Insured | 8/20 at 100.00 | AA+ | | 1,353,091 | |
| | 1,290 | | Syracuse Industrial Development Authority, New York, PILOT Mortgage Revenue Bonds, Carousel Center Project, Series 2007A, 5.000%, 1/01/36 – SYNCORA GTY Insured (Alternative Minimum Tax) | 1/17 at 100.00 | BBB– | | 946,280 | |
| | 71,360 | | Total Tax Obligation/Limited | | | | 72,714,072 | |
| | | Nuveen Insured New York Premium Income Municipal Fund, Inc. (continued) |
| NNF | | Portfolio of Investments |
March 31, 2011 (Unaudited)
| | Principal | | | Optional Call | | | | |
| | Amount (000) | | Description (1) | Provisions (2) | Ratings (3) | | Value | |
| | | | Transportation – 15.4% (9.9% of Total Investments) | | | | | |
| $ | 2,000 | | Metropolitan Transportation Authority, New York, Transportation Revenue Bonds, Series 2003A, 5.000%, 11/15/25 – AGM Insured | 11/13 at 100.00 | AA+ | $ | 2,003,300 | |
| | | | Metropolitan Transportation Authority, New York, Transportation Revenue Bonds, Series 2005A: | | | | | |
| | 600 | | 4.750%, 11/15/27 – NPFG Insured | 11/15 at 100.00 | AA+ | | 587,814 | |
| | 1,500 | | 4.750%, 11/15/30 – AMBAC Insured | 11/15 at 100.00 | A | | 1,388,805 | |
| | | | Metropolitan Transportation Authority, New York, Transportation Revenue Refunding Bonds, Series 2002A: | | | | | |
| | 500 | | 5.500%, 11/15/19 – AMBAC Insured | 11/12 at 100.00 | A | | 527,050 | |
| | 2,010 | | 5.000%, 11/15/25 – FGIC Insured | 11/12 at 100.00 | A | | 2,012,673 | |
| | 2,000 | | Metropolitan Transportation Authority, New York, Transportation Revenue Refunding Bonds, Series 2002E, 5.000%, 11/15/25 – NPFG Insured | 11/12 at 100.00 | A | | 2,002,660 | |
| | 330 | | New York State Thruway Authority, General Revenue Bonds, Refunding Series 2007H, 5.000%, 1/01/25 – FGIC Insured | 1/18 at 100.00 | A+ | | 339,976 | |
| | | | New York State Thruway Authority, General Revenue Bonds, Series 2005F: | | | | | |
| | 925 | | 5.000%, 1/01/20 – AMBAC Insured | 1/15 at 100.00 | A+ | | 956,339 | |
| | 2,240 | | 5.000%, 1/01/30 – AMBAC Insured | 1/15 at 100.00 | A+ | | 2,233,078 | |
| | 600 | | New York State Thruway Authority, General Revenue Bonds, Series 2005G, 5.000%, 1/01/30 – AGM Insured (UB) | 7/15 at 100.00 | AA+ | | 601,206 | |
| | 500 | | Niagara Frontier Airport Authority, New York, Airport Revenue Bonds, Buffalo Niagara International Airport, Series 1999A, 5.625%, 4/01/29 – NPFG Insured (Alternative Minimum Tax) | 10/11 at 100.00 | Baa1 | | 486,770 | |
| | | | Port Authority of New York and New Jersey, Consolidated Revenue Bonds, One Hundred Fortieth Series 2005: | | | | | |
| | 1,000 | | 5.000%, 12/01/28 – SYNCORA GTY Insured | 6/15 at 101.00 | Aa2 | | 1,016,100 | |
| | 565 | | 5.000%, 12/01/31 – SYNCORA GTY Insured | 6/15 at 101.00 | Aa2 | | 566,300 | |
| | 410 | | Port Authority of New York and New Jersey, Consolidated Revenue Bonds, One Hundred Forty Eighth Series 2008, Trust 2920, 17.512%, 8/15/32 – AGM Insured (IF) | 8/17 at 100.00 | AA+ | | 404,572 | |
| | | | Triborough Bridge and Tunnel Authority, New York, Subordinate Lien General Purpose Revenue Refunding Bonds, Series 2002E: | | | | | |
| | 780 | | 5.500%, 11/15/20 – NPFG Insured | No Opt. Call | Aa3 | | 885,932 | |
| | 2,300 | | 5.250%, 11/15/22 – NPFG Insured | 11/12 at 100.00 | Aa3 | | 2,377,832 | |
| | 18,260 | | Total Transportation | | | | 18,390,407 | |
| | | | U.S. Guaranteed – 8.2% (5.3% of Total Investments) (4) | | | | | |
| | 1,270 | | Dormitory Authority of the State of New York, Revenue Bonds, State University Educational Facilities, Series 2002A, 5.000%, 5/15/16 (Pre-refunded 5/15/12) – FGIC Insured | 5/12 at 101.00 | AA– (4) | | 1,348,600 | |
| | 500 | | Metropolitan Transportation Authority, New York, Dedicated Tax Fund Bonds, Series 1999A, 5.000%, 4/01/29 (Pre-refunded 10/01/14) – AGM Insured | 10/14 at 100.00 | AAA | | 569,360 | |
| | 1,000 | | New York City Health and Hospitals Corporation, New York, Health System Revenue Bonds, Series 2002A, 5.500%, 2/15/17 (Pre-refunded 2/15/12) – AGM Insured | 2/12 at 100.00 | Aaa | | 1,044,810 | |
| | | | New York City Transitional Finance Authority, New York, Future Tax Secured Bonds, Fiscal Series 2003C: | | | | | |
| | 715 | | 5.250%, 8/01/20 (Pre-refunded 8/01/12) – AMBAC Insured | 8/12 at 100.00 | AAA | | 760,917 | |
| | 2,345 | | 5.250%, 8/01/21 (Pre-refunded 8/01/12) – AMBAC Insured | 8/12 at 100.00 | AAA | | 2,495,596 | |
| | 1,000 | | New York State Thruway Authority, Highway and Bridge Trust Fund Bonds, Series 2002B, 5.000%, 4/01/20 (Pre-refunded 4/01/12) – AMBAC Insured | 4/12 at 100.00 | AAA | | 1,046,530 | |
| | 2,000 | | New York State Urban Development Corporation, State Personal Income Tax Revenue Bonds, State Facilities and Equipment, Series 2002C-1, 5.500%, 3/15/21 (Pre-refunded 3/15/13) – FGIC Insured | 3/13 at 100.00 | AAA | | 2,189,040 | |
| | 85 | | Niagara Falls, New York, General Obligation Bonds, Series 1994, 7.500%, 3/01/13 – NPFG Insured (ETM) | No Opt. Call | A2 (4) | | 96,081 | |
| | 265 | | Suffolk County Water Authority, New York, Subordinate Lien Waterworks Revenue Bonds, Series 1993, 5.100%, 6/01/12 – NPFG Insured (ETM) | No Opt. Call | AAA | | 279,580 | |
| | 9,180 | | Total U.S. Guaranteed | | | | 9,830,514 | |
| | Principal | | | Optional Call | | | | |
| | Amount (000) | | Description (1) | Provisions (2) | Ratings (3) | | Value | |
| | | | Utilities – 7.0% (4.5% of Total Investments) | | | | | |
| $ | 540 | | Guam Power Authority, Revenue Bonds, Series 2010A, 5.000%, 10/01/37 – AGM Insured | 10/20 at 100.00 | AA+ | $ | 474,941 | |
| | 500 | | Long Island Power Authority, New York, Electric System General Revenue Bonds, Series 2001A, 5.000%, 9/01/27 – AGM Insured | 9/11 at 100.00 | AA+ | | 500,140 | |
| | | | Long Island Power Authority, New York, Electric System General Revenue Bonds, Series 2006A: | | | | | |
| | 2,270 | | 5.000%, 12/01/23 – FGIC Insured | 6/16 at 100.00 | A– | | 2,334,740 | |
| | 2,930 | | 5.000%, 12/01/25 – FGIC Insured | 6/16 at 100.00 | A– | | 2,987,223 | |
| | 1,500 | | 5.000%, 12/01/26 – AGC Insured | 6/16 at 100.00 | AA+ | | 1,521,015 | |
| | 250 | | Long Island Power Authority, New York, Electric System General Revenue Bonds, Series 2006B, 5.000%, 12/01/35 – CIFG Insured | 6/16 at 100.00 | A– | | 236,765 | |
| | 250 | | Power Authority of the State of New York, General Revenue Bonds, Series 2006A, 5.000%, 11/15/19 – FGIC Insured | 11/15 at 100.00 | Aa2 | | 265,045 | |
| | 8,240 | | Total Utilities | | | | 8,319,869 | |
| | | | Water and Sewer – 10.0% (6.4% of Total Investments) | | | | | |
| | 2,000 | | New York City Municipal Water Finance Authority, New York, Water and Sewerage System Revenue Bonds, Second Generation Resolution, Fiscal 2010 Series 2009BB, 5.000%, 6/15/27 | 6/19 at 100.00 | AA+ | | 2,086,680 | |
| | 1,980 | | New York City Municipal Water Finance Authority, New York, Water and Sewerage System Revenue Bonds, Fiscal Series 2005C, 5.000%, 6/15/27 – NPFG Insured (UB) | 6/15 at 100.00 | AAA | | 2,030,767 | |
| | 1,200 | | New York City Municipal Water Finance Authority, New York, Water and Sewerage System Revenue Bonds, Fiscal Series 2006B, 5.000%, 6/15/36 – NPFG Insured (UB) | 6/16 at 100.00 | AAA | | 1,167,228 | |
| | 3,305 | | New York City Municipal Water Finance Authority, New York, Water and Sewerage System Revenue Bonds, Fiscal Series 2004C, 5.000%, 6/15/35 – AMBAC Insured | 6/14 at 100.00 | AAA | | 3,229,877 | |
| | 735 | | Suffolk County Water Authority, New York, Subordinate Lien Waterworks Revenue Bonds, Series 1993, 5.100%, 6/01/12 – NPFG Insured | No Opt. Call | Baa1 | | 770,477 | |
| | 2,500 | | Suffolk County Water Authority, New York, Waterworks Revenue Bonds, Series 2005C, 5.000%, 6/01/28 – NPFG Insured (UB) | 6/15 at 100.00 | AA+ | | 2,558,775 | |
| | 11,720 | | Total Water and Sewer | | | | 11,843,804 | |
| $ | 182,370 | | Total Investments (cost $185,051,410) – 155.0% | | | | 185,026,995 | |
| | | | Floating Rate Obligations – (13.9)% | | | | (16,600,000 | ) |
| | | | Other Assets Less Liabilities – 1.1% | | | | 1,328,711 | |
| | | | Auction Rate Preferred Shares, at Liquidation Value – (42.2)% (5) | | | | (50,350,000 | ) |
| | | | Net Assets Applicable to Common Shares – 100% | | | $ | 119,405,706 | |
| | | The Fund intends to invest at least 80% of its managed assets in municipal securities that are covered by insurance guaranteeing the timely payment of principal and interest. See Notes to Financial Statements, Footnote 1 – General Information and Significant Accounting Policies, Insurance for more information. |
| (1) | | All percentages shown in the Portfolio of Investments are based on net assets applicable to Common shares unless otherwise noted. |
| (2) | | Optional Call Provisions: Dates (month and year) and prices of the earliest optional call or redemption. There may be other call provisions at varying prices at later dates. Certain mortgage-backed securities may be subject to periodic principal paydowns. |
| (3) | | Ratings: Using the highest of Standard & Poor’s Group (“Standard & Poor’s”), Moody’s Investor Service, Inc. (“Moody’s”) or Fitch, Inc. (“Fitch”) rating. Ratings below BBB by Standard & Poor’s, Baa by Moody’s or BBB by Fitch are considered to be below investment grade. Holdings designated N/R are not rated by any of these national rating agencies. |
| (4) | | Backed by an escrow or trust containing sufficient U.S. Government or U.S. Government agency securities, which ensure the timely payment of principal and interest. Such investments are normally considered to be equivalent to AAA rated securities. |
| (5) | | Auction Rate Preferred Shares, at Liquidation Value as a percentage of Total Investments is 27.2%. |
| N/R | | Not rated. |
| (ETM) | | Escrowed to maturity. |
| (IF) | | Inverse floating rate investment. |
| (UB) | | Underlying bond of an inverse floating rate trust reflected as a financing transaction. See Notes to Financial Statements, Footnote 1 – General Information and Significant Accounting Policies, Inverse Floating Rate Securities for more information. |
See accompanying notes to financial statements.
| | | Nuveen Insured New York Dividend Advantage Municipal Fund |
| NKO | | Portfolio of Investments |
March 31, 2011 (Unaudited)
| | Principal | | | Optional Call | | | | |
| | Amount (000) | | Description (1) | Provisions (2) | Ratings (3) | | Value | |
| | | | Consumer Staples – 2.6% (1.7% of Total Investments) | | | | | |
| $ | 1,575 | | New York Counties Tobacco Trust II, Tobacco Settlement Pass-Through Bonds, Series 2001, 5.250%, 6/01/25 | 6/11 at 101.00 | BBB | $ | 1,378,456 | |
| | 1,000 | | New York Counties Tobacco Trust III, Tobacco Settlement Pass-Through Bonds, Series 2003, 5.750%, 6/01/33 | 6/13 at 100.00 | BBB | | 885,760 | |
| | 730 | | Puerto Rico, The Children’s Trust Fund, Tobacco Settlement Asset-Backed Refunding Bonds, Series 2002, 5.375%, 5/15/33 | 5/12 at 100.00 | BBB | | 645,181 | |
| | 3,305 | | Total Consumer Staples | | | | 2,909,397 | |
| | | | Education and Civic Organizations – 23.5% (15.5% of Total Investments) | | | | | |
| | 395 | | Dormitory Authority of the State of New York, Housing Revenue Bonds, Fashion Institute of Technology, Series 2007, 5.250%, 7/01/34 – FGIC Insured | No Opt. Call | BBB | | 355,113 | |
| | 4,000 | | Dormitory Authority of the State of New York, Insured Revenue Bonds, Mount Sinai School of Medicine, Series 1994A, 5.150%, 7/01/24 – NPFG Insured | No Opt. Call | A– | | 3,998,160 | |
| | 1,280 | | Dormitory Authority of the State of New York, Insured Revenue Bonds, | 7/11 at 100.00 | Baa1 | | 1,283,392 | |
| | | | New York Medical College, Series 1998, 5.000%, 7/01/21 – NPFG Insured | | | | | |
| | 1,000 | | Dormitory Authority of the State of New York, Lease Revenue Bonds, State University Dormitory Facilities, Series 2003B, 5.250%, 7/01/32 (Mandatory put 7/01/13) – SYNCORA GTY Insured | No Opt. Call | Aa2 | | 1,079,510 | |
| | 140 | | Dormitory Authority of the State of New York, Lease Revenue Bonds, State University Dormitory Facilities, Series 2004A, 5.000%, 7/01/29 – NPFG Insured | 7/15 at 100.00 | Aa2 | | 141,109 | |
| | 920 | | Dormitory Authority of the State of New York, Lease Revenue Bonds, State University Dormitory Facilities, Series 2006A, 5.000%, 7/01/31 – NPFG Insured | 7/16 at 100.00 | Aa2 | | 917,608 | |
| | 240 | | Dormitory Authority of the State of New York, Revenue Bonds, Barnard College, Series 2007A, 5.000%, 7/01/37 – FGIC Insured | 7/17 at 100.00 | BBB | | 222,158 | |
| | 580 | | Dormitory Authority of the State of New York, Revenue Bonds, Convent of the Sacred Heart, Series 2011, 5.750%, 11/01/40 – AGM Insured | 5/21 at 100.00 | AA+ | | 586,600 | |
| | 3,250 | | Dormitory Authority of the State of New York, Revenue Bonds, New York University, Series 1998A, 6.000%, 7/01/18 – NPFG Insured | No Opt. Call | AA– | | 3,854,110 | |
| | 330 | | Dormitory Authority of the State of New York, Revenue Bonds, New York University, Series 2007, 5.000%, 7/01/32 – AMBAC Insured | 7/17 at 100.00 | AA– | | 330,063 | |
| | 510 | | Madison County Industrial Development Agency, New York, Civic Facility Revenue Bonds, Colgate University, Tender Option Bond Trust 3127, 13.041%, 1/01/14 – AMBAC Insured (IF) | No Opt. Call | AA+ | | 493,486 | |
| | 300 | | New York City Industrial Development Agency, New York, Payment in Lieu of Taxes Revenue Bonds, Queens Baseball Stadium Project, Series 2009, 6.125%, 1/01/29 – AGC Insured | 1/19 at 100.00 | AA+ | | 315,630 | |
| | | | New York City Industrial Development Agency, New York, PILOT Revenue Bonds, Queens Baseball Stadium Project, Series 2006: | | | | | |
| | 1,000 | | 5.000%, 1/01/36 – AMBAC Insured | 1/17 at 100.00 | BB+ | | 830,930 | |
| | 1,060 | | 5.000%, 1/01/46 – AMBAC Insured | 1/17 at 100.00 | BB+ | | 849,685 | |
| | 885 | | New York City Industrial Development Agency, New York, Revenue Bonds, Yankee Stadium Project PILOT, Series 2009A, 7.000%, 3/01/49 – AGC Insured | 3/19 at 100.00 | AA+ | | 950,959 | |
| | | | New York City Industrial Development Authority, New York, PILOT Revenue Bonds, Yankee Stadium Project, Series 2006: | | | | | |
| | 395 | | 5.000%, 3/01/31 – FGIC Insured | 9/16 at 100.00 | BBB– | | 362,969 | |
| | 2,210 | | 5.000%, 3/01/36 – NPFG Insured | 9/16 at 100.00 | Baa1 | | 1,899,274 | |
| | 1,920 | | 4.500%, 3/01/39 – FGIC Insured | 9/16 at 100.00 | BBB– | | 1,489,613 | |
| | 1,560 | | New York City Trust for Cultural Resources, New York, Revenue Bonds, American Museum of Natural History, Series 2004A, 5.000%, 7/01/36 – NPFG Insured | 7/14 at 100.00 | AA | | 1,517,350 | |
| | 4,000 | | New York City Trust for Cultural Resources, New York, Revenue Bonds, Museum of Modern Art, Series 2001D, 5.125%, 7/01/31 – AMBAC Insured | 7/12 at 100.00 | Aa2 | | 3,962,360 | |
| | 1,000 | | Tompkins County Development Corporation, New York, Revenue Bonds, Ithaca College, Series 2011, 5.250%, 7/01/36 (WI/DD, Settling 4/07/11) – AGM Insured | 1/21 at 100.00 | A2 | | 980,720 | |
| | 350 | | Troy Capital Resource Corporation, New York, Revenue Bonds, Rensselaer Polytechnic Institute, Series 2010A, 5.125%, 9/01/40 | 9/20 at 100.00 | A | | 320,506 | |
| | 27,325 | | Total Education and Civic Organizations | | | | 26,741,305 | |
| | Principal | | | Optional Call | | | | |
| | Amount (000) | | Description (1) | Provisions (2) | Ratings (3) | | Value | |
| | | | Health Care – 15.0% (9.9% of Total Investments) | | | | | |
| $ | 1,400 | | Dormitory Authority of the State of New York, FHA-Insured Mortgage Hospital Revenue Bonds, St. Barnabas Hospital, Series 2002A, 5.125%, 2/01/22 – AMBAC Insured | 8/12 at 100.00 | N/R | $ | 1,411,396 | |
| | 760 | | Dormitory Authority of the State of New York, FHA-Insured Mortgage Revenue Bonds, Hudson Valley Hospital Center, Series 2007, 5.000%, 8/15/27 – AGM Insured | 8/17 at 100.00 | AA+ | | 771,134 | |
| | 425 | | Dormitory Authority of the State of New York, FHA-Insured Mortgage Revenue Bonds, Montefiore Hospital, Series 2004, 5.000%, 8/01/33 – FGIC Insured | 2/15 at 100.00 | BBB | | 403,066 | |
| | 1,500 | | Dormitory Authority of the State of New York, FHA-Insured Revenue Bonds, Montefiore Medical Center, Series 2005, 5.000%, 2/01/22 – FGIC Insured | 2/15 at 100.00 | BBB | | 1,526,895 | |
| | 2,050 | | Dormitory Authority of the State of New York, Hospital Revenue Bonds, Catholic Health Services of Long Island Obligated Group – St. Francis Hospital, Series 1999A, 5.500%, 7/01/22 – NPFG Insured | 7/11 at 100.00 | A3 | | 2,052,645 | |
| | 170 | | Dormitory Authority of the State of New York, Revenue Bonds, Catholic Health Services of Long Island Obligated Group – St. Charles Hospital and Rehabilitation Center, Series 1999A, 5.500%, 7/01/22 – NPFG Insured | 7/11 at 100.00 | A3 | | 170,219 | |
| | 1,540 | | Dormitory Authority of the State of New York, Revenue Bonds, Health Quest System Inc., Series 2007B, 5.250%, 7/01/27 – AGC Insured | 7/17 at 100.00 | AA+ | | 1,551,288 | |
| | 1,725 | | Dormitory Authority of the State of New York, Revenue Bonds, Memorial Sloan-Kettering Cancer Center, Series 2003-1, 5.000%, 7/01/21 – NPFG Insured | 7/13 at 100.00 | AA | | 1,771,230 | |
| | 875 | | Dormitory Authority of the State of New York, Revenue Bonds, New York and Presbyterian Hospital, Series 2004A, 5.250%, 8/15/15 – AGM Insured | 8/14 at 100.00 | AA+ | | 935,839 | |
| | 600 | | Dormitory Authority of the State of New York, Revenue Bonds, South Nassau Communities Hospital, Series 2003B, 5.500%, 7/01/23 | 7/13 at 100.00 | Baa1 | | 604,608 | |
| | 700 | | Dormitory Authority of the State of New York, Revenue Bonds, The New York and Presbyterian Hospital Project, Series 2007, 5.000%, 8/15/36 – AGM Insured | 8/14 at 100.00 | AA+ | | 665,224 | |
| | | | New York City Health and Hospitals Corporation, New York, Health System Revenue Bonds, Series 2003A: | | | | | |
| | 1,500 | | 5.250%, 2/15/21 – AMBAC Insured | 2/13 at 100.00 | Aa3 | | 1,543,815 | |
| | 1,000 | | 5.250%, 2/15/22 – AMBAC Insured | 2/13 at 100.00 | Aa3 | | 1,035,690 | |
| | | | Suffolk County Industrial Development Agency, New York, Revenue Bonds, Huntington Hospital, Series 2002C: | | | | | |
| | 725 | | 6.000%, 11/01/22 | 11/12 at 100.00 | A– | | 735,788 | |
| | 1,045 | | 5.875%, 11/01/32 | 11/12 at 100.00 | A– | | 1,041,771 | |
| | 850 | | Westchester County Health Care Corporation, New York, Senior Lien Revenue Bonds, Series 2010-C2, 6.125%, 11/01/37 | 11/20 at 100.00 | A3 | | 830,875 | |
| | 16,865 | | Total Health Care | | | | 17,051,483 | |
| | | | Housing/Multifamily – 5.3% (3.5% of Total Investments) | | | �� | | |
| | 1,000 | | Canton Capital Resource Corporation, New York, Student Housing Facility Revenue Bonds, Grasse River LLC at SUNY Canton Project Series 2010A, 5.000%, 5/01/40 | 5/20 at 100.00 | AA+ | | 874,900 | |
| | 180 | | New York City Housing Development Corporation, New York, Multifamily Housing Revenue Bonds, Seaview Towers, Series 2006A, 4.750%, 7/15/39 – AMBAC Insured (Alternative Minimum Tax) | 1/17 at 100.00 | AAA | | 160,024 | |
| | | | New York City Housing Development Corporation, New York, Multifamily Housing Revenue Bonds, Series 2002A: | | | | | |
| | 2,725 | | 5.375%, 11/01/23 (Alternative Minimum Tax) | 5/12 at 100.00 | AA | | 2,739,225 | |
| | 1,375 | | 5.500%, 11/01/34 (Alternative Minimum Tax) | 5/12 at 100.00 | AA | | 1,364,165 | |
| | 1,000 | | New York State Housing Finance Agency, Affordable Housing Revenue Bonds, Series 2007B, 5.300%, 11/01/37 (Alternative Minimum Tax) | 11/17 at 100.00 | Aa2 | | 937,740 | |
| | 6,280 | | Total Housing/Multifamily | | | | 6,076,054 | |
| | | | Long-Term Care – 4.1% (2.6% of Total Investments) | | | | | |
| | 1,500 | | Dormitory Authority of the State of New York, FHA-Insured Nursing Home Mortgage Revenue Bonds, Norwegian Christian Home and Health Center, Series 2001, 6.100%, 8/01/41 – NPFG Insured | 8/11 at 105.00 | Baa1 | | 1,593,600 | |
| | 510 | | Dormitory Authority of the State of New York, GNMA Collateralized Revenue Bonds, Cabrini of Westchester Project, Series 2006, 5.200%, 2/15/41 | 2/17 at 103.00 | AAA | | 487,290 | |
| | | | Dormitory Authority of the State of New York, GNMA Collateralized Revenue Bonds, Willow Towers Inc., Series 2002: | | | | | |
| | 1,000 | | 5.250%, 2/01/22 | 8/12 at 101.00 | AAA | | 1,023,560 | |
| | 1,500 | | 5.400%, 2/01/34 | 8/12 at 101.00 | AAA | | 1,500,780 | |
| | 4,510 | | Total Long-Term Care | | | | 4,605,230 | |
| | | Nuveen Insured New York Dividend Advantage Municipal Fund (continued) |
| NKO | | Portfolio of Investments |
March 31, 2011 (Unaudited)
| | Principal | | | Optional Call | | | | |
| | Amount (000) | | Description (1) | Provisions (2) | Ratings (3) | | Value | |
| | | | Tax Obligation/General – 8.0% (5.3% of Total Investments) | | | | | |
| | | | Buffalo, New York, General Obligation Bonds, Series 2002B: | | | | | |
| $ | 1,490 | | 5.375%, 11/15/18 – NPFG Insured | 11/12 at 100.00 | A1 | $ | 1,572,516 | |
| | 2,375 | | 5.375%, 11/15/20 – NPFG Insured | 11/12 at 100.00 | A1 | | 2,503,393 | |
| | 1,240 | | Canandaigua City School District, Ontario County, New York, General Obligation Refunding Bonds, Series 2002A, 5.375%, 4/01/17 – AGM Insured | 4/12 at 101.00 | Aa3 | | 1,303,662 | |
| | 200 | | New York City, New York, General Obligation Bonds, Fiscal 2009 Series E, 5.000%, 8/01/28 | 8/19 at 100.00 | AA | | 204,708 | |
| | 525 | | New York City, New York, General Obligation Bonds, Fiscal Series 2006C, 5.000%, 8/01/16 – AGM Insured | 8/15 at 100.00 | AA+ | | 580,230 | |
| | | | New York City, New York, General Obligation Bonds: | | | | | |
| | 1,700 | | 5.000%, 11/01/19 – AGM Insured (UB) | 11/14 at 100.00 | AA+ | | 1,788,876 | |
| | 1,100 | | 5.000%, 11/01/20 – AGM Insured (UB) | 11/14 at 100.00 | AA+ | | 1,150,930 | |
| | 8,630 | | Total Tax Obligation/General | | | | 9,104,315 | |
| | | | Tax Obligation/Limited – 49.0% (32.3% of Total Investments) | | | | | |
| | 210 | | Dormitory Authority of the State of New York, 853 Schools Program Insured Revenue Bonds, Vanderheyden Hall Inc., Issue 2, Series 1998F, 5.250%, 7/01/18 – AMBAC Insured | 6/11 at 100.00 | N/R | | 210,626 | |
| | 3,000 | | Dormitory Authority of the State of New York, Revenue Bonds, School Districts Financing Program, Series 2002D, 5.250%, 10/01/23 – NPFG Insured | 10/12 at 100.00 | A+ | | 3,101,460 | |
| | 160 | | Dormitory Authority of the State of New York, State Personal Income Tax Revenue Bonds, Series 2005F, 5.000%, 3/15/21 – AGM Insured | 3/15 at 100.00 | AAA | | 167,531 | |
| | 400 | | Erie County Industrial Development Agency, New York, School Facility Revenue Bonds, Buffalo City School District, Series 2003, 5.750%, | 5/12 at 100.00 | AA+ | | 415,300 | |
| | | | 5/01/20 – AGM Insured | | | | | |
| | | | Erie county Industrial Development Agency, New York, School Facility Revenue Bonds, Buffalo City School District Project, Series 2008A: | | | | | |
| | 590 | | 5.750%, 5/01/27 – AGM Insured (UB) | 5/18 at 100.00 | AA+ | | 638,185 | |
| | 190 | | 5.750%, 5/01/28 – AGM Insured (UB) | 5/18 at 100.00 | AA+ | | 204,560 | |
| | 2,485 | | Erie county Industrial Development Agency, New York, School Facility Revenue Bonds, Buffalo City School District Project, Series 2007A, 5.750%, 5/01/28 – AGM Insured (UB) | 5/17 at 100.00 | AA+ | | 2,651,992 | |
| | 4,760 | | Hudson Yards Infrastructure Corporation, New York, Revenue Bonds, Series 2006A, 5.000%, 2/15/47 – FGIC Insured | 2/17 at 100.00 | A | | 3,905,961 | |
| | 2,290 | | Metropolitan Transportation Authority, New York, Dedicated Tax Fund Bonds, Series 2002A, 5.250%, 11/15/25 – AGM Insured | 11/12 at 100.00 | AA+ | | 2,357,074 | |
| | 4,000 | | Metropolitan Transportation Authority, New York, State Service Contract Refunding Bonds, Series 2002A, 5.000%, 7/01/25 – FGIC Insured | 7/12 at 100.00 | AA– | | 4,006,880 | |
| | 1,000 | | Nassau County Interim Finance Authority, New York, Sales Tax Secured Revenue Bonds, Series 2003A, 5.000%, 11/15/18 – AMBAC Insured | 11/13 at 100.00 | AAA | | 1,070,490 | |
| | | | New York City Sales Tax Asset Receivable Corporation, New York, Dedicated Revenue Bonds, Local Government Assistance Corporation, Series 2004A: | | | | | |
| | 3,400 | | 5.000%, 10/15/25 – NPFG Insured | 10/14 at 100.00 | AAA | | 3,546,438 | |
| | 1,040 | | 5.000%, 10/15/26 – NPFG Insured | 10/14 at 100.00 | AAA | | 1,087,819 | |
| | 300 | | 5.000%, 10/15/29 – AMBAC Insured | 10/14 at 100.00 | AAA | | 305,097 | |
| | 3,950 | | 5.000%, 10/15/32 – AMBAC Insured | 10/14 at 100.00 | AAA | | 3,982,390 | |
| | 2,500 | | New York City Transitional Finance Authority, New York, Building Aid Revenue Bonds, Fiscal Series 2007S-2, 5.000%, 1/15/28 – FGIC Insured | 1/17 at 100.00 | AA– | | 2,526,725 | |
| | 5 | | New York City Transitional Finance Authority, New York, Future Tax Secured Bonds, Fiscal Series 2002B, 5.250%, 5/01/16 – NPFG Insured | 11/11 at 101.00 | AAA | | 5,180 | |
| | 500 | | New York City Transitional Finance Authority, New York, Future Tax Secured Bonds, Fiscal Series 2004C, 5.000%, 2/01/19 – SYNCORA GTY Insured | 2/14 at 100.00 | AAA | | 538,625 | |
| | | | New York City, New York, Educational Construction Fund, Revenue Bonds, Series 2011A: | | | | | |
| | 5,130 | | 5.750%, 4/01/33 – AGM Insured | 4/21 at 100.00 | AA+ | | 5,335,660 | |
| | 1,000 | | 5.750%, 4/01/41 | 4/21 at 100.00 | AA– | | 1,012,130 | |
| | | | New York Convention Center Development Corporation, Hotel Fee Revenue Bonds, Tender Option Bonds Trust 3095: | | | | | |
| | 165 | | 13.359%, 11/15/30 – AMBAC Insured (IF) | 11/15 at 100.00 | AA+ | | 172,618 | |
| | 140 | | 13.345%, 11/15/44 – AMBAC Insured (IF) | 11/15 at 100.00 | AA+ | | 130,941 | |
| | Principal | | | Optional Call | | | | |
| | Amount (000) | | Description (1) | Provisions (2) | Ratings (3) | | Value | |
| | | | Tax Obligation/Limited (continued) | | | | | |
| | | | New York State Thruway Authority, Highway and Bridge Trust Fund Bonds, Second General, Series 2005B: | | | | | |
| $ | 2,625 | | 5.500%, 4/01/20 – AMBAC Insured | No Opt. Call | AA | $ | 3,007,253 | |
| | 500 | | 5.000%, 4/01/21 – AMBAC Insured | 10/15 at 100.00 | AA | | 518,655 | |
| | | | New York State Tobacco Settlement Financing Corporation, Tobacco Settlement Asset-Backed and State Contingency Contract-Backed Bonds, Series 2003A-1: | | | | | |
| | 1,900 | | 5.250%, 6/01/20 – AMBAC Insured | 6/13 at 100.00 | AA– | | 1,984,398 | |
| | 1,000 | | 5.250%, 6/01/22 – AMBAC Insured | 6/13 at 100.00 | AA– | | 1,031,260 | |
| | 750 | | New York State Tobacco Settlement Financing Corporation, Tobacco Settlement Asset-Backed and State Contingency Contract-Backed Bonds, Series 2003B-1C, 5.500%, 6/01/21 | 6/13 at 100.00 | AA– | | 781,905 | |
| | 8,600 | | New York State Urban Development Corporation, Revenue Refunding Bonds, State Facilities, Series 1995, 5.700%, 4/01/20 – AGM Insured (UB) | No Opt. Call | AA+ | | 9,881,658 | |
| | 295 | | Puerto Rico Sales Tax Financing Corporation, Sales Tax Revenue Bonds, First Subordinate Series 2010C, 5.125%, 8/01/42 – AGM Insured | 8/20 at 100.00 | AA+ | | 271,539 | |
| | 1,225 | | Syracuse Industrial Development Authority, New York, PILOT Mortgage Revenue Bonds, Carousel Center Project, Series 2007A, 5.000%, 1/01/36 – SYNCORA GTY Insured (Alternative Minimum Tax) | 1/17 at 100.00 | BBB– | | 898,599 | |
| | 54,110 | | Total Tax Obligation/Limited | | | | 55,748,949 | |
| | | | Transportation – 17.8% (11.7% of Total Investments) | | | | | |
| | 2,000 | | Metropolitan Transportation Authority, New York, Transportation Revenue Bonds, Series 2003A, 5.000%, 11/15/25 – AGM Insured | 11/13 at 100.00 | AA+ | | 2,003,300 | |
| | 300 | | Metropolitan Transportation Authority, New York, Transportation Revenue Bonds, Series 2005A, 4.750%, 11/15/27 – NPFG Insured | 11/15 at 100.00 | AA+ | | 293,907 | |
| | | | Metropolitan Transportation Authority, New York, Transportation Revenue Refunding Bonds, Series 2002A: | | | | | |
| | 2,000 | | 5.125%, 11/15/22 – FGIC Insured | 11/12 at 100.00 | A | | 2,047,460 | |
| | 4,000 | | 5.000%, 11/15/25 – FGIC Insured | 11/12 at 100.00 | A | | 4,005,320 | |
| | 1,250 | | Metropolitan Transportation Authority, New York, Transportation Revenue Refunding Bonds, Series 2002F, 5.000%, 11/15/31 – NPFG Insured | 11/12 at 100.00 | A | | 1,185,950 | |
| | 315 | | New York State Thruway Authority, General Revenue Bonds, Refunding Series 2007H, 5.000%, 1/01/25 – FGIC Insured | 1/18 at 100.00 | A+ | | 324,522 | |
| | 865 | | New York State Thruway Authority, General Revenue Bonds, Series 2005F, 5.000%, 1/01/20 – AMBAC Insured | 1/15 at 100.00 | A+ | | 894,306 | |
| | 350 | | New York State Thruway Authority, General Revenue Bonds, Series 2005G, 5.000%, 1/01/30 – AGM Insured (UB) | 7/15 at 100.00 | AA+ | | 350,704 | |
| | 85 | | Niagara Frontier Airport Authority, New York, Airport Revenue Bonds, Buffalo Niagara International Airport, Series 1999A, 5.625%, 4/01/29 – NPFG Insured (Alternative Minimum Tax) | 10/11 at 100.00 | Baa1 | | 82,751 | |
| | 2,000 | | Port Authority of New York and New Jersey, Consolidated Revenue Bonds, One Hundred Fifty Second Series 2007, 5.000%, 11/01/28 (Alternative Minimum Tax) | 5/18 at 100.00 | Aa2 | | 1,919,680 | |
| | | | Port Authority of New York and New Jersey, Consolidated Revenue Bonds, One Hundred Fortieth Series 2005: | | | | | |
| | 500 | | 5.000%, 12/01/19 – AGM Insured | 6/15 at 101.00 | AA+ | | 538,800 | |
| | 1,000 | | 5.000%, 12/01/28 – SYNCORA GTY Insured | 6/15 at 101.00 | Aa2 | | 1,016,100 | |
| | 345 | | 5.000%, 12/01/31 – SYNCORA GTY Insured | 6/15 at 101.00 | Aa2 | | 345,794 | |
| | 390 | | Port Authority of New York and New Jersey, Consolidated Revenue Bonds, One Hundred Forty Eighth Series 2008, Trust 2920, 17.512%, 8/15/32 – AGM Insured (IF) | 8/17 at 100.00 | AA+ | | 384,836 | |
| | 4,000 | | Port Authority of New York and New Jersey, Consolidated Revenue Bonds, One Hundred Twenty-Fourth Series 2001, 5.000%, 8/01/11 – FGIC Insured (Alternative Minimum Tax) | 6/11 at 100.00 | Aa2 | | 4,014,959 | |
| | 780 | | Triborough Bridge and Tunnel Authority, New York, Subordinate Lien General Purpose Revenue Refunding Bonds, Series 2002E, 5.500%, 11/15/20 – NPFG Insured | No Opt. Call | Aa3 | | 885,932 | |
| | 20,180 | | Total Transportation | | | | 20,294,321 | |
| | | | U.S. Guaranteed – 10.5% (6.9% of Total Investments) (4) | | | | | |
| | 120 | | Dormitory Authority of the State of New York, Judicial Facilities Lease Revenue Bonds, Suffolk County Issue, Series 1986, 7.375%, 7/01/16 (ETM) | No Opt. Call | AAA | | 139,163 | |
| | 690 | | New York City Health and Hospitals Corporation, New York, Health System Revenue Bonds, Series 2002A, 5.500%, 2/15/17 (Pre-refunded 2/15/12) – AGM Insured | 2/12 at 100.00 | Aaa | | 720,919 | |
| | | Nuveen Insured New York Dividend Advantage Municipal Fund (continued) |
| NKO | | Portfolio of Investments |
March 31, 2011 (Unaudited)
| | Principal | | | Optional Call | | | | |
| | Amount (000) | | Description (1) | Provisions (2) | Ratings (3) | | Value | |
| | | | U.S. Guaranteed (4) (continued) | | | | | |
| $ | 4,995 | | New York City Transitional Finance Authority, New York, Future Tax Secured Bonds, Fiscal Series 2002B, 5.250%, 5/01/16 (Pre-refunded 11/01/11) – NPFG Insured | 11/11 at 101.00 | AAA | $ | 5,187,856 | |
| | 1,000 | | New York City Transitional Finance Authority, New York, Future Tax Secured Bonds, Fiscal Series 2003C, 5.250%, 8/01/21 (Pre-refunded 8/01/12) – AMBAC Insured | 8/12 at 100.00 | AAA | | 1,064,220 | |
| | 3,250 | | New York City, New York, General Obligation Bonds, Fiscal Series 2002C, 5.125%, 3/15/25 (Pre-refunded 3/15/12) – AGM Insured | 3/12 at 100.00 | AA+ (4) | | 3,397,388 | |
| | 120 | | New York State Housing Finance Agency, Construction Fund Bonds, State University, Series 1986A, 8.000%, 5/01/11 (ETM) | No Opt. Call | AAA | | 120,667 | |
| | 1,205 | | TSASC Inc., New York, Tobacco Asset-Backed Bonds, Series 2002-1, 5.500%, 7/15/24 (Pre-refunded 7/15/12) | 7/12 at 100.00 | AAA | | 1,269,552 | |
| | 11,380 | | Total U.S. Guaranteed | | | | 11,899,765 | |
| | | | Utilities – 13.0% (8.6% of Total Investments) | | | | | |
| | 5,000 | | Long Island Power Authority, New York, Electric System General Revenue Bonds, Series 2001A, 5.000%, 9/01/27 – AGM Insured | 9/11 at 100.00 | AA+ | | 5,001,399 | |
| | | | Long Island Power Authority, New York, Electric System General Revenue Bonds, Series 2006A: | | | | | |
| | 1,700 | | 5.000%, 12/01/23 – FGIC Insured | 6/16 at 100.00 | A– | | 1,748,484 | |
| | 1,300 | | 5.000%, 12/01/25 – FGIC Insured | 6/16 at 100.00 | A– | | 1,325,389 | |
| | 1,500 | | 5.000%, 12/01/26 – AGC Insured | 6/16 at 100.00 | AA+ | | 1,521,015 | |
| | 250 | | Long Island Power Authority, New York, Electric System General Revenue Bonds, Series 2006B, 5.000%, 12/01/35 – CIFG Insured | 6/16 at 100.00 | A– | | 236,765 | |
| | 5,000 | | New York State Energy Research and Development Authority, Pollution Control Revenue Refunding Bonds, Niagara Mohawk Power Corporation, Series 1998A, 5.150%, 11/01/25 – AMBAC Insured | 5/11 at 100.00 | A– | | 5,000,899 | |
| | 14,750 | | Total Utilities | | | | 14,833,951 | |
| | | | Water and Sewer – 3.0% (2.0% of Total Investments) | | | | | |
| | 1,140 | | New York City Municipal Water Finance Authority, New York, Water and Sewerage System Revenue Bonds, Series 2006B, 5.000%, 6/15/36 – NPFG Insured (UB) | 6/16 at 100.00 | AAA | | 1,108,867 | |
| | 2,295 | | Suffolk County Water Authority, New York, Waterworks Revenue Bonds, Series 2005C, 5.000%, 6/01/28 – NPFG Insured | 6/15 at 100.00 | AA+ | | 2,348,957 | |
| | 3,435 | | Total Water and Sewer | | | | 3,457,824 | |
| $ | 170,770 | | Total Investments (cost $173,138,876) – 151.8% | | | | 172,722,594 | |
| | | | Floating Rate Obligation – (10.2)% | | | | (11,620,000 | ) |
| | | | Variable Rate Demand Preferred Shares, at Liquidation Value – (43.9)% (5) | | | | (50,000,000 | ) |
| | | | Other Assets Less Liabilities – 2.3% | | | | 2,663,235 | |
| | | | Net Assets Applicable to Common Shares – 100% | | | $ | 113,765,829 | |
| | | The Fund intends to invest at least 80% of its managed assets in municipal securities that are covered by insurance guaranteeing the timely payment of principal and interest. See Notes to Financial Statements, Footnote 1 – General Information and Significant Accounting Policies, Insurance for more information. |
| (1) | | All percentages shown in the Portfolio of Investments are based on net assets applicable to Common shares unless otherwise noted. |
| (2) | | Optional Call Provisions: Dates (month and year) and prices of the earliest optional call or redemption. There may be other call provisions at varying prices at later dates. Certain mortgage-backed securities may be subject to periodic principal paydowns. |
| (3) | | Ratings: Using the highest of Standard & Poor’s Group (“Standard & Poor’s”), Moody’s Investor Service, Inc. (“Moody’s”) or Fitch, Inc. (“Fitch”) rating. Ratings below BBB by Standard & Poor’s, Baa by Moody’s or BBB by Fitch are considered to be below investment grade. Holdings designated N/R are not rated by any of these national rating agencies. |
| (4) | | Backed by an escrow or trust containing sufficient U.S. Government or U.S. Government agency securities, which ensure the timely payment of principal and interest. Such investments are normally considered to be equivalent to AAA rated securities. |
| (5) | | Variable Rate Demand Preferred Shares, at Liquidation Value as a percentage of Total Investment is 28.9%. |
| N/R | | Not rated. |
| WI/DD | | Purchased on a when-issued or delayed delivery basis. |
| (ETM) | | Escrowed to maturity. |
| (IF) | | Inverse floating rate investment. |
| (UB) | | Underlying bond of an inverse floating rate trust reflected as a financing transaction. See Notes to Financial Statements, Footnote 1 – General Information and Significant Accounting Policies, Inverse Floating Rate Securities for more information. |
See accompanying notes to financial statements.
| | | Nuveen Insured New York Tax-Free Advantage Municipal Fund |
| NRK | | Portfolio of Investments |
March 31, 2011 (Unaudited)
| | Principal | | | Optional Call | | | | |
| | Amount (000) | | Description (1) | Provisions (2) | Ratings (3) | | Value | |
| | | | Consumer Staples – 3.2% (2.0% of Total Investments) | | | | | |
| $ | 1,500 | | New York Counties Tobacco Trust III, Tobacco Settlement Pass-Through Bonds, Series 2003, 5.750%, 6/01/33 | 6/13 at 100.00 | BBB | $ | 1,328,640 | |
| | 290 | | Puerto Rico, The Children’s Trust Fund, Tobacco Settlement Asset-Backed Refunding Bonds, Series 2002, 5.375%, 5/15/33 | 5/12 at 100.00 | BBB | | 256,305 | |
| | 1,790 | | Total Consumer Staples | | | | 1,584,945 | |
| | | | Education and Civic Organizations – 23.2% (14.8% of Total Investments) | | | | | |
| | 2,000 | | Dormitory Authority of the State of New York, Insured Revenue Bonds, Long Island University, Series 2003A, 5.000%, 9/01/32 – RAAI Insured | 9/12 at 100.00 | Baa3 | | 1,828,000 | |
| | 2,000 | | Dormitory Authority of the State of New York, Insured Revenue Bonds, Mount Sinai School of Medicine, Series 1994A, 5.150%, 7/01/24 – NPFG Insured | No Opt. Call | A– | | 1,999,080 | |
| | 1,000 | | Dormitory Authority of the State of New York, Lease Revenue Bonds, State University Dormitory Facilities, Series 2003B, 5.250%, 7/01/32 (Mandatory put 7/01/13) – SYNCORA GTY Insured | No Opt. Call | Aa2 | | 1,079,510 | |
| | 410 | | Dormitory Authority of the State of New York, Lease Revenue Bonds, State University Dormitory Facilities, Series 2006A, 5.000%, 7/01/31 – NPFG Insured | 7/16 at 100.00 | Aa2 | | 408,934 | |
| | 1,000 | | Dormitory Authority of the State of New York, Revenue Bonds, Barnard College, Series 2007A, 5.000%, 7/01/25 – FGIC Insured | 7/17 at 100.00 | BBB | | 1,017,640 | |
| | 1,000 | | Dormitory Authority of the State of New York, Revenue Bonds, Mount St. Mary College, Series 2003, 5.000%, 7/01/32 – RAAI Insured | 7/13 at 100.00 | N/R | | 888,380 | |
| | | | Dormitory Authority of the State of New York, Revenue Bonds, Rochester Institute of Technology, Series 2006A: | | | | | |
| | 100 | | 5.250%, 7/01/20 – AMBAC Insured | No Opt. Call | A1 | | 108,572 | |
| | 80 | | 5.250%, 7/01/21 – AMBAC Insured | No Opt. Call | A1 | | 86,448 | |
| | 225 | | Madison County Industrial Development Agency, New York, Civic Facility Revenue Bonds, Colgate University, Tender Option Bond Trust 3127, 13.041%, 1/01/14 – AMBAC Insured (IF) | 7/15 at 100.00 | AA+ | | 217,715 | |
| | 300 | | New York City Industrial Development Agency, New York, Payment in Lieu of Taxes Revenue Bonds, Queens Baseball Stadium Project, Series 2009, 6.125%, 1/01/29 – AGC Insured | 1/19 at 100.00 | AA+ | | 315,630 | |
| | 495 | | New York City Industrial Development Agency, New York, Revenue Bonds, Yankee Stadium Project PILOT, Series 2009A, 7.000%, 3/01/49 – AGC Insured | 3/19 at 100.00 | AA+ | | 531,892 | |
| | | | New York City Industrial Development Authority, New York, PILOT Revenue Bonds, Yankee Stadium Project, Series 2006: | | | | | |
| | 170 | | 5.000%, 3/01/31 – FGIC Insured | 9/16 at 100.00 | BBB– | | 156,215 | |
| | 1,425 | | 5.000%, 3/01/36 – NPFG Insured | 9/16 at 100.00 | Baa1 | | 1,224,645 | |
| | 840 | | 4.500%, 3/01/39 – FGIC Insured | 9/16 at 100.00 | BBB– | | 651,706 | |
| | 1,000 | | New York City Trust for Cultural Resources, New York, Revenue Bonds, American Museum of Natural History, Series 2004A, 5.000%, 7/01/36 – NPFG Insured | 7/14 at 100.00 | AA | | 972,660 | |
| | 12,045 | | Total Education and Civic Organizations | | | | 11,487,027 | |
| | | | Health Care – 22.3% (14.2% of Total Investments) | | | | | |
| | 2,000 | | Dormitory Authority of the State of New York, FHA-Insured Mortgage Hospital Revenue Bonds, Lutheran Medical Center, Series 2003, 5.000%, 8/01/31 – NPFG Insured | 2/13 at 100.00 | Baa1 | | 1,928,140 | |
| | 3,000 | | Dormitory Authority of the State of New York, FHA-Insured Mortgage Hospital Revenue Bonds, St. Barnabas Hospital, Series 2002A, 5.000%, 2/01/31 – AMBAC Insured | 8/12 at 100.00 | N/R | | 2,893,710 | |
| | 335 | | Dormitory Authority of the State of New York, FHA-Insured Mortgage Revenue Bonds, Hudson Valley Hospital Center, Series 2007, 5.000%, 8/15/27 – AGM Insured | 8/17 at 100.00 | AA+ | | 339,908 | |
| | 1,000 | | Dormitory Authority of the State of New York, FHA-Insured Revenue Bonds, Montefiore Medical Center, Series 2005, 5.000%, 2/01/22 – FGIC Insured | 2/15 at 100.00 | BBB | | 1,017,930 | |
| | 255 | | Dormitory Authority of the State of New York, Revenue Bonds, Health Quest System Inc., Series 2007B, 5.125%, 7/01/37 – AGC Insured | 7/17 at 100.00 | AA+ | | 240,427 | |
| | 25 | | Dormitory Authority of the State of New York, Revenue Bonds, Memorial Sloan-Kettering Cancer Center, Series 2003-1, 5.000%, 7/01/21 – NPFG Insured | 7/13 at 100.00 | AA | | 25,670 | |
| | 780 | | Dormitory Authority of the State of New York, Revenue Bonds, New York and Presbyterian Hospital, Series 2004A, 5.250%, 8/15/15 – AGM Insured | 8/14 at 100.00 | AA+ | | 834,233 | |
| | | Nuveen Insured New York Tax-Free Advantage Municipal Fund (continued) |
| NRK | | Portfolio of Investments |
March 31, 2011 (Unaudited)
| | Principal | | | Optional Call | | | | |
| | Amount (000) | | Description (1) | Provisions (2) | Ratings (3) | | Value | |
| | | | Health Care (continued) | | | | | |
| $ | 750 | | Dormitory Authority of the State of New York, Revenue Bonds, South Nassau Communities Hospital, Series 2003B, 5.500%, 7/01/23 | 7/13 at 100.00 | Baa1 | $ | 755,760 | |
| | 305 | | Dormitory Authority of the State of New York, Revenue Bonds, The New York and Presbyterian Hospital Project, Series 2007, 5.000%, 8/15/36 – AGM Insured | 8/14 at 100.00 | AA+ | | 289,848 | |
| | 2,640 | | New York City Health and Hospitals Corporation, New York, Health System Revenue Bonds, Series 2003A, 5.250%, 2/15/21 – AMBAC Insured | 2/13 at 100.00 | Aa3 | | 2,717,114 | |
| | 11,090 | | Total Health Care | | | | 11,042,740 | |
| | | | Long-Term Care – 3.8% (2.4% of Total Investments) | | | | | |
| | 1,500 | | Dormitory Authority of the State of New York, FHA-Insured Nursing Home Mortgage Revenue Bonds, Norwegian Christian Home and Health Center, Series 2001, 6.100%, 8/01/41 – NPFG Insured | 8/11 at 105.00 | Baa1 | | 1,593,600 | |
| | 290 | | Dormitory Authority of the State of New York, GNMA Collateralized Revenue Bonds, Cabrini of Westchester Project, Series 2006, 5.200%, 2/15/41 | 2/17 at 103.00 | AAA | | 277,086 | |
| | 1,790 | | Total Long-Term Care | | | | 1,870,686 | |
| | | | Tax Obligation/General – 3.2% (2.0% of Total Investments) | | | | | |
| | 1,000 | | Nassau County, New York, General Obligation Bonds, General Improvement Series 2009C, 5.000%, 10/01/29 – AGC Insured | 10/19 at 100.00 | AA+ | | 1,008,270 | |
| | 50 | | New York City, New York, General Obligation Bonds, Fiscal Series 1998H, 5.125%, 8/01/25 – NPFG Insured | 6/11 at 100.00 | AA | | 50,128 | |
| | 225 | | New York City, New York, General Obligation Bonds, Fiscal Series 2006C, 5.000%, 8/01/16 – AGM Insured | 8/15 at 100.00 | AA+ | | 248,670 | |
| | 250 | | New York City, New York, General Obligation Bonds, 5.000%, 11/01/19 – AGM Insured (UB) | 11/14 at 100.00 | AA+ | | 263,070 | |
| | 1,525 | | Total Tax Obligation/General | | | | 1,570,138 | |
| | | | Tax Obligation/Limited – 46.2% (29.4% of Total Investments) | | | | | |
| | 2,695 | | Buffalo Fiscal Stability Authority, New York, Sales Tax Revenue State Aid Secured Bonds, Series 2004A, 5.250%, 8/15/12 – NPFG Insured | No Opt. Call | Aa1 | | 2,861,120 | |
| | 1,000 | | Dormitory Authority of the State of New York, Master Lease Program Revenue Bonds, Nassau County Board of Cooperative Educational Services, Series 2009A, 5.000%, 8/15/28 – AGC Insured | 8/19 at 100.00 | AA+ | | 1,016,360 | |
| | 3,000 | | Dormitory Authority of the State of New York, Revenue Bonds, School Districts Financing Program, Series 2002D, 5.250%, 10/01/23 – NPFG Insured | 10/12 at 100.00 | A+ | | 3,101,460 | |
| | 1,000 | | Dormitory Authority of the State of New York, Revenue Bonds, School Districts Financing Program, Series 2009A, 5.625%, 10/01/29 – AGC Insured | 10/19 at 100.00 | AA+ | | 1,044,610 | |
| | 340 | | Erie County Industrial Development Agency, New York, School Facility Revenue Bonds, Buffalo City School District Project, Series 2008A, 5.750%, 5/01/27 – AGM Insured (UB) | 5/18 at 100.00 | AA+ | | 367,768 | |
| | 1,085 | | Erie County Industrial Development Agency, New York, School Facility Revenue Bonds, Buffalo City School District, Series 2007A, 5.750%, | 5/17 at 100.00 | AA+ | | 1,157,912 | |
| | | | 5/01/28 – AGM Insured (UB) | | | | | |
| | 2,055 | | Hudson Yards Infrastructure Corporation, New York, Revenue Bonds, Series 2006A, 5.000%, 2/15/47 – FGIC Insured | 2/17 at 100.00 | A | | 1,686,292 | |
| | 1,000 | | Metropolitan Transportation Authority, New York, State Service Contract Refunding Bonds, Series 2002A, 5.000%, 7/01/25 – FGIC Insured | 7/12 at 100.00 | AA– | | 1,001,720 | |
| | 560 | | Monroe Newpower Corporation, New York, Power Facilities Revenue Bonds, Series 2003, 5.500%, 1/01/34 | 1/13 at 102.00 | BBB | | 486,550 | |
| | | | New York City Sales Tax Asset Receivable Corporation, New York, Dedicated Revenue Bonds, Local Government Assistance Corporation, Series 2004A: | | | | | |
| | 610 | | 5.000%, 10/15/25 – NPFG Insured (UB) | 10/14 at 100.00 | AAA | | 636,273 | |
| | 555 | | 5.000%, 10/15/26 – NPFG Insured (UB) | 10/14 at 100.00 | AAA | | 580,519 | |
| | 740 | | New York City Transitional Finance Authority, New York, Building Aid Revenue Bonds, Fiscal Series 2007S-2, 5.000%, 1/15/28 – FGIC Insured | 1/17 at 100.00 | AA– | | 747,911 | |
| | 2,000 | | New York City Transitional Finance Authority, New York, Future Tax Secured Refunding Bonds, Fiscal Series 2003D, 5.000%, 2/01/22 – NPFG Insured | 2/13 at 100.00 | AAA | | 2,094,120 | |
| | 1,000 | | New York City, New York, Educational Construction Fund, Revenue Bonds, Series 2011A, 5.750%, 4/01/33 – AGM Insured | 4/21 at 100.00 | AA+ | | 1,040,090 | |
| | Principal | | | Optional Call | | | | |
| | Amount (000) | | Description (1) | Provisions (2) | Ratings (3) | | Value | |
| | | | Tax Obligation/Limited (continued) | | | | | |
| $ | 280 | | New York Convention Center Development Corporation, Hotel Fee Revenue Bonds, Tender Option Bonds Trust 3095, 13.345%, 11/15/44 – AMBAC Insured (IF) | 11/15 at 100.00 | AA+ | $ | 261,881 | |
| | 1,290 | | New York State Environmental Facilities Corporation, State Personal Income Tax Revenue Bonds, Series 2002A, 5.000%, 1/01/23 – FGIC Insured | 1/13 at 100.00 | AAA | | 1,347,328 | |
| | 950 | | New York State Thruway Authority, Highway and Bridge Trust Fund Bonds, Second General, Series 2005B, 5.500%, 4/01/20 – AMBAC Insured | No Opt. Call | AA | | 1,088,339 | |
| | 1,200 | | New York State Tobacco Settlement Financing Corporation, Tobacco Settlement Asset-Backed and State Contingency Contract-Backed Bonds, Series 2003A-1, 5.250%, 6/01/20 – AMBAC Insured | 6/13 at 100.00 | AA– | | 1,253,304 | |
| | 750 | | New York State Tobacco Settlement Financing Corporation, Tobacco Settlement Asset-Backed and State Contingency Contract-Backed Bonds, Series 2003B-1C, 5.500%, 6/01/21 | 6/13 at 100.00 | AA– | | 781,905 | |
| | 295 | | Puerto Rico Sales Tax Financing Corporation, Sales Tax Revenue Bonds, First Subordinate Series 2010C, 5.125%, 8/01/42 – AGM Insured | 8/20 at 100.00 | AA+ | | 271,539 | |
| | 22,405 | | Total Tax Obligation/Limited | | | | 22,827,001 | |
| | | | Transportation – 13.8% (8.8% of Total Investments) | | | | | |
| | | | Metropolitan Transportation Authority, New York, Transportation Revenue Bonds, Series 2005A: | | | | | |
| | 100 | | 4.750%, 11/15/27 – NPFG Insured | 11/15 at 100.00 | AA+ | | 97,969 | |
| | 500 | | 4.750%, 11/15/30 – AMBAC Insured | 11/15 at 100.00 | A | | 462,935 | |
| | 1,000 | | Metropolitan Transportation Authority, New York, Transportation Revenue Refunding Bonds, Series 2002A, 5.000%, 11/15/25 – FGIC Insured | 11/12 at 100.00 | A | | 1,001,330 | |
| | 140 | | New York State Thruway Authority, General Revenue Bonds, Refunding Series 2007H, 5.000%, 1/01/25 – FGIC Insured | 1/18 at 100.00 | A+ | | 144,232 | |
| | 1,875 | | New York State Thruway Authority, General Revenue Bonds, Series 2005F, 5.000%, 1/01/20 – AMBAC Insured | 1/15 at 100.00 | A+ | | 1,938,525 | |
| | 3,000 | | New York State Thruway Authority, General Revenue Bonds, Series 2005G, 5.000%, 1/01/32 – AGM Insured | 7/15 at 100.00 | AA+ | | 2,990,160 | |
| | 170 | | Port Authority of New York and New Jersey, Consolidated Revenue Bonds, One Hundred Forty Eighth Series 2008, Trust 2920, 17.512%, 8/15/32 – AGM Insured (IF) | 8/17 at 100.00 | AA+ | | 167,749 | |
| | 6,785 | | Total Transportation | | | | 6,802,900 | |
| | | | U.S. Guaranteed – 33.8% (21.5% of Total Investments) (4) | | | | | |
| | 1,185 | | Dormitory Authority of the State of New York, FHA-Insured Nursing Home Mortgage Revenue Bonds, Shorefront Jewish Geriatric Center Inc., Series 2002, 5.200%, 2/01/32 (Pre-refunded 2/01/13) | 2/13 at 102.00 | Aaa | | 1,306,865 | |
| | 500 | | Dormitory Authority of the State of New York, Revenue Bonds, North Shore Long Island Jewish Group, Series 2003, 5.375%, 5/01/23 (Pre-refunded 5/01/13) | 5/13 at 100.00 | Aaa | | 548,895 | |
| | 2,500 | | Dormitory Authority of the State of New York, Revenue Bonds, Rochester Institute of Technology, Series 2002A, 5.250%, 7/01/22 (Pre-refunded 7/01/12) – AMBAC Insured | 7/12 at 100.00 | A1 (4) | | 2,651,500 | |
| | 70 | | Erie County Water Authority, New York, Water Revenue Bonds, Series 1990B, 6.750%, 12/01/14 – AMBAC Insured (ETM) | 12/14 at 100.00 | N/R (4) | | 77,937 | |
| | 500 | | New York City Health and Hospitals Corporation, New York, Health System Revenue Bonds, Series 2002A, 5.500%, 2/15/17 (Pre-refunded 2/15/12) – AGM Insured | 2/12 at 100.00 | Aaa | | 522,405 | |
| | 3,000 | | New York City Transitional Finance Authority, New York, Future Tax Secured Bonds, Fiscal Series 2003C, 5.250%, 8/01/18 (Pre-refunded 8/01/12) – AMBAC Insured | 8/12 at 100.00 | AAA | | 3,192,660 | |
| | 3,500 | | New York State Thruway Authority, Highway and Bridge Trust Fund Bonds, Series 2002B, 5.000%, 4/01/20 (Pre-refunded 4/01/12) – AMBAC Insured | 4/12 at 100.00 | AAA | | 3,662,852 | |
| | 500 | | New York State Urban Development Corporation, State Personal Income Tax Revenue Bonds, State Facilities and Equipment, Series 2002C-1, 5.500%, 3/15/21 (Pre-refunded 3/15/13) – FGIC Insured | 3/13 at 100.00 | AAA | | 547,260 | |
| | 2,000 | | Power Authority of the State of New York, General Revenue Bonds, Series 2002A, 5.000%, 11/15/20 (Pre-refunded 11/15/12) | 11/12 at 100.00 | Aa2 (4) | | 2,146,060 | |
| | 1,975 | | Triborough Bridge and Tunnel Authority, New York, General Purpose Revenue Bonds, Series 2002A, 5.125%, 1/01/31 (Pre-refunded 1/01/12) – NPFG Insured | 1/12 at 100.00 | AAA | | 2,047,167 | |
| | 15,730 | | Total U.S. Guaranteed | | | | 16,703,601 | |
| | | Nuveen Insured New York Tax-Free Advantage Municipal Fund (continued) |
| NRK | | Portfolio of Investments |
March 31, 2011 (Unaudited)
| | Principal | | | Optional Call | | | | |
| | Amount (000) | | Description (1) | Provisions (2) | Ratings (3) | | Value | |
| | | | Utilities – 6.6% (4.3% of Total Investments) | | | | | |
| | | | Long Island Power Authority, New York, Electric System General Revenue Bonds, Series 2006A: | | | | | |
| $ | 1,130 | | 5.000%, 12/01/23 – FGIC Insured | 6/16 at 100.00 | A– | $ | 1,162,228 | |
| | 870 | | 5.000%, 12/01/25 – FGIC Insured | 6/16 at 100.00 | A– | | 886,991 | |
| | 1,000 | | 5.000%, 12/01/26 – AGC Insured | 6/16 at 100.00 | AA+ | | 1,014,010 | |
| | 125 | | Long Island Power Authority, New York, Electric System General Revenue Bonds, Series 2006B, 5.000%, 12/01/35 – CIFG Insured | 6/16 at 100.00 | A– | | 118,383 | |
| | 110 | | Power Authority of the State of New York, General Revenue Bonds, Series 2006A, 5.000%, 11/15/19 – FGIC Insured | 11/15 at 100.00 | Aa2 | | 116,619 | |
| | 3,235 | | Total Utilities | | | | 3,298,231 | |
| | | | Water and Sewer – 1.0% (0.6% of Total Investments) | | | | | |
| | 495 | | New York City Municipal Water Finance Authority, New York, Water and Sewer System Revenue Bonds, Series 2006B, 5.000%, 6/15/36 – NPFG Insured (UB) | 6/16 at 100.00 | AAA | | 481,482 | |
| $ | 76,890 | | Total Investments (cost $77,758,819) – 157.1% | | | | 77,668,751 | |
| | | | Floating Rate Obligations – (4.8)% | | | | (2,390,000 | ) |
| | | | MuniFund Term Preferred Shares, at Liquidation Value – (56.0)% (5) | | | | (27,680,000 | ) |
| | | | Other Assets Less Liabilities – 3.7% | | | | 1,837,271 | |
| | | | Net Assets Applicable to Common Shares – 100% | | | $ | 49,436,022 | |
| | | The Fund intends to invest at least 80% of its managed assets in municipal securities that are covered by insurance guaranteeing the timely payment of principal and interest. See Notes to Financial Statements, Footnote 1 – General Information and Significant Accounting Policies, Insurance for more information. |
| (1) | | All percentages shown in the Portfolio of Investments are based on net assets applicable to Common shares unless otherwise noted. |
| (2) | | Optional Call Provisions: Dates (month and year) and prices of the earliest optional call or redemption. There may be other call provisions at varying prices at later dates. Certain mortgage-backed securities may be subject to periodic principal paydowns. |
| (3) | | Ratings: Using the highest of Standard & Poor’s Group (“Standard & Poor’s”), Moody’s Investor Service, Inc. (“Moody’s”) or Fitch, Inc. (“Fitch”) rating. Ratings below BBB by Standard & Poor’s, Baa by Moody’s or BBB by Fitch are considered to be below investment grade. Holdings designated N/R are not rated by any of these national rating agencies. |
| (4) | | Backed by an escrow or trust containing sufficient U.S. Government or U.S. Government agency securities, which ensure the timely payment of principal and interest. Such investments are normally considered to be equivalent to AAA rated securities. |
| (5) | | MuniFund Term Preferred Shares, at Liquidation Value as a percentage of Total Investments is 35.6%. |
| N/R | | Not rated. |
| (ETM) | | Escrowed to maturity. |
| (IF) | | Inverse floating rate investment. |
| (UB) | | Underlying bond of an inverse floating rate trust reflected as a financing transaction. See Notes to Financial Statements, Footnote 1 – General Information and Significant Accounting Policies, Inverse Floating Rate Securities for more information. |
See accompanying notes to financial statements.
| | | Statement of |
| | | Assets & Liabilities |
| | | March 31, 2011 (Unaudited) |
| | | New York | | | New York | | | New York | |
| | | Investment | | | Select | | | Quality | |
| | | Quality | | | Quality | | | Income | |
| | | (NQN | ) | | (NVN | ) | | (NUN | ) |
| Assets | | | | | | | | | |
| Investments, at value (cost $395,556,703, $522,490,792 and $531,389,009, respectively) | | $ | 393,701,138 | | | $ | 524,500,926 | | | $ | 532,112,904 | |
| Cash | | | — | | | | 802,520 | | | | 4,257,167 | |
| Interest receivable | | | 5,616,970 | | | | 7,428,377 | | | | 7,477,445 | |
| Deferred offering costs | | | 686,339 | | | | 834,479 | | | | 836,816 | |
| Other assets | | | 119,502 | | | | 168,212 | | | | 170,124 | |
| Total assets | | | 400,123,949 | | | | 533,734,514 | | | | 544,854,456 | |
| Liabilities | | | | | | | | | | | | |
| Cash overdraft | | | 235,395 | | | | — | | | | — | |
| Floating rate obligations | | | 37,145,000 | | | | 33,510,000 | | | | 40,245,000 | |
| Payables: | | | | | | | | | | | | |
| Auction Rate Preferred share dividends | | | — | | | | — | | | | 5,532 | |
| Common share dividends | | | 1,002,192 | | | | 1,392,096 | | | | 1,423,752 | |
| Interest | | | — | | | | — | | | | — | |
| Investments purchased | | | — | | | | 1,426,752 | | | | 3,955,400 | |
| Offering costs | | | 287,398 | | | | 261,689 | | | | 297,657 | |
| MuniFund Term Preferred (MTP) shares, at liquidation value | | | — | | | | — | | | | — | |
| Variable Rate Demand Preferred (VRDP) shares, at liquidation value | | | 112,300,000 | | | | 164,800,000 | | | | 161,700,000 | |
| Accrued expenses: | | | | | | | | | | | | |
| Management fees | | | 207,516 | | | | 275,694 | | | | 280,107 | |
| Other | | | 117,756 | | | | 172,164 | | | | 177,042 | |
| Total liabilities | | | 151,295,257 | | | | 201,838,395 | | | | 208,084,490 | |
| Auction Rate Preferred Shares (ARPS), at liquidation value | | | — | | | | — | | | | — | |
| Net assets applicable to Common shares | | $ | 248,828,692 | | | $ | 331,896,119 | | | $ | 336,769,966 | |
| Common shares outstanding | | | 17,518,033 | | | | 23,198,402 | | | | 23,752,339 | |
| Net asset value per Common share outstanding (net assets applicable to Common shares, divided by Common shares outstanding) | | $ | 14.20 | | | $ | 14.31 | | | $ | 14.18 | |
| Net assets applicable to Common shares consist of: | | | | | | | | | | | | |
| Common shares, $.01 par value per share | | $ | 175,180 | | | $ | 231,984 | | | $ | 237,523 | |
| Paid-in surplus | | | 248,968,995 | | | | 328,424,282 | | | | 334,551,337 | |
| Undistributed (Over-distribution of) net investment income | | | 3,632,326 | | | | 4,727,027 | | | | 5,107,429 | |
| Accumulated net realized gain (loss) | | | (2,092,244 | ) | | | (3,497,308 | ) | | | (3,850,218 | ) |
| Net unrealized appreciation (depreciation) | | | (1,855,565 | ) | | | 2,010,134 | | | | 723,895 | |
| Net assets applicable to Common shares | | $ | 248,828,692 | | | $ | 331,896,119 | | | $ | 336,769,966 | |
| Authorized shares: | | | | | | | | | | | | |
| Common | | | 200,000,000 | | | | 200,000,000 | | | | 200,000,000 | |
| ARPS | | | 1,000,000 | | | | 1,000,000 | | | | 1,000,000 | |
| MTP | | | — | | | | — | | | | — | |
| VRDP | | Unlimited | | | Unlimited | | | Unlimited | |
See accompanying notes to financial statements.
| | | Statement of |
| | | Assets & Liabilities (Unaudited) (continued) |
| | | Insured | | | Insured | | | Insured | |
| | | New York | | | New York | | | New York | |
| | | Premium | | | Dividend | | | Tax-Free | |
| | | Income | | | Advantage | | | Advantage | |
| | | (NNF | ) | | (NKO | ) | | (NRK | ) |
| Assets | | | | | | | | | |
| Investments, at value (cost $185,051,410, $173,138,876 and $77,758,819, respectively) | | $ | 185,026,995 | | | $ | 172,722,594 | | | $ | 77,668,751 | |
| Cash | | | — | | | | 979,672 | | | | 666,757 | |
| Interest receivable | | | 2,636,521 | | | | 2,658,393 | | | | 1,034,489 | |
| Deferred offering costs | | | — | | | | 627,595 | | | | 540,817 | |
| Other assets | | | 24,525 | | | | 45,729 | | | | 34,234 | |
| Total assets | | | 187,688,041 | | | | 177,033,983 | | | | 79,945,048 | |
| Liabilities | | | | | | | | | | | | |
| Cash overdraft | | | 716,063 | | | | — | | | | — | |
| Floating rate obligations | | | 16,600,000 | | | | 11,620,000 | | | | 2,390,000 | |
| Payables: | | | | | | | | | | | | |
| Auction Rate Preferred share dividends | | | 1,350 | | | | — | | | | — | |
| Common share dividends | | | 476,281 | | | | 497,089 | | | | 207,206 | |
| Interest | | | — | | | | — | | | | 58,820 | |
| Investments purchased | | | — | | | | 986,150 | | | | — | |
| Offering costs | | | — | | | | 68,951 | | | | 106,886 | |
| MuniFund Term Preferred (MTP) shares, at liquidation value | | | — | | | | — | | | | 27,680,000 | |
| Variable Rate Demand Preferred (VRDP) shares, at liquidation value | | | — | | | | 50,000,000 | | | | — | |
| Accrued expenses: | | | | | | | | | | | | |
| Management fees | | | 98,644 | | | | 78,314 | | | | 41,501 | |
| Other | | | 39,997 | | | | 17,650 | | | | 24,613 | |
| Total liabilities | | | 17,932,335 | | | | 63,268,154 | | | | 30,509,026 | |
| Auction Rate Preferred Shares (ARPS), at liquidation value | | | 50,350,000 | | | | — | | | | — | |
| Net assets applicable to Common shares | | $ | 119,405,706 | | | $ | 113,765,829 | | | $ | 49,436,022 | |
| Common shares outstanding | | | 8,243,515 | | | | 7,937,131 | | | | 3,506,560 | |
| Net asset value per Common share outstanding (net assets applicable to Common shares, divided by Common shares outstanding) | | $ | 14.48 | | | $ | 14.33 | | | $ | 14.10 | |
| Net assets applicable to Common shares consist of: | | | | | | | | | | | | |
| Common shares, $.01 par value per share | | $ | 82,435 | | | $ | 79,371 | | | $ | 35,066 | |
| Paid-in surplus | | | 118,631,530 | | | | 113,666,918 | | | | 49,854,094 | |
| Undistributed (Over-distribution of) net investment income | | | 1,964,176 | | | | 1,286,273 | | | | 203,951 | |
| Accumulated net realized gain (loss) | | | (1,248,020 | ) | | | (850,451 | ) | | | (567,021 | ) |
| Net unrealized appreciation (depreciation) | | | (24,415 | ) | | | (416,282 | ) | | | (90,068 | ) |
| Net assets applicable to Common shares | | $ | 119,405,706 | | | $ | 113,765,829 | | | $ | 49,436,022 | |
| Authorized shares: | | | | | | | | | | | | |
| Common | | | 200,000,000 | | | Unlimited | | | Unlimited | |
| ARPS | | | 1,000,000 | | | Unlimited | | | Unlimited | |
| MTP | | | — | | | | — | | | Unlimited | |
| VRDP | | | — | | | Unlimited | | | | — | |
See accompanying notes to financial statements.
| | | Statement of |
| | | Operations |
| | | Six Months Ended March 31, 2011 (Unaudited) |
| | | | | | | | | | | | Insured | | | Insured | | | Insured | |
| | | New York | | | New York | | | New York | | | New York | | | New York | | | New York | |
| | | Investment | | | Select | | | Quality | | | Premium | | | Dividend | | | Tax-Free | |
| | | Quality | | | Quality | | | Income | | | Income | | | Advantage | | | Advantage | |
| | | (NQN | ) | | (NVN | ) | | (NUN | ) | | (NNF | ) | | (NKO | ) | | (NRK | ) |
| Investment Income | | $ | 9,329,770 | | | $ | 12,875,582 | | | $ | 12,881,296 | | | $ | 4,396,467 | | | $ | 4,215,186 | | | $ | 1,884,576 | |
| Expenses | | | | | | | | | | | | | | | | | | | | | | | | |
| Management fees | | | 1,234,971 | | | | 1,642,959 | | | | 1,666,675 | | | | 586,057 | | | | 553,182 | | | | 247,143 | |
| Auction fees | | | 56,773 | | | | 83,316 | | | | 90,622 | | | | 44,582 | | | | 25,278 | | | | — | |
| Dividend disbursing agent fees | | | — | | | | — | | | | 22,411 | | | | 9,973 | | | | — | | | | — | |
| Shareholders’ servicing agent fees and expenses | | | 12,473 | | | | 12,238 | | | | 12,358 | | | | 4,734 | | | | 593 | | | | 18,098 | |
| Interest expense and amortization of offering costs | | | 433,306 | | | | 553,406 | | | | 393,018 | | | | 57,517 | | | | 152,384 | | | | 422,414 | |
| Liquidity fees on VRDP shares | | | 433,682 | | | | 636,427 | | | | 363,693 | | | | — | | | | 257,454 | | | | — | |
| Custodian’s fees and expenses | | | 35,927 | | | | 47,360 | | | | 45,901 | | | | 19,605 | | | | 18,408 | | | | 11,602 | |
| Directors’/Trustees’ fees and expenses | | | 5,176 | | | | 7,112 | | | | 7,080 | | | | 2,402 | | | | 2,306 | | | | 1,088 | |
| Professional fees | | | 13,042 | | | | 16,661 | | | | 17,233 | | | | 9,826 | | | | 7,917 | | | | 5,642 | |
| Shareholders’ reports – printing and mailing expenses | | | 14,658 | | | | 17,410 | | | | 20,470 | | | | 8,780 | | | | 7,406 | | | | 4,070 | |
| Stock exchange listing fees | | | 4,532 | | | | 4,532 | | | | 4,532 | | | | 4,532 | | | | 553 | | | | 13,756 | |
| Investor relations expense | | | 11,688 | | | | 15,268 | | | | 15,405 | | | | 5,810 | | | | 5,240 | | | | 2,924 | |
| Other expenses | | | 20,296 | | | | 23,525 | | | | 26,578 | | | | 13,359 | | | | 15,948 | | | | 11,291 | |
| Total expenses before custodian fee credit and expense reimbursement | | | 2,276,524 | | | | 3,060,214 | | | | 2,685,976 | | | | 767,177 | | | | 1,046,669 | | | | 738,028 | |
| Custodian fee credit | | | (1,162 | ) | | | (3,425 | ) | | | (9,119 | ) | | | (697 | ) | | | (2,504 | ) | | | (305 | ) |
| Expense reimbursement | | | — | | | | — | | | | — | | | | — | | | | (88,116 | ) | | | (10,790 | ) |
| Net expenses | | | 2,275,362 | | | | 3,056,789 | | | | 2,676,857 | | | | 766,480 | | | | 956,049 | | | | 726,933 | |
| Net investment income (loss) | | | 7,054,408 | | | | 9,818,793 | | | | 10,204,439 | | | | 3,629,987 | | | | 3,259,137 | | | | 1,157,643 | |
| Realized and Unrealized Gain (Loss) | | | | | | | | | | | | | | | | | | | | | | | | |
| Net realized gain (loss) from investments | | | 677,860 | | | | 230,130 | | | | 431,813 | | | | 112,343 | | | | 55,700 | | | | (81,269 | ) |
| Change in net unrealized appreciation (depreciation) of investments | | | (23,001,208 | ) | | | (33,929,112 | ) | | | (32,238,309 | ) | | | (10,723,320 | ) | | | (8,715,687 | ) | | | (4,212,474 | ) |
| Net realized and unrealized gain (loss) | | | (22,323,348 | ) | | | (33,698,982 | ) | | | (31,806,496 | ) | | | (10,610,977 | ) | | | (8,659,987 | ) | | | (4,293,743 | ) |
| Distributions to Auction Rate Preferred Shareholders | | | | | | | | | | | | | | | | | | | | | | | | |
| From net investment income | | | — | | | | — | | | | (195,043 | ) | | | (104,313 | ) | | | — | | | | — | |
Decrease in net assets applicable to Common shares from distributions to Auction Rate Preferred shareholders | | | — | | | | — | | | | (195,043 | ) | | | (104,313 | ) | | | — | | | | — | |
| Net increase (decrease) in net assets applicable to Common shares from operations | | $ | (15,268,940 | ) | | $ | (23,880,189 | ) | | $ | (21,797,100 | ) | | $ | (7,085,303 | ) | | $ | (5,400,850 | ) | | $ | (3,136,100 | ) |
See accompanying notes to financial statements.
| | | Statement of |
| | | Changes in Net Assets (Unaudited) |
| | | New York | | | New York | | | New York | |
| | | Investment Quality (NQN) | | | Select Quality (NVN) | | | Quality Income (NUN) | |
| | | Six Months | | | Year | | | Six Months | | | Year | | | Six Months | | | Year | |
| | | Ended | | | Ended | | | Ended | | | Ended | | | Ended | | | Ended | |
| | | 3/31/11 | | | 9/30/10 | | | 3/31/11 | | | 9/30/10 | | | 3/31/11 | | | 9/30/10 | |
| Operations | | | | | | | | | | | | | | | | | | |
| Net investment income (loss) | | $ | 7,054,408 | | | $ | 15,306,739 | | | $ | 9,818,793 | | | $ | 21,221,615 | | | $ | 10,204,439 | | | $ | 21,690,212 | |
| Net realized gain (loss) from investments | | | 677,860 | | | | 1,107,452 | | | | 230,130 | | | | 819,456 | | | | 431,813 | | | | 571,906 | |
| Net increase from payments by the Adviser for losses realized on the disposal of investments purchased in violation of investment restrictions | | | — | | | | — | | | | — | | | | — | | | | — | | | | — | |
| Change in net unrealized appreciation (depreciation) of investments | | | (23,001,208 | ) | | | 5,430,758 | | | | (33,929,112 | ) | | | 6,657,396 | | | | (32,238,309 | ) | | | 5,806,336 | |
| Distributions to Auction Rate Preferred Shareholders: | | | | | | | | | | | | | | | | | | | | | | | | |
| From net investment income | | | — | | | | (428,280 | ) | | | — | | | | (642,714 | ) | | | (195,043 | ) | | | (651,201 | ) |
| From accumulated net realized gains | | | — | | | | — | | | | — | | | | — | | | | — | | | | — | |
| Net increase (decrease) in net assets applicable to Common shares from operations | | | (15,268,940 | ) | | | 21,416,669 | | | | (23,880,189 | ) | | | 28,055,753 | | | | (21,797,100 | ) | | | 27,417,253 | |
| Distributions to Common Shareholders | | | | | | | | | | | | | | | | | | | | | | | | |
| From net investment income | | | (7,042,250 | ) | | | (13,558,960 | ) | | | (9,743,329 | ) | | | (18,349,937 | ) | | | (9,833,469 | ) | | | (18,717,052 | ) |
| From accumulated net realized gains | | | (888,164 | ) | | | — | | | | (677,393 | ) | | | — | | | | (104,510 | ) | | | — | |
| Decrease in net assets applicable to Common shares from distributions to Common shareholders | | | (7,930,414 | ) | | | (13,558,960 | ) | | | (10,420,722 | ) | | | (18,349,937 | ) | | | (9,937,979 | ) | | | (18,717,052 | ) |
| Capital Share Transactions | | | | | | | | | | | | | | | | | | | | | | | | |
| Common shares repurchased and retired | | | — | | | | — | | | | — | | | | — | | | | — | | | | (21,811 | ) |
| Net increase (decrease) in net assets applicable to Common shares from capital share transactions | | | — | | | | — | | | | — | | | | — | | | | — | | | | (21,811 | ) |
| Net increase (decrease) in net assets applicable to Common shares | | | (23,199,354 | ) | | | 7,857,709 | | | | (34,300,911 | ) | | | 9,705,816 | | | | (31,735,079 | ) | | | 8,678,390 | |
| Net assets applicable to Common shares at the beginning of period | | | 272,028,046 | | | | 264,170,337 | | | | 366,197,030 | | | | 356,491,214 | | | | 368,505,045 | | | | 359,826,655 | |
| Net assets applicable to Common shares at the end of period | | $ | 248,828,692 | | | $ | 272,028,046 | | | $ | 331,896,119 | | | $ | 366,197,030 | | | $ | 336,769,966 | | | $ | 368,505,045 | |
| Undistributed (Over-distribution of) net investment income at the end of period | | $ | 3,632,326 | | | $ | 3,620,168 | | | $ | 4,727,027 | | | $ | 4,651,563 | | | $ | 5,107,429 | | | $ | 4,931,502 | |
See accompanying notes to financial statements.
| | | Insured New York | | | Insured New York | | | Insured New York | |
| | | Premium Income (NNF) | | | Dividend Advantage (NKO) | | | Tax-Free Advantage (NRK) | |
| | | Six Months | | | Year | | | Six Months | | | Year | | | Six Months | | | Year | |
| | | Ended | | | Ended | | | Ended | | | Ended | | | Ended | | | Ended | |
| | | 3/31/11 | | | 9/30/10 | | | 3/31/11 | | | 9/30/10 | | | 3/31/11 | | | 9/30/10 | |
| Operations | | | | | | | | | | | | | | | | | | |
| Net investment income (loss) | | $ | 3,629,987 | | | $ | 7,057,254 | | | $ | 3,259,137 | | | $ | 6,394,808 | | | $ | 1,157,643 | | | $ | 2,711,733 | |
| Net realized gain (loss) from investments | | | 112,343 | | | | 63,935 | | | | 55,700 | | | | (6,075 | ) | | | (81,269 | ) | | | (33,902 | ) |
| Net increase from payments by the Adviser for losses realized on the disposal of investments purchased in violation of investment restrictions | | | — | | | | — | | | | — | | | | — | | | | — | | | | 35,020 | |
| Change in net unrealized appreciation (depreciation) of investments | | | (10,723,320 | ) | | | 2,739,985 | | | | (8,715,687 | ) | | | 1,592,173 | | | | (4,212,474 | ) | | | 800,598 | |
| Distributions to Auction Rate Preferred Shareholders: | | | | | | | | | | | | | | | | | | | | | | | | |
| From net investment income | | | (104,313 | ) | | | (204,610 | ) | | | — | | | | — | | | | — | | | | (42,251 | ) |
| From accumulated net realized gains | | | — | | | | — | | | | — | | | | — | | | | — | | | | (36,601 | ) |
| Net increase (decrease) in net assets applicable to Common shares from operations | | | (7,085,303 | ) | | | 9,656,564 | | | | (5,400,850 | ) | | | 7,980,906 | | | | (3,136,100 | ) | | | 3,434,597 | |
| Distributions to Common Shareholders | | | | | | | | | | | | | | | | | | | | | | | | |
| From net investment income | | | (3,190,241 | ) | | | (6,068,555 | ) | | | (3,071,670 | ) | | | (6,127,465 | ) | | | (1,293,921 | ) | | | (2,563,296 | ) |
| From accumulated net realized gains | | | — | | | | — | | | | — | | | | (20,637 | ) | | | — | | | | (228,628 | ) |
| Decrease in net assets applicable to Common shares from distributions to Common shareholders | | | (3,190,241 | ) | | | (6,068,555 | ) | | | (3,071,670 | ) | | | (6,148,102 | ) | | | (1,293,921 | ) | | | (2,791,924 | ) |
| Capital Share Transactions | | | | | | | | | | | | | | | | | | | | | | | | |
| Common shares repurchased and retired | | | — | | | | (165,653 | ) | | | — | | | | — | | | | — | | | | — | |
| Net increase (decrease) in net assets applicable to Common shares from capital share transactions | | | — | | | | (165,653 | ) | | | — | | | | — | | | | — | | | | — | |
| Net increase (decrease) in net assets applicable to Common shares | | | (10,275,544 | ) | | | 3,422,356 | | | | (8,472,520 | ) | | | 1,832,804 | | | | (4,430,021 | ) | | | 642,673 | |
| Net assets applicable to Common shares at the beginning of period | | | 129,681,250 | | | | 126,258,894 | | | | 122,238,349 | | | | 120,405,545 | | | | 53,866,043 | | | | 53,223,370 | |
| Net assets applicable to Common shares at the end of period | | $ | 119,405,706 | | | $ | 129,681,250 | | | $ | 113,765,829 | | | $ | 122,238,349 | | | $ | 49,436,022 | | | $ | 53,866,043 | |
| Undistributed (Over-distribution of) net investment income at the end of period | | $ | 1,964,176 | | | $ | 1,628,743 | | | $ | 1,286,273 | | | $ | 1,098,806 | | | $ | 203,951 | | | $ | 340,229 | |
See accompanying notes to financial statements.
| | | Statement of |
| | | Cash Flows |
| | | Six Months Ended March 31, 2011 (Unaudited) |
| | | New York | | | New York | | | New York | |
| | | Investment | | | Select | | | Quality | |
| | | Quality | | | Quality | | | Income | |
| | | (NQN | ) | | (NVN | ) | | (NUN | ) |
| Cash Flows from Operating Activities: | | | | | | | | | |
| Net Increase (Decrease) in Net Assets Applicable to Common Shares from Operations | | $ | (15,268,940 | ) | | $ | (23,880,189 | ) | | $ | (21,797,100 | ) |
| Adjustments to reconcile the net increase (decrease) in net assets applicable to Common shares from operations to net cash provided by (used in) operating activities: | | | | | | | | | | | | |
| Purchases of investments | | | (11,066,006 | ) | | | (20,114,081 | ) | | | (27,165,217 | ) |
| Proceeds from sales and maturities of investments | | | 10,955,000 | | | | 9,203,566 | | | | 8,912,815 | |
| Proceeds from (Purchases of) short-term investments, net | | | 25,000 | | | | 25,000 | | | | — | |
| Amortization (Accretion) of premiums and discounts, net | | | 695,947 | | | | 303,621 | | | | 342,863 | |
| (Increase) Decrease in: | | | | | | | | | | | | |
| Receivable for interest | | | (84,637 | ) | | | (168,032 | ) | | | (249,288 | ) |
| Receivable for investments sold | | | 110,000 | | | | 8,559,582 | | | | 6,281,592 | |
| Other assets | | | 90,736 | | | | 120,432 | | | | (34,784 | ) |
| Increase (Decrease) in: | | | | | | | | | | | | |
| Payable for Auction Rate Preferred share dividends | | | — | | | | — | | | | (1,979 | ) |
| Payable for interest | | | — | | | | — | | | | — | |
| Payable for investments purchased | | | — | | | | 1,426,752 | | | | 3,955,400 | |
| Accrued management fees | | | (4,538 | ) | | | (7,234 | ) | | | (5,436 | ) |
| Accrued other expenses | | | (17,448 | ) | | | (42,428 | ) | | | (52,725 | ) |
| Net realized gain (loss) from: | | | | | | | | | | | | |
| Investments | | | (677,860 | ) | | | (230,130 | ) | | | (431,813 | ) |
| Paydowns | | | — | | | | (2,032 | ) | | | (1,690 | ) |
| Change in net unrealized (appreciation) depreciation of investments | | | 23,001,208 | | | | 33,929,112 | | | | 32,238,309 | |
| Taxes paid on undistributed capital gains | | | (6,177 | ) | | | (5,308 | ) | | | (437 | ) |
| Net cash provided by (used in) operating activities | | | 7,752,285 | | | | 9,118,631 | | | | 1,990,510 | |
| Cash Flows from Financing Activities: | | | | | | | | | | | | |
| (Increase) Decrease in deferred offering costs | | | 11,659 | | | | 14,175 | | | | (836,816 | ) |
| Increase (Decrease) in: | | | | | | | | | | | | |
| Cash overdraft balance | | | 235,395 | | | | — | | | | — | |
| Payable for offering costs | | | (162,869 | ) | | | (224,622 | ) | | | 297,657 | |
| VRDP shares, at liquidation value | | | — | | | | — | | | | 161,700,000 | |
| ARPS, at liquidation value | | | — | | | | — | | | | (160,775,000 | ) |
| Cash distributions paid to Common shareholders | | | (7,934,187 | ) | | | (10,426,339 | ) | | | (9,943,885 | ) |
| Net cash provided by (used in) financing activities | | | (7,850,002 | ) | | | (10,636,786 | ) | | | (9,558,044 | ) |
| Net Increase (Decrease) in Cash | | | (97,717 | ) | | | (1,518,155 | ) | | | (7,567,534 | ) |
| Cash at the beginning of period | | | 97,717 | | | | 2,320,675 | | | | 11,824,701 | |
| Cash at the End of Period | | $ | — | | | $ | 802,520 | | | $ | 4,257,167 | |
| Supplemental Disclosure of Cash Flow Information | | | | | | | | | | | | |
| | | | | | | | | | | | | |
| | | | New York | | | | New York | | | | New York | |
| | | | Investment | | | | Select | | | | Quality | |
| | | | Quality | | | | Quality | | | | Income | |
| | | | (NQN | ) | | | (NVN | ) | | | (NUN | ) |
| Cash paid for interest (excluding amortization of offering costs, where applicable) | | $ | 421,649 | | | $ | 539,234 | | | $ | 384,834 | |
See accompanying notes to financial statements.
| | | Insured | | | Insured | | | Insured | |
| | | New York | | | New York | | | New York | |
| | | Premium | | | Dividend | | | Tax-Free | |
| | | Income | | | Advantage | | | Advantage | |
| | | (NNF | ) | | (NKO | ) | | (NRK | ) |
| Cash Flows from Operating Activities: | | | | | | | | | |
| Net Increase (Decrease) in Net Assets Applicable to Common Shares from Operations | | $ | (7,085,303 | ) | | $ | (5,400,850 | ) | | $ | (3,136,100 | ) |
| Adjustments to reconcile the net increase (decrease) in net assets applicable to Common shares from operations to net cash provided by (used in) operating activities: | | | | | | | | | | | | |
| Purchases of investments | | | (12,479,813 | ) | | | (17,654,176 | ) | | | (1,029,340 | ) |
| Proceeds from sales and maturities of investments | | | 3,362,130 | | | | 14,841,272 | | | | 1,895,665 | |
| Proceeds from (Purchases of) short-term investments, net | | | 6,470,000 | | | | — | | | | — | |
| Amortization (Accretion) of premiums and discounts, net | | | 301,641 | | | | 218,043 | | | | 137,495 | |
| (Increase) Decrease in: | | | | | | | | | | | | |
| Receivable for interest | | | (128,178 | ) | | | (103,570 | ) | | | 15,415 | |
| Receivable for investments sold | | | 516,635 | | | | 2,720,750 | | | | — | |
| Other assets | | | 1,906 | | | | 16,719 | | | | (144 | ) |
| Increase (Decrease) in: | | | | | | | | | | | | |
| Payable for Auction Rate Preferred share dividends | | | (190 | ) | | | — | | | | — | |
| Payable for interest | | | — | | | | — | | | | (3,921 | ) |
| Payable for investments purchased | | | — | | | | 986,150 | | | | — | |
| Accrued management fees | | | (1,879 | ) | | | (1,113 | ) | | | 4,442 | |
| Accrued other expenses | | | (8,506 | ) | | | (14,535 | ) | | | (577 | ) |
| Net realized gain (loss) from: | | | | | | | | | | | | |
| Investments | | | (112,343 | ) | | | (55,700 | ) | | | 81,269 | |
| Paydowns | | | — | | | | — | | | | — | |
| Change in net unrealized (appreciation) depreciation of investments | | | 10,723,320 | | | | 8,715,687 | | | | 4,212,474 | |
| Taxes paid on undistributed capital gains | | | — | | | | (524 | ) | | | (226 | ) |
| Net cash provided by (used in) operating activities | | | 1,559,420 | | | | 4,268,153 | | | | 2,176,452 | |
| Cash Flows from Financing Activities: | | | | | | | | | | | | |
| (Increase) Decrease in deferred offering costs | | | — | | | | (985 | ) | | | 66,148 | |
| Increase (Decrease) in: | | | | | | | | | | | | |
| Cash overdraft balance | | | 716,063 | | | | (208,043 | ) | | | (250,766 | ) |
| Payable for offering costs | | | — | | | | (10,378 | ) | | | (30,962 | ) |
| VRDP shares, at liquidation value | | | — | | | | — | | | | — | |
| ARPS, at liquidation value | | | — | | | | — | | | | — | |
| Cash distributions paid to Common shareholders | | | (3,193,433 | ) | | | (3,069,075 | ) | | | (1,294,115 | ) |
| Net cash provided by (used in) financing activities | | | (2,477,370 | ) | | | (3,288,481 | ) | | | (1,509,695 | ) |
| Net Increase (Decrease) in Cash | | | (917,950 | ) | | | 979,672 | | | | 666,757 | |
| Cash at the beginning of period | | | 917,950 | | | | — | | | | — | |
| Cash at the End of Period | | $ | — | | | $ | 979,672 | | | $ | 666,757 | |
| Supplemental Disclosure of Cash Flow Information | | | | | | | | | | | | |
| | | | | | | | | | | | | |
| | | | Insured | | | | Insured | | | | Insured | |
| | | | New York | | | | New York | | | | New York | |
| | | | Premium | | | | Dividend | | | | Tax-Free | |
| | | | Income | | | | Advantage | | | | Advantage | |
| | | | (NNF | ) | | | (NKO | ) | | | (NRK | ) |
| Cash paid for interest (excluding amortization of offering costs, where applicable) | | $ | 57,517 | | | $ | 141,478 | | | $ | 360,187 | |
See accompanying notes to financial statements.
| | | Financial |
| | | Highlights (Unaudited) |
| | | |
| | | Selected data for a Common share outstanding throughout each period: |
| | | | | | Investment Operations | | Less Distributions | | | | | | | | | | |
| | | Beginning Common Share Net Asset Value | | Net Investment Income (Loss) | | Net Realized/ Unrealized Gain (Loss) | | Distributions from Net Investment Income to Auction Rate Preferred Share- holders | (a) | Distributions from Capital Gains to Auction Rate Preferred Share– holders | (a) | Total | | Net Investment Income to Common Share- holders | | Capital Gains to Common Share– holders | | Total | | Discount from Common Shares Repurchased and Retired | | Ending Common Share Net Asset Value | | Ending Market Value | |
| New York Investment Quality (NQN) | | | | | | | | | | | | | | | | | | | | | | | | |
| Year Ended 9/30: | | | | | | | | | | | | | | | | | | | | | | | | | |
| 2011(f) | | $ | 15.53 | | $ | .40 | | $ | (1.28 | ) | $ | — | | $ | — | | $ | (.88 | ) | $ | (.40 | ) | $ | (.05 | ) | $ | (.45 | ) | $ | — | | $ | 14.20 | | $ | 13.19 | |
| 2010 | | | 15.08 | | | .87 | | | .37 | | | (.02 | ) | | — | | | 1.22 | | | (.77 | ) | | — | | | (.77 | ) | | — | | | 15.53 | | | 14.93 | |
| 2009 | | | 13.23 | | | .88 | | | 1.74 | | | (.09 | ) | | — | | | 2.53 | | | (.68 | ) | | — | | | (.68 | ) | | — | * | | 15.08 | | | 14.13 | |
| 2008 | | | 14.77 | | | .90 | | | (1.56 | ) | | (.26 | ) | | — | | | (.92 | ) | | (.62 | ) | | — | | | (.62 | ) | | — | * | | 13.23 | | | 10.72 | |
| 2007 | | | 15.18 | | | .89 | | | (.29 | ) | | (.25 | ) | | (.02 | ) | | .33 | | | (.67 | ) | | (.07 | ) | | (.74 | ) | | — | | | 14.77 | | | 13.70 | |
| 2006 | | | 15.87 | | | .90 | | | (.05 | ) | | (.17 | ) | | (.09 | ) | | .59 | | | (.75 | ) | | (.53 | ) | | (1.28 | ) | | — | | | 15.18 | | | 13.99 | |
| | | | | | | | | | | | | | | | | | | | | | | | | |
| New York Select Quality (NVN) | | | | | | | | | | | | | | | | | | | | | | | | |
| Year Ended 9/30: | | | | | | | | | | | | | | | | | | | | | | | | | |
| 2011(f) | | | 15.79 | | | .42 | | | (1.45 | ) | | — | | | — | | | (1.03 | ) | | (.42 | ) | | (.03 | ) | | (.45 | ) | | — | | | 14.31 | | | 13.54 | |
| 2010 | | | 15.37 | | | .91 | | | .33 | | | (.03 | ) | | — | | | 1.21 | | | (.79 | ) | | — | | | (.79 | ) | | — | | | 15.79 | | | 15.40 | |
| 2009 | | | 13.34 | | | .90 | | | 1.90 | | | (.09 | ) | | — | | | 2.71 | | | (.68 | ) | | — | | | (.68 | ) | | — | * | | 15.37 | | | 13.76 | |
| 2008 | | | 14.98 | | | .91 | | | (1.63 | ) | | (.27 | ) | | — | * | | (.99 | ) | | (.64 | ) | | (.01 | ) | | (.65 | ) | | — | * | | 13.34 | | | 10.70 | |
| 2007 | | | 15.44 | | | .92 | | | (.37 | ) | | (.27 | ) | | (.01 | ) | | .27 | | | (.70 | ) | | (.03 | ) | | (.73 | ) | | — | | | 14.98 | | | 13.86 | |
| 2006 | | | 15.87 | | | .93 | | | (.07 | ) | | (.21 | ) | | (.05 | ) | | .60 | | | (.76 | ) | | (.27 | ) | | (1.03 | ) | | — | | | 15.44 | | | 14.34 | |
| | | Auction Rate Prefered Shares at End of Period | | Variable Rate Demand Prefered Shares at End of Period | |
| | | Aggregate Amount Outstanding (000) | | Liquidation Value Per Share | | Asset Coverage Per Share | | Aggregate Amount Outstanding (000) | | Liquidation Value Per Share | | Asset Coverage Per Share | |
| New York Investment Quality (NQN) | | | | | | | | | | | | | | | | | | | |
| Year Ended 9/30: | | | | | | | | | | | | | | | | | | | |
| 2011(f) | | $ | — | | $ | — | | $ | — | | $ | 112,300 | | $ | 100,000 | | $ | 321,575 | |
| 2010 | | | — | | | — | | | — | | | 112,300 | | | 100,000 | | | 342,233 | |
| 2009 | | | 111,500 | | | 25,000 | | | 84,231 | | | — | | | — | | | — | |
| 2008 | | | 114,925 | | | 25,000 | | | 75,664 | | | — | | | — | | | — | |
| 2007 | | | 144,000 | | | 25,000 | | | 70,178 | | | — | | | — | | | — | |
| 2006 | | | 144,000 | | | 25,000 | | | 71,699 | | | — | | | — | | | — | |
| | | | | | | | | | | | | | | | | | | | |
| New York Select Quality (NVN) | | | | | | | | | | | | | | | | | | | |
| Year Ended 9/30: | | | | | | | | | | | | | | | | | | | |
| 2011(f) | | | — | | | — | | | — | | | 164,800 | | | 100,000 | | | 301,393 | |
| 2010 | | | — | | | — | | | — | | | 164,800 | | | 100,000 | | | 322,207 | |
| 2009 | | | 163,900 | | | 25,000 | | | 79,376 | | | — | | | — | | | — | |
| 2008 | | | 163,900 | | | 25,000 | | | 72,427 | | | — | | | — | | | — | |
| 2007 | | | 193,000 | | | 25,000 | | | 70,258 | | | — | | | — | | | — | |
| 2006 | | | 193,000 | | | 25,000 | | | 71,884 | | | — | | | — | | | — | |
| | | | | | | | Ratios/Supplemental Data | |
| | Total Returns | | | | | Ratios to Average Net Assets Applicable to Common Shares(c)(d) | | | | |
| | Based on Market Value | (b) | Based on Common Share Net Asset Value | (b) | Ending Net Assets Applicable to Common Shares (000) | | Expenses Including Interest | (e) | Expenses Excluding Interest | | Net Investment Income | | Portfolio Turnover Rate | |
| | | | | | | | | | | | | | | | | | | | | | |
| | | | | | | | | | | | | | | | | | | | | | |
| | | (8.69 | )% | | (5.68 | )% | $ | 248,829 | | | 1.79 | %** | | 1.45 | %** | | 5.53 | %** | | 3 | % |
| | | 11.63 | | | 8.42 | | | 272,028 | | | 1.31 | | | 1.18 | | | 5.83 | | | 6 | |
| | | 39.45 | | | 19.74 | | | 264,170 | | | 1.42 | | | 1.20 | | | 6.45 | | | 3 | |
| | | (17.85 | ) | | (6.46 | ) | | 232,903 | | | 1.46 | | | 1.24 | | | 6.15 | | | 9 | |
| | | 3.22 | | | 2.22 | | | 260,224 | | | 1.40 | | | 1.22 | | | 5.98 | | | 19 | |
| | | 2.39 | | | 4.03 | | | 268,986 | | | 1.22 | | | 1.22 | | | 5.92 | | | 16 | |
| | | | | | | | | | | | | | | | | | | | | | |
| | | | | | | | | | | | | | | | | | | | | | |
| | | (9.20 | ) | | (6.56 | ) | | 331,896 | | | 1.79 | ** | | 1.48 | ** | | 5.75 | ** | | 2 | |
| | | 18.34 | | | 8.18 | | | 366,197 | | | 1.26 | | | 1.17 | | | 6.00 | | | 8 | |
| | | 36.22 | | | 20.98 | | | 356,491 | | | 1.36 | | | 1.20 | | | 6.52 | | | 5 | |
| | | (18.81 | ) | | (6.90 | ) | | 310,931 | | | 1.41 | | | 1.21 | | | 6.16 | | | 12 | |
| | | 1.70 | | | 1.75 | | | 349,388 | | | 1.38 | | | 1.20 | | | 6.05 | | | 17 | |
| | | 4.53 | | | 4.10 | | | 361,945 | | | 1.20 | | | 1.20 | | | 6.03 | | | 15 | |
| (a) | The amounts shown are based on Common share equivalents. |
| (b) | Total Return Based on Market Value is the combination of changes in the market price per share and the effect of reinvested dividend income and reinvested capital gains distributions, if any, at the average price paid per share at the time of reinvestment. The last dividend declared in the period, which is typically paid on the first business day of the following month, is assumed to be reinvested at the ending market price. The actual reinvestment for the last dividend declared in the period may take place over several days, and in some instances may not be based on the market price, so the actual reinvestment price may be different from the price used in the calculation. |
| | Total returns are not annualized. |
| | |
| | Total Return Based on Common Share Net Asset Value is the combination of changes in Common share net asset value, reinvested dividend income at net asset value and reinvested capital gains distributions at net asset value, if any. The last dividend declared in the period, which is typically paid on the first business day of the following month, is assumed to be reinvested at the ending net asset value. The actual reinvest price for the last dividend declared in the period may often be based on the Fund’s market price (and not its net asset value), and therefore may be different from the price used in the calculation. Total returns are not annualized. |
| (c) | Ratios do not reflect the effect of dividend payments to Auction Rate Preferred shareholders; Net Investment Income ratios reflect income earned and expenses incurred on assets attributable to Auction Rate Preferred shares and/or Variable Rate Demand Preferred shares, where applicable. |
| (d) | Ratios do not reflect the effect of custodian fee credits earned on the Fund’s net cash on deposit with the custodian bank, where applicable. |
| (e) | The expense ratios reflect, among other things, payments to Variable Rate Demand Preferred shareholders and/or the interest expense deemed to have been paid by the Fund on the floating rate certificates issued by the special purpose trusts for the self-deposited inverse floaters held by the Fund, where applicable, both as described in Footnote 1 – General Information and Significant Accounting Policies, Variable Rate Demand Preferred Shares and Inverse Floating Rate Securities, respectively. |
| (f) | For the six months ended March 31, 2011. |
| * | Rounds to less than $.01 per share. |
| ** | Annualized. |
See accompanying notes to financial statements.
| | | Financial |
| | | Highlights (Unaudited) (continued) |
| | | |
| | | Selected data for a Common share outstanding throughout each period: |
| | | | | | Investment Operations | | Less Distributions | | | | | | | | | | |
| | | Beginning Common Share Net Asset Value | | Net Investment Income (Loss) | | Net Realized/ Unrealized Gain (Loss) | | Distributions from Net Investment Income to Auction Rate Preferred Share- holders | (a) | Distributions from Capital Gains to Auction Rate Preferred Share– holders | (a) | Total | | Net Investment Income to Common Share- holders | | Capital Gains to Common Share– holders | | Total | | Discount from Common Shares Repurchased and Retired | | Ending Common Share Net Asset Value | | Ending Market Value | |
| New York Quality Income (NUN) | | | | | | | | | | | | | | | | | | | | | |
| Year Ended 9/30: | | | | | | | | | | | | | | | | | | | | | | | | | |
| 2011(f) | | $ | 15.51 | | $ | .43 | | $ | (1.34 | ) | $ | (.01 | ) | $ | — | | $ | (.92 | ) | $ | (.41 | ) | $ | — | * | $ | (.41 | ) | $ | — | | $ | 14.18 | | $ | 13.42 | |
| 2010 | | | 15.15 | | | .91 | | | .27 | | | (.03 | ) | | — | | | 1.15 | | | (.79 | ) | | — | | | (.79 | ) | | — | * | | 15.51 | | | 15.10 | |
| 2009 | | | 13.20 | | | .89 | | | 1.81 | | | (.09 | ) | | — | | | 2.61 | | | (.67 | ) | | — | | | (.67 | ) | | .01 | | | 15.15 | | | 13.68 | |
| 2008 | | | 14.79 | | | .89 | | | (1.59 | ) | | (.27 | ) | | — | * | | (.97 | ) | | (.61 | ) | | (.01 | ) | | (.62 | ) | | — | * | | 13.20 | | | 10.43 | |
| 2007 | | | 15.21 | | | .89 | | | (.33 | ) | | (.28 | ) | | (.01 | ) | | .27 | | | (.65 | ) | | (.04 | ) | | (.69 | ) | | — | | | 14.79 | | | 13.46 | |
| 2006 | | | 15.64 | | | .90 | | | (.05 | ) | | (.20 | ) | | (.05 | ) | | .60 | | | (.76 | ) | | (.27 | ) | | (1.03 | ) | | — | | | 15.21 | | | 14.11 | |
| | | | | | | | | | | | | | | | | | | | | | | | | |
| Insured New York Premium Income (NNF) | | | | | | | | | | | | | | | | | | | | | | | | |
| Year Ended 9/30: | | | | | | | | | | | | | | | | | | | | | | | | | |
| 2011(f) | | | 15.73 | | | .44 | | | (1.29 | ) | | (.01 | ) | | — | | | (.86 | ) | | (.39 | ) | | — | | | (.39 | ) | | — | | | 14.48 | | | 13.87 | |
| 2010 | | | 15.29 | | | .86 | | | .35 | | | (.03 | ) | | — | | | 1.18 | | | (.74 | ) | | — | | | (.74 | ) | | — | * | | 15.73 | | | 15.18 | |
| 2009 | | | 13.39 | | | .84 | | | 1.76 | | | (.08 | ) | | — | | | 2.52 | | | (.63 | ) | | — | | | (.63 | ) | | .01 | | | 15.29 | | | 13.64 | |
| 2008 | | | 14.88 | | | .86 | | | (1.48 | ) | | (.26 | ) | | — | | | (.88 | ) | | (.61 | ) | | — | | | (.61 | ) | | — | | | 13.39 | | | 11.04 | |
| 2007 | | | 15.31 | | | .87 | | | (.33 | ) | | (.25 | ) | | (.01 | ) | | .28 | | | (.67 | ) | | (.04 | ) | | (.71 | ) | | — | | | 14.88 | | | 13.54 | |
| 2006 | | | 15.78 | | | .88 | | | (.06 | ) | | (.18 | ) | | (.05 | ) | | .59 | | | (.73 | ) | | (.33 | ) | | (1.06 | ) | | — | | | 15.31 | | | 14.26 | |
| | | Auction Rate Prefered Shares at End of Period | | Variable Rate Demand Prefered Shares at End of Period | |
| | | Aggregate Amount Outstanding (000) | | Liquidation Value Per Share | | Asset Coverage Per Share | | Aggregate Amount Outstanding (000) | | Liquidation Value Per Share | | Asset Coverage Per Share | |
| New York Quality Income (NUN) | | | | | | | | | | | | | | | | | | | |
| Year Ended 9/30: | | | | | | | | | | | | | | | | | | | |
| 2011(f) | | $ | — | | $ | — | | $ | — | | $ | 161,700 | | $ | 100,000 | | $ | 308,268 | |
| 2010 | | | 160,775 | | | 25,000 | | | 82,301 | | | — | | | — | | | — | |
| 2009 | | | 160,775 | | | 25,000 | | | 80,952 | | | — | | | — | | | — | |
| 2008 | | | 165,375 | | | 25,000 | | | 72,696 | | | — | | | — | | | — | |
| 2007 | | | 197,000 | | | 25,000 | | | 69,868 | | | — | | | — | | | — | |
| 2006 | | | 197,000 | | | 25,000 | | | 71,498 | | | — | | | — | | | — | |
| | | | | | | | | | | | | | | | | | | | |
| Insured New York Premium Income (NNF) | | | | | | | | | | | | | | | | | | | |
| Year Ended 9/30: | | | | | | | | | | | | | | | | | | | |
| 2011(f) | | | 50,350 | | | 25,000 | | | 84,288 | | | — | | | — | | | — | |
| 2010 | | | 50,350 | | | 25,000 | | | 89,390 | | | — | | | — | | | — | |
| 2009 | | | 50,350 | | | 25,000 | | | 87,691 | | | — | | | — | | | — | |
| 2008 | | | 52,000 | | | 25,000 | | | 78,619 | | | — | | | — | | | — | |
| 2007 | | | 65,000 | | | 25,000 | | | 72,675 | | | — | | | — | | | — | |
| 2006 | | | 65,000 | | | 25,000 | | | 74,056 | | | — | | | — | | | — | |
| | | | | | | | Ratios/Supplemental Data | |
| | Total Returns | | | | | Ratios to Average Net Assets Applicable to Common Shares(c)(d) | | | | |
| | Based on Market Value | (b) | Based on Common Share Net Asset Value | (b) | Ending Net Assets Applicable to Common Shares (000) | | Expenses Including Interest | (e) | Expenses Excluding Interest | | Net Investment Income | | Portfolio Turnover Rate | |
| | | | | | | | | | | | | | | | | | | | | | |
| | | | | | | | | | | | | | | | | | | | | | |
| | | (8.41 | )% | | (5.91 | )% | $ | 336,770 | | | 1.55 | %** | | 1.33 | %** | | 5.90 | %** | | 2 | % |
| | | 16.77 | | | 7.87 | | | 368,505 | | | 1.22 | | | 1.15 | | | 6.08 | | | 6 | |
| | | 38.91 | | | 20.46 | | | 359,827 | | | 1.38 | | | 1.20 | | | 6.50 | | | 5 | |
| | | (18.60 | ) | | (6.80 | ) | | 315,510 | | | 1.42 | | | 1.21 | | | 6.10 | | | 9 | |
| | | .21 | | | 1.81 | | | 353,564 | | | 1.38 | | | 1.20 | | | 5.95 | | | 21 | |
| | | 4.27 | | | 4.06 | | | 366,405 | | | 1.21 | | | 1.21 | | | 5.95 | | | 14 | |
| | | | | | | | | | | | | | | | | | | | | | |
| | | | | | | | | | | | | | | | | | | | | | |
| | | (6.06 | ) | | (5.51 | ) | | 119,406 | | | 1.26 | ** | | 1.16 | ** | | 5.95 | ** | | 2 | |
| | | 17.25 | | | 7.96 | | | 129,681 | | | 1.25 | | | 1.16 | | | 5.63 | | | 4 | |
| | | 30.31 | | | 19.42 | | | 126,259 | | | 1.42 | | | 1.21 | | | 6.02 | | | 5 | |
| | | (14.53 | ) | | (6.18 | ) | | 111,528 | | | 1.45 | | | 1.24 | | | 5.84 | | | 10 | |
| | | (.20 | ) | | 1.85 | | | 123,956 | | | 1.40 | | | 1.23 | | | 5.79 | | | 21 | |
| | | 3.30 | | | 3.96 | | | 127,546 | | | 1.22 | | | 1.22 | | | 5.75 | | | 14 | |
| (a) | The amounts shown are based on Common share equivalents. |
| (b) | Total Return Based on Market Value is the combination of changes in the market price per share and the effect of reinvested dividend income and reinvested capital gains distributions, if any, at the average price paid per share at the time of reinvestment. The last dividend declared in the period, which is typically paid on the first business day of the following month, is assumed to be reinvested at the ending market price. The actual reinvestment for the last dividend declared in the period may take place over several days, and in some instances may not be based on the market price, so the actual reinvestment price may be different from the price used in the calculation. |
| | Total returns are not annualized. |
| | |
| | Total Return Based on Common Share Net Asset Value is the combination of changes in Common share net asset value, reinvested dividend income at net asset value and reinvested capital gains distributions at net asset value, if any. The last dividend declared in the period, which is typically paid on the first business day of the following month, is assumed to be reinvested at the ending net asset value. The actual reinvest price for the last dividend declared in the period may often be based on the Fund’s market price (and not its net asset value), and therefore may be different from the price used in the calculation. Total returns are not annualized. |
| (c) | Ratios do not reflect the effect of dividend payments to Auction Rate Preferred shareholders; Net Investment Income ratios reflect income earned and expenses incurred on assets attributable to Auction Rate Preferred shares and/or Variable Rate Demand Preferred shares, where applicable. |
| (d) | Ratios do not reflect the effect of custodian fee credits earned on the Fund’s net cash on deposit with the custodian bank, where applicable. |
| (e) | The expense ratios reflect, among other things, payments to Variable Rate Demand Preferred Shareholders and/or the interest expense deemed to have been paid by the Fund on the floating rate certificates issued by the special purpose trusts for the self-deposited inverse floaters held by the Fund, where applicable, both as described in Footnote 1 – General Information and Significant Accounting Policies, Variable Rate Demand Preferred Shares and Inverse Floating Rate Securities, respectively. |
| (f) | For the six months ended March 31, 2011. |
| * | Rounds to less than $.01 per share. |
| ** | Annualized. |
See accompanying notes to financial statements.
| | | Financial |
| | | Highlights (Unaudited) (continued) |
| | | |
| | | Selected data for a Common share outstanding throughout each period: |
| | | | | | Investment Operations | | Less Distributions | | | | | | | | | | |
| | | Beginning Common Share Net Asset Value | | Net Investment Income (Loss) | | Net Realized/ Unrealized Gain (Loss) | | Distributions from Net Investment Income to Auction Rate Preferred Share- holders | (a) | Distributions from Capital Gains to Auction Rate Preferred Share– holders | (a) | Total | | Net Investment Income to Common Share- holders | | Capital Gains to Common Share– holders | | Total | | Discount from Common Shares Repurchased and Retired | | Ending Common Share Net Asset Value | | Ending Market Value | |
| Insured New York Dividend Advantage (NKO) | | | | | | | | | | | | | | | | | | | | | | | | |
| Year Ended 9/30: | | | | | | | | | | | | | | | | | | | | | | | | | |
| 2011(f) | | $ | 15.40 | | $ | .41 | | $ | (1.09 | ) | $ | — | | $ | — | | $ | (.68 | ) | $ | (.39 | ) | $ | — | | $ | (.39 | ) | $ | — | | $ | 14.33 | | $ | 13.54 | |
| 2010 | | | 15.17 | | | .81 | | | .19 | | | — | | | — | | | 1.00 | | | (.77 | ) | | — | * | | (.77 | ) | | — | | | 15.40 | | | 14.72 | |
| 2009 | | | 13.38 | | | .78 | | | 1.73 | | | — | | | — | * | | 2.51 | | | (.70 | ) | | (.02 | ) | | (.72 | ) | | — | * | | 15.17 | | | 14.07 | |
| 2008 | | | 14.96 | | | .91 | | | (1.57 | ) | | (.22 | ) | | (.01 | ) | | (.89 | ) | | (.66 | ) | | (.03 | ) | | (.69 | ) | | — | | | 13.38 | | | 10.96 | |
| 2007 | | | 15.34 | | | .95 | | | (.34 | ) | | (.26 | ) | | — | * | | .35 | | | (.72 | ) | | (.01 | ) | | (.73 | ) | | — | | | 14.96 | | | 14.10 | |
| 2006 | | | 15.67 | | | .95 | | | (.08 | ) | | (.20 | ) | | (.03 | ) | | .64 | | | (.78 | ) | | (.19 | ) | | (.97 | ) | | — | | | 15.34 | | | 14.85 | |
| | | | | | | | | | | | | | | | | | | | | | | | | |
| Insured New York Tax-Free Advantage (NRK) | | | | | | | | | | | | | | | | | | | | | | | | |
| Year Ended 9/30: | | | | | | | | | | | | | | | | | | | | | | | | |
| 2011(f) | | | 15.36 | | | .33 | | | (1.22 | ) | | — | | | — | | | (.89 | ) | | (.37 | ) | | — | | | (.37 | ) | | — | | | 14.10 | | | 13.12 | |
| 2010 | | | 15.18 | | | .77 | | | .23 | | | (.01 | ) | | (.01 | ) | | .98 | | | (.73 | ) | | (.07 | ) | | (.80 | ) | | — | | | 15.36 | | | 14.75 | |
| 2009 | | | 13.31 | | | .83 | | | 1.81 | | | (.10 | ) | | — | * | | 2.54 | | | (.66 | ) | | (.01 | ) | | (.67 | ) | | — | * | | 15.18 | | | 13.70 | |
| 2008 | | | 14.65 | | | .88 | | | (1.32 | ) | | (.25 | ) | | — | * | | (.69 | ) | | (.65 | ) | | — | * | | (.65 | ) | | — | | | 13.31 | | | 11.52 | |
| 2007 | | | 14.92 | | | .91 | | | (.29 | ) | | (.23 | ) | | — | * | | .39 | | | (.65 | ) | | (.01 | ) | | (.66 | ) | | — | | | 14.65 | | | 13.74 | |
| 2006 | | | 15.00 | | | .90 | | | (.05 | ) | | (.21 | ) | | — | * | | .64 | | | (.69 | ) | | (.03 | ) | | (.72 | ) | | — | | | 14.92 | | | 14.08 | |
| | | Auction Rate Prefered Shares at End of Period | | MuniFund Term Preferred Shares at End of Period | | Variable Rate Demand Prefered Shares at End of Period | |
| | | Aggregate Amount Outstanding (000) | | Liquidation Value Per Share | | Asset Coverage Per Share | | Aggregate Amount Outstanding (000) | | Liquidation Value Per Share | | Ending Market Value Per Share | | Average Market Value Per Share | | Asset Coverage Per Share | | Aggregate Amount Outstanding | | Liquidation Value Per Share | | Asset Coverage Per Share | |
| Insured New York Dividend Advantage (NKO) | | | | | | | | | | | | | | | |
| Year Ended 9/30: | | | | | | | | | | | | | | | | | | | | | | | | | | | | |
| 2011(f) | | $ | — | | $ | — | | $ | — | | $ | — | | $ | — | | $ | — | | $ | — | | $ | — | | $ | 50,000 | | $ | 100,000 | | $ | 327,532 | |
| 2010 | | | — | | | — | | | — | | | — | | | — | | | — | | | — | | | — | | | 50,000 | | | 100,000 | | | 344,477 | |
| 2009 | | | — | | | — | | | — | | | — | | | — | | | — | | | — | | | — | | | 50,000 | | | 100,000 | | | 340,811 | |
| 2008 | | | — | | | — | | | — | | | — | | | — | | | — | | | — | | | — | | | 50,000 | | | 100,000 | | | 313,166 | |
| 2007 | | | 61,000 | | | 25,000 | | | 73,824 | | | — | | | — | | | — | | | — | | | — | | | — | | | — | | | — | |
| 2006 | | | 61,000 | | | 25,000 | | | 75,032 | | | — | | | — | | | — | | | — | | | — | | | — | | | — | | | — | |
| | | | | | | | | | | | | | | | |
| Insured New York Tax-Free Advantage (NRK) | | | | | | | | | | | | | | | |
| Year Ended 9/30: | | | | | | | | | | | | | | | | | | | | | | | | | | | | |
| 2011(f) | | | — | | | — | | | — | | | 27,680 | | | 10.00 | | | 10.05 | | | 10.06 | | | 27.86 | | | — | | | — | | | — | |
| 2010 | | | — | | | — | | | — | | | 27,680 | | | 10.00 | | | 10.33 | | | 10.09 | ^ | | 29.46 | | | — | | | — | | | — | |
| 2009 | | | 27,000 | | | 25,000 | | | 74,281 | | | — | | | — | | | — | | | — | | | — | | | — | | | — | | | — | |
| 2008 | | | 27,000 | | | 25,000 | | | 68,304 | | | — | | | — | | | — | | | — | | | — | | | — | | | — | | | — | |
| 2007 | | | 27,000 | | | 25,000 | | | 72,665 | | | — | | | — | | | — | | | — | | | — | | | — | | | — | | | — | |
| 2006 | | | 27,000 | | | 25,000 | | | 73,541 | | | — | | | — | | | — | | | — | | | — | | | — | | | — | | | — | |
| | | | | | | | Ratios/Supplemental Data | |
| | Total Returns | | | | | Ratios to Average Net Assets Applicable to Common Shares Before Reimbursement(c) | | Ratios to Average Net Assets Applicable to Common Shares After Reimbursement(c)(d) | | | | |
| | Based on Market Value | (b) | Based on Common Share Net Asset Value | (b) | Ending Net Assets Applicable to Common Shares (000) | | Expenses Including Interest | (e) | Expenses Excluding Interest | | Net Investment Income | | Expenses Including Interest | (e) | Expenses Excluding Interest | | Net Investment Income | | Portfolio Turnover Rate | |
| | | | | | | | | | | | | | | | | | | | | | | | | | | | | | | |
| | | | | | | | | | | | | | | | | | | | | | | | | | | | | | | |
| | | (5.38 | )% | | (4.45 | )% | $ | 113,766 | | | 1.81 | %*** | | 1.56 | %*** | | 5.47 | %*** | | 1.65 | %*** | | 1.41 | %*** | | 5.62 | %*** | | 9 | % |
| | | 10.62 | | | 6.88 | | | 122,238 | | | 1.86 | | | 1.66 | | | 5.19 | | | 1.67 | | | 1.47 | | | 5.37 | | | 2 | |
| | | 36.41 | | | 19.41 | | | 120,406 | | | 2.13 | | | 1.48 | | | 5.42 | | | 1.87 | | | 1.22 | | | 5.68 | | | 3 | |
| | | (18.10 | ) | | (6.24 | ) | | 106,583 | | | 1.65 | | | 1.26 | | | 5.81 | | | 1.68 | | | 1.29 | | | 5.78 | | | 9 | |
| | | (.21 | ) | | 2.36 | | | 119,131 | | | 1.38 | | | 1.20 | | | 5.83 | | | 1.40 | | | 1.22 | | | 5.81 | | | 19 | |
| | | 7.92 | | | 4.29 | | | 122,078 | | | 1.20 | | | 1.20 | | | 5.79 | | | 1.21 | | | 1.21 | | | 5.78 | | | 11 | |
| | | | | | | | | | | | | | | | | | | | | | | | | | | | | | | |
| | | | | | | | | | | | | | | | | | | | | | | | | | | | | | | |
| | | (8.59 | ) | | (5.83 | ) | | 49,436 | | | 2.91 | *** | | 1.51 | *** | | 4.53 | *** | | 2.87 | *** | | 1.46 | *** | | 4.57 | *** | | 1 | |
| | | 13.97 | | | 6.70 | ** | | 53,866 | | | 1.95 | | | 1.30 | | | 5.01 | | | 1.81 | | | 1.15 | | | 5.15 | | | 4 | |
| | | 25.65 | | | 19.67 | | | 53,223 | | | 1.40 | | | 1.31 | | | 5.77 | | | 1.13 | | | 1.04 | | | 6.04 | | | 4 | |
| | | (11.94 | ) | | (4.91 | ) | | 46,769 | | �� | 1.41 | | | 1.26 | | | 5.68 | | | 1.44 | | | 1.29 | | | 5.65 | | | 8 | |
| | | 2.24 | | | 2.69 | | | 51,479 | | | 1.40 | | | 1.25 | | | 5.65 | | | 1.42 | | | 1.27 | | | 5.63 | | | 17 | |
| | | 5.79 | | | 4.38 | | | 52,425 | | | 1.27 | | | 1.27 | | | 5.62 | | | 1.29 | | | 1.29 | | | 5.60 | | | 8 | |
| (a) | The amounts shown are based on Common share equivalents. |
| (b) | Total Return Based on Market Value is the combination of changes in the market price per share and the effect of reinvested dividend income and reinvested capital gains distributions, if any, at the average price paid per share at the time of reinvestment. The last dividend declared in the period, which is typically paid on the first business day of the following month, is assumed to be reinvested at the ending market price. The actual reinvestment for the last dividend declared in the period may take place over several days, and in some instances may not be based on the market price, so the actual reinvestment price may be different from the price used in the calculation. |
| | Total returns are not annualized. |
| | |
| | Total Return Based on Common Share Net Asset Value is the combination of changes in Common share net asset value, reinvested dividend income at net asset value and reinvested capital gains distributions at net asset value, if any. The last dividend declared in the period, which is typically paid on the first business day of the following month, is assumed to be reinvested at the ending net asset value. The actual reinvest price for the last dividend declared in the period may often be based on the Fund’s market price (and not its net asset value), and therefore may be different from the price used in the calculation. Total returns are not annualized. |
| (c) | Ratios do not reflect the effect of dividend payments to Auction Rate Preferred shareholders; Net Investment Income ratios reflect income earned and expenses incurred on assets attributable to Auction Rate Preferred shares, MuniFund Term Preferred shares and/or Variable Rate Demand Preferred shares, where applicable. |
| (d) | After expense reimbursement from the Adviser, where applicable. Ratios do not reflect the effect of custodian fee credits earned on the Fund’s net cash on deposit with the custodian bank, where applicable. As of November 30, 2010, the Adviser is no longer reimbursing Insured New York Tax-Free Advantage (NRK) for any fees or expenses. |
| (e) | The expense ratios reflect, among other things, payments to MuniFund Term Preferred shareholders, Variable Rate Demand Preferred shareholders and/or the interest expense deemed to have been paid by the Fund on the floating rate certificates issued by the special purpose trusts for the self-deposited inverse floaters held by the Fund, where applicable, each as described in Footnote 1 – General Information and Significant Accounting Policies, MuniFund Term Preferred Shares, Variable Rate Demand Preferred Shares and Inverse Floating Rate Securities, respectively. |
| (f) | For the six months ended March 31, 2011. |
| * | Rounds to less than $.01 per share. |
| ** | During the fiscal year ended September 30, 2010, Insured New York Tax-Free Advantage (NRK) received payments from the Adviser of $35,020 to offset losses realized on the disposal of investments purchased in violation of the Fund’s investment restrictions. This reimbursement did not have an impact on the Fund’s Total Return on Common Share Net Asset Value. |
| *** | Annualized. |
| ^ | For the period April 14, 2010 (first issuance date of shares) through September 30, 2010. |
See accompanying notes to financial statements.
| | | Notes to |
| | | Financial Statements (Unaudited) |
1. General Information and Significant Accounting Policies
General Information
The funds covered in this report and their corresponding Common share stock exchange symbols are Nuveen New York Investment Quality Municipal Fund, Inc. (NQN), Nuveen New York Select Quality Municipal Fund, Inc. (NVN), Nuveen New York Quality Income Municipal Fund, Inc. (NUN), Nuveen Insured New York Premium Income Municipal Fund, Inc. (NNF), Nuveen Insured New York Dividend Advantage Municipal Fund (NKO) and Nuveen Insured New York Tax-Free Advantage Municipal Fund (NRK) (collectively, the “Funds”). Common shares of New York Investment Quality (NQN), New York Select Quality (NVN), New York Quality Income (NUN) and Insured New York Premium Income (NNF) are traded on the New York Stock Exchange (“NYSE”) while Common shares of Insured New York Dividend Advantage (NKO) and Insured New York Tax-Free Advantage (NRK) are traded on the NYSE Amex. The Funds are registered under the Investment Company Act of 1940, as amended, as closed-end registered investment companies.
Effective January 1, 2011, the Funds’ adviser, Nuveen Asset Management, a wholly-owned subsidiary of Nuveen Investments, Inc. (“Nuveen”), changed its name to Nuveen Fund Advisors, Inc. (the “Adviser”). Concurrently, the Adviser formed a wholly-owned subsidiary, Nuveen Asset Management, LLC (the “Sub-Adviser”), to house its portfolio management capabilities and to serve as the Funds’ sub-adviser, and the Funds’ portfolio manager became an employee of the Sub-Adviser. This allocation of responsibilities between the Adviser and the Sub-Adviser affects each of the Funds. The Adviser will compensate the Sub-Adviser for the portfolio management services it provides to the Funds from each Fund’s management fee.
Each Fund seeks to provide current income exempt from both regular federal and New York state income taxes, and in the case of Insured New York Tax-Free Advantage (NRK) the alternative minimum tax applicable to individuals, by investing primarily in a portfolio of municipal obligations issued by state and local government authorities within the state of New York or certain U.S. territories.
Significant Accounting Policies
The following is a summary of significant accounting policies followed by the Funds in the preparation of their financial statements in accordance with U.S. generally accepted accounting principles (“U.S. GAAP”).
Investment Valuation
Prices of municipal bonds are provided by a pricing service approved by the Funds’ Board of Directors/Trustees. These securities are generally classified as Level 2 for fair value measurement purposes. When price quotes are not readily available (which is usually the case for municipal bonds) the pricing service establishes a security’s fair value using methods that may include consideration of the following: yields or prices of investments of comparable quality, type of issue, coupon, maturity and rating, market quotes or indications of value from security dealers, evaluations of anticipated cash flows or collateral, general market conditions and other information and analysis, including the obligor’s credit characteristics considered relevant. In pricing certain securities, particularly less liquid and lower quality securities, the pricing service may consider information about a security, its issuer, or market activity, provided by the Adviser. These securities are generally classified as Level 2 or Level 3 depending on the priority of the significant inputs.
Certain securities may not be able to be priced by the pre-established pricing methods as described above. Such securities may be valued by the Funds’ Board of Directors/Trustees or its designee at fair value. These securities generally include, but are not limited to, restricted securities (securities which may not be publicly sold without registration under the Securities Act of 1933, as amended) for which a pricing service is unable to provide a market price; securities whose trading has been formally suspended; debt securities that have gone into default and for which there is no current market quotation; a security whose market price is not available from a pre-established pricing source; a security with respect to which an event has occurred that is likely to materially affect the value of the security after the market has closed but before the calculation of a Fund’s net asset value (as may be the case in non-U.S. markets on which the security is primarily traded) or make it difficult or impossible to obtain a reliable market quotation; and a security whose price, as provided by the pricing service, is not deemed to reflect the security’s fair value. As a general principle, the fair value of securities would appear to be the amount that the owner might reasonably expect to receive for it in a current sale. A variety of factors may be considered in determining the fair value of such securities, which may include consideration of the following: yields or prices of investments of comparable quality, type of issue, coupon, maturity and rating, market quotes or indications of value from security dealers, evaluations of anticipated cash flows or collateral, general market conditions and other information and analysis, including the obligor’s credit characteristics considered relevant.
These securities are generally classified as Level 2 or Level 3 depending on the priority of the significant inputs. Regardless of the method employed to value a particular security, all valuations are subject to review by the Funds’ Board of Directors/Trustees or its designee.
Refer to Footnote 2 – Fair Value Measurements for further details on the leveling of securities held by the Funds as of the end of the reporting period.
Investment Transactions
Investment transactions are recorded on a trade date basis. Realized gains and losses from transactions are determined on the specific identification method which is the same basis used for federal income tax purposes. Investments purchased on a when-issued/delayed delivery basis may have extended settlement periods. Any investments so purchased are subject to market fluctuation during this period. The Funds have instructed the custodian to segregate assets with a current value at least equal to the amount of the when-issued/delayed delivery purchase commitments. At March 31, 2011, New York Select Quality (NVN), New York Quality Income (NUN) and Insured New York Dividend Advantage (NKO) had outstanding when issued/delayed delivery purchase commitments of $1,426,752, $3,955,400 and $986,150, respectively. There were no such outstanding purchase commitments in any of the other Funds.
Investment Income
Investment income, which reflects the amortization of premiums and includes accretion of discounts for financial reporting purposes, is recorded on an accrual basis. Investment income also reflects paydown gains and losses, if any.
Income Taxes
Each Fund is a separate taxpayer for federal income tax purposes. Each Fund intends to distribute substantially all of its net investment income and net capital gains to shareholders and to otherwise comply with the requirements of Subchapter M of the Internal Revenue Code applicable to regulated investment companies. Therefore, no federal income tax provision is required. Furthermore, each Fund intends to satisfy conditions that will enable interest from municipal securities, which is exempt from regular federal and New York state income taxes, and in the case of Insured New York Tax-Free Advantage (NRK) the alternative minimum tax applicable to individuals, to retain such tax-exempt status when distributed to shareholders of the Funds. Net realized capital gains and ordinary income distributions paid by the Funds are subject to federal taxation.
For all open tax years and all major taxing jurisdictions, management of the Funds has concluded that there are no significant uncertain tax positions that would require recognition in the financial statements. Open tax years are those that are open for examination by taxing authorities (i.e., generally the last four tax year ends and the interim tax period since then). Furthermore, management of the Funds is also not aware of any tax positions for which it is reasonably possible that the total amounts of unrecognized tax benefits will significantly change in the next twelve months.
Dividends and Distributions to Common Shareholders
Dividends from net investment income are declared monthly. Net realized capital gains and/or market discount from investment transactions, if any, are distributed to shareholders at least annually. Furthermore, capital gains are distributed only to the extent they exceed available capital loss carryforwards.
Distributions to Common shareholders of net investment income, net realized capital gains and/or market discount, if any, are recorded on the ex-dividend date. The amount and timing of distributions are determined in accordance with federal income tax regulations, which may differ from U.S. GAAP.
Auction Rate Preferred Shares
Each Fund is authorized to issue Auction Rate Preferred Shares (“ARPS”). The following Fund has issued and outstanding ARPS, $25,000 stated value per share, which approximates market value, as a means of effecting financial leverage. The Fund’s ARPS are issued in more than one Series. The dividend rate paid by the Fund on each Series is determined every seven days, pursuant to a dutch auction process overseen by the auction agent, and is payable at the end of each rate period. As of March 31, 2011, the number of ARPS outstanding, by Series and in total, for the Fund is as follows:
| | | Insured | |
| | | New York | |
| | | Premium | |
| | | Income | |
| | | (NNF | ) |
| Number of shares: | | | |
| Series M | | | 1,022 | |
| Series T | | | 992 | |
| Total | | | 2,014 | |
| | | Notes to |
| | | Financial Statements (Unaudited) (continued) |
Beginning in February 2008, more shares for sale were submitted in the regularly scheduled auctions for the ARPS issued by the Funds than there were offers to buy. This meant that these auctions “failed to clear,’’ and that many ARPS shareholders who wanted to sell their shares in these auctions were unable to do so. ARPS shareholders unable to sell their shares received distributions at the “maximum rate’’ applicable to failed auctions as calculated in accordance with the pre-established terms of the ARPS. As of March 31, 2011, the aggregate amount of outstanding ARPS redeemed by each Fund is as follows:
| | | | | | | | | | | | | Insured | | | Insured | | | Insured | |
| | | | New York | | | New York | | | New York | | | New York | | | New York | | | New York | |
| | | | Investment | | | Select | | | Quality | | | Premium | | | Dividend | | | Tax-Free | |
| | | | Quality | | | Quality | | | Income | | | Income | | | Advantage | | | Advantage | |
| | | | (NQN | ) | | (NVN | ) | | (NUN | ) | | (NNF | ) | | (NKO | ) | | (NRK | ) |
| ARPS redeemed, at liquidation value | | $ | 144,000,000 | | $ | 193,000,000 | | $ | 197,000,000 | | $ | 14,650,000 | | $ | 61,000,000 | | $ | 27,000,000 | |
During the fiscal year ended September 30, 2010, lawsuits pursuing claims made in a demand letter alleging that New York Quality Income’s (NUN) Board of Directors breached its fiduciary duties related to the redemption at par of its ARPS had been filed on behalf of shareholders of the Fund, against the Adviser together with current and former officers and interested director/trustees of the Fund. Nuveen and the other named defendants believe these lawsuits to be without merit, and all named parties intend to defend themselves vigorously. The Fund believes that these lawsuits will not have a material effect on the Fund or on the Adviser’s ability to serve as investment adviser to the Fund.
MuniFund Term Preferred Shares
Insured New York Tax-Free Advantage (NRK) has issued and outstanding $27,680,000, of 2.55%, Series 2015 MuniFund Term Preferred (“MTP”) Shares, with a $10 stated value per share. Proceeds from the issuance of MTP Shares, net of offering expenses, were used to redeem all of the Fund’s outstanding ARPS. Dividends, which are recognized as interest expense for financial reporting purposes, are paid monthly at a fixed annual rate of 2.55%, subject to adjustment in certain circumstances. The MTP Shares trade on NYSE under the ticker symbol “NRK Pr C.”
The Fund is obligated to redeem its MTP Shares on May 1, 2015, unless earlier redeemed or repurchased by the Fund. MTP Shares are subject to optional and mandatory redemption in certain circumstances. The MTP Shares are subject to redemption at the option of the Fund, subject to payment of a premium until April 31, 2012, and at par thereafter. The MTP Shares also will be subject to redemption, at the option of the Fund, at par in the event of certain changes in the credit rating of the MTP Shares. The Fund may be obligated to redeem certain of the MTP Shares if the Fund fails to maintain certain asset coverage and leverage ratio requirements and such failures are not cured by the applicable cure date. The redemption price per share is equal to the sum of the liquidation value per share plus any accumulated but unpaid dividends.
During the six months ended March 31, 2011, Insured New York Tax-Free Advantage (NRK) had all $27,680,000 of its MTP Shares outstanding.
For financial reporting purposes only, the liquidation value of MTP Shares is recorded as a liability on the Statement of Assets and Liabilities. Unpaid dividends on MTP Shares are recognized as a component of “Interest payable” on the Statement of Assets and Liabilities. Dividends paid on MTP Shares are recognized as a component of “Interest expense and amortization of offering costs” on the Statement of Operations.
Net amounts earned by Nuveen as underwriter of the Fund’s MTP Share offering are recorded as reductions of offering costs recognized by the Fund. During the six months ended March 31, 2011, there was no amounts earned by Insured New York Tax-Free Advantage (NRK).
Variable Rate Demand Preferred Shares
The following Funds have issued and outstanding Variable Rate Demand Preferred (“VRDP”) Shares, with a $100,000 liquidation value per share. New York Investment Quality (NQN), New York Select Quality (NVN), New York Quality Income (NUN) and Insured New York Dividend Advantage (NKO) issued their VRDP Shares in privately negotiated offerings during August 2010, August 2010, December 2010 and August 2008, respectively. Concurrent with renewing agreements with the liquidity provider for its VRDP Shares in June 2010, Insured New York Dividend Advantage (NKO) exchanged all its 500 Series 1 VRDP Shares for 500 Series 2 VRDP Shares. The principal difference in terms between Series 1 and Series 2 VRDP Shares is the requirement that the Fund redeem VRDP Shares owned by the liquidity provider if the VRDP Shares have been owned by the liquidity provider through six months of continuous, unsuccessful remarketing. Proceeds of each Fund’s offering were used to redeem all, or a portion of, each Fund’s outstanding ARPS. The VRDP Shares were offered to qualified institutional buyers pursuant to Rule 144A under the Securities Act of 1933. As of March 31, 2011, the number of VRDP Shares outstanding and maturity date for each Fund are as follows:
| | | | | | | | | | | | | Insured | |
| | | | New York | | | New York | | | New York | | | New York | |
| | | | Investment | | | Select | | | Quality | | | Dividend | |
| | | | Quality | | | Quality | | | Income | | | Advantage | |
| | | | (NQN | ) | | (NVN | ) | | (NUN | ) | | (NKO | ) |
| Series | | | 1 | | | 1 | | | 1 | | | 2 | |
| Shares Outstanding | | | 1,123 | | | 1,648 | | | 1,617 | | | 500 | |
| Maturity | | | August 1, 2040 | | | August 1, 2040 | | | December 1, 2040 | | | June 1, 2040 | |
VRDP Shares include a liquidity feature that allows VRDP shareholders to have their shares purchased by a liquidity provider with whom each Fund has contracted in the event that purchase orders for VRDP Shares in a remarketing are not sufficient in number to be matched with the sale orders in that remarketing. Each Fund is required to redeem any VRDP Shares that are still owned by the liquidity provider after six months of continuous, unsuccessful remarketing.
Dividends on the VRDP Shares (which are treated as interest payments for financial reporting purposes) are set weekly at a rate established by a remarketing agent; therefore, the market value of the VRDP Shares is expected to approximate its liquidation value. If remarketings for VRDP Shares are continuously unsuccessful for six months, the maximum rate is designed to escalate according to a specified schedule in order to enhance the remarketing agent’s ability to successfully remarket the VRDP Shares.
Subject to certain conditions, VRDP Shares may be redeemed, in whole or in part, at any time at the option of each Fund. Each Fund may also redeem certain of the VRDP Shares if the Fund fails to maintain certain asset coverage requirements and such failures are not cured by the applicable cure date. The redemption price per share is equal to the sum of the liquidation value per share plus any accumulated but unpaid dividends.
The average liquidation value outstanding and annualized dividend rate of VRDP Shares for each Fund during the six months ended March 31, 2011, were as follows:
| | | | | | | | | | | | | Insured | |
| | | | New York | | | New York | | | New York | | | New York | |
| | | | Investment | | | Select | | | Quality | | | Dividend | |
| | | | Quality | | | Quality | | | Income | | | Advantage | |
| | | | (NQN | ) | | (NVN | ) | | (NUN | )* | | (NKO | ) |
| Average liquidation value outstanding | | | 112,300,000 | | | 164,800,000 | | | 161,700,000 | | | 50,000,000 | |
| Annualized dividend rate | | | 0.52% | | | 0.52% | | | 0.52% | | | 0.41% | |
| * | For the period December 16, 2010 (issuance date of shares) through March 31, 2011. |
For financial reporting purposes only, the liquidation value of VRDP Shares is recognized as a liability on the Statement of Assets and Liabilities. Unpaid dividends on VRDP Shares are recognized as a component of “Interest payable” on the Statement of Assets and Liabilities. Dividends paid on the VRDP Shares are recognized as a component of “Interest expense and amortization of offering costs” on the Statement of Operations. In addition to interest expense, each Fund also pays a per annum liquidity fee to the liquidity provider, which is recognized as “Liquidity fees on VRDP Shares” on the Statement of Operations.
Insurance
Since 2007, the financial status of most major municipal bond insurers has deteriorated substantially, and some insurers have gone out of business, rendering worthless the insurance policies they had written. Under normal circumstances, each Fund invests at least 80% of its managed assets (as defined in Footnote 7 – Management Fees and Other Transactions with Affiliates) in municipal securities that are covered by insurance guaranteeing the timely payment of principal and interest. In addition, the municipal securities in which each Fund invests will be investment grade at the time of purchase (including (i) bonds insured by investment grade rated insurers or are rated investment grade; (ii) unrated bonds that are judged to be investment grade by the Adviser; and (iii) escrowed bonds). Ratings below BBB by one or more national rating agencies are considered to be below investment grade.
Each insured municipal security is covered by Original Issue Insurance, Secondary Market Insurance or Portfolio Insurance. Assuming that the insurer remains creditworthy, the insurance feature of a municipal security guarantees the full payment of principal and interest when due through the life of an insured obligation. Such insurance does not guarantee the market value of the insured obligation or the value of the Fund’s Common shares. Original Issue Insurance and Secondary Market Insurance remain in effect as long as the municipal securities covered thereby remain outstanding and the insurer remains in business, regardless of whether the Funds ultimately dispose of such municipal securities. Consequently, the market value of the municipal securities covered by Original Issue Insurance or Secondary Market Insurance may reflect value attributable to the insurance. Portfolio Insurance, in contrast, is effective only while the municipal securities are held by the Funds and is reflected as an expense over the term of the policy when applicable. Accordingly, neither the prices used in determining the market value of the underlying municipal securities nor the Common share
| | | Notes to |
| | | Financial Statements (Unaudited) (continued) |
net asset value of the Funds include value, if any, attributable to the Portfolio Insurance. Each policy of the Portfolio Insurance does, however, give the Funds the right to obtain permanent insurance with respect to the municipal security covered by the Portfolio Insurance policy at the time of its sale.
Inverse Floating Rate Securities
Each Fund is authorized to invest in inverse floating rate securities. An inverse floating rate security is created by depositing a municipal bond, typically with a fixed interest rate, into a special purpose trust created by a broker-dealer. In turn, this trust (a) issues floating rate certificates, in face amounts equal to some fraction of the deposited bond’s par amount or market value, that typically pay short-term tax-exempt interest rates to third parties, and (b) issues to a long-term investor (such as one of the Funds) an inverse floating rate certificate (sometimes referred to as an “inverse floater”) that represents all remaining or residual interest in the trust. The income received by the inverse floater holder varies inversely with the short-term rate paid to the floating rate certificates’ holders, and in most circumstances the inverse floater holder bears substantially all of the underlying bond’s downside investment risk and also benefits disproportionately from any potential appreciation of the underlying bond’s value. The price of an inverse floating rate security will be more volatile than that of the underlying bond because the interest rate is dependent on not only the fixed coupon rate of the underlying bond but also on the short-term interest paid on the floating rate certificates, and because the inverse floating rate security essentially bears the risk of loss of the greater face value of the underlying bond.
A Fund may purchase an inverse floating rate security in a secondary market transaction without first owning the underlying bond (referred to as an “externally-deposited inverse floater”), or instead by first selling a fixed-rate bond to a broker-dealer for deposit into the special purpose trust and receiving in turn the residual interest in the trust (referred to as a “self-deposited inverse floater”). The inverse floater held by a Fund gives the Fund the right (a) to cause the holders of the floating rate certificates to tender their notes at par, and (b) to have the broker transfer the fixed-rate bond held by the trust to the Fund, thereby collapsing the trust. An investment in an externally-deposited inverse floater is identified in the Portfolio of Investments as “(IF) – Inverse floating rate investment.” An investment in a self-deposited inverse floater is accounted for as a financing transaction. In such instances, a fixed-rate bond deposited into a special purpose trust is identified in the Portfolio of Investments as “(UB) – Underlying bond of an inverse floating rate trust reflected as a financing transaction,” with the Fund accounting for the short-term floating rate certificates issued by the trust as “Floating rate obligations” on the Statement of Assets and Liabilities. In addition, the Fund reflects in “Investment Income” the entire earnings of the underlying bond and recognizes the related interest paid to the holders of the short-term floating rate certificates as a component of “Interest expense and amortization of offering costs” on the Statement of Operations.
During the six months ended March 31, 2011, each Fund invested in externally-deposited inverse floaters and/or self-deposited inverse floaters.
Each Fund may also enter into shortfall and forbearance agreements (sometimes referred to as a “recourse trust” or “credit recovery swap”) (such agreements referred to herein as “Recourse Trusts”) with a broker-dealer by which a Fund agrees to reimburse the broker-dealer, in certain circumstances, for the difference between the liquidation value of the fixed-rate bond held by the trust and the liquidation value of the floating rate certificates issued by the trust plus any shortfalls in interest cash flows. Under these agreements, a Fund’s potential exposure to losses related to or on inverse floaters may increase beyond the value of a Fund’s inverse floater investments as a Fund may potentially be liable to fulfill all amounts owed to holders of the floating rate certificates. At period end, any such shortfall is recognized as “Unrealized depreciation on Recourse Trusts” on the Statement of Assets and Liabilities.
At March 31, 2011, each Fund’s maximum exposure to externally-deposited Recourse Trusts is as follows:
| | | | | | | | | | | | | Insured | | | Insured | | | Insured | |
| | | | New York | | | New York | | | New York | | | New York | | | New York | | | New York | |
| | | | Investment | | | Select | | | Quality | | | Premium | | | Dividend | | | Tax-Free | |
| | | | Quality | | | Quality | | | Income | | | Income | | | Advantage | | | Advantage | |
| | | | (NQN | ) | | (NVN | ) | | (NUN | ) | | (NNF | ) | | (NKO | ) | | (NRK | ) |
| Maximum exposure to Recourse Trusts | | $ | 7,790,000 | | $ | 9,585,000 | | $ | 9,700,000 | | $ | 3,420,000 | | $ | 610,000 | | $ | 560,000 | |
The average floating rate obligations outstanding and average annual interest rate and fees related to self-deposited inverse floaters during the six months ended March 31, 2011, were as follows:
| | | | | | | | | | | | | Insured | | | Insured | | | Insured | |
| | | | New York | | | New York | | | New York | | | New York | | | New York | | | New York | |
| | | | Investment | | | Select | | | Quality | | | Premium | | | Dividend | | | Tax-Free | |
| | | | Quality | | | Quality | | | Income | | | Income | | | Advantage | | | Advantage | |
| | | | (NQN | ) | | (NVN | ) | | (NUN | ) | | (NNF | ) | | (NKO | ) | | (NRK | ) |
| Average floating rate obligations outstanding | | $ | 37,145,000 | | $ | 33,510,000 | | $ | 40,245,000 | | $ | 16,600,000 | | $ | 11,620,000 | | $ | 2,390,000 | |
| Average annual interest rate and fees | | | 0.69 | % | | 0.65 | % | | 0.70 | % | | 0.69 | % | | 0.66 | % | | 0.61 | % |
Derivative Financial Instruments
Each Fund is authorized to invest in certain derivative instruments, including foreign currency forwards, futures, options and swap contracts. Although each Fund is authorized to invest in such derivative instruments, and may do so in the future, they did not make any such investments during the six months ended March 31, 2011.
Market and Counterparty Credit Risk
In the normal course of business each Fund may invest in financial instruments and enter into financial transactions where risk of potential loss exists due to changes in the market (market risk) or failure of the other party to the transaction to perform (counterparty credit risk). The potential loss could exceed the value of the financial assets recorded on the financial statements. Financial assets, which potentially expose each Fund to counterparty credit risk, consist principally of cash due from counterparties on forward, option and swap transactions, when applicable. The extent of each Fund’s exposure to counterparty credit risk in respect to these financial assets approximates their carrying value as recorded on the Statement of Assets and Liabilities. Futures contracts, when applicable, expose a Fund to minimal counterparty credit risk as they are exchange traded and the exchange’s clearinghouse, which is counterparty to all exchange traded futures, guarantees the futures contracts against default.
Each Fund helps manage counterparty credit risk by entering into agreements only with counterparties the Adviser believes have the financial resources to honor their obligations and by having the Adviser monitor the financial stability of the counterparties. Additionally, counterparties may be required to pledge collateral daily (based on the daily valuation of the financial asset) on behalf of each Fund with a value approximately equal to the amount of any unrealized gain above a pre-determined threshold. Reciprocally, when each Fund has an unrealized loss, the Funds have instructed the custodian to pledge assets of the Funds as collateral with a value approximately equal to the amount of the unrealized loss above a pre-determined threshold. Collateral pledges are monitored and subsequently adjusted if and when the valuations fluctuate, either up or down, by at least the predetermined threshold amount.
Zero Coupon Securities
Each Fund is authorized to invest in zero coupon securities. A zero coupon security does not pay a regular interest coupon to its holders during the life of the security. Tax-exempt income to the holder of the security comes from accretion of the difference between the original purchase price of the security at issuance and the par value of the security at maturity and is effectively paid at maturity. The market prices of zero coupon securities generally are more volatile than the market prices of securities that pay interest periodically.
Offering Costs
Costs incurred by Insured New York Tax-Free Advantage (NRK) in connection with its offering of MTP Shares ($670,200) were recorded as a deferred charge, which are being amortized over the life of the shares. Costs incurred by New York Investment Quality (NQN), New York Select Quality (NVN), New York Quality Income (NUN) and Insured New York Dividend Advantage (NKO) in connection with their offerings of VRDP Shares ($700,750, $852,000, $845,000 and $675,000, respectively) were recorded as deferred charges which are being amortized over the life of the shares. Each Fund’s amortized deferred charges are recognized as a component of “Interest expense and amortization of offering costs” on the Statement of Operations.
Custodian Fee Credit
Each Fund has an arrangement with the custodian bank whereby certain custodian fees and expenses are reduced by net credits earned on each Fund’s cash on deposit with the bank. Such deposit arrangements are an alternative to overnight investments. Credits for cash balances may be offset by charges for any days on which a Fund overdraws its account at the custodian bank.
Indemnifications
Under the Funds’ organizational documents, their officers and directors/trustees are indemnified against certain liabilities arising out of the performance of their duties to the Funds. In addition, in the normal course of business, the Funds enter into contracts that provide general indemnifications to other parties. The Funds’ maximum exposure under these arrangements is unknown as this would involve future claims that may be made against the Funds that have not yet occurred. However, the Funds have not had prior claims or losses pursuant to these contracts and expect the risk of loss to be remote.
Use of Estimates
The preparation of financial statements in conformity with U.S. GAAP requires management to make estimates and assumptions that affect the reported amounts of assets and liabilities at the date of the financial statements and the reported amounts of increases and decreases in net assets applicable to Common shares from operations during the reporting period. Actual results may differ from those estimates.
| | | Notes to |
| | | Financial Statements (Unaudited) (continued) |
2. Fair Value Measurements
Fair value is defined as the price that the Funds would receive upon selling an investment or transferring a liability in an orderly transaction to an independent buyer in the principal or most advantageous market of the investment. A three-tier hierarchy is used to maximize the use of observable market data and minimize the use of unobservable inputs and to establish classification of fair value measurements for disclosure purposes. Observable inputs reflect the assumptions market participants would use in pricing the asset or liability. Observable inputs are based on market data obtained from sources independent of the reporting entity. Unobservable inputs reflect the reporting entity’s own assumptions about the assumptions market participants would use in pricing the asset or liability. Unobservable inputs are based on the best information available in the circumstances. The three-tier hierarchy of inputs is summarized in the three broad levels listed below:
| | | |
| | Level 1 – | Quoted prices in active markets for identical securities. |
| | Level 2 – | Other significant observable inputs (including quoted prices for similar securities, interest rates, prepayment speeds, credit risk, etc.). |
| | Level 3 – | Significant unobservable inputs (including management’s assumptions in determining the fair value of investments). |
The inputs or methodologies used for valuing securities are not an indication of the risk associated with investing in those securities. The following is a summary of each Fund’s fair value measurements as of March 31, 2011:
| New York Investment Quality (NQN) | | Level 1 | | | Level 2 | | | Level 3 | | | Total | |
| Investments: | | | | | | | | | | | | |
| Municipal Bonds | | $ | — | | | $ | 388,751,138 | | | $ | — | | | $ | 388,751,138 | |
| Short-Term Investments | | | — | | | | 4,950,000 | | | | — | | | | 4,950,000 | |
| Total | | $ | — | | | $ | 393,701,138 | | | $ | — | | | $ | 393,701,138 | |
| New York Select Quality (NVN) | | Level 1 | | | Level 2 | | | Level 3 | | | Total | |
| Investments: | | | | | | | | | | | | |
| Municipal Bonds | | $ | — | | | $ | 519,550,926 | | | $ | — | | | $ | 519,550,926 | |
| Short-Term Investments | | | — | | | | 4,950,000 | | | | — | | | | 4,950,000 | |
| Total | | $ | — | | | $ | 524,500,926 | | | $ | — | | | $ | 524,500,926 | |
| New York Quality Income (NUN) | | Level 1 | | | Level 2 | | | Level 3 | | | Total | |
| Investments: | | | | | | | | | | | | |
| Municipal Bonds | | $ | — | | | $ | 532,112,904 | | | $ | — | | | $ | 532,112,904 | |
| Insured New York Premium Income (NNF) | | Level 1 | | | Level 2 | | | Level 3 | | | Total | |
| Investments: | | | | | | | | | | | | |
| Municipal Bonds | | $ | — | | | $ | 185,026,995 | | | $ | — | | | $ | 185,026,995 | |
| Insured New York Dividend Advantage (NKO) | | Level 1 | | | Level 2 | | | Level 3 | | | Total | |
| Investments: | | | | | | | | | | | | |
| Municipal Bonds | | $ | — | | | $ | 172,722,594 | | | $ | — | | | $ | 172,722,594 | |
| Insured New York Tax-Free Advantage (NRK) | | Level 1 | | | Level 2 | | | Level 3 | | | Total | |
| Investments: | | | | | | | | | | | | |
| Municipal Bonds | | $ | — | | | $ | 77,668,751 | | | $ | — | | | $ | 77,668,751 | |
During the six months ended March 31, 2011, the Funds recognized no significant transfers to/from Level 1, Level 2 or Level 3.
3. Derivative Instruments and Hedging Activities
The Funds record derivative instruments at fair value, with changes in fair value recognized on the Statement of Operations, when applicable. Even though the Funds’ investments in derivatives may represent economic hedges, they are not considered to be hedge transactions for financial reporting purposes. The Funds did not invest in derivative instruments during the six months ended March 31, 2011.
4. Fund Shares
Common Shares
Transactions in Common shares were as follows:
| | | | New York | | | | New York | | | | New York | |
| | | | Investment Quality (NQN) | | | | Select Quality (NVN) | | | | Quality Income (NUN) | |
| | | Six Months | | | | | | Six Months | | | | | | Six Months | | | | |
| | | Ended | | | Year Ended | | | Ended | | | Year Ended | | | Ended | | | Year Ended | |
| | | 3/31/11 | | | 9/30/10 | | | 3/31/11 | | | 9/30/10 | | | 3/31/11 | | | 9/30/10 | |
| Common shares repurchased and retired | | | — | | | | — | | | | — | | | | — | | | | — | | | | (1,700 | ) |
| Weighted average Common share: | | | | | | | | | | | | | | | | | | | | | | | | |
| Price per share repurchased and retired | | | — | | | | — | | | | — | | | | — | | | | — | | | $ | 12.81 | |
| Discount per share repurchased and retired | | | — | | | | — | | | | — | | | | — | | | | — | | | | 12.38 | % |
| | | | Insured New York | | | | Insured New York | | | | Insured New York | |
| | | | Premium Income (NNF) | | | | Dividend Advantage (NKO) | | | | Tax-Free Advantage (NRK) | |
| | | Six Months | | | | | | Six Months | | | | | | Six Months | | | | |
| | | Ended | | | Year Ended | | | Ended | | | Year Ended | | | Ended | | | Year Ended | |
| | | 3/31/11 | | | 9/30/10 | | | 3/31/11 | | | 9/30/10 | | | 3/31/11 | | | 9/30/10 | |
| Common shares repurchased and retired | | | — | | | | (12,700 | ) | | | — | | | | — | | | | — | | | | — | |
| Weighted average Common share: | | | | | | | | | | | | | | | | | | | | | | | | |
| Price per share repurchased and retired | | | — | | | $ | 13.02 | | | | — | | | | — | | | | — | | | | — | |
| Discount per share repurchased and retired | | | — | | | | 11.83 | % | | | — | | | | — | | | | — | | | | — | |
Preferred Shares
Insured New York Premium Income (NNF) did not redeem any of its outstanding ARPS during the six months ended March 31, 2011 or the fiscal year ended September 30, 2010. Insured New York Dividend Advantage (NKO) redeemed all of its outstanding ARPS during the fiscal year ended September 30, 2008.
Transactions in ARPS were as follows:
| | | | New York | | | New York | |
| | | | Investment Quality (NQN) | | | Select Quality (NVN) | |
| | | | Six Months Ended | | | | Year Ended | | | Six Months Ended | | | | Year Ended | |
| | | | 3/31/11 | | | | 9/30/10 | | | 3/31/11 | | | | 9/30/10 | |
| | | Shares | | | Amount | | | Shares | | | Amount | | | Shares | | | Amount | | | Shares | | | Amount | |
| ARPS redeemed: | | | | | | | | | | | | | | | | | | | | | | | | |
| Series M | | | — | | | $ | — | | | | 744 | | | $ | 18,600,000 | | | | — | | | $ | — | | | | — | | | $ | — | |
| Series T | | | — | | | | — | | | | 1,858 | | | | 46,450,000 | | | | — | | | | — | | | | 1,461 | | | | 36,525,000 | |
| Series W | | | — | | | | — | | | | — | | | | — | | | | — | | | | — | | | | 2,038 | | | | 50,950,000 | |
| Series TH | | | — | | | | — | | | | — | | | | — | | | | — | | | | — | | | | 3,057 | | | | 76,425,000 | |
| Series F | | | — | | | | — | | | | 1,858 | | | | 46,450,000 | | | | — | | | | — | | | | — | | | | — | |
| Total | | | — | | | $ | — | | | | 4,460 | | | $ | 111,500,000 | | | | — | | | $ | — | | | | 6,556 | | | $ | 163,900,000 | |
| | | | New York Quality Income (NUN) | | | Insured New York Tax-Free Advantage (NRK) | |
| | | | Six Months Ended | | | | Year Ended | | | Six Months Ended | | | | Year Ended | |
| | | | 3/31/11 | | | | 9/30/10 | | | 3/31/11 | | | | 9/30/10 | |
| | | Shares | | | Amount | | | Shares | | | Amount | | | Shares | | | Amount | | | Shares | | | Amount | |
| ARPS redeemed: | | | | | | | | | | | | | | | | | | | | | | | | |
| Series M | | | 1,794 | | | $ | 44,850,000 | | | | — | | | $ | — | | | | — | | | $ | — | | | | — | | | $ | — | |
| Series W | | | 1,796 | | | | 44,900,000 | | | | — | | | | — | | | | — | | | | — | | | | — | | | | — | |
| Series TH | | | 1,959 | | | | 48,975,000 | | | | — | | | | — | | | | — | | | | — | | | | 1,080 | | | | 27,000,000 | |
| Series F | | | 882 | | | | 22,050,000 | | | | — | | | | — | | | | — | | | | — | | | | — | | | | — | |
| Total | | | 6,431 | | | $ | 160,775,000 | | | | — | | | $ | — | | | | — | | | $ | — | | | | 1,080 | | | $ | 27,000,000 | |
| | | Notes to |
| | | Financial Statements (Unaudited) (continued) |
Transactions in MTP Shares were as follows:
| | | Insured New York Tax-Free Advantage (NRK) | |
| | | Six Months Ended 3/31/11 | | | Year Ended 9/30/10 | |
| | Shares | | | Amount | | Shares | | | Amount | |
| MTP Shares issued: | | | | | | | | | | | | |
| Series 2015 | | — | | | $ | — | | 2,768,000 | | | $ | 27,680,000 | |
Transactions in VRDP Shares were as follows:
| | | New York Investment Quality (NQN) | | New York Select Quality (NVN) | |
| | | | Six Months Ended 3/31/11 | | | Year Ended 9/30/10 | | | Six Months Ended 3/31/11 | | | Year Ended 9/30/10 | |
| | | Shares | | Amount | | Shares | | | Amount | | Shares | | | Amount | | Shares | | | Amount | |
| VRDP Shares issued: | | | | | | | | | | | | | | | | | | | | | | | | | |
| Series 1 | | | — | | $ | — | | 1,123 | | $ | 112,300,000 | | — | | $ | — | | 1,648 | | $ | 164,800,000 | |
| | | New York Quality Income (NUN) | |
| | | Six Months Ended 3/31/11 | | | Year Ended 9/30/10 | |
| | Shares | | Amount | | Shares | | Amount | |
| VRDP Shares issued: | | | | | | | | | | |
| Series 1 | 1,671 | | $ | 161,700,000 | | — | | $ | — | |
During the fiscal year ended September 30, 2010, Insured New York Dividend Advantage (NKO) completed a private exchange offer in which all of its 500 Series 1 VRDP Shares were exchanged for 500 Series 2 VRDP Shares.
5. Investment Transactions
Purchases and sales (including maturities but excluding short-term investments and derivative transactions, when applicable) during the six months ended March 31, 2011, were as follows:
| | | | | | | | | | | | Insured | | | Insured | | | Insured | |
| | | New York | | | New York | | | New York | | | New York | | | New York | | | New York | |
| | | Investment | | | Select | | | Quality | | | Premium | | | Dividend | | | Tax-Free | |
| | | Quality | | | Quality | | | Income | | | Income | | | Advantage | | | Advantage | |
| | | (NQN) | | | (NVN) | | | (NUN) | | | (NNF) | | | (NKO) | | | (NRK) | |
| Purchases | | $ | 11,066,006 | | | $ | 20,114,081 | | | $ | 27,165,217 | | | $ | 12,479,813 | | | $ | 17,654,176 | | | $ | 1,029,340 | |
| Sales and maturities | | | 10,955,000 | | | | 9,203,566 | | | | 8,912,815 | | | | 3,362,130 | | | | 14,841,272 | | | | 1,895,665 | |
6. Income Tax Information
The following information is presented on an income tax basis. Differences between amounts for financial statement and federal income tax purposes are primarily due to the timing differences in recognizing taxable market discount, timing differences in recognizing certain gains and losses on investment transactions and the treatment of investments in inverse floating rate securities reflected as financing transactions, if any. To the extent that differences arise that are permanent in nature, such amounts are reclassified within the capital accounts as detailed below. Temporary differences do not require reclassification. Temporary and permanent differences do not impact the net asset values of the Funds.
At March 31, 2011, the cost and unrealized appreciation (depreciation) of investments, as determined on a federal income tax basis, were as follows:
| | | | | | | | | | | | Insured | | | Insured | | | Insured | |
| | | New York | | | New York | | | New York | | | New York | | | New York | | | New York | |
| | | Investment | | | Select | | | Quality | | | Premium | | | Dividend | | | Tax-Free | |
| | | Quality | | | Quality | | | Income | | | Income | | | Advantage | | | Advantage | |
| | | (NQN) | | | (NVN) | | | (NUN) | | | (NNF) | | | (NKO) | | | (NRK) | |
| Cost of investments | | $ | 358,292,981 | | | $ | 489,009,625 | | | $ | 491,640,609 | | | $ | 168,469,438 | | | $ | 161,146,765 | | | $ | 75,352,589 | |
| Gross unrealized: | | | | | | | | | | | | | | | | | | | | | | | | |
| Appreciation | | $ | 7,945,673 | | | $ | 15,418,675 | | | $ | 14,221,336 | | | $ | 4,232,716 | | | $ | 3,273,306 | | | $ | 1,718,499 | |
| Depreciation | | | (9,667,432 | ) | | | (13,444,118 | ) | | | (14,019,630 | ) | | | (4,267,490 | ) | | | (3,302,152 | ) | | | (1,796,387 | ) |
| Net unrealized appreciation (depreciation) of investments | | $ | (1,721,759 | ) | | $ | 1,974,557 | | | $ | 201,706 | | | $ | (34,774 | ) | | $ | (28,846 | ) | | $ | (77,888 | ) |
Permanent differences, primarily due to federal taxes paid, taxable market discount and distribution character reclassifications, resulted in reclassifications among the Funds’ components of Common share net assets at September 30, 2010, the Funds’ last tax year end, as follows:
| | | | | | | | | | | | Insured | | | Insured | | | Insured | |
| | | New York | | | New York | | | New York | | | New York | | | New York | | | New York | |
| | | Investment | | | Select | | | Quality | | | Premium | | | Dividend | | | Tax-Free | |
| | | Quality | | | Quality | | | Income | | | Income | | | Advantage | | | Advantage | |
| | | (NQN) | | | (NVN) | | | (NUN) | | | (NNF) | | | (NKO) | | | (NRK) | |
| Paid-in-surplus | | $ | (2,754 | ) | | $ | (2,872 | ) | | $ | — | | | $ | — | | | $ | (255,231 | ) | | $ | (62,299 | ) |
| Undistributed (Over-distribution of) net investment income | | | 2,754 | | | | (40,477 | ) | | | (39,845 | ) | | | (166 | ) | | | 255,738 | | | | 61,642 | |
| Accumulated net realized gain (loss) | | | — | | | | 43,349 | | | | 39,845 | | | | 166 | | | | (507 | ) | | | 657 | |
The tax components of undistributed net tax-exempt income, net ordinary income and net long-term capital gains at September 30, 2010, the Funds’ last tax year end, were as follows:
| | | | | | | | | | | | Insured | | | Insured | | | Insured | |
| | | New York | | | New York | | | New York | | | New York | | | New York | | | New York | |
| | | Investment | | | Select | | | Quality | | | Premium | | | Dividend | | | Tax-Free | |
| | | Quality | | | Quality | | | Income | | | Income | | | Advantage | | | Advantage | |
| | | (NQN) | | | (NVN) | | | (NUN) | | | (NNF) | | | (NKO) | | | (NRK) | |
| Undistributed net tax-exempt income * | | $ | 4,344,606 | | | $ | 6,075,147 | | | $ | 6,348,177 | | | $ | 2,050,491 | | | $ | 1,504,602 | | | $ | 606,810 | |
| Undistributed net ordinary income ** | | | 8,786 | | | | 6,619 | | | | — | | | | — | | | | — | | | | 235 | |
| Undistributed net long-term capital gains | | | 901,589 | | | | 688,765 | | | | 106,704 | | | | — | | | | — | | | | 1,273 | |
| * | Undistributed net tax-exempt income (on a tax basis) has not been reduced for the dividend declared on September 1, 2010, paid on October 1, 2010. |
| ** | Net ordinary income consists of taxable market discount income and net short-term capital gains, if any. |
The tax character of distributions paid during the Funds’ last tax year ended September 30, 2010, was designated for purposes of the dividends paid deduction as follows:
| | | | | | | | | | | | Insured | | | Insured | | | Insured | |
| | | New York | | | New York | | | New York | | | New York | | | New York | | | New York | |
| | | Investment | | | Select | | | Quality | | | Premium | | | Dividend | | | Tax-Free | |
| | | Quality | | | Quality | | | Income | | | Income | | | Advantage | | | Advantage | |
| | | (NQN) | | | (NVN) | | | (NUN) | | | (NNF) | | | (NKO) | | | (NRK) | |
| Distributions from net tax-exempt income | | $ | 13,979,689 | | | $ | 18,904,600 | | | $ | 19,182,269 | | | $ | 6,203,408 | | | $ | 6,279,396 | | | $ | 2,864,336 | |
| Distributions from net ordinary income ** | | | — | | | | — | | | | — | | | | — | | | | 5,556 | | | | 99,670 | |
| Distributions from net long-term capital gains | | | — | | | | — | | | | — | | | | — | | | | 15,081 | | | | 165,559 | |
| ** | Net ordinary income consists of taxable market discount income and net short-term capital gains, if any. |
| | | Notes to |
| | | Financial Statements (Unaudited) (continued) |
At September 30, 2010, the Funds’ last tax year end, the following Funds had unused capital loss carryforwards available for federal income tax purposes to be applied against future capital gains, if any. If not applied, the carryforwards will expire as follows:
| | | Insured | | | Insured | |
| | | New York | | | New York | |
| | | Premium | | | Dividend | |
| | | Income | | | Advantage | |
| | | (NNF) | | | (NKO) | |
| Expiration: | | | | | | |
| September 30, 2016 | | $ | 10,016 | | | $ | — | |
| September 30, 2018 | | | — | | | | 4,774 | |
| | | | | | | | | |
| Total | | $ | 10,016 | | | $ | 4,774 | |
During the Funds’ last tax year ended September 30, 2010, the following Funds utilized capital loss carryforwards as follows:
| | | | | | | | | | | | | Insured | |
| | | | New York | | | New York | | | New York | | | New York | |
| | | | Investment | | | Select | | | Quality | | | Premium | |
| | | | Quality | | | Quality | | | Income | | | Income | |
| | | | (NQN) | | | (NVN) | | | (NUN) | | | (NNF) | |
| Utilized capital loss carryforwards | | $ | 205,863 | | $ | 174,040 | | $ | 505,047 | | $ | 64,101 | |
7. Management Fees and Other Transactions with Affiliates
Each Fund’s management fee consists of two components – a fund-level fee, based only on the amount of assets within the Fund, and a complex-level fee, based on the aggregate amount of all eligible fund assets managed by the Adviser. This pricing structure enables Fund shareholders to benefit from growth in the assets within their Fund as well as from growth in the amount of complex-wide assets managed by the Adviser.
The annual fund-level fee for each Fund, payable monthly, is calculated according to the following schedule:
| | | New York Investment Quality (NQN) |
| | | New York Select Quality (NVN) |
| | | New York Quality Income (NUN) |
| | | Insured New York Premium Income (NNF) |
| Average Daily Managed Assets* | | Fund-Level Fee Rate |
| For the first $125 million | | | .4500 | % |
| For the next $125 million | | | .4375 | |
| For the next $250 million | | | .4250 | |
| For the next $500 million | | | .4125 | |
| For the next $1 billion | | | .4000 | |
| For the next $3 billion | | | .3875 | |
| For managed assets over $5 billion | | | .3750 | |
| | | Insured New York Dividend Advantage (NKO) |
| | | Insured New York Tax-Free Advantage (NRK) |
| Average Daily Managed Assets* | | Fund-Level Fee Rate |
| For the first $125 million | | | .4500 | % |
| For the next $125 million | | | .4375 | |
| For the next $250 million | | | .4250 | |
| For the next $500 million | | | .4125 | |
| For the next $1 billion | | | .4000 | |
| For managed assets over $2 billion | | | .3750 | |
The annual complex-level fee for each Fund, payable monthly, is calculated according to the following schedule:
| Complex-Level Managed Asset Breakpoint Level* | Effective Rate at Breakpoint Level |
| $55 billion | .2000% |
| $56 billion | .1996 |
| $57 billion | .1989 |
| $60 billion | .1961 |
| $63 billion | .1931 |
| $66 billion | .1900 |
| $71 billion | .1851 |
| $76 billion | .1806 |
| $80 billion | .1773 |
| $91 billion | .1691 |
| $125 billion | .1599 |
| $200 billion | .1505 |
| $250 billion | .1469 |
| $300 billion | .1445 |
| * | For the fund-level and complex-level fees, managed assets include closed-end fund assets managed by the Adviser that are attributable to financial leverage. For these purposes, financial leverage includes the funds’ use of preferred stock and borrowings and certain investments in the residual interest certificates (also called inverse floating rate securities) in tender option bond (TOB) trusts, including the portion of assets held by a TOB trust that has been effectively financed by the trust’s issuance of floating rate securities, subject to an agreement by the Adviser as to certain funds to limit the amount of such assets for determining managed assets in certain circumstances. The complex-level fee is calculated based upon the aggregate daily managed assets of all Nuveen funds that constitute “eligible assets.” Eligible assets do not include assets attributable to investments in other Nuveen funds or assets in excess of $2 billion added to the Nuveen fund complex in connection with the Adviser’s assumption of the management of the former First American Funds effective January 1, 2011. As of March 31, 2011, the complex-level fee rate for these Funds was .1800%. |
The management fee compensates the Adviser for overall investment advisory and administrative services and general office facilities. The Adviser has entered into Sub-Advisory Agreements with the Sub-Adviser under which the Sub-Adviser manages the investment portfolios of the Funds. The Sub-Adviser is compensated for its services to the Funds from the management fees paid to the Adviser.
The Funds pay no compensation directly to those of its directors/trustees who are affiliated with the Adviser or to its officers, all of whom receive remuneration for their services to the Funds from the Adviser or its affiliates. The Board of Directors/Trustees has adopted a deferred compensation plan for independent directors/trustees that enables directors/trustees to elect to defer receipt of all or a portion of the annual compensation they are entitled to receive from certain Nuveen advised funds. Under the plan, deferred amounts are treated as though equal dollar amounts had been invested in shares of select Nuveen-advised funds.
For the first ten years of Insured New York Dividend Advantage’s (NKO) operations, the Adviser has agreed to reimburse the Fund, as a percentage of average daily managed assets, for fees and expenses in the amounts and for the time periods set forth below:
| Year Ending | | | | Year Ending | | |
| March 31, | | | | March 31, | | |
| | | | | | | |
| 2002* | .30 | % | | 2008 | .25 | % |
| 2003 | .30 | | | 2009 | .20 | |
| 2004 | .30 | | | 2010 | .15 | |
| 2005 | .30 | | | 2011 | .10 | |
| 2006 | .30 | | | 2012 | .05 | |
| 2007 | .30 | | | | | |
* From the commencement of operations.
The Adviser has not agreed to reimburse Insured New York Dividend Advantage (NKO) for any portion of its fees and expenses beyond March 31, 2012.
| | | Notes to |
| | | Financial Statements (Unaudited) (continued) |
For the first eight years of Insured New York Tax-Free Advantage’s (NRK) operations, the Adviser has agreed to reimburse the Fund, as a percentage of average daily managed assets, for fees and expenses in the amounts and for the time periods set forth below:
| Year Ending | | | | Year Ending | | |
| November 30, | | | | November 30, | | |
| | | | | | | |
| 2002* | .32 | % | | 2007 | .32 | % |
| 2003 | .32 | | | 2008 | .24 | |
| 2004 | .32 | | | 2009 | .16 | |
| 2005 | .32 | | | 2010 | .08 | |
| 2006 | .32 | | | | | |
| * | From the commencement of operations. |
The Adviser has not agreed to reimburse Insured New York Tax-Free Advantage (NRK) for any portion of its fees and expenses beyond November 30, 2010.
As a result of certain trading errors that occurred during the fiscal year ended September 30, 2010, Insured New York Tax-Free Advantage (NRK) was reimbursed $35,020 by the Adviser to offset losses realized on the disposal of investments in violation of investment guidelines.
8. Subsequent Events
Regulatory Matters
Subsequent to the reporting period, Nuveen Securities, LLC (“Nuveen Securities”) entered into a settlement with the Financial Industry Regulatory Authority (“FINRA”) with respect to certain allegations regarding Nuveen-sponsored closed-end fund ARPS marketing brochures. As part of this settlement, Nuveen Securities neither admitted to nor denied FINRA’s allegations. Nuveen Securities is the broker-dealer subsidiary of Nuveen.
The settlement with FINRA concludes an investigation that followed the widespread failure of auctions for ARPS and other auction rate securities, which generally began in mid-February 2008. In the settlement, FINRA alleged that certain marketing materials provided by Nuveen Securities were false and misleading. Nuveen Securities agreed to a censure and the payment of a $3 million fine.
Board Approval of Sub-Advisory
Arrangements (Unaudited)
At a meeting held on May 25-26, 2010 (the “May Meeting”), the Boards of Trustees or Directors (as the case may be) (each, a “Board” and each Trustee or Director, a “Board Member”) of the Funds, including a majority of the Board Members who are not parties to the advisory agreements or “interested persons” of any parties (the “Independent Board Members”), considered and approved the advisory agreements (each, an “Advisory Agreement”) between each Fund and Nuveen Asset Management (the “Adviser”). Since the May Meeting, Nuveen has engaged in an internal restructuring (the “Restructuring”) pursuant to which the portfolio management services provided by the Adviser to the Funds were transferred to Nuveen Asset Management, LLC (“NAM LLC”), a newly-organized wholly-owned subsidiary of the Adviser and the Adviser changed its name to Nuveen Fund Advisors, Inc. (“NFA”). The Adviser, under its new name NFA, continues to serve as investment adviser to the Funds and, in that capacity, will continue to provide various oversight, administrative, compliance and other services. To effectuate the foregoing, NFA entered into sub-advisory agreements with NAM LLC on behalf of the Funds (each, a “Sub-Advisory Agreement”). Under each Sub-Advisory Agreement, NAM LLC, subject to the oversight of NFA and the Board, will furnish an investment program, make investment decisions for, and place all orders for the purchase and sale of securities for the portion of the respective Fund’s investment portfolio allocated to it by NFA. There have been no changes to the advisory fees paid by the Funds; rather, NFA will pay a portion of the investment advisory fee it receives to NAM LLC for its sub-advisory services. The Independent Board Members reviewed the allocation of fees between NFA and NAM LLC. NFA and NAM LLC do not anticipate any reduction in the nature or level of services provided to the Funds following the Restructuring. The personnel of NFA who engaged in portfolio management activities prior to the spinoff of NAM LLC are not expected to materially change as a result of the spinoff. In light of the foregoing, at a meeting held on November 16-18, 2010, the Board Members, including a majority of the Independent Board Members, approved the Sub-Advisory Agreements on behalf of the Funds. Given that the Restructuring was not expected to reduce the level or nature of services provided and the advisory fees paid by the Funds were the same, the factors considered and determinations made at the May Meeting in approving the Advisory Agreements were equally applicable to the approval of the Sub-Advisory Agreements. For a discussion of these considerations, please see the shareholder report of the Funds that was first issued after the May Meeting for the period including May 2010.
Reinvest Automatically,
Easily and Conveniently
Nuveen makes reinvesting easy. A phone call is all it takes to set up your reinvestment account.
Nuveen Closed-End Funds Automatic Reinvestment Plan
Your Nuveen Closed-End Fund allows you to conveniently reinvest distributions in additional Fund shares.
By choosing to reinvest, you’ll be able to invest money regularly and automatically, and watch your investment grow through the power of compounding. Just like distributions in cash, there may be times when income or capital gains taxes may be payable on distributions that are reinvested.
It is important to note that an automatic reinvestment plan does not ensure a profit, nor does it protect you against loss in a declining market.
Easy and convenient
To make recordkeeping easy and convenient, each month you’ll receive a statement showing your total distributions, the date of investment, the shares acquired and the price per share, and the total number of shares you own.
How shares are purchased
The shares you acquire by reinvesting will either be purchased on the open market or newly issued by the Fund. If the shares are trading at or above net asset value at the time of valuation, the Fund will issue new shares at the greater of the net asset value or 95% of the then-current market price. If the shares are trading at less than net asset value, shares for your account will be purchased on the open market. If the Plan Agent begins purchasing Fund shares on the open market while shares are trading below net asset value, but the Fund’s shares subsequently trade at or above their net asset value before the Plan Agent is able to complete its purchases, the Plan Agent may cease open-market purchases and may invest the uninvested portion of the distribution in newly-issued Fund shares at a price equal to the greater of the shares’ net asset value or 95% of the shares’ market value on the last business day immediately prior to the purchase date. Distributions received to purchase shares in the open market will normally be invested shortly after the distribution payment date. No interest will be paid on distributions awaiting reinvestment. Because the market price of the shares may increase before purchases are completed, the average purchase price per share may
exceed the market price at the time of valuation, resulting in the acquisition of fewer shares than if the distribution had been paid in shares issued by the Fund. A pro rata portion of any applicable brokerage commissions on open market purchases will be paid by Plan participants. These commissions usually will be lower than those charged on individual transactions.
Flexible
You may change your distribution option or withdraw from the Plan at any time, should your needs or situation change.
You can reinvest whether your shares are registered in your name, or in the name of a brokerage firm, bank, or other nominee. Ask your investment advisor if his or her firm will participate on your behalf. Participants whose shares are registered in the name of one firm may not be able to transfer the shares to another firm and continue to participate in the Plan.
The Fund reserves the right to amend or terminate the Plan at any time. Although the Fund reserves the right to amend the Plan to include a service charge payable by the participants, there is no direct service charge to participants in the Plan at this time.
Call today to start reinvesting distributions
For more information on the Nuveen Automatic Reinvestment Plan or to enroll in or withdraw from the Plan, speak with your financial advisor or call us at (800) 257-8787.
Glossary of Terms
Used in this Report
| ■ | Auction Rate Bond: An auction rate bond is a security whose interest payments are adjusted periodically through an auction process, which process typically also serves as a means for buying and selling the bond. Auctions that fail to attract enough buyers for all the shares offered for sale are deemed to have “failed,” with current holders receiving a formula-based interest rate until the next scheduled auction. |
| | |
| ■ | Average Annual Total Return: This is a commonly used method to express an investment’s performance over a particular, usually multi-year time period. It expresses the return that would have been necessary each year to equal the investment’s actual cumulative performance (including change in NAV or market price and reinvested dividends and capital gains distributions, if any) over the time period being considered. |
| | |
| ■ | Average Effective Maturity: The market-value-weighted average of the effective maturity dates of the individual securities including cash. In the case of a bond that has been advance-refunded to a call date, the effective maturity is the date on which the bond is scheduled to be redeemed using the proceeds of an escrow account. In most other cases the effective maturity is the stated maturity date of the security. |
| | |
| ■ | Inverse Floaters: Inverse floating rate securities, also known as inverse floaters, are created by depositing a municipal bond, typically with a fixed interest rate, into a special purpose trust created by a broker-dealer. This trust, in turn, (a) issues floating rate certificates typically paying short-term tax-exempt interest rates to third parties in amounts equal to some fraction of the deposited bond’s par amount or market value, and (b) issues an inverse floating rate certificate (sometimes referred to as an “inverse floater”) to an investor (such as a Fund) interested in gaining investment exposure to a long-term municipal bond. The income received by the holder of the inverse floater varies inversely with the short-term rate paid to the floating rate certificates’ holders, and in most circumstances the holder of the inverse floater bears substantially all of the underlying bond’s downside investment risk. The holder of the inverse floater typically also benefits disproportionately from any potential appreciation of the underlying bond’s value. Hence, an inverse floater essentially represents an investment in the underlying bond on a leveraged basis. |
| | |
| ■ | Leverage: Using borrowed money to invest in securities or other assets. |
| ■ | Leverage-Adjusted Duration: Duration is a measure of the expected period over which a bond’s principal and interest will be paid, and consequently is a measure of the sensitivity of a bond’s or bond Fund’s value to changes when market interest rates change. Generally, the longer a bond’s or Fund’s duration, the more the price of the bond or Fund will change as interest rates change. Leverage-adjusted duration takes into account the leveraging process for a Fund and therefore is longer than the duration of the Fund’s portfolio of bonds. |
| | |
| ■ | Market Yield (also known as Dividend Yield or Current Yield): An investment’s current annualized dividend divided by its current market price. |
| | |
| ■ | Net Asset Value (NAV): A Fund’s NAV per common share is calculated by subtracting the liabilities of the Fund (including any Preferred shares issued in order to leverage the Fund) from its total assets and then dividing the remainder by the number of common shares outstanding. Fund NAVs are calculated at the end of each business day. |
| | |
| ■ | Pre-Refunding: Pre-Refunding, also known as advanced refundings or refinancings, is a procedure used by state and local governments to refinance municipal bonds to lower interest expenses. The issuer sells new bonds with a lower yield and uses the proceeds to buy U.S. Treasury securities, the interest from which is used to make payments on the higher-yielding bonds. Because of this collateral, pre-refunding generally raises a bond’s credit rating and thus its value. |
| | |
| ■ | Structural Leverage: Structural Leverage consists of preferred shares or debt issued by the fund. Both of these are part of a fund’s capital structure. Structural leverage is sometimes referred to as “‘40 Act Leverage” and is subject to asset coverage limits set in the Investment Company Act of 1940. |
| | |
| ■ | Taxable-Equivalent Yield: The yield necessary from a fully taxable investment to equal, on an after-tax basis, the yield of a municipal bond investment. |
| | |
| ■ | Zero Coupon Bond: A zero coupon bond does not pay a regular interest coupon to its holders during the life of the bond. Tax-exempt income to the holder of the bond comes from accretion of the difference between the original purchase price of the bond at issuance and the par value of the bond at maturity and is effectively paid at maturity. The market prices of zero coupon bonds generally are more volatile than the market prices of bonds that pay interest periodically. |
Notes
Notes
Notes
Other Useful Information
| Board of |
| Directors/Trustees |
| John P. Amboian |
| Robert P. Bremner |
| Jack B. Evans |
| William C. Hunter |
| David J. Kundert |
| William J. Schneider |
| Judith M. Stockdale |
| Carole E. Stone |
| Virginia L. Stringer |
| Terence J. Toth |
| |
| Fund Manager |
| Nuveen Fund Advisors, Inc. |
| 333 West Wacker Drive |
| Chicago, IL 60606 |
| |
| Custodian |
| State Street Bank |
| & Trust Company |
| Boston, MA |
| |
| Transfer Agent and |
| Shareholder Services |
| State Street Bank |
| & Trust Company |
| Nuveen Funds |
| P.O. Box 43071 |
| Providence, RI 02940-3071 |
| (800) 257-8787 |
| |
| Legal Counsel |
| Chapman and Cutler LLP |
| Chicago, IL |
| |
| Independent Registered |
| Public Accounting Firm |
| Ernst & Young LLP |
| Chicago, IL |
Quarterly Portfolio of Investments and Proxy Voting Information
You may obtain (i) each Fund’s quarterly portfolio of investments, (ii) information regarding how the Funds voted proxies relating to portfolio securities held during the most recent twelve-month period ended June 30, and (iii) a description of the policies and procedures that the Funds used to determine how to vote proxies relating to portfolio securities without charge, upon request, by calling Nuveen Investments toll-free at (800) 257-8787 or on Nuveen’s website at www.nuveen.com.
You may also obtain this and other Fund information directly from the Securities and Exchange Commission (SEC). The SEC may charge a copying fee for this information. Visit the SEC on-line at http://www.sec.gov or in person at the SEC’s Public Reference Room in Washington, D.C. Call the SEC at (202) 942-8090 for room hours and operation. You may also request Fund information by sending an e-mail request to publicinfo@sec.gov or by writing to the SEC’s Public References Section at 100 F Street NE, Washington, D.C. 20549.
CEO Certification Disclosure
Each Fund’s Chief Executive Officer has submitted to the New York Stock Exchange (NYSE) the annual CEO certification as required by Section 303A.12(a) of the NYSE Listed Company Manual.
Each Fund has filed with the SEC the certification of its Chief Executive Officer and Chief Financial Officer required by Section 302 of the Sarbanes-Oxley Act.
Common and Preferred Share Information
Each Fund intends to repurchase and/or redeem shares of its own common and/or auction rate preferred stock in the future at such times and in such amounts as is deemed advisable. During the period covered by this report, the Funds repurchased and/or redeemed shares of their common and/or auction rate preferred stock as shown in the accompanying table.
| | | Auction Rate |
| | Common Shares | Preferred Shares |
| Fund | Repurchased | Redeemed |
| NQN | — | — |
| NVN | — | — |
| NUN | — | 6,431 |
| NNF | — | — |
| NKO | — | — |
| NRK | — | — |
Any future repurchases and/or redemptions will be reported to shareholders in the next annual or semi-annual report.
Nuveen Investments:
Serving Investors for Generations
Since 1898, financial advisors and their clients have relied on Nuveen Investments to provide dependable investment solutions through continued adherence to proven, long-term investing principles. Today, we offer a range of high quality equity and fixed-income solutions designed to be integral components of a well-diversified core portfolio.
Focused on meeting investor needs.
Nuveen Investments is a global investment management firm that seeks to help secure the long-term goals of institutions and high net worth investors as well as the consultants and financial advisors who serve them. We market our growing range of specialized investment solutions under the high-quality brands of HydePark, NWQ, Nuveen Asset Management, Santa Barbara, Symphony, Tradewinds and Winslow Capital. In total, Nuveen Investments managed approximately $206 billion of assets as of March 31, 2011.
Find out how we can help you.
To learn more about how the products and services of Nuveen Investments may be able to help you meet your financial goals, talk to your financial advisor, or call us at (800) 257-8787. Please read the information provided carefully before you invest. Investors should consider the investment objective and policies, risk considerations, charges and expenses of any investment carefully. Where applicable, be sure to obtain a prospectus, which contains this and other relevant information. To obtain a prospectus, please contact your securities representative or Nuveen Investments, 333 W. Wacker Dr., Chicago, IL 60606. Please read the prospectus carefully before you invest or send money.
Learn more about Nuveen Funds at: www.nuveen.com/cef
Nuveen makes things e-simple. It only takes a minute to sign up for e-Reports. Once enrolled, you’ll receive an e-mail as soon as your Nuveen Fund information is ready - no more waiting for delivery by regular mail. Just click on the link within the e-mail to see the report and save it on your computer if you wish. Free e-Reports right to your e-mail! www.investordelivery.com If you receive your Nuveen Fund distributions and statements from your financial advisor or brokerage account. OR www.nuveen.com/accountaccess If you receive your Nuveen Fund distributions and statements directly from Nuveen. | |
Distributed by
Nuveen Securities, LLC
333 West Wacker Drive
Chicago, IL 60606
www.nuveen.com
ESA-B-0311D
ITEM 2. CODE OF ETHICS.
Not applicable to this filing.
ITEM 3. AUDIT COMMITTEE FINANCIAL EXPERT.
Not applicable to this filing.
ITEM 4. PRINCIPAL ACCOUNTANT FEES AND SERVICES.
Not applicable to this filing.
ITEM 5. AUDIT COMMITTEE OF LISTED REGISTRANTS.
Not applicable to this filing.
ITEM 6. SCHEDULE OF INVESTMENTS.
(a) See Portfolio of Investments in Item 1.
(b) Not applicable.
ITEM 7. DISCLOSURE OF PROXY VOTING POLICIES AND PROCEDURES FOR CLOSED-END MANAGEMENT INVESTMENT COMPANIES.
Not applicable to this filing.
ITEM 8. PORTFOLIO MANAGERS OF CLOSED-END MANAGEMENT INVESTMENT COMPANIES.
Not applicable to this filing.
ITEM 9. PURCHASES OF EQUITY SECURITIES BY CLOSED-END MANAGEMENT INVESTMENT COMPANY AND AFFILIATED PURCHASERS.
Not applicable.
ITEM 10. SUBMISSION OF MATTERS TO A VOTE OF SECURITY HOLDERS.
There have been no material changes to the procedures by which shareholders may recommend nominees to the registrant's Board of Directors or Trustees implemented after the registrant last provided disclosure in response to this Item.
ITEM 11. CONTROLS AND PROCEDURES.
| (a) | The registrant's principal executive and principal financial officers, or persons performing similar functions, have concluded that the registrant's disclosure controls and procedures (as defined in Rule 30a-3(c) under the Investment Company Act of 1940, as amended (the "1940 Act") (17 CFR 270.30a-3(c))) are effective, as of a date within 90 days of the filing date of this report that includes the disclosure required by this paragraph, based on their evaluation of the controls and procedures required by Rule 30a-3(b) under the 1940 Act (17 CFR 270.30a-3(b)) and Rules 13a-15(b) or 15d-15(b) under the Securities Exchange Act of 1934, as amended (the "Exchange Act")(17 CFR 240.13a-15(b) or 240.15d-15(b)). |
| (b) | There were no changes in the registrant's internal control over financial reporting (as defined in Rule 30a-3(d) under the 1940 Act (17 CFR 270.30a-3(d)) that occurred during the second fiscal quarter of the period covered by this report that has materially affected, or is reasonably likely to materially affect, the registrant's internal control over financial reporting. |
ITEM 12. EXHIBITS.
File the exhibits listed below as part of this Form.
| (a)(1) | Any code of ethics, or amendment thereto, that is the subject of the disclosure required by Item 2, to the extent that the registrant intends to satisfy the Item 2 requirements through filing of an exhibit: Not applicable to this filing. |
| (a)(2) | A separate certification for each principal executive officer and principal financial officer of the registrant as required by Rule 30a-2(a) under the 1940 Act (17 CFR 270.30a-2(a)) in the exact form set forth below: See Ex-99.CERT attached hereto. |
| (a)(3) | Any written solicitation to purchase securities under Rule 23c-1 under the 1940 Act (17 CFR 270.23c-1) sent or given during the period covered by the report by or on behalf of the registrant to 10 or more persons: Not applicable. |
| (b) | If the report is filed under Section 13(a) or 15(d) of the Exchange Act, provide the certifications required by Rule 30a-2(b) under the 1940 Act (17 CFR 270.30a-2(b)); Rule 13a-14(b) or Rule 15d-14(b) under the Exchange Act (17 CFR 240.13a-14(b) or 240.15d-14(b)), and Section 1350 of Chapter 63 of Title 18 of the United States Code (18 U.S.C. 1350) as an exhibit. A certification furnished pursuant to this paragraph will not be deemed "filed" for purposes of Section 18 of the Exchange Act (15 U.S.C. 78r), or otherwise subject to the liability of that section. Such certification will not be deemed to be incorporated by reference into any filing under the Securities Act of 1933 or the Exchange Act, except to the extent that the registrant specifically incorporates it by reference: See Ex-99.906 CERT attached hereto. |
SIGNATURES
Pursuant to the requirements of the Securities Exchange Act of 1934 and the Investment Company Act of 1940, the registrant has duly caused this report to be signed on its behalf by the undersigned, thereunto duly authorized.
(Registrant) Nuveen New York Investment Quality Municipal Fund, Inc.
By (Signature and Title) /s/ Kevin J. McCarthy
Kevin J. McCarthy
(Vice President and Secretary)
Date: June 6, 2011
Pursuant to the requirements of the Securities Exchange Act of 1934 and the Investment Company Act of 1940, this report has been signed below by the following persons on behalf of the registrant and in the capacities and on the dates indicated.
By (Signature and Title) /s/ Gifford R. Zimmerman
Gifford R. Zimmerman
Chief Administrative Officer
(principal executive officer)
Date: June 6, 2011
By (Signature and Title) /s/ Stephen D. Foy
Stephen D. Foy
Vice President and Controller
(principal financial officer)
Date: June 6, 2011