|
UNITED STATES |
SECURITIES AND EXCHANGE COMMISSION |
Washington, D.C. 20549 |
|
FORM N-CSRS |
|
CERTIFIED SHAREHOLDER REPORT OF REGISTERED MANAGEMENT INVESTMENT COMPANIES |
Investment Company Act file number 811-06180
Name of Fund: BlackRock Utilities & Telecommunications Fund, Inc.
Fund Address: 100 Bellevue Parkway, Wilmington, DE 19809
|
Name and address of agent for service: Donald C. Burke, Chief Executive Officer, BlackRock Utilities & Telecommunications Fund, Inc., 800 Scudders Mill Road, Plainsboro, NJ, 08536. Mailing address: P.O. Box 9011, Princeton, NJ, 08543-9011 |
Registrant’s telephone number, including area code: (800) 441-7762
Date of fiscal year end: 07/31/2009
Date of reporting period: 08/01/2008 – 01/31/2009
|
|
Item 1 – | Report to Stockholders |
EQUITIES FIXED INCOME REAL ESTATE LIQUIDITY ALTERNATIVES BLACKROCK SOLUTIONS
|
|
Semi-Annual Report |
|
| |
JANUARY 31, 2009 | (UNAUDITED) |
|

BlackRock Equity Dividend Fund
BlackRock Natural Resources Trust
BlackRock Utilities and Telecommunications Fund, Inc.
NOT FDIC INSURED
MAY LOSE VALUE
NO BANK GUARANTEE
|
|
Table of Contents |
|
|
|
|
|
| Page |
|
| |||
| 3 |
| |
Semi-Annual Report: |
|
|
|
| 4 |
| |
| 10 |
| |
| 11 |
| |
| 12 |
| |
Financial Statements: |
|
|
|
| 14 |
| |
| 21 |
| |
| 23 |
| |
| 24 |
| |
| 27 |
| |
| 43 |
| |
| 52 |
| |
| 53 |
| |
| 55 |
|
|
|
|
2 | SEMI-ANNUAL REPORT | JANUARY 31, 2009 |
|
|
Dear Shareholder
The present time may well be remembered as one of the most tumultuous periods in financial market history. Over the past year, the bursting of the housing bubble and the resultant credit crisis swelled into an all-out global financial market meltdown that featured the collapse of storied financial firms, volatile swings in the world’s financial markets and monumental government responses, including the nearly $800 billion economic stimulus plan signed into law just after period end.
The US economy appeared relatively resilient through the first few months of 2008, when rising food and energy prices fueled inflation fears. Mid-summer ushered in dramatic changes — inflationary pressure subsided amid a plunge in commodity prices, while economic pressures intensified in the midst of a rapid deterioration in consumer spending, employment and other key indicators. By year’s end, the National Bureau of Economic Research affirmed that the United States was in a recession, which officially began in December 2007. The Federal Reserve Board (the “Fed”), after slashing interest rates aggressively early in the period, resumed that rate-cutting campaign in the fall, with the final reduction in December 2008 bringing the target federal funds rate to a record low range of between zero and 0.25%. Importantly, the central bank pledged that future policy moves to revive the global economy and financial markets would comprise primarily nontraditional and quantitative easing measures, such as capital injections, lending programs and government guarantees.
Against this backdrop, US equity markets experienced intense volatility, with the sentiment turning decisively negative toward period end. Declines were significant and broad-based, with little divergence among large- and small-cap stocks. Non-US stocks posted stronger results early on, but quickly lost ground as the credit crisis revealed itself to be global in scope and as the worldwide economic slowdown gathered pace. Overall, aggressive monetary and fiscal policy, combined with the defensiveness of the US, helped domestic equities notch better performance than their non-US counterparts.
In fixed income markets, risk aversion remained the popular theme, leading the Treasury sector to top all other asset classes. The high yield market was particularly hard hit in this environment, as economic turmoil, combined with frozen credit markets and substantial technical pressures, took a heavy toll. Meanwhile, the municipal bond market was challenged by a dearth of market participants, lack of liquidity, difficult funding environment and backlog of new-issue supply, which sent prices lower and yields well above Treasuries. By period end, however, some positive momentum had returned to the municipal space.
In all, an investor flight to safety prevailed, as evidenced in the six- and 12-month returns of the major benchmark indexes:
|
|
|
|
|
|
|
|
Total Returns as of January 31, 2009 |
| 6-month |
| 12-month |
| ||
US equities (S&P 500 Index) |
|
| (33.95 | )% |
| (38.63 | )% |
Small cap US equities (Russell 2000 Index) |
|
| (37.38 | ) |
| (36.84 | ) |
International equities (MSCI Europe, Australasia, Far East Index) |
|
| (40.75 | ) |
| (43.74 | ) |
US Treasury securities (Merrill Lynch 10-Year US Treasury Index) |
|
| 11.96 |
|
| 10.64 |
|
Taxable fixed income (Barclays Capital US Aggregate Bond Index*) |
|
| 3.23 |
|
| 2.59 |
|
Tax-exempt fixed income (Barclays Capital Municipal Bond Index*) |
|
| 0.70 |
|
| (0.16 | ) |
High yield bonds (Barclays Capital US Corporate High Yield 2% Issuer Capped Index*) |
|
| (19.07 | ) |
| (19.72 | ) |
| |||||||
* Formerly a Lehman Brothers index. |
|
|
|
|
|
|
|
Past performance is no guarantee of future results. Index performance shown for illustrative purposes only. You cannot invest directly in an index.
Through periods of market turbulence, as ever, BlackRock’s full resources are dedicated to the management of our clients’ assets. For our most current views on the economy and financial markets, we invite you to visit www.blackrock.com/funds. We thank you for entrusting BlackRock with your investments, and we look forward to continuing to serve you in the months and years ahead.
Sincerely,

Rob Kapito
President, BlackRock Advisors, LLC
|
|
|
THIS PAGE NOT PART OF YOUR FUND REPORT |
| 3 |
|
|
| |
BlackRock Equity Dividend Fund |
|
Portfolio Management Commentary |
|
|
| How did the Fund perform? |
|
|
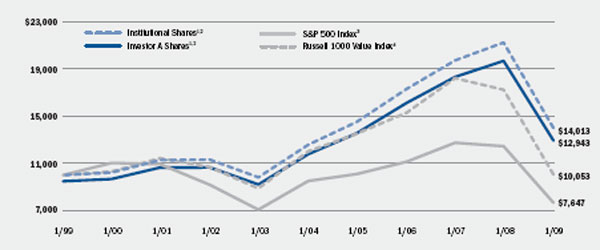
• | In an acutely challenging environment for equities, Fund returns outpaced those of the broad-market S&P 500 Index and the Russell 1000 Value Index for the six-month period ended January 31, 2009. |
|
|
| What factors influenced performance? |
|
|
• | The leading contributors to performance for the period included an average cash position of 11.25% (of net assets), a large underweight and stock selection in the financials sector and stock selection in both the industrials and consumer discretionary sectors. |
|
|
• | Detracting from overall performance were a large overweight position and stock selection in the materials sector, individual security selection in the energy sector and an underweight position in the health care sector. |
|
|
| Describe recent portfolio activity. |
|
|
• | During the six months, there were a few changes made to the strategic position of the Fund. While an underweight in financials continued to grow as a result of government regulation and dividend restrictions, we also exited some of the Fund’s more well-established holdings, including Citigroup, Inc., Morgan Stanley and Bank of America Corp. We added to the Fund’s consumer staples exposure as we continued to establish a stronger overweight within the sector. Additionally, we introduced some cash into S&P futures options, due to lack of visibility on company fundamentals and concerns about the potential for a sharp market upswing. The Fund’s primary, long-term outlook remains intact, despite price volatility and the increased likelihood of a short-term weakness in global growth. |
|
|
| Describe Fund positioning at period end. |
|
|
• | At period end, the Fund remained positioned to capitalize on global growth and demand trends, as it was overweight in sectors that are currently exposed to industrialization and urbanization abroad. We believe that during this year, sector allocation and rotation will ultimately be less important than the quality of reported earnings and balance sheet strength. Companies whose managements have articulated clear, conservative strategies to manage cash and new projects should be able to maintain their business models and be better prepared for a global economic slowdown. Our view is that companies will, in all likelihood, remain guarded and cautious in their future outlooks. There may not be a great deal of clarity through the 2009 first quarter and its earnings season, as corporations look for ways to refine, restructure and revamp their business segments, and to preserve operating margins. |
|
|
• | As we embark on 2009, our focus will be on high-quality investments. Quality, in this market, equates to dividends, a continued ability to pay dividends and, especially with all revenues slowing, low cost of production. |
|
|
| The views expressed reflect the opinions of BlackRock as of the date of this report and are subject to change based on changes in market, economic or other conditions. These views are not intended to be a forecast of future events and are no guarantee of future results. |
|
Expense Example |
|
|
|
|
|
|
|
|
|
|
|
|
|
|
|
|
|
|
|
|
|
| Actual |
| Hypothetical2 |
| ||||||||||||||
|
|
|
| ||||||||||||||||
|
| Beginning |
| Ending |
| Expenses Paid |
| Beginning |
| Ending |
| Expenses Paid |
| ||||||
Institutional |
|
| $1,000 |
|
| $681.80 |
|
| $3.08 |
|
| $1,000 |
|
| $1,021.44 |
|
| $3.70 |
|
Service |
|
| $1,000 |
|
| $681.30 |
|
| $4.09 |
|
| $1,000 |
|
| $1,019.94 |
|
| $4.91 |
|
Investor A |
|
| $1,000 |
|
| $680.70 |
|
| $4.38 |
|
| $1,000 |
|
| $1,019.89 |
|
| $5.27 |
|
Investor B |
|
| $1,000 |
|
| $677.90 |
|
| $7.74 |
|
| $1,000 |
|
| $1,015.87 |
|
| $9.30 |
|
Investor C |
|
| $1,000 |
|
| $678.00 |
|
| $7.49 |
|
| $1,000 |
|
| $1,016.18 |
|
| $9.00 |
|
Class R |
|
| $1,000 |
|
| $679.50 |
|
| $5.73 |
|
| $1,000 |
|
| $1,018.28 |
|
| $6.88 |
|
|
|
|
| 1 | For each class of the Fund, expenses are equal to the annualized expense ratio for the class (0.73% for Institutional, 0.97% for Service, 1.04% for Investor A, 1.84% for Investor B, 1.78% for Investor C and 1.36% for Class R), multiplied by the average account value over the period, multiplied by 183/365 (to reflect the one-half year period shown). |
|
|
|
| 2 | Hypothetical 5% annual return before expenses is calculated by pro-rating the number of days in the most recent fiscal half year divided by 365. |
|
|
|
|
| See “Disclosure of Expenses” on page 11 for further information on how expenses were calculated. |
|
|
|
4 | SEMI-ANNUAL REPORT | JANUARY 31, 2009 |
|
|
BlackRock Equity Dividend Fund |
|
Total Return Based on a $10,000 Investment |
|
|
|
| ||
| 1 | Assuming maximum sales charge, if any, transaction costs and other operating expenses, including advisory fees. Institutional Shares do not have a sales charge. |
|
|
|
| 2 | The Fund invests primarily in equity securities and dividend paying securities. |
|
|
|
| 3 | This unmanaged Index covers 500 industrial, utility, transportation and financial companies of the US markets (mostly NYSE issues), representing about 75% of NYSE market capitalization and 30% of NYSE issues. |
|
|
|
| 4 | This unmanaged broad-based Index is a subset of the Russell 1000 Index consisting of those Russell 1000 securities with lower price/book ratios and lower forecasted growth values. |
|
Performance Summary for the Period Ended January 31, 2009 |
|
|
|
|
|
|
|
|
|
|
|
|
|
|
|
|
|
|
|
|
|
|
|
|
|
|
|
|
|
|
|
| Average Annual Total Returns1 |
| ||||||||||||||||||
|
|
|
|
|
|
| |||||||||||||||||||
|
|
|
|
|
| 1 Year |
| 5 Years |
| 10 Years |
| ||||||||||||||
|
|
|
|
|
|
|
|
| |||||||||||||||||
|
| Standardized |
| 6-Month |
| w/o sales |
| w/sales |
| w/o sales |
| w/sales |
| w/o sales |
| w/sales |
| ||||||||
Institutional |
| 2.76 | % |
| (31.82 | )% |
| (34.17 | )% |
| N/A |
|
| 2.18 | % |
| N/A |
|
| 3.43 | % |
| N/A |
|
|
Service |
| 2.54 |
|
| (31.87 | ) |
| (34.35 | ) |
| N/A |
|
| 1.92 |
|
| N/A |
|
| 3.17 |
|
| N/A |
|
|
Investor A |
| 2.29 |
|
| (31.93 | ) |
| (34.38 | ) |
| (37.83 | )% |
| 1.89 |
|
| 0.80 | % |
| 3.17 |
|
| 2.61 | % |
|
Investor B |
| 1.60 |
|
| (32.21 | ) |
| (34.92 | ) |
| (37.81 | ) |
| 1.09 |
|
| 0.72 |
|
| 2.53 |
|
| 2.53 |
|
|
Investor C |
| 1.67 |
|
| (32.20 | ) |
| (34.88 | ) |
| (35.52 | ) |
| 1.12 |
|
| 1.12 |
|
| 2.38 |
|
| 2.38 |
|
|
Class R |
| 2.11 |
|
| (32.05 | ) |
| (34.61 | ) |
| N/A |
|
| 1.63 |
|
| N/A |
|
| 2.98 |
|
| N/A |
|
|
S&P 500 Index |
| — |
|
| (33.95 | ) |
| (38.63 | ) |
| N/A |
|
| (4.24 | ) |
| N/A |
|
| (2.65 | ) |
| N/A |
|
|
Russell 1000 Value Index |
| — |
|
| (35.10 | ) |
| (41.78 | ) |
| N/A |
|
| (3.52 | ) |
| N/A |
|
| 0.05 |
|
| N/A |
|
|
|
|
|
| 1 | Assuming maximum sales charges. Average annual total returns with and without sales charges reflect reductions for distributions and service fees. See “About Fund/Trust Performance” on page 10 for a detailed description of share classes, including any related sales charges and fees. |
|
|
|
|
| N/A — Not applicable as share class and index do not have a sales charge. |
|
|
|
Past performance is not indicative of future results. | ||
SEMI-ANNUAL REPORT | JANUARY 31, 2009 | 5 |
|
|
|
|
Trust Summary as of January 31, 2009 | BlackRock Natural Resources Trust |
|
Portfolio Management Commentary |
|
|
| How did the Trust perform? |
|
|
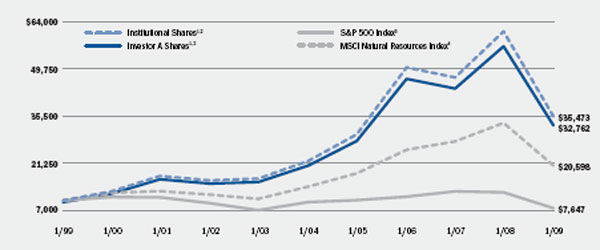
• | The Trust underperformed the MSCI Natural Resources Index and the broad-market S&P 500 Index for the six-month period. Given its focus on natural resources stocks, the MSCI Natural Resources Index is deemed a more comparable means for measuring the Trust’s performance. |
|
|
| What factors influenced performance? |
|
|
• | Integrated oil and gas companies comprise nearly half of the MSCI Natural Resources Index. While more than 20% of the Trust was invested in these stocks during the period, the resultant underweight versus the benchmark significantly detracted from relative performance. In fact, the Trust would have outperformed the benchmark if the effect of this underweight was ignored. |
|
|
• | In an extraordinarily daunting environment in which credit markets were dysfunctional, investors flocked to large, diversified companies with strong balance sheets. Exxon Mobil Corp. has an extremely large amount of cash on its balance sheet, and as a result, the stock (and other similar large, integrated oil & gas stocks) outperformed the rest of the energy sector, falling by less than 5% during the period. Exxon Mobil constitutes a dramatically large portion of the benchmark; by comparison, the Trust was underweight in the stock by approximately 11%, which also had a negative effect on relative results. |
|
|
• | Contributing positively to Trust returns during the six months was an overweight in gold, within the context of an underweight positioning in other metals and mining stocks relative to the benchmark. As economic activity slowed considerably, demand for commodities declined sharply and the stocks reacted to declines in commodity prices. Gold, especially in recent months, has been viewed as a haven from potential inflation, currency and financial system risk, and has experienced superior performance as a result. |
|
|
| Describe recent portfolio activity. |
|
|
• | We reduced exposure to Canadian holdings during the fourth quarter of 2008, but were content with the Trust’s other holdings. We have always emphasized companies with strong balance sheets and realized that this has become increasingly important in the current environment. |
|
|
| Describe Trust positioning at period end. |
|
|
• | At period end, the Trust remains overweight in high-quality oil & gas exploration & production, drilling, and oil & gas equipment & services stocks, as valuations are very depressed and long-term growth prospects remain strong. We also remain underweight in integrated oil and gas companies, given a more difficult environment for gaining access to prospective basins, as well as increasingly complex contract terms. |
|
|
| The views expressed reflect the opinions of BlackRock as of the date of this report and are subject to change based on changes in market, economic or other conditions. These views are not intended to be a forecast of future events and are no guarantee of future results. |
|
Expense Example |
|
|
|
|
|
|
|
|
|
|
|
|
|
|
|
|
|
|
|
|
|
|
|
|
|
|
|
|
|
|
|
|
|
| Actual |
| Hypothetical2 |
| ||||||||||||||||||||||||||
|
|
| |||||||||||||||||||||||||||||
|
| Beginning |
| Ending |
| Expenses Paid |
| Beginning |
| Ending |
| Expenses Paid |
| ||||||||||||||||||
Institutional |
|
| $ | 1,000 |
|
|
| $ | 517.70 |
|
|
| $ | 3.46 |
|
|
| $ | 1,000 |
|
|
| $ | 1,020.54 |
|
|
| $ | 4.61 |
|
|
Investor A |
|
| $ | 1,000 |
|
|
| $ | 516.80 |
|
|
| $ | 4.68 |
|
|
| $ | 1,000 |
|
|
| $ | 1,018.93 |
|
|
| $ | 6.23 |
|
|
Investor B |
|
| $ | 1,000 |
|
|
| $ | 514.80 |
|
|
| $ | 7.40 |
|
|
| $ | 1,000 |
|
|
| $ | 1,015.32 |
|
|
| $ | 9.85 |
|
|
Investor C |
|
| $ | 1,000 |
|
|
| $ | 514.70 |
|
|
| $ | 7.67 |
|
|
| $ | 1,000 |
|
|
| $ | 1,014.97 |
|
|
| $ | 10.20 |
|
|
|
|
|
| 1 | For each class of the Trust, expenses are equal to the annualized expense ratio for the class (0.91% for Institutional, 1.23% for Investor A, 1.95% for Investor B and 2.02% for Investor C), multiplied by the average account value over the period, multiplied by 183/365 (to reflect the one-half year period shown). |
|
|
|
| 2 | Hypothetical 5% annual return before expenses is calculated by pro-rating the number of days in the most recent fiscal half year divided by 365. See “Disclosure of Expenses” on page 11 for further information on how expenses were calculated. |
|
|
|
6 | SEMI-ANNUAL REPORT | JANUARY 31, 2009 |
|
|
BlackRock Natural Resources Trust |
|
Total Return Based on a $10,000 Investment |
|
|
|
|
| |
|
|
|
| 1 | Assuming maximum sales charge, if any, transaction costs and other operating expenses, including advisory fees. Institutional Shares do not have a sales charge. |
|
|
|
| 2 | The Trust invests primarily in equity securities of domestic and foreign companies with substantial natural resource assets. |
|
|
|
| 3 | This unmanaged Index covers the 500 industrial, utility, transportation and financial companies of the US markets (mostly NYSE issues), representing about 75% of NYSE market capitalization and 30% of NYSE issues. |
|
|
|
| 4 | This unmanaged Index is comprised of all global securities classified as natural-resource related securities. |
|
Performance Summary for the Period Ended January 31, 2009 |
|
|
|
|
|
|
|
|
|
|
|
|
|
|
|
|
|
|
|
|
|
|
|
|
|
|
|
| Average Annual Total Returns1 |
| ||||||||||||||||
|
|
|
|
| ||||||||||||||||||
|
|
|
|
| 1 Year |
| 5 Years |
| 10 Years |
| ||||||||||||
|
|
|
|
|
|
| ||||||||||||||||
|
| 6-Month |
| w/o sales |
| w/sales |
| w/o sales |
| w/sales |
| w/o sales |
| w/sales |
| |||||||
Institutional |
| (48.23 | )% |
| (42.10 | )% |
| N/A |
|
| 10.04 | % |
| N/A |
|
| 13.50 | % |
| N/A |
|
|
Investor A |
| (48.32 | ) |
| (42.27 | ) |
| (45.30 | )% |
| 9.75 |
|
| 8.58 | % |
| 13.21 |
|
| 12.60 | % |
|
Investor B |
| (48.52 | ) |
| (42.70 | ) |
| (45.22 | ) |
| 8.91 |
|
| 8.63 |
|
| 12.51 |
|
| 12.51 |
|
|
Investor C |
| (48.53 | ) |
| (42.71 | ) |
| (43.27 | ) |
| 8.91 |
|
| 8.91 |
|
| 12.33 |
|
| 12.33 |
|
|
S&P 500 Index |
| (33.95 | ) |
| (38.63 | ) |
| N/A |
|
| (4.24 | ) |
| N/A |
|
| (2.65 | ) |
| N/A |
|
|
MSCI Natural Resources Index |
| (42.11 | ) |
| (38.54 | ) |
| N/A |
|
| 7.72 |
|
| N/A |
|
| 7.49 |
|
| N/A |
|
|
|
|
|
| 1 | Assuming maximum sales charges. Average annual total returns with and without sales charges reflect reductions for distributions and service fees. See “About Fund/Trust Performance” on page 10 for a detailed description of share classes, including any related sales charges and fees. |
|
|
|
|
| N/A — Not applicable as share class and index do not have a sales charge. |
|
|
|
Past performance is not indicative of future results. | ||
SEMI-ANNUAL REPORT | JANUARY 31, 2009 | 7 |
|
|
|
|
Fund Summary as of January 31, 2009 | BlackRock Utilities and Telecommunications Fund, Inc. |
|
Portfolio Management Commentary |
|
|
| How did the Fund perform? |
|
|
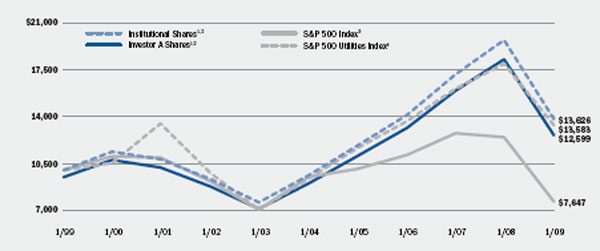
• | The Fund outperformed the broad-market S&P 500 Index for the six-month period, but underperformed its custom benchmark, comprised 70% S&P 500 Utilities Index and 30% S&P 500 Telecommunication Services Index, which returned –21.65%. Fund results also trailed that of the S&P 500 Utilities Index. |
|
|
| What factors influenced performance? |
|
|
• | The Fund’s higher-than-average cash position was the largest contributor to relative performance versus the custom benchmark. Due to continued evidence of a substantial and persistent economic contraction, we became increasingly defensive throughout the period. As a result, we allowed the Fund’s cash position to build as we sold out of some names that were at risk of missing earnings estimates and lowering future performance. |
|
|
• | Stock selection within the wireless telecommunication services sector also generated positive relative returns. In particular, the Fund’s underweight in Sprint Nextel Corp. proved to be beneficial, as the stock fell by approximately 70% during the period. |
|
|
• | The Fund’s overweight in independent power producers and energy traders had a negative impact on performance as the weakening economy and credit markets dragged down the sector. The credit issues at Constellation Energy Group, Inc. likely worsened this decline. We have since reduced overall exposure to independent power producers given continued economic weakness and likely downward earnings revisions. |
|
|
• | Stock selection within electric utilities also detracted significantly from relative performance, as some of the Fund’s non-US holdings declined substantially. E.ON AG, for example, in which we were overweight, was down more than 45% over the period. In addition, the Fund’s underweight in AT&T Inc. and Verizon Communications, Inc. hindered relative returns, as these stocks performed well because of their defensive characteristics. While we were somewhat constructive on the companies, their outsized benchmark allocation is one that we will rarely be comfortable matching. |
|
|
| Describe recent portfolio activity. |
|
|
• | Fund turnover was relatively light, but the primary trend was toward defensiveness. We reduced exposure to some of the Fund’s non-US names, such as Iberdrola Renovables SA and Telecom Italia SpA, and built cash positions within the Fund. We also reduced exposure to independent power producers and energy traders throughout the period. |
|
|
| Describe Fund positioning at period end. |
|
|
• | Overall, we remain defensive, but also realize that valuations are extremely attractive. We have built cash positions and reduced international exposure in an effort to limit further downside risk within the Fund amid a very volatile market environment. However, we are ready to opportunistically put cash to work, as stocks with favorable fundamentals are unfairly punished due to market conditions. As an example of this strategy, we recently added Qwest Communications International Inc. on extreme price weakness. This purchase has already generated strong performance on both a relative and absolute basis. We continue to be defensive, while searching for opportunities to add attractively-priced, high-quality companies with solid long-term prospects. |
|
|
| The views expressed reflect the opinions of BlackRock as of the date of this report and are subject to change based on changes in market, economic or other conditions. These views are not intended to be a forecast of future events and are no guarantee of future results. |
|
Expense Example |
|
|
|
|
|
|
|
|
|
|
|
|
|
|
|
|
|
|
|
|
|
|
|
|
|
|
|
|
|
|
|
|
|
| Actual |
| Hypothetical2 |
| ||||||||||||||||||||||||||
|
|
| |||||||||||||||||||||||||||||
|
| Beginning |
| Ending |
| Expenses Paid |
| Beginning |
| Ending |
| Expenses Paid |
| ||||||||||||||||||
Institutional |
|
| $ | 1,000 |
|
|
| $ | 720.90 |
|
|
| $ | 4.66 |
|
|
| $ | 1,000 |
|
|
| $ | 1,019.69 |
|
|
| $ | 5.47 |
|
|
Investor A |
|
| $ | 1,000 |
|
|
| $ | 720.00 |
|
|
| $ | 5.69 |
|
|
| $ | 1,000 |
|
|
| $ | 1,018.48 |
|
|
| $ | 6.68 |
|
|
Investor B |
|
| $ | 1,000 |
|
|
| $ | 717.30 |
|
|
| $ | 9.77 |
|
|
| $ | 1,000 |
|
|
| $ | 1,013.72 |
|
|
| $ | 11.46 |
|
|
Investor B1 |
|
| $ | 1,000 |
|
|
| $ | 717.40 |
|
|
| $ | 8.27 |
|
|
| $ | 1,000 |
|
|
| $ | 1,015.47 |
|
|
| $ | 9.70 |
|
|
Investor C |
|
| $ | 1,000 |
|
|
| $ | 717.00 |
|
|
| $ | 9.56 |
|
|
| $ | 1,000 |
|
|
| $ | 1,013.97 |
|
|
| $ | 11.21 |
|
|
Investor C1 |
|
| $ | 1,000 |
|
|
| $ | 717.60 |
|
|
| $ | 8.48 |
|
|
| $ | 1,000 |
|
|
| $ | 1,015.22 |
|
|
| $ | 9.95 |
|
|
|
|
|
| 1 | For each class of the Fund, expenses are equal to the annualized expense ratio for the class (1.08% for Institutional, 1.32% for Investor A, 2.27% for Investor B, 1.92% for Investor B1, 2.22% for Investor C and 1.97% for Investor C1), multiplied by the average account value over the period, multiplied by 183/365 (to reflect the one-half year period shown). |
| ||
| 2 | Hypothetical 5% annual return before expenses is calculated by pro-rating the number of days in the most recent fiscal half year divided by 365. See “Disclosure of Expenses” on page 11 for further information on how expenses were calculated. |
|
|
|
8 | SEMI-ANNUAL REPORT | JANUARY 31, 2009 |
|
|
BlackRock Utilities and Telecommunications Fund, Inc. |
|
Total Return Based on a $10,000 Investment |
|
|
|
|
| |
|
|
|
| 1 | Assuming maximum sales charge, if any, transaction costs and other operating expenses, including advisory fees. Institutional Shares do not have a sales charge. |
|
|
|
| 2 | The Fund invests primarily in equity and debt securities issued by domestic and foreign companies that are, in the opinion of the Manager, primarily engaged in the ownership or operation of facilities used to generate, transmit or distribute electricity, telecommunications, gas or water. |
|
|
|
| 3 | The S&P 500 Index covers 500 industrial, utility, transportation and financial companies of the US markets (mostly NYSE issues). The unmanaged Index represents about 75% of NYSE market capitalization and 30% of NYSE issues. |
|
|
|
| 4 | This unmanaged capitalization Index is comprised of all stocks designed to measure the performance of electric and natural gas utilities within the S&P 500 Index. |
|
Performance Summary for the Period Ended January 31, 2009 |
|
|
|
|
|
|
|
|
|
|
|
|
|
|
|
|
|
|
|
|
|
|
|
|
|
|
|
| Average Annual Total Returns1 |
| ||||||||||||||||
|
|
|
|
| ||||||||||||||||||
|
|
|
|
| 1 Year |
| 5 Years |
| 10 Years |
| ||||||||||||
|
|
|
|
|
|
| ||||||||||||||||
|
| 6-Month |
| w/o sales |
| w/sales |
| w/o sales |
| w/sales |
| w/o sales |
| w/sales |
| |||||||
Institutional |
| (27.91 | )% |
| (30.86 | )% |
| N/A |
|
| 7.20 | % |
| N/A |
|
| 3.14 | % |
| N/A |
|
|
Investor A |
| (28.00 | ) |
| (31.03 | ) |
| (34.65 | )% |
| 6.93 |
|
| 5.78 | % |
| 2.89 |
|
| 2.34 | % |
|
Investor B |
| (28.27 | ) |
| (31.55 | ) |
| (34.46 | ) |
| 6.10 |
|
| 5.79 |
|
| 2.10 |
|
| 2.10 |
|
|
Investor B1 |
| (28.26 | ) |
| (31.45 | ) |
| (34.03 | ) |
| 6.35 |
|
| 6.04 |
|
| 2.46 |
|
| 2.46 |
|
|
Investor C |
| (28.30 | ) |
| (31.60 | ) |
| (32.24 | ) |
| 6.12 |
|
| 6.12 |
|
| 2.11 |
|
| 2.11 |
|
|
Investor C1 |
| (28.24 | ) |
| (31.43 | ) |
| (32.08 | ) |
| 6.30 |
|
| 6.30 |
|
| 2.33 |
|
| 2.33 |
|
|
S&P 500 Index |
| (33.95 | ) |
| (38.63 | ) |
| N/A |
|
| (4.24 | ) |
| N/A |
|
| (2.65 | ) |
| N/A |
|
|
S&P 500 Utilities Index |
| (22.69 | ) |
| (24.26 | ) |
| N/A |
|
| 7.70 |
|
| N/A |
|
| 3.11 |
|
| N/A |
|
|
|
|
|
| 1 | Assuming maximum sales charges. Average annual total returns with and without sales charges reflect reductions for distributions and service fees. See “About Fund/Trust Performance” on page 10 for a detailed description of share classes, including any related sales charges and fees. |
|
|
|
|
| N/A — Not applicable as share class and index do not have a sales charge. |
|
|
|
Past performance is not indicative of future results. | ||
SEMI-ANNUAL REPORT | JANUARY 31, 2009 | 9 |
|
|
|
|
|
|
• | Institutional Shares are not subject to any sales charge. Institutional Shares bear no ongoing distribution or service fees and are available only to eligible investors. |
|
|
• | Service Shares (available only to BlackRock Equity Dividend Fund) are not subject to any sales charge. Service Shares are subject to a service fee of 0.25% per year (but no distribution fee) and are available only to eligible investors. Prior to October 2, 2006, Service Share performance results are those of Institutional Shares (which have no distribution or service fees) restated to reflect the Service Share fees. |
|
|
• | Investor A Shares incur a maximum initial sales charge (front-end load) of 5.25% and a service fee of 0.25% per year (but no distribution fee). |
|
|
• | Investor B Shares are subject to a maximum contingent deferred sales charge of 4.50% declining to 0% after six years. In addition, Investor B Shares are subject to a distribution fee of 0.75% per year and a service fee of 0.25% per year. These shares automatically convert to Investor A Shares after approximately eight years. (There is no initial sales charge for automatic share conversions.) All returns for periods greater than eight years reflect this conversion. For BlackRock Utilities and Telecommunications Fund, Inc. prior to October 2, 2006, Investor B Share performance results are those of Institutional Shares (which have no distribution or service fees) restated to reflect the Investor B Share fees. |
|
|
• | Investor B1 Shares (available only to Black Rock Utilities and Telecommunications Fund, Inc.) are subject to a maximum contingent deferred sales charge of 4% declining to 0% after six years. In addition, Investor B1 Shares are subject to a distribution fee of 0.50% per year and a service fee of 0.25% per year. These shares automatically convert to Investor A Shares after approximately eight years. (There is no initial sales charge for automatic share conversions.) All returns for periods greater than eight years reflect this conversion. |
|
|
• | Investor C Shares are subject to a distribution fee of 0.75% and a service fee of 0.25% per year. In addition, Investor C Shares are subject to a 1% contingent deferred sales charge if redeemed within one year of purchase. For BlackRock Utilities and Telecommunications Fund, Inc. prior to October 2, 2006, Investor C Share performance results are those of Institutional Shares (which have no distribution or service fees) restated to reflect the Investor C Share fees. |
|
|
• | Investor C1 Shares (available only to BlackRock Utilities and Telecommunications Fund, Inc.) are subject to a distribution fee of 0.55% per year and a service fee of 0.25% per year. In addition, Investor C1 Shares are subject to a 1% contingent deferred sales charge if redeemed within one year of purchase. |
|
|
• | Class R Shares (available only to BlackRock Equity Dividend Fund) do not incur a maximum initial sales charge (front-end load) or deferred sales charge. These shares are subject to a distribution fee of 0.25% per year and a service fee of 0.25% per year. Class R Shares are available only to certain retirement plans. Prior to inception, Class R Share performance results are those of Institutional Shares (which have no distribution or service fees) restated to reflect the Class R Share fees. |
|
|
| Performance information reflects past performance and does not guarantee future results. Current performance may be lower or higher than the performance data quoted. Refer to www.blackrock.com/funds to obtain performance data current to the most recent month-end. Performance results do not reflect the deduction of taxes that a shareholder would pay on fund distributions or the redemption of fund shares. Figures shown in the performance tables on pages 5,7 and 9 assume reinvestment of all dividends and capital gain distributions, if any, at net asset value on the ex-dividend date. Investment return and principal value of shares will fluctuate so that shares, when redeemed, may be worth more or less than their original cost. Dividends paid to each class of shares will vary because of the different levels of service, distribution and transfer agency fees applicable to each class, which are deducted from the income available to be paid to shareholders. |
|
|
|
10 | SEMI-ANNUAL REPORT | JANUARY 31, 2009 |
|
|
|
|
Shareholders of the Funds/Trust may incur the following charges: (a) expenses related to transactions, including sales charges, redemption fees and exchange fees; and (b) operating expenses, including advisory fees, distribution fees including 12b-1 fees, and other Fund/Trust expenses. The expense examples on pages 4, 6 and 8 (which are based on a hypothetical investment of $1,000 invested on August 1, 2008 and held through January 31, 2009) is intended to assist shareholders both in calculating expenses based on an investment in each Fund/Trust and in comparing these expenses with similar costs of investing in other mutual funds.
The tables provide information about actual account values and actual expenses. In order to estimate the expenses a shareholder paid during the period covered by this report, shareholders can divide their account value by $1,000 and then multiply the result by the number corresponding to their share class under the heading entitled “Expenses Paid During the Period.”
The tables also provide information about hypothetical account values and hypothetical expenses based on each Fund’s/Trust’s actual expense ratio and an assumed rate of return of 5% per year before expenses. In order to assist shareholders in comparing the ongoing expenses of investing in these Funds/Trust and other funds, compare the 5% hypothetical example with the 5% hypothetical examples that appear in other funds’ shareholder reports.
The expenses shown in the tables are intended to highlight shareholders’ ongoing costs only and do not reflect any transactional expenses, such as sales charges, redemption fees or exchange fees. Therefore, the hypothetical examples are useful in comparing ongoing expenses only, and will not help shareholders determine the relative total expenses of owning different funds. If these transactional expenses were included, shareholder expenses would have been higher.
|
|
|
SEMI-ANNUAL REPORT | JANUARY 31, 2009 | 11 |
|
|
|
|
|
BlackRock Equity Dividend Fund |
|
|
|
|
|
Ten Largest Holdings |
| Percent of |
| |
Exxon Mobil Corp. |
| 5 | % |
|
Chevron Corp. |
| 4 |
|
|
JPMorgan Chase & Co. |
| 3 |
|
|
Total SA |
| 3 |
|
|
Raytheon Co. |
| 3 |
|
|
AT&T Inc. |
| 2 |
|
|
Verizon Communications, Inc. |
| 2 |
|
|
Procter & Gamble Co. |
| 2 |
|
|
The Travelers Cos., Inc. |
| 2 |
|
|
BHP Billiton Ltd. |
| 2 |
|
|
|
|
|
|
|
Sector Allocation |
| Percent of |
| |
Energy |
| 20 | % |
|
Consumer Staples |
| 16 |
|
|
Financials |
| 12 |
|
|
Industrials |
| 12 |
|
|
Utilities |
| 11 |
|
|
Materials |
| 10 |
|
|
Health Care |
| 7 |
|
|
Telecommunication Services |
| 6 |
|
|
Information Technology |
| 3 |
|
|
Consumer Discretionary |
| 3 |
|
|
For Fund compliance purposes, the Fund’s sector classifications refer to any one or more of the sector sub-classifications used by one or more widely recognized market indexes or ratings group indexes, and/or as defined by Fund management. This definition may not apply for purposes of this report, which may combine such sector sub-classifications for reporting ease.
|
BlackRock Natural Resources Trust |
|
|
|
|
|
Ten Largest Holdings |
| Percent of |
| |
EOG Resources, Inc. |
| 6 | % |
|
Devon Energy Corp. |
| 5 |
|
|
Murphy Oil Corp. |
| 4 |
|
|
Exxon Mobil Corp. |
| 4 |
|
|
Chevron Corp. |
| 4 |
|
|
Apache Corp. |
| 4 |
|
|
Transocean Ltd. |
| 3 |
|
|
Occidental Petroleum Corp. |
| 2 |
|
|
National Oilwell Varco, Inc. |
| 2 |
|
|
Talisman Energy, Inc. |
| 2 |
|
|
|
|
|
|
|
Industry Allocation |
| Percent of |
| |
Oil & Gas Exploration & Production |
| 26 | % |
|
Canadian Independents |
| 13 |
|
|
Integrated Oil & Gas |
| 19 |
|
|
Energy Equipment & Services |
| 10 |
|
|
Oil & Gas Equipment & Services |
| 9 |
|
|
Metals & Mining |
| 7 |
|
|
Oil & Gas Drilling |
| 6 |
|
|
Oil, Gas & Consumable Fuels |
| 4 |
|
|
Gold |
| 2 |
|
|
Utilities |
| 2 |
|
|
Chemicals |
| 1 |
|
|
Refining, Marketing & Transportation |
| 1 |
|
|
For Trust compliance purposes, the Trust’s industry classifications refer to any one or more of the industry sub-classifications used by one or more widely recognized market indexes or ratings group indexes, and/or as defined by Trust management. This definition may not apply for purposes of this report, which may combine industry sub-classifications for reporting ease.
|
|
|
12 | SEMI-ANNUAL REPORT | JANUARY 31, 2009 |
|
|
|
|
Portfolio Information as of January 31, 2009 (concluded) | |
|
BlackRock Utilities and Telecommunications Fund, Inc. |
|
|
|
|
|
Ten Largest Holdings |
| Percent of |
| |
Verizon Communications, Inc. |
| 5 | % |
|
Public Service Enterprise Group, Inc. |
| 5 |
|
|
FPL Group, Inc. |
| 4 |
|
|
AT&T Inc. |
| 4 |
|
|
NRG Energy, Inc. |
| 4 |
|
|
Exelon Corp. |
| 4 |
|
|
The Southern Co. |
| 4 |
|
|
PPL Corp. |
| 3 |
|
|
Entergy Corp. |
| 3 |
|
|
FirstEnergy Corp. |
| 3 |
|
|
|
|
|
|
|
Industry Allocation |
| Percent of |
| |
Electric Utilities |
| 39 | % |
|
Multi-Utilities |
| 18 |
|
|
Diversified Telecommunication Services |
| 16 |
|
|
Independent Power Producers & Energy Traders |
| 9 |
|
|
Wireless Telecommunication Services |
| 5 |
|
|
Gas Utilities |
| 4 |
|
|
Oil, Gas & Consumable Fuels |
| 4 |
|
|
Water Utilities |
| 3 |
|
|
Construction & Engineering |
| 1 |
|
|
Electronic Equipment & Instruments |
| 1 |
|
|
For Fund compliance purposes, the Fund’s industry classifications refer to any one or more of the industry sub-classifications used by one or more widely recognized market indexes or ratings group indexes, and/or as defined by Fund management. This definition may not apply for the purposes of this report, which may combine industry sub-classifications for reporting ease.
|
|
|
SEMI-ANNUAL REPORT | JANUARY 31, 2009 | 13 |
|
|
| |
BlackRock Equity Dividend Fund | |
| (Percentages shown are based on Net Assets) |
|
|
|
|
|
|
|
|
Common Stocks |
| Shares |
| Value |
| ||
Aerospace & Defense — 5.7% |
|
|
|
|
|
|
|
General Dynamics Corp. |
|
| 685,300 |
| $ | 38,877,069 |
|
Northrop Grumman Corp. |
|
| 708,800 |
|
| 34,107,456 |
|
Raytheon Co. |
|
| 1,414,500 |
|
| 71,601,990 |
|
Rockwell Collins, Inc. |
|
| 220,800 |
|
| 8,319,744 |
|
United Technologies Corp. |
|
| 922,900 |
|
| 44,289,971 |
|
|
|
|
|
| |||
|
|
|
|
|
| 197,196,230 |
|
Beverages — 2.3% |
|
|
|
|
|
|
|
The Coca-Cola Co. |
|
| 899,700 |
|
| 38,435,184 |
|
Diageo Plc |
|
| 2,948,700 |
|
| 39,564,072 |
|
|
|
|
|
| |||
|
|
|
|
|
| 77,999,256 |
|
Capital Markets — 0.0% |
|
|
|
|
|
|
|
The Bank of New York Mellon Corp. |
|
| 66,168 |
|
| 1,703,164 |
|
Chemicals — 3.2% |
|
|
|
|
|
|
|
Air Products & Chemicals, Inc. |
|
| 269,400 |
|
| 13,550,820 |
|
The Dow Chemical Co. |
|
| 510,000 |
|
| 5,910,900 |
|
E.I. du Pont de Nemours & Co. |
|
| 1,668,800 |
|
| 38,315,648 |
|
Olin Corp. |
|
| 952,100 |
|
| 13,377,005 |
|
Praxair, Inc. |
|
| 286,700 |
|
| 17,849,942 |
|
Rohm & Haas Co. |
|
| 409,100 |
|
| 22,578,229 |
|
|
|
|
|
| |||
|
|
|
|
|
| 111,582,544 |
|
Commercial Banks — 3.7% |
|
|
|
|
|
|
|
The Bank of Nova Scotia |
|
| 1,270,800 |
|
| 30,747,919 |
|
National Bank of Canada |
|
| 953,900 |
|
| 26,619,741 |
|
SunTrust Banks, Inc. |
|
| 103,400 |
|
| 1,267,684 |
|
The Toronto-Dominion Bank |
|
| 516,500 |
|
| 16,763,874 |
|
U.S. Bancorp |
|
| 1,793,300 |
|
| 26,612,572 |
|
Wells Fargo & Co. |
|
| 1,346,400 |
|
| 25,446,960 |
|
|
|
|
|
| |||
|
|
|
|
|
| 127,458,750 |
|
Computers & Peripherals — 2.4% |
|
|
|
|
|
|
|
Hewlett-Packard Co. |
|
| 1,092,500 |
|
| 37,964,375 |
|
International Business Machines Corp. |
|
| 475,600 |
|
| 43,588,740 |
|
|
|
|
|
| |||
|
|
|
|
|
| 81,553,115 |
|
Consumer Finance — 0.0% |
|
|
|
|
|
|
|
American Express Co. |
|
| 111,070 |
|
| 1,858,201 |
|
Containers & Packaging — 0.0% |
|
|
|
|
|
|
|
Temple-Inland, Inc. |
|
| 353,400 |
|
| 2,003,778 |
|
Diversified Financial Services — 2.4% |
|
|
|
|
|
|
|
JPMorgan Chase & Co. |
|
| 3,175,350 |
|
| 81,003,178 |
|
Diversified Telecommunication Services — 4.6% |
|
|
|
|
|
|
|
AT&T Inc. |
|
| 2,658,303 |
|
| 65,447,420 |
|
BCE, Inc. |
|
| 165,773 |
|
| 3,391,716 |
|
Manitoba Telecom Services, Inc. |
|
| 219,600 |
|
| 6,414,738 |
|
TELUS Corp. (Non-Voting Shares) |
|
| 259,400 |
|
| 6,925,795 |
|
Verizon Communications, Inc. |
|
| 2,078,521 |
|
| 62,085,422 |
|
Windstream Corp. |
|
| 1,505,442 |
|
| 13,067,237 |
|
|
|
|
|
| |||
|
|
|
|
|
| 157,332,328 |
|
Electric Utilities — 4.8% |
|
|
|
|
|
|
|
American Electric Power Co., Inc. |
|
| 392,500 |
|
| 12,304,875 |
|
Duke Energy Corp. |
|
| 1,339,520 |
|
| 20,293,728 |
|
Exelon Corp. |
|
| 512,400 |
|
| 27,782,328 |
|
FPL Group, Inc. |
|
| 528,400 |
|
| 27,239,020 |
|
FirstEnergy Corp. |
|
| 334,400 |
|
| 16,716,656 |
|
ITC Holdings Corp. |
|
| 202,100 |
|
| 8,484,158 |
|
Northeast Utilities Inc. |
|
| 310,200 |
|
| 7,382,760 |
|
|
|
|
|
|
|
|
|
Common Stocks |
| Shares |
| Value |
| ||
Electric Utilities (concluded) |
|
|
|
|
|
|
|
PPL Corp. |
|
| 590,800 |
| $ | 18,113,928 |
|
The Southern Co. |
|
| 836,000 |
|
| 27,964,200 |
|
|
|
|
|
| |||
|
|
|
|
|
| 166,281,653 |
|
Electrical Equipment — 0.2% |
|
|
|
|
|
|
|
Rockwell Automation, Inc. |
|
| 248,300 |
|
| 6,465,732 |
|
Energy Equipment & Services — 1.7% |
|
|
|
|
|
|
|
Diamond Offshore Drilling, Inc. |
|
| 418,500 |
|
| 26,265,060 |
|
Halliburton Co. |
|
| 930,200 |
|
| 16,045,950 |
|
Schlumberger Ltd. |
|
| 397,100 |
|
| 16,205,651 |
|
|
|
|
|
| |||
|
|
|
|
|
| 58,516,661 |
|
Food & Staples Retailing — 1.3% |
|
|
|
|
|
|
|
Wal-Mart Stores, Inc. |
|
| 921,900 |
|
| 43,439,928 |
|
Food Products — 3.8% |
|
|
|
|
|
|
|
General Mills, Inc. |
|
| 470,600 |
|
| 27,835,990 |
|
H.J. Heinz Co. |
|
| 699,400 |
|
| 25,528,100 |
|
Kraft Foods, Inc. |
|
| 1,114,503 |
|
| 31,261,809 |
|
Unilever NV (a) |
|
| 2,070,900 |
|
| 45,497,673 |
|
|
|
|
|
| |||
|
|
|
|
|
| 130,123,572 |
|
Gas Utilities — 1.0% |
|
|
|
|
|
|
|
AGL Resources, Inc. |
|
| 221,200 |
|
| 6,819,596 |
|
Equitable Resources, Inc. |
|
| 851,000 |
|
| 29,129,730 |
|
|
|
|
|
| |||
|
|
|
|
|
| 35,949,326 |
|
Hotels, Restaurants & Leisure — 1.7% |
|
|
|
|
|
|
|
McDonald’s Corp. |
|
| 942,550 |
|
| 54,686,751 |
|
Tim Hortons, Inc. |
|
| 140,100 |
|
| 3,442,257 |
|
|
|
|
|
| |||
|
|
|
|
|
| 58,129,008 |
|
Household Durables — 0.3% |
|
|
|
|
|
|
|
Electrolux AB |
|
| 370,400 |
|
| 2,666,735 |
|
Newell Rubbermaid, Inc. |
|
| 892,200 |
|
| 7,208,976 |
|
|
|
|
|
| |||
|
|
|
|
|
| 9,875,711 |
|
Household Products — 3.8% |
|
|
|
|
|
|
|
Clorox Co. |
|
| 783,500 |
|
| 39,292,525 |
|
Kimberly-Clark Corp. |
|
| 592,000 |
|
| 30,470,240 |
|
The Procter & Gamble Co. |
|
| 1,098,500 |
|
| 59,868,250 |
|
|
|
|
|
| |||
|
|
|
|
|
| 129,631,015 |
|
Industrial Conglomerates — 2.1% |
|
|
|
|
|
|
|
3M Co. |
|
| 511,100 |
|
| 27,492,069 |
|
General Electric Co. |
|
| 3,641,103 |
|
| 44,166,579 |
|
|
|
|
|
| |||
|
|
|
|
|
| 71,658,648 |
|
Insurance — 3.2% |
|
|
|
|
|
|
|
The Allstate Corp. |
|
| 754,400 |
|
| 16,347,848 |
|
Chubb Corp. |
|
| 805,500 |
|
| 34,298,190 |
|
Marsh & McLennan Cos., Inc. |
|
| 80,900 |
|
| 1,563,797 |
|
The Travelers Cos., Inc. |
|
| 1,544,794 |
|
| 59,690,840 |
|
|
|
|
|
| |||
|
|
|
|
|
| 111,900,675 |
|
Machinery — 1.8% |
|
|
|
|
|
|
|
Caterpillar, Inc. (b) |
|
| 843,400 |
|
| 26,018,890 |
|
Deere & Co. |
|
| 1,075,100 |
|
| 37,348,974 |
|
|
|
|
|
| |||
|
|
|
|
|
| 63,367,864 |
|
Marine — 0.1% |
|
|
|
|
|
|
|
Eagle Bulk Shipping, Inc. (c) |
|
| 634,300 |
|
| 3,387,162 |
|
|
|
|
See Notes to Financial Statements. | ||
14 | SEMI-ANNUAL REPORT | JANUARY 31, 2009 |
|
|
| |
Schedule of Investments (continued) | BlackRock Equity Dividend Fund |
| (Percentages shown are based on Net Assets) |
|
|
|
|
|
|
|
|
Common Stocks |
| Shares |
| Value |
| ||
Media — 0.1% |
|
|
|
|
|
|
|
The McGraw-Hill Cos., Inc. |
|
| 157,600 |
| $ | 3,465,624 |
|
Metals & Mining — 4.3% |
|
|
|
|
|
|
|
Aluminum Corp. of China Ltd. (a) |
|
| 421,420 |
|
| 4,719,904 |
|
BHP Billiton Ltd. |
|
| 3,068,300 |
|
| 56,896,754 |
|
Barrick Gold Corp. |
|
| 636,800 |
|
| 23,960,817 |
|
BlueScope Steel Ltd. |
|
| 5,178,500 |
|
| 11,382,899 |
|
Nucor Corp. |
|
| 584,600 |
|
| 23,845,834 |
|
Rio Tinto Ltd. |
|
| 666,970 |
|
| 17,312,668 |
|
Southern Copper Corp. |
|
| 703,100 |
|
| 9,801,214 |
|
|
|
|
|
| |||
|
|
|
|
|
| 147,920,090 |
|
Multi-Utilities — 2.2% |
|
|
|
|
|
|
|
Consolidated Edison, Inc. |
|
| 260,200 |
|
| 10,603,150 |
|
DTE Energy Co. |
|
| 130,500 |
|
| 4,502,250 |
|
Dominion Resources, Inc. |
|
| 574,900 |
|
| 20,224,982 |
|
PG&E Corp. |
|
| 280,500 |
|
| 10,846,935 |
|
Public Service Enterprise Group, Inc. |
|
| 693,900 |
|
| 21,906,423 |
|
Wisconsin Energy Corp. |
|
| 193,000 |
|
| 8,603,940 |
|
|
|
|
|
| |||
|
|
|
|
|
| 76,687,680 |
|
Oil, Gas & Consumable Fuels — 14.9% |
|
|
|
|
|
|
|
BP Plc (a) |
|
| 704,947 |
|
| 29,939,099 |
|
Cameco Corp. |
|
| 848,500 |
|
| 14,074,202 |
|
Chevron Corp. (b) |
|
| 1,405,738 |
|
| 99,132,644 |
|
ConocoPhillips |
|
| 780,698 |
|
| 37,106,576 |
|
Consol Energy, Inc. |
|
| 440,100 |
|
| 11,997,126 |
|
Enbridge Inc. |
|
| 918,700 |
|
| 30,147,595 |
|
Exxon Mobil Corp. |
|
| 1,725,306 |
|
| 131,951,403 |
|
Marathon Oil Corp. |
|
| 1,088,800 |
|
| 29,648,024 |
|
Murphy Oil Corp. |
|
| 183,900 |
|
| 8,124,702 |
|
Occidental Petroleum Corp. |
|
| 496,400 |
|
| 27,078,620 |
|
Peabody Energy Corp. |
|
| 372,100 |
|
| 9,302,500 |
|
Spectra Energy Corp. |
|
| 561,760 |
|
| 8,151,138 |
|
Total SA (a) |
|
| 1,515,900 |
|
| 75,461,502 |
|
|
|
|
|
| |||
|
|
|
|
|
| 512,115,131 |
|
Paper & Forest Products — 0.7% |
|
|
|
|
|
|
|
MeadWestvaco Corp. |
|
| 837,700 |
|
| 9,750,828 |
|
Weyerhaeuser Co. |
|
| 466,800 |
|
| 12,762,312 |
|
|
|
|
|
| |||
|
|
|
|
|
| 22,513,140 |
|
Personal Products — 0.4% |
|
|
|
|
|
|
|
Avon Products, Inc. |
|
| 676,600 |
|
| 13,836,470 |
|
Pharmaceuticals — 5.4% |
|
|
|
|
|
|
|
Abbott Laboratories |
|
| 702,100 |
|
| 38,924,424 |
|
Bristol-Myers Squibb Co. (b) |
|
| 2,245,200 |
|
| 48,069,732 |
|
Johnson & Johnson |
|
| 620,700 |
|
| 35,808,183 |
|
Pfizer, Inc. |
|
| 2,081,512 |
|
| 30,348,445 |
|
Wyeth |
|
| 811,200 |
|
| 34,857,264 |
|
|
|
|
|
| |||
|
|
|
|
|
| 188,008,048 |
|
|
|
|
|
|
|
|
|
Common Stocks |
| Shares |
| Value |
| ||
Real Estate Investment Trusts (REITs) — 0.4% |
|
|
|
|
|
|
|
Boston Properties, Inc. |
|
| 153,200 |
| $ | 6,633,560 |
|
Vornado Realty Trust |
|
| 137,000 |
|
| 6,960,970 |
|
|
|
|
|
| |||
|
|
|
|
|
| 13,594,530 |
|
Semiconductors & Semiconductor Equipment — 0.2% |
|
|
|
|
|
|
|
Intel Corp. |
|
| 580,816 |
|
| 7,492,526 |
|
Software — 0.3% |
|
|
|
|
|
|
|
Microsoft Corp. |
|
| 608,430 |
|
| 10,404,153 |
|
Specialty Retail — 0.1% |
|
|
|
|
|
|
|
Home Depot, Inc. |
|
| 28,228 |
|
| 607,749 |
|
Limited Brands, Inc. |
|
| 369,700 |
|
| 2,928,024 |
|
|
|
|
|
| |||
|
|
|
|
|
| 3,535,773 |
|
Tobacco — 1.8% |
|
|
|
|
|
|
|
Altria Group, Inc. |
|
| 796,500 |
|
| 13,174,110 |
|
Philip Morris International, Inc. |
|
| 1,271,100 |
|
| 47,221,365 |
|
|
|
|
|
| |||
|
|
|
|
|
| 60,395,475 |
|
Water Utilities — 0.6% |
|
|
|
|
|
|
|
American Water Works Co, Inc. |
|
| 900,200 |
|
| 19,066,236 |
|
Wireless Telecommunication Services — 0.5% |
|
|
|
|
|
|
|
Vodafone Group Plc (a) |
|
| 873,781 |
|
| 16,243,589 |
|
Total Long-Term Investments |
|
|
|
|
| 2,823,695,964 |
|
|
|
|
|
|
|
|
|
Short-Term Securities |
| Beneficial |
|
|
|
| |
BlackRock Liquidity Series, LLC Cash Sweep Series, 0.66% (d)(e) |
| $ | 601,807 |
|
| 601,807,095 |
|
BlackRock Liquidity Series, LLC Money Market Series, 0.77% (d)(e)(f) |
|
| 3,580 |
|
| 3,579,600 |
|
Total Short-Term Securities |
|
|
|
|
| 605,386,695 |
|
Total Investments (Cost — $4,432,513,467*) — 99.6% |
|
|
|
| $ | 3,429,082,659 |
|
| |||||||
Other Assets Less Liabilities — 0.4% |
|
|
|
|
| 15,341,261 |
|
|
|
|
|
| |||
Net Assets — 100.0% |
|
|
|
| $ | 3,444,423,920 |
|
|
|
|
|
| |||
|
|
|
|
See Notes to Financial Statements. | |||
| SEMI-ANNUAL REPORT | JANUARY 31, 2009 | 15 |
|
|
|
|
Schedule of Investments (concluded) | BlackRock Equity Dividend Fund |
|
|
* | The cost and unrealized appreciation (depreciation) of investments as of January 31, 2009, as computed for federal income tax purposes, were as follows: |
|
|
|
|
|
|
| Aggregate cost |
| $ | 4,426,675,305 |
|
|
|
|
| ||
| Gross unrealized appreciation |
| $ | 16,315,538 |
|
| Gross unrealized depreciation |
|
| (1,013,908,184 | ) |
|
|
|
| ||
| Net unrealized depreciation |
| $ | (997,592,646 | ) |
|
|
|
|
|
|
(a) | Depositary receipts. |
|
|
(b) | All or a portion of the security has been pledged as collateral in connection with open financial futures contracts. |
|
|
(c) | Security, or a portion of security, is on loan. |
|
|
(d) | Investments in companies considered to be an affiliate of the Fund, for purposes of Section 2(a)(3) of the Investment Company Act of 1940, were as follows: |
|
|
|
|
|
|
|
|
|
| ||||||||
| Affiliate |
| Net |
| Income |
| ||
| ||||||||
| BlackRock Liquidity Series, LLC Cash Sweep Series |
| $ | 200,971,512 |
| $ | 4,126,442 |
|
| BlackRock Liquidity Series, LLC Money Market Series |
| $ | 3,579,600 |
| $ | 3,517 |
|
| ||||||||
|
|
(e) | Represents the current yield as of report date. |
|
|
(f) | Security was purchased with the cash proceeds from securities loans. |
|
|
• | For Fund compliance purposes, the Fund’s industry classifications refer to any one or more of the industry sub-classifications used by one or more widely recognized market indexes or ratings group indexes, and/or as defined by Fund management. This definition may not apply for purposes of this report, which may combine industry sub-classifications for reporting ease. |
|
|
• | Financial futures contracts purchased as of January 31, 2009 were as follows: |
|
|
|
|
|
|
|
|
|
|
|
|
|
| ||||||||||||
| Contracts |
| Issue |
| Expiration |
| Face |
| Unrealized |
| ||
| ||||||||||||
| 6,270 |
| S&P 500 Index |
| March 2009 |
| $ | 281,604,479 |
| $ | (17,386,679 | ) |
| ||||||||||||
|
|
|
• | Effective August 1, 2008, the Fund adopted Financial Accounting Standards Board Statement of Financial Accounting Standards No. 157, “Fair Value Measurements” (“FAS 157”). FAS 157 clarifies the definition of fair value, establishes a framework for measuring fair values and requires additional disclosures about the use of fair value measurements. Various inputs are used in determining the fair value of investments, which are as follows: | |
|
| |
| • | Level 1 — price quotations in active markets/exchanges for identical securities |
|
|
|
| • | Level 2 — other observable inputs (including, but not limited to: quoted prices for similar assets or liabilities in markets that are not active, inputs other than quoted prices that are observable for the assets or liabilities (such as interest rates, yield curves, volatilities, prepayment speeds, loss severities, credit risks, and default rates) or other market-corroborated inputs) |
|
|
|
| • | Level 3 — unobservable inputs based on the best information available in the circumstance, to the extent observable inputs are not available (including the Fund’s own assumption used in determining the fair value of investments) |
|
|
|
| The inputs or methodology used for valuing securities are not necessarily an indication of the risk associated with investing in those securities. For information about the Fund’s policy regarding valuation of investments and other significant accounting policies, please refer to Note 1 of the Notes to Financial Statements. | |
|
|
|
| The following table summarizes the inputs used as of January 31, 2009 in determining the fair valuation of the Fund’s Investments: | |
|
|
|
|
|
|
|
|
|
| ||||||||
| Valuation Inputs |
| Investments in |
| Other Financial |
| ||
| ||||||||
|
|
| Assets |
| Liabilities |
| ||
|
|
|
| |||||
| Level 1 |
| $ | 2,695,872,836 |
| $ | (17,386,679 | ) |
| Level 2 |
|
| 733,209,823 |
|
| — |
|
| Level 3 |
|
| — |
|
| — |
|
| ||||||||
| Total |
| $ | 3,429,082,659 |
| $ | (17,386,679 | ) |
|
|
| ||||||
|
|
* | Other financial instruments are futures, which are valued at the unrealized appreciation/depreciation on the instrument. |
|
|
|
See Notes to Financial Statements. | ||
16 | SEMI-ANNUAL REPORT | JANUARY 31, 2009 |
|
|
| |
Schedule of Investments January 31, 2009 (Unaudited) | BlackRock Natural Resources Trust |
| (Percentages shown are based on Net Assets) |
|
|
|
|
|
|
|
|
Common Stocks |
| Shares |
| Value |
| ||
Canadian Independents — 12.1% |
|
|
|
|
|
|
|
Addax Petroleum Corp. |
|
| 44,300 |
| $ | 708,078 |
|
Canadian Natural Resources Ltd. |
|
| 85,600 |
|
| 3,063,799 |
|
Compton Petroleum Corp. (a) |
|
| 113,800 |
|
| 96,515 |
|
Connacher Oil And Gas Ltd. (a) |
|
| 436,000 |
|
| 320,000 |
|
Crew Energy, Inc. (a) |
|
| 270,700 |
|
| 772,640 |
|
EnCana Corp. |
|
| 123,622 |
|
| 5,501,368 |
|
Husky Energy, Inc. |
|
| 106,400 |
|
| 2,641,236 |
|
Iteration Energy Ltd. (a) |
|
| 144,063 |
|
| 111,608 |
|
Nexen, Inc. |
|
| 118,600 |
|
| 1,727,377 |
|
Niko Resources Ltd. |
|
| 21,800 |
|
| 896,711 |
|
Pan Orient Energy Corp. (a) |
|
| 224,000 |
|
| 597,333 |
|
Paramount Resources Ltd. (a) |
|
| 75,000 |
|
| 433,028 |
|
Petro-Canada |
|
| 116,800 |
|
| 2,532,691 |
|
Progress Energy Resources Corp. (a) |
|
| 140,653 |
|
| 1,204,368 |
|
Suncor Energy, Inc. |
|
| 228,400 |
|
| 4,378,947 |
|
TUSK Energy Corp. (a) |
|
| 673,096 |
|
| 466,570 |
|
Talisman Energy, Inc. |
|
| 601,800 |
|
| 5,697,776 |
|
TriStar Oil and Gas Ltd. (a) |
|
| 222,959 |
|
| 1,963,676 |
|
UTS Energy Corp. (a) |
|
| 150,000 |
|
| 211,621 |
|
|
|
|
|
| |||
|
|
|
|
|
| 33,325,342 |
|
Chemicals — 0.8% |
|
|
|
|
|
|
|
E.I. du Pont de Nemours & Co. |
|
| 33,400 |
|
| 766,864 |
|
Intrepid Potash, Inc. (a) |
|
| 18,400 |
|
| 374,992 |
|
Praxair, Inc. |
|
| 18,000 |
|
| 1,120,680 |
|
|
|
|
|
| |||
|
|
|
|
|
| 2,262,536 |
|
Energy Equipment & Services — 9.3% |
|
|
|
|
|
|
|
Acergy SA (b) |
|
| 85,000 |
|
| 466,650 |
|
Cameron International Corp. (a) |
|
| 186,200 |
|
| 4,312,392 |
|
Dresser-Rand Group, Inc. (a) |
|
| 179,800 |
|
| 3,502,504 |
|
Dril-Quip, Inc. (a) |
|
| 56,000 |
|
| 1,372,000 |
|
National Oilwell Varco, Inc. (a) |
|
| 239,601 |
|
| 6,335,051 |
|
Tesco Corp. (a) |
|
| 106,300 |
|
| 1,056,622 |
|
Transocean Ltd. (a) |
|
| 150,909 |
|
| 8,242,650 |
|
Trican Well Service Ltd. |
|
| 42,500 |
|
| 235,331 |
|
|
|
|
|
|
| ||
|
|
|
|
|
| 25,523,200 |
|
Gold — 1.9% |
|
|
|
|
|
|
|
Barrick Gold Corp. |
|
| 51,800 |
|
| 1,949,074 |
|
Eldorado Gold Corp. (a) |
|
| 404,500 |
|
| 3,166,728 |
|
|
|
|
|
|
| ||
|
|
|
|
|
| 5,115,802 |
|
Independent Power Producers & Energy Traders — 0.0% |
|
|
|
|
|
|
|
Dynegy, Inc. Class A (a) |
|
| 2,656 |
|
| 5,604 |
|
Integrated Oil & Gas — 18.4% |
|
|
|
|
|
|
|
BP Plc (b) |
|
| 40,800 |
|
| 1,732,776 |
|
Chevron Corp. |
|
| 139,591 |
|
| 9,843,957 |
|
ConocoPhillips |
|
| 112,475 |
|
| 5,345,937 |
|
Eni SpA (b) |
|
| 19,250 |
|
| 816,008 |
|
Exxon Mobil Corp. |
|
| 129,328 |
|
| 9,891,006 |
|
Hess Corp. |
|
| 64,800 |
|
| 3,603,528 |
|
Marathon Oil Corp. |
|
| 142,400 |
|
| 3,877,552 |
|
Murphy Oil Corp. |
|
| 247,400 |
|
| 10,930,132 |
|
Total SA (b) |
|
| 90,800 |
|
| 4,520,024 |
|
|
|
|
|
| |||
|
|
|
|
|
| 50,560,920 |
|
|
|
|
|
|
|
|
|
Common Stocks |
| Shares |
| Value |
| ||
Marine — 0.4% |
|
|
|
|
|
|
|
Aegean Marine Petroleum Network, Inc. |
|
| 72,300 |
| $ | 1,237,053 |
|
Metals & Mining — 6.8% |
|
|
|
|
|
|
|
Alcoa, Inc. |
|
| 22,900 |
|
| 178,391 |
|
Alumina Ltd. |
|
| 153,800 |
|
| 108,028 |
|
Aluminum Corp. of China Ltd. (b)(c) |
|
| 188,500 |
|
| 2,111,200 |
|
BHP Billiton Ltd. |
|
| 60,500 |
|
| 1,121,876 |
|
Companhia Vale do Río Doce (Common Shares) (b) |
|
| 174,000 |
|
| 2,455,140 |
|
First Quantum Minerals Ltd. |
|
| 55,700 |
|
| 990,677 |
|
Franco-Nevada Corp. |
|
| 75,000 |
|
| 1,556,575 |
|
Goldcorp, Inc. |
|
| 124,682 |
|
| 3,692,926 |
|
HudBay Minerals, Inc. (a) |
|
| 195,000 |
|
| 779,205 |
|
Inmet Mining Corp. |
|
| 12,700 |
|
| 215,007 |
|
Newcrest Mining Ltd. |
|
| 162,000 |
|
| 3,140,313 |
|
Newmont Mining Corp. |
|
| 9,100 |
|
| 361,998 |
|
Southern Copper Corp. |
|
| 137,400 |
|
| 1,915,356 |
|
|
|
|
|
| |||
|
|
|
|
|
| 18,626,692 |
|
Oil & Gas Drilling — 5.3% |
|
|
|
|
|
|
|
Diamond Offshore Drilling, Inc. |
|
| 46,600 |
|
| 2,924,616 |
|
Helmerich & Payne, Inc. |
|
| 95,200 |
|
| 2,138,192 |
|
Nabors Industries Ltd. (a) |
|
| 109,000 |
|
| 1,193,550 |
|
Noble Corp. |
|
| 149,900 |
|
| 4,069,785 |
|
Pride International, Inc. (a) |
|
| 70,700 |
|
| 1,139,684 |
|
Rowan Cos., Inc. |
|
| 50,000 |
|
| 633,000 |
|
Saipem SpA |
|
| 164,500 |
|
| 2,506,422 |
|
|
|
|
|
| |||
|
|
|
|
|
| 14,605,249 |
|
Oil & Gas Equipment & Services — 8.5% |
|
|
|
|
|
|
|
BJ Services Co. |
|
| 59,900 |
|
| 658,900 |
|
Baker Hughes, Inc. |
|
| 89,300 |
|
| 2,975,476 |
|
Complete Production Services, Inc. (a) |
|
| 39,100 |
|
| 250,631 |
|
Exterran Holdings, Inc. (a) |
|
| 521 |
|
| 11,545 |
|
FMC Technologies, Inc. (a) |
|
| 142,600 |
|
| 4,219,534 |
|
Halliburton Co. |
|
| 174,200 |
|
| 3,004,950 |
|
Oil States International, Inc. (a) |
|
| 73,400 |
|
| 1,343,954 |
|
Schlumberger Ltd. |
|
| 75,800 |
|
| 3,093,398 |
|
Smith International, Inc. |
|
| 80,700 |
|
| 1,831,890 |
|
Technip SA (b) |
|
| 64,975 |
|
| 1,997,981 |
|
Weatherford International Ltd. (a) |
|
| 349,452 |
|
| 3,854,456 |
|
|
|
|
|
| |||
|
|
|
|
|
| 23,242,715 |
|
Oil & Gas Exploration & Production — 24.2% |
|
|
|
|
|
|
|
Anadarko Petroleum Corp. |
|
| 52,200 |
|
| 1,917,828 |
|
Apache Corp. |
|
| 126,760 |
|
| 9,507,000 |
|
CNOOC Ltd. (b) |
|
| 31,400 |
|
| 2,701,656 |
|
Cabot Oil & Gas Corp. Class A |
|
| 88,200 |
|
| 2,424,618 |
|
Carrizo Oil & Gas, Inc. (a)(c) |
|
| 59,100 |
|
| 819,126 |
|
Cimarex Energy Co. |
|
| 21,094 |
|
| 523,975 |
|
Denbury Resources, Inc. (a) |
|
| 58,113 |
|
| 711,303 |
|
Devon Energy Corp. |
|
| 196,898 |
|
| 12,128,917 |
|
EOG Resources, Inc. |
|
| 210,900 |
|
| 14,292,693 |
|
Forest Oil Corp. (a) |
|
| 45,800 |
|
| 687,000 |
|
Mariner Energy, Inc. (a) |
|
| 37,065 |
|
| 366,944 |
|
Newfield Exploration Co. (a) |
|
| 69,000 |
|
| 1,324,110 |
|
Noble Energy, Inc. |
|
| 63,800 |
|
| 3,121,734 |
|
Occidental Petroleum Corp. |
|
| 117,100 |
|
| 6,387,805 |
|
Pioneer Natural Resources Co. |
|
| 36,600 |
|
| 535,824 |
|
Range Resources Corp. |
|
| 156,900 |
|
| 5,623,296 |
|
SandRidge Energy, Inc. (a) |
|
| 104,300 |
|
| 694,638 |
|
Southwestern Energy Co. (a) |
|
| 62,000 |
|
| 1,962,300 |
|
XTO Energy, Inc. |
|
| 25,125 |
|
| 931,886 |
|
|
|
|
|
| |||
|
|
|
|
|
| 66,662,653 |
|
|
|
|
See Notes to Financial Statements. |
|
|
SEMI-ANNUAL REPORT | JANUARY 31, 2009 | 17 |
|
|
| |
Schedule of Investments (concluded) | BlackRock Natural Resources Trust |
| (Percentages shown are based on Net Assets) |
|
|
|
|
|
|
|
|
Common Stocks |
| Shares |
| Value |
| ||
Oil, Gas & Consumable Fuels — 3.9% |
|
|
|
|
|
|
|
Arch Coal, Inc. |
|
| 36,000 |
| $ | 546,840 |
|
Coastal Energy Co. (a) |
|
| 500,000 |
|
| 599,388 |
|
Consol Energy, Inc. |
|
| 68,200 |
|
| 1,859,132 |
|
Patriot Coal Corp. (a) |
|
| 27,840 |
|
| 142,819 |
|
Peabody Energy Corp. |
|
| 139,200 |
|
| 3,480,000 |
|
Petroleo Brasileiro SA (b) |
|
| 107,400 |
|
| 2,813,880 |
|
Whiting Petroleum Corp. (a) |
|
| 46,700 |
|
| 1,354,300 |
|
|
|
|
|
| |||
|
|
|
|
|
| 10,796,359 |
|
Paper & Forest Products — 0.2% |
|
|
|
|
|
|
|
Votorantim Celulose e Papel SA (a)(b) |
|
| 100,000 |
|
| 580,000 |
|
Refining, Marketing & Transportation — 0.8% |
|
|
|
|
|
|
|
Valero Energy Corp. |
|
| 89,000 |
|
| 2,146,680 |
|
Utilities — 1.6% |
|
|
|
|
|
|
|
Equitable Resources, Inc. |
|
| 102,000 |
|
| 3,491,460 |
|
Williams Cos., Inc. |
|
| 67,200 |
|
| 950,880 |
|
|
|
|
|
| |||
|
|
|
|
|
| 4,442,340 |
|
Total Long-Term Investments |
|
|
|
|
| 259,133,145 |
|
|
|
|
|
|
|
|
|
Short-Term Securities |
| Beneficial |
|
|
|
| |
BlackRock Liquidity Series, LLC Cash Sweep Series, 0.66% (d)(e) |
| $ | 15,996 |
|
| 15,995,973 |
|
BlackRock Liquidity Series, LLC Money Market Series, 0.77% (d)(e)(f) |
|
| 1,637 |
|
| 1,636,800 |
|
Total Short-Term Securities |
|
|
|
|
| 17,632,773 |
|
Total Investments (Cost — $209,354,696*) — 100.6% |
|
|
|
|
| 276,765,918 |
|
| |||||||
Liabilities in Excess of Other Assets — (0.6)% |
|
|
|
|
| (1,770,746 | ) |
|
|
|
|
| |||
Net Assets — 100.0% |
|
|
|
| $ | 274,995,172 |
|
|
|
|
|
| |||
|
|
| |
* | The cost and unrealized appreciation (depreciation) of investments as of January 31, 2009, as computed for federal income tax purposes, were as follows: |
|
|
|
|
|
|
|
|
Aggregate cost |
|
|
|
| $ | 209,863,156 |
|
|
|
|
|
|
| ||
Gross unrealized appreciation |
|
|
|
| $ | 101,820,650 |
|
Gross unrealized depreciation |
|
|
|
|
| (34,917,888 | ) |
|
|
|
|
|
| ||
Net unrealized appreciation |
|
|
|
| $ | 66,902,762 |
|
|
|
|
|
|
|
|
|
(a) | Non-income producing security. |
|
|
(b) | Depositary receipts. |
|
|
(c) | Security, or a portion of security, is on loan. |
|
|
(d) | Investments in companies considered to be an affiliate of the Fund, for purposes of Section 2(a)(3) of the Investment Company Act of 1940, were as follows: |
|
|
|
|
|
|
|
|
Affiliate |
| Net |
| Income |
| ||
BlackRock Liquidity Series, LLC Cash Sweep Series |
| $ | 15,955,973 |
| $ | 171,801 |
|
BlackRock Liquidity Series, LLC Money Market Series |
| $ | 1,636,800 |
| $ | 2,453 |
|
Merrill Lynch Premier Institutional Fund |
| $ | (6,031,600 | ) |
| — |
|
|
|
(e) | Represents the current yield as of report date. |
|
|
(f) | Security was purchased with the cash proceeds from securities loans. |
|
|
• | Foreign currency exchange contracts as of January 31, 2009 were as follows: |
|
|
|
|
|
Currency | Currency |
| Settlement | Unrealized |
Purchased | Sold | Counterparty | Date | Appreciation |
|
| State Street |
|
|
USD 66,503 | CAD 80,500 | Bank & Trust Co. | 2/02/09 | $858 |
|
|
|
• | For Trust compliance purposes, the Trust’s industry classifications refer to any one or more of the industry sub-classifications used by one or more widely recognized market indexes or ratings group indexes, and/or as defined by Trust management. This definition may not apply for purposes of this report, which may combine industry sub-classifications for reporting ease. | |
|
|
|
• | Effective August 1, 2008, the Trust adopted Financial Accounting Standards Board Statement of Financial Accounting Standards No. 157, “Fair Value Measurements” (“FAS 157”). FAS 157 clarifies the definition of fair value, establishes a framework for measuring fair values and requires additional disclosures about the use of fair value measurements. Various inputs are used in determining the fair value of investments, which are as follows: | |
|
|
|
| • | Level 1 — price quotations in active markets/exchanges for identical securities |
|
|
|
| • | Level 2 — other observable inputs (including, but not limited to: quoted prices for similar assets or liabilities in markets that are not active, inputs other than quoted prices that are observable for the assets or liabilities (such as interest rates, yield curves, volatilities, prepayment speeds, loss severities, credit risks, and default rates) or other market-corroborated inputs) |
|
|
|
| • | Level 3 — unobservable inputs based on the best information available in the circumstance, to the extent observable inputs are not available (including the Trust’s own assumption used in determining the fair value of investments) |
The inputs or methodology used for valuing securities are not necessarily an indication of the risk associated with investing in those securities. For information about the Trust’s policy regarding valuation of investments and other significant accounting policies, please refer to Note 1 of the Notes to Financial Statements.
The following table summarizes the inputs used as of January 31, 2009 in determining the fair valuation of the Trust’s investments:
|
|
|
|
|
|
|
|
Valuation Inputs |
| Investments in |
| Other Financial |
| ||
|
| Assets |
| Assets |
| ||
|
|
| |||||
Level 1 |
| $ | 252,256,504 |
|
| — |
|
Level 2 |
|
| 24,509,414 |
| $ | 858 |
|
Level 3 |
|
| — |
|
| — |
|
Total |
| $ | 276,765,918 |
| $ | 858 |
|
|
| ||||||
|
|
|
| * | Other financial instruments are foreign currency exchange contracts, which are valued at the unrealized appreciation/depreciation on the instrument. |
|
|
|
• | Currency Abbreviations: | |
| ||
| CAD Canadian Dollar | |
| USD US Dollar | |
|
|
|
See Notes to Financial Statements. |
| |
18 | SEMI-ANNUAL REPORT | JANUARY 31, 2009 |
|
|
|
|
|
| |
Schedule of Investments January 31, 2009 (Unaudited) | BlackRock Utilities and Telecommunications Fund, Inc. |
| (Percentages shown are based on Net Assets) |
|
|
|
|
|
|
|
|
Common Stocks |
| Shares |
| Value |
| ||
Commercial Services & Supplies — 0.1% |
|
|
|
|
|
|
|
Suez Environnement SA |
|
| 8,300 |
| $ | 132,262 |
|
Construction & Engineering — 0.5% |
|
|
|
|
|
|
|
Quanta Services, Inc. (a) |
|
| 21,075 |
|
| 450,584 |
|
Diversified Telecommunication Services — 14.7% |
|
|
|
|
|
|
|
AT&T Inc. |
|
| 147,762 |
|
| 3,637,900 |
|
Cable & Wireless Plc |
|
| 100,500 |
|
| 227,645 |
|
Deutsche Telekom AG |
|
| 30,600 |
|
| 369,265 |
|
France Telecom SA |
|
| 24,300 |
|
| 544,537 |
|
Frontier Communications Corp. |
|
| 74,400 |
|
| 603,384 |
|
GVT Holding SA (a) |
|
| 25,900 |
|
| 277,197 |
|
Koninklijke KPN NV |
|
| 42,000 |
|
| 559,040 |
|
Manitoba Telecom Services, Inc. |
|
| 30,000 |
|
| 876,330 |
|
Qwest Communications International Inc. |
|
| 253,300 |
|
| 815,626 |
|
TW Telecom, Inc. (a) |
|
| 41,000 |
|
| 313,650 |
|
Telefonica SA |
|
| 79,448 |
|
| 1,408,513 |
|
Verizon Communications, Inc. |
|
| 142,500 |
|
| 4,256,475 |
|
Windstream Corp. |
|
| 39,141 |
|
| 339,744 |
|
|
|
|
|
| |||
|
|
|
|
|
| 14,229,306 |
|
Electric Utilities — 36.1% |
|
|
|
|
|
|
|
Allegheny Energy, Inc. |
|
| 50,800 |
|
| 1,688,592 |
|
American Electric Power Co., Inc. |
|
| 51,000 |
|
| 1,598,850 |
|
British Energy Group Plc |
|
| 40,000 |
|
| 445,833 |
|
CPFL Energia SA (b) |
|
| 12,100 |
|
| 465,487 |
|
Cia Energetica de Minas Gerais (b) |
|
| 47,950 |
|
| 651,641 |
|
DPL, Inc. |
|
| 75,000 |
|
| 1,616,250 |
|
Duke Energy Corp. |
|
| 177,532 |
|
| 2,689,610 |
|
E.ON AG |
|
| 19,800 |
|
| 637,774 |
|
EDP — Energias do Brasil SA |
|
| 33,200 |
|
| 317,690 |
|
Edison International |
|
| 18,000 |
|
| 586,260 |
|
Electricité de France SA |
|
| 8,600 |
|
| 419,138 |
|
Entergy Corp. |
|
| 39,800 |
|
| 3,039,128 |
|
Exelon Corp. |
|
| 60,700 |
|
| 3,291,154 |
|
FPL Group, Inc. |
|
| 77,300 |
|
| 3,984,815 |
|
FirstEnergy Corp. |
|
| 56,700 |
|
| 2,834,433 |
|
ITC Holdings Corp. |
|
| 49,500 |
|
| 2,078,010 |
|
Iberdrola SA |
|
| 113,000 |
|
| 874,972 |
|
NV Energy, Inc. |
|
| 23,300 |
|
| 250,009 |
|
Northeast Utilities Inc. |
|
| 30,700 |
|
| 730,660 |
|
PPL Corp. |
|
| 101,800 |
|
| 3,121,188 |
|
Pepco Holdings, Inc. |
|
| 6,400 |
|
| 113,984 |
|
Progress Energy, Inc. |
|
| 12,400 |
|
| 480,128 |
|
The Southern Co. |
|
| 94,000 |
|
| 3,144,300 |
|
|
|
|
|
| |||
|
|
|
|
|
| 35,059,906 |
|
Electronic Equipment & Instruments — 0.5% |
|
|
|
|
|
|
|
Itron, Inc. (a) |
|
| 6,800 |
|
| 444,040 |
|
Gas Utilities — 4.0% |
|
|
|
|
|
|
|
Equitable Resources, Inc. |
|
| 30,300 |
|
| 1,037,169 |
|
New Jersey Resources Corp. |
|
| 20,400 |
|
| 817,836 |
|
Questar Corp. |
|
| 44,400 |
|
| 1,508,712 |
|
UGI Corp. |
|
| 19,000 |
|
| 482,030 |
|
|
|
|
|
| |||
|
|
|
|
|
| 3,845,747 |
|
|
|
|
|
|
|
|
|
Common Stocks |
| Shares |
| Value |
| ||
Independent Power Producers &Energy Traders — 7.8% |
|
|
|
|
|
|
|
AES Tiete SA (Preference Shares) |
|
| 68,500 |
| $ | 474,481 |
|
Constellation Energy Group, Inc. |
|
| 47,400 |
|
| 1,246,620 |
|
Dynegy, Inc. Class A (a) |
|
| 373,300 |
|
| 787,663 |
|
International Power Plc |
|
| 132,500 |
|
| 519,676 |
|
NRG Energy, Inc. (a) |
|
| 147,600 |
|
| 3,447,936 |
|
Ormat Technologies, Inc. |
|
| 25,300 |
|
| 784,047 |
|
Tractebel Energia SA |
|
| 42,500 |
|
| 328,642 |
|
|
|
|
|
| |||
|
|
|
|
|
| 7,589,065 |
|
Media — 0.3% |
|
|
|
|
|
|
|
Vivendi SA |
|
| 13,000 |
|
| 334,887 |
|
Multi-Utilities — 16.6% |
|
|
|
|
|
|
|
Ameren Corp. |
|
| 12,600 |
|
| 418,950 |
|
CMS Energy Corp. |
|
| 132,500 |
|
| 1,556,875 |
|
Centrica Plc |
|
| 183,700 |
|
| 683,474 |
|
Consolidated Edison, Inc. |
|
| 36,200 |
|
| 1,475,150 |
|
Dominion Resources, Inc. |
|
| 56,674 |
|
| 1,993,791 |
|
GDF Suez |
|
| 31,689 |
|
| 1,212,391 |
|
NSTAR |
|
| 26,200 |
|
| 886,084 |
|
National Grid Plc |
|
| 54,718 |
|
| 510,659 |
|
PG&E Corp. |
|
| 54,500 |
|
| 2,107,515 |
|
Public Service Enterprise Group, Inc. |
|
| 128,000 |
|
| 4,040,960 |
|
RWE AG |
|
| 4,500 |
|
| 349,638 |
|
Wisconsin Energy Corp. |
|
| 19,100 |
|
| 851,478 |
|
|
|
|
|
| |||
|
|
|
|
|
| 16,086,965 |
|
Oil, Gas & Consumable Fuels — 3.9% |
|
|
|
|
|
|
|
Consol Energy, Inc. |
|
| 7,500 |
|
| 204,450 |
|
Devon Energy Corp. |
|
| 10,000 |
|
| 616,000 |
|
EOG Resources, Inc. |
|
| 10,500 |
|
| 711,585 |
|
El Paso Corp. |
|
| 40,500 |
|
| 331,290 |
|
Range Resources Corp. |
|
| 5,900 |
|
| 211,456 |
|
Southwestern Energy Co. (a) |
|
| 17,600 |
|
| 557,040 |
|
Spectra Energy Corp. |
|
| 25,816 |
|
| 374,590 |
|
Williams Cos., Inc. |
|
| 58,800 |
|
| 832,020 |
|
|
|
|
|
| |||
|
|
|
|
|
| 3,838,431 |
|
Water Utilities — 2.9% |
|
|
|
|
|
|
|
American States Water Co. |
|
| 3,400 |
|
| 117,538 |
|
American Water Works Co, Inc. |
|
| 25,500 |
|
| 540,090 |
|
Aqua America, Inc. |
|
| 31,500 |
|
| 653,310 |
|
California Water Service Group |
|
| 14,200 |
|
| 617,700 |
|
Cia de Saneamento Basico do Estado de São Paulo |
|
| 20,800 |
|
| 225,034 |
|
Cia Saneamento (Preference Shares) (c)(d) |
|
| 314 |
|
| 16,891 |
|
Companhia de Saneamento de Minas Gerais |
|
| 32,000 |
|
| 264,138 |
|
Northumbrian Water Group Plc |
|
| 100,000 |
|
| 339,268 |
|
|
|
|
|
| |||
|
|
|
|
|
| 2,773,969 |
|
|
|
|
See Notes to Financial Statements. |
|
|
SEMI-ANNUAL REPORT | JANUARY 31, 2009 | 19 |
|
|
|
|
Schedule of Investments (concluded) | BlackRock Utilities and Telecommunications Fund, Inc. |
| (Percentages shown are based on Net Assets) |
|
|
|
|
|
|
|
|
Common Stocks |
| Shares |
| Value |
| ||
Wireless Telecommunication Services — 4.8% |
|
|
|
|
|
|
|
America Movil, SA de CV (b) |
|
| 29,400 |
| $ | 838,194 |
|
American Tower Corp. Class A (a) |
|
| 22,700 |
|
| 688,718 |
|
Millicom International Cellular SA |
|
| 8,000 |
|
| 313,280 |
|
Rogers Communications, Inc. Class B |
|
| 17,000 |
|
| 478,720 |
|
SBA Communications Corp. Class A (a) |
|
| 37,700 |
|
| 750,230 |
|
Vodafone Group Plc (b) |
|
| 84,512 |
|
| 1,571,077 |
|
|
|
|
|
| |||
|
|
|
|
|
| 4,640,219 |
|
Total Common Stocks (Cost — $79,220,295) — 92.2% |
|
|
|
|
| 89,425,381 |
|
|
|
|
|
|
|
|
|
Short-Term Securities |
|
| Beneficial |
|
|
|
|
BlackRock Liquidity Series, LLC Cash Sweep Series, 0.66% (e)(f) |
| $ | 7,008 |
|
| 7,007,779 |
|
Total Short-Term Securities |
|
|
|
|
| 7,007,779 |
|
Total Investments (Cost — $86,228,074*) — 99.4% |
|
|
|
|
| 96,433,160 |
|
Other Assets Less Liabilities — 0.6% |
|
|
|
|
| 571,558 |
|
|
|
|
|
| |||
Net Assets — 100.0% |
|
|
|
| $ | 97,004,718 |
|
|
|
|
|
| |||
|
|
| |
* | The cost and unrealized appreciation (depreciation) of investments as of January 31, 2009, as computed for federal income tax purposes, were as follows: |
|
|
|
|
|
Aggregate cost |
| $ | 86,140,488 |
|
|
|
| ||
Gross unrealized appreciation |
| $ | 17,608,020 |
|
Gross unrealized depreciation |
|
| (7,315,348 | ) |
|
|
| ||
Net unrealized appreciation |
| $ | 10,292,672 |
|
|
|
|
|
|
(a) | Non-income producing security. |
|
|
(b) | Depositary receipts. |
|
|
(c) | Convertible security. |
|
|
(d) | Security is valued in accordance with the Fund’s fair valuation policy. |
|
|
(e) | Represents the current yield as of report date. |
|
|
(f) | Investments in companies considered to be an affiliate of the Fund, for purposes of Section 2(a)(3) of the Investment Company Act of 1940, were as follows: |
|
|
|
|
|
|
|
|
Income |
| Net |
| Income |
| ||
BlackRock Liquidity Series, LLC Cash Sweep Series |
| $ | 6,998,585 |
| $ | 81,313 |
|
|
|
|
• | For Fund compliance purposes, the Fund’s industry classifications refer to any one or more of the industry sub-classifications used by one or more widely recognized market indexes or ratings group indexes, and/or as defined by Fund management. This definition may not apply for the purposes of this report, which may combine industry sub-classifications for reporting ease. | |
|
|
|
• | Effective August 1, 2008, the Fund adopted Financial Accounting Standards Board Statement of Financial Accounting Standards No. 157, “Fair Value Measurements” (“FAS 157”). FAS 157 clarifies the definition of fair value, establishes a framework for measuring fair values and requires additional disclosures about the use of fair value measurements. Various inputs are used in determining the fair value of investments, which are as follows: | |
|
|
|
| • | Level 1 — price quotations in active markets/exchanges for identical securities |
|
|
|
| • | Level 2 — other observable inputs (including, but not limited to: quoted prices for similar assets or liabilities in markets that are not active, inputs other than quoted prices that are observable for the assets or liabilities (such as interest rates, yield curves, volatilities, prepayment speeds, loss severities, credit risks, and default rates) or other market-corroborated inputs) |
|
|
|
| • | Level 3 — unobservable inputs based on the best information available in the circumstance, to the extent observable inputs are not available (including the Fund’s own assumption used in determining the fair value of investments) |
|
|
|
| The inputs or methodology used for valuing securities are not necessarily an indication of the risk associated with investing in those securities. For information about the Fund’s policy regarding valuation of investments and other significant accounting policies, please refer to Note 1 of the Notes to Financial Statements. | |
|
| |
The following table summarizes the inputs used as of January 31, 2009 in determining the fair valuation of the Fund’s investments: | ||
|
|
|
|
|
Valuation Inputs |
| Investments in |
| |
|
| Assets |
| |
|
| |||
Level 1 |
| $ | 79,839,519 |
|
Level 2 |
|
| 16,576,750 |
|
Level 3 |
|
| 16,891 |
|
Total |
| $ | 96,433,160 |
|
|
| |||
The following is a reconciliation of investments for unobservable inputs (Level 3) used in determining fair value:
|
|
|
|
|
|
| Investments in |
| |
Balance as of July 31, 2008 |
| $ | 25,019 |
|
Accrued discounts/premiums |
|
| — |
|
Realized gain (loss) |
|
| — |
|
Change in unrealized appreciation (depreciation)* |
|
| (8,128 | ) |
Net purchases (sales) |
|
| — |
|
Net transfers in/out of Level 3 |
|
| — |
|
Balance as of January 31, 2009 |
| $ | 16,891 |
|
|
| |||
|
|
* | Included in the related net change in unrealized appreciation/depreciation on the Statements of Operations. |
|
|
|
See Notes to Financial Statements. |
| |
20 | SEMI-ANNUAL REPORT | JANUARY 31, 2009 |
|
|
|
|
|
|
|
|
|
|
|
|
|
|
|
|
January 31, 2009 (Unaudited) |
| BlackRock |
| BlackRock |
| BlackRock |
| |||
Assets |
|
|
|
|
|
|
|
|
|
|
Investments at value — unaffiliated1,2 |
| $ | 2,823,695,964 |
| $ | 259,133,145 |
| $ | 89,425,381 |
|
Investments at value — affiliated3 |
|
| 605,386,695 |
|
| 17,632,773 |
|
| 7,007,779 |
|
Cash |
|
| — |
|
| — |
|
| 6,100 |
|
Foreign currency at value4 |
|
| 166,099 |
|
| 1,045,454 |
|
| 28,814 |
|
Unrealized appreciation on foreign currency exchange contracts |
|
| — |
|
| 858 |
|
| — |
|
Dividends receivable |
|
| 7,406,334 |
|
| 140,775 |
|
| 289,486 |
|
Investments sold receivable |
|
| — |
|
| 65,647 |
|
| 428,171 |
|
Capital shares sold receivable |
|
| 27,503,373 |
|
| 1,040,236 |
|
| 46,069 |
|
Interest receivable |
|
| — |
|
| 489 |
|
| — |
|
Prepaid expenses |
|
| 139,773 |
|
| 27,440 |
|
| 15,748 |
|
Securities lending income receivable — affiliated |
|
| 3,517 |
|
| 640 |
|
| — |
|
Other assets |
|
| 244,748 |
|
| — |
|
| 556 |
|
|
| |||||||||
Total assets |
|
| 3,464,546,503 |
|
| 279,087,457 |
|
| 97,248,104 |
|
|
| |||||||||
|
|
|
|
|
|
|
|
|
|
|
Liabilities |
|
|
|
|
|
|
|
|
|
|
Collateral at value — securities loaned |
|
| 3,579,600 |
|
| 1,636,800 |
|
| — |
|
Bank overdraft |
|
| 19,553 |
|
| — |
|
| — |
|
Capital shares redeemed payable |
|
| 7,001,765 |
|
| 668,356 |
|
| 111,868 |
|
Investments purchased payable |
|
| — |
|
| 1,354,300 |
|
| — |
|
Margin variation payable |
|
| 6,364,050 |
|
| — |
|
| — |
|
Investment advisory fees payable |
|
| 1,728,032 |
|
| 137,803 |
|
| 49,041 |
|
Other affiliates payable |
|
| 529,075 |
|
| 67,710 |
|
| 804 |
|
Distribution fees payable |
|
| 879,483 |
|
| 95,488 |
|
| 25,472 |
|
Officer’s and Directors’ fees payable |
|
| 527 |
|
| 41 |
|
| 55 |
|
Other liabilities |
|
| 20,498 |
|
| 3,191 |
|
| 101 |
|
Other accrued expenses payable |
|
| — |
|
| 128,596 |
|
| 56,045 |
|
|
| |||||||||
Total liabilities |
|
| 20,122,583 |
|
| 4,092,285 |
|
| 243,386 |
|
|
| |||||||||
Net Assets |
| $ | 3,444,423,920 |
| $ | 274,995,172 |
| $ | 97,004,718 |
|
|
| |||||||||
|
|
|
|
|
|
|
|
|
|
|
Net Assets Consist of |
|
|
|
|
|
|
|
|
|
|
Institutional Shares, $0.10 par value |
| $ | 8,691,952 |
| $ | 117,471 |
| $ | 163,654 |
|
Service Shares, $0.10 par value |
|
| 116,050 |
|
| — |
|
| — |
|
Investor A Shares, $0.10 par value |
|
| 13,809,346 |
|
| 443,189 |
|
| 648,905 |
|
Investor B Shares, $0.10 par value |
|
| 552,758 |
|
| 59,902 |
|
| 10,336 |
|
Investor B1 Shares, $0.10 par value |
|
| — |
|
| — |
|
| 48,322 |
|
Investor C Shares, $0.10 par value |
|
| 4,007,898 |
|
| 169,392 |
|
| 30,572 |
|
Investor C1 Shares, $0.10 par value |
|
| — |
|
| — |
|
| 82,979 |
|
Class R Shares, $0.10 par value |
|
| 1,086,216 |
|
| — |
|
| — |
|
Paid-in capital in excess of par |
|
| 4,734,609,405 |
|
| 213,214,361 |
|
| 89,242,971 |
|
Undistributed (accumulated) net investment income (loss) |
|
| 2,949,755 |
|
| (853,119 | ) |
| 84,504 |
|
Accumulated net realized loss |
|
| (300,573,554 | ) |
| (5,473,047 | ) |
| (3,501,241 | ) |
Net unrealized appreciation/depreciation |
|
| (1,020,825,906 | ) |
| 67,317,023 |
|
| 10,193,716 |
|
|
| |||||||||
Net Assets |
| $ | 3,444,423,920 |
| $ | 274,995,172 |
| $ | 97,004,718 |
|
|
| |||||||||
|
|
|
See Notes to Financial Statements. |
|
|
SEMI-ANNUAL REPORT | JANUARY 31, 2009 | 21 |
|
|
Statements of Assets and Liabilities (concluded) |
|
|
|
|
|
|
|
|
|
|
|
January 31, 2009 (Unaudited) |
| BlackRock |
| BlackRock |
| BlackRock |
| |||
Net Asset Value |
|
|
|
|
|
|
|
|
|
|
Institutional: |
|
|
|
|
|
|
|
|
|
|
Net assets |
| $ | 1,062,685,677 |
| $ | 42,615,116 |
| $ | 16,139,021 |
|
|
| |||||||||
Shares outstanding |
|
| 86,919,520 |
|
| 1,174,713 |
|
| 1,636,541 |
|
|
| |||||||||
Net asset value |
| $ | 12.23 |
| $ | 36.28 |
| $ | 9.86 |
|
|
| |||||||||
Shares authorized |
|
| Unlimited |
|
| Unlimited |
|
| 100,000,000 |
|
|
| |||||||||
Service: |
|
|
|
|
|
|
|
|
|
|
Net assets |
| $ | 14,164,730 |
|
| — |
|
| — |
|
|
| |||||||||
Shares outstanding |
|
| 1,160,502 |
|
| — |
|
| — |
|
|
| |||||||||
Net asset value |
| $ | 12.21 |
|
| — |
|
| — |
|
|
| |||||||||
Shares authorized |
|
| Unlimited |
|
| — |
|
| — |
|
|
| |||||||||
Investor A: |
|
|
|
|
|
|
|
|
|
|
Net assets |
| $ | 1,685,925,206 |
| $ | 157,612,181 |
| $ | 64,061,507 |
|
|
| |||||||||
Shares outstanding |
|
| 138,093,462 |
|
| 4,431,895 |
|
| 6,489,049 |
|
|
| |||||||||
Net asset value |
| $ | 12.21 |
| $ | 35.56 |
| $ | 9.87 |
|
|
| |||||||||
Shares authorized |
|
| Unlimited |
|
| Unlimited |
|
| 100,000,000 |
|
|
| |||||||||
Investor B: |
|
|
|
|
|
|
|
|
|
|
Net assets |
| $ | 67,836,857 |
| $ | 19,751,162 |
| $ | 1,012,434 |
|
|
| |||||||||
Shares outstanding |
|
| 5,527,584 |
|
| 599,023 |
|
| 103,362 |
|
|
| |||||||||
Net asset value |
| $ | 12.27 |
| $ | 32.97 |
| $ | 9.80 |
|
|
| |||||||||
Shares authorized |
|
| Unlimited |
|
| Unlimited |
|
| 100,000,000 |
|
|
| |||||||||
Investor B1: |
|
|
|
|
|
|
|
|
|
|
Net assets |
|
| — |
|
| — |
| $ | 4,766,582 |
|
|
| |||||||||
Shares outstanding |
|
| — |
|
| — |
|
| 483,223 |
|
|
| |||||||||
Net asset value |
|
| — |
|
| — |
| $ | 9.86 |
|
|
| |||||||||
Shares authorized |
|
| — |
|
| — |
|
| 100,000,000 |
|
|
| |||||||||
Investor C: |
|
|
|
|
|
|
|
|
|
|
Net assets |
| $ | 480,491,524 |
| $ | 55,016,713 |
| $ | 2,951,982 |
|
|
| |||||||||
Shares outstanding |
|
| 40,078,982 |
|
| 1,693,920 |
|
| 305,722 |
|
|
| |||||||||
Net asset value |
| $ | 11.99 |
| $ | 32.48 |
| $ | 9.66 |
|
|
| |||||||||
Shares authorized |
|
| Unlimited |
|
| Unlimited |
|
| 100,000,000 |
|
|
| |||||||||
Investor C1: |
|
|
|
|
|
|
|
|
|
|
Net assets |
|
| — |
|
| — |
| $ | 8,073,192 |
|
|
| |||||||||
Shares outstanding |
|
| — |
|
| — |
|
| 829,793 |
|
|
| |||||||||
Net asset value |
|
| — |
|
| — |
| $ | 9.73 |
|
|
| |||||||||
Shares authorized |
|
| — |
|
| — |
|
| 100,000,000 |
|
|
| |||||||||
Class R: |
|
|
|
|
|
|
|
|
|
|
Net assets |
| $ | 133,319,926 |
|
| — |
|
| — |
|
|
| |||||||||
Shares outstanding |
|
| 10,862,161 |
|
| — |
|
| — |
|
|
| |||||||||
Net asset value |
| $ | 12.27 |
|
| — |
|
| — |
|
|
| |||||||||
Shares authorized |
|
| Unlimited |
|
| — |
|
| — |
|
|
| |||||||||
1 Securities loaned — at value |
| $ | 3,185,844 |
| $ | 1,644,860 |
|
| — |
|
|
| |||||||||
2 Investments at cost — unaffiliated |
| $ | 3,827,126,772 |
| $ | 191,721,923 |
| $ | 79,220,295 |
|
|
| |||||||||
3 Investments at cost — affiliated |
| $ | 605,386,695 |
| $ | 17,632,773 |
| $ | 7,007,779 |
|
|
| |||||||||
4 Cost of foreign currency |
| $ | 172,200 |
| $ | 1,139,850 |
| $ | 29,056 |
|
|
| |||||||||
|
|
|
See Notes to Financial Statements. |
| |
22 | SEMI-ANNUAL REPORT | JANUARY 31, 2009 |
|
|
|
|
|
|
|
|
|
|
|
|
|
|
|
|
Six Months Ended January 31, 2009 (Unaudited) |
| BlackRock |
| BlackRock |
| BlackRock |
| |||
Investment Income |
|
|
|
|
|
|
|
|
|
|
Dividends |
| $ | 58,290,581 |
| $ | 2,290,776 |
| $ | 1,822,707 |
|
Foreign taxes withheld |
|
| (913,359 | ) |
| (104,656 | ) |
| (32,187 | ) |
Income — affiliated |
|
| 4,127,118 |
|
| 171,993 |
|
| 81,648 |
|
Securities lending — affiliated |
|
| 3,517 |
|
| 2,453 |
|
| — |
|
|
| |||||||||
Total income |
|
| 61,507,857 |
|
| 2,360,566 |
|
| 1,872,168 |
|
|
| |||||||||
|
|
|
|
|
|
|
|
|
|
|
Expenses |
|
|
|
|
|
|
|
|
|
|
Investment advisory |
|
| 10,456,082 |
|
| 1,064,938 |
|
| 338,234 |
|
Service — Service |
|
| 14,652 |
|
| — |
|
| — |
|
Service — Investor A |
|
| 2,068,294 |
|
| 249,693 |
|
| 92,016 |
|
Service and distribution — Investor B |
|
| 408,310 |
|
| 137,631 |
|
| 5,622 |
|
Service and distribution — Investor B1 |
|
| — |
|
| — |
|
| 23,781 |
|
Service and distribution — Investor C |
|
| 2,556,766 |
|
| 364,904 |
|
| 16,618 |
|
Service and distribution — Investor C1 |
|
| — |
|
| — |
|
| 38,602 |
|
Service and distribution — Class R |
|
| 305,916 |
|
| — |
|
| — |
|
Transfer agent — Institutional |
|
| 498,802 |
|
| 43,867 |
|
| 14,609 |
|
Transfer agent — Service |
|
| 4,210 |
|
| — |
|
| — |
|
Transfer agent — Investor A |
|
| 1,241,746 |
|
| 229,301 |
|
| 54,191 |
|
Transfer agent — Investor B |
|
| 80,520 |
|
| 27,853 |
|
| 1,974 |
|
Transfer agent — Investor B1 |
|
| — |
|
| — |
|
| 7,758 |
|
Transfer agent — Investor C |
|
| 371,481 |
|
| 96,305 |
|
| 4,961 |
|
Transfer agent — Investor C1 |
|
| — |
|
| — |
|
| 11,915 |
|
Transfer agent — Class R |
|
| 148,780 |
|
| — |
|
| — |
|
Accounting services |
|
| 256,008 |
|
| 91,219 |
|
| 48,883 | �� |
Registration |
|
| 145,878 |
|
| 34,452 |
|
| 29,305 |
|
Printing |
|
| 100,883 |
|
| 39,720 |
|
| 34,451 |
|
Custodian |
|
| 81,916 |
|
| 37,503 |
|
| 11,876 |
|
Professional |
|
| 59,062 |
|
| 32,529 |
|
| 34,334 |
|
Officer and Directors |
|
| 53,816 |
|
| 13,881 |
|
| 8,317 |
|
Miscellaneous |
|
| 58,640 |
|
| 20,552 |
|
| 15,061 |
|
|
| |||||||||
Total expenses |
|
| 18,911,762 |
|
| 2,484,348 |
|
| 792,508 |
|
Less fees waived by advisor |
|
| (14,447 | ) |
| — |
|
| — |
|
Less fees paid indirectly |
|
| (24 | ) |
| — |
|
| (381 | ) |
|
| |||||||||
Total expenses after fees paid indirectly |
|
| 18,897,291 |
|
| 2,484,348 |
|
| 792,127 |
|
|
| |||||||||
Net investment income (loss) |
|
| 42,610,566 |
|
| (123,782 | ) |
| 1,080,041 |
|
|
| |||||||||
|
|
|
|
|
|
|
|
|
|
|
Realized and Unrealized Gain (Loss) |
|
|
|
|
|
|
|
|
|
|
Net realized gain (loss) from: |
|
|
|
|
|
|
|
|
|
|
Investments |
|
| (281,430,396 | ) |
| (5,231,997 | ) |
| (3,496,829 | ) |
Futures |
|
| 1,255,484 |
|
| — |
|
| — |
|
Foreign currency |
|
| (330,876 | ) |
| (153,001 | ) |
| (4,404 | ) |
|
| |||||||||
|
|
| (280,505,788 | ) |
| (5,384,998 | ) |
| (3,501,233 | ) |
|
| |||||||||
Net change in unrealized appreciation/depreciation on: |
|
|
|
|
|
|
|
|
|
|
Investments |
|
| (1,091,077,842 | ) |
| (255,363,440 | ) |
| (38,462,487 | ) |
Futures |
|
| (17,386,679 | ) |
| — |
|
| — |
|
Foreign currency |
|
| (4,911 | ) |
| (87,006 | ) |
| (17,169 | ) |
|
| |||||||||
|
|
| (1,108,469,432 | ) |
| (255,450,446 | ) |
| (38,479,656 | ) |
|
| |||||||||
Total realized and unrealized loss |
|
| (1,388,975,220 | ) |
| (260,835,444 | ) |
| (41,980,889 | ) |
|
| |||||||||
Net Decrease in Net Assets Resulting from Operations |
| $ | (1,346,364,654 | ) | $ | (260,959,226 | ) | $ | (40,900,848 | ) |
|
| |||||||||
|
|
|
See Notes to Financial Statements. |
|
|
SEMI-ANNUAL REPORT | JANUARY 31, 2009 | 23 |
|
|
|
|
BlackRock Equity Dividend Fund | |
|
|
|
|
|
|
|
|
Increase (Decrease) in Net Assets: |
| Six Months |
| Year Ended |
| ||
Operations |
|
|
|
|
|
|
|
Net investment income |
| $ | 42,610,566 |
| $ | 46,943,999 |
|
Net realized gain (loss) |
|
| (280,505,788 | ) |
| 5,578,523 |
|
Net change in unrealized appreciation/depreciation |
|
| (1,108,469,432 | ) |
| (248,374,410 | ) |
|
| ||||||
Net decrease in net assets resulting from operations |
|
| (1,346,364,654 | ) |
| (195,851,888 | ) |
|
| ||||||
|
|
|
|
|
|
|
|
Dividends and Distributions to Shareholders From |
|
|
|
|
|
|
|
Net investment income: |
|
|
|
|
|
|
|
Institutional |
|
| (16,444,919 | ) |
| (15,441,977 | ) |
Service |
|
| (163,172 | ) |
| (109,472 | ) |
Investor A |
|
| (21,933,427 | ) |
| (19,224,018 | ) |
Investor B |
|
| (670,539 | ) |
| (916,440 | ) |
Investor C |
|
| (4,813,306 | ) |
| (4,804,460 | ) |
Class R |
|
| (1,475,300 | ) |
| (1,096,496 | ) |
Net realized gain: |
|
|
|
|
|
|
|
Institutional |
|
| — |
|
| (8,235,330 | ) |
Service |
|
| — |
|
| (44,839 | ) |
Investor A |
|
| — |
|
| (9,901,143 | ) |
Investor B |
|
| — |
|
| (1,420,001 | ) |
Investor C |
|
| — |
|
| (5,064,731 | ) |
Class R |
|
| — |
|
| (649,778 | ) |
Tax return on capital: |
|
|
|
|
|
|
|
Institutional |
|
| — |
|
| (561,389 | ) |
Service |
|
| — |
|
| (5,209 | ) |
Investor A |
|
| — |
|
| (862,842 | ) |
Investor B |
|
| — |
|
| (59,120 | ) |
Investor C |
|
| — |
|
| (311,826 | ) |
Class R |
|
| — |
|
| (58,930 | ) |
|
| ||||||
Decrease in net assets resulting from dividends and distributions to shareholders |
|
| (45,500,663 | ) |
| (68,768,001 | ) |
|
| ||||||
|
|
|
|
|
|
|
|
Capital Share Transactions |
|
|
|
|
|
|
|
Net increase in net assets derived from capital share transactions |
|
| 1,196,075,699 |
|
| 2,444,990,311 |
|
|
| ||||||
|
|
|
|
|
|
|
|
Net Assets |
|
|
|
|
|
|
|
Total increase (decrease) in net assets |
|
| (195,789,618 | ) |
| 2,180,370,422 |
|
Beginning of period |
|
| 3,640,213,538 |
|
| 1,459,843,116 |
|
|
| ||||||
End of period |
| $ | 3,444,423,920 |
| $ | 3,640,213,538 |
|
|
| ||||||
End of period undistributed net investment income |
| $ | 2,949,755 |
| $ | 5,839,852 |
|
|
| ||||||
|
|
|
See Notes to Financial Statements. | ||
24 | SEMI-ANNUAL REPORT | JANUARY 31, 2009 |
|
|
|
|
Statements of Changes in Net Assets | BlackRock Natural Resources Trust |
|
|
|
|
|
|
|
|
Increase (Decrease) in Net Assets: |
| Six Months |
| Year Ended |
| ||
Operations |
|
|
|
|
|
|
|
Net investment loss |
| $ | (123,782 | ) | $ | (1,222,538 | ) |
Net realized gain (loss) |
|
| (5,384,998 | ) |
| 12,832,260 |
|
Net change in unrealized appreciation/depreciation |
|
| (255,450,446 | ) |
| 56,616,414 |
|
|
| ||||||
Net increase (decrease) in net assets resulting from operations |
|
| (260,959,226 | ) |
| 68,226,136 |
|
|
| ||||||
|
|
|
|
|
|
|
|
Distributions to Shareholders From |
|
|
|
|
|
|
|
Net realized gain: |
|
|
|
|
|
|
|
Institutional |
|
| (844,577 | ) |
| (3,262,487 | ) |
Investor A |
|
| (3,222,416 | ) |
| (10,719,439 | ) |
Investor B |
|
| (481,269 | ) |
| (2,061,398 | ) |
Investor C |
|
| (1,286,378 | ) |
| (4,552,267 | ) |
|
| ||||||
Decrease in net assets resulting from distributions to shareholders |
|
| (5,834,640 | ) |
| (20,595,591 | ) |
|
| ||||||
|
|
|
|
|
|
|
|
Capital Share Transactions |
|
|
|
|
|
|
|
Net increase (decrease) in net assets derived from capital share transactions |
|
| (28,674,234 | ) |
| 66,681,498 |
|
|
| ||||||
|
|
|
|
|
|
|
|
Net Assets |
|
|
|
|
|
|
|
Total increase (decrease) in net assets |
|
| (295,468,100 | ) |
| 114,312,043 |
|
Beginning of period |
|
| 570,463,272 |
|
| 456,151,229 |
|
|
| ||||||
End of period |
| $ | 274,995,172 |
| $ | 570,463,272 |
|
|
| ||||||
End of period accumulated net investment loss |
| $ | (853,119 | ) | $ | (729,337 | ) |
|
| ||||||
|
|
|
See Notes to Financial Statements. |
|
|
SEMI-ANNUAL REPORT | JANUARY 31, 2009 | 25 |
|
|
|
|
Statements of Changes in Net Assets | BlackRock Utilities and Telecommunications Fund, Inc. |
|
|
|
|
|
|
|
|
|
|
|
Increase (Decrease) in Net Assets: |
| Six Months |
| Period |
| Year Ended |
| |||
Operations |
|
|
|
|
|
|
|
|
|
|
Net investment income |
| $ | 1,080,041 |
| $ | 1,862,789 |
| $ | 2,106,382 |
|
Net realized gain (loss) |
|
| (3,501,233 | ) |
| 4,319,972 |
|
| 16,158,803 |
|
Net change in unrealized appreciation/depreciation |
|
| (38,479,656 | ) |
| (24,001,737 | ) |
| 20,049,078 |
|
|
| |||||||||
Net increase (decrease) in net assets resulting from operations |
|
| (40,900,848 | ) |
| (17,818,976 | ) |
| 38,314,263 |
|
|
| |||||||||
|
|
|
|
|
|
|
|
|
|
|
Dividends and Distributions to Shareholders From |
|
|
|
|
|
|
|
|
|
|
Net investment income: |
|
|
|
|
|
|
|
|
|
|
Institutional |
|
| (245,582 | ) |
| (388,934 | ) |
| (454,751 | ) |
Investor A |
|
| (869,424 | ) |
| (1,323,321 | ) |
| (1,377,723 | ) |
Investor B |
|
| (7,287 | ) |
| (9,789 | ) |
| (7,234 | ) |
Investor B1 |
|
| (50,982 | ) |
| (86,659 | ) |
| (107,450 | ) |
Investor C |
|
| (24,215 | ) |
| (32,188 | ) |
| (16,756 | ) |
Investor C1 |
|
| (82,677 | ) |
| (115,141 | ) |
| (123,612 | ) |
Net realized gain: |
|
|
|
|
|
|
|
|
|
|
Institutional |
|
| (712,776 | ) |
| (2,457,512 | ) |
| — |
|
Investor A |
|
| (2,825,657 | ) |
| (9,478,659 | ) |
| — |
|
Investor B |
|
| (41,376 | ) |
| (118,768 | ) |
| — |
|
Investor B1 |
|
| (247,208 | ) |
| (1,113,505 | ) |
| — |
|
Investor C |
|
| (131,014 | ) |
| (321,936 | ) |
| — |
|
Investor C1 |
|
| (373,896 | ) |
| (1,383,322 | ) |
| — |
|
|
| |||||||||
Decrease in net assets resulting from dividends and distributions to shareholders |
|
| (5,612,094 | ) |
| (16,829,734 | ) |
| (2,087,526 | ) |
|
| |||||||||
|
|
|
|
|
|
|
|
|
|
|
Capital Share Transactions |
|
|
|
|
|
|
|
|
|
|
Net increase (decrease) in net assets derived from capital share transactions |
|
| (5,473,880 | ) |
| 4,451,326 |
|
| (13,368,045 | ) |
|
| |||||||||
|
|
|
|
|
|
|
|
|
|
|
Net Assets |
|
|
|
|
|
|
|
|
|
|
Total increase (decrease) in net assets |
|
| (51,986,822 | ) |
| (30,197,384 | ) |
| 22,858,692 |
|
Beginning of period |
|
| 148,991,540 |
|
| 179,188,924 |
|
| 156,330,232 |
|
|
| |||||||||
End of period |
| $ | 97,004,718 |
| $ | 148,991,540 |
| $ | 179,188,924 |
|
|
| |||||||||
End of period undistributed net investment income |
| $ | 84,504 |
| $ | 284,630 |
| $ | 389,829 |
|
|
| |||||||||
|
|
|
See Notes to Financial Statements. | ||
26 | SEMI-ANNUAL REPORT | JANUARY 31, 2009 |
|
|
|
|
BlackRock Equity Dividend Fund | |
|
|
|
|
|
|
|
|
|
|
|
|
|
|
|
|
|
|
|
|
|
| Institutional |
| ||||||||||||||||
|
| ||||||||||||||||||
|
| Six Months |
|
|
|
|
|
|
|
|
|
|
| ||||||
|
|
| Year Ended July 31, |
| |||||||||||||||
|
|
| |||||||||||||||||
|
|
| 2008 |
| 2007 |
| 2006 |
| 2005 |
| 2004 |
| |||||||
Per Share Operating Performance |
|
|
|
|
|
|
|
|
|
|
|
|
|
|
|
|
|
|
|
Net asset value, beginning of period |
| $ | 18.23 |
| $ | 19.57 |
| $ | 17.20 |
| $ | 15.32 |
| $ | 12.79 |
| $ | 10.94 |
|
|
| ||||||||||||||||||
Net investment income1 |
|
| 0.21 |
|
| 0.45 |
|
| 0.39 |
|
| 0.34 |
|
| 0.25 |
|
| 0.18 |
|
Net realized and unrealized gain (loss) |
|
| (6.00 | ) |
| (1.12 | ) |
| 2.60 |
|
| 1.88 |
|
| 2.52 |
|
| 1.85 |
|
|
| ||||||||||||||||||
Net increase (decrease) from investment operations |
|
| (5.79 | ) |
| (0.67 | ) |
| 2.99 |
|
| 2.22 |
|
| 2.77 |
|
| 2.03 |
|
|
| ||||||||||||||||||
Dividends and distributions from: |
|
|
|
|
|
|
|
|
|
|
|
|
|
|
|
|
|
|
|
Net investment income |
|
| (0.21 | ) |
| (0.39 | ) |
| (0.39 | ) |
| (0.31 | ) |
| (0.24 | ) |
| (0.18 | ) |
Net realized gain |
|
| — |
|
| (0.27 | ) |
| (0.23 | ) |
| (0.03 | ) |
| — |
|
| — |
|
Tax return of capital |
|
| — |
|
| (0.01 | ) |
| — |
|
| — |
|
| — |
|
| — |
|
|
| ||||||||||||||||||
Total dividends and distributions |
|
| (0.21 | ) |
| (0.67 | ) |
| (0.62 | ) |
| (0.34 | ) |
| (0.24 | ) |
| (0.18 | ) |
|
| ||||||||||||||||||
Net asset value, end of period |
| $ | 12.23 |
| $ | 18.23 |
| $ | 19.57 |
| $ | 17.20 |
| $ | 15.32 |
| $ | 12.79 |
|
|
| ||||||||||||||||||
|
|
|
|
|
|
|
|
|
|
|
|
|
|
|
|
|
|
|
|
Total Investment Return2 |
|
|
|
|
|
|
|
|
|
|
|
|
|
|
|
|
|
|
|
Based on net asset value |
|
| (31.82 | )%3 |
| (3.67 | )% |
| 17.68 | % |
| 14.68 | % |
| 21.78 | % |
| 18.66 | % |
|
| ||||||||||||||||||
|
|
|
|
|
|
|
|
|
|
|
|
|
|
|
|
|
|
|
|
Ratios to Average Net Assets |
|
|
|
|
|
|
|
|
|
|
|
|
|
|
|
|
|
|
|
Total expenses after waiver and fees paid indirectly |
|
| 0.73 | %4 |
| 0.74 | % |
| 0.76 | % |
| 0.82 | % |
| 0.87 | % |
| 0.92 | % |
|
| ||||||||||||||||||
Total expenses |
|
| 0.73 | %4 |
| 0.74 | % |
| 0.76 | % |
| 0.82 | % |
| 0.87 | % |
| 0.92 | % |
|
| ||||||||||||||||||
Net investment income |
|
| 2.80 | %4 |
| 2.31 | % |
| 2.08 | % |
| 2.10 | % |
| 1.76 | % |
| 1.51 | % |
|
| ||||||||||||||||||
|
|
|
|
|
|
|
|
|
|
|
|
|
|
|
|
|
|
|
|
Supplemental Data |
|
|
|
|
|
|
|
|
|
|
|
|
|
|
|
|
|
|
|
Net assets, end of period (000) |
| $ | 1,062,686 |
| $ | 1,107,277 |
| $ | 496,465 |
| $ | 276,433 |
| $ | 191,538 |
| $ | 120,151 |
|
|
| ||||||||||||||||||
Portfolio turnover |
|
| 4 | % |
| 2 | % |
| 9 | % |
| 2 | % |
| 4 | % |
| 8 | % |
|
| ||||||||||||||||||
|
|
|
| 1 | Based on average shares outstanding. |
|
|
|
| 2 | Total investment returns exclude the effects of any sales charges. |
|
|
|
| 3 | Aggregate total investment return. |
|
|
|
| 4 | Annualized. |
|
|
|
See Notes to Financial Statements. |
|
|
SEMI-ANNUAL REPORT | JANUARY 31, 2009 | 27 |
|
|
|
|
Financial Highlights (continued) | BlackRock Equity Dividend Fund |
|
|
|
|
|
|
|
|
|
|
|
|
| Service |
| |||||||
|
| |||||||||
|
| Six Months |
| Year |
| October 2, |
| |||
Per Share Operating Performance |
|
|
|
|
|
|
|
|
|
|
Net asset value, beginning of period |
| $ | 18.19 |
| $ | 19.55 |
| $ | 17.34 |
|
|
| |||||||||
Net investment income2 |
|
| 0.18 |
|
| 0.39 |
|
| 0.23 |
|
Net realized and unrealized gain (loss) |
|
| (5.97 | ) |
| (1.11 | ) |
| 2.56 |
|
|
| |||||||||
Net increase (decrease) from investment operations |
|
| (5.79 | ) |
| (0.72 | ) |
| 2.79 |
|
|
| |||||||||
Dividends and distributions from: |
|
|
|
|
|
|
|
|
|
|
Net investment income |
|
| (0.19 | ) |
| (0.36 | ) |
| (0.35 | ) |
Net realized gain |
|
| — |
|
| (0.27 | ) |
| (0.23 | ) |
Tax return of capital |
|
| — |
|
| (0.01 | ) |
| — |
|
|
| |||||||||
Total dividends and distributions |
|
| (0.19 | ) |
| (0.64 | ) |
| (0.58 | ) |
|
| |||||||||
Net asset value, end of period |
| $ | 12.21 |
| $ | 18.19 |
| $ | 19.55 |
|
|
| |||||||||
|
|
|
|
|
|
|
|
|
|
|
Total Investment Return |
|
|
|
|
|
|
|
|
|
|
Based on net asset value |
|
| (31.87 | )%3 |
| (3.93 | )% |
| 16.42 | %3 |
|
| |||||||||
|
|
|
|
|
|
|
|
|
|
|
Ratios to Average Net Assets |
|
|
|
|
|
|
|
|
|
|
Total expenses after waiver and fees paid indirectly |
|
| 0.97 | %4 |
| 0.99 | % |
| 1.02 | %4 |
|
| |||||||||
Total expenses |
|
| 0.97 | %4 |
| 0.99 | % |
| 1.02 | %4 |
|
| |||||||||
Net investment income |
|
| 2.55 | %4 |
| 2.02 | % |
| 1.60 | %4 |
|
| |||||||||
|
|
|
|
|
|
|
|
|
|
|
Supplemental Data |
|
|
|
|
|
|
|
|
|
|
Net assets, end of period (000) |
| $ | 14,165 |
| $ | 9,688 |
| $ | 1,642 |
|
|
| |||||||||
Portfolio turnover |
|
| 4 | % |
| 2 | % |
| 9 | % |
|
| |||||||||
|
|
|
| 1 | Commencement of operations. |
| 2 | Based on average shares outstanding. |
| 3 | Aggregate total investment return. |
| 4 | Annualized. |
|
|
|
See Notes to Financial Statements. | ||
28 | SEMI-ANNUAL REPORT | JANUARY 31, 2009 |
|
|
|
|
Financial Highlights (continued) | BlackRock Equity Dividend Fund |
|
|
|
|
|
|
|
|
|
|
|
|
|
|
|
|
|
|
|
|
|
| Investor A |
| ||||||||||||||||
|
| ||||||||||||||||||
|
| Six Months |
|
|
|
|
|
|
|
|
|
|
| ||||||
|
|
| Year Ended July 31, |
| |||||||||||||||
|
|
| |||||||||||||||||
|
|
| 2008 |
| 2007 |
| 2006 |
| 2005 |
| 2004 |
| |||||||
Per Share Operating Performance |
|
|
|
|
|
|
|
|
|
|
|
|
|
|
|
|
|
|
|
Net asset value, beginning of period |
| $ | 18.20 |
| $ | 19.55 |
| $ | 17.19 |
| $ | 15.31 |
| $ | 12.78 |
| $ | 10.94 |
|
|
| ||||||||||||||||||
Net investment income1 |
|
| 0.18 |
|
| 0.39 |
|
| 0.34 |
|
| 0.30 |
|
| 0.21 |
|
| 0.15 |
|
Net realized and unrealized gain (loss) |
|
| (5.98 | ) |
| (1.12 | ) |
| 2.59 |
|
| 1.89 |
|
| 2.52 |
|
| 1.84 |
|
|
| ||||||||||||||||||
Net increase (decrease) from investment operations |
|
| (5.80 | ) |
| (0.73 | ) |
| 2.93 |
|
| 2.19 |
|
| 2.73 |
|
| 1.99 |
|
|
| ||||||||||||||||||
Dividends and distributions from: |
|
|
|
|
|
|
|
|
|
|
|
|
|
|
|
|
|
|
|
Net investment income |
|
| (0.19 | ) |
| (0.34 | ) |
| (0.34 | ) |
| (0.28 | ) |
| (0.20 | ) |
| (0.15 | ) |
Net realized gain |
|
| — |
|
| (0.27 | ) |
| (0.23 | ) |
| (0.03 | ) |
| — |
|
| — |
|
Tax return of capital |
|
| — |
|
| (0.01 | ) |
| — |
|
| — |
|
| — |
|
| — |
|
|
| ||||||||||||||||||
Total dividends and distributions |
|
| (0.19 | ) |
| (0.62 | ) |
| (0.57 | ) |
| (0.31 | ) |
| (0.20 | ) |
| (0.15 | ) |
|
| ||||||||||||||||||
Net asset value, end of period |
| $ | 12.21 |
| $ | 18.20 |
| $ | 19.55 |
| $ | 17.19 |
| $ | 15.31 |
| $ | 12.78 |
|
|
| ||||||||||||||||||
|
|
|
|
|
|
|
|
|
|
|
|
|
|
|
|
|
|
|
|
Total Investment Return2 |
|
|
|
|
|
|
|
|
|
|
|
|
|
|
|
|
|
|
|
Based on net asset value |
|
| (31.93 | )%3 |
| (3.94 | )% |
| 17.35 | % |
| 14.42 | % |
| 21.51 | % |
| 18.28 | % |
|
| ||||||||||||||||||
|
|
|
|
|
|
|
|
|
|
|
|
|
|
|
|
|
|
|
|
Ratios to Average Net Assets |
|
|
|
|
|
|
|
|
|
|
|
|
|
|
|
|
|
|
|
Total expenses after waiver and fees paid indirectly |
|
| 1.04 | %4 |
| 1.02 | % |
| 1.03 | % |
| 1.07 | % |
| 1.12 | % |
| 1.17 | % |
|
| ||||||||||||||||||
Total expenses |
|
| 1.04 | %4 |
| 1.02 | % |
| 1.03 | % |
| 1.07 | % |
| 1.12 | % |
| 1.17 | % |
|
| ||||||||||||||||||
Net investment income |
|
| 2.48 | %4 |
| 2.01 | % |
| 1.80 | % |
| 1.85 | % |
| 1.51 | % |
| 1.26 | % |
|
| ||||||||||||||||||
|
|
|
|
|
|
|
|
|
|
|
|
|
|
|
|
|
|
|
|
Supplemental Data |
|
|
|
|
|
|
|
|
|
|
|
|
|
|
|
|
|
|
|
Net assets, end of period (000) |
| $ | 1,685,925 |
| $ | 1,733,008 |
| $ | 531,661 |
| $ | 278,233 |
| $ | 185,675 |
| $ | 128,068 |
|
|
| ||||||||||||||||||
Portfolio turnover |
|
| 4 | % |
| 2 | % |
| 9 | % |
| 2 | % |
| 4 | % |
| 8 | % |
|
| ||||||||||||||||||
|
|
|
| 1 | Based on average shares outstanding. |
|
|
|
| 2 | Total investment returns exclude the effects of sales charges. |
|
|
|
| 3 | Aggregate total investment return. |
|
|
|
| 4 | Annualized. |
|
|
|
See Notes to Financial Statements. |
|
|
SEMI-ANNUAL REPORT | JANUARY 31, 2009 | 29 |
|
|
|
|
Financial Highlights (continued) | BlackRock Equity Dividend Fund |
|
|
|
|
|
|
|
|
|
|
|
|
|
|
|
|
|
|
|
|
|
| Investor B |
| ||||||||||||||||
|
| ||||||||||||||||||
|
| Six Months |
|
|
|
|
|
|
|
|
|
|
| ||||||
|
|
| Year Ended July 31, |
| |||||||||||||||
|
|
| |||||||||||||||||
|
|
| 2008 |
| 2007 |
| 2006 |
| 2005 |
| 2004 |
| |||||||
Per Share Operating Performance |
|
|
|
|
|
|
|
|
|
|
|
|
|
|
|
|
|
|
|
Net asset value, beginning of period |
| $ | 18.27 |
| $ | 19.62 |
| $ | 17.24 |
| $ | 15.36 |
| $ | 12.83 |
| $ | 10.97 |
|
|
| ||||||||||||||||||
Net investment income1 |
|
| 0.13 |
|
| 0.26 |
|
| 0.20 |
|
| 0.18 |
|
| 0.11 |
|
| 0.06 |
|
Net realized and unrealized gain (loss) |
|
| (6.01 | ) |
| (1.16 | ) |
| 2.60 |
|
| 1.88 |
|
| 2.52 |
|
| 1.86 |
|
|
| ||||||||||||||||||
Net increase (decrease) from investment operations |
|
| (5.88 | ) |
| (0.90 | ) |
| 2.80 |
|
| 2.06 |
|
| 2.63 |
|
| 1.92 |
|
|
| ||||||||||||||||||
Dividends and distributions from: |
|
|
|
|
|
|
|
|
|
|
|
|
|
|
|
|
|
|
|
Net investment income |
|
| (0.12 | ) |
| (0.17 | ) |
| (0.19 | ) |
| (0.15 | ) |
| (0.10 | ) |
| (0.06 | ) |
Net realized gain |
|
| — |
|
| (0.27 | ) |
| (0.23 | ) |
| (0.03 | ) |
| — |
|
| — |
|
Tax return of capital |
|
| — |
|
| (0.01 | ) |
| — |
|
| — |
|
| — |
|
| — |
|
|
| ||||||||||||||||||
Total dividends and distributions |
|
| (0.12 | ) |
| (0.45 | ) |
| (0.42 | ) |
| (0.18 | ) |
| (0.10 | ) |
| (0.06 | ) |
|
| ||||||||||||||||||
Net asset value, end of period |
| $ | 12.27 |
| $ | 18.27 |
| $ | 19.62 |
| $ | 17.24 |
| $ | 15.36 |
| $ | 12.83 |
|
|
| ||||||||||||||||||
|
|
|
|
|
|
|
|
|
|
|
|
|
|
|
|
|
|
|
|
Total Investment Return2 |
|
|
|
|
|
|
|
|
|
|
|
|
|
|
|
|
|
|
|
Based on net asset value |
|
| (32.21 | )%3 |
| (4.75 | )% |
| 16.50 | % |
| 13.48 | % |
| 20.52 | % |
| 17.52 | % |
|
| ||||||||||||||||||
|
|
|
|
|
|
|
|
|
|
|
|
|
|
|
|
|
|
|
|
Ratios to Average Net Assets |
|
|
|
|
|
|
|
|
|
|
|
|
|
|
|
|
|
|
|
Total expenses after waiver and fees paid indirectly |
|
| 1.84 | %4 |
| 1.80 | % |
| 1.82 | % |
| 1.84 | % |
| 1.89 | % |
| 1.94 | % |
|
| ||||||||||||||||||
Total expenses |
|
| 1.84 | %4 |
| 1.80 | % |
| 1.82 | % |
| 1.84 | % |
| 1.89 | % |
| 1.94 | % |
|
| ||||||||||||||||||
Net investment income |
|
| 1.72 | %4 |
| 1.31 | % |
| 1.05 | % |
| 1.09 | % |
| 0.75 | % |
| 0.49 | % |
|
| ||||||||||||||||||
|
|
|
|
|
|
|
|
|
|
|
|
|
|
|
|
|
|
|
|
Supplemental Data |
|
|
|
|
|
|
|
|
|
|
|
|
|
|
|
|
|
|
|
Net assets, end of period (000) |
| $ | 67,837 |
| $ | 100,597 |
| $ | 102,810 |
| $ | 83,643 |
| $ | 78,548 |
| $ | 62,608 |
|
|
| ||||||||||||||||||
Portfolio turnover |
|
| 4 | % |
| 2 | % |
| 9 | % |
| 2 | % |
| 4 | % |
| 8 | % |
|
| ||||||||||||||||||
|
|
|
| 1 | Based on average shares outstanding. |
|
|
|
| 2 | Total investment returns exclude the effects of sales charges. |
|
|
|
| 3 | Aggregate total investment return. |
|
|
|
| 4 | Annualized. |
|
|
|
See Notes to Financial Statements. | ||
30 | SEMI-ANNUAL REPORT | JANUARY 31, 2009 |
|
|
|
|
Financial Highlights (continued) | BlackRock Equity Dividend Fund |
|
|
|
|
|
|
|
|
|
|
|
|
|
|
|
|
|
|
|
|
|
| Investor C |
| ||||||||||||||||
|
| ||||||||||||||||||
|
| Six Months |
|
|
|
|
|
|
|
|
|
|
|
|
|
|
|
| |
|
|
|
|
|
|
|
|
|
|
|
|
|
|
|
|
|
| ||
|
|
| Year Ended July 31, |
| |||||||||||||||
|
|
| |||||||||||||||||
|
|
| 2008 |
| 2007 |
| 2006 |
| 2005 |
| 2004 |
| |||||||
Per Share Operating Performance |
|
|
|
|
|
|
|
|
|
|
|
|
|
|
|
|
|
|
|
Net asset value, beginning of period |
| $ | 17.87 |
| $ | 19.22 |
| $ | 16.92 |
| $ | 15.08 |
| $ | 12.60 |
| $ | 10.79 |
|
|
| ||||||||||||||||||
Net investment income1 |
|
| 0.13 |
|
| 0.25 |
|
| 0.19 |
|
| 0.17 |
|
| 0.10 |
|
| 0.06 |
|
Net realized and unrealized gain (loss) |
|
| (5.88 | ) |
| (1.11 | ) |
| 2.56 |
|
| 1.86 |
|
| 2.49 |
|
| 1.81 |
|
|
| ||||||||||||||||||
Net increase (decrease) from investment operations |
|
| (5.75 | ) |
| (0.86 | ) |
| 2.75 |
|
| 2.03 |
|
| 2.59 |
|
| 1.87 |
|
|
| ||||||||||||||||||
Dividends and distributions from: |
|
|
|
|
|
|
|
|
|
|
|
|
|
|
|
|
|
|
|
Net investment income |
|
| (0.13 | ) |
| (0.21 | ) |
| (0.22 | ) |
| (0.16 | ) |
| (0.11 | ) |
| (0.06 | ) |
Net realized gain |
|
| — |
|
| (0.27 | ) |
| (0.23 | ) |
| (0.03 | ) |
| — |
|
| — |
|
Tax return of capital |
|
| — |
|
| (0.01 | ) |
| — |
|
| — |
|
| — |
|
| — |
|
|
| ||||||||||||||||||
Total dividends and distributions |
|
| (0.13 | ) |
| (0.49 | ) |
| (0.45 | ) |
| (0.19 | ) |
| (0.11 | ) |
| (0.06 | ) |
|
| ||||||||||||||||||
Net asset value, end of period |
| $ | 11.99 |
| $ | 17.87 |
| $ | 19.22 |
| $ | 16.92 |
| $ | 15.08 |
| $ | 12.60 |
|
|
| ||||||||||||||||||
|
|
|
|
|
|
|
|
|
|
|
|
|
|
|
|
|
|
|
|
Total Investment Return2 |
|
|
|
|
|
|
|
|
|
|
|
|
|
|
|
|
|
|
|
Based on net asset value |
|
| (32.20 | )%3 |
| (4.67 | )% |
| 16.50 | % |
| 13.56 | % |
| 20.58 | % |
| 17.40 | % |
|
| ||||||||||||||||||
|
|
|
|
|
|
|
|
|
|
|
|
|
|
|
|
|
|
|
|
Ratios to Average Net Assets |
|
|
|
|
|
|
|
|
|
|
|
|
|
|
|
|
|
|
|
Total expenses after waiver and fees paid indirectly |
|
| 1.78 | %4 |
| 1.76 | % |
| 1.78 | % |
| 1.84 | % |
| 1.89 | % |
| 1.94 | % |
|
| ||||||||||||||||||
Total expenses |
|
| 1.78 | %4 |
| 1.76 | % |
| 1.78 | % |
| 1.84 | % |
| 1.89 | % |
| 1.94 | % |
|
| ||||||||||||||||||
Net investment income |
|
| 1.75 | %4 |
| 1.31 | % |
| 1.04 | % |
| 1.09 | % |
| 0.74 | % |
| 0.48 | % |
|
| ||||||||||||||||||
|
|
|
|
|
|
|
|
|
|
|
|
|
|
|
|
|
|
|
|
Supplemental Data |
|
|
|
|
|
|
|
|
|
|
|
|
|
|
|
|
|
|
|
Net assets, end of period (000) |
| $ | 480,492 |
| $ | 570,963 |
| $ | 295,005 |
| $ | 135,557 |
| $ | 81,489 |
| $ | 43,287 |
|
|
| ||||||||||||||||||
Portfolio turnover |
|
| 4 | % |
| 2 | % |
| 9 | % |
| 2 | % |
| 4 | % |
| 8 | % |
|
| ||||||||||||||||||
|
|
|
| 1 | Based on average shares outstanding. |
|
|
|
| 2 | Total investment returns exclude the effects of sales charges. |
|
|
|
| 3 | Aggregate total investment return. |
|
|
|
| 4 | Annualized. |
|
|
|
See Notes to Financial Statements. |
|
|
SEMI-ANNUAL REPORT | JANUARY 31, 2009 | 31 |
|
|
|
|
Financial Highlights (continued) | BlackRock Equity Dividend Fund |
|
|
|
|
|
|
|
|
|
|
|
|
|
|
|
|
|
|
|
|
|
| Class R |
| ||||||||||||||||
|
| ||||||||||||||||||
|
| Six Months |
|
|
|
|
|
|
|
|
|
|
|
|
|
|
|
| |
|
|
|
|
|
|
|
|
|
|
|
|
|
|
|
|
|
| ||
|
|
| Year Ended July 31, |
| |||||||||||||||
|
|
| |||||||||||||||||
|
|
| 2008 |
| 2007 |
| 2006 |
| 2005 |
| 2004 |
| |||||||
Per Share Operating Performance |
|
|
|
|
|
|
|
|
|
|
|
|
|
|
|
|
|
|
|
Net asset value, beginning of period |
| $ | 18.29 |
| $ | 19.66 |
| $ | 17.30 |
| $ | 15.41 |
| $ | 12.87 |
| $ | 11.02 |
|
|
| ||||||||||||||||||
Net investment income1 |
|
| 0.16 |
|
| 0.33 |
|
| 0.27 |
|
| 0.27 |
|
| 0.19 |
|
| 0.07 |
|
Net realized and unrealized gain (loss) |
|
| (6.01 | ) |
| (1.13 | ) |
| 2.61 |
|
| 1.89 |
|
| 2.54 |
|
| 1.91 |
|
|
| ||||||||||||||||||
Net increase (decrease) from investment operations |
|
| (5.85 | ) |
| (0.80 | ) |
| 2.88 |
|
| 2.16 |
|
| 2.73 |
|
| 1.98 |
|
|
| ||||||||||||||||||
Dividends and distributions from: |
|
|
|
|
|
|
|
|
|
|
|
|
|
|
|
|
|
|
|
Net investment income |
|
| (0.17 | ) |
| (0.29 | ) |
| (0.29 | ) |
| (0.24 | ) |
| (0.19 | ) |
| (0.13 | ) |
Net realized gain |
|
| — |
|
| (0.27 | ) |
| (0.23 | ) |
| (0.03 | ) |
| — |
|
| — |
|
Tax return of capital |
|
| — |
|
| (0.01 | ) |
| — |
|
| — |
|
| — |
|
| — |
|
|
| ||||||||||||||||||
Total dividends and distributions |
|
| (0.17 | ) |
| (0.57 | ) |
| (0.52 | ) |
| (0.27 | ) |
| (0.19 | ) |
| (0.13 | ) |
|
| ||||||||||||||||||
Net asset value, end of period |
| $ | 12.27 |
| $ | 18.29 |
| $ | 19.66 |
| $ | 17.30 |
| $ | 15.41 |
| $ | 12.87 |
|
|
| ||||||||||||||||||
|
|
|
|
|
|
|
|
|
|
|
|
|
|
|
|
|
|
|
|
Total Investment Return |
|
|
|
|
|
|
|
|
|
|
|
|
|
|
|
|
|
|
|
Based on net asset value |
|
| (32.05 | )%2 |
| (4.26 | )% |
| 16.96 | % |
| 14.18 | % |
| 21.31 | % |
| 18.19 | % |
|
| ||||||||||||||||||
|
|
|
|
|
|
|
|
|
|
|
|
|
|
|
|
|
|
|
|
Ratios to Average Net Assets |
|
|
|
|
|
|
|
|
|
|
|
|
|
|
|
|
|
|
|
Total expenses after waiver and fees paid indirectly |
|
| 1.36 | %3 |
| 1.33 | % |
| 1.36 | % |
| 1.32 | % |
| 1.29 | % |
| 1.33 | % |
|
| ||||||||||||||||||
Total expenses |
|
| 1.38 | %3 |
| 1.34 | % |
| 1.37 | % |
| 1.32 | % |
| 1.29 | % |
| 1.33 | % |
|
| ||||||||||||||||||
Net investment income |
|
| 2.15 | %3 |
| 1.68 | % |
| 1.41 | % |
| 1.61 | % |
| 1.32 | % |
| 1.05 | % |
|
| ||||||||||||||||||
|
|
|
|
|
|
|
|
|
|
|
|
|
|
|
|
|
|
|
|
Supplemental Data |
|
|
|
|
|
|
|
|
|
|
|
|
|
|
|
|
|
|
|
Net assets, end of period (000) |
| $ | 133,320 |
| $ | 118,681 |
| $ | 32,259 |
| $ | 10,204 |
| $ | 2,809 |
| $ | 741 |
|
|
| ||||||||||||||||||
Portfolio turnover |
|
| 4 | % |
| 2 | % |
| 9 | % |
| 2 | % |
| 4 | % |
| 8 | % |
|
| ||||||||||||||||||
|
|
|
| 1 | Based on average shares outstanding. |
|
|
|
| 2 | Aggregate total investment return. |
|
|
|
| 3 | Annualized. |
|
|
|
See Notes to Financial Statements. | ||
32 | SEMI-ANNUAL REPORT | JANUARY 31, 2009 |
|
|
|
|
Financial Highlights (continued) | BlackRock Natural Resources Trust |
|
|
|
|
|
|
|
|
|
|
|
|
|
|
|
|
|
|
|
|
|
| Institutional |
| ||||||||||||||||
|
| ||||||||||||||||||
|
| Six Months |
|
|
|
|
|
|
|
|
|
|
|
|
|
|
|
| |
|
|
|
|
|
|
|
|
|
|
|
|
|
|
|
|
|
| ||
|
|
| Year Ended July 31, |
| |||||||||||||||
|
|
| |||||||||||||||||
|
|
| 2008 |
| 2007 |
| 2006 |
| 2005 |
| 2004 |
| |||||||
Per Share Operating Performance |
|
|
|
|
|
|
|
|
|
|
|
|
|
|
|
|
|
|
|
Net asset value, beginning of period |
| $ | 71.61 |
| $ | 63.83 |
| $ | 55.85 |
| $ | 44.93 |
| $ | 29.22 |
| $ | 21.25 |
|
|
| ||||||||||||||||||
Net investment income1 |
|
| 0.10 |
|
| 0.17 |
|
| 0.17 |
|
| 0.16 |
|
| 0.02 |
|
| — | 2 |
Net realized and unrealized gain (loss) |
|
| (34.64 | ) |
| 10.48 |
|
| 10.65 |
|
| 11.09 |
|
| 15.69 |
|
| 7.97 |
|
|
| ||||||||||||||||||
Net increase (decrease) from investment operations |
|
| (34.54 | ) |
| 10.65 |
|
| 10.82 |
|
| 11.25 |
|
| 15.71 |
|
| 7.97 |
|
|
| ||||||||||||||||||
Distributions from net realized gain |
|
| (0.79 | ) |
| (2.87 | ) |
| (2.84 | ) |
| (0.33 | ) |
| — |
|
| — |
|
|
| ||||||||||||||||||
Net asset value, end of period |
| $ | 36.28 |
| $ | 71.61 |
| $ | 63.83 |
| $ | 55.85 |
| $ | 44.93 |
| $ | 29.22 |
|
|
| ||||||||||||||||||
|
|
|
|
|
|
|
|
|
|
|
|
|
|
|
|
|
|
|
|
Total Investment Return3 |
|
|
|
|
|
|
|
|
|
|
|
|
|
|
|
|
|
|
|
Based on net asset value |
|
| (48.23 | )%4 |
| 16.86 | % |
| 20.98 | % |
| 25.10 | % |
| 53.76 | % |
| 37.51 | % |
|
| ||||||||||||||||||
|
|
|
|
|
|
|
|
|
|
|
|
|
|
|
|
|
|
|
|
Ratios to Average Net Assets |
|
|
|
|
|
|
|
|
|
|
|
|
|
|
|
|
|
|
|
Total expenses |
|
| 0.91 | %5 |
| 0.80 | % |
| 0.83 | % |
| 0.82 | % |
| 0.91 | % |
| 1.00 | % |
|
| ||||||||||||||||||
Net investment income |
|
| 0.42 | %5 |
| 0.23 | % |
| 0.32 | % |
| 0.31 | % |
| 0.05 | % |
| 0.02 | % |
|
| ||||||||||||||||||
|
|
|
|
|
|
|
|
|
|
|
|
|
|
|
|
|
|
|
|
Supplemental Data |
|
|
|
|
|
|
|
|
|
|
|
|
|
|
|
|
|
|
|
Net assets, end of period (000) |
| $ | 42,615 |
| $ | 87,353 |
| $ | 69,739 |
| $ | 75,429 |
| $ | 52,148 |
| $ | 35,088 |
|
|
| ||||||||||||||||||
Portfolio turnover |
|
| 1 | % |
| 4 | % |
| 6 | % |
| 10 | % |
| 11 | % |
| 11 | % |
|
| ||||||||||||||||||
|
|
|
| 1 | Based on average shares outstanding. |
|
|
|
| 2 | Amount is less than $0.01 per share. |
|
|
|
| 3 | Total investment returns exclude the effect of any sales charges. |
|
|
|
| 4 | Aggregate total investment return. |
|
|
|
| 5 | Annualized. |
|
|
|
See Notes to Financial Statements. |
|
|
SEMI-ANNUAL REPORT | JANUARY 31, 2009 | 33 |
|
|
|
|
Financial Highlights (continued) | BlackRock Natural Resources Trust |
|
|
|
|
|
|
|
|
|
|
|
|
|
|
|
|
|
|
|
|
|
| Investor A |
| ||||||||||||||||
|
| ||||||||||||||||||
|
| Six Months |
|
|
| ||||||||||||||
|
|
| Year Ended July 31, |
| |||||||||||||||
|
|
| |||||||||||||||||
|
|
| 2008 |
| 2007 |
| 2006 |
| 2005 |
| 2004 |
| |||||||
Per Share Operating Performance |
|
|
|
|
|
|
|
|
|
|
|
|
|
|
| ||||
Net asset value, beginning of period |
| $ | 70.34 |
| $ | 62.73 |
| $ | 54.94 |
| $ | 44.32 |
| $ | 28.89 |
| $ | 21.06 |
|
|
| ||||||||||||||||||
Net investment income (loss)1 |
|
| 0.02 |
|
| (0.02 | ) |
| 0.03 |
|
| 0.03 |
|
| (0.07 | ) |
| (0.06 | ) |
Net realized and unrealized gain (loss) |
|
| (34.01 | ) |
| 10.32 |
|
| 10.48 |
|
| 10.92 |
|
| 15.50 |
|
| 7.89 |
|
|
| ||||||||||||||||||
Net increase (decrease) from investment operations |
|
| (33.99 | ) |
| 10.30 |
|
| 10.51 |
|
| 10.95 |
|
| 15.43 |
|
| 7.83 |
|
|
| ||||||||||||||||||
Distributions from net realized gain |
|
| (0.79 | ) |
| (2.69 | ) |
| (2.72 | ) |
| (0.33 | ) |
| — |
|
| — |
|
|
| ||||||||||||||||||
Net asset value, end of period |
| $ | 35.56 |
| $ | 70.34 |
| $ | 62.73 |
| $ | 54.94 |
| $ | 44.32 |
| $ | 28.89 |
|
|
| ||||||||||||||||||
|
|
|
|
|
|
|
|
|
|
|
|
|
|
|
|
|
|
|
|
Total Investment Return2 |
|
|
|
|
|
|
|
|
|
|
|
|
|
|
|
|
| ||
Based on net asset value |
|
| (48.32 | )%3 |
| 16.57 | % |
| 20.66 | % |
| 24.77 | % |
| 53.41 | % |
| 37.18 | % |
|
| ||||||||||||||||||
|
|
|
|
|
|
|
|
|
|
|
|
|
|
|
|
|
|
|
|
Ratios to Average Net Assets |
|
|
|
|
|
|
|
|
|
|
|
|
|
|
|
|
| ||
Total expenses |
|
| 1.23 | %4 |
| 1.06 | % |
| 1.08 | % |
| 1.07 | % |
| 1.16 | % |
| 1.25 | % |
|
| ||||||||||||||||||
Net investment income (loss) |
|
| 0.10 | %4 |
| (0.03 | )% |
| 0.05 | % |
| 0.05 | % |
| (0.20 | )% |
| (0.23 | )% |
|
| ||||||||||||||||||
|
|
|
|
|
|
|
|
|
|
|
|
|
|
|
|
|
|
|
|
Supplemental Data |
|
|
|
|
|
|
|
|
|
|
|
|
|
|
|
|
|
|
|
Net assets, end of period (000) |
| $ | 157,612 |
| $ | 317,892 |
| $ | 239,916 |
| $ | 208,789 |
| $ | 136,740 |
| $ | 77,035 |
|
|
| ||||||||||||||||||
Portfolio turnover |
|
| 1 | % |
| 4 | % |
| 6 | % |
| 10 | % |
| 11 | % |
| 11 | % |
|
| ||||||||||||||||||
|
|
|
| 1 | Based on average shares outstanding. |
|
|
|
| 2 | Total investment returns exclude the effect of sales charges. |
|
|
|
| 3 | Aggregate total investment return. |
|
|
|
| 4 | Annualized. |
|
|
|
See Notes to Financial Statements. |
| |
34 | SEMI-ANNUAL REPORT | JANUARY 31, 2009 |
|
|
|
|
Financial Highlights (continued) | BlackRock Natural Resources Trust |
|
|
|
|
|
|
|
|
|
|
|
|
|
|
|
|
|
|
|
|
|
| Investor B |
| ||||||||||||||||
|
| ||||||||||||||||||
|
| Six Months |
|
|
| ||||||||||||||
|
|
| Year Ended July 31, |
| |||||||||||||||
|
|
| |||||||||||||||||
|
|
| 2008 |
| 2007 |
| 2006 |
| 2005 |
| 2004 |
| |||||||
Per Share Operating Performance |
|
|
|
|
|
|
|
|
|
|
|
|
|
|
|
| |||
Net asset value, beginning of period |
| $ | 65.57 |
| $ | 59.05 |
| $ | 52.23 |
| $ | 42.47 |
| $ | 27.90 |
| $ | 20.49 |
|
|
| ||||||||||||||||||
Net investment loss1 |
|
| (0.13 | ) |
| (0.51 | ) |
| (0.35 | ) |
| (0.35 | ) |
| (0.32 | ) |
| (0.25 | ) |
Net realized and unrealized gain (loss) |
|
| (31.68 | ) |
| 9.70 |
|
| 9.85 |
|
| 10.44 |
|
| 14.89 |
|
| 7.66 |
|
|
| ||||||||||||||||||
Net increase (decrease) from investment operations |
|
| (31.81 | ) |
| 9.19 |
|
| 9.50 |
|
| 10.09 |
|
| 14.57 |
|
| 7.41 |
|
|
| ||||||||||||||||||
Distributions from net realized gain |
|
| (0.79 | ) |
| (2.67 | ) |
| (2.68 | ) |
| (0.33 | ) |
| — |
|
| — |
|
|
| ||||||||||||||||||
Net asset value, end of period |
| $ | 32.97 |
| $ | 65.57 |
| $ | 59.05 |
| $ | 52.23 |
| $ | 42.47 |
| $ | 27.90 |
|
|
| ||||||||||||||||||
|
|
|
|
|
|
|
|
|
|
|
|
|
|
|
|
|
|
|
|
Total Investment Return2 |
|
|
|
|
|
|
|
|
|
|
|
|
|
|
|
|
|
|
|
Based on net asset value |
|
| (48.52 | )%3 |
| 15.69 | % |
| 19.74 | % |
| 23.82 | % |
| 52.22 | % |
| 36.16 | % |
|
| ||||||||||||||||||
|
|
|
|
|
|
|
|
|
|
|
|
|
|
|
|
|
|
|
|
Ratios to Average Net Assets |
|
|
|
|
|
|
|
|
|
|
|
|
|
|
| ||||
Total expenses |
|
| 1.95 | %4 |
| 1.81 | % |
| 1.85 | % |
| 1.84 | % |
| 1.93 | % |
| 2.02 | % |
|
| ||||||||||||||||||
Net investment loss |
|
| (0.62 | )%4 |
| (0.77 | )% |
| (0.70 | )% |
| (0.71 | )% |
| (0.97 | )% |
| (1.00 | )% |
|
| ||||||||||||||||||
|
|
|
|
|
|
|
|
|
|
|
|
|
|
|
|
|
|
|
|
Supplemental Data |
|
|
|
|
|
|
|
|
|
|
|
|
|
|
|
|
| ||
Net assets, end of period (000) |
| $ | 19,751 |
| $ | 46,394 |
| $ | 47,381 |
| $ | 57,926 |
| $ | 52,595 |
| $ | 35,399 |
|
|
| ||||||||||||||||||
Portfolio turnover |
|
| 1 | % |
| 4 | % |
| 6 | % |
| 10 | % |
| 11 | % |
| 11 | % |
|
| ||||||||||||||||||
|
|
|
| 1 | Based on average shares outstanding. |
|
|
|
| 2 | Total investment returns exclude the effect of sales charges. |
|
|
|
| 3 | Aggregate total investment return. |
|
|
|
| 4 | Annualized. |
|
|
|
See Notes to Financial Statements. |
| |
SEMI-ANNUAL REPORT | JANUARY 31, 2009 | 35 |
|
|
|
|
Financial Highlights (continued) | BlackRock Natural Resources Trust |
|
|
|
|
|
|
|
|
|
|
|
|
|
|
|
|
|
|
|
|
|
| Investor C |
| ||||||||||||||||
|
| ||||||||||||||||||
|
| Six Months |
|
|
| ||||||||||||||
|
|
| Year Ended July 31, |
| |||||||||||||||
|
|
| |||||||||||||||||
|
|
| 2008 |
| 2007 |
| 2006 |
| 2005 |
| 2004 |
| |||||||
Per Share Operating Performance |
|
|
|
|
|
|
|
|
|
|
|
|
|
|
|
| |||
Net asset value, beginning of period |
| $ | 64.63 |
| $ | 58.25 |
| $ | 51.57 |
| $ | 41.93 |
| $ | 27.55 |
| $ | 20.23 |
|
|
| ||||||||||||||||||
Net investment loss1 |
|
| (0.15 | ) |
| (0.53 | ) |
| (0.36 | ) |
| (0.35 | ) |
| (0.32 | ) |
| (0.25 | ) |
Net realized and unrealized gain (loss) |
|
| (31.21 | ) |
| 9.58 |
|
| 9.72 |
|
| 10.32 |
|
| 14.70 |
|
| 7.57 |
|
|
| ||||||||||||||||||
Net increase (decrease) from investment operations |
|
| (31.36 | ) |
| 9.05 |
|
| 9.36 |
|
| 9.97 |
|
| 14.38 |
|
| 7.32 |
|
|
| ||||||||||||||||||
Distributions from net realized gain |
|
| (0.79 | ) |
| (2.67 | ) |
| (2.68 | ) |
| (0.33 | ) |
| — |
|
| — |
|
|
| ||||||||||||||||||
Net asset value, end of period |
| $ | 32.48 |
| $ | 64.63 |
| $ | 58.25 |
| $ | 51.57 |
| $ | 41.93 |
| $ | 27.55 |
|
|
| ||||||||||||||||||
|
|
|
|
|
|
|
|
|
|
|
|
|
|
|
|
|
|
|
|
Total Investment Return2 |
|
|
|
|
|
|
|
|
|
|
|
|
|
|
|
|
|
|
|
Based on net asset value |
|
| (48.53 | )%3 |
| 15.67 | % |
| 19.72 | % |
| 23.84 | % |
| 52.20 | % |
| 36.18 | % |
|
| ||||||||||||||||||
|
|
|
|
|
|
|
|
|
|
|
|
|
|
|
|
|
|
|
|
Ratios to Average Net Assets |
|
|
|
|
|
|
|
|
|
|
|
|
|
|
|
|
|
|
|
Total expenses |
|
| 2.02 | %4 |
| 1.84 | % |
| 1.86 | % |
| 1.84 | % |
| 1.93 | % |
| 2.02 | % |
|
| ||||||||||||||||||
Net investment loss |
|
| (0.69 | )%4 |
| (0.81 | )% |
| (0.71 | )% |
| (0.71 | )% |
| (0.97 | )% |
| (1.01 | )% |
|
| ||||||||||||||||||
|
|
|
|
|
|
|
|
|
|
|
|
|
|
|
|
|
|
|
|
Supplemental Data |
|
|
|
|
|
|
|
|
|
|
|
|
|
|
|
|
|
|
|
Net assets, end of period (000) |
| $ | 55,017 |
| $ | 118,825 |
| $ | 99,115 |
| $ | 96,895 |
| $ | 56,131 |
| $ | 29,695 |
|
|
| ||||||||||||||||||
Portfolio turnover |
|
| 1 | % |
| 4 | % |
| 6 | % |
| 10 | % |
| 11 | % |
| 11 | % |
|
| ||||||||||||||||||
|
|
|
| 1 | Based on average shares outstanding. |
|
|
|
| 2 | Total investment returns exclude the effect of sales charges. |
|
|
|
| 3 | Aggregate total investment return. |
|
|
|
| 4 | Annualized. |
|
|
|
See Notes to Financial Statements. | ||
36 | SEMI-ANNUAL REPORT | JANUARY 31, 2009 |
|
|
|
|
Financial Highlights (continued) | BlackRock Utilities and Telecommunications Fund, Inc. |
|
|
|
|
|
|
|
|
|
|
|
|
|
|
|
|
|
|
|
|
|
|
|
|
| Institutional |
| |||||||||||||||||||
|
| |||||||||||||||||||||
|
| Six Months |
| Period |
|
|
| |||||||||||||||
|
|
|
| Year Ended November 30, |
| |||||||||||||||||
|
|
|
|
| ||||||||||||||||||
|
|
|
| 2007 |
| 2006 |
| 2005 |
| 2004 |
| 2003 |
| |||||||||
Per Share Operating Performance |
|
|
|
|
|
|
|
|
|
|
|
|
|
|
|
|
|
| ||||
Net asset value, beginning of period |
| $ | 14.53 |
| $ | 17.85 |
| $ | 14.37 |
| $ | 11.87 |
| $ | 10.37 |
| $ | 8.22 |
| $ | 7.39 |
|
|
| |||||||||||||||||||||
Net investment income1 |
|
| 0.13 |
|
| 0.21 |
|
| 0.25 |
|
| 0.35 |
|
| 0.26 |
|
| 0.22 |
|
| 0.21 |
|
Net realized and unrealized gain (loss) |
|
| (4.20 | ) |
| (1.84 | ) |
| 3.48 |
|
| 2.50 |
|
| 1.51 |
|
| 2.14 |
|
| 0.84 |
|
|
| |||||||||||||||||||||
Net increase (decrease) from investment operations |
|
| (4.07 | ) |
| (1.63 | ) |
| 3.73 |
|
| 2.85 |
|
| 1.77 |
|
| 2.36 |
|
| 1.05 |
|
|
| |||||||||||||||||||||
Dividends and distributions from: |
|
|
|
|
|
|
|
|
|
|
|
|
|
|
|
|
|
|
|
|
|
|
Net investment income |
|
| (0.15 | ) |
| (0.23 | ) |
| (0.25 | ) |
| (0.35 | ) |
| (0.27 | ) |
| (0.21 | ) |
| (0.22 | ) |
Net realized gain |
|
| (0.45 | ) |
| (1.46 | ) |
| — |
|
| — |
|
| — |
|
| — |
|
| — |
|
|
| |||||||||||||||||||||
Total dividends and distributions |
|
| (0.60 | ) |
| (1.69 | ) |
| (0.25 | ) |
| (0.35 | ) |
| (0.27 | ) |
| (0.21 | ) |
| (0.22 | ) |
|
| |||||||||||||||||||||
Net asset value, end of period |
| $ | 9.86 |
| $ | 14.53 |
| $ | 17.85 |
| $ | 14.37 |
| $ | 11.87 |
| $ | 10.37 |
| $ | 8.22 |
|
|
| |||||||||||||||||||||
|
|
|
|
|
|
|
|
|
|
|
|
|
|
|
|
|
|
|
|
|
|
|
Total Investment Return2 |
|
|
|
|
|
|
|
|
|
|
|
|
|
|
|
|
|
| ||||
Based on net asset value |
|
| (27.91 | )%3 |
| (10.03 | )%3 |
| 26.10 | % |
| 24.45 | % |
| 17.25 | % |
| 29.16 | % |
| 14.54 | % |
|
| |||||||||||||||||||||
|
|
|
|
|
|
|
|
|
|
|
|
|
|
|
|
|
|
|
|
|
|
|
Ratios to Average Net Assets |
|
|
|
|
|
|
|
|
|
|
|
|
|
|
|
|
|
| ||||
Total expenses after fees paid indirectly |
|
| 1.08 | %4 |
| 0.98 | %4 |
| 0.96 | % |
| 0.97 | % |
| 0.98 | % |
| 1.03 | % |
| 1.07 | % |
|
| |||||||||||||||||||||
Net investment income |
|
| 2.24 | %4 |
| 1.99 | %4 |
| 1.57 | % |
| 2.77 | % |
| 2.32 | % |
| 2.36 | % |
| 2.77 | % |
|
| |||||||||||||||||||||
|
|
|
|
|
|
|
|
|
|
|
|
|
|
|
|
|
|
|
|
|
|
|
Supplemental Data |
|
|
|
|
|
|
|
|
|
|
|
|
|
|
|
|
|
| ||||
Net assets, end of period (000) |
| $ | 16,139 |
| $ | 24,428 |
| $ | 29,915 |
| $ | 27,255 |
| $ | 25,125 |
| $ | 23,677 |
| $ | 22,514 |
|
|
| |||||||||||||||||||||
Portfolio turnover |
|
| 13 | % |
| 8 | % |
| 31 | % |
| 44 | % |
| 25 | % |
| 11 | % |
| 21 | % |
|
| |||||||||||||||||||||
|
|
|
| 1 | Based on average shares outstanding. |
|
|
|
| 2 | Total investment returns exclude the effects of any sales charges. |
|
|
|
| 3 | Aggregate total investment return. |
|
|
|
| 4 | Annualized. |
|
|
|
See Notes to Financial Statements. |
| |
SEMI-ANNUAL REPORT | JANUARY 31, 2009 | 37 |
|
|
|
|
Financial Highlights (continued) | BlackRock Utilities and Telecommunications Fund, Inc. |
|
|
|
|
|
|
|
|
|
|
|
|
|
|
|
|
|
|
|
|
|
|
|
|
| Investor A |
| |||||||||||||||||||
|
| |||||||||||||||||||||
|
| Six Months |
| Period |
|
|
|
|
|
|
|
|
|
|
|
|
|
|
|
| ||
|
|
|
|
|
|
|
|
|
|
|
|
|
| |||||||||
|
|
|
| Year Ended November 30, |
| |||||||||||||||||
|
|
|
| |||||||||||||||||||
|
|
|
| 2007 |
| 2006 |
| 2005 |
| 2004 |
| 2003 |
| |||||||||
Per Share Operating Performance |
|
|
|
|
|
|
|
|
|
|
|
|
|
|
|
|
|
| ||||
Net asset value, beginning of period |
| $ | 14.54 |
| $ | 17.86 |
| $ | 14.37 |
| $ | 11.88 |
| $ | 10.38 |
| $ | 8.23 |
| $ | 7.40 |
|
|
| |||||||||||||||||||||
Net investment income1 |
|
| 0.11 |
|
| 0.19 |
|
| 0.22 |
|
| 0.32 |
|
| 0.24 |
|
| 0.20 |
|
| 0.19 |
|
Net realized and unrealized gain (loss) |
|
| (4.19 | ) |
| (1.85 | ) |
| 3.48 |
|
| 2.47 |
|
| 1.51 |
|
| 2.14 |
|
| 0.85 |
|
|
| |||||||||||||||||||||
Net increase (decrease) from investment operations |
|
| (4.08 | ) |
| (1.66 | ) |
| 3.70 |
|
| 2.79 |
|
| 1.75 |
|
| 2.34 |
|
| 1.04 |
|
|
| |||||||||||||||||||||
Dividends and distributions from: |
|
|
|
|
|
|
|
|
|
|
|
|
|
|
|
|
|
|
|
|
|
|
Net investment income |
|
| (0.14 | ) |
| (0.20 | ) |
| (0.21 | ) |
| (0.30 | ) |
| (0.25 | ) |
| (0.19 | ) |
| (0.21 | ) |
Net realized gain |
|
| (0.45 | ) |
| (1.46 | ) |
| — |
|
| — |
|
| — |
|
| — |
|
| — |
|
|
| |||||||||||||||||||||
Total dividends and distributions |
|
| (0.59 | ) |
| (1.66 | ) |
| (0.21 | ) |
| (0.30 | ) |
| (0.25 | ) |
| (0.19 | ) |
| (0.21 | ) |
|
| |||||||||||||||||||||
Net asset value, end of period |
| $ | 9.87 |
| $ | 14.54 |
| $ | 17.86 |
| $ | 14.37 |
| $ | 11.88 |
| $ | 10.38 |
| $ | 8.23 |
|
|
| |||||||||||||||||||||
|
|
|
|
|
|
|
|
|
|
|
|
|
|
|
|
|
|
|
|
|
|
|
Total Investment Return2 |
|
|
|
|
|
|
|
|
|
|
|
|
|
|
|
|
|
|
|
|
|
|
Based on net asset value |
|
| (28.00 | )%3 |
| (10.19 | )%3 |
| 25.90 | % |
| 24.04 | % |
| 16.95 | % |
| 28.82 | % |
| 14.26 | % |
|
| |||||||||||||||||||||
|
|
|
|
|
|
|
|
|
|
|
|
|
|
|
|
|
|
|
|
|
|
|
Ratios to Average Net Assets |
|
|
|
|
|
|
|
|
|
|
|
|
|
|
|
|
|
| ||||
Total expenses after fees paid indirectly |
|
| 1.32 | %4 |
| 1.22 | %4 |
| 1.20 | % |
| 1.22 | % |
| 1.23 | % |
| 1.28 | % |
| 1.33 | % |
|
| |||||||||||||||||||||
Net investment income |
|
| 2.00 | %4 |
| 1.76 | %4 |
| 1.33 | % |
| 2.52 | % |
| 2.07 | % |
| 2.11 | % |
| 2.42 | % |
|
| |||||||||||||||||||||
|
|
|
|
|
|
|
|
|
|
|
|
|
|
|
|
|
|
|
|
|
|
|
Supplemental Data |
|
|
|
|
|
|
|
|
|
|
|
|
|
|
|
|
|
|
|
|
|
|
Net assets, end of period (000) |
| $ | 64,062 |
| $ | 96,086 |
| $ | 113,647 |
| $ | 93,670 |
| $ | 79,008 |
| $ | 73,286 |
| $ | 60,142 |
|
|
| |||||||||||||||||||||
Portfolio turnover |
|
| 13 | % |
| 8 | % |
| 31 | % |
| 44 | % |
| 25 | % |
| 11 | % |
| 21 | % |
|
| |||||||||||||||||||||
|
|
|
| 1 | Based on average shares outstanding. |
|
|
|
| 2 | Total investment returns exclude the effects of sales charges. |
|
|
|
| 3 | Aggregate total investment return. |
|
|
|
| 4 | Annualized. |
|
|
|
See Notes to Financial Statements. |
| |
38 | SEMI-ANNUAL REPORT | JANUARY 31, 2009 |
|
|
|
|
Financial Highlights (continued) | BlackRock Utilities and Telecommunications Fund, Inc. |
|
|
|
|
|
|
|
|
|
|
|
|
|
|
|
| Investor B |
| ||||||||||
|
|
| |||||||||||
|
| Six Months |
| Period |
| Year |
| Period |
| ||||
Per Share Operating Performance |
|
|
|
|
|
|
|
|
|
|
|
|
|
Net asset value, beginning of period |
| $ | 14.41 |
| $ | 17.69 |
| $ | 14.29 |
| $ | 13.58 |
|
|
| ||||||||||||
Net investment income2 |
|
| 0.06 |
|
| 0.10 |
|
| 0.08 |
|
| 0.02 |
|
Net realized and unrealized gain (loss) |
|
| (4.15 | ) |
| (1.82 | ) |
| 3.45 |
|
| 0.80 |
|
|
| ||||||||||||
Net increase (decrease) from investment operations |
|
| (4.09 | ) |
| (1.72 | ) |
| 3.53 |
|
| 0.82 |
|
|
| ||||||||||||
Dividends and distributions from: |
|
|
|
|
|
|
|
|
|
|
|
|
|
Net investment income |
|
| (0.07 | ) |
| (0.10 | ) |
| (0.13 | ) |
| (0.11 | ) |
Net realized gain |
|
| (0.45 | ) |
| (1.46 | ) |
| — |
|
| — |
|
|
| ||||||||||||
Total dividends and distributions |
|
| (0.52 | ) |
| (1.56 | ) |
| (0.13 | ) |
| (0.11 | ) |
|
| ||||||||||||
Net asset value, end of period |
| $ | 9.80 |
| $ | 14.41 |
| $ | 17.69 |
| $ | 14.29 |
|
|
| ||||||||||||
|
|
|
|
|
|
|
|
|
|
|
|
|
|
Total Investment Return3 |
|
|
|
|
|
|
|
|
|
|
|
|
|
Based on net asset value |
|
| (28.27 | )%4 |
| (10.64 | )%4 |
| 24.79 | % |
| 6.05 | %4 |
|
| ||||||||||||
|
|
|
|
|
|
|
|
|
|
|
|
|
|
Ratios to Average Net Assets |
|
|
|
|
|
|
|
|
|
|
|
|
|
Total expenses after fees paid indirectly |
|
| 2.27 | %5 |
| 2.09 | %5 |
| 2.07 | % |
| 1.96 | %5 |
|
| ||||||||||||
Net investment income |
|
| 1.04 | %5 |
| 0.94 | %5 |
| 0.51 | % |
| 1.00 | %5 |
|
| ||||||||||||
|
|
|
|
|
|
|
|
|
|
|
|
|
|
Supplemental Data |
|
|
|
|
|
|
|
|
|
|
|
|
|
Net assets, end of period (000) |
| $ | 1,012 |
| $ | 1,483 |
| $ | 1,334 |
| $ | 238 |
|
|
| ||||||||||||
Portfolio turnover |
|
| 13 | % |
| 8 | % |
| 31 | % |
| 44 | % |
|
| ||||||||||||
|
|
|
| ||
| 1 | Commencement of operations. |
|
|
|
| 2 | Based on average shares outstanding. |
|
|
|
| 3 | Total investment returns exclude the effects of sales charges. |
|
|
|
| 4 | Aggregate total investment return. |
|
|
|
| 5 | Annualized. |
|
|
|
See Notes to Financial Statements. |
|
|
SEMI-ANNUAL REPORT | JANUARY 31, 2009 | 39 |
|
|
|
|
Financial Highlights (continued) | BlackRock Utilities and Telecommunications Fund, Inc. |
|
|
|
|
|
|
|
|
|
|
|
|
|
|
|
|
|
|
|
|
|
|
|
|
| Investor B1 |
| |||||||||||||||||||
|
| |||||||||||||||||||||
|
| Six Months |
| Period |
|
|
|
|
|
|
|
|
|
|
| |||||||
|
|
|
|
|
|
|
|
|
|
|
|
|
| |||||||||
|
|
|
| Year Ended November 30, |
| |||||||||||||||||
|
|
|
| |||||||||||||||||||
|
|
|
| 2007 |
| 2006 |
| 2005 |
| 2004 |
| 2003 |
| |||||||||
Per Share Operating Performance |
|
|
|
|
|
|
|
|
|
|
|
|
|
|
|
|
|
|
| |||
Net asset value, beginning of period |
| $ | 14.52 |
| $ | 17.81 |
| $ | 14.33 |
| $ | 11.84 |
| $ | 10.35 |
| $ | 8.19 |
| $ | 7.37 |
|
|
| |||||||||||||||||||||
Net investment income1 |
|
| 0.08 |
|
| 0.12 |
|
| 0.12 |
|
| 0.26 |
|
| 0.18 |
|
| 0.14 |
|
| 0.16 |
|
Net realized and unrealized gain (loss) |
|
| (4.20 | ) |
| (1.82 | ) |
| 3.47 |
|
| 2.48 |
|
| 1.49 |
|
| 2.16 |
|
| 0.82 |
|
|
| |||||||||||||||||||||
Net increase (decrease) from investment operations |
|
| (4.12 | ) |
| (1.70 | ) |
| 3.59 |
|
| 2.74 |
|
| 1.67 |
|
| 2.30 |
|
| 0.98 |
|
|
| |||||||||||||||||||||
Dividends and distributions from: |
|
|
|
|
|
|
|
|
|
|
|
|
|
|
|
|
|
|
|
|
|
|
Net investment income |
|
| (0.09 | ) |
| (0.13 | ) |
| (0.11 | ) |
| (0.25 | ) |
| (0.18 | ) |
| (0.14 | ) |
| (0.16 | ) |
Net realized gain |
|
| (0.45 | ) |
| (1.46 | ) |
| — |
|
| — |
|
| — |
|
| — |
|
| — |
|
|
| |||||||||||||||||||||
Total dividends and distributions |
|
| (0.54 | ) |
| (1.59 | ) |
| (0.11 | ) |
| (0.25 | ) |
| (0.18 | ) |
| (0.14 | ) |
| (0.16 | ) |
|
| |||||||||||||||||||||
Net asset value, end of period |
| $ | 9.86 |
| $ | 14.52 |
| $ | 17.81 |
| $ | 14.33 |
| $ | 11.84 |
| $ | 10.35 |
| $ | 8.19 |
|
|
| |||||||||||||||||||||
|
|
|
|
|
|
|
|
|
|
|
|
|
|
|
|
|
|
|
|
|
|
|
Total Investment Return2 |
|
|
|
|
|
|
|
|
|
|
|
|
|
|
|
|
|
|
|
|
|
|
Based on net asset value |
|
| (28.26 | )%3 |
| (10.46 | )%3 |
| 25.13 | % |
| 23.43 | % |
| 16.26 | % |
| 28.30 | % |
| 13.47 | % |
|
| |||||||||||||||||||||
|
|
|
|
|
|
|
|
|
|
|
|
|
|
|
|
|
|
|
|
|
|
|
Ratios to Average Net Assets |
|
|
|
|
|
|
|
|
|
|
|
|
|
|
|
|
|
|
| |||
Total expenses after fees paid indirectly |
|
| 1.92 | %4 |
| 1.77 | %4 |
| 1.75 | % |
| 1.75 | % |
| 1.75 | % |
| 1.81 | % |
| 1.86 | % |
|
| |||||||||||||||||||||
Net investment income |
|
| 1.44 | %4 |
| 1.17 | %4 |
| 0.77 | % |
| 2.02 | % |
| 1.56 | % |
| 1.58 | % |
| 2.08 | % |
|
| |||||||||||||||||||||
|
|
|
|
|
|
|
|
|
|
|
|
|
|
|
|
|
|
|
|
|
|
|
Supplemental Data |
|
|
|
|
|
|
|
|
|
|
|
|
|
|
|
|
|
|
|
|
|
|
Net assets, end of period (000) |
| $ | 4,767 |
| $ | 9,460 |
| $ | 13,921 |
| $ | 18,347 |
| $ | 28,298 |
| $ | 31,935 |
| $ | 41,317 |
|
|
| |||||||||||||||||||||
Portfolio turnover |
|
| 13 | % |
| 8 | % |
| 31 | % |
| 44 | % |
| 25 | % |
| 11 | % |
| 21 | % |
|
| |||||||||||||||||||||
|
|
|
| 1 | Based on average shares outstanding. |
|
|
|
| 2 | Total investment returns exclude the effects of sales charges. |
|
|
|
| 3 | Aggregate total investment return. |
|
|
|
| 4 | Annualized. |
|
|
|
See Notes to Financial Statements. |
| |
40 | SEMI-ANNUAL REPORT | JANUARY 31, 2009 |
|
|
|
|
Financial Highlights (continued) | BlackRock Utilities and Telecommunications Fund, Inc. |
|
|
|
|
|
|
|
|
|
|
|
|
|
|
|
| Investor C |
| ||||||||||
|
| ||||||||||||
|
| Six Months |
| Period |
| Year |
| Period |
| ||||
Per Share Operating Performance |
|
|
|
|
|
|
|
|
|
|
|
|
|
|
|
|
|
|
|
|
|
|
|
|
|
|
|
Net asset value, beginning of period |
| $ | 14.23 |
| $ | 17.50 |
| $ | 14.15 |
| $ | 13.44 |
|
|
| ||||||||||||
Net investment income2 |
|
| 0.06 |
|
| 0.10 |
|
| 0.09 |
|
| 0.02 |
|
Net realized and unrealized gain (loss) |
|
| (4.10 | ) |
| (1.80 | ) |
| 3.41 |
|
| 0.80 |
|
|
| ||||||||||||
Net increase (decrease) from investment operations |
|
| (4.04 | ) |
| (1.70 | ) |
| 3.50 |
|
| 0.82 |
|
|
| ||||||||||||
Dividends and distributions from: |
|
|
|
|
|
|
|
|
|
|
|
|
|
Net investment income |
|
| (0.08 | ) |
| (0.11 | ) |
| (0.15 | ) |
| (0.11 | ) |
Net realized gain |
|
| (0.45 | ) |
| (1.46 | ) |
| — |
|
| — |
|
|
| ||||||||||||
Total dividends and distributions |
|
| (0.53 | ) |
| (1.57 | ) |
| (0.15 | ) |
| (0.11 | ) |
|
| ||||||||||||
Net asset value, end of period |
| $ | 9.66 |
| $ | 14.23 |
| $ | 17.50 |
| $ | 14.15 |
|
|
| ||||||||||||
|
|
|
|
|
|
|
|
|
|
|
|
|
|
Total Investment Return3 |
|
|
|
|
|
|
|
|
|
|
|
|
|
Based on net asset value |
|
| (28.30 | )%4 |
| (10.63 | )%4 |
| 24.86 | % |
| 6.11 | %4 |
|
| ||||||||||||
|
|
|
|
|
|
|
|
|
|
|
|
|
|
Ratios to Average Net Assets |
|
|
|
|
|
|
|
|
|
|
|
|
|
Total expenses after fees paid indirectly |
|
| 2.22 | %5 |
| 2.06 | %5 |
| 2.01 | % |
| 1.97 | %5 |
|
| ||||||||||||
Net investment income |
|
| 1.10 | %5 |
| 0.99 | %5 |
| 0.56 | % |
| 0.98 | %5 |
|
| ||||||||||||
|
|
|
|
|
|
|
|
|
|
|
|
|
|
Supplemental Data |
|
|
|
|
|
|
|
|
|
|
|
|
|
Net assets, end of period (000) |
| $ | 2,952 |
| $ | 4,494 |
| $ | 3,617 |
| $ | 292 |
|
|
| ||||||||||||
Portfolio turnover |
|
| 13 | % |
| 8 | % |
| 31 | % |
| 44 | % |
|
| ||||||||||||
|
|
|
| 1 | Commencement of operations. |
|
|
|
| 2 | Based on average shares outstanding. |
|
|
|
| 3 | Total investment returns exclude the effects of sales charges. |
|
|
|
| 4 | Aggregate total investment return. |
|
|
|
| 5 | Annualized. |
|
|
|
See Notes to Financial Statements. | ||
SEMI-ANNUAL REPORT | JANUARY 31, 2009 | 41 |
|
|
|
|
Financial Highlights (concluded) | BlackRock Utilities and Telecommunications Fund, Inc. |
|
|
|
|
|
|
|
|
|
|
|
|
|
|
|
|
|
|
|
|
|
|
|
|
| Investor C1 |
| |||||||||||||||||||
|
| |||||||||||||||||||||
|
| Six Months |
| Period |
|
|
|
|
|
|
|
|
|
|
| |||||||
|
|
|
| Year Ended November 30, |
| |||||||||||||||||
|
|
|
| |||||||||||||||||||
|
|
|
| 2007 |
| 2006 |
| 2005 |
| 2004 |
| 2003 |
| |||||||||
Per Share Operating Performance |
|
|
|
|
|
|
|
|
|
|
|
|
|
|
|
|
|
| ||||
Net asset value, beginning of period |
| $ | 14.34 |
| $ | 17.61 |
| $ | 14.18 |
| $ | 11.73 |
| $ | 10.25 |
| $ | 8.13 |
| $ | 7.31 |
|
|
| |||||||||||||||||||||
Net investment income1 |
|
| 0.08 |
|
| 0.12 |
|
| 0.12 |
|
| 0.25 |
|
| 0.17 |
|
| 0.14 |
|
| 0.15 |
|
Net realized and unrealized gain (loss) |
|
| (4.14 | ) |
| (1.81 | ) |
| 3.43 |
|
| 2.45 |
|
| 1.50 |
|
| 2.12 |
|
| 0.83 |
|
|
| |||||||||||||||||||||
Net increase (decrease) from investment operations |
|
| (4.06 | ) |
| (1.69 | ) |
| 3.55 |
|
| 2.70 |
|
| 1.67 |
|
| 2.26 |
|
| 0.98 |
|
|
| |||||||||||||||||||||
Dividends and distributions from: |
|
|
|
|
|
|
|
|
|
|
|
|
|
|
|
|
|
|
|
|
|
|
Net investment income |
|
| (0.10 | ) |
| (0.12 | ) |
| (0.12 | ) |
| (0.25 | ) |
| (0.19 | ) |
| (0.14 | ) |
| (0.16 | ) |
Net realized gain |
|
| (0.45 | ) |
| (1.46 | ) |
| — |
|
| — |
|
| — |
|
| — |
|
| — |
|
|
| |||||||||||||||||||||
Total dividends and distributions |
|
| (0.55 | ) |
| (1.58 | ) |
| (0.12 | ) |
| (0.25 | ) |
| (0.19 | ) |
| (0.14 | ) |
| (0.16 | ) |
|
| |||||||||||||||||||||
Net asset value, end of period |
| $ | 9.73 |
| $ | 14.34 |
| $ | 17.61 |
| $ | 14.18 |
| $ | 11.73 |
| $ | 10.25 |
| $ | 8.13 |
|
|
| |||||||||||||||||||||
|
|
|
|
|
|
|
|
|
|
|
|
|
|
|
|
|
|
|
|
|
|
|
Total Investment Return2 |
|
|
|
|
|
|
|
|
|
|
|
|
|
|
|
|
|
|
|
|
|
|
Based on net asset value |
|
| (28.24 | )%3 |
| (10.48 | )%3 |
| 25.11 | % |
| 23.30 | % |
| 16.34 | % |
| 28.03 | % |
| 13.62 | % |
|
| |||||||||||||||||||||
|
|
|
|
|
|
|
|
|
|
|
|
|
|
|
|
|
|
|
|
|
|
|
Ratios to Average Net Assets |
|
|
|
|
|
|
|
|
|
|
|
|
|
|
|
|
|
|
|
|
|
|
Total expenses after fees paid indirectly |
|
| 1.97 | %4 |
| 1.83 | %4 |
| 1.79 | % |
| 1.79 | % |
| 1.80 | % |
| 1.85 | % |
| 1.91 | % |
|
| |||||||||||||||||||||
Net investment income |
|
| 1.36 | %4 |
| 1.14 | %4 |
| 0.74 | % |
| 1.94 | % |
| 1.49 | % |
| 1.53 | % |
| 1.93 | % |
|
| |||||||||||||||||||||
|
|
|
|
|
|
|
|
|
|
|
|
|
|
|
|
|
|
|
|
|
|
|
Supplemental Data |
|
|
|
|
|
|
|
|
|
|
|
|
|
|
|
|
|
|
|
|
|
|
Net assets, end of period (000) |
| $ | 8,073 |
| $ | 13,041 |
| $ | 16,754 |
| $ | 16,527 |
| $ | 14,789 |
| $ | 11,898 |
| $ | 10,994 |
|
|
| |||||||||||||||||||||
Portfolio turnover |
|
| 13 | % |
| 8 | % |
| 31 | % |
| 44 | % |
| 25 | % |
| 11 | % |
| 21 | % |
|
| |||||||||||||||||||||
|
|
|
| 1 | Based on average shares outstanding. |
|
|
|
| 2 | Total investment returns exclude the effects of sales charges. |
|
|
|
| 3 | Aggregate total investment return. |
|
|
|
| 4 | Annualized. |
|
|
|
See Notes to Financial Statements. | ||
42 | SEMI-ANNUAL REPORT | JANUARY 31, 2009 |
|
|
1. Organization and Significant Accounting Policies:
BlackRock Equity Dividend Fund (“Equity Dividend”), BlackRock Natural Resources Trust (“Natural Resources”) and BlackRock Utilities and Telecommunications Fund, Inc. (“Utilities and Telecommunications”) (referred to as the “Funds” or individually as the “Fund”), are registered under the Investment Company Act of 1940, as amended (the “1940 Act”). Equity Dividend and Utilities and Telecommunications are registered as diversified, open-end management investment companies. Natural Resources is registered as a non-diversified, open-end management investment company. Equity Dividend and Natural Resources are organized as Massachusetts business trusts and Utilities and Telecommunications is organized as a Maryland corporation. The Funds’ financial statements are prepared in conformity with accounting principles generally accepted in the United States of America, which may require the use of management accruals and estimates. Actual results may differ from these estimates. The Funds offer multiple classes of shares. Institutional and Service Shares are sold only to certain eligible investors. Investor A Shares are generally sold with a front-end sales charge. Investor B, Investor B1, Investor C and Investor C1 Shares may be subject to a contingent deferred sales charge. Class R Shares are sold only to certain retirement plans. All classes of shares have identical voting, dividend, liquidation and other rights and the same terms and conditions, except that Investor A, Investor B, Investor B1, Investor C, Investor C1 and Class R Shares bear certain expenses related to the shareholder servicing of such shares, and Investor B, Investor B1, Investor C, Investor C1 and Class R Shares also bear certain expenses related to the distribution of such shares. Each class has exclusive voting rights with respect to matters relating to its shareholder servicing and distribution expenditures (except that Investor B and Investor B1 shareholders may vote on material changes to the Investor A distribution plan).
Fund Reorganization: The Board of Directors of PNC Equity Income Fund and shareholders of Equity Dividend approved a reorganization. The reorganization was a tax-free event and took place on November 17, 2008.
On November 17, 2008, BlackRock Equity Dividend Fund (“Equity Dividend”) acquired substantially all of the assets and assumed substantially all of the liabilities of PNC Equity Income Fund of PNC Funds, Inc. (“Equity Income”), pursuant to a plan of reorganization. The acquisition was accomplished by a tax-free exchange of 8,934,168 capital shares of Equity Income for 1,147,662 capital shares of Equity Dividend. Equity Income’s net assets on that date of $15,092,663, including $47,570,110 of paid-in capital, $17,597,294 of net realized capital losses and $14,880,153 of net unrealized depreciation were combined with those of Equity Dividend. The aggregate net assets immediately after the acquisition amounted to $3,196,818,529.
The following is a summary of significant accounting policies followed by the Funds:
Valuation of Securities: Equity investments traded on a recognized securities exchange or the NASDAQ Global Market System are valued at the last reported sale price that day or the NASDAQ official closing price, if applicable. For equity investments traded on more than one exchange, the last reported sale price on the exchange where the stock is primarily traded is used. Equity investments traded on a recognized exchange for which there were no sales on that day are valued at the last available bid price. If no bid price is available, the prior day’s price will be used, unless it is determined that such prior day’s price no longer reflects the fair value of the security. Short-term securities with maturities less than 60 days are valued at amortized cost, which approximates fair value. Investments in open-end investment companies are valued at net asset value each business day. Each Fund values its investments in Cash Sweep Series and Money Market Series, each of the BlackRock Liquidity Series, LLC, at fair value, which is ordinarily based upon their pro-rata ownership in the net assets of the fund.
In the event that application of these methods of valuation results in a price for an investment which is deemed not to be representative of the market value of such investment, the investment will be valued by a method approved by the Board of Directors for Utilities and Telecommunications and by the Board of Trustees for Equity Dividend and Natural Resources (individually the “Board” or together the “Boards”) as reflecting fair value (“Fair Value Assets”). When determining the price for Fair Value Assets, the investment advisor and/or sub-advisor seeks to determine the price that the Funds might reasonably expect to receive from the current sale of that asset in an arm’s-length transaction. Fair value determinations shall be based upon all available factors that the investment advisor and/or sub-advisor deems relevant. The pricing of all Fair Value Assets is subsequently reported to the respective Board or a committee thereof.
Generally, trading in foreign securities is substantially completed each day at various times prior to the close of business on the New York Stock Exchange (“NYSE”). The values of such securities used in computing the net assets of each Fund are determined as of such times. Foreign currency exchange rates will be determined as of the close of business on the NYSE. Occasionally, events affecting the values of such securities and such exchange rates may occur between the times at which they are determined and the close of business on the NYSE that may not be reflected in the computation of each Fund’s net assets. If events (for example, a company announcement, market volatility or a natural disaster) occur during such periods that are expected to materially affect the value of such securities, those securities will be valued at their fair value as determined in good faith by the Board or by the investment advisor using a pricing service and/or procedures approved by the Board. Foreign currency exchange contracts and forward foreign currency exchange contracts are valued at the mean between the bid and ask prices. Interpolated values are derived when the settlement date of the contract is an interim date for which quotations are not available.
|
|
|
SEMI-ANNUAL REPORT | JANUARY 31, 2009 | 43 |
|
|
Notes to Financial Statements (continued) |
Derivative Financial Instruments: Each Fund may engage in various portfolio investment strategies to increase the return of the Funds and to hedge, or protect, its exposure to interest rate movements and movements in the securities markets. Losses may arise if the value of the contract decreases due to an unfavorable change in the price of the underlying security, or if the counterparty does not perform under the contract.
|
|
• | Financial futures contracts — Each Fund may purchase or sell financial futures contracts and options on futures contracts. Futures contracts are contracts for delayed delivery of securities at a specific future date and at a specific price or yield. Pursuant to the contract, the Fund agrees to receive from or pay to the broker an amount of cash equal to the daily fluctuation in value of the contract. Such receipts or payments are known as margin variation and are recorded by the Funds as unrealized gains or losses. When the contract is closed, the Fund records a realized gain or loss equal to the difference between the value of the contract at the time it was opened and the value at the time it was closed. The use of futures transactions involves the risk of an imperfect correlation in the movements in the price of futures contracts, interest rates and the underlying assets, and the possible inability of counterparties to meet the terms of their contracts. |
Foreign Currency Transactions: Foreign currency amounts are translated into United States dollars on the following basis: (i) market value of investment securities, assets and liabilities at the current rate of exchange; and (ii) purchases and sales of investment securities, income and expenses at the rates of exchange prevailing on the respective dates of such transactions. Each Fund reports foreign currency related transactions as components of realized gains for financial reporting purposes, whereas such components are treated as ordinary income for federal income tax purposes.
Segregation and Collateralization: In cases in which the 1940 Act and the interpretive positions of the Securities and Exchange Commission (“SEC”) require that each Fund segregates assets in connection with certain investments (e.g., financial futures contracts), each Fund will, consistent with certain interpretive letters issued by the SEC, designate on its books and records cash or other liquid securities having a market value at least equal to the amount that would otherwise be required to be physically segregated. Furthermore, based on requirements and agreements with certain exchanges and third party broker-dealers, each Fund may also be required to deliver or deposit securities as collateral for certain investments (e.g., financial futures contracts).
Investment Transactions and Investment Income: Investment transactions are recorded on the dates the transactions are entered into (the trade dates). Realized gains and losses on security transactions are determined on the identified cost basis. Dividend income is recorded on the ex-dividend dates. Dividends from foreign securities where the ex-dividend date may have passed are subsequently recorded when the Funds have determined the ex-dividend date. Upon notification from issuers, some of the dividend income received from a real estate investment trust may be redesignated as a reduction of cost of the related investment and/or realized gain. Interest income is recognized on the accrual basis. Income and realized and unrealized gains and losses are allocated daily to each class based on its relative net assets.
Dividends and Distributions: Dividends and distributions paid by each Fund are recorded on the ex-dividend dates. If the total dividends and distributions made in any tax year exceeds net investment income and accumulated realized capital gains, a portion of the total distribution may be treated as a tax return of capital.
Securities Lending: The Funds may lend securities to financial institutions that provide cash or securities issued or guaranteed by the United States government as collateral, which will be maintained at all times in an amount equal to at least 100% of the current market value of the loaned securities. The market value of the loaned securities is determined at the close of business of each Fund and any additional required collateral is delivered to the Funds on the next business day. Each Fund typically receives income on loaned securities but does not receive income on the collateral. Where each Fund receives cash collateral, it may invest such collateral and retain the amount earned on such investment, net of any amount rebated to the borrower. For the six months ended January 31, 2009, the Funds received only cash collateral for any securities loaned. Loans of securities are terminable at any time and the borrower, after notice, is required to return borrowed securities within the standard time period for settlement of securities transactions. The Funds may pay reasonable lending agent, administrative and custodial fees in connection with its loans. In the event that the borrower defaults on its obligation to return borrowed securities because of insolvency or for any other reason, the Funds could experience delays and costs in gaining access to the collateral. The Funds also could suffer a loss where the value of the invested collateral falls below the market value of the borrowed securities either in the event of borrower default or in the event of losses on investments made with cash collateral.
Income Taxes: It is each Fund’s policy to comply with the requirements of the Internal Revenue Code applicable to regulated investment companies and to distribute substantially all of its taxable income to its shareholders. Therefore, no federal income tax provision is required. Under the applicable foreign tax laws, a withholding tax may be imposed on interest, dividends and capital gains at various rates.
Each Fund files US federal and various state and local tax returns. No income tax returns are currently under examination. The statute of limitations on each Fund’s US federal tax returns remains open for each of the four years ended through July 31, 2008. The statutes of limitations on each Fund’s state and local tax returns may remain open for an additional year depending upon the jurisdiction.
|
|
|
44 | SEMI-ANNUAL REPORT | JANUARY 31, 2009 |
|
|
Notes to Financial Statements (continued) |
Recent Accounting Pronouncement: In March 2008, Statement of Financial Accounting Standards No. 161, “Disclosures about Derivative Instruments and Hedging Activities — an amendment of FASB Statement No. 133” (“FAS 161”), was issued. FAS 161 is intended to improve financial reporting for derivative instruments by requiring enhanced disclosure that enables investors to understand how and why an entity uses derivatives, how derivatives are accounted for and how derivative instruments affect an entity’s results of operations and financial position. FAS 161 is effective for financial statements issued for fiscal years and interim periods beginning after November 15, 2008. The impact on the Funds’ financial statement disclosures, if any, is currently being assessed.
Other: Expenses directly related to each Fund or its classes are charged to that Fund or class. Other operating expenses shared by several funds are pro-rated among those funds on the basis of relative net assets or other appropriate methods. Other expenses of each Fund are allocated daily to each class based on its relative net assets.
Bank Overdraft: Equity Dividend recorded a bank overdraft resulting from estimates of available cash.
2. Investment Advisory Agreements and Other Transactions with Affiliates:
Each Fund has entered into an Investment Advisory Agreement with BlackRock Advisors, LLC (the “Advisor”), an indirect, wholly owned subsidiary of BlackRock, Inc., to provide investment advisory and administration services. As of January 31, 2009, The PNC Financial Services Group, Inc. (“PNC”) and Bank of America Corporation (“BAC”) are the largest stockholders of BlackRock, Inc. (“BlackRock”). BAC became a stockholder of BlackRock following its acquisition of Merrill Lynch & Co., Inc. (“Merrill Lynch”) on January 1, 2009. Prior to that date, both PNC and Merrill Lynch were considered affiliates of the Funds under the 1940 Act. Subsequent to the acquisition, PNC remains an affiliate, but due to the restructuring of Merrill Lynch’s ownership interest of BlackRock, BAC is not deemed to be an affiliate under the 1940 Act.
The Advisor is responsible for the management of each Fund’s portfolio and provides the necessary personnel, facilities, equipment and certain other services necessary to the operation of each Fund. For such services, each Fund pays the Advisor a monthly fee at an annual rate of 0.60% on an annual basis of the average daily value of each Fund’s net assets.
The Advisor has entered into a voluntary arrangement with Equity Dividend under which the expenses incurred by each class of shares of the Fund (excluding distribution and/or service fees) will not exceed 0.90%. The Advisor may reduce or discontinue this arrangement at any time without notice.
The Advisor, on behalf of the Funds, has entered into a separate sub-advisory agreement with BlackRock Investment Management, LLC (“BIM”), an affiliate of the Advisor, under which the Advisor pays BIM for services it provides, a monthly fee at an annual rate that is a percentage of the investment advisory fee paid by each Fund to the Advisor.
Effective October 1, 2008, the Funds entered into a Distribution Agreement and Distribution Plans with BlackRock Investments, Inc. (“BII”), which replaced FAM Distributors, Inc. (“FAMD”) and BlackRock Distributors, Inc. (“BDI”) (collectively, the “Distributor”) as the sole distributor of the Funds. FAMD is a wholly owned subsidiary of Merrill Lynch Group, Inc. BII and BDI are affiliates of BlackRock, Inc. The service and distribution fees did not change as a result of this transaction.
Pursuant to the Distribution Plans adopted by the Funds in accordance with Rule 12b-1 under the 1940 Act, each Fund pays the Distributor ongoing service and distribution fees. The fees are accrued daily and paid monthly at annual rates based upon the average daily net assets of the shares as follows:
|
|
|
|
|
|
|
|
|
|
|
|
| Service Fees |
| |||||||
|
| Equity |
| Natural |
| Utilities and |
| |||
Service |
| 0.25 | % |
| — |
|
| — |
|
|
Investor A |
| 0.25 | % |
| 0.25 | % |
| 0.25 | % |
|
Investor B |
| 0.25 | % |
| 0.25 | % |
| 0.25 | % |
|
Investor B1 |
| — |
|
| — |
|
| 0.25 | % |
|
Investor C |
| 0.25 | % |
| 0.25 | % |
| 0.25 | % |
|
Investor C1 |
| — |
|
| — |
|
| 0.25 | % |
|
Class R |
| 0.25 | % |
| — |
|
| — |
|
|
|
|
|
|
|
|
|
|
|
|
|
|
| Distribution Fees |
| |||||||
|
| Equity |
| Natural |
| Utilities and |
| |||
Investor B |
| 0.75 | % |
| 0.75 | % |
| 0.75 | % |
|
Investor B1 |
| — |
|
| — |
|
| 0.50 | % |
|
Investor C |
| 0.75 | % |
| 0.75 | % |
| 0.75 | % |
|
Investor C1 |
| — |
|
| — |
|
| 0.55 | % |
|
Class R |
| 0.25 | % |
| — |
|
| — |
|
|
Pursuant to sub-agreements with each Distributor, broker-dealers, including Merrill Lynch, Pierce, Fenner & Smith Incorporated (“MLPF&S”), a wholly owned subsidiary of Merrill Lynch, and the Distributor provide shareholder servicing and distribution services to each Fund. The ongoing service and/or distribution fee compensates the Distributor and each broker-dealer for providing shareholder servicing and/or distribution-related services to Investor A, Investor B, Investor B1, Investor C, Investor C1 and Class R shareholders.
|
|
|
SEMI-ANNUAL REPORT | JANUARY 31, 2009 | 45 |
|
|
Notes to Financial Statements (continued) |
For a portion of the six months ended January 31, 2009, affiliates earned underwriting discounts, direct commissions and dealer concessions on sales of the Funds’ Investor A Shares as follows:
|
|
|
|
|
|
| Investor A |
| |
Equity Dividend |
| $ | 321,034 |
|
Natural Resources |
| $ | 17,584 |
|
Utilities and Telecommunications |
| $ | 9,447 |
|
For a portion of the six months ended January 31, 2009, affiliates received contingent deferred sales charges relating to transactions in Investor B, Investor B1, Investor C and Investor C1 Shares as follows:
|
|
|
|
|
|
|
|
|
|
|
|
|
|
|
|
|
| Investor B |
| Investor B1 |
| Investor C |
| Investor C1 |
| ||||||
Equity Dividend |
| $ | 85,586 |
|
| — |
| $ | 176,322 |
|
|
| — |
|
|
Natural Resources |
| $ | 40,204 |
|
| — |
| $ | 21,511 |
|
| — |
| ||
Utilities and Telecommunications |
| $ | 3,216 |
| $ | 5,254 |
| $ | 2,250 |
|
| $ | 1 |
|
|
Furthermore, affiliates received contingent deferred sales charges relating to transactions subject to front-end sales charge waivers relating to Investor A Shares as follows:
|
|
|
|
|
|
| Investor A |
| |
Equity Dividend |
| $ | 15,096 |
|
Natural Resources |
| $ | 4,023 |
|
In addition, MLPF&S received commissions on the execution of portfolio transactions for the period August 1, 2008 to December 31, 2008 as follows:
|
|
|
|
|
Equity Dividend |
| $ | 206,301 |
|
Natural Resources |
| $ | 1,260 |
|
Utilities and Telecommunications |
| $ | 7,717 |
|
Subsequent to that date, neither MLPF&S or Merrill Lynch are considered affiliates of the Funds.
Pursuant to the terms of the custody agreements, custodian fees may be reduced by amounts calculated on uninvested cash balances (“Custody Credits”), which are shown on the Statements of Operations as fees paid indirectly.
The Funds have received an exemptive order from the SEC permitting it to lend portfolio securities to MLPF&S, a wholly owned subsidiary of Merrill Lynch or its affiliates. Pursuant to that order, the Funds have retained BIM as the securities lending agent for a fee based on a share of the returns on investment of cash collateral. BIM may, on behalf of the Funds, invest cash collateral received by the Funds for such loans, among other things, in a private investment company managed by the Advisor or in registered money market funds advised by the Advisor or its affiliates. The share of income earned by the Funds on such investments is shown as securities lending — affiliated on the Statements of Operations. For the six months ended January 31, 2009, BIM received $1,012 and $510, in securities lending agent fees from Equity Dividend and Natural Resources Trust, respectively.
PNC Global Investment Servicing (US) Inc., an indirect, wholly owned subsidiary of PNC and an affiliate of the Advisor, is the Funds’ transfer agent and dividend disbursing agent. Each class of the Funds bear the costs of transfer agent fees associated with such respective classes. Transfer agency fees borne by each class of the Funds are comprised of those fees charged for all shareholder communications including mailing of shareholder reports, dividend and distribution notices, and proxy materials for shareholders meetings, as well as per account and per transaction fees related to servicing and maintenance of shareholder accounts, including the issuing, redeeming and transferring of shares of each class of the Fund, 12b-1 fee calculation, check writing, anti-money laundering services, and customer identification services.
Pursuant to written agreements, certain affiliates provide the Funds with sub-accounting, recordkeeping, sub-transfer agency and other administrative services with respect to sub-accounts they service. For these services, these affiliates receive an annual fee per shareholder account which will vary depending on share class. For the six months ended January 31, 2009, the Funds paid the following fees in return for these services, which are a component of the transfer agent fees in the accompanying Statements of Operations.
|
|
|
|
|
Equity Dividend |
| $ | 1,134,494 |
|
Natural Resources |
| $ | 175,276 |
|
Utilities and Telecommunications |
| $ | 66,513 |
|
The Funds may earn income on positive cash balances in demand deposit accounts that are maintained by the transfer agent on behalf of the Funds. For the six months ended January 31, 2009, the Funds earned the following, which are included in income — affiliated in the Statements of Operations:
|
|
|
|
|
Equity Dividend |
| $ | 676 |
|
Natural Resources |
| $ | 192 |
|
Utilities and Telecommunications |
| $ | 335 |
|
|
|
|
46 | SEMI-ANNUAL REPORT | JANUARY 31, 2009 |
|
|
The Advisor maintains a call center, which is responsible for providing certain shareholder services to the Funds, such as responding to shareholder inquiries and processing transactions based upon instructions from shareholders with respect to the subscription and redemption of Fund shares. For the six months ended January 31, 2009, the following amounts have been accrued by the Funds to reimburse the Advisor for costs incurred running the call center, which are a component of the transfer agent fees in the accompanying Statements of Operations.
|
|
|
|
|
|
|
|
|
|
|
|
|
|
|
|
|
| ||||||||||||||||
|
| Equity |
| Natural |
| Utilities and |
| |||||||||
| ||||||||||||||||
Institutional |
|
| $ | 8,220 |
|
|
| $ | 696 |
|
|
| $ | 234 |
|
|
Service |
|
| $ | 173 |
|
|
|
| — |
|
|
|
| — |
|
|
Investor A |
|
| $ | 38,286 |
|
|
| $ | 6,948 |
|
|
| $ | 2,244 |
|
|
Investor B |
|
| $ | 2,634 |
|
|
| $ | 1,110 |
|
|
| $ | 288 |
|
|
Investor C |
|
| $ | 10,692 |
|
|
| $ | 1,836 |
|
|
| $ | 330 |
|
|
Class R |
|
| $ | 1,068 |
|
|
|
| — |
|
|
|
| — |
|
|
| ||||||||||||||||
For the six months ended January 31, 2009, each Fund reimbursed the Advisor for certain accounting services, which are included in accounting services in the Statements of Operations as follows:
|
|
|
|
|
|
|
| ||||||
|
| Accounting |
| |||
| ||||||
Equity Dividend |
|
| $ | 32,183 |
|
|
Natural Resources |
|
| $ | 5,345 |
|
|
Utilities and Telecommunications |
|
| $ | 1,239 |
|
|
| ||||||
Certain officers and/or directors/trustees of the Funds are officers and/or directors of BlackRock, Inc. or its affiliates. The Funds reimburse the Advisor for compensation paid to the Funds’ Chief Compliance Officer.
3. Investments:
Purchases and sales of investments, excluding short-term securities, for the six months ended January 31, 2009 were as follows:
|
|
|
|
|
|
|
|
| |||||||
|
| Purchases |
| Sales |
| ||
| |||||||
Equity Dividend |
| $ | 1,073,210,398 |
| $ | 117,967,472 |
|
Natural Resources |
| $ | 3,623,474 |
| $ | 4,885,513 |
|
Utilities and Telecommunications |
| $ | 14,296,225 |
| $ | 26,015,757 |
|
| |||||||
4. Short-Term Borrowings:
Each Fund, along with certain other funds managed by the Advisor and its affiliates, is a party to a $500,000,000 credit agreement with a group of lenders, which expired in November 2008 and was subsequently renewed until November 2009. Each Fund may borrow under the credit agreement to fund shareholder redemptions and for other lawful purposes other than for leverage. Each Fund may borrow up to the maximum amount allowable under each Fund’s current Prospectus and Statement of Additional Information, subject to various other legal, regulatory or contractual limits. The Funds paid their pro rata share of 0.02% upfront fee on the aggregate commitment amount based on their net assets as of October 31, 2008. Each Fund pays a commitment fee of 0.08% per annum based on each Fund’s pro rata share of the unused portion of the credit agreement, which is included in miscellaneous in the Statements of Operations. Amounts borrowed under the credit agreement bear interest at a rate equal to the higher of the (a) federal funds effective rate and (b) reserve adjusted one month LIBOR, plus, in each case, the higher of (i) 1.50% and (ii) 50% of the CDX Index (as defined in the credit agreement) in effect from time to time. The Funds did not borrow under the credit agreement during the six months ended January 31, 2009.
5. Market and Credit Risk:
In the normal course of business, the Funds invest in securities and enter into transactions where risks exist due to fluctuations in the market (market risk) or failure of the issuer of a security to meet all its obligations (credit risk). The value of securities held by the Funds may decline in response to certain events, including those directly involving the issuers whose securities are owned by the Funds; conditions affecting the general economy; overall market changes; local, regional or global political, social or economic instability; and currency and interest rate and price fluctuations. Similar to credit risk, the Funds may be exposed to counterparty risk, or the risk that an entity with which the Funds have unsettled or open transactions may default. Financial assets, which potentially expose the Funds to credit and counterparty risks, consist principally of investments and cash due from counterparties. The extent of the Funds’ exposure to credit and counterparty risks with respect to these financial assets is approximated by their value recorded in the Funds’ Statements of Assets and Liabilities.
|
|
|
SEMI-ANNUAL REPORT | JANUARY 31, 2009 | 47 |
|
|
6. Capital Share Transactions:
Transactions in capital shares for each class were as follows:
|
|
|
|
|
|
|
|
|
|
|
|
|
|
|
| Six Months Ended |
| Year Ended |
| ||||||||
|
|
| |||||||||||
Equity Dividend |
| Shares |
| Amount |
| Shares |
| Amount |
| ||||
Institutional |
|
|
|
|
|
|
|
|
|
|
|
|
|
Shares sold |
|
| 40,450,452 |
| $ | 595,156,098 |
|
| 42,795,064 |
| $ | 832,513,912 |
|
Shares issued resulting from reorganization |
|
| 1,132,399 |
|
| 14,892,266 |
|
| — |
|
| — |
|
Shares issued to shareholders in reinvestment of dividends and distributions |
|
| 896,125 |
|
| 11,682,179 |
|
| 862,766 |
|
| 16,940,101 |
|
|
| ||||||||||||
Total issued |
|
| 42,478,976 |
|
| 621,730,543 |
|
| 43,657,830 |
|
| 849,454,013 |
|
Shares redeemed |
|
| (16,313,340 | ) |
| (230,804,884 | ) |
| (8,268,654 | ) |
| (159,423,646 | ) |
|
| ||||||||||||
Net increase |
|
| 26,165,636 |
| $ | 390,925,659 |
|
| 35,389,176 |
| $ | 690,030,367 |
|
|
| ||||||||||||
|
|
|
|
|
|
|
|
|
|
|
|
|
|
Service |
|
|
|
|
|
|
|
|
|
|
|
|
|
Shares sold |
|
| 809,646 |
| $ | 11,821,419 |
|
| 474,390 |
| $ | 9,254,982 |
|
Shares issued to shareholders in reinvestment of dividends and distributions |
|
| 12,386 |
|
| 161,044 |
|
| 8,033 |
|
| 156,250 |
|
|
| ||||||||||||
Total issued |
|
| 822,032 |
|
| 11,982,463 |
|
| 482,423 |
|
| 9,411,232 |
|
Shares redeemed |
|
| (194,048 | ) |
| (2,902,511 | ) |
| (33,899 | ) |
| (643,339 | ) |
|
| ||||||||||||
Net increase |
|
| 627,984 |
| $ | 9,079,952 |
|
| 448,524 |
| $ | 8,767,893 |
|
|
| ||||||||||||
|
|
|
|
|
|
|
|
|
|
|
|
|
|
Investor A |
|
|
|
|
|
|
|
|
|
|
|
|
|
Shares sold and automatic conversion of shares |
|
| 65,950,223 |
| $ | 951,629,662 |
|
| 79,391,098 |
| $ | 1,543,286,832 |
|
Shares issued resulting from reorganization |
|
| 15,149 |
|
| 198,923 |
|
| — |
|
| — |
|
Shares issued to shareholders in reinvestment of dividends and distributions |
|
| 1,535,048 |
|
| 19,990,711 |
|
| 1,393,193 |
|
| 27,217,038 |
|
|
| ||||||||||||
Total issued |
|
| 67,500,420 |
|
| 971,819,296 |
|
| 80,784,291 |
|
| 1,570,503,870 |
|
Shares redeemed |
|
| (24,634,908 | ) |
| (354,462,635 | ) |
| (12,746,110 | ) |
| (243,684,728 | ) |
|
| ||||||||||||
Net increase |
|
| 42,865,512 |
| $ | 617,356,661 |
|
| 68,038,181 |
| $ | 1,326,819,142 |
|
|
| ||||||||||||
|
|
|
|
|
|
|
|
|
|
|
|
|
|
Investor B |
|
|
|
|
|
|
|
|
|
|
|
|
|
Shares sold |
|
| 1,027,695 |
| $ | 15,096,835 |
|
| 1,850,608 |
| $ | 36,327,081 |
|
Shares issued to shareholders in reinvestment of dividends and distributions |
|
| 43,668 |
|
| 571,254 |
|
| 102,941 |
|
| 2,067,773 |
|
|
| ||||||||||||
Total issued |
|
| 1,071,363 |
|
| 15,668,089 |
|
| 1,953,549 |
|
| 38,394,854 |
|
Shares redeemed and automatic conversion of shares |
|
| (1,048,731 | ) |
| (15,343,958 | ) |
| (1,688,842 | ) |
| (32,992,246 | ) |
|
| ||||||||||||
Net increase |
|
| 22,632 |
| $ | 324,131 |
|
| 264,707 |
| $ | 5,402,608 |
|
|
| ||||||||||||
|
|
|
|
|
|
|
|
|
|
|
|
|
|
Investor C |
|
|
|
|
|
|
|
|
|
|
|
|
|
Shares sold |
|
| 13,668,024 |
| $ | 192,863,775 |
|
| 19,517,178 |
| $ | 374,115,244 |
|
Shares issued resulting from reorganization |
|
| 114 |
|
| 1,474 |
|
| — |
|
| — |
|
Shares issued to shareholders in reinvestment of dividends and distributions |
|
| 339,750 |
|
| 4,341,497 |
|
| 468,965 |
|
| 9,133,821 |
|
|
| ||||||||||||
Total issued |
|
| 14,007,888 |
|
| 197,206,746 |
|
| 19,986,143 |
|
| 383,249,065 |
|
Shares redeemed |
|
| (5,887,764 | ) |
| (82,473,421 | ) |
| (3,378,715 | ) |
| (63,763,675 | ) |
|
| ||||||||||||
Net increase |
|
| 8,120,124 |
| $ | 114,733,325 |
|
| 16,607,428 |
| $ | 319,485,390 |
|
|
| ||||||||||||
|
|
|
48 | SEMI-ANNUAL REPORT | JANUARY 31, 2009 |
|
|
|
|
|
|
|
|
|
|
|
|
|
|
|
|
|
| Six Months Ended |
| Year Ended |
| ||||||||
|
|
| |||||||||||
Equity Dividend (concluded) |
| Shares |
| Amount |
| Shares |
| Amount |
| ||||
Class R |
|
|
|
|
|
|
|
|
|
|
|
|
|
Shares sold |
|
| 5,721,476 |
| $ | 82,972,221 |
|
| 5,837,183 |
| $ | 113,592,642 |
|
Shares issued to shareholders in reinvestment of dividends and distributions |
|
| 112,396 |
|
| 1,471,591 |
|
| 90,780 |
|
| 1,786,737 |
|
|
| ||||||||||||
Total issued |
|
| 5,833,872 |
|
| 84,443,812 |
|
| 5,927,963 |
|
| 115,379,379 |
|
Shares redeemed |
|
| (1,459,251 | ) |
| (20,787,841 | ) |
| (1,080,923 | ) |
| (20,894,468 | ) |
|
| ||||||||||||
Net increase |
|
| 4,374,621 |
| $ | 63,655,971 |
|
| 4,847,040 |
| $ | 94,484,911 |
|
|
| ||||||||||||
|
|
|
|
|
|
|
|
|
|
|
|
|
|
Natural Resources |
|
|
|
|
|
|
|
|
|
|
|
|
|
Institutional |
|
|
|
|
|
|
|
|
|
|
|
|
|
Shares sold |
|
| 334,118 |
| $ | 13,966,678 |
|
| 455,588 |
| $ | 33,979,339 |
|
Shares issued to shareholders in reinvestment of distributions |
|
| 21,733 |
|
| 787,832 |
|
| 43,296 |
|
| 3,017,542 |
|
|
| ||||||||||||
Total issued |
|
| 355,851 |
|
| 14,754,510 |
|
| 498,884 |
|
| 36,996,881 |
|
Shares redeemed |
|
| (400,992 | ) |
| (18,641,492 | ) |
| (371,684 | ) |
| (26,221,322 | ) |
|
| ||||||||||||
Net increase (decrease) |
|
| (45,141 | ) | $ | (3,886,982 | ) |
| 127,200 |
| $ | 10,775,559 |
|
|
| ||||||||||||
|
|
|
|
|
|
|
|
|
|
|
|
|
|
Investor A |
|
|
|
|
|
|
|
|
|
|
|
|
|
Shares sold and automatic conversion of shares |
|
| 829,244 |
| $ | 33,961,738 |
|
| 1,500,327 |
| $ | 108,134,899 |
|
Shares issued to shareholders in reinvestment of distributions |
|
| 78,069 |
|
| 2,776,988 |
|
| 132,467 |
|
| 9,080,524 |
|
|
| ||||||||||||
Total issued |
|
| 907,313 |
|
| 36,738,726 |
|
| 1,632,794 |
|
| 117,215,423 |
|
Shares redeemed |
|
| (994,997 | ) |
| (47,989,317 | ) |
| (937,569 | ) |
| (65,666,264 | ) |
|
| ||||||||||||
Net increase (decrease) |
|
| (87,684 | ) | $ | (11,250,591 | ) |
| 695,225 |
| $ | 51,549,159 |
|
|
| ||||||||||||
|
|
|
|
|
|
|
|
|
|
|
|
|
|
Investor B |
|
|
|
|
|
|
|
|
|
|
|
|
|
Shares sold |
|
| 54,474 |
| $ | 2,193,569 |
|
| 120,456 |
| $ | 8,151,564 |
|
Shares issued to shareholders in reinvestment of distributions |
|
| 12,362 |
|
| 408,559 |
|
| 27,561 |
|
| 1,772,057 |
|
|
| ||||||||||||
Total issued |
|
| 66,836 |
|
| 2,602,128 |
|
| 148,017 |
|
| 9,923,621 |
|
Shares redeemed and automatic conversion of shares |
|
| (175,367 | ) |
| (8,194,715 | ) |
| (242,812 | ) |
| (15,852,040 | ) |
|
| ||||||||||||
Net decrease |
|
| (108,531 | ) | $ | (5,592,587 | ) |
| (94,795 | ) | $ | (5,928,419 | ) |
|
| ||||||||||||
|
|
|
|
|
|
|
|
|
|
|
|
|
|
Investor C |
|
|
|
|
|
|
|
|
|
|
|
|
|
Shares sold |
|
| 334,765 |
| $ | 12,813,933 |
|
| 554,703 |
| $ | 37,046,240 |
|
Shares issued to shareholders in reinvestment of distributions |
|
| 35,669 |
|
| 1,161,401 |
|
| 64,719 |
|
| 4,102,221 |
|
|
| ||||||||||||
Total issued |
|
| 370,434 |
|
| 13,975,334 |
|
| 619,422 |
|
| 41,148,461 |
|
Shares redeemed |
|
| (515,183 | ) |
| (21,919,408 | ) |
| (482,248 | ) |
| (30,863,262 | ) |
|
| ||||||||||||
Net increase (decrease) |
|
| (144,749 | ) | $ | (7,944,074 | ) |
| 137,174 |
| $ | 10,285,199 |
|
|
| ||||||||||||
|
|
|
SEMI-ANNUAL REPORT | JANUARY 31, 2009 | 49 |
|
|
Notes to Financial Statements (continued) |
|
|
|
|
|
|
|
|
|
|
|
|
|
|
|
|
|
|
|
|
|
| Six Months Ended |
| Period December 1, 2007 |
| Year Ended |
| ||||||||||||
Utilities and |
|
|
|
| |||||||||||||||
| Shares |
| Amount |
| Shares |
| Amount |
| Shares |
| Amount |
| |||||||
Institutional |
|
|
|
|
|
|
|
|
|
|
|
|
|
|
|
|
|
|
|
Shares sold |
|
| 83,775 |
| $ | 875,047 |
|
| 117,496 |
| $ | 1,866,129 |
|
| 217,408 |
| $ | 3,497,190 |
|
Shares issued to shareholders in reinvestment of dividends and distributions |
|
| 88,069 |
|
| 846,122 |
|
| 154,025 |
|
| 2,497,817 |
|
| 24,104 |
|
| 396,264 |
|
|
| ||||||||||||||||||
Total issued |
|
| 171,844 |
|
| 1,721,169 |
|
| 271,521 |
|
| 4,363,946 |
|
| 241,512 |
|
| 3,893,454 |
|
Shares redeemed |
|
| (216,094 | ) |
| (2,345,283 | ) |
| (266,658 | ) |
| (4,194,303 | ) |
| (462,683 | ) |
| (7,520,256 | ) |
|
| ||||||||||||||||||
Net increase (decrease) |
|
| (44,250 | ) | $ | (624,114 | ) |
| 4,863 |
| $ | 169,643 |
|
| (221,171 | ) | $ | (3,626,802 | ) |
|
| ||||||||||||||||||
| |||||||||||||||||||
Investor A |
|
|
|
|
|
|
|
|
|
|
|
|
|
|
|
|
|
|
|
Shares sold and automatic conversion of shares |
|
| 327,499 |
| $ | 3,723,323 |
|
| 801,097 |
| $ | 13,042,209 |
|
| 862,897 |
| $ | 13,948,915 |
|
Shares issued to shareholders in reinvestment of dividends and distributions |
|
| 305,429 |
|
| 2,936,740 |
|
| 527,469 |
|
| 8,564,315 |
|
| 65,005 |
|
| 1,070,888 |
|
|
| ||||||||||||||||||
Total issued |
|
| 632,928 |
|
| 6,660,063 |
|
| 1,328,566 |
|
| 21,606,524 |
|
| 927,902 |
|
| 15,019,803 |
|
Shares redeemed |
|
| (750,662 | ) |
| (8,397,726 | ) |
| (1,086,598 | ) |
| (16,919,890 | ) |
| (1,079,874 | ) |
| (17,445,028 | ) |
|
| ||||||||||||||||||
Net increase (decrease) |
|
| (117,734 | ) | $ | (1,737,663 | ) |
| 241,968 |
| $ | 4,686,634 |
|
| (151,972 | ) | $ | (2,425,225 | ) |
|
| ||||||||||||||||||
| |||||||||||||||||||
Investor B |
|
|
|
|
|
|
|
|
|
|
|
|
|
|
|
|
|
|
|
Shares sold |
|
| 25,276 |
| $ | 275,413 |
|
| 38,992 |
| $ | 622,875 |
|
| 83,999 |
| $ | 1,317,040 |
|
Shares issued to shareholders in reinvestment of dividends and distributions |
|
| 4,063 |
|
| 38,722 |
|
| 6,636 |
|
| 107,088 |
|
| 363 |
|
| 5,996 |
|
|
| ||||||||||||||||||
Total issued |
|
| 29,339 |
|
| 314,135 |
|
| 45,628 |
|
| 729,963 |
|
| 84,362 |
|
| 1,323,036 |
|
Shares redeemed |
|
| (28,902 | ) |
| (316,473 | ) |
| (18,125 | ) |
| (276,076 | ) |
| (25,594 | ) |
| (415,323 | ) |
|
| ||||||||||||||||||
Net increase (decrease) |
|
| 437 |
| $ | (2,338 | ) |
| 27,503 |
| $ | 453,887 |
|
| 58,768 |
| $ | 907,713 |
|
|
| ||||||||||||||||||
| |||||||||||||||||||
Investor B1 |
|
|
|
|
|
|
|
|
|
|
|
|
|
|
|
|
|
|
|
Shares sold |
|
| 26,126 |
| $ | 288,006 |
|
| 19,619 |
| $ | 309,207 |
|
| 53,667 |
| $ | 841,895 |
|
Shares issued to shareholders in reinvestment of dividends and distributions |
|
| 22,984 |
|
| 220,611 |
|
| 54,218 |
|
| 881,620 |
|
| 4,743 |
|
| 77,065 |
|
|
| ||||||||||||||||||
Total issued |
|
| 49,110 |
|
| 508,617 |
|
| 73,837 |
|
| 1,190,827 |
|
| 58,410 |
|
| 918,960 |
|
Shares redeemed and automatic conversion of shares |
|
| (217,518 | ) |
| (2,481,888 | ) |
| (203,847 | ) |
| (3,212,222 | ) |
| (556,886 | ) |
| (8,780,653 | ) |
|
| ||||||||||||||||||
Net decrease |
|
| (168,408 | ) | $ | (1,973,271 | ) |
| (130,010 | ) | $ | (2,021,395 | ) |
| (498,476 | ) | $ | (7,861,693 | ) |
|
| ||||||||||||||||||
|
|
|
50 | SEMI-ANNUAL REPORT | JANUARY 31, 2009 |
|
|
Notes to Financial Statements (concluded) |
|
|
|
|
|
|
|
|
|
|
|
|
|
|
|
|
|
|
|
|
|
| Six Months Ended |
| Period December 1, 2007 |
| Year Ended |
| ||||||||||||
Utilities and |
|
|
|
| |||||||||||||||
| Shares |
| Amount |
| Shares |
| Amount |
| Shares |
| Amount |
| |||||||
Investor C |
|
|
|
|
|
|
|
|
|
|
|
|
|
|
|
|
|
|
|
Shares sold |
|
| 83,180 |
| $ | 881,790 |
|
| 144,664 |
| $ | 2,264,597 |
|
| 231,988 |
| $ | 3,690,344 |
|
Shares issued to shareholders in reinvestment of dividends and distributions |
|
| 14,951 |
|
| 140,531 |
|
| 21,099 |
|
| 335,759 |
|
| 942 |
|
| 15,652 |
|
|
| ||||||||||||||||||
Total issued |
|
| 98,131 |
|
| 1,022,321 |
|
| 165,763 |
|
| 2,600,356 |
|
| 232,930 |
|
| 3,705,996 |
|
Shares redeemed |
|
| (108,236 | ) |
| (1,228,954 | ) |
| (56,639 | ) |
| (861,831 | ) |
| (46,897 | ) |
| (771,783 | ) |
|
| ||||||||||||||||||
Net increase (decrease) |
|
| (10,105 | ) | $ | (206,633 | ) |
| 109,124 |
| $ | 1,738,525 |
|
| 186,033 |
| $ | 2,934,213 |
|
|
| ||||||||||||||||||
| |||||||||||||||||||
Investor C1 |
|
|
|
|
|
|
|
|
|
|
|
|
|
|
|
|
|
|
|
Shares sold |
|
| 20,707 |
| $ | 235,903 |
|
| 32,849 |
| $ | 508,255 |
|
| 53,963 |
| $ | 856,314 |
|
Shares issued to shareholders in reinvestment of dividends and distributions |
|
| 40,317 |
|
| 381,810 |
|
| 77,966 |
|
| 1,251,599 |
|
| 6,160 |
|
| 99,484 |
|
|
| ||||||||||||||||||
Total issued |
|
| 61,024 |
|
| 617,713 |
|
| 110,815 |
|
| 1,759,854 |
|
| 60,123 |
|
| 955,798 |
|
Shares redeemed |
|
| (140,774 | ) |
| (1,547,574 | ) |
| (152,481 | ) |
| (2,335,822 | ) |
| (274,092 | ) |
| (4,252,049 | ) |
|
| ||||||||||||||||||
Net decrease |
|
| (79,750 | ) | $ | (929,861 | ) |
| (41,666 | ) | $ | (575,968 | ) |
| (213,969 | ) | $ | (3,296,251 | ) |
|
| ||||||||||||||||||
|
|
|
SEMI-ANNUAL REPORT | JANUARY 31, 2009 | 51 |
|
|
|
Robert M. Hernandez, Chairman of the Board, Director/Trustee and |
Member of the Audit Committee |
Fred G. Weiss, Vice Chairman of the Board, Chairman of the Audit |
Committee and Director/Trustee |
James H. Bodurtha, Director/Trustee |
Bruce R. Bond, Director/Trustee |
Donald W. Burton, Director/Trustee |
Richard S. Davis, Fund/Trust President1 and Director/Trustee |
Stuart E. Eizenstat, Director/Trustee |
Laurence D. Fink, Director/Trustee |
Kenneth A. Froot, Director/Trustee |
Henry Gabbay, Director/Trustee |
John F. O’Brien, Director/Trustee |
Roberta Cooper Ramo, Director/Trustee |
Jean Margo Reid, Director/Trustee |
David H. Walsh, Director/Trustee |
Richard R. West, Director/Trustee and Member of the Audit Committee |
Donald C. Burke, Fund President2 and Chief Executive Officer |
Anne F. Ackerley, Vice President |
Neal J. Andrews, Chief Financial Officer |
Jay M. Fife, Treasurer |
Brian P. Kindelan, Chief Compliance Officer of the Funds |
Howard B. Surloff, Secretary |
|
|
|
| 1 | Fund/Trust President of BlackRock Equity Dividend Fund and BlackRock Natural Resources Trust. |
|
|
|
| 2 | Fund President of BlackRock Utilities and Telecommunications Fund, Inc. |
|
Custodians |
|
State Street Bank and Trust Company |
Boston, MA 02101 |
|
For BlackRock Natural Resources Trust: |
The Bank of New York |
New York, NY 10286 |
|
For BlackRock Utilities and Telecommunications Fund, Inc.: |
JPMorgan Chase Bank, N.A. |
Brooklyn, NY 11245 |
|
Transfer Agent |
|
Wilmington, DE 19809 |
|
Accounting Agent |
|
Princeton, NJ 08540 |
|
Independent Registered Public Accounting Firm |
|
Princeton, NJ 08540 |
|
Legal Counsel |
|
New York, NY 10019 |
|
|
|
52 | SEMI-ANNUAL REPORT | JANUARY 31, 2009 |
|
|
|
BlackRock Privacy Principles |
BlackRock is committed to maintaining the privacy of its current and former fund investors and individual clients (collectively, “Clients”) and to safeguarding their non-public personal information. The following information is provided to help you understand what personal information BlackRock collects, how we protect that information and why in certain cases we share such information with select parties.
If you are located in a jurisdiction where specific laws, rules or regulations require BlackRock to provide you with additional or different privacy-related rights beyond what is set forth below, then BlackRock will comply with those specific laws, rules or regulations.
BlackRock obtains or verifies personal non-public information from and about you from different sources, including the following: (i) information we receive from you or, if applicable, your financial intermediary, on applications, forms or other documents; (ii) information about your transactions with us, our affiliates, or others; (iii) information we receive from a consumer reporting agency; and (iv) from visits to our websites.
BlackRock does not sell or disclose to non-affiliated third parties any non-public personal information about its Clients, except as permitted by law or as is necessary to respond to regulatory requests or to service Client accounts. These non-affiliated third parties are required to protect the confidentiality and security of this information and to use it only for its intended purpose.
We may share information with our affiliates to service your account or to provide you with information about other BlackRock products or services that may be of interest to you. In addition, BlackRock restricts access to non-public personal information about its Clients to those BlackRock employees with a legitimate business need for the information. BlackRock maintains physical, electronic and procedural safeguards that are designed to protect the non-public personal information of its Clients, including procedures relating to the proper storage and disposal of such information.
|
Availability of Additional Information |
Electronic copies of most financial reports and prospectuses are available on the Funds’ website or shareholders can sign up for e-mail notifications of quarterly statements, annual and semi-annual reports and prospectuses by enrolling in the Funds’ electronic delivery program.
To enroll:
Shareholders Who Hold Accounts with Investment Advisors, Banks or Brokerages:
Please contact your financial advisor. Please note that not all investment advisors, banks or brokerages may offer this service.
Shareholders Who Hold Accounts Directly with BlackRock:
|
|
1) | Access the BlackRock website at |
| http://www.blackrock.com/edelivery |
|
|
2) | Select “eDelivery” under the “More Information” section |
|
|
3) | Log into your account |
Availability of Proxy Voting Policies and Procedures
A description of the policies and procedures that the Funds use to determine how to vote proxies relating to portfolio securities is available (1) without charge, upon request, by calling toll-free (800) 441-7762; (2) at www.blackrock.com; and (3) on the Securities and Exchange Commission’s (the “SEC”) website at http://www.sec.gov.
Availability of Proxy Voting Record
Information about how the Funds vote proxies relating to securities held in the Funds’ portfolios during the most recent 12-month period ended June 30 is available upon request and without charge (1) at www.blackrock.com or by calling (800) 441-7762 and (2) on the SEC’s website at http://www.sec.gov.
|
|
|
SEMI-ANNUAL REPORT | JANUARY 31, 2009 | 53 |
|
|
Additional Information (concluded) |
|
Availability of Additional Information (concluded) |
Availability of Quarterly Portfolio Schedule
The Funds file its complete schedule of portfolio holdings with the SEC for the first and third quarters of each fiscal year on Form N-Q. The Funds’ Forms N-Q are available on the SEC’s website at http://www.sec.gov and may also be reviewed and copied at the SEC’s Public Reference Room in Washington, D.C. Information on the operation of the Public Reference Room may be obtained by calling (800) SEC-0330. The Funds’ Forms N-Q may also be obtained upon request and without charge by calling (800) 441-7762.
Householding
The Funds will mail only one copy of shareholder documents, including prospectuses, annual and semi-annual reports and proxy statements, to shareholders with multiple accounts at the same address. This practice is commonly called “householding” and it is intended to reduce expenses and eliminate duplicate mailings of shareholder documents. Mailings of your shareholder documents may be householded indefinitely unless you instruct us otherwise. If you do not want the mailing of these documents to be combined with those for other members of your household, please contact the Fund at (800) 441-7762.
|
Shareholder Privileges |
Account Information
Call us at (800) 441-7762 from 8:00 AM to 6:00 PM EST to get information about your account balances, recent transactions and share prices. You can also reach us on the Web at www.blackrock.com/funds.
Automatic Investment Plans
Investor Class shareholders who want to invest regularly can arrange to have $50 or more automatically deducted from their checking or savings account and invested in any of the BlackRock funds.
Systematic Withdrawal Plans
Investor Class shareholders can establish a systematic withdrawal plan and receive periodic payments of $50 or more from their BlackRock funds, as long as their account is at least $10,000.
Retirement Plans
Shareholders may make investments in conjunction with Traditional, Rollover, Roth, Coverdell, Simple IRAs, SEP IRAs and 403(b) Plans.
|
|
|
54 | SEMI-ANNUAL REPORT | JANUARY 31, 2009 |
|
|
|
BlackRock offers a diverse lineup of open-end mutual funds crossing all investment styles and managed by experts in equity, fixed income and tax-exempt investing. |
|
Equity Funds |
|
BlackRock All-Cap Energy & Resources Portfolio |
BlackRock Asset Allocation Portfolio† |
BlackRock Aurora Portfolio |
BlackRock Balanced Capital Fund† |
BlackRock Basic Value Fund |
BlackRock Capital Appreciation Portfolio |
BlackRock Energy & Resources Portfolio |
BlackRock Equity Dividend Fund |
BlackRock EuroFund |
BlackRock Focus Growth Fund |
BlackRock Focus Value Fund |
BlackRock Fundamental Growth Fund |
BlackRock Global Allocation Fund† |
BlackRock Global Dynamic Equity Fund |
BlackRock Global Emerging Markets Fund |
BlackRock Global Financial Services Fund |
BlackRock Global Growth Fund |
BlackRock Global Opportunities Portfolio |
BlackRock Global SmallCap Fund |
BlackRock Health Sciences Opportunities Portfolio |
BlackRock Healthcare Fund |
BlackRock Index Equity Portfolio* |
BlackRock International Fund |
BlackRock International Diversification Fund |
BlackRock International Index Fund |
BlackRock International Opportunities Portfolio |
BlackRock International Value Fund |
BlackRock Large Cap Core Fund |
BlackRock Large Cap Core Plus Fund |
BlackRock Large Cap Growth Fund |
BlackRock Large Cap Value Fund |
BlackRock Latin America Fund |
BlackRock Mid-Cap Growth Equity Portfolio |
BlackRock Mid-Cap Value Equity Portfolio |
BlackRock Mid Cap Value Opportunities Fund |
BlackRock Natural Resources Trust |
BlackRock Pacific Fund |
BlackRock Science & Technology |
Opportunities Portfolio |
BlackRock Small Cap Core Equity Portfolio |
BlackRock Small Cap Growth Equity Portfolio |
BlackRock Small Cap Growth Fund II |
BlackRock Small Cap Index Fund |
BlackRock Small Cap Value Equity Portfolio* |
BlackRock Small/Mid-Cap Growth Portfolio |
BlackRock S&P 500 Index Fund |
BlackRock U.S. Opportunities Portfolio |
BlackRock Utilities and Telecommunications Fund |
BlackRock Value Opportunities Fund |
|
Fixed Income Funds |
|
BlackRock Emerging Market Debt Portfolio |
BlackRock Enhanced Income Portfolio |
BlackRock GNMA Portfolio |
BlackRock Government Income Portfolio |
BlackRock High Income Fund |
BlackRock High Yield Bond Portfolio |
BlackRock Income Portfolio† |
BlackRock Income Builder Portfolio† |
BlackRock Inflation Protected Bond Portfolio |
BlackRock Intermediate Bond Portfolio II |
BlackRock Intermediate Government Bond Portfolio |
BlackRock International Bond Portfolio |
BlackRock Long Duration Bond Portfolio |
BlackRock Low Duration Bond Portfolio |
BlackRock Managed Income Portfolio |
BlackRock Short-Term Bond Fund |
BlackRock Strategic Income Portfolio |
BlackRock Total Return Fund |
BlackRock Total Return Portfolio II |
BlackRock World Income Fund |
|
Municipal Bond Funds |
|
BlackRock AMT-Free Municipal Bond Portfolio |
BlackRock California Insured Municipal Bond Fund |
BlackRock Delaware Municipal Bond Portfolio |
BlackRock High Yield Municipal Fund |
BlackRock Intermediate Municipal Fund |
BlackRock Kentucky Municipal Bond Portfolio |
BlackRock Municipal Insured Fund |
BlackRock National Municipal Fund |
BlackRock New Jersey Municipal Bond Fund |
BlackRock New York Municipal Bond Fund |
BlackRock Ohio Municipal Bond Portfolio |
BlackRock Pennsylvania Municipal Bond Fund |
BlackRock Short-Term Municipal Fund |
|
Target Risk & Target Date Funds |
|
BlackRock Prepared Portfolios |
Conservative Prepared Portfolio |
Moderate Prepared Portfolio |
Growth Prepared Portfolio |
Aggressive Growth Prepared Portfolio |
BlackRock Lifecycle Prepared Portfolios |
Prepared Portfolio 2010 |
Prepared Portfolio 2015 |
Prepared Portfolio 2020 |
Prepared Portfolio 2025 |
Prepared Portfolio 2030 |
Prepared Portfolio 2035 |
Prepared Portfolio 2040 |
Prepared Portfolio 2045 |
Prepared Portfolio 2050 |
|
|
|
| * | See the prospectus for information on specific limitations on investments in the fund. |
|
|
|
| † | Mixed asset fund. |
BlackRock mutual funds are currently distributed by BlackRock Investments, Inc. You should consider the investment objectives, risks, charges and expenses of the funds under consideration carefully before investing. Each fund’s prospectus contains this and other information and is available at www.blackrock.com or by calling (800) 882-0052 or from your financial advisor. The prospectus should be read carefully before investing.
|
|
|
SEMI-ANNUAL REPORT | JANUARY 31, 2009 | 55 |

This report is not authorized for use as an offer of sale or a solicitation of an offer to buy shares of the Funds unless accompanied or preceded by the Funds’ current prospectus. Past performance results shown in this report should not be considered a representation of future performance. Investment returns and principal value of shares will fluctuate so that shares, when redeemed, may be worth more or less than their original cost. Statements and other information herein are as dated and are subject to change.
BlackRock Equity Dividend Fund
BlackRock Natural Resources Trust
BlackRock Utilities and Telecommunications Fund, Inc.
100 Bellevue Parkway
Wilmington, DE 19809

#EDNRUT-SAR-1/09
|
|
Item 2 – | Code of Ethics – Not Applicable to this semi-annual report |
|
|
Item 3 – | Audit Committee Financial Expert – Not Applicable to this semi-annual report |
|
|
Item 4 – | Principal Accountant Fees and Services – Not Applicable to this semi-annual report |
|
|
Item 5 – | Audit Committee of Listed Registrants – Not Applicable |
|
|
Item 6 – | Investments |
|
|
| (a) The registrant’s Schedule of Investments is included as part of the Report to Stockholders filed under Item 1 of this form. |
|
|
| (b) Not Applicable due to no such divestments during the semi-annual period covered since the previous Form N-CSR filing. |
|
|
Item 7 – | Disclosure of Proxy Voting Policies and Procedures for Closed-End Management Investment Companies – Not Applicable |
|
|
Item 8 – | Portfolio Managers of Closed-End Management Investment Companies – Not Applicable |
|
|
Item 9 – | Purchases of Equity Securities by Closed-End Management Investment Company and Affiliated Purchasers – Not Applicable |
|
|
Item 10 – | Submission of Matters to a Vote of Security Holders – The registrant’s Nominating and Governance Committee will consider nominees to the board of directors recommended by shareholders when a vacancy becomes available. Shareholders who wish to recommend a nominee should send nominations that include biographical information and set forth the qualifications of the proposed nominee to the registrant’s Secretary. There have been no material changes to these procedures. |
|
|
Item 11 – | Controls and Procedures |
|
|
11(a) – | The registrant’s principal executive and principal financial officers or persons performing similar functions have concluded that the registrant’s disclosure controls and procedures (as defined in Rule 30a-3(c) under the Investment Company Act of 1940, as amended (the “1940 Act”)) are effective as of a date within 90 days of the filing of this report based on the evaluation of these controls and procedures required by Rule 30a-3(b) under the 1940 Act and Rule 15(d)-15(b) under the Securities Exchange Act of 1934, as amended. |
|
|
11(b) – | There were no changes in the registrant’s internal control over financial reporting (as defined in Rule 30a-3(d) under the 1940 Act) that occurred during the second fiscal quarter of the period covered by this report that have materially affected, or are reasonably likely to materially affect, the registrant’s internal control over financial reporting. |
|
|
Item 12 – | Exhibits attached hereto |
|
|
12(a)(1) – Code of Ethics – Not Applicable to this semi-annual report | |
|
|
12(a)(2) – Certifications – Attached hereto | |
|
|
12(a)(3) – Not Applicable | |
|
|
12(b) – Certifications – Attached hereto | |
|
|
|
| Pursuant to the requirements of the Securities Exchange Act of 1934 and the Investment Company Act of 1940, the registrant has duly caused this report to be signed on its behalf by the undersigned, thereunto duly authorized. | |
|
|
|
| BlackRock Utilities & Telecommunications Fund, Inc. | |
|
| |
| By: | /s/ Donald C. Burke |
|
| |
|
| Donald C. Burke |
|
| Chief Executive Officer of |
|
| BlackRock Utilities & Telecommunications Fund, Inc. |
|
|
|
| Date: March 25, 2009 | |
|
| |
| Pursuant to the requirements of the Securities Exchange Act of 1934 and the Investment Company Act of 1940, this report has been signed below by the following persons on behalf of the registrant and in the capacities and on the dates indicated. | |
|
|
|
| By: | /s/ Donald C. Burke |
|
| |
|
| Donald C. Burke |
|
| Chief Executive Officer (principal executive officer) of |
|
| BlackRock Utilities & Telecommunications Fund, Inc. |
|
|
|
| Date: March 25, 2009 | |
|
|
|
| By: | /s/ Neal J. Andrews |
|
| |
|
| Neal J. Andrews |
|
| Chief Financial Officer (principal financial officer) of |
|
| BlackRock Utilities & Telecommunications Fund, Inc. |
|
|
|
| Date: March 25, 2009 | |