Exhibit 99.1
TELUS CORPORATION
CONSOLIDATED FINANCIAL STATEMENTS
DECEMBER 31, 2016
report of management on internal control over financial reporting
Management of TELUS Corporation (TELUS, or the Company) is responsible for establishing and maintaining adequate internal control over financial reporting and for its assessment of the effectiveness of internal control over financial reporting.
TELUS’ President and Chief Executive Officer and Executive Vice-President and Chief Financial Officer have assessed the effectiveness of the Company’s internal control over financial reporting as of December 31, 2016, in accordance with the criteria established in Internal Control — Integrated Framework (2013) issued by the Committee of Sponsoring Organizations of the Treadway Commission. Internal control over financial reporting is a process designed by, or under the supervision of, the President and Chief Executive Officer and the Executive Vice-President and Chief Financial Officer and effected by the Board of Directors, management and other personnel to provide reasonable assurance regarding the reliability of financial reporting and the preparation of financial statements for external purposes in accordance with generally accepted accounting principles.
Due to its inherent limitations, internal control over financial reporting may not prevent or detect misstatements on a timely basis. Also, projections of any evaluation of the effectiveness of internal control over financial reporting to future periods are subject to the risk that the controls may become inadequate because of changes in conditions, or that the degree of compliance with the policies or procedures may deteriorate. Based on the assessment referenced in the preceding paragraph, management has determined that the Company’s internal control over financial reporting is effective as of December 31, 2016. In connection with this assessment, no material weaknesses in the Company’s internal control over financial reporting were identified by management as of December 31, 2016.
Deloitte LLP, an Independent Registered Public Accounting Firm, audited the Company’s Consolidated financial statements for the year ended December 31, 2016, and as stated in the Report of Independent Registered Public Accounting Firm, they have expressed an unqualified opinion on the effectiveness of the Company’s internal control over financial reporting as of December 31, 2016.
/s/ “Doug French” |
| /s/ “Darren Entwistle” |
|
|
|
Doug French |
| Darren Entwistle |
Executive Vice-President |
| President |
and Chief Financial Officer |
| and Chief Executive Officer |
February 9, 2017 |
| February 9, 2017 |
![]()
report of independent registered public accounting firm
To the Board of Directors and Shareholders of TELUS Corporation
We have audited the accompanying consolidated financial statements of TELUS Corporation and subsidiaries (the Company), which comprise the consolidated statements of financial position as at December 31, 2016 and 2015, and the consolidated statements of income and other comprehensive income, consolidated statements of changes in owners’ equity and consolidated statements of cash flows for the years then ended, and a summary of significant accounting policies and other explanatory information.
Management’s Responsibility for the Consolidated Financial Statements
Management is responsible for the preparation and fair presentation of these consolidated financial statements in accordance with International Financial Reporting Standards as issued by the International Accounting Standards Board, and for such internal control as management determines is necessary to enable the preparation of consolidated financial statements that are free from material misstatement, whether due to fraud or error.
Auditors’ Responsibility
Our responsibility is to express an opinion on these consolidated financial statements based on our audits. We conducted our audits in accordance with Canadian generally accepted auditing standards and the standards of the Public Company Accounting Oversight Board (United States). Those standards require that we comply with ethical requirements and plan and perform the audit to obtain reasonable assurance about whether the consolidated financial statements are free from material misstatement.
An audit involves performing procedures to obtain audit evidence about the amounts and disclosures in the consolidated financial statements. The procedures selected depend on the auditor’s judgment, including the assessment of the risks of material misstatement of the consolidated financial statements, whether due to fraud or error. In making those risk assessments, the auditor considers internal control relevant to the entity’s preparation and fair presentation of the consolidated financial statements in order to design audit procedures that are appropriate in the circumstances. An audit also includes evaluating the appropriateness of accounting policies used and the reasonableness of accounting estimates made by management, as well as evaluating the overall presentation of the consolidated financial statements.
We believe that the audit evidence we have obtained in our audits is sufficient and appropriate to provide a basis for our audit opinion.
Opinion
In our opinion, the consolidated financial statements present fairly, in all material respects, the financial position of TELUS Corporation and subsidiaries as at December 31, 2016 and 2015, and their financial performance and their cash flows for the years then ended, in accordance with International Financial Reporting Standards as issued by the International Accounting Standards Board.
Other Matter
We have also audited, in accordance with the standards of the Public Company Accounting Oversight Board (United States), the Company’s internal control over financial reporting as at December 31, 2016, based on the criteria established in Internal Control — Integrated Framework (2013) issued by the Committee of Sponsoring Organizations of the Treadway Commission and our report dated February 9, 2017, expressed an unqualified opinion on the Company’s internal control over financial reporting.
| /s/ “Deloitte LLP” |
|
|
| Deloitte LLP |
| Chartered Professional Accountants |
| Vancouver, Canada |
| February 9, 2017 |
![]()
report of independent registered public accounting firm
To the Board of Directors and Shareholders of TELUS Corporation
We have audited the internal control over financial reporting of TELUS Corporation and subsidiaries (the Company) as of December 31, 2016, based on the criteria established in Internal Control — Integrated Framework (2013) issued by the Committee of Sponsoring Organizations of the Treadway Commission. The Company’s management is responsible for maintaining effective internal control over financial reporting and for its assessment of the effectiveness of internal control over financial reporting, included in the accompanying Report of Management on Internal Control over Financial Reporting. Our responsibility is to express an opinion on the Company’s internal control over financial reporting based on our audit.
We conducted our audit in accordance with the standards of the Public Company Accounting Oversight Board (United States). Those standards require that we plan and perform the audit to obtain reasonable assurance about whether effective internal control over financial reporting was maintained in all material respects. Our audit included obtaining an understanding of internal control over financial reporting, assessing the risk that a material weakness exists, testing and evaluating the design and operating effectiveness of internal control based on the assessed risk, and performing such other procedures as we considered necessary in the circumstances. We believe that our audit provides a reasonable basis for our opinion.
A company’s internal control over financial reporting is a process designed by, or under the supervision of, the company’s principal executive and principal financial officers, or persons performing similar functions, and effected by the company’s board of directors, management, and other personnel to provide reasonable assurance regarding the reliability of financial reporting and the preparation of financial statements for external purposes in accordance with International Financial Reporting Standards as issued by the International Accounting Standards Board. A company’s internal control over financial reporting includes those policies and procedures that (1) pertain to the maintenance of records that, in reasonable detail, accurately and fairly reflect the transactions and dispositions of the assets of the company; (2) provide reasonable assurance that transactions are recorded as necessary to permit preparation of financial statements in accordance with International Financial Reporting Standards as issued by the International Accounting Standards Board, and that receipts and expenditures of the company are being made only in accordance with authorizations of management and directors of the company; and (3) provide reasonable assurance regarding prevention or timely detection of unauthorized acquisition, use, or disposition of the company’s assets that could have a material effect on the financial statements.
Because of the inherent limitations of internal control over financial reporting, including the possibility of collusion or improper management override of controls, material misstatements due to error or fraud may not be prevented or detected on a timely basis. Also, projections of any evaluation of the effectiveness of the internal control over financial reporting to future periods are subject to the risk that the controls may become inadequate because of changes in conditions, or that the degree of compliance with the policies or procedures may deteriorate.
In our opinion, the Company maintained, in all material respects, effective internal control over financial reporting as of December 31, 2016, based on the criteria established in Internal Control — Integrated Framework (2013) issued by the Committee of Sponsoring Organizations of the Treadway Commission.
We have also audited, in accordance with Canadian generally accepted auditing standards and the standards of the Public Company Accounting Oversight Board (United States), the consolidated financial statements as at and for the year ended December 31, 2016, of the Company and our report dated February 9, 2017, expressed an unmodified/unqualified opinion on those financial statements.
| /s/ “Deloitte LLP” |
|
|
| Deloitte LLP |
| Chartered Professional Accountants |
| Vancouver, Canada |
| February 9, 2017 |
![]()
consolidated statements of income and other comprehensive income
Years ended December 31 (millions except per share amounts) |
| Note |
| 2016 |
| 2015 |
| ||
OPERATING REVENUES |
|
|
|
|
|
|
| ||
Service |
|
|
| $ | 12,000 |
| $ | 11,590 |
|
Equipment |
|
|
| 725 |
| 840 |
| ||
Revenues arising from contracts with customers |
|
|
| 12,725 |
| 12,430 |
| ||
Other operating income |
| 6 |
| 74 |
| 72 |
| ||
|
|
|
| 12,799 |
| 12,502 |
| ||
OPERATING EXPENSES |
|
|
|
|
|
|
| ||
Goods and services purchased |
|
|
| 5,631 |
| 5,532 |
| ||
Employee benefits expense |
| 7 |
| 2,939 |
| 2,708 |
| ||
Depreciation |
| 17 |
| 1,564 |
| 1,475 |
| ||
Amortization of intangible assets |
| 18 |
| 483 |
| 434 |
| ||
|
|
|
| 10,617 |
| 10,149 |
| ||
OPERATING INCOME |
|
|
| 2,182 |
| 2,353 |
| ||
Financing costs |
| 8 |
| 520 |
| 447 |
| ||
INCOME BEFORE INCOME TAXES |
|
|
| 1,662 |
| 1,906 |
| ||
Income taxes |
| 9 |
| 426 |
| 524 |
| ||
NET INCOME |
|
|
| 1,236 |
| 1,382 |
| ||
OTHER COMPREHENSIVE INCOME |
| 10 |
|
|
|
|
| ||
Items that may subsequently be reclassified to income |
|
|
|
|
|
|
| ||
Change in unrealized fair value of derivatives designated as cash flow hedges |
|
|
| (20 | ) | (4 | ) | ||
Foreign currency translation adjustment arising from translating financial statements of foreign operations |
|
|
| 5 |
| 25 |
| ||
|
|
|
| (15 | ) | 21 |
| ||
Item never subsequently reclassified to income |
|
|
|
|
|
|
| ||
Employee defined benefit plan re-measurements |
|
|
| — |
| 445 |
| ||
|
|
|
| (15 | ) | 466 |
| ||
COMPREHENSIVE INCOME |
|
|
| $ | 1,221 |
| $ | 1,848 |
|
NET INCOME ATTRIBUTABLE TO: |
|
|
|
|
|
|
| ||
Common Shares |
|
|
| $ | 1,223 |
| $ | 1,382 |
|
Non-controlling interest |
|
|
| 13 |
| — |
| ||
|
|
|
| $ | 1,236 |
| $ | 1,382 |
|
COMPREHENSIVE INCOME ATTRIBUTABLE TO: |
|
|
|
|
|
|
| ||
Common Shares |
|
|
| $ | 1,206 |
| $ | 1,848 |
|
Non-controlling interest |
|
|
| 15 |
| — |
| ||
|
|
|
| $ | 1,221 |
| $ | 1,848 |
|
NET INCOME PER COMMON SHARE |
| 11 |
|
|
|
|
| ||
Basic |
|
|
| $ | 2.06 |
| $ | 2.29 |
|
Diluted |
|
|
| $ | 2.06 |
| $ | 2.29 |
|
|
|
|
|
|
|
|
| ||
TOTAL WEIGHTED AVERAGE COMMON SHARES OUTSTANDING |
|
|
|
|
|
|
| ||
Basic |
|
|
| 592 |
| 603 |
| ||
Diluted |
|
|
| 593 |
| 604 |
| ||
The accompanying notes are an integral part of these consolidated financial statements.
![]()
consolidated statements of financial position
As at December 31 (millions) |
| Note |
| 2016 |
| 2015 |
| ||
ASSETS |
|
|
|
|
|
|
| ||
Current assets |
|
|
|
|
|
|
| ||
Cash and temporary investments, net |
|
|
| $ | 432 |
| $ | 223 |
|
Accounts receivable |
| 16 |
| 1,471 |
| 1,428 |
| ||
Income and other taxes receivable |
|
|
| 9 |
| 1 |
| ||
Inventories |
| 1(p) |
| 318 |
| 360 |
| ||
Prepaid expenses |
|
|
| 233 |
| 213 |
| ||
Real estate joint venture advances |
| 21(c) |
| — |
| 66 |
| ||
Current derivative assets |
| 4(h) |
| 11 |
| 40 |
| ||
|
|
|
| 2,474 |
| 2,331 |
| ||
Non-current assets |
|
|
|
|
|
|
| ||
Property, plant and equipment, net |
| 17 |
| 10,464 |
| 9,736 |
| ||
Intangible assets, net |
| 18 |
| 10,364 |
| 9,985 |
| ||
Goodwill, net |
| 18 |
| 3,787 |
| 3,761 |
| ||
Other long-term assets |
| 20 |
| 640 |
| 593 |
| ||
|
|
|
| 25,255 |
| 24,075 |
| ||
|
|
|
| $ | 27,729 |
| $ | 26,406 |
|
|
|
|
|
|
|
|
| ||
LIABILITIES AND OWNERS’ EQUITY |
|
|
|
|
|
|
| ||
Current liabilities |
|
|
|
|
|
|
| ||
Short-term borrowings |
| 22 |
| $ | 100 |
| $ | 100 |
|
Accounts payable and accrued liabilities |
| 23 |
| 2,330 |
| 1,990 |
| ||
Income and other taxes payable |
|
|
| 37 |
| 108 |
| ||
Dividends payable |
| 12 |
| 284 |
| 263 |
| ||
Advance billings and customer deposits |
| 24 |
| 737 |
| 760 |
| ||
Provisions |
| 25 |
| 124 |
| 197 |
| ||
Current maturities of long-term debt |
| 26 |
| 1,327 |
| 856 |
| ||
Current derivative liabilities |
| 4(h) |
| 12 |
| 2 |
| ||
|
|
|
| 4,951 |
| 4,276 |
| ||
Non-current liabilities |
|
|
|
|
|
|
| ||
Provisions |
| 25 |
| 395 |
| 433 |
| ||
Long-term debt |
| 26 |
| 11,604 |
| 11,182 |
| ||
Other long-term liabilities |
| 27 |
| 736 |
| 688 |
| ||
Deferred income taxes |
| 9(b) |
| 2,107 |
| 2,155 |
| ||
|
|
|
| 14,842 |
| 14,458 |
| ||
Liabilities |
|
|
| 19,793 |
| 18,734 |
| ||
Owners’ equity |
|
|
|
|
|
|
| ||
Common equity |
| 28 |
| 7,917 |
| 7,672 |
| ||
Non-controlling interest |
|
|
| 19 |
| — |
| ||
|
|
|
| 7,936 |
| 7,672 |
| ||
|
|
|
| $ | 27,729 |
| $ | 26,406 |
|
|
|
|
|
|
|
|
| ||
Contingent Liabilities |
| 29 |
|
|
|
|
| ||
The accompanying notes are an integral part of these consolidated financial statements.
Approved by the Directors: |
|
|
|
|
|
/s/ “William A. MacKinnon” |
| /s/ “R.H. Auchinleck” |
|
|
|
William A. MacKinnon |
| R.H. Auchinleck |
Director |
| Director |
![]()
consolidated statements of changes in owners’ equity
|
|
|
| Common equity |
|
|
|
|
| |||||||||||||||||
|
|
|
| Equity contributed |
|
|
| Accumulated |
|
|
|
|
|
|
| |||||||||||
|
|
|
| Common Shares (Note 28) |
|
|
|
|
| other |
|
|
| Non- |
|
|
| |||||||||
|
|
|
| Number |
| Share |
| Contributed |
| Retained |
| comprehensive |
|
|
| controlling |
|
|
| |||||||
(millions) |
| Note |
| of shares |
| capital |
| surplus |
| earnings |
| income |
| Total |
| interest |
| Total |
| |||||||
Balance as at January 1, 2015 |
|
|
| 609 |
| $ | 5,175 |
| $ | 141 |
| $ | 2,100 |
| $ | 38 |
| $ | 7,454 |
|
|
|
|
| ||
Net income |
|
|
| — |
| — |
| — |
| 1,382 |
| — |
| 1,382 |
|
|
|
|
| |||||||
Other comprehensive income |
| 10 |
| — |
| — |
| — |
| 445 |
| 21 |
| 466 |
|
|
|
|
| |||||||
Dividends |
| 12 |
| — |
| — |
| — |
| (1,011 | ) | — |
| (1,011 | ) |
|
|
|
| |||||||
Share option award expense |
| 13(a) |
| — |
| — |
| 1 |
| — |
| — |
| 1 |
|
|
|
|
| |||||||
Share option award net-equity settlement feature |
| 13(d) |
| 1 |
| 7 |
| (7 | ) | — |
| — |
| — |
|
|
|
|
| |||||||
Normal course issuer bid purchase of Common Shares |
|
|
| (16 | ) | (133 | ) | — |
| (502 | ) | — |
| (635 | ) |
|
|
|
| |||||||
Liability for automatic share purchase plan commitment pursuant to normal course issuer bids for Common Shares |
| 28(b) |
|
|
|
|
|
|
|
|
|
|
|
|
|
|
|
|
| |||||||
Reversal of opening liability |
|
|
| — |
| 15 |
| — |
| 60 |
| — |
| 75 |
|
|
|
|
| |||||||
Recognition of closing liability |
|
|
| — |
| (14 | ) | — |
| (46 | ) | — |
| (60 | ) |
|
|
|
| |||||||
Balance as at December 31, 2015 |
|
|
| 594 |
| $ | 5,050 |
| $ | 135 |
| $ | 2,428 |
| $ | 59 |
| $ | 7,672 |
|
|
|
|
| ||
Balance as at January 1, 2016 |
|
|
| 594 |
| $ | 5,050 |
| $ | 135 |
| $ | 2,428 |
| $ | 59 |
| $ | 7,672 |
| $ | — |
| $ | 7,672 |
|
Net income |
|
|
| — |
| — |
| — |
| 1,223 |
| — |
| 1,223 |
| 13 |
| 1,236 |
| |||||||
Other comprehensive income |
| 10 |
| — |
| — |
| — |
| — |
| (17 | ) | (17 | ) | 2 |
| (15 | ) | |||||||
Dividends |
| 12 |
| — |
| — |
| — |
| (1,091 | ) | — |
| (1,091 | ) | — |
| (1,091 | ) | |||||||
Treasury shares acquired |
| 13(a), 28(b) |
| (1 | ) | (45 | ) | — |
| — |
| — |
| (45 | ) | — |
| (45 | ) | |||||||
Shares settled from Treasury |
| 13(a), 28(b) |
| 1 |
| 44 |
| — |
| (3 | ) | — |
| 41 |
| — |
| 41 |
| |||||||
Share option award net-equity settlement feature |
| 13(d) |
| — |
| 2 |
| (2 | ) | — |
| — |
| — |
| — |
| — |
| |||||||
Normal course issuer bid purchase of Common Shares |
|
|
| (4 | ) | (36 | ) | — |
| (129 | ) | — |
| (165 | ) | — |
| (165 | ) | |||||||
Reversal of opening liability for automatic share purchase plan commitment pursuant to normal course issuer bids for Common Shares |
| 28(b) |
| — |
| 14 |
| — |
| 46 |
| — |
| 60 |
| — |
| 60 |
| |||||||
Change in ownership interests of subsidiary |
| 1(a), 31(b) |
| — |
| — |
| 239 |
| — |
| — |
| 239 |
| 4 |
| 243 |
| |||||||
Balance as at December 31, 2016 |
|
|
| 590 |
| $ | 5,029 |
| $ | 372 |
| $ | 2,474 |
| $ | 42 |
| $ | 7,917 |
| $ | 19 |
| $ | 7,936 |
|
The accompanying notes are an integral part of these consolidated financial statements.
![]()
consolidated statements of cash flows
Years ended December 31 (millions) |
| Note |
| 2016 |
| 2015 |
| ||
OPERATING ACTIVITIES |
|
|
|
|
|
|
| ||
Net income |
|
|
| $ | 1,236 |
| $ | 1,382 |
|
Adjustments to reconcile net income to cash provided by operating activities: |
|
|
|
|
|
|
| ||
Depreciation and amortization |
|
|
| 2,047 |
| 1,909 |
| ||
Deferred income taxes |
| 9 |
| (42 | ) | 68 |
| ||
Share-based compensation expense, net |
| 13(a) |
| (2 | ) | (38 | ) | ||
Net employee defined benefit plans expense |
| 14(b),(g) |
| 93 |
| 118 |
| ||
Employer contributions to employee defined benefit plans |
|
|
| (71 | ) | (94 | ) | ||
Other |
|
|
| 29 |
| (3 | ) | ||
Net change in non-cash operating working capital |
| 31(a) |
| (71 | ) | 214 |
| ||
Cash provided by operating activities |
|
|
| 3,219 |
| 3,556 |
| ||
INVESTING ACTIVITIES |
|
|
|
|
|
|
| ||
Cash payments for capital assets, excluding spectrum licences |
| 31(a) |
| (2,752 | ) | (2,522 | ) | ||
Cash payments for spectrum licences |
|
|
| (145 | ) | (2,048 | ) | ||
Cash payments for acquisitions |
|
|
| (90 | ) | (10 | ) | ||
Real estate joint ventures advances and contributions |
| 21(c) |
| (33 | ) | (50 | ) | ||
Real estate joint venture receipts |
| 21(c) |
| 103 |
| 98 |
| ||
Proceeds on dispositions |
|
|
| 3 |
| 52 |
| ||
Other |
|
|
| (9 | ) | 3 |
| ||
Cash used by investing activities |
|
|
| (2,923 | ) | (4,477 | ) | ||
FINANCING ACTIVITIES |
| 31(b) |
|
|
|
|
| ||
Dividends paid to holders of Common Shares |
| 12(a) |
| (1,070 | ) | (992 | ) | ||
Purchase of Common Shares for cancellation |
| 28(b) |
| (179 | ) | (628 | ) | ||
Long-term debt issued |
| 26 |
| 5,726 |
| 8,973 |
| ||
Redemptions and repayment of long-term debt |
| 26 |
| (4,843 | ) | (6,254 | ) | ||
Issue of shares by subsidiary to non-controlling interest |
| 1(a) |
| 294 |
| — |
| ||
Other |
|
|
| (15 | ) | (15 | ) | ||
Cash provided (used) by financing activities |
|
|
| (87 | ) | 1,084 |
| ||
CASH POSITION |
|
|
|
|
|
|
| ||
Increase in cash and temporary investments, net |
|
|
| 209 |
| 163 |
| ||
Cash and temporary investments, net, beginning of period |
|
|
| 223 |
| 60 |
| ||
Cash and temporary investments, net, end of period |
|
|
| $ | 432 |
| $ | 223 |
|
SUPPLEMENTAL DISCLOSURE OF OPERATING CASH FLOWS |
|
|
|
|
|
|
| ||
Interest paid |
|
|
| $ | (510 | ) | $ | (458 | ) |
Interest received |
|
|
| $ | 4 |
| $ | 24 |
|
Income taxes paid, net |
|
|
| $ | (600 | ) | $ | (256 | ) |
The accompanying notes are an integral part of these consolidated financial statements.
![]()
notes to consolidated financial statements
DECEMBER 31, 2016
TELUS Corporation is one of Canada’s largest telecommunications companies, providing a wide range of telecommunications services and products, including wireless and wireline voice and data. Data services include: Internet protocol; television; hosting, managed information technology and cloud-based services; healthcare solutions; and business process outsourcing.
TELUS Corporation was incorporated under the Company Act (British Columbia) on October 26, 1998, under the name BCT.TELUS Communications Inc. (BCT). On January 31, 1999, pursuant to a court-approved plan of arrangement under the Canada Business Corporations Act among BCT, BC TELECOM Inc. and the former Alberta-based TELUS Corporation (TC), BCT acquired all of the shares of BC TELECOM Inc. and TC in exchange for Common Shares and Non-Voting Shares of BCT, and BC TELECOM Inc. was dissolved. On May 3, 2000, BCT changed its name to TELUS Corporation and in February 2005, TELUS Corporation transitioned under the Business Corporations Act (British Columbia), successor to the Company Act (British Columbia). TELUS Corporation maintains its registered office at Floor 7, 510 West Georgia Street, Vancouver, British Columbia, V6B 0M3.
The terms “TELUS”, “we”, “us”, “our” or “ourselves” are used to refer to TELUS Corporation and, where the context of the narrative permits or requires, its subsidiaries.
Notes to consolidated financial statements |
| Page |
General application |
|
|
1. Summary of significant accounting policies |
| 10 |
2. Accounting policy developments |
| 19 |
3. Capital structure financial policies |
| 22 |
4. Financial instruments |
| 24 |
Consolidated results of operations focused |
|
|
5. Segment information |
| 30 |
6. Other operating income |
| 31 |
7. Employee benefits expense |
| 32 |
8. Financing costs |
| 32 |
9. Income taxes |
| 33 |
10. Other comprehensive income |
| 34 |
11. Per share amounts |
| 34 |
12. Dividends per share |
| 35 |
13. Share-based compensation |
| 35 |
14. Employee future benefits |
| 39 |
15. Restructuring and other costs |
| 45 |
Consolidated financial position focused |
|
|
16. Accounts receivable |
| 46 |
17. Property, plant and equipment |
| 46 |
18. Intangible assets and goodwill |
| 47 |
19. Leases |
| 50 |
20. Other long-term assets |
| 51 |
21. Real estate joint ventures |
| 51 |
22. Short-term borrowings |
| 54 |
23. Accounts payable and accrued liabilities |
| 54 |
24. Advance billings and customer deposits |
| 54 |
25. Provisions |
| 54 |
26. Long-term debt |
| 55 |
27. Other long-term liabilities |
| 58 |
28. Common Share capital |
| 58 |
29. Contingent liabilities |
| 59 |
Other |
|
|
30. Related party transactions |
| 62 |
31. Additional statement of cash flow information |
| 63 |
![]()
notes to consolidated financial statements
1 summary of significant accounting policies
Our consolidated financial statements are expressed in Canadian dollars. The generally accepted accounting principles that we use are International Financial Reporting Standards as issued by the International Accounting Standards Board (IFRS-IASB) and Canadian generally accepted accounting principles. The date of our transition to IFRS-IASB was January 1, 2010, and the date of our adoption was January 1, 2011.
Generally accepted accounting principles require that we disclose the accounting policies we have selected in those instances where we have been obligated to choose from among various accounting policies that comply with generally accepted accounting principles. In certain other instances, including those in which no selection among policies is allowed, we are also required to disclose how we have applied certain accounting policies. In the selection and application of accounting policies we consider, among other factors, the fundamental qualitative characteristics of useful financial information, namely relevance and faithful representation. In our assessment, our required accounting policy disclosures are not all equally significant for us, as set out in the accompanying table; their relative significance to us will evolve over time as we do.
These consolidated financial statements for each of the years ended December 31, 2016 and 2015, were authorized by our Board of Directors for issue on February 9, 2017.
|
| Accounting policy requiring a more | ||
Accounting policy |
| Yes |
| No |
General application |
|
|
|
|
(a) Consolidation |
|
|
| X |
(b) Use of estimates and judgments |
| X |
|
|
(c) Financial instruments — recognition and measurement |
|
|
| X |
(d) Hedge accounting |
|
|
| X |
Results of operations focused |
|
|
|
|
(e) Revenue recognition |
| X |
|
|
(f) Government assistance |
|
|
| X |
(g) Cost of acquisition and advertising costs |
|
|
| X |
(h) Research and development |
|
|
| X |
(i) Depreciation, amortization and impairment |
| X |
|
|
(j) Translation of foreign currencies |
|
|
| X |
(k) Income and other taxes |
| X |
|
|
(l) Share-based compensation |
|
|
| X |
(m) Employee future benefit plans |
| X |
|
|
Financial position focused |
|
|
|
|
(n) Cash and temporary investments, net |
|
|
| X |
(o) Sales of trade receivables |
|
|
| X |
(p) Inventories |
|
|
| X |
(q) Property, plant and equipment; intangible assets |
| X |
|
|
(r) Leases |
|
|
| X |
(s) Investments |
|
|
| X |
(a) Consolidation
Our consolidated financial statements include our accounts and the accounts of all of our subsidiaries, the principal one of which is TELUS Communications Inc., in which we have a 100% equity interest. Currently, through a 100% interest in both the TELUS Communications Company partnership and the TELE-MOBILE COMPANY partnership, TELUS Communications Inc. includes substantially all of our wireless and wireline operations.
Our financing arrangements and those of our wholly-owned subsidiaries do not impose restrictions on inter-corporate dividends.
On a continuing basis, we review our corporate organization and effect changes as appropriate so as to enhance the value of TELUS Corporation. This process can, and does, affect which of our subsidiaries are considered principal subsidiaries at any particular point in time.
During the three-month period ended June 30, 2016, there was a change in our ownership interests in our TELUS International (Cda) Inc. subsidiary, which encompasses our TELUS International operations, from the issuing of shares to Baring Private Equity Asia for approximately $302 million, exclusive of net transaction costs. We continue to control and consolidate this subsidiary, and the shares it issued to Baring Private Equity Asia are accounted for as a 35% non-controlling interest. Associated with this transaction, an amount equal to 35% of the net book value of the subsidiary has been credited to non-controlling interest in our Consolidated statement of changes in owners’ equity, and the net balance of the proceeds has been credited to contributed surplus. In connection with the issuance of shares to Baring Private Equity Asia, we have also arranged bank financing in the subsidiary company, as set out in Note 26(f).
(b) Use of estimates and judgments
The preparation of financial statements in conformity with generally accepted accounting principles requires management to make estimates, assumptions and judgments that affect: the reported amounts of assets and liabilities at the date of the
![]()
notes to consolidated financial statements
financial statements; the disclosure of contingent assets and liabilities at the date of the financial statements; and the reported amounts of revenues and expenses during the reporting period. Actual results could differ from those estimates.
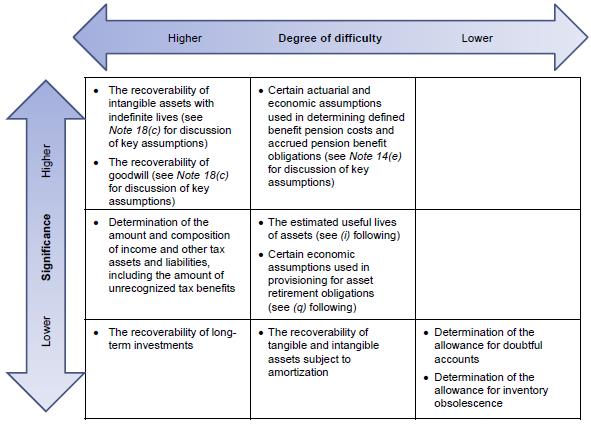
Estimates
Examples of the significant estimates and assumptions that we make, and their relative significance and degree of difficulty, are as set out in the graphic at right.
Judgments
Examples of our significant judgments, apart from those involving estimation, include the following:
· Assessments about whether line items are sufficiently material to warrant separate presentation in the primary financial statements and, if not, whether they are sufficiently material to warrant separate presentation in the notes to the financial statements. In the normal course, we make changes to our assessments regarding materiality for presentation so that they reflect current economic conditions. Due consideration is given to the view that it is reasonable to expect differing opinions of what is, and is not, material.
· In respect of revenue-generating transactions, we must make judgments that affect the timing of the recognition of revenue. See Note 2(b) for significant changes to IFRS-IASB which are not yet effective and have not yet been applied, but which will significantly affect the timing of the recognition of revenue and the classification of our revenues presented as either service or equipment revenues.
· We must make judgments about when we have satisfied our performance obligations to our customers, satisfied either over a period of time or at a point in time. Service revenues are recognized based upon customers’ access to, or usage of, our telecommunications infrastructure; we believe this method faithfully depicts the transfer of the services, and thus the revenues are recognized as the services are made available and/or rendered. We consider our performance obligations arising from the sale of equipment to have been satisfied when the equipment has been delivered to, and accepted by, the end-user customers (see (e) following).
· Principally in the context of revenue-generating transactions involving wireless handsets, we must make judgments about whether third-party re-sellers that deliver equipment to our customers are acting in the transaction as principals or as our agents. Upon due consideration of the relevant indicators, we believe the decision to consider the re-sellers to be acting, solely for accounting purposes, as our agents is more representative of the economic substance of the transactions, as we are the primary obligor to the end-user customers. The effect of this judgment is that no equipment revenue is recognized upon the transfer of inventory to third-party re-sellers.
· The decision to depreciate and amortize any property, plant, equipment and intangible assets that are subject to amortization on a straight-line basis, as we believe that this method reflects the consumption of resources related to the economic lifespan of those assets better than an accelerated method and is more representative of the economic substance of the underlying use of those assets.
· The preparation of financial statements in accordance with generally accepted accounting principles requires management to make judgments that affect the financial statement disclosure of information regularly reviewed by our chief operating decision-maker used to make resource allocation decisions and to assess performance (segment information, Note 5). A significant judgment we make is in respect of distinguishing between our wireless and
![]()
notes to consolidated financial statements
wireline operations and cash flows, such distinction having been significantly affected by the convergence and integration of our wireless and wireline telecommunications infrastructure technology and operations.
Through December 31, 2015, our judgment was that our wireless and wireline telecommunications infrastructure technology and operations had not experienced sufficient convergence to objectively make their respective operations and cash flows practically indistinguishable. The continued build-out of our technology-agnostic fibre-optic infrastructure, in combination with converged edge network technology, has significantly affected this judgment, as has the commercialization of fixed-wireless solutions.
It has become increasingly impractical to objectively distinguish between our wireless and wireline operations and cash flows, and the assets from which those cash flows arise. Our judgment as to whether these operations can continue to be judged to be individual components of the business and discrete operating segments may change in the future.
The increasing impracticality of objectively distinguishing between our wireless and wireline cash flows, and the assets from which those cash flows arise, is evidence of their increasing interdependence; this may result in the unification of the wireless cash-generating unit and the wireline cash-generating unit as a single cash-generating unit for impairment testing purposes in the future.
· The view that our spectrum licences granted by Innovation, Science and Economic Development Canada will likely be renewed by Innovation, Science and Economic Development Canada; that we intend to renew them; that we believe we have the financial and operational ability to renew them; and thus, they have an indefinite life, as discussed further in Note 18(b).
· In connection with the annual impairment testing of intangible assets with indefinite lives and goodwill, there are instances in which we must exercise judgment in allocating our net assets, including shared corporate and administrative assets, to our cash-generating units when determining their carrying amounts. These judgments are necessary because of the convergence our wireless and wireline telecommunications infrastructure technology and operations have experienced to date, and because of our continuous development. There are instances in which similar judgments must also be made in respect of future capital expenditures in support of both wireless and wireline operations, which are a component of the determination of recoverable amounts used in the annual impairment testing, as discussed further in Note 18(c).
· In respect of claims and lawsuits, as discussed further in Note 29(a), the determination of whether an item is a contingent liability or whether an outflow of resources is probable and thus needs to be accounted for as a provision.
(c) Financial instruments — recognition and measurement
In respect of the recognition and measurement of financial instruments, we have adopted the following policies:
|
| Accounting classification | ||||||||
Financial instrument |
| Fair value |
| Loans and |
| Available- |
| Other liabilities |
| Part of a cash |
Measured at amortized cost |
|
|
|
|
|
|
|
|
|
|
Accounts receivable |
|
|
| X |
|
|
|
|
|
|
Construction credit facilities advances to real estate joint ventures |
|
|
| X |
|
|
|
|
|
|
Short-term obligations |
|
|
|
|
|
|
| X |
|
|
Accounts payable |
|
|
|
|
|
|
| X |
|
|
Provisions |
|
|
|
|
|
|
| X |
|
|
Long-term debt |
|
|
|
|
|
|
| X |
|
|
Measured at fair value |
|
|
|
|
|
|
|
|
|
|
Cash and temporary investments |
| X |
|
|
|
|
|
|
|
|
Long-term investments (not subject to significant influence) 4 |
|
|
|
|
| X |
|
|
|
|
Foreign exchange derivatives |
| X |
|
|
|
|
|
|
| X |
Share-based compensation derivatives |
| X |
|
|
|
|
|
|
| X |
(1) Classification includes financial instruments held for trading. Certain qualifying financial instruments that are not required to be classified as held for trading may be classified as held for trading if we so choose.
(2) Unrealized changes in the fair values of financial instruments are included in net income.
(3) Unrealized changes in the fair values of financial instruments classified as available-for-sale, or the effective portion of unrealized changes in the fair values of financial instruments held for hedging, are included in other comprehensive income.
(4) Long-term investments over which we do not have significant influence are classified as available-for-sale. In respect of investments in securities for which the fair values can be reliably measured, we determine the classification on an instrument-by-instrument basis at the time of initial recognition.
![]()
notes to consolidated financial statements
· Trade receivables that may be sold to an arm’s-length securitization trust are accounted for as loans and receivables. We have selected this classification as the benefits of selecting the available-for-sale classification were not expected to exceed the costs of selecting and implementing that classification.
· Long-term investments over which we do not have significant influence are accounted for as available-for-sale. We have selected this classification as we believe that it better reflects management’s investment intentions.
· Derivatives that are part of an established and documented cash flow hedging relationship are accounted for as held for hedging. We believe that classification as held for hedging results in a better matching of the change in the fair value of the derivative financial instrument with the risk exposure being hedged.
In respect of hedges of anticipated transactions, which for us may include those related to inventory purchase commitments, hedge gains/losses are included in the cost of the inventory and are expensed when the inventory is sold. We have selected this method as we believe that it results in a better matching of the hedge gains/losses with the risk exposure being hedged.
Derivatives that are not part of a documented cash flow hedging relationship are accounted for as held for trading and thus are measured at fair value through net income.
· Regular-way purchases or sales of financial assets or financial liabilities (purchases or sales that require actual delivery of financial assets or financial liabilities) are recognized on the settlement date. We have selected this method as the benefits of using the trade date method were not expected to exceed the costs of selecting and implementing that method.
· Transaction costs, other than in respect of items held for trading, are added to the initial fair value of the acquired financial asset or financial liability. We have selected this method as we believe that it results in a better matching of the transaction costs with the periods in which we benefit from the transaction costs.
(d) Hedge accounting
General
We apply hedge accounting to the financial instruments used to: establish designated currency hedging relationships for certain U.S. dollar-denominated future purchase commitments and debt repayments, as set out in Note 4(d); and fix the compensation cost arising from specific grants of restricted stock units, as set out in Note 4(f) and further discussed in Note 13(b).
Hedge accounting
The purpose of hedge accounting, in respect of our designated hedging relationships, is to ensure that counterbalancing gains and losses are recognized in the same periods. We have chosen to apply hedge accounting as we believe this is more representative of the economic substance of the underlying transactions.
In order to apply hedge accounting, a high correlation (which indicates effectiveness) is required in the offsetting changes in the values of the financial instruments (the hedging items) used to establish the designated hedging relationships and all, or a part, of the asset, liability or transaction having an identified risk exposure that we have taken steps to modify (the hedged items). We assess the anticipated effectiveness of designated hedging relationships at inception and their actual effectiveness for each reporting period thereafter. We consider a designated hedging relationship to be effective if the following critical terms match between the hedging item and the hedged item: the notional amount of the hedging item and the principal amount of the hedged item; maturity dates; payment dates; and interest rate index (if, and as, applicable). As set out in Note 4(i), any ineffectiveness, such as would result from a difference between the notional amount of the hedging item and the principal amount of the hedged item, or from a previously effective designated hedging relationship becoming ineffective, is reflected in the Consolidated statements of income and other comprehensive income as Financing costs if in respect of long-term debt, as Goods and services purchased if in respect of U.S. dollar-denominated future purchase commitments or as Employee benefits expense if in respect of share-based compensation.
Hedging assets and liabilities
In the application of hedge accounting, an amount (the hedge value) is recorded in the Consolidated statements of financial position in respect of the fair value of the hedging items. The net difference, if any, between the amounts recognized in the determination of net income and the amounts necessary to reflect the fair value of the designated cash flow hedging items recorded in the Consolidated statements of financial position is recognized as a component of Other comprehensive income, as set out in Note 10.
In the application of hedge accounting to the compensation cost arising from share-based compensation, the amount recognized in the determination of net income is the amount that counterbalances the difference between the quoted market price of our Common Shares at the statement of financial position date and the price of our Common Shares in the hedging items.
![]()
notes to consolidated financial statements
(e) Revenue recognition
General
We earn the majority of our revenues (wireless: network revenues (voice and data); wireline: data revenues (which include: Internet protocol; television; hosting, managed information technology and cloud-based services; business process outsourcing; and certain healthcare solutions) and voice revenues) from access to, and usage of, our telecommunications infrastructure. The majority of the balance of our revenues (wireless equipment and other) arises from providing services and products facilitating access to, and usage of, our telecommunications infrastructure.
We offer complete and integrated solutions to meet our customers’ needs. These solutions may involve deliveries of multiple services and products that occur at different points in time and/or over different periods of time; as referred to in (b), this is a significant judgment for us. As appropriate, these multiple element arrangements are separated into their component accounting units, consideration is measured and allocated among the accounting units based upon their relative fair values (derived using Company-specific objective evidence) and then our relevant revenue recognition policies are applied to the accounting units. (We estimate that more than two-thirds of our revenues arise from multiple element arrangements.) A limitation cap restricts the consideration allocated to services or products currently transferred in multiple element arrangements to an amount that is not contingent upon either delivering additional items or meeting other specified performance conditions. Our view is that the limitation cap results in a faithful depiction of the transfer of services and products, as it reflects the telecommunications industry’s generally accepted understanding of the transfer of services and products, while also reflecting the related cash flows; however, a new revenue accounting standard, which has not yet been applied and must be adopted by January 1, 2018, prohibits the use of a limitation cap, as discussed further in Note 2.
When we receive no identifiable, separable benefit for consideration given to a customer (e.g. discounts and rebates), the consideration is recorded as a reduction of revenue rather than as an expense.
Multiple contracts with a single customer are normally accounted for as separate arrangements. In instances where multiple contracts are entered into with a customer in a short period of time, the contracts are reviewed as a group to ensure that, as with multiple element arrangements, their relative fair values are appropriate.
Lease accounting is applied to an accounting unit if it conveys to a customer the right to use a specific asset but does not convey the risks and/or benefits of ownership.
Our revenues are recorded net of any value-added and/or sales taxes billed to the customer concurrent with a revenue-generating transaction.
Voice and data
We recognize revenues on an accrual basis and include an estimate of revenues earned but unbilled. Wireless and wireline service revenues are recognized based upon access to, and usage of, our telecommunications infrastructure and upon contract fees.
Advance billings are recorded when billing occurs prior to provision of the associated services; such advance billings are recognized as revenue in the period in which the services are provided. Similarly, and as appropriate, upfront customer activation and connection fees are deferred and recognized over the average expected term of the customer relationship.
We use the liability method of accounting for the amounts of our quality of service rate rebates that arise from the jurisdiction of the Canadian Radio-television and Telecommunications Commission (CRTC).
The CRTC has established a mechanism to subsidize local exchange carriers, such as ourselves, that provide residential basic telephone service to high cost serving areas. The CRTC has determined the per network access line/per band subsidy rate for all local exchange carriers. We recognize the subsidy on an accrual basis by applying the subsidy rate to the number of residential network access lines we provide in high cost serving areas, as further discussed in Note 6. Differences, if any, between interim and final subsidy rates set by the CRTC are accounted for as a change in estimate in the period in which the CRTC finalizes the subsidy rate.
Other and wireless equipment
We recognize product revenues, including amounts related to wireless handsets sold to re-sellers and customer premises equipment, when the products are both delivered to and accepted by the end-user customers irrespective of which supply channel delivers the product. With respect to wireless handsets sold to re-sellers, we consider ourselves to be the principal and primary obligor to the end-user customers. Revenues from operating leases of equipment are recognized on a systematic and rational basis (normally a straight-line basis) over the term of the lease.
Non-high cost serving area deferral account
In an effort to foster competition for residential basic service in non-high cost serving areas, the concept of a deferral account mechanism was introduced by the CRTC in 2002 as an alternative to mandating price reductions. We use the
![]()
notes to consolidated financial statements
liability method of accounting for the deferral account. We discharge the deferral account liability by undertaking qualifying actions. We recognize the amortization (over a period no longer than three years) of a proportionate share of the deferral account as qualifying actions are completed. Such amortization is included as a component of government assistance in Other operating income, as set out in Note 6.
(f) Government assistance
We recognize government assistance amounts on an accrual basis as the subsidized services are provided or as the subsidized costs are incurred. As set out in Note 6, government assistance amounts are included in the Consolidated statements of income and other comprehensive income as Other operating income.
(g) Cost of acquisition and advertising costs
The total cost of wireless equipment sold to customers and any commissions and advertising and promotion costs related to initial customer acquisition are expensed as incurred; the cost of equipment we own that is situated at customers’ premises and associated installation costs are capitalized as incurred. Costs of acquiring customers that are expensed are included in the Consolidated statements of income and other comprehensive income as a component of Goods and services purchased, with the exception of amounts paid to our employees, which are included as Employee benefits expense. Costs of advertising production, advertising airtime and advertising space are expensed as incurred.
See Note 2(b) for significant changes to IFRS-IASB that are not yet effective and have not yet been applied, but will significantly affect the timing of recognition of costs of acquiring customers.
(h) Research and development
Research and development costs are expensed except for cases in which development costs meet certain identifiable criteria for capitalization. Capitalized development costs are amortized over the life of the related commercial production, or in the case of serviceable property, plant and equipment, are included in the appropriate property group and are depreciated over its estimated useful life.
(i) Depreciation, amortization and impairment
Depreciation and amortization
Assets are depreciated on a straight-line basis over their estimated useful lives as determined by a continuing program of asset life studies. Depreciation includes amortization of assets under finance leases and amortization of leasehold improvements. Leasehold improvements are normally amortized over the lesser of their expected average service life or the term of the lease. Intangible assets with finite lives (intangible assets subject to amortization) are amortized on a straight-line basis over their estimated useful lives, which are reviewed at least annually and adjusted as appropriate. As referred to in (b), the use of a straight-line basis of depreciation and amortization is a significant judgment for us.
Estimated useful lives for the majority of our property, plant and equipment subject to depreciation are as follows:
|
| Estimated useful lives 1 |
|
Network assets |
|
|
|
Outside plant |
| 17 to 40 years |
|
Inside plant |
| 4 to 17 years |
|
Wireless site equipment |
| 5 to 10 years |
|
Balance of depreciable property, plant and equipment |
| 3 to 40 years |
|
(1) The composite depreciation rate for the year ended December 31, 2016, was 5.0% (2015 — 4.8%). The rate is calculated by dividing depreciation expense by an average of the gross book value of depreciable assets over the reporting period.
Estimated useful lives for the majority of our intangible assets subject to amortization are as follows:
|
| Estimated useful lives |
|
Wireline subscriber base |
| 25 years |
|
Customer contracts, related customer relationships and leasehold interests |
| 6 to 10 years |
|
Software |
| 2 to 7 years |
|
Access to rights-of-way and other |
| 5 to 30 years |
|
Impairment — general
Impairment testing compares the carrying values of the assets or cash-generating units being tested with their recoverable amounts (the recoverable amount being the greater of an asset’s or a cash-generating unit’s value in use or its fair value less costs to sell); as referred to in (b), this is a significant estimate for us. Impairment losses are immediately recognized to the extent that the carrying value of an asset or cash-generating unit exceeds its recoverable amount. Should the recoverable amounts for impaired assets or cash-generating units subsequently increase, the impairment losses previously recognized (other than in respect of goodwill) may be reversed to the extent that the reversal is not a
![]()
notes to consolidated financial statements
result of “unwinding of the discount” and that the resulting carrying values do not exceed the carrying values that would have been the result if no impairment losses had been previously recognized.
Impairment — property, plant and equipment; intangible assets subject to amortization
The continuing program of asset life studies considers such items as the timing of technological obsolescence, competitive pressures and future infrastructure utilization plans; these considerations could also indicate that the carrying value of an asset may not be recoverable. If the carrying value of an asset were not considered recoverable, an impairment loss would be recorded.
Impairment — intangible assets with indefinite lives; goodwill
The carrying values of intangible assets with indefinite lives and goodwill are periodically tested for impairment. The frequency of the impairment testing is generally the reciprocal of the stability of the relevant events and circumstances, but intangible assets with indefinite lives and goodwill must, at a minimum, be tested annually; we have selected December as our annual test date.
We assess our intangible assets with indefinite lives by comparing the recoverable amounts of our cash-generating units to the carrying values of our cash-generating units (including the intangible assets with indefinite lives allocated to a cash-generating unit, but excluding any goodwill allocated to a cash-generating unit). To the extent that the carrying value of a cash-generating unit (including the intangible assets with indefinite lives allocated to the cash-generating unit, but excluding any goodwill allocated to the cash-generating unit) exceeds its recoverable amount, the excess amount would be recorded as a reduction in the carrying value of intangible assets with indefinite lives.
Subsequent to assessing intangible assets with indefinite lives, we assess goodwill by comparing the recoverable amounts of cash-generating units to their carrying values (including the intangible assets with indefinite lives and the goodwill allocated to a cash-generating unit). To the extent that the carrying value of the cash-generating unit (including the intangible assets with indefinite lives and the goodwill allocated to the cash-generating unit) exceeds its recoverable amount, the excess amount would first be recorded as a reduction in the carrying value of goodwill and any remainder would be recorded as a reduction in the carrying values of the assets of the cash-generating unit on a pro-rated basis.
(j) Translation of foreign currencies
Trade transactions completed in foreign currencies are translated into Canadian dollars at the rates of exchange prevailing at the time of the transactions. Monetary assets and liabilities denominated in foreign currencies are translated into Canadian dollars at the rate of exchange in effect at the statement of financial position date, with any resulting gain or loss recorded in the Consolidated statements of income and other comprehensive income as a component of Financing costs, as set out in Note 8. Hedge accounting is applied in specific instances, as further discussed in (d) preceding.
We have foreign subsidiaries that do not have the Canadian dollar as their functional currency. Foreign exchange gains and losses arising from the translation of these foreign subsidiaries’ accounts into Canadian dollars subsequent to January 1, 2010, are reported as a component of other comprehensive income, as set out in Note 10.
(k) Income and other taxes
We follow the liability method of accounting for income taxes; as referred to in (b), this is a significant estimate for us. Under this method, current income taxes are recognized for the estimated income taxes payable for the current year. Deferred income tax assets and liabilities are recognized for temporary differences between the tax and accounting bases of assets and liabilities, and also for any benefits of losses and Investment Tax Credits available to be carried forward to future years for tax purposes that are more likely than not to be realized. The amounts recognized in respect of deferred income tax assets and liabilities are based upon the expected timing of the reversal of temporary differences or usage of tax losses and the application of the substantively enacted tax rates at the time of reversal or usage.
We account for any changes in substantively enacted income tax rates affecting deferred income tax assets and liabilities in full in the period in which the changes are substantively enacted. We account for changes in the estimates of prior year(s) tax balances as estimate revisions in the period in which the changes in estimates arise; we have selected this approach as its emphasis on the statement of financial position is more consistent with the liability method of accounting for income taxes.
Our operations are complex and the related tax interpretations, regulations, legislation and jurisprudence are continually changing. As a result, there are usually some tax matters in question that result in uncertain tax positions. We only recognize the income tax benefit of an uncertain tax position when it is more likely than not that the ultimate determination of the tax treatment of the position will result in that benefit being realized. We accrue an amount for interest charges on current tax liabilities that have not been funded, which would include interest and penalties arising from uncertain tax positions. We include such charges in the Consolidated statements of income and other comprehensive income as a component of Financing costs.
![]()
notes to consolidated financial statements
Our research and development activities may be eligible to earn Investment Tax Credits, for which the determination of eligibility is a complex matter. We only recognize Investment Tax Credits when there is reasonable assurance that the ultimate determination of the eligibility of our research and development activities will result in the Investment Tax Credits being received, at which time they are accounted for using the cost reduction method, whereby such credits are deducted from the expenditures or assets to which they relate, as set out in Note 9(c).
(l) Share-based compensation
General
When share-based compensation vests in its entirety at one future point in time (cliff vesting), we recognize the expense on a straight-line basis over the vesting period. When share-based compensation vests in tranches (graded vesting), we recognize the expense using the accelerated expense attribution method. An estimate of forfeitures during the vesting period is made at the date of grant of such share-based compensation; this estimate is adjusted to reflect actual experience.
Share option awards
A fair value for share option awards is determined at the date of grant and that fair value is recognized in the financial statements. Proceeds arising from the exercise of share option awards are credited to share capital, as are the recognized grant-date fair values of the exercised share option awards.
Share option awards that have a net-equity settlement feature, as set out in Note 13(d), are accounted for as equity instruments. We have selected the equity instrument fair value method of accounting for the net-equity settlement feature as it is consistent with the accounting treatment afforded to the associated share option awards.
Restricted stock units
In respect of restricted stock units without market performance conditions, as set out in Note 13(b), we accrue a liability equal to the product of the number of vesting restricted stock units multiplied by the fair market value of the corresponding Common Shares at the end of the reporting period (unless hedge accounting is applied, as set out in (d) preceding). Similarly, we accrue a liability for the notional subset of our restricted stock units with market performance conditions using a fair value determined using a Monte Carlo simulation. The expense for restricted stock units that do not ultimately vest is reversed against the expense that was previously recorded in their respect.
(m) Employee future benefit plans
Defined benefit plans
We accrue amounts for our obligations under employee defined benefit plans and the related costs, net of plan assets. The cost of pensions and other retirement benefits earned by employees is actuarially determined using the accrued benefit method pro-rated on service and management’s best estimates of salary escalation and the retirement ages of employees. In the determination of net income, net interest for each plan, which is the product of the plan’s surplus (deficit) multiplied by the discount rate, is included as a component of Financing costs, as set out in Note 8.
An amount reflecting the effect of differences between the discount rate and the actual rate of return on plan assets is included as a component of employee defined benefit plan re-measurements within Other comprehensive income, as set out in Note 10 and Note 14. We determine the maximum economic benefit available from the plans’ assets on the basis of reductions in future contributions to the plans.
On an annual basis, at a minimum, the defined benefit plan key assumptions are assessed and revised as appropriate; as referred to in (b), these are significant estimates for us. When the defined benefit plan key assumptions fluctuate significantly relative to their immediately preceding year-end values, actuarial gains (losses) arising from such significant fluctuations are recognized on an interim basis.
Defined contribution plans
We use defined contribution accounting for the Telecommunication Workers Pension Plan and the British Columbia Public Service Pension Plan, which cover certain of our employees and provide defined benefits to their members. In the absence of any regulations governing the calculation of the share of the underlying financial position and plan performance attributable to each employer-participant, and in the absence of contractual agreements between the plans and the employer-participants related to the financing of any shortfall (or distribution of any surplus), we account for these plans as defined contribution plans in accordance with International Accounting Standard 19, Employee Benefits.
(n) Cash and temporary investments, net
Cash and temporary investments, which may include investments in money market instruments that are purchased three months or less from maturity, are presented net of outstanding items, including cheques written but not cleared by the
![]()
notes to consolidated financial statements
related banks as at the statement of financial position date. Cash and temporary investments, net, are classified as a liability in the statement of financial position when the total amount of all cheques written but not cleared by the related banks exceeds the amount of cash and temporary investments. When cash and temporary investments, net, are classified as a liability, they may also include overdraft amounts drawn on our bilateral bank facilities, which revolve daily and are discussed further in Note 22.
(o) Sales of trade receivables
Sales of trade receivables in securitization transactions are recognized as collateralized short-term borrowings and thus do not result in our de-recognition of the trade receivables sold.
(p) Inventories
Our inventories consist primarily of wireless handsets, parts and accessories (totalling $266 million (2015 — totalling $319 million)) and communications equipment held for resale. Inventories are valued at the lower of cost and net realizable value, with cost being determined on an average cost basis. Previous write-downs to net realizable value are reversed if there is a subsequent increase in the value of the related inventories. Costs of goods sold for the year ended December 31, 2016, totalled $1,837 million (2015 — $1,806 million).
(q) Property, plant and equipment; intangible assets
General
Property, plant and equipment and intangible assets are recorded at historical cost, which for self-constructed property, plant and equipment includes materials, direct labour and applicable overhead costs. For internally developed, internal-use software, the historical cost recorded includes materials, direct labour and direct labour-related costs. Where property, plant and equipment construction projects are of sufficient size and duration, an amount is capitalized for the cost of funds used to finance construction, as set out in Note 8. The rate for calculating the capitalized financing cost is based on our weighted average cost of borrowing experienced during the reporting period.
When we sell property, plant and/or equipment, the net book value is netted against the sale proceeds and the difference, as set out in Note 6, is included in the Consolidated statements of income and other comprehensive income as Other operating income.
Asset retirement obligations
Provisions for liabilities, as set out in Note 25, are recognized for statutory, contractual or legal obligations, normally when incurred, associated with the retirement of property, plant and equipment (primarily certain items of outside plant and wireless site equipment) when those obligations result from the acquisition, construction, development and/or normal operation of the assets; as referred to in (b), this is a significant estimate for us. The obligations are measured initially at fair value, determined using present value methodology, and the resulting costs are capitalized as a part of the carrying value of the related asset. In subsequent periods, the liability is adjusted for the accretion of discount, for any changes in the market-based discount rate and for any changes in the amount or timing of the underlying future cash flows. The capitalized asset retirement cost is depreciated on the same basis as the related asset and the discount accretion, as set out in Note 8, is included in the Consolidated statements of income and other comprehensive income as a component of Financing costs.
(r) Leases
Leases are classified as finance or operating depending upon the terms and conditions of the contracts. See Note 2 for significant changes to IFRS-IASB that are not yet effective and have not yet been applied, but will significantly affect the timing of the recognition of operating lease expenses and their recognition on the Consolidated statement of financial position, as well as their classification in both the Consolidated statement of income and other comprehensive income and the Consolidated statement of cash flows.
Where we are the lessee, asset values recorded under finance leases are amortized on a straight-line basis over the period of expected use. Obligations recorded under finance leases are reduced by lease payments net of imputed interest.
(s) Investments
We account for our investments in companies over which we have significant influence using the equity method of accounting, whereby the investments are initially recorded at cost and subsequently adjusted to recognize our share of earnings or losses of the investee companies and any earnings distributions received. The excess of the cost of an equity investment over its underlying book value at the date of acquisition, except for goodwill, is amortized over the estimated useful lives of the underlying assets to which the excess cost is attributed.
![]()
notes to consolidated financial statements
Similarly, we account for our interests in the real estate joint ventures, discussed further in Note 21, using the equity method of accounting. Unrealized gains and losses from transactions with (including contributions to) the real estate joint ventures are deferred in proportion to our remaining interest in the real estate joint ventures.
We account for our other investments as available-for-sale at their fair values unless they are investment securities that do not have quoted market prices in an active market or do not have other clear and objective evidence of fair value. When we do not account for our available-for-sale investments at their fair values, we use the cost basis of accounting, whereby the investments are initially recorded at cost and earnings from those investments are recognized only to the extent received or receivable. The costs of investments sold or the amounts reclassified from other comprehensive income to earnings are determined on a specific-identification basis.
Unless there is a significant or prolonged decline in the value of an available-for-sale investment, the carrying values of available-for-sale investments are adjusted to their estimated fair values, and the amount of any such adjustment is included in the Consolidated statements of income and other comprehensive income as a component of other comprehensive income. When there is a significant or prolonged decline in the value of an investment, the carrying value of any such investment accounted for using the equity, available-for-sale or cost method is reduced to its estimated fair value, and the amount of any such reduction is included in the Consolidated statements of income and other comprehensive income as Other operating income.
2 accounting policy developments
(a) Initial application of standards, interpretations and amendments to standards and interpretations in the reporting period
In January 2016, the International Accounting Standards Board released Amendments to IAS 7, Statement of Cash Flows as a part of its Disclosure Initiative. The amendments are required to be applied for years beginning on or after January 1, 2017; however, we have applied them for the year ended December 31, 2016, as set out in Note 31(b), and such application has had no material effect on our financial performance or disclosure.
Annual Improvements to IFRSs 2012-2014 Cycle are required to be applied for years beginning on or after January 1, 2016, and such application has had no effect on our financial performance or disclosure.
(b) Standards, interpretations and amendments to standards not yet effective and not yet applied
· IFRS 9, Financial Instruments, is required to be applied for years beginning on or after January 1, 2018. The new standard includes a model for the classification and measurement of financial instruments, a single forward-looking “expected loss” impairment model and a reformed approach to hedge accounting. Based upon current facts and circumstances, we do not expect our financial performance or disclosure to be materially affected by the application of the standard.
· IFRS 15, Revenue from Contracts with Customers, is required to be applied for years beginning on or after January 1, 2018, such date reflecting the one-year deferral approved by the International Accounting Standards Board on July 22, 2015. The International Accounting Standards Board and the Financial Accounting Standards Board of the United States worked on this joint project to clarify the principles for the recognition of revenue. The new standard was released in May 2014 and supersedes existing standards and interpretations including IAS 18, Revenue. In April 2016, the International Accounting Standards Board issued Clarifications to IFRS 15, Revenue from Contracts with Customers, clarifying application of some of the more complex aspects of the standard. We are currently assessing the impacts and transition provisions of the new standard; however, we expect that we will apply the standard retrospectively to prior reporting periods, subject to permitted and elected practical expedients.
The effects of the new standard and the materiality of those effects will vary by industry and entity. Like many other telecommunications companies, we currently expect to be materially affected by its application, primarily in respect of the timing of revenue recognition, the classification of revenue, the capitalization of costs of obtaining a contract with a customer and possibly the capitalization of the costs of contract fulfilment (as defined by the new standard).
Revenue — timing of recognition; classification
The timing of revenue recognition and the classification of our revenues as either service revenues or equipment revenues will be affected, since the allocation of consideration in multiple element arrangements (solutions for our customers that may involve deliveries of multiple services and products that occur at different points in time and/or over different periods of time) will no longer be affected by the current limitation cap methodology.
![]()
notes to consolidated financial statements
The effects of the timing of revenue recognition and the classification of revenue are expected to be most pronounced in our wireless segment. Although the measurement of the total revenue recognized over the life of a contract will be largely unaffected by the new standard, the prohibition of the use of the limitation cap methodology will accelerate the recognition of total contract revenue, relative to both the associated cash inflows from customers and our current practice (using the limitation cap methodology). The acceleration of the recognition of contract revenue relative to the associated cash inflows will also result in the recognition of an amount reflecting the resulting difference as a contract asset. Although the underlying transaction economics would not differ, during periods of sustained growth in the number of wireless subscriber connection additions, assuming comparable contract-lifetime per unit cash inflows, revenues would appear to be greater than under the current practice (using the limitation cap methodology). Wireline segment results arising from transactions that include the initial provision of subsidized equipment or promotional pricing plans will be similarly affected.
Costs of contract acquisition; costs of contract fulfilment — timing of recognition
Similarly, the measurement of the total costs of contract acquisition and contract fulfilment over the life of a contract will be unaffected by the new standard, but the timing of recognition will be. The new standard will result in our wireless and wireline segments’ costs of contract acquisition and contract fulfilment, to the extent that they are material, being capitalized and subsequently recognized as an expense over the life of a contract on a rational, systematic basis consistent with the pattern of the transfer of goods or services to which the asset relates. Although the underlying transaction economics would not differ, during periods of sustained growth in the number of customer connection additions, assuming comparable per unit costs of contract acquisition and contract fulfilment, absolute profitability measures would appear to be greater than under the current practice (immediately expensing such costs).
Implementation
Our operations and associated systems are complex and our accounting for millions of multi-year contracts with our customers will be affected. Significantly, in order to effect the associated accounting, incremental compilation of historical data will be necessary for the millions of already existing multi-year contracts with our customers that are expected to be in-scope for purposes of transitioning to the new standard. Our current estimate of the time and effort necessary to develop and implement the accounting policies, estimates, judgments and processes (including critical incremental requirements of our information technology systems) we will need to have in place in order to comply with the new standard extends into mid/late-2017.
Once we have developed and implemented the necessary accounting policies, estimates, judgments and processes, we will commence the incremental compilation of historical data, as well as the accounting for that data, which is necessary to transition to, and to make reasonable quantitative estimates (which will also be subject to associated incremental internal controls over financial reporting) of the effects of, the new standard. As a result, at this time, it is not possible to make reasonable quantitative estimates of the effects of the new standard, and we may not be able to do so prior to completing our December 31, 2017, annual consolidated financial statements.
Illustrative example
To assist with understanding how the fundamental timing of recognition and classification of transactions will be affected by the new standard, we have developed the following illustrative example to contrast the currently expected effects of applying the new standard on certain primary financial statement line items for a single consumer postpaid wireless 24-month contract (handset and service) involving a re-seller with the effects of applying our current accounting policies.
The currently expected effects of the new standard reflected in the following illustrative example should be used with caution and, although reasonably depicting a representative transaction, they cannot be extrapolated to our population of contracts with customers as:
· changes in underlying assumptions and amounts are not linear — relative to this illustrative example, the dynamic maturity profile of our wireless subscriber base (which currently reflects, among other things, seasonal fluctuations of contract inceptions), the dynamic mix of gross subscriber additions and retention units (gross subscriber additions and retention units combined were approximately 3.5 million in each of the years ended December 31, 2016 and 2015), the dynamic pricing profile of our wireless subscriber base (which currently reflects, among other things, the choices made by customers, both initial and ongoing, in respect of handsets, rate plans and levels of device subsidy), and the dynamic choice of distribution channel made by the customer (due to costs of contract acquisition currently varying by distribution channel), are, in combination, all very significant factors in quantifying how the timing of recognition and classification changes arising from the new standard will affect us and these factors have not been reflected in this illustrative example;
· the effects of retrospective application upon adoption are not components of the illustrative example;
![]()
notes to consolidated financial statements
· the illustrative example represents only one of the many ways in which we can provide our customers with access to, and usage of, our telecommunications infrastructure; and
· the composite ongoing inception, maturation and expiration of millions of multi-year contracts with our customers are expected to somewhat mute the pronounced results of operations timing of recognition effects of a single contract.
|
| Selected results1 applying |
| Selected results1 applying IFRS 15 |
| ||||||||||||||||||||
As at, or fiscal years ending, December 31 (single $) |
| Fiscal |
| Fiscal |
| Fiscal |
| Total |
| Fiscal |
| Fiscal |
| Fiscal |
| Total |
| ||||||||
RESULTS OF OPERATIONS |
|
|
|
|
|
|
|
|
|
|
|
|
|
|
|
|
| ||||||||
OPERATING REVENUES |
|
|
|
|
|
|
|
|
|
|
|
|
|
|
|
|
| ||||||||
Service |
| $ | 80 |
| $ | 960 |
| $ | 880 |
| $ | 1,920 |
| $ | 61 |
| $ | 731 |
| $ | 670 |
| $ | 1,462 |
|
Equipment |
| 400 |
| — |
| — |
| 400 |
| 858 |
| — |
| — |
| 858 |
| ||||||||
Revenues arising from contract with customer |
| 480 |
| 960 |
| 880 |
| 2,320 |
| 919 |
| 731 |
| 670 |
| 2,320 |
| ||||||||
OPERATING EXPENSES EXCLUDING COSTS OF SERVICE |
|
|
|
|
|
|
|
|
|
|
|
|
|
|
|
|
| ||||||||
Goods and services purchased |
| 990 |
| — |
| — |
| 990 |
| 856 |
| 70 |
| 64 |
| 990 |
| ||||||||
OPERATING INCOME EFFECTS EXCLUDING COSTS OF SERVICE |
| (510 | ) | 960 |
| 880 |
| 1,330 |
| 63 |
| 661 |
| 606 |
| 1,330 |
| ||||||||
Income taxes |
| (138 | ) | 259 |
| 238 |
| 359 |
| 17 |
| 178 |
| 164 |
| 359 |
| ||||||||
NET INCOME EFFECTS EXCLUDING COSTS OF SERVICE |
| $ | (372 | ) | $ | 701 |
| $ | 642 |
| $ | 971 |
| $ | 46 |
| $ | 483 |
| $ | 442 |
| $ | 971 |
|
|
|
|
|
|
|
|
|
|
|
|
|
|
|
|
|
|
| ||||||||
RECONCILIATION OF REVENUES RECOGNIZED AND AMOUNTS BILLED TO CUSTOMER |
|
|
|
|
|
|
|
|
|
|
|
|
|
|
|
|
| ||||||||
Revenues recognized |
| $ | 480 |
| $ | 960 |
| $ | 880 |
| $ | 2,320 |
| $ | 919 |
| $ | 731 |
| $ | 670 |
| $ | 2,320 |
|
Revenues initially recognized but not initially billable and thus initially recognized as contract asset 2 |
| — |
| — |
| — |
| — |
| (458 | ) | — |
| — |
| (458 | ) | ||||||||
Contract asset 2 amortized and billed to customer |
| — |
| — |
| — |
| — |
| 19 |
| 229 |
| 210 |
| 458 |
| ||||||||
Total of amounts billed to customer |
| $ | 480 |
| $ | 960 |
| $ | 880 |
| $ | 2,320 |
| $ | 480 |
| $ | 960 |
| $ | 880 |
| $ | 2,320 |
|
FINANCIAL POSITION EFFECTS OF DIFFERENCES ARISING FROM ITEMS NOTED ABOVE |
|
|
|
|
|
|
|
|
| |||
ASSETS |
|
|
|
|
|
|
|
|
| |||
Current assets |
|
|
|
|
|
|
|
|
| |||
Contract assets 2 |
| $ | 229 |
| $ | 210 |
| $ | — |
|
|
|
Prepaid expenses and other |
| 70 |
| 64 |
| — |
|
|
| |||
Non-current assets |
|
|
|
|
|
|
|
|
| |||
Contract assets |
| 210 |
| — |
| — |
|
|
| |||
Other long-term assets |
| 64 |
| — |
| — |
|
|
| |||
|
| $ | 573 |
| $ | 274 |
| $ | — |
|
|
|
LIABILITIES AND OWNERS’ EQUITY |
|
|
|
|
|
|
|
|
| |||
Current liabilities |
|
|
|
|
|
|
|
|
| |||
Advance billings and customer deposits 2 |
| $ | — |
| $ | — |
| $ | — |
|
|
|
Non-current liabilities |
|
|
|
|
|
|
|
|
| |||
Deferred income taxes |
| 155 |
| 74 |
| — |
|
|
| |||
OWNERS’ EQUITY |
|
|
|
|
|
|
|
|
| |||
Common Share equity | �� | 418 |
| 200 |
| — |
|
|
| |||
|
| $ | 573 |
| $ | 274 |
| $ | — |
|
|
|
CASH FLOW EFFECTS OF ITEMS NOTED ABOVE |
|
|
|
|
|
|
|
|
|
|
|
|
|
|
|
|
| ||||||||
OPERATING ACTIVITIES |
|
|
|
|
|
|
|
|
|
|
|
|
|
|
|
|
| ||||||||
Net income effects excluding costs of service |
| $ | (372 | ) | $ | 701 |
| $ | 642 |
| $ | 971 |
| $ | 46 |
| $ | 483 |
| $ | 442 |
| $ | 971 |
|
Adjustments to reconcile to effects on cash (used) provided by operating activities |
|
|
|
|
|
|
|
|
|
|
|
|
|
|
|
|
| ||||||||
Deferred income taxes |
| (138 | ) | 259 |
| 238 |
| 359 |
| 17 |
| 178 |
| 164 |
| 359 |
| ||||||||
Change in operating working capital |
| — |
| — |
| — |
| — |
| (573 | ) | 299 |
| 274 |
| — |
| ||||||||
Effects on cash (used) provided by operating activities |
| $ | (510 | ) | $ | 960 |
| $ | 880 |
| $ | 1,330 |
| $ | (510 | ) | $ | 960 |
| $ | 880 |
| $ | 1,330 |
|
(1) This illustrative example of a single consumer postpaid wireless 24-month contract (handset and service) involving a re-seller is intended to illustrate the differences between our current accounting policies and the accounting effects we currently expect upon application of the new standard; the accounting for the associated costs of service, such as network operating expenses, would not differ upon application of the new standard and thus the associated costs of service have been excluded from this illustrative example. This illustrative example is based upon an actual November 30, 2016, offering of ours.
This illustrative example reflects the commencement of the contract on December 1 of the first fiscal year and running through to expiry, and ending 24 months later on, November 30 of the third fiscal year. Reflected in this illustrative example is that the minimum transaction price (minimum spend amount) is determinable and is thus used as the contract’s transaction price.
![]()
notes to consolidated financial statements
Goods and services purchased, in this illustrative example, include both the cost of the handset sold ($850) and contract acquisition costs (which, in this illustrative example, are commissions ($140)).
To simplify this illustrative example:
· no provision has been made for any value-added or sales taxes billed to the customer concurrent with the revenue generating transactions;
· an income tax rate of 27% has been used for all fiscal years and all income taxes are considered deferred; and
· amounts billed to customer are received when due; our monthly recurring charges would be $80 per month over the term of the contract and would be incremental to an initial payment of $400 due at contract inception.
(2) The new standard requires that a contract’s contract asset and contract liability (advance billings and customer billings) be presented net on the statement of financial position. To simplify this illustrative example, such statement of financial position line item reclassification has not been effected.
· In January 2016, the International Accounting Standards Board released IFRS 16, Leases, which is required to be applied for years beginning on or after January 1, 2019, and which supersedes IAS 17, Leases; earlier application is allowed, but not before the application of IFRS 15, Revenue from Contracts with Customers. The International Accounting Standards Board and the Financial Accounting Standards Board of the United States worked together to modify the accounting for leases, generally by eliminating lessees’ classification of leases as either operating leases or finance leases and, for IFRS-IASB, introducing a single lessee accounting model.
The most significant effect of the new standard will be the lessee’s recognition of the initial present value of unavoidable future lease payments as lease assets and lease liabilities on the statement of financial position, including those for most leases that would be currently accounted for as operating leases. Both leases with durations of 12 months or less and leases for low-value assets may be exempted.
The measurement of the total lease expense over the term of a lease will be unaffected by the new standard. However, the new standard will result in the timing of lease expense recognition being accelerated for leases which would be currently accounted for as operating leases; the International Accounting Standards Board expects that this effect may be muted by a lessee having a portfolio of leases with varying maturities and lengths of term. The presentation on the statement of income and other comprehensive income required by the new standard will result in most lease expenses being presented as amortization of lease assets and financing costs arising from lease liabilities rather than as a part of goods and services purchased, thus reported operating income would be higher under the new standard.
Relative to the results of applying the current standard, although the actual cash flows will be unaffected, the lessee’s statement of cash flows will reflect increases in cash flows from operating activities offset equally by decreases in cash flows from financing activities. This is due to the payment of the “principal” component of leases that would be currently accounted for as operating leases being presented as a cash flow use within financing activities under the new standard.
We are currently assessing the impacts and transition provisions of the new standard; however, we expect that we will apply the standard retrospectively to prior reporting periods, subject to permitted and elected practical expedients; our current intention is to apply the new standard concurrent with our initial application of IFRS 15, Revenue from Contracts with Customers. Our current estimate of the time and effort necessary to develop and implement the accounting policies, estimates and processes (including incremental requirements of our information technology systems) we will need to have in place in order to comply with the new standard extends into late 2017. We expect that our Consolidated statement of financial position will be materially affected, as will those financial metrics related to both debt and results of operations; however, at this time it is not possible to make reasonable quantitative estimates of the effects of the new standard.
3 capital structure financial policies
Our objective when managing capital is to maintain a flexible capital structure that optimizes the cost and availability of capital at acceptable risk.
In the management of capital and in its definition, we include common equity (excluding accumulated other comprehensive income), long-term debt (including long-term credit facilities, commercial paper backstopped by long-term credit facilities and any hedging assets or liabilities associated with long-term debt items, net of amounts recognized in accumulated other comprehensive income), cash and temporary investments, and short-term borrowings arising from securitized trade receivables.
We manage our capital structure and make adjustments to it in light of changes in economic conditions and the risk characteristics of our telecommunications infrastructure. In order to maintain or adjust our capital structure, we may adjust the amount of dividends paid to holders of Common Shares, purchase Common Shares for cancellation pursuant to normal course issuer bids, issue new shares, issue new debt, issue new debt to replace existing debt with different characteristics and/or increase or decrease the amount of trade receivables sold to an arm’s-length securitization trust.
![]()
notes to consolidated financial statements
We monitor capital utilizing a number of measures, including: net debt to earnings before interest, income taxes, depreciation and amortization (EBITDA*) — excluding restructuring and other costs; and dividend payout ratios.
Net debt to EBITDA — excluding restructuring and other costs is calculated as net debt at the end of the period divided by 12-month trailing EBITDA — excluding restructuring and other costs. This measure, historically, is substantially similar to the leverage ratio covenant in our credit facilities. Net debt, EBITDA — excluding restructuring and other costs and adjusted net earnings are measures that do not have any standardized meanings prescribed by IFRS-IASB and are therefore unlikely to be comparable to similar measures presented by other companies. The calculation of these measures is as set out in the following table. Net debt is one component of a ratio used to determine compliance with debt covenants.
The dividend payout ratio presented is a historical measure calculated as the sum of the last four quarterly dividends declared per Common Share, as recorded in the financial statements, divided by the sum of basic earnings per share for the most recent four quarters for interim reporting periods (divided by annual basic earnings per share if the reported amount is in respect of a fiscal year). The dividend payout ratio of adjusted net earnings presented, also a historical measure, differs in that it excludes the gain on exchange of wireless spectrum licences, net gains and equity income from real estate joint ventures, long-term debt prepayment premium and income tax-related adjustments.
During 2016, our financial objectives, which are reviewed annually and which were unchanged from 2015, included the financial objectives set out in the following table. We believe that our financial objectives are supportive of our long-term strategy.
As at, or for the 12-month periods ended, December 31 ($ in millions) |
| Objective |
| 2016 |
| 2015 |
| ||
Components of debt and coverage ratios |
|
|
|
|
|
|
| ||
Net debt 1 |
|
|
| $ | 12,652 |
| $ | 11,953 |
|
EBITDA — excluding restructuring and other costs 2 |
|
|
| $ | 4,708 |
| $ | 4,488 |
|
Net interest cost 3 |
|
|
| $ | 566 |
| $ | 465 |
|
Debt ratio |
|
|
|
|
|
|
| ||
Net debt to EBITDA — excluding restructuring and other costs |
| 2.00 – 2.50 4 |
| 2.69 |
| 2.66 |
| ||
Coverage ratios |
|
|
|
|
|
|
| ||
Earnings coverage 5 |
|
|
| 4.0 |
| 4.8 |
| ||
EBITDA — excluding restructuring and other costs interest coverage 6 |
|
|
| 8.3 |
| 9.7 |
| ||
Other measures |
|
|
|
|
|
|
| ||
Dividend payout ratio of adjusted net earnings 7 |
|
|
| 77 | % | 73 | % | ||
Dividend payout ratio |
| 65%–75% 8 |
| 89 | % | 73 | % | ||
(1) Net debt is calculated as follows:
As at December 31 |
| Note |
| 2016 |
| 2015 |
| ||
Long-term debt |
| 26 |
| $ | 12,931 |
| $ | 12,038 |
|
Debt issuance costs netted against long-term debt |
|
|
| 67 |
| 52 |
| ||
Derivative (assets) liabilities, net |
|
|
| 20 |
| (14 | ) | ||
Accumulated other comprehensive income amounts arising from financial instruments used to manage interest rate and currency risks associated with U.S. dollar-denominated long-term debt (excluding tax effects) |
|
|
| (34 | ) | — |
| ||
Cash and temporary investments, net |
|
|
| (432 | ) | (223 | ) | ||
Short-term borrowings |
| 22 |
| 100 |
| 100 |
| ||
Net debt |
|
|
| $ | 12,652 |
| $ | 11,953 |
|
(2) EBITDA — excluding restructuring and other costs is calculated as follows:
Years ended December 31 |
| Note |
| 2016 |
| 2015 |
| ||
EBITDA |
| 5 |
| $ | 4,229 |
| $ | 4,262 |
|
Restructuring and other costs |
| 15 |
| 479 |
| 226 |
| ||
EBITDA — excluding restructuring and other costs |
|
|
| $ | 4,708 |
| $ | 4,488 |
|
(3) Net interest cost is defined as financing costs, excluding employee defined benefit plans net interest, recoveries on long-term debt prepayment premium and repayment of debt, calculated on a 12-month trailing basis (expenses recorded for long-term debt prepayment premium, if any, are included in net interest cost).
(4) Our long-term objective range for this ratio is 2.00 – 2.50 times. The ratio as at December 31, 2016, is outside the long-term objective range. In the short term, we may permit, and have permitted, this ratio to go outside the objective range (for long-term investment opportunities), but will endeavour to return this ratio to within the objective range in the medium term, as we believe that this range is supportive of our long-term strategy. We are in compliance with our credit facilities leverage ratio covenant, which states that we may not permit our net debt to operating cash flow ratio to exceed 4.00:1.00 (see Note 26(d)); the calculation of the debt ratio is substantially similar to the calculation of the leverage ratio covenant in our credit facilities.
(5) Earnings coverage is defined as net income before borrowing costs and income tax expense, divided by borrowing costs (interest on long-term debt; interest on short-term borrowings and other; long-term debt prepayment premium), and adding back capitalized interest.
* EBITDA does not have any standardized meaning prescribed by IFRS-IASB and is therefore unlikely to be comparable to similar measures presented by other issuers; we define EBITDA as operating revenues less goods and services purchased and employee benefits expense. We have issued guidance on, and report, EBITDA because it is a key measure that management uses to evaluate the performance of our business, and it is also utilized in measuring compliance with certain debt covenants.
![]()
notes to consolidated financial statements
(6) EBITDA — excluding restructuring and other costs interest coverage is defined as EBITDA — excluding restructuring and other costs, divided by net interest cost. This measure is substantially similar to the coverage ratio covenant in our credit facilities.
(7) Adjusted net earnings attributable to Common Shares is calculated as follows:
12-month periods ended December 31 |
| 2016 |
| 2015 |
| ||
Net income attributable to Common Shares |
| $ | 1,223 |
| $ | 1,382 |
|
Gain on exchange of wireless spectrum licences, after income taxes |
| (13 | ) | — |
| ||
Gain and net equity income related to real estate redevelopment project, after income taxes |
| (16 | ) | — |
| ||
Business acquisition-related provisions, after income taxes |
| 15 |
| — |
| ||
Immediately vesting transformative compensation expense, after income taxes |
| 224 |
| — |
| ||
Income tax-related adjustments |
| (17 | ) | 1 |
| ||
Adjusted net earnings attributable to Common Shares |
| $ | 1,416 |
| $ | 1,383 |
|
(8) Our target guideline for the dividend payout ratio is 65%—75% of sustainable earnings on a prospective basis; we estimate that we will be within our target guideline on a prospective basis.
Net debt to EBITDA — excluding restructuring and other costs was 2.69 times as at December 31, 2016, up from 2.66 one year earlier. The increase in net debt increased the ratio by 0.16, which was largely offset by growth in EBITDA — excluding restructuring and other costs, which decreased the ratio by 0.13. The earnings coverage ratio for the twelve-month period ended December 31, 2016, was 4.0 times, down from 4.8 times one year earlier. Higher borrowing costs reduced the ratio by 0.3 and lower income before borrowing costs and income taxes reduced the ratio by 0.5. The EBITDA — excluding restructuring and other costs interest coverage ratio for the twelve-month period ended December 31, 2016, was 8.3 times, down from 9.7 times one year earlier. Growth in EBITDA — excluding restructuring and other costs increased the ratio by 0.4, while an increase in net interest costs reduced the ratio by 1.8.
4 financial instruments
(a) Risks — overview
Our financial instruments, and the nature of certain risks to which they may be subject, are as set out in the following table.
|
| Risks |
| ||||||||
|
|
|
|
|
| Market risks |
| ||||
Financial instrument |
| Credit |
| Liquidity |
| Currency |
| Interest rate |
| Other price |
|
Measured at amortized cost |
|
|
|
|
|
|
|
|
|
|
|
Accounts receivable |
| X |
|
|
| X |
|
|
|
|
|
Construction credit facilities advances to real estate joint venture |
|
|
|
|
|
|
| X |
|
|
|
Short-term obligations |
|
|
| X |
| X |
| X |
|
|
|
Accounts payable |
|
|
| X |
| X |
|
|
|
|
|
Provisions (including restructuring accounts payable) |
|
|
| X |
| X |
|
|
| X |
|
Long-term debt |
|
|
| X |
| X |
| X |
|
|
|
Measured at fair value |
|
|
|
|
|
|
|
|
|
|
|
Cash and temporary investments |
| X |
|
|
| X |
| X |
|
|
|
Long-term investments (not subject to significant influence) 1 |
|
|
|
|
| X |
|
|
| X |
|
Foreign exchange derivatives 2 |
| X |
| X |
| X |
|
|
|
|
|
Share-based compensation derivatives 2 |
| X |
| X |
|
|
|
|
| X |
|
(1) Long-term investments over which we do not have significant influence are measured at fair value if those fair values can be reliably measured.
(2) Use of derivative financial instruments is subject to a policy which requires that no derivative transaction is to be entered into for the purpose of establishing a speculative or leveraged position (the corollary being that all derivative transactions are to be entered into for risk management purposes only) and sets criteria for the creditworthiness of the transaction counterparties.
(b) Credit risk
Excluding credit risk, if any, arising from currency swaps settled on a gross basis, the best representation of our maximum exposure (excluding income tax effects) to credit risk, which is a worst-case scenario and does not reflect results we expect, is as set out in the following table:
As at December 31 (millions) |
| 2016 |
| 2015 |
| ||
Cash and temporary investments, net |
| $ | 432 |
| $ | 223 |
|
Accounts receivable |
| 1,471 |
| 1,428 |
| ||
Derivative assets |
| 17 |
| 40 |
| ||
|
| $ | 1,920 |
| $ | 1,691 |
|
![]()
notes to consolidated financial statements
Cash and temporary investments
Credit risk associated with cash and temporary investments is managed by ensuring that these financial assets are placed with: governments; major financial institutions that have been accorded strong investment grade ratings by a primary rating agency; and/or other creditworthy counterparties. An ongoing review is performed to evaluate changes in the status of counterparties.
Accounts receivable
Credit risk associated with accounts receivable is inherently managed by the size and diversity of our large customer base, which includes substantially all consumer and business sectors in Canada. We follow a program of credit evaluations of customers and limit the amount of credit extended when deemed necessary.
The following table presents an analysis of the age of customer accounts receivable for which an allowance had not been made as at the dates of the Consolidated statements of financial position. As at December 31, 2016, the weighted average age of customer accounts receivable was 26 days (2015 — 28 days) and the weighted average age of past-due customer accounts receivable was 61 days (2015 — 62 days). Any late payment charges are levied at an industry-based market or negotiated rate on outstanding non-current customer account balances.
As at December 31 (millions) |
| Note |
| 2016 |
| 2015 |
| ||
Customer accounts receivable, net of allowance for doubtful accounts |
|
|
|
|
|
|
| ||
Less than 30 days past billing date |
|
|
| $ | 897 |
| $ | 823 |
|
30-60 days past billing date |
|
|
| 176 |
| 208 |
| ||
61-90 days past billing date |
|
|
| 35 |
| 52 |
| ||
More than 90 days past billing date |
|
|
| 55 |
| 64 |
| ||
|
|
|
| $ | 1,163 |
| $ | 1,147 |
|
Customer accounts receivable |
| 16 |
| $ | 1,217 |
| $ | 1,199 |
|
Allowance for doubtful accounts |
|
|
| (54 | ) | (52 | ) | ||
|
|
|
| $ | 1,163 |
| $ | 1,147 |
|
We maintain allowances for potential credit losses related to doubtful accounts. Current economic conditions, historical information, reasons for the accounts being past due and line of business from which the customer accounts receivable arose are all considered when determining whether to make allowances for past-due accounts. The same factors are considered when determining whether to write off amounts charged to the allowance for doubtful accounts against the customer accounts receivable. The doubtful accounts expense is calculated on a specific-identification basis for customer accounts receivable above a specific balance threshold and on a statistically derived allowance basis for the remainder. No customer accounts receivable are written off directly to the doubtful accounts expense.
The following table presents a summary of the activity related to our allowance for doubtful accounts.
Years ended December 31 (millions) |
| 2016 |
| 2015 |
| ||
Balance, beginning of period |
| $ | 52 |
| $ | 44 |
|
Additions (doubtful accounts expense) |
| 58 |
| 55 |
| ||
Net use |
| (56 | ) | (47 | ) | ||
Balance, end of period |
| $ | 54 |
| $ | 52 |
|
Derivative assets (and derivative liabilities)
Counterparties to our share-based compensation cash-settled equity forward agreements and foreign exchange derivatives are major financial institutions that have been accorded investment grade ratings by a primary credit rating agency. The dollar amount of credit exposure under contracts with any one financial institution is limited and counterparties’ credit ratings are monitored. We do not give or receive collateral on swap agreements and hedging items due to our credit rating and those of our counterparties. While we are exposed to potential credit losses due to the possible non-performance of our counterparties, we consider this risk remote. Our derivative liabilities do not have credit risk-related contingent features.
(c) Liquidity risk
As a component of our capital structure financial policies, discussed further in Note 3, we manage liquidity risk by:
· maintaining a daily cash pooling process that enables us to manage our available liquidity and our liquidity requirements according to our actual needs;
· maintaining an agreement to sell trade receivables to an arm’s-length securitization trust (Note 22);
· maintaining bilateral bank facilities (Note 22) and syndicated credit facilities (Note 26(d),(f));
· maintaining a commercial paper program (Note 26(c));
· maintaining an in-effect shelf prospectus;
· continuously monitoring forecast and actual cash flows; and
![]()
notes to consolidated financial statements
· managing maturity profiles of financial assets and financial liabilities.
Our debt maturities in future years are as disclosed in Note 26(g). As at December 31, 2016, we could offer $2.2 billion of debt or equity securities pursuant to a shelf prospectus that is in effect until April 2018 (2015 — $250 million until December 2016). We believe that our investment grade credit ratings contribute to reasonable access to capital markets.
We closely match the contractual maturities of our derivative financial liabilities with those of the risk exposures they are being used to manage.
The expected maturities of our undiscounted financial liabilities do not differ significantly from the contractual maturities, other than as noted below. The contractual maturities of our undiscounted financial liabilities, including interest thereon (where applicable), are as set out in the following tables:
|
| Non-derivative |
| Derivative |
| ||||||||||||||||||||||||||
As at |
| Non-interest |
|
|
| Construction |
| Composite long-term debt |
|
|
|
|
|
|
|
|
| ||||||||||||||
December 31, |
| bearing |
|
|
| credit facilities |
| Long-term |
| Currency swap agreement |
|
|
| Currency swap agreement |
|
|
| ||||||||||||||
2016 |
| financial |
| Short-term |
| commitment |
| debt 1 |
| amounts to be exchanged 3 |
|
|
| amounts to be exchanged |
|
|
| ||||||||||||||
(millions) |
| liabilities |
| borrowings 1 |
| (Note 21) 2 |
| (Note 26) |
| (Receive) |
| Pay |
| Other |
| (Receive) |
| Pay |
| Total |
| ||||||||||
2017 |
| $ | 1,949 |
| $ | 1 |
| $ | 93 |
| $ | 1,832 |
| $ | (634 | ) | $ | 634 |
| $ | 3 |
| $ | (475 | ) | $ | 469 |
| $ | 3,872 |
|
2018 |
| 227 |
| 102 |
| — |
| 750 |
| (23 | ) | 23 |
| — |
| — |
| — |
| 1,079 |
| ||||||||||
2019 |
| 16 |
| — |
| — |
| 1,498 |
| (23 | ) | 23 |
| — |
| — |
| — |
| 1,514 |
| ||||||||||
2020 |
| 9 |
| — |
| — |
| 1,447 |
| (23 | ) | 23 |
| — |
| — |
| — |
| 1,456 |
| ||||||||||
2021 |
| 9 |
| — |
| — |
| 1,711 |
| (23 | ) | 23 |
| — |
| — |
| — |
| 1,720 |
| ||||||||||
Thereafter |
| 5 |
| — |
| — |
| 11,584 |
| (930 | ) | 921 |
| — |
| — |
| — |
| 11,580 |
| ||||||||||
Total |
| $ | 2,215 |
| $ | 103 |
| $ | 93 |
| $ | 18,822 |
| $ | (1,656 | ) | $ | 1,647 |
| $ | 3 |
| $ | (475 | ) | $ | 469 |
| $ | 21,221 |
|
|
|
|
|
|
|
|
| Total (Note 26(g)) |
| $ | 18,813 |
|
|
|
|
|
|
|
|
| |||||||||||
(1) Cash outflows in respect of interest payments on our short-term borrowings, commercial paper and amounts drawn under our credit facilities (if any) have been calculated based upon the interest rates in effect as at December 31, 2016.
(2) The drawdowns on the construction credit facilities are expected to occur as construction progresses through 2018.
(3) The amounts included in undiscounted non-derivative long-term debt in respect of U.S. dollar-denominated long-term debt, and the corresponding amounts in the long-term debt currency swaps receive column, have been determined based upon the currency exchange rates in effect as at December 31, 2016. The hedged U.S. dollar-denominated long-term debt contractual amounts at maturity, in effect, are reflected in the long-term debt currency swaps pay column as gross cash flows are exchanged pursuant to the currency swap agreements.
|
| Non-derivative |
| Derivative |
|
|
| ||||||||||||||||||||||||
As at |
| Non-interest |
|
|
| Construction |
| Composite long-term debt |
|
|
|
|
|
|
|
|
| ||||||||||||||
December 31, |
| bearing |
|
|
| credit facilities |
| Long-term |
| Currency swap agreement |
|
|
| Currency swap agreement |
|
|
| ||||||||||||||
2015 |
| financial |
| Short-term |
| commitment |
| debt 1 |
| amounts to be exchanged 3 |
|
|
| amounts to be exchanged |
|
|
| ||||||||||||||
(millions) |
| liabilities |
| borrowings 1 |
| (Note 21) 2 |
| (Note 26) |
| (Receive) |
| Pay |
| Other |
| (Receive) |
| Pay |
| Total |
| ||||||||||
2016 |
| $ | 1,895 |
| $ | 101 |
| $ | 131 |
| $ | 1,353 |
| $ | (256 | ) | $ | 242 |
| $ | 4 |
| $ | (415 | ) | $ | 390 |
| $ | 3,445 |
|
2017 |
| 28 |
| — |
| — |
| 1,174 |
| — |
| — |
| 9 |
| — |
| — |
| 1,211 |
| ||||||||||
2018 |
| 8 |
| — |
| — |
| 705 |
| — |
| — |
| — |
| — |
| — |
| 713 |
| ||||||||||
2019 |
| 6 |
| — |
| — |
| 1,453 |
| — |
| — |
| — |
| — |
| — |
| 1,459 |
| ||||||||||
2020 |
| 6 |
| — |
| — |
| 1,402 |
| — |
| — |
| — |
| — |
| — |
| 1,408 |
| ||||||||||
Thereafter |
| 6 |
| — |
| — |
| 12,057 |
| — |
| — |
| — |
| — |
| — |
| 12,063 |
| ||||||||||
Total |
| $ | 1,949 |
| $ | 101 |
| $ | 131 |
| $ | 18,144 |
| $ | (256 | ) | $ | 242 |
| $ | 13 |
| $ | (415 | ) | $ | 390 |
| $ | 20,299 |
|
|
|
|
|
|
|
|
| Total |
| $ | 18,130 |
|
|
|
|
|
|
|
|
| |||||||||||
(1) Cash outflows in respect of interest payments on our short-term borrowings, commercial paper and amounts drawn under our credit facilities (if any) have been calculated based upon the interest rates in effect as at December 31, 2015.
(2) The drawdowns on the construction credit facilities are expected to occur as construction progresses through 2018.
(3) The amounts included in undiscounted non-derivative long-term debt in respect of U.S. dollar-denominated long-term debt, and the corresponding amounts in the long-term debt currency swaps receive column, have been determined based upon the currency exchange rates in effect as at December 31, 2015. The hedged U.S. dollar-denominated long-term debt contractual amounts at maturity, in effect, are reflected in the long-term debt currency swaps pay column as gross cash flows are exchanged pursuant to the currency swap agreements.
(d) Currency risk
Our functional currency is the Canadian dollar, but certain routine revenues and operating costs are denominated in U.S. dollars and some inventory purchases and capital asset acquisitions are sourced internationally. The U.S. dollar is the only foreign currency to which we have a significant exposure.
Our foreign exchange risk management includes the use of foreign currency forward contracts and currency options to fix the exchange rates on short-term U.S. dollar-denominated transactions, commitments and commercial paper.
As discussed further in Note 26(b) and (f), we are also exposed to currency risk in that the fair value or future cash flows of our U.S. Dollar Notes and our TELUS International (Cda) Inc. credit facility U.S. dollar borrowings could fluctuate because of changes in foreign exchange rates. Currency hedging relationships have been established for the related semi-annual interest payments and the principal payment at maturity in respect of the U.S. Dollar Notes.
![]()
notes to consolidated financial statements
(e) Interest rate risk
Changes in market interest rates will cause fluctuations in the fair values or future cash flows of temporary investments, construction credit facility advances made to the real estate joint venture, short-term obligations, long-term debt and interest rate swap derivatives.
When we have temporary investments, they have short maturities and fixed interest rates and as a result, their fair values will fluctuate with changes in market interest rates; absent monetization prior to maturity, the related future cash flows will not change due to changes in market interest rates.
If the balance of short-term investments includes dividend-paying equity instruments, we could be exposed to interest rate risk.
Due to the short-term nature of the applicable rates of interest charged, the fair value of the construction credit facilities advances made to the real estate joint venture is not materially affected by changes in market interest rates; associated cash flows representing interest payments will be affected until such advances are repaid.
As short-term obligations arising from bilateral bank facilities, which typically have variable interest rates, are rarely outstanding for periods that exceed one calendar week, interest rate risk associated with this item is not material.
Short-term borrowings arising from the sales of trade receivables to an arm’s-length securitization trust are fixed-rate debt. Due to the short maturities of these borrowings, interest rate risk associated with this item is not material.
All of our currently outstanding long-term debt, other than commercial paper and amounts drawn on our credit facilities (Note 26(d), (f)), is fixed-rate debt. The fair value of fixed-rate debt fluctuates with changes in market interest rates; absent early redemption, the related future cash flows will not change. Due to the short maturities of commercial paper, its fair value is not materially affected by changes in market interest rates, but the associated cash flows representing interest payments may be if the commercial paper is rolled over.
Amounts drawn on our short-term and long-term credit facilities will be affected by changes in market interest rates in a manner similar to commercial paper.
(f) Other price risk
Long-term investments
We are exposed to equity price risk arising from investments classified as available-for-sale. Such investments are held for strategic rather than trading purposes.
Share-based compensation derivatives
We are exposed to other price risk arising from cash-settled share-based compensation (appreciating Common Share prices increase both the expense and the potential cash outflow). Certain cash-settled equity swap agreements have been entered into that fix the cost associated with our restricted stock units (Note 13(b)).
(g) Market risks
Net income and other comprehensive income for the years ended December 31, 2016 and 2015, could have varied if the Canadian dollar: U.S. dollar exchange rate and our Common Share price varied by reasonably possible amounts from their actual statement of financial position date amounts.
The sensitivity analysis of our exposure to currency risk at the reporting date has been determined based upon a hypothetical change taking place at the relevant statement of financial position date. The U.S. dollar-denominated balances and derivative financial instrument notional amounts as at the statement of financial position dates have been used in the calculations.
The sensitivity analysis of our exposure to other price risk arising from share-based compensation at the reporting date has been determined based upon a hypothetical change taking place at the relevant statement of financial position date. The relevant notional number of Common Shares at the statement of financial position date, which includes those in the cash-settled equity swap agreements, has been used in the calculations.
Income tax expense, which is reflected net in the sensitivity analysis, reflects the applicable statutory income tax rates for the reporting periods.
![]()
notes to consolidated financial statements
Years ended December 31 |
| Net income |
| Other comprehensive income |
| Comprehensive income |
| ||||||||||||
(increase (decrease) in millions) |
| 2016 |
| 2015 |
| 2016 |
| 2015 |
| 2016 |
| 2015 |
| ||||||
Reasonably possible changes in market risks 1 |
|
|
|
|
|
|
|
|
|
|
|
|
| ||||||
10% change in Cdn.$: U.S.$ exchange rate |
|
|
|
|
|
|
|
|
|
|
|
|
| ||||||
Canadian dollar appreciates |
| $ | (1 | ) | $ | (25 | ) | $ | (4 | ) | $ | (8 | ) | $ | (5 | ) | $ | (33 | ) |
Canadian dollar depreciates |
| $ | 1 |
| $ | 25 |
| $ | 6 |
| $ | 8 |
| $ | 7 |
| $ | 33 |
|
25% 2 change in Common Share price 3 |
|
|
|
|
|
|
|
|
|
|
|
|
| ||||||
Price increases |
| $ | (8 | ) | $ | (9 | ) | $ | 16 |
| $ | 12 |
| $ | 8 |
| $ | 3 |
|
Price decreases |
| $ | 8 |
| $ | 5 |
| $ | (16 | ) | $ | (12 | ) | $ | (8 | ) | $ | (7 | ) |
(1) These sensitivities are hypothetical and should be used with caution. Changes in net income and/or other comprehensive income generally cannot be extrapolated because the relationship of the change in assumption to the change in net income and/or other comprehensive income may not be linear. In this table, the effect of a variation in a particular assumption on the amount of net income and/or other comprehensive income is calculated without changing any other factors; in reality, changes in one factor may result in changes in another, which might magnify or counteract the sensitivities.
The sensitivity analysis assumes that we would realize the changes in exchange rates; in reality, the competitive marketplace in which we operate would have an effect on this assumption.
No consideration has been made for a difference in the notional number of Common Shares associated with share-based compensation awards made during the reporting period that may have arisen due to a difference in the Common Share price.
(2) To facilitate ongoing comparison of sensitivities, a constant variance of approximate magnitude has been used. Reflecting a twelve-month data period and calculated on a monthly basis, the volatility of our Common Share price as at December 31, 2016, was 13.1% (2015 — 14.1%).
(3) The hypothetical effects of changes in the price of our Common Shares are restricted to those which would arise from our share-based compensation awards that are accounted for as liability instruments and the associated cash-settled equity swap agreements.
(h) Fair values
General
The carrying values of cash and temporary investments, accounts receivable, short-term obligations, short-term borrowings, accounts payable and certain provisions (including restructuring accounts payable) approximate their fair values due to the immediate or short-term maturity of these financial instruments. The fair values are determined directly by reference to quoted market prices in active markets.
The carrying values of our investments accounted for using the cost method do not exceed their fair values. The fair values of our investments accounted for as available-for-sale are based on quoted market prices in active markets or other clear and objective evidence of fair value.
The fair value of our long-term debt is based on quoted market prices in active markets.
The fair values of the derivative financial instruments we use to manage our exposure to currency risks are estimated based upon quoted market prices in active markets for the same or similar financial instruments or on the current rates offered to us for financial instruments of the same maturity, as well as discounted future cash flows determined using current rates for similar financial instruments of similar maturities subject to similar risks (such fair value estimates being largely based on the Canadian dollar: U.S. dollar forward exchange rate as at the statement of financial position dates).
The fair values of the derivative financial instruments we use to manage our exposure to increases in compensation costs arising from certain forms of share-based compensation are based upon fair value estimates of the related cash-settled equity forward agreements provided by the counterparty to the transactions (such fair value estimates being largely based on our Common Share price as at the statement of financial position dates).
The financial instruments that we measure at fair value on a recurring basis in periods subsequent to initial recognition and the level within the fair value hierarchy at which they are measured are as set out in the following table.
|
|
|
|
|
| Fair value measurements at reporting date using |
| ||||||||||||||||||
|
|
|
|
|
| Quoted prices in active |
| Significant other |
| Significant unobservable |
| ||||||||||||||
|
| Carrying value |
| (Level 1) |
| (Level 2) |
| (Level 3) |
| ||||||||||||||||
As at December 31 (millions) |
| 2016 |
| 2015 |
| 2016 |
| 2015 |
| 2016 |
| 2015 |
| 2016 |
| 2015 |
| ||||||||
Assets |
|
|
|
|
|
|
|
|
|
|
|
|
|
|
|
|
| ||||||||
Foreign exchange derivatives |
| $ | 10 |
| $ | 40 |
| $ | — |
| $ | — |
| $ | 10 |
| $ | 40 |
| $ | — |
| $ | — |
|
Share-based compensation derivatives |
| 7 |
| — |
| — |
| — |
| 7 |
| — |
| — |
| — |
| ||||||||
Available-for-sale portfolio investments |
| 62 |
| 30 |
| — |
| 2 |
| 62 |
| 28 |
| — |
| — |
| ||||||||
|
| $ | 79 |
| $ | 70 |
| $ | — |
| $ | 2 |
| $ | 79 |
| $ | 68 |
| $ | — |
| $ | — |
|
Liabilities |
|
|
|
|
|
|
|
|
|
|
|
|
|
|
|
|
| ||||||||
Foreign exchange derivatives |
| $ | 30 |
| $ | — |
| $ | — |
| $ | — |
| $ | 30 |
| $ | — |
| $ | — |
| $ | — |
|
Share-based compensation derivatives |
| 3 |
| 11 |
| — |
| — |
| 3 |
| 11 |
| — |
| — |
| ||||||||
|
| $ | 33 |
| $ | 11 |
| $ | — |
| $ | — |
| $ | 33 |
| $ | 11 |
| $ | — |
| $ | — |
|
![]()
notes to consolidated financial statements
Derivative
The derivative financial instruments that we measure at fair value on a recurring basis subsequent to initial recognition are as set out in the following table.
|
|
|
|
|
| 2016 |
| 2015 |
| ||||||||
As at December 31 (millions) |
| Designation |
| Maximum |
| Notional |
| Fair value |
| Notional |
| Fair value |
| ||||
Current Assets 1 |
|
|
|
|
|
|
|
|
|
|
|
|
| ||||
Derivatives used to manage |
|
|
|
|
|
|
|
|
|
|
|
|
| ||||
Currency risks arising from U.S. dollar-denominated purchases |
| HFT 2 |
| 2017 |
| $ | 8 |
| $ | — |
| $ | 115 |
| $ | 15 |
|
Currency risks arising from U.S. dollar-denominated purchases |
| HFH 3 |
| 2017 |
| $ | 263 |
| 7 |
| $ | 161 |
| 11 |
| ||
Currency risks arising from U.S. dollar revenues |
| HFT 2 |
| 2017 |
| $ | 4 |
| — |
| $ | 62 |
| — |
| ||
Changes in share-based compensation costs (Note 13(b)) |
| HFH 3 |
| 2017 |
| $ | 6 |
| 1 |
| $ | — |
| — |
| ||
Currency risks arising from U.S. dollar-denominated long-term debt (Note 26(b)-(c)) |
| HFH 3 |
| 2017 |
| $ | 191 |
| 3 |
| $ | 243 |
| 14 |
| ||
|
|
|
|
|
|
|
| $ | 11 |
|
|
| $ | 40 |
| ||
Other Long-Term Assets 1 |
|
|
|
|
|
|
|
|
|
|
|
|
| ||||
Derivatives used to manage |
|
|
|
|
|
|
|
|
|
|
|
|
| ||||
Changes in share-based compensation costs (Note 13(b)) |
| HFH 3 |
| 2018 |
| $ | 69 |
| $ | 6 |
| $ | — |
| $ | — |
|
Current Liabilities 1 |
|
|
|
|
|
|
|
|
|
|
|
|
| ||||
Derivatives used to manage |
|
|
|
|
|
|
|
|
|
|
|
|
| ||||
Currency risks arising from U.S. dollar-denominated purchases |
| HFT 2 |
| 2017 |
| $ | — |
| $ | — |
| $ | 31 |
| $ | — |
|
Currency risks arising from U.S. dollar-denominated purchases |
| HFH 3 |
| 2017 |
| $ | 69 |
| 2 |
| $ | 11 |
| — |
| ||
Currency risks arising from U.S. dollar revenues |
| HFT 2 |
| 2017 |
| $ | 124 |
| 5 |
| $ | 8 |
| — |
| ||
Changes in share-based compensation costs (Note 13(b)) |
| HFH 3 |
| 2017 |
| $ | 65 |
| 3 |
| $ | 71 |
| 2 |
| ||
Currency risks arising from U.S. dollar-denominated long-term debt (Note 26(b)-(c)) |
| HFH 3 |
| 2017 |
| $ | 422 |
| 2 |
| $ | — |
| — |
| ||
|
|
|
|
|
|
|
| $ | 12 |
|
|
| $ | 2 |
| ||
Other Long-Term Liabilities 1 |
|
|
|
|
|
|
|
|
|
|
|
|
| ||||
Derivatives used to manage |
|
|
|
|
|
|
|
|
|
|
|
|
| ||||
Changes in share-based compensation costs (Note 13(b)) |
| HFH 3 |
| 2017 |
| $ | — |
| $ | — |
| $ | 68 |
| $ | 9 |
|
Currency risks arising from U.S. dollar-denominated long-term debt (Note 26(b)-(c)) |
| HFH 3 |
| 2027 |
| $ | 1,036 |
| 21 |
| $ | — |
| — |
| ||
|
|
|
|
|
|
|
| $ | 21 |
|
|
| $ | 9 |
| ||
(1) Derivative financial assets and liabilities are not set off.
(2) Designated as held for trading (HFT) upon initial recognition; hedge accounting is not applied.
(3) Designated as held for hedging (HFH) upon initial recognition (cash flow hedging item); hedge accounting is applied.
Non-derivative
Our long-term debt, which is measured at amortized cost, and the fair value thereof, are as set out in the following table.
|
| 2016 |
| 2015 |
| ||||||||
As at December 31 (millions) |
| Carrying |
| Fair value |
| Carrying |
| Fair value |
| ||||
Long-term debt (Note 26) |
| $ | 12,931 |
| $ | 13,533 |
| $ | 12,038 |
| $ | 12,575 |
|
(i) Recognition of derivative gains and losses
The following table sets out the gains and losses, excluding income tax effects, on derivative instruments that are classified as cash flow hedging items and their location within the Consolidated statements of income and other comprehensive income. There was no ineffective portion of derivative instruments classified as cash flow hedging items for the periods presented.
![]()
notes to consolidated financial statements
|
| Amount of gain (loss) |
| Gain (loss) reclassified from other comprehensive |
| ||||||||||
|
|
|
|
| Amount |
| |||||||||
Years ended December 31 (millions) |
| 2016 |
| 2015 |
| Location |
| 2016 |
| 2015 |
| ||||
Derivatives used to manage |
|
|
|
|
|
|
|
|
|
|
| ||||
Currency risks arising from U.S. dollar-denominated purchases |
| $ | (12 | ) | $ | 12 |
| Goods and services purchased |
| $ | (9 | ) | $ | 2 |
|
Changes in share-based compensation costs (Note 13(b)) |
| 19 |
| (15 | ) | Employee benefits expense |
| 8 |
| — |
| ||||
Currency risks arising from U.S. dollar-denominated long-term debt (Note 26(b)-(c)) |
| (54 | ) | 61 |
| Financing costs |
| (20 | ) | 61 |
| ||||
|
| $ | (47 | ) | $ | 58 |
|
|
| $ | (21 | ) | $ | 63 |
|
The following table sets out the gains and losses arising from derivative instruments that are classified as held for trading and that are not designated as being in a hedging relationship, and their location within the Consolidated statements of income and other comprehensive income.
|
|
|
| Gain (loss) recognized in |
| ||||
Years ended December 31 (millions) |
| Location |
| 2016 |
| 2015 |
| ||
Derivatives used to manage currency risks |
| Financing costs |
| $ | (2 | ) | $ | 10 |
|
5 segment information
General
Operating segments are components of an entity that engage in business activities from which they earn revenues and incur expenses (including revenues and expenses related to transactions with the other component(s)), the operating results of which are regularly reviewed by a chief operating decision-maker to make resource allocation decisions and to assess performance. The operating segments that are regularly reported to our Chief Executive Officer (our chief operating decision-maker) are wireless and wireline.
As we do not currently aggregate operating segments, our currently reportable segments are also wireless and wireline. The wireless segment includes network revenues (data and voice) and equipment sales arising from mobile technologies. The wireline segment includes data revenues (which include Internet protocol; television; hosting, managed information technology and cloud-based services; business process outsourcing; and certain healthcare solutions), voice and other telecommunications services revenues (excluding wireless arising from mobile technologies), and equipment sales. Segmentation is based on similarities in technology (mobile versus fixed), the technical expertise required to deliver the service and products, customer characteristics, the distribution channels used and regulatory treatment. Intersegment sales are recorded at the exchange value, which is the amount agreed to by the parties.
The segment information regularly reported to our chief operating decision-maker, and the reconciliations thereof to our revenues and income before income taxes, are as set out in the following table.
![]()
notes to consolidated financial statements
Years ended December 31 |
| Wireless |
| Wireline |
| Eliminations |
| Consolidated |
| ||||||||||||||||
(millions) |
| 2016 |
| 2015 |
| 2016 |
| 2015 |
| 2016 |
| 2015 |
| 2016 |
| 2015 |
| ||||||||
Operating revenues |
|
|
|
|
|
|
|
|
|
|
|
|
|
|
|
|
| ||||||||
External revenues |
|
|
|
|
|
|
|
|
|
|
|
|
|
|
|
|
| ||||||||
Service |
| $ | 6,569 |
| $ | 6,338 |
| $ | 5,431 |
| $ | 5,252 |
| $ | — |
| $ | — |
| $ | 12,000 |
| $ | 11,590 |
|
Equipment |
| 509 |
| 586 |
| 216 |
| 254 |
| — |
| — |
| 725 |
| 840 |
| ||||||||
Revenues arising from contracts with customers |
| 7,078 |
| 6,924 |
| 5,647 |
| 5,506 |
| — |
| — |
| 12,725 |
| 12,430 |
| ||||||||
Other operating income |
| 37 |
| 9 |
| 37 |
| 63 |
| — |
| — |
| 74 |
| 72 |
| ||||||||
|
| 7,115 |
| 6,933 |
| 5,684 |
| 5,569 |
| — |
| — |
| 12,799 |
| 12,502 |
| ||||||||
Intersegment revenues |
| 58 |
| 61 |
| 194 |
| 174 |
| (252 | ) | (235 | ) | — |
| — |
| ||||||||
|
| $ | 7,173 |
| $ | 6,994 |
| $ | 5,878 |
| $ | 5,743 |
| $ | (252 | ) | $ | (235 | ) | $ | 12,799 |
| $ | 12,502 |
|
EBITDA 1 |
| $ | 2,906 |
| $ | 2,806 |
| $ | 1,323 |
| $ | 1,456 |
| $ | — |
| $ | — |
| $ | 4,229 |
| $ | 4,262 |
|
CAPEX, excluding spectrum licences 2 |
| $ | 982 |
| $ | 893 |
| $ | 1,986 |
| $ | 1,684 |
| $ | — |
| $ | — |
| $ | 2,968 |
| $ | 2,577 |
|
|
|
|
|
|
|
|
|
|
| Operating revenues — external (above) |
| $ | 12,799 |
| $ | 12,502 |
|
|
|
|
|
|
|
|
|
|
| Goods and services purchased |
| 5,631 |
| 5,532 |
| ||
|
|
|
|
|
|
|
|
|
| Employee benefits expense |
| 2,939 |
| 2,708 |
| ||
|
|
|
|
|
|
|
|
|
| EBITDA (above) |
| 4,229 |
| 4,262 |
| ||
|
|
|
|
|
|
|
|
|
| Depreciation |
| 1,564 |
| 1,475 |
| ||
|
|
|
|
|
|
|
|
|
| Amortization |
| 483 |
| 434 |
| ||
|
|
|
|
|
|
|
|
|
| Operating income |
| 2,182 |
| 2,353 |
| ||
|
|
|
|
|
|
|
|
|
| Financing costs |
| 520 |
| 447 |
| ||
|
|
|
|
|
|
|
|
|
| Income before income taxes |
| $ | 1,662 |
| $ | 1,906 |
|
(1) Earnings before interest, income taxes, depreciation and amortization (EBITDA) does not have any standardized meaning prescribed by IFRS-IASB and is therefore unlikely to be comparable to similar measures presented by other issuers; we define EBITDA as operating revenues less goods and services purchased and employee benefits expense. We have issued guidance on, and report, EBITDA because it is a key measure that management uses to evaluate the performance of our business, and it is also utilized in measuring compliance with certain debt covenants.
(2) Total capital expenditures (CAPEX); see Note 31(a) for a reconciliation of capital expenditures, excluding spectrum licences to cash payments for capital assets, excluding spectrum licences reported in the Consolidated statements of cash flows.
Geographical information
We attribute revenues from external customers to individual countries on the basis of the location where the goods and/or services are provided. We do not have material revenues that we attribute to countries other than Canada (our country of domicile), nor do we have material amounts of property, plant, equipment, intangible assets and/or goodwill located outside of Canada.
6 other operating income
Years ended December 31 (millions) |
| Note |
| 2016 |
| 2015 |
| ||
Government assistance, including deferral account amortization |
|
|
| $ | 36 |
| $ | 48 |
|
Investment income (loss) |
|
|
| 27 |
| (5 | ) | ||
Interest income |
| 21(c) |
| 1 |
| 3 |
| ||
Gain on disposal of assets and other |
|
|
| 10 |
| 26 |
| ||
|
|
|
| $ | 74 |
| $ | 72 |
|
We receive government assistance, as defined by IFRS-IASB, from a number of sources and include such amounts received in Other operating income.
CRTC subsidy
Local exchange carriers’ costs of providing the level of residential basic telephone services that the CRTC requires to be provided in high cost serving areas are greater than the amounts the CRTC allows the local exchange carriers to charge for the level of service. To ameliorate the situation, the CRTC directs the collection of contribution payments, in a central fund, from all registered Canadian telecommunications service providers (including voice, data and wireless service providers) that are then disbursed to incumbent local exchange carriers as subsidy payments to partially offset the costs of providing residential basic telephone services in non-forborne high cost serving areas. The subsidy payments are based upon a total subsidy requirement calculated on a per network access line/per band subsidy rate. For the year ended December 31, 2016, our subsidy receipts were $20 million (2015 — $22 million).
The CRTC currently determines, at a national level, the total annual contribution requirement necessary to pay the subsidies and then collects contribution payments from the Canadian telecommunications service providers, calculated as a percentage of their CRTC-defined telecommunications service revenue. The final contribution expense rate for 2016
![]()
notes to consolidated financial statements
was 0.53% and the interim rate for 2017 has been set at 0.63%. For the year ended December 31, 2016, our contributions to the central fund, which are accounted for as goods and services purchased, were $23 million (2015 — $26 million).
Government of Quebec
Salaries for qualifying employment positions in the province of Quebec, mainly in the information technology sector, are eligible for tax credits. In respect of such tax credits, for the year ended December 31, 2016, we recorded $6 million (2015 — $8 million).
7 employee benefits expense
|
|
|
| 2016 |
| 2015 |
| ||||||||
Years ended December 31 (millions) |
| Note |
| Traditional |
| Transformative |
| Total |
| Total |
| ||||
Employee benefits expense — gross |
|
|
|
|
|
|
|
|
|
|
| ||||
Wages and salaries |
|
|
| $ | 2,548 |
| $ | 185 |
| $ | 2,733 |
| $ | 2,537 |
|
Share-based compensation 1 |
| 13 |
| 114 |
| 67 |
| 181 |
| 125 |
| ||||
Pensions — defined benefit |
| 14(b) |
| 92 |
| — |
| 92 |
| 118 |
| ||||
Pensions — defined contribution |
| 14(f) |
| 89 |
| 41 |
| 130 |
| 90 |
| ||||
Other defined benefits |
| 14(g) |
| 1 |
| — |
| 1 |
| — |
| ||||
Restructuring costs 1 |
| 15(b) |
| 112 |
| — |
| 112 |
| 156 |
| ||||
Other |
|
|
| 153 |
| 12 |
| 165 |
| 149 |
| ||||
|
|
|
| 3,109 |
| 305 |
| 3,414 |
| 3,175 |
| ||||
Capitalized internal labour costs |
|
|
|
|
|
|
|
|
|
|
| ||||
Property, plant and equipment |
|
|
| (314 | ) | — |
| (314 | ) | (319 | ) | ||||
Intangible assets subject to amortization |
|
|
| (161 | ) | — |
| (161 | ) | (148 | ) | ||||
|
|
|
| (475 | ) | — |
| (475 | ) | (467 | ) | ||||
|
|
|
| $ | 2,634 |
| $ | 305 |
| $ | 2,939 |
| $ | 2,708 |
|
(1) For the year ended December 31, 2016, $4 of share-based compensation was included in restructuring costs (2015 — $7).
8 financing costs
Years ended December 31 (millions) |
| Note |
| 2016 |
| 2015 |
| ||
Interest expense |
|
|
|
|
|
|
| ||
Interest on long-term debt — gross |
|
|
| $ | 538 |
| $ | 498 |
|
Capitalized long-term debt interest 1 |
| 18(a) |
| (52 | ) | (45 | ) | ||
Interest on long-term debt — net |
|
|
| 486 |
| 453 |
| ||
Interest on short-term borrowings and other |
|
|
| 4 |
| 5 |
| ||
Interest accretion on provisions |
| 25 |
| 12 |
| 12 |
| ||
|
|
|
| 502 |
| 470 |
| ||
Employee defined benefit plans net interest |
| 14(b), (g) |
| 6 |
| 27 |
| ||
Foreign exchange |
|
|
| 15 |
| (25 | ) | ||
|
|
|
| 523 |
| 472 |
| ||
Interest income |
|
|
|
|
|
|
| ||
Interest on income tax refunds |
|
|
| (1 | ) | (23 | ) | ||
Other |
|
|
| (2 | ) | (2 | ) | ||
|
|
|
| (3 | ) | (25 | ) | ||
|
|
|
| $ | 520 |
| $ | 447 |
|
(1) Long-term debt interest at a composite rate of 3.31% was capitalized to intangible assets with indefinite lives.
![]()
notes to consolidated financial statements
9 income taxes
(a) Expense composition and rate reconciliation
Years ended December 31 (millions) |
| 2016 |
| 2015 |
| ||
Current income tax expense |
|
|
|
|
| ||
For the current reporting period |
| $ | 506 |
| $ | 553 |
|
Adjustments recognized in the current period for income taxes of prior periods |
| (38 | ) | (97 | ) | ||
|
| 468 |
| 456 |
| ||
Deferred income tax expense (recovery) |
|
|
|
|
| ||
Arising from the origination and reversal of temporary differences |
| (64 | ) | (47 | ) | ||
Revaluation of deferred income tax liability to reflect future statutory income tax rates |
| (4 | ) | 48 |
| ||
Adjustments recognized in the current period for income taxes of prior periods |
| 26 |
| 67 |
| ||
|
| (42 | ) | 68 |
| ||
|
| $ | 426 |
| $ | 524 |
|
Our income tax expense and effective income tax rate differ from those calculated by applying the applicable statutory rates for the following reasons:
Years ended December 31 ($ in millions) |
| 2016 |
| 2015 |
| ||||||
Income taxes computed at applicable statutory rates |
| $ | 444 |
| 26.7 | % | $ | 505 |
| 26.5 | % |
Revaluation of deferred income tax liability to reflect future income tax rates |
| (4 | ) | (0.2 | ) | 48 |
| 2.5 |
| ||
Adjustments recognized in the current period for income taxes of prior periods |
| (12 | ) | (0.8 | ) | (30 | ) | (1.6 | ) | ||
Other |
| (2 | ) | (0.1 | ) | 1 |
| 0.1 |
| ||
Income tax expense per Consolidated statements of income and other comprehensive income |
| $ | 426 |
| 25.6 | % | $ | 524 |
| 27.5 | % |
(b) Temporary differences
We must make significant estimates in respect of the composition of our deferred income tax liability. Our operations are complex and the related income tax interpretations, regulations, legislation and jurisprudence are continually changing. As a result, there are usually some income tax matters in question.
Temporary differences comprising the net deferred income tax liability and the amounts of deferred income taxes recognized in the Consolidated statements of income and other comprehensive income and the Consolidated statements of changes in owners’ equity are estimated as follows:
(millions) |
| Property, plant |
| Intangible |
| Partnership |
| Net pension |
| Reserves not |
| Losses |
| Other |
| Net deferred |
| ||||||||
As at January 1, 2015 |
| $ | 601 |
| $ | 1,289 |
| $ | 359 |
| $ | (194 | ) | $ | (135 | ) | $ | (5 | ) | $ | 21 |
| $ | 1,936 |
|
Deferred income tax expense recognized in |
|
|
|
|
|
|
|
|
|
|
|
|
|
|
|
|
| ||||||||
Net income |
| 184 |
| 91 |
| (164 | ) | (5 | ) | (25 | ) | 2 |
| (15 | ) | 68 |
| ||||||||
Other comprehensive income |
| — |
| — |
| — |
| 154 |
| — |
| — |
| (3 | ) | 151 |
| ||||||||
As at December 31, 2015 |
| 785 |
| 1,380 |
| 195 |
| (45 | ) | (160 | ) | (3 | ) | 3 |
| 2,155 |
| ||||||||
Deferred income tax expense recognized in |
|
|
|
|
|
|
|
|
|
|
|
|
|
|
|
|
| ||||||||
Net income |
| 85 |
| 77 |
| (200 | ) | (7 | ) | 12 |
| (3 | ) | (6 | ) | (42 | ) | ||||||||
Other comprehensive income |
| — |
| — |
| — |
| 4 |
| — |
| — |
| (10 | ) | (6 | ) | ||||||||
Deferred income taxes charged directly to owners’ equity and other |
| — |
| — |
| — |
| — |
| — |
| — |
| (5 | ) | (5 | ) | ||||||||
As at December 31, 2016 2 |
| $ | 870 |
| $ | 1,457 |
| $ | (5 | ) | $ | (48 | ) | $ | (148 | ) | $ | (6 | ) | $ | (18 | ) | $ | 2,102 |
|
(1) We expect to be able to utilize our non-capital losses prior to expiry.
(2) Deferred tax liability of $2,107, net of deferred tax asset of $5 (included in Other long-term assets).
IFRS-IASB requires the separate disclosure of temporary differences arising from the carrying value of investments in subsidiaries and partnerships exceeding their tax base, for which no deferred income tax liabilities have been recognized unless the parent is able to control the timing of the reversal of the difference and it is probable that it will not reverse in the forseeable future. In our specific instance, this is relevant to our investments in Canadian subsidiaries and Canadian partnerships. We are not required to recognize such deferred income tax liabilities, as we are in a position to control the timing and manner of the reversal of the temporary differences, which would not be expected to be exigible to income tax, and it is probable that such differences will not reverse in the foreseeable future. We are in a position to control the timing and manner of the reversal of temporary differences in respect of our non-Canadian subsidiaries, and it is probable that such differences will not reverse in the foreseeable future.
![]()
notes to consolidated financial statements
(c) Other
We have net capital losses and such losses may only be applied against realized taxable capital gains. We expect to include a net capital loss carry-forward of $4 million (2015 — $4 million) in our Canadian income tax returns. During the year ended December 31, 2016, we recognized the benefit of $NIL (2015 — $3 million) of net capital losses.
We conduct research and development activities, which are eligible to earn Investment Tax Credits. During the year ended December 31, 2016, we recorded Investment Tax Credits of $5 million (2015 — $6 million). Of this amount, $1 million (2015 — $4 million) was recorded as a reduction of property, plant and equipment and/or intangible assets and the balance was recorded as a reduction of Goods and services purchased.
10 other comprehensive income
|
| Items that may subsequently be reclassified to income |
| Item never |
|
|
| ||||||||||||||||||
|
| Change in unrealized fair value of |
| Cumulative |
| Change in |
|
|
| Employee |
|
|
| ||||||||||||
(millions) |
| Gains (losses) |
| Prior period |
| Total |
| foreign adjustment |
| value of |
| Accumulated other comp. income |
| defined benefit re-measure- |
| Other |
| ||||||||
Accumulated balance as at January 1, 2015 |
|
|
|
|
| $ | 4 |
| $ | 18 |
| $ | 16 |
| $ | 38 |
|
|
|
|
| ||||
Other comprehensive income (loss) |
|
|
|
|
|
|
|
|
|
|
|
|
|
|
|
|
| ||||||||
Amount arising |
| $ | 58 |
| $ | (63 | ) | (5 | ) | 25 |
| — |
| 20 |
| $ | 597 |
| $ | 617 |
| ||||
Income taxes |
| $ | 15 |
| $ | (16 | ) | (1 | ) | — |
| — |
| (1 | ) | 152 |
| 151 |
| ||||||
Net |
|
|
|
|
| (4 | ) | 25 |
| — |
| 21 |
| $ | 445 |
| $ | 466 |
| ||||||
Accumulated balance as at December 31, 2015 |
|
|
|
|
| — |
| 43 |
| 16 |
| 59 |
|
|
|
|
| ||||||||
Other comprehensive income (loss) |
|
|
|
|
|
|
|
|
|
|
|
|
|
|
|
|
| ||||||||
Amount arising |
| $ | (47 | ) | $ | 21 |
| (26 | ) | 5 |
| — |
| (21 | ) | $ | — |
| $ | (21 | ) | ||||
Income taxes |
| $ | (13 | ) | $ | 7 |
| (6 | ) | — |
| — |
| (6 | ) | — |
| (6 | ) | ||||||
Net |
|
|
|
|
| (20 | ) | 5 |
| — |
| (15 | ) | $ | — |
| $ | (15 | ) | ||||||
Accumulated balance as at December 31, 2016 |
|
|
|
|
| $ | (20 | ) | $ | 48 |
| $ | 16 |
| $ | 44 |
|
|
|
|
| ||||
Attributable to: |
|
|
|
|
|
|
|
|
|
|
|
|
|
|
|
|
| ||||||||
Common Shares |
|
|
|
|
|
|
|
|
|
|
| $ | 42 |
|
|
|
|
| |||||||
Non-controlling interest |
|
|
|
|
|
|
|
|
|
|
| 2 |
|
|
|
|
| ||||||||
|
|
|
|
|
|
|
|
|
|
|
| $ | 44 |
|
|
|
|
| |||||||
As at December 31, 2016, our estimate of the net amount of existing gains (losses) arising from the unrealized fair value of derivatives designated as cash flow hedges that are reported in accumulated other comprehensive income and are expected to be reclassified to net income in the next twelve months, excluding income tax effects, is $(1) million.
11 per share amounts
Basic net income per Common Share is calculated by dividing net income attributable to Common Shares by the total weighted average number of Common Shares outstanding during the period. Diluted net income per Common Share is calculated to give effect to share option awards and restricted stock units.
The following table presents the reconciliations of the denominators of the basic and diluted per share computations. Net income was equal to diluted net income for all periods presented.
Years ended December 31 (millions) |
|
|
|
|
| 2016 |
| 2015 |
|
Basic total weighted average number of Common Shares outstanding |
|
|
|
|
| 592 |
| 603 |
|
Effect of dilutive securities |
|
|
|
|
|
|
|
|
|
Share option awards |
|
|
|
|
| 1 |
| 1 |
|
Diluted total weighted average number of Common Shares outstanding |
|
|
|
|
| 593 |
| 604 |
|
For the years ended December 31, 2016 and 2015, no outstanding share option awards were excluded in the computation of diluted net income per Common Share.
![]()
notes to consolidated financial statements
12 dividends per share
(a) Dividends declared
Years ended December 31 (millions |
| 2016 |
| 2015 |
| ||||||||||||||||
|
| Declared |
| Paid to |
|
|
| Declared |
| Paid to |
|
|
| ||||||||
Common Share dividends |
| Effective |
| Per share |
| shareholders |
| Total |
| Effective |
| Per share |
| shareholders |
| Total |
| ||||
Quarter 1 dividend |
| Mar. 11, 2016 |
| $ | 0.44 |
| Apr. 1, 2016 |
| $ | 261 |
| Mar. 11, 2015 |
| $ | 0.40 |
| Apr. 1, 2015 |
| $ | 243 |
|
Quarter 2 dividend |
| Jun. 10, 2016 |
| 0.46 |
| Jul. 4, 2016 |
| 274 |
| Jun. 10, 2015 |
| 0.42 |
| Jul. 2, 2015 |
| 253 |
| ||||
Quarter 3 dividend |
| Sep. 9, 2016 |
| 0.46 |
| Oct. 3, 2016 |
| 272 |
| Sep. 10, 2015 |
| 0.42 |
| Oct. 1, 2015 |
| 252 |
| ||||
Quarter 4 dividend |
| Dec. 9, 2016 |
| 0.48 |
| Jan. 3, 2017 |
| 284 |
| Dec. 11, 2015 |
| 0.44 |
| Jan. 4, 2016 |
| 263 |
| ||||
|
|
|
| $ | 1.84 |
|
|
| $ | 1,091 |
|
|
| $ | 1.68 |
|
|
| $ | 1,011 |
|
On February 8, 2017, the Board of Directors declared a quarterly dividend of $0.48 per share on our issued and outstanding Common Shares payable on April 3, 2017, to holders of record at the close of business on March 10, 2017. The final amount of the dividend payment depends upon the number of Common Shares issued and outstanding at the close of business on March 10, 2017.
(b) Dividend Reinvestment and Share Purchase Plan
We have a Dividend Reinvestment and Share Purchase Plan under which eligible holders of Common Shares may acquire additional Common Shares by reinvesting dividends and by making additional optional cash payments to the trustee. Under this Plan, we have the option of offering Common Shares from Treasury or having the trustee acquire Common Shares in the stock market.
We may, at our discretion, offer Common Shares at a discount of up to 5% from the market price under the Plan. During the years ended December 31, 2016 and 2015, we opted to have the trustee acquire the Common Shares in the stock market with no discount offered. In respect of Common Share dividends declared during the year ended December 31, 2016, $59 million (2015 — $59 million) was to be reinvested in Common Shares.
Under the share purchase feature of the Plan, eligible shareholders can make optional cash payments and purchase our Common Shares at the market price without brokerage commissions or service charges; such purchases are subject to a minimum investment of $100 per transaction and a maximum investment of $20,000 per calendar year.
13 share-based compensation
(a) Details of share-based compensation expense
Reflected in the Consolidated statements of income and other comprehensive income as Employee benefits expense and in the Consolidated statements of cash flows are the following share-based compensation amounts:
|
|
|
| 2016 |
| 2015 |
| ||||||||||||||
Years ended December 31 (millions) |
| Note |
| Employee |
| Associated cash outflows |
| Statement flows |
| Employee |
| Associated outflows |
| Statement |
| ||||||
Restricted stock units 1 |
| (b) |
| $ | 81 |
| $ | (83 | ) | $ | (2 | ) | $ | 93 |
| $ | (132 | ) | $ | (39 | ) |
Transformative compensation 2 |
| 15(c) |
| 64 |
| (64 | ) | — |
| — |
| — |
| — |
| ||||||
Employee share purchase plan 3 |
| (c) |
| 40 |
| (40 | ) | — |
| 38 |
| (38 | ) | — |
| ||||||
Share option awards |
| (d) |
| — |
| — |
| — |
| 1 |
| — |
| 1 |
| ||||||
|
|
|
| $ | 185 |
| $ | (187 | ) | $ | (2 | ) | $ | 132 |
| $ | (170 | ) | $ | (38 | ) |
(1) The expense arising from restricted stock units was net of cash-settled equity swap agreement effects (see Note 4(i)). Within employee benefits expense (see Note 7), restricted stock unit expense of $77 (2015 — $86) is presented as share-based compensation and the balance is included in restructuring costs.
(2) As set out in Note 15(c), we made immediately vesting, transformative compensation lump-sum payments to substantially all of our existing unionized and non-unionized Canadian-sited workforces. For the unionized and non-unionized workforces, approximately 40% of the after-tax value of such qualifying lump-sum payments was paid in our Common Shares (see Note 28(b)) by way of an employee benefit trust.
As a result of our being considered for accounting purposes to control an employee benefit plan trust that was used to effect these Common Share payments, such transactions have been recognized as treasury stock transactions and we have applied the cost method of accounting. As at December 31, 2016, the employee benefit plan trust held no Common Shares.
(3) Employees receiving an immediately vesting, transformative compensation lump-sum payment contributed a percentage of their payment to the employee share purchase plan consistent with their regular compensation payment, as further described in (c). Our associated employer expense and contributions were $3.
![]()
notes to consolidated financial statements
For the year ended December 31, 2016, the associated operating cash outflows in respect of restricted stock units were net of cash inflows arising from the cash-settled equity swap agreements of $9 million (2015 — $27 million). For the year ended December 31, 2016, the income tax benefit arising from share-based compensation was $49 million (2015 — $35 million).
(b) Restricted stock units
General
We use restricted stock units as a form of retention and incentive compensation. Each restricted stock unit is nominally equal in value to one equity share and is nominally entitled to the dividends that would arise thereon if it were an issued and outstanding equity share. The notional dividends are recorded as additional issuances of restricted stock units during the life of the restricted stock unit. Due to the notional dividend mechanism, the grant-date fair value of restricted stock units equals the fair market value of the corresponding equity shares at the grant date. The restricted stock units generally become payable when vesting is completed and typically vest over a period of 33 months (the requisite service period). The vesting method of restricted stock units, which is determined on or before the date of grant, may be either cliff or graded; the majority of restricted stock units outstanding have cliff vesting. The associated liability is normally cash-settled.
TELUS Corporation restricted stock units
We also award restricted stock units that largely have the same features as our general restricted stock units, but have a variable payout (0% — 200%) that depends upon the achievement of our total customer connections performance condition (with a weighting of 25%) and the total shareholder return on our Common Shares relative to an international peer group of telecommunications companies (with a weighting of 75%). The grant-date fair value of the notional subset of our restricted stock units affected by the total customer connections performance condition equals the fair market value of the corresponding Common Shares at the grant date, and thus the notional subset has been included in the presentation of our restricted stock units with only service conditions. The recurring estimate, which reflects a variable payout, of the fair value of the notional subset of our restricted stock units affected by the relative total shareholder return performance element is determined using a Monte Carlo simulation.
The following table presents a summary of outstanding TELUS Corporation non-vested restricted stock units.
Number of non-vested restricted stock units as at December 31 |
| 2016 |
| 2015 |
|
Restricted stock units without market performance conditions |
|
|
|
|
|
Restricted stock units with only service conditions |
| 3,260,745 |
| 3,429,008 |
|
Notional subset affected by total customer connections performance condition |
| 130,234 |
| 135,404 |
|
|
| 3,390,979 |
| 3,564,412 |
|
Restricted stock units with market performance conditions |
|
|
|
|
|
Notional subset affected by relative total shareholder return performance condition |
| 390,703 |
| 406,243 |
|
|
| 3,781,682 |
| 3,970,655 |
|
The following table presents a summary of the activity related to TELUS Corporation restricted stock units without market performance conditions.
|
| 2016 |
| 2015 |
| ||||||||||
|
| Number of restricted |
| Weighted |
| Number of restricted |
| Weighted |
| ||||||
Years ended December 31 |
| Non-vested |
| Vested |
| fair value |
| Non-vested |
| Vested |
| fair value |
| ||
Outstanding, beginning of period |
|
|
|
|
|
|
|
|
|
|
|
|
| ||
Non-vested |
| 3,564,412 |
| — |
| $ | 41.42 |
| 5,471,978 |
| — |
| $ | 35.04 |
|
Vested |
| — |
| 29,008 |
| $ | 40.00 |
| — |
| 38,585 |
| $ | 34.20 |
|
Issued |
|
|
|
|
|
|
|
|
|
|
|
|
| ||
Initial award |
| 1,942,446 |
| — |
| $ | 39.74 |
| 1,844,161 |
| — |
| $ | 44.00 |
|
In lieu of dividends |
| 209,027 |
| 381 |
| $ | 41.63 |
| 224,336 |
| 385 |
| $ | 42.31 |
|
Vested |
| (2,024,130 | ) | 2,024,130 |
| $ | 39.31 |
| (3,810,514 | ) | 3,810,514 |
| $ | 33.44 |
|
Settled in cash |
| — |
| (2,004,126 | ) | $ | 39.29 |
| — |
| (3,820,476 | ) | $ | 33.34 |
|
Forfeited and cancelled |
| (300,776 | ) | (20,285 | ) | $ | 35.70 |
| (165,549 | ) | — |
| $ | 38.19 |
|
Outstanding, end of period |
|
|
|
|
|
|
|
|
|
|
|
|
| ||
Non-vested |
| 3,390,979 |
| — |
| $ | 41.71 |
| 3,564,412 |
| — |
| $ | 41.42 |
|
Vested |
| — |
| 29,108 |
| $ | 38.09 |
| — |
| 29,008 |
| $ | 40.00 |
|
(1) Excluding the notional subset of restricted stock units affected by the relative total shareholder return performance element.
![]()
notes to consolidated financial statements
With respect to certain issuances of TELUS Corporation restricted stock units, we have entered into cash-settled equity forward agreements that fix our cost; that information, as well as a schedule of non-vested TELUS Corporation restricted stock units outstanding as at December 31, 2016, is set out in the following table.
Vesting in years ending December 31 |
| Number of |
| Our fixed cost |
| Number of |
| Total number of |
| |
2017 |
| 1,610,984 |
| $ | 45.35 |
| 35,609 |
| 1,646,593 |
|
2018 |
| 1,604,835 |
| $ | 40.77 |
| 139,551 |
| 1,744,386 |
|
|
| 3,215,819 |
|
|
| 175,160 |
| 3,390,979 |
| |
(1) Excluding the notional subset of restricted stock units affected by the relative total shareholder return performance element.
TELUS International (Cda) Inc. restricted stock units
We also award restricted stock units that largely have the same features as the TELUS Corporation restricted stock units, but have a variable payout (0% — 150%) that depends upon the achievement of TELUS International (Cda) Inc. financial performance and non-market quality-of-service performance conditions.
The following table presents a summary of the activity related to TELUS International (Cda) Inc. restricted stock units.
|
| 2016 |
| ||||||||||
|
| U.S.$ denominated |
| Canadian $ denominated |
| ||||||||
|
| Number of |
| Grant-date |
| Number of restricted |
| Grant-date |
| ||||
Year ended December 31 |
| stock units |
| fair value |
| Non-vested |
| Vested |
| fair value |
| ||
Issued — initial award |
| 156,936 |
| U.S.$ | 21.92 |
| 32,299 |
| — |
| $ | 21.36 |
|
Vested |
| — |
| U.S.$ | — |
| (32,299 | ) | 32,299 |
| $ | 21.36 |
|
Outstanding, end of period |
|
|
|
|
|
|
|
|
|
|
| ||
Non-vested |
| 156,936 |
| U.S.$ | 21.92 |
| — |
| — |
| $ | — |
|
Vested |
| — |
| U.S.$ | — |
| — |
| 32,299 |
| $ | 21.36 |
|
(c) Employee share purchase plan
We have an employee share purchase plan under which eligible employees up to a certain job classification can purchase our Common Shares through regular payroll deductions by contributing between 1% and 20% of their pay; for more highly compensated job classifications, employees may contribute between 1% and 55% of their pay. For every dollar contributed by an employee, up to a maximum of 6% of eligible employee pay, we are required to make a contribution at a percentage between 20% and 40%. For the years ended December 31, 2016 and 2015, we contributed 40% for employees up to a certain job classification; for more highly compensated job classifications, we contributed 35%. We record our contributions as a component of Employee benefits expense and our contribution vests on the earlier of a plan participant’s last day in our employ or the last business day of the calendar year of our contribution, unless the plan participant’s employment is terminated with cause, in which case the plan participant will forfeit any in-year contribution from us.
(d) Share option awards
General
We use share option awards as a form of retention and incentive compensation. We apply the fair value method of accounting for share-based compensation awards granted to officers and other employees. Share option awards typically have a three-year vesting period (the requisite service period), but may vest over periods of up to five years. The vesting method of share option awards, which is determined on or before the date of grant, may be either cliff or graded; all share option awards granted subsequent to 2004 have been cliff-vesting awards.
The weighted average fair value of share option awards granted is calculated by using the Black-Scholes model (a closed-form option pricing model). The risk-free interest rate used in determining the fair value of the share option awards is based on a Government of Canada yield curve that is current at the time of grant. The expected lives of the share option awards are based on our historical share option award exercise data. Similarly, expected volatility considers the historical volatility in the price of our Common Shares for TELUS Corporation share options and historical volatility in the price of a peer group’s shares in respect of TELUS International (Cda) Inc. share options. The dividend yield is the annualized dividend current at the time of grant divided by the share option award exercise price. Dividends are not paid on unexercised share option awards and are not subject to vesting.
![]()
notes to consolidated financial statements
TELUS Corporation share options
Employees may receive options to purchase Common Shares at a price equal to the fair market value at the time of grant. Share option awards granted under the plan may be exercised over specific periods not to exceed seven years from the time of grant. No share options were awarded in fiscal 2016 or 2015.
These share option awards have a net-equity settlement feature. The optionee does not have the choice of exercising the net-equity settlement feature; it is at our option whether the exercise of a share option award is settled as a share option or settled using the net-equity settlement feature.
The following table presents a summary of the activity related to the TELUS Corporation share option plan.
|
| 2016 |
| 2015 |
| ||||||
Years ended December 31 |
| Number of |
| Weighted |
| Number of |
| Weighted |
| ||
Outstanding, beginning of period |
| 2,375,596 |
| $ | 22.96 |
| 4,667,422 |
| $ | 23.53 |
|
Exercised 1 |
| (925,682 | ) | $ | 20.75 |
| (2,064,100 | ) | $ | 24.23 |
|
Forfeited |
| (13,112 | ) | $ | 24.49 |
| (72,350 | ) | $ | 26.13 |
|
Expired |
| (19,109 | ) | $ | 15.29 |
| (155,376 | ) | $ | 21.90 |
|
Outstanding, end of period |
| 1,417,693 |
| $ | 24.49 |
| 2,375,596 |
| $ | 22.96 |
|
(1) The total intrinsic value of share option awards exercised for the year ended December 31, 2016, was $19 million (2015 — $38 million), reflecting a weighted average price at the dates of exercise of $41.06 per share (2015 — $42.64 per share). The difference between the number of share options exercised and the number of Common Shares issued (as reflected in the Consolidated statements of changes in owners’ equity) is the effect of our choosing to settle share option award exercises using the net-equity settlement feature.
The following is a life and exercise price stratification of outstanding TELUS Corporation share options, all of which are vested, as at December 31, 2016.
Options outstanding and exercisable
|
|
|
|
|
|
|
|
|
| Weighted |
| |||||
|
|
|
|
|
|
|
| Total |
| average |
| |||||
Range of option prices |
|
|
|
|
|
|
|
|
|
|
|
|
|
|
| |
Low |
| $ | 16.31 |
| $ | 21.42 |
| $ | 28.56 |
| $ | 16.31 |
|
|
| |
High |
| $ | 18.92 |
| $ | 25.64 |
| $ | 31.69 |
| $ | 31.69 |
|
|
| |
Year of expiry and number of options |
|
|
|
|
|
|
|
|
|
|
| |||||
2017 |
| 295,887 |
| 8,180 |
| — |
| 304,067 |
| $ | 16.53 |
| ||||
2018 |
| — |
| 477,308 |
| — |
| 477,308 |
| $ | 23.29 |
| ||||
2019 |
| — |
| — |
| 636,318 |
| 636,318 |
| $ | 29.21 |
| ||||
|
| 295,887 |
| 485,488 |
| 636,318 |
| 1,417,693 |
|
|
| |||||
Weighted average remaining contractual life (years) |
| 0.2 |
| 1.2 |
| 2.4 |
| 1.5 |
|
|
| |||||
Weighted average price |
| $ | 16.37 |
| $ | 23.27 |
| $ | 29.21 |
| $ | 24.49 |
|
|
| |
Aggregate intrinsic value 1 (millions) |
| $ | 8 |
| $ | 9 |
| $ | 9 |
| $ | 26 |
|
|
| |
(1) The aggregate intrinsic value is calculated based on the December 31, 2016, price of $42.75 per Common Share.
TELUS International (Cda) Inc. share options
Employees may receive equity share options (equity-settled) to purchase TELUS International (Cda) Inc. common shares at a price equal to, or a multiple of, the fair market value at the time of grant and/or phantom share options (cash-settled) that provide them with exposure to TELUS International (Cda) Inc. common share price appreciation. Share option awards granted under the plan may be exercised over specific periods not to exceed ten years from the time of grant. All equity share option awards and most phantom share option awards have a variable payout (0% — 100%) that depends upon the achievement of TELUS International (Cda) Inc. financial performance and non-market quality-of-service performance conditions.
The following table presents a summary of the activity related to the TELUS International (Cda) Inc. share option plan.
|
| 2016 |
| ||||||||
|
| U.S.$ denominated |
| Canadian $ denominated |
| ||||||
Year ended December 31 |
| Number of |
| Weighted |
| Number of |
| Share option |
| ||
Granted and outstanding, end of period |
| 573,354 |
| U.S.$ | 34.71 |
| 53,832 |
| $ | 21.36 |
|
(1) The range of share option prices is U.S.$21.90 — U.S.$40.26 per TELUS International (Cda) Inc. equity share and the weighted average remaining contractual life is 10 years.
(2) The weighted average remaining contractual life is 9.5 years.
![]()
notes to consolidated financial statements
14 employee future benefits
We have a number of defined benefit and defined contribution plans providing pension and other retirement and post-employment benefits to most of our employees. As at December 31, 2016 and 2015, all registered defined benefit pension plans were closed to substantially all new participants and substantially all benefits had vested. The benefit plans in which our employees are participants reflect developments in our corporate history.
TELUS Corporation Pension Plan
Management and professional employees in Alberta who joined us prior to January 1, 2001, and certain unionized employees who joined us prior to June 9, 2011, are covered by this contributory defined benefit pension plan, which comprises slightly more than one-half of our total defined benefit obligation accrued. The plan contains a supplemental benefit account that may provide indexation of up to 70% of the annual increase in a specified cost-of-living index. Pensionable remuneration is determined by the average of the best five years in the last ten years preceding retirement.
Pension Plan for Management and Professional Employees of TELUS Corporation
This defined benefit pension plan, which with certain limited exceptions ceased accepting new participants on January 1, 2006, and which comprises approximately one-quarter of our total defined benefit obligation accrued, provides a non-contributory base level of pension benefits. Additionally, on a contributory basis, employees annually can choose increased and/or enhanced levels of pension benefits above the base level. At an enhanced level of pension benefits, the plan has indexation of 100% of the annual increase in a specified cost-of-living index, to an annual maximum of 2%. Pensionable remuneration is determined by the annualized average of the best 60 consecutive months.
TELUS Québec Defined Benefit Pension Plan
This contributory defined benefit pension plan, which ceased accepting new participants on April 14, 2009, covers any employee not governed by a collective agreement in Quebec who joined us prior to April 1, 2006, any non-supervisory employee governed by a collective agreement who joined us prior to September 6, 2006, and certain other unionized employees. The plan comprises approximately one-tenth of our total defined benefit obligation accrued. The plan has no indexation and pensionable remuneration is determined by the average of the best four years.
TELUS Edmonton Pension Plan
This contributory defined benefit pension plan ceased accepting new participants on January 1, 1998. Indexation is 60% of the annual increase in a specified cost-of-living index and pensionable remuneration is determined by the annualized average of the best 60 consecutive months. The plan comprises less than one-tenth of our total defined benefit obligation accrued.
Other defined benefit pension plans
In addition to the foregoing plans, we have non-registered, non-contributory supplementary defined benefit pension plans, which have the effect of maintaining the earned pension benefit once the allowable maximums in the registered plans are attained. As is common with non-registered plans of this nature, these plans are typically funded only as benefits are paid. These plans comprise less than 5% of our total defined benefit obligation accrued.
We have three contributory non-indexed defined benefit pension plans arising from a pre-merger acquisition, which comprise less than 1% of our total defined benefit obligation accrued; these plans ceased accepting new participants in September 1989.
Telecommunication Workers Pension Plan
Certain employees in British Columbia are covered by a negotiated-cost, target-benefit union pension plan. Our contributions are determined in accordance with provisions of negotiated labour contracts, the current one of which expires December 31, 2021, and are generally based on employee gross earnings. We are not required to guarantee the benefits or assure the solvency of the plan, and we are not liable to the plan for other participating employers’ obligations. For the years ended December 31, 2016 and 2015, our contributions comprised a significant proportion of the employer contributions to the union pension plan; similarly, a significant proportion of the plan participants were our active and retired employee participants.
British Columbia Public Service Pension Plan
Certain employees in British Columbia are covered by a public service pension plan. Contributions are determined in accordance with provisions of labour contracts negotiated by the Province of British Columbia and are generally based on employee gross earnings.
![]()
notes to consolidated financial statements
Defined contribution pension plans
We offer three defined contribution pension plans, which are contributory, and these are the pension plans that we sponsor that are available to our non-unionized and certain of our unionized employees. Employees, annually, can generally choose to contribute to the plans at a rate of between 3% and 6% of their pensionable earnings. Generally, we match 100% of the contributions of employees up to 5% of their pensionable earnings and 80% of employee contributions greater than that. Membership in a defined contribution pension plan is generally voluntary until an employee’s third-year service anniversary. In the event that annual contributions exceed allowable maximums, excess amounts are in certain cases contributed to a non-registered supplementary defined contribution pension plan.
Other defined benefit plans
Other defined benefit plans, which are all non-contributory and, as at December 31, 2016 and 2015, non-funded, are comprised of a healthcare plan for retired employees and a life insurance plan, both of which ceased accepting new participants on January 1, 1997.
(a) Defined benefit pension plans — funded status overview
Information concerning our defined benefit pension plans, in aggregate, is as follows:
As at December 31 (millions) |
| 2016 |
| 2015 |
| ||
PRESENT VALUE OF THE DEFINED BENEFIT OBLIGATIONS |
|
|
|
|
| ||
Balance at beginning of year |
| $ | 8,620 |
| $ | 9,036 |
|
Current service cost |
| 109 |
| 126 |
| ||
Past service cost |
| 2 |
| 11 |
| ||
Interest expense |
| 340 |
| 349 |
| ||
Actuarial loss (gain) arising from: |
|
|
|
|
| ||
Demographic assumptions |
| 25 |
| (69 | ) | ||
Financial assumptions |
| 184 |
| (418 | ) | ||
Benefits paid |
| (443 | ) | (415 | ) | ||
Balance at end of year |
| 8,837 |
| 8,620 |
| ||
PLAN ASSETS |
|
|
|
|
| ||
Fair value at beginning of year |
| 8,641 |
| 8,480 |
| ||
Return on plan assets |
|
|
|
|
| ||
Notional interest income on plan assets at discount rate |
| 339 |
| 325 |
| ||
Actual return on plan assets greater than discount rate |
| 247 |
| 139 |
| ||
Contributions |
|
|
|
|
| ||
Employer contributions (d) |
| 70 |
| 93 |
| ||
Employees’ contributions |
| 25 |
| 25 |
| ||
Benefits paid |
| (443 | ) | (415 | ) | ||
Administrative fees |
| (6 | ) | (6 | ) | ||
Fair value at end of year |
| 8,873 |
| 8,641 |
| ||
Effect of asset ceiling limit |
|
|
|
|
| ||
Beginning of year |
| (74 | ) | (42 | ) | ||
Change |
| (41 | ) | (32 | ) | ||
End of year |
| (115 | ) | (74 | ) | ||
Fair value of plan assets at end of year, net of asset ceiling limit |
| 8,758 |
| 8,567 |
| ||
FUNDED STATUS — PLAN SURPLUS (DEFICIT) |
| $ | (79 | ) | $ | (53 | ) |
The plan surplus (deficit) is reflected in the Consolidated statements of financial position as follows:
As at December 31 (millions) |
| Note |
| 2016 |
| 2015 |
| ||
Funded status — plan surplus (deficit) |
|
|
|
|
|
|
| ||
Pension benefit plans |
|
|
| $ | (79 | ) | $ | (53 | ) |
Other benefit plans |
|
|
| (43 | ) | (42 | ) | ||
|
|
|
| $ | (122 | ) | $ | (95 | ) |
Presented in the Consolidated statements of financial position as: |
|
|
|
|
|
|
| ||
Other long-term assets |
| 20 |
| $ | 358 |
| $ | 356 |
|
Other long-term liabilities |
| 27 |
| (480 | ) | (451 | ) | ||
|
|
|
| $ | (122 | ) | $ | (95 | ) |
The measurement date used to determine the plan assets and defined benefit obligations accrued was December 31.
![]()
notes to consolidated financial statements
(b) Defined benefit pension plans — details
Expense
Our defined benefit pension plan expense (recovery) was as follows:
|
| 2016 |
| 2015 |
| ||||||||||||||||||||
Years ended December 31 (millions) |
| Employee |
| Financing |
| Other |
| Total |
| Employee |
| Financing |
| Other |
| Total |
| ||||||||
Current service cost |
| $ | 84 |
| $ | — |
| $ | — |
| $ | 84 |
| $ | 101 |
| $ | — |
| $ | — |
| $ | 101 |
|
Past service costs |
| 2 |
| — |
| — |
| 2 |
| 11 |
| — |
| — |
| 11 |
| ||||||||
Net interest; return on plan assets |
|
|
|
|
|
|
|
|
|
|
|
|
|
|
|
|
| ||||||||
Interest expense arising from defined benefit obligations accrued |
| — |
| 340 |
| — |
| 340 |
| — |
| 349 |
| — |
| 349 |
| ||||||||
Return, including interest income, on plan assets 1 |
| — |
| (339 | ) | (247 | ) | (586 | ) | — |
| (325 | ) | (139 | ) | (464 | ) | ||||||||
Interest effect on asset ceiling limit |
| — |
| 3 |
| — |
| 3 |
| — |
| 2 |
| — |
| 2 |
| ||||||||
|
| — |
| 4 |
| (247 | ) | (243 | ) | — |
| 26 |
| (139 | ) | (113 | ) | ||||||||
Administrative fees |
| 6 |
| — |
| — |
| 6 |
| 6 |
| — |
| — |
| 6 |
| ||||||||
Re-measurements arising from: |
|
|
|
|
|
|
|
|
|
|
|
|
|
|
|
|
| ||||||||
Demographic assumptions |
| — |
| — |
| 25 |
| 25 |
| — |
| — |
| (69 | ) | (69 | ) | ||||||||
Financial assumptions |
| — |
| — |
| 184 |
| 184 |
| — |
| — |
| (418 | ) | (418 | ) | ||||||||
|
| — |
| — |
| 209 |
| 209 |
| — |
| — |
| (487 | ) | (487 | ) | ||||||||
Changes in the effect of limiting net defined benefit assets to the asset ceiling |
| — |
| — |
| 38 |
| 38 |
| — |
| — |
| 30 |
| 30 |
| ||||||||
|
| $ | 92 |
| $ | 4 |
| $ | — |
| $ | 96 |
| $ | 118 |
| $ | 26 |
| $ | (596 | ) | $ | (452 | ) |
(1) The interest income on the plan assets portion of the employee defined benefit plans net interest amount included in Financing costs reflects a rate of return on plan assets equal to the discount rate used in determining the defined benefit obligations accrued.
Disaggregation of defined benefit pension plan funding status
Defined benefit obligations accrued are the actuarial present values of benefits attributed to employee services rendered to a particular date. Our disaggregation of defined benefit pension plan surpluses and deficits at year-end is as follows:
|
| 2016 |
| 2015 |
| ||||||||||||||||||||
As at December 31 (millions) |
| Defined |
| Plan |
| Difference |
| PBSR |
| Defined |
| Plan |
| Difference |
| PBSR |
| ||||||||
Pension plans that have plan assets in excess of defined benefit obligations accrued |
| $ | 7,610 |
| $ | 7,968 |
| $ | 358 |
| $ | 356 |
| $ | 7,429 |
| $ | 7,785 |
| $ | 356 |
| $ | 98 |
|
Pension plans that have defined benefit obligations accrued in excess of plan assets |
|
|
|
|
|
|
|
|
|
|
|
|
|
|
|
|
| ||||||||
Funded |
| 1,034 |
| 790 |
| (244 | ) | (62 | ) | 1,001 |
| 782 |
| (219 | ) | (190 | ) | ||||||||
Unfunded |
| 193 |
| — |
| (193 | ) | N/A | 2 | 190 |
| — |
| (190 | ) | N/A | 2 | ||||||||
|
| 1,227 |
| 790 |
| (437 | ) | (62 | ) | 1,191 |
| 782 |
| (409 | ) | (190 | ) | ||||||||
|
| $ | 8,837 |
| $ | 8,758 |
| $ | (79 | ) | $ | 294 |
| $ | 8,620 |
| $ | 8,567 |
| $ | (53 | ) | $ | (92 | ) |
Defined benefit obligations accrued owed to: |
|
|
|
|
|
|
|
|
|
|
|
|
|
|
|
|
| ||||||||
Active members |
| $ | 2,140 |
|
|
|
|
|
|
| $ | 2,271 |
|
|
|
|
|
|
| ||||||
Deferred members |
| 557 |
|
|
|
|
|
|
| 513 |
|
|
|
|
|
|
| ||||||||
Pensioners |
| 6,140 |
|
|
|
|
|
|
| 5,836 |
|
|
|
|
|
|
| ||||||||
|
| $ | 8,837 |
|
|
|
|
|
|
| $ | 8,620 |
|
|
|
|
|
|
| ||||||
(1) The Office of the Superintendent of Financial Institutions, by way of the Pension Benefits Standards Regulations, 1985 (PBSR) (see (d)), requires that a solvency valuation be performed on a periodic basis. The actual PBSR solvency positions are determined in conjunction with mid-year annual funding reports prepared by actuaries (see (d)); as a result, the PBSR solvency positions in this table as at December 31, 2016 and 2015, are interim estimates and updated estimates, respectively. The interim estimate as at December 31, 2015, was a net surplus of $429.
Interim estimated solvency ratios as at December 31, 2016, ranged from 93% to 107% (2015 — updated estimate is 90% to 102%; interim estimate was 96% to 110%) and the estimated three-year average solvency ratios, adjusted as required by the Pension Benefits Standards Regulations, 1985, ranged from 93% to 104% (2015 — updated estimate is 95% to 106%; interim estimate was 97% to 108%).
The solvency valuation effectively uses the fair value (excluding any asset ceiling limit effects) of the funded defined benefit pension plan assets (adjusted for theoretical wind-up expenses) to measure the solvency assets. Although the defined benefit obligations accrued and the solvency liabilities are calculated similarly, the assumptions used for each differ, primarily in respect of retirement ages and discount rates, and the solvency liabilities, due to the
![]()
notes to consolidated financial statements
required assumption about each plan being terminated on the valuation date, do not reflect assumptions about future compensation levels. Relative to the experience-based estimates of retirement ages used for purposes of determining the defined benefit obligations accrued, the minimum no-consent retirement age used for solvency valuation purposes may result in either a greater or lesser pension liability, depending upon the provisions of each plan. The solvency positions in this table reflect composite weighted average discount rates of 3.10% (2015 — 3.00%). A hypothetical decrease of 25 basis points in the composite weighted average discount rate would result in a $303 decrease in the PBSR solvency position as at December 31, 2016 (2015 — $322); these sensitivities are hypothetical, should be used with caution, are calculated without changing any other assumption and generally cannot be extrapolated because changes in amounts may not be linear.
(2) PBSR solvency position calculations are not required for the three pension plans arising from a pre-merger acquisition or for the non-registered, unfunded pension plans.
Fair value measurements
Information about the fair value measurements of our defined benefit pension plan assets, in aggregate, is as follows:
|
|
|
|
|
| Fair value measurements at reporting date using |
| ||||||||||||
|
| Total |
| Quoted prices in active |
| Other |
| ||||||||||||
As at December 31 (millions) |
| 2016 |
| 2015 |
| 2016 |
| 2015 |
| 2016 |
| 2015 |
| ||||||
Asset class |
|
|
|
|
|
|
|
|
|
|
|
|
| ||||||
Equity securities |
|
|
|
|
|
|
|
|
|
|
|
|
| ||||||
Canadian |
| $ | 1,172 |
| $ | 1,841 |
| $ | 1,135 |
| $ | 1,387 |
| $ | 37 |
| $ | 454 |
|
Foreign |
| 1,876 |
| 2,232 |
| 1,189 |
| 1,527 |
| 687 |
| 705 |
| ||||||
Debt securities |
|
|
|
|
|
|
|
|
|
|
|
|
| ||||||
Issued by national, provincial or local governments |
| 1,463 |
| 1,441 |
| 1,362 |
| 1,338 |
| 101 |
| 103 |
| ||||||
Corporate debt securities |
| 1,317 |
| 1,164 |
| — |
| — |
| 1,317 |
| 1,164 |
| ||||||
Asset-backed securities |
| 31 |
| 32 |
| — |
| — |
| 31 |
| 32 |
| ||||||
Commercial mortgages |
| 1,107 |
| 691 |
| — |
| — |
| 1,107 |
| 691 |
| ||||||
Cash, cash equivalents and other |
| 1,151 |
| 614 |
| 29 |
| 12 |
| 1,122 |
| 602 |
| ||||||
Real estate |
| 756 |
| 626 |
| — |
| 14 |
| 756 |
| 612 |
| ||||||
|
| 8,873 |
| 8,641 |
| $ | 3,715 |
| $ | 4,278 |
| $ | 5,158 |
| $ | 4,363 |
| ||
Effect of asset ceiling limit |
| (115 | ) | (74 | ) |
|
|
|
|
|
|
|
| ||||||
|
| $ | 8,758 |
| $ | 8,567 |
|
|
|
|
|
|
|
|
| ||||
As at December 31, 2016, we administered pension benefit trusts that held no TELUS Corporation Common Shares and held debt of TELUS Corporation with a fair value of approximately $3 million (2015 — $3 million) (see (c) — Allowable and prohibited investment types). As at December 31, 2016 and 2015, pension benefit trusts that we administered did not lease real estate to us.
Future benefit payments
Estimated future benefit payments from our defined benefit pension plans, calculated as at December 31, 2016, are as follows:
Years ending December 31 (millions) |
|
|
| |
2017 |
| $ | 441 |
|
2018 |
| 450 |
| |
2019 |
| 456 |
| |
2020 |
| 459 |
| |
2021 |
| 464 |
| |
2022-2026 |
| 2,399 |
| |
(c) Plan investment strategies and policies
Our primary goal for the defined benefit pension plans is to ensure the security of the retirement income and other benefits of the plan members and their beneficiaries. A secondary goal is to maximize the long-term rate of return on the defined benefit plans’ assets within a level of risk acceptable to us.
Risk management
We consider absolute risk (the risk of contribution increases, inadequate plan surplus and unfunded obligations) to be more important than relative return risk. Accordingly, the defined benefit plans’ designs, the nature and maturity of defined benefit obligations and the characteristics of the plans’ memberships significantly influence investment strategies and policies. We manage risk by specifying allowable and prohibited investment types, setting diversification strategies and determining target asset allocations.
Allowable and prohibited investment types
Allowable and prohibited investment types, along with associated guidelines and limits, are set out in each plan’s required Statement of Investment Policies and Procedures (SIPP), which is reviewed and approved annually by the designated governing body. The SIPP guidelines and limits are further governed by the permitted investments and lending limits set out in the Pension Benefits Standards Regulations, 1985. As well as conventional investments, each
![]()
notes to consolidated financial statements
fund’s SIPP may provide for the use of derivative products to facilitate investment operations and to manage risk, provided that no short position is taken, no use of leverage is made and there is no violation of guidelines and limits established in the SIPP. Internally and externally managed funds are not permitted to directly invest in our securities and are prohibited from increasing grandfathered investments in our securities; grandfathered investments were made prior to the merger of BC TELECOM Inc. and TELUS Corporation, our predecessors.
Diversification
Our strategy for investments in equity securities is to be broadly diversified across individual securities, industry sectors and geographical regions. A meaningful portion (20% – 30% of total plan assets) of the plans’ investment in equity securities is allocated to foreign equity securities with the intent of further diversifying plan assets. Debt securities may include a meaningful allocation to mortgages, with the objective of enhancing cash flow and providing greater scope for the management of the bond component of the plan assets. Debt securities also may include real return bonds to provide inflation protection, consistent with the indexed nature of some defined benefit obligations. Real estate investments are used to provide diversification of plan assets, hedging of potential long-term inflation and comparatively stable investment income.
Relationship between plan assets and benefit obligations
With the objective of lowering the long-term costs of our defined benefit pension plans, we purposely mismatch plan assets and benefit obligations. This mismatching is effected by including equity investments in the long-term asset mix, as well as fixed income securities and mortgages with durations that differ from those of the benefit obligations.
As at December 31, 2016, the present value-weighted average timing of estimated cash flows for the obligations (duration) of the defined benefit pension plans was 13.6 years (2015 — 13.6 years) and of the other defined benefit plans was 7.3 years (2015 — 7.3 years). Compensation for liquidity issues that may have otherwise arisen from the mismatching of plan assets and benefit obligations is provided by broadly diversified investment holdings (including cash and short-term investments) and cash flows from dividends, interest and rents from those diversified investment holdings.
Asset allocations
Our defined benefit pension plans’ target asset allocations and actual asset allocations are as follows:
|
| Target |
| Percentage of plan assets |
| ||
Years ended December 31 |
| 2017 |
| 2016 |
| 2015 |
|
Equity securities |
| 20-50% |
| 38 | % | 47 | % |
Debt securities |
| 40-75% |
| 53 | % | 46 | % |
Real estate |
| 5-25% |
| 9 | % | 7 | % |
Other |
| 0-4% |
| — |
| — |
|
|
|
|
| 100 | % | 100 | % |
(d) Employer contributions
The determination of the minimum funding amounts necessary for substantially all of our registered defined benefit pension plans is governed by the Pension Benefits Standards Act, 1985, which requires that, in addition to current service costs being funded, both going-concern and solvency valuations be performed on a specified periodic basis.
· Any excess of plan assets over plan liabilities determined in the going-concern valuation reduces our minimum funding requirement for current service costs, but may not reduce the requirement to an amount less than the employees’ contributions. The going-concern valuation generally determines the excess (if any) of a plan’s assets over its liabilities, determined on a projected benefit basis.
· As of the date of these consolidated financial statements, the solvency valuation generally requires that a plan’s average solvency liabilities, determined on the basis that the plan is terminated on the valuation date, in excess of its assets (if any) be funded, at a minimum, in equal annual amounts over a period not exceeding five years. So as to manage the risk of overfunding the plans, which results from the solvency valuation for funding purposes utilizing the average solvency ratios, our funding may include the provision of letters of credit. As at December 31, 2016, undrawn letters of credit in the amount of $175 million (2015 — $161 million) secured certain obligations of the defined benefit pension plans.
Our best estimate of fiscal 2017 employer contributions to our defined benefit plans is approximately $65 million for defined benefit pension plans. This estimate is based upon the mid-year 2016 annual funding reports that were prepared by actuaries using December 31, 2015, actuarial valuations. The funding reports are based on the pension plans’ fiscal years, which are calendar years. The next annual funding valuations are expected to be prepared mid-year 2017.
![]()
notes to consolidated financial statements
(e) Assumptions
As referred to in Note 1(b), management is required to make significant estimates related to certain actuarial and economic assumptions that are used in determining defined benefit pension costs, defined benefit obligations accrued and pension plan assets. These significant estimates are of a long-term nature, consistent with the nature of employee future benefits.
Demographic assumptions
In determining the defined benefit pension expense recognized in net income for the years ended December 31, 2016 and 2015, we utilized the Canadian Institute of Actuaries CPM 2014 mortality tables.
Financial assumptions
The discount rate, which is used to determine a plan’s defined benefit obligations accrued, is based upon the yield on long-term, high-quality fixed-term investments, and is set annually. The rate of future increases in compensation is based upon current benefits policies and economic forecasts.
The significant weighted average actuarial assumptions arising from these estimates and adopted in measuring our defined benefit obligations accrued are as follows:
|
| 2016 |
| 2015 |
|
Discount rate 1 used to determine: |
|
|
|
|
|
Net benefit costs for the year ended December 31 |
| 4.00 | % | 3.90 | % |
Defined benefit obligations accrued as at December 31 |
| 3.80 | % | 4.00 | % |
Current service cost in subsequent fiscal year |
| 4.00 | % | 4.00 | % |
Rate of future increases in compensation used to determine: |
|
|
|
|
|
Net benefit costs for the year ended December 31 |
| 3.00 | % | 3.00 | % |
Defined benefit obligations accrued as at December 31 |
| 2.51 | % | 3.00 | % |
(1) In 2016, we refined our methodology for estimating the discount rate to reflect discount rates appropriate for the timing of estimated cash flows for the obligations, rather than applying a single discount rate that was not specific to the timing of the estimated cash flows for the obligations. The discount rate disclosed in this table reflects the computation of an average discount rate that replicates the timing of the obligation cash flows. This refinement in estimation methodology did not have a material impact on our 2016 results of operations.
Sensitivity of key assumptions
The sensitivity of our key assumptions for our defined benefit pension plans was as follows:
Years ended, or as at, December 31 |
| 2016 |
| 2015 |
| ||||||||
Increase (decrease) (millions) |
| Change in |
| Change in |
| Change in |
| Change in |
| ||||
Sensitivity of key demographic assumptions to an increase of one year 1 in life expectancy |
| $ | 228 |
| $ | 10 |
| $ | 214 |
| $ | 11 |
|
Sensitivity of key financial assumptions to a hypothetical decrease of 25 basis points 1 in: |
|
|
|
|
|
|
|
|
| ||||
Discount rate |
| $ | 310 |
| $ | 17 |
| $ | 302 |
| $ | 17 |
|
Rate of future increases in compensation |
| $ | (27 | ) | $ | (3 | ) | $ | (26 | ) | $ | (3 | ) |
(1) These sensitivities are hypothetical and should be used with caution. Favourable hypothetical changes in the assumptions result in decreased amounts, and unfavourable hypothetical changes in the assumptions result in increased amounts, of the obligations and expenses. Changes in amounts based on a variation in assumptions of one year or 25 basis points generally cannot be extrapolated because the relationship of the change in assumption to the change in amounts may not be linear. Also, in this table, the effect of a variation in a particular assumption on the change in obligations or change in expense is calculated without changing any other assumption; in reality, changes in one factor may result in changes in another (for example, increases in the discount rate may result in changes in expectations about the rate of future increases in compensation), which might magnify or counteract the sensitivities.
(f) Defined contribution plans — expense
Our total defined contribution pension plan costs recognized were as follows:
|
| 2016 |
|
|
| ||||||||
Years ended December 31 (millions) |
| Traditional |
| Transformative |
| Total |
| 2015 |
| ||||
Union pension plan and public service pension plan contributions |
| $ | 26 |
| $ | 36 |
| $ | 62 |
| $ | 28 |
|
Other defined contribution pension plans |
| 63 |
| 5 |
| 68 |
| 62 |
| ||||
|
| $ | 89 |
| $ | 41 |
| $ | 130 |
| $ | 90 |
|
We expect that our 2017 union pension plan and public service pension plan contributions will be approximately $88 million.
(g) Other defined benefit plans
For the year ended December 31, 2016, other defined benefit current service cost was $1 million (2015 — $NIL), financing cost was $2 million (2015 — $1 million) and other re-measurements recorded in other comprehensive income were $NIL (2015 — $(1) million). Estimated future benefit payments from our other defined benefit plans, calculated as at December 31, 2016, are $2 million annually for the five-year period from 2017 to 2021 and $7 million for the five-year period from 2022 to 2026.
![]()
notes to consolidated financial statements
15 restructuring and other costs
(a) Details of restructuring and other costs
With the objective of reducing ongoing costs, we incur associated incremental, non-recurring restructuring costs, as discussed further in (b) following. We may also incur atypical charges when undertaking major or transformational changes to our business or operating models, as discussed further in (c) following. We also include incremental external costs incurred in connection with business acquisition or disposition activity, as well as litigation costs, in the context of significant losses or settlements, in other costs.
Restructuring and other costs are presented in the Consolidated statements of income and other comprehensive income as set out in the following table:
|
| Restructuring (b) |
| Other (c) |
| Total |
| ||||||||||||
Years ended December 31 (millions) |
| 2016 |
| 2015 |
| 2016 |
| 2015 |
| 2016 |
| 2015 |
| ||||||
Goods and services purchased |
| $ | 62 |
| $ | 70 |
| $ | — |
| $ | — |
| $ | 62 |
| $ | 70 |
|
Employee benefits expense |
| 112 |
| 156 |
| 305 |
| — |
| 417 |
| 156 |
| ||||||
|
| $ | 174 |
| $ | 226 |
| $ | 305 |
| $ | — |
| $ | 479 |
| $ | 226 |
|
(b) Restructuring provisions
Employee related provisions and other provisions, as presented in Note 25, include amounts in respect of restructuring activities. In 2016, restructuring activities included ongoing and incremental efficiency initiatives, including personnel-related costs and rationalization of real estate. These initiatives were intended to improve our long-term operating productivity and competitiveness.
|
| 2016 |
| 2015 |
| ||||||||||||||
Years ended December 31 (millions) |
| Employee |
| Other 1 |
| Total 1 |
| Employee |
| Other 1 |
| Total 1 |
| ||||||
Restructuring costs |
|
|
|
|
|
|
|
|
|
|
|
|
| ||||||
Additions |
| $ | 116 |
| $ | 69 |
| $ | 185 |
| $ | 160 |
| $ | 74 |
| $ | 234 |
|
Reversal |
| (4 | ) | (7 | ) | (11 | ) | (4 | ) | (4 | ) | (8 | ) | ||||||
Expense |
| 112 |
| 62 |
| 174 |
| 156 |
| 70 |
| 226 |
| ||||||
Use |
| (146 | ) | (39 | ) | (185 | ) | (81 | ) | (41 | ) | (122 | ) | ||||||
Expenses greater (less) than disbursements |
| (34 | ) | 23 |
| (11 | ) | 75 |
| 29 |
| 104 |
| ||||||
Restructuring provisions |
|
|
|
|
|
|
|
|
|
|
|
|
| ||||||
Balance, beginning of period |
| 116 |
| 57 |
| 173 |
| 41 |
| 28 |
| 69 |
| ||||||
Balance, end of period |
| $ | 82 |
| $ | 80 |
| $ | 162 |
| $ | 116 |
| $ | 57 |
| $ | 173 |
|
(1) The transactions and balances in this column, excluding share-based compensation amounts, are included in, and thus are a subset of, the transactions and balances in the column with the same caption in Note 25.
(c) Other costs
For the year ended December 31, 2016, other costs are in respect of immediately vesting, transformative compensation expense for substantially all of our existing unionized (see Note 29(c)) and non-unionized Canadian-situated workforces; a portion of the expense is considered share-based compensation for accounting purposes, as set out in Note 13(a). The compensation vested immediately, and thus was expensed when incurred, as there was no requisite service period of the recipients. The one-time payment to our existing unionized Canadian-situated workforce was compensation in respect of collective agreement concessions that moderate future labour costs and underpin productivity improvements, as well as in lieu of salary increases that would otherwise have been paid on July 1, 2016, 2017 and 2018; the one-time payment to our non-unionized Canadian-sited workforce was in lieu of general salary increases that would otherwise have been awarded in 2017 and 2018.
![]()
notes to consolidated financial statements
16 accounts receivable
As at December 31 (millions) |
| Note |
| 2016 |
| 2015 |
| ||
Customer accounts receivable |
| 4(b) |
| $ | 1,217 |
| $ | 1,199 |
|
Accrued receivables — customer |
|
|
| 131 |
| 128 |
| ||
Allowance for doubtful accounts |
| 4(b) |
| (54 | ) | (52 | ) | ||
|
|
|
| 1,294 |
| 1,275 |
| ||
Accrued receivables — other |
|
|
| 177 |
| 153 |
| ||
|
|
|
| $ | 1,471 |
| $ | 1,428 |
|
17 property, plant and equipment
(millions) |
| Network |
| Buildings and |
| Other |
| Land |
| Assets under |
| Total |
| ||||||
At cost |
|
|
|
|
|
|
|
|
|
|
|
|
| ||||||
As at January 1, 2015 |
| $ | 26,415 |
| $ | 2,801 |
| $ | 1,163 |
| $ | 55 |
| $ | 504 |
| $ | 30,938 |
|
Additions 1 |
| 732 |
| 24 |
| 93 |
| — |
| 1,252 |
| 2,101 |
| ||||||
Dispositions, retirements and other |
| (1,098 | ) | (106 | ) | (209 | ) | — |
| — |
| (1,413 | ) | ||||||
Assets under construction put into service |
| 1,142 |
| 128 |
| 73 |
| — |
| (1,343 | ) | — |
| ||||||
As at December 31, 2015 |
| 27,191 |
| 2,847 |
| 1,120 |
| 55 |
| 413 |
| 31,626 |
| ||||||
Additions 1 |
| 762 |
| 45 |
| 39 |
| — |
| 1,472 |
| 2,318 |
| ||||||
Additions arising from business acquisitions |
| — |
| 1 |
| 1 |
| — |
| — |
| 2 |
| ||||||
Dispositions, retirements and other |
| (739 | ) | (78 | ) | (223 | ) | — |
| — |
| (1,040 | ) | ||||||
Assets under construction put into service |
| 1,070 |
| 139 |
| 84 |
| — |
| (1,293 | ) | — |
| ||||||
As at December 31, 2016 |
| $ | 28,284 |
| $ | 2,954 |
| $ | 1,021 |
| $ | 55 |
| $ | 592 |
| $ | 32,906 |
|
Accumulated depreciation |
|
|
|
|
|
|
|
|
|
|
|
|
| ||||||
As at January 1, 2015 |
| $ | 19,202 |
| $ | 1,808 |
| $ | 805 |
| $ | — |
| $ | — |
| $ | 21,815 |
|
Depreciation |
| 1,268 |
| 95 |
| 112 |
| — |
| — |
| 1,475 |
| ||||||
Dispositions, retirements and other |
| (1,119 | ) | (93 | ) | (188 | ) | — |
| — |
| (1,400 | ) | ||||||
As at December 31, 2015 |
| 19,351 |
| 1,810 |
| 729 |
| — |
| — |
| 21,890 |
| ||||||
Depreciation |
| 1,357 |
| 99 |
| 108 |
| — |
| — |
| 1,564 |
| ||||||
Dispositions, retirements and other |
| (758 | ) | (73 | ) | (181 | ) | — |
| — |
| (1,012 | ) | ||||||
As at December 31, 2016 |
| $ | 19,950 |
| $ | 1,836 |
| $ | 656 |
| $ | — |
| $ | — |
| $ | 22,442 |
|
Net book value |
|
|
|
|
|
|
|
|
|
|
|
|
| ||||||
As at December 31, 2015 |
| $ | 7,840 |
| $ | 1,037 |
| $ | 391 |
| $ | 55 |
| $ | 413 |
| $ | 9,736 |
|
As at December 31, 2016 |
| $ | 8,334 |
| $ | 1,118 |
| $ | 365 |
| $ | 55 |
| $ | 592 |
| $ | 10,464 |
|
(1) For the year ended December 31, 2016, additions include $(40) (2015 — $65) in respect of asset retirement obligations (see Note 25).
As at December 31, 2016, our contractual commitments for the acquisition of property, plant and equipment totalled $436 million over a period ending December 31, 2020 (2015 — $326 million over a period ending December 31, 2017).
![]()
notes to consolidated financial statements
18 intangible assets and goodwill
(a) Intangible assets and goodwill, net
|
| Intangible assets subject to amortization |
| Intangible |
|
|
|
|
|
|
| ||||||||||||||||||||
(millions) |
| Subscriber |
| Customer contracts, |
| Software |
| Access to |
| Assets |
| Total |
| Spectrum |
| Total |
| Goodwill 1 |
| Total |
| ||||||||||
At cost |
|
|
|
|
|
|
|
|
|
|
|
|
|
|
|
|
|
|
|
|
| ||||||||||
As at January 1, 2015 |
| $ | 245 |
| $ | 228 |
| $ | 3,406 |
| $ | 83 |
| $ | 222 |
| $ | 4,184 |
| $ | 6,390 |
| $ | 10,574 |
| $ | 4,121 |
| $ | 14,695 |
|
Additions |
| — |
| — |
| 19 |
| 4 |
| 508 |
| 531 |
| 2,048 |
| 2,579 |
| — |
| 2,579 |
| ||||||||||
Additions arising from business acquisitions |
| — |
| — |
| 2 |
| — |
| — |
| 2 |
| — |
| 2 |
| 4 |
| 6 |
| ||||||||||
Dispositions, retirements and other (including capitalized interest (see Note 8)) |
| — |
| — |
| (140 | ) | 3 |
| — |
| (137 | ) | 42 |
| (95 | ) | — |
| (95 | ) | ||||||||||
Assets under construction put into service |
| — |
| — |
| 514 |
| — |
| (514 | ) | — |
| — |
| — |
| — |
| — |
| ||||||||||
As at December 31, 2015 |
| 245 |
| 228 |
| 3,801 |
| 90 |
| 216 |
| 4,580 |
| 8,480 |
| 13,060 |
| 4,125 |
| 17,185 |
| ||||||||||
Additions |
| — |
| — |
| 50 |
| 4 |
| 575 |
| 629 |
| 164 |
| 793 |
| — |
| 793 |
| ||||||||||
Additions arising from business acquisitions |
| — |
| 12 |
| 4 |
| — |
| — |
| 16 |
| — |
| 16 |
| 22 |
| 38 |
| ||||||||||
Dispositions, retirements and other (including capitalized interest (see Note 8)) |
| — |
| — |
| (137 | ) | (3 | ) | — |
| (140 | ) | 49 |
| (91 | ) | — |
| (91 | ) | ||||||||||
Assets under construction put into service |
| — |
| — |
| 577 |
| 2 |
| (579 | ) | — |
| — |
| — |
| — |
| — |
| ||||||||||
Net foreign exchange differences |
| — |
| — |
| — |
| — |
| — |
| — |
| — |
| — |
| 4 |
| 4 |
| ||||||||||
As at December 31, 2016 |
| $ | 245 |
| $ | 240 |
| $ | 4,295 |
| $ | 93 |
| $ | 212 |
| $ | 5,085 |
| $ | 8,693 |
| $ | 13,778 |
| $ | 4,151 |
| $ | 17,929 |
|
Accumulated amortization |
|
|
|
|
|
|
|
|
|
|
|
|
|
|
|
|
|
|
|
|
| ||||||||||
As at January 1, 2015 |
| $ | 98 |
| $ | 139 |
| $ | 2,490 |
| $ | 50 |
| $ | — |
| $ | 2,777 |
| $ | — |
| $ | 2,777 |
| $ | 364 |
| $ | 3,141 |
|
Amortization |
| 14 |
| 29 |
| 387 |
| 4 |
| — |
| 434 |
| — |
| 434 |
| — |
| 434 |
| ||||||||||
Dispositions, retirements and other |
| — |
| — |
| (138 | ) | 2 |
| — |
| (136 | ) | — |
| (136 | ) | — |
| (136 | ) | ||||||||||
As at December 31, 2015 |
| 112 |
| 168 |
| 2,739 |
| 56 |
| — |
| 3,075 |
| — |
| 3,075 |
| 364 |
| 3,439 |
| ||||||||||
Amortization |
| 13 |
| 30 |
| 436 |
| 4 |
| — |
| 483 |
| — |
| 483 |
| — |
| 483 |
| ||||||||||
Dispositions, retirements and other |
| — |
| — |
| (143 | ) | (1 | ) | — |
| (144 | ) | — |
| (144 | ) | — |
| (144 | ) | ||||||||||
As at December 31, 2016 |
| $ | 125 |
| $ | 198 |
| $ | 3,032 |
| $ | 59 |
| $ | — |
| $ | 3,414 |
| $ | — |
| $ | 3,414 |
| $ | 364 |
| $ | 3,778 |
|
Net book value |
|
|
|
|
|
|
|
|
|
|
|
|
|
|
|
|
|
|
|
|
| ||||||||||
As at December 31, 2015 |
| $ | 133 |
| $ | 60 |
| $ | 1,062 |
| $ | 34 |
| $ | 216 |
| $ | 1,505 |
| $ | 8,480 |
| $ | 9,985 |
| $ | 3,761 |
| $ | 13,746 |
|
As at December 31, 2016 |
| $ | 120 |
| $ | 42 |
| $ | 1,263 |
| $ | 34 |
| $ | 212 |
| $ | 1,671 |
| $ | 8,693 |
| $ | 10,364 |
| $ | 3,787 |
| $ | 14,151 |
|
(1) Accumulated amortization of goodwill is amortization recorded prior to 2002; there are no accumulated impairment losses in the accumulated amortization of goodwill.
notes to consolidated financial statements
As at December 31, 2016, our contractual commitments for the acquisition of intangible assets, excluding that arising from BCE Inc.’s announced agreement to acquire Manitoba Telecom Services Inc. discussed in the following paragraph, totalled $82 million over a period ending December 31, 2020 (2015 — $55 million over a period ending December 31, 2018).
On May 2, 2016, BCE Inc. announced that it had entered into a definitive agreement to acquire all issued and outstanding shares of Manitoba Telecom Services Inc., subject to customary closing conditions, including court, shareholder and regulatory approvals, and was expected to close in late 2016 or early 2017; as of September 30, 2016, court and shareholder approvals had been obtained. In June 2016, we submitted a notification and advanced ruling request to the Competition Bureau regarding our previously announced agreement in principle with BCE Inc. pursuant to which we intend to acquire a portion of Manitoba Telecom Services Inc.’s postpaid wireless subscribers and dealer locations in Manitoba, upon the successful completion of BCE Inc.’s acquisition of Manitoba Telecom Services Inc. Our total price of the transaction with BCE Inc. will vary depending upon the actual number of qualifying postpaid wireless subscribers acquired. On February 2, 2017, BCE Inc. announced that it expected to close its acquisition of Manitoba Telecom Services Inc. by the end of March 31, 2017, subject to Competition Bureau and Innovation, Science and Economic Development Canada approvals. As of February 9, 2017, BCE Inc. had not received the requisite approvals from the Competition Bureau and Innovation, Science and Economic Development Canada.
(b) Intangible assets with indefinite lives — spectrum licences
Our intangible assets with indefinite lives include spectrum licences granted by Innovation, Science and Economic Development Canada and which are used for the provision of both mobile and fixed wireless services. The spectrum licence policy terms indicate that the spectrum licences will likely be renewed. We expect our spectrum licences to be renewed every 20 years following a review of our compliance with licence terms. In addition to current usage, our licensed spectrum can be used for planned and new technologies. As a result of our assessment of the combination of these significant factors, we currently consider our spectrum licences to have indefinite lives and, as referred to in Note 1(b), this represents a significant judgment for us.
(c) Impairment testing of intangible assets with indefinite lives and goodwill
General
As referred to in Note 1(i), the carrying values of intangible assets with indefinite lives and goodwill are periodically tested for impairment and, as referred to in Note 1(b), this test represents a significant estimate for us, while also requiring significant judgments to be made.
The allocated carrying values of intangible assets with indefinite lives and goodwill are as set out in the following table.
|
| Intangible assets with |
| Goodwill |
| Total |
| ||||||||||||
As at December 31 (millions) |
| 2016 |
| 2015 |
| 2016 |
| 2015 |
| 2016 |
| 2015 |
| ||||||
Wireless |
| $ | 8,693 |
| $ | 8,480 |
| $ | 2,647 |
| $ | 2,646 |
| $ | 11,340 |
| $ | 11,126 |
|
Wireline |
| — |
| — |
| 1,140 |
| 1,115 |
| 1,140 |
| 1,115 |
| ||||||
|
| $ | 8,693 |
| $ | 8,480 |
| $ | 3,787 |
| $ | 3,761 |
| $ | 12,480 |
| $ | 12,241 |
|
The recoverable amounts of the cash-generating units’ assets have been determined based on a fair value less costs of disposal calculation (2015 — value in use calculation). There is a material degree of uncertainty with respect to the estimates of the recoverable amounts of the cash-generating units’ assets, given the necessity of making key economic assumptions about the future. The fair value less costs of disposal recoverable amounts are categorized as Level 3 fair value measures.
We validate our recoverable amount calculation results through a market-comparable approach and an analytical review of industry facts and facts that are specific to us. The market-comparable approach uses current (at time of test) market consensus estimates and equity trading prices for U.S. and Canadian firms in the same industry. In addition, we ensure that the combination of the valuations of the cash-generating units is reasonable based on our current (at time of test) market values.
Key assumptions
The fair value less costs of disposal and the value in use calculations both use discounted cash flow projections that employ the following key assumptions: future cash flows and growth projections (including judgments about the allocation of future capital expenditures supporting both wireless and wireline operations); associated economic risk assumptions and estimates of achieving key operating metrics and drivers; estimates of future generational infrastructure capital expenditures; and the future weighted average cost of capital. We consider a range of reasonably possible amounts to use for key assumptions and decide upon amounts that represent management’s best estimates of market amounts (2015 — TELUS-specific amounts). In the normal course, we make changes to key assumptions so that they reflect current (at time of test) economic conditions, updates of historical information used to develop the key assumptions and changes (if any) in our debt ratings.
The key assumptions for cash flow projections are based upon our approved financial forecasts, which span a period of three years and are discounted, for December 2016 annual test purposes, at a consolidated post-tax notional rate of 7.0% (the fair value less costs of disposal method requires the use of a post-tax rate) (2015 — 9.11% (the value in use method requires the use of a pre-tax rate)). For impairment testing valuations, the cash flows subsequent to the three-year projection period are extrapolated, for December 2016 annual test purposes, using perpetual growth rates of 2.0% (2015 — 1.75%) for the wireless cash-generating unit and 2.0% (2015 — 0.50%) for the wireline cash-generating unit; these growth rates do not exceed the long-term average growth rates observed in the markets in which we operate.
![]()
notes to consolidated financial statements
We believe that any reasonably possible change in the key assumptions on which the calculation of the recoverable amounts of our cash-generating units is based would not cause the cash-generating units’ carrying values (including the intangible assets with indefinite lives and the goodwill allocated to each cash-generating unit) to exceed their recoverable amounts. If the future were to adversely differ from management’s best estimates of key assumptions and associated cash flows were to be materially adversely affected, we could potentially experience future material impairment charges in respect of our intangible assets with indefinite lives and goodwill.
Sensitivity testing
Sensitivity testing was conducted as a part of the December 2016 annual test, a component of which was hypothetical changes in the future weighted average cost of capital. Stress testing included moderate declines in annual cash flows with all other assumptions being held constant; under this scenario, we would be able to recover the carrying values of our intangible assets with indefinite lives and goodwill for the foreseeable future.
(d) Business acquisitions
During the years ended December 31, 2016 and 2015, we acquired 100% ownership of multiple businesses complementary to our existing lines of business. The primary factor that gave rise to the recognition of goodwill was the earnings capacity of the acquired businesses in excess of the net tangible and intangible assets acquired (such excess arising from: the low levels of tangible assets relative to the earnings capacity of the businesses; expected synergies; the benefits of acquiring established businesses with certain capabilities in the industry; and the geographic presence of the acquired businesses). A portion of the amounts assigned to goodwill may be deductible for income tax purposes.
The acquisition-date fair values assigned to assets acquired and liabilities assumed in the individually immaterial acquisitions are also individually immaterial. Any differences between the results of operations currently presented and the pro forma amounts for operating revenues, net income and basic and diluted net income per Common Share reflecting the results of operations as if the business acquisitions had been completed at the beginning of the fiscal year are immaterial (as are the post-acquisition operating revenues and net income of the acquired businesses for the year ended December 31, 2016).
19 leases
We occupy leased premises in various locations and have land, buildings and equipment under operating leases. For the year ended December 31, 2016, real estate and vehicle operating lease expenses, which are net of the amortization of deferred gains on the sale-leaseback of buildings and the occupancy costs associated with leased real estate, were $231 million (2015 — $227 million); occupancy costs associated with leased real estate totalled $78 million (2015 — $88 million).
As referred to in Note 15, we have consolidated administrative real estate holdings and, in some instances, this has resulted in subletting land and buildings. The future minimum lease payments under operating leases are as follows:
As at December 31 (millions) |
| 2016 |
| 2015 |
| ||||||||||||||
Years ending |
| Operating |
| Operating |
| Total |
| Operating |
| Operating |
| Total |
| ||||||
1 year hence |
| $ | 211 |
| $ | 6 |
| $ | 217 |
| $ | 206 |
| $ | 6 |
| $ | 212 |
|
2 years hence |
| 192 |
| 6 |
| 198 |
| 177 |
| 6 |
| 183 |
| ||||||
3 years hence |
| 171 |
| 12 |
| 183 |
| 157 |
| 12 |
| 169 |
| ||||||
4 years hence |
| 147 |
| 13 |
| 160 |
| 132 |
| 12 |
| 144 |
| ||||||
5 years hence |
| 125 |
| 13 |
| 138 |
| 112 |
| 13 |
| 125 |
| ||||||
Thereafter |
| 599 |
| 220 |
| 819 |
| 624 |
| 228 |
| 852 |
| ||||||
|
| $ | 1,445 |
| $ | 270 |
| $ | 1,715 |
| $ | 1,408 |
| $ | 277 |
| $ | 1,685 |
|
(1) Immaterial amounts for minimum lease receipts from sublet land and buildings have been netted against the minimum lease payments in this table. Minimum lease payments exclude occupancy costs and thus will differ from future amounts reported for operating lease expenses. As at December 31, 2016, commitments under operating leases for occupancy costs totalled $869 (2015 — $907).
(2) As set out in Note 21(d), we have entered into leases with the real estate joint ventures. This table includes 100% of the minimum lease payment amounts due under these leases; of the total, $112 (2015 — $116) is due to our economic interests in the real estate joint ventures and $158 (2015 — $159) is due to our partners’ economic interests in the real estate joint ventures.
![]()
notes to consolidated financial statements
Of the total amount above as at December 31, 2016:
· Approximately 34% (2015 — 37%) was in respect of our five largest leases, all of which were for office premises over various terms, with expiry dates ranging from 2024 to 2036 (2015 — ranging from 2024 to 2036); the weighted average term of these leases is approximately 14 years (2015 — 15 years).
· Approximately 30% (2015 — 29%) was in respect of wireless site leases; the weighted average term of these leases is approximately 17 years (2015 — 17 years).
See Note 2(b) for details of significant changes to IFRS-IASB which are not yet effective and have not yet been applied, but which will significantly affect the timing of the recognition of operating lease expenses and their recognition in the Consolidated statement of financial position, as well as their classification in the Consolidated statement of income and other comprehensive income and the Consolidated statement of cash flows.
20 other long-term assets
As at December 31 (millions) |
| Note |
| 2016 |
| 2015 |
| ||
Pension assets |
| 14(a) |
| $ | 358 |
| $ | 356 |
|
Investments |
|
|
| 62 |
| 69 |
| ||
Prepaid maintenance |
|
|
| 62 |
| 46 |
| ||
Real estate joint ventures |
| 21(c) |
| 30 |
| 25 |
| ||
Real estate joint venture advances |
| 21(c) |
| 21 |
| 3 |
| ||
Other |
|
|
| 107 |
| 94 |
| ||
|
|
|
| $ | 640 |
| $ | 593 |
|
21 real estate joint ventures
(a) General
In 2011, we partnered, as equals, with an arm’s-length party in a residential condominium, retail and commercial real estate redevelopment project, TELUS Garden, in Vancouver, British Columbia. TELUS is a tenant in TELUS Garden, which is now our global headquarters. The new-build office tower has received its 2009 Leadership in Energy and Environmental Design (LEED) Platinum certification, and the neighbouring new-build residential condominium tower was built to the LEED Gold standard.
In 2013, we partnered, as equals, with two arm’s-length parties (one of which is also our TELUS Garden partner) in a residential, retail and commercial real estate redevelopment project, TELUS Sky, in Calgary, Alberta. The new-build tower, scheduled for completion in 2018, is to be built to the LEED Platinum standard.
![]()
notes to consolidated financial statements
(b) Real estate joint ventures — summarized financial information
As at December 31 (millions) |
| 2016 |
| 2015 |
| ||
ASSETS |
|
|
|
|
| ||
Current assets |
|
|
|
|
| ||
Cash and temporary investments, net |
| $ | 15 |
| $ | 20 |
|
Escrowed deposits for tenant inducements and liens |
| 5 |
| 20 |
| ||
Sales contract deposits held by arm’s-length trustee |
| 2 |
| 6 |
| ||
Other |
| 6 |
| 21 |
| ||
Property under development — residential condominiums (subject to sales contracts) |
| 13 |
| 156 |
| ||
|
| 41 |
| 223 |
| ||
Non-current assets |
|
|
|
|
| ||
Property under development — Investment property |
| 121 |
| 96 |
| ||
Investment property |
| 261 |
| 238 |
| ||
|
| 382 |
| 334 |
| ||
|
| $ | 423 |
| $ | 557 |
|
LIABILITIES AND OWNERS’ EQUITY |
|
|
|
|
| ||
Current liabilities |
|
|
|
|
| ||
Accounts payable and accrued liabilities |
| $ | 18 |
| $ | 46 |
|
Sales contract deposits |
|
|
|
|
| ||
Payable |
| 3 |
| 55 |
| ||
Held by arm’s-length trustee |
| 2 |
| 6 |
| ||
Current portion of senior secured 3.4% bonds due July 2025 |
| 4 |
| 4 |
| ||
Construction credit facilities |
| — |
| 96 |
| ||
Construction holdback liabilities |
| 7 |
| 10 |
| ||
Other financial liability 1 |
| — |
| 18 |
| ||
|
| 34 |
| 235 |
| ||
Non-current liabilities |
|
|
|
|
| ||
Construction credit facilities |
| 63 |
| 9 |
| ||
Other |
| — |
| 4 |
| ||
Senior secured 3.4% bonds due July 2025 |
| 213 |
| 217 |
| ||
|
| 276 |
| 230 |
| ||
Liabilities |
| 310 |
| 465 |
| ||
Owners’ equity |
|
|
|
|
| ||
TELUS 2 |
| 48 |
| 36 |
| ||
Other partners |
| 65 |
| 56 |
| ||
|
| 113 |
| 92 |
| ||
|
| $ | 423 |
| $ | 557 |
|
(1) Other financial liability was due to us; such amount was non-interest bearing, was secured by an $18 mortgage on the TELUS Garden residential condominium tower, was payable in cash and was due subsequent to repayment of the residential condominium tower construction credit facility.
(2) The equity amounts recorded by the real estate joint ventures differ from those recorded by us by the amount of the deferred gains on our real estate contributed and the valuation provision we have recorded in excess of that recorded by the real estate joint venture.
Years ended December 31 (millions) |
| 2016 |
| 2015 |
| ||
Revenue |
|
|
|
|
| ||
From investment property |
| $ | 34 |
| $ | 17 |
|
From sale of residential condominiums |
| $ | 262 |
| $ | — |
|
Depreciation and amortization |
| $ | 8 |
| $ | 7 |
|
Interest expense 1 |
| $ | 10 |
| $ | 7 |
|
Net income (loss) and comprehensive income (loss) 2 |
| $ | 72 |
| $ | (4 | ) |
(1) During the year ended December 31, 2016, the real estate joint ventures capitalized $4 (2015 — $5) of financing costs.
(2) As the real estate joint ventures are partnerships, no provision for income taxes of the partners is made in determining the real estate joint ventures’ net income (loss) and comprehensive income (loss).
![]()
notes to consolidated financial statements
(c) Our real estate joint ventures activity
Our real estate joint ventures investment activity is as set out in the following table.
|
| 2016 |
| 2015 |
| ||||||||||||||
Years ended December 31 (millions) |
| Loans and |
| Equity 2 |
| Total |
| Loans and |
| Equity 2 |
| Total |
| ||||||
Related to real estate joint ventures’ statements of income and other comprehensive income |
|
|
|
|
|
|
|
|
|
|
|
|
| ||||||
Comprehensive income (loss) attributable to us 3 |
| $ | — |
| $ | 33 |
| $ | 33 |
| $ | — |
| $ | (2 | ) | $ | (2 | ) |
Related to real estate joint ventures’ statements of financial position |
|
|
|
|
|
|
|
|
|
|
|
|
| ||||||
Items not affecting currently reported cash flows |
|
|
|
|
|
|
|
|
|
|
|
|
| ||||||
Recognition of gain initially deferred on our real estate initially contributed |
| — |
| 8 |
| 8 |
| — |
| — |
| — |
| ||||||
Construction credit facilities financing costs charged by us and other (Note 6) |
| 1 |
| — |
| 1 |
| 3 |
| — |
| 3 |
| ||||||
Cash flows in the current reporting period |
|
|
|
|
|
|
|
|
|
|
|
|
| ||||||
Construction credit facilities |
|
|
|
|
|
|
|
|
|
|
|
|
| ||||||
Amounts advanced |
| 33 |
| — |
| 33 |
| 44 |
| — |
| 44 |
| ||||||
Amounts repaid |
| (63 | ) | — |
| (63 | ) | (95 | ) | — |
| (95 | ) | ||||||
Financing costs paid to us |
| (1 | ) | — |
| (1 | ) | (3 | ) | — |
| (3 | ) | ||||||
Repayment of funds advanced |
| (18 | ) | — |
| (18 | ) | — |
| — |
| — |
| ||||||
Funds we contributed |
| — |
| — |
| — |
| — |
| 6 |
| 6 |
| ||||||
Funds repaid to us and earnings distributed |
| — |
| (21 | ) | (21 | ) | — |
| — |
| — |
| ||||||
Net increase (decrease) |
| (48 | ) | 20 |
| (28 | ) | (51 | ) | 4 |
| (47 | ) | ||||||
Real estate joint ventures carrying amounts |
|
|
|
|
|
|
|
|
|
|
|
|
| ||||||
Balance, beginning of period |
| 69 |
| 25 |
| 94 |
| 120 |
| 21 |
| 141 |
| ||||||
Valuation provision |
| — |
| (15 | ) | (15 | ) | — |
| — |
| — |
| ||||||
Balance, end of period |
| $ | 21 |
| $ | 30 |
| $ | 51 |
| $ | 69 |
| $ | 25 |
| $ | 94 |
|
(1) Loans and receivables are included in our Consolidated statements of financial position as Real estate joint venture advances and are comprised of advances under construction credit facilities (see (d)) and, prior to its repayment during the three-month period ended September 30, 2016, an $18 mortgage on the TELUS Garden residential condominium tower.
(2) We account for our interests in the real estate joint ventures using the equity method of accounting.
(3) As the real estate joint ventures are partnerships, no provision for income taxes of the partners is made in determining the real estate joint ventures’ net income (loss) and comprehensive income (loss); provision for income taxes is made in determining the comprehensive income (loss) attributable to us.
During the year ended December 31, 2016, the TELUS Garden real estate joint venture recognized $11 million (2015 — $6 million) of revenue from our TELUS Garden office tenancy; of this amount, one-half is due to our economic interest in the real estate joint venture and one-half is due to our partner’s economic interest in the real estate joint venture.
(d) Commitments and contingent liabilities
Construction commitments
The TELUS Sky real estate joint venture is expected to spend a total of approximately $400 million on the construction of a mixed-use tower. As at December 31, 2016, the real estate joint venture’s construction-related contractual commitments were approximately $121 million through to 2018 (2015 — $124 million through to 2018).
Construction credit facilities
The TELUS Sky real estate joint venture has a credit agreement with three Canadian financial institutions (as 66-2/3% lender) and TELUS Corporation (as 33-1/3% lender) to provide $342 million of construction financing for the project. The TELUS Garden real estate joint venture had a credit agreement with two Canadian financial institutions (as 50% lender) and TELUS Corporation (as 50% lender) to provide $136 million of construction financing for the residential project as at December 31, 2015; as at December 31, 2016, all outstanding amounts had been repaid.
The construction credit facilities contain customary real estate construction financing representations, warranties and covenants and are secured by demand debentures constituting first fixed and floating charge mortgages over the underlying real estate assets. The construction credit facilities are available by way of bankers’ acceptance or prime loan and bear interest at rates in line with similar construction financing facilities.
As at December 31 (millions) |
| Note |
| 2016 |
| 2015 |
| ||
Construction credit facilities commitment — TELUS Corporation |
|
|
|
|
|
|
| ||
Undrawn |
| 4(c) |
| $ | 93 |
| $ | 131 |
|
Advances |
|
|
| 21 |
| 51 |
| ||
|
|
|
| 114 |
| 182 |
| ||
Construction credit facilities commitment — other |
|
|
| 228 |
| 296 |
| ||
|
|
|
| $ | 342 |
| $ | 478 |
|
![]()
notes to consolidated financial statements
22 short-term borrowings
On July 26, 2002, one of our subsidiaries, TELUS Communications Inc., entered into an agreement with an arm’s-length securitization trust associated with a major Schedule I bank under which it is able to sell an interest in certain trade receivables up to a maximum of $500 million (2015 — $500 million). This revolving-period securitization agreement term ends December 31, 2018, and it requires minimum cash proceeds of $100 million from monthly sales of interests in certain trade receivables. TELUS Communications Inc. is required to maintain at least a BB (2015 — BB) credit rating by Dominion Bond Rating Service or the securitization trust may require the sale program to be wound down prior to the end of the term.
When we sell our trade receivables, we retain reserve accounts, which are retained interests in the securitized trade receivables, and servicing rights. As at December 31, 2016, we had sold to the trust (but continued to recognize) trade receivables of $116 million (2015 — $124 million). Short-term borrowings of $100 million (2015 — $100 million) are comprised of amounts advanced to us by the arm’s-length securitization trust pursuant to the sale of trade receivables.
The balance of short-term borrowings (if any) are comprised of amounts drawn on our bilateral bank facilities.
23 accounts payable and accrued liabilities
As at December 31 (millions) |
| 2016 |
| 2015 |
| ||
Accrued liabilities |
| $ | 1,013 |
| $ | 843 |
|
Payroll and other employee related liabilities |
| 460 |
| 410 |
| ||
Restricted stock units liability |
| 55 |
| 58 |
| ||
|
| 1,528 |
| 1,311 |
| ||
Trade accounts payable |
| 578 |
| 476 |
| ||
Interest payable |
| 144 |
| 134 |
| ||
Other |
| 80 |
| 69 |
| ||
|
| $ | 2,330 |
| $ | 1,990 |
|
24 advance billings and customer deposits
As at December 31 (millions) |
| 2016 |
| 2015 |
| ||
Advance billings |
| $ | 697 |
| $ | 706 |
|
Deferred customer activation and connection fees |
| 17 |
| 19 |
| ||
Customer deposits |
| 15 |
| 19 |
| ||
Regulatory deferral accounts |
| 8 |
| 16 |
| ||
|
| $ | 737 |
| $ | 760 |
|
25 provisions
(millions) |
| Asset |
| Employee |
| Other |
| Total |
| ||||
As at January 1, 2015 |
| $ | 320 |
| $ | 41 |
| $ | 107 |
| $ | 468 |
|
Additions 1 |
| 5 |
| 153 |
| 85 |
| 243 |
| ||||
Use |
| (9 | ) | (81 | ) | (45 | ) | (135 | ) | ||||
Reversal |
| (10 | ) | (4 | ) | (4 | ) | (18 | ) | ||||
Interest effect 2 |
| 71 |
| — |
| 1 |
| 72 |
| ||||
As at December 31, 2015 |
| 377 |
| 109 |
| 144 |
| 630 |
| ||||
Additions 1 |
| 15 |
| 113 |
| 71 |
| 199 |
| ||||
Use |
| (9 | ) | (141 | ) | (105 | ) | (255 | ) | ||||
Reversal |
| — |
| (4 | ) | (8 | ) | (12 | ) | ||||
Interest effect 2 |
| (44 | ) | — |
| 1 |
| (43 | ) | ||||
As at December 31, 2016 |
| $ | 339 |
| $ | 77 |
| $ | 103 |
| $ | 519 |
|
Current |
| $ | 19 |
| $ | 109 |
| $ | 69 |
| $ | 197 |
|
Non-current |
| 358 |
| — |
| 75 |
| 433 |
| ||||
As at December 31, 2015 |
| $ | 377 |
| $ | 109 |
| $ | 144 |
| $ | 630 |
|
Current |
| $ | 11 |
| $ | 76 |
| $ | 37 |
| $ | 124 |
|
Non-current |
| 328 |
| 1 |
| 66 |
| 395 |
| ||||
As at December 31, 2016 |
| $ | 339 |
| $ | 77 |
| $ | 103 |
| $ | 519 |
|
(1) For the year ended December 31, 2016, employee related additions are net of share-based compensation of $4 (2015 — $7).
(2) The difference of $(55) (2015 — $60) between the interest effect in this table and the amount disclosed in Note 8 is in respect of the change in the discount rates applicable to the provision, such difference being included in the cost of the associated asset(s) by way of being included with (netted against) the additions detailed in Note 17.
![]()
notes to consolidated financial statements
Asset retirement obligation
We establish provisions for liabilities associated with the retirement of property, plant and equipment when those obligations result from the acquisition, construction, development and/or normal operation of the assets. We expect that the cash outflows in respect of the balance accrued as at the financial statement date will occur proximate to the dates these assets are retired.
Employee related
The employee related provisions are largely in respect of restructuring activities (as discussed further in Note 15(b)). The timing of the cash outflows in respect of the balance accrued as at the financial statement date is substantially short-term in nature.
Other
The provisions for other include: legal claims; non-employee related restructuring activities (as discussed further in Note 15); and written put options, contract termination costs and onerous contracts related to business acquisitions. Other than as set out following, we expect that the cash outflows in respect of the balance accrued as at the financial statement date will occur over an indeterminate multi-year period.
As discussed further in Note 29, we are involved in a number of legal claims and we are aware of certain other possible legal claims. In respect of legal claims, we establish provisions, when warranted, after taking into account legal assessments, information presently available, and the expected availability of recourse. The timing of cash outflows associated with legal claims cannot be reasonably determined.
In connection with business acquisitions, we have established provisions for contingent consideration, contract termination costs and onerous contracts acquired. In respect of contract termination costs and onerous contracts acquired, cash outflows are expected to occur through mid-2018.
26 long-term debt
(a) Details of long-term debt
As at December 31 (millions) |
| Note |
| 2016 |
| 2015 |
| ||
TELUS Corporation notes |
| (b) |
| $ | 11,367 |
| $ | 11,164 |
|
TELUS Corporation commercial paper |
| (c) |
| 613 |
| 256 |
| ||
TELUS Communications Inc. debentures |
| (e) |
| 619 |
| 618 |
| ||
TELUS International (Cda) Inc. credit facility |
| (f) |
| 332 |
| — |
| ||
Long-term debt |
|
|
| $ | 12,931 |
| $ | 12,038 |
|
Current |
|
|
| $ | 1,327 |
| $ | 856 |
|
Non-current |
|
|
| 11,604 |
| 11,182 |
| ||
Long-term debt |
|
|
| $ | 12,931 |
| $ | 12,038 |
|
(b) TELUS Corporation notes
The notes are our senior, unsecured and unsubordinated obligations and rank equally in right of payment with all of our existing and future unsecured, unsubordinated obligations, are senior in right of payment to all of our existing and future subordinated indebtedness, and are effectively subordinated to all existing and future obligations of, or guaranteed by, our subsidiaries. The indentures governing the notes contain certain covenants which, among other things, place limitations on our ability and the ability of certain of our subsidiaries to: grant security in respect of indebtedness; enter into sale-leaseback transactions; and incur new indebtedness.
|
|
|
|
|
|
|
|
|
| Principal face amount |
| Redemption present |
| |||||||
Series 1 |
| Issued |
| Maturity |
| Issue |
| Effective |
| Originally |
| Outstanding at |
| Basis |
| Cessation |
| |||
4.95% Notes, Series CD |
| March 2007 |
| March 2017 |
| $ | 999.53 |
| 4.96 | % | $ | 700 million |
| $ | 700 million |
| 24 3 |
| N/A |
|
5.05% Notes, Series CG 4 |
| December 2009 |
| December 2019 |
| $ | 994.19 |
| 5.13 | % | $ | 1.0 billion |
| $ | 1.0 billion |
| 45.5 3 |
| N/A |
|
5.05% Notes, Series CH 4 |
| July 2010 |
| July 2020 |
| $ | 997.44 |
| 5.08 | % | $ | 1.0 billion |
| $ | 1.0 billion |
| 47 3 |
| N/A |
|
3.65% Notes, Series CI 4 |
| May 2011 |
| May 2016 |
| $ | 996.29 |
| 3.73 | % | $ | 600 million |
| $ | NIL |
| 29.5 3 |
| N/A |
|
3.35% Notes, Series CJ 4 |
| December 2012 |
| March 2023 |
| $ | 998.83 |
| 3.36 | % | $ | 500 million |
| $ | 500 million |
| 40 5 |
| Dec. 15, 2022 |
|
3.35% Notes, Series CK 4 |
| April 2013 |
| April 2024 |
| $ | 994.35 |
| 3.41 | % | $ | 1.1 billion |
| $ | 1.1 billion |
| 36 5 |
| Jan. 2, 2024 |
|
4.40% Notes, Series CL 4 |
| April 2013 |
| April 2043 |
| $ | 997.68 |
| 4.41 | % | $ | 600 million |
| $ | 600 million |
| 47 5 |
| Oct. 1, 2042 |
|
3.60% Notes, Series CM 4 |
| November 2013 |
| January 2021 |
| $ | 997.15 |
| 3.65 | % | $ | 400 million |
| $ | 400 million |
| 35 3 |
| N/A |
|
5.15% Notes, Series CN 4 |
| November 2013 |
| November 2043 |
| $ | 995.00 |
| 5.18 | % | $ | 400 million |
| $ | 400 million |
| 50 5 |
| May 26, 2043 |
|
![]()
notes to consolidated financial statements
|
|
|
|
|
|
|
|
|
| Principal face amount |
| Redemption present |
| ||||||||||
Series 1 |
| Issued |
| Maturity |
| Issue |
| Effective |
| Originally |
| Outstanding at |
| Basis |
| Cessation |
| ||||||
3.20% Notes, Series CO 4 |
| April 2014 |
| April 2021 |
| $ | 997.39 |
| 3.24 | % | $ | 500 million |
| $ | 500 million |
| 30 5 |
| Mar. 5, 2021 |
| |||
4.85% Notes, Series CP 4 |
| Multiple 6 |
| April 2044 |
| $ | 987.91 | 6 | 4.93 | %6 | $ | 500 million | 6 | $ | 900 million | 6 | 46 5 |
| Oct. 5, 2043 |
| |||
3.75% Notes, Series CQ 4 |
| September 2014 |
| January 2025 |
| $ | 997.75 |
| 3.78 | % | $ | 800 million |
| $ | 800 million |
| 38.5 5 |
| Oct. 17, 2024 |
| |||
4.75% Notes, Series CR 4 |
| September 2014 |
| January 2045 |
| $ | 992.91 |
| 4.80 | % | $ | 400 million |
| $ | 400 million |
| 51.5 5 |
| July 17, 2044 |
| |||
1.50% Notes, Series CS 4 |
| March 2015 |
| March 2018 |
| $ | 999.62 |
| 1.51 | % | $ | 250 million |
| $ | 250 million |
| N/A 7 |
| N/A |
| |||
2.35% Notes, Series CT 4 |
| March 2015 |
| March 2022 |
| $ | 997.31 |
| 2.39 | % | $ | 1.0 billion |
| $ | 1.0 billion |
| 35.5 5 |
| Feb. 28, 2022 |
| |||
4.40% Notes, Series CU 4 |
| March 2015 |
| January 2046 |
| $ | 999.72 |
| 4.40 | % | $ | 500 million |
| $ | 500 million |
| 60.5 5 |
| July 29, 2045 |
| |||
3.75% Notes, Series CV 4 |
| December 2015 |
| March 2026 |
| $ | 992.14 |
| 3.84 | % | $ | 600 million |
| $ | 600 million |
| 53.5 5 |
| Dec. 10, 2025 |
| |||
2.80% U.S. Dollar Notes 4, 8 |
| September 2016 |
| February 2027 |
| U.S.$ | 991.89 |
| 2.89 | % | U.S.$ | 600 million |
| U.S.$ | 600 million |
| 20 9 |
| Nov. 16, 2026 |
| |||
(1) Interest is payable semi-annually.
(2) The effective interest rate is that which the notes would yield to an initial debt holder if held to maturity.
(3) The notes are redeemable at our option, in whole at any time, or in part from time to time, on not fewer than 30 and not more than 60 days’ prior notice. The redemption price is equal to the greater of (i) the present value of the notes discounted at the Government of Canada yield plus the redemption present value spread, or (ii) 100% of the principal amount thereof. In addition, accrued and unpaid interest, if any, will be paid to the date fixed for redemption.
(4) This series of notes requires us to make an offer to repurchase the notes at a price equal to 101% of their principal amount plus accrued and unpaid interest to the date of repurchase upon the occurrence of a change in control triggering event, as defined in the supplemental trust indenture.
(5) At any time prior to the respective maturity dates set out in the table, the notes are redeemable at our option, in whole at any time, or in part from time to time, on not fewer than 30 and not more than 60 days’ prior notice. The redemption price is equal to the greater of (i) the present value of the notes discounted at the Government of Canada yield plus the redemption present value spread calculated over the period to maturity, other than in the case of the Series CT and Series CU notes, where it is calculated over the period to the redemption present value spread cessation date, or (ii) 100% of the principal amount thereof. In addition, accrued and unpaid interest, if any, will be paid to the date fixed for redemption. On or after the respective redemption present value spread cessation dates set out in the table, the notes are redeemable at our option, in whole but not in part, on not fewer than 30 and not more than 60 days’ prior notice, at redemption prices equal to 100% of the principal amount thereof.
(6) $500 million of 4.85% Notes, Series CP were issued in April 2014 at an issue price of $998.74 and an effective interest rate of 4.86%. This series of notes was reopened in December 2015 and a further $400 million of notes were issued at an issue price of $974.38 and an effective interest rate of 5.02%.
(7) The notes are not redeemable at our option, other than in the event of certain changes in tax laws.
(8) We have entered into a foreign exchange derivative (a cross currency interest rate exchange agreement) which effectively converted the principal payments and interest obligations to Canadian dollar obligations with a fixed interest rate of 2.95% and an issued and outstanding amount of $792 million (reflecting a fixed exchange rate of $1.3205).
(9) At any time prior to the maturity date set out in the table, the notes are redeemable at our option, in whole at any time, or in part from time to time, on not fewer than 30 and not more than 60 days’ prior notice. The redemption price is equal to the greater of (i) the present value of the notes discounted at the U.S. Adjusted Treasury Rate plus the redemption present value spread calculated over the period to the redemption present value spread cessation date, or (ii) 100% of the principal amount thereof. In addition, accrued and unpaid interest, if any, will be paid to the date fixed for redemption. On or after the redemption present value spread cessation date set out in the table, the notes are redeemable at our option, in whole but not in part, on not fewer than 30 and not more than 60 days’ prior notice, at a redemption price equal to 100% of the principal amount thereof.
(c) TELUS Corporation commercial paper
TELUS Corporation has an unsecured commercial paper program, which is backstopped by our $2.25 billion syndicated credit facility (see (d)) and is to be used for general corporate purposes, including capital expenditures and investments. This program enables us to issue commercial paper, subject to conditions related to debt ratings, up to a maximum aggregate amount at any one time of $1.4 billion (2015 — $1.4 billion). Foreign currency forward contracts are used to manage currency risk arising from issuing commercial paper denominated in U.S. dollars. Commercial paper debt is due within one year and is classified as a current portion of long-term debt, as the amounts are fully supported, and we expect that they will continue to be supported, by the revolving credit facility, which has no repayment requirements within the next year. As at December 31, 2016, we had $613 million of commercial paper outstanding, all of which was denominated in U.S. dollars (U.S.$456 million), with an effective weighted average interest rate of 1.21%, maturing through March 2017.
(d) TELUS Corporation credit facility
As at December 31, 2016, TELUS Corporation had an unsecured revolving $2.25 billion bank credit facility, expiring on May 31, 2021, with a syndicate of financial institutions, which is to be used for general corporate purposes, including the backstopping of commercial paper.
TELUS Corporation’s credit facility bears interest at prime rate, U.S. Dollar Base Rate, a bankers’ acceptance rate or London interbank offered rate (LIBOR) (all such terms as used or defined in the credit facility), plus applicable margins. The credit facility contains customary representations, warranties and covenants, including two financial quarter-end financial ratio tests. These tests are that our net debt to operating cash flow ratio must not exceed 4.00:1.00 and our operating cash flow to interest expense ratio must not be less than 2.00:1.00, each as defined under the credit facility.
Continued access to TELUS Corporation’s credit facility is not contingent on TELUS Corporation maintaining a specific credit rating.
![]()
notes to consolidated financial statements
As at December 31 (millions) |
| 2016 |
| 2015 |
| ||
Net available |
| $ | 1,637 |
| $ | 1,994 |
|
Backstop of commercial paper |
| 613 |
| 256 |
| ||
Gross available |
| $ | 2,250 |
| $ | 2,250 |
|
We had $210 million of letters of credit outstanding as at December 31, 2016 (2015 — $202 million), issued under various uncommitted facilities; such letter of credit facilities are in addition to the ability to provide letters of credit pursuant to our committed bank credit facility.
(e) TELUS Communications Inc. debentures
The Series 3 and 5 Debentures were issued by a predecessor corporation of TELUS Communications Inc., BC TEL, under a Trust Indenture dated May 31, 1990. The Series B Debentures were issued by a predecessor corporation of TELUS Communications Inc., AGT Limited, under a Trust Indenture dated August 24, 1994, and a supplemental trust indenture dated September 22, 1995.
|
|
|
|
|
|
|
| Principal face amount |
| Redemption present |
| |||||
Series 1 |
| Issued |
| Maturity |
| Issue |
| Originally |
| Outstanding at |
| Basis points |
| |||
10.65% Debentures, Series 3 |
| June 1991 |
| June 2021 |
| $ | 998.00 |
| $ | 175 million |
| $ | 175 million |
| N/A (non-redeemable) |
|
9.65% Debentures, Series 5 2 |
| April 1992 |
| April 2022 |
| $ | 972.00 |
| $ | 150 million |
| $ | 249 million |
| N/A (non-redeemable) |
|
8.80% Debentures, Series B |
| September 1995 |
| September 2025 |
| $ | 995.10 |
| $ | 200 million |
| $ | 200 million |
| 15 3 |
|
(1) Interest is payable semi-annually.
(2) Series 4 debentures were exchangeable, at the holder’s option, effective on April 8 of any year during the four-year period from 1996 to 1999 for Series 5 debentures; $99 million of Series 4 debentures were exchanged for Series 5 debentures.
(3) At any time prior to the maturity date set out in the table, the debentures are redeemable at our option, in whole at any time, or in part from time to time, on not less than 30 days’ prior notice. The redemption price is equal to the greater of (i) the present value of the debentures discounted at the Government of Canada yield plus the redemption present value spread, or (ii) 100% of the principal amount thereof. In addition, accrued and unpaid interest, if any, will be paid to the date fixed for redemption.
The debentures became obligations of TELUS Communications Inc. pursuant to an amalgamation on January 1, 2001, are not secured by any mortgage, pledge or other charge and are governed by certain covenants, including a negative pledge and a limitation on issues of additional debt, subject to a debt to capitalization ratio and an interest coverage test. Effective June 12, 2009, TELUS Corporation guaranteed the payment of the debentures’ principal and interest.
(f) TELUS International (Cda) Inc. credit facility
As at December 31, 2016, TELUS International (Cda) Inc. had a U.S.$330 million bank credit facility, secured by its assets, expiring on May 31, 2021, with a syndicate of financial institutions. The credit facility is comprised of a U.S.$115 million revolving component and a U.S.$215 million term loan component. The credit facility is non-recourse to TELUS Corporation. As at December 31, 2016, $340 million ($332 million net of unamortized issue costs) was outstanding, all of which was denominated in U.S. dollars (U.S.$253 million), with a weighted average interest rate of 2.49%.
TELUS International (Cda) Inc.’s credit facility bears interest at prime rate, U.S. Dollar Base Rate, a bankers’ acceptance rate or London interbank offered rate (LIBOR) (all such terms as used or defined in the credit facility), plus applicable margins. The credit facility contains customary representations, warranties and covenants, including two financial quarter-end financial ratio tests. These tests are that TELUS International (Cda) Inc.’s net debt to operating cash flow ratio must not exceed 3.75:1.00 through June 30, 2017, and 3.25:1.00 subsequently, and its operating cash flow to debt service (interest and scheduled principal repayment) ratio must not be less than 1.50:1.00, all as defined in the credit facility.
The term loan is subject to an amortization schedule which requires that 5% of the principal advanced be repaid each year of the term of the agreement, with the balance due at maturity.
![]()
notes to consolidated financial statements
(g) Long-term debt maturities
Anticipated requirements to meet long-term debt repayments, calculated upon such long-term debts owing as at December 31, 2016, for each of the next five fiscal years are as follows:
|
|
|
| U.S. dollars |
|
|
| ||||||||||||
Long-term debt denominated in |
| Cdn. dollars |
|
|
| Derivative liability |
|
|
|
|
| ||||||||
Years ending December 31 (millions) |
| Debt |
| Debt |
| (Receive) 1 |
| Pay |
| Total |
| Total |
| ||||||
2017 |
| $ | 700 |
| $ | 627 |
| $ | (623 | ) | $ | 622 |
| $ | 626 |
| $ | 1,326 |
|
2018 |
| 250 |
| 14 |
| — |
| — |
| 14 |
| 264 |
| ||||||
2019 |
| 1,000 |
| 14 |
| — |
| — |
| 14 |
| 1,014 |
| ||||||
2020 |
| 1,000 |
| 14 |
| — |
| — |
| 14 |
| 1,014 |
| ||||||
2021 |
| 1,075 |
| 283 |
| — |
| — |
| 283 |
| 1,358 |
| ||||||
Thereafter |
| 7,249 |
| 806 |
| (806 | ) | 792 |
| 792 |
| 8,041 |
| ||||||
Future cash outflows in respect of long-term debt principal repayments |
| 11,274 |
| 1,758 |
| (1,429 | ) | 1,414 |
| 1,743 |
| 13,017 |
| ||||||
Future cash outflows in respect of associated interest and like carrying costs 2 |
| 5,518 |
| 272 |
| (227 | ) | 233 |
| 278 |
| 5,796 |
| ||||||
Undiscounted contractual maturities (Note 4(c)) |
| $ | 16,792 |
| $ | 2,030 |
| $ | (1,656 | ) | $ | 1,647 |
| $ | 2,021 |
| $ | 18,813 |
|
(1) Where applicable, principal-related cash flows reflect foreign exchange rates at December 31, 2016.
(2) Future cash outflows in respect of associated interest and like carrying costs for commercial paper and amounts drawn under our credit facilities (if any) have been calculated based upon the rates in effect at December 31, 2016.
27 other long-term liabilities
As at December 31 (millions) |
| Note |
| 2016 |
| 2015 |
| ||
Pension and other post-retirement liabilities |
| 14(a) |
| $ | 480 |
| $ | 451 |
|
Other |
|
|
| 170 |
| 150 |
| ||
Restricted stock unit and deferred share unit liabilities |
|
|
| 62 |
| 57 |
| ||
|
|
|
| 712 |
| 658 |
| ||
Deferred customer activation and connection fees |
|
|
| 24 |
| 30 |
| ||
|
|
|
| $ | 736 |
| $ | 688 |
|
28 Common Share capital
(a) General
Our authorized share capital is as follows:
As at December 31 |
| 2016 |
| 2015 |
|
First Preferred Shares |
| 1 billion |
| 1 billion |
|
Second Preferred Shares |
| 1 billion |
| 1 billion |
|
Common Shares |
| 2 billion |
| 2 billion |
|
Only holders of Common Shares may vote at our general meetings, with each holder of Common Shares entitled to one vote per Common Share held at all such meetings so long as not less than 66-2/3% of the issued and outstanding Common Shares are owned by Canadians. With respect to priority in payment of dividends and in the distribution of assets in the event of our liquidation, dissolution or winding-up, whether voluntary or involuntary, or any other distribution of our assets among our shareholders for the purpose of winding up our affairs, preferences are as follows: First Preferred Shares; Second Preferred Shares; and finally Common Shares.
As at December 31, 2016, approximately 48 million Common Shares were reserved for issuance, from Treasury, under a share option plan (see Note 13(d)).
(b) Purchase of Common Shares for cancellation pursuant to normal course issuer bid
As referred to in Note 3, we may purchase a portion of our Common Shares for cancellation pursuant to normal course issuer bids in order to maintain or adjust our capital structure. During the years ended December 31, 2016 and 2015, we purchased a number of our Common Shares for cancellation, through the facilities of the Toronto Stock Exchange, the New York Stock Exchange and/or alternative trading platforms or otherwise as may be permitted by applicable securities laws and regulations, including privately negotiated block purchases, as set out in the following table.
![]()
notes to consolidated financial statements
|
| 2016 |
| 2015 |
| ||||||
Years ended December 31 (millions) |
| Common |
| Cost |
| Common |
| Cost |
| ||
Normal course issuer bid period: |
|
|
|
|
|
|
|
|
| ||
October 1, 2014 — September 30, 2015 (bid maximum reached on September 14, 2015) |
| — |
| $ | — |
| 9 |
| $ | 385 |
|
September 15, 2015 — September 14, 2016 |
| 3 |
| 130 |
| 7 |
| 250 |
| ||
September 30, 2016 — September 29, 2017 1 |
| 1 |
| 35 |
| — |
| — |
| ||
Total excluding employee benefit plan trust transactions |
| 4 |
| 165 |
| 16 |
| 635 |
| ||
Employee benefit plan trust transactions |
| — |
| 4 |
| — |
| — |
| ||
|
| 4 |
| $ | 169 |
| 16 |
| $ | 635 |
|
(1) On September 28, 2016, we announced that we had received approval for a normal course issuer bid to purchase and cancel up to 8 of our Common Shares (up to a maximum amount of $250) from September 30, 2016, to September 29, 2017; in lieu of purchasing and cancelling shares, an employee benefit plan trust could purchase up to 25% of the approved normal course issuer bid amount for distribution to non-executive employees pursuant to partial payment of the immediately vesting, transformative compensation expense (see Notes 7, 13(a) and 15(a)). Transactions with the employee benefit plan trust are presented in the Consolidated statements of changes in owners’ equity as treasury share transactions. Additionally, we have entered into an automatic share purchase plan with a broker for the purpose of permitting us to purchase our Common Shares under the normal course issuer bid at times when we would not be permitted to trade in our own Common Shares during internal blackout periods, including during regularly scheduled quarterly blackout periods. Such purchases are determined by the broker in its sole discretion based on parameters we have established. We record a liability and charge share capital and retained earnings for purchases that may occur during such blackout periods based upon the parameters of the normal course issuer bid as at the statement of financial position date.
The excess of the purchase price over the average stated value of Common Shares purchased for cancellation is charged to retained earnings. We cease to consider the Common Shares to be outstanding on the date of our purchase of the Common Shares, although the actual cancellation of the Common Shares by the transfer agent and registrar occurs on a timely basis on a date shortly thereafter.
29 contingent liabilities
(a) Claims and lawsuits
General
A number of claims and lawsuits (including class actions and intellectual property infringement claims) seeking damages and other relief are pending against us and, in some cases, numerous other wireless carriers and telecommunications service providers. As well, we have received notice of, or are aware of, certain possible claims (including intellectual property infringement claims) against us.
It is not currently possible for us to predict the outcome of such claims, possible claims and lawsuits due to various factors, including: the preliminary nature of some claims; uncertain damage theories and demands; an incomplete factual record; uncertainty concerning legal theories and procedures and their resolution by the courts, at both the trial and the appeal levels; and the unpredictable nature of opposing parties and their demands.
However, subject to the foregoing limitations, management is of the opinion, based upon legal assessments and information presently available, that it is unlikely that any liability, to the extent not provided for through insurance or otherwise, would have a material effect on our financial position and the results of our operations, including cash flows, with the exception of the items enumerated following.
Certified class actions
Certified class actions against us include the following:
System access fee class actions
In 2004 a class action was brought in Saskatchewan against a number of past and present wireless service providers, including us, which alleged breach of contract, misrepresentation, unjust enrichment and violation of competition, trade practices and consumer protection legislation across Canada in connection with the collection of system access fees. In September 2007, a national opt-in class was certified by the Saskatchewan Court of Queen’s Bench in relation to the unjust enrichment claim only; all appeals of this certification decision have now been exhausted. In February 2008, the Saskatchewan Court of Queen’s Bench granted an order amending the certification order so as to exclude from the class of plaintiffs any customer bound by an arbitration clause with us. All appeals of this decision have now been exhausted. In addition to the 2004 class action brought in Saskatchewan, fourteen additional class actions were brought against us and other wireless service providers in the period 2004 to date in connection with the collection of system access fees in nine provinces. One of those actions, filed in Alberta in 2013, was a nullity. A second action, filed in British Columbia in 2004, was dismissed against us in January 2013, with an appeal of that decision being dismissed in March 2015. During the year ended December 31, 2016, developments in the remaining twelve additional class actions occurred which will lead to their final resolution:
![]()
notes to consolidated financial statements
· Seven were discontinued pursuant to terms of settlement.
· The plaintiff was denied leave to appeal by the Supreme Court of Canada in relation to three additional class actions dismissed as an abuse of process by the Courts of Appeal of Alberta, Manitoba and Nova Scotia.
· The plaintiff was denied leave to appeal by the Supreme Court of Canada in relation to a British Columbia action in respect of which the Court of Appeal had denied certification, ending this matter.
· The plaintiff agreed to dismiss an Alberta action, and that dismissal has now been implemented.
As a result, none of the additional fourteen class actions has been certified and all have been dismissed, stayed or discontinued, or are in the process of being dismissed, stayed or discontinued.
Per minute billing class action
In 2008 a class action was brought in Ontario against us alleging breach of contract, breach of the Ontario Consumer Protection Act, breach of the Competition Act and unjust enrichment, in connection with our practice of “rounding up” wireless airtime to the nearest minute and charging for the full minute. The action sought certification of a national class. In November 2014, an Ontario class only was certified by the Ontario Superior Court of Justice in relation to the breach of contract, breach of Consumer Protection Act, and unjust enrichment claims; all appeals of the certification decision have now been exhausted. At the same time, the Ontario Superior Court of Justice declined to stay the claims of our business customers notwithstanding an arbitration clause in our customer service agreements with those customers. This latter decision is under appeal; the appeal hearing was held in September 2016 and we are awaiting the Court’s decision.
Unilateral rate amendments class actions
In 2012 a class action was brought against us in Quebec alleging that we improperly unilaterally amended customer contracts to increase various wireless rates for optional services, contrary to the Quebec Consumer Protection Act and the Civil Code of Quebec. On June 13, 2013, the Superior Court of Quebec authorized this matter as a class action. This class action follows on a non-material 2008 class action brought in Quebec alleging that we improperly unilaterally amended customer contracts to charge for incoming SMS messages. On April 8, 2014, judgment was granted in part against TELUS in the 2008 class action. We had appealed that judgment, but have now settled both the 2008 and 2012 class actions. This settlement received court approval in June 2016, is being implemented and has been fully accounted for in our financial statements.
Call set-up time class actions
In 2005 a class action was brought against us in British Columbia alleging that we have engaged in deceptive trade practices in charging for incoming calls from the moment the caller connects to the network, and not from the moment the incoming call is connected to the recipient. In 2011, the Supreme Court of Canada upheld a stay of all of the causes of action advanced by the plaintiff in this class action, with one exception, based on the arbitration clause that was included in TELUS’ customer service agreements. The sole exception was the cause of action based on deceptive or unconscionable practices under the British Columbia Business Practices and Consumer Protection Act, which the Supreme Court of Canada declined to stay. In January 2016, the British Columbia Supreme Court certified this class action in relation to the claim under the Business Practices and Consumer Protection Act. The class is limited to residents of British Columbia who contracted wireless services with TELUS in the period from January 21, 1999, to April 2010. We have appealed the certification decision and the appeal hearing is expected to occur in May 2017. A companion class action was brought against us in Alberta at the same time as the British Columbia class action. The Alberta class action duplicates the allegations in the British Columbia action, but has not proceeded to date and is not certified.
Uncertified class actions
Uncertified class actions against us include:
9-1-1 class actions
In 2008 a class action was brought in Saskatchewan against us and other Canadian telecommunications carriers alleging that, among other matters, we failed to provide proper notice of 9-1-1 charges to the public, have been deceitfully passing them off as government charges, and have charged 9-1-1 fees to customers who reside in areas where 9-1-1 service is not available. The plaintiffs advance causes of action in breach of contract, misrepresentation and false advertising and seek certification of a national class. A virtually identical class action was filed in Alberta at
![]()
notes to consolidated financial statements
the same time, but the Alberta Court of Queen’s Bench declared that class action expired against us as of 2009. No steps were taken in this proceeding in 2016.
Electromagnetic field radiation class actions
In 2013 a class action was brought in British Columbia against us, other telecommunications carriers, and cellular telephone manufacturers alleging that prolonged usage of cellular telephones causes adverse health effects. The British Columbia class action alleges: strict liability; negligence; failure to warn; breach of warranty; breach of competition, consumer protection and trade practices legislation; negligent misrepresentation, breach of a duty not to market the products in question; and waiver of tort. Certification of a national class is sought, but the action has not proceeded to date and no steps were taken in 2016. In 2015 a class action was brought in Quebec against us, other telecommunications carriers, and various other defendants alleging that electromagnetic field radiation causes adverse health effects, contravenes the Quebec Environmental Quality Act, creates a nuisance, and constitutes an abuse of right pursuant to the Quebec Civil Code. This action has not yet proceeded to an authorization hearing.
Public Mobile class actions
In 2014 class actions were brought against us in Quebec and Ontario on behalf of Public Mobile’s customers, alleging that changes to the technology, services and rate plans made by us contravene our statutory and common law obligations. In particular, the Quebec action alleges that our actions constitute a breach of the Quebec Consumer Protection Act, the Quebec Civil Code, and the Ontario Consumer Protection Act. It has not yet proceeded to an authorization hearing. The Ontario class action alleges negligence, breach of express and implied warranty, breach of the Competition Act, unjust enrichment, and waiver of tort. No steps have been taken in this proceeding since it was filed and served.
Promotional pricing class action
In 2016 a class action was brought in Quebec against us, other telecommunications carriers, and various other defendants alleging that we violated the Quebec Consumer Protection Act by enticing Quebec consumer customers to contract with us by providing them goods or services at a reduced price, or free as a trial, for a fixed period and, at the end of the fixed period, charging them the regular price if they did not take steps to either renegotiate or cancel their contract with us. This action has not yet proceeded to an authorization hearing.
Handset subsidy class action
In 2016 a class action was brought in Quebec against us and other telecommunications carriers alleging that we breached the Quebec Consumer Protection Act and the Civil Code of Quebec by making false or misleading representations relating to the handset subsidy provided to our wireless customers, and by charging our wireless customers inflated rate plan prices and termination fees higher than those permitted under the Act. This action has not yet proceeded to an authorization hearing.
Intellectual property infringement claims
Claims and possible claims received by us include:
Optik TV patent infringement claim
A patent infringement claim was filed in Ontario in 2014 alleging that TELUS’ IPTV products, including its Optik TV product that utilizes the MediaRoom platform and its previous TELUS TV product that utilized the Minerva platform, infringe two third-party patents. In late 2016, the plaintiff agreed to abandon its claims relating to the TELUS TV product and relating to one of the two patents that it had asserted. This matter is scheduled to proceed to trial on liability issues only in April 2017.
4G LTE network patent infringement claim
A patent infringement claim was filed in Ontario in 2016 alleging that communications between devices, including cellular telephones, and base stations on TELUS’ 4G LTE network infringe three third-party patents. No trial date has yet been set for this matter.
Summary
We believe that we have good defences to the above matters. Should the ultimate resolution of these matters differ from management’s assessments and assumptions, a material adjustment to our financial position and the results of our operations, including cash flows, could result. Management’s assessments and assumptions include that reliable estimates of any such exposure cannot be made considering the continued uncertainty about: the nature of the damages
![]()
notes to consolidated financial statements
that may be sought by the plaintiffs; the causes of action that are being, or may ultimately be, pursued; and, in the case of the uncertified class actions, the causes of action that may ultimately be certified.
(b) Indemnification obligations
In the normal course of operations, we provide indemnification in conjunction with certain transactions. The terms of these indemnification obligations range in duration. These indemnifications would require us to compensate the indemnified parties for costs incurred as a result of failure to comply with contractual obligations, or litigation claims or statutory sanctions, or damages that may be suffered by an indemnified party. In some cases, there is no maximum limit on these indemnification obligations. The overall maximum amount of an indemnification obligation will depend on future events and conditions and therefore cannot be reasonably estimated. Where appropriate, an indemnification obligation is recorded as a liability. Other than obligations recorded as liabilities at the time of such transactions, historically we have not made significant payments under these indemnifications.
See Note 21(d) for details regarding our guarantees to the real estate joint ventures.
As at December 31, 2016, we had no liability recorded in respect of our indemnification obligations.
(c) Concentration of labour
In 2015, we commenced collective bargaining with the Telecommunications Workers Union, United Steel Workers Local Union 1944, to renew the collective agreement that expired on December 31, 2015; the expired contract covered approximately 40% of our Canadian workforce as at December 31, 2015.
On October 3, 2016, the Telecommunications Workers Union, United Steel Workers Local Union 1944 and ourselves announced that the two parties had reached a tentative five-year collective agreement which would be subject to ratification by members of the Telecommunications Workers Union, United Steel Workers Local Union 1944. On November 23, 2016, the Telecommunications Workers Union, United Steel Workers Local Union 1944 announced that its members had voted to accept the October 3, 2016, tentative agreement. The terms and conditions of the new collective agreement are effective from November 27, 2016, to December 31, 2021, and cover approximately 37% of our Canadian workforce as at December 31, 2016.
In December 2016, a new collective agreement between the Syndicat des agents de maîtrise de TELUS and ourselves was ratified by a majority of its members. This collective agreement will take effect on April 1, 2017, and will expire on March 31, 2022. A new collective agreement between the Syndicat québécois des employés de TELUS and ourselves was also ratified in December 2016. The new agreement is effective from January 1, 2018 to December 31, 2022. The current Syndicat québécois des employés de TELUS collective agreement will remain in effect until it expires on December 31, 2017.
30 related party transactions
(a) Transactions with key management personnel
Our key management personnel have authority and responsibility for overseeing, planning, directing and controlling our activities and consist of our Board of Directors and our Executive Leadership Team.
Total compensation expense for key management personnel, and the composition thereof, is as follows:
Years ended December 31 (millions) |
| 2016 |
| 2015 |
| ||
Short-term benefits |
| $ | 12 |
| $ | 13 |
|
Post-employment pension 1 and other benefits |
| 7 |
| 14 |
| ||
Termination benefits |
| — |
| 8 |
| ||
Share-based compensation 2 |
| 35 |
| 30 |
| ||
|
| $ | 54 |
| $ | 65 |
|
(1) Our Executive Leadership Team members are either: members of our Pension Plan for Management and Professional Employees of TELUS Corporation and non-registered, non-contributory supplementary defined benefit pension plans; or members of one of our defined contribution pension plans.
(2) For the year ended December 31, 2016, share-based compensation expense is net of $2 (2015 — $1) of the effects of derivatives used to manage share-based compensation costs (Note 13(b)). For the year ended December 31, 2016, $4 (2015 — $(6)) is included in share-based compensation expense representing restricted stock unit and deferred share unit expense arising from changes in the fair market value of the corresponding Common Shares, which is not affected by derivatives used to manage share-based compensation costs. For the year ended December 31, 2016, share-based compensation expense of $4 (2015 — $7) was included in restructuring costs (Note 15).
As disclosed in Note 13, we made initial awards of share-based compensation in 2016 and 2015, including, as set out in the following table, to our key management personnel. As most of these awards are cliff-vesting or graded-vesting and have multi-year requisite service periods, the expense will be recognized ratably over a period of years and thus only a portion of the 2016 and 2015 awards are included in the amounts in the table above.
![]()
notes to consolidated financial statements
|
| 2016 |
| 2015 |
| ||||||||||||
Years ended December 31 |
| Number of |
| Notional |
| Grant-date |
| Number of |
| Notional value 1 |
| Grant-date |
| ||||
Awarded in period |
| 585,759 |
| $ | 23 |
| $ | 15 |
| 595,674 |
| $ | 26 |
| $ | 30 |
|
(1) Notional value is determined by multiplying the Common Share price at the time of award by the number of units awarded. The grant-date fair value differs from the notional value because the fair values of some awards have been determined using a Monte Carlo simulation (see Note 13(b)).
During the year ended December 31, 2016, key management personnel (including retirees) exercised 169,522 share options (2015 — 98,702 share options) that had an intrinsic value of $4 million (2015 — $2 million) at the time of exercise, reflecting a weighted average price at the date of exercise of $42.47 (2015 — $42.04).
The liability amounts accrued for share-based compensation awards to key management personnel are as follows:
As at December 31 (millions) |
| 2016 |
| 2015 |
| ||
Restricted stock units |
| $ | 25 |
| $ | 21 |
|
Deferred share units 1 |
| 32 |
| 29 |
| ||
|
| $ | 57 |
| $ | 50 |
|
(1) Our Directors’ Deferred Share Unit Plan provides that, in addition to his or her annual equity grant of deferred share units, a director may elect to receive his or her annual retainer and meeting fees in deferred share units, Common Shares or cash. Deferred share units entitle directors to a specified number of, or a cash payment based on the value of, our Common Shares. Deferred share units are paid out when a director ceases to be a director, for any reason, at a time elected by the director in accordance with the Directors’ Deferred Share Unit Plan; during the year ended December 31, 2016, $4 (2015 — $3) was paid out.
Employment agreements with members of the Executive Leadership Team typically provide for severance payments if an executive’s employment is terminated without cause: generally 18—24 months of base salary, benefits and accrual of pension service in lieu of notice and 50% of base salary in lieu of an annual cash bonus. In the event of a change in control, Executive Leadership Team members are not entitled to treatment any different than that given to our other employees with respect to non-vested share-based compensation.
(b) Transactions with defined benefit pension plans
During the year ended December 31, 2016, we provided management and administrative services to our defined benefit pension plans; the charges for these services were on a cost recovery basis and amounted to $6 million (2015 — $7 million).
(c) Transactions with real estate joint ventures
During the years ended December 31, 2016 and 2015, we had transactions with the real estate joint ventures, which are related parties, as set out in Note 21.
31 additional statement of cash flow information
(a) Statements of cash flows — operating activities and investing activities
Years ended December 31 (millions) |
| Note |
| 2016 |
| 2015 |
| ||
Net change in non-cash operating working capital |
|
|
|
|
|
|
| ||
Accounts receivable |
|
|
| $ | (45 | ) | $ | 55 |
|
Inventories |
|
|
| 42 |
| (40 | ) | ||
Prepaid expenses |
|
|
| (20 | ) | (22 | ) | ||
Accounts payable and accrued liabilities |
|
|
| 126 |
| (60 | ) | ||
Income and other taxes receivable and payable, net |
|
|
| (128 | ) | 202 |
| ||
Advance billings and customer deposits |
|
|
| (28 | ) | 7 |
| ||
Provisions |
|
|
| (18 | ) | 72 |
| ||
|
|
|
| $ | (71 | ) | $ | 214 |
|
![]()
notes to consolidated financial statements
Years ended December 31 (millions) |
| Note |
| 2016 |
| 2015 |
| ||
Cash payments for capital assets, excluding spectrum licences |
|
|
|
|
|
|
| ||
Capital asset additions, excluding spectrum licences |
|
|
|
|
|
|
| ||
Gross capital expenditures |
|
|
|
|
|
|
| ||
Property, plant and equipment |
| 17 |
| $ | (2,358 | ) | $ | (2,046 | ) |
Intangible assets |
| 18 |
| (629 | ) | (531 | ) | ||
|
|
|
| (2,987 | ) | (2,577 | ) | ||
Additions arising from non-monetary transactions |
|
|
| 19 |
| — |
| ||
Capital expenditures |
|
|
| (2,968 | ) | (2,577 | ) | ||
Asset retirement obligations netted (included) in additions |
|
|
| 40 |
| (65 | ) | ||
|
|
|
| (2,928 | ) | (2,642 | ) | ||
Other non-cash items included above |
|
|
|
|
|
|
| ||
Change in associated non-cash investing working capital |
|
|
| 231 |
| 60 |
| ||
Non-cash change in asset retirement obligation |
|
|
| (55 | ) | 60 |
| ||
|
|
|
| 176 |
| 120 |
| ||
|
|
|
| $ | (2,752 | ) | $ | (2,522 | ) |
![]()
notes to consolidated financial statements
(b) Changes in liabilities arising from financing activities
|
|
|
| Year ended December 31, 2015 |
|
|
| Year ended December 31, 2016 |
|
|
| |||||||||||||||||||||||
|
|
|
| Statement of cash flows |
| Non-cash changes |
|
|
| Statement of cash flows |
| Non-cash changes |
|
|
| |||||||||||||||||||
(millions) |
| As at |
| Issued or |
| Redemptions, |
| Foreign |
| Other |
| As at |
| Issued or |
| Redemptions, |
| Foreign |
| Other |
| As at |
| |||||||||||
Dividends paid to holders of Common Shares |
| $ | 244 |
| $ | — |
| $ | (992 | ) | $ | — |
| $ | 1,011 |
| $ | 263 |
| $ | — |
| $ | (1,070 | ) | $ | — |
| $ | 1,091 |
| $ | 284 |
|
Purchase of Common Shares for cancellation 1 |
| $ | 3 |
| $ | — |
| $ | (628 | ) | $ | — |
| $ | 635 |
| $ | 10 |
| $ | — |
| $ | (179 | ) | $ | — |
| $ | 169 |
| $ | — |
|
Short-term borrowings |
| $ | 100 |
| $ | 401 |
| $ | (401 | ) | $ | — |
| $ | — |
| $ | 100 |
| $ | 3 |
| $ | (3 | ) | $ | — |
| $ | — |
| $ | 100 |
|
Long-term debt |
|
|
|
|
|
|
|
|
|
|
|
|
|
|
|
|
|
|
|
|
|
|
| |||||||||||
TELUS Corporation notes |
| $ | 8,437 |
| $ | 2,732 |
| $ | — |
| $ | — |
| $ | (5 | ) | $ | 11,164 |
| $ | 785 |
| $ | (600 | ) | $ | 19 |
| $ | (1 | ) | $ | 11,367 |
|
TELUS Corporation commercial paper |
| 130 |
| 5,461 |
| (5,396 | ) | 61 |
| — |
| 256 |
| 4,568 |
| (4,181 | ) | (30 | ) | — |
| 613 |
| |||||||||||
TELUS Corporation credit facility |
| — |
| 780 |
| (780 | ) | — |
| — |
| — |
| — |
| — |
| — |
| — |
| — |
| |||||||||||
TELUS Communications Inc. debentures |
| 743 |
| — |
| (125 | ) | — |
| — |
| 618 |
| — |
| — |
| — |
| 1 |
| 619 |
| |||||||||||
TELUS International (Cda) Inc. credit facility |
| — |
| — |
| — |
| — |
| — |
| — |
| 373 |
| (42 | ) | 9 |
| (8 | ) | 332 |
| |||||||||||
Derivatives used to manage currency risks arising from U.S. dollar-denominated long-term debt — liability (asset) |
| — |
| 4,229 |
| (4,182 | ) | (61 | ) | — |
| (14 | ) | 4,181 |
| (4,201 | ) | 11 |
| 43 |
| 20 |
| |||||||||||
|
| 9,310 |
| 13,202 |
| (10,483 | ) | — |
| (5 | ) | 12,024 |
| 9,907 |
| (9,024 | ) | 9 |
| 35 |
| 12,951 |
| |||||||||||
To eliminate effect of gross settlement of derivatives used to manage currency risks arising from U.S. dollar-denominated long-term debt |
| — |
| (4,229 | ) | 4,229 |
| — |
| — |
| — |
| (4,181 | ) | 4,181 |
| — |
| — |
| — |
| |||||||||||
|
| $ | 9,310 |
| $ | 8,973 |
| $ | (6,254 | ) | $ | — |
| $ | (5 | ) | $ | 12,024 |
| $ | 5,726 |
| $ | (4,843 | ) | $ | 9 |
| $ | 35 |
| $ | 12,951 |
|
Issue of shares by subsidiary to non-controlling interest |
|
|
|
|
|
|
|
|
|
|
|
|
|
|
|
|
|
|
|
|
|
|
| |||||||||||
Gross proceeds on share issuance |
|
|
|
|
|
|
|
|
|
|
|
|
| $ | 302 |
| $ | — |
| $ | — |
| $ | (302 | ) | $ | — |
| ||||||
Transaction costs |
|
|
|
|
|
|
|
|
|
|
|
|
| — |
| (8 | ) | — |
| 12 |
| 4 |
| |||||||||||
Income taxes charged directly to contributed surplus 2 |
|
|
|
|
|
|
|
|
|
|
|
|
| — |
| — |
| — |
| 47 |
| 47 |
| |||||||||||
|
|
|
|
|
|
|
|
|
|
|
|
|
| 302 |
| (8 | ) | — |
| (243 | ) | 51 |
| |||||||||||
To eliminate effect of gross settlement of transaction costs |
|
|
|
|
|
|
|
|
|
|
|
|
| (8 | ) | 8 |
| — |
| — |
| — |
| |||||||||||
|
|
|
|
|
|
|
|
|
|
|
|
|
| $ | 294 |
| $ | — |
| $ | — |
| $ | (243 | ) | $ | 51 |
| ||||||
(1) Normal course issuer bid transactions including employee benefit plan trust transactions (see Note 28(b)).
(2) Income taxes charged directly to contributed surplus were comprised of a current income tax charge of $50 and a deferred income tax recovery of $3.
![]()