


We are delivering exceptional experiences and providing our customers with a wide range of innovative products and services powered by leading technologies to keep them connected to what matters most.
Mobile services Keeping our customers happy We are meeting our customers’ growing mobile needs with the increasing speeds, capacity and coverage of our award-winning 4G LTE wireless network and our leading device lineup. Over the past several years, we have introduced hundreds of customer-centric programs and services to improve our customers’ experiences and continue to earn their business, wherever they go. With our customers first focus, TELUS has consistently led the Canadian industry in wireless loyalty and network performance, and has one of the best wireless churn rates in the world.
Future friendly home services Offering innovative broadband solutions TELUS offers a wide range of telecommunications, connectivity and entertainment services to consumers in British Columbia, Alberta and Eastern Quebec. Our multi-year, multi-billion-dollar investment has expanded our gigabit-capable TELUS PureFibreTM network directly to a majority of homes across these provinces. With TELUS PureFibre, customers can reliably connect to the digital technologies that matter most to them, such as streaming video, smart home services and security solutions. |
| Business solutions Helping businesses succeed We offer a full suite of data solutions for businesses and governments, providing a mix of traditional and cloud technologies, fibre network connectivity, and collaboration, security, managed IT and advisory services to accelerate our clients’ digital transformation. Businesses are transforming their operations with our mobile, Network as a Service and Internet of Things solutions to increase their productivity and efficiency.
Healthcare technology solutions Improving the delivery of healthcare At TELUS Health, we are working with healthcare providers and patients to improve information-sharing and harness the power of technology to improve healthcare for Canadians. Our digital innovations are helping patients get a better care experience while easing the burden on the healthcare system. We provide digital health solutions for physicians, pharmacies, extended healthcare providers, patients, insurers and health authorities. We also offer employee health and wellness services.
Business process and IT solutions Extending our caring culture around the globe TELUS International is a contact centre and customer experience innovator that designs, builds and delivers next-gen digital solutions. Our services cover digital transformation, IT life cycle, advisory and digital consulting, risk management and back-office support, and are delivered by more than 32,000 team members in over 40 languages at locations across North and Central America, Asia, and Europe. |
TELUS IN 2018

Q1
· Earned the top spot in four major wireless network awards for quality, speed and/or reliability · Passed the halfway point in our program to expand our TELUS PureFibre network directly to homes and businesses across our footprint · Launched the TELUS Baby Health app to help parents keep track of their baby’s health information.
|
| Q2
· Became the first TV provider in Canada to launch 4K HDR TV content · Expanded Mobility for Good™ to Quebec and Ontario, providing smartphones and data plans to youth aging out of foster care · Held our 13th annual TELUS Days of Giving® with more than 36,000 people volunteering around the world.
|
|
|
|
Q3
· Introduced TELUS SmartHome Security and TELUS Secure Business solutions in B.C., Alberta and Saskatchewan · Launched the TELUS Friendly Future Foundation™ to provide youth better access to health and educational opportunities · Expanded Health for Good™ to Victoria, delivering healthcare to vulnerable citizens.
|
| Q4
· Introduced our fastest-ever Internet service options boasting download speeds of 1 GB and 750 Mbps · Received the fewest customer complaints of any national provider in the annual Commission for Complaints for Telecom-television Services report · Engaged close to 1.7 million people in our #EndBullying campaign to take our TELUS Wise® Digital Pledge in 2018.
|


2018 PERFORMANCE AT A GLANCE
DELIVERING SOLID RESULTS
OPERATIONS |
|
|
|
|
+7.2% | +4.9% | +1.9% | +6.6% | |
|
|
|
| |
Operating | Adjusted | Basic EPS | Dividends declared | |
|
|
|
| |
|
|
|
|
|
FINANCIAL RESOURCES |
|
|
|
|
+24% | -$180 | +6.5% | -0.13 | |
|
|
|
| |
Free cash flow1 | Capital expenditures
| Total | Net debt to | |
|
|
| ||
|
|
|
|
|
CUSTOMER CONNECTIONS3 |
|
|
|
|
+17% | +42% | +80% | 33% | |
|
|
|
| |
Wireless subscriber | Internet subscriber | TV subscriber | Residential network | |
|
|
|
|
OPERATING REVENUES ($ billions)
|
|
ADJUSTED EBITDA1 ($ billions)
|
|
|
|
DIVIDENDS DECLARED PER SHARE ($)
|
|
TOTAL CUSTOMER CONNECTIONS3 (millions)
|


2018 FINANCIAL AND OPERATING HIGHLIGHTS Applying IFRS 9 and IFRS 15 ($ in millions except per share amounts) 2018 2017 % change OPERATIONS Operating revenues $ 14,368 $ 13,408 7.2 Earnings before interest, taxes, depreciation and amortization (EBITDA)1 $ 5,104 $ 4,910 3.9 EBITDA margin (%) 35.5 36.6 n/m EBITDA – excluding restructuring and other costs1 $ 5,421 $ 5,027 7.8 Adjusted EBITDA1 $ 5,250 $ 5,005 4.9 Operating income $ 2,837 $ 2,741 3.5 Net income attributable to common shares $ 1,600 $ 1,559 2.6 Basic earnings per share (EPS) $ 2.68 $ 2.63 1.9 Adjusted basic EPS1 $ 2.85 $ 2.77 2.9 Dividends declared per share $ 2.10 $ 1.97 6.6 Dividend payout ratio (%)1 78 80 n/m WIRELESS SEGMENT External revenue $ 8,135 $ 7,671 6.0 Adjusted EBITDA1 $ 3,461 $ 3,286 5.3 Adjusted EBITDA margin1 (%) 42.7 42.7 n/m WIRELINE SEGMENT External revenue $ 6,233 $ 5,737 8.6 Adjusted EBITDA1 $ 1,789 $ 1,719 4.1 Adjusted EBITDA margin1 (%) 28.2 28.9 n/m FINANCIAL POSITION Total assets $ 33,065 $ 31,053 6.5 Net debt1 $ 13,770 $ 13,422 2.6 Return on common equity (%)4 16.4 17.1 n/m LIQUIDITY AND CAPITAL RESOURCES Cash from operations $ 4,058 $ 3,947 2.8 Capital expenditures (excluding spectrum licences) $ 2,914 $ 3,094 (5.8) Free cash flow (before dividends)1 $ 1,197 $ 966 23.9 Net debt to EBITDA ratio1,2 2.54 2.67 n/m CUSTOMER CONNECTIONS3 (in thousands at December 31) Wireless subscribers 9,235 8,911 3.6 Internet subscribers 1,858 1,743 6.6 Residential network access lines (NALs) 1,248 1,298 (3.9) Total TV subscribers 1,093 1,098 (0.5) Total customer connections 13,434 13,050 2.9 n/m – not meaningful 1 These are non-GAAP measures and do not have standardized meanings under IFRS-IASB. Therefore, they are unlikely to be comparable to similar measures presented by other companies. For more information, see Sections 1.3, 5.4, 5.5 and 11 of Management’s discussion and analysis (MD&A) in this report. 2 Excludes restructuring and other costs. 3 Customer connections have been revised in 2017 and 2018 to account for acquisitions and adjustments. For details, see Section 1.3 of the MD&A in this report. 4 Net income attributed to equity shares for a 12-month trailing period, divided by the average common equity for the 12-month period. TELUS 2018 ANNUAL REPORT • 5


2018 scorecard
At TELUS, we believe in setting annual financial targets to provide clarity for investors and help drive our performance. As the following scorecard shows, in 2018, we achieved three of our four consolidated targets. Our revenue achievement reflected an increase in wireless network revenue resulting from growth in our wireless subscriber base, as well as growth in wireline data service revenue. Adjusted EBITDA growth reflected higher wireless equipment margins and an increase in wireless network revenue, in addition to higher Internet and TELUS Health margins and an increased contribution from TELUS International. Basic earnings per share (EPS) growth was driven by higher operating income |
| and lower income taxes, partly offset by increased financing and depreciation and amortization costs. Capital expenditures exceeded our target as we continued to focus on investments in broadband infrastructure, including connecting more homes and businesses directly to our fibre-optic network. Notably, by consistently achieving our financial targets, we have supported the return of capital to shareholders through our shareholder-friendly initiatives, including our multi-year dividend growth program. For further information, see Section 1.4 of Management’s discussion and analysis (MD&A) in this report. |
| 2018 targets1 | 2018 results | 2018 growth | Achieved | ||
Revenues |
| Growth of | $14.37 billion |
| 7.2% |
|
Adjusted EBITDA2 |
| Growth of | $5.25 billion |
| 4.9% |
|
Basic EPS |
| Growth of up to | $2.68 |
| 1.9% |
|
Capital expenditures | Approximately | $2.91 billion |
| – |
| |
1 Reflects the 2018 targets that were announced with our first quarter 2018 results news release on May 10, 2018 to account for the adoption of IFRS 15 on January 1, 2018. For more information, see Section 1.4 of the MD&A in this report.
2 Adjusted EBITDA is a non-GAAP measure and does not have a standardized meaning under IFRS-IASB. Therefore, it is unlikely to be comparable to similar measures presented by other companies. See Section 11 of the MD&A in this report.

2019 targets
We are guided by a number of long-term financial objectives, policies and guidelines, which are detailed in Section 4.3 of the MD&A. With these policies in mind, our consolidated financial targets for 2019 reflect continued growth in data services across wireless and wireline, supported by our strategic investments in advanced broadband technologies and our leading network, a team member culture of delivering customer service excellence, and our ongoing focus on operational effectiveness. TELUS’ 2019 financial targets are supportive of the Company’s multi-year dividend growth program first announced in May 2011, under which TELUS has since delivered 16 dividend increases.
In 2019, TELUS plans to continue generating positive subscriber growth in its key growth segments, including wireless, high-speed Internet and TELUS TV. Increasing customer demand for reliable access and fast data services is expected to support continued customer growth. TELUS International and TELUS Health are also expected to contribute to TELUS’ growth profile.
For more information and a complete set of 2019 financial targets and the assumptions on which they are based, see our fourth quarter 2018 results and 2019 targets news release issued February 14, 2019.
| 2019 targets | |
Revenues1 |
| Growth of 3 to 5% |
Adjusted EBITDA2,3 |
| Growth of 8 to 10% |
Adjusted EBITDA2 (excluding the effects of IFRS 16) |
| Growth of 4 to 6% |
Basic EPS |
| Growth of 2 to 10% |
Capital expenditures (excluding spectrum licences) | Approximately $2.85 billion | |
1 The 2019 revenue growth target is calculated using operating revenues, excluding non-recurring equity income of $171 million arising from the sale of TELUS Garden in 2018.
2 Adjusted EBITDA is a non-GAAP measure and does not have a standardized meaning under IFRS-IASB. Therefore, it is unlikely to be comparable to similar measures presented by other companies. See Section 11 of the MD&A in this report.
3 The 2019 Adjusted EBITDA growth target reflects the non-cash impacting application of IFRS 16, Leases in 2019.
Caution regarding forward-looking statements summary
This annual report contains forward-looking statements including statements relating to our 2019 targets, expected performance and multi-year dividend growth program. By their nature, forward-looking statements do not refer to historical facts and require the Company to make assumptions and predictions, and are subject to inherent risks. There is significant risk that the forward-looking statements will not prove to be accurate and there can be no assurance that TELUS will achieve its targets or performance goals or maintain its multi-year dividend growth program. Readers are cautioned not to place undue reliance on forward-looking statements as a number of factors (such as regulatory developments and government decisions, the competitive environment, technological substitution, economic performance in Canada, our cost reduction initiatives, our earnings and free cash flow, and our capital expenditures) could cause actual future performance and events to differ materially from those expressed in the forward-looking statements. Accordingly, this document is subject to the disclaimer and qualified by the assumptions (including assumptions on which our 2019 annual targets and guidance are based and regarding semi-annual dividend increases through 2019), qualifications and risk factors as set out in Management’s discussion and analysis in this report, especially Sections 9 and 10, and in other TELUS public disclosure documents and filings with securities commissions in Canada (on SEDAR at sedar.com) and in the United States (on EDGAR at sec.gov). Except as required by law, TELUS disclaims any intention or obligation to update or revise forward-looking statements, and reserves the right to change, at any time at its sole discretion, its current practice of updating annual targets and guidance. Statements regarding our 2019 targets are presented for the purpose of assisting our investors and others in understanding certain key elements of our expected 2019 financial results as well as our objectives, strategic priorities and business outlook. Such information may not be appropriate for other purposes.

Leading the world in creating a friendlier future
Inspired by our passionate social purpose, the TELUS team is helping to improve the social, economic and health outcomes of Canadians and simultaneously driving value for our shareholders. As we work to change the paradigm on health, education, the environment and social inequities, we are creating a friendlier future – one where technology breaks down barriers, keeps us safe and empowers us all to achieve our full potential.
Investing to bridge digital divides, both geographic and socio-economic
We know that technology is a great equalizer, but only if we all have access to it equally. Unequal access to technology is exacerbating the unacceptable social barriers facing Canadians: 40 per cent of low-income families lack consistent Internet access, putting kids at risk of falling behind in school; 350,000 young people are in government care, often experiencing an isolating transition to adulthood, unable to participate in our digital world; and 35,000 Canadians are homeless on any given night, many disconnected from the basic right in Canada to healthcare.
Our TELUS team has stepped up to address these pressing social issues, making unprecedented investments in technology to bridge geographic and socio-economic divides and support more vibrant and sustainable communities. Indeed, since 2000 your Company has invested $175 billion to connect Canadians to the people, resources and information that make their lives better. Moreover, TELUS has an enviable track record of rolling out new technology and infrastructure to the breadth of our Canadian population, enabling a symmetrical urban and rural experience, ensuring all citizens have access to the digital tools to drive improved health, social and economic outcomes in their communities.
Empowering underserved Canadians through our Connecting for Good programs
These investments are helping to remedy many of the critical inequities facing Canadians through solutions like TELUS’ portfolio of Connecting for Good initiatives. Our life-changing programs provide TELUS-subsidized access to the technologies that underpin the success of so many Canadians at risk of being left behind in our increasingly digital society.
Notably, TELUS Internet for Good offers 50,000 low-income families access to low-cost, high-speed Internet service and a computer, free online music education programming from The Royal Conservatory, as well as digital literacy training and TELUS Wise support to help them participate safely in our

Darren Entwistle volunteered alongside 800 dedicated members of our TELUS family for our annual TELUS Days of Giving in Sofia, Bulgaria, where they planted 12,000 trees in the newly minted TELUS International Forest, reversing the destruction caused by severe insect damage in this previously lush environment.
digital world. These resources will connect underserved families to their community and to the tools that characterize today’s learning experience. Internet for Good will provide children with opportunities such as learning a new language online, taking virtual journeys to see the Wonders of the World or learning how to play an instrument – all from the comfort of their home. We will not rest until we reach every single one of the 40 per cent of families in Canada who are lacking this fundamental resource and until all children have the same access to digital resources, social connections and educational information as their classmates.
Through TELUS Mobility for Good, today, we are offering 10,000 young people aging out of foster care a free smartphone and data plan for two years. This program is empowering vulnerable youth with a vital lifeline to the tools needed to stay in touch with social workers offering support; to contact prospective employers, post-secondary institutions and healthcare providers; to access educational mobile apps and websites; and to remain connected with friends through their social networks. We will not rest until every one of the 350,000 young people currently in government care is able to begin their independent life feeling safer, more confident and connected, and better prepared for their future.
Lastly, TELUS Health for Good is removing many of the barriers Canadians living on the streets face in receiving medical care and re-connecting thousands of patients to
the public healthcare system. TELUS mobile health clinics provide essential primary medical care, including electronic health records, to these marginalized Canadians, generating 11,500 patient visits since the program’s inception in 2014. We will not rest until all 35,000 of these at-risk Canadians have access to the health and social care they need and deserve, including vital support for mental health. I am positive that the “universal” in healthcare is supposed to mean all of our citizens, not just those of us lucky enough to have an address.
Fostering the responsible use of technology in our digital world
Whilst connecting to technology is an essential part of our daily lives, resolving inequities through programs like Connecting for Good can only be considered successful if that technology is also being used responsibly. Unfortunately, this is not always the case. At TELUS, we understand the power of technology and all the good it can help us achieve. We also understand that technology has the potential to enable negative and cruel behaviour, such as cyberbullying and the subsequent anguish it can cause our families. Heartbreakingly, more than one million kids are cyberbullied each month, sometimes with tragic repercussions. This statistic represents an unacceptable and devastating reality that demands action.
Indeed, we are holding ourselves responsible for helping address this major social issue. By way of our TELUS Wise program, we are encouraging young Canadians to become digital citizens, whilst simultaneously protecting our youth online. Through TELUS Wise, we have engaged with more than seven million Canadians, providing the tools and knowledge to stay safe online. Moreover, as part of our mission to #EndBullying, in 2018, we motivated 1.7 million Canadians to take our TELUS Wise digital pledge and join us in rising above cyberbullying. Together, with the support of Canadians from coast to coast, we will not consider our efforts successful until every young person can safely engage online and the nefarious practice of cyberbullying has been eradicated for good.
Investing in technology innovation to answer our world’s most pressing social challenges
Investing in leading-edge technology is imperative to prevent the next pandemic, preserve our planet and deliver on the promise of a thriving digital economy. In this regard, your Company’s technology innovation is addressing one of the most pressing social issues of our lifetime: healthcare effectiveness and efficiency. Indeed, with as much as half of all provincial budgets being invested into healthcare, Canada’s spending is one of the highest in the world and growing due to our aging population and the prevalence of chronic diseases.
Helping healthcare professionals deliver better health outcomes
At TELUS, we believe that by building a primary healthcare ecosystem that places the patient at the centre, we can deliver better health outcomes for our fellow Canadians, for less money spent. Importantly, using technology, we can also shift the focus from the remediation of disease to the prevention of illness. In this regard, our technology innovations are enabling better access to vital healthcare information leveraging our broadband wireless and fibre networks that are the best in the world in respect of speed, coverage and quality. By way of example, we are the leading provider of the electronic medical records that are helping physicians and pharmacists provide better care across the healthcare continuum, through secure access to patient files that detail medical history and ensure continuity of care.
As the leading social capitalism company, we are using our technology to resolve critical economic inequities facing Canadians and to address our most pressing social challenges. |
TELUS is also focusing our innovation on improving the flow of information in the primary healthcare sector. Our ePrescribe technology is evolving our health system away from handwritten prescriptions and reducing the associated errors and sad outcomes they can entail. The digitization of prescription fulfilment not only leads to improved medication adherence but will also help to track medication misuse, which is critical in the battle against opioid addiction. In this regard, complementing the efforts of our Health for Good mobile health clinics, we are bringing critical insight into the opioid crisis plaguing our communities by means of a TELUS Health Original documentary, Painkiller: Inside the Opioid Crisis. This enlightening video, which has already been viewed 200,000 times, strives to raise awareness about this heartbreaking social tragedy and, ultimately, save lives through education. This documentary is available through our unique TELUS Healthy Living Network, which provides customers with hundreds of curated health-themed programs through TELUS Optik on Demand.
Supporting employee wellness in a burdened healthcare system
TELUS is driving employer-based support of health and wellness as a major thrust in answering the national healthcare burden. Employers can play a significant role in optimizing the health of their teams, leading to reduced absenteeism and elevated employee engagement that will, in turn, drive any organization’s success. Through our Medisys-on-Demand virtual care service, as well as our investment in BEACON, a digital mental health
support service, we are helping employers support the physical and mental well-being of their employees and their families by way of a digital platform that provides personalized care from a health professional.
Enabling better health outcomes through better health information
Your Company is committed to providing all Canadians with the tools, information and support to enable them to live healthier and happier lives. Across Canada, there are five million people who do not have a family physician and many struggle to find urgent care after hours. In an effort to address healthcare accessibility challenges, our Babylon by TELUS Health service empowers Canadians with immediate and reliable medical knowledge and support. Our smartphone application offers an expansive symptom checker powered by an extensively researched artificial intelligence engine, as well as a one-on-one virtual consultation feature, allowing patients to speak directly with a doctor within a couple of hours from the comfort of their homes or on the move. In addition, the TELUS LivingWell Companion service supports elderly Canadians in sustaining their independence by providing a constant connection to loved ones. In the case of an accident or a fall, customers simply push a button to activate a two-way conversation, or an automatic fall detection feature will be initiated.
TELUS’ technology will continue transforming healthcare in ways that were unimaginable only a few years ago. Your Company is enabling a future where access to healthcare will be personal, precise, predictive, preventative and amazingly universal. Indeed, with new capabilities to capture and analyze data, healthcare will be transformed through a detailed understanding of how outcomes are influenced by genetics, environment, diet, lifestyle and medication on an individual basis. We are working toward a digital future in which healthcare professionals can readily leverage artificial intelligence alongside the insights provided through genomics, bio-analysis and imaging in order to deliver optimized preventative wellness protocols as well as disease treatments for each patient on a customized basis.
Moving health information to the point of care quickly and securely
We know that delivering information digitally across the healthcare continuum can only be effective if the networks carrying the information are reliable, fast, secure and expansive. In 2018, TELUS earned global recognition in network excellence from OpenSignal, J.D. Power, PCMag, Tutela and the consumer-initiated Ookla Speedtest. These leading rankings, each received consecutively for two years or more, reinforce the superiority of our network, whether assessed
on speed and availability or customer experience. Thanks to our award-winning network, supported by the expertise of our talented Canadian engineers and technologists, we have the infrastructure and thought leadership to deliver on our promise of connected healthcare for all Canadians.
Smart technologies helping us care for the planet our children will inherit
We are equally focused on the health of our planet. Our investments are building a more sustainable world for our future generations. By way of example, despite our country’s dispersed population and vast and rugged geography, broadband networks, ubiquitously deployed, are bridging time and distance, allowing us to live and work in the areas of our choosing without compromising productivity. Indeed, in a world of powerful wireless and fibre technology, you do not have to live in Vancouver, with its associated cost of living, to work in Vancouver.
TELUS’ innovative Work Styles program is one way we are allowing people to work where and when it is most convenient and productive. Through this program, we have decreased our environmental footprint by eliminating 18,500 tonnes of carbon dioxide emissions and reducing 2.9 million hours of commuting time in 2018 alone – time that can be spent on more precious endeavours, like engaging with loved ones. Importantly, we are able to recognize our high-performing team members by endorsing their participation in our Work Styles program, thereby driving enhanced team member engagement. We are further reducing our carbon footprint by using super high-definition video-conferencing technology that mimics a face-to-face meeting, which has contributed to more than $40 million in team member travel savings since 2007, whilst increasing team collaboration across the country. Reflecting our commitment to creating workplaces built to the highest leadership in energy and environmental design (LEED) standards, our team members and operations occupy one of the largest LEED platinum footprints in all of North America.
Finding digital solutions to help feed a hungry world
As part of our efforts to promote sustainability and wellness, we are expanding our reach in the emerging agriculture technology sector. By leveraging technology innovation and artificial intelligence, we will help farmers and ranchers produce food for the world’s ever-expanding population more efficiently, safely and in a more environmentally friendly manner. Our efforts to optimize food production are contributing to a better yield of food supply to meet the ever-growing requirements of our planet and our fellow citizens. In addition, through our technology, we will help to answer the challenge of food traceability to ensure retailers and
consumers can trust the health and responsible production of their food, from the farm or ranch all the way to the fork. Importantly, we are striving to provide innovative solutions to advance the agriculture sector on a worldwide basis, whilst positioning Canada as a preferred global supplier of safe, sustainable food.
Enabling our digital economy to drive Canada’s competitiveness and create skilled jobs
Your Company is also leveraging our investments in technology innovation to advance economic diversity and empowering our nation to drive the kind of sustainable innovation that elevates the competitiveness of our private sector. By offering the infrastructure necessary to promote innovation across the country, we are able to attract new industries and innovators, supporting the jobs of today and those that have yet to be imagined. The advantage our networks provide Canadians cannot be overstated. We cannot have a vibrant private sector without powerful, world-leading technology and robust infrastructure that is widely deployed. Indeed, by connecting Canadians to the opportunities that underpin our success, we are supporting growth and skilled job creation for Canada. Moreover, through our best-in-class networks, we are providing start-ups and home-based businesses with access to the same Internet speeds, functionality, reliability and security that large enterprises currently enjoy.
Powering the success of Canadian businesses
Our broadband network investments, coupled with next-generation services for businesses, such as unified communications, cloud computing and network security, are enabling Canadian organizations of all sizes to increase their productivity and enhance their contributions to our nation. We are partnering with businesses to enable their digital transformations and thereby strengthen the engagement and effectiveness of their teams, enhance the experiences they offer to their customers, increase the efficiency of their supply chain and sales channels, better leverage data insights and ultimately, increase revenue whilst rationalizing costs.
We are leveraging our technology, in concert with our social innovation, to ensure every Canadian is connected safely, reliably and responsibly. |
By leveraging technology innovation, including machine-to-machine communications and artificial intelligence, we are helping our business clients be more efficient and productive
in terms of risk management. For example, we are enabling organizations across Canada to support the safety of their field workers and long-haul drivers, secure the transmission of sensitive financial data and access vital healthcare information at the point of care. In this vein, we take to heart the undeniable fact that our networks, platforms, devices and applications enable the successful operation of every sector of our economy and thereby fuel job creation, as well as our country’s competitiveness.
Setting Canada up for success by leading the way in 5G and fibre
Throughout 2018, we continued to evolve our wireless network toward the 5G ecosystem that is foundational to democratizing access to the transformative technology of today and tomorrow. Moreover, your Company increased its active fibre connections by 34 per cent last year, well exceeding the Organization for Economic Co-operation and Development average, and connected our 100th fibre community along the way. Our near-ubiquitous wireless network, together with the fibre backbone that underpins it, will cost-effectively support the transformative 5G technology that will drive innovation whilst fuelling economic growth for generations to come. Indeed, in concert with the emerging artificial intelligence economy, this new ecosystem will power our smart homes, vehicles, businesses and intelligent cities, as well as the applications, devices and services that improve educational outcomes, support environmental sustainability, enable our entrepreneurial spirit and unleash human productivity.
Even in a digital world, the most important connection is the human connection
Perhaps most meaningfully, our social purpose is animated by a deeply human side – the TELUS team. Our unparalleled and collective commitment to being a leader in social capitalism has earned us recognition as the most philanthropic company on a global basis. It has also helped to drive world-leading engagement across our team, placing your Company within the top one per cent of employers globally, when compared against companies of similar size and composition.
Putting our communities and customers first inspires team member engagement
Our highly engaged, high-performing team is inspired by a sense of purpose borne from our commitment to doing good in our communities. This passion for putting our communities first motivates us to also put our customers first and earn their trust and loyalty. There is truly a synergistic relationship between what we do in business in terms of driving positive
outcomes for our customers relative to the competition, and what we do socially to drive positive outcomes for our communities to ensure they are healthier, more sustainable and more vibrant. This, in turn, fuels heightened business performance and value for our shareholders, ultimately enabling us to reinvest in our communities.
Reflecting the diversity of the communities and customers we serve Embedded within the globally admired culture we have built together is our belief that diversity creates a whole that is so much stronger than the sum of its parts. We are a team that fosters inclusion; recognizes and celebrates every team member’s unique talents, voice and abilities; and encourages our team members to always bring their whole selves to work. Our diverse and inclusive work environment facilitates a broader and more creative exchange of ideas, promotes better talent acquisition and retention, and sparks innovation. These critical attributes foster elasticity of thought, skills, knowledge and perspectives, which help us to better understand and support the needs of our diverse communities and customer base. Much of our Company’s progress with respect to diversity and inclusiveness is driven by our team members themselves. Notably, 7,100 team members volunteer in five groups that celebrate diversity and inclusiveness in Canada and in the global communities where we operate. Our groups provide support, mentorship and camaraderie for team members and their families: Abilities supports colleagues living with varied abilities; Connections links women professionals at TELUS; Eagles provides support for Aboriginal team members; Mosaic welcomes newcomers to Canada; and Spectrum connects LGBTQ team members around the globe. Our team’s commitment to inclusion extends to our TELUS Board of Directors, and by the end of 2019, we will exceed the objectives we set for ourselves regarding Board diversity, with 50 per cent of our independent directors reflecting our overall diversity objective and 42 per cent being women.
The most giving company in the world Our award-winning culture of caring underpins our passion for giving. The spirited volunteerism of our 85,000 team members and retirees worldwide reinforces TELUS’ position as the most giving company in the world. Indeed, thanks to the extraordinary generosity of our TELUS family, since 2000, we have contributed $1.2 billion, through $682 million in financial support and 1.3 million days of volunteerism, to create stronger, healthier communities. Throughout 2018, the TELUS team continued to give with our hearts and our hands, including the 36,000 volunteers who participated in our hallmark TELUS Days of Giving events |
| across the country. These dedicated members of our TELUS family supported their communities through nearly 2,000 initiatives in the year, including sorting 68,000 pounds of food at food banks, filling 13,500 backpacks with school supplies for children in need and serving 27,000 healthy meals to feed the hungry. Through our TELUS Days of Giving, we are inspiring hope and improving the circumstances of tens of thousands of our fellow citizens.
Caring for our youth, today and tomorrow This passionate commitment to giving is further epitomized by our TELUS Community Boards. Our 18 Boards worldwide exemplify an innovative approach to charitable giving – one that puts decision-making in the hands of local leaders who know their communities best to ensure our resources are accessible to local grassroots organizations and yielding the desired social outcome. From the launch of our first TELUS Community Board in Edmonton in 2005, to building a much-needed school for children and their families living on the outskirts of a landfill in Guatemala City with our TELUS International team, this concept has transformed into a critical funding model focused on improving social and health outcomes for youth around the world, whether it be in education, the performing arts, science, technology, social entrepreneurship or environmental conservation. Since that first life-changing discussion in 2005, our amazing TELUS Community Boards have contributed $72 million to 7,000 grassroots programs, helping two million youth each year.
Engendering social responsibility and volunteerism within our youth Building on the incredible work being done by our Community Boards, our TELUS family is also helping to enable the success of our young people in a challenging world. Through our technology innovation, we are connecting youth to the enormous educational, social and philanthropic opportunities surfaced by our digital society. Moreover, by embracing critical partnerships like those with WE Charity, we are providing our future leaders with the tools and inspiration to engage as agents of change. Indeed, as the national sponsor of WE Day since 2007, we have introduced millions of young people to the importance of volunteerism and the desire to generate lasting social change.
Assuring a friendly future in perpetuity As the capstone of the good we have done in our communities over the past two decades, your Company created the TELUS Friendly Future Foundation following the sale of TELUS Garden, our corporate home in Vancouver. Enabled through an unprecedented $120 million gift from TELUS – the largest |
donation made by a publicly traded Canadian company in history and one of the largest ever in North America – the Foundation exemplifies our connection to both our communities and our customers and will build on the meaningful work being done by our TELUS Community Boards. Indeed, by reinvesting the profit from the monetization of TELUS Garden into creating a sustainable funding model to support our crucial social endeavours in perpetuity, our team is demonstrating that social capitalism is very much at the heart of our social and economic purpose. This seminal event in the history of corporate giving is a reflection of our enduring commitment to fuse technology, social innovation and human compassion to provide a friendlier future for vulnerable young Canadians.
Leadership in social purpose is symbiotic with our leadership in business To us, doing well in business and doing good in our communities are mutually inclusive. Our leadership in social capitalism is reflective of our world-leading results in respect of team engagement, customer outcomes, financial results and shareholder value creation.
Delivering best-in-class results Once again, in 2018, your Company achieved industry-leading customer growth, with 474,000 total net client additions across our wireless and wireline businesses, establishing a leadership margin of 111,000, or more than 30 per cent, as compared to our closest national peer. In addition, we realized industry-leading customer loyalty, inclusive of achieving the best combined retention levels on record across all of postpaid wireless, high-speed Internet and best-in-class Optik TV. Moreover, 2018 marked the fifth consecutive year in which TELUS achieved postpaid wireless churn below one per cent – a globally leading accomplishment. Indeed, our unsurpassed customer loyalty is the product of a highly engaged team, motivated by a social purpose that reflects our dual focus on putting our communities and our customers first. When customers choose to do business with TELUS, they understand it is reciprocated by the positive social outcomes we support in their communities. Your Company also delivered a strong financial performance, as reflected in our healthy revenue and EBITDA expansion. Additionally, our free cash flow grew by 24 per cent in 2018, which led the Canadian industry. Our leading wireline revenue contributed to wireline EBITDA growth that led the industry for the second consecutive year. Notably, 2018 marked our sixth year of wireline EBITDA growth, a performance unrivalled among our global incumbent peers. |
| Delivering the best dividend growth program Thanks to our consistently strong and industry-leading operational and financial results, TELUS continues to return significant capital to our shareholders whilst maintaining a robust balance sheet and simultaneously making significant capital investments in advanced broadband technologies. In 2018, we announced two more dividend increases, in line with our current dividend growth program, which is targeting annual growth of between seven and 10 per cent through 2019. Since we established our first three-year dividend growth program in 2011, our cash dividend to shareholders has more than doubled. We have now returned $16 billion to shareholders since 2004, including $11 billion in dividends, representing over $27 per share. This is the most attractive, long-standing and consistent dividend growth program in the private sector.
Delivering world-leading shareholder returns Your Company continues to be the unparalleled leader in shareholder returns over the long term. Since the beginning of 2000 through the end of 2018, your Company has generated a total shareholder return of 429 per cent, more than 250 points higher than the return for the Toronto Stock Exchange’s S&P/TSX Composite Index of 173 per cent and dramatically overshadowing the MSCI World Telecom Services Index return of negative seven per cent over the same period. During the 15 multi-year time periods since 2000, for the years ending from 2004 until today, TELUS’ total shareholder return was number one in the world versus its incumbent peers 13 times, surpassing the second place finisher by an average of 48 percentage points over those periods. As of February 22, 2019, our total shareholder return since 2000 is 453 per cent, a substantial 111 per cent higher than our closest global peer and better than the TSX by 247 per cent. Our long-running global leadership in giving back, team member engagement, customer service excellence and total shareholder return is no coincidence, but rather, empirical proof of our social capitalism thesis and the inextricable link between the economic vibrancy of your Company and the welfare of the communities we serve. Importantly, these returns support the retirement and other savings of our more than 600,000 shareholders, as well as the millions who own TELUS shares in pension and mutual funds in Canada and around the world.
Honouring our tax obligations A reflection of your Company’s enduring belief in the profound connection between the success of our business and the welfare of our communities is our commitment to tax morality. Since 2000, we have contributed $39.1 billion in total tax remittances, including payroll taxes and spectrum renewal and purchase fees, to our federal, provincial and municipal governments. Last year |
alone, we supported our communities through tax remittances totalling $2.6 billion, inclusive of remitting $586 million in payroll income taxes on behalf of our middle-class Canadian team members. By paying our taxes transparently and fairly, TELUS is supporting economic, educational, cultural, environmental and health opportunities for our fellow citizens.
Building value in your Company’s brand Clearly, TELUS is establishing a leadership example in the holistic economics of what it means to conduct good business. In the same way that social capitalism is aligned with our strategy, technology investments and culture, it is also explicitly aligned with our brand and the promise it represents. Your Company remains an industry leader in brand resonance, having increased the value of the TELUS brand from a few hundred million dollars in 2000 to nearly $10 billion in 2018, as assessed by Brand Finance. Our brand value is a symbol of the trust Canadians have placed in your Company and the affinity they hold for an organization that shares their values – a company that delivers on their brand promise of a friendly future.
Advancing social capitalism in 2019 and beyond Inspired by our social and business leadership over the past two decades, we are approaching 2019 with our typical sense of purpose, as reflected in the financial, community giving and social impact targets we have set for the year. This includes underlying growth in revenue of up to five per cent, EBITDA of up to six per cent and earnings per share of up to 10 per cent. In addition, our 2019 outlook for free cash flow, before income taxes, dividends and spectrum payments, is robust, at up to 29 per cent growth. |
| Our 2019 goals for community giving and social impact include: inspiring 40,000 members of our TELUS family to volunteer for TELUS Days of Giving and contributing 1.1 million volunteer hours for the year – both increases of 10 per cent – as well as connecting a cumulative total of 60,000 vulnerable Canadians with our world-leading technology through our TELUS Internet for Good, TELUS Mobility for Good and TELUS Health for Good programs by year-end. Also, our total giving target is to contribute $50 million to charitable organizations, and to fundraise over $4 million for the TELUS Friendly Future Foundation. In addition, having surpassed our 2020 goals in energy and greenhouse gas reduction, in 2019 we will focus on making additional progress in achieving our 90 per cent waste diversion target by 2020, further reducing our environmental footprint. Our unwavering commitment to leveraging our technology to improve outcomes for our fellow citizens, combined with our track record of generating world-leading operating financial and shareholder results, defines TELUS as the leader in social capitalism – perhaps the only sustainable form of capitalism in our world today. By continuing to deliver exceptional experiences and value for our communities, customers, team members and shareholders, we will make the economic and social investments necessary to deliver on our promise of a friendly future for all.
Thank you for helping advance our social purpose.
Darren Entwistle Member of the TELUS team since 2000 February 22, 2019 |

2019 corporate priorities
|
|
|
Our corporate priorities help guide our actions as we execute on our national growth strategy. |
| |
|
| |
· Honouring our customers, communities and social purpose by our team delivering on our brand promise |
| |
· Leveraging our broadband networks to drive TELUS’ growth |
| |
· Fuelling our future through recurring efficiency gains |
| |
· Driving emerging opportunities to build scale in TELUS Health and TELUS International. |
|


Providing Canadians with world-class wireless solutions
The Canadian wireless industry experienced a third consecutive year of accelerating postpaid subscriber growth in 2018 with more than 1.6 million net additions. Demand was stimulated by the ongoing adoption of more capable smartphones and tablets, as well as data rate plan and handset promotions throughout the year by the numerous wireless brands available in each market. Carriers continued making significant capital investments to enhance their 4G LTE networks, deploying new spectrum to boost data speeds and building new cell sites to accommodate the rapid growth in data usage. Customer acquisition and retention costs remained elevated due to an ongoing market shift toward more expensive smartphones.
Maintaining our leadership position in a growing wireless market
We recorded a North American industry-leading average monthly postpaid churn rate of 0.89 per cent and robust postpaid subscriber growth, despite continued competitive dynamics, demonstrating the effectiveness of our sustained focus on putting customers first. We were also recognized for our significant network investments in 4G LTE and LTE advanced technologies, including the integration of small-cell technology, as we earned the top spot in all four major third-party network awards in 2018. Our persistent focus on delivering an exceptional customer experience helped us generate industry-leading average lifetime revenue per customer of $6,200. Our external wireless revenue grew 6.0 per cent and Adjusted EBITDA increased 5.3 per cent in 2018, reflecting 356,000 high-value postpaid net additions, modest growth in average monthly billing per subscriber unit and our ongoing initiatives focused on efficiency.
|
|
|
| Visit telus.com/learn and find out how to get the most from your device |
|
|
|
|
+17% | +$200 | 0.01% | +3.6% |
|
|
|
|
Wireless subscriber | Lifetime revenue | Postpaid | Total wireless |
net additions | per customer | churn rate | subscribers |
2018: 347,000 | 2018: $6,200 | 2018: 0.89% | 2018: 9.235 million |
2017: 296,000 | 2017: $6,000 | 2017: 0.90% | 2017: 8.911 million |
In 2018, we created positive outcomes by:
· Enhancing the customer experience by introducing innovative and flexible options, such as Platinum plans and the Bring-It-BackTM program, which enable customers to pay less upfront for the latest device
· Expanding and enhancing our 4G LTE coverage to additional markets to now cover approximately 36.9 million Canadians, offering even faster data speeds
· Achieving speeds up to 27 times faster than today’s LTE advanced standard in our 5G Living Lab in Vancouver, supporting a future of driverless cars and smart homes, businesses and cities, as well as healthcare applications, devices and services
· Making it easier for customers to interact with TELUS by empowering them to manage their services on the My TELUS app, which saw a 24 per cent increase in active users in 2018. We also expanded our online support – including TELUS Virtual Assistant and Koodo Assist – and engaged in more than two million active conversations with customers.
In 2019, we are connecting people to what matters most by:
· Elevating our customers’ experience, as measured by their likelihood to recommend our products and services
· Enhancing our network with the continued build-out of LTE advanced technology, deploying additional spectrum and integrating small-cell technology to improve coverage and capacity and prepare for our evolution to 5G
· Growing our postpaid subscriber base and driving profitable growth in smartphone and data services, while refreshing our prepaid offerings to target new segments
· Strengthening our market share in the national business sector by leveraging our integrated service offerings
· Evolving our Internet of Things (IoT) solutions to help consumers simplify their daily lives and to help businesses incorporate connected devices into their operations to enhance efficiency, productivity and profitability.
|
We offer
· Leading 4G LTE network covering 99 per cent of Canadians · The latest smartphones, tablets, mobile Internet devices, and smart home and IoT solutions · Lightning-fast wireless Internet access for video, social networking, messaging and mobile applications, including our Optik TV® app · International roaming to more than 225 destinations
|
|

|
2018 results – wireless |
| |
|
|
|
|
| +6.0% | +5.3% |
|
|
|
|
|
| Revenue (external) | Adjusted EBITDA |
|
| 2018: $8.14 billion | 2018: $3.46 billion |
|
| 2017: $7.67 billion | 2017: $3.29 billion |
|
|
|
|
|

Leading in a dynamic environment
The wireline communications market is in a period of rapid change as a result of technological evolution, changing customer habits and intense competition. In 2018, the industry showed modest revenue growth in enhanced Internet and cloud services, which was tempered by heightened competition and moderate business spending, as well as the continuing decline in higher-margin legacy voice services. Telecom companies made significant investments in fibre-optic network expansions to support their growing Internet, TV and business service offerings. Carriers continued to invest in their video delivery platforms to keep pace with the changing environment, and TV entertainment remained a key area of growth for telecom companies. Canadian regulators continued to encourage facilities-based competition, which balances continued investment with rigorous competition in telecom services.
Investing for growth
TELUS remains one of the few established telecoms in the world generating consistent growth in wireline revenue, EBITDA and customer connections. The ongoing expansion of our TELUS PureFibre network has put us at the forefront of delivering customers a superior Internet experience. In 2018, we enhanced our Future Friendly® Home service bundle with the addition of TELUS Home Security solutions, which further differentiates us in the market. We continue to target high-value business segments across the country with our comprehensive integrated wireless and wireline solutions, which can help our customers maximize their IT investments and achieve greater business agility. TELUS International added new customers and capabilities, in part through acquisitions, while TELUS Health continued to expand its reach to even more primary care providers. Our focus on these growing markets, as well as on efficiency and effectiveness, helped TELUS generate leading wireline customer and financial results.
+13% | +42% | +80% | +60,000 |
|
|
|
|
Data revenue | Internet subscriber | TV subscriber | Wireline customer |
2018: $4.59 billion | net additions | net additions | connections |
2017: $4.08 billion | 2018: 115,000 | 2018: 63,000 | 2018: 4.20 million |
| 2017: 81,000 | 2017: 35,000 | 2017: 4.14 million |
In 2018, we created positive outcomes by:
· Expanding and enhancing our gigabit-enabled fibre-optic network, TELUS PureFibre, which now reaches 1.89 million premises in B.C., Alberta and Eastern Quebec, or 61 per cent of our current broadband footprint
· Introducing our fastest-ever Internet service options boasting download speeds of 1 Gbps and 750 Mbps, respectively
· Launching Boost Wi-Fi, extending the reach of strong and reliable in-home Wi-Fi signals for our customers
· Enhancing our TV offerings with 4K HDR content on Optik TV and new online and mobile app versions of Pik TV®
· Introducing TELUS Secure Business, a suite of integrated smart automation, intrusion monitoring and video surveillance solutions to help small businesses run safely and smoothly
· Evolving TELUS International operations and IT consulting strategy with the acquisition of Xavient Information Systems
· Growing TELUS Health’s workplace wellness services with the acquisition of a leading provider of preventative healthcare services for employers across Canada.
In 2019, we are connecting people to what matters most by:
· Continuing to elevate the customer experience by putting our customers first, simplifying products and delivering exceptional service, while also enhancing operational efficiency
· Expanding the footprint, capabilities, speed and reliability of our TELUS PureFibre network
· Growing our TV and Internet subscriber bases and promoting additional innovative services, including home security and enhanced TV functionality
· Driving sales and efficiency for business customers through enhanced connectivity, tailored solutions, Internet of Things offerings and high-quality customer service
· Integrating recent TELUS International acquisitions and attracting new business with our exceptional customer experience solutions and our advanced IT consulting and delivery capabilities
· Increasing the reach and adoption of our innovative healthcare technology solutions to support greater collaboration and drive better patient outcomes.
We offer
· Comprehensive high-speed Internet access with a growing fibre-optic network · Differentiated TELUS Optik TV 4K and Pik TV service · Reliable home phone service · Home automation and security · Leading IP networks and applications for businesses · Hosting, managed IT, security and cloud-based services · Innovative healthcare technology solutions · Business process solutions
|
|

|
2018 results – wireline |
| |
|
|
| |
| +8.6% | +4.1% |
|
|
|
|
|
| Revenue (external) | Adjusted EBITDA |
|
| 2018: $6.23 billion | 2018: $1.79 billion |
|
| 2017: $5.74 billion | 2017: $1.72 billion |
|
|
|
|
|

We are committed to leveraging our world-leading technology to help those who need our support the most and to enable remarkable human outcomes in our all-connected world.
Giving back to our communities
The TELUS team is passionate about giving back and providing support in the communities where we live and work. Guided by our philosophy – we give where we live® – we are committed to driving positive social outcomes and helping to build stronger and healthier communities. In 2018, TELUS, our team members and retirees contributed $150 million to charitable and community organizations and volunteered one million hours.
Advancing our legacy of giving
In 2018, we launched the TELUS Friendly Future Foundation, an independent charitable organization founded to address the social and economic challenges facing Canada’s disadvantaged youth. Made possible with an unprecedented $120 million endowment from TELUS, the Foundation is helping vulnerable youth thrive in our digital society through better access to health and educational opportunities, enabled by technology.
The Foundation represents the next evolution of our philosophy to give where we live. It provides financial grants to small, grassroots charities across Canada that need help in directly supporting youth in our communities. It builds on the achievements of our 13 TELUS Community Boards across Canada and ensures TELUS’ commitment to giving will be sustained for decades.
Bringing healthcare to vulnerable citizens
We expanded our Health for Good program in 2018 to Vancouver, Victoria and Calgary to help reconnect marginalized citizens to our healthcare system by deploying specially equipped mobile health clinics in communities where front-line care is urgently needed. These clinics on wheels – equipped with TELUS Health electronic medical records technology and TELUS LTE Wi-Fi service – bring necessary medical care to homeless citizens and underserved communities.
52,000 | 1 million | $150 million | 30,000 |
|
|
|
|
citizens reached through | hours spent giving back | contributed to charitable | Canadians supported |
Since inception in Montreal in 2014, the program has supported approximately 11,500 patient interventions, with ongoing efforts being made to integrate these patients into the broader healthcare and social support systems. In September, we announced a $5 million commitment to expand our mobile clinics in additional communities across Canada in 2019.
Helping at-risk youth stay connected
After launching our Mobility for Good program in B.C. in 2017, we expanded the program in 2018 into Ontario and Alberta, and launched a pilot program in Quebec, in partnership with the Children’s Aid Foundation of Canada and the Fondation du Centre jeunesse. Mobility for Good provides youth transitioning out of foster care with fully subsidized smartphones and data plans, enabling them to stay connected to their support networks, social services, and educational and employment opportunities.
With the recent expansion, Mobility for Good can assist more than 10,000 youth who qualify for the program. Currently, about 1,200 youth participate in Mobility for Good, a number that is expected to grow in 2019 as we continue to expand the program into Manitoba and New Brunswick.
Supporting low-income families
We extended the reach of our Internet for GoodTM program to more low-income families in November by participating in the federal government’s national Connecting Families initiative. With the expansion, we now offer access to low-cost high-speed Internet,
training and tools for 50,000 low-income families in B.C., Alberta and Quebec. Approximately 16,500 citizens are currently participating in this program with TELUS.
Keeping Canadians safe online
As part of our long-term commitment to help youth realize their potential, we continue to invest in educational initiatives to promote friendly and responsible online behaviour. An important component of this is the work we do in support of our commitment to help #EndBullying and our TELUS Wise program.
TELUS Wise, now in its sixth year and endorsed by the Canadian Association of Chiefs of Police, is a free digital literacy educational program that provides workshops and materials related to digital safety and cyberbullying. Through this program, we are empowering youth and adults alike with tools and knowledge that can help them stay safe online and rise above cyberbullying. In 2018 alone, we reached more than 52,000 participants through our TELUS Wise workshops.
Building on our goal to make the digital world a safe space, in 2018, we asked Canadians to commit to being kind online by taking the TELUS Wise Digital Pledge. We were also able to share the call to #EndBullying through other opportunities, including our 11-year partnership with WE, an international charity and educational partner. For example, as the national co-title sponsor of WE Day events, we help inspire young leaders to drive social change and rise above to #EndBullying. Last year, 123,000 youth attended nine WE Day events across Canada.
Enabling better outcomes for underserved citizens
|
|
|
Through our Connecting for GoodTM programs – including Health for Good, Mobility for Good and Internet for Good – we are leveraging our technology to ensure disadvantaged citizens are connected to the people, information and opportunities that matter most to them in our all-connected world. For more information, visit telus.com/futurefriendly.
|
|


Throughout the year, we look for opportunities to make a positive impact and help build strong, healthy and sustainable communities. Here are some of the ways members of our Executive Leadership Team give back.
|
|
| ||
|
|
| ||
Josh Blair volunteering at the Pacific Assistance Dogs Society (PADS) in Burnaby, B.C. | Josh Blair Group President and Chief Corporate Officer, TELUS Location: Vancouver, British Columbia Joined TELUS: 1995 Executive: 2007 TELUS shareholdings: 329,487 |
| Doug French helping with yard improvement alongside his daughter, Samantha, at PADS in Burnaby, B.C. | Doug French Executive Vice-President (EVP) and Chief Financial Officer Location: Vancouver, British Columbia Joined TELUS: 2000 (Clearnet: 1996) Executive: 2016 TELUS shareholdings: 111,470 |


|
|
| ||
|
|
|
|
|
Tony Geheran serving meals at the 2018 TELUS Retiree Holiday Dinner in Burnaby, B.C. | Tony Geheran EVP and Chief Customer Officer Location: Vancouver, British Columbia Joined TELUS: 2001 Executive: 2015 TELUS shareholdings: 131,741 |
| François Gratton sorting food at the Moisson Montréal Food Bank with his daughter, Stéphanie, and son, Alexandre, in Montreal, Quebec. | François Gratton Group President, TELUS and Chair, TELUS Québec Location: Montreal, Quebec Joined TELUS: 2008 (Emergis: 2002) Executive: 2015 TELUS shareholdings: 123,652 |


| Sandy McIntosh |
|
| Eros Spadotto |
EVP, People and Culture, |
| EVP, Technology Strategy | ||
and Chief Human |
| and Business Transformation | ||
Resources Officer |
| Location: Toronto, Ontario | ||
Location: Toronto, Ontario |
| Joined TELUS: 2000 | ||
Joined TELUS: 2007 |
| (Clearnet: 1995) | ||
Executive: 2015 |
| Executive: 2005 | ||
TELUS shareholdings: 128,329 |
| TELUS shareholdings: 176,306 | ||
|
|
| ||
|
|
| ||
Sandy McIntosh having her face painted in preparation to #ShareLove and march in the rain during the Toronto Pride Parade. |
| Eros Spadotto planting trees with the Toronto and Region Conservation Authority. | ||
| ||||
| ||||
| ||||
| ||||
|
| |||
|
|
| ||
|
|
|


Darren Entwistle
President and Chief Executive Officer
More information can be found on page 27
|
|
|
|
| For further information, visit telus.com/executive |
| TELUS shareholdings represent the total common shares and restricted stock units held as at December 31, 2018. |
|
|
|

|
|
|
“We are future-proofing Canadian
Zainul Mawji |
| “Our multi-brand strategy – including
Jim Senko |
|
|
|
How do Canadians benefit from TELUS’ network investments? |
| What is driving TELUS’ consistently strong wireless results? | ||
|
|
| ||
| Zainul Mawji President, Home and Small Business Solutions |
|
| Jim Senko President, Mobility Solutions |
Through our investments in our leading TELUS PureFibre network, we are addressing Canadians’ demands for improved reliability, faster Internet speeds and greater capacity. We are future-proofing Canadian communities and empowering citizens in their digital life, as the Internet of Things (IoT) and smart city strategies soon come to the forefront. Our investments are also supporting Canada’s digital economy for small businesses, giving them the speed they need to operate locally and compete globally. Furthermore, we are enabling local healthcare providers, educators and businesses to draw upon the technology needed to evolve how they deliver services. We are utilizing the power of our network to launch new capabilities, such as security and consumer health, which increase customer value and convenience. In addition, we are leveraging our technology to deliver social programs that help vulnerable citizens gain access to technology, health and educational opportunities to help them succeed in our digital society. Relative to traditional technology, our investments in fibre also generate significant benefits for our organization, including increased customer growth and satisfaction, decreased repair rates, greater product penetration and higher lifetime revenue per client, all of which contribute to increased wireline profitability. Lastly, these are TELUS-funded investments, with little to no cost to municipalities or taxpayers, which is a significant benefit for Canadians. |
| First, we put our customers at the heart of everything we do. This focus on service excellence, transparency and proactively removing pain points for our customers has earned us industry-leading mobility customer loyalty, including a postpaid wireless churn rate below one per cent for five straight years. It is also reflected in the results from the annual Commission for Complaints for Telecom-television Services report, where we have consistently received the fewest complaints among our national competitors. Next, we provide our customers with the speed and reliability they demand by delivering the fastest and most reliable network in the country, as demonstrated once again by TELUS earning the top spot in all four major network awards, including OpenSignal, J.D. Power, Ookla and PCMag. Additionally, our multi-brand strategy – including TELUS, Koodo and Public Mobile offerings – enables us to provide choice and flexibility to a diverse customer base. Furthermore, we are proactive in driving growth in markets where we have opportunity by increasing traffic and conversion in channels, promoting self-serve options and supporting customer segments like new Canadians and new businesses. Our cross-product bundling options also help generate strong results across consumer and small business mobility markets, as we are able to achieve greater customer loyalty when our customers bundle their mobility services with TV, Internet, voice, home automation and security services. Beyond the consumer market, we are focused on maintaining strong growth in the small business mobility market, which continues to drive significant gains for our organization. | ||


|
|
|
“TELUS Business Solutions enables
Navin Arora |
| “While others can imitate our products
Andrea Wood |
|
|
|
How is TELUS helping businesses succeed? |
| How is TELUS’ corporate culture a key differentiator? | ||
|
|
| ||
| Navin Arora President, TELUS Business Solutions |
|
| Andrea Wood Chief Legal and Governance Officer |
We are powering the digital workplace of the future. We provide businesses of all sizes – from our smallest customers to our largest enterprise organizations – with the right technology and solutions that set them up to compete aggressively and accelerate their growth and success in a digital economy. TELUS Business Solutions enables our customers to improve efficiency and productivity, speed up time to market, deliver a seamless customer experience, and adapt and scale as they grow. TELUS proudly has the fastest wireless network in Canada. Coupled with our fully integrated and extremely reliable suite of business solutions – including collaboration tools such as TELUS Business Connect®, Workplace as a Service, and our customizable cloud communications platform; data networks such as Network as a Service; and more advanced solutions like IoT, cybersecurity, and cloud and managed IT services – we are creating meaningful value for our customers. With a focus on efficiency, TELUS is able to compete and drive profitable growth across all business segments and key industries. |
| We believe that our strong corporate culture enables us to attract, engage and retain quality team members. While others can imitate our products and services, our powerful culture is nearly impossible to replicate. Highly engaged team members are our greatest asset, as they truly differentiate us from our peers. One important aspect that drives team member engagement is giving back. We recognize that the good we are doing in our communities has a direct impact on the success of our Company, as customers and team members choose to align themselves with organizations that share their values. A second pillar of our culture is our priority to put our customers first, and this includes something near and dear to my heart – maintaining the highest standards in protecting our customers’ trust and the privacy and security of their data. Additionally, we monitor our team member engagement by harvesting the insights from an annual survey whereby team members offer candid feedback about the processes and policies that shape our Company. Finally, we build a strong culture by being champions of one another, as illustrated by our resource groups dedicated to advancing our diverse and inclusive culture. For example, I am proud to serve as the global executive sponsor of Connections – the TELUS Women’s Network. Our diverse team enables us to better understand and reflect the complexion of all our customers. We see our strong corporate culture as a key competitive differentiator and we work hard to maintain that culture. | ||


Board of Directors

1 | R.H. (Dick) Auchinleck, TELUS Chair | 6 | Mary Jo Haddad | 11 | Sarabjit (Sabi) S. Marwah | |
| Residence: Victoria, British Columbia |
| Residence: Oakville, Ontario |
| Residence: Toronto, Ontario | |
| Director since: 2003 |
| Director since: 2014 |
| Director since: 2015 | |
| TELUS shareholdings: 210,780 |
| TELUS Committee: Chair, Human |
| TELUS Committees: Audit and Corporate Governance | |
2 | Raymond T. Chan |
| TELUS shareholdings: 27,441 |
| ||
| Residence: Calgary, Alberta |
|
|
|
| |
| Director since: 2013 | 7 | Kathy Kinloch | 12 | Claude Mongeau | |
| TELUS Committees: Pension, and |
| Residence: Vancouver, British Columbia |
| Residence: Montreal, Quebec | |
| Human Resources and Compensation |
| Director since: 2017 |
| Director since: 2017 | |
| TELUS shareholdings: 40,701 |
| TELUS Committees: Corporate |
| TELUS Committees: Audit and Corporate | |
|
|
| Governance, and Human Resources and |
| Governance | |
3 | Stockwell Day |
| Compensation |
| TELUS shareholdings: 77,107 | |
| Residence: Vancouver, British Columbia |
| TELUS shareholdings: 9,635 |
|
| |
| Director since: 2011 |
|
| 13 | David Mowat | |
| TELUS Committees: Human Resources | 8 | William (Bill) A. MacKinnon |
| Residence: Edmonton, Alberta | |
| and Compensation; and Chair, Pension |
| Residence: Toronto, Ontario |
| Director since: 2016 | |
| TELUS shareholdings: 40,425 |
| Director since: 2009 |
| TELUS Committee: Chair, Audit | |
|
|
| TELUS Committee: Audit |
| TELUS shareholdings: 19,876 | |
4 | Lisa de Wilde |
| TELUS shareholdings: 81,703 |
|
| |
| Residence: Toronto, Ontario |
|
| 14 | Marc Parent | |
| Director since: 2015 | 9 | Christine Magee |
| Residence: Montreal, Quebec | |
| TELUS Committees: Corporate |
| Residence: Toronto, Ontario |
| Director since: 2017 | |
| Governance and Pension |
| Director since: 2018 |
| TELUS Committees: Pension, and Human | |
| TELUS shareholdings: 18,095 |
| TELUS Committee: Audit |
| Resources and Compensation | |
|
|
| TELUS shareholdings: 3,162 |
| TELUS shareholdings: 6,830 | |
5 | Darren Entwistle |
|
|
|
| |
| Residence: Vancouver, British Columbia | 10 | John Manley | 15 | Denise Pickett | |
| Director since: 2000 |
| Residence: Ottawa, Ontario |
| Residence: Toronto, Ontario | |
| TELUS shareholdings: 615,771 |
| Director since: 2012 |
| Director since: 2018 | |
|
|
| TELUS Committees: Pension; and Chair, |
| TELUS Committee: Audit | |
| For further information, visit telus.com/board |
| Corporate Governance |
| TELUS shareholdings: 1,930 | |
| TELUS shareholdings: 43,306 |
|
| |||
|
| TELUS shareholdings represent the total common shares and deferred stock units (restricted stock units for Darren Entwistle) held as at December 31, 2018. | ||||
|
| |||||
|
|
|
| |||
CORPORATE GOVERNANCE

We are strongly committed to sound and effective practices in corporate governance and full and fair disclosure. Our ongoing efforts to enhance our practices help us to continually pursue greater transparency and ensure integrity in our actions.
Evolving our Board
In 2018, we announced the appointment of two new directors. Christine Magee joined our Board in August and Denise Pickett joined in November. Together, they bring a wealth of operational expertise, particularly in relation to retail and customer experience.
Our committee chair succession process saw David Mowat replace Bill MacKinnon as Chair of the Audit Committee, with Bill remaining a member of the committee to facilitate the transition.
Encouraging Board diversity
We believe that fostering diversity provides a major competitive advantage and enables our Board to benefit from a broader range of perspectives and relevant experience that better reflects our customers and the communities we serve.
In support of our Board diversity policy, we set objectives to have diversity represented by not less than 30 per cent of our Board’s independent members, and a minimum representation of 30 per cent of each gender. In 2018, we exceeded these objectives with 50 per cent (seven members) of our independent
|
|
| For a full statement of TELUS’ corporate governance practices, including our Board policy manual and disclosure regarding our governance practices compared to those required by the New York Stock Exchange, refer to the TELUS 2019 information circular or visit telus.com/governance |
|
|
directors representing diversity and 36 per cent (five members) being women.
We also signed the Catalyst Accord 2022, which calls on Canadian boards and CEOs to pledge to accelerate the advancement of women in business by increasing the average percentage of women on boards and in executive positions in corporate Canada to 30 per cent or greater by 2022 and to share key metrics with Catalyst for annual benchmarking of our collective progress.
Maintaining a culture of trust and integrity
Creating and sustaining a strong ethical culture is the shared responsibility and commitment of all team members and essential to everything we do at TELUS. Our culture underpins our values and ensures decisions are made with the highest level of integrity and respect for each other, our customers and our business. Increasingly, team members are seeking advice and wanting clarification on potential ethical situations, demonstrating the importance our team places on adhering to high ethical standards.
We review our code of ethics and conduct annually to ensure it remains relevant. In 2018, the code was enhanced with respect to expectations regarding ethical sales practices, diversity and inclusion and stronger language on sexual harassment. Each year, we also update our learning course, called Integrity, which brings to life the policies and guidelines that inform the way we work and interact with each other, and with our customers, investors, suppliers and communities. The course focuses on ethics, privacy, security and respect, and is mandatory for all team members and the majority of our contractors.
Late in the year, we also updated our anti-bribery and corruption policy to reflect recent industry developments and best practices and to increase understanding for team members.
We are committed to earning and maintaining stakeholder trust in our privacy practices by protecting personal information and being transparent about how we collect, use and secure information. Taking a proactive approach, our dedicated Data & Trust Office regularly reviews our privacy program to ensure our commitments are consistent with changing technologies and laws and to help customers increase their understanding of our privacy practices. This includes updating our online privacy training, which is mandatory for all team members and the majority of our contractors, to ensure it remains up to date and relevant. For more information on privacy, visit telus.com/privacy.
We continue to provide an EthicsLine for anonymous and confidential questions or complaints on internal controls and other issues related to integrity. Calls are handled by an independent agency, offering multi-language services to internal and external callers 24 hours a day. For the 16th consecutive year, none of the calls that were reported to the Ethics Office in 2018 involved team members with a significant role in internal controls over financial reporting.
Communicating with stakeholders
We continue to provide timely and ongoing communication with investors to help them make sound, informed investment decisions. In 2018, we hosted four conference calls with simultaneous webcasts to all investors to discuss our quarterly results and outlook. We also participated in a number of industry-specific investor conferences and met with many institutional investors in Canada, the United States and Europe. As well, our TELUS Chair, Corporate Governance Committee Chair, and members of senior management met with the Canadian Coalition for Good Governance to discuss our governance practices. To view past and upcoming events, visit telus.com/investors.
|
|
| To provide shareholder feedback or comments to our Board, email board@telus.com |
|
|
Long-standing best practices in corporate governance
· Say-on-pay vote
· Majority voting policy
· Clawback policy
· Board diversity policy
· Shareholder engagement policy
· Code of ethics and conduct and EthicsLine
· Privacy management program framework
· Enterprise risk governance and oversight
· Board recruitment process and orientation programs
· Mandatory continuing education sessions for the Board
· Board and committee succession planning
· CEO succession planning
· Board, committee and director evaluations
· Director term limits
· Share ownership guidelines for directors and executives
|
|


Working collaboratively, the TELUS team delivered strong results in 2018, highlighted by our focus on creating positive outcomes for our stakeholders, delivering consistent financial performance, and putting our customers and our communities first.
Elevating our leadership
At TELUS, sustainability is deeply embedded in our culture and we are proud of the important role our financial operations play in creating a healthier future. We believe we have a responsibility as a leading corporate citizen to create a better world for generations to come – it is not only the right thing to do, it is also a catalyst for strong financial performance. Our successes are based on our integrated approach to operations, finance and sustainability, and supported by a resilient business model reflecting the opportunities posed by social and environmental issues.
Our commitment to putting our stakeholders first, which supports our financial and operational success, drives us to lead positive change across the communities where we live, work and serve. In 2018, we elevated our leadership by providing continuous funding of our social purpose initiatives for the years and decades to come, directing the economic gain from the
sale of TELUS Garden, our corporate headquarters in Vancouver, to establish the TELUS Friendly Future Foundation. With our unprecedented $120 million endowment donation, the Foundation will work to help vulnerable youth thrive in our digital society, helping to create the friendly future our brand promise inspires.
Investing in our future
We continued our strategic investments, driving the expansion of our TELUS PureFibre technology to an additional 450,000 homes and businesses in 2018. TELUS’ broadband investments are reinforcing the backbone of our 5G network and will be foundational to our ability to deliver the advanced broadband solutions that will fuel economic growth and innovation, as well as positive social, educational and health outcomes, across Canada.
We added 534,000 new wireless postpaid, high-speed Internet and TV customers in 2018, ending the year with
“Our commitment to putting our stakeholders first, which supports our financial and operational success, drives us to lead positive change across the communities where we live, work and serve.”
|
|
13.4 million customer connections. Our customer loyalty continues to lead the industry, despite a heightened level of competitive intensity throughout the year. We earn this loyalty through the dedicated and successful efforts of our team members to deliver exceptional experiences on our award-winning network.
Delivering value for shareholders
In 2018, revenue grew by 7.2 per cent to $14.4 billion and Adjusted EBITDA increased by 4.9 per cent to $5.25 billion. We achieved profitable growth across both our wireline and wireless businesses, reinforcing the financial strength of our organization. These achievements reflect our team’s ongoing dedication to advancing our strategy and delivering on our number one priority of putting our customers first.
In the spirit of maintaining a strong balance sheet and responsible stewardship of capital over the long term,
we achieved significant growth in free cash flow in 2018, bolstered by operational effectiveness initiatives to optimize our cost structure. As planned, we increased our dividend twice – our 15th and 16th dividend increases since 2011 – and returned $1.2 billion to shareholders through our dividend growth program.
Creating positive outcomes
Looking forward, the continued execution of our proven strategy supports profitable customer growth while simultaneously delivering on our industry-leading multi-year dividend growth program. This strategy, along with the unwavering efforts of the TELUS team, has enabled us to set ambitious growth targets for 2019. I am confident that with the continued commitment of our team to drive exceptional customer experiences, and our ongoing focus on cost efficiency, margin accretive customer growth, broadband investments and sustainable business practices, 2019 should prove to be an equally successful year for our customers, investors and communities.
Best regards,

Doug French
Executive Vice-President and Chief Financial Officer
February 22, 2019
|
|
|
|
|
| Financial review |
| ||
|
|
|
|
|
| 32–37 |
| 118 –186 |
|
|
|
|
|
|
| Financial and operating statistics |
| Consolidated financial statements |
|
|
|
|
|
|
| Annual and quarterly financial and operating information |
| 2018 consolidated financial statements and accompanying notes |
|
|
|
|
|
|
|
|
|
|
|
| 38–117 |
| 187–Back cover |
|
|
|
|
|
|
| Management’s discussion and analysis |
| Additional investor resources |
|
|
|
|
|
|
| A discussion of our financial position and performance |
| Glossary, investor information and reasons to invest in TELUS |
|
|
|
|
|
|
|
|
|
|
|
|
|
|
|
|
Annual consolidated financial information
Consolidated | Applying IFRS 9 and IFRS 15 | Excluding IFRS 9 and IFRS 15 | |||||
Statement of income (millions) | 2018 | 2017 | 2016 | 2015 | 2014 | 2013 | 2012 |
Operating revenues1 | $ 14,368 | $ 13,408 | $ 12,799 | $ 12,502 | $ 12,002 | $ 11,404 | $ 10,921 |
Operating expenses before restructuring and other costs, depreciation and amortization2 | 8,947 | 8,381 | 8,091 | 8,014 | 7,711 | 7,288 | 7,014 |
EBITDA – excluding restructuring and other costs2 | 5,421 | 5,027 | 4,708 | 4,488 | 4,291 | 4,116 | 3,907 |
Restructuring and other costs3 | 317 | 117 | 479 | 226 | 75 | 98 | 48 |
EBITDA2 | 5,104 | 4,910 | 4,229 | 4,262 | 4,216 | 4,018 | 3,859 |
Depreciation and amortization | 2,267 | 2,169 | 2,047 | 1,909 | 1,834 | 1,803 | 1,865 |
Operating income | 2,837 | 2,741 | 2,182 | 2,353 | 2,382 | 2,215 | 1,994 |
Financing costs before long-term debt prepayment premium | 627 | 573 | 520 | 447 | 443 | 424 | 374 |
Long-term debt prepayment premium | 34 | – | – | – | 13 | 23 | – |
Income before income taxes | 2,176 | 2,168 | 1,662 | 1,906 | 1,926 | 1,768 | 1,620 |
Income taxes | 552 | 590 | 426 | 524 | 501 | 474 | 416 |
Net income | $ 1,624 | $ 1,578 | $ 1,236 | $ 1,382 | $ 1,425 | $ 1,294 | $ 1,204 |
Net income attributable to common shares4 | $ 1,600 | $ 1,559 | $ 1,223 | $ 1,382 | $ 1,425 | $ 1,294 | $ 1,204 |
|
|
|
|
|
|
|
|
Share information4 | 2018 | 2017 | 2016 | 2015 | 2014 | 2013 | 2012 |
Basic total weighted average shares outstanding (millions) | 597 | 593 | 592 | 603 | 616 | 640 | 651 |
Year-end shares outstanding (millions) | 599 | 595 | 590 | 594 | 609 | 623 | 652 |
Basic earnings per share (EPS) | $ 2.68 | $ 2.63 | $ 2.06 | $ 2.29 | $ 2.31 | $ 2.02 | $ 1.85 |
Dividends declared per common share | 2.10 | 1.97 | 1.84 | 1.68 | 1.52 | 1.36 | 1.22 |
|
|
|
|
|
|
|
|
Financial position (millions) | 2018 | 2017 | 2016 | 2015 | 2014 | 2013 | 2012 |
Total assets | $ 33,065 | $ 31,053 | $ 27,729 | $ 26,406 | $ 23,217 | $ 21,566 | $ 20,445 |
Net debt5 | 13,770 | 13,422 | 12,652 | 11,953 | 9,393 | 7,592 | 6,577 |
Total capitalization6 | 24,099 | 22,833 | 20,546 | 19,566 | 16,809 | 15,576 | 14,223 |
Long-term debt | 13,265 | 12,256 | 11,604 | 11,182 | 9,055 | 7,493 | 5,711 |
Owners’ equity | 10,341 | 9,458 | 7,936 | 7,672 | 7,454 | 8,015 | 7,686 |

Quarterly consolidated financial information
Consolidated | Applying IFRS 9 and IFRS 15 | |||||||
Statement of income (millions) | Q4 2018 | Q3 2018 | Q2 2018 | Q1 2018 | Q4 2017 | Q3 2017 | Q2 2017 | Q1 2017 |
Operating revenues1 | $ 3,764 | $ 3,774 | $ 3,453 | $ 3,377 | $ 3,541 | $ 3,404 | $ 3,280 | $ 3,183 |
Operating expenses before restructuring and other costs, depreciation and amortization2 | 2,454 | 2,252 | 2,167 | 2,074 | 2,264 | 2,137 | 2,036 | 1,944 |
EBITDA – excluding restructuring and other costs2 | 1,310 | 1,522 | 1,286 | 1,303 | 1,277 | 1,267 | 1,244 | 1,239 |
Restructuring and other costs3 | 75 | 173 | 35 | 34 | 54 | 23 | 36 | 4 |
EBITDA2 | 1,235 | 1,349 | 1,251 | 1,269 | 1,223 | 1,244 | 1,208 | 1,235 |
Depreciation and amortization | 586 | 572 | 559 | 550 | 564 | 547 | 526 | 532 |
Operating income | 649 | 777 | 692 | 719 | 659 | 697 | 682 | 703 |
Financing costs before long-term debt prepayment premium | 159 | 162 | 150 | 156 | 144 | 149 | 142 | 138 |
Long-term debt prepayment premium | – | 34 | – | – | – | – | – | – |
Income before income taxes | 490 | 581 | 542 | 563 | 515 | 548 | 540 | 565 |
Income taxes | 122 | 134 | 145 | 151 | 161 | 142 | 144 | 143 |
Net income | $ 368 | $ 447 | $ 397 | $ 412 | $ 354 | $ 406 | $ 396 | $ 422 |
Net income attributable to common shares | $ 357 | $ 443 | $ 390 | $ 410 | $ 353 | $ 403 | $ 389 | $ 414 |
|
|
|
|
|
|
|
|
|
Share information | Q4 2018 | Q3 2018 | Q2 2018 | Q1 2018 | Q4 2017 | Q3 2017 | Q2 2017 | Q1 2017 |
Basic total weighted average shares outstanding (millions) | 599 | 597 | 596 | 595 | 595 | 594 | 592 | 591 |
Period-end shares outstanding (millions) | 599 | 598 | 596 | 595 | 595 | 594 | 593 | 591 |
Basic EPS | $ 0.60 | $ 0.74 | $ 0.66 | $ 0.69 | $ 0.59 | $ 0.68 | $ 0.66 | $ 0.70 |
Dividends declared per common share | 0.5450 | 0.5250 | 0.5250 | 0.5050 | 0.5050 | 0.4925 | 0.4925 | 0.4800 |
1 In the third quarter of 2018, as part of Operating revenues, we recorded equity income related to real estate joint ventures of $171 million arising from the sale of TELUS Garden.
2 These are non-GAAP measures and do not have standardized meanings under International Financial Reporting Standards (IFRS) as issued by the International Accounting Standards Board (IASB). Therefore, they are unlikely to be comparable to similar measures presented by other companies. For definitions or more information, see Section 11 of the MD&A in this report.
3 In the third quarter of 2018, we recorded a donation to the TELUS Friendly Future Foundation of $118 million as part of other costs. In 2016, we recorded a $305 million immediately vesting transformative compensation expense as part of other costs.
4 Common shares and non-voting shares prior to February 4, 2013.
5 For a definition of Net debt, see Section 11 of the MD&A in this report.
6 Net debt plus Owners’ equity excluding Accumulated other comprehensive income (loss).
Note: Certain comparative information has been restated to conform with the 2018 presentation.
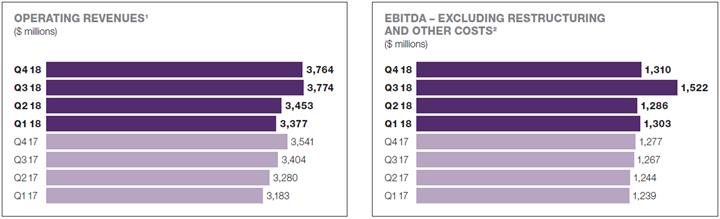
Annual operating statistics
| Applying IFRS 9 and IFRS 15 | Excluding IFRS 9 and IFRS 15 | |||||
Consolidated | 2018 | 2017 | 2016 | 2015 | 2014 | 2013 | 2012 |
Cash flow statement information |
|
|
|
|
|
|
|
Cash provided by operating activities (millions) | $ 4,058 | $ 3,947 | $ 3,219 | $ 3,556 | $ 3,407 | $ 3,246 | $ 3,219 |
Cash used by investing activities (millions) | (2,977) | (3,643) | (2,923) | (4,477) | (3,668) | (2,389) | (2,058) |
Cash provided (used) by financing activities (millions) | (1,176) | (227) | (87) | 1,084 | (15) | (628) | (1,100) |
Profitability ratios |
|
|
|
|
|
|
|
Dividend payout1 | 78% | 80% | 89% | 73% | 66% | 67% | 66% |
Return on common equity2 | 16.4% | 17.1% | 15.4% | 18.3% | 17.8% | 16.8% | 15.6% |
Debt and coverage ratios |
|
|
|
|
|
|
|
EBITDA interest coverage ratio3 | 8.4 | 8.9 | 8.3 | 9.7 | 9.5 | 10.5 | 11.8 |
Net debt to EBITDA ratio4,5 | 2.54 | 2.67 | 2.69 | 2.66 | 2.19 | 1.84 | 1.68 |
Other metrics |
|
|
|
|
|
|
|
EBITDA5 less capital expenditures (millions) | $ 2,507 | $ 1,933 | $ 1,740 | $ 1,911 | $ 1,932 | $ 2,006 | $ 1,926 |
Free cash flow (millions)6 | $ 1,197 | $ 966 | $ 141 | $ 1,078 | $ 1,057 | $ 1,051 | $ 1,331 |
Capital expenditures (excluding spectrum licences) (millions) | $ 2,914 | $ 3,094 | $ 2,968 | $ 2,577 | $ 2,359 | $ 2,110 | $ 1,981 |
Cash payments for spectrum licences (millions) | $ 1 | – | $ 145 | $ 2,048 | $ 1,171 | $ 67 | – |
Capex intensity7 | 20% | 23% | 23% | 21% | 20% | 19% | 18% |
Total customer connections (000s)8 | 13,434 | 13,050 | 12,673 | 12,495 | 12,228 | 11,685 | 11,474 |
Employee-related information |
|
|
|
|
|
|
|
Total salaries and benefits (millions)5 | $ 3,254 | $ 3,036 | $ 2,985 | $ 3,007 | $ 2,851 | $ 2,743 | $ 2,474 |
Total active employees9 | 58,000 | 53,600 | 51,300 | 47,700 | 43,700 | 43,400 | 42,400 |
Full-time equivalent (FTE) employees | 56,900 | 52,900 | 50,500 | 46,600 | 42,700 | 42,300 | 41,400 |

Quarterly operating statistics
| Applying IFRS 9 and IFRS 15 | |||||||
Consolidated | Q4 2018 | Q3 2018 | Q2 2018 | Q1 2018 | Q4 2017 | Q3 2017 | Q2 2017 | Q1 2017 |
Cash flow statement information |
|
|
|
|
|
|
|
|
Cash provided by operating activities (millions) | $ 948 | $ 1,066 | $ 1,206 | $ 838 | $ 979 | $ 1,133 | $ 1,126 | $ 709 |
Cash used by investing activities (millions) | (629) | (621) | (795) | (932) | (734) | (866) | (1,221) | (822) |
Cash provided (used) by financing activities (millions) | (338) | (695) | (143) | – | (224) | (150) | (328) | 475 |
Profitability ratios |
|
|
|
|
|
|
|
|
Dividend payout1 | 78% | 77% | 77% | 76% | 80% | n/a | n/a | n/a |
Return on common equity2 | 16.4% | 16.6% | 16.3% | 16.5% | 17.1% | n/a | n/a | n/a |
Debt and coverage ratios |
|
|
|
|
|
|
|
|
EBITDA interest coverage ratio3 | 8.4 | 8.5 | 8.8 | 8.8 | 8.9 | n/a | n/a | n/a |
Net debt to EBITDA ratio4,5 | 2.54 | 2.54 | 2.66 | 2.71 | 2.67 | n/a | n/a | n/a |
Other metrics |
|
|
|
|
|
|
|
|
EBITDA5 less capital expenditures (millions) | $ 599 | $ 760 | $ 495 | $ 653 | $ 538 | $ 446 | $ 434 | $ 515 |
Free cash flow (millions)6 | $ 122 | $ 303 | $ 329 | $ 443 | $ 274 | $ 215 | $ 260 | $ 217 |
Capital expenditures (excluding spectrum licences) (millions) | $ 711 | $ 762 | $ 791 | $ 650 | $ 739 | $ 821 | $ 810 | $ 724 |
Cash payments for spectrum licences (millions) | – | $ 1 | – | – | – | – | – | – |
Capex intensity7 | 19% | 20% | 23% | 19% | 21% | 24% | 25% | 23% |
Total customer connections (000s)8 | 13,434 | 13,311 | 13,124 | 13,067 | 13,050 | 12,942 | 12,810 | 12,683 |
Employee-related information |
|
|
|
|
|
|
|
|
Total salaries and benefits (millions)5 | $ 816 | $ 831 | $ 813 | $ 794 | $ 786 | $ 754 | $ 756 | $ 740 |
n/a – not applicable
1 Sum of the last quarterly dividends declared per share, divided by the sum of Basic earnings per share reported in the most recent four quarters. See Section 7.5 of the MD&A in this report.
2 Net income attributed to equity shares for a 12-month trailing period, divided by the average common equity for the 12-month period.
3 EBITDA – excluding restructuring and other costs, divided by Financing costs, excluding employee defined benefit plans net interest, recoveries on long-term debt prepayment premium and repayment of debt, calculated on a 12-month trailing basis.
4 Net debt at the end of the period divided by 12-month trailing EBITDA – excluding restructuring and other costs.
5 Excludes restructuring and other costs.
6 For a definition of free cash flow, see Section 11 of the MD&A in this report.
7 Capital expenditures (excluding spectrum licences) divided by Operating revenues.
8 The sum of wireless subscribers, residential network access lines, high-speed Internet subscribers and TELUS TV subscribers. Customer connections have been adjusted in certain years. For details on adjustments, see Section 1.3 of the MD&A in this report.
9 Excluding employees in TELUS International, total active employees were 25,700 in 2018, 25,700 in 2017, 25,500 in 2016, 27,000 in 2015, 27,900 in 2014, 28,300 in 2013, and 28,000 in 2012.
Note: Certain comparative information has been restated to conform with the 2018 presentation.

Annual segment statistics
| Applying IFRS 9 and IFRS 15 | Excluding IFRS 9 and IFRS 15 | |||||
| 2018 | 2017 | 2016 | 2015 | 2014 | 2013 | 2012 |
Wireless segment |
|
|
|
|
|
|
|
Network revenues (millions) | $ 6,025 | $ 5,867 | $ 6,541 | $ 6,298 | $ 6,008 | $ 5,641 | $ 5,367 |
Operating revenues (millions)1 | $ 8,182 | $ 7,714 | $ 7,173 | $ 6,994 | $ 6,641 | $ 6,177 | $ 5,886 |
Operating expenses before restructuring and other costs, depreciation and amortization (millions) | 4,636 | 4,407 | 4,146 | 4,107 | 3,884 | 3,543 | 3,415 |
EBITDA – excluding restructuring and other costs (millions) | 3,546 | 3,307 | 3,027 | 2,887 | 2,757 | 2,634 | 2,471 |
Restructuring and other costs (millions)2 | 115 | 57 | 121 | 81 | 30 | 30 | 13 |
EBITDA (millions) | $ 3,431 | $ 3,250 | $ 2,906 | $ 2,806 | $ 2,727 | $ 2,604 | $ 2,458 |
EBITDA margin3 | 43.3% | 42.9% | 42.2% | 41.3% | 41.5% | 42.6% | 42.0% |
Capital expenditures (excluding spectrum licences) (millions) | $ 896 | $ 978 | $ 982 | $ 893 | $ 832 | $ 712 | $ 711 |
Cash payments for spectrum licences (millions) | $ 1 | – | $ 145 | $ 2,048 | $ 1,171 | $ 67 | – |
Subscriber gross additions (000s)4,5 | 1,516 | 1,460 | 1,399 | 1,443 | 1,620 | 1,614 | 1,646 |
Subscriber net additions (000s)4,5 | 347 | 296 | 173 | 176 | 252 | 307 | 331 |
Subscribers (000s)4,5,6,7 | 9,235 | 8,911 | 8,585 | 8,457 | 8,281 | 7,807 | 7,670 |
Wireless market share, subscriber-based | 28% | 29% | 29% | 29% | 28% | 27% | 28% |
Blended monthly average billing per unit (ABPU)4,5 | $ 67 | $ 67 | $ 65 | $ 63 | $ 62 | $ 61 | $ 60 |
Monthly blended churn rate4,5 | 1.08% | 1.11% | 1.21% | 1.26% | 1.41% | 1.41% | 1.47% |
Monthly postpaid churn rate5 | 0.89% | 0.90% | 0.95% | 0.94% | 0.93% | 1.03% | 1.09% |
Wireline segment |
|
|
|
|
|
|
|
Operating revenues (millions)1 | $ 6,440 | $ 5,943 | $ 5,878 | $ 5,743 | $ 5,590 | $ 5,443 | $ 5,246 |
Operating expenses before restructuring and other costs, depreciation and amortization (millions) | 4,565 | 4,223 | 4,197 | 4,142 | 4,056 | 3,961 | 3,810 |
EBITDA – excluding restructuring and other costs (millions) | 1,875 | 1,720 | 1,681 | 1,601 | 1,534 | 1,482 | 1,436 |
Restructuring and other costs (millions)2 | 202 | 60 | 358 | 145 | 45 | 68 | 35 |
EBITDA (millions) | $ 1,673 | $ 1,660 | $ 1,323 | $ 1,456 | $ 1,489 | $ 1,414 | $ 1,401 |
EBITDA margin3 | 29.1% | 28.9% | 28.6% | 27.9% | 27.4% | 27.2% | 27.4% |
Capital expenditures (millions) | $ 2,018 | $ 2,116 | $ 1,986 | $ 1,684 | $ 1,527 | $ 1,398 | $ 1,270 |
Internet subscribers (000s)8,9,10 | 1,858 | 1,743 | 1,655 | 1,566 | 1,475 | 1,420 | 1,359 |
Residential network access lines (NALs) (000s)9 | 1,248 | 1,298 | 1,374 | 1,467 | 1,556 | 1,643 | 1,767 |
Total TV subscribers (000s)9 | 1,093 | 1,098 | 1,059 | 1,005 | 916 | 815 | 678 |

Quarterly segment statistics
| Applying IFRS 9 and IFRS 15 | |||||||
| Q4 2018 | Q3 2018 | Q2 2018 | Q1 2018 | Q4 2017 | Q3 2017 | Q2 2017 | Q1 2017 |
Wireless segment |
|
|
|
|
|
|
|
|
Network revenues (millions) | $ 1,509 | $ 1,547 | $ 1,497 | $ 1,472 | $ 1,482 | $ 1,513 | $ 1,457 | $ 1,415 |
Operating revenues (millions)1 | $ 2,179 | $ 2,161 | $ 1,941 | $ 1,901 | $ 2,066 | $ 1,991 | $ 1,874 | $ 1,783 |
Operating expenses before restructuring and other costs, depreciation and amortization (millions) | 1,327 | 1,164 | 1,090 | 1,055 | 1,234 | 1,138 | 1,050 | 985 |
EBITDA – excluding restructuring and other costs (millions) | 852 | 997 | 851 | 846 | 832 | 853 | 824 | 798 |
Restructuring and other costs (millions)2 | 22 | 76 | 7 | 10 | 21 | 11 | 24 | 1 |
EBITDA (millions) | $ 830 | $ 921 | $ 844 | $ 836 | $ 811 | $ 842 | $ 800 | $ 797 |
EBITDA margin3 | 39.1% | 46.1% | 43.8% | 44.5% | 40.3% | 42.8% | 44.0% | 44.8% |
Capital expenditures (excluding spectrum licences) (millions) | $ 253 | $ 218 | $ 243 | $ 182 | $ 233 | $ 237 | $ 259 | $ 249 |
Cash payments for spectrum licences (millions) | – | $ 1 | – | – | – | – | – | – |
Subscriber gross additions (000s)5 | 419 | 427 | 362 | 308 | 424 | 399 | 342 | 295 |
Subscriber net additions (000s)5 | 106 | 145 | 91 | 5 | 98 | 124 | 83 | (9) |
Subscribers (000s)5 | 9,235 | 9,152 | 9,007 | 8,916 | 8,911 | 8,824 | 8,700 | 8,576 |
Wireless market share, subscriber-based | 28% | 28% | 29% | 29% | 29% | 29% | 29% | 29% |
Blended monthly ABPU5 | $ 67 | $ 69 | $ 67 | $ 67 | $ 67 | $ 69 | $ 67 | $ 66 |
Monthly blended churn rate5 | 1.14% | 1.03% | 1.01% | 1.14% | 1.23% | 1.05% | 1.00% | 1.18% |
Monthly postpaid churn rate5 | 0.91% | 0.87% | 0.83% | 0.95% | 0.99% | 0.86% | 0.79% | 0.93% |
Wireline segment |
|
|
|
|
|
|
|
|
Operating revenues (millions)1 | $ 1,650 | $ 1,677 | $ 1,574 | $ 1,539 | $ 1,536 | $ 1,475 | $ 1,469 | $ 1,463 |
Operating expenses before restructuring and other costs, depreciation and amortization (millions) | 1,192 | 1,152 | 1,139 | 1,082 | 1,091 | 1,061 | 1,049 | 1,022 |
EBITDA – excluding restructuring and other costs (millions) | 458 | 525 | 435 | 457 | 445 | 414 | 420 | 441 |
Restructuring and other costs (millions)2 | 53 | 97 | 28 | 24 | 33 | 12 | 12 | 3 |
EBITDA (millions) | $ 405 | $ 428 | $ 407 | $ 433 | $ 412 | $ 402 | $ 408 | $ 438 |
EBITDA margin3 | 27.8% | 31.3% | 27.6% | 29.7% | 29.0% | 28.1% | 28.6% | 30.1% |
Capital expenditures (millions) | $ 458 | $ 544 | $ 548 | $ 468 | $ 506 | $ 584 | $ 551 | $ 475 |
Internet subscribers (000s)9 | 1,858 | 1,830 | 1,794 | 1,765 | 1,743 | 1,722 | 1,703 | 1,686 |
Residential NALs (000s)9 | 1,248 | 1,260 | 1,272 | 1,282 | 1,298 | 1,312 | 1,332 | 1,351 |
Total TV subscribers (000s)9 | 1,093 | 1,069 | 1,051 | 1,104 | 1,098 | 1,084 | 1,075 | 1,070 |
1 Includes intersegment revenue for all years; in the third quarter of 2018, we recorded equity income related to real estate joint ventures of $171 million arising from the sale of TELUS Garden, where 50% was allocated to each of our segments ($85 million in wireless and $86 million in wireline).
2 In the third quarter of 2018, we recorded a donation to the TELUS Friendly Future Foundation of $118 million as part of other costs, where 50% was allocated to each of our segments ($59 million in wireless and $59 million in wireline). In 2016, we recorded a $305 million immediately vesting transformative compensation expense as part of other costs ($70 million in wireless and $235 million in wireline).
3 Excludes restructuring and other costs.
4 Effective January 1, 2014, prepaid subscribers, total subscribers and associated operating statistics have been adjusted for inclusion of 222,000 Public Mobile prepaid subscribers in the opening subscriber balances, and subsequent Public Mobile subscriber changes. TELUS acquired 100% of Public Mobile in November 2013.
5 Subscribers have been adjusted in certain years. For details, see Section 5.4 of the MD&A in this report.
6 Includes an April 1, 2013 adjustment to remove approximately 76,000 machine-to-machine subscriptions and an October 1, 2013 adjustment to remove approximately 94,000 Mike subscriptions.
7 Subsequent to a review of our subscriber base during the first quarter of 2016, our 2016 opening wireless postpaid subscriber base was reduced by 45,000.
8 Effective January 1, 2014, Internet subscribers exclude dial-up subscribers.
9 Subscriber connections have been adjusted in certain years. For details, see Section 5.5 of the MD&A in this report.
10 Subsequent to a review of our subscriber base during the first quarter of 2016, our 2016 opening wireline high-speed Internet subscriber base was increased by 21,000.
Note: Certain comparative information has been restated to conform with the 2018 presentation.
Management’s discussion and analysis
Caution regarding forward-looking statements
The terms TELUS, the Company, we, us and our refer to TELUS Corporation and, where the context of the narrative permits or requires, its subsidiaries.
This document contains forward-looking statements about expected events and our financial and operating performance. Forward-looking statements include any statements that do not refer to historical facts. They include, but are not limited to, statements relating to our objectives and our strategies to achieve those objectives, our targets, outlook, updates, and our multi-year dividend growth program. Forward-looking statements are typically identified by the words assumption, goal, guidance, objective, outlook, strategy, target and other similar expressions, or future or conditional verbs such as aim, anticipate, believe, could, expect, intend, may, plan, predict, seek, should, strive and will. These statements are made pursuant to the “safe harbour” provisions of applicable securities laws in Canada and the United States Private Securities Litigation Reform Act of 1995.
By their nature, forward-looking statements are subject to inherent risks and uncertainties and are based on assumptions, including assumptions about future economic conditions and courses of action. These assumptions may ultimately prove to have been inaccurate and, as a result, our actual results or events may differ materially from expectations expressed in or implied by the forward-looking statements. Our general outlook and assumptions for 2019 are presented in Section 9 General trends, outlook and assumptions, and regulatory developments and proceedings in this Management’s discussion and analysis (MD&A).
Risks and uncertainties that could cause actual performance or events to differ materially from the forward-looking statements made herein and in other TELUS filings include, but are not limited to, the following:
· Regulatory decisions and developments including changes to our regulatory regime or the outcomes of proceedings, cases or inquiries relating to its application, such as: the potential of government intervention to further increase wireless competition and any new regulatory requirements as a result of the CRTC’s planned review to be commenced in 2019 of the wholesale wireless regulatory framework; the potential for government intervention concerning the CRTC’s decision on lower-cost data-only plans; changes to the cost burden associated with CRTC-mandated network interconnections; disputes with certain municipalities regarding rights-of-way bylaws, and other potential threats to unitary federal regulatory authority over telecommunications, including provincial wireless and consumer protection legislation; the impact of the CRTC’s wireline wholesale services review, with a review of rates and configurations for wholesale access currently in progress for TELUS; the CRTC’s forthcoming report on the retail practices of Canada’s large telecommunications carriers, as directed by the Governor in Council; the Competition Bureau’s market study on competition in broadband services; the CRTC’s phase-out of the local service subsidy regime and corresponding establishment of a broadband funding regime to support the enhancement of high-speed Internet services focusing on underserved areas in Canada; the CRTC’s review of the price cap and local forbearance regimes; the CRTC’s proceeding to create a mandatory code of conduct to address the clarity and content of contracts for retail fixed Internet access and related issues; broadcasting-related issues, such as: the CRTC’s implementation of new initiatives discussed in its May 2018 report “Harnessing Change: The Future of Programming Distribution in Canada”; the federal government’s review of the Broadcasting Act, Telecommunications Act and Radiocommunication Act as announced on June 5, 2018; the review of the Copyright Act, which began in early 2018; spectrum and compliance with licences, including our compliance with licence conditions, changes to spectrum licence fees, spectrum policy determinations such as restrictions on the purchase, sale and transfer of spec-trum licences, and the amount of spectrum TELUS is able to acquire and its cost under the Technical, Policy and Licensing Framework for Spectrum in the 600 MHz Band auction, as well as cost and availability of spectrum in the 3500 MHz and mmWave bands; the impact on us and other Canadian tele-communications carriers of government or regulatory actions with respect to certain countries or suppliers; restrictions on non-Canadian ownership and control of TELUS Common Shares and the ongoing monitoring and compliance with such restrictions; and our ability to comply with complex and changing regulation of the healthcare and medical devices industry in the provinces of Canada in which we operate, including as an operator of health clinics.
· Competitive environment including: our ability to continue to retain customers through an enhanced customer service experience, including through the deployment and operation of evolving wireless and wireline infrastructure; intense wireless competition, including the ability of industry competitors to successfully combine a mix of high-speed Internet access (HSIA) and, in some cases, wireless services under one bundled and/or discounted monthly rate, along with their existing broadcast or satellite-based TV services; the success of new products, new services and supporting systems, such as home automation security, and Internet of Things (IoT) services for Internet-connected devices; wireline voice and data competition including continued intense rivalry across all services among wireless and wireline telecommunications companies, cable-TV providers, other communications companies and over-the-top (OTT) services, which, among other things, places pressures on current and future average billing per subscriber unit per month (ABPU), average revenue per subscriber unit per month (ARPU), cost of acquisition, cost of retention and churn rate for all services, as do customer usage patterns, increased data bucket sizes or flat-rate pricing trends for voice and data, inclusive rate plans for voice and data and availability of Wi-Fi networks for data; mergers and acquisitions of industry competitors; pressures on high-speed Internet and TV ARPU and churn rate resulting from market conditions, government actions and customer usage patterns; residential and business network access line (NAL) losses; subscriber additions and retention volumes, and associated costs for wireless, TV and high-speed Internet services; our ability to obtain and offer content on a timely basis across multiple devices on wireless and TV platforms at a reasonable cost; vertical integration in the broadcasting industry resulting in competitors owning broadcast content services, and timely and effective enforcement of related regulatory safeguards; our ability to compete successfully in customer care and business services (CCBS) given our competitors’ brand recognition, consolidation and strategic alliances as well as technology development and, in our TELUS Health business, our ability to compete with other providers of electronic medical records and pharmacy management products, systems integrators and health service providers including those that own a vertically integrated mix of health services delivery, IT solutions, and related services, and global providers that could achieve expanded Canadian footprints.
· Technological substitution including: reduced utilization and increased commoditization of traditional wireline voice local and long distance services from impacts of OTT applications and wireless substitution, a declining overall market for paid TV services, including as a result of content piracy and signal theft and as a result of a rise in OTT direct to consumer video offerings and virtual multichannel video programming distribution platforms; the increasing number of households that have only wireless and/or Internet-based telephone services; potential wireless ABPU and ARPU declines as a result of, among other factors, substitution to messaging and OTT applications; substitution to increasingly available Wi-Fi services; and disruptive technologies, such as OTT IP services, including Network as a Service in the business market, that may displace or re-rate our existing data services.
· Technology including: high subscriber demand for data that challenges wireless networks and spectrum capacity levels and may be accompanied by increases in delivery cost; our reliance on information technology and our need to streamline our legacy systems; the roll-out and evolution of wireless broadband technologies and systems including video distribution platforms and telecommunications network technologies (broadband initiatives, such as fibre to the premises (FTTP), wireless small-cell deployment, 5G wireless and availability of resources and ability to build out adequate broadband capacity); our reliance on wireless network access agreements, which have facilitated our deployment of wireless technologies; choice of suppliers and those suppliers’ ability to maintain and service their product lines, which could affect the success of upgrades to, and evolution of, technology that we offer; supplier limitations and concentration and market power for network equipment, TELUS TV and wireless handsets; the performance of wireless technology; our expected long-term need to acquire additional spectrum capacity through future spectrum auctions and from third parties to address increasing demand for data; deployment and operation
MANAGEMENT’S DISCUSSION AND ANALYSIS (MD&A)
of new wireline broadband network technologies at a reasonable cost and availability and success of new products and services to be rolled out using such network technologies; network reliability and change management; self-learning tools and automation that may change the way we interact with customers; and uncertainties around our strategy to replace certain legacy wireline network technologies, systems and services to reduce operating costs.
· Capital expenditure levels and potential outlays for spectrum licences in spectrum auctions or from third parties, due to: our broadband initiatives, including connecting more homes and businesses directly to fibre; our ongoing deployment of newer wireless technologies, including wireless small cells to improve coverage and capacity and prepare for a more efficient and timely evolution to 5G wireless services; utilizing acquired spectrum; investments in network resiliency and reliability; subscriber demand for data; evolving systems and business processes; implementing efficiency initiatives; supporting large complex deals; and future wireless spectrum auctions held by Innovation, Science and Economic Development Canada (ISED) including the 600 MHz spectrum auction scheduled to take place in March 2019 which will result in increased expenditures. Our capital expenditure levels could be impacted if we do not achieve our targeted operational and financial results.
· Operational performance and business combination risks including: our reliance on legacy systems and ability to implement and support new products and services and business operations in a timely manner; our ability to implement effective change management for system replacements and upgrades, process redesigns and business integrations (such as our ability to successfully integrate acquisitions, complete divestitures or establish partnerships in a timely manner, and realize expected strategic benefits, including those following compliance with any regulatory orders); our ability to identify and manage new risks inherent to new service offerings that we may provide, including as a result of acquisitions, which could result in damage to our brand, our business in the relevant area or as a whole, additional exposure to litigation or regulatory proceedings; and real estate joint venture risks.
· Data protection including risks that malfunctions or unlawful acts could result in the unauthorized access to, change, loss, or distribution of data, which may compromise the privacy of individuals and could result in financial loss and harm to our reputation and brand.
· Security threats including intentional damage or unauthorized access to our physical assets or our IT systems and networks, which could prevent us from providing reliable service or result in unauthorized access to our information or that of our customers.
· Ability to successfully implement cost reduction initiatives and realize planned savings, net of restructuring and other costs, without losing customer service focus or negatively affecting business operations. Examples of these initiatives are: our operating efficiency and effectiveness program to drive improvements in financial results; business integrations; business product simplification; business process outsourcing; offshoring and reorganizations, including any full-time equivalent (FTE) employee reduction programs; procurement initiatives; and real estate rationalization.
· Implementation of large enterprise deals, which may be adversely impacted by available resources, system limitations and degree of co-operation from other service providers.
· Foreign operations and our ability to successfully manage operations in foreign jurisdictions, including managing risks such as currency fluctuations.
· Business continuity events including: our ability to maintain customer service and operate our network in the event of human error or human-caused threats, such as cyberattacks and equipment failures that could cause various degrees of network outages; supply chain disruptions, delays and economics including as a result of government restrictions or trade actions; natural disaster threats; epidemics; pandemics; political instability in certain international locations; information security and privacy breaches, including data loss or theft of data; and the completeness and effectiveness of business continuity and disaster recovery plans and responses.
· Human resource matters including: recruitment, retention and appropriate training in a highly competitive industry, and the level of employee engagement.
· Financing and debt requirements including: our ability to carry out financing activities, our ability to refinance our maturing debt, our ability to maintain investment grade credit ratings in the range of BBB+ or the equivalent. Our business plans and growth could be negatively affected if existing financing is not sufficient to cover our funding requirements.
· Lower than planned free cash flow could constrain our ability to invest in operations, reduce debt or return capital to shareholders, and could affect our ability to sustain our dividend growth program through 2019. This program may be affected by factors such as the competitive environment, economic performance in Canada, our earnings and free cash flow, our levels of capital expenditures and spectrum licence purchases, acquisitions, the management of our capital structure, and regulatory decisions and developments. Quarterly dividend decisions are subject to assessment and determination by our Board of Directors (Board) based on our financial position and outlook. Shares may be purchased under our normal course issuer bid (NCIB) when and if we consider it opportunistic, based on our financial position and outlook, and the market price of TELUS shares. There can be no assurance that our dividend growth program or any NCIB will be maintained, not changed and/or completed through 2019.
· Taxation matters including: interpretation of complex domestic and foreign tax laws by the relevant tax authorities that may differ from our interpretations; the timing and character of income and deductions, such as tax depreciation and operating expenses; tax credits or other attributes; changes in tax laws, including tax rates; tax expenses being materially different than anticipated, including the taxability of income and deductibility of tax attributes; elimination of income tax deferrals through the use of different tax year-ends for operating partnerships and corporate partners; and changes to the interpretation of tax laws, including as a result of changes to applicable accounting standards or tax authorities adopting more aggressive auditing practices, tax reassessments or adverse court decisions impacting the tax payable by us.
· Litigation and legal matters including: our ability to successfully respond to investigations and regulatory proceedings; our ability to defend against existing and potential claims and lawsuits (including intellectual property infringement claims and class actions based on consumer claims, data, privacy or security breaches and secondary market liability), or to negotiate and execute upon indemnity rights or other protections in respect of such claims and lawsuits; and the complexity of legal compliance in domestic and foreign jurisdictions, including compliance with competition, anti-bribery and foreign corrupt practices laws.
· Health, safety and the environment including: lost employee work time resulting from illness or injury, public concerns related to radio frequency emissions, environmental issues affecting our business including climate change, waste and waste recycling, risks relating to fuel systems on our properties, and changing government and public expectations regarding environmental matters and our responses.
· Economic growth and fluctuations including: the state of the economy in Canada, which may be influenced by economic and other developments outside of Canada, including potential outcomes of yet unknown policies and actions of foreign governments; future interest rates; inflation; unemployment levels; effects of fluctuating oil prices; effects of low business spending (such as reducing investments and cost structure); pension investment returns, funding and discount rates; and fluctuations in foreign exchange rates of the currencies in the regions in which we operate, and the impact of tariffs on trade between Canada and the U.S. as well as global implications of a trade conflict between the U.S. and China.
These risks are described in additional detail in Section 9 General trends, outlook and assumptions, and regulatory developments and proceedings and Section 10 Risks and risk management in this MD&A. Those descriptions are incorporated by reference in this cautionary statement but are not intended to be a complete list of the risks that could affect the Company.
Many of these factors are beyond our control or our current expectations or knowledge. Additional risks and uncertainties not currently known to us or that we currently deem to be immaterial may also have a material adverse effect on our financial position, financial performance, cash flows, business or reputation. Except as otherwise indicated in this document, the forward-looking statements made herein do not reflect the potential impact of any non-recurring or special items or any mergers, acquisitions, dispositions or other business combinations or transactions that may be announced or that may occur after the date of this document.
Readers are cautioned not to place undue reliance on forward-looking statements. Forward-looking statements in this document describe our expectations and are based on our assumptions as at the date of this document and are subject to change after this date. Except as required by law, we disclaim any intention or obligation to update or revise any forward-looking statements.
This cautionary statement qualifies all of the forward-looking statements in this MD&A.
February 14, 2019
|
|
|
|
|
|
|
|
Section |
| Page |
| Section |
| Page |
|
1 | Introduction | 41 |
| 7 | Liquidity and capital resources | 73 |
|
1.1 Preparation of the MD&A 1.2 The environment in which we operate 1.3 Highlights of 2018 1.4 Performance scorecard | 41 |
| 7.1 Overview | 73 |
| ||
41 |
| 7.2 Cash provided by operating activities | 73 |
| |||
| 42 |
|
| 7.3 Cash used by investing activities | 73 |
| |
|
|
|
| 7.4 Cash used by financing activities | 74 |
| |
| 7.5 Liquidity and capital resource measures | 75 |
| ||||
|
|
|
|
| 7.6 Credit facilities | 76 |
|
2 | Core business and strategy | 48 |
|
| 7.7 Sale of trade receivables | 77 |
|
2.1 Core business | 48 |
|
| 7.8 Credit ratings | 77 |
| |
2.2 Strategic imperatives | 48 |
|
| 7.9 Financial instruments, commitments and contingent liabilities | 78 |
| |
|
|
|
| ||||
3 | Corporate priorities | 49 |
|
| 7.10 Outstanding share information | 82 |
|
|
|
|
| 7.11 Transactions between related parties | 82 |
| |
|
|
|
|
|
|
| |
4 | Capabilities | 51 |
| 8 | Accounting matters | 82 |
|
4.1 Principal markets addressed and competition | 51 |
| 8.1 Critical accounting estimates and judgments | 82 |
| ||
4.2 Operational resources | 54 |
| 8.2 Accounting policy developments | 87 |
| ||
| 4.3 Liquidity and capital resources | 56 |
|
|
|
|
|
| 4.4 Disclosure controls and procedures and changes in internal control over financial reporting | 58 |
| 9 | General trends, outlook and assumptions, and regulatory developments and proceedings | 89 |
|
|
|
|
| 9.1 Telecommunications industry in 2018 | 89 |
| |
5 | Discussion of operations | 59 |
|
| 9.2 Telecommunications industry general outlook and trends | 90 |
|
5.1 General | 59 |
|
| 9.3 TELUS assumptions for 2019 | 92 |
| |
5.2 Summary of consolidated quarterly results, trends and fourth quarter recap | 60 |
|
| 9.4 Communications industry regulatory developments and proceedings | 93 |
| |
| 5.3 Consolidated operations | 63 |
|
|
|
|
|
| 5.4 Wireless segment | 65 |
| 10 | Risks and risk management | 95 |
|
| 5.5 Wireline segment | 68 |
| 10.1 Overview | 95 |
| |
|
|
|
| 10.2 Regulatory matters | 97 |
| |
6 | Changes in financial position | 71 |
|
| 10.3 Competitive environment | 98 |
|
|
|
|
| 10.4 Technology | 101 |
| |
|
|
|
| 10.5 Operational performance | 104 |
| |
|
|
|
|
| 10.6 Human resources | 107 |
|
|
|
|
|
| 10.7 Financing, debt requirements and returning cash to shareholders | 108 |
|
|
|
|
|
| 10.8 Taxation matters | 109 |
|
|
|
|
|
| 10.9 Litigation and legal matters | 109 |
|
|
|
|
|
| 10.10 Health, safety and environment | 112 |
|
|
|
|
|
| 10.11 Economic growth and fluctuations | 113 |
|
|
|
|
|
|
|
|
|
|
|
|
| 11 | Definitions and reconciliations | 114 |
|
|
|
|
| 11.1 Non-GAAP and other financial measures | 114 |
| |
|
|
|
| 11.2 Operating indicators | 117 |
| |
|
|
|
|
|
|
|
|
MD&A: INTRODUCTION
|
|
1 | Introduction |
|
|
The forward-looking statements in this section, including estimates regarding economic growth, are qualified by the Caution regarding forward-looking statements at the beginning of this Management’s discussion and analysis (MD&A).
1.1 Preparation of the MD&A
The following sections are a discussion of our consolidated financial position and financial performance for the year ended December 31, 2018, and should be read together with our December 31, 2018, audited consolidated statements of income and other comprehensive income, statements of financial position, statements of changes in owners’ equity and statements of cash flows, and the related notes (collectively referred to as the Consolidated financial statements). The generally accepted accounting principles (GAAP) we use are the International Financial Reporting Standards (IFRS) as issued by the International Accounting Standards Board (IASB). Our Consolidated financial statements comply with IFRS-IASB and Canadian GAAP. In this MD&A, the term IFRS refers to these standards. We adopted IFRS 9, Financial Instruments, and IFRS 15, Revenue from Contracts with Customers, on January 1, 2018, with retrospective application. See Note 2 of the Consolidated financial statements for reconciliations of results excluding IFRS 15 effects. In our discussion, we also use certain non-GAAP financial measures to evaluate our performance, monitor compliance with debt covenants and manage our capital structure. These measures are defined, qualified and reconciled with their nearest GAAP measures in Section 11.1. All currency amounts are in Canadian dollars, unless otherwise specified.
Additional information relating to the Company, including our annual information form and other filings with securities commissions or similar regulatory authorities in Canada, is available on SEDAR (sedar.com). Our filings with the Securities and Exchange Commission in the United States, including Form 40-F, are available on EDGAR (sec.gov).
Our disclosure controls and procedures are designed to provide reasonable assurance that all relevant information is gathered and reported to senior management on a timely basis, so that appropriate decisions can be made regarding public disclosure. This MD&A and the Consolidated financial statements were reviewed by our Audit Committee and authorized by our Board of Directors (Board) for issuance on February 14, 2019.
In this MD&A, unless otherwise indicated, results for the year ended December 31, 2018, are compared with results for the year ended December 31, 2017, adjusted for the retrospective application of IFRS 9 and IFRS 15 (for the year ended December 31, 2017).
1.2 The environment in which we operate
The success of our business and the challenges we face can best be understood with reference to the environment in which we operate, including broader economic factors that affect our customers and us, and the competitive nature of our industry. Our estimates regarding our environment also form an important part of the assumptions on which our targets are based.
2018 Canadian telecom
Est. $63 billion |
| TELUS 2018 revenues
$14.4 billion |
|
|
|
TELUS subscriber
13.4 million |
| TELUS 2018 dividends
$1.3 billion / 7.4% |
Economic growth
We estimate that the rate of economic growth in Canada in 2019 will be 2.0% (2.1% in 2018), both rates being based on a composite of estimates from Canadian banks and other sources. For our incumbent local exchange carrier (ILEC) provinces in Western Canada, we estimate that economic growth will be 2.3% in 2019 in British Columbia (B.C.) (2.2% in 2018) and 2.1% in Alberta (2.2% in 2018). The Bank of Canada’s January 2019 Monetary Policy Report estimated that economic growth in Canada will be 1.7% in 2019 (2.0% in 2018). The extent to which these economic growth estimates affect us and the timing of their impact will depend upon the actual experience of specific sectors of the Canadian economy.
With respect to the national unemployment rate, Statistics Canada’s Labour Force Survey reported a rate of 5.6% for December 2018 (5.7% reported for December 2017). The unemployment rate for B.C. was 4.4% for December 2018 (4.6% for December 2017), while the unemployment rate for Alberta was 6.4% for December 2018 (6.9% for December 2017). Based on a composite of estimates from Canadian banks and other sources, we estimate that the unemployment rate in 2019 will be 5.8% in Canada, 4.9% in B.C. and 6.2% in Alberta.
With respect to the pace of housing starts, in January 2019, Canada Mortgage and Housing Corporation reported housing starts in Canada of approximately 213,000 units in 2018 and approximately 220,000 units in 2017. Based on a composite of estimates from Canadian banks and other sources, we estimate that housing starts in Canada for 2019 will be approximately 196,000 units.
Canadian telecommunications industry growth
We estimate that Canadian telecommunications industry revenues (including TV revenue and excluding media revenue) grew by approximately 4% in 2018 (3% in 2017). We estimate that the Canadian wireless industry grew by approximately 1.5 million new subscribers in 2018 and experienced approximately 4.2% network revenue growth. Key drivers of subscriber growth included immigration and population growth; the trend toward multiple devices, including tablets; the expanding functionality of data and related applications; and mobile adoption by both younger and older generations. With respect to the wireline industry, the Canadian consumer high-speed Internet penetration rate grew by approximately 2% in 2018 and subscriber growth is expected to continue. Competitive pressures continued in both the wireline consumer and business markets, while declines in higher-margin legacy voice services were ongoing, partially attributable to technological substitution. (See Section 9 General trends, outlook and assumptions, and regulatory developments and proceedings, Section 10.3 Competition, and Section 10.11 Economic growth and fluctuations.)
1.3 Highlights of 2018
Home and business security-related acquisitions
Throughout 2018, we completed home and business security acquisitions, including our January 2018 acquisition of the customers, assets and operations of AlarmForce Industries Inc. in B.C., Alberta and Saskatchewan. These acquisitions, combined with our growing gigabit-capable TELUS PureFibre infrastructure, were made with a view to accelerating our position in smart home and security services, and providing us with the ability to offer our customers additional services as part of a bundle.
Xavient Information Systems
In February 2018, through our TELUS International (Cda) Inc. subsidiary, we closed an acquisition of a 65% interest in Xavient Information Systems (Xavient), a group of information technology consulting and software services companies with facilities in the U.S. and India. The investment was made with a view to enhancing our ability to provide complex and higher-value information technology services, improving our related sales and solutioning capabilities, and acquiring multi-site redundancy in support of other facilities.
Medisys Health Group Inc.
In July 2018, we acquired Medisys Health Group Inc., a leading provider of preventative healthcare and wellness services for workplaces across Canada. The total purchase price was approximately $84 million, of which $79 million was paid by issuance of approximately 1.7 million TELUS Common Shares. The investment was made with a view to growing the delivery of employee-centred workplace health and wellness services. With this acquisition, TELUS Health will be able to deliver employee-centred care, backed by TELUS’ broadband network and supported by digital tools such as patient portals, virtual care, wellness and mental health applications, electronic prescribing, electronic benefit claims and secure messaging. The Medisys Health Group network will serve as an innovation hub for next-generation technology, as well as preventative care and wellness programs, so that patient outcomes can be measured.
Long-term debt issues
On March 1, 2018, we issued $600 million of senior unsecured notes at 3.625% due March 1, 2028 and $150 million through the re-opening of Series CW Notes at 4.70% due March 6, 2048. The net proceeds
were used to repay approximately $725 million of outstanding commercial paper; to fund the repayment, on maturity, of a portion of the $250 million principal amount outstanding on TELUS’ Series CS Notes due March 27, 2018; and for general corporate purposes.
On June 12, 2018, we issued US$750 million of senior unsecured 30-year notes at 4.60%, maturing on November 16, 2048. The net proceeds were used to repay outstanding indebtedness, including outstanding commercial paper, and for general corporate purposes. We have fully hedged the principal and interest obligations of the notes against fluctuations in the Canadian dollar foreign exchange rate for the entire term of the notes by entering into a foreign exchange derivative (a cross currency interest rate exchange agreement), which effectively converted the principal payments and interest obligations to Canadian dollar obligations with a fixed interest rate of 4.41% and an issued and outstanding amount of $974 million (reflecting a fixed exchange rate of $1.2985).
Early redemption of 2019 Notes
On August 1, 2018, we executed our June 28, 2018, notice to early redeem all of our $1.0 billion 5.05% Series CG Notes due December 4, 2019. The long-term debt prepayment premium recorded was approximately $34 million before income taxes (or $0.04 per share after income taxes).
Sale of TELUS Garden and donation to the TELUS Friendly Future Foundation
On August 8, 2018, the TELUS Garden real estate joint venture sold the income-producing properties and the related net assets. The purchaser assumed the 3.7% mortgage and the 3.4% bonds secured by the income-producing properties. In the application of equity accounting, we recorded our share of the non-recurring gain at $171 million. Concurrently, we committed to a donation of $118 million to the TELUS Friendly Future Foundation to help ensure that vulnerable youth can thrive in our digital society through better access to technology, health and educational opportunities. Of this $118 million, we have donated $101 million in 2018, including an initial donation of $100 million made in the third quarter of 2018 in TELUS Corporation Common Shares acquired in the market. The remainder of the committed donation may be made in TELUS Corporation Common Shares or cash and is committed over a 10-year period. The Foundation will give financial grants to grassroots charities across Canada that need help in directly supporting underserved youth in our communities. Through these grants, the Foundation will support our TELUS Community Boards in connecting youth to the people and opportunities that matter most.
Changes to the Board of Directors
John Lacey, an independent director who had served as a TELUS director since 2000, retired from our Board in May 2018.
In August 2018, we welcomed Christine Magee to our Board. Christine is the Co-Founder and Co-Chair of Sleep Country Canada, the largest mattress retailer in Canada. From 1982 to 1994, Christine worked in the banking and financial services industry at the National Bank of Canada and Continental Bank of Canada. She is currently a member of the board of directors of Metro Inc., Woodbine Entertainment Group, Trillium Health Partners, Plan International Canada, and the Advisory Council of the Talent Fund. Christine has also taken on an active mentoring role for Women’s Executive Network. The recipient of numerous awards and other recognition, Christine received the Excellence Canada Special Recognition of Achievement Award in 2017, and was appointed to the Order of Canada on July 1, 2015.
MD&A: INTRODUCTION
Christine holds an Honours Business and Administration degree from the University of Western Ontario.
In November 2018, Denise Pickett joined our Board. Denise was named Chief Risk Officer and President, Global Risk, Banking and Compliance, American Express in February 2018. From 1992 to the present, Denise has held a series of progressively senior roles throughout American Express. She was Country Manager for American Express Canada and President and CEO of Amex Bank of Canada. Denise subsequently relocated to the United States, where she served as the President of American Express OPEN, the company’s small business division, and then as the President of U.S. Consumer Services. She was also a member of the board of directors of the Hudson’s Bay Company (2012 to 2018) and serves as Vice Chair of the board of directors of
the United Way of New York City. Denise holds an MBA in Marketing from the Schulich School of Business at York University and earned an Honours BA in Human Biology and Physiology from the University of Toronto. She was named to Payment Source’s Most Influential Women in Payments in 2018.
Business acquisition – subsequent to 2018
On January 14, 2019, we acquired a business complementary to our existing telecommunications lines of business, for consideration consisting of cash of $89 million and TELUS Corporation Common Shares of $38 million. The investment was made with a view to growing our managed network, cloud, security and unified communications services.
Consolidated highlights
Years ended December 31 ($ millions, except footnotes and unless noted otherwise) | 2018 | 2017 | Change |
|
| Applying IFRS 9 and IFRS 15 |
|
| |
Consolidated statements of income |
|
|
|
|
Operating revenues1 | 14,368 | 13,408 | 7.2% |
|
Operating income | 2,837 | 2,741 | 3.5% |
|
Income before income taxes | 2,176 | 2,168 | 0.4% |
|
Net income | 1,624 | 1,578 | 2.9% |
|
Net income attributable to Common Shares | 1,600 | 1,559 | 2.6% |
|
Adjusted Net income2 | 1,703 | 1,643 | 3.7% |
|
Earnings per share (EPS) ($) |
|
|
|
|
Basic EPS | 2.68 | 2.63 | 1.9% |
|
Adjusted basic EPS2 | 2.85 | 2.77 | 2.9% |
|
Diluted EPS | 2.68 | 2.63 | 1.9% |
|
Dividends declared per Common Share ($) | 2.10 | 1.97 | 6.6% |
|
Basic weighted-average Common Shares outstanding (millions) | 597 | 593 | 0.7% |
|
Consolidated statements of cash flows |
|
|
|
|
Cash provided by operating activities | 4,058 | 3,947 | 2.8% |
|
Cash used by investing activities | (2,977) | (3,643) | (18.3)% |
|
Acquisitions | (280) | (564) | (50.4)% |
|
Capital expenditures3 | (2,914) | (3,094) | (5.8)% |
|
Cash used by financing activities | (1,176) | (227) | n/m |
|
Other highlights |
|
|
|
|
Subscriber connections4 (thousands) | 13,434 | 13,050 | 2.9% |
|
Earnings before interest, income taxes, depreciation and amortization (EBITDA)2 | 5,104 | 4,910 | 3.9% |
|
Restructuring and other costs2,5 | 317 | 117 | n/m |
|
Adjusted EBITDA6 | 5,250 | 5,005 | 4.9% |
|
Adjusted EBITDA margin7 (%) | 37.0 | 37.4 | (0.4) pts. |
|
Free cash flow2 | 1,197 | 966 | 23.9% |
|
Net debt to EBITDA – excluding restructuring and other costs2,8 (times) | 2.54 | 2.67 | (0.13 | ) |
Notations used in MD&A: n/m – not meaningful; pts. – percentage points.
1 In the third quarter of 2018, we recorded equity income related to real estate joint ventures of $171 million arising from the sale of TELUS Garden.
2 These are non-GAAP and other financial measures. See Section 11.1 Non-GAAP and other financial measures.
3 Capital expenditures include assets purchased but not yet paid for, and consequently differ from Cash payments for capital assets, excluding spectrum licences, as reported in the Consolidated financial statements.
4 The sum of active wireless subscribers, residential network access lines (NALs), high-speed Internet access subscribers and TELUS TV subscribers, measured at the end of the respective periods based on information in billing and other systems. Effective April 1, 2018, and on a prospective basis, we have adjusted cumulative subscriber connections to remove approximately 68,000 TELUS TV subscribers as we have ceased marketing our Satellite TV product. Q4 2018 opening postpaid and total subscribers, as well as associated Q4 2018 operating statistics (average revenue per subscriber unit per month (ARPU), average billing per subscriber unit per month (ABPU), and churn) have been adjusted to exclude an estimated 23,000 subscribers impacted by the CRTC’s final pro-rating ruling in June 2018, which was effective October 1, 2018.
5 In the third quarter of 2018, we recorded a donation to the TELUS Friendly Future Foundation of $118 million as part of other costs.
6 Adjusted EBITDA for all periods excludes restructuring and other costs (see Section 11.1 for restructuring and other cost amounts) and non-recurring gains and equity income related to real estate joint ventures. Adjusted EBITDA for 2017 excludes the MTS net recovery (as defined later in this section).
7 Adjusted EBITDA margin is Adjusted EBITDA divided by Operating revenues, where the calculation of the Operating revenues excludes non-recurring gains and equity income related to real estate joint ventures, and for 2017, excludes the MTS net recovery (as defined later in this section).
8 Excluding the third quarter of 2018 equity income related to real estate joint ventures of $171 million arising from the sale of TELUS Garden, the 2018 amount would be 2.62.
Operating highlights
· Consolidated operating revenues increased by $960 million in 2018:
Service revenues increased by $550 million in 2018, mainly due to growth in wireless network revenue and wireline data services revenue, partly offset by the ongoing decline in legacy wireline voice revenue.
Equipment revenues increased by $240 million in 2018, largely due to higher wireless equipment revenue resulting from a higher volume of new postpaid contracts, as well as higher-value smartphones in the sales mix of gross additions and retention units.
Other operating income increased by $170 million in 2018. In the third quarter of 2018, we recorded equity income related to real estate joint ventures arising from the sale of TELUS Garden of $171 million, as previously noted, of which 50% was allocated to each of the wireless and wireline segments. Excluding the effect of equity income related to real estate joint ventures arising from the sale of TELUS Garden, Other operating income was relatively flat. In 2017, we recorded a non-recurring pre-tax recovery of contingent consideration paid of $26 million to reflect the revised estimate of qualifying Manitoba Telecom Services Inc. (MTS) subscribers acquired (MTS contingent consideration recovery). The change in Other operating income reflects the non-recurrence of the 2017 MTS contingent consideration recovery, partly offset by higher net gains from the sale of property, plant and equipment, and a decrease in the provision related to written put options in respect of non-controlling interests.
For additional details on operating revenues, see Section 5.4 Wireless segment and Section 5.5 Wireline segment.
· During 2018, our total subscriber connections increased by 384,000, reflecting a 4.2% increase in wireless postpaid subscribers, a 6.6% increase in high-speed Internet subscribers and, excluding the Satellite TV subscriber adjustment, a 4.8% increase in TELUS TV subscribers, partly offset by a 1.0% decline in wireless prepaid subscribers and a 3.9% decline in wireline residential NALs.
Our postpaid wireless subscriber net additions were 356,000 in 2018, down 23,000 from 2017, due to higher deactivations associated with a larger subscriber base partly offset by higher gross additions resulting from continued net new demand from Canadian consumers and businesses. Our comparatively low postpaid churn rate was 0.89% in 2018, while our blended churn rate was 1.08% in 2018. In 2017, our postpaid churn rate was 0.90% and our blended churn rate was 1.11%. (See Section 5.4 Wireless segment for additional details.)
Net additions of high-speed Internet subscribers were 115,000 in 2018, up 34,000 from 2017. The increase resulted from the increased demand for our high-speed broadband services, including fibre to the premises (FTTP), as well as improved churn reflecting our focus on executing our customers first initiatives and retention programs. Net additions of TELUS TV subscribers were 63,000 in 2018, up 28,000 from 2017. The increase reflects a lower customer churn rate from stronger retention efforts and higher gross additions from our diverse product offerings. Our continued focus on expanding our addressable high-speed Internet and Optik TV footprint, connecting
more homes and businesses directly to fibre, and bundling these services together contributed to combined Internet and TV subscriber growth of 110,000 or 3.9% over the last 12 months. We have made TELUS PureFibre available to 61% of our broadband footprint at the end of 2018. (See Section 5.5 Wireline segment for additional details.)
· Operating income increased by $96 million in 2018, reflecting higher wireless equipment margins and wireless network growth driven by a growing customer base, in addition to growth in EBITDA contribution from our customer care and business services (CCBS) (formerly business process outsourcing) business. These factors were partly offset by increased costs associated with a growing wireless customer base, declines in wireline legacy voice services, higher wireline restructuring and other costs from efficiency initiatives, and increased depreciation and amortization.
EBITDA includes restructuring and other costs, non-recurring gains and equity income related to real estate joint ventures, and the fourth quarter 2017 MTS contingent consideration recovery net of post-closing adjustments (MTS net recovery). EBITDA increased by $194 million or 3.9% in 2018.
Adjusted EBITDA excludes restructuring and other costs and non-recurring gains and equity income related to real estate joint ventures, as well as the 2017 MTS net recovery. Adjusted EBITDA increased by $245 million or 4.9% for 2018. The increase reflects higher wireless equipment margins and wireless network revenue growth driven by a growing customer base, in addition to growth in EBITDA contribution from our CCBS business. These factors were partly offset by increased costs associated with a growing wireless customer base and declines in wireline legacy voice services. (See Section 5.4 Wireless segment and Section 5.5 Wireline segment for additional details.)
· Income before income taxes increased by $8 million in 2018. Higher Operating income, as noted above, was offset by an increase in Financing costs. The increase in Financing costs resulted primarily from the $34 million long-term debt prepayment premium in the third quarter of 2018, higher average long-term debt outstanding along with a higher average effective interest rate in 2018, and higher interest accretion on provisions. (See Financing costs in Section 5.3.)
· Income taxes decreased by $38 million in 2018 and the effective tax rate decreased from 27.2% to 25.4%. The decrease in the effective tax rate was primarily due to the lower capital gain rate on the TELUS Garden sale, as well as a requirement to revalue deferred tax liabilities for changes in legislated tax rates in 2017.
· Net income attributable to Common Shares increased by $41 million in 2018. This increase was primarily driven by higher Operating income and lower income taxes, partly offset by increased Financing costs.
Adjusted Net income excludes the effects of restructuring and other costs, income tax-related adjustments, non-recurring gains and equity income related to real estate joint ventures, the long-term debt prepayment premium and the 2017 MTS net recovery. Adjusted Net income increased by $60 million or 3.7% for the full year of 2018.
MD&A: INTRODUCTION
Reconciliation of adjusted Net income
Years ended December 31 ($ millions) |
| 2018 |
| 2017 |
| Change |
|
|
| Applying IFRS 9 and IFRS 15 |
|
|
| ||
|
| (2017 adjusted) |
|
|
| ||
Net income attributable to Common Shares |
| 1,600 |
| 1,559 |
| 41 |
|
Add back (deduct): |
|
|
|
|
|
|
|
Restructuring and other costs, after income taxes1 |
| 235 |
| 86 |
| 149 |
|
(Favourable) unfavourable income tax-related adjustments |
| (7 | ) | 21 |
| (28 | ) |
Non-recurring losses and equity losses (gains and equity income) related to real estate joint ventures, after income taxes2 |
| (150 | ) | (1 | ) | (149 | ) |
Long-term debt prepayment premium, after income taxes |
| 25 |
| – |
| 25 |
|
MTS net recovery |
| – |
| (22 | ) | 22 |
|
Adjusted Net income |
| 1,703 |
| 1,643 |
| 60 |
|
1 Includes our third quarter of 2018 committed donation to the TELUS Friendly Future Foundation of $90 million after income taxes.
2 Includes equity income arising from the third quarter 2018 sale of TELUS Garden of $150 million after income taxes.
· Basic EPS increased by $0.05 or 1.9% in 2018. This increase was primarily driven by higher Operating income and lower income taxes, partly offset by increased Financing costs.
Adjusted basic EPS excludes the effects of restructuring and other costs, income tax-related adjustments, non-recurring gains and equity income related to real estate joint ventures, the long-term debt prepayment premium and the 2017 MTS net recovery. Adjusted basic EPS increased by $0.08 or 2.9% for the full year of 2018.
Reconciliation of adjusted basic EPS
Years ended December 31 ($) |
| 2018 |
| 2017 |
| Change |
|
|
| Applying IFRS 9 and IFRS 15 |
|
|
| ||
|
| (2017 adjusted) |
|
|
| ||
Basic EPS |
| 2.68 |
| 2.63 |
| 0.05 |
|
Add back (deduct): |
|
|
|
|
|
|
|
Restructuring and other costs, after income taxes, per share1 |
| 0.39 |
| 0.15 |
| 0.24 |
|
(Favourable) unfavourable income-tax related adjustments, per share |
| (0.01 | ) | 0.03 |
| (0.04 | ) |
Non-recurring gains and equity income related to real estate joint ventures, after income taxes, per share2 |
| (0.25 | ) | – |
| (0.25 | ) |
Long-term debt prepayment premium, after income taxes, per share |
| 0.04 |
| – |
| 0.04 |
|
MTS net recovery, per share |
| – |
| (0.04 | ) | 0.04 |
|
Adjusted basic EPS |
| 2.85 |
| 2.77 |
| 0.08 |
|
1 Includes our third quarter of 2018 committed donation to the TELUS Friendly Future Foundation of $0.15 per share after income taxes.
2 Includes equity income arising from the third quarter 2018 sale of TELUS Garden of $0.25 per share after income taxes.
· Dividends declared per Common Share totalled $2.10 in 2018, up 6.6% from 2017. On February 13, 2019, the Board declared a first quarter dividend of $0.5450 per share on the issued and out-standing Common Shares, payable on April 1, 2019, to shareholders of record at the close of business on March 11, 2019. The first quarter dividend increased by $0.04 per share or 7.9% from the $0.5050 per share dividend declared one year earlier, consistent with our multi-year dividend growth program described in Section 4.3 Liquidity and capital resources.
Liquidity and capital resource highlights
· Net debt to EBITDA – excluding restructuring and other costs was 2.54 times at December 31, 2018, down from 2.67 times at December 31, 2017, as the effect of the increase in EBITDA – excluding restructuring and other costs exceeded the effect of the increase in net debt. Excluding the third quarter of 2018 equity income related to real estate joint ventures of $171 million arising from the sale of TELUS Garden, the ratio was 2.62. (See Section 4.3 Liquidity and capital resources and Section 7.5 Liquidity and capital resource measures.)
· Cash provided by operating activities increased by $111 million in 2018 due to growth in EBITDA and lower restructuring and other costs disbursements, net of expense and Shares settled from Treasury. This was partly offset by other working capital changes and increased interest paid, which includes the long-term debt prepayment premium.
· Cash used by investing activities decreased by $666 million in 2018, attributed to lower cash payments for business acquisitions, lower capital expenditures and non-recurring real estate joint venture receipts, net of advances arising from the sale of TELUS Garden. Acquisitions decreased by $284 million in 2018 as we made larger cash payments for business acquisitions in 2017. Capital expenditures decreased by $180 million in 2018, primarily reflecting the planned reduction in our capital spend. We have made TELUS PureFibre available to 61% of our broadband footprint at December 31, 2018. (See Section 7.3 Cash used by investing activities.)
· Cash used by financing activities increased by $949 million in 2018, primarily reflecting lower issuances of long-term debt, net of redemptions and repayment, as well as Treasury shares acquired. (See Section 7.4 Cash used by financing activities.)
· Free cash flow increased by $231 million in 2018, largely resulting from higher Adjusted EBITDA and lower capital expenditures, partly offset by increased interest paid. (See calculation in Section 11.1 Non-GAAP and other financial measures.) The application of IFRS 15 reflects a non-cash accounting change. As such, the underlying economics and free cash flow generated by the business are not impacted by the change.
1.4 Performance scorecard
(key performance measures)
In 2018, we achieved three of four IFRS 15-translated consolidated targets, missing only the target for capital expenditures. Our original targets were announced on February 8, 2018 and were set excluding the impact of IFRS 15. On May 10, 2018, we announced equivalent targets that were translated to reflect the adoption of IFRS 15 herein referred to as the consolidated targets.
We achieved our consolidated revenue target, primarily due to growth in wireless network revenue resulting from growth in our wireless subscriber base. Additionally, we experienced increased wireline data service revenue resulting from increases in CCBS revenue inclusive of acquisitions, Internet and enhanced data service, TELUS Health revenue, TELUS TV revenue and revenue from our home and business security lines of business, partly offset by the ongoing decline in legacy wireline voice revenue. As well, we experienced increased equipment revenues from a higher volume of new postpaid contracts and higher-value smartphones in the sales mix of gross additions and retention units.
We met our Adjusted EBITDA target largely from higher wireless equipment margins and wireless network revenue growth driven by a growing customer base, in addition to growth in EBITDA contribution from our CCBS business. These factors were partly offset by increased costs associated with a growing wireless customer base and declines in wireline legacy voice services.
Our basic EPS fell within our target range, driven by higher Operating income and lower income taxes, partly offset by increased Financing costs.
Our capital expenditures in 2018 exceeded our consolidated target, as we made opportunistic capital expenditures prior to the year-end. We also continued to focus on investments in broadband infrastructure, including connecting more homes and businesses directly to our fibre-optic infrastructure, which resulted in TELUS PureFibre reaching 61% of our broadband footprint at year-end. These investments also support our systems reliability and operational efficiency and effectiveness, as well as our small-cell technology strategy to improve coverage and prepare for a more efficient and timely evolution to 5G.
Our capital structure financial policies and report on financing and capital structure management plans are described in Section 4.3.
The following scorecard compares TELUS’ performance to our consolidated 2018 targets. For information related to our 2018 targets, see Section 9 General trends, outlook and assumptions, and regulatory developments and proceedings.
SCORECARD |
| 2018 PERFORMANCE |
|
| ||
Consolidated |
| Consolidated targets2 and growth |
| Actual results and growth |
| Result |
Revenues |
| An increase of
|
| $14.37 billion |
| |
Adjusted EBITDA1 |
| An increase of
|
| $5.25 billion |
|
|
Basic EPS |
| An increase of
|
| $2.68 |
|
|
Capital expenditures
|
| Approx. $2.85 billion |
| $2.91 billion |
|
|
1 See description in Section 11.1 Non-GAAP and other financial measures. 2 Reflects the 2018 translated targets that were announced on May 10, 2018, to reflect the adoption of IFRS 15. The original 2018 targets were set on February 8, 2018 and were based on pre-IFRS 15 results. 2a The original target for Consolidated revenues excluding the impact of IFRS 15 was $13.835 to $14.100 billion, or an increase of 4 to 6%. 2b The original target for Consolidated Adjusted EBITDA excluding the impact of IFRS 15 was $5.105 to $5.230 billion, or an increase of 4 to 7%. 2c The original target for basic EPS excluding the impact of IFRS 15 was $2.53 to $2.68, or an increase of 3 to 9%.
|
|
| ||||
MD&A: INTRODUCTION
We made the following key assumptions when we announced the 2018 targets in February 2018.
ASSUMPTIONS FOR 2018 TARGETS AND RESULTS
|
· Our economic assumptions are based on a composite of estimates from Canadian banks and other sources. Our original assumptions for 2018 were: (i) slightly slower rate of economic growth in Canada of 2.2%, down from an estimated 3.1% in 2017; (ii) for our ILEC provinces in Western Canada, economic growth in B.C. of 2.5%, down from an estimated 3.4% in 2017, and economic growth in Alberta of 2.4%, down from an estimated 3.9% in 2017. In our MD&A for the first quarter of 2018, we revised our 2018 economic growth assumption to 2.1% for Canada. In our MD&A for the third quarter of 2018, we revised our 2018 economic growth assumptions to 2.2% for B.C. and 2.2% for Alberta. We currently estimate that economic growth for 2018 was 2.1% for Canada, 2.2% for B.C. and 2.2% for Alberta. · Our original assumption for restructuring and other costs was approximately $135 million. In our MD&A for the third quarter of 2018, we revised our assumption for restructuring and other costs upwards to approximately $300 million to account for the committed donation of $118 million to the TELUS Friendly Future Foundation and to support ongoing and incremental operational efficiencies and personnel-related costs. Our actual 2018 amount for restructuring and other costs was $317 million. · Our assumption for income taxes was computed at a statutory rate of 26.7 to 27.3% and cash income tax payments of approximately $170 million to $230 million. Our actual results were at a statutory income tax rate of 27.0% and cash income tax payments were $197 million. · Our assumption was for stabilization in the average Canadian dollar: U.S. dollar exchange rate, which was US$0.77 in 2017. The average Canadian dollar: U.S. dollar exchange rate was US$0.77 during 2018 and closed at US$0.73 on December 31, 2018. · Our assumption was that no wireless spectrum auctions were anticipated in 2018. We participated in a wireless residual spectrum auction in 2018 resulting in Cash payment for spectrum licences of $1 million in 2018.
Confirmed: · No material adverse regulatory rulings or government actions. · Continued intense wireless and wireline competition in both consumer and business markets. · An increase in wireless industry penetration of the Canadian market. · Ongoing subscriber adoption of, and upgrades to, data-intensive smartphones, as customers want more mobile connectivity to the Internet. · Wireless revenue growth resulting from growth in both postpaid subscriber loadings and blended ABPU. · Continued pressure on wireless acquisition and retention expenses, dependent on gross loading and customer renewal volumes, competitive intensity and customer preferences. · Continued growth in wireline data revenue, resulting from an increase in high-speed Internet and TELUS TV subscribers, speed upgrades and expanding broadband infrastructure, as well as CCBS and healthcare solutions. · Continued erosion of wireline voice revenues, resulting from technological substitution and greater use of inclusive long distance. · Continued focus on our customers first initiatives and maintaining our customers’ likelihood-to-recommend scores. · Pension plans: Defined benefit pension plan expense of approximately $97 million recorded in Employee benefits expense and approximately $14 million recorded in employee defined benefit plans net interest in Financing costs; a rate of 3.40% for discounting the obligation (2017 – 3.80%) and a rate of 3.50% for current service costs for employee defined benefit pension plan accounting purposes (2017 – 4.00%); and defined benefit pension plan funding of approximately $50 million. Actual results were: $95 million recorded in Employee benefits expense, $16 million recorded in employee defined benefit plans net interest, a rate of 3.90% for discounting the obligation, a rate of 3.50% for current service costs employee defined benefit pension plan accounting purposes, and defined benefit pension plan funding of $52 million. · Further investments in broadband infrastructure, including expanding our fibre-optic infrastructure and 4G LTE capacity expansion and upgrades, as well as investments in network and systems resiliency and reliability.
|
|
|
|
2 | Core business and strategy |
|
|
2.1 Core business
We provide a wide range of telecommunications products and services. Wireless products and services include network revenue (data and voice) and equipment sales arising from mobile technologies. Wireline products and services include data revenues (which include revenues from Internet protocol; television; hosting, managed information technology and cloud-based services; customer care and business services (CCBS) (formerly business process outsourcing); certain healthcare solutions; and home and business security), voice revenues, and other telecommunications services and equipment revenues. We earn the majority of our revenue from access to, and usage of, our telecommunications infrastructure, and from providing services and products that facilitate access to, and usage of, our infrastructure.
2.2 Strategic imperatives
Since 2000, we have maintained a proven national growth strategy. Our strategic intent is to unleash the power of the Internet to deliver the best solutions to Canadians at home, in the workplace and on the move.
We also developed six strategic imperatives in 2000 that remain relevant for future growth, despite changing regulatory, technological and competitive environments. We believe that a consistent focus on these imperatives guides our actions and contributes to the achievement of our financial goals. To advance these long-term strategic imperatives and address near-term opportunities and challenges, we confirm or set new corporate priorities each year, as further described in Section 3. Our six strategic imperatives are listed below.
· Focusing relentlessly on growth markets of data, IP and wireless
· Providing integrated solutions that differentiate TELUS from our competitors
· Building national capabilities across data, IP, voice and wireless
· Partnering, acquiring and divesting to accelerate the implementation of our strategy and focus our resources on core business
· Going to market as one team under a common brand, executing a single strategy
· Investing in internal capabilities to build a high-performance culture and efficient operation.
MD&A: CORE BUSINESS AND STRATEGY, AND CORPORATE PRIORITIES
|
|
3 | Corporate priorities |
|
|
We confirm or set new corporate priorities each year to advance TELUS’ long-term strategic imperatives (see Section 2.2) and address near-term opportunities and challenges. The following table provides a discussion of activities and initiatives that relate to our 2018 corporate priorities.
Honouring our team, customers and social purpose by delivering on our brand promise
· Each year, we conduct team member Pulsecheck engagement surveys to gather confidential team member feedback about TELUS as a place to work and to measure our progress in establishing a high-performance culture. Following each survey, business units and departments make use of their Pulsecheck results to review their current action plans and prioritize their ongoing actions. In 2018, our employee engagement score increased by 1 percentage point to 85%, elevating our high-performance culture and continuing to place our Company within the top 10% of all employers surveyed on a global basis. · In November 2018, the Commission for Complaints for Telecom-television Services (CCTS) issued its annual report for the 12-month period ended July 31, 2018, and TELUS again received the fewest customer complaints among the national carriers, while Koodo again received the fewest complaints among the national flanker brands. TELUS, Koodo and Public Mobile were the subjects of 6.6%, 2.5% and 1.0% of the total customer complaints accepted by the CCTS, respectively, or 10.1% of total customer complaints, in aggregate, when approximately 28% of Canadian wireless customers have chosen us as their wireless service provider. · As noted in Section 1.3, we committed to a donation of $118 million to the TELUS Friendly Future Foundation to help ensure vulnerable youth thrive in our digital society through better access to technology, health and educational opportunities. Of this $118 million, we have donated $101 million in 2018, including an initial donation of $100 million that was made in the third quarter of 2018 in TELUS Common Shares acquired in the market. The remainder of the committed donation is committed over a 10-year period. · On February 1, 2018, we were awarded the 2018 Best Sustainability Report in the Technology & Communications sector by the Finance and Sustainability Initiative. · We extended the reach of our Mobility for Good program in 2018 to Ontario and Alberta, and launched a pilot program in Quebec, in partnership with the Children’s Aid Foundation of Canada and Fondation du Centre Jeunesse. Mobility for Good provides qualifying youth transitioning from foster care with fully subsidized smartphones and data plans from TELUS, enabling them to stay connected to their vital support networks. · In November 2018, we expanded our Internet for Good program by participating in the federal government’s new Connecting Families initiative to help bridge the digital divide for Canadian families who may struggle to afford Internet access. Internet for Good provides access to low-cost high-speed Internet, training and tools to low-income families. · During 2018, we expanded our Health for Good program to Vancouver, Victoria and Calgary to provide healthcare to vulnerable and underserved Canadians by deploying specially equipped mobile health clinics into communities where frontline care is urgently needed. In September 2018, we announced a $5 million commitment to expand our Health for Good program nationally. · In September 2018, we were recognized for corporate social responsibility by being named to the Dow Jones Sustainability North America Index for the 18th consecutive year. Additionally, we were named to the Dow Jones Sustainability World Index for the third year in a row. · We continued to promote safe and responsible behaviour online through the delivery of TELUS Wise digital citizenship workshops to more than 52,000 youth, adults and seniors in 2018. We also continued our partnership with the WE organization and focused on our shared goal to #EndBullying. As part of our commitment to end bullying, we are asking citizens to join us in our mission to promote positive behaviour online by signing the TELUS Wise Digital Pledge. · Our customers’ likelihood-to-recommend scores improved year over year for Consumer Solutions and TELUS Health.
Leveraging our broadband networks to drive TELUS’ growth
· We continued to invest in our leading-edge broadband technology, which has enabled the success of our Internet, Optik TV and Pik TV offerings, business services, and Mobility solutions and helps ready our network for 5G deployment in the future. · Our 4G LTE infrastructure covered 99% of Canada’s population at December 31, 2018. · Our high-speed broadband footprint covered more than 3.1 million households and businesses in B.C., Alberta and Eastern Quebec at December 31, 2018, including approximately 1.89 million households and businesses covered with fibre-optic cable (representing 61% of our broadband footprint), providing these premises with immediate access to our gigabit-capable fibre-optic infrastructure. This is up from approximately 1.44 million households and businesses in 2017. · In OpenSignal’s State of Mobile Networks: Canada (February 2018) report, we were recognized as having the fastest 4G download speed and the fastest overall download speed. · In the J.D. Power 2018 Canadian Wireless Network Quality Study, TELUS was ranked Highest Wireless Network Quality Performance in Ontario for four years in a row and in the West (including British Columbia, Alberta, Saskatchewan and Manitoba) for three years in a row. · Based on data from the first half of 2018, followed by data from the second half of 2018, we won Ookla’s Mobile Speedtest Award for fastest mobile network in Canada for the second year in a row. Meanwhile, according to Ookla’s Speedtest Global Index for December 2018, TELUS ranked third in the word for the fastest mobile network, while Canada as a country also ranked third fastest behind Iceland and Norway.
|
Leveraging our broadband networks to drive TELUS’ growth (continued)
· In August 2018, we were ranked as having the fastest overall download speeds nationally for the second year in a row according to OpenSignal’s State of Mobile Networks: Canada (August 2018) report. Additionally, we were ranked first in LTE speeds in two key markets – Toronto and Montreal. · In PCMag’s Fastest Mobile Network Canada 2018 report released in September 2018, we were named as having the fastest mobile network nationally, for the second year in a row. We were also ranked as having the fastest network in certain markets across Canada, including Vancouver, Calgary, Edmonton, Winnipeg, Toronto, Ottawa, Montreal, Quebec and Halifax. Additionally, Koodo was recognized as having the best wireless plan in Canada. · We were recognized as providing Canadians with the best mobile video experience in OpenSignal’s State of Mobile Video (September 2018) report. · In February 2018, the Digital Technology Supercluster, with TELUS as the lead applicant, was one of the winners in the government of Canada’s Innovation Superclusters Initiative and will receive significant funding to further develop Canada’s strengths in data collection, analytics and visualization technologies for diverse industries. The Digital Technology Supercluster was officially launched in November 2018. · In April 2018, we became the first provider in Canada to offer 4K HDR content, which is available on Optik TV via Netflix and On Demand. 4K HDR dramatically enhances the picture quality of existing 4K technology by improving the colour contrast range with millions of additional colour options to each individual pixel. · Our Pik TV offering can now be accessed directly from an Internet browser, from Apple TV (fourth generation and above) or through our Android or iOS mobile applications, enabling streaming on computers, smartphones and tablets. Our Pik TV media box and its support for Google Play Store applications is now an optional, complementary component of the Pik TV experience. · In August 2018, we announced the debut of Travelxp 4K HDR, a global travel and lifestyle channel, available for Optik TV customers in B.C. and Alberta. This is the first time a network broadcasting 24/7 4K HDR has been available in Canada. Customers who do not yet have 4K HDR-capable TVs can still enjoy Travelxp in 4K, HD or standard definition. · In September 2018, we launched the Platinum wireless rate plan, which allows customers to obtain higher-tier handsets for a lower upfront payment. We also unveiled our Bring-It-Back upgrade program, which is available to existing customers on Premium, Premium Plus and Platinum plans, and to new customers activating on Platinum plans. The Bring-It-Back program allows customers to upgrade to higher-tier smartphones with lower upfront payments and, at the end of the term, choose to either return the device or repay the original Bring-It-Back program amount. · In May 2018, we expanded our voice over LTE (VoLTE) coverage across the province of Manitoba. · We launched TELUS SmartHome Security and TELUS Secure Business in B.C., Alberta and Saskatchewan, with TELUS SmartHome Security also offered in Eastern Quebec. TELUS SmartHome Security provides security and automation technology for residential customers. TELUS Secure Business offers security solutions that help small businesses run safely and smoothly through a suite of integrated smart automation, intrusion monitoring and video surveillance solutions. · In October 2018, we launched our first LTE-M low-power wide-area (LPWA) technology deployment, which delivers a strong wireless connection to IoT (Internet of Things) devices while requiring minimal power for each transmission, helping to prolong the battery life of connected devices. It will extend the reach of our 4G LTE infrastructure further for compatible devices, penetrate deeper into buildings and underground, and enable simpler and more cost-efficient connected solutions to run efficiently on battery power for years. · To provide customers with an improved wireless calling experience, as of October 2018, customers with a VoLTE-enabled phone will be able to place and receive calls using LTE technology instead of HSPA technology while roaming in the U.S. · Throughout the year, we made a series of announcements regarding the connection of additional homes and businesses to our TELUS PureFibre infrastructure, including: · Further investments of approximately $50 million to connect additional homes and businesses in Eastern Quebec by the end of 2021. These investments were made with support from the federal government’s Connect to Innovate program and the provincial government’s Québec branché program. With this support, we are continuing to deploy our TELUS PureFibre network in Eastern Quebec, which will connect more than 99% of Eastern Quebec homes and businesses by 2021 · An investment of $20 million within Port Moody, B.C. to connect by the end of 2020 · An investment of $65 million in the city of Delta, B.C., including Tilbury and Annacis Island · An investment of $45 million in the district of North Vancouver, B.C. · An investment of $110 million within Richmond, B.C., including Steveston, to connect by the spring of 2019 · An investment of $21 million within Langley City, B.C. to connect by the spring of 2019 · An investment of $8 million within Princeton, B.C. to connect by the end of 2019. · We have now connected more than 100 communities in the Greater Quebec City and Eastern Quebec region to our TELUS PureFibre infrastructure. · In December 2018, we launched Gigabit Internet and Internet 750/750, offering 1 Gps download and 940 Mbps upload speeds, and 750 Mbps symmetrical download and upload speeds, respectively. These plans are available to all TELUS PureFibre customers in Western Canada.
Fuelling our future through recurring efficiency gains
· We achieved efficiency gains to continue investing in our digital transformation, including conducting an urban trial, with a leading vendor, of 5G wireless-to-the-home service using customer premises equipment. · We took steps to simplify our organizational structure in order to drive better customer outcomes. This will allow us to leverage cross-country synergies by streamlining our workflows to stay ahead of growing business complexities. · We incurred incremental restructuring and other costs with the objective of improving our operating efficiency and effectiveness. Restructuring costs associated with the rationalization of administrative, channel and network real estate were recorded in Goods and services purchased. Employee-related restructuring costs for reorganizing and streamlining business processes, such as certain client care, marketing and support functions, were recorded in Employee benefits expense. Other costs for incremental external expense in connection with business acquisition or disposition activity were recorded in Goods and services purchased.
|
MD&A: CAPABILITIES
Driving emerging opportunities in TELUS Health and TELUS International
· In January 2018, we launched the TELUS Baby Health app, a free digital tool that can be used to create a health record for infants and as an educational resource for new and expecting parents. · In February 2018, we acquired WEBS Inc. with a view to broadening our portfolio of health benefit management solutions. · We completed the acquisition of a 65% interest in Xavient Information Systems, as noted in Section 1.3, which now operates as Xavient Digital – powered by TELUS International. With this acquisition, we have increased our ability to expand our global IT services offering with the addition of advanced, next-generation IT consulting and delivery capabilities, including artificial intelligence-powered digital transformation services, user interface/ user experience design, open source platform services, DevOps, and IT lifecycle services, in order to provide a more comprehensive suite of services, positioning us for future growth. · We acquired Medisys Health Group Inc., as noted in Section 1.3, with a view to enhancing our capability for delivering employee-centred workplace health and wellness services. · In August 2018, we launched the LivingWell Companion™, medical alert devices that enable more independent senior living and provide peace of mind to caregivers. The devices provide 24/7 access to a trained operator and fall detection support by calling emergency contacts and dispatching an ambulance where needed while relaying important health information on the senior’s behalf. · In September 2018, TELUS Health announced a partnership with Babylon, a British digital healthcare provider, to better connect patients with medical solutions through a digital healthcare smartphone app. This service will complement existing healthcare services across the country by delivering more options to Canadians for accessing quality healthcare and communicating more efficiently with healthcare practitioners from anywhere, at any time.
|
Our 2019 corporate priorities are provided in the table below.
2019 CORPORATE PRIORITIES
· Honouring our customers, communities and social purpose by our team delivering on our brand promise · Leveraging our broadband networks to drive TELUS’ growth · Fuelling our future through recurring efficiency gains · Driving emerging opportunities to build scale in TELUS Health and TELUS International.
|
|
|
4 | Capabilities |
|
|
The forward-looking statements in this section, including statements regarding our dividend growth program and our financial objectives in Section 4.3, are qualified by the Caution regarding forward-looking statements at the beginning of this MD&A.
4.1 Principal markets addressed and competition
WIRELESS PRODUCTS AND SERVICES FOR CONSUMERS AND BUSINESSES ACROSS CANADA
Our products and services
· Data and voice – Fast Internet access for video, social networking, messaging and mobile applications, including our new Optik TV app; Internet of Things (IoT) solutions (including machine-to-machine (M2M) connectivity); clear and reliable voice services; push-to-talk (PTT) solutions, including TELUS Link® service; and international roaming. · Devices – The latest smartphones, tablets, mobile Internet keys, mobile Wi-Fi devices, M2M modems, digital life devices and wearable technology, such as smart watches. · Suite of IoT solutions to support Canadian businesses locally and internationally, including asset tracking, fleet management, remote monitoring, digital signage and security.
|
WIRELESS PRODUCTS AND SERVICES FOR CONSUMERS AND BUSINESSES ACROSS CANADA
Our capabilities
· Licensed gross national wireless spectrum holdings averaging 160.8 MHz. · Coast-to-coast digital 4G LTE access technology: · Overall coverage of 99% of Canada’s population, with the LTE advanced (LTE-A) technology covering 93% of Canada’s population at December 31, 2018. Coverage includes domestic roaming agreements. · Coverage and capacity were enhanced with the deployment of the 700 MHz wireless spectrum licences acquired in 2014 and the deployment of the 2500 MHz wireless spectrum licences acquired in 2015. We plan to utilize other spectrum licences purchased in recent years in combination with unlicensed supplementary spectrum, as network and device ecosystems evolve. · Manufacturer’s rated download speeds: LTE-A, up to 1,100 Mbps; LTE, up to 150 Mbps; HSPA+, up to 42 Mbps. Average expected speeds: LTE-A, 12–250 Mbps; LTE, 12–45 Mbps; HSPA+, 4–14 Mbps.1 · Reverts to HSPA+ technology and speeds when customers are outside LTE coverage areas. · International voice and data roaming capabilities in more than 225 destinations.
Competition overview
· Facilities-based national competitors Rogers Wireless and Bell Mobility, as well as provincial or regionally focused telecommunications companies Shaw, Quebecor, SaskTel, Eastlink, Tbaytel and Xplornet. · Fixed wireless services. · Resellers of competitors’ wireless networks. · Services offered by cable-TV and wireless competitors over wireless and metropolitan Wi-Fi networks.
WIRELINE PRODUCTS AND SERVICES: RESIDENTIAL SERVICES IN BRITISH COLUMBIA, ALBERTA AND EASTERN QUEBEC; HEALTHCARE SOLUTIONS; BUSINESS SERVICES ACROSS CANADA; AND CUSTOMER CARE AND BUSINESS SERVICES (CCBS) SOLUTIONS OFFERED INTERNATIONALLY
Our products and services
· Voice – Reliable fixed phone service with long distance and advanced calling features; voice over IP (VoIP) supporting voice services into the future. · Internet – TELUS PureFibre, which covers 61% of our broadband footprint at December 31, 2018. Fixed high-speed Internet access (HSIA) service with email and a comprehensive suite of security solutions. Also includes HSIA over LTE, with reliable Wi-Fi, and cloud storage. TELUS offers multiple plans, including 1 Gbps download and 940 Mbps upload speeds, and 750 Mbps symmetrical download and upload speeds. · TELUS TV – High-definition entertainment service with Optik TV and Pik TV. Optik TV offers extensive content options, including 4K HDR TV, On Demand content and Netflix, as well as 4K entertainment, such as live TV, On Demand content, Netflix and YouTube. Optik TV also delivers innovative features, including a wireless digital box, large PVR capacity and the ability to restart live TV in progress or from the past 30 hours. In addition, our Optik TV app allows customers to watch live TV, set recordings and access On Demand content from a smartphone, tablet or computer. Pik TV delivers a streamlined offer for customers through our Pik TV media box or Apple TV, and is also accessible through an Internet browser or our Android or iOS mobile applications. Pik TV embraces the changing environment where content is increasingly available from over-the-top (OTT) services (see Section 3 for further information). · IP connectivity for businesses – Converged voice, video and data services and Internet access, offered on a high-performing network. Also includes software-defined wide area network (SD-WAN) offerings. · Cloud and managed IT services – Suite of hybrid IT solutions provides traditional and cloud technologies, network connectivity, security, managed IT and cloud advisory services. · Security consulting and managed services – Cloud and on-premises solutions ensuring security for data, email, websites, networks and applications. · Unified Communications conferencing and collaboration – Full range of equipment and application solutions, including Unified Communications as a Service (UCaaS), to support meetings and webcasts by means of phone, video and Internet. · CCBS solutions, IT and digital business services through TELUS International. With more than 32,000 employees operating in 10 countries across North and Central America, Asia, and Europe, supporting customers in more than 40 languages, TELUS International offers voice and non-voice customer interaction services, and designs, builds and delivers next-generation digital solutions covering digital transformation, IT lifecycle, advisory and digital consulting, risk management, and back-office support. These solutions and services are provided across the technology, financial services, communications, gaming, travel/hospitality and healthcare industries.
1 Network speeds vary with location, signal and customer device. Compatible device required.
|
MD&A: CAPABILITIES
Our products and services
· Healthcare – TELUS Health’s services, including pharmacy management, electronic medical records (EMR) and mobile EMR, electronic health records, drug information systems, regional clinical information systems, personal health record systems, remote patient monitoring, online settlement claims management solutions, e-prescribing services, TELUS Health Exchange Platform and MedDialog, as well as employee wellness, comprehensive primary care, and workplace health and well-being services. · Fixed wireless services – HSIA over LTE and wireless home phone. · Home and business security – Real-time 24/7 central monitoring station, guard response service (where available), and wireless and hard-wired security accessibility, integrated with smart devices, such as cameras and sensors. These services are part of enabling smart homes and businesses through deploying evolving technology solutions such as home health monitoring, which was implemented in B.C. in 2018.
Our capabilities
· High-speed broadband footprint covered more than 3.1 million households and businesses in B.C., Alberta and Eastern Quebec at December 31, 2018. · Ongoing connection of households and businesses directly to fibre-optic cable; approximately 1.89 million households and businesses covered with TELUS PureFibre in B.C., Alberta and Eastern Quebec at December 31, 2018, and we have reached 61% of our broadband footprint. · Broadcasting distribution licences allowing us to offer digital television services in incumbent territories, as well as licences to offer commercial video-on-demand services. · Security technology to support central monitoring and guard response service (where available), integrated with automated smart devices. Field services capabilities to install, upgrade and repair security technology at customers’ premises. · An IP-based national network overlaying an extensive switched network in B.C., Alberta and Eastern Quebec, as well as global interconnection arrangements. · Eight data centres in six communities directly connected to the national TELUS IP network, creating an advanced and regionally diverse computing infrastructure in Canada. · Access to businesses across Canada through our network, as well as competitive local exchange carrier status. · CCBS solutions, next-generation IT and digital business services with global delivery capabilities through our multinational, multi-language programs, supported by more than 32,000 employees across North America, Asia, Europe and Central America, as at December 31, 2018. · Technology solutions to assist health regions, hospitals, insurers, consumers and employers; also to improve connectivity and collaboration among healthcare providers, including physicians, nurses, pharmacists and physiotherapists.
Competition overview
· Cable-TV competitors for Internet and entertainment services, such as Shaw Communications (in B.C. and Alberta) and Cogeco Cable and Videotron (in Eastern Quebec). · Substitution of wireless services, including our own wireless offerings, for residential local and long distance services. The percentage of households with wireless-only telephone services (among all providers, including TELUS) is estimated to be 48% in B.C. and Alberta, and 19% in Eastern Quebec in 2018, compared to 45% and 18%, respectively, in 2017. · Allstream Inc., a national telecommunications service provider for business customers, owned by Zayo Group Holdings Inc., a U.S.-based provider of communications infrastructure services. Our national telecommunications competitors Rogers Communications Inc. and BCE Inc. also offer telecommunications services for business and enterprise customers. · Various others offering VoIP-based local and long distance, as well as Internet and data services, or reselling those services. · OTT and direct-to-consumer voice and/or entertainment services, such as Skype, Netflix, Amazon Prime Video, CBS All Access and YouTube. · Satellite-based entertainment and Internet services offered by Bell Canada, Shaw Communications and Xplornet. · Competitors to our CCBS business include customized managed outsourcing solutions competitors, such as system integrators CGI Group Inc., EDS division of HP Enterprise Services and IBM. Competitors for contact centre and IT digital services include companies such as Convergys, Teleperformance, Sykes, Atento, Genpact and Sitel. · Fixed wireless services. · Competitors for TELUS Health include providers of EMR and pharmacy management products, such as Omnimed, Familiprix, Medfar, Fillware, ARI and Logipharm. Competitors also include systems integrators; health service providers, such as Loblaws, McKesson and the Jean Coutu Group, that have also become vertically integrated and own a mix of health services delivery, IT solutions and related services; and potentially, global providers, such as EPIC and Cerner, that could achieve expanded Canadian footprints. Competitors for TELUS Health’s corporate and preventative health service offerings include Medcan, Cleveland Clinic, Dialogue and Wellpoint. · Competitors for home and business security range from local to national companies, such as ADT, Chubb-Edwards, Stanley Security, Fluent Home and Brinks Home Security.
|
4.2 Operational resources
RESOURCES
|
Our team
|
· Approximately 58,000 employees at the end of 2018, with 26,000 employees located in Canada and 32,000 employees located internationally. · Approximately 9,480 of our employees are covered by collective agreements. The agreement with the Telecommunications Workers Union (TWU), United Steel Workers Local Union 1944, which covers approximately 8,060 employees, expires on December 31, 2021. The agreement with the Syndicat québécois des employés de TELUS (SQET), which covers approximately 740 employees, expires on December 31, 2022. The agreement with the Syndicat des agents de maîtrise de TELUS (SAMT), which covers approximately 625 employees in the TELUS Quebec region, expires on March 31, 2022. Our TELUS Sourcing Solutions Inc. subsidiary is signatory to a collective agreement with the B.C. Government and Services Employees’ Union, which covers less than 100 employees and expires on April 30, 2019. · Operations at Canadian and international locations to support CCBS solutions and digital business services for external customers, as well as for certain internal functions. · Employee compensation programs that support a high-performance culture and contain market-driven and performance-based components (bonus and share-based compensation) to attract and retain key employees. · Succession management and talent reviews for our team continue to cover attrition and ongoing sourcing strategies for ready access to labour in Canada, with competition for talent in specialized or emerging skill areas presenting a challenge. To address this challenge, we continue with an innovative sourcing strategy to proactively attract and engage candidates. Additionally, for our CCBS solutions, we have ready access to labour in the U.S. for management and support positions, and in various international locations for contact centres. We also use external contractors and consultants. · Learning and development programs to improve employee engagement levels and enhance our customers’ experiences.
|
Our brand and distribution channels
|
· TELUS – A national telecommunications company providing a wide range of telecommunications services and products, including wireless and wireline voice and data, with a well-established and recognizable brand (TELUS, the future is friendly). · Koodo Mobile® – A national provider of postpaid and prepaid wireless voice and data services with a broad distribution network, including TELUS-owned stores, dealers and third-party electronics retailers. · Public Mobile – A prepaid wireless service provider with a distribution channel that is primarily web-based, providing customers with a SIM-only service. · Optik TV brand, launched in mid-2010. Pik TV brand, launched in mid-2017. · TELUS PureFibre, our next-generation fibre-optic network. · TELUS Health, a national provider of telehomecare, electronic medical and health records, consumer health, benefits management, pharmacy management and preventive healthcare services. · TELUS SmartHome Security – Our brand offering security services for residential customers, launched in mid-2018. · TELUS Secure Business – Our brand offering security services for businesses, launched in mid-2018. · Our sales and support distribution channels: · Wireless services are supported through a broad network of TELUS-owned and branded stores, including our 50% ownership of the kiosk channel WOW! Mobile, an extensive distribution network of exclusive dealers and large third-party electronics retailers (e.g. Best Buy, Walmart and London Drugs), as well as online self-serve applications, mass marketing campaigns and customer care telephone agents. · Wireline residential services are supported through TELUS-owned and branded stores, including third-party electronics retailers, as well as mass marketing campaigns, customer care telephone agents, and online and TV-based self-serve applications. · Through telus.com, we sell both wireless and wireline products and services online. We also provide online account management tools, enabling wireless and wireline customers to manage their accounts through our website or mobile applications. · TELUS Health provides some of its consumer services – personal health records and home health monitoring – in partnership with provincial governments. · Business services, including healthcare, across wireless and wireline are supported through certain dedicated stores for business, TELUS sales representatives, product specialists, independent dealers and online self-serve applications for small and medium-sized businesses. CCBS solutions and digital business services are supported through sales representatives and client relationship management teams. · Dedicated direct-to-consumer channel with approximately 500 field sales agents.
|
MD&A: CAPABILITIES
RESOURCES
|
Our technology, systems and properties
|
· We are a technology-enabled company with a multitude of IT systems and processes. We are focused on driving innovation and making generational investments to deliver state-of-the-art broadband solutions in an increasingly digital society. · Wireless broadband infrastructure – In 2012, we launched our 4G LTE wireless technology capable of speeds of up to 110 Mbps, and today, our wireless technology covers 99% of Canada’s population. Our LTE technology allows customers to take advantage of the newest mobile devices and enjoy a seamless experience across their multiple devices. In 2015, we launched the newest LTE advanced (LTE-A) network technology and have been working to expand our LTE capabilities with this technology ever since. In April 2016, we enhanced our LTE-A technology with the first global implementation of frequency division duplex (FDD) 4x4 multiple-input-multiple-output (MIMO) technology. We implemented another key enhancement to our LTE-A infrastructure in June 2017 by introducing quad-band LTE-A carrier aggregation technology – this technology covers 92% of Canada’s population and enables theoretical peak speeds of 1.1 Gbps. See Leveraging our broadband networks to drive TELUS’ growth in Section 3 Corporate Priorities for additional information. · In 2014, we deployed a centralized radio access technology (C-RAN) in Vancouver and, in 2016, launched voice over LTE (VoLTE) service in B.C. and Alberta communities. Both deployments were key transformations in our wireless capabilities. We were also the first national operator to provide high-speed Internet service over our LTE infrastructure for rural customers in B.C., Alberta and Quebec through our Smart Hub wireless Internet solution. Today, we serve nearly 60,000 households in rural Canada that do not have the same level of access to broadband service. · We have made significant investments in heterogeneous network (HetNet) technology, one of the key building blocks for 5G. HetNet combines multiple types of cells, such as outdoor macro cells and microcells, as well as indoor pico cells, to enhance coverage and capacity in crowded urban areas and inside buildings. By taking continuous strides to evolve our small cell technology concurrent with the evolution of network technologies to LTE-A pro (i.e. 4.5G), in 2017, we became the first operator in Canada to introduce licensed assisted access (LAA) small cells for both outdoor and indoor environments, capable of speeds up to 970 Mbps. In 2018, we continued advancing LAA technology with the fastest speeds in Canada, up to 1.1 Gbps. · In 2018, we became the first operator globally to introduce LTE FDD Massive MIMO 32TRx technology on the B7 band as part of the LTE-A pro technology evolution. This technology will further enhance the capacity of our wireless infrastructure and enable a stronger customer experience. · Wireline broadband infrastructure – Our investments to deploy our gigabit-enabled TELUS PureFibre technology have brought fibre-optic connectivity deeper into our infrastructure and directly to homes and businesses. At the end of 2018, 1.89 million homes and businesses in communities across B.C., Alberta and Quebec had access to ultra-fast, symmetrical 150/150 and 750/750 Internet download and upload speeds with TELUS PureFibre. Over 100 communities now also have 1 Gbps and 750 Mbps Internet service tier options available to them. Recognizing the need for highly reliable, high-capacity connectivity with low latency to support emerging services such as virtualized networks and Internet of Things (IoT) applications, we have also begun rolling out a next-generation nationwide optical backbone network capable of 400 Gbps per channel with automated self-healing and the ability to turn up network capacity on demand. · We started the next evolution of our wireline IP and optical core/edge technology, collapsed metro architecture, and initial deployments will continue over three years. This architecture enables a number of future requirements to support 5G and network growth, including significant per-port cost improvement, the ability to leverage software-defined networking (SDN) and network function virtualization (NFV), and improved network and service resiliency. · We completed Phase 1 of our third-generation national dense wavelength division multiplexing (DWDM) T transport backbone (packet transport 3.0) CDC (colourless, directionless and contentionless) network overlay, connecting Alberta and Ontario. This architecture will allow network growth without the need for costly re-generation, enable optimal optical rerouting during a fibre cut and reduce network growth costs. The second phase of the build began in 2018, with anticipated completion in 2019, and the final stage is set to be completed in 2020. · We advanced our converged voice evolution strategy with the launch of our enhanced home phone service and small business voice services. These services leverage the capabilities of the TELUS PureFibre infrastructure and will serve as a foundation for new services in conjunction with our wireless technology. · We have continued to innovate for our customers through our Optik TV and Pik TV platforms. In 2018, we introduced HDR (high dynamic range) colour capability to our 4K Optik TV customers, making us the first operator in Canada to deliver 4K/HDR video across live TV, video-on-demand and Netflix services. We also launched an Apple TV application for Pik TV and gave customers the option to purchase Pik TV using only a web browser. By investing in the cloudification of video infrastructure and innovative applications, we will continue to advance our priority of enabling “anytime, everywhere” content and entertainment, thereby continuing to deliver an exceptional customer experience. · In 2018, we also launched TELUS Boost Wi-Fi, a network of boosters that extends the reach of strong and reliable in-home Wi-Fi signals. · Real estate – Our network facilities are constructed under or along streets and highways, pursuant to rights-of-way granted by the owners of land, including municipalities and the Crown, or on freehold land we own. · Our real estate properties (owned or leased) also include administrative office spaces, work centres and space for telecommunications equipment. Some buildings are constructed on leasehold land and the majority of wireless radio antennae are on towers that are situated on lands or are on buildings held under leases or licences with varying terms. We also participate in two real estate joint ventures. (See Section 7.11.)
|
RESOURCES
|
Our technology, systems and properties
|
· Intangible assets – Our intangible assets include wireless spectrum licences from Innovation, Science and Economic Development Canada (ISED), which are essential to providing wireless services. We have assets averaging 160.8 MHz nationally. We have deployed 700 MHz, 2300 MHz, 2500 MHz, 1900 MHz, AWS-1, AWS-3 and 850 MHz spectrum to evolve our wireless infrastructure and will look to the introduction of new bands that will enable the realization of 5G technology. We intend to continue acquiring spectrum within the rules set out by ISED to meet our future capacity requirements. · Intellectual property, which we own or which we have been granted the right to use, is also an essential asset for us. Intellectual property enables us to be known and recognized in the marketplace through our brand style, trade dress, domain names and trademarks. It protects our know-how and software, systems, processes and method of doing business through copyrights, patents and information treated as confidential. It also helps us to increase our competitiveness by fostering an innovative work environment. Each form of intellectual property is important to our success. For instance, the TELUS brand plays a key role in product positioning and our Company’s reputation. We aim to maximize the value of our intangible assets in the areas of innovation and invention by ensuring that they are adequately used, protected and valued. To protect our intellectual property assets, we rely on a combination of legal protections afforded under copyright, trademark, patent and other intellectual property laws, as well as contractual provisions under licensing arrangements. Further information on recognized tangible and intangible properties can be found in Section 8.1 Critical accounting estimates and judgments. · Our broadcasting distribution licences enable us to provide entertainment services. See Broadcasting-related issues in Section 9.4 describing developments relating to these licences. · Future technologies, TELUS Health and TELUS International – In addition to evolving our existing wireless and wireline infrastructure, we are investing in the technologies of the future that will serve as the foundation to provide next-generation services to Canadians. By way of example, we are building the next generation of 5G wireless technologies and capitalizing on the promise of convergent wireless and wireline network technologies. As mobile operators globally work to develop 5G, we have achieved groundbreaking wireless speeds of nearly 30 Gbps – 200 times faster than today’s LTE standard – in our Living Lab. In 2017, we broke new ground by piloting 5G wireless-to-the-premises (WTTx) technology and achieved 2 Gbps download speeds in a live-environment test using 3.5 GHz spectrum. · In 2018, we achieved the first 3GPP-based 5G non-standalone (NSA) technology field trial in HetNet architecture in Canada, which included both outdoor macro cells on 3.5 GHz spectrum and 28 GHz spectrum microcells. We also demonstrated a number of 5G experience use cases including live video distribution, face identification, and home security during the seventh next generation mobile networks (NGMN) Industry Conference & Exhibition held in Vancouver in November 2018. These are key milestones in our ongoing effort to unleash the benefits of 5G for Canadians. · We continue to invest in enabling systems such as our Jasper connected device platform (CDP) and our dedicated machine-to-machine virtual evolved packet core (M2M vEPC) to support IoT applications, where the ease of onboarding partners is crucial for emerging services such as connected vehicles, fleet management and more. · In 2017, we launched our Network as a Service (NaaS) solution, the first Canadian NFV infrastructure that will power the virtualized networks of the future and enable Canadian businesses to better serve their customers with improved total cost of ownership. Looking ahead, we will continue on our journey of network virtualization in support of bringing services to customers faster. · In 2018, we deployed our LTE-machine (LTE-M) technology across Canada. LTE-M is a low-power wide area network (LPWAN) technology, which is ideal for IoT because it supports large numbers of devices that transmit infrequent, short bursts of data, like IoT sensors. It will enable a plethora of IoT applications through long-range connectivity, extended battery life and carrier-grade security and quality of service. · Through TELUS Health’s services – such as pharmacy management, electronic medical records (EMRs) (including mobile EMRs), electronic health records, personal health records, clinical information systems, remote patient monitoring, virtual care and online claims settlement management software solutions, including the online renewal of prescriptions, e-prescribing services and MedDialog – TELUS Health facilitates the integration of electronic health records from the home to the doctor’s office to the hospital, making critical health information available to healthcare providers over our wireless and wireline broadband network. · Through TELUS International, we continue to provide a wide array of products and services, as described in Section 4.1. These services are provided from facilities located in North America, Asia, Europe and Central America.
|
4.3 Liquidity and capital resources
Capital structure financial policies
Our objective when managing capital is to maintain a flexible capital structure that optimizes the cost and availability of capital at acceptable risk.
In the management of capital and in its definition, we include Common Share equity (excluding Accumulated other comprehensive income), Long-term debt (including long-term credit facilities, commercial paper backstopped by long-term credit facilities and any hedging assets or liabilities associated with Long-term debt items, net of amounts recognized in Accumulated other comprehensive income), Cash and temporary investments, and short-term borrowings arising from securitized trade receivables.
We manage our capital structure and make adjustments to it in light of changes in economic conditions and the risk characteristics of our business. In order to maintain or adjust our capital structure, we may adjust the amount of dividends paid to holders of Common Shares, purchase Common Shares for cancellation pursuant to normal course issuer bid (NCIB) programs, issue new shares, issue new debt, issue new debt to replace existing debt with different characteristics, and/or increase or decrease the amount of trade receivables sold to an arm’s-length securitization trust.
We monitor capital utilizing a number of measures, including our net debt to EBITDA – excluding restructuring and other costs ratio, coverage ratios and dividend payout ratios. (See definitions in Section 11.1 Non-GAAP and other financial measures.)
MD&A: CAPABILITIES
Financing and capital structure management plans
REPORT ON FINANCING AND CAPITAL STRUCTURE MANAGEMENT PLANS
|
Pay dividends to the holders of Common Shares under our multi-year dividend growth program
|
· In May 2016, we announced our intention to target ongoing semi-annual dividend increases, with the annual increase in the range of 7 to 10% from 2017 through to the end of 2019, thereby extending the policy first announced in May 2011. Notwithstanding this target, dividend decisions will continue to be subject to our Board’s assessment and the determination of our financial position and outlook on a quarterly basis. Our long-term dividend payout ratio guideline is 65 to 75% of prospective net earnings per share. (See Section 7.5 Liquidity and capital resource measures.) There can be no assurance that we will maintain a dividend growth program or that it will be unchanged through 2019. (See Caution regarding forward-looking statements – Ability to sustain our dividend growth program through 2019 and Section 10.7 Financing, debt requirements and returning cash to shareholders.) · Dividends declared in 2018 totalled $2.10 per share, an increase of $0.13 per share or 6.6% compared to the dividends declared in 2017. On February 13, 2019, the Board declared a first quarter dividend of $0.5450 per share, payable on April 1, 2019, to shareholders of record at the close of business on March 11, 2019. The first quarter dividend for 2019 reflects a cumulative increase of $0.04 per share or 7.9% from the $0.5050 per share dividend declared one year earlier. · During 2018, our dividend reinvestment and share purchase plan trustee purchased from Treasury approximately 1.8 million dividend reinvestment Common Shares for $85 million, with no discount applicable.
|
Purchase Common Shares
|
· In August 2018, we received approval from the Toronto Stock Exchange (TSX) to amend our 2018 NCIB expiring on November 12, 2018, to permit TELUS Communications Inc., a direct wholly owned subsidiary of TELUS Corporation, to purchase Common Shares with an aggregate fair market value of up to $105 million for donation to the TELUS Friendly Future Foundation. All other terms of the 2018 NCIB remained unchanged except that the maximum number of shares that can be purchased during the same trading day on the TSX was 238,480 shares (being 25% of the average daily trading volume for the six months ended July 31, 2018, which was equal to 953,922 shares), subject to certain exemptions for block purchases. · Under the 2018 NCIB, in August and September 2018, TELUS Communications Inc. purchased approximately 2.1 million Common Shares in aggregate in the market for $100 million, and donated the Shares on a timely basis shortly thereafter to the TELUS Friendly Future Foundation. · In December 2018, we received approval from the TSX for a new 2019 NCIB to purchase and cancel up to 8 million Common Shares for consideration of up to $250 million over a 12-month period, from January 2, 2019, to January 1, 2020, through the facilities of the TSX, the New York Stock Exchange, and alternative trading platforms or as otherwise permitted by applicable securities laws. TELUS will purchase Common Shares only when and if we consider it opportunistic, subject to any purchases that may be made under an automatic share purchase plan (ASPP). As of February 14, 2019, we have not had any transactions pursuant to our 2019 NCIB. · We may also enter into an ASPP with a broker for the purpose of permitting us to purchase our Common Shares under our NCIB at times when we would not be permitted to trade in our shares, including regularly scheduled quarterly blackout periods. Such purchases will be determined by the broker in its sole discretion based on parameters that we have established prior to any blackout period, in accordance with TSX rules and applicable securities laws. The ASPP has been approved by the TSX and may be implemented from time to time in the future.
|
Use proceeds from securitized trade receivables (Short-term borrowings), bank facilities and commercial paper as needed, to supplement free cash flow and meet other cash requirements
|
· Our issued and outstanding commercial paper was $774 million at December 31, 2018, all of which was denominated in U.S. dollars (US$569 million), compared to $1,140 million (US$908 million) at December 31, 2017. · Our net draws on the TELUS International (Cda) Inc. credit facility were $427 million ($419 million net of unamortized costs) at December 31, 2018, compared to $346 million ($339 million net of unamortized issue costs) at December 31, 2017. · Proceeds from securitized trade receivables were $100 million at December 31, 2018, unchanged from December 31, 2017.
|
Maintain compliance with financial objectives
|
Certain of our current financial objectives will be reviewed in 2019 for possible revision due to changes arising from the adoption of new accounting standards, notably IFRS 16, Leases. (See Section 8.2 Accounting policy developments.) · Maintain investment grade credit ratings in the range of BBB+ or the equivalent – On February 14, 2019, investment grade credit ratings from the four rating agencies that cover TELUS were in the desired range. (See Section 7.8 Credit ratings.) · Net debt to EBITDA – excluding restructuring and other costs ratio of 2.00 to 2.50 times – As measured at December 31, 2018, the ratio was 2.54 times, outside of the objective range, primarily due to the funding of spectrum licences acquired in wireless spectrum auctions held during 2014 and 2015, and the elevated strategic capital investments in our fibre-optic infrastructure. Given the cash demands of upcoming spectrum auctions, the assessment of the guideline and return to the objective range remains to be determined; however, it is our intent to return to a ratio below 2.50 times in the medium term, consistent with our long-term strategy. (See Section 7.5 Liquidity and capital resource measures.) Excluding the equity income related to real estate joint ventures of $171 million arising from the sale of TELUS Garden in the third quarter of 2018, the ratio was 2.62 at December 31, 2018. · Dividend payout ratio of 65 to 75% of net earnings per share on a prospective basis – Our objective range is on a prospective basis. The dividend payout ratio we present in this MD&A is a historical measure utilizing the last four quarters of dividends declared and earnings per share, and is disclosed for illustrative purposes in evaluating our target guideline. As at December 31, 2018, the historical ratio of 78% and the adjusted historical ratio of 81% exceeded the objective range; however, we currently expect that we will be within our target guideline when considered on a prospective basis within the medium term. (See Section 7.5 Liquidity and capital resource measures.) · Generally maintain a minimum of $1 billion in unutilized liquidity – As at December 31, 2018, our unutilized liquidity on a consolidated basis was approximately $2.1 billion. (See Section 7.6 Credit facilities.)
|
Financing and capital structure management plans for 2019
At the end of 2018, our long-term debt (excluding unamortized discount) was $14.2 billion and the weighted average term to maturity was approximately 12.2 years (excluding commercial paper, the revolving component of the TELUS International (Cda) Inc. credit facility and finance leases). Our weighted average interest rate on long-term debt (excluding commercial paper, the revolving component of the TELUS International (Cda) Inc. credit facility and finance leases) was 4.18% at December 31, 2018, the same as one year earlier. Aside from Short-term borrowings of $100 million, commercial paper of $774 million (US$569 million), the utilized revolving component of the TELUS International (Cda) Inc. credit facility of $273 million (US$200 million) and finance leases of $102 million, all of our debt was on a fixed-rate basis.
During 2019, we may issue senior Notes to fund spectrum purchases, accelerate future debt by prepaying certain Notes, refinance maturing debt or use for general corporate purposes. Anticipated free cash flow and sources of capital are expected to be more than sufficient to meet requirements. For the related risk discussion, see Section 10.7 Financing, debt requirements and returning cash to shareholders.

4.4 Disclosure controls and procedures and changes in internal control over financial reporting
Disclosure controls and procedures
Disclosure controls and procedures are designed to provide reasonable assurance that all relevant information is gathered and reported to senior management, including the President and Chief Executive Officer (CEO) and the Executive Vice-President and Chief Financial Officer (CFO), on a timely basis so that appropriate decisions can be made regarding public disclosure.
The CEO and the CFO have assessed the effectiveness of our disclosure controls and procedures related to the preparation of this MD&A and the December 31, 2018, Consolidated financial statements. They have concluded that our disclosure controls and procedures were effective, at a reasonable assurance level, in ensuring that material information relating to TELUS and its consolidated subsidiaries would be made known to them by others within those entities, particularly during the period in which the MD&A and the Consolidated financial statements were being prepared.
Internal control over financial reporting
Internal control over financial reporting is a process designed to provide reasonable assurance regarding the reliability of financial reporting and the preparation of financial statements in accordance with IFRS-IASB and the requirements of the Securities and Exchange Commission in the United States, as applicable. TELUS’ CEO and CFO have assessed the effectiveness of our internal control over financial reporting as of December 31, 2018, in accordance with the criteria established in Internal Control – Integrated Framework (2013), issued by the Committee of Sponsoring Organizations of the Treadway Commission (COSO). Based on this assessment, TELUS’ CEO and CFO have concluded that our internal control over financial reporting is effective as of December 31, 2018, and have certified TELUS’ annual filings within our annual report on Form 40 F, as required by the United States’ Sarbanes-Oxley Act of 2002, and TELUS’ Annual Information Form, as required by National Instrument 52-109 Certification of Disclosure in Issuers’ Annual and Interim Filings.
Deloitte LLP, our auditor, has audited our internal control over financial reporting as of December 31, 2018.
Changes in internal control over financial reporting
There were no changes in internal control over financial reporting that have materially affected, or are reasonably likely to materially affect our internal control over financial reporting in 2018.
MD&A: DISCUSSION OF OPERATIONS
|
|
5 | Discussion of operations |
|
|
This section contains forward-looking statements, including those with respect to average billing per subscriber unit per month (ABPU) and average revenue per subscriber unit per month (ARPU) growth, wireless trends regarding loading and retention spending, high-speed Internet subscriber growth and various future trends. To support the transition to the new accounting standard, we believe ABPU provides management, investors and analysts with useful information to assess and evaluate our performance excluding the effects of implementing IFRS 15. ABPU represents the average monthly wireless network revenue derived from monthly service plan, roaming and usage charges, as well as monthly re-payments of the outstanding device balance owing from customers on contract (see Section 11.2 Operating indicators). There can be no assurance that we have accurately identified these trends based on past results or that these trends will continue. See Caution regarding forward-looking statements at the beginning of this MD&A.
5.1 General
A significant judgment we make is in respect of distinguishing between our wireless and wireline operations and cash flows (and this extends to allocations of both direct and indirect expenses and capital expenditures). The clarity of such distinction has been increasingly affected by the convergence and integration of our wireless and wireline telecommunications infrastructure and technology. The continued build-out of our technology-agnostic fibre-optic infrastructure, in combination with converged edge technology, has significantly affected this judgment, as has the commercialization of fixed-wireless telecommunications solutions for customers and the consolidation of our non-customer facing operations. As a result, it has become increasingly impractical and difficult to objectively and clearly distinguish between our wireless and
wireline operations and cash flows. As we do not currently aggregate operating segments, our reportable segments as at December 31, 2018, are also wireless and wireline. Segmented information in Note 5 of the Consolidated financial statements is regularly reported to our Chief Executive Officer (CEO) (our chief operating decision-maker).
We applied IFRS 9 and IFRS 15, both with a transition date of January 1, 2018, with retrospective application. Refer to Section 8.2 Accounting policy developments in this MD&A and Note 2 of the Consolidated financial statements for further information. In the following table, the selected information presented below excluding IFRS 9 and IFRS 15 has been derived from, and should be read in conjunction with, the audited consolidated financial statements of TELUS Corporation dated December 31, 2017.
Selected annual information
Years ended December 31 ($ in millions, except per share amounts) |
| 2018 |
| 2017 |
| 2017 |
| 2016 |
|
|
|
|
|
|
|
|
|
|
|
|
| Applying IFRS 9 and IFRS 15 |
| Excluding IFRS 9 and |
| ||||
|
| (2017 adjusted) |
| IFRS 15 |
| ||||
Operating revenues |
| 14,368 |
| 13,408 |
| 13,304 |
| 12,799 |
|
Net income |
| 1,624 |
| 1,578 |
| 1,479 |
| 1,236 |
|
Net income attributable to Common Shares |
| 1,600 |
| 1,559 |
| 1,460 |
| 1,223 |
|
Net income per Common Share |
|
|
|
|
|
|
|
|
|
Basic earnings per share |
| 2.68 |
| 2.63 |
| 2.46 |
| 2.06 |
|
Diluted earnings per share |
| 2.68 |
| 2.63 |
| 2.46 |
| 2.06 |
|
Cash dividends declared per Common Share |
| 2.10 |
| 1.97 |
| 1.97 |
| 1.84 |
|
|
|
|
|
|
|
|
|
|
|
At December 31 ($ millions) |
| 2018 |
| 2017 |
| 2017 |
| 2016 |
|
|
| Applying IFRS 9 and IFRS 15 |
| Excluding IFRS 9 and |
| ||||
|
| (2017 adjusted) |
| IFRS 15 |
| ||||
Total assets |
| 33,065 |
| 31,053 |
| 29,548 |
| 27,729 |
|
Current maturities of long-term debt |
| 836 |
| 1,404 |
| 1,404 |
| 1,327 |
|
Non-current financial liabilities1 |
|
|
|
|
|
|
|
|
|
Provisions |
| 395 |
| 152 |
| 152 |
| 57 |
|
Long-term debt |
| 13,265 |
| 12,256 |
| 12,256 |
| 11,604 |
|
Other long-term financial liabilities |
| 169 |
| 224 |
| 224 |
| 166 |
|
Total non-current liabilities |
| 13,829 |
| 12,632 |
| 12,632 |
| 11,827 |
|
Deferred income taxes |
| 3,152 |
| 2,941 |
| 2,500 |
| 2,107 |
|
Common equity |
| 10,259 |
| 9,416 |
| 8,221 |
| 7,917 |
|
1 In our specific current instance, financial liabilities do not include liabilities that are excluded by definition (e.g. employee benefits and share-based compensation liabilities) or liabilities that do not involve a future outlay of economic resources (e.g. deferred recognition of customer activation and connection fees; deferred gains on sale-leaseback of buildings).
| Operating revenues: Combined wireless revenue and wireline data revenue represented approximately 90% of consolidated revenues in 2018 and approximately 89% in 2017. Excluding the effects of IFRS 9 and IFRS 15, combined wireless revenue and wireline data revenue represented approximately 87% in 2016.
Total assets: Growth in Total assets includes increases in Property, plant and equipment and Intangible assets, which increased by a combined $1,021 million in 2018 and $1,198 million in 2017. These increases resulted primarily from our ongoing investments in broadband infrastructure, connecting additional homes and businesses directly to our fibre-optic technology, and business acquisitions. See Section 7.3 Cash used by investing activities.
For changes in Long-term debt, see Section 6 Changes in financial position and Section 7.4 Cash used by financing activities. |
5.2 Summary of consolidated quarterly results, trends and fourth quarter recap
Summary of quarterly results
($ millions, except per share amounts) |
| 2018 Q4 |
| 2018 Q3 |
| 2018 Q2 |
| 2018 Q1 |
| 2017 Q4 |
| 2017 Q3 |
| 2017 Q2 |
| 2017 Q1 |
|
Operating revenues1 |
| 3,764 |
| 3,774 |
| 3,453 |
| 3,377 |
| 3,541 |
| 3,404 |
| 3,280 |
| 3,183 |
|
Operating expenses |
|
|
|
|
|
|
|
|
|
|
|
|
|
|
|
|
|
Goods and services purchased2,4 |
| 1,784 |
| 1,685 |
| 1,491 |
| 1,408 |
| 1,635 |
| 1,522 |
| 1,423 |
| 1,324 |
|
Employee benefits expense2 |
| 745 |
| 740 |
| 711 |
| 700 |
| 683 |
| 638 |
| 649 |
| 624 |
|
Depreciation and amortization |
| 586 |
| 572 |
| 559 |
| 550 |
| 564 |
| 547 |
| 526 |
| 532 |
|
Total operating expenses |
| 3,115 |
| 2,997 |
| 2,761 |
| 2,658 |
| 2,882 |
| 2,707 |
| 2,598 |
| 2,480 |
|
Operating income |
| 649 |
| 777 |
| 692 |
| 719 |
| 659 |
| 697 |
| 682 |
| 703 |
|
Financing costs before long-term debt prepayment premium |
| 159 |
| 162 |
| 150 |
| 156 |
| 144 |
| 149 |
| 142 |
| 138 |
|
Long-term debt prepayment premium |
| – |
| 34 |
| – |
| – |
| – |
| – |
| – |
| – |
|
Income before income taxes |
| 490 |
| 581 |
| 542 |
| 563 |
| 515 |
| 548 |
| 540 |
| 565 |
|
Income taxes |
| 122 |
| 134 |
| 145 |
| 151 |
| 161 |
| 142 |
| 144 |
| 143 |
|
Net income |
| 368 |
| 447 |
| 397 |
| 412 |
| 354 |
| 406 |
| 396 |
| 422 |
|
Net income attributable to Common Shares |
| 357 |
| 443 |
| 390 |
| 410 |
| 353 |
| 403 |
| 389 |
| 414 |
|
Net income per Common Share: |
|
|
|
|
|
|
|
|
|
|
|
|
|
|
|
|
|
Basic earnings per share (EPS) |
| 0.60 |
| 0.74 |
| 0.66 |
| 0.69 |
| 0.59 |
| 0.68 |
| 0.66 |
| 0.70 |
|
Adjusted basic EPS3 |
| 0.69 |
| 0.74 |
| 0.70 |
| 0.73 |
| 0.66 |
| 0.70 |
| 0.70 |
| 0.71 |
|
Diluted EPS |
| 0.60 |
| 0.74 |
| 0.66 |
| 0.69 |
| 0.59 |
| 0.68 |
| 0.66 |
| 0.70 |
|
Dividends declared per Common Share |
| 0.5450 |
| 0.5250 |
| 0.5250 |
| 0.5050 |
| 0.5050 |
| 0.4925 |
| 0.4925 |
| 0.4800 |
|
Additional information: |
|
|
|
|
|
|
|
|
|
|
|
|
|
|
|
|
|
EBITDA3 |
| 1,235 |
| 1,349 |
| 1,251 |
| 1,269 |
| 1,223 |
| 1,244 |
| 1,208 |
| 1,235 |
|
Restructuring and other costs3,4 |
| 75 |
| 173 |
| 35 |
| 34 |
| 54 |
| 23 |
| 36 |
| 4 |
|
Non-recurring gains and equity income (non-recurring losses and equity losses) related to real estate joint ventures |
| – |
| 171 |
| – |
| – |
| (2 | ) | – |
| 3 |
| – |
|
MTS net recovery |
| – |
| – |
| – |
| – |
| 21 |
| – |
| – |
| – |
|
Adjusted EBITDA3 |
| 1,310 |
| 1,351 |
| 1,286 |
| 1,303 |
| 1,258 |
| 1,267 |
| 1,241 |
| 1,239 |
|
Cash provided by operating activities |
| 948 |
| 1,066 |
| 1,206 |
| 838 |
| 979 |
| 1,133 |
| 1,126 |
| 709 |
|
Free cash flow3 |
| 122 |
| 303 |
| 329 |
| 443 |
| 274 |
| 215 |
| 260 |
| 217 |
|
1 In the third quarter of 2018, we recorded equity income related to real estate joint ventures of $171 million arising from the sale of TELUS Garden.
2 Goods and services purchased and Employee benefits expense amounts include restructuring and other costs.
3 See Section 11.1 Non-GAAP and other financial measures.
4 In the third quarter of 2018, we recorded a donation to the TELUS Friendly Future Foundation of $118 million as part of other costs.
MD&A: DISCUSSION OF OPERATIONS
Trends
The trend of year-over-year increases in consolidated revenue reflects: (i) wireless network revenue generated from growth in our subscriber base; and (ii) growth in wireline data services revenues, including customer care and business services (CCBS) (formerly business process outsourcing), Internet and enhanced data, TELUS Health, TELUS TV services, and home and business security. Increased CCBS revenues, TELUS Health revenues, home security and business security revenues include revenues from business acquisitions. Increased Internet and TV service revenues are being generated by subscriber growth and higher Internet revenue per customer. Year-over-year wireless equipment revenues generally increased from a higher volume of new postpaid contracts and higher-value smart-phones in the sales mix of gross additions and retention units. Operating revenues in the third quarter of 2018 include equity income related to


real estate joint ventures of $171 million arising from the sale of TELUS Garden. For additional information on wireless and wireline revenue and subscriber trends, see Section 5.4 Wireless segment and Section 5.5 Wireline segment.
The trend of year-over-year increases in Goods and services purchased expense reflects increases in wireless and wireline customer service, roaming, and external labour expenses to support growth in both our subscriber base and business acquisitions; increased wireline TV costs of sales associated with a growing subscriber base; and higher equipment expenses associated with an increase in postpaid gross additions and increases in higher-value smartphones in the sales mix of gross additions and retention units. Goods and services purchased in the third quarter of 2018 include a $118 million charitable donation to the TELUS Friendly Future Foundation. (See Section 1.3 for additional details.)
The general trend of year-over-year increases in net Employee benefits expense reflects increases in the number of employees resulting from business acquisitions, including those supporting CCBS revenue growth, expansion of our TELUS Health offerings and growth in our home and business security lines of business. This was partly offset by moderating salaries expense resulting from reductions in the number of full-time equivalent (FTE) domestic employees related to cost efficiency and effectiveness programs.
The trend of year-over-year increases in Depreciation and amortization reflects increases due to growth in capital assets, which is supporting the expansion of our broadband footprint and enhanced LTE technology coverage, and growth in business acquisitions. The investments in our fibre-optic technology also support our small-cell technology strategy to improve coverage and capacity while preparing for a more efficient and timely evolution to 5G.
The trend of year-over-year increases in Financing costs reflects an increase in long-term debt outstanding, mainly associated with our generational investments in fibre to homes and businesses and our wireless technology, and our business acquisitions, in addition to a higher average effective interest rate. Financing costs include a long-term debt prepayment premium of $34 million in the third quarter of 2018. Financing costs are net of capitalized interest, which was related to spectrum licences acquired during past wireless spectrum licence auctions. Capitalization of interest ceased in the first quarter of 2017, as cell sites were then capable of utilizing the acquired frequencies. Financing costs also includes Interest accretion on provisions and Employee defined benefit plans net interest expense. Additionally, for the eight periods shown, Financing costs include varying amounts of foreign exchange gains or losses and varying amounts of interest income.
The trend in Net income reflects the items noted above, as well as non-cash adjustments arising from legislated income tax changes and adjustments recognized in the current periods for income taxes of prior periods, including any related after-tax interest on reassessments. Historically, the trend in basic EPS has been impacted by the same trends as Net income and has also been impacted by share purchases under our normal course issuer bid (NCIB) programs. See Financing and capital structure management plans within Section 4.3.
The general trend of year-over-year increases in Cash provided by operating activities reflects generally higher year-over-year consolidated EBITDA. This trend was reduced by increased interest payments arising from increases in debt outstanding and year-over-year increases in fixed-term interest rates. The trend of year-over-year increases in free cash flow reflects the above factors affecting Cash provided by operating activities.
Additionally, free cash flow was impacted by the increases in capital expenditures in 2017, as we connected more homes and businesses directly to fibre and by the end of 2018, TELUS PureFibre was available to 61% of our broadband footprint. For further discussion on these trends, see Section 5.4 Wireless segment and Section 5.5 Wireline segment.
Fourth quarter recap
Results for the fourth quarter of 2018 (three-month period ended December 31, 2018) are discussed in our February 14, 2019 news release and are compared with results from the fourth quarter of 2017 (three-month period ended December 31, 2017), adjusted for the retrospective application of IFRS 9 and IFRS 15 (to the three-month period ended December 31, 2017).
· Consolidated operating revenues in the fourth quarter of 2018 were $3,764 million, an increase of $223 million.
· Service revenues in the fourth quarter of 2018 were $3,014 million and increased by $133 million, reflecting growth in wireless network revenue and wireline data services, partly offset by the continuing decline in wireline voice revenues. Wireless network revenue increases were driven by a growing wireless subscriber base partly offset by lower ARPU per customer. The increase in wireline data services revenue reflects increased CCBS revenue growth, including the growth in business volumes from recent business acquisitions, as well as increases in Internet and enhanced data service, TELUS Health revenues, TELUS TV revenue and revenues from our home and business security lines of business. Internet and TV revenues increased due to subscriber growth, as well as higher Internet revenue per customer.
· Equipment revenues in the fourth quarter of 2018 were $699 million and increased by $103 million, primarily due to increased wireless revenue mainly from more higher-value smartphones in the sales mix of gross additions and retention units and growth in revenue per handset, as well as a higher volume of new postpaid contracts. Excluding the effects of implementing IFRS 15, equipment revenues would have increased by $13 million or 6.0% in the fourth quarter of 2018.
· Other operating income in the fourth quarter of 2018 was $51 million and decreased by $13 million, mainly due to the non-recurrence of the 2017 MTS contingent consideration recovery, partly offset by higher net gains from the sale of property, plant and equipment, and a decrease in the provision related to written put options in respect of non-controlling interests.
· Consolidated operating expenses in the fourth quarter of 2018 were $3,115 million, an increase of $233 million.
· Goods and services purchased in the fourth quarter of 2018 were $1,784 million and increased by $149 million, largely due to higher wireless handset costs reflecting higher-value smartphones in the sales mix of gross additions and retention units, increases in employee-related and other costs related to business acquisitions, higher wireline product costs associated with equipment sales and TELUS Health services, higher TV content costs, and higher administrative costs to support the larger wireless customer base, partly offset by the non-recurrence of 2017 non-labour restructuring and other costs, including those associated with the migration of subscribers from MTS and customer support costs related to acquired MTS subscribers.
· Employee benefits expense in the fourth quarter of 2018 were $745 million and increased by $62 million, due to higher compensation and benefit costs resulting from an increase in the number of employees from business acquisitions, as well as higher employee-related restructuring and other costs related to efficiency initiatives in the quarter. This was partly offset by lower compensation and benefit costs from a decrease in the number of domestic FTEs, excluding business acquisitions, and higher capitalized labour costs.
· Depreciation in the fourth quarter of 2018 was $428 million and increased by $14 million, due to higher expenditures associated with growth in capital assets over the last 12 months, including those arising from our investments in fibre and business acquisitions.
· Amortization of intangible assets in the fourth quarter of 2018 was $158 million and increased by $8 million, reflecting higher expenditures associated with the intangible asset base, including those arising from business acquisitions.
· EBITDA includes restructuring and other costs, non-recurring gains and equity income related to real estate joint ventures, and the fourth quarter of 2017 MTS net recovery. EBITDA in the fourth quarter of 2018 was $1,235 million, an increase of $12 million or 1.0%.
· Adjusted EBITDA excludes restructuring and other costs, non-recurring gains and equity income or net losses and equity losses related to real estate joint ventures, and the fourth quarter of 2017 MTS net recovery. Adjusted EBITDA in the fourth quarter of 2018 was $1,310 million, an increase of $52 million or 4.1%, reflecting higher wireless equipment margins and wireless network revenue growth driven by a growing customer base, in addition to growth in EBITDA contribution from our CCBS business. These factors were partly offset by increased costs associated with a growing wireless customer base and declines in wireline legacy voice services.
· Net income attributable to Common Shares in the fourth quarter of 2018 was $357 million, an increase of $4 million, driven by lower income taxes, partly offset by lower Operating income and increased Financing costs. Adjusted Net income excludes the effects of restructuring and other costs, income tax-related adjustments, non-recurring gains and equity income related to real estate joint ventures, the long-term debt prepayment premium and the 2017 MTS net recovery. Adjusted Net income in the fourth quarter of 2018 was $409 million and increased by $13 million or 3.3%.
· Basic EPS was $0.60 in the fourth quarter of 2018, an increase of $0.01 or 1.7%, driven by lower income taxes, partly offset by lower Operating income and increased Financing costs. Adjusted basic EPS excludes the effects of restructuring and other costs, income tax-related adjustments, non-recurring gains and equity income (non-recurring losses and equity losses) related to real estate joint ventures, the long-term debt prepayment premium and the 2017 MTS net recovery. Adjusted basic EPS in the fourth quarter of 2018 was $0.69 and increased by $0.03 or 4.5%.
· Cash provided by operating activities was $948 million in the fourth quarter of 2018, a decrease of $31 million, primarily due to increased income taxes paid and increased share-based compensation paid, partially offset by other working capital changes.
MD&A: DISCUSSION OF OPERATIONS
· Cash used by investing activities was $629 million in the fourth quarter of 2018, a decrease of $105 million, mainly due to lower capital expenditures primarily reflecting the planned reduction in our capital spend.
· Cash used by financing activities was $338 million in the fourth quarter of 2018, an increase of $114 million, primarily reflecting lower issuances of long-term debt, net of redemptions and repayment.
· Free cash flow was $122 million in the fourth quarter of 2018, a decrease of $152 million, primarily resulting from increased income taxes paid and increased shared-based compensation paid.
5.3 Consolidated operations
The following is a discussion of our consolidated financial performance. Segment information in Note 5 of the Consolidated financial statements is regularly reported to our CEO. We discuss the performance of our segments in Section 5.4 Wireless segment, Section 5.5 Wireline segment and Section 7.3 Cash used by investing activities.

Operating revenues
Years ended December 31 ($ in millions) |
| 2018 |
| 2017 |
| Change |
|
| Applying IFRS 9 and IFRS 15 |
| |||
Service |
| 11,882 |
| 11,332 |
| 4.9% |
Equipment |
| 2,213 |
| 1,973 |
| 12.2% |
Revenues arising from contracts with customers |
| 14,095 |
| 13,305 |
| 5.9% |
Other operating income |
| 273 |
| 103 |
| n/m |
Operating revenues |
| 14,368 |
| 13,408 |
| 7.2% |
Consolidated operating revenues increased by $960 million in 2018.
· Service revenues increased by $550 million in 2018, reflecting growth in wireless network revenue and wireline data services, partly offset by the continuing decline in wireline voice revenues. Wireless network revenue increases reflect a growing wireless subscriber base. The increase in wireline data service revenue reflects increased CCBS revenue growth, including the growth in business volumes from recent business acquisitions, as well as increases in Internet and enhanced data service, TELUS Health revenues, TELUS TV revenue and revenues from our home and business security lines of business. Internet and TV revenues increased due to subscriber growth, as well as higher Internet revenue per customer.
· Equipment revenues increased by $240 million in 2018, primarily due to increased wireless revenue mainly from a higher volume of new postpaid contracts, as well as higher-value smartphones in the sales mix of gross additions and retention units. Excluding the effects of implementing IFRS 15, equipment revenues would have increased by $68 million or 9.4% in 2018. See Note 2(c) of the Consolidated financial statements.
· Other operating income increased by $170 million in 2018, primarily due to the third quarter of 2018 equity income related to real estate joint ventures arising from the sale of TELUS Garden of $171 million, as noted in Section 1.3. Excluding the effect of equity income related to real estate joint ventures arising from the sale of TELUS Garden, Other operating income was relatively flat in the year, primarily due to the non-recurrence of the 2017 MTS contingent consideration recovery, partly offset by higher net gains from the sale of property, plant and equipment and a decrease in the provision related to written put options in respect of non-controlling interests.
Operating expenses
Years ended December 31 ($ in millions) |
| 2018 |
| 2017 |
| Change |
|
| Applying IFRS 9 and IFRS 15 |
| |||
Goods and services purchased |
| 6,368 |
| 5,904 |
| 7.9% |
Employee benefits expense |
| 2,896 |
| 2,594 |
| 11.6% |
Depreciation |
| 1,669 |
| 1,617 |
| 3.2% |
Amortization of intangible assets |
| 598 |
| 552 |
| 8.3% |
Operating expenses |
| 11,531 |
| 10,667 |
| 8.1% |
Consolidated operating expenses increased by $864 million in 2018.
· Goods and services purchased increased by $464 million in 2018, primarily due to the third quarter of 2018 $118 million donation to the TELUS Friendly Future Foundation, as noted in Section 1.3, made in TELUS Corporation Common Shares. Excluding the effect of the donation, Goods and services purchased increased by $346 million or 5.9% in 2018, largely due to employee-related and other costs associated with business acquisitions, higher wireless handset costs reflecting higher-value smartphones in the sales mix of gross additions and retention units, higher wireline product costs associated with equipment sales and TELUS Health services, and higher TV content costs.
· Employee benefits expense increased by $302 million in 2018, due to higher compensation and benefit costs resulting from an increase in the number of employees from business acquisitions, as well as higher employee-related restructuring and other costs related to efficiency initiatives in the year. This was partly offset by lower compensation and benefit costs from a decrease in the number of domestic FTEs, excluding business acquisitions, and higher capitalized labour costs.
· Depreciation increased by $52 million in 2018 due to higher expenditures associated with growth in capital assets over the last 12 months, including those arising from our investments in fibre and business acquisitions.
· Amortization of intangible assets increased by $46 million in 2018, reflecting higher expenditures associated with the intangible asset base, including those arising from business acquisitions.
Operating income
Years ended December 31 ($ in millions) |
| 2018 |
| 2017 |
| Change |
|
| Applying IFRS 9 and IFRS 15 |
|
| ||
Wireless EBITDA (see Section 5.4) |
| 3,431 |
| 3,250 |
| 5.5% |
Wireline EBITDA (see Section 5.5) |
| 1,673 |
| 1,660 |
| 0.8% |
EBITDA |
| 5,104 |
| 4,910 |
| 3.9% |
Depreciation and amortization (discussed above) |
| (2,267 | ) | (2,169 | ) | n/m |
Operating income |
| 2,837 |
| 2,741 |
| 3.5% |
Operating income increased by $96 million in 2018, while EBITDA increased by $194 million in 2018. These increases reflect higher wireless equipment margins and wireless network revenue growth driven by a growing customer base, in addition to growth in EBITDA contribution from our CCBS business. These factors were partly offset by increased costs associated with a growing wireless customer base, declines in wireline legacy voice services, and higher wireline restructuring and other costs related to efficiency initiatives, as well as increased depreciation and amortization.
Adjusted EBITDA
Years ended December 31 ($ in millions) |
| 2018 |
| 2017 |
| Change |
|
| Applying IFRS 9 and IFRS 15 |
|
| ||
Wireless Adjusted EBITDA (see Section 5.4) |
| 3,461 |
| 3,286 |
| 5.3% |
Wireline Adjusted EBITDA (see Section 5.5) |
| 1,789 |
| 1,719 |
| 4.1% |
Adjusted EBITDA |
| 5,250 |
| 5,005 |
| 4.9% |
Adjusted EBITDA increased by $245 million or 4.9% in 2018, reflecting higher wireless equipment margins and wireless network revenue growth driven by a growing customer base, growth in EBITDA contribution from our CCBS business and higher Internet and TELUS Health margins. These factors were partly offset by increased costs associated with a growing wireless customer base, declines in wireline legacy voice services and a decline in the EBITDA contribution from our business services.
Financing costs
Years ended December 31 ($ in millions) |
| 2018 |
| 2017 |
| Change |
|
| Applying IFRS 9 and IFRS 15 |
|
| ||
Interest expense, before long-term debt prepayment premium |
| 625 |
| 579 |
| 7.9% |
Long-term debt prepayment premium |
| 34 |
| – |
| n/m |
Interest expense |
| 659 |
| 579 |
| 13.8% |
Employee defined benefit plans net interest |
| 17 |
| 6 |
| n/m |
Foreign exchange gains |
| (6 | ) | (5 | ) | 20.0% |
Interest income |
| (9 | ) | (7 | ) | 28.6% |
Financing costs |
| 661 |
| 573 |
| 15.4% |
Financing costs increased by $88 million in 2018, mainly due to the following factors:
· Interest expense, before long-term debt prepayment premium increased by $46 million in 2018, primarily due to the following:
· Interest on long-term debt increased by $37 million in 2018, resulting from an increase in average long-term debt balances outstanding, in addition to an increase in the effective interest rate in the respective periods. Our weighted average interest rate on long-term debt (excluding commercial paper, the revolving component of the TELUS International (Cda) Inc. credit facility and finance leases) was 4.18% at December 31, 2018, as compared to 4.18% one year earlier. (See Long-term debt issues and repayments in Section 7.4.)
· Interest accretion on provisions increased by $8 million in 2018, attributed to written put options in respect of business acquisitions.
· In the third quarter of 2018, we recorded a long-term debt prepayment premium of $34 million before income taxes related to the early redemption of all our $1.0 billion 5.05%, Series CG Notes due December 4, 2019. There was no comparable activity in 2017.
· Employee defined benefit plans net interest increased by $11 million in 2018, primarily due to the increase in the defined benefit plan deficit at December 31, 2017, to $334 million, up from $79 million one year earlier, partly offset by a decrease in the discount rate.
· Foreign exchange (gains) losses were relatively flat in 2018.
· Interest income was relatively flat in the full year of 2018.

Income taxes
Years ended December 31 |
| 2018 |
| 2017 |
| Change |
|
| Applying IFRS 9 and IFRS 15 |
|
| ||
Income tax computed at applicable statutory rates |
| 586 |
| 578 |
| 1.4% |
Revaluation of deferred income tax liability to reflect income tax rates |
| – |
| 28 |
| n/m |
Adjustments recognized in the current period for income taxes of prior periods |
| (6 | ) | (4 | ) | 50.0% |
Other |
| (28 | ) | (12 | ) | 133.3% |
Income taxes |
| 552 |
| 590 |
| (6.4)% |
Income taxes computed at applicable statutory rates (%) |
| 27.0 |
| 26.7 |
| 0.3 pts. |
Effective tax rate (%) |
| 25.4 |
| 27.2 |
| (1.8) pts. |
Total income tax expense decreased by $38 million in 2018. The effective tax rate decreased to 25.4% for the year, primarily due to a requirement to revalue the deferred tax liability for higher legislated tax rates in the fourth quarter of 2017, as well as the lower capital gain rate on the TELUS Garden sale.
MD&A: DISCUSSION OF OPERATIONS

Comprehensive income
Years ended December 31 ($ in millions) |
| 2018 |
| 2017 |
| Change |
|
| Applying IFRS 9 and IFRS 15 |
|
| ||
Net income |
| 1,624 |
| 1,578 |
| 2.9% |
Other comprehensive income (net of income taxes): |
|
|
|
|
|
|
Items that may be subsequently reclassified to income |
| (48 | ) | 24 |
| n/m |
Items never subsequently reclassified to income |
| 332 |
| (184 | ) | n/m |
Comprehensive income |
| 1,908 |
| 1,418 |
| 34.6% |
Comprehensive income increased by $490 million in 2018, primarily as a result of changes in employee defined benefit plan re-measurement amounts largely arising from increases in the reference discount rate. Items that may be subsequently reclassified to income are composed of changes in the unrealized fair value of derivatives designated as cash flow hedges and foreign currency translation adjustments arising from translating financial statements of foreign operations. Items never subsequently reclassified to income are composed of changes in the measurement of investment financial assets and employee defined benefit plans re-measurement amounts.
5.4 Wireless segment
|
|
|
|
|
|
| ||
| Postpaid subscribers |
|
|
| Blended ABPU |
| ||
| 2018: 8,311,000 | +4.2% |
|
|
| 2018: $67.30 | +0.4% |
|
| 2017:7,978,000 |
|
|
| 2017: $67.05 |
| ||
|
|
|
|
|
|
| ||
|
|
|
|
|
|
| ||
|
|
|
|
|
|
| ||
| Prepaid subscribers |
|
|
| Postpaid churn rate |
| ||
| 2018: 924,000 | (1.0)% |
|
|
| 2018: 0.89% | (0.01)pts. |
|
| 2017: 933,000 |
|
|
| 2017: 0.90% |
| ||
|
|
|
|
|
|
| ||
Wireless trends and seasonality
The historical trend over the last eight quarters in wireless network revenue reflects growth in our subscriber base, as well as higher-value smartphones in the sales mix of gross additions and retention units. There has been a general year-over-year increase in equipment revenues from a higher volume of new postpaid contracts and higher-value smartphones in the sales mix of gross additions and retention units. The general trend of year-over-year increases in subscriber net additions resulted from the success of our promotions for prepaid subscribers; the effects of market growth arising from a growing population, changing population demographics and an increasing number of customers with multiple devices; marketing efforts focused on higher-value postpaid
loading; and continuous improvements in the speed and quality of our network, combined with our improved churn rate, which reflected our focus on executing customers first initiatives. Our expenditures on network improvements increase capacity and coverage, allowing us to grow revenue through net additions of wireless subscribers. Although there have historically been significant third and fourth quarter seasonal effects that result in increased loading, competitive intensity in both the consumer and business markets and launches of new devices may impact subscriber addition results and trends for future periods.
Wireless ABPU growth has been moderating, primarily due to two offsetting factors: (i) competitive pressures driving larger allotments of data and rate plans encompassing data sharing and international roaming features, as well as the consumer behavioural response to more frequent customer data usage notifications and offloading of data traffic to increasingly available Wi-Fi hotspots; and (ii) an increased mix of higher-priced rate plans, such as data share plans, in addition to more higher-value smartphones in the sales mix of gross additions and retention units, and an increased proportion of higher-value postpaid customers in the subscriber mix in 2018. As a result of increased competitive pressures, customers have been able to gain access to higher network speeds and larger allotments of data included for a given price point, further limiting ABPU expansion. The economic environment, consumer behaviour, the regulatory environment, device selection and other factors also impact ABPU, and as a consequence, there cannot be assurance that ABPU will return to growth in the coming quarters.
The trend of our comparatively low postpaid and blended churn rates reflects our customers first efforts, our retention programs and our focus on building and maintaining our high-quality network. We may experience pressure on our postpaid churn rate if the level of competitive intensity increases, in part due to increased promotional activity, if there is an increase in customers on expired or no contracts, or due to regulatory changes. Accordingly, our wireless segment historical operating results and trends may not be reflective of results and trends for future periods.
The effects of implementation of IFRS 15 are most pronounced in our wireless results. Although the measurement of the total revenue recognized over the life of a contract is largely unaffected by the new standard, the effect of IFRS 15 implementation generally accelerates the recognition of contract revenue relative to the associated cash inflows, which are unchanged. While the underlying transaction economics do not differ, during periods of sustained growth in the number of wireless subscriber contract additions (assuming comparable contract-lifetime per unit cash inflows), revenues under IFRS 15 would appear to be greater than would have been the case prior to IFRS 15. With respect to costs, the measurement of the total costs of contract acquisition and contract fulfilment over the life of a contract is unaffected by the new standard, but the timing of recognition is affected. The new standard results in our costs of contract acquisition and contract fulfilment, to the extent that they are material, being capitalized and subsequently recognized as an expense over the life of a contract on a rational, systematic basis consistent with the pattern of the transfer of goods or services to which the asset relates. Although the underlying transaction economics would not differ, during periods of sustained growth in the number of customer connection additions, assuming comparable per unit costs of contract acquisition and contract fulfilment, absolute profitability measures would appear to be greater than under the previous practice (immediate expensing of such costs). We will be implementing IFRS 16 on January 1, 2019,
the effects of which will be more pronounced in our wireless results due to the relative prevalence of lease-in activity in the wireless business, and will impact trends in wireless EBITDA-based operating metrics; however, implementation will not have any impact on economics or cash flows. (See Section 8.2 Accounting policy developments for additional details.)
Wireless operating indicators
At December 31 |
| 2018 |
| 2017 |
| Change |
Subscribers1 (000s): |
|
|
|
|
|
|
Postpaid |
| 8,311 |
| 7,978 |
| 4.2% |
Prepaid |
| 924 |
| 933 |
| (1.0)% |
Total |
| 9,235 |
| 8,911 |
| 3.6% |
Postpaid proportion of subscriber base (%) |
| 90.0 |
| 89.5 |
| 0.5 pts. |
HSPA+ population coverage2 (millions) |
| 37.0 |
| 36.7 |
| 0.8% |
LTE population coverage2 (millions) |
| 36.9 |
| 36.6 |
| 0.8% |
|
|
|
|
|
|
|
Years ended December 31 |
| 2018 |
| 2017 |
| Change |
|
| Applying IFRS 9 and IFRS 15 |
|
| ||
|
|
|
|
|
|
|
Subscriber gross additions1 (000s): |
|
|
|
|
|
|
Postpaid |
| 1,150 |
| 1,140 |
| 0.9% |
Prepaid |
| 366 |
| 320 |
| 14.4% |
Total |
| 1,516 |
| 1,460 |
| 3.8% |
Subscriber net additions1 (000s): |
|
|
|
|
|
|
Postpaid |
| 356 |
| 379 |
| (6.1)% |
Prepaid |
| (9 | ) | (83 | ) | n/m |
Total |
| 347 |
| 296 |
| 17.2% |
ABPU, per month1,3 ($) |
| 67.30 |
| 67.05 |
| 0.4% |
ARPU, per month1,3 ($) |
| 56.08 |
| 56.55 |
| (0.8)% |
Churn, per month1,2 (%) |
|
|
|
|
|
|
Blended |
| 1.08 |
| 1.11 |
| (0.03) pts. |
Postpaid |
| 0.89 |
| 0.90 |
| (0.01) pts. |
1 Q4 2018 opening postpaid and total subscribers, as well as associated Q4 2018 operating statistics (ARPU, ABPU and churn), have been adjusted to exclude an estimated 23,000 subscribers impacted by the CRTC’s final pro-rating ruling in June 2018, which was effective October 1, 2018.
2 Including network access agreements with other Canadian carriers.
3 See Section 11.2 Operating indicators. These are industry measures useful in assessing operating performance of a wireless company, but are not measures defined under IFRS-IASB.
Operating revenues – Wireless segment
Years ended December 31 ($ in millions) |
| 2018 |
| 2017 |
| Change |
|
| Applying IFRS 9 and IFRS 15 |
|
| ||
Network revenue |
| 6,025 |
| 5,867 |
| 2.7% |
Equipment and other service revenues |
| 1,992 |
| 1,768 |
| 12.7% |
Revenues arising from contracts with customers |
| 8,017 |
| 7,635 |
| 5.0% |
Other operating income1 |
| 118 |
| 36 |
| n/m |
External operating revenues |
| 8,135 |
| 7,671 |
| 6.0% |
Intersegment revenues |
| 47 |
| 43 |
| 9.3% |
Wireless operating revenues |
| 8,182 |
| 7,714 |
| 6.1% |
1 Includes equity income related to real estate joint ventures allocated to the wireless segment of $85 million (50% of the total of $171 million) arising from the sale of TELUS Garden recorded in the third quarter of 2018.
Total wireless operating revenues increased by $468 million in 2018.
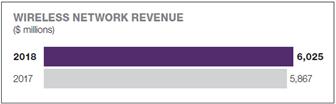
Network revenue from external customers increased by $158 million in 2018 or 2.7%, reflecting: (i) growth in the subscriber base; and (ii) a larger proportion of customers selecting higher-priced rate plans with larger data buckets or periodically topping up their data buckets. These were partly offset by declining chargeable data usage and the competitive environment putting pressure on base rate plan prices in the current and prior periods. Monthly ABPU was $67.30 in 2018, reflecting an increase of $0.25 or 0.4%, as growth from customers selecting plans with larger data buckets, the introduction of our Platinum rate plan and more higher-value smartphones in the sales mix of gross additions and retention units was partly offset by declines in chargeable data usage and the competitive pressures on base rate plan prices mentioned above. Monthly ARPU was $56.08 in 2018, reflecting a decrease of $0.47 or 0.8% due to the declines in chargeable data usage and competitive pressures on base rate plan prices mentioned above.
· Gross subscriber additions were 1,516,000 in 2018, reflecting an increase of 56,000. Postpaid gross additions increased by 10,000 in 2018 due to the success of our promotions and marketing efforts focused on higher-value postpaid and smart-phone loading, as well as demographic shifts, and growth, in the Canadian population, partly offset by the non-recurrence of an aggressive holiday rate plan offer that stimulated significant traffic in the prior year. Prepaid gross activations increased by 46,000 in 2018, mainly as a result of successful promotions and expanded prepaid channels.
· Our postpaid churn rate was 0.89% in 2018, as compared to 0.90% in 2017. The comparatively low postpaid churn rate during 2018 reflects our focus on executing customers first initiatives and retention programs and our leading network quality, partly offset by incremental deactivations from competitive intensity. Our blended churn rate was 1.08% in 2018, as compared to 1.11% in 2017. The improvement in our blended churn rate reflects aforementioned improvements in postpaid churn rates and improvements in prepaid churn rates, as well as an increase in the mix of postpaid subscribers compared to prepaid subscribers in our subscriber base.
· Net subscriber additions reflect postpaid net additions of 356,000 in 2018, compared to 379,000 in 2017. The decline is attributed to higher numbers of deactivations associated with a larger subscriber base, partly offset by higher numbers of gross additions. In 2018, our prepaid subscriber base decreased by 9,000, as compared to a decrease of 83,000 in 2017. Total net subscriber additions were 347,000 in 2018, reflecting a year-over-year improvement of 51,000 compared to 2017.
MD&A: DISCUSSION OF OPERATIONS
Equipment and other service revenues increased by $224 million in 2018, due to more higher-value smartphones in the sales mix of gross additions and retention units, growth in revenue per handset and a higher volume of new postpaid contracts. With the implementation of IFRS 15, equipment revenues are allocated a much larger portion of bundle revenues, particularly for our wireless segment, as, in contrast to the accounting principles that were superseded, IFRS 15 does not constrain the measurement of equipment revenue in bundled arrangements to amounts that are received at the time of activation of handsets. The measurement of equipment revenue and service revenue is determined by allocating the minimum transaction price (the “minimum spend” amount required in a contract with a customer) based upon the stand-alone selling prices of the contracted equipment and services included in the minimum transaction price. For clarity, the application of IFRS 15 does not affect our cash flows from operations or the underlying economics of our relationships with customers. See Note 1(e) and Note 2(a), (c) of the Consolidated financial statements.
Other operating income increased by $82 million in 2018, mainly due to the third quarter of 2018 equity income related to real estate joint ventures arising from the sale of TELUS Garden, as noted in Section 1.3, of which 50% of the total of $171 million was allocated to each of the wireless and wireline segments. Excluding the effect of the equity income related to real estate joint ventures arising from the sale of TELUS Garden, the change in Other operating income decreased by $3 million in 2018, mainly due to the non-recurrence of the 2017 MTS contingent consideration recovery, partly offset by higher net gains from the sale of property, plant and equipment.
Intersegment revenues represent network services that are eliminated upon consolidation along with the associated wireline expenses.
Operating expenses – Wireless segment
Years ended December 31 ($ in millions) |
| 2018 |
| 2017 |
| Change |
|
| Applying IFRS 9 and IFRS 15 |
|
| ||
Goods and services purchased: |
|
|
|
|
|
|
Equipment sales expenses |
| 1,960 |
| 1,805 |
| 8.6% |
Network operating expenses |
| 841 |
| 826 |
| 1.8% |
Marketing expenses |
| 393 |
| 373 |
| 5.4% |
Other1,2 |
| 867 |
| 806 |
| 7.6% |
Employee benefits expense1 |
| 690 |
| 654 |
| 5.5% |
Wireless operating expenses |
| 4,751 |
| 4,464 |
| 6.4% |
1 Includes restructuring and other costs. See Section 11.1 Non-GAAP and other financial measures.
2 Includes a donation to the TELUS Friendly Future Foundation allocated to the wireless segment of $59 million (50% of the total of $118 million) recorded in other costs in the third quarter of 2018.
Wireless operating expenses increased by $287 million in 2018.
Equipment sales expenses increased by $155 million in 2018, reflecting an increase in higher-value smartphones in the sales mix of gross additions and retention units, and an increase in new postpaid contracts.
Network operating expenses increased by $15 million in 2018, mainly due to increased roaming expenses.
Marketing expenses increased by $20 million in 2018, primarily due to higher commissions and higher advertising spend.
Other goods and services purchased increased by $61 million in 2018, mainly due to the third quarter of 2018 donation to the TELUS Friendly Future Foundation, as noted in Section 1.3, of which 50% of the total of $118 million was allocated to each of the wireless and wireline segments. Excluding the effect of the donation, Other goods and services purchased increased by $2 million in 2018, mainly due to higher administrative costs supporting the larger customer base, partly offset by the non-recurrence of 2017 customer support costs related to acquired MTS subscribers.
Employee benefits expense increased by $36 million in 2018, primarily due to higher labour-related restructuring costs related to efficiency initiatives, partly offset by higher capitalized labour costs and lower FTEs.
EBITDA – Wireless segment
Years ended December 31 |
|
|
|
|
|
|
($ in millions, except margins) |
| 2018 |
| 2017 |
| Change |
|
| Applying IFRS 9 and IFRS 15 |
|
| ||
EBITDA |
| 3,431 |
| 3,250 |
| 5.5% |
Add back restructuring and other costs included in EBITDA1 |
| 115 |
| 57 |
| n/m |
Deduct non-recurring gains and equity income related to real estate joint ventures2 |
| (85 | ) | – |
| n/m |
Deduct MTS net recovery |
| – |
| (21 | ) | n/m |
Adjusted EBITDA3 |
| 3,461 |
| 3,286 |
| 5.3% |
EBITDA margin (%) |
| 41.9 |
| 42.1 |
| (0.2) pts. |
Adjusted EBITDA margin4 (%) |
| 42.7 |
| 42.7 |
| – pts. |
1 Includes a donation to the TELUS Friendly Future Foundation allocated to the wireless segment of $59 million (50% of the total of $118 million) recorded in other costs in the third quarter of 2018.
2 Includes equity income related to real estate joint ventures allocated to the wireless segment of $85 million (50% of the total of $171 million) arising from the sale of TELUS Garden recorded in the third quarter of 2018.
3 See description under EBITDA in Section 11.1 Non-GAAP and other financial measures.
4 Adjusted EBITDA margin is Adjusted EBITDA divided by Operating revenues, where the calculation of Operating revenues excludes non-recurring gains and equity income related to real estate joint ventures, and for 2017, excludes the MTS net recovery.
Wireless EBITDA increased by $181 million or 5.5% in 2018. Wireless Adjusted EBITDA increased by $175 million or 5.3% in 2018, reflecting higher equipment margins and network revenue growth driven by a larger customer base, partly offset by higher administrative costs and increased customer support costs due to growth in the subscriber base, as well as increased network operating expenses.


5.5 Wireline segment
|
|
|
|
|
|
| ||
| High-speed Internet |
|
|
| TELUS TV subscriber |
| ||
| subscriber net additions |
|
|
| net additions |
| ||
| 2018: 115,000 |
|
|
|
| 2018: 63,000 |
|
|
| 2017: 81,000 |
|
|
|
| 2017: 35,000 |
|
|
|
|
|
|
|
|
| ||
|
|
|
|
|
|
| ||
|
|
|
|
|
|
| ||
| Residential NAL |
|
|
| Total wireline subscriber |
| ||
| net losses |
|
|
| net additions |
| ||
| 2018: (51,000) |
|
|
|
| 2018: 127,000 |
|
|
| 2017: (76,000) |
|
|
|
| 2017: 40,000 |
|
|
|
|
|
|
|
|
| ||
Wireline trends
The trend over the last eight quarters of increases in wireline service revenue reflects growth in high-speed Internet and enhanced data services, CCBS revenues, TELUS TV revenues, TELUS Health revenues, and home and business security revenues, and is partly offset by declining wireline voice revenues and equipment revenues. The increases in Internet and TV service revenues are being generated by subscriber growth and higher Internet revenue per customer resulting from upgrades to faster speeds, larger data usage rate plans and expansion of our fibre footprint. We expect continued high-speed Internet subscriber base growth as the economy grows and as we continue our investments in expanding our fibre-optic infrastructure. The total number of TELUS TV subscribers has increased as a result of our lower customer churn rate and diverse product offerings. Residential network access line (NAL) losses continue to reflect the ongoing trend of substitution to wireless and Internet-based services, but have been partly mitigated by the success of our bundled service offerings. The trend of declining wireline voice revenues is due to technological substitution, greater use of inclusive long distance coupled with lower long distance minutes used, and intensification of competition in the small and medium-sized business market. The general trend of increasing TELUS Health revenues has been driven by both organic growth and business acquisitions. The migration of business products and services offerings to IP services yield inherently lower margins compared to some legacy business products and service offerings. We expect the rate of growth of CCBS revenues to increase as a result of business acquisition growth and a recovery of organic growth.
The trends in wireline EBITDA-based operating metrics will be impacted by our adoption of IFRS 16, as discussed further in Section 8.2 Accounting policy developments.
Wireline operating indicators
At December 31 (000s)
|
| 2018 |
| 2017 |
| Change |
Subscriber connections: |
|
|
|
|
|
|
High-speed Internet subscribers |
| 1,858 |
| 1,743 |
| 6.6% |
TELUS TV subscribers1 |
| 1,093 |
| 1,098 |
| (0.5)% |
Residential NALs |
| 1,248 |
| 1,298 |
| (3.9)% |
Total wireline subscriber connections1
|
| 4,199 |
| 4,139 |
| 1.4% |
|
|
|
|
|
|
|
Years ended December 31 (000s) |
| 2018 |
| 2017 |
| Change |
Subscriber connection net additions (losses): |
|
|
|
|
|
|
High-speed Internet |
| 115 |
| 81 |
| 42.0% |
TELUS TV |
| 63 |
| 35 |
| 80.0% |
Residential NALs |
| (51 | ) | (76 | ) | 32.9% |
Total wireline subscriber connection net additions |
| 127 |
| 40 |
| n/m |
1 Effective April 1, 2018, and on a prospective basis, we have adjusted cumulative subscriber connections to remove approximately 68,000 TELUS TV subscribers as we have ceased marketing our Satellite TV product. Excluding the impacts of this adjustment, total TELUS TV subscriber connections would have increased by 4.8%.
Operating revenues – Wireline segment
Years ended December 31 ($ in millions)
|
| 2018 |
| 2017 |
| Change |
|
| Applying IFRS 9 and IFRS 15 |
|
| ||
Data services |
| 4,588 |
| 4,076 |
| 12.6% |
Voice services |
| 1,084 |
| 1,216 |
| (10.9)% |
Other services and equipment |
| 406 |
| 378 |
| 7.4% |
Revenues arising from contracts with customers |
| 6,078 |
| 5,670 |
| 7.2% |
Other operating income1 |
| 155 |
| 67 |
| n/m |
External operating revenues |
| 6,233 |
| 5,737 |
| 8.6% |
Intersegment revenues |
| 207 |
| 206 |
| 0.5% |
Wireline operating revenues |
| 6,440 |
| 5,943 |
| 8.4% |
1 Includes equity income related to real estate joint ventures allocated to the wireline segment of $86 million (50% of the total of $171 million) arising from the sale of TELUS Garden recorded in the third quarter of 2018.
Total wireline operating revenues increased by $497 million in 2018.

MD&A: DISCUSSION OF OPERATIONS
· Data services revenues increased by $512 million in 2018. The increase was primarily due to: (i) growth in CCBS revenues, primarily due to growth in business volumes resulting from both business acquisitions and organic growth; (ii) increased Internet and enhanced data service revenues, reflecting higher revenue per customer as a result of upgrades to faster Internet speeds, larger data usage Internet rate plans and certain rate changes, as well as a 6.6% increase in our high-speed Internet subscribers over the last 12 months; (iii) increased TELUS Health revenues, driven by both business acquisitions and organic growth; (iv) revenues from our home and business security lines of business; and (v) increased TELUS TV revenues, reflecting subscriber growth of 4.8% over the last 12 months, excluding the Satellite TV subscriber adjustment. This growth was partly offset by the ongoing decline in legacy data services.
· Voice services revenues decreased by $132 million in 2018, reflecting the ongoing decline in legacy revenues from technological substitution, greater use of inclusive long distance plans and price plan changes. We experienced a 3.9% decline in residential NALs in 2018, as compared to a 5.5% decline in residential NALs in 2017.
· Other services and equipment revenues increased by $28 million in 2018, mainly due to higher data and voice equipment sales.
· Wireline subscriber connection net additions were 127,000 in 2018, reflecting an increase of 87,000.
· Net additions of high-speed Internet subscribers were 115,000 in 2018, reflecting an increase of 34,000 driven by increased customer demand for our high-speed broadband services, including fibre to the premises, as well as improved churn reflecting our focus on executing customers first initiatives and retention programs. Our continued focus on connecting more homes and businesses directly to fibre (with TELUS PureFibre available to 61% of our broadband footprint at the end of 2018), expanding and enhancing our addressable high-speed Internet and Optik TV footprint, and bundling these services together contributed to combined Internet and TV subscriber growth of 110,000 over the last 12 months.
· Net additions of TELUS TV subscribers were 63,000 in 2018, reflecting an increase of 28,000 due to a lower customer churn rate from stronger retention efforts and higher gross additions in response to our diverse product offerings.
· Residential NAL losses were 51,000 in 2018, as compared to NAL losses of 76,000 in 2017. The residential NAL losses continue to reflect the trend of substitution to wireless and Internet-based services, partially mitigated by the success of our stronger retention efforts.
Other operating income increased by $88 million in 2018, mainly due to the third quarter of 2018 equity income related to real estate joint ventures arising from the sale of TELUS Garden, as noted in Section 1.3, of which 50% of the total of $171 million was allocated to each of the wireless and wireline segments. Excluding the effect of the equity income related to real estate joint ventures arising from the sale of TELUS Garden, Other operating income increased by $3 million in 2018 due to gains on the sale of certain assets, partly offset by a decrease in amounts recognized from the regulatory price cap deferral account for the provisioning of broadband Internet services to eligible rural and remote communities.
Intersegment revenues represent services including CCBS provided to the wireless segment. Such revenue is eliminated upon consolidation together with the associated expenses in wireless.
Operating expenses – Wireline segment
Years ended December 31 ($ in millions) |
| 2018 |
| 2017 |
| Change |
|
| Applying IFRS 9 and IFRS 15 |
|
| ||
Goods and services purchased1,2 |
| 2,561 |
| 2,343 |
| 9.3% |
Employee benefits expense1 |
| 2,206 |
| 1,940 |
| 13.7% |
Wireline operating expenses |
| 4,767 |
| 4,283 |
| 11.3% |
1 Includes restructuring and other costs. See Section 11.1 Non-GAAP and other financial measures.
2 Includes a donation to the TELUS Friendly Future Foundation allocated to the wireline segment of $59 million (50% of the total of $118 million) recorded in other costs in the third quarter of 2018.
Total wireline operating expenses increased by $484 million in 2018.
Goods and services purchased increased by $218 million in 2018, primarily due to the third quarter of 2018 donation to the TELUS Friendly Future Foundation, as noted in Section 1.3, of which 50% of the total of $118 million was allocated to each of the wireless and wireline segments. Excluding the effect of the donation, Goods and services purchased increased by $159 million in 2018, mainly due to higher product costs associated with equipment sales and TELUS Health services, higher TV content costs mainly driven by our growing TV subscriber base (excluding the Satellite TV subscriber adjustment), and increases in external labour, employee-related and other costs related to business acquisitions.
Employee benefits expense increased by $266 million in 2018, mainly due to increases in compensation and benefit costs resulting from an increase in the number of employees from business acquisitions and higher labour-related restructuring costs related to efficiency initiatives in the year. These increases were partly offset by a decrease in the number of domestic FTEs, excluding business acquisitions, and higher capitalized labour costs, including contract acquisition and fulfilment costs.
EBITDA – Wireline segment
Years ended December 31 |
|
|
|
|
|
|
($ in millions, except margins) |
| 2018 |
| 2017 |
| Change |
|
| Applying IFRS 9 and IFRS 15 |
|
| ||
EBITDA |
| 1,673 |
| 1,660 |
| 0.8% |
Add back restructuring and other costs included in EBITDA1 |
| 202 |
| 60 |
| n/m |
Deduct non-recurring gains and equity income related to real estate joint ventures2 |
| (86 | ) | (1 | ) | n/m |
Adjusted EBITDA3 |
| 1,789 |
| 1,719 |
| 4.1% |
EBITDA margin (%) |
| 26.0 |
| 27.9 |
| (1.9) pts. |
Adjusted EBITDA margin4 (%) |
| 28.2 |
| 28.9 |
| (0.7) pts. |
1 Includes a donation to the TELUS Friendly Future Foundation allocated to the wireline segment of $59 million (50% of the total of $118 million) recorded in other costs in the third quarter of 2018.
2 Includes equity income related to real estate joint ventures allocated to the wireline segment of $86 million (50% of the total of $171 million) arising from the sale of TELUS Garden recorded in the third quarter of 2018.
3 See description under EBITDA in Section 11.1 Non-GAAP and other financial measures.
4 Adjusted EBITDA margin is Adjusted EBITDA divided by Operating revenues, where the calculation of Operating revenues excludes non-recurring gains and equity income related to real estate joint ventures.
Wireline EBITDA increased by $13 million or 0.8% in 2018. Wireline Adjusted EBITDA increased by $70 million or 4.1% in 2018, reflecting an increased contribution from our CCBS business arising primarily from business acquisitions, higher Internet and TELUS Health margins, and higher margins in other services and equipment, partly offset by the continued declines in legacy voice services and a decline in the EBITDA contribution from our business services.
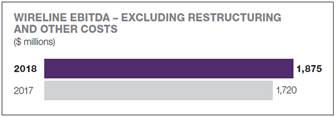

MD&A: CHANGES IN FINANCIAL POSITION
|
|
6 | Changes in financial position |
|
|
|
|
|
|
|
|
|
|
|
|
Financial position at December 31 ($ millions) |
| 2018 |
| 2017 |
| Change |
| Change includes:
|
|
| Applying IFRS 9 and IFRS 15 |
|
|
|
| ||||
Current assets |
|
|
|
|
|
|
|
|
|
Cash and temporary investments, net |
| 414 |
| 509 |
| (95 | ) | See Section 7 Liquidity and capital resources |
|
Accounts receivable |
| 1,600 |
| 1,614 |
| (14 | ) | A decrease in roaming revenue accruals, as well as receipt of vendor credits and a 2017 refund for MTS subscribers not migrated to TELUS, partly offset by an increase in sales and subscriber growth |
|
Income and other taxes receivable |
| 3 |
| 96 |
| (93 | ) | Refunds received, as well as Income and other taxes payable for the current year, which more than offset Income and other taxes receivable for prior years |
|
Inventories |
| 376 |
| 380 |
| (4 | ) | A decrease in volume of handsets, partly offset by a higher cost mix of smartphones |
|
Contract assets |
| 860 |
| 757 |
| 103 |
| An increase primarily driven by a higher number of contracted subscribers, as well as higher contract amounts per subscriber, in the period |
|
Prepaid expenses |
| 539 |
| 493 |
| 46 |
| An increase in costs incurred to obtain or fulfill a contract with a customer |
|
Current derivative assets |
| 49 |
| 18 |
| 31 |
| An increase in the nominal amounts of U.S. currency hedging items and a favourable change in the spread between the hedging rate and the actual rate at the balance sheet date. |
|
Current liabilities |
|
|
|
|
|
|
|
|
|
Short-term borrowings |
| 100 |
| 100 |
| – |
| See Section 7.7 Sale of trade receivables |
|
Accounts payable and accrued liabilities |
| 2,570 |
| 2,460 |
| 110 |
| An increase in network-related accruals and payroll and other employee-related liabilities, partly offset by the timing of accounts payable and wireless handset purchases. See Note 23 of the Consolidated financial statements |
|
Income and other taxes payable |
| 218 |
| 34 |
| 184 |
| Current income tax expense in excess of instalments |
|
Dividends payable |
| 326 |
| 299 |
| 27 |
| Effects of an increase in the dividend rate, as well as an increase in the number of shares outstanding |
|
Advance billings and customer deposits |
| 653 |
| 632 |
| 21 |
| An increase in advance billings reflecting increased wireless subscriber growth during the year. See Note 24 of the Consolidated financial statements |
|
Provisions |
| 129 |
| 78 |
| 51 |
| New restructuring provisions exceeded restructuring disbursements. See Note 25 of the Consolidated financial statements |
|
Current maturities of long-term debt |
| 836 |
| 1,404 |
| (568 | ) | A decrease in outstanding commercial paper and maturation of $250 of our 1.50% Notes, Series CS in March 2018 |
|
Current derivative liabilities |
| 9 |
| 33 |
| (24 | ) | A decrease in the nominal amounts of U.S. currency hedging items. |
|
Working capital |
| (1,000 | ) | (1,173 | ) | 173 |
| TELUS normally has a negative working capital position. See Financing and capital structure management plans in Section 4.3 and the Liquidity risk discussion in Section 7.9.
|
|
|
|
|
|
|
|
|
|
|
|
Financial position at December 31 ($ millions) |
| 2018 |
| 2017 |
| Change |
| Change includes:
|
|
| Applying IFRS 9 and IFRS 15 |
|
|
|
| ||||
Non-current assets |
|
|
|
|
|
|
|
|
|
Property, plant and equipment, net |
| 12,091 |
| 11,368 |
| 723 |
| See Capital expenditures in Section 7.3 Cash used by investing activities and Depreciation in Section 5.3 |
|
Intangible assets, net |
| 10,956 |
| 10,658 |
| 298 |
| See Capital expenditures in Section 7.3 Cash used by investing activities and Amortization of intangible assets in Section 5.3 |
|
Goodwill, net |
| 4,733 |
| 4,236 |
| 497 |
| Acquisitions including Xavient Information Systems, Medisys Health Group Inc., and home and business security companies |
|
Contract assets |
| 458 |
| 396 |
| 62 |
| An increase primarily driven by a higher number of contracted subscribers, as well as higher contract amounts per subscriber, in the period |
|
Other long-term assets |
| 986 |
| 528 |
| 458 |
| An increase in pension assets resulting from actuarial gains primarily arising from financial assumption changes in the pension plans, as well as an increase in the nominal amounts of U.S. currency hedging items, a favourable change in the spread between the hedging rate and the actual rate at the balance sheet date, and a net increase in investments. See Note 20 of the Consolidated financial statements. |
|
Non-current liabilities |
|
|
|
|
|
|
|
|
|
Provisions |
| 728 |
| 511 |
| 217 |
| An increase due to written put options in connection with a business acquisition in respect of non-controlling interests. See Note 25 of the Consolidated financial statements |
|
Long-term debt |
| 13,265 |
| 12,256 |
| 1,009 |
| See Section 7.4 Cash used by financing activities |
|
Other long-term liabilities |
| 738 |
| 847 |
| (109 | ) | A decrease in pension and post-retirement liabilities resulting from actuarial gains primarily arising from financial assumption changes in the pension plans, as well as a decrease in the nominal amounts of U.S. currency hedging items and a favourable change in the spread between the hedging rate and the actual rate at the balance sheet date. See Note 27 of the Consolidated financial statements |
|
Deferred income taxes |
| 3,152 |
| 2,941 |
| 211 |
| An increase in temporary differences between the accounting and tax basis of assets and liabilities, including employee benefit plan re-measurements recorded in Other comprehensive income. |
|
Owners’ equity |
|
|
|
|
|
|
|
|
|
Common equity |
| 10,259 |
| 9,416 |
| 843 |
| See Consolidated statements of changes in owners’ equity in the Consolidated financial statements |
|
Non-controlling interests |
| 82 |
| 42 |
| 40 |
| See Consolidated statements of changes in owners’ equity in the Consolidated financial statements.
|
|
MD&A: LIQUIDITY AND CAPITAL RESOURCES
|
|
7 | Liquidity and capital resources |
|
|
This section contains forward-looking statements, including those with respect to our dividend payout ratio and net debt to EBITDA – excluding restructuring and other costs ratio. See Caution regarding forward-looking statements at the beginning of this MD&A.
7.1 Overview
Our capital structure financial policies and financing and capital structure management plans are described in Section 4.3.
Cash flows
Years ended December 31 ($ millions)
| 2018
| 2017
| Change
|
|
| Applying IFRS 9 and IFRS 15 |
|
| |
Cash provided by operating activities | 4,058 | 3,947 | 111 |
|
Cash used by investing activities | (2,977) | (3,643) | 666 |
|
Cash used by financing activities | (1,176) | (227) | (949 | ) |
Increase (decrease) in Cash and temporary investments, net | (95) | 77 | (172 | ) |
Cash and temporary investments, net, beginning of period | 509 | 432 | 77 |
|
Cash and temporary investments, net, end of period | 414 | 509 | (95 | ) |
7.2 Cash provided by operating activities
Analysis of changes in cash provided by operating activities
Years ended December 31 ($ millions)
| 2018
| 2017
| Change
|
|
| Applying IFRS 9 and IFRS 15 |
|
| |
EBITDA (see Section 5.4 and Section 5.5) | 5,104 | 4,910 | 194 |
|
Restructuring and other costs, net of disbursements and Shares settled from Treasury | 178 | (21) | 199 |
|
Employee defined benefit plans expense, net of employer contributions | 42 | 15 | 27 |
|
Share-based compensation expense, net of payments | 6 | 17 | (11 | ) |
Interest paid, net of interest received | (606) | (532) | (74 | ) |
Income taxes paid, net of recoveries received | (197) | (191) | (6 | ) |
Other operating working capital changes | (469) | (251) | (218 | ) |
Cash provided by operating activities | 4,058 | 3,947 | 111 |
|
· Restructuring and other costs, net of disbursements and Shares settled from Treasury represented a net change of $199 million in 2018. This was largely attributed to our donation to the TELUS Friendly Future Foundation, as noted in Section 1.3, in addition to an increase in restructuring and other costs expense not yet disbursed related to improving our overall cost structure and operational effectiveness.
· Interest paid, net of interest received increased by $74 million, largely due to the long-term debt prepayment premium described in Section 5.3, in addition to an increase in the average long-term debt balance, along with a higher average effective interest rate in 2018.
· For a discussion of Other operating working capital changes, see Section 6 Changes in financial position and Note 31(a) of the Consolidated financial statements.

7.3 Cash used by investing activities
Analysis of changes in cash used by investing activities
Years ended December 31 ($ millions)
| 2018
| 2017
| Change
|
|
| Applying IFRS 9 and IFRS 15 |
|
| |
Cash payments for capital assets, excluding spectrum licences | (2,874) | (3,081) | 207 |
|
Cash payments for spectrum licences | (1) | – | (1 | ) |
Cash payments for acquisitions, net | (280) | (564) | 284 |
|
Real estate joint ventures receipts, net of advances (advances, net of receipts) | 162 | (8) | 170 |
|
Proceeds on dispositions and Other | 16 | 10 | 6 |
|
Cash used by investing activities | (2,977) | (3,643) | 666 |
|
· The decrease in Cash payments for capital assets, excluding spectrum licences for 2018 was primarily composed of:
· A decrease in capital expenditures of $180 million in 2018 (see Capital expenditure measures table and discussion below).
· Lower capital expenditure payments with respect to payment timing differences, as the change in associated Accounts payable and accrued liabilities increased by $74 million in 2018.
· In 2018, we made cash payments for business acquisitions, including Medisys Health Group Inc., home and business security-related acquisitions including certain assets of AlarmForce Industries Inc., 65% of Xavient Information Systems (Xavient) and other individually immaterial acquisitions complementary to our existing lines of business. This is compared to business acquisition activity in 2017, which included 55% of Voxpro Limited, certain assets of Manitoba Telecom Services Inc. and the Kroll Computer Systems Inc. transaction.
· Real estate joint ventures receipts, net of advances increased by $170 million in 2018, attributed to funds repaid to us and earnings distributed from the TELUS Garden real estate joint venture arising from the sale of TELUS Garden, as noted in Section 1.3.
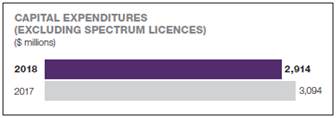
Capital expenditure measures
Years ended December 31
($ in millions, except capital intensity)
| 2018
| 2017
| Change
|
| Applying IFRS 9 and IFRS 15 |
| |
Capital expenditures1 |
|
|
|
Wireless segment | 896 | 978 | (8.4)% |
Wireline segment | 2,018 | 2,116 | (4.6)% |
Consolidated | 2,914 | 3,094 | (5.8)% |
Wireless segment capital intensity (%) | 11 | 13 | (2) pts. |
Wireline segment capital intensity (%) | 31 | 36 | (5) pts. |
Consolidated capital intensity2 (%) | 20 | 23 | (3) pts. |
1 Capital expenditures include assets purchased but not yet paid for, and therefore differ from Cash payments for capital assets, excluding spectrum licences, as presented on the Consolidated statements of cash flows.
2 See Section 11.1 Non-GAAP and other financial measures.
Wireless segment capital expenditures decreased by $82 million in 2018, as we incurred costs in 2017 to update our radio access network technology in Ontario and Quebec, which was completed in the second quarter of 2017.
Wireline segment capital expenditures decreased by $98 million in 2018, primarily reflecting the planned reduction in our capital spend. We continued connecting additional homes and businesses directly to our fibre-optic technology and our investments support systems reliability and operational efficiency and effectiveness. These investments support our high-speed Internet and TELUS TV subscriber growth, as well as our customers’ demand for faster Internet speeds, and extend the reach and functionality of our business and healthcare solutions. At December 31, 2018, we made TELUS PureFibre available to 61% of our broadband footprint.
7.4 Cash used by financing activities
Analysis of changes in cash used by financing activities
Years ended December 31 ($ millions) | 2018 | 2017 | Change |
|
| Applying IFRS 9 and IFRS 15 |
|
| |
Dividends paid to holders of Common Shares | (1,141) | (1,082) | (59 | ) |
Treasury shares acquired | (100) | – | (100 | ) |
Repayment of short-term borrowings, net | (67) | – | (67 | ) |
Long-term debt issued, net of redemptions and repayment | 123 | 865 | (742 | ) |
Issue of shares by subsidiary to non-controlling interests | 24 | (1) | 25 |
|
Other | (15) | (9) | (6 | ) |
| (1,176) | (227) | (949 | ) |
Dividends paid to holders of Common Shares
In connection with dividends declared during 2018, the dividend reinvestment and share purchase plan trustee (Trustee) purchased shares from Treasury for the dividend reinvestment and share purchase plan instead of acquiring Common Shares in the stock market. During 2018, cash dividends paid to the holders of Common Shares increased by $59 million, which reflects higher dividend rates under our dividend growth program (see Section 4.3), as well as an increase in the number of shares outstanding. During 2018, the Trustee purchased dividend reinvestment Common Shares for $85 million, with no discount applicable.
In January 2019, we paid dividends of $303 million to the holders of Common Shares and the Trustee purchased dividend reinvestment Common Shares from Treasury for $23 million, totalling $326 million.
Treasury shares acquired
As noted in Section 1.3, an initial donation of $100 million to the TELUS Friendly Future Foundation was made in TELUS Corporation Common Shares acquired in the market in the third quarter of 2018.
Repayment of short-term borrowings, net
In connection with our third quarter of 2018 acquisition of Medisys Health Group Inc., we repaid short-term borrowings of $62 million.
Long-term debt issues and repayments
For the full year of 2018, long-term debt issues net of repayments were $123 million, a decrease of $742 million, primarily composed of:
· A net decrease in commercial paper, including foreign exchange effects, of $366 million to a balance of $774 million (US$569 million) at December 31, 2018, from a balance of $1,140 million (US$908 million) at December 31, 2017. Our commercial paper program, when utilized, provides low-cost funds and is fully backstopped by the five-year committed credit facility (see Section 7.6 Credit facilities).
· An increase in net draws on the TELUS International (Cda) Inc. credit facility, including foreign exchange effects, of $81 million (US$37 million). As at December 31, 2018, net draws were $427 million ($419 million net of unamortized issue costs), all of which were denominated in U.S. dollars (US$313 million). As at December 31, 2017, net draws were $346 million ($339 million net of unamortized issue costs), all of which were denominated in U.S. dollars (US$276 million). The increase in net draws on the TELUS International (Cda) Inc. credit facility was used to fund the acquisition of 65% of Xavient. The credit facility is non-recourse to TELUS Corporation.
MD&A: LIQUIDITY AND CAPITAL RESOURCES
· The March 1, 2018, issues of $600 million of senior unsecured Series CX notes at 3.625% due March 1, 2028, and $150 million through the re-opening of Series CW notes at 4.70% due March 6, 2048. For additional information on these notes, refer to Note 26(b) of the Consolidated financial statements.
· The June 2018 issue of US$750 million of senior unsecured 30-year notes at 4.60% due November 16, 2048. We have fully hedged the principal and interest obligations of the notes against fluctuations in the Canadian dollar foreign exchange rate for the entire term of the notes by entering into a foreign exchange derivative (a cross currency interest rate exchange agreement), which effectively converted the principal payments and interest obligations to Canadian dollar obligations with a fixed interest rate of 4.41% and an issued and outstanding amount of $974 million (reflecting a fixed exchange rate of $1.2985).
· The March 2018 repayment of $250 million of Series CS notes.
· The August 1, 2018, early full redemption of $1 billion of Series CG notes at 5.05% due December 4, 2019. The long-term debt prepayment premium recorded in the three-month period ended September 30, 2018, was $34 million before income taxes.
In comparison, for the full year of 2017, long-term debt issues net of repayments were $865 million and were primarily composed of:
· A net increase in commercial paper, including foreign exchange effects, of $527 million from a balance of $613 million (US$456 million) at December 31, 2016.
· An increase in net draws on the TELUS International (Cda) Inc. credit facility, including foreign exchange effects, of $6 million (US $23 million). As at December 31, 2016, net draws were $340 million ($332 million net of unamortized issue costs), all of which were denominated in U.S. dollars (US$253 million).
· The March 2017 issues of US$500 million of senior unsecured notes at 3.70%, due September 15, 2027, and $325 million of senior unsecured notes at 4.70% due March 6, 2048.
· The March 2017 repayment of $700 million of Series CD Notes.
The average term to maturity of our long-term debt (excluding commercial paper, the revolving component of the TELUS International (Cda) Inc. credit facility and finance leases) was approximately 12.2 years as at December 31, 2018, increasing from approximately 10.7 years as at December 31, 2017. Additionally, our weighted average cost of long-term debt (excluding commercial paper, the revolving component of the TELUS International (Cda) Inc. credit facility and finance leases) was 4.18% as at both December 31, 2018, and 2017.
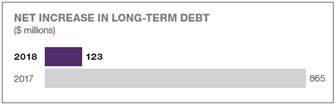

Issue of shares by subsidiary to non-controlling interests
In connection with our first quarter of 2018 acquisition of 65% of Xavient, our TELUS International (Cda) Inc. subsidiary issued shares to non-controlling interests.
7.5 Liquidity and capital resource measures
Net debt was $13.8 billion at December 31, 2018, an increase of $0.4 billion when compared to one year earlier, resulting mainly from the issuances of the US$750 million of senior unsecured notes, $600 million of Series CX notes and $150 million through the re-opening of Series CW notes as described in Section 7.4, as well as lower Cash and temporary investments, net. These increases were partially offset by a net reduction of commercial paper outstanding, the repayment of Series CS Notes and the early redemption of Series CG Notes as described in Section 7.4. The calculation of Net debt will be impacted by the application of IFRS 16, Leases, as described in Section 8.2 and Note 2(b) of the Consolidated financial statements.
Fixed-rate debt as a proportion of total indebtedness was 91% as at December 31, 2018, up from 89% one year earlier, mainly due to a net decrease in commercial paper, which emulates floating-rate debt, as well as the June 2018 note issuance and the two unsecured note issuances in the first quarter of 2018 described in Section 7.4. This was partly offset by an increase in the amounts drawn on the TELUS International (Cda) Inc. credit facility, which is non-recourse to TELUS Corporation, and the early redemption of Series CG Notes.
Net debt to EBITDA – excluding restructuring and other costs ratio was 2.54 times, as measured at December 31, 2018, down from 2.67 times one year earlier, partly attributed to current year equity income related to real estate joint ventures arising from the sale of TELUS Garden. Excluding the equity income related to real estate joint ventures of $171 million arising from the sale of TELUS Garden, the ratio was 2.62 times as at December 31, 2018. Our long-term objective for this measure is within a range of 2.00 to 2.50 times, which we believe is consistent with maintaining investment grade credit ratings in the range of BBB+, or the equivalent, and providing reasonable access to capital. As at December 31, 2018, this ratio remains outside of the long-term objective range due to prior issuances of incremental debt, primarily for the acquisition in 2014 and 2015 of spectrum licences for approximately $3.6 billion and the elevated strategic capital investments in our fibre-optic infrastructure, partially offset by growth in EBITDA – excluding restructuring and other costs. These acquired licences have more than doubled our national spectrum holdings and represent an investment to extend our network capacity to support continuing data consumption growth, as well as growth in our wireless customer base. Given the cash demands of upcoming spectrum auctions, the assessment of this guideline and return to the objective range remains to be determined; however, it is our intent to return to a ratio below 2.50 times in the medium term, consistent with our long-term strategy. While this ratio exceeds our long-term objective range, we are well in compliance with the leverage ratio covenant in our credit facilities, which states that we may not permit our net debt to operating cash flow ratio to exceed 4.00:1.00 (see Section 7.6 Credit facilities). The calculation of EBITDA – excluding restructuring and other costs will be impacted by the application of IFRS 16 as described in Section 8.2 and Note 2(b) of the Consolidated financial statements.

Liquidity and capital resource measures
As at, or years ended, December 31
| 2018
| 2017
| Change
|
| Applying IFRS 9 and IFRS 15 |
| |
Components of debt and coverage ratios1 ($ millions) |
|
|
|
Net debt | 13,770 | 13,422 | 348 |
EBITDA – excluding restructuring and other costs | 5,421 | 5,027 | 394 |
Net interest cost | 644 | 567 | 77 |
Debt ratios |
|
|
|
Fixed-rate debt as a proportion of total indebtedness (%) | 91 | 89 | 2 pts. |
Average term to maturity of long-term debt (excluding commercial paper, the revolving component of the TELUS International (Cda) Inc. credit facility and finance leases) (years) | 12.2 | 10.7 | 1.5 |
Weighted average interest rate on long-term debt (excluding commercial paper, the revolving component of the TELUS International (Cda) Inc. credit facility and finance leases) (%) | 4.18 | 4.18 | – pts. |
Net debt to EBITDA – excluding restructuring and other costs1,2 (times) | 2.54 | 2.67 | (0.13) |
Coverage ratios1 (times) |
|
|
|
Earnings coverage | 4.4 | 4.8 | (0.4) |
EBITDA – excluding restructuring and other costs interest coverage | 8.4 | 8.9 | (0.5) |
Other measures1 (%) |
|
|
|
Dividend payout ratio | 78 | 80 | (2) pts. |
Dividend payout ratio of adjusted net earnings | 81 | 80 | 1 pt. |
1 See Section 11.1 Non-GAAP and other financial measures.
2 Excluding the third quarter of 2018 equity income related to real estate joint ventures of $171 million arising from the sale of TELUS Garden, the ratio was 2.62 at December 31, 2018.
Earnings coverage ratio for 2018 was 4.4 times, down from 4.8 times one year earlier. An increase in income before borrowing costs and income taxes increased the ratio by 0.1, while an increase in borrowing costs reduced the ratio by 0.5.
EBITDA – excluding restructuring and other costs interest coverage ratio for 2018 was 8.4 times, down from 8.9 times one year earlier. Growth in EBITDA – excluding restructuring and other costs increased the ratio by 0.6, while an increase in net interest costs reduced the ratio by 1.1.
Dividend payout ratios: Actual dividend payout decisions will continue to be subject to our Board’s assessment and the determination of our financial position and outlook, as well as our long-term dividend payout objective range of 65 to 75% of prospective net earnings per share. The disclosed basic and adjusted dividend payout ratios are historical measures utilizing the last four quarters of dividends declared and
earnings per share. We currently expect that we will be within our objective range when considered on a prospective dividend payout ratio basis within the medium term. The historical measures for the 12-month period ended December 31, 2018, are presented for illustrative purposes in evaluating our target guideline, and both exceeded the objective range.
7.6 Credit facilities
At December 31, 2018, we had available liquidity of approximately $1.5 billion from the TELUS revolving credit facility and approximately $205 million of available liquidity from the TELUS International (Cda) Inc. credit facility. In addition, we had $400 million available under our trade receivables securitization program (see Section 7.7 Sale of trade receivables). We are well within our objective of generally maintaining at least $1.0 billion of available liquidity.
MD&A: LIQUIDITY AND CAPITAL RESOURCES
TELUS revolving credit facility
We have a $2.25 billion (or U.S. dollar equivalent) revolving credit facility with a syndicate of financial institutions, which was renewed in May 2018 and which extended the expiration date from May 31, 2021 to May 31, 2023. The revolving credit facility is used for general corporate purposes, including the backstop of commercial paper, as required.
TELUS revolving credit facility at December 31, 2018
|
|
|
| Outstanding | Backstop |
|
|
|
|
| undrawn letters | for commercial | Available |
($ millions)
| Expiry
| Size
| Drawn
| of credit
| paper program
| liquidity
|
Five-year revolving facility1 | May 31, 2021 | 2,250 | – | – | (774) | 1,476 |
1 Canadian dollars or U.S. dollar equivalent.
Our revolving credit facility contains customary covenants, including a requirement that we not permit our consolidated leverage ratio to exceed 4.00 to 1.00 and that we not permit our consolidated coverage ratio to be less than 2.00 to 1.00 at the end of any financial quarter. As at December 31, 2018, our consolidated leverage ratio was approximately 2.54 to 1.00, and our consolidated coverage ratio was approximately 8.42 to 1.00. These ratios are expected to remain well within the covenants. There are certain minor differences in the calculation of the leverage ratio and coverage ratio under the revolving credit facility, as compared with the calculation of Net debt to EBITDA – excluding restructuring and other costs and EBITDA – excluding restructuring and other costs interest coverage. Historically, the calculations have not been materially different. The covenants are not impacted by revaluation, if any, of Property, plant and equipment, Intangible assets or Goodwill for accounting purposes. Continued access to our credit facilities is not contingent on maintaining a specific credit rating.
Commercial paper
TELUS Corporation has an unsecured commercial paper program, which is backstopped by our revolving credit facility, enabling us to issue commercial paper up to a maximum aggregate amount of $1.4 billion as at December 31, 2018, including a U.S. dollar-denominated commercial paper program for up to US$1.0 billion within this maximum aggregate amount. Foreign currency forward contracts are used to manage currency risk arising from issuing commercial paper denominated in U.S. dollars. The commercial paper program is to be used for general corporate purposes, including, but not limited to, capital expenditures and investments. Our ability to reasonably access the commercial paper market in Canada and the U.S. is dependent on our credit ratings (see Section 7.8 Credit ratings).
TELUS International (Cda) Inc. credit facility
As at December 31, 2018, TELUS International (Cda) Inc. had a bank credit facility, secured by its assets, expiring on December 20, 2022, with a syndicate of financial institutions. The credit facility is composed of a US$350 million (2017 – US$350 million) revolving component and an amortizing US$120 million (2017 – US$120 million) term loan component. The credit facility is non-recourse to TELUS Corporation. As at December 31, 2018, $427 million ($419 million net of unamortized issue costs) was outstanding, all of which was denominated in U.S. dollars (US$313 million), with the revolving component having a weighted average interest rate of 4.22%.
Other letter of credit facilities
At December 31, 2018, we had $184 million of letters of credit outstanding (2017 – $224 million) issued under various uncommitted facilities; such letter of credit facilities are in addition to the ability to provide letters of credit pursuant to our committed bank credit facility. Available liquidity under various uncommitted letters of credit facilities was $131 million at December 31, 2018. We have arranged incremental letters of credit to allow us to participate in Innovation, Science and Economic Development Canada’s 600 MHz wireless spectrum auction that is to be held in March 2019. Under the terms of the auction, communications between bidders that would provide insights into bidding strategies, including reference to preferred blocks, technologies or valuations, are precluded until the deadline for the final payment in the auction. Disclosure of the precise amount of our letters of credit could be interpreted as a signal of bidding intentions. The maximum amount of letters of credit that any individual participant could be required to deliver is approximately $880 million.
7.7 Sale of trade receivables
TELUS Communications Inc., a wholly owned subsidiary of TELUS, is a party to an agreement with an arm’s-length securitization trust associated with a major Schedule I Canadian bank, under which it is able to sell an interest in certain trade receivables for an amount up to a maximum of $500 million. The agreement is in effect until December 31, 2021 (2017 – December 31, 2018), and available liquidity was $400 million as at December 31, 2018. (See Note 22 of the Consolidated financial statements.) Sales of trade receivables in securitization transactions are recognized as collateralized Short-term borrowings and thus do not result in our de-recognition of the trade receivables sold.
TELUS Communications Inc. is required to maintain at least a BB credit rating by DBRS Ltd., or the securitization trust may require the sale program to be wound down prior to the end of the term. The necessary credit rating was exceeded as of February 14, 2019.
7.8 Credit ratings
There were no changes to our investment grade credit ratings during 2018, or as of February 14, 2019. We believe adherence to most of our stated financial policies (see Section 4.3), coupled with our efforts to maintain a constructive relationship with banks, investors and credit rating agencies, continues to provide reasonable access to capital markets. (See discussion of risks in Section 10.7 Financing, debt requirements and returning cash to shareholders.)
7.9 Financial instruments, commitments and contingent liabilities
Financial instruments
Our financial instruments, their accounting classification and the nature of certain risks that they may be subject to are set out below and described in Note 4 of the Consolidated financial statements. Our policies in respect of the recognition and measurement of financial instruments are described in Note 1(c) of the Consolidated financial statements.
|
|
|
| Risks | ||||||||
|
|
|
|
|
|
|
| Market risks | ||||
Financial instrument |
| Accounting classification |
| Credit |
| Liquidity |
| Currency |
| Interest rate |
| Other price |
Measured at amortized cost |
|
|
|
|
|
|
|
|
|
|
|
|
Accounts receivable |
| AC1 |
| X |
|
|
| X |
|
|
|
|
Contract assets |
| AC1 |
| X |
|
|
|
|
|
|
|
|
Construction credit facilities advances to real estate joint venture |
| AC1 |
|
|
|
|
|
|
| X |
|
|
Short-term obligations |
| AC1 |
|
|
| X |
| X |
| X |
|
|
Accounts payable |
| AC1 |
|
|
| X |
| X |
|
|
|
|
Provisions |
| AC1 |
|
|
| X |
| X |
|
|
| X |
Long-term debt |
| AC1 |
|
|
| X |
| X |
| X |
|
|
Measured at fair value |
|
|
|
|
|
|
|
|
|
|
|
|
Cash and temporary investments |
| FVTPL2 |
| X |
|
|
| X |
| X |
|
|
Long-term investments (not subject to significant influence)3 |
| FVTPL/FVOCI3 |
|
|
|
|
| X |
|
|
| X |
Foreign exchange derivatives4 |
| FVTPL2 |
| X |
| X |
| X |
|
|
|
|
Share-based compensation derivatives4 |
| FVTPL2 |
| X |
| X |
|
|
|
|
| X |
1 For accounting recognition and measurement purposes, classified as amortized cost (AC).
2 For accounting recognition and measurement purposes, classified as fair value through net income (FVTPL). Unrealized changes in the fair values of financial instruments are included in net income unless part of a cash flow hedging relationship. The effective portion of unrealized changes in the fair values of financial instruments held for hedging are included in other comprehensive income.
3 Long-term investments over which we do not have significant influence are measured at fair value if those fair values can be reliably measured. For accounting recognition and measurement purposes, on an investment-by-investment basis, long-term investments are classified as either fair value through net income or fair value through other comprehensive income (FVOCI).
4 Use of derivative financial instruments is subject to a policy which requires that no derivative transaction is to be entered into for the purpose of establishing a speculative or leveraged position (the corollary being that all derivative transactions are to be entered into for risk management purposes only) and sets criteria for the creditworthiness of the transaction counterparties.
Derivatives that are part of an established and documented cash flow hedging relationship are accounted for as held for hedging. We believe that classification as held for hedging results in a better matching of the change in the fair value of the derivative financial instrument with the risk exposure being hedged.
In respect of hedges of anticipated transactions, hedge gains/losses are included with the expenditure and are expensed when the transaction is recognized in our results of operations. We have selected this method as we believe that it results in a better matching of the hedge gains/losses with the risk exposure being hedged.
Derivatives that are not part of a documented cash flow hedging relationship are accounted for as held for trading and thus are measured at fair value through net income.
Credit risk
Credit risk arises from Cash and temporary investments, Accounts receivable, Contract assets and derivative financial instruments. We mitigate credit risk as follows:
· Credit risk associated with Cash and temporary investments is managed by ensuring that these financial assets are placed with governments, major financial institutions that have been accorded strong investment grade ratings by a primary rating agency, and/or other creditworthy counterparties. An ongoing review is performed to evaluate changes in the status of counterparties.
· Credit risk associated with Accounts receivable is inherently managed by the size and diversity of our large customer base, which includes substantially all consumer and business sectors in Canada. We follow a program of credit evaluations of customers and limit the amount of credit extended when deemed necessary. As at December 31, 2018, the weighted average age of past-due customer Accounts receivable was 56 days (2017 – 60 days).
We maintain allowances for lifetime expected credit losses related to doubtful accounts. Current economic conditions (including forward-looking macroeconomic data), historical information (including credit agency reports, if available), reasons for the accounts being past-due and line of business from which the customer Accounts receivable arose are all considered when determining whether to make allowances for past-due accounts. The same factors are considered when determining whether to write off amounts charged to the allowance for doubtful accounts against the customer Accounts receivable. The doubtful accounts expense is calculated on a specific-identification basis for customer Accounts receivable above a specific balance threshold and on a statistically derived allowance basis for the remainder. No customer Accounts receivable are written off directly to the doubtful accounts expense.
MD&A: LIQUIDITY AND CAPITAL RESOURCES
· Credit risk associated with Contract assets is inherently managed by the size and diversity of our large customer base, which includes substantially all customer and business sectors in Canada. We follow a program of credit evaluations of customers and limit the amount of credit extended when deemed necessary.
We maintain allowances for lifetime expected credit losses related to contract assets. Current economic conditions, historical information (including credit agency reports, if available), and the line of business from which the contract asset arose are all considered when determining impairment allowances. The same factors are considered when determining whether to write off amounts charged to the impairment allowance for contract assets against Contract assets.
· Counterparties to our share-based compensation cash-settled equity forward agreements and foreign exchange derivatives are major financial institutions that have been accorded investment grade ratings by a primary credit rating agency. The dollar amount of credit exposure under contracts with any one financial institution is limited and counterparties’ credit ratings are monitored. We do not give or receive collateral on swap agreements and hedging items due to our credit rating and those of our counterparties. While we are exposed to the risk of potential credit losses due to the possible non-performance of our counterparties, we consider this risk remote. Our derivative liabilities do not have credit risk-related contingent features.
Liquidity risk
Liquidity risk is the risk that we may not have cash available to satisfy our financial obligations as they come due. As a component of our capital structure financial policies, discussed in Section 4.3 Liquidity and capital resources, we manage liquidity risk by: maintaining a daily cash pooling process that enables us to manage our available liquidity and our liquidity requirements according to our actual needs; maintaining an agreement to sell trade receivables to an arm’s-length securitization trust; maintaining bilateral bank facilities and syndicated credit facilities; maintaining a commercial paper program; maintaining an in-effect shelf prospectus; continuously monitoring forecast and actual cash flows; and managing maturity profiles of financial assets and financial liabilities.
Our debt maturities in future years are as disclosed in the long-term debt principal maturities chart in Section 4.3. As at December 31, 2018, we had liquidity of more than $1.5 billion available from unutilized credit facilities (see Section 7.6 Credit facilities) and $400 million available under our trade receivables securitization program (see Section 7.7 Sale of trade receivables), and we could offer $2.5 billion of debt or equity securities pursuant to a shelf prospectus that is in effect until June 2020. This adheres to our objective of generally maintaining at least $1 billion of available liquidity. We believe that our investment grade credit ratings contribute to reasonable access to capital markets.
The expected maturities of our undiscounted financial liabilities do not differ significantly from the contractual maturities, other than as shown in the table in Note 4(c) of the Consolidated financial statements.
Currency risk
Our functional currency is the Canadian dollar, but certain routine revenues and operating costs are denominated in U.S. dollars and some inventory purchases and capital asset acquisitions are sourced inter-nationally. The U.S. dollar is the only foreign currency to which we have a significant exposure.
Our foreign exchange risk management includes the use of foreign currency forward contracts and currency options to fix the exchange rates on a varying percentage, typically in the range of 50 to 75%, of our domestic short-term U.S. dollar-denominated transactions and commitments and all U.S. dollar-denominated commercial paper. Other than in respect of U.S. dollar-denominated commercial paper, we designate only the spot element of these instruments as the hedging item; the forward element is wholly immaterial; in respect of U.S. dollar-denominated commercial paper, we designate the forward rate.
We are also exposed to currency risk in that the fair value or future cash flows of our U.S. Dollar Notes and our TELUS International (Cda) Inc. credit facility U.S. dollar borrowings could fluctuate because of changes in foreign exchange rates. Currency hedging relationships have been established for the related semi-annual interest payments and the principal payment at maturity in respect of the U.S. Dollar Notes; we designate only the spot element of these instruments as the hedging item; the forward element is wholly immaterial. As the functional currency of our TELUS International (Cda) Inc. subsidiary is the U.S. dollar, fluctuations in foreign exchange rates affecting its borrowings are reflected as a foreign currency translation adjustment within other comprehensive income.
Interest rate risk
Changes in market interest rates will cause fluctuations in the fair values or future cash flows of temporary investments, construction credit facility advances made to the real estate joint ventures, short-term obligations, long-term debt and interest rate swap derivatives.
When we have temporary investments, they have short maturities and fixed interest rates and as a result, their fair values will fluctuate with changes in market interest rates; absent monetization prior to maturity, the related future cash flows will not change due to changes in market interest rates.
If the balance of short-term investments includes dividend-paying equity instruments, we could be exposed to interest rate risk.
Due to the short-term nature of the applicable rates of interest charged, the fair value of the construction credit facility advances made to the real estate joint venture is not materially affected by changes in market interest rates; associated cash flows representing interest payments will be affected until such advances are repaid.
As short-term obligations arising from bilateral bank facilities, which typically have variable interest rates, are rarely outstanding for periods that exceed one calendar week, interest rate risk associated with this item is not material.
Short-term borrowings arising from the sales of trade receivables to an arm’s-length securitization trust are fixed-rate debt. Due to the short maturities of these borrowings, interest rate risk associated with this item is not material.
All of our currently outstanding long-term debt, other than commercial paper and amounts drawn on our credit facilities, is fixed-rate debt (see Section 7.5). The fair value of fixed-rate debt fluctuates with changes in market interest rates; absent early redemption, the related future cash flows will not change. Due to the short maturities of commercial paper, its fair value is not materially affected by changes in market interest rates, but the associated cash flows representing interest payments may be affected if the commercial paper is rolled over.
Amounts drawn on our short-term and long-term credit facilities will be affected by changes in market interest rates in a manner similar to commercial paper.
Other price risk
· Long-term investments: We are exposed to equity price risk arising from investments classified as fair value through other comprehensive income. Such investments are held for strategic rather than trading purposes.
· Share-based compensation derivatives: We are exposed to other price risk arising from cash-settled share-based compensation (appreciating Common Share prices increase both the expense and the potential cash outflow). Certain cash-settled equity swap agreements have been entered into that fix the cost associated with our estimate of our restricted stock units which are expected to vest and are not subject to performance conditions (see Note 14(b) of the Consolidated financial statements).
Market risks
Net income and Other comprehensive income for the years ended December 31, 2018 and 2017 could have varied if the Canadian dollar: U.S. dollar exchange rate and our Common Share price varied by reasonably possible amounts from their actual statement of financial position date amounts.
The sensitivity analysis of our exposure to market risks is shown in Note 4(g) of the Consolidated financial statements.
Fair values – General
The carrying values of Cash and temporary investments, Accounts receivable, short-term obligations, Short-term borrowings, Accounts payable and certain provisions (including restructuring provisions) approximate their fair values due to the immediate or short-term maturity of these financial instruments. The fair values are determined directly by reference to quoted market prices in active markets.
The fair values of our investment financial assets are based on quoted market prices in active markets or other clear and objective evidence of fair value.
The fair value of our Long-term debt is based on quoted market prices in active markets.
The fair values of the derivative financial instruments we use to manage our exposure to currency risk are estimated based upon quoted market prices in active markets for the same or similar financial instruments or on the current rates offered to us for financial instruments of the same maturity, as well as discounted future cash flows determined using current rates for similar financial instruments of similar maturities subject to similar risks (such fair value estimates being largely based on the Canadian dollar: U.S. dollar forward exchange rate as at the statement of financial position dates).
The fair values of the derivative financial instruments we use to manage our exposure to increases in compensation costs arising from certain forms of share-based compensation are based upon fair value estimates of the related cash-settled equity forward agreements provided by the counterparty to the transactions (such fair value estimates being largely based on our Common Share price as at the statement of financial position dates).
The derivative financial instruments that we measure at fair value on a recurring basis subsequent to initial recognition are as set out in Note 4(h) of the Consolidated financial statements.
Fair values – Derivative and non-derivative
The derivative financial instruments that we measure at fair value on a recurring basis subsequent to initial recognition, and our Long-term debt, which is measured at amortized cost, and the fair value thereof, are set out in tables in Note 4(h) of the Consolidated financial statements.
Recognition of derivative gains and losses
Gains and losses, excluding income tax effects, arising from derivative instruments that are classified as cash flow hedging items, as well as gains and losses arising from derivative instruments that are classified as held for trading and that are not designated as being in a hedging relationship, and their locations within the Consolidated statements of income and other comprehensive income, are detailed in Note 4(i) of the Consolidated financial statements.
MD&A: LIQUIDITY AND CAPITAL RESOURCES
Commitments and contingent liabilities
Contractual obligations as at December 31, 2018
($ millions) |
| 2019 |
| 2020 |
| 2021 |
| 2022 |
| 2023 |
| 2024-2028 |
| Thereafter |
| Total |
|
Short-term borrowings |
|
|
|
|
|
|
|
|
|
|
|
|
|
|
|
|
|
Interest obligations |
| 3 |
| 3 |
| 3 |
| – |
| – |
| – |
| – |
| 9 |
|
Principal obligations1 |
| – |
| – |
| 100 |
| – |
| – |
| – |
| – |
| 100 |
|
|
| 3 |
| 3 |
| 103 |
| – |
| – |
| – |
| – |
| 109 |
|
Long-term debt |
|
|
|
|
|
|
|
|
|
|
|
|
|
|
|
|
|
Interest obligations |
| 565 |
| 559 |
| 484 |
| 435 |
| 386 |
| 1,439 |
| 3,446 |
| 7,314 |
|
Principal maturities2 |
| 784 |
| 1,008 |
| 1,083 |
| 1,651 |
| 500 |
| 4,801 |
| 4,298 |
| 14,125 |
|
|
| 1,349 |
| 1,567 |
| 1,567 |
| 2,086 |
| 886 |
| 6,240 |
| 7,744 |
| 21,439 |
|
Finance leases |
|
|
|
|
|
|
|
|
|
|
|
|
|
|
|
|
|
Interest obligations |
| 3 |
| 1 |
| – |
| – |
| – |
| – |
| – |
| 4 |
|
Principal maturities2 |
| 52 |
| 50 |
| – |
| – |
| – |
| – |
| – |
| 102 |
|
|
| 55 |
| 51 |
| – |
| – |
| – |
| – |
| – |
| 106 |
|
Construction credit facilities commitment3 |
| 45 |
| – |
| – |
| – |
| – |
| – |
| – |
| 45 |
|
Minimum operating lease payments3,4 |
| 242 |
| 228 |
| 201 |
| 167 |
| 145 |
| 408 |
| 385 |
| 1,776 |
|
Occupancy costs3 |
| 104 |
| 101 |
| 95 |
| 88 |
| 83 |
| 243 |
| 99 |
| 813 |
|
Purchase obligations5 |
|
|
|
|
|
|
|
|
|
|
|
|
|
|
|
|
|
Operating expenditures |
| 499 |
| 134 |
| 100 |
| 70 |
| 69 |
| 176 |
| 9 |
| 1,057 |
|
Property, plant and equipment, and Intangible assets |
| 178 |
| 50 |
| 6 |
| 2 |
| – |
| – |
| – |
| 236 |
|
|
| 677 |
| 184 |
| 106 |
| 72 |
| 69 |
| 176 |
| 9 |
| 1,293 |
|
Non-interest bearing financial liabilities |
| 2,372 |
| 251 |
| 102 |
| 18 |
| 19 |
| 20 |
| – |
| 2,782 |
|
Other obligations |
| (39 | ) | (5 | ) | (6 | ) | (5 | ) | (6 | ) | (70 | ) | (132 | ) | (263 | ) |
Total |
| 4,808 |
| 2,380 |
| 2,168 |
| 2,426 |
| 1,196 |
| 7,017 |
| 8,105 |
| 28,100 |
|
1 See Section 7.7 Sale of trade receivables.
2 See Long-term debt maturity chart in Section 4.3.
3 Construction credit facilities reflect loan amounts for a real estate joint venture, a related party. Minimum operating lease payments and occupancy costs include transactions with real estate joint ventures. See Section 7.11 Transactions between related parties.
4 Total minimum operating lease payments include approximately 28% in respect of our five largest leases for office premises over various terms, with expiry dates that range between 2024 and 2039 with a weighted average term of approximately 13 years; and approximately 34% in respect of wireless site leases with a weighted average term of approximately 14 years. Total minimum operating lease payments with related party lessor is immaterial. See Note 19 of the Consolidated financial statements.
5 Where applicable, purchase obligations reflect foreign exchange rates at December 31, 2018. Purchase obligations include future operating and capital expenditures that have been contracted for at the current year-end and include the most likely estimates of prices and volumes, where necessary. As purchase obligations reflect market conditions at the time the obligation was incurred for the items being purchased, they may not be representative of future years. Obligations from personnel supply contracts and other such labour agreements have been excluded.
Claims and lawsuits
A number of claims and lawsuits (including class actions and intellectual property infringement claims) seeking damages and other relief are pending against us and, in some cases, other wireless carriers and telecommunications service providers. As well, we have received notice of, or are aware of, certain possible claims (including intellectual property infringement claims) against us and, in some cases, other wireless carriers and telecommunications service providers. (See the related risk discussion in Section 10.9 Litigation and legal matters.)
It is not currently possible for us to predict the outcome of such claims, possible claims and lawsuits due to various factors, including: the prelim-nary nature of some claims; uncertain damage theories and demands; an incomplete factual record; uncertainty concerning legal theories and procedures and their resolution by the courts, at both the trial and the appeal levels; and the unpredictable nature of opposing parties and their demands.
However, subject to the foregoing limitations, management is of the opinion, based upon legal assessments and information presently available, that it is unlikely that any liability, to the extent not provided for through insurance or otherwise, would have a material effect on our financial position and the results of our operations, including cash
flows, with the exception of the items disclosed in Note 29(a) of the Consolidated financial statements. This is a significant judgment for us (see Section 8.1 Critical accounting estimates and judgments).
Indemnification obligations
In the normal course of operations, we provide indemnification in conjunction with certain transactions. The terms of these indemnification obligations range in duration. These indemnifications would require us to compensate the indemnified parties for costs incurred as a result of failure to comply with contractual obligations, or litigation claims or statutory sanctions, or damages that may be suffered by an indemnified party. In some cases, there is no maximum limit on these indemnification obligations. The overall maximum amount of an indemnification obligation will depend on future events and conditions and therefore cannot be reasonably estimated. Where appropriate, an indemnification obligation is recorded as a liability. Other than obligations recorded as liabilities at the time of the related transactions, historically we have not made significant payments under these indemnifications.
As at December 31, 2018, we had no liability recorded in respect of our indemnification obligations.
7.10 Outstanding share information
|
| December 31, |
| January 31, |
Outstanding shares (millions) |
| 2018 |
| 2019 |
Common Shares |
| 599 |
| 600 |
|
|
|
|
|
Common Share options – |
|
|
|
|
all exercisable (one for one) |
| <1 |
| <1 |
7.11 Transactions between related parties
Transactions with key management personnel
Our key management personnel have authority and responsibility for overseeing, planning, directing and controlling our activities and consist of our Board of Directors and our Executive Leadership Team. Total compensation expense for key management personnel was $64 million in 2018, as compared to $50 million in 2017. The increase in compensation expense for key management personnel was due to greater share-based compensation primarily arising from metrics affecting performance condition-based restricted stock units. See Note 30(a) of the Consolidated financial statements for additional details.
Transactions with defined benefit pension plans
We provided management and administrative services to our defined benefit pension plans. Charges for these services were on a cost recovery basis and were immaterial.
Transactions with real estate joint ventures
In 2018, we had transactions with real estate joint ventures, which are related parties to us, as set out in Note 21 of our Consolidated financial statements.
For the TELUS Garden real estate joint venture, during the year ended December 31, 2018, the real estate joint venture sold the income-producing properties and the related net assets. The purchaser assumed the 3.7% mortgage and the 3.4% bonds secured by the income-producing properties. In the application of equity accounting, we recorded our share of the non-recurring gain at $171 million. Concurrently, we committed to a donation of $118 million, of which an initial donation of $100 million was made in TELUS Corporation Common Shares acquired in the market. See Section 1.3 and Note 28(b) of the Consolidated financial statements for additional details.
For the TELUS Sky real estate joint venture, commitments and contingent liabilities include construction-related contractual commitments through to 2019 (approximately $35 million at December 31, 2018) and construction financing ($342 million with three Canadian financial institutions as 662/3% lender and TELUS as 331/3% lender). As well, we have entered into a lease agreement with the TELUS Sky real estate joint venture.
8 | Accounting matters |
8.1 Critical accounting estimates and judgments
Our significant accounting policies are described in Note 1 of the Consolidated financial statements for the year ended December 31, 2018. The preparation of financial statements in conformity with generally accepted accounting principles (GAAP) requires management to make estimates, assumptions and judgments that affect: the reported amounts of assets and liabilities at the date of the financial statements; the disclosure of contingent assets and liabilities at the date of the financial statements; and the reported amounts of revenues and expenses during the reporting period. Actual results could differ from those estimates. Our critical accounting estimates and significant judgments are generally discussed with the Audit Committee each quarter.
Examples of our significant judgments, apart from those involving estimation, include the following:
· Assessments about whether line items are sufficiently material to warrant separate presentation in the primary financial statements and, if not, whether they are sufficiently material to warrant separate presentation in the notes to the financial statements. In the normal course, we make changes to our assessments regarding materiality for presentation so that they reflect current economic conditions. Due consideration is given to the view that it is reasonable to expect differing opinions of what is, and is not, material.
· In respect of revenue-generating transactions, we must make judgments that affect the timing of the recognition of revenue. See Section 8.2 Accounting policy developments below and Note 2 of our Consolidated financial statements for significant changes to IFRS-IASB which significantly affect the timing of the recognition of revenue and the classification of revenues presented as either service or equipment revenues.
· We must make judgments about when we have satisfied our performance obligations to our customers, either over a period of time or at a point in time. Service revenues are recognized based upon customers’ access to, or usage of, our telecommunications infrastructure; we believe that this method faithfully depicts the transfer of the services, and thus the revenues are recognized as the services are made available and/or rendered. We consider our performance obligations arising from the sale of equipment to have been satisfied when the equipment has been delivered to, and accepted by, the end-user customers.
· Principally in the context of revenue-generating transactions involving wireless handsets, we must make judgments about whether third party re-sellers that deliver equipment to our customers are acting in the transactions as principals or as our agents. Upon due consideration of the relevant indicators, we believe that the decision to consider the re-sellers to be acting, solely for accounting purposes, as our agents is more representative of the economic substance of the transactions, as we are the primary obligor to the end-user customers.
MD&A: ACCOUNTING MATTERS
The effect of this judgment is that no equipment revenue is recognized upon the transfer of inventory to third-party re-sellers.
· We compensate third-party re-sellers and our employees for generating revenues, and we must exercise judgment as to whether such sales-based compensation amounts are costs incurred to obtain contracts with customers that should be capitalized (see Note 20 of the Consolidated financial statements). We believe that compensation amounts tangentially attributable to obtaining a contract with a customer, because the amount of such compensation could be affected in ways other than by simply obtaining that contract, should be expensed as incurred; compensation amounts directly attributable to obtaining a contract with a customer should be capitalized and subsequently amortized on a systematic basis, consistent with the satisfaction of our associated performance obligations.
Judgment must also be exercised in the capitalization of costs incurred to fulfill revenue-generating contracts with customers. Such fulfilment costs are those incurred to set up, activate or otherwise implement services involving access to, or usage of, our telecommunications infrastructure that would not otherwise be capitalized as property, plant and equipment and intangible assets (see Note 20 of the Consolidated financial statements).
· The decision to depreciate and amortize any property, plant, equipment and intangible assets that are subject to amortization on a straight-line basis, as we believe that this method reflects the consumption of resources related to the economic lifespan of those assets better than an accelerated method and is more representative of the economic substance of the underlying use of those assets.
· The preparation of financial statements in accordance with generally accepted accounting principles requires management to make judgments that affect the financial statement disclosure of information regularly reviewed by our chief operating decision-maker used to make resource allocation decisions and to assess performance (see Note 5 of the Consolidated financial statements). A significant judgment we make is in respect of distinguishing between our wireless and wireline operations and cash flows (and this extends to allocations of both direct and indirect expenses and capital expenditures). The clarity of such distinction has been increasingly affected by the convergence and integration of our wireless and wireline telecommunications infrastructure technology and operations. Less than one-half of the operating expenses included in the segment performance measure reported to our chief operating decision-maker during the years ended December 31, 2018 and 2017, are direct costs; judgment, largely based upon historical experience, is applied in apportioning indirect expenses which are not objectively distinguishable between our wireless and wireline operations.
Recently, our judgment was that our wireless and wireline telecommunications infrastructure technology and operations had not experienced sufficient convergence to objectively make their respective operations and cash flows practically indistinguishable. The continued build-out of our technology-agnostic fibre-optic infrastructure, in combination with converged edge network technology, has significantly affected this judgment, as has the commercialization of fixed-wireless telecommunications solutions for customers and the consolidation of our non-customer facing operations.
As a result, it has become increasingly difficult and impractical to objectively and clearly distinguish between our wireless and wireline operations and cash flows, and the assets from which those cash flows arise. Our judgment as to whether these operations can continue to be judged to be individual components of the business and discrete operating segments may change.
The increasing impracticality of objectively distinguishing between our wireless and wireline cash flows, and the assets from which those cash flows arise, is evidence of their increasing interdependence; this may result in the unification of the wireless cash-generating unit and the wireline cash-generating unit as a single cash-generating unit for impairment testing purposes in the future. As our business continues to evolve, new cash-generating units may develop.
· The view that our spectrum licences granted by Innovation, Science and Economic Development Canada will likely be renewed; that we intend to renew them; that we believe we have the financial and operational ability to renew them; and, thus, that they have an indefinite life, as discussed further in Note 18(e) of the Consolidated financial statements.
· In connection with the annual impairment testing of intangible assets with indefinite lives and goodwill, there are instances in which we must exercise judgment in allocating our net assets, including shared corporate and administrative assets, to our cash-generating units when determining their carrying amounts. These judgments are necessary because of the convergence that our wireless and wireline telecommunications infrastructure technology and operations have experienced to date, and because of our continuous development. There are instances in which similar judgments must also be made in respect of future capital expenditures in support of both wireless and wireline operations, which are a component of the determination of recoverable amounts used in the annual impairment testing, as discussed further in Note 18(f) of the Consolidated financial statements.
· In respect of claims and lawsuits, as discussed further in Note 29(a) of the Consolidated financial statements, the determination of whether an item is a contingent liability or whether an outflow of resources is probable and thus needs to be accounted for as a provision.
Examples of the significant estimates and judgments that we make, and their relative significance and degree of difficulty, are as set out in the graphic in Note 1 of the Consolidated financial statements.
Our critical accounting estimates and assumptions are described below.
General
· In determining our critical accounting estimates, we consider trends, commitments, events or uncertainties that we reasonably expect to materially affect our methodology or assumptions. Our statements in this MD&A regarding such consideration are made subject to the Caution regarding forward-looking statements.
· In the normal course, we make changes to assumptions under-lying all critical accounting estimates so that they reflect current economic conditions, updated historical information used to develop the assumptions, and changes in our credit ratings, where applicable. Unless indicated otherwise in the discussion below, we expect that no material changes in overall financial performance and financial statement line items would arise either from reasonably likely changes in material assumptions underlying the estimate or from selection of a different estimate from within a range of valid estimates.
· Our critical accounting estimates affect line items on the Consolidated statements of income and other comprehensive income, and line items on the Consolidated statements of financial position, as follows:
| Consolidated statements of income and other comprehensive income |
| |||||||
|
|
| Operating expenses |
| Employee defined benefit plans re-measurements | 2 | |||
Consolidated statements of financial position | Operating revenues | Goods and services purchased | Employee benefits expense | Depreciation | Amortization of intangible assets | Financing costs | |||
Intangible assets, net, and Goodwill, net |
|
|
|
| X1 |
|
|
| |
Employee defined benefit pension plans |
|
| X | X3 | X3 | X | X |
| |
Property, plant and equipment, net |
|
|
| X |
|
|
|
| |
Provisions for asset retirement obligations |
| X |
| X |
| X |
|
| |
Provisions related to business combinations | X |
|
|
|
| X |
|
| |
Investments | X |
|
|
|
|
|
|
| |
Accounts receivable |
| X |
|
|
|
|
|
| |
Contract assets |
| X |
|
|
|
|
|
| |
Inventories |
| X |
|
|
|
|
|
| |
|
|
|
|
|
|
|
|
| |
1 Accounting estimate, as applicable to Intangible assets with indefinite lives and Goodwill, primarily relates to spectrum holdings and accordingly affects our wireless cash-generating unit.
2 Other comprehensive income – Item never subsequently reclassified to income.
3 Accounting estimate impact due to internal labour capitalization rates.
· All critical accounting estimates are uncertain at the time an estimate is made and affect the following Consolidated statements of income and other comprehensive income line items: Income taxes (except for estimates about Goodwill) and Net income. Similarly, all critical accounting estimates affect the following Consolidated statements of financial position line items: Current assets (Income and other taxes receivable), Current liabilities (Income and other taxes payable), Deferred income tax liabilities and Common equity (retained earnings) and Non-controlling interests. The discussion of each critical accounting estimate does not differ between our two segments, wireless and wireline, unless explicitly noted.
Intangible assets, net; Goodwill, net; and Property, plant and equipment, net
General
· The Intangible assets, net, line item represents approximately 33% of Total assets as at December 31, 2018 (34% as at December 31, 2017). Included in Intangible assets are spectrum licences, which represent approximately 26% of Total assets as at December 31, 2018 (28% as at December 31, 2017).
· The Goodwill, net, line item represents approximately 14% of Total assets as at December 31, 2018 and 2017.
· The Property, plant and equipment, net, line item on our Consolidated statements of financial position represents approximately 37% of Total assets as at December 31, 2018 and 2017.
· If our estimates of the useful lives of assets were incorrect, we could experience increased or decreased charges for amortization or depreciation in the future. If the future were to differ adversely from our best estimate of key economic assumptions and associated cash flows were to materially decrease, we could potentially experience future material impairment charges in respect of our Property, plant and equipment assets, Intangible assets or Goodwill. If Intangible assets with indefinite lives were determined to have finite lives at some point in the future, we could experience increased charges for amortization of Intangible assets. Such charges in and of themselves do not result in a cash outflow and would not immediately affect our liquidity.
The recoverability of Intangible assets with indefinite lives; the recoverability of Goodwill
· The carrying values of Intangible assets with indefinite lives and Goodwill are periodically tested for impairment, and this test represents a significant estimate for us.
· The recoverable amounts of the cash-generating units’ assets have been determined based on a fair value less costs of disposal calculation. There is a material degree of uncertainty with respect to the estimates of the recoverable amounts of the cash-generating units’ assets, given the necessity of making key economic assumptions about the future. The fair value less costs of disposal and value-in-use calculations both use future cash flows and growth projections (including judgments about the allocation of future capital expenditures supporting both wireless and wireline operations); associated economic risk assumptions and estimates of the likelihood of achieving key operating metrics and drivers; estimates of future generational infrastructure capital expenditures; and the future weighted average cost of capital.
· See Note 18(f) of the Consolidated financial statements for further discussion of methodology and sensitivity testing.
The estimated useful lives of assets; the recoverability of tangible assets
· The estimated useful lives of assets are determined by a continuing program of asset life studies. The recoverability of assets with finite lives is significantly impacted by the estimated useful lives of assets.
· Assumptions underlying the estimated useful lives of assets include the timing of technological obsolescence, competitive pressures and future infrastructure utilization plans.
Employee defined benefit pension plans
Certain actuarial and economic assumptions used in determining defined benefit pension costs, accrued pension benefit obligations and pension plan assets
· We review industry practices, trends, economic conditions and data provided by actuaries when developing assumptions used in the determination of defined benefit pension costs and accrued pension benefit obligations. Pension plan assets are generally valued using market prices; however, some assets are valued using market estimates when market prices are not readily available.
MD&A: ACCOUNTING MATTERS
Actuarial support is obtained for interpolations of experience gains and losses that affect the employee defined benefit plan actuarial gains and losses and accrued pension benefit obligations. The discount rate, which is used to determine the accrued benefit obligation, is based upon the yield on long-term, high-quality fixed-term investments. The discount rate is set annually at the end of each calendar year, based upon yields on long-term corporate bond indices in consultation with actuaries, and is reviewed quarterly for significant changes. Future increases in compensation are based upon the current benefits policies and economic forecasts. We have examined our respective pension obligation and current service cost durations and observed a 10-year difference in duration. As individual discount rates more accurately reflect the obligation and current service cost, commencing in 2018, we applied a dual discount rate methodology.
· On an annual basis, at a minimum, the defined benefit pension plan assumptions are assessed and revised as appropriate. When the defined benefit pension plan key assumptions fluctuate significantly relative to their immediately preceding year-end values, actuarial gains (losses) arising from such significant fluctuations are recognized on an interim basis. Assumptions used in determining defined benefit pension costs, accrued pension benefit obligations and pension plan assets include life expectancy, discount rates, market estimates and rates of future compensation increases. Material changes in overall financial performance and financial statement line items would arise from reasonably likely changes, because of assumptions that have been revised to reflect updated historical information and updated economic conditions, in the material assumptions underlying this estimate. See Note 15 of the Consolidated financial statements for further analysis.
· This accounting estimate related to employee defined benefit pension plans is in respect of components of the Operating expenses line item, Financing costs line item and Other comprehensive income line item on our Consolidated statements of income and other comprehensive income. If the future were to adversely differ from our best estimate of assumptions used in determining defined benefit pension costs, accrued benefit obligations and pension plan assets, we could experience future increased (or decreased) defined benefit pension expense, financing costs and charges to Other comprehensive income.
Income tax assets and liabilities
The amount and composition of income tax assets and income tax liabilities, including the amount of unrecognized tax benefits
· Assumptions underlying the composition of income tax assets and liabilities are based upon an assessment of the technical merits of tax positions. Income tax benefits on uncertain tax positions are recognized only when it is more likely than not that the ultimate determination of the tax treatment of a position will result in the related benefit being realizable; however, this does not mean that tax authorities cannot challenge these positions. Income tax assets and liabilities are measured at the amount that is expected to be realized or incurred upon ultimate settlement with taxation authorities. Such assessments are based upon the applicable income tax legislation, regulations, interpretations and jurisprudence, all of which in turn are subject to change and interpretation.
· Current income tax assets and liabilities are estimated based upon the amount of income tax that is calculated as being owed to taxation authorities, net of periodic instalment payments.
Deferred income tax liabilities are composed of the tax effect of temporary differences between the carrying amount and tax basis of assets and liabilities, as well as the income tax effect of undeducted income tax losses. The timing of the reversal of temporary differences is estimated and the income tax rate substantively enacted for the periods of reversal is applied to the temporary differences. The carrying amounts of assets and liabilities are based upon the amounts recorded in the financial statements and are, therefore, subject to accounting estimates that are inherent in those balances. The tax basis of assets and liabilities, as well as the amount of undeducted income tax losses, are based upon the assessment and measurement of tax positions, as noted above. Assumptions as to the timing of reversal of temporary differences include expectations about the future results of operations and future cash flows. The composition of income tax liabilities is reasonably likely to change from period to period because of changes in the estimation of these significant uncertainties.
· This accounting estimate is in respect of material asset and liability line items on our Consolidated statements of financial position comprising less than 1% of Total assets as at December 31, 2018 and 2017, and approximately 10% of Total liabilities and owners’ equity as at December 31, 2018 and 2017. If the future were to adversely differ from our best estimate of the likelihood of tax positions being sustained, the amount of tax expected to be incurred, the future results of operations, the timing of reversal of deductible temporary differences and taxable temporary differences, and the tax rates applicable to future years, we could experience material current income tax adjustments and deferred income tax adjustments. Such current and deferred income tax adjustments could result in an increase or acceleration of cash outflows at an earlier time than might otherwise be expected.
Provisions for asset retirement obligations
Certain economic assumptions used in provisioning for asset retirement obligations
· Asset retirement obligation provisions are recognized for statutory, contractual or legal obligations, normally when incurred, associated with the retirement of Property, plant and equipment (primarily certain items of outside plant and wireless site equipment) when those obligations result from the acquisition, construction, development and/or normal operation of the assets. The obligations are measured initially at fair value, determined using present value methodology, and the resulting costs are capitalized as a part of the carrying value of the related asset.
· On an annual basis, at a minimum, assumptions underlying the provisions for asset retirement obligations include expectations, which may span numerous decades, about inflation, discount rates and any changes in the amount or timing of the underlying future cash flows. Material changes in financial position would arise from reasonably likely changes, because of assumptions that have been revised to reflect updated historical information and updated economic conditions, in the material assumptions underlying this estimate. The capitalized asset retirement cost is depreciated on the same basis as the related asset, and the discount accretion is included in the Consolidated statements of income and other comprehensive income as a component of Financing costs.
· This accounting estimate is in respect of the asset retirement obligations component of the Provisions line item on our Consolidated statements of financial position, and this component comprises approximately 1% of Total liabilities and owners’ equity as at December 31, 2018 and 2017. If the provisions for asset retirement obligations were to be inadequate, we could experience a charge to Goods and services purchased in the future. A charge for an inadequate asset retirement obligation provision would result in a cash outflow proximate to the time that the asset retirement obligation is satisfied.
Provisions related to business combinations
Provisions for written put options
· In connection with certain business acquisitions, we have established provisions for written put options in respect of non-controlling interests. We provide written put options to the remaining selling shareholders whereby they could put the remaining non-controlling interests at, or after, a specified date. The acquisition-date fair values of the puttable shares held by the non-controlling shareholders are recorded as provisions.
· On an annual basis, at a minimum, the provisions for written put options are assessed and revised as appropriate. The provisions for written put options have been determined based on the net present values of estimated future earnings results; there is a material degree of uncertainty with respect to the estimates of future earnings results given the necessity of making key economic assumptions about the future. The amounts of provisions for written put options are reasonably likely to change from period to period because of changes in the estimation of future earnings and foreign exchange movements.
· This accounting estimate is in respect of the provisions for written put options in respect of the non-controlling interests component of the Provisions line item on our Consolidated statements of financial position, and this component comprises approximately 1% of Total liabilities and owners’ equity as at December 31, 2018 (2017 – less than 1%). If the provisions for written put options were to be inadequate, we could experience a charge to Operating revenues in the future. A charge for an inadequate written put option provision would result in a cash outflow proximate to the time that the written put option is exercised.
Investments
The recoverability of long-term investments
· We assess the recoverability of our long-term investments on a regular, recurring basis. The recoverability of investments is assessed on a specific-identification basis, taking into consideration expectations about future performance of the investments and comparison of historical results to past expectations.
· The most significant assumptions underlying the recoverability of long-term investments are related to the achievement of future cash flow and operating expectations. Our estimate of the recoverability of long-term investments could change from period to period due to the recurring nature of the recoverability assessment and due to the nature of long-term investments (we do not control the investees).
· Investments are included in the Other long-term assets line item on our Consolidated statements of financial position, which itself comprises approximately 3% of Total assets as at December 31, 2018 (2017 – 2%). If the allowance for recoverability of long-term investments were to be inadequate, we could experience an increased charge to Other operating income in the future. Such a provision for recoverability of long-term investments does not result in a cash outflow. When there is clear and objective evidence of an increase in the fair value of an investment, which may be indicated by either a recent sale of shares by another current investor or the injection of new cash into the entity by a new or existing investor, we recognize the after-tax increase in value in Other comprehensive income (change in unrealized fair value of available-for-sale financial assets).
Accounts receivable
General
· When determining our allowance for doubtful accounts, we consider the business area that gave rise to the Accounts receivable, conduct a statistical analysis of portfolio delinquency trends and perform specific account identification.
· These accounting estimates are in respect of the Accounts receivable line item on our Consolidated statements of financial position, which comprises approximately 5% of Total assets as at December 31, 2018 and 2017. If the future were to differ adversely from our best estimates of the fair value of the residual cash flows and the allowance for doubtful accounts, we could experience an increase in the doubtful accounts expense in the future. Such doubtful accounts expense in and of itself does not result in a cash outflow.
The allowance for doubtful accounts
· The estimate of our allowance for doubtful accounts could materially change from period to period because the allowance is a function of the balance and composition of Accounts receivable, which can vary on a month-to-month basis. The variability of the balance of Accounts receivable arises from the variability of the amount and composition of Operating revenues and from the variability of Accounts receivable collection performance.
Contract assets
General
· We maintain allowances for lifetime expected credit losses related to contract assets. Current economic conditions, historical information (including credit agency reports, if available), and the line of business from which the contract asset arose are all considered when determining impairment allowances. The same factors are considered when determining whether to write off amounts charged to the impairment allowance for contract assets against contract assets.
The impairment allowance
· These accounting estimates are in respect of the Contract assets line items on our Consolidated statements of financial position, which comprise approximately 4% of Total assets as at December 31, 2018 and 2017. If the future were to differ adversely from our best estimates of the fair value of the residual cash flows and the impairment allowance for contract assets, we could experience an increase in the impairment allowance for contracts against contract assets in the future. Such impairment allowance in and of itself does not result in a cash outflow.
MD&A: ACCOUNTING MATTERS
Inventories
The allowance for inventory obsolescence
· We determine our allowance for inventory obsolescence based upon expected inventory turnover, inventory aging, and current and future expectations with respect to product offerings.
· Assumptions underlying the allowance for inventory obsolescence include future sales trends and offerings and the expected inventory requirements and inventory composition necessary to support these future offerings. Our estimate of the allowance for inventory obsolescence could materially change from period to period due to changes in product offerings and the level of consumer acceptance of those products.
· This accounting estimate is in respect of the Inventories line item on our Consolidated statements of financial position, which comprises approximately 1% of Total assets as at December 31, 2018 and 2017. If the allowance for inventory obsolescence were to be inadequate, we could experience a charge to Goods and services purchased in the future. Such an inventory obsolescence charge does not result in a cash outflow.
8.2 Accounting policy developments
IFRS 9, Financial Instruments
IFRS 9, Financial Instruments, is required to be applied for years beginning on or after January 1, 2018, with retrospective application. The new standard includes a model for the classification and measurement of financial instruments, a single forward-looking “expected loss” impairment model and a reformed approach to hedge accounting. Our financial performance is currently not materially affected by the retrospective application of the standard, nor is our financial position.
IFRS 15, Revenue from Contracts with Customers
IFRS 15, Revenue from Contracts with Customers, is required to be applied for years beginning on or after January 1, 2018. The International Accounting Standards Board and the Financial Accounting Standards Board of the United States worked on this joint project to clarify the principles for the recognition of revenue. The new standard was released in May 2014 and supersedes existing standards and interpretations, including IAS 18, Revenue. We have applied the standard retrospectively to prior reporting periods, subject to permitted and elected practical expedients.
The effects of the new standard and the materiality of those effects will vary by industry and entity; the effects of our retrospective application are set out in Note 2(c) of the Consolidated financial statements. Like many other telecommunications companies, we are materially affected by its application, primarily in respect of the timing of revenue recognition, the classification of revenue, the capitalization of the costs of obtaining a contract with a customer and the capitalization of the costs of contract fulfilment (as defined by the new standard).
Revenue – timing of recognition; classification
The timing of revenue recognition and the classification of our revenues as either service revenues or equipment revenues are affected, since the allocation of consideration in multiple element arrangements (solutions for our customers that may involve deliveries of multiple services and products that occur at different points in time and/or over different periods of time) is no longer affected by the limitation cap methodology previously required by generally accepted accounting principles.
The effects of the timing of revenue recognition and the classification of revenue are most pronounced in our wireless results. Although the measurement of the total revenue recognized over the life of a contract is largely unaffected by the new standard, the prohibition of the use of the limitation cap methodology accelerates the recognition of total contract revenue, relative to both the associated cash inflows from customers and our previous practice (using the limitation cap methodology); however, cash inflows are unaffected. The acceleration of the recognition of contract revenue relative to the associated cash inflows also results in the recognition of an amount reflecting the resulting difference as a contract asset. Although the underlying transaction economics do not differ, during periods of sustained growth in the number of wireless subscriber connection additions, assuming comparable contract-lifetime per unit cash inflows, revenues would appear to be greater than under the previous practice (using the limitation cap methodology). Wireline results arising from transactions that include the initial provision of subsidized equipment or promotional pricing plans will be similarly affected.
We have applied the new standard retrospectively, subject to associated decisions in respect of transitional provisions and permitted practical expedients. The contract asset initially recorded upon transition to the new standard represents revenues that will not be, and have not been, reflected at any time in our periodic results of operations, but that would have been if not for the transition to the new standard; the effect of this “pulling forward” of revenues is expected to be somewhat muted by the composite ongoing inception, maturation and expiration of millions of multi-year contracts with our customers.
Costs of contract acquisition; costs of contract fulfilment – timing of recognition
Similarly, the measurement of the total costs of contract acquisition and contract fulfilment over the life of a contract is unaffected by the new standard, but the timing of recognition is. The new standard results in our costs of contract acquisition and contract fulfilment, to the extent that they are material, being capitalized and subsequently recognized as an expense over the life of a contract on a rational, systematic basis consistent with the pattern of the transfer of goods or services to which the asset relates. Although the underlying transaction economics would not differ, during periods of sustained growth in the number of customer connection additions, assuming comparable per unit costs of contract acquisition and contract fulfilment, absolute profitability measures would appear to be greater than under the previous practice (immediate expensing of such costs).
Implementation
Our operations and associated systems are complex and our accounting for millions of multi-year contracts with our customers was affected. Significantly, in order to give effect to the new accounting methodology, incremental compilation of historical data was necessary for our millions of already existing multi-year contracts with our customers that were in-scope for purposes of transitioning to the new standard.
After a multi-year expenditure of time and effort, we developed the accounting policies, estimates, judgments and processes necessary to transition to the new standard. Upon completion of the implementation of these items, which included the critical incremental requirements of our information technology systems, we completed the incremental compilation of historical data and the related accounting for that data, all of which is necessary to transition to the new standard.
We are using the following practical expedients provided for in, and transitioning to, the new standard:
· No restatement for contracts that were completed as at January 1, 2017, or earlier.
· No restatement for contracts that were modified prior to January 1, 2017. The aggregate effect of all such modifications will be reflected when identifying satisfied and unsatisfied performance obligations and the transaction prices to be allocated thereto and when determining the transaction prices.
· No disclosure of the aggregate transaction prices allocated to the remaining unfulfilled, or partially unfulfilled, performance obligations for periods ending prior to January 1, 2018.
IFRS 16, Leases
In January 2016, the International Accounting Standards Board released IFRS 16, Leases, which is required to be applied for years beginning on or after January 1, 2019, and which supersedes IAS 17, Leases. The International Accounting Standards Board and the Financial Accounting Standards Board of the United States worked together to modify the accounting for leases, generally by eliminating lessees’ classification of leases as either operating leases or finance leases and, for IFRS-IASB, introducing a single lessee accounting model.
The most significant effect of the new standard will be the lessee’s recognition of the initial present value of unavoidable future lease payments as right-of-use lease assets and lease liabilities on the statement of financial position, including those for most leases that would currently be accounted for as operating leases. Both leases with durations of 12 months or less and leases for low-value assets may be exempted.
The measurement of the total lease expense over the term of a lease will be unaffected by the new standard. However, the new standard will result in an acceleration of the timing of lease expense recognition for leases that would currently be accounted for as operating leases; the International Accounting Standards Board expects that this effect may be muted by a lessee having a portfolio of leases with varying maturities and lengths of term, and we expect that we will be similarly affected. The presentation on the statement of income and other comprehensive income required by the new standard will result in the presentation of most non-executory lease expenses as depreciation of right-of-use lease assets and financing costs arising from lease liabilities, rather than as a part of goods and services purchased (executory lease expenses will remain a part of goods and services purchased); reported operating income would thus be higher under the new standard.
Relative to the results of applying the current standard, although actual cash flows will be unaffected, the lessee’s statement of cash flows will reflect increases in cash flows from operating activities offset equally by decreases in cash flows from financing activities. This is the result of
the presentation of the payments of the “principal” component of leases that would currently be accounted for as operating leases as a cash flow use within financing activities under the new standard.
We will be applying the standard retrospectively, with the cumulative effect of the initial application of the new standard recognized at the date of initial application, January 1, 2019, subject to permitted and elected practical expedients; such method of application would not result in the retrospective adjustment of amounts reported for periods prior to fiscal 2019. The nature of the transition method selected is such that the lease population as at January 1, 2019, and the discount rates determined contemporaneously, will be the basis for the cumulative effects recorded as of that date.
Implementation
As a transitional practical expedient permitted by the new standard, we will not reassess whether contracts are, or contain, leases as at January 1, 2019, applying the criteria of the new standard; as at January 1, 2019, only contracts that were previously identified as leases applying IAS 17, Leases, and IFRIC 4, Determining whether an Arrangement contains a Lease, will be a part of the transition to the new standard. Only contracts entered into (or changed) after January 1, 2019, will be assessed for being, or containing, leases applying the criteria of the new standard.
IFRS 3, Business Combinations
In October 2018, the International Accounting Standards Board amended IFRS 3, Business Combinations, seeking to clarify whether an acquisition transaction results in the acquisition of an asset or the acquisition of a business. The amendments are effective for acquisition transactions on or after January 1, 2020, although earlier application is permitted. The amended standard has a narrower definition of a business, which could result in the recognition of fewer business combinations than under the current standard; the implication of this is that amounts which may have been recognized as goodwill in a business combination under the current standard may now be recognized as allocations to net identifiable assets acquired under the amended standard (with an associated effect in an entity’s results of operations that would differ from the effect of goodwill having been recognized). We are currently assessing the impacts and transition provisions of the amended standard; however, we expect that we will apply the standard prospectively from January 1, 2020. The effects, if any, of the amended standard on our financial performance and disclosure will be dependent on the facts and circumstances of any future acquisition transactions.
Other issued standards
Other issued standards required to be applied for periods beginning on or after January 1, 2019, are expected to have no significant effect on our financial performance or disclosure.
MD&A: GENERAL TRENDS, OUTLOOK AND ASSUMPTIONS, AND REGULATORY DEVELOPMENTS AND PROCEEDINGS
9 | General trends, outlook and assumptions, and regulatory developments and proceedings |
This section contains forward-looking statements, which should be read together with the Caution regarding forward-looking statements at the beginning of this MD&A.
9.1 Telecommunications industry in 2018
We estimate that Canadian telecommunications industry revenues (including TV and excluding media) grew by approximately 4% to approximately $63 billion in 2018. Wireless and data services continue to drive ongoing industry growth. Consumer communications and data consumption behaviours continue to demonstrate a strong preference for data-rich applications and data-intensive smartphones and tablets.
TELUS’ revenues of $14.4 billion represented approximately 23% of industry revenues, with wireless products and services representing 57% of our total revenues. In our wireline business, growth in high-speed Internet access, enhanced data, TV, healthcare, customer care and business services (CCBS) solutions, and home and business security has more than offset the decline in demand for legacy services.
Wireless
Based on publicly reported results and estimates, in 2018, the Canadian wireless industry experienced network revenue growth of approximately 4.2% and adjusted EBITDA growth of approximately 7.3%. TELUS wireless network revenue growth was 2.7%, and TELUS wireless Adjusted EBITDA grew by 5.3%.
We estimate that the Canadian wireless industry added approximately 1.5 million new subscriber units in 2018, compared to approximately 1.3 million in 2017. This was supported by immigration and population growth; the trend toward multiple devices, including tablets; the expanding functionality of data and related applications; and the adoption of mobile devices and services by both younger and older generations. The wireless penetration rate increased to approximately 89% in Canada, with further increases in penetration expected to continue in 2019. By comparison, the wireless penetration rate in the U.S. is well over 100%, while in Europe and Asia it is even higher, suggesting an opportunity for continued growth in Canada.
In 2018, the wireless market was again characterized by high levels of retention and acquisition activity and the associated high costs of device subsidies on two-year contracts, a heightened level of competitive intensity, and the continued adoption of higher-value, data-centric smart-phones. Growth in blended average billing per subscriber unit per month (ABPU) has moderated due to declines in chargeable data usage and larger allotments of data driven by competitive pressures, in addition to other moderating factors such as: the popularity of data sharing plans; more frequent customer friendly data usage notifications; and an evolving customer mix shift towards non-traditional wireless devices. These factors are being offset by continuing robust customer growth and growing overall data usage, including customers selecting higher rate plans with larger data buckets on high-value smartphones and a larger proportion of postpaid customers in the subscriber mix.
While the general trend towards more moderate ABPU growth, compared to past years, was anticipated, we continue to work diligently to better monetize robust growth in data services while simultaneously delivering a strong value for money proposition to our customers. To this end, we are focusing intensely on quality margin accretive customer growth and strong ABPU performance through our consistent strategic execution of premium smartphone loading, which includes driving higher-value data and share plan adoption. Moreover, we are also focusing on the other levers available to us in an environment of moderating ABPU growth to ensure we continue to deliver on our wireless EBITDA growth objectives, including:
· Continuing to drive volume growth through high-quality loading on the back of strong ongoing industry growth
· Seeking new sources of wireless revenue, such as Internet of Things (IoT) or Internet of Everything, machine-to-machine (M2M) and security applications
· Exploring and securing new channel strategies with attractive associated economic characteristics
· Pursuing smart bundling opportunities across wireless and wireline to achieve better economies of scope and enhance lifetime revenue per customer
· Driving better roaming growth by further encouraging customers travelling abroad to adopt and use our Easy Roam® offering, which now covers more than 125 countries, as well as securing in-roaming opportunities for those travelling to Canada
· Working persistently to enhance the efficiency of the flow from revenue to EBITDA, or the flow from ABPU to average margin per subscriber unit per month (AMPU), in order to buttress and enhance our operating margins, including the organizational and management structure streamlining we undertook in the second half of 2018.
The Canadian wireless industry continues to be highly competitive and capital-intensive, with carriers continuing to expand and enhance their broadband wireless networks including material investments in spectrum.
Wireline
Canada’s four major cable-TV companies had an estimated base of approximately 3.8 million telephony subscribers at the end of 2018. This represents a national consumer market share of approximately 42.2%, up from approximately 41.5% in 2017. Other non-facilities-based competitors also offer local and long distance voice over IP (VoIP) services and resell high-speed Internet solutions. This competition, along with technological substitution by wireless services, is continuing to erode the number of residential network access lines and associated local and long distance revenues, as expected.
Although the consumer high-speed Internet market is maturing, with a penetration rate of approximately 86% in Western Canada and 85% across Canada, subscriber growth is expected to continue over the coming years. The four major cable-TV companies had an estimated 6.9 million Internet subscribers at the end of 2018 (50% market share), up 3% from approximately 6.7 million at the end of 2017.
Telecommunications companies had approximately 6.7 million Internet subscribers (49% market share), up 4% from approximately 6.5 million at the end of 2017. We continue to make moderate gains in market share as a result of the expansion of our fibre-optic infrastructure and the pull-through of subscribers from our IP-based TELUS TV service.
While Canadians still watch conventional TV, digital platforms are playing an increasingly important role in the broadcasting industry. Popular online video services are providing Canadians with more choice about where, when and how to access their video content. In 2018, Canadian IP TV providers increased their subscriber base by an estimated 6% to 2.8 million as a result of expanded network coverage, enhanced differentiated service offerings, and marketing and promotions focused on IP TV. Despite this IP TV growth, the combined cable-TV and satellite-TV subscriber penetration rate declined. We estimate that the four major cable-TV companies have approximately 5.6 million TV subscribers or a 51% market share, a slight decrease from 52% at the end of 2017. The balance of industry subscribers were served by satellite-TV and regional providers.
In 2018, Rogers launched Ignite TV in Ontario, based on the Comcast X1 TV platform, while Quebecor announced its intention to unveil Helix, also based on the Comcast X1 TV platform in 2019. Our IP-based Optik TV platform continues to offer numerous service leadership advantages over this cable platform, including: flexible pricing plans and packaging available to all customers; picture clarity and quality; content depth and breadth; and the number of ways customers can access content, including wireless set-top boxes, Restart TV, higher capacity PVR and the Optik TV app, which offers more than twice the number of live TV channels at home or on the go compared to our cable competitor. Notably, we are the only Canadian TV service provider offering live 4K HDR channels and 4K HDR on-demand movies, including the latest Hollywood blockbusters and the latest movies and series from Netflix, which has named TELUS the #1 network for streaming Netflix in Canada in November and December of 2018 (based on the Netflix ISP Speed Index rankings for Canadian Providers as of November/December 2018), as well as 4K sports content, more HD content, more on-demand content, more over-the-top (OTT) content with Netflix, YouTube, TED Talks and the National Film Board of Canada, and we are the multicultural content leader in Western Canada.
The national Canadian telecom providers continue to acquire and otherwise develop capabilities in home security. In the first quarter of 2018, TELUS acquired all of the customers, assets and operations of AlarmForce Industries Inc. in B.C., Alberta and Saskatchewan. Additionally throughout 2018, we made other smaller home and business security-related acquisitions. These acquisitions were made to strengthen our opportunity to offer attractive bundled solutions and advance our connected home strategy while accelerating our entry into smart home solutions.
9.2 Telecommunications industry general outlook and trends
Wireless
Wireless growth continues to be driven by increasing data usage and adoption, including: higher-value smartphones, shared family data plans and tablets, and growth in IoT and M2M devices. In addition, consumers continue to replace wireline access with wireless access and related data services. These trends are expected to continue to drive a growing demand for wireless data services for the foreseeable future.
Industry ABPU growth is expected to continue growing at a more modest rate than seen in recent years.
While LTE and LTE-A technologies increase download speeds, encourage data usage and improve the customer experience, growth in data traffic demands pose challenges to wireless access technology. (See High demand for data challenges wireless networks and may be accompanied by increases in delivery cost in Section 10.4 Technology.) To better manage this data traffic, Canadian providers continue to evolve their networks. Innovation, Science, and Economic Development Canada (ISED) announced the auction of 600 MHz spectrum in March 2019, including spectrum set aside for non-incumbent companies, with further spectrum auctions expected in 2020 and 2021.
M2M and IoT technologies connect communications-enabled remote devices via wireless technologies, allowing them to exchange key information and share processes. Advanced platforms and networks are already in place in industries such as healthcare, utilities, agriculture and fleet management, with deployment ongoing in other industries, including vehicle insurance, retail, food services and consumer utilities. These and other industries are looking to IoT, combined with other applications, to generate value from their connections. IoT represents a meaningful opportunity for growth in mobility products and services, with secure connectivity, customer value and efficiency. While M2M applications generally have lower average revenue per subscriber unit per month (ARPU), they tend to generate high service volumes with low or no subsidy costs, thereby supporting both revenue growth and margins.
5G has begun to play a mainstream role in technology evolution and innovation globally, and is an important component of meeting Canada’s and TELUS’ efforts to further bridge the digital divide and connect rural Canadians. Investing in 5G will drive capex savings by allowing us to provide high-speed Internet services over wireless in less urban areas, as well as improved cost savings and innovative services in industrial automation, transportation and telehealth. Driven by significantly faster speeds, lower latencies, improved reliability and attractive economics, 5G will enable a host of new applications: for industries, 5G will enable remote operations, industrial control and manufacturing automation; for consumers, home automation, autonomous vehicles, and wireless-to-the-home connectivity with speeds comparable to wired access technologies; and for healthcare, converged solutions for hospitals, clinics and remote patient monitoring. 5G is essential to Canada’s digital future and is expected to generate significant innovation, growth and productivity. Mobile 5G wireless technology is up to 100 times faster than current 4G technology.
Enabling a robust and reliable 5G experience for Canadians will require complementary wireless spectrum bands to support the needs of a diverse subscriber base. Low band spectrum, such as 600 MHz which will be auctioned by ISED in early 2019, is valuable as it covers wide areas and penetrates well into buildings, thus improving coverage in urban and suburban areas. This low band spectrum will play a vital role in bringing 5G to Canadians and as such, it is an important resource for Canada as wireless operators build out 5G in rural areas. High bandwidth spectrum, such as millimetre wave (mmWave) is valuable as it can enable speeds up to 100 times faster than 600 MHz spectrum, however, does not have the same coverage characteristics to penetrate well into buildings. This high-bandwidth spectrum and the associated faster connection speeds will help unlock new technologies such as virtual and augmented reality. Current trials show that mmWave delivers the richest 5G experience, albeit in a localized fashion. 3.5 GHz spectrum is important to the 5G ecosystem as it able to support both the coverage characteristics of
MD&A: GENERAL TRENDS, OUTLOOK AND ASSUMPTIONS, AND REGULATORY DEVELOPMENTS AND PROCEEDINGS
low band spectrum with the speed characteristics of mmWave spectrum, albeit at slightly lower speeds. This spectrum will be integral to low latency communications services including autonomous monitoring and vehicle-to-everything communication. Current trials show 3.5 GHz is key for broader 5G coverage. See Section 9.4 Communications industry regulatory developments and proceedings for further details on upcoming spectrum auctions.
Wireline
The traditional wireline telecommunications market is expected to remain very competitive in 2019 as technology substitution – such as the broad deployment of higher-speed Internet; the use of email, messaging and social media as alternatives to voice services; and the growth of wireless and VoIP services – continues to replace higher-margin legacy voice revenues. In our incumbent operating areas of B.C. and Alberta, it is estimated that 48% of households no longer have a fixed line and 29% of households no longer have a broadcast TV service in 2018. While we are a key provider of these substitution services, the decline in this legacy business is continuing as expected, although network access line (NAL) losses slowed considerably in 2018. Our long-standing growth strategy remains focused on wireless, data and IP-centric wireline capabilities.
The popularity of viewing TV and on-demand content anywhere, particularly on handheld devices, is expected to continue to grow as customers adopt services that enable them to view content on multiple screens. Streaming media providers continue to enhance OTT streaming services in order to compete for a share of viewership as viewing habits and consumer demand evolve. Studies suggest that 45% of Canadian households had a subscription to Netflix at the end of 2018. Other streaming TV services are expected to launch services in Canada in the upcoming years.
TV providers are monitoring OTT developments and evolving their content and market strategy to compete with these non-traditional offerings. Bell Media offers a content streaming service through its expanded Crave TV offering. We view OTT as an opportunity to add further capabilities to our linear and on-demand assets, providing customers with flexible options to choose the content they want and encourage greater customer use of the TELUS high-speed Internet and wireless technologies. We continue to enhance our Optik TV service by adding content and capabilities, including ultra-high-definition 4K content, and by entering into multicultural content and distribution deals with OTT content providers such as Netflix and Crave TV. TELUS continues to offer Pik TV, an attractive OTT-friendly basic TV offering that allows customers to access live TV and streaming services like Netflix and YouTube, conveniently and affordably, through a self-install media box, Apple TV, Internet browser or our Android and iOS mobile applications.
Telecommunications companies continue to make significant capital investments in broadband networks, with a focus on fibre to the premises or home (FTTP/FTTH) to maintain and enhance their ability to support enhanced IP-based services and higher broadband speeds. Cable-TV companies continue to evolve their cable networks with the gradual roll-out of the DOCSIS 3.1 platform. Although this platform increases speed in the near term and is cost-efficient, it does not offer the same advanced capabilities as FTTP over the longer term, such as fast symmetrical upload and download speeds. At the end of 2018, our Optik TV footprint covered more than 3.1 million households and businesses, with approximately 97% having access to speeds of at least 50 Mbps, enabling us to deliver a better customer experience. In addition, at the end of 2018, our fibre-optic infrastructure was available
to approximately 1.89 million homes and businesses, reaching 61% of our broadband footprint. Advances in LTE wireless technology and our extensive LTE access technology also allow us to target otherwise underserved areas with a fixed wireless solution, and 5G is widely expected to offer vastly expanded opportunities in this regard.
Combining wireline local and long distance voice services with wireless and high-speed Internet access and entertainment services, telecommunications companies can focus on offering bundled products to achieve competitive differentiation and provide customers with more flexibility and choice on networks that can reliably support these services. Our broadband investments, including the build-out of our FTTP broad-band network, our premium differentiated IP-based Optik TV service and integrated bundled service offerings, continue to enhance our competitive position and customer loyalty relative to our main cable-TV competitor.
As the industry moves to 5G wireless in the coming years, we expect to be operating on, and providing services over, a more converged network. The lines between wireline access and wireless access will continue to blur, as the way we deliver services to customers – and the way our customers use those services – continue to evolve. As our broadband network continues to expand and 5G begins to be commercialized in the coming years, we expect to benefit from the flexibility of being able to select the most efficient way to deliver services across our footprint. We do not expect to have to build fibre to every home; instead we believe that there will be opportunities to deliver services to some areas within our broadband footprint wirelessly with 5G.
Additional wireline capabilities
In the business market (enterprise and small and medium-sized businesses, or SMB), the convergence of IT and telecommunications, facilitated by the ubiquity of IP, continues to shape the competitive environment, with non-traditional providers increasingly blurring the lines of competition and business models. Cable-TV companies continue to make investments to better compete in the highly contested SMB space. Telecommunications companies like TELUS are providing network-centric managed applications that leverage their significant FTTP investments, while IT service providers are bundling network connectivity with their proprietary software as service offerings. Although our business-to-business (B2B) line of business was dilutive to our EBITDA in 2018, we are aggressively pursuing opportunities to stabilize this business, return to growth and enhance margins in future years.
The development of IP-based platforms providing combined IP voice, data and video solutions creates potential cost efficiencies that compensate, in part, for the loss of margins resulting from the migration from legacy to IP-based services. New opportunities exist for integrated solutions and business process outsourcing that could have a greater business impact than traditional telecommunications services. Data security represents both a challenge and an opportunity for TELUS to provide customers with our data security solutions. Increasingly, businesses are looking to partner with their communications service provider to address their business goals and challenges, and to tailor cloud-based solutions for their needs that leverage telecommunications in ways not imagined 10 years ago. Cloud computing is changing service delivery to always-on and everything-as-a-service, and strong growth is expected in this area. TELUS offers Network as a Service capabilities that provide businesses the option of an IT network as a service over the Internet, mirrored across multiple locations, based on a self-serve platform that reduces deployment cycles and reliance on IT specialists. Our home and business security in Western Canada is powered by our broadband network and integrates the latest smart devices to improve the lives of Canadians.
Healthcare is expected to be a continued growth area in future years, based on an aging population in Canada, an increasing emphasis on chronic disease management, and the potential benefits that technology can deliver in terms of efficiency and effectiveness within the sector. We are leveraging our expanding broadband network to increase the availability, integration and effectiveness of our innovative tools and applications across the primary care ecosystem in order to position ourselves to compete for the anticipated future growth in this sector. These tools include personal health records to facilitate self-management of healthcare data, electronic drug prescriptions with online insurance validation by the physician, and home health monitoring devices and data capture with caregiver oversight. The digitization of everyday functions in the healthcare ecosystem, combined with broadband network connectivity, provides an open platform that can support the development and delivery of even more advanced health applications. In 2018, our home health monitoring service was implemented in B.C. following an earlier successful pilot that demonstrated reductions in hospitalizations, positive patient experiences and significant cost reductions. Pharma Space®, our online pharmacy service that helps patients manage their prescriptions through features like scheduling online reminders and automatic refills, has enabled patients to refill more than four million prescriptions online in 2018. Our acquisition of Medisys Health Group Inc. will allow us to deliver employee-centred care with each clinic outfitted with the full suite of TELUS Health solutions, thereby providing us further opportunities to scale our TELUS Health business.
TELUS International (TI), our global CCBS and digital services provider, continues its expansion through organic growth and strategic acquisitions (see Section 1.3 Highlights of 2018 for further details). TI is a global customer experience innovator that designs, builds and delivers next-generation digital services for some of the world’s most demanding, discerning and disruptive tech brands. TELUS Corporation is TI’s largest customer. From TI’s successful inception 13 years ago in the Philippines, established to support TELUS’ growing customer service needs, TI has grown exponentially in size, scope and geographic diversity to deliver exceptional customer experiences for clients from sites in North and Central America, Europe and Asia. Notably, the acquisition of Xavient Information Systems, a global IT consulting and next-generation software services company, accelerates TI’s ability to expand its global IT services offering with the addition of advanced, next-generation IT consulting and delivery capabilities, in order to provide a more comprehensive suite of services to existing and prospective clients. These capabilities include artificial intelligence-powered digital transformation services, user interface/user experience (UI/UX) design, open source platform services, cloud services, OTT solutions, IoT, big data services, DevOps and IT lifecycle services. TI strengthens TELUS’ ability to provide global clients with leading, differentiated services that align with our top priority of delivering the best customer experience to all our customers.
As technology continues to change our industry rapidly, customer demand continues to evolve and grow, and Canada shifts to a more digital economy, we are committed to evolving our business and offering innovative and reliable services and thought leadership in core future growth areas that are complementary to our traditional business. This, along with our intense focus on leadership in delivering an enhanced customer experience, positions us for continued differentiation and growth.
9.3 TELUS assumptions for 2019
In 2019, we expect growth in both wireless and wireline EBITDA, driven by the continued high demand for data services and high-speed Internet access in our wireless and wireline products and services; our consistent strategic focus on our core wireless and wireline capabilities (see Section 2.2 Strategic imperatives, Section 3 Corporate priorities and Section 4 Capabilities); significant ongoing investments in our leading broadband network; continued efforts to enhance operational efficiency; and our sustained focus on an enhanced customer experience across all areas of our operations.
Our assumptions in support of our 2019 outlook are generally based on the industry analysis above, including our estimates regarding economic and telecom industry growth (see Section 1.2 The environment in which we operate), as well as our 2018 results and trends discussed in Section 5. Our key assumptions include the following:
· Slightly slower rate of economic growth in Canada in 2019, estimated to be 2.0% (2.1% in 2018). For our incumbent local exchange carrier (ILEC) provinces in Western Canada, we estimate that economic growth in B.C. will be 2.3% in 2019 (2.2% in 2018), and that economic growth in Alberta will be 2.1% in 2019 (2.2% in 2018).
· No material adverse regulatory rulings or government actions.
· Continued intense wireless and wireline competition in both consumer and business markets.
· Continued increase in wireless industry penetration of the Canadian market.
· Ongoing subscriber adoption of, and upgrades to, data-intensive smartphones, as customers seek more mobile connectivity to the Internet.
· Wireless revenue growth resulting from improvements in subscriber loading with continued competitive pressure on blended ARPU.
· Continued pressure on wireless acquisition and retention expenses, dependent on gross loading and customer renewal volumes, competitive intensity and customer preferences.
· Continued growth in wireline data revenue, reflecting an increase in high-speed Internet and TELUS TV subscribers, speed upgrades, rate plans with larger data usage and expansion of our broadband infrastructure, as well as growth in customer care and business services, healthcare solutions, and home and business security offerings.
· Continued erosion of wireline voice revenue, resulting from technological substitution and greater use of inclusive long distance.
· Continued focus on our customers first initiatives and maintaining our customers’ likelihood-to-recommend scores.
· Employee defined benefit pension plans: Pension plan expense of approximately $79 million recorded in Employee benefits expense; a rate of 3.90% for discounting the obligation and a rate of 4.00% for current service costs for employee defined benefit pension plan accounting purposes; and defined benefit pension plan funding of approximately $52 million.
· Restructuring and other costs of approximately $100 million for continuing operational effectiveness initiatives, with margin enhancement initiatives to mitigate pressures related to intense competition, technological substitution, repricing of our services, increasing subscriber growth and retention costs, and integration costs associated with business acquisitions.
· Income taxes: Income taxes computed at applicable statutory rate of 26.7 to 27.3% and cash income tax payments of approximately $600 million to $680 million (2018 – $197 million).
MD&A: GENERAL TRENDS, OUTLOOK AND ASSUMPTIONS, AND REGULATORY DEVELOPMENTS AND PROCEEDINGS
· Further investments in broadband infrastructure as we have reached 61% of our broadband footprint at December 31, 2018, including fibre-optic network expansion and 4G LTE capacity and upgrades, as well as investments in network and systems resiliency and reliability.
· Participation in the ISED wireless spectrum auction for 600 MHz spectrum band, currently expected in March 2019.
· Stabilization in the average Canadian dollar: U.S. dollar exchange rate (U.S. 77 cents in 2018).
· Continued deployment of access-agnostic technology in our network.
9.4 Communications industry regulatory developments and proceedings
Our telecommunications, broadcasting and radiocommunication services are regulated under federal laws by various authorities, including the Canadian Radio-television and Telecommunications Commission (CRTC), ISED, the Minister of Canadian Heritage and Multiculturalism, and the Competition Bureau.
The following is a summary of certain significant regulatory developments and proceedings relevant to our business and our industry. This summary is not intended to be a comprehensive legal analysis and description of all of the specific issues described. Although we have indicated where we do not currently expect the outcome of a development or proceeding to be material to us, there can be no assurance that the expected outcome will occur or that our current assessment of its likely impact on us will be accurate. See Section 10.2 Regulatory matters.
Radiocommunication licences and spectrum-related matters
ISED regulates, among other matters, the allocation and use of radio spectrum in Canada and licenses radio apparatus, frequency bands and/ or radio channels within various frequency bands to service providers and private users. The department also establishes the terms and conditions attaching to such radio authorizations, including restrictions on licence transfers, coverage obligations, research and development obligations, annual reporting, and obligations concerning mandated roaming and antenna site sharing with competitors.
600 MHz spectrum repurposing
On August 14, 2015, ISED published its Decision on repurposing the 600 MHz Band, SLPB-004-15. In its decision, ISED announced its intention to jointly repack the 600 MHz band in line with the U.S. and to adopt the 70 MHz mobile band plan arising from the Federal Communications Commission (FCC) Incentive Auction. In August 2017, ISED initiated its Consultation on a Technical, Policy and Licensing Framework for Spectrum in the 600 MHz Band and on March 28, 2018, ISED released its Technical, Policy and Licensing Framework for the 600 MHz spectrum auction. ISED announced a 30 MHz set-aside for facilities-based providers who serve less than 10% of the national subscriber share and are actively providing commercial telecommunication services to the general public in the licensed area of interest. The asymmetric design of the auction framework, which sets aside a significant portion of the spectrum under auction exclusively for certain carriers (as defined in the framework), raises the risk that we will not be able to acquire all the spectrum we need in the auction process or that we will be required to pay more than we might otherwise pay. The auction will commence on March 12, 2019.
Spectrum Outlook 2018–2022
On June 6, 2018, ISED published the Spectrum Outlook 2018–2022. There is a risk that bands identified as promising for mobile service will not be allocated for mobile service or will be delayed in being allocated or assigned as the Spectrum Outlook is not a binding forecast of future spectrum assignments. However, any such delay or failure to allocate would generally impact all Canadian mobile service providers and not just us specifically.
Repurposing the 3500 MHz spectrum to support 5G
On December 18, 2014, ISED released its Decisions Regarding Policy Changes in the 3500 MHz Band (3475 – 3650 MHz) and a New Licensing Process noting the band would be fundamentally reallocated for flexible (mobile and fixed) use in the near future. On June 6, 2018, ISED released its Consultation on Revisions to the 3500 MHz Band to Accommodate Flexible Use and Preliminary Consultation on Changes to the 3800 MHz Band, proposing to claw back 56 to 66% of the band from fixed wireless incumbents (predominantly Inukshuk, which is a joint venture owned by Bell and Rogers, and Xplornet) and to auction the amount clawed back in 2020. In our consultation response, we called for a 100% clawback in large population centres. After ISED issues a transition decision, it will then consult on a licensing framework (i.e. auction rules and conditions of licence) for the 3500 MHz band. There is a risk that the transition decision and the auction rules will favour certain carriers over us and impact our ability to acquire 3500 MHz band spectrum.
Repurposing mmWave spectrum to support 5G
On June 5, 2017, ISED issued a Consultation on Releasing Millimetre Wave Spectrum to Support 5G, proposing to release 3.25 GHz of millimetre wave (mmWave) spectrum for licensed use and 7 GHz for licence-exempt use largely in line with recent U.S. mmWave developments. On June 6, 2018, ISED released an Addendum to the Consultation on Releasing Millimetre Wave Spectrum to Support 5G, proposing to release an additional 1 GHz of spectrum in the 26.5–27.5 GHz range. After issuing a repurposing decision, ISED will then consult on a licensing framework (i.e. auction rules and conditions of licence) for the mmWave bands. There is a risk that the repurposing decisions and the auction rules will favour certain carriers over us and impact our ability to acquire mmWave band spectrum.
Regulatory and federal government reviews
The CRTC and the federal government have initiated public proceedings to review various matters. They are discussed below.
Wireline wholesale services follow-up
On July 22, 2015, the CRTC released Review of wholesale wireline services and associated policies, Telecom Regulatory Policy CRTC 2015-326. The major component of this decision was that the CRTC ordered the introduction of a disaggregated wholesale high-speed Internet access service for Internet service provider (ISP) competitors. This will include access to FTTP facilities. This requirement is being phased in geographically beginning in the largest markets in Ontario and Quebec (i.e. in the serving territories of Bell, Cogeco, Rogers and Videotron). The CRTC initiated a follow-up proceeding to determine the technical configurations, appropriate costs and wholesale cost-based rates in those regions.
The FTTP follow-up activities directed in Telecom Policy CRTC 2015-326 remain ongoing. For the second phase, which involves FTTP wholesale services for the rest of Canada (including our serving territories), a proceeding on technical configurations commenced in 2017 and the associated cost study and tariff review will follow. The timing of the FTTP follow-up activities will also be affected by the recent application filed by the Canadian Network Operators Consortium Inc. (CNOC) to review the wholesale high-speed Internet access services framework. The CRTC has conducted a process to examine CNOC’s proposed interim relief, and a decision on this is pending. The CRTC has also asked parties to comment on the substantive elements of CNOC’s application. In any event, we anticipate no material adverse impact in the short term from the CRTC’s decision. Given the phased implementation of the mandated provision of wholesale access to our FTTP network, it is too early to determine the impact this decision will have on us in the longer term. The provision of access to unbundled local loops (ULLs) to competitors had not been mandated as of July 22, 2018, subject to the approval of an application setting out a test for ULL forbearance, which addresses areas where forbearance for retail voice service was predicated on the availability of ULLs. We filed such an application on January 19, 2018, and on September 11, 2018, the CRTC approved our application, which means that our provision of ULLs is based on commercial arrangements rather than a CRTC-approved tariff.
CRTC report on sales practices of large telecommunications carriers
On June 14, 2018, the Governor in Council directed the CRTC, pursuant to section 14 of the Telecommunications Act, to provide a report, by no later than February 28, 2019, regarding the retail sales practices of Canada’s large telecommunications carriers. The CRTC was directed to examine claims of aggressive or misleading sales practices concerning telecommunications services, the prevalence and impact on consumers, and potential solutions. On July 16, 2018, the CRTC issued a notice of consultation commencing its inquiry. We participated actively in this proceeding, highlighted the customer service successes associated with our customers first journey, and proposed a code of conduct consolidating existing regulations with no further substantive regulation. The CRTC received written submissions from parties and intervenors in August and September 2018, an oral hearing was held in October 2018, and parties and intervenors made final written submissions on November 9, 2018. While we feel that the CRTC’s current regulations allow the CRTC to adequately regulate sales practices, until the CRTC releases its report in 2019, it is too early to determine any new potential impacts on us.
Competition Bureau market study on competition in broadband services
On May 10, 2018, the Competition Bureau commenced a market study to better understand the competitive dynamics of Canada’s broadband Internet services industry. The Bureau states that the purpose of the study is to better understand these market outcomes and the competitive dynamics of Canadian broadband markets more generally, including whether resellers are fulfilling their role in placing increased competitive discipline on traditional telephone and cable companies. The Bureau expects to publish the results of the study in a public report, which may include recommendations to relevant government authorities, as appropriate. The Bureau states that the study will enable it to, among other things: make informed regulatory interventions regarding steps that regulators or policymakers could take to further support competition
in the broadband industry; and increase its knowledge and understanding of the competitive dynamics of the broadband industry, and the telecommunications industry more generally, to inform the Bureau’s future work. We are participating in this proceeding and filed our initial submissions with the Bureau on August 31, 2018. It is undertaking further stakeholder engagement and research, as well as information analysis. The Bureau intends to publish a draft report in spring 2019, at which point it will hold public consultations and then publish a final report.
Phase-out of the local service subsidy regime
On June 26, 2018, the CRTC issued Phase-out of the local service subsidy regime, Telecom Regulatory Policy CRTC 2018-213. In this decision, the CRTC determined that it would phase out the existing local service subsidy over three years, from January 1, 2019 to December 31, 2021. In September 2018, the Independent Telecommunications Providers Association (ITPA), which represents small ILECs, brought an application to the CRTC to review and vary this decision. In its application, the ITPA seeks to keep the existing local service subsidy regime in place. If upheld, the impact of this decision is not expected to be material.
Review of the price cap and local forbearance regimes
Simultaneously with the release of the Phase-out of the local service subsidy regime decision noted above, the CRTC issued Review of the price cap and local forbearance regimes, Telecom Notice of Consultation CRTC 2018-214. In this proceeding, the CRTC intends to review, among other things: pricing constraints for residential local exchange services; whether compensation to ILECs is required given that the local service subsidy is being eliminated further to the Phase-out of the local service subsidy regime decision; whether there is still a need for an exogenous factor mechanism in the price cap regimes; and whether changes are necessary to test for local forbearance. It is too early to determine the impact of this proceeding. Initial submissions were filed on October 10, 2018.
Code of conduct for retail Internet services
On November 9, 2018, the CRTC issued Call for comments – Proceeding to establish a mandatory code for Internet services, Telecom Notice of Consultation CRTC 2018-422. In this proceeding, the CRTC is considering establishing a mandatory code of conduct to address the clarity of contracts for retail fixed access Internet services and related issues. Among other things, the CRTC is proposing mandating the provision of a critical information summary, limiting early cancellation fees, and requiring that ISPs offer a cooling-off period for customers who sign term contracts. In our written submissions filed December 19, 2018, we stressed that TELUS already undertakes many of these initiatives as part of our customers first initiatives, but argued that certain proposals should not be adopted, including, among other things, certain restrictions, early cancellation fees and the CRTC’s proposal to give a new code retrospective effect. The proceeding remains ongoing, with a decision anticipated by the end of 2019. It is too early to determine the impact of this proceeding on us.
Broadcasting-related issues
Broadcasting licences held by TELUS
Our regional licences to operate broadcasting distribution undertakings in B.C. and Alberta have been granted renewals in Broadcasting Decision CRTC 2018-267, which extend the licence terms to August 31, 2023.
MD&A: RISKS AND RISK MANAGEMENT
Our regional broadcasting distribution licence to serve Quebec has also been granted an additional administrative renewal, which has extended the current licence terms to March 31, 2019. A renewal of our regional licence to operate broadcasting distribution undertakings in Quebec is expected by the end of the first quarter of 2019. Our licence to operate a national video-on-demand service was renewed to August 31, 2023, as part of Broadcasting Decision CRTC 2018-20.
CRTC ordered to report back to federal government on distribution models of the future
On September 22, 2017, the Governor in Council issued an Order in Council pursuant to section 15 of the Broadcasting Act to request that the CRTC hold hearings and report on distribution models of the future and how Canadians will access programming. On May 31, 2018, the CRTC issued its report, titled Harnessing Change: The Future of Programming Distribution in Canada, which provides an overview of the state of programming content distribution in Canada and sets out some options for change to the policy framework for consideration. This report will likely form part of the record for the joint review of the Broadcasting Act and Telecommunications Act by a panel of experts as described below. The CRTC has also announced in its forecast of activities for 2019 to 2020 that it intends to implement some of the new initiatives discussed in its report. Further consultations are anticipated but the outcomes are not expected to have any negative material impact on us.
Review of the Telecommunications Act and the Broadcasting Act
On June 5, 2018, the federal government announced a joint review of the Telecommunications Act and the Broadcasting Act to be conducted by a panel of seven experts, which will have until January 31, 2020 to provide its final recommendations. Written submissions in response to the panel’s call for comments were filed by January 11, 2019, and the panel expects to issue an interim report in the spring of 2019 on what it has heard during this consultation process. At this time, we do not know the impact of the review and any resulting amendments to the Telecommunications Act, the Broadcasting Act or the Radiocommunication Act (all three of which form the main legislative framework for communications).
Review of the Copyright Act and Copyright Board
The Copyright Act’s mandated five-year review was due in 2017 and the process for review via parliamentary committee was announced in December 2017. Both the Standing Committee on Industry, Science and Technology and the Standing Committee on Canadian Heritage are engaged in reviewing aspects of the Copyright Act and its policy framework. The expected completion timeline for this review is early 2019. The policy approach for copyright has traditionally been based on a balance of interests of creators and consumers, and as a result, changes to the Copyright Act are not expected to have a negative material impact on us.
10 | Risks and risk management |
10.1 Overview
Our business activities expose us to both risks and opportunities. Risk oversight and management processes are integral elements of our risk governance and strategic planning efforts.
Board risk governance and oversight
We maintain strong risk governance and oversight practices, with risk oversight responsibilities outlined in the Board’s and the Board committees’ terms of reference. The Board is responsible for ensuring the identification of material risks to our business and overseeing the implementation of appropriate systems and processes to identify, monitor and manage material risks.
In addition:
· Risks on the enterprise key risk profile are assigned for Board or committee oversight
· Board committees provide updates to the Board on the risks they oversee based on their respective terms of reference
· Board or Board committees may request risk briefings by our executive risk owners. The Vice-President, Risk Management and Chief Internal Auditor attends and/or receives a summary of these briefings.
Risk governance and culture
We have a strong risk governance culture across TELUS that starts with clear risk management leadership and transparent communications, supported by our Board and Executive Leadership Team.
In our approach to risk governance, accountability for the management of risks and reporting of risk information is clearly defined. Training and awareness programs, appropriate resources and risk champions help to ensure we have the risk management competencies necessary to support effective decision-making across the organization. Ethics are integral to our risk governance culture, and our code of ethics and conduct directs team members to meet the highest standards of integrity in all business decisions and actions.
Responsibilities for risk management
We take a multi-step approach to managing risks, with responsibility shared across the organization. The first line of assurance is executive and operating management, and its members are expected to integrate risk management into core decision-making processes (including strategic planning processes) and day-to-day operations. We have risk management and compliance functions across the organization, in areas including Finance, Legal, Data and Trust (which includes Privacy), Security and other business operational areas, which form the second line of assurance. These functions establish policies, provide guidance and expertise, and work collaboratively with management to monitor the design and operation of controls. Internal Audit is the third line of assurance, providing independent assurance regarding the effectiveness and efficiency of risk management and controls across all areas of our business.
Definition of business risk
We define business risk by the degree of exposure associated with the achievement of key strategic, financial, organizational and process objectives in relation to the effectiveness and efficiency of operations, the reliability and integrity of financial reporting, compliance with laws, regulations, policies, procedures and contracts, and safeguarding of assets within an ethical organizational culture.
Our enterprise risks arise primarily from our business environment and are fundamentally linked to our strategies and business objectives. We strive to proactively mitigate our risk exposures through performance planning, business operational management and risk response strategies, which can include mitigating, transferring, retaining and/or avoiding risks. For example, residual exposure for certain risks is mitigated through insurance coverage, if we judge this to be efficient and commercially viable. We also mitigate risks through contract terms, as well as through contingency planning and other risk response strategies, as appropriate.
Events outside and within TELUS present us with both risks and opportunities. We strive to avoid taking on undue risk, and we work to ensure alignment of risks with business strategies, objectives, values and risk tolerances; in turn, we also aim to take advantage of opportunities that may emerge.
Risk and control assessment process
We have in place multi-level enterprise risk and control assessment processes that solicit and incorporate insights of leaders from all areas of TELUS and enable us to track multi-year trends in key risks and the control environment across the organization.

MULTI-LEVEL ENTERPRISE RISK AND CONTROL ASSESSMENT PROCESSES | |
Annual risk and control assessment | We conduct a comprehensive annual review that includes: |
· Interviews with executive leaders | |
| · Information from our ongoing strategic planning process |
| · Consideration of recent internal and external audits, SOX (Sarbanes-Oxley Act of 2002) compliance and risk management activities |
| · An extensive enterprise-wide risk and control environment assessment aligned with the COSO (Committee of Sponsoring Organizations of the Treadway Commission) enterprise risk management and internal control integrated frameworks. |
| Board members complete an annual assessment providing perspectives on our key risks, risk appetite, and approach to enterprise risk management. |
| Key enterprise risks are identified, defined and prioritized. Risk appetite and effectiveness of risk management integration are evaluated by risk category and fraud risks are considered. |
| Results of the assessments are shared with senior management, our Board of Directors and the Audit Committee, and inform the development of our risk-focused internal audit program. They are also incorporated into our strategic planning, operational risk management and performance management processes. |
Quarterly risk assessment | We conduct quarterly risk assessment reviews with our executive-level risk owners and designated risk primes across all business units to capture and communicate changing business risks, assess perceptions of inherent and residual risk, identify key risk mitigation activities, and provide quarterly key risk updates and assurance to the Audit Committee and other Board committees. |
Other specific risk assessments | We conduct ongoing and/or detailed risk assessments for various risk management, strategic and operational initiatives (e.g. strategic planning, project and environmental management, safety, business continuity planning, network and IT vulnerability, and fraud and ethics) and for specific audit engagements. Results of risk assessments are evaluated, prioritized, updated and integrated into decision-making, policies and processes, as well as the key risk profile, throughout the year. |
MD&A: RISKS AND RISK MANAGEMENT
Principal risks and uncertainties
The following subsections describe our principal risks and uncertainties and associated risk mitigation activities. The significance of these risks is such that they alone or in combination may have material impacts on our business operations, results, reputation and brand, as well as the valuation approaches taken by investment analysts when they evaluate TELUS.
Although we believe the measures taken to mitigate risks described below are reasonable, there can be no expectation or assurance that they will effectively mitigate or fully address the risks described or that new developments and risks will not materially affect our operations or financial results. Forward-looking statements in this section and elsewhere in this MD&A are based on the assumption that our risk mitigation measures will be effective. See Caution regarding forward-looking statements.
10.2 Regulatory matters
The regulatory regime under which we operate, including the laws, regulations, and decisions in regulatory proceedings and court cases, reviews, appeals, policy announcements, and other developments, such as those described in Section 9.4 Communications industry regulatory developments and proceedings, imposes conditions on the products and services that we provide and the ways in which we provide them. The regulatory regime sets forth, among other matters, rates, terms and conditions for the provision of telecommunications services, licensing of broadcast services, licensing of spectrum and radio apparatus, and restrictions on ownership and control by non-Canadians.
Changes to our regulatory regime
Changes to the regulatory regime under which we operate, including changes to laws and regulations, could materially and adversely affect our business, results of operations, operating procedures and profitability. Such changes may not be anticipated or, where they are anticipated, our assessment of their impact on us and our business may not be accurate. While we are involved or intervene in proceedings, court cases or inquiries related to the application of the regulatory regime, such as those described in Section 9.4 Communications industry regulatory developments and proceedings, there is no certainty that the positions we advocate in such proceedings will be adopted or that our prediction of the likely outcomes of such proceedings will be accurate. Changes to our regulatory regime could increase our costs, restrict or impede the way we provide our services, what services we provide or manage our network, or alter customer perceptions of our operations. The further regulation of our broadband, wireless and other activities and any related regulatory decisions could also restrict our ability to compete in the marketplace and limit the return we can expect to achieve on past and future investments in our network. Through TELUS Health, we are entering into new areas such as virtual care and electronic prescriptions, which are less predictable from a regulatory regime perspective, can be subject to different regulations in certain provinces, and can be subject to political intervention. See also Legal and ethical compliance in Section 10.9 Litigation and legal matters.
Government or regulatory actions with respect to certain countries or suppliers may impact us and other Canadian telecommunications carriers. The Government of Canada is currently conducting a cybersecurity review of international suppliers of next-generation network equipment and technologies, focused on Huawei Technologies, to evaluate potential risks to the development of 5G networks in Canada. A decision on 5G technology in Canada is expected in the coming months. Over the last decade, our partnership with Huawei has allowed us to utilize the most advanced
technology in a cost-effective manner in our advanced 3G and 4G networks without any security incidents. In building our 3G and 4G national networks, we have collaborated closely with the Government of Canada for many years to ensure robust protections across all equipment used. This has included complying with a series of security protocols that effectively ban Chinese equipment from our core networks and limit such equipment to the less sensitive radio and antenna portions. We are continuing to work with the government as it conducts this cybersecurity review and we have yet to select a vendor for our 5G network. Given the range of potential outcomes of the cybersecurity review, the impact on Canadian wireless service providers cannot currently be predicted. A decision prohibiting the deployment of Huawei technology without compensation or other accommodations being made by the Government of Canada could have a material, non-recurring, incremental increase in the cost of TELUS’ 5G network deployment and, potentially, the timing of such deployment. In the case of a ban, there is a risk that the Canadian telecom market would undergo a structural change, as a reduction to an only two global supplier environment could permanently affect the cost structure of 5G equipment for all operators. See Section 10.4 Supplier risks.
Risk mitigation: We attempt to mitigate regulatory risks through our advocacy at all levels of government, including our participation in CRTC and federal government proceedings, studies, reviews and other consultations; representations before provincial and municipal governments pertaining to telecommunications issues; legal proceedings impacting our operations at all levels of the courts; and other relevant inquiries (such as those relating to the exclusive federal jurisdiction over telecommunications), as described in Section 9.4 Communications industry regulatory developments and proceedings. See also Vertical integration into broadcast content ownership by competitors in Section 10.3 Competitive environment. |
Spectrum and compliance with licences
We require access to radio spectrum in order to operate our wireless business. The allocation and use of spectrum in Canada are governed by Innovation, Science and Economic Development Canada (ISED), which establishes spectrum policies, determines spectrum auction frameworks, issues licences and sets radio authorization conditions. While we believe that we are substantially in compliance with our radio authorization conditions, there can be no assurance that we will be found to comply with all radio authorization conditions, or if we are found not to be compliant, that a waiver will be granted or that the costs to be incurred to achieve compliance will not be significant. Any failure to comply with the radio authorization conditions could result in the revocation of our licences and/or the imposition of fines. Our ability to provide competitive services, including our ability to improve our current services and offer new services on a timely basis, is also dependent on our ability to obtain access to new spectrum licences at a reasonable cost as they are made available. The revocation of, or a material limitation on, certain of our spectrum licences, or our failure to obtain access to new spectrum as it becomes available, could have a material adverse effect on our business, results of operations and financial condition by, among other things, negatively affecting both the quality and reliability of our network and service offering, and our brand, and thereby impeding our ability to attract or retain our customers.
Risk mitigation: We continue to strive to comply with all radio authorization and spectrum licence and renewal conditions and plan to participate in future wireless spectrum auctions. We continue to advocate with |
the federal government for fair spectrum auction rules, so that mobile wireless companies like TELUS can bid on an equal footing with other competitors for spectrum blocks available at auction and can purchase spectrum licences available for sale from competitors. We continue to strongly advocate that preferential treatment is not required for advanced wireless services (AWS) entrants, including for 5G services, most notably for entrants that are now part of established, sophisticated and well-financed cable companies. |
Restrictions on non-Canadian ownership and control
We are subject to Canadian ownership and control restrictions, including restrictions on the ownership of our Common Shares by non-Canadians, imposed by the Canadian Telecommunications Common Carrier Ownership and Control Regulations under the Telecommunications Act (collectively, the Telecommunications Regulations) and the Direction to the CRTC (Ineligibility of Non-Canadians), as ordered by the Governor in Council pursuant to the Broadcasting Act (the Broadcasting Direction). Although we believe that we are in compliance with the relevant legislation, future CRTC or Canadian Heritage determinations, or events beyond our control, could result in us ceasing to be in compliance with the relevant legislation. If such a development were to occur, the ability of our subsidiaries to operate as Canadian carriers under the Telecommunications Act or to maintain, renew or secure licences under the Radiocommunication Act and the Broadcasting Act could be jeopardized and our business could be materially adversely affected.
Under the Telecommunications Regulations, in order to maintain our eligibility to operate certain of our subsidiaries that are deemed to be Canadian carriers by law, among other requirements, the level of non-Canadian ownership of TELUS Common Shares cannot exceed 331/3% and we must not otherwise be controlled by non-Canadians. The Broadcasting Direction further provides for a qualified corporation, which can be a subsidiary corporation whose parent corporation or its directors do not exercise control or influence over any programming decisions of the subsidiary corporation where:
(a) Canadians beneficially own and control less than 80% of the issued and outstanding voting shares of the parent corporation and less than 80% of the votes
(b) The chief executive officer is a non-Canadian or
(c) Less than 80% of the directors of the parent corporation are Canadian.
Risk mitigation: As we are a holding corporation of Canadian carriers, the Telecommunications Regulations give us certain powers to monitor and control the level of non-Canadian ownership of our Common Shares. These powers have been incorporated into our Articles and extended to ensure compliance under both the Broadcasting Act and the Radiocommunication Act (under which the requirements for Canadian ownership and control were subsequently cross-referenced to the Telecommunications Act). These powers include the right to: (i) refuse to register a transfer of Common Shares to a non-Canadian; (ii) require a non-Canadian to sell any Common Shares; and (iii) suspend the voting rights attached to the Common Shares held by non-Canadians in inverse order of registration. We have reasonable controls in place to monitor foreign ownership levels through a reservation and declaration system. On August 10, 2017, in response to levels of foreign ownership of shares exceeding 20% and in accordance with the Broadcasting Direction, the TELUS Board of Directors appointed an independent programming committee to make all programming decisions relating to its licensed broadcasting undertakings. |
10.3 Competitive environment
Customer experience
Our customers’ loyalty and their likelihood to recommend TELUS are both dependent upon our ability to provide a service experience that meets or exceeds their expectations. Consequently, if our service experience or sales practices do not meet or exceed customer expectations, our reputation and brand could suffer, potentially resulting in higher rates of customer churn. Meanwhile, our profitability could be negatively impacted should customer net additions decrease and/or the costs to acquire and retain customers increase.
Risk mitigation: Our top corporate priority is putting customers first and earning our way to industry leadership in the likelihood to recommend from our clients. In fact, 55% of the scorecard we use internally to measure our corporate performance is weighted to team member engagement and customer experience. Effective and fair compensation plans are part of achieving high team member engagement and include measures on how well we serve the customer – through the eyes of the customer. To enhance the customer experience, we continue to invest in our products and services, system and network reliability, team members, and system and process improvements. Additionally, we endeavour to introduce innovative products and services, enhance our current services with integrated bundled offers and invest in customer-focused initiatives to bring greater transparency and simplicity to our customers, all in order to help differentiate our services from those of our competitors. With respect to sales practices, our primary performance objective for our call centre team members in sales functions is customer satisfaction. |
Intense wireless competition is expected to continue
At the end of 2018, there were nine facilities-based wireless competitors operating in Canada: three national carriers (TELUS Rogers and Bell), and six regional carriers. (See Competition overview in Section 4.1.) In addition, the national carriers each operate three distinct brands to better compete across various customer segments. In late 2018, Quebecor’s Videotron launched Fizz, its second wireless brand, to target the prepaid segment, while in Manitoba, Xplornet launched Xplore Mobile.
All wireless competitors use various promotional offers to attract customers, including price discounting on both handsets and rate plans, large allotments of data, flat-rate pricing for voice and data, and bundling with wireline services. Such promotional activity, as well as the sustained consumer appetite for higher-value smartphones, combined with the effect of the ongoing Canadian dollar to U.S. dollar exchange rate implications, may continue to lead to higher costs of acquisition and retention. Meanwhile, more inclusive rate plans, including international roaming and larger allotments of data for data sharing, and substitution by increasingly available Wi-Fi networks could lead to a reduction in chargeable data usage, resulting in pressure on average revenue per subscriber unit per month (ARPU) and customer churn. (See Wireless trends and seasonality in Section 5.4.)
We also expect increased competition based on the use of unlicensed spectrum to deliver higher-speed data services, such as the use of Wi-Fi networks to deliver entertainment to customers beyond the home. In addition, satellite operators such as Xplornet are augmenting their existing high-speed Internet access (HSIA) services by launching high-throughput satellites. See also Section 9.4 Communications industry regulatory developments and proceedings.
MD&A: RISKS AND RISK MANAGEMENT
Risk mitigation: Our 4G wireless technology covers approximately 99% of Canada’s population, facilitated by network access agreements with Bell Canada and SaskTel. Wireless 4G technologies have enabled us to establish and maintain a strong position in smartphone and data device selection and expand roaming capability to more than 225 destinations. Faster data download speeds provided by these technologies enable delivery of our Optik® on the go service to mobile devices when customers are beyond the reach of Wi-Fi. To compete more effectively in a variety of customer segments, in addition to our full-service TELUS brand, we also offer two flanker brands – Koodo Mobile and Public Mobile. We believe that by leveraging our three brands through uniquely targeted value propositions and distinct distribution and web-based channels, as well as by bundling wireless services with our home services in our incumbent markets, we are well positioned to compete with other wireless service providers. We continue our disciplined long-term strategy of investing in our growth areas and executing upon our customers first priority. We intend to continue to market and distribute innovative and differentiated wireless services; offer bundled wireless services (e.g. voice, text and data), including data sharing plans; invest in our extensive network and systems to support customer service; evolve technologies; invest in our distribution channels; and acquire the use of spectrum to facilitate service development and the expansion of our subscriber base, as well as to address the accelerating growth in demand for data usage. Our investments in our fibre-optic network are supporting our small-cell technology strategy to improve coverage, capacity and back-haul while preparing for a more efficient and timely evolution to a converged 5G network. In addition, we continue to implement operational effectiveness initiatives to drive improvements in EBITDA. (See Reorganizations and integration of acquisitions in Section 10.5.) |
Wireline voice and data competition
We expect competition to remain intense from traditional telephony, data, IP and information technology (IT) service providers, as well as from VoIP-focused competitors in both consumer and business markets. This competitive intensity, including the use of various promotional offers, also places pressures on ARPU, churn and costs of acquisition and retention.
The industry continues to transition from legacy voice infrastructure to IP telephony and Unified Communications, and from legacy data platforms to mature data platforms such as Ethernet, IP virtual private networks, multi-protocol label switching IP platforms and emerging software-defined networking solutions. These transitions continue to create both uncertainties and opportunities. Legacy data revenues and margins continue to decline, and this has been only partially offset by growth in demand and/or migration of customers to IP-based platforms. IP-based solutions are also subject to downward pricing pressure, lower margins and technological evolution.
Business
In the business wireline market, traditional facilities-based competitors continue to compete based on network footprint and reliability, while over-the-top (OTT) providers emphasize price, flexibility and convenience. Having made significant investments in voice over IP (VoIP), security and IT services for business, cable-based competitors are using price discounting to drive new customer acquisition and retention. In addition, larger cloud service providers, such as Amazon and Microsoft, leverage global scale to offer low-cost data storage and cloud computing services.
Rapidly advancing technologies, such as software-defined networks and virtualized network functions, enable the layering of new services in cloud-centric solutions. Evolving customer needs represent both a growth opportunity and a risk to our legacy voice and data revenue, as businesses seek to shift fixed local line, long distance and/or voicemail services to the new lower-priced cloud-centric market paradigm.
Consumer
In the consumer wireline market, cable-TV companies and other competitors continue to combine a mix of residential local VoIP, long distance, HSIA and, in some cases, wireless services under one bundled and/or discounted monthly rate, along with their existing broadcast or satellite-based TV services. In addition, Canadian cable competitors are investing in next-generation TV platforms. In 2017, Shaw Communications, our primary cable competitor in Alberta and B.C., launched BlueSky TV, licensing the X1 platform developed by Comcast, a U.S.-based cable company. In 2018, Rogers launched Ignite TV in Ontario, based on the same Comcast X1 platform, and Quebecor has announced its intention to unveil Helix, a TV offering also based on the Comcast X1 TV platform, in 2019 in Quebec. Meanwhile, Cogeco Communications, which provides cable services in part of our incumbent footprint in Quebec, announced it is partnering with MediaKind to offer its customers the MediaFirst platform. The MediaFirst platform is the same IP TV platform used to deliver TELUS TV. At the same time, Canadian cable competitors continue to increase the speed of their HSIA offerings and their roll-out of Wi-Fi services in metropolitan areas. To a lesser extent, other non-facilities-based competitors offer local and long distance VoIP services over the Internet and resell HSIA solutions. Technological innovation has resulted in an improvement in the performance and speed of satellite-based Internet access services and enhanced their competiveness. Erosion of our residential network access lines (NALs) is expected to continue due to this competition and ongoing technological substitution by wireless and VoIP. Legacy voice revenues are also expected to continue to decline. It is expected that competition in the consumer space will remain intense. In our TELUS Health business, we compete with other providers of electronic medical records and pharmacy management products, systems integrators and health service providers including those that own a vertically integrated mix of health services delivery, IT solutions, and related services, and global providers that could achieve expanded Canadian footprints.
Risk mitigation: We are making significant investments in our broadband infrastructure, including connecting more homes and businesses directly to our gigabit-capable fibre-optic network. These investments meet customer demand for faster Internet service, including symmetrical download and upload speeds, expand the coverage of our high-speed Internet service, and extend the coverage, capability and content lineup of our IP-based TV services, including Optik TV in B.C., Alberta and Eastern Quebec and Pik TV in Western Canada (see Broadcasting below). Additionally, we offer customers in underserved communities a fixed wire-less Internet service over our LTE access technology, further expanding our broadband reach. Our broadband investments extend the reach and functionality of our business and healthcare solutions and will support a more efficient and timely evolution to a converged 5G network. The provision of our IP TV services and service bundles helps us attract and pull through Internet subscriptions and mitigate residential NAL losses. We are continuing to evolve IP TV services by enabling ultra-high definition 4K HDR content, integrating our services with |
conversational interfaces, and increasing our focus on and investment in growing multicultural segments. Meanwhile, customers can now stream live TV on their laptop, tablet or smartphone with the Pik TV app, as well as through Apple TV. We also continue to invest in other product and service development initiatives, including smart home and connected home capabilities, home security and monitoring, and consumer health solutions. We continue to enhance our TV content capabilities with greater choice and flexibility of channels in theme packs and on an individual basis, a wider variety of multicultural content, OTT solutions that can be streamed or accessed directly through a set-top box and enabling ultra-high definition 4K HDR content. We continue to add to our capabilities in the business market through prudent product development initiatives, including new advanced cloud-based solutions such as Network as a Service (NaaS), a combination of acquisitions and partnerships, a focus on key vertical markets (public sector, healthcare, financial services, energy, agriculture and telecommunications wholesale) and expansion of solution sets in the enterprise market, as well as our modular approach in the small and medium-sized business (SMB) market (including services such as TELUS Business Connect) and Internet of Things (IoT) solutions. In addition, we also have retention plans in place to mitigate the loss of business customers as their needs evolve. Through TELUS Health, we have leveraged our systems, proprietary solutions and third-party solutions to extend our footprint in healthcare and benefit from the investments in eHealth being made by governments. Additionally, through our customer care, CCBS and our multi-site customer service centres, we enable experiences that realize efficiencies, cost savings and business growth for our customers. |
Technological substitution may adversely affect market share, volume and pricing
We face technological substitution across all key business lines and market segments, including the consumer, SMB and large enterprise markets, TELUS Health and TI.
Technological advances have blurred the boundaries between broadcasting, Internet and telecommunications. (See Section 10.4 Technology.) Wireless carriers and cable-TV companies continue to expand their offerings and launch next-generation TV platforms, resulting in intensified competition for high-speed Internet services in residential and certain SMB markets, as well as for TV services and local access and long distance. OTT services, such as Netflix, Amazon Prime Video and YouTube, compete for share of viewership, which may accelerate the disconnection of TV services or affect subscriber and revenue growth in our TV and entertainment services. Wireless voice ARPU continues to decline as a result of, among other factors, switching to messaging and OTT applications. We expect pressure from customer acquisition efforts and content distribution, costs and pricing to continue across most product and service categories and market segments in the industry.
Risk mitigation: Our IP TV and OTT multimedia initiatives provide the next generation of IP TV and, importantly, tie our OTT environment to one platform, enabling us to be agile in the delivery of OTT services, such as Netflix and YouTube. They also facilitate cloud-based media delivery and ultimately everything on demand, on any device, on any network. Active monitoring of competitive developments and internal prototyping in product and geographic markets enable us to respond rapidly to competitor offers and leverage our full suite of integrated wireless and wireline solutions and national reach, and we also monitor global telecom carriers for their next-generation OTT offers. To mitigate losses in legacy |
services in our incumbent areas of B.C., Alberta and Eastern Quebec, investments are being made in our broadband network, including our fibre-optic technology, in order to increase speeds, improve network reliability, expand our reach and provide an industry-leading customer experience. We also continue to introduce and enhance innovative products and services such as Pik TV, enable ultra-high definition 4K HDR content, include integrated bundled offers across our services, and invest in customer-focused initiatives to improve our customers’ experience. The adoption of new technologies and products is pursued to improve the efficiency of our service offerings. |
Broadcasting
We offer IP TV services to more than three million households and businesses in B.C., Alberta and Eastern Quebec, and we continue targeted roll-outs in new areas. Our TV services provide numerous interactivity and customization advantages over those of our primary cable-TV competitor. In 2018, we added 63,000 TV subscribers, ending the year with a total of 1.1 million TV subscribers. In 2019 and beyond, there can be no assurance that subscriber growth rates will be maintained or that we will achieve planned revenue growth and greater operating efficiency in the context of a high level of industry market penetration, a declining overall market for retail TV services, and actions by our competitors and content suppliers. In addition, competition from OTT services, content piracy and signal theft could also affect subscriber and revenue growth by accelerating the disconnection of TV services or reducing spending on those services.
Risk mitigation: We have broadened the addressable market for our IP TV services through the deployment of advanced broadband technologies, including the continued expansion of our fibre-optic network to homes and businesses in communities across B.C., Alberta and Eastern Quebec. We continue to introduce new features and capabilities to our TV services, including OTT offerings such as Netflix and YouTube, and strengthen our leadership position in Western Canada in the number of high-definition linear channels, video-on-demand services and ultra-high definition 4K HDR content. |
Vertical integration into broadcast content ownership by competitors
We are not currently seeking to be a broadcast content owner, but some of our competitors own and continue to acquire broadcast content assets, which could result in content being withheld from us or being made available to us at inflated prices or on unattractive terms.
Risk mitigation: Our strategy is to aggregate, integrate and make accessible content and applications for our customers’ enjoyment, on a timely basis across multiple devices. We have demonstrated that it is not necessary to own content in order to make it accessible to customers on an economically attractive basis, provided there is timely and strict enforcement of the CRTC’s regulatory safeguards to prevent abusive practices by vertically integrated competitors. We support a regime under the Broadcasting Act that ensures all Canadian consumers continue to have equitable access to broadcast content irrespective of the distributor or platform they choose. We continue to advocate for the timely and strict enforcement of the CRTC vertical integration safeguards and for further meaningful safeguards, as required. We also actively intervene in broadcast licence renewals of vertically integrated competitors. |
MD&A: RISKS AND RISK MANAGEMENT
10.4 Technology
Technology is a key enabler of our business, however, its evolution brings risks and uncertainties, as well as opportunities. We maintain short-term and long-term strategies to optimize our selection and timely use of technology while minimizing the associated costs, risks and uncertainties. Following are our main technology risks and uncertainties and a description of how we proactively address them.
High demand for data challenges wireless networks and may be accompanied by increases in delivery cost
The demand for wireless data services continues to grow rapidly, driven by ongoing broadband penetration, growing personal connectivity and networking, improvements in the affordability and selection of smartphones and high-usage data devices, richer multimedia services and applications, IoT services (including machine-to-machine data applications and other wearable technology), growth in cloud-based services and changes arising from wireless price competition, including larger allotments of data in rate plans. For example, according to the CRTC Communications Monitoring Report 2018, the average data usage per subscriber over mobile wireless networks increased by 30% in 2017, while the total measure of retail wireless data revenue increased by 7.8% over the same period. Rising data traffic levels and the fast pace of data device innovation present challenges to providing adequate capacity and maintaining high service levels at competitive cost structures.
Risk mitigation: Our ongoing investments in our 4G LTE technology, including LTE advanced (LTE-A) technology, as well as foundational investments in early 5G capabilities, allow us to manage data capacity demands by more effectively utilizing the spectrum we hold. We intend to deploy newer standards-based technologies that are ready for commercial implementation to the network in order to provide higher-performance connectivity solutions. In addition, the evolution to LTE-A technologies is supported by our investments in IP network, IP/fibre back-haul to cell sites, including our small cells, and a software-upgradeable radio infrastructure. The LTE-A expansion is expected to further increase network capacity and speed, reduce delivery costs per megabyte, enable richer multimedia applications and services, and deliver a superior subscriber experience. Our 4G LTE access technology covers 99% of Canada’s population, while our LTE-A access technology covers 93% of the Canadian population, up from 88% at the end of 2017. Mobile network infrastructure investment will increasingly be directed to systems based on network function virtualization (NFV) that offer greater capacity for computing and storage, higher resiliency, and more flexible software design. Our large-scale move to national, geographically distributed data centres that use generalized commercial off-the-shelf computing and storage solutions enables the utilization of broad-scale NFV and software-defined network technologies, which will allow us to virtualize much of our infrastructure and will also facilitate a common control plane for coordination of our virtualized and non-virtualized network assets. The architecture of our intelligence and content capabilities is located at the edge of our mobility network, close to our customers. The distributed smaller-scale computing power and storage deliver services faster while managing the ongoing need to continually scale the IP/fibre core network infrastructure. Rapid growth of wireless data volumes requires optimal and efficient utilization of our spectrum holdings, which have more than doubled through our 2014 and 2015 purchases of 700 MHz, AWS-3 and 2500 MHz spectrum licences. We are now deploying those licences as required to provide added capacity to mitigate risks from growing data traffic. |
We also plan to combine our licensed spectrum with unlicensed supplementary spectrum, as network and device ecosystems evolve to support licensed assisted access (LAA) technology. The spectrum licences previously used for our CDMA access technology have been repurposed for use with LTE technology. Our public Wi-Fi service increasingly integrates seamlessly with our 4G access technology and offloads data traffic from our wireless spectrum to a continually growing number of available Wi-Fi hotspots. Our deployment of small-cell technology, coupled with both licensed and licence-exempt spectrum technologies, helps us achieve a more efficient utilization of our spectrum holdings. |
Roll-out and evolution of wireless broadband technologies and systems
As part of a natural 4G access technology progression, we are committed to LTE-A and LTE technology to support the medium-term and long-term growth of our mobile broadband services. Our business depends on the deployment of wireless technology. The repurposing of spectrum holdings must be managed appropriately to ensure optimal use of capital and resources. Overall, as wireless broadband technologies and systems evolve, there is the risk that our future capital expenditures may be higher, as our ongoing technology investments could involve costs higher than those historically recorded. See also Supplier risks.
Meanwhile, 5G technology is evolving rapidly and the world’s first standards-based commercial launches are expected in 2019, while smartphones are generally expected to support 5G technology by late 2019 or 2020. It is expected that early 5G ecosystems will operate on three distinct spectrum bands: 3.5 GHz, millimetre wave (mmWave) spectrum (28 GHz and 37-40 GHz) and 600 MHz. Globally, 3.5 GHz spectrum is becoming the primary band for 5G mobile coverage. In Canada, 3.5 GHz spectrum was auctioned for fixed wireless access (FWA) between 2004 and 2009; it is currently not licensed for mobile applications and is largely held by Inukshuk (a joint venture owned by Bell and Rogers) in most urban markets. ISED is expected to claw back a portion of Inukshuk’s 3.5 GHz spectrum holdings and re-auction it for flexible use (permitting the deployment for mobile applications, such as 5G). Depending on the amount of 3.5 GHz spectrum clawed back and re-auctioned, there is a risk that we and the other regional operators could end up with less 3.5 GHz spectrum and would not be able to compete equally in the provision of higher network speeds and 5G capacity. Meanwhile, if ISED releases 3.5 GHz spectrum for mobile use before the 3.5 GHz auction concludes, current holders would have access to 5G spectrum before us and could gain a competitive time to market advantage.
With regard to the other spectrum bands, mmWave is expected to be used for very high data demand locations in which customers are not only very close to the antenna but also have an unobstructed view of the transmitting site, as traffic on this spectrum is limited in propagation to hundreds of metres and cannot cover large areas or penetrate obstacles or buildings. Services using this particular spectrum are expected to be an alternative to fibre-to-the-home (FTTH) deployments. The 600 MHz spectrum band is being targeted for 5G in the United States, particularly by T-Mobile USA. In Canada, the 600 MHz auction will commence in March 2019 with ISED auctioning a total of 70 MHz, including a set-aside of 30 MHz for regional service providers. There is a risk that we may not be able to provide 5G services on 600 MHz at the same level of capability as regional wireless carriers. Furthermore, as a result of the government set-aside, there is no guarantee that rural Canada, which 600 MHz propagation is best suited for, will realize the full potential of 5G networks since 30 MHz will be set aside for smaller carriers and possibly only deployed in urban centres.
Risk mitigation: Our practice is to continually optimize capital investments in order to ensure reasonable payback periods for generating positive cash flows from investments and flexibility in considering future technology evolutions. Some capital investments, such as wireless towers, leasehold improvements and power systems, are technology-neutral. Our wireless access technologies evolve through software upgrades to support enhancements in systems based on the third-generation partnership project (which unites seven telecommunications standards development organizations and provides their members with a stable environment to produce the reports and specifications that define third-generation partnership technologies) and the Institute of Electrical and Electronics Engineers that improve performance, capacity and speed. We expect to be able to leverage the economies of scale and handset variety of the North American and global ecosystems. Reciprocal network access agreements, principally with Bell Canada, have facilitated our deployment of wireless technologies for the benefit of our customers and provided the means for us to better manage our capital expenditures. These agreements are expected to provide ongoing cost savings, as well as the flexibility to invest in service differentiation and support systems. We maintain close co-operation with our network technology suppliers and operator partners in order to influence and benefit from developments in 5G, LTE-A, LTE and Wi-Fi technologies. In order to influence the timing, rules and policy regarding 3.5 GHz spectrum, we have emphasized to ISED the need for early, fair and timely access to 3.5 GHz spectrum for all operators in order to ensure that Canada continues to lead all G7 countries in terms of wireless speeds and capabilities. We are arguing for a fair treatment of this spectrum band and for ISED to accelerate its release for mobile use to all industry players while avoiding a head start for specific operators. (Refer to Section 10.2 Regulatory matters.) ISED is currently expected to auction the spectrum in late 2020, and assuming successful participation in the auction, operationalizing the spectrum will commence in 2021. In order to prepare for the future deployment of mmWave spectrum, we continue to conduct 5G trials in the mmWave spectrum bands. Our trials have established a platform that will form the basis for evaluating our future 5G use cases and will help us prepare for network planning in the mmWave bands. Additionally, we continue to collaborate with ISED, sharing trial results in discussions to help guide the regulator as it finalizes its decisions on establishing the policy and timing for the release of mmWave spectrum for 5G. The auction for mmWave spectrum is expected to occur in 2021. Furthermore, our investment in small cells will help us densify our network and mitigate potential speed and capacity disadvantages created by 3.5 GHz availability, as well as improve future mmWave deployment feasibility, cost and time to market. |
Disruptive technology
A paradigm shift with the consumer adoption of alternative technologies, such as video and voice OTT offerings (e.g. Netflix, FaceTime) and increasingly available Wi-Fi networks, has the potential to negatively affect our revenue streams. For example, Wi-Fi networks are being used to deliver various entertainment services to customers beyond the home. OTT content providers are competing for a share of entertainment viewership. OTT may also impact business segment services by enabling capabilities that in the past were associated with telecommunications service providers (e.g. Skype, cloud-based services, roaming). On the other hand, the proliferation of low-power wide-area (LPWA) IoT networks opens up new revenue opportunities, combined with the challenges of
very low bandwidth usage. These factors, including the growing customer demand for access to Wi-Fi outside the home and OTT services on demand on any device, may drive increased churn rates for our wireless, TELUS TV and high-speed Internet services, and add further pressure on our revenue streams. (See Intense wireless competition is expected to continue in Section 10.3 Competitive environment and OTT services present challenges to network capacity and conventional business models below.) Advanced self-learning technologies and automation (e.g. artificial intelligence and robotic process automation) will change the way we manage our operations and support customer experience innovation.
Risk mitigation: Since early 2014, we have worked with thousands of businesses and many major sports and entertainment venues as we continue to expand our public Wi-Fi infrastructure. This public Wi-Fi service is part of our network strategy of deploying small cells that integrate seamlessly with our 4G wireless access technology, automatically shifting our smartphone customers to Wi-Fi and offloading data traffic from our wireless spectrum. Integrated public Wi-Fi infrastructure build activity naturally extends service and channel opportunities with small and medium-sized enterprises and improves customers’ likelihood-to-recommend. Integration of home Wi-Fi increases the propensity for higher data usage on smartphones within and outside the home, helping to drive the uptake of our Internet service. In addition to the availability of our Wi-Fi service, we have unified communications offerings, including Business Connect with Ring Central and TC2 with Cisco. Our IoT port-folio is also growing, with the addition of services such as Connected Vehicle, GEOTrac, TELUS Alert and Assist and a number of others. Our customer service delivery sites experiment with different automation and self-learning tools to assess the impact such technology may have on customer experiences and operating efficiencies. |
Supplier risks
Supplier limitations or disruption, restructuring of vendors or discontinuance of products may affect our network and services
We have relationships with multiple vendors, including large cloud service providers such as Amazon and Microsoft, which are important in supporting network and service evolution plans and delivery of services to our customers. Our vendors may experience business difficulties, privacy and/or security incidents, and government or regulatory pressures. They may restructure their operations, be consolidated with other suppliers, discontinue products or sell their operations or products to other vendors. Government or regulatory actions with respect to certain countries or suppliers may also affect our ability to use the products or technology of certain vendors that we use or that we currently plan to use. Any of these events could affect the future development and support of products or services we use, and ultimately, the success of upgrades and evolution of technology that we offer our customers, such as our IP TV solutions and the roll-out and evolution of our wireless broadband technologies and systems. There can be no guarantee that the outcome of any particular vendor strategy including a decision or requirement to discontinue use of a supplier’s products or technology will not affect the services that we provide to our customers, or that we will not incur additional costs or delays in continuing to provide services or deploying our technologies and systems. We may not be able to replace a supplier or vendor on a timely basis or without incurring additional cost. Certain customer needs and preferences may not be aligned with our vendor selection or product and service offering, which may result in limitations on growth or loss of existing business.
MD&A: RISKS AND RISK MANAGEMENT
Supplier concentration and market power
In certain cases the number of suppliers of a product, service or technology that we use is limited. The popularity of certain models of smartphones and tablets has led us to rely on certain manufacturers, which may increase their market power and adversely affect our ability to purchase certain products at an affordable cost. In addition, owners of popular broadcasting content may raise their distribution charges and attempt to renegotiate the broadcasting distribution agreements we have with them, which could adversely affect our entertainment service offerings and/or profitability. See also Wireline in Section 9.2, Broadcasting-related issues in Section 9.4 and Vertical integration into broadcast content ownership by competitors in Section 10.3. An increase in supplier concentration affecting products, technology and equipment or services that we use or offer to our customers may adversely affect our business, operations or financial results, including by increasing the cost of acquisition or the time required to deploy technology and systems.
Risk mitigation: As a leading network aggregator, we partner with several network equipment suppliers and work with numerous international and domestic vendors to deliver the best possible experience for our customers. We consider possible vendor strategies and/or restructuring outcomes when planning for our future growth, as well as the maintenance and support of existing equipment and services. We have reasonable contingency plans for different scenarios, including working with multiple vendors, maintaining ongoing strong vendor relations with periodic reviews of vendor performance and working closely with other product and service users to influence vendors’ product or service development plans. In addition, we regularly monitor the risk profile of our key vendors and review the applicable terms and conditions of our agreements to determine whether additional contractual safeguards are required, and we promote our Supplier Code of Conduct based upon generally accepted standards of ethical business conduct. In respect of supplier market power, we offer and promote alternative devices or programming content to provide greater choice for consumers and to help limit our reliance on a few key suppliers. |
Support systems will be increasingly critical to operational efficiency
We have a large number of interconnected operational and business support systems, and their complexity has been continually increasing, which can affect system stability and availability. The development and launch of a new service typically requires significant systems development and integration efforts. Effective management of all associated development and ongoing operational costs is a significant factor in maintaining a competitive position and profit margins. As next-generation services are introduced, they must work with next-generation systems, frameworks and IT infrastructures, while being compatible with legacy services and support systems. There can be no assurance that any of our proposed IT systems or process change initiatives will be implemented successfully, that they will be implemented in accordance with anticipated timelines, or that sufficiently skilled personnel will be available to complete such initiatives. If we fail to implement and maintain appropriate IT systems on a timely basis, fail to create and maintain an effective governance and operating framework to support the management of staff, or fail to understand and streamline our significant number of legacy systems and proactively meet constantly evolving business requirements, any such failure could have an adverse effect on our business and financial performance.
Risk mitigation: In line with industry best practice, our approach is to separate business support systems (BSS) from operational support systems (OSS) and underlying network technology. Our aim is to decouple the introduction of new network technologies from the services we sell to customers so that both can evolve independently. This allows us to optimize network investments while limiting the impact on customer services, and also facilitates the introduction of new services. In addition, due to the maturing nature of telecommunications vendor software, we adopt industry standard software for BSS/OSS functions and avoid custom development where possible. This enables us to leverage vendor knowledge and industry practices acquired through the installation of those platforms at numerous global telecommunications companies. We have established a next-generation BSS/OSS framework to ensure that, as new services and technologies are developed, they are part of the next-generation framework that will ease the retirement of legacy systems in accordance with TeleManagement Forum’s next-generation operations systems and software program. As part of our fibre roll-out, we have invested in new operational support systems that are consolidating our legacy systems and simplifying our current environment. This will improve our ability to support and maintain our systems with newer, more resilient technology. We also continue to make significant investments in system resiliency and reliability in support of our ongoing customer first initiatives. |
IP-based telephony as a replacement for legacy analogue telephony is evolving and cost savings are uncertain
We continue to monitor the evolution of IP-based telephony technologies and service offerings, and we have developed a consumer solution for IP-based telephony involving access to our broadband infrastructure. This solution is being deployed and is replacing legacy analogue telephone service in areas that are served by our fibre-based facilities. The solution can be expanded to provide additional telephone services over the existing analogue service infrastructure and is designed to replace the platform currently in use. We are also in the process of deploying our next-generation IP telephony solution for business users, which is intended to replace existing business VoIP platforms, as well as addressing areas that are served by fibre-based facilities. We are deploying converged IP solutions in the consumer segment that deliver telephony, video and Internet access on the same broadband infrastructure. However, the exchange of information between service providers with different broadband infrastructures is still at an early stage.
Digital-only broadband access may not be feasible or financially viable in many areas for some time, particularly in rural and remote areas. Accordingly, we expect to support both legacy and IP-based voice systems for some time and incur costs to maintain both systems. There is a risk that investments in IP-based voice systems may not be accompanied by a reduction in the costs of maintaining legacy voice systems. There is also a risk that IP-based access infrastructure and corresponding IP-based telephony platforms may not be in place in time to avoid the need for some reinvestment in our current switching platforms to support the legacy public switched telephone network access base in certain areas, which could result in some investment in line adaptation in non-broadband central offices.
Risk mitigation: We continue to deploy residential IP-based voice technologies in communities served by our fibre-based facilities, and we work with vendors and the industry to assess the technical applicability and evolving cost profiles of proactively migrating legacy customers |
onto IP-based platforms while striving to meet CRTC commitments and customer expectations. Our ongoing investments in advanced broadband network technologies, including fibre-to-the-premises (FTTP), should enable a smoother future evolution of IP-based telephony. We are also working with manufacturers to optimize the operations, cost structure and life expectancy of analogue systems and solutions so that some of this infrastructure can be adapted for integration into the overall evolution towards IP. Additionally, IP-based solutions that we are currently deploying are capable of supporting a wide range of customers and services, which helps limit our exposure to any one market segment. Going forward, as our wireless services evolve, we will continue to assess the opportunity to further consolidate separate technologies within a single voice service environment. One example is the integration of our new IP-based consumer VoIP solution into the same platform that supports wireless telephony. We are looking at opportunities to rationalize our existing legacy voice infrastructure in order to manage costs. We are also working with our vendors and partners to reduce the cost structure of VoIP deployments. |
Convergence in a common IP-based application environment for telephony, Internet and video is complex
The convergence of wireless and wireline services in a common IP-based application environment, delivered over a common IP-based network, provides opportunities for cost savings and for the rapid development of more advanced services that are also more flexible and convenient. However, the transformation from separate systems to a common environment is very complex and could be accompanied by implementation errors, design issues and system instability.
Risk mitigation: We mitigate implementation risk through modular architectures, lab investments, employee trials, partnering with system integrators where appropriate, purchasing hardware that is common to most other North American IP based technology deployments and introducing virtualization technologies, where feasible. We are also active in a number of standards bodies, such as the Metro Ethernet Forum and IP Sphere, in order to help influence a new IP infrastructure strategy that leverages standards-based functionality, which could further simplify our network. |
Delivery of fibre-based facilities leveraged by IP telephony solutions is expensive and complex, with long implementation schedules
The deployment of fibre-based facilities in new communities and regions requires significant investment and planning, as well as long implementation schedules. This may rule it out as a viable alternative for communities in which the legacy voice equipment requires immediate replacement. It may not be cost-effective to deliver fibre-optic network access to customers who subscribe only to home phone services, which would prevent full migration away from legacy technologies.
Risk mitigation: We mitigate schedule risk by continuing to maintain our legacy switching environments and striving to maintain the necessary technological expertise, access to replacement hardware and regular maintenance programs. We support delivery of IP telephony through a copper-based access facility by deploying line access gateway technology that connects our customers’ generic equipment with the IP telephony platforms, which gives us a more cost-effective way to provide those customers with the reliability and enhanced capabilities of these solutions. |
OTT services present challenges to network capacity and conventional business models
OTT services compete directly with pay-TV, video and wireless and wireline voice and messaging services. OTT video services, in particular, have rapidly become the largest source of traffic on the North American Internet backbone. OTT service providers do not invest in, or own, networks and growth in their services presents Internet service providers (ISPs) and network owners with the challenge of preventing network congestion. While we have designed an IP-based network that has not experienced significant congestion problems through 2018, there can be no assurance that we will not experience such congestion in the future.
Risk mitigation: As more OTT service providers launch services and offer higher-resolution video over the Internet, we continue to make investments in our network to support greater capacity. We are also developing new responses and service offerings, such as more flexible data plans, for the challenges posed by OTT service providers. These investments include the ongoing build-out of our fibre-optic infrastructure, including multi-year investments to connect homes and businesses in B.C., Alberta and Eastern Quebec to our gigabit-capable network. In addition, our IP TV offerings, including Optik TV and Pik TV, make popular OTT services easy to access by including them as selections that are available directly through each of our TV offerings. For further discussion of our IP TV offerings, see Wireline voice and data competition, Technological substitution may adversely affect market share, volume and pricing and Broadcasting in Section 10.3 Competitive environment. |
Capital expenditure levels and potential future outlays for spectrum licences may be impacted by our operating and financial results, as well as our ability to carry out financing activities
Our capital expenditure levels are affected by our network initiatives, including the ongoing connection of more homes and businesses directly to our fibre-optic infrastructure; our ongoing deployment of newer technologies such as 5G; the deployment of newly acquired spectrum; investments in network resiliency and reliability; growing subscriber demand for data; evolving systems and business processes; implementation of efficiency initiatives; support for large complex deals; and participation in future wireless spectrum auctions held by ISED. There can be no assurance that investments in capital assets and wireless spectrum licences will not be affected by future operating and financial results.
Risk mitigation: We carry out a number of unique initiatives each year that are intended to improve our productivity and competitiveness. See Reorganizations and integration of acquisitions and Implementation of large enterprise deals in Section 10.5. For a discussion of financing risks and risk mitigation activities, see Section 10.7 Financing, debt requirements and returning cash to shareholders. |
10.5 Operational performance
Systems and processes
We routinely have numerous complex systems and process change initiatives underway. There can be no assurance that the full complement of our various systems and process change initiatives, including those
MD&A: RISKS AND RISK MANAGEMENT
required to improve delivery of customer services and support management decision-making, will be successfully implemented or that funding and sufficiently skilled resources will be available to complete all key initiatives planned. There is a risk that certain projects may be deferred or cancelled and the expected benefits of such projects may be deferred or unrealized. Moreover, any ineffectiveness in the change management required to protect our complex systems and limit service disruptions could adversely impact our customer service, operating performance and financial results. Additionally, the ongoing acquisition and post-merger integration of various Health, international and other operations may carry short-term risks from operational continuity, competition and process governance perspectives.
Risk mitigation: We have change management policies, processes and controls in place, based upon industry best practices. In general, we strive to ensure that system development and process change are prioritized, and we apply a project management approach to such initiatives that includes reasonable risk identification and contingency planning, scope and change control, and resource and quality management. We generally also complete reasonable functional, performance and revenue assurance testing, as well as capturing and applying any lessons learned. Where a change involves major system and process conversions, we often move our business continuity planning and emergency management operations centre to a heightened state of readiness in advance of the change. |
Data protection
We operate data centres and collect and manage data in our business and on behalf of our customers (including, in the case of TELUS Health, sensitive health information). Some of our efficiency initiatives rely on the offshoring of internal functions to our personnel in other countries or outsourcing to partners located in Canada and abroad. To be effective, these arrangements require us to allow personnel in other countries and domestic and foreign partners to have access to this data.
We or our partners may be subject to software, equipment or other system malfunctions, or thefts or other unlawful acts that result in the unauthorized access to, or change, loss or destruction of, our data. There is a risk that such malfunctions or unlawful acts may compromise the privacy of individuals, including our customers, employees and suppliers, or may compromise other sensitive information. Despite our efforts to implement controls in domestic and offshore operations and at our partners’ operations, unauthorized access to data could lead to data being lost, compromised or used for inappropriate purposes that could, in turn, result in financial loss (loss of subscribers or damage to our ability to attract new ones), harm our reputation and brand, expose us to claims of damages by customers and employees, and impact our customers’ ability to maintain normal business operations and deliver critical services. Also see Legal and ethical compliance in Section 10.9 Litigation and legal matters and Security discussed below.
Risk mitigation: Certain new IT systems undergo a security and privacy assessment early in their development life cycle, pursuant to which data that is to be used and/or collected is reviewed and classified, and design features such as audit, logging, encryption and access control restrictions are recommended, when appropriate and possible. As part of our systems and software development life cycle and quality assurance processes, privacy and security controls are also tested before new systems are fully deployed. |
Our Internet data centres have security threat detection and mitigation capabilities, and certain data centres and networks undergo yearly external independent third-party audits that include assessment of our logical, physical and policy-based security and privacy controls. We have a vulnerability management program in place that monitors both our Internet-facing and internal network and systems in order to track and address vulnerabilities that may be detected. To support the security of our customers’ credit card transactions, we use security technologies such as encryption and segmentation, and we adhere to the principle of least privilege. We maintain these practices and review their effectiveness on a regular basis, considering industry standards and changes in the constantly evolving threat landscape. Another component of our strategy is the stipulation that data generally resides in our facilities in Canada, with the deployment of infrastructure that supports partner connectivity to view our systems. We require partners and service providers to comply with privacy and security measures, including the reporting of any possible data-related threats. Personnel in other countries are provided with remote views of authorized data only and, where applicable, without the data being stored on local systems. These personnel are also required to comply with physical and process restrictions and participate in training designed to help prevent and detect unauthorized access to, or use of, our data. Our strategy also includes reactive planning and business continuity planning processes that would be invoked in the event of a breach. There can be no assurance that our controls will prove effective in all instances. |
Security
We have a number of assets that are subject to intentional threats. These include physical assets that are subject to security risks such as vandalism and/or theft, including (but not limited to) distributive copper cable, corporate stores, network and telephone switch centres, and elements of corporate infrastructure, as well as IT systems and networks that we operate. The latter are subject to cyberattacks, which are intentional attempts to disrupt our business or gain unauthorized access to our information systems and network for unlawful, unethical or improper purposes. Attacks may use a variety of techniques that include the targeting of individuals and the use of sophisticated malicious software and hardware or a combination of both to evade the technical and administrative safeguards that are in place (including firewalls, intrusion prevention systems, active monitoring, etc.). The risk and consequences of cyberattacks on our assets could surpass physical security risks and consequences because of the rapidly evolving nature and sophistication of these threats.
A successful disruption of our systems, network and infrastructure, or those of our third parties, vendors and partners, may prevent us from providing reliable service, impact the operations of our network or allow for the unauthorized interception, destruction, use or dissemination of our information or our customers’ information. Such disruption or unauthorized access to information could cause us to lose customers or revenue, incur expenses, and experience reputational and goodwill damages. It could also subject us to litigation or governmental investigation and sanction. The costs of such events may include liability for information loss, as well as the costs of repairs to infrastructure and systems and any retention incentives offered to customers and business partners. Our insurance may not cover, or fully reimburse us for, these costs and losses. See also Data protection above.
Risk mitigation: We have implemented technical and administrative measures to mitigate the risk of threats, attacks and other disruptive events. Our security program addresses risk through a number of mechanisms, including the implementation of controls based on policies, standards and methodologies that are aligned with recognized industry frameworks and practices, the monitoring of external activities by potential attackers, regular evaluations of our most important assets through our Crown Jewels program, the identification and regular re-evaluation of our known security risks, regular reviews of our standards and policies to ensure they address current needs and threats, and business continuity and recovery planning processes that would be invoked in the event of a disruption. We incorporate security provisions into new initiatives through a standard secure-by-design process and methodology, and re-assess our security posture over the life cycle of our systems. Our technical capabilities help us identify security-related events, respond to possible threats and adjust our security posture appropriately. Additionally, our approach to cyber hygiene includes regular vulnerability assessments and the prioritization and remediation of any identified exposure through patching or other mechanisms. Our security office works with law enforcement and other agencies to address the ongoing threat of cyberattacks and disruptions. While we have reasonable physical security and cybersecurity programs in place, there can be no assurance that specific security-related incidents will not materially affect our operations and financial results. |
Reorganizations and integration of acquisitions
We carry out a number of unique operational consolidation, cost reduction and rationalization initiatives each year that are intended to improve our productivity and competitiveness. Examples of these initiatives include operational effectiveness programs to drive improvements in EBITDA, including business integrations; business process outsourcing; offshoring and reorganizations, including full-time equivalent (FTE) employee reduc-tion programs; procurement initiatives; and real estate rationalization. We may record significant cash and non-cash restructuring charges and other costs for such initiatives, which could adversely impact our operating results. There can be no assurance that all planned initiatives will be completed, or that such initiatives will provide the expected benefits or will not have a negative impact on our customer service, work processes, employee engagement, operating performance and financial results. Additional revenue and operational effectiveness initiatives will continue to be assessed and implemented, as required.
Post-acquisition activities include the review and alignment of accounting policies and other corporate policies, such as ethics and privacy policies, employee transfers and moves, information systems integration, optimization of service offerings and the establishment of control over new operations. Such activities may not be conducted efficiently and effectively, which may negatively impact our service levels, competitive position and financial results. There can be no assurance that we will be able to successfully and efficiently integrate acquisitions, complete divestitures or establish partnerships in a timely manner, and realize expected strategic benefits.
Risk mitigation: We focus on and manage organizational change through a formalized business transformation function by leveraging the expertise, key learnings and effective practices developed in recent years during the implementation of mergers, business integrations and efficiency-related reorganizations. We also have formal senior executive level reviews of major competitive enhancement programs, with monthly updates from key business units and a comprehensive tracking program to ensure all initiatives are tracked and properly governed. |
We have a post-merger integration team that works with our business units and the operations they acquire, applying an integration model based on learnings from previous integrations, which enhances and accelerates the standardization of our business processes and is intended to preserve the unique qualities of each acquired operation. For further details of our acquisitions made during the year ended December 31, 2018, see Highlights of 2018 in Section 1.3. |
Implementation of large enterprise deals
Large enterprise deals may be characterized by the need to anticipate, understand and respond to complex and multi-faceted customer-specific enterprise requirements, including customized systems and reporting requirements, service credits that lower revenues, and significant upfront expenses and capital expenditures involved in implementing the contracts. There can be no assurance that service implementation will proceed as planned and expected efficiencies will be achieved, which may impact return on investment or projected margins. We may also be constrained by limits on available staff and system resources or by the level of co-operation from other service providers, which may in turn limit the number of large contracts that can be implemented concurrently in a given period and/or increase our costs related to such implementations.
Risk mitigation: We expect to continue being selective as to which new large contracts we bid on, and we continue to focus our efforts on the SMB market and mid-market. We have a sales and bid governance process in place, which involves the preparation, review and sign-off of bids, as well as all related due diligence and authorizations. For each new large enterprise deal, we look to leverage systems and processes developed in previous contract wins while incorporating others as required, using a controlled methodology to form a new custom solution. We also follow standard industry practices for project management, including executive and senior level governance and project oversight, commitment of appropriate project resources, tools and supporting processes, and proactive project-specific risk assessments and risk mitigation planning. As well, we conduct independent project reviews and internal audits of previous contract work to identify areas that may require additional focus and to document any systemic issues and learnings in project implementations that could be relevant for other future large enterprise deals. |
Foreign operations
Our international operations present certain risks, which include: competition in foreign markets and industries such as business process and IT outsourcing; customer rights to terminate contracts with notice; infrastructure and security challenges; employee recruitment and retention; customer concentration; technological advances in robotic process automation (RPA) and artificial intelligence; country-specific risks (such as differences in and changes to political, economic and social systems, including changes to legal and regulatory regimes); different taxation regimes; differences in type, exposure to, and frequency of, natural disasters; and foreign currency exchange rate fluctuations. There can be no assurance that international initiatives and risk mitigation efforts will provide the benefits and efficiencies expected, or that there will not be significant difficulties in combining different management structures and cultures, which could have a negative impact on operating and financial results. See also Legal and ethical compliance in Section 10.9 Litigation and legal matters and Business continuity below, which may apply to our international operations.
MD&A: RISKS AND RISK MANAGEMENT
Risk mitigation: We invest in service development and process improvements, and we regularly survey customers for feedback and monitor quality of service metrics so that we can proactively address our customers’ concerns and exceed their expectations. Our sales focus on winning new clients, as well as our strategic business acquisitions, limit our customer concentration risk on an ongoing basis and add to our RPA and digital service capabilities. In 2016, we entered an agreement with Baring Private Equity Asia to acquire a 35% non-controlling interest in TELUS International (TI), which positions TI well to leverage Baring Private Equity Asia’s deep Asian markets presence and worldwide experience, and to tap into its global network in order to further expand TI’s operations. Our IT systems undergo security and privacy assessments (see Data protection and Security above). We make significant investments in support of our team members, including high-end workplace facilities, competitive benefits, ongoing training and development, and recurring surveys to identify and address areas of concern. We maintain a diverse base of operations, with facilities located in North America, Asia, Europe and Central America, which helps minimize country-specific risks, gives us the ability to serve customers in multiple languages and in multiple time zones, and provides network redundancy and contingency planning opportunities. International operational practices are monitored for alignment with changes in regulation, best practices and customer expectations, as well as the privacy, integrity, anti-bribery and procurement policies of our domestic Canadian operations, as appropriate. We also utilize foreign currency forward contracts to mitigate currency risks (see Currency risk in Section 7.9 Financial instruments, commitments and contingent liabilities). |
Business continuity
We are a key provider of essential telecommunications infrastructure in Canada, along with operations and infrastructure in North America, Asia, Europe and Central America. Our network, information technology, physical assets, team members, business functions, supply chain and business results may be materially impacted by exogenous threats, including:
· Natural hazards, such as forest fires, severe weather, earthquakes and other natural disasters
· Disruptions of critical infrastructure, such as power and telecommunications
· Human-caused threats, such as cyberattacks, labour disputes, theft, vandalism, sabotage, and political and civil unrest
· Public health threats, such as pandemics.
See Concerns related to the environment in Section 10.10.
Risk mitigation: We have an enterprise-wide business continuity program that is aligned with our corporate priorities, which include ensuring the safety of our team members, minimizing the impacts of threats to our facilities and business operations, maintaining service to our customers and keeping our communities connected. These priorities have been demonstrated in a number of disruptive events in 2018, such as the wildfires in British Columbia and the spring flooding in British Columbia, Ontario and Quebec. Mitigation initiatives to address severe weather threats have been an increasing focus and we have operationalized enhanced severe weather monitoring, notification of key stakeholders, incident management processes and climate incident playbooks that leverage learnings from prior events. Our business continuity program aligns with the current standards and business practices, and encompasses provisions for mitigation, preparedness, response, recovery and ongoing program improvements. |
The program focuses on mitigating the impacts of a disruption to our facilities, workforce, technology and supply chain. Although we have business continuity planning processes in place, there can be no assurance that specific events or a combination of events will not disrupt our operations or materially affect our financial results. Ongoing risk-based optimization of our disaster recovery capabilities for our IT and telecommunications network assets is a key focus for preventing outages and limiting their impact on our operations and customers. We are focused on driving closer alignment of IT and network recovery capabilities with business requirements. However, while disaster recovery is a focus for us, not all of our systems have recovery and continuity capabilities. |
Real estate joint venture (TELUS Sky)
We have entered into joint ventures to develop real estate projects, including the TELUS Sky project in Calgary. Risks associated with our real estate joint ventures include possible construction-related cost overruns, financing risks, reputational risks and the uncertainty of future demand, especially during market downturns. There can be no assurance that the real estate project will be completed on budget or on time, or will obtain lease commitments as planned. Accordingly, we are exposed to the risk of loss on our investment and loan amounts, and a potential inability to service debt payments should a project’s business plan not be successfully realized. Additionally, reputational risks arise from the possibility that we may be unable to meet our stated commitments and/or that the quality of the development may not be consistent with our brand expectations.
Risk mitigation: To develop TELUS Sky in Calgary, we have established a joint venture with partners experienced in large commercial and residential real estate projects – Westbank and Allied REIT. For projects in progress, budget-overrun risks have been miti-gated through fixed-price supply contracts, expert project management oversight and insurance for certain risks. Construction costs for TELUS Sky continue to be consistent with the approved budget plan and we are applying the knowledge and experience gained on the TELUS Garden project in Vancouver to streamline and improve the cost-effectiveness of TELUS Sky. Additionally, we have retained independent third-party consultants to assist in identifying other potential cost and time savings, and we continue to monitor economic conditions which may have impacts on the TELUS Sky real estate joint venture and consider mitigation strategies as required. |
10.6 Human resources
Employee retention, recruitment and engagement
Our success depends on the abilities, experience and engagement of our team members. The loss of key employees through attrition and retirement, the inability to attract and retain employees with essential or evolving skills, or any deterioration in overall employee morale and engagement resulting from organizational changes, unresolved collective agreements or ongoing cost reduction initiatives, could have an adverse impact on our growth, business and profitability and our efforts to enhance the customer experience. Changes in technology are also shifting the set of skills needed by our team, and we face competition from other global players for these same skills.
Risk mitigation: We aim to attract and retain key employees through both monetary and non-monetary approaches. Our compensation and benefits program is designed to support our high-performance culture and is both market-driven and performance-based. Where required, we implement targeted retention solutions for employees with critical skills or talents that are scarce in the marketplace. We have a succession planning process to identify top talent for key management positions. Additionally, we work continuously to raise the level of our employee engagement. We believe that our strong employee engagement continues to be supported by our focus on the customer and team member experience, our success in the marketplace and our social purpose. We plan to continue our focus on other non-monetary factors that are clearly aligned with employee engagement, including performance development, career opportunities, learning and development, recognition, diversity and inclusiveness, health and wellness programs, our Work Styles® program (e.g. facilitating working remotely from home or other alternative work locations), and our community volunteerism. The level of our employee engagement continues to place our organization within the top 10% of all employers surveyed. See also Section 10.10 Team member health, wellness and safety. |
10.7 Financing, debt requirements and returning cash to shareholders
Our business plans and growth could be negatively affected if existing financing is not sufficient to cover funding requirements
Risk factors, such as disruptions in capital markets, regulatory requirements for an increase in bank capitalization, a reduction in lending activity in general, or a reduction in the number of Canadian chartered banks as a result of reduced activity or consolidation, could reduce the availability of capital or increase the cost of such capital for investment grade corporate issuers, including us. External capital market conditions could potentially affect our ability to make strategic investments and meet ongoing capital funding requirements.
Risk mitigation: We may finance future capital funding requirements with internally generated funds, borrowings under the unutilized portion of our bank credit facilities, use of securitized trade receivables, use of commercial paper and/or the issuance of debt or equity securities. We have a shelf prospectus in effect until June 2020, under which we can offer up to $2.5 billion of debt or equity securities as of the date of this MD&A. We believe that our investment grade credit ratings, coupled with our efforts to maintain a constructive relationship with banks, investors and credit rating agencies, continue to provide reasonable access to capital markets. To enable us to meet our financial objective of generally maintaining $1 billion of available liquidity, we have a $2.25 billion credit facility that expires on May 31, 2023 ($1.5 billion available at December 31, 2018), as well as availability under other bank credit facilities (see Section 7.6 Credit facilities). In addition, TELUS Communications Inc. (TCI) has an agreement with an arm’s-length securitization trust until December 31, 2021, under which it is able to sell an interest in certain of its trade receivables up to a maximum of $500 million, of which $400 million was available at December 31, 2018 (see Section 7.7 Sale of trade receivables). |
Ability to refinance maturing debt
At December 31, 2018, our long-term debt was approximately $14.2 billion, with maturities in certain years from 2019 to 2048 (see the Long-term debt principal maturities chart in Section 4.3). We operate a commercial paper program (maximum of $1.4 billion) that currently permits access to low-cost funding. At December 31, 2018, we had $774 million of commercial paper outstanding, all of which was denominated in U.S. dollars (US$569 million). When we issue commercial paper, it must be refinanced on an ongoing basis in order to realize the cost savings relative to borrowing on the $2.25 billion credit facility. Capital market conditions may prohibit the roll-over of commercial paper at low rates.
Risk mitigation: We successfully completed a number of debt transactions in 2017 and 2018 (see Section 7.4). As a result, the average term to maturity of our long-term debt (excluding commercial paper, the revolving component of the TELUS International credit facility and finance leases) was 12.2 years at December 31, 2018 (as compared to 10.7 years at December 31, 2017). Foreign currency forward contracts are used to manage currency risk arising from issuing commercial paper and long-term debt denominated in U.S. dollars (excluding the TELUS International credit facility). Our commercial paper program is fully backstopped by our $2.25 billion credit facility. |
A reduction in credit ratings could affect our cost of capital and access to capital
There can be no assurance that we will maintain or improve current credit ratings. Our cost of capital could increase and our access to capital could be affected by a reduction in the credit ratings of TELUS and/or TCI. A reduction in our ratings, from the current BBB+ or equivalent, could result in an increase to our cost of capital.
Risk mitigation: We manage our capital structure and adjust it in light of changes in economic conditions and the risk characteristics of our telecommunications infrastructure. We have financial policies in place that are reviewed annually and are intended to help maintain our existing investment grade credit ratings in the range of BBB+ or the equivalent. Four credit rating agencies currently have ratings that are in line with this target. Access to our $2.25 billion credit facility would be maintained, even if our ratings were reduced to below BBB+. |
Lower than planned free cash flow could constrain our ability to invest in operations, reduce debt or return capital to shareholders
While future free cash flow and sources of capital are expected to be sufficient to meet current requirements, our current intention to return capital to shareholders could constrain our ability to invest in our operations for future growth. Funding of future spectrum licence purchases, funding of defined benefit pension plans and any increases in corporate income tax rates will reduce the after-tax cash flow otherwise available to return as capital to our shareholders. Should actual results differ from our expectations, there can be no assurance that we will not change our financing plans, including our intention to pay dividends according to our payout policy guideline and to maintain our multi-year dividend growth program. Shares may be purchased under our normal course issuer bid (NCIB) when and if we consider it advantageous, based on our financial position and outlook, and the market price of our Common Shares. For further detail on our multi-year dividend growth program and 2019 NCIB program, see Section 4.3 Liquidity and capital resources.
MD&A: RISKS AND RISK MANAGEMENT
Risk mitigation: Our Board of Directors reviews and approves the declaration of a dividend each quarter, and the amount of the dividend, based on a number of factors, including our financial position and outlook. This assessment is subject to various assumptions and the impact of various risks and uncertainties, including those described in this Section 10.
|
Financial instruments
Our financial instruments, and the nature of credit risks, liquidity risks and market risks to which they may be subject, are described in Section 7.9 Financial instruments, commitments and contingent liabilities.
10.8 Taxation matters
We are subject to the risk that income and commodity tax amounts, including tax expense, may be materially different than anticipated, and that a general tendency by domestic and foreign tax collection authorities to adopt more interpretations and aggressive auditing practices could adversely affect our financial condition and operating results
We collect and pay significant amounts of indirect taxes, such as goods and services taxes, harmonized sales taxes, provincial sales taxes, sales and use taxes and value-added taxes, to various tax authorities. As our operations are complex and the related tax interpretations, regulations, legislation and jurisprudence that pertain to our activities are subject to continual change and evolving interpretation, the final determination of the taxation of many transactions is uncertain. Moreover, the implementation of new legislation in itself has its own complexities, including those of execution where multiple systems are involved, and the interpretation of new rules as they apply to specific transactions, products and services.
We have significant current and deferred income tax assets and liabilities, income tax expenses and cash tax payments. Income tax amounts are based on our estimates, applying accounting principles that recognize the benefit of income tax positions only when it is more likely than not that the ultimate determination of the tax treatment of a position will result in the related benefit being realized. The assessment of the likelihood and amount of income tax benefits, as well as the timing of realization of such amounts, can materially affect the determination of Net income or cash flows. We expect the income taxes calculated at applicable statutory rates to range between 26.7% and 27.3% in 2019. These expectations can change as a result of changes in interpretations, regulations, legislation or jurisprudence.
The timing of the monetization of deferred income tax accounts is uncertain, as it is dependent on our future earnings and other events. The amounts of deferred income tax liabilities are also uncertain, as the amounts are based upon substantively enacted future income tax rates that were in effect at the time of deferral, which can be changed by tax authorities. As well, the amounts of cash tax payments and current and deferred income tax liabilities are also based upon our anticipated mix of revenues among the jurisdictions in which we operate, which is also subject to change.
The audit and review activities of tax authorities affect the ultimate determination of the actual amounts of indirect taxes payable or receivable, income taxes payable or receivable, deferred income tax liabilities, taxes on certain items included within capital and income tax expense. Therefore, there can be no assurance that taxes will be payable as anticipated and/or that the amount and timing of receipt or use of the tax-related assets will be as currently expected.
TELUS International operates in a number of foreign jurisdictions, including Barbados, Bulgaria, El Salvador, Guatemala, India, Ireland, Philippines, Romania, the United Kingdom and the United States, which increases our exposure to multiple forms of taxation.
Generally, each jurisdiction has taxation peculiarities in the forms of taxation imposed (e.g. value-added tax, gross receipts tax, stamp and transfer tax, and income tax), and differences in the applicable tax base and tax rates, legislation and tax treaties, where applicable, as well as currency and language differences. In addition, the telecommunications industry faces unique issues that lead to uncertainty in the application of tax laws and the division of tax between domestic and foreign jurisdictions. Furthermore, there has been a more intense focus by the media and by political and tax authorities on taxation, both domestically and internationally, with an intent to enhance tax transparency and to address perceived tax abuses. Accordingly, our activities may increase our exposure to tax risks, from both a financial and a reputational perspective.
Risk mitigation: We follow a comprehensive tax conduct and risk management policy that was adopted by our Board. This policy outlines the principles underlying and guiding the roles of team members, their responsibilities and personal conduct, the method of conducting business in relation to tax law and the approaches to working relationships with external tax authorities and external advisors. This policy recognizes the requirement to comply with all relevant tax laws. The components necessary for the effective control and mitigation of tax risk are outlined in the policy, as is the delegation of authority to management for addressing tax matters in accordance with Board and Audit Committee communication guidelines. In giving effect to this policy, we maintain an internal Taxation department comprised of professionals who stay current on domestic and foreign tax obligations, supplemented where appropriate with external advisors. This team reviews systems and process changes for compliance with applicable domestic and international taxation laws and regulations. Its members are also responsible for the specialized accounting required for income taxes. Material transactions are reviewed by our Taxation department so that transactions of an unusual or non-recurring nature are assessed from multiple risk-based perspectives. Tax-related transaction risks are regularly communicated to, and re-assessed by, our Taxation department as a check to initial exposure assessments. As a matter of regular practice, large transactions are reviewed by external tax advisors, while other third-party advisors may also be engaged to express their views as to the potential for tax liability. We continue to review and monitor our activities so that we can take action to comply with any related regulatory, legal and tax obligations. In some cases, we also engage external advisors to review our systems and processes for tax-related compliance. The advice provided and tax returns prepared by such advisors and counsel are reviewed for reasonableness by our internal Taxation department.
|
10.9 Litigation and legal matters
Investigations, claims and lawsuits
Given the size of our organization, investigations, claims and lawsuits seeking damages and other relief are regularly threatened or pending against us. The growing diversity of our service offerings, which now includes communication, health, and security services, may increase these risks. It is not currently possible for us to predict the outcome of
such matters due to various factors, including: the preliminary nature of some claims; uncertain damage theories and demands; incomplete factual records; the uncertain nature of legal theories and procedures and their resolution by the courts, at both the trial and the appellate levels; and the unpredictable nature of opposing parties and their demands. There can be no assurance that financial or operating results will not be negatively impacted by any of these factors.
Subject to the foregoing limitations, management is of the opinion, based upon legal assessments and the information presently available, that it is unlikely that any liability relating to existing investigations, claims and lawsuits, to the extent not provided for through insurance or otherwise, would have a material effect on our financial position and the results of our operations, excepting the items disclosed herein and in Note 29(a) of the Consolidated financial statements.
Risk mitigation: We believe that we have in place reasonable policies and processes designed to enable compliance with legal and contractual obligations and reduce our exposure to, and the effect on us of, legal claims. We also maintain a team of legal professionals who advise on and manage risks related to claims and possible claims. See other risk mitigation steps discussed below.
|
Class actions
We are a defendant in a number of certified and uncertified class actions. Over the past decade or more, we have observed a willingness on the part of claimants to launch class actions whereby a representative plaintiff seeks to pursue a legal claim on behalf of a large group of persons. The number of class actions filed against us has varied from year to year, with claimants continually looking to expand the matters in respect of which they file class actions. The adoption by governments of increasingly stringent consumer protection and privacy legislation may increase the number of class actions by creating new causes of action, or may decrease the number of class actions by improving clarity in the areas of consumer marketing and contracting and the protection of privacy. A successful class action lawsuit, by its nature, could result in a sizable damage award that could negatively affect a defendant’s financial or operating results. Certified and uncertified class actions against us are detailed in Note 29(a) of the Consolidated financial statements.
Assessment of class actions
We believe that we have good defences to each of these certified and uncertified class actions. Should the ultimate resolution of these actions differ from management’s assessments and assumptions, a material adjustment to our financial position and the results of our operations could result. Management’s assessments and assumptions include that reliable estimates of the exposure cannot be made for the majority of these class actions, considering continued uncertainty relating to the causes of action that may ultimately be pursued by the plaintiffs and certified by the courts and the nature of the damages that may be sought by the plaintiffs.
Risk mitigation: We are vigorously defending each of the class actions brought against us, including opposing certification of uncertified class actions. Certification is a procedural step that determines whether a particular lawsuit may be prosecuted by a representative plaintiff on behalf of a class of individuals. Certification of a class action does not determine the merits of the claim, so that, if we were unsuccessful in defeating certification, the plaintiffs would still be required to prove the
|
merits of their claims. In appropriate cases, we are pursuing settlements that we consider to be in our best interests. We regularly assess our business practices and actively monitor class action developments in Canada and the United States in order to identify and minimize the risk of further class actions against us.
|
Civil liability in the secondary market
Like other public companies, we are subject to civil liability for misrepresentations in written disclosure and oral statements, and liability for fraud and market manipulation.
Risk mitigation: We continually monitor legal developments and annually re-evaluate our disclosure practices and procedures. In addition, we periodically consult external advisors to review our disclosure practices and procedures and the extent to which they are documented. We have a corporate disclosure policy that restricts the role of Company spokesperson to specifically designated members of senior management, provides a protocol for communicating with investment analysts and investors, as well as oral presentations, and outlines the communication approach to issues. Our Disclosure Committee reviews key disclosure documents.
|
Legal and ethical compliance
We rely on our employees, officers, Board of Directors, key suppliers and other business partners to demonstrate behaviour consistent with applicable legal and ethical standards in all jurisdictions within which we operate, including, but not limited to, anti-bribery laws and regulations. Situations might occur where individuals intentionally or inadvertently do not adhere to our policies, applicable laws and regulations or contractual obligations. For instance, there could be cases in which the personal information of a customer or employee is collected, retained, used or disclosed in a manner that is not fully compliant with legislation, contractual obligations or our policies. In the case of TELUS Health and our recently acquired medical clinics, personal information includes sensitive health information about individuals who are our customers or healthcare providers’ end customers. In addition, there could be situations in which compliance programs may not be fully adhered to, or in which parties may have a different interpretation of the requirements of particular legislative provisions. As our TELUS Health team and recently acquired medical clinics offer new services (such as virtual care and electronic prescription), including in some cases to consumers and in other cases through third-party partnerships, new risks arise across parameters such as dependence on third-party suppliers for legal compliance and/or compliance with medical professional standards, as well as a heightened possibility of political intervention. The acquisition of medical clinics in 2018 and resulting direct participation in providing healthcare services increases our exposure to the risks of non-compliance and political intervention. These various situations expose us to the risk of litigation and the possibility of damages, sanctions and fines, or of being disqualified from bidding on contracts, and may negatively affect our financial or operating results, reputation and brand.
We continue to expand our activities into the United States and other countries. When operating in foreign jurisdictions, we are required to comply with local laws and regulations, which may differ substantially from Canadian laws and add to the regulatory, legal and tax exposures that we face. In certain cases, foreign laws with extra-territorial application may also impose obligations on us.
MD&A: RISKS AND RISK MANAGEMENT
For example, the EU’s General Data Protection Regulation (GDPR) came into force in May 2018, and applies to many of our business customers who, in turn, pass those obligations on to us as their service provider. When we acquire companies, they could have past records of non-compliance with laws and regulations and/or may have taken actions that could give rise to litigation.
Risk mitigation: Although we cannot predict outcomes with certainty, we believe we have reasonable policies, controls and processes in place, and levels of awareness sufficient for proper compliance, and that these are having a positive effect on limiting risks. We have an anti-bribery and corruption policy, a comprehensive code of ethics and conduct for our employees, officers and Board of Directors, and mandatory annual integrity training for employees, officers and identified contractors. We also have a supplier code of conduct and a toll-free EthicsLine for anonymous reporting by anyone who may have concerns or complaints to bring forward. We conduct targeted mandatory training on our anti-bribery and corruption policies, as well as on our business sales code of conduct, and we have mandatory annual training on privacy for all of our team members. We have a designated Chief Data and Trust Officer, whose role is to work across the enterprise to ensure that the business has appropriate processes and controls in place in order to facilitate legal compliance and to report on compliance to the Audit Committee. We have an established review process to ensure that regulatory, legal and tax requirements are considered when pursuing opportunities outside of Canada. On an ongoing basis, we review our international structure, systems and processes to ensure that we mitigate regulatory, legal and tax risks as our business activities expand beyond Canada. We also engage external counsel and advisors qualified in the relevant foreign jurisdictions to provide regulatory, legal and tax advice, as appropriate. In advance of the coming into force of the GDPR, we launched a GDPR readiness program to prepare us to review our own direct and indirect compliance obligations and to assist our customers in their compliance efforts. When we acquire a company, we conduct due diligence, obtain standard industry representations and warranties relating to the acquired assets and liabilities, and assess any risks related to litigation disclosed to us.
|
Defects in software and failures in data or transaction processing
We provide certain applications and managed services to our customers that involve the management, processing, sharing and/or storing of data, including sensitive personal medical records, and the transfer of funds. Software defects or failures in data or transaction processing could lead to substantial damage claims (including privacy and medical claims). For instance, a defect in a Health application could lead to personal injury or unauthorized access to personal information, while a failure in transaction processing could result in the transfer of funds to the wrong recipient. See Data protection above.
Risk mitigation: We believe that we have in place reasonable policies, controls, processes (such as quality assurance programs in software development procedures) and contractual arrangements (such as disclaimers, indemnities and limitations of liability in most cases), as well as insurance coverage, to limit our exposure to these types of legal claims. However, there can be no assurance that all team members will follow our processes at all times or that we have indemnities and limitations of liability covering all cases.
|
Intellectual property and proprietary rights
Technology evolution also brings additional legal risks and uncertainties. The intellectual property and proprietary rights of owners and developers of hardware, software, business processes and other technologies may be protected under statute, such as patent, copyright and industrial design legislation, or under common law, such as trade secrets. With the growth and development of technology-based industries, the value of these intellectual property and proprietary rights has increased. Significant damages may be awarded in intellectual property infringement claims advanced by rights holders. In addition, defendants may incur significant costs to defend such claims, and that possibility may prompt defendants to settle claims more readily, in part to limit those costs. Both of these factors may also encourage intellectual property rights holders to pursue infringement claims more aggressively.
Given the vast array of technologies and systems that we use to deliver products and services, and the rapid change and complexity of such technologies, the number of disputes over intellectual property and proprietary rights can reasonably be expected to increase. As a user of technology, we receive communications from time to time, ranging from solicitations to demands and legal actions from third parties claiming ownership rights over intellectual property used by us and asking for settlement payments or licensing fees for the continued use of such intellectual property.
There can be no assurance that we will not be faced with other significant claims based on the alleged infringement of intellectual property rights, whether such claims are based on a legitimate dispute over the validity of the intellectual property rights or their infringement, or are advanced for the primary purpose of extracting a settlement. We may incur significant costs in defending ourselves against infringement claims, we may suffer significant damages and we could lose the right to use technologies that are essential to our operations should any infringement claim prove successful. As a developer of technology, our TELUS Health team depends on its ability to protect the proprietary aspects of its technology. The failure to adequately do so could materially affect our business. However, policing unauthorized use of our intellectual property may be difficult and costly.
Assessment of intellectual property claims
We believe that we have good defences to each of the intellectual property claims against us. Should the ultimate resolution of these claims differ from management’s assessments and assumptions, a material adjustment to our financial position and the results of our operations could result. Management’s assessments and assumptions include that reliable estimates of the exposure cannot be made for the majority of these claims, considering the continued uncertainty relating to the validity of the intellectual property at issue, whether or not technology used by us infringes upon that intellectual property, and the nature of the damages that will be sought by the plaintiffs.
Risk mitigation: We incorporate many technologies into our products and services. However, we are not primarily in the business of creating or inventing technology. In acquiring products and services from suppliers, it is our practice to seek and obtain contractual protections consistent with standard industry practices to help mitigate the risks of intellectual property infringements. Whenever creating or inventing technology and applications, it is our practice to protect our intellectual property rights through litigation and other means.
|
10.10 Health, safety and environment
Team member health, well-being and safety
Lost work time resulting from team member illness or injury can negatively affect organizational productivity and employee benefit costs.
Risk mitigation: To support team members’ overall well-being and to achieve a positive effect on absenteeism in the workplace, we take a holistic and proactive approach to team members’ health that involves health risk prevention, early intervention, employee and family assistance, assessment and support services, disability management, and accommodation and return to work services. Our health and well-being strategy encourages our team members to develop optimal personal health through five dimensions of well-being: physical, psychological, financial, social and environmental. To promote safe work practices, we offer training and orientation programs for team members and contractors who access our facilities. There can be no assurance that these health, well-being and safety programs and practices will be effective in all situations.
|
Concerns related to radio frequency emissions from mobile phones and wireless towers
We understand there are public concerns over potential impacts associated with low levels of non-ionizing radio frequency (RF) emissions from mobile phones and cell towers.
To address these concerns, we look to recognized experts with peer-reviewed findings, as well as government agencies, to provide guidance on potential risks. While a small number of epidemiological studies have revealed that exposure to RF fields might be linked to certain cancers, other studies have not supported this association. Furthermore, animal laboratory studies have found no evidence that RF fields are carcinogenic for laboratory rodents or cause damage to DNA.
The International Agency for Research on Cancer and Health Canada have advised mobile phone users that they can take practical measures to reduce their exposure to RF emissions, such as limiting the length of cellphone calls, using hands-free devices and replacing cellphone calls with text messages. In addition, Health Canada encourages parents to take these same measures to reduce their children’s RF emission exposure, since children are typically more sensitive to a variety of environmental agents. We also offer information and advice with respect to RF emissions on our website at telus.com/support.
There can be no assurance that future studies, government regula-tions or public concerns about the health effects of RF emissions will not have an adverse effect on our business and prospects. For example, public concerns or government action could reduce subscriber growth and usage, and costs could increase as a result of the need to modify handsets, relocate wireless towers and address any incremental legal requirements and product liability lawsuits that might arise or have arisen. See Class actions in Section 10.9 Litigation and legal matters.
Risk mitigation: Canada’s federal government is responsible for establishing safe limits for signal levels of radio devices. We are confident that the mobile handsets and devices we sell, and our cell towers and other associated devices, comply, in all material respects, with all applicable Canadian and U.S. government safety standards. We continue to monitor new published studies, government regulations and public concerns about the health impacts of RF exposure.
|
Concerns related to the environment
A detailed report of our environmental risk mitigation activities can be found in our sustainability report at telus.com/sustainability. Environmental issues affecting our business include:
Climate-related risk
Our operations are exposed to climate-related physical risks, such as from the consequences of increasing severity and frequency of extreme weather events and rising global temperatures, as well as transition risks related to climate change, such as the impact of changes in policy or implementation of the lower-emission technology.
Waste and waste recycling; water consumption; spills and releases
Several areas of our operations are subject to environmental considerations, such as the handling and disposal of waste, electronic waste or other residual materials, the management of our water use, and spills and releases from our operations. Some areas of our operations are subject to evolving and increasingly stringent federal, provincial and local environmental, health and safety laws and regulations. Such laws and regulations impose requirements with respect to matters such as the release of certain substances into the environment, corrective and remedial action concerning such releases, and the proper handling and management of certain substances, including wastes. Evolving public expectations and increasingly stringent laws and regulations could result in increased costs of compliance, while failure to recognize and adequately respond to the same could result in penalties, regulatory scrutiny or damage to our reputation and brand.
Risk mitigation: Our approach to climate-related risk consists of a governance component that has Board oversight and a management program with climate change impact assessments; a strategic component that includes energy management programs, business continuity planning and readiness activities; a risk management component that incorporates a climate-related risk assessment as part of our ongoing enterprise risk management processes, as well as disclosure in our sus-tainability report of our performance in managing these risks; and the use of metrics to assess climate-related risks and opportunities and of targets for greenhouse gas (GHG) emissions, including disclosure of our actions and progress towards these targets in our sustainability report. Our corporate target is a 25% reduction in CO2e from 2010 levels by 2020 and a 10% reduction in energy use over the same period. We have also invested in renewable energy solutions and green building technology. We utilize an ISO 14001:2015 certified environmental management system (EMS) to identify and control the environmental impacts associated with our operations. The EMS is audited annually to ensure compliance with standard applicable regulatory requirements. Within the EMS, we have specific programs for the management of waste and waste recycling, water consumption, and spills and releases. Our e-waste management program specifies approved recycling channels for both external and internal electronic products. We regularly examine our waste streams to identify new ways of reducing our impact on the environment through the diversion of waste from landfills, and we have a corporate target of diverting 90% of waste from landfill by the end of 2020. Our waste and recycling strategy is focused on education and awareness programs, as well as the expansion of recycling infrastructure in our administrative buildings. Our spills and releases program includes the tracking and reporting of spills and releases, as well as risk-based assessments of any affected property and implementation of remedial solutions.
|
MD&A: RISKS AND RISK MANAGEMENT
10.11 Economic growth and fluctuations
Slow or uneven economic growth and fluctuating oil prices may adversely affect us
We estimate that economic growth in Canada will be approximately 2.0% in 2019 (see Economic growth in Section 1.2), but growth may be influenced by developments outside of Canada. In addition, macroeconomic risks in Canada continue to include concerns about fluctuating oil prices and high levels of consumer and mortgage debt, which may cause consumers to reduce discretionary spending, even in a growing economy. Further risks to the Canadian economy include rising interest rates, a weakening housing market, and uncertainty related to trade issues, including the ongoing imposition of tariffs. Meanwhile, trade conflicts between countries, as well as other economic and political uncertainties, may also have global implications, as supply chains are increasingly integrated.
Economic uncertainty may cause consumers and business customers to delay new service purchases, reduce volumes of use, discontinue use of services or seek lower-priced alternatives from us or our competitors. Weakness in the extractive energy sector that began in 2015 has had a significant impact on Western Canada, which is evident in lower levels of investment and employment, especially in Alberta. A particular risk for Alberta is the spread between global oil prices and Alberta-based oil prices, with Alberta-based oil selling below global prices due to the difficulties of bringing oil to market. As a result, an energy-related recovery has been more muted in Alberta than it would have been if the spread were smaller. This was partially mitigated by declining costs in non-extractive industries, such as manufacturing. The previous lower growth rates in Western Canada continued to reverse through 2018 after a robust economic performance in 2017, with economic growth in 2018 estimated to be 2.5% in Alberta and 2.3% in British Columbia, as compared to 2.2% for Canada.
Fluctuating oil prices, along with housing market and consumer debt risks in the Canadian economy, could adversely impact our customer growth, revenue, profitability and free cash flow, and could potentially require us to record impairments in the carrying value of our assets, including, but not limited to, our intangible assets with indefinite lives (spectrum licences and goodwill). Impairments in the carrying value of our assets would result in a charge to earnings and a reduction in owners’ equity, but would not affect cash flow. Furthermore, fluctuating interest rates may have an impact on consumer behaviour, as debt service burdens increase and Canadian households experience a reduction in disposable income.
A further risk to Canada is trade with the U.S. While the North American Free Trade Agreement (NAFTA) has been renegotiated as the U.S.-Mexico-Canada Agreement (USMCA), tariffs remain in place and the cost of trade has gone up in certain areas. Further, a trade conflict emerging between the United States and China may have global implications, as supply chains are increasingly integrated.
In 2018, the Canadian dollar exchange rate with the U.S. dollar was volatile, with the Canadian dollar generally weakening over the year, from roughly USD:CAD 1.26 to 1.35. Fluctuating oil prices and certain U.S. monetary policy changes may put further downward pressure on the Canadian dollar relative to the U.S. dollar in 2019. This will be particularly pronounced if the Federal Reserve increases overnight rates at a faster pace than the Bank of Canada, as a growing interest rate differential would lift the U.S. dollar. Certain of our revenues, capital asset acquisitions and operating costs are denominated in U.S. dollars.
Therefore, a continuing weakness in the Canadian dollar to U.S. dollar exchange rate may negatively impact our financial and operating results. Additionally, certain capital asset acquisitions and inventory purchases from outside Canada, although priced in Canadian dollars, may be negatively impacted by continuing weakness in the Canadian dollar relative to the U.S. dollar.
Risk mitigation: While economic risks cannot be completely mitigated, our top priority of putting customers first and pursuing global leadership in the likelihood of our clients to recommend our products, services and people, supports our efforts to acquire and retain customers through the economic fluctuations that affect them and us. We will also support customers negatively affected by fluctuating oil prices with cost-effective solutions that help them realize efficiencies in their operations, and we will continue to pursue cost reduction and efficiency initiatives in our own business (see discussion in Section 3 Corporate priorities). See Section 4.3 Liquidity and capital resources for our capital structure financial policies and plans. Our foreign currency exchange rate risk management includes the use of foreign currency forward contracts and currency options to fix the exchange rates on U.S. dollar-denominated transactions, commitments, commercial paper and U.S. Dollar Notes, but does not eliminate this risk entirely.
|
Pension funding
Economic and capital market fluctuations could adversely affect the investment performance, funding and expense associated with the defined benefit pension plans that we sponsor. Our pension funding obligations are based on certain actuarial assumptions relating to expected plan asset returns, salary escalation, retirement ages, life expectancy, the performance of the financial markets and future interest rates.
The employee defined benefit pension plans, in aggregate with the application of the asset ceiling, were in a $57 million surplus position at December 31, 2018 (compared to a $334 million deficit position at the end of 2017). Our solvency position, as determined under the Pension Benefits Standards Act, 1985, was estimated to be a surplus of $257 million (compared to a $482 million surplus position at the end of 2017). There can be no assurance that our pension expense and funding of our defined benefit pension plans will not increase in the future and thereby negatively impact earnings and/or cash flow. Defined benefit funding risks may arise if total pension liabilities exceed the total value of the respective plan assets in trust funds. Unfunded differences may arise from lower than expected investment returns, changes to mortality and other assumptions, reductions in the discount rate used to value pension liabilities, changes to statutory funding requirements and actuarial losses. While employee defined benefit pension plan re-measurements will cause fluctuations in other comprehensive income, these re-measurements will never be subsequently reclassified to income.
Risk mitigation: We seek to mitigate this risk through the application of policies and procedures designed to control investment risk and through ongoing monitoring of our funding position. Our best estimate of cash contributions to our defined benefit pension plans in 2019 is $36 million ($50 million in 2018.)
|
11 | Definitions and reconciliations |
11.1 Non-GAAP and other financial measures
We have issued guidance on and report certain non-GAAP measures that are used to evaluate the performance of TELUS, as well as to determine compliance with debt covenants and to manage our capital structure. As non-GAAP measures generally do not have a standardized meaning, they may not be comparable to similar measures presented by other issuers. Securities regulations require such measures to be clearly defined, qualified and reconciled with their nearest GAAP measure.
Adjusted Net income and adjusted basic earnings per share:
These measures are used to evaluate performance at a consolidated level and exclude items that may obscure the underlying trends in business performance. These measures should not be considered alternatives to Net income and basic earnings per share in measuring TELUS’ performance. Items that may, in management’s view, obscure the underlying trends in business performance include significant gains or losses associated with real estate development partnerships, gains on exchange of wireless spectrum licences, restructuring and other costs, long-term debt prepayment premiums (when applicable), income tax-related adjustments, asset retirements related to restructuring activities and gains arising from business combinations. (See Reconciliation of adjusted Net income and Reconciliation of adjusted basic EPS in Section 1.3.)
Capital intensity: This measure is calculated as capital expenditures (excluding spectrum licences) divided by total operating revenues. This measure provides a basis for comparing the level of capital expenditures to those of other companies of varying size within the same industry.
Dividend payout ratio: This is a historical measure calculated as the sum of the last four quarterly dividends declared per Common Share, as reported in the financial statements, divided by the sum of basic earnings per share for the most recent four quarters for interim reporting periods. For fiscal years, the denominator is annual basic earnings per share. Our objective range for the annual dividend payout ratio is on a prospective basis, rather than on a trailing basis, and is 65 to 75% of sustainable earnings per share on a prospective basis. (See Section 7.5 Liquidity and capital resource measures.)
Calculation of Dividend payout ratio
Years ended December 31 ($) | 2018 | 2017 |
|
| Applying IFRS 9 and IFRS 15 | ||
Numerator – Sum of the last four quarterly dividends declared per Common Share | 2.10 | 1.97 |
|
Denominator – Net income per Common Share | 2.68 | 2.46 |
|
Ratio (%) | 78 | 80 |
|
Dividend payout ratio of adjusted net earnings: This ratio is a historical measure calculated as the sum of the last four quarterly dividends declared per Common Share, as reported in the financial statements, divided by adjusted net earnings per share. Adjusted net earnings per share is basic earnings per share, as used in the Dividend payout ratio, adjusted to exclude the gain on the exchange of wireless spectrum licences, gains and equity income related to real estate joint ventures, provisions related to business combinations, long-term debt prepayment premium (when applicable) and income tax-related adjustments.
Calculation of Dividend payout ratio of adjusted net earnings
Years ended December 31 ($) | 2018 | 2017 |
|
| Applying IFRS 9 and IFRS 15 | ||
Numerator – sum of the last four quarterly dividends declared per Common Share | 2.10 | 1.97 |
|
Adjusted net earnings ($ millions): |
|
|
|
Net income attributable to Common Shares | 1,600 | 1,559 |
|
Deduct non-recurring gains and equity income related to real estate joint ventures, after income taxes | (150) | (1 | ) |
Provisions related to business combinations, after income taxes | (17) | (22 | ) |
(Deduct net favourable) add back net unfavourable income tax-related adjustments | (7) | 21 |
|
Add back long-term debt prepayment premium, after income taxes | 25 | – |
|
Add back initial and committed donation to TELUS Friendly Future Foundation, after income taxes | 90 | – |
|
| 1,541 | 1,557 |
|
Denominator – Adjusted net earnings per Common Share | 2.58 | 2.46 |
|
Adjusted ratio (%) | 81 | 80 |
|
Earnings coverage: This measure is defined in the Canadian Securities Administrators’ National Instrument 41-101 and related instruments, and is calculated as follows:
Calculation of Earnings coverage
Years ended December 31 ($ millions, except ratio) | 2018 | 2017 |
|
| Applying IFRS 9 and IFRS 15 | ||
Net income attributable to Common Shares | 1,600 | 1,559 |
|
Income taxes (attributable to Common Shares) | 542 | 583 |
|
Borrowing costs (attributable to Common Shares)1 | 630 | 562 |
|
Numerator | 2,772 | 2,704 |
|
Denominator – Borrowing costs | 630 | 562 |
|
Ratio (times) | 4.4 | 4.8 |
|
1 Interest on Long-term debt plus Interest on short-term borrowings and other plus long-term debt prepayment premium, adding back capitalized interest and deducting borrowing costs attributable to non-controlling interests.
MD&A: DEFINITIONS AND RECONCILIATIONS
EBITDA (earnings before interest, income taxes, depreciation and amortization): We have issued guidance on and report EBITDA because it is a key measure used to evaluate performance at a consolidated level. EBITDA is commonly reported and widely used by investors and lending institutions as an indicator of a company’s operating performance and ability to incur and service debt, and as a valuation metric. EBITDA should not be considered an alternative to Net income in measuring TELUS’ performance, nor should it be used as an exclusive measure of cash flow. EBITDA as calculated by TELUS is equivalent to Operating revenues less the total of Goods and services purchased expense and Employee benefits expense.
We calculate EBITDA – excluding restructuring and other costs, as it is a component of the EBITDA – excluding restructuring and other costs interest coverage ratio and the Net debt to EBITDA – excluding restructuring and other costs ratio.
We also calculate Adjusted EBITDA to exclude items of an unusual nature that do not reflect our ongoing operations and should not, in our opinion, be considered in a long-term valuation metric or should not be included in an assessment of our ability to service or incur debt.
EBITDA reconciliation
Years ended December 31 ($ millions) | 2018 | 2017 |
|
| Applying IFRS 9 and IFRS 15 | ||
Net income | 1,624 | 1,578 |
|
Financing costs | 661 | 573 |
|
Income taxes | 552 | 590 |
|
Depreciation | 1,669 | 1,617 |
|
Amortization of intangible assets | 598 | 552 |
|
EBITDA | 5,104 | 4,910 |
|
Add back restructuring and other costs included in EBITDA | 317 | 117 |
|
EBITDA – excluding restructuring and other costs | 5,421 | 5,027 |
|
Deduct non-recurring gains and equity income related to real estate joint ventures | (171) | (1 | ) |
Deduct MTS net recovery | – | (21 | ) |
Adjusted EBITDA | 5,250 | 5,005 |
|
EBITDA – excluding restructuring and other costs interest coverage: This measure is defined as EBITDA – excluding restructuring and other costs, divided by Net interest cost, calculated on a 12-month trailing basis. This measure is similar to the coverage ratio covenant in our credit facilities, as described in Section 7.6 Credit facilities.
Free cash flow: We report this measure as a supplementary indicator of our operating performance. It should not be considered an alternative to the measures in the Consolidated statements of cash flows. Free cash flow excludes certain working capital changes (such as trade receivables and trade payables), proceeds from divested assets and other sources and uses of cash, as found in the Consolidated statements of cash flows. It provides an indication of how much cash generated by operations is available after capital expenditures (excluding purchases of spectrum licences) that may be used to, among other things, pay dividends, repay debt, purchase shares or make other investments. Free cash flow may be supplemented from time to time by proceeds from divested assets or financing activities. The application of IFRS 15 reflects a non-cash accounting change. As such, the underlying economics and free cash flow generated by the business are not impacted by the change.
Free cash flow calculation
Years ended December 31 ($ millions) | 2018 | 2017 |
|
| Applying IFRS 9 and IFRS 15 | ||
EBITDA | 5,104 | 4,910 |
|
Deduct non-cash gains from the sale of property, plant and equipment | (49) | (7 | ) |
Restructuring and other costs, net of disbursements | 78 | (22 | ) |
Deduct non-recurring gains and equity income related to real estate joint ventures | (171) | (1 | ) |
Donation to TELUS Friendly Future Foundation in TELUS Common Shares | 100 | – |
|
Effects of contract asset, acquisition and fulfilment* | (203) | (135 | ) |
Items from the Consolidated statements of cash flows: |
|
|
|
Share-based compensation, net | 6 | 17 |
|
Net employee defined benefit plans expense | 95 | 82 |
|
Employer contributions to employee defined benefit plans | (53) | (67 | ) |
Interest paid | (608) | (539 | ) |
Interest received | 9 | 7 |
|
Capital expenditures (excluding spectrum licences) | (2,914) | (3,094 | ) |
Other | – | 6 |
|
Free cash flow before income taxes | 1,394 | 1,157 |
|
Income taxes paid, net of refunds | (197) | (191 | ) |
Free cash flow | 1,197 | 966 |
|
*See the following page for the reconciliation of effects of contract asset, acquisition and fulfillment.
Reconciliation of effects of contract asset, acquisition and fulfilment
Years ended December 31 ($ millions) | 2018 | 2017 |
|
| Applying IFRS 9 and IFRS 15 | ||
From Note 6(c) of the Consolidated financial statements: |
|
|
|
Net additions arising from operations | 1,455 | 1,270 |
|
Amounts billed in period and thus reclassified to accounts receivable | (1,284) | (1,166 | ) |
Change in impairment allowance, net | (1) | (3 | ) |
Other | 2 | (3 | ) |
From Note 20 of the Consolidated financial statements: |
|
|
|
Additions – Total | 321 | 308 |
|
Amortization – Total | (290) | (271 | ) |
Effects of contract asset, acquisition and fulfilment | 203 | 135 |
|
Our method of calculating Free cash flow has been revised in 2018 to reflect the discretionary nature of the donation to the TELUS Friendly Future Foundation that fundamentally transformed our operating model in respect of philanthropic giving.
The following reconciles our definition of free cash flow with cash provided by operating activities.
Free cash flow reconciliation with Cash provided by operating activities
Years ended December 31 ($ millions) | 2018 | 2017 |
|
| Applying IFRS 9 and IFRS 15 | ||
Free cash flow | 1,197 | 966 |
|
Add (deduct): |
|
|
|
Capital expenditures (excluding spectrum licences) | 2,914 | 3,094 |
|
Adjustments to reconcile to Cash provided by operating activities | (53) | (113 | ) |
Cash provided by operating activities | 4,058 | 3,947 |
|
Net debt: We believe that net debt is a useful measure because it represents the amount of Short-term borrowings and long-term debt obligations that are not covered by available Cash and temporary investments. The nearest IFRS measure to net debt is Long-term debt, including Current maturities of Long-term debt. Net debt is a component of the Net debt to EBITDA – excluding restructuring and other costs ratio.
Calculation of Net debt
As at December 31 ($ millions) | 2018 | 2017 |
|
| Applying IFRS 9 and IFRS 15 | ||
Long-term debt including current maturities | 14,101 | 13,660 |
|
Debt issuance costs netted against long-term debt | 93 | 73 |
|
Derivative (assets) liabilities, net | (73) | 93 |
|
Accumulated other comprehensive income amounts arising from financial instruments used to manage interest rate and currency risks associated with U.S. dollar-denominated long-term debt (excluding tax effects) | (37) | 5 |
|
Cash and temporary investments, net | (414) | (509 | ) |
Short-term borrowings | 100 | 100 |
|
Net debt | 13,770 | 13,422 |
|
Net debt to EBITDA – excluding restructuring and other costs: This measure is defined as net debt at the end of the period divided by 12-month trailing EBITDA – excluding restructuring and other costs. Our long-term policy guideline for this ratio is from 2.00 to 2.50 times. (See discussion in Section 7.5 Liquidity and capital resource measures.) This measure is similar to the leverage ratio covenant in our credit facilities, as described in Section 7.6 Credit facilities.
Net interest cost: This measure is the denominator in the calculation of EBITDA – excluding restructuring and other costs interest coverage. Net interest cost is defined as financing costs, excluding capitalized long-term debt interest, employee defined benefit plans net interest and recoveries on redemption and repayment of debt, calculated on a 12-month trailing basis. No recoveries on redemption and repayment of debt were recorded in 2018 and 2017. Expenses recorded for the long-term debt prepayment premium, if any, are included in net interest cost. Net interest cost was $644 million in 2018 and $567 million in 2017.
Restructuring and other costs: With the objective of reducing ongoing costs, we incur associated incremental, non-recurring restructuring costs. We may also incur atypical charges, which are included in other costs, when undertaking major or transformational changes to our business or operating models. In addition, we include incremental external costs incurred in connection with business acquisition or disposition activity, as well as litigation costs, in the context of significant losses and settlements, in other costs.
Components of restructuring and other costs
Years ended December 31 ($ millions) | 2018 | 2017 |
|
| Applying IFRS 9 and IFRS 15 | ||
Goods and services purchased | 181 | 81 |
|
Employee benefits expense | 136 | 36 |
|
Restructuring and other costs included in EBITDA | 317 | 117 |
|
MD&A: DEFINITIONS AND RECONCILIATIONS
11.2 Operating indicators
The following measures are industry metrics that are useful in assessing the operating performance of a wireless and wireline telecommunications entity, but do not have a standardized meaning under IFRS-IASB.
Average billing per subscriber unit per month (ABPU) for wireless subscribers is calculated as network revenue derived from monthly service plan, roaming and usage charges, as well as monthly re-payments of the outstanding device balance owing from customers on contract; divided by the average number of subscriber units on the network during the period and is expressed as a rate per month.
Average revenue per subscriber unit per month (ARPU) for wireless subscribers is calculated as network revenue derived from monthly service plan, roaming and usage charges; divided by the average number of subscriber units on the network during the period and is expressed as a rate per month.
Churn per month (or churn) is calculated as the number of subscriber units deactivated during a given period divided by the average number of subscriber units on the network during the period, and is expressed as a rate per month. Blended churn refers to the aggregate average of both prepaid and postpaid churn. A TELUS, Koodo or Public Mobile brand prepaid wireless subscriber is deactivated when the subscriber has no usage for 90 days following expiry of the prepaid credits.
Wireless subscriber unit (subscriber) is defined as an active mobile recurring revenue-generating unit (e.g. mobile phone, tablet or mobile Internet key) with a unique subscriber identifier (SIM or IMEI number). In addition, TELUS has a direct billing or support relationship with the user of each device. Subscriber units exclude machine-to-machine devices (a subset of the Internet of Things), such as those used for asset tracking, remote control monitoring and meter readings, vending machines and wireless automated teller machines.
Wireline subscriber connection is defined as an active recurring revenue-generating unit that has access to stand-alone services, including fixed Internet access, TELUS TV and residential network access lines (NALs). In addition, TELUS has a direct billing or support relationship with the user of each service. Reported subscriber units exclude business NALs, as the impact of migrating from voice lines to IP services has led to business NAL losses without a similar decline in revenue, thus diminishing its relevance as a key performance indicator.
Report of management on internal control over financial reporting
Management of TELUS Corporation (TELUS, or the Company) is responsible for establishing and maintaining adequate internal control over financial reporting and for its assessment of the effectiveness of internal control over financial reporting.
TELUS’ President and Chief Executive Officer and Executive Vice-President and Chief Financial Officer have assessed the effectiveness of the Company’s internal control over financial reporting as of December 31, 2018, in accordance with the criteria established in Internal Control – Integrated Framework (2013) issued by the Committee of Sponsoring Organizations of the Treadway Commission. Internal control over financial reporting is a process designed by, or under the supervision of, the President and Chief Executive Officer and the Executive Vice-President and Chief Financial Officer and effected by the Board of Directors, management and other personnel to provide reasonable assurance regarding the reliability of financial reporting and the preparation of financial statements for external purposes in accordance with generally accepted accounting principles.
Due to its inherent limitations, internal control over financial reporting may not prevent or detect misstatements on a timely basis. Also, projections of any evaluation of the effectiveness of internal control over financial reporting to future periods are subject to the risk that the controls may become inadequate because of changes in conditions, or that the degree of compliance with the policies or procedures may deteriorate.
Based on the assessment referenced in the preceding paragraph, management has determined that the Company’s internal control over financial reporting is effective as of December 31, 2018. In connection with this assessment, no material weaknesses in the Company’s internal control over financial reporting were identified by management as of December 31, 2018.
Deloitte LLP, an Independent Registered Public Accounting Firm, audited the Company’s Consolidated financial statements for the year ended December 31, 2018, and as stated in the Report of Independent Registered Public Accounting Firm, they have expressed an unqualified opinion on the effectiveness of the Company’s internal control over financial reporting as of December 31, 2018.
|
|
|
|
Doug French | Darren Entwistle |
Executive Vice-President | President |
and Chief Financial Officer | and Chief Executive Officer |
February 14, 2019 | February 14, 2019 |

CONSOLIDATED FINANCIAL STATEMENTS
Report of independent registered public accounting firm
To the Shareholders and Board of Directors of TELUS Corporation
Opinion on the Financial Statements
We have audited the accompanying consolidated statements of financial position of TELUS Corporation and subsidiaries (the Company) as at December 31, 2018 and 2017, the related consolidated statements of income and other comprehensive income, changes in owners’ equity and cash flows, for the years then ended, and the related notes, (collectively referred to as the “financial statements”). In our opinion, the financial statements present fairly, in all material respects, the financial position of the Company as at December 31, 2018 and 2017, and its financial performance and its cash flows for each of the years then ended, in accordance with International Financial Reporting Standards as issued by the International Accounting Standards Board.
We have also audited, in accordance with the standards of the Public Company Accounting Oversight Board (United States) (PCAOB), the Company’s internal control over financial reporting as of December 31, 2018, based on criteria established in Internal Control – Integrated Framework (2013) issued by the Committee of Sponsoring Organizations of the Treadway Commission and our report dated February 14, 2019, expressed an unqualified opinion on the Company’s internal control over financial reporting.
Change in Accounting Principle
As discussed in Note 2 to the financial statements, the Company has changed its method of accounting for revenue from contracts with customers due to the adoption of IFRS 15 on January 1, 2018, and has retrospectively adjusted the 2017 financial statements, including the disclosure of the January 1, 2017 retrospectively adjusted consolidated statement of financial position.
Basis for Opinion
These financial statements are the responsibility of the Company’s management. Our responsibility is to express an opinion on the Company’s financial statements based on our audits. We are a public accounting firm registered with the PCAOB and are required to be independent with respect to the Company in accordance with the U.S. federal securities laws and the applicable rules and regulations of the Securities and Exchange Commission and the PCAOB.
We conducted our audits in accordance with the standards of the PCAOB. Those standards require that we plan and perform the audit to obtain reasonable assurance about whether the financial statements are free of material misstatement, whether due to error or fraud. Our audits included performing procedures to assess the risks of material misstatement of the financial statements, whether due to error or fraud, and performing procedures that respond to those risks. Such procedures included examining, on a test basis, evidence regarding the amounts and disclosures in the financial statements. Our audits also included evaluating the accounting principles used and significant estimates made by management, as well as evaluating the overall presentation of the financial statements. We believe that our audits provide a reasonable basis for our opinion.

Chartered Professional Accountants
February 14, 2019
Vancouver, Canada
We have served as the Company’s auditor since 2002.
Report of independent registered public accounting firm
To the Shareholders and Board of Directors of TELUS Corporation
Opinion on Internal Control over Financial Reporting
We have audited the internal control over financial reporting of TELUS Corporation and subsidiaries (the Company) as of December 31, 2018, based on criteria established in Internal Control – Integrated Framework (2013) issued by the Committee of Sponsoring Organizations of the Treadway Commission (COSO). In our opinion, the Company maintained, in all material respects, effective internal control over financial reporting as of December 31, 2018, based on criteria established in Internal Control – Integrated Framework (2013) issued by COSO.
We have also audited, in accordance with the standards of the Public Company Accounting Oversight Board (United States) (PCAOB), the consolidated financial statements as of and for the year ended December 31, 2018 of the Company and our report dated February 14, 2019, expressed an unqualified opinion on those financial statements and included an explanatory paragraph regarding the Company’s change in accounting for revenue from contracts with customers in the year ended December 31, 2018 due to the adoption of IFRS 15.
Basis for Opinion
The Company’s management is responsible for maintaining effective internal control over financial reporting and for its assessment of the effectiveness of internal control over financial reporting, included in the accompanying Report of Management on Internal Control over Financial Reporting. Our responsibility is to express an opinion on the Company’s internal control over financial reporting based on our audit. We are a public accounting firm registered with the PCAOB and are required to be independent with respect to the Company in accordance with the U.S. federal securities laws and the applicable rules and regulations of the Securities and Exchange Commission and the PCAOB.
We conducted our audit in accordance with the standards of the PCAOB. Those standards require that we plan and perform the audit to obtain reasonable assurance about whether effective internal control over financial reporting was maintained in all material respects. Our audit included obtaining an understanding of internal control over financial reporting, assessing the risk that a material weakness exists, testing and evaluating the design and operating effectiveness of internal control based on the assessed risk, and performing such other procedures as we considered necessary in the circumstances. We believe that our audit provides a reasonable basis for our opinion.
Definition and Limitations of Internal Control over Financial Reporting
A company’s internal control over financial reporting is a process designed to provide reasonable assurance regarding the reliability of financial reporting and the preparation of financial statements for external purposes in accordance with International Financial Reporting Standards as issued by the International Accounting Standards Board. A company’s internal control over financial reporting includes those policies and procedures that (1) pertain to the maintenance of records that, in reasonable detail, accurately and fairly reflect the transactions and dispositions of the assets of the company; (2) provide reasonable assurance that transactions are recorded as necessary to permit preparation of financial statements in accordance with International Financial Reporting Standards as issued by the International Accounting Standards Board, and that receipts and expenditures of the company are being made only in accordance with authorizations of management and directors of the company; and (3) provide reasonable assurance regarding prevention or timely detection of unauthorized acquisition, use, or disposition of the company’s assets that could have a material effect on the financial statements.
Because of its inherent limitations, internal control over financial reporting may not prevent or detect misstatements. Also, projections of any evaluation of effectiveness to future periods are subject to the risk that controls may become inadequate because of changes in conditions, or that the degree of compliance with the policies or procedures may deteriorate.
![]()
Chartered Professional Accountants
February 14, 2019
Vancouver, Canada
CONSOLIDATED FINANCIAL STATEMENTS
Consolidated statements of income and other comprehensive income
Years ended December 31 (millions except per share amounts) |
| Note |
| 2018 |
| 2017 |
| ||
|
|
|
| (Note 2(c)) |
| (adjusted – Note 2(c)) |
| ||
Operating Revenues |
|
|
|
|
|
|
| ||
Service |
|
|
| $ | 11,882 |
| $ | 11,332 |
|
Equipment |
|
|
| 2,213 |
| 1,973 |
| ||
Revenues arising from contracts with customers |
| 6 |
| 14,095 |
| 13,305 |
| ||
Other operating income |
| 7 |
| 273 |
| 103 |
| ||
|
|
|
| 14,368 |
| 13,408 |
| ||
Operating Expenses |
|
|
|
|
|
|
| ||
Goods and services purchased |
|
|
| 6,368 |
| 5,904 |
| ||
Employee benefits expense |
| 8 |
| 2,896 |
| 2,594 |
| ||
Depreciation |
| 17 |
| 1,669 |
| 1,617 |
| ||
Amortization of intangible assets |
| 18 |
| 598 |
| 552 |
| ||
|
|
|
| 11,531 |
| 10,667 |
| ||
Operating Income |
|
|
| 2,837 |
| 2,741 |
| ||
Financing costs |
| 9 |
| 661 |
| 573 |
| ||
Income Before Income Taxes |
|
|
| 2,176 |
| 2,168 |
| ||
Income taxes |
| 10 |
| 552 |
| 590 |
| ||
Net Income |
|
|
| 1,624 |
| 1,578 |
| ||
Other Comprehensive Income |
| 11 |
|
|
|
|
| ||
Items that may subsequently be reclassified to income |
|
|
|
|
|
|
| ||
Change in unrealized fair value of derivatives designated as cash flow hedges |
|
|
| (18 | ) | 19 |
| ||
Foreign currency translation adjustment arising from translating financial statements of foreign operations |
|
|
| (30 | ) | 5 |
| ||
|
|
|
| (48 | ) | 24 |
| ||
Items never subsequently reclassified to income |
|
|
|
|
|
|
| ||
Change in measurement of investment financial assets |
|
|
| (1 | ) | (12 | ) | ||
Employee defined benefit plan re-measurements |
|
|
| 333 |
| (172 | ) | ||
|
|
|
| 332 |
| (184 | ) | ||
|
|
|
| 284 |
| (160 | ) | ||
Comprehensive Income |
|
|
| $ | 1,908 |
| $ | 1,418 |
|
Net Income Attributable to: |
|
|
|
|
|
|
| ||
Common Shares |
|
|
| $ | 1,600 |
| $ | 1,559 |
|
Non-controlling interests |
|
|
| 24 |
| 19 |
| ||
|
|
|
| $ | 1,624 |
| $ | 1,578 |
|
Comprehensive Income Attributable to: |
|
|
|
|
|
|
| ||
Common Shares |
|
|
| $ | 1,898 |
| $ | 1,395 |
|
Non-controlling interests |
|
|
| 10 |
| 23 |
| ||
|
|
|
| $ | 1,908 |
| $ | 1,418 |
|
Net Income Per Common Share |
| 12 |
|
|
|
|
| ||
Basic |
|
|
| $ | 2.68 |
| $ | 2.63 |
|
Diluted |
|
|
| $ | 2.68 |
| $ | 2.63 |
|
Total Weighted Average Common Shares Outstanding |
|
|
|
|
|
|
| ||
Basic |
|
|
| 597 |
| 593 |
| ||
Diluted |
|
|
| 597 |
| 593 |
| ||
The accompanying notes are an integral part of these consolidated financial statements.
TELUS 2018 ANNUAL REPORT · 121
Consolidated statements of financial position
As at (millions) |
| Note |
| December 31, 2018 |
| December 31, 2017 |
| January 1, 2017 |
| |||
|
|
|
| (Note 2(c)) |
| (adjusted – Note 2(c)) |
| (Note 2(c)) |
| |||
Assets |
|
|
|
|
|
|
|
|
| |||
Current assets |
|
|
|
|
|
|
|
|
| |||
Cash and temporary investments, net |
|
|
| $ | 414 |
| $ | 509 |
| $ | 432 |
|
Accounts receivable |
| 6(b) |
| 1,600 |
| 1,614 |
| 1,462 |
| |||
Income and other taxes receivable |
|
|
| 3 |
| 96 |
| 9 |
| |||
Inventories |
| 1(l) |
| 376 |
| 380 |
| 320 |
| |||
Contract assets |
| 6(c) |
| 860 |
| 757 |
| 700 |
| |||
Prepaid expenses |
| 20 |
| 539 |
| 493 |
| 443 |
| |||
Current derivative assets |
| 4(h) |
| 49 |
| 18 |
| 11 |
| |||
|
|
|
| 3,841 |
| 3,867 |
| 3,377 |
| |||
Non-current assets |
|
|
|
|
|
|
|
|
| |||
Property, plant and equipment, net |
| 17 |
| 12,091 |
| 11,368 |
| 10,464 |
| |||
Intangible assets, net |
| 18 |
| 10,956 |
| 10,658 |
| 10,364 |
| |||
Goodwill, net |
| 18 |
| 4,733 |
| 4,236 |
| 3,787 |
| |||
Contract assets |
| 6(c) |
| 458 |
| 396 |
| 352 |
| |||
Other long-term assets |
| 20 |
| 986 |
| 528 |
| 733 |
| |||
|
|
|
| 29,224 |
| 27,186 |
| 25,700 |
| |||
|
|
|
| $ | 33,065 |
| $ | 31,053 |
| $ | 29,077 |
|
Liabilities and Owners’ Equity |
|
|
|
|
|
|
|
|
| |||
Current liabilities |
|
|
|
|
|
|
|
|
| |||
Short-term borrowings |
| 22 |
| $ | 100 |
| $ | 100 |
| $ | 100 |
|
Accounts payable and accrued liabilities |
| 23 |
| 2,570 |
| 2,460 |
| 2,330 |
| |||
Income and other taxes payable |
|
|
| 218 |
| 34 |
| 37 |
| |||
Dividends payable |
| 13 |
| 326 |
| 299 |
| 284 |
| |||
Advance billings and customer deposits |
| 24 |
| 653 |
| 632 |
| 584 |
| |||
Provisions |
| 25 |
| 129 |
| 78 |
| 124 |
| |||
Current maturities of long-term debt |
| 26 |
| 836 |
| 1,404 |
| 1,327 |
| |||
Current derivative liabilities |
| 4(h) |
| 9 |
| 33 |
| 12 |
| |||
|
|
|
| 4,841 |
| 5,040 |
| 4,798 |
| |||
Non-current liabilities |
|
|
|
|
|
|
|
|
| |||
Provisions |
| 25 |
| 728 |
| 511 |
| 395 |
| |||
Long-term debt |
| 26 |
| 13,265 |
| 12,256 |
| 11,604 |
| |||
Other long-term liabilities |
| 27 |
| 738 |
| 847 |
| 736 |
| |||
Deferred income taxes |
| 10 |
| 3,152 |
| 2,941 |
| 2,511 |
| |||
|
|
|
| 17,883 |
| 16,555 |
| 15,246 |
| |||
Liabilities |
|
|
| 22,724 |
| 21,595 |
| 20,044 |
| |||
Owners’ equity |
|
|
|
|
|
|
|
|
| |||
Common equity |
| 28 |
| 10,259 |
| 9,416 |
| 9,014 |
| |||
Non-controlling interests |
|
|
| 82 |
| 42 |
| 19 |
| |||
|
|
|
| 10,341 |
| 9,458 |
| 9,033 |
| |||
|
|
|
| $ | 33,065 |
| $ | 31,053 |
| $ | 29,077 |
|
Contingent Liabilities |
| 29 |
|
|
|
|
|
|
| |||
The accompanying notes are an integral part of these consolidated financial statements.
Approved by the Directors:
|
|
David L. Mowat | R.H. Auchinleck |
Director | Director |
122 · TELUS 2018 ANNUAL REPORT
CONSOLIDATED FINANCIAL STATEMENTS
Consolidated statements of changes in owners’ equity
|
|
|
| Common equity |
|
|
|
|
| |||||||||||||||||
|
|
|
| Equity contributed |
|
|
| Accumulated other comprehensive |
|
|
|
|
|
|
| |||||||||||
|
|
|
| Common Shares (Note 28) |
|
|
|
|
|
|
|
| Non- |
|
|
| ||||||||||
|
|
|
| Number of |
| Share |
| Contributed |
| Retained |
|
|
|
| controlling |
|
|
| ||||||||
(millions) |
| Note |
| shares |
| capital |
| surplus |
| earnings |
| income |
| Total |
| interests |
| Total |
| |||||||
Balance as at January 1, 2017 |
|
|
|
|
|
|
|
|
|
|
|
|
|
|
|
|
|
|
| |||||||
As previously reported |
|
|
| 590 |
| $ | 5,029 |
| $ | 372 |
| $ | 2,474 |
| $ | 42 |
| $ | 7,917 |
| $ | 19 |
| $ | 7,936 |
|
IFRS 9, Financial Instruments transitional amount |
| 2(a), 11 |
| – |
| – |
| – |
| 3 |
| (3 | ) | – |
| – |
| – |
| |||||||
IFRS 15, Revenue from Contracts with Customers transitional amount |
| 2(c) |
| – |
| – |
| – |
| 1,097 |
| – |
| 1,097 |
| – |
| 1,097 |
| |||||||
As adjusted |
|
|
| 590 |
| 5,029 |
| 372 |
| 3,574 |
| 39 |
| 9,014 |
| 19 |
| 9,033 |
| |||||||
Net income |
| 2(c) |
| – |
| – |
| – |
| 1,559 |
| – |
| 1,559 |
| 19 |
| 1,578 |
| |||||||
Other comprehensive income |
| 11 |
| – |
| – |
| – |
| (172 | ) | 8 |
| (164 | ) | 4 |
| (160 | ) | |||||||
Dividends |
| 13 |
| – |
| – |
| – |
| (1,167 | ) | – |
| (1,167 | ) | – |
| (1,167 | ) | |||||||
Dividends reinvested and optional cash payments |
| 13(b), 14(c) |
| 2 |
| 71 |
| – |
| – |
| – |
| 71 |
| – |
| 71 |
| |||||||
Share option award net-equity settlement feature |
| 14(d) |
| 1 |
| 2 |
| (2 | ) | – |
| – |
| – |
| – |
| – |
| |||||||
Issue of shares in business combination |
|
|
| 2 |
| 100 |
| – |
| – |
| – |
| 100 |
| – |
| 100 |
| |||||||
Other |
|
|
| – |
| 3 |
| – |
| – |
| – |
| 3 |
| – |
| 3 |
| |||||||
Balance as at December 31, 2017 |
|
|
| 595 |
| $ | 5,205 |
| $ | 370 |
| $ | 3,794 |
| $ | 47 |
| $ | 9,416 |
| $ | 42 |
| $ | 9,458 |
|
Balance as at January 1, 2018 |
|
|
|
|
|
|
|
|
|
|
|
|
|
|
|
|
|
|
| |||||||
As previously reported |
|
|
| 595 |
| $ | 5,205 |
| $ | 370 |
| $ | 2,595 |
| $ | 51 |
| $ | 8,221 |
| $ | 42 |
| $ | 8,263 |
|
IFRS 9, Financial Instruments transitional amount |
| 2(a), 11 |
| – |
| – |
| – |
| 4 |
| (4 | ) | – |
| – |
| – |
| |||||||
IFRS 15, Revenue from Contracts with Customers transitional amount |
| 2(c) |
| – |
| – |
| – |
| 1,195 |
| – |
| 1,195 |
| – |
| 1,195 |
| |||||||
As adjusted |
|
|
| 595 |
| 5,205 |
| 370 |
| 3,794 |
| 47 |
| 9,416 |
| 42 |
| 9,458 |
| |||||||
Net income |
|
|
| – |
| – |
| – |
| 1,600 |
| – |
| 1,600 |
| 24 |
| 1,624 |
| |||||||
Other comprehensive income |
| 11 |
| – |
| – |
| – |
| 333 |
| (35 | ) | 298 |
| (14 | ) | 284 |
| |||||||
Dividends |
| 13 |
| – |
| – |
| – |
| (1,253 | ) | – |
| (1,253 | ) | – |
| (1,253 | ) | |||||||
Dividends reinvested and optional cash payments |
| 13(b), 14(c) |
| 2 |
| 86 |
| – |
| – |
| – |
| 86 |
| – |
| 86 |
| |||||||
Treasury shares acquired |
| 16(c), 28(b) |
| (2 | ) | (100 | ) | – |
| – |
| – |
| (100 | ) | – |
| (100 | ) | |||||||
Shares settled from Treasury |
| 16(c), 28(b) |
| 2 |
| 100 |
| – |
| – |
| – |
| 100 |
| – |
| 100 |
| |||||||
Share option award net-equity settlement feature |
| 14(d) |
| – |
| 1 |
| (1 | ) | – |
| – |
| – |
| – |
| – |
| |||||||
Issue of shares in business combination |
| 18(b) |
| 2 |
| 98 |
| – |
| – |
| – |
| 98 |
| – |
| 98 |
| |||||||
Change in ownership interests of subsidiary |
| 31(a) |
| – |
| – |
| 14 |
| – |
| – |
| 14 |
| 30 |
| 44 |
| |||||||
Balance as at December 31, 2018 |
|
|
| 599 |
| $ | 5,390 |
| $ | 383 |
| $ | 4,474 |
| $ | 12 |
| $ | 10,259 |
| $ | 82 |
| $ | 10,341 |
|
The accompanying notes are an integral part of these consolidated financial statements.
TELUS 2018 ANNUAL REPORT · 123
Consolidated statements of cash flows
Years ended December 31 (millions) |
| Note |
| 2018 |
| 2017 |
| ||
|
|
|
| (Note 2(c)) |
| (adjusted – Note 2(c)) |
| ||
Operating Activities |
|
|
|
|
|
|
| ||
Net income |
|
|
| $ | 1,624 |
| $ | 1,578 |
|
Adjustments to reconcile net income to cash provided by operating activities: |
|
|
|
|
|
|
| ||
Depreciation and amortization |
|
|
| 2,267 |
| 2,169 |
| ||
Deferred income taxes |
| 10 |
| 74 |
| 467 |
| ||
Share-based compensation expense, net |
| 14(a) |
| 6 |
| 17 |
| ||
Net employee defined benefit plans expense |
| 15(b) |
| 95 |
| 82 |
| ||
Employer contributions to employee defined benefit plans |
|
|
| (53 | ) | (67 | ) | ||
Non-current contract assets |
|
|
| (62 | ) | (44 | ) | ||
Income from equity accounted investments |
| 7, 21 |
| (170 | ) | (4 | ) | ||
Shares settled from Treasury |
| 16(c) |
| 100 |
| – |
| ||
Other |
|
|
| (79 | ) | (32 | ) | ||
Net change in non-cash operating working capital |
| 31(a) |
| 256 |
| (219 | ) | ||
Cash provided by operating activities |
|
|
| 4,058 |
| 3,947 |
| ||
Investing Activities |
|
|
|
|
|
|
| ||
Cash payments for capital assets, excluding spectrum licences |
| 31(a) |
| (2,874 | ) | (3,081 | ) | ||
Cash payment for spectrum licences |
| 18(a) |
| (1 | ) | – |
| ||
Cash payments for acquisitions, net |
| 18(b) |
| (280 | ) | (564 | ) | ||
Real estate joint ventures advances |
| 21(c) |
| (22 | ) | (26 | ) | ||
Real estate joint venture receipts |
| 21(c) |
| 184 |
| 18 |
| ||
Proceeds on dispositions |
|
|
| 38 |
| 28 |
| ||
Other |
|
|
| (22 | ) | (18 | ) | ||
Cash used by investing activities |
|
|
| (2,977 | ) | (3,643 | ) | ||
Financing Activities |
| 31(b) |
|
|
|
|
| ||
Dividends paid to holders of Common Shares |
| 13(a) |
| (1,141 | ) | (1,082 | ) | ||
Treasury shares acquired |
|
|
| (100 | ) | – |
| ||
Issue (repayment) of short-term borrowings, net |
|
|
| (67 | ) | – |
| ||
Long-term debt issued |
| 26 |
| 5,500 |
| 6,367 |
| ||
Redemptions and repayment of long-term debt |
| 26 |
| (5,377 | ) | (5,502 | ) | ||
Issue of shares by subsidiary to non-controlling interests |
| 31(a) |
| 24 |
| (1 | ) | ||
Other |
|
|
| (15 | ) | (9 | ) | ||
Cash used by financing activities |
|
|
| (1,176 | ) | (227 | ) | ||
Cash Position |
|
|
|
|
|
|
| ||
Increase (decrease) in cash and temporary investments, net |
|
|
| (95 | ) | 77 |
| ||
Cash and temporary investments, net, beginning of period |
|
|
| 509 |
| 432 |
| ||
Cash and temporary investments, net, end of period |
|
|
| $ | 414 |
| $ | 509 |
|
Supplemental Disclosure of Operating Cash Flows |
|
|
|
|
|
|
| ||
Interest paid |
|
|
| $ | (608 | ) | $ | (539 | ) |
Interest received |
|
|
| $ | 9 |
| $ | 7 |
|
Income taxes paid, net |
|
|
| $ | (197 | ) | $ | (191 | ) |
The accompanying notes are an integral part of these consolidated financial statements.
124 · TELUS 2018 ANNUAL REPORT
CONSOLIDATED FINANCIAL STATEMENTS
Notes to consolidated financial statements
December 31, 2018
TELUS Corporation is one of Canada’s largest telecommunications companies, providing a wide range of telecommunications services and products, including wireless and wireline voice and data. Data services include: Internet protocol; television; hosting, managed information technology and cloud-based services; healthcare solutions; customer care and business services (formerly business process outsourcing); and home and business security.
TELUS Corporation was incorporated under the Company Act (British Columbia) on October 26, 1998, under the name BCT.TELUS Communications Inc. (BCT). On January 31, 1999, pursuant to a court-approved plan of arrangement under the Canada Business Corporations Act among BCT, BC TELECOM Inc. and the former Alberta-based TELUS Corporation (TC), BCT acquired all of the shares of BC TELECOM Inc. and TC in exchange for Common Shares and Non-Voting Shares of BCT, and BC TELECOM Inc. was dissolved. On May 3, 2000, BCT changed its name to TELUS Corporation and in February 2005, TELUS Corporation transitioned under the Business Corporations Act (British Columbia), successor to the Company Act (British Columbia). TELUS Corporation maintains its registered office at Floor 7, 510 West Georgia Street, Vancouver, British Columbia, V6B 0M3.
The terms “TELUS”, “we”, “us”, “our” or “ourselves” are used to refer to TELUS Corporation and, where the context of the narrative permits or requires, its subsidiaries.
Notes to consolidated financial statements | Page | |
GENERAL APPLICATION |
| |
1. | Summary of significant accounting policies | 126 |
2. | Accounting policy developments | 133 |
3. | Capital structure financial policies | 140 |
4. | Financial instruments | 142 |
CONSOLIDATED RESULTS OF OPERATIONS FOCUSED |
| |
5. | Segment information | 149 |
6. | Revenue from contracts with customers | 151 |
7. | Other operating income | 152 |
8. | Employee benefits expense | 153 |
9. | Financing costs | 153 |
10. | Income taxes | 153 |
11. | Other comprehensive income | 155 |
12. | Per share amounts | 156 |
13. | Dividends per share | 156 |
14. | Share-based compensation | 157 |
15. | Employee future benefits | 160 |
16. | Restructuring and other costs | 166 |
CONSOLIDATED FINANCIAL POSITION FOCUSED |
| |
17. | Property, plant and equipment | 167 |
18. | Intangible assets and goodwill | 168 |
19. | Leases | 172 |
20. | Other long-term assets | 173 |
21. | Real estate joint ventures | 174 |
22. | Short-term borrowings | 176 |
23. | Accounts payable and accrued liabilities | 176 |
24. | Advance billings and customer deposits | 176 |
25. | Provisions | 177 |
26. | Long-term debt | 178 |
27. | Other long-term liabilities | 181 |
28. | Common Share capital | 182 |
29. | Contingent liabilities | 182 |
OTHER |
| |
30. | Related party transactions | 184 |
31. | Additional statement of cash flow information | 185 |
|
|
1 | Summary of significant accounting policies |
|
|
Our consolidated financial statements are expressed in Canadian dollars. The generally accepted accounting principles that we use are International Financial Reporting Standards as issued by the International Accounting Standards Board (IFRS-IASB) and Canadian generally accepted accounting principles.
Generally accepted accounting principles require that we disclose the accounting policies we have selected in those instances where we have been obligated to choose from among various accounting policies that comply with generally accepted accounting principles. In certain other instances, including those in which no selection among policies is allowed, we are also required to disclose how we have applied certain accounting policies. In the selection and application of accounting policies we consider, among other factors, the fundamental qualitative characteristics of useful financial information, namely relevance and faithful representation. In our assessment, our required accounting policy disclosures are not all equally significant for us, as set out in the accompanying table; their relative significance for us will evolve over time as we do.
These consolidated financial statements for each of the years ended December 31, 2018 and 2017, were authorized by our Board of Directors for issue on February 14, 2019.
(a) Consolidation
Our consolidated financial statements include our accounts and the accounts of all of our subsidiaries, the principal one of which is TELUS Communications Inc., in which we have a 100% equity interest. TELUS Communications Inc. includes substantially all of our wireless and wireline operations.
Our financing arrangements and those of our wholly owned subsidiaries do not impose restrictions on inter-corporate dividends.
On a continuing basis, we review our corporate organization and effect changes as appropriate so as to enhance the value of TELUS Corporation. This process can, and does, affect which of our subsidiaries are considered principal subsidiaries at any particular point in time.
|
Accounting policy | ||
| requiring a more significant | ||
| choice among policies | ||
| and/or a more significant | ||
| application of judgment | ||
Accounting policy | Yes | No | |
GENERAL APPLICATION |
|
| |
(a) | Consolidation |
| X |
(b) | Use of estimates and judgments | X |
|
(c) |
Financial instruments – recognition and measurement |
| X |
(d) | Hedge accounting |
| X |
RESULTS OF OPERATIONS FOCUSED |
|
| |
(e) | Revenue recognition | X |
|
(f) |
Depreciation, amortization and impairment | X |
|
(g) | Translation of foreign currencies |
| X |
(h) | Income and other taxes | X |
|
(i) | Share-based compensation |
| X |
(j) | Employee future benefit plans | X |
|
FINANCIAL POSITION FOCUSED |
|
| |
(k) | Cash and temporary investments, net |
| X |
(l) | Inventories |
| X |
(m) |
Property, plant and equipment; intangible assets | X |
|
(n) | Leases |
| X |
(o) | Investments |
| X |
(b) Use of estimates and judgments The preparation of financial statements in conformity with generally accepted accounting principles requires management to make estimates, assumptions and judgments that affect: the reported amounts of assets and liabilities at the date of the financial statements; the disclosure of contingent assets and liabilities at the date of the financial statements; and the reported amounts of revenues and expenses during the reporting period. Actual results could differ from those estimates. |
| |
| |
| Denotes accounting policy requiring, for us, a more significant choice among accounting policies and/or a more significant application of judgment. |
126 · TELUS 2018 ANNUAL REPORT
CONSOLIDATED FINANCIAL STATEMENTS: NOTE 1
Estimates Examples of the significant estimates and assumptions that we make, and their relative significance and degree of difficulty, are set out in the graphic below. |
|
| ||
|
|
|
|
| · The recoverability of intangible assets with indefinite lives (see Note 18(e) for discussion of key assumptions) · The recoverability of goodwill (see Note 18(e) for discussion of key assumptions) | · Certain actuarial and economic assumptions used in determining defined benefit pension costs and accrued pension benefit obligations (see Note 15(e) for discussion of key assumptions) |
|
· Determination of the amounts and composition of income and other tax assets and liabilities, including the amounts of unrecognized tax benefits | · The estimated useful lives of assets (see (f) following) · Certain economic assumptions used in provisioning for asset retirement obligations (see (m) following) |
| |
· Amounts for net identifiable assets acquired in business combinations and provisions related to business combinations · The recoverability of long-term investments | · The recoverability of tangible and intangible assets subject to amortization | · Determination of the allowance for doubtful accounts and the impairment allowance for contract assets · Determination of the allowance for inventory obsolescence | |
Judgments Examples of our significant judgments, apart from those involving estimation, include the following: · Assessments about whether line items are sufficiently material to warrant separate presentation in the primary financial statements and, if not, whether they are sufficiently material to warrant separate presentation in the notes to the financial statements. In the normal course, we make changes to our assessments regarding materiality for presentation so that they reflect current economic conditions. Due consideration is given to the view that it is reasonable to expect differing opinions of what is, and is not, material. · In respect of revenue-generating transactions, we must make judgments that affect the timing of the recognition of revenue. See Note 2(a) for significant changes to IFRS-IASB which significantly affect the timing of the recognition of revenue and the classification of revenues presented as either service or equipment revenues. · We must make judgments about when we have satisfied our performance obligations to our customers, either over a period of time or at a point in time. Service revenues are recognized based upon customers’ access to, or usage of, our telecommunications infrastructure; we believe that this method faithfully depicts the transfer of the services, and thus the revenues are recognized as the services are made available and/or rendered. We consider our performance obligations arising from the sale of equipment to have been satisfied when the equipment has been delivered to, and accepted by, the end-user customers (see (e) following). · Principally in the context of revenue-generating transactions involving wireless handsets, we must make judgments about whether third-party re-sellers that deliver equipment to our customers are acting in the transactions as principals or as our agents. Upon due consideration of the relevant indicators, we believe that the decision to consider the re-sellers to be acting, solely for accounting purposes, as our agents is more representative of the economic substance of the transactions, as we are the primary
|
obligor to the end-user customers. The effect of this judgment is that no equipment revenue is recognized upon the transfer of inventory to third-party re-sellers. · We compensate third-party re-sellers and our employees for generating revenues, and we must exercise judgment as to whether such sales-based compensation amounts are costs incurred to obtain contracts with customers that should be capitalized (see Note 20). We believe that compensation amounts tangentially attributable to obtaining a contract with a customer, because the amount of such compensation could be affected in ways other than by simply obtaining that contract, should be expensed as incurred; compensation amounts directly attributable to obtaining a contract with a customer should be capitalized and subsequently amortized on a systematic basis, consistent with the satisfaction of our associated performance obligations. Judgment must also be exercised in the capitalization of costs incurred to fulfill revenue-generating contracts with customers. Such fulfilment costs are those incurred to set up, activate or otherwise implement services involving access to, or usage of, our telecommunications infrastructure that would not otherwise be capitalized as property, plant and equipment and intangible assets (see Note 20). · The decision to depreciate and amortize any property, plant, equipment and intangible assets that are subject to amortization on a straight-line basis, as we believe that this method reflects the consumption of resources related to the economic lifespan of those assets better than an accelerated method and is more representative of the economic substance of the underlying use of those assets. · The preparation of financial statements in accordance with generally accepted accounting principles requires management to make judgments that affect the financial statement disclosure of information regularly reviewed by our chief operating decision-maker used to make resource allocation decisions and to assess performance (segment information, Note 5). A significant judgment we make
|
| |
| |
| Denotes accounting policy requiring, for us, a more significant choice among accounting policies and/or a more significant application of judgment. |
TELUS 2018 ANNUAL REPORT · 127
is in respect of distinguishing between our wireless and wireline operations and cash flows (and this extends to allocations of both direct and indirect expenses and capital expenditures). The clarity of such distinction has been increasingly affected by the convergence and integration of our wireless and wireline telecommunications infrastructure technology and operations. Less than one-half of the operating expenses included in the segment performance measure reported to our chief operating decision-maker during the years ended December 31, 2018 and 2017, are direct costs; judgment, largely based upon historical experience, is applied in apportioning indirect expenses which are not objectively distinguishable between our wireless and wireline operations. Recently, our judgment was that our wireless and wireline telecommunications infrastructure technology and operations had not experienced sufficient convergence to objectively make their respective operations and cash flows practically indistinguishable. The continued build-out of our technology-agnostic fibre-optic infrastructure, in combination with converged edge network technology, has significantly affected this judgment, as has the commercialization of fixed-wireless telecommunications solutions for customers and the consolidation of our non-customer facing operations. As a result, it has become increasingly difficult and impractical to objectively and clearly distinguish between our wireless and wireline operations and cash flows, and the assets from which those cash flows arise. Our judgment as to whether these operations can continue to be judged to be individual components of the business and discrete operating segments may change. The increasing impracticality of objectively distinguishing between our wireless and wireline cash flows, and the assets from which those cash flows arise, is evidence of their increasing interdependence; this may result in the unification of the wireless cash-generating unit and the wireline cash-generating unit as a single cash-generating unit for impairment testing purposes in the future. As our business continues to evolve, new cash-generating units may develop. · The view that our spectrum licences granted by Innovation, Science and Economic Development Canada will likely be renewed; that we intend to renew them; that we believe we have the financial and operational ability to renew them; and thus, that they have an indefinite life, as discussed further in Note 18(e). · In connection with the annual impairment testing of intangible assets with indefinite lives and goodwill, there are instances in which we must exercise judgment in allocating our net assets, including shared corporate and administrative assets, to our cash-generating units when determining their carrying amounts. These judgments are necessary because of the convergence that our wireless and wireline telecommunications infrastructure technology and operations have experienced to date, and because of our continuous development. There are instances in which similar judgments must also be made in respect of future capital expenditures in support of both wireless and wireline operations, which are a component of the determination of recoverable amounts used in the annual impairment testing, as discussed further in Note 18(f). · In respect of claims and lawsuits, as discussed further in Note 29(a), the determination of whether an item is a contingent liability or whether an outflow of resources is probable and thus needs to be accounted for as a provision.
|
(c) Financial instruments – recognition and measurement
In respect of the recognition and measurement of financial instruments, we have adopted the following policies:
· Regular-way purchases or sales of financial assets or financial liabilities (purchases or sales that require actual delivery of financial assets or financial liabilities) are recognized on the settlement date. We have selected this method as the benefits of using the trade date method were not expected to exceed the costs of selecting and implementing that method.
· Transaction costs, other than in respect of items held for trading, are added to the initial fair value of the acquired financial asset or financial liability. We have selected this method as we believe that it results in a better matching of the transaction costs with the periods in which we benefit from the transaction costs.
(d) Hedge accounting
General
We apply hedge accounting to the financial instruments used to: establish designated currency hedging relationships for certain U.S. dollar-denominated future purchase commitments and debt repayments, as set out in Note 4(a) and (d); and fix the compensation cost arising from specific grants of restricted stock units, as set out in Note 4(f) and discussed further in Note 14(b).
Hedge accounting
The purpose of hedge accounting, in respect of our designated hedging relationships, is to ensure that counterbalancing gains and losses are recognized in the same periods. We have chosen to apply hedge accounting as we believe this is more representative of the economic substance of the underlying transactions.
In order to apply hedge accounting, a high correlation (which indicates effectiveness) is required in the offsetting changes in the risk-associated values of the financial instruments (the hedging items) used to establish the designated hedging relationships and all, or a part, of the asset, liability or transaction having an identified risk exposure that we have taken steps to modify (the hedged items). We assess the anticipated effectiveness of designated hedging relationships at inception and their actual effectiveness for each reporting period thereafter. We consider a designated hedging relationship to be effective if the following critical terms match between the hedging item and the hedged item: the notional amount of the hedging item and the principal amount of the hedged item; maturity dates; payment dates; and interest rate index (if, and as, applicable). As set out in Note 4(i), any ineffectiveness, such as would result from a difference between the notional amount of the hedging item and the principal amount of the hedged item, or from a previously effective designated hedging relationship becoming ineffective, is reflected in the Consolidated statements of income and other comprehensive income as Financing costs if in respect of long-term debt, as Goods and services purchased if in respect of U.S. dollar-denominated future purchase commitments, or as Employee benefits expense if in respect of share-based compensation.
Hedging assets and liabilities
In the application of hedge accounting, an amount (the hedge value) is recorded in the Consolidated statements of financial position in respect of the fair value of the hedging items. The net difference, if any, between the amounts recognized in the determination of net income and the
| |
| |
| Denotes accounting policy requiring, for us, a more significant choice among accounting policies and/or a more significant application of judgment. |
128 · TELUS 2018 ANNUAL REPORT
CONSOLIDATED FINANCIAL STATEMENTS: NOTE 1
amounts necessary to reflect the fair value of the designated cash flow hedging items recorded in the Consolidated statements of financial position is recognized as a component of Other comprehensive income, as set out in Note 11.
In the application of hedge accounting to the compensation cost arising from share-based compensation, the amount recognized in the determination of net income is the amount that counterbalances the difference between the quoted market price of our Common Shares at the statement of financial position date and the price of our Common Shares in the hedging items.
(e) Revenue recognition See Note 2(a) for significant changes to IFRS-IASB which significantly affect the timing of the recognition of revenue and the classification of revenues presented as either service or equipment revenues.
General We earn the majority of our revenues (wireless: network revenues (voice and data); wireline: data revenues (which include: Internet protocol; television; hosting, managed information technology and cloud-based services; business process outsourcing; certain healthcare solutions; and home and business security) and voice revenues) from access to, and usage of, our telecommunications infrastructure. The majority of the balance of our revenues (wireless equipment and other) arises from providing services and products facilitating access to, and usage of, our telecommunications infrastructure. We offer complete and integrated solutions to meet our customers’ needs. These solutions may involve deliveries of multiple services and products (our performance obligations) that occur at different points in time and/or over different periods of time; as referred to in (b), this is a significant judgment for us. As required, the performance obligations of these multiple element arrangements are identified, the transaction price for the entire multiple element arrangement is determined and allocated among the performance obligations based upon our relative stand-alone selling prices for each of them, and our relevant revenue recognition policies are then applied, so that revenue is recognized when, or as, we satisfy the performance obligations. (We estimate that approximately two-thirds of our revenues arise from multiple element arrangements.) To the extent that variable consideration is included in determining the minimum transaction price, it is constrained to the “minimum spend” amount required in a contract with a customer. Service revenues arising from contracts with customers typically have variable consideration, because customers have the ongoing ability to both add and remove features and services, and because customer usage of our telecommunications infrastructure may exceed the base amounts provided for in their contracts. Our contracts with customers do not have a significant financing component. Excepting both equipment-related upfront payments that may be required under the terms of contracts with customers and in-store “cash and carry” sales of equipment and accessories, payments are typically due 30 days from the billing date. Billings are typically rendered on a monthly basis. Multiple contracts with a single customer are normally accounted for as separate arrangements. In instances where multiple contracts are entered into with a customer in a short period of time, the contracts are reviewed as a group to ensure that, as with multiple element arrangements, their relative transaction prices are appropriate.
|
Lease accounting is applied to an accounting unit if it conveys to a customer the right to use a specific asset but does not convey the risks and/or benefits of ownership. Our revenues are recorded net of any value-added and/or sales taxes billed to the customer concurrent with a revenue-generating transaction. We use the following revenue accounting practical expedients provided for in IFRS 15, Revenue from Contracts with Customers: · No adjustment of the contracted amount of consideration for the effects of financing components when, at the inception of a contract, we expect that the effect of the financing component is not significant at the individual contract level. · No deferral of contract acquisition costs when the amortization period for such costs would be one year or less. · When estimating minimum transaction prices allocated to any remaining unfulfilled, or partially unfulfilled, performance obligations, exclusion of amounts arising from contracts originally expected to have a duration of one year or less, as well as amounts arising from contracts under which we may recognize and bill revenue in an amount that corresponds directly with our completed performance obligations.
Contract assets Many of our multiple element arrangements arise from bundling the sale of equipment (e.g. a wireless handset) with a contracted service period. Although the customer receives the equipment at contract inception and the revenue from the associated completed performance obligation is recognized at that time, the customer’s payment for the equipment will effectively be received rateably over the contracted service period to the extent it is not received as a lump-sum amount at contract inception. The difference between the equipment revenue recognized and the associated amount cumulatively billed to the customer is recognized on the Consolidated statements of financial position as a contract asset. Contract assets may also arise in instances where we give consideration to a customer. When we receive no identifiable, separable benefit for consideration given to a customer, the amount of the consideration is recorded as a reduction of revenue rather than as an expense. Such amounts are included in the determination of transaction prices for allocation purposes in multiple element arrangements. · Some forms of consideration given to a customer, effectively at contract inception, such as rebates (including prepaid non-bank cards) and/or equipment, are considered to be performance obligations in a multiple element arrangement. Although the performance obligation is satisfied at contract inception, the customer’s payment associated with the performance obligation will effectively be received rateably over the associated contracted service period. The difference between the revenue arising from the satisfied performance obligation and the associated amount cumulatively reflected in billings to the customer is recognized on the Consolidated statements of financial position as a contract asset. · Other forms of consideration given to a customer, either at contract inception or over a period of time, such as discounts (including prepaid bank cards), may result in us receiving no identifiable, separable benefit and thus are not considered performance obligations. Such consideration is recognized as a reduction of revenue rateably over the term of the contract. The difference between the consideration provided and the associated amount recognized as a reduction of revenue is recognized on the Consolidated statements of financial position as a contract asset.
|
| |
| |
| Denotes accounting policy requiring, for us, a more significant choice among accounting policies and/or a more significant application of judgment. |
TELUS 2018 ANNUAL REPORT · 129
Contract liabilities Advance billings are recorded when billing occurs prior to provision of the associated services; such advance billings are recognized as revenue in the period in which the services and/or equipment are provided (see Note 24). Similarly, and as appropriate, upfront customer activation and connection fees are deferred and recognized over the average expected term of the customer relationship.
Costs of contract acquisition and contract fulfilment Costs of contract acquisition (typically commissions) and contract fulfilment costs are capitalized and recognized as an expense, generally over the life of the contract on a systematic and rational basis consistent with the pattern of the transfer of goods or services to which the asset relates. The amortization of such costs is included in the Consolidated statements of income and other comprehensive income as a component of Goods and services purchased, with the exception of amounts paid to our employees, which are included as Employee benefits expense. The total cost of wireless equipment sold to customers and advertising and promotion costs related to initial customer acquisition are expensed as incurred; the cost of equipment we own that is situated at customers’ premises and associated installation costs are capitalized as incurred. Costs of advertising production, advertising airtime and advertising space are expensed as incurred.
Voice and data We recognize revenues on an accrual basis and include an estimate of revenues earned but unbilled. Wireless and wireline service revenues are recognized based upon access to, and usage of, our telecommunications infrastructure and upon contract fees. Advance billings are recorded when billing occurs prior to provision of the associated services; such advance billings are recognized as revenue in the period in which the services are provided. Similarly, and as appropriate, upfront customer activation and connection fees are deferred and recognized over the average expected term of the customer relationship. We use the liability method of accounting for the amounts of our quality of service rate rebates that arise from the jurisdiction of the Canadian Radio-television and Telecommunications Commission (CRTC). The CRTC has established a mechanism to subsidize local exchange carriers, such as ourselves, that provide residential basic telephone service to high cost serving areas. The CRTC has determined the per network access line/per band subsidy rate for all local exchange carriers. We recognize the subsidy on an accrual basis by applying the subsidy rate to the number of residential network access lines we provide in high cost serving areas, as discussed further in Note 7. Differences, if any, between interim and final subsidy rates set by the CRTC are accounted for as a change in estimate in the period in which the CRTC finalizes the subsidy rate.
Other and wireless equipment We recognize product revenues, including amounts related to wireless handsets sold to re-sellers and customer premises equipment, when the products are both delivered to and accepted by the end-user customers, irrespective of which supply channel delivers the product. With respect to wireless handsets sold to re-sellers, we consider ourselves to be the principal and primary obligor to the end-user customers. Revenues from operating leases of equipment are recognized on a systematic and rational basis (normally a straight-line basis) over the term of the lease.
|
Non-high cost serving area deferral account In an effort to foster competition for residential basic service in non-high cost serving areas, the concept of a deferral account mechanism was introduced by the CRTC in 2002 as an alternative to mandating price reductions. We use the liability method of accounting for the deferral account. We discharge the deferral account liability by undertaking qualifying actions. We recognize the amortization (over a period no longer than three years) of a proportionate share of the deferral account as qualifying actions are completed. Such amortization is included as a component of government assistance in Other operating income, as set out in Note 7.
(f) Depreciation, amortization and impairment
Depreciation and amortization Assets are depreciated on a straight-line basis over their estimated useful lives as determined by a continuing program of asset life studies. Depreciation includes amortization of assets under finance leases and amortization of leasehold improvements. Leasehold improvements are normally amortized over the lesser of their expected average service life or the term of the lease. Intangible assets with finite lives (intangible assets subject to amortization) are amortized on a straight-line basis over their estimated useful lives, which are reviewed at least annually and adjusted as appropriate. As referred to in (b), the use of a straight-line basis of depreciation and amortization is a significant judgment for us. Estimated useful lives for the majority of our property, plant and equipment subject to depreciation are as follows: | |||||
| |||||
|
| Estimated useful lives1 |
| ||
| Network assets |
|
| ||
| Outside plant | 17 to 40 years |
| ||
| Inside plant | 4 to 25 years |
| ||
| Wireless site equipment | 5 to 7 years |
| ||
| Balance of depreciable property, plant and equipment | 3 to 40 years |
| ||
|
|
|
| ||
1 The composite depreciation rate for the year ended December 31, 2018, was 5.0% (2017 – 5.0%). The rate is calculated by dividing depreciation expense by an average of the gross book value of depreciable assets over the reporting period. | |||||
| |||||
Estimated useful lives for the majority of our intangible assets subject to amortization are as follows: | |||||
| |||||
|
| Estimated useful lives |
| ||
| Wireline subscriber base | 25 years |
| ||
| Customer contracts and related customer relationships | 4 to 10 years |
| ||
| Software | 2 to 10 years |
| ||
| Access to rights-of-way and other | 5 to 30 years |
| ||
| |||||
Impairment – general Impairment testing compares the carrying values of the assets or cash-generating units being tested with their recoverable amounts (the recoverable amount being the greater of an asset’s or a cash-generating unit’s value in use or its fair value less costs to sell); as referred to in (b), this is a significant estimate for us. Impairment losses are immediately recognized to the extent that the carrying value of an asset or a cash-generating unit exceeds its recoverable amount. Should the recoverable amounts for impaired assets or cash-generating units subsequently increase, the impairment losses previously recognized (other than in respect of goodwill) may be reversed to the extent that the reversal is not a result of “unwinding of the discount” and that the resulting carrying values do not exceed the carrying values that would have been the result if no impairment losses had been recognized previously.
| |||||
| |
| |
| Denotes accounting policy requiring, for us, a more significant choice among accounting policies and/or a more significant application of judgment.
|
130 · TELUS 2018 ANNUAL REPORT
CONSOLIDATED FINANCIAL STATEMENTS: NOTE 1
Impairment – property, plant and equipment; intangible assets subject to amortization The continuing program of asset life studies considers such items as the timing of technological obsolescence, competitive pressures and future infrastructure utilization plans; these considerations could also indicate that the carrying value of an asset may not be recoverable. If the carrying value of an asset were not considered to be recoverable, an impairment loss would be recorded.
Impairment - intangible assets with indefinite lives; goodwill The carrying values of intangible assets with indefinite lives and goodwill are periodically tested for impairment. The frequency of the impairment testing is generally the reciprocal of the stability of the relevant events and circumstances, but intangible assets with indefinite lives and goodwill must, at a minimum, be tested annually; we have selected December as the time of our annual test. We assess our intangible assets with indefinite lives by comparing the recoverable amounts of our cash-generating units to their carrying values (including the intangible assets with indefinite lives allocated to a cash-generating unit, but excluding any goodwill allocated to a cash-generating unit). To the extent that the carrying value of a cash-generating unit (including the intangible assets with indefinite lives allocated to the cash-generating unit, but excluding any goodwill allocated to the cash-generating unit) exceeds its recoverable amount, the excess amount would be recorded as a reduction in the carrying value of intangible assets with indefinite lives. Subsequent to assessing intangible assets with indefinite lives, we assess goodwill by comparing the recoverable amounts of our cash-generating units to their carrying values (including the intangible assets with indefinite lives and the goodwill allocated to a cash-generating unit). To the extent that the carrying value of a cash-generating unit (including the intangible assets with indefinite lives and the goodwill allocated to the cash-generating unit) exceeds its recoverable amount, the excess amount would first be recorded as a reduction in the carrying value of goodwill and any remainder would be recorded as a reduction in the carrying values of the assets of the cash-generating unit on a pro-rated basis.
|
(g) Translation of foreign currencies
Trade transactions completed in foreign currencies are translated into Canadian dollars at the rates of exchange prevailing at the time of the transactions. Monetary assets and liabilities denominated in foreign currencies are translated into Canadian dollars at the rate of exchange in effect at the statement of financial position date, with any resulting gain or loss recorded in the Consolidated statements of income and other comprehensive income as a component of Financing costs, as set out in Note 9. Hedge accounting is applied in specific instances, as discussed further in (d) preceding.
We have foreign subsidiaries that do not have the Canadian dollar as their functional currency. Foreign exchange gains and losses arising from the translation of these foreign subsidiaries’ accounts into Canadian dollars subsequent to January 1, 2010, the date of our transition to IFRS-IASB, are reported as a component of other comprehensive income as set out in Note 11.
(h) Income and other taxes We follow the liability method of accounting for income taxes; as referred to in (b), this is a significant estimate for us. Under this method, current income taxes are recognized for the estimated income taxes payable for the current year. Deferred income tax assets and liabilities are recognized for temporary differences between the tax and accounting bases of assets and liabilities, and also for any benefits of losses and Investment Tax Credits available to be carried forward to future years for tax purposes that are more likely than not to be realized. The amounts recognized in respect of deferred income tax assets and liabilities are based upon the expected timing of the reversal of temporary differences or the usage of tax losses and the application of the substantively enacted tax rates at the time of reversal or usage. We account for any changes in substantively enacted income tax rates affecting deferred income tax assets and liabilities in full in the period in which the changes are substantively enacted. We account for changes in the estimates of tax balances for prior years as estimate revisions in the period in which changes in the estimates arise; we have selected this approach as its emphasis on the statement of financial position is more consistent with the liability method of accounting for income taxes. Our operations are complex and the related domestic and foreign tax interpretations, regulations, legislation and jurisprudence are continually changing. As a result, there are usually some tax matters in question that result in uncertain tax positions. We only recognize the income tax benefit of an uncertain tax position when it is more likely than not that the ultimate determination of the tax treatment of the position will result in that benefit being realized; however, this does not mean that tax authorities cannot challenge these positions. We accrue an amount for interest charges on current tax liabilities that have not been funded, which would include interest and penalties arising from uncertain tax positions. We include such charges in the Consolidated statements of income and other comprehensive income as a component of Financing costs. Our research and development activities may be eligible to earn Investment Tax Credits, for which the determination of eligibility is a complex matter. We only recognize Investment Tax Credits when there is reasonable assurance that the ultimate determination of the eligibility of our research and development activities will result in the Investment Tax Credits being received, at which time they are accounted for using the cost reduction method, whereby such credits are deducted from the expenditures or assets to which they relate, as set out in Note 10(c).
|
(i) Share-based compensation
General
When share-based compensation vests in its entirety at one future point in time (cliff vesting), we recognize the expense on a straight-line basis over the vesting period. When share-based compensation vests in tranches (graded vesting), we recognize the expense using the accelerated expense attribution method. An estimate of forfeitures during the vesting period is made at the date of grant of such share-based compensation; this estimate is adjusted to reflect actual experience.
Restricted stock units
In respect of restricted stock units without market performance conditions, as set out in Note 14(b), we accrue a liability equal to the product of the number of vesting restricted stock units multiplied by the fair market value of the corresponding Common Shares at the end of the reporting period (unless hedge accounting is applied, as set out in (d) preceding).
| |
| |
| Denotes accounting policy requiring, for us, a more significant choice among accounting policies and/or a more significant application of judgment. |
TELUS 2018 ANNUAL REPORT · 131
Similarly, we accrue a liability for the notional subset of our restricted stock units with market performance conditions using a fair value determined using a Monte Carlo simulation. The expense for restricted stock units that do not ultimately vest is reversed against the expense that was previously recorded in their respect.
Share option awards A fair value for share option awards is determined at the date of grant and that fair value is recognized in the financial statements. Proceeds arising from the exercise of share option awards are credited to share capital, as are the recognized grant-date fair values of the exercised share option awards. Share option awards that have a net-equity settlement feature, as set out in Note 14(d), are accounted for as equity instruments. We have selected the equity instrument fair value method of accounting for the net-equity settlement feature as it is consistent with the accounting treatment afforded to the associated share option awards. |
|
(j) Employee future benefit plans
Defined benefit plans We accrue amounts for our obligations under employee defined benefit plans and the related costs, net of plan assets. The cost of pensions and other retirement benefits earned by employees is actuarially determined using the accrued benefit method pro-rated on service and management’s best estimates of salary escalation and the retirement ages of employees. In the determination of net income, net interest for each plan, which is the product of the plan’s surplus (deficit) multiplied by the discount rate, is included as a component of Financing costs, as set out in Note 9. An amount reflecting the effect of differences between the discount rate and the actual rate of return on plan assets is included as a component of employee defined benefit plan re-measurements within Other comprehensive income, as set out in Note 11 and Note 15. We determine the maximum economic benefit available from the plans’ assets on the basis of reductions in future contributions to the plans. On an annual basis, at a minimum, the defined benefit plan key assumptions are assessed and revised as appropriate; as referred to in (b), these are significant estimates for us. When the defined benefit plan key assumptions fluctuate significantly relative to their immediately preceding year-end values, actuarial gains (losses) arising from such significant fluctuations are recognized on an interim basis.
Defined contribution plans We use defined contribution accounting for the Telecommunication Workers Pension Plan and the British Columbia Public Service Pension Plan, which cover certain of our employees and provide defined benefits to their members. In the absence of any regulations governing the calculation of the share of the underlying financial position and plan performance attributable to each employer-participant, and in the absence of contractual agreements between the plans and the employer-participants related to the financing of any shortfall (or distribution of any surplus), we account for these plans as defined contribution plans in accordance with International Accounting Standard 19, Employee Benefits.
|
|
(k) Cash and temporary investments, net Cash and temporary investments, which may include investments in money market instruments that are purchased three months or less from maturity, are presented net of outstanding items, including cheques written |
but not cleared by the related banks as at the statement of financial position date. Cash and temporary investments, net, are classified as a liability in the statement of financial position when the total amount of all cheques written but not cleared by the related banks exceeds the amount of cash and temporary investments. When cash and temporary investments, net, are classified as a liability, they may also include overdraft amounts drawn on our bilateral bank facilities, which revolve daily and are discussed further in Note 22.
(l) Inventories Our inventories primarily consist of wireless handsets, parts and accessories totalling $320 million at year-end (December 31, 2017 – $322 million (adjusted – Note 2(c)); January 1, 2017 – $268 million (Note 2(c)) and communications equipment held for resale. Costs of goods sold for the year ended December 31, 2018, totalled $2,144 million (2017 – $1,975 million (adjusted – Note 2(c)). |
|
(m) Property, plant and equipment; intangible assets
General Property, plant and equipment and intangible assets are recorded at historical cost, which for self-constructed property, plant and equipment includes materials, direct labour and applicable overhead costs. For internally developed, internal-use software, the historical cost recorded includes materials, direct labour and direct labour-related costs. Where property, plant and equipment construction projects are of sufficient size and duration, an amount is capitalized for the cost of funds used to finance construction, as set out in Note 9. The rate for calculating the capitalized financing cost is based on the weighted average cost of borrowing we experience during the reporting period. When we sell property, plant and/or equipment, the net book value is netted against the sale proceeds and the difference, as set out in Note 7, is included in the Consolidated statements of income and other comprehensive income as Other operating income.
Asset retirement obligations Provisions for liabilities, as set out in Note 25, are recognized for statutory, contractual or legal obligations, normally when incurred, associated with the retirement of property, plant and equipment (primarily certain items of outside plant and wireless site equipment) when those obligations result from the acquisition, construction, development and/or normal operation of the assets; as referred to in (b), this is a significant estimate for us. The obligations are measured initially at fair value, which is determined using present value methodology, and the resulting costs are capitalized as a part of the carrying value of the related asset. In subsequent periods, the provisions for these liabilities are adjusted for the accretion of discount, for any changes in the market-based discount rate and for any changes in the amount or timing of the underlying future cash flows. The capitalized asset retirement cost is depreciated on the same basis as the related asset and the discount accretion, as set out in Note 9, is included in the Consolidated statements of income and other comprehensive income as a component of Financing costs.
|
|
(n) Leases Leases are classified as finance or operating depending upon the terms and conditions of the contracts. See Note 2 for significant changes to IFRS-IASB which are not yet effective, but which we will apply in fiscal 2019 and which, on an individual lease basis, will significantly affect the |
| |
| |
| Denotes accounting policy requiring, for us, a more significant choice among accounting policies and/or a more significant application of judgment. |
132 · TELUS 2018 ANNUAL REPORT
CONSOLIDATED FINANCIAL STATEMENTS: NOTE 2
timing of the recognition of operating lease expenses and their recognition in the Consolidated statement of financial position, as well as their classification in both the Consolidated statement of income and other comprehensive income and the Consolidated statement of cash flows.
Where we are the lessee, asset values recorded under finance leases are amortized on a straight-line basis over the period of expected use. Obligations recorded under finance leases are reduced by lease payments net of imputed interest.
(o) Investments
We account for our investments in companies over which we have significant influence using the equity method of accounting, whereby the investments are initially recorded at cost and subsequently adjusted to recognize our share of earnings or losses of the investee companies and any earnings distributions received. The excess of the cost of an equity investment over its underlying book value at the date of acquisition except for goodwill, is amortized over the estimated useful lives of the underlying assets to which the excess cost is attributed.
Similarly, we account for our interests in the real estate joint ventures, discussed further in Note 21, using the equity method of accounting. Unrealized gains and losses from transactions with (including contributions to) the real estate joint ventures are deferred in proportion to our remaining interest in the real estate joint ventures.
We account for our other investments as available-for-sale at their fair values unless they are investment securities that do not have quoted market prices in an active market or do not have other clear and objective evidence of fair value. When we do not account for our available-for-sale investments at their fair values, we use the cost basis of accounting, whereby the investments are initially recorded at cost and earnings from those investments are recognized only to the extent received or receivable. The costs of investments sold or the amounts reclassified from other comprehensive income to earnings are determined on a specific-identification basis.
Unless there is a significant or prolonged decline in the value of an available-for-sale investment, the carrying values of available-for-sale investments are adjusted to their estimated fair values, and the amount of any such adjustment is included in the Consolidated statement of income and other comprehensive income as a component of other comprehensive income. When there is a significant or prolonged decline in the value of an investment, the carrying value of any such investment accounted for using the equity, available-for-sale or cost method is reduced to its estimated fair value, and the amount of any such reduction is included in the Consolidated statement of income and other comprehensive income as Other operating income.
|
|
2 | Accounting policy developmets |
|
|
(a) Initial application of standards, interpretations and amendments to standards and interpretations in the reporting period
· Amendments to standards arising from Annual Improvements to IFRSs 2015-2017 Cycle were required to be applied for years beginning on or after January 1, 2019; such application has had no effect on our financial performance or disclosure.
· Amendments to standards arising from Annual Improvements to IFRSs 2014-2016 Cycle were required to be applied for years beginning on or after January 1, 2017 (for IFRS 12, Disclosure of Interests in Other Entities), and January 1, 2018 (for the balance of the amendments); such application has had no effect on our financial performance or disclosure.
· IFRS 9, Financial Instruments, is required to be applied for years beginning on or after January 1, 2018, with retrospective application. The new standard includes a model for the classification and measurement of financial instruments, a single forward-looking “expected loss” impairment model and a reformed approach to hedge accounting. Our financial performance is currently not materially affected by the retrospective application of the standard, nor is our financial position, as set out in (c) following.
The previous measurement category and carrying amount of our portfolio investments (see Note 20) determined in accordance with IAS 39, Financial Instruments: Recognition and Measurement and the measurement category and carrying amount determined under the new standard are as follows:
As at (millions) |
|
|
| December 31, 2017 |
|
|
|
|
| January 1, 2017 | ||
|
| As previously |
| IFRS 9 |
| As currently |
| As previously |
| IFRS 9 |
| As currently |
|
| reported |
| effects |
| reported |
| reported |
| effects |
| reported |
Classified as |
|
|
|
|
|
|
|
|
|
|
|
|
Available-for-sale financial assets |
| $ 41 |
| $ (41 | ) | $ – |
| $ 62 |
| $ (62 | ) | $ – |
Fair value through net income1 |
| – |
| 20 |
| 20 |
| – |
| 41 |
| 41 |
Fair value through other comprehensive income |
| – |
| 21 |
| 21 |
| – |
| 21 |
| 21 |
|
| $ 41 |
| $ – |
| $ 41 |
| $ 62 |
| $ – |
| $ 62 |
1 Arising from the classification of investments as accounted for at fair value through net income under the new standard, as at December 31, 2017, $4 (January 1, 2017 – $3), net of income tax effects of $1 (January 1, 2017 – $1), has been adjusted to retained earnings from accumulated other comprehensive income.
TELUS 2018 ANNUAL REPORT · 133
· IFRS 15, Revenue from Contracts with Customers, is required to be applied for years beginning on or after January 1, 2018. The International Accounting Standards Board and the Financial Accounting Standards Board of the United States worked on this joint project to clarify the principles for the recognition of revenue. The new standard was released in May 2014 and supersedes existing standards and interpretations, including IAS 18, Revenue. We have applied the standard retrospectively to prior reporting periods, subject to permitted and elected practical expedients.
The effects of the new standard and the materiality of those effects vary by industry and entity; the effects of our retrospective application are set out in (c) following. Like many other telecommunications companies, we are materially affected by its application, primarily in respect of the timing of revenue recognition, the classification of revenue, the capitalization of the costs of obtaining a contract with a customer and the capitalization of the costs of contract fulfilment (as defined by the new standard).
Revenue – timing of recognition; classification
The timing of revenue recognition and the classification of our revenues as either service revenues or equipment revenues are affected, since the allocation of consideration in multiple element arrangements (solutions for our customers that may involve deliveries of multiple services and products that occur at different points in time and/or over different periods of time) is no longer affected by the limitation cap methodology previously required by generally accepted accounting principles.
The effects of the timing of revenue recognition and the classification of revenue are most pronounced in our wireless results. Although the measurement of the total revenue recognized over the life of a contract is largely unaffected by the new standard, the prohibition of the use of the limitation cap methodology accelerates the recognition of total contract revenue, relative to both the associated cash inflows from customers and our previous practice (using the limitation cap methodology); as set out in (c) following, cash inflows are unaffected. The acceleration of the recognition of contract revenue relative to the associated cash inflows also results in the recognition of an amount reflecting the resulting difference as a contract asset. Although the underlying transaction economics do not differ, during periods of sustained growth in the number of wireless subscriber connection additions, assuming comparable contract-lifetime per unit cash inflows, revenues would appear to be greater than under the previous practice (using the limitation cap methodology). Wireline results arising from transactions that include the initial provision of subsidized equipment or promotional pricing plans will be similarly affected.
We have applied the new standard retrospectively, subject to associated decisions in respect of transitional provisions and permitted practical expedients. The contract asset initially recorded upon transition to the new standard represents revenues that will not be, and have not been, reflected at any time in our periodic results of operations, but that would have been if not for the transition to the new standard; the effect of this “pulling forward” of revenues is expected to be somewhat muted by the composite ongoing inception, maturation and expiration of millions of multi-year contracts with our customers.
Costs of contract acquisition; costs of contract fulfilment – timing of recognition
Similarly, the measurement of the total costs of contract acquisition and contract fulfilment over the life of a contract is unaffected by the new standard, but the timing of recognition is. The new standard results in our costs of contract acquisition and contract fulfilment, to the extent that they are material, being capitalized and subsequently recognized as an expense over the life of a contract on a rational, systematic basis consistent with the pattern of the transfer of goods or services to which the asset relates. Although the underlying transaction economics would not differ, during periods of sustained growth in the number of customer connection additions, assuming comparable per unit costs of contract acquisition and contract fulfilment, absolute profitability measures would appear to be greater than under the previous practice (immediate expensing of such costs).
Implementation
Our operations and associated systems are complex and our accounting for millions of multi-year contracts with our customers was affected. Significantly, in order to give effect to the new accounting methodology, incremental compilation of historical data was necessary for our millions of already existing multi-year contracts with our customers that were in-scope for purposes of transitioning to the new standard.
After a multi-year expenditure of time and effort, we developed the accounting policies, estimates, judgments and processes necessary to transition to the new standard. Upon completion of the implementation of these items, which included the critical incremental requirements of our information technology systems, we completed the incremental compilation of historical data and the related accounting for that data, all of which is necessary to transition to the new standard.
We are using the following practical expedients provided for in, and transitioning to, the new standard:
· No restatement for contracts that were completed as at January 1, 2017, or earlier.
· No restatement for contracts that were modified prior to January 1, 2017. The aggregate effect of all such modifications will be reflected when identifying satisfied and unsatisfied performance obligations and the transaction prices to be allocated thereto, and when determining the transaction prices.
· No disclosure of the aggregate transaction prices allocated to remaining unfulfilled, or partially unfulfilled, performance obligations for all periods ending prior to January 1, 2018.
(b) Standards, interpretations and amendments to standards not yet effective and not yet applied
· In January 2016, the International Accounting Standards Board released IFRS 16, Leases, which is required to be applied for years beginning on or after January 1, 2019, and which supersedes IAS 17, Leases. The International Accounting Standards Board and the Financial Accounting Standards Board of the United States worked together to modify the accounting for leases, generally by eliminating lessees’ classification of leases as either operating leases or finance leases and, for IFRS-IASB, introducing a single lessee accounting model.
CONSOLIDATED FINANCIAL STATEMENTS: NOTE 2
The most significant effect of the new standard will be the lessee’s recognition of the initial present value of unavoidable future lease payments as right-of-use lease assets and lease liabilities on the statement of financial position, including those for most leases that would currently be accounted for as operating leases. Both leases with durations of 12 months or less and leases for low-value assets may be exempted.
The measurement of the total lease expense over the term of a lease will be unaffected by the new standard. However, the new standard will result in an acceleration of the timing of lease expense recognition for leases that would currently be accounted for as operating leases; the International Accounting Standards Board expects that this effect may be muted by a lessee having a portfolio of leases with varying maturities and lengths of term, and we expect that we will be similarly affected. The presentation on the statement of income and other comprehensive income required by the new standard will result in the presentation of most non-executory lease expenses as depreciation of right-of-use lease assets and financing costs arising from lease liabilities, rather than as a part of goods and services purchased (executory lease expenses will remain a part of goods and services purchased); reported operating income would thus be higher under the new standard.
Relative to the results of applying the current standard, although actual cash flows will be unaffected, the lessee’s statement of cash flows will reflect increases in cash flows from operating activities offset equally by decreases in cash flows from financing activities. This is the result of the presentation of the payments of the “principal” component of leases that would currently be accounted for as operating leases as a cash flow use within financing activities under the new standard.
We will be applying the standard retrospectively, with the cumulative effect of the initial application of the new standard recognized at the date of initial application, January 1, 2019, subject to permitted and elected practical expedients; such method of application would not result in the retrospective adjustment of amounts reported for periods prior to fiscal 2019. The nature of the transition method selected is such that the lease population as at January 1, 2019, and the discount rates determined contemporaneously, will be the basis for the cumulative effects recorded as of that date.
Implementation
As a transitional practical expedient permitted by the new standard, we will not reassess whether contracts are, or contain, leases as at January 1, 2019, applying the criteria of the new standard; as at January 1, 2019, only contracts that were previously identified as leases applying IAS 17, Leases, and IFRIC 4, Determining whether an Arrangement contains a Lease, will be a part of the transition to the new standard. Only contracts entered into (or changed) after January 1, 2019, will be assessed for being, or containing, leases applying the criteria of the new standard.
IFRS 16, Leases, will affect the fiscal 2019 opening amounts to be reported in our fiscal 2019 Consolidated statements of financial position as follows:
| Excluding |
|
|
|
| |
| effects of | IFRS 16 |
|
| ||
As at January 1, 2019 (billions) | IFRS 16 | effects | Pro forma | |||
Non-current assets |
|
|
|
|
|
|
Property, plant and equipment, net | $ | 12.1 | $ | 1.0 | $ | 13.1 |
Current liabilities |
|
|
|
|
|
|
Provisions | $ | 0.1 | $ | * | $ | 0.1 |
Current maturities of long-term debt | $ | 0.8 | $ | 0.2 | $ | 1.0 |
Non-current liabilities |
|
|
|
|
|
|
Provisions | $ | 0.7 | $ | * | $ | 0.7 |
Long-term debt | $ | 13.3 | $ | 1.1 | $ | 14.4 |
Other long-term liabilities | $ | 0.7 | $ | * | $ | 0.7 |
Deferred income taxes | $ | 3.2 | $ | (0.1) | $ | 3.1 |
Owners’ equity |
|
|
|
|
|
|
Retained earnings | $ | 4.5 | $ | (0.2) | $ | 4.3 |
Accumulated other comprehensive income | $ | * | $ | * | $ | * |
Non-controlling interests | $ | 0.1 | $ | * | $ | 0.1 |
*Amounts less than $0.1 billion. |
|
|
|
|
|
|
The weighted average discount rate reflected in the lease liability recognized on transition was 4.55%. The difference between the total of the minimum lease payments set out in Note 19 and the additions to long-term debt set out in the table above arises because of the effect of discounting the minimum lease payments (approximately two-thirds of the difference) and because the minimum lease payments set out in Note 19 include payments for leases that have commencement dates subsequent to December 31, 2018 (approximately one-third of the difference).
· In October 2018, the International Accounting Standards Board amended IFRS 3, Business Combinations, seeking to clarify whether an acquisition transaction results in the acquisition of an asset or the acquisition of a business. The amendments are effective for acquisition transactions on or after January 1, 2020, although earlier application is permitted. The amended standard has a narrower definition of a business, which could result in the recognition of fewer business combinations than under the current standard; the implication of this is that amounts which may have been recognized as goodwill in a business combination under the current standard may now be recognized as allocations to net identifiable assets acquired under the amended standard (with an associated effect in an entity’s results of operations that would differ from the effect of goodwill having been recognized). We are currently assessing the impacts and transition provisions of the amended standard; however, we expect that we will apply the standard prospectively from January 1, 2020. The effects, if any, of the amended standard on our financial performance and disclosure will be dependent on the facts and circumstances of any future acquisition transactions.
(c) Impacts of application of new standards in fiscal 2018
IFRS 15, Revenue from Contracts with Customers, affected our Consolidated statements of income and other comprehensive income as follows:
Years ended December 31 (millions except per share amounts) |
|
|
|
|
| 2018 |
|
|
|
|
| 2017 |
| ||||||
|
| Excluding |
|
|
|
|
| Excluding |
|
|
|
|
| ||||||
|
| effects of |
| IFRS 15 |
| As currently |
| effects of |
| IFRS 15 |
| As currently |
| ||||||
|
| IFRS 15 |
| effects |
| reported |
| IFRS 15 |
| effects |
| reported |
| ||||||
Operating revenues |
|
|
|
|
|
|
|
|
|
|
|
|
|
|
|
|
|
|
|
Service |
| $ | 13,130 |
| $ | (1,248 | ) | $ | 11,882 |
| $ | 12,478 |
| $ | (1,146 | ) | $ | 11,332 |
|
Equipment |
|
| 792 |
|
| 1,421 |
|
| 2,213 |
|
| 724 |
|
| 1,249 |
|
| 1,973 |
|
Revenues arising from contracts with customers |
|
| 13,922 |
|
| 173 |
|
| 14,095 |
|
| 13,202 |
|
| 103 |
|
| 13,305 |
|
Other operating income1 |
|
| 273 |
|
| – |
|
| 273 |
|
| 103 |
|
| – |
|
| 103 |
|
|
|
| 14,195 |
|
| 173 |
|
| 14,368 |
|
| 13,305 |
|
| 103 |
|
| 13,408 |
|
Operating expenses |
|
|
|
|
|
|
|
|
|
|
|
|
|
|
|
|
|
|
|
Goods and services purchased |
|
| 6,388 |
|
| (20 | ) |
| 6,368 |
|
| 5,935 |
|
| (31 | ) |
| 5,904 |
|
Employee benefits expense |
|
| 2,906 |
|
| (10 | ) |
| 2,896 |
|
| 2,595 |
|
| (1 | ) |
| 2,594 |
|
Depreciation |
|
| 1,669 |
|
| – |
|
| 1,669 |
|
| 1,617 |
|
| – |
|
| 1,617 |
|
Amortization of intangible assets |
|
| 598 |
|
| – |
|
| 598 |
|
| 552 |
|
| – |
|
| 552 |
|
|
|
| 11,561 |
|
| (30 | ) |
| 11,531 |
|
| 10,699 |
|
| (32 | ) |
| 10,667 |
|
Operating income |
|
| 2,634 |
|
| 203 |
|
| 2,837 |
|
| 2,606 |
|
| 135 |
|
| 2,741 |
|
Financing costs |
|
| 661 |
|
| – |
|
| 661 |
|
| 573 |
|
| – |
|
| 573 |
|
Income before income taxes |
|
| 1,973 |
|
| 203 |
|
| 2,176 |
|
| 2,033 |
|
| 135 |
|
| 2,168 |
|
Income taxes |
|
| 497 |
|
| 55 |
|
| 552 |
|
| 553 |
|
| 37 |
|
| 590 |
|
Net income |
|
| 1,476 |
|
| 148 |
|
| 1,624 |
|
| 1,480 |
|
| 98 |
|
| 1,578 |
|
Other comprehensive income1 |
|
| 284 |
|
| – |
|
| 284 |
|
| (160 | ) |
| – |
|
| (160 | ) |
Comprehensive income1 |
| $ | 1,760 |
| $ | 148 |
| $ | 1,908 |
| $ | 1,320 |
| $ | 98 |
| $ | 1,418 |
|
Net income attributable to: |
|
|
|
|
|
|
|
|
|
|
|
|
|
|
|
|
|
|
|
Common Shares |
| $ | 1,452 |
| $ | 148 |
| $ | 1,600 |
| $ | 1,461 |
| $ | 98 |
| $ | 1,559 |
|
Non-controlling interests |
|
| 24 |
|
| – |
|
| 24 |
|
| 19 |
|
| – |
|
| 19 |
|
|
| $ | 1,476 |
| $ | 148 |
| $ | 1,624 |
| $ | 1,480 |
| $ | 98 |
| $ | 1,578 |
|
Comprehensive income attributable to: |
|
|
|
|
|
|
|
|
|
|
|
|
|
|
|
|
|
|
|
Common Shares |
| $ | 1,750 |
| $ | 148 |
| $ | 1,898 |
| $ | 1,297 |
| $ | 98 |
| $ | 1,395 |
|
Non-controlling interests |
|
| 10 |
|
| – |
|
| 10 |
|
| 23 |
|
| – |
|
| 23 |
|
|
| $ | 1,760 |
| $ | 148 |
| $ | 1,908 |
| $ | 1,320 |
| $ | 98 |
| $ | 1,418 |
|
Net income per Common Share |
|
|
|
|
|
|
|
|
|
|
|
|
|
|
|
|
|
|
|
Basic |
| $ | 2.43 |
| $ | 0.25 |
| $ | 2.68 |
| $ | 2.46 |
| $ | 0.17 |
| $ | 2.63 |
|
Diluted |
| $ | 2.43 |
| $ | 0.25 |
| $ | 2.68 |
| $ | 2.46 |
| $ | 0.17 |
| $ | 2.63 |
|
1 For the year ended December 31, 2017, other operating income and the change in measurement of investment financial assets included within other comprehensive income increased and decreased, respectively, by $1 arising from the designation of financial assets as being accounted for either at fair value through net income or at fair value through other comprehensive income. Such designation of financial assets is required due to the retrospective implementation of IFRS 9, Financial Instruments.
136 · TELUS 2018 ANNUAL REPORT
CONSOLIDATED FINANCIAL STATEMENTS: NOTE 2
The effects of the transition to IFRS 15 on the line items in the preceding table are set out below:
| Amount of IFRS 15 effect (increase (decrease) in millions except per share amounts) |
| |||||||||||||||||||
| Allocation of transaction price (affecting timing of revenue recognition) |
| |||||||||||||||||||
|
|
|
|
|
| Costs incurred to obtain or fulfill a contract with a customer |
| ||||||||||||||
|
|
|
|
|
|
|
|
|
|
| Total |
| |||||||||
Years ended December 31 |
| 2018 |
| 2017 |
|
| 2018 |
| 2017 |
|
| 2018 |
|
| 2017 |
| |||||
Operating revenues |
|
|
|
|
|
|
|
|
|
|
|
|
|
|
|
| |||||
Service |
| $ | (1,248 | ) | $ | (1,146 | ) |
| $ | – |
| $ | – |
|
| $ | (1,248 | ) | $ | (1,146 | ) |
Equipment |
| $ | 1,421 |
| $ | 1,249 |
|
| $ | – |
| $ | – |
|
| $ | 1,421 |
| $ | 1,249 |
|
Goods and services purchased |
| $ | – |
| $ | 5 |
|
| $ | (20 | ) | $ | (36 | ) |
| $ | (20 | ) | $ | (31 | ) |
Employee benefits expense |
| $ | – |
| $ | – |
|
| $ | (10 | ) | $ | (1 | ) |
| $ | (10 | ) | $ | (1 | ) |
Income taxes |
| $ | 47 |
| $ | 27 |
|
| $ | 8 |
| $ | 10 |
|
| $ | 55 |
| $ | 37 |
|
Net income attributable to: |
|
|
|
|
|
|
|
|
|
|
|
|
|
|
|
| |||||
Common Shares |
| $ | 126 |
| $ | 71 |
|
| $ | 22 |
| $ | 27 |
|
| $ | 148 |
| $ | 98 |
|
Net income per Common Share |
|
|
|
|
|
|
|
|
|
|
|
|
|
|
|
| |||||
Basic |
| $ | 0.21 |
| $ | 0.12 |
|
| $ | 0.04 |
| $ | 0.05 |
|
| $ | 0.25 |
| $ | 0.17 |
|
Diluted |
| $ | 0.21 |
| $ | 0.12 |
|
| $ | 0.04 |
| $ | 0.05 |
|
| $ | 0.25 |
| $ | 0.17 |
|
|
|
|
|
|
| Previously, costs incurred to obtain or fulfill a contract with a customer were expensed as incurred. The new standard requires that such costs be capitalized and subsequently recognized as an expense over the life of the contract on a rational, systematic basis consistent with the pattern of the transfer of goods or services to which the asset relates. This has the effect of reducing the costs recognized in the period arising from contracts with customers entered into during the period, offset by the amortization of capitalized costs arising from contracts with customers entered into in previous periods. |
| ||||||||||||||
| Previously, a “limitation cap” constrained the recognition of revenue in a multiple element arrangement to an amount that was not contingent upon either delivering additional items or meeting other specified performance conditions. The new standard requires that amounts contingently billable and collectible in the future be recognized currently as revenue to the extent we have currently satisfied our performance obligations to the customer; this is the new standard’s most significant effect on us. For a contract with a customer, this has the effect of allocating more of the consideration to equipment revenue, which is recognized at the inception of the contract, and less to future service revenue. |
| |||||||||||||||||||
TELUS 2018 ANNUAL REPORT · 137
IFRS 15, Revenue from Contracts with Customers, affected our Consolidated statements of financial position as follows:
As at (millions) |
|
|
| December 31, 2018 |
|
|
|
| December 31, 20171 |
|
|
|
| January 1, 2017 | |||||||||||||||
| Excluding |
|
|
|
|
|
| Excluding |
|
|
|
|
|
| Excluding |
|
|
|
| ||||||||||
|
| effects of |
| IFRS 15 | As currently |
|
| effects of |
| IFRS 15 | As currently |
|
| effects of |
| IFRS 15 | As currently | ||||||||||||
|
| IFRS 15 |
| effects |
| reported |
|
| IFRS 15 |
| effects |
| reported |
|
| IFRS 15 |
| effects |
| reported | |||||||||
Assets |
|
|
|
|
|
|
|
|
|
|
|
|
|
|
|
|
|
|
|
| |||||||||
Current assets |
|
|
|
|
|
|
|
|
|
|
|
|
|
|
|
|
|
|
|
| |||||||||
Cash and temporary investments, net |
| $ | 414 |
| $ | – |
| $ | 414 |
|
| $ | 509 |
| $ | – |
| $ | 509 |
|
| $ | 432 |
| $ | – |
| $ | 432 |
Accounts receivable |
| 1,609 |
| (9 | ) | 1,600 |
|
| 1,623 |
| (9 | ) | 1,614 |
|
| 1,471 |
| (9 | ) | 1,462 | |||||||||
Income and other taxes receivable |
| 3 |
| – |
| 3 |
|
| 96 |
| – |
| 96 |
|
| 9 |
| – |
| 9 | |||||||||
Inventories |
| 374 |
| 2 |
| 376 |
|
| 378 |
| 2 |
| 380 |
|
| 318 |
| 2 |
| 320 | |||||||||
Contract assets |
| – |
| 860 |
| 860 |
|
| – |
| 757 |
| 757 |
|
| – |
| 700 |
| 700 | |||||||||
Prepaid expenses |
| 278 |
| 261 |
| 539 |
|
| 260 |
| 233 |
| 493 |
|
| 233 |
| 210 |
| 443 | |||||||||
Current derivative assets |
| 49 |
| – |
| 49 |
|
| 18 |
| – |
| 18 |
|
| 11 |
| – |
| 11 | |||||||||
|
| 2,727 |
| 1,114 |
| 3,841 |
|
| 2,884 |
| 983 |
| 3,867 |
|
| 2,474 |
| 903 |
| 3,377 | |||||||||
Non-current assets |
|
|
|
|
|
|
|
|
|
|
|
|
|
|
|
|
|
|
|
| |||||||||
Property, plant and equipment, net |
| 12,091 |
| – |
| 12,091 |
|
| 11,368 |
| – |
| 11,368 |
|
| 10,464 |
| – |
| 10,464 | |||||||||
Intangible assets, net |
| 10,956 |
| – |
| 10,956 |
|
| 10,658 |
| – |
| 10,658 |
|
| 10,364 |
| – |
| 10,364 | |||||||||
Goodwill, net |
| 4,733 |
| – |
| 4,733 |
|
| 4,236 |
| – |
| 4,236 |
|
| 3,787 |
| – |
| 3,787 | |||||||||
Contract assets |
| – |
| 458 |
| 458 |
|
| – |
| 396 |
| 396 |
|
| – |
| 352 |
| 352 | |||||||||
Other long-term assets |
| 876 |
| 110 |
| 986 |
|
| 421 |
| 107 |
| 528 |
|
| 640 |
| 93 |
| 733 | |||||||||
|
| 28,656 |
| 568 |
| 29,224 |
|
| 26,683 |
| 503 |
| 27,186 |
|
| 25,255 |
| 445 |
| 25,700 | |||||||||
|
| $ | 31,383 |
| $ | 1,682 |
| $ | 33,065 |
|
| $ | 29,567 |
| $ | 1,486 |
| $ | 31,053 |
|
| $ | 27,729 |
| $ | 1,348 |
| $ | 29,077 |
Liabilities and Owners’ Equity |
|
|
|
|
|
|
|
|
|
|
|
|
|
|
|
|
|
|
|
| |||||||||
Current liabilities |
|
|
|
|
|
|
|
|
|
|
|
|
|
|
|
|
|
|
|
| |||||||||
Short-term borrowings |
| $ | 100 |
| $ | – |
| $ | 100 |
|
| $ | 100 |
| $ | – |
| $ | 100 |
|
| $ | 100 |
| $ | – |
| $ | 100 |
Accounts payable and accrued liabilities |
| 2,570 |
| – |
| 2,570 |
|
| 2,460 |
| – |
| 2,460 |
|
| 2,330 |
| – |
| 2,330 | |||||||||
Income and other taxes payable |
| 218 |
| – |
| 218 |
|
| 34 |
| – |
| 34 |
|
| 37 |
| – |
| 37 | |||||||||
Dividends payable |
| 326 |
| – |
| 326 |
|
| 299 |
| – |
| 299 |
|
| 284 |
| – |
| 284 | |||||||||
Advance billings and customer deposits |
| 810 |
| (157 | ) | 653 |
|
| 782 |
| (150 | ) | 632 |
|
| 737 |
| (153 | ) | 584 | |||||||||
Provisions |
| 129 |
| – |
| 129 |
|
| 78 |
| – |
| 78 |
|
| 124 |
| – |
| 124 | |||||||||
Current maturities of long-term debt |
| 836 |
| – |
| 836 |
|
| 1,404 |
| – |
| 1,404 |
|
| 1,327 |
| – |
| 1,327 | |||||||||
Current derivative liabilities |
| 9 |
| – |
| 9 |
|
| 33 |
| – |
| 33 |
|
| 12 |
| – |
| 12 | |||||||||
|
| 4,998 |
| (157 | ) | 4,841 |
|
| 5,190 |
| (150 | ) | 5,040 |
|
| 4,951 |
| (153 | ) | 4,798 | |||||||||
Non-current liabilities |
|
|
|
|
|
|
|
|
|
|
|
|
|
|
|
|
|
|
|
| |||||||||
Provisions |
| 728 |
| – |
| 728 |
|
| 511 |
| – |
| 511 |
|
| 395 |
| – |
| 395 | |||||||||
Long-term debt |
| 13,265 |
| – |
| 13,265 |
|
| 12,256 |
| – |
| 12,256 |
|
| 11,604 |
| – |
| 11,604 | |||||||||
Other long-term liabilities |
| 738 |
| – |
| 738 |
|
| 847 |
| – |
| 847 |
|
| 736 |
| – |
| 736 | |||||||||
Deferred income taxes |
| 2,656 |
| 496 |
| 3,152 |
|
| 2,500 |
| 441 |
| 2,941 |
|
| 2,107 |
| 404 |
| 2,511 | |||||||||
|
| 17,387 |
| 496 |
| 17,883 |
|
| 16,114 |
| 441 |
| 16,555 |
|
| 14,842 |
| 404 |
| 15,246 | |||||||||
Liabilities |
| 22,385 |
| 339 |
| 22,724 |
|
| 21,304 |
| 291 |
| 21,595 |
|
| 19,793 |
| 251 |
| 20,044 | |||||||||
Owners’ equity |
|
|
|
|
|
|
|
|
|
|
|
|
|
|
|
|
|
|
|
| |||||||||
Common equity |
| 8,916 |
| 1,343 |
| 10,259 |
|
| 8,221 |
| 1,195 |
| 9,416 |
|
| 7,917 |
| 1,097 |
| 9,014 | |||||||||
Non-controlling interests |
| 82 |
| – |
| 82 |
|
| 42 |
| – |
| 42 |
|
| 19 |
| – |
| 19 | |||||||||
|
| 8,998 |
| 1,343 |
| 10,341 |
|
| 8,263 |
| 1,195 |
| 9,458 |
|
| 7,936 |
| 1,097 |
| 9,033 | |||||||||
|
| $ | 31,383 |
| $ | 1,682 |
| $ | 33,065 |
|
| $ | 29,567 |
| $ | 1,486 |
| $ | 31,053 |
|
| $ | 27,729 |
| $ | 1,348 |
| $ | 29,077 |
1 Goodwill and non-current provisions have been adjusted as set out in Note 18(c).
138 · TELUS 2018 ANNUAL REPORT
CONSOLIDATED FINANCIAL STATEMENTS: NOTE 2
The effects of the transition to IFRS 15 on the line items in the preceding table are set out below:
| Amount of IFRS 15 effect (increase (decrease) in millions) |
| ||||||||||||||||||||||||||||
| Allocation of transaction price (affecting timing of revenue recognition) |
| ||||||||||||||||||||||||||||
|
|
|
|
|
|
|
| Costs incurred to obtain or fulfill a contract with a customer |
| |||||||||||||||||||||
|
|
| Total |
| ||||||||||||||||||||||||||
As at | Dec. 31, | Dec. 31, | Jan. 1, |
| Dec. 31, | Dec. 31, | Jan. 1, |
| Dec. 31, | Dec. 31, |
| Jan. 1, |
| |||||||||||||||||
Current assets |
|
|
|
|
|
|
|
|
|
|
|
|
|
|
|
|
|
|
|
|
| |||||||||
Accounts receivable |
| $ | (9 | ) | $ | (9 | ) | $ | (9 | ) |
| $ | – |
| $ | – |
| $ | – |
|
| $ | (9 | ) | $ | (9 | ) | $ | (9 | ) |
Inventories |
| $ | 2 |
| $ | 2 |
| $ | 2 |
|
| $ | – |
| $ | – |
| $ | – |
|
| $ | 2 |
| $ | 2 |
| $ | 2 |
|
Contract assets, net |
| $ | 860 |
| $ | 757 |
| $ | 700 |
|
| $ | – |
| $ | – |
| $ | – |
|
| $ | 860 |
| $ | 757 |
| $ | 700 |
|
Prepaid expenses and other |
| $ | – |
| $ | – |
| $ | – |
|
| $ | 261 |
| $ | 233 |
| $ | 210 |
|
| $ | 261 |
| $ | 233 |
| $ | 210 |
|
Non-current assets |
|
|
|
|
|
|
|
|
|
|
|
|
|
|
|
|
|
|
|
|
| |||||||||
Contract assets, net |
| $ | 458 |
| $ | 396 |
| $ | 352 |
|
| $ | – |
| $ | – |
| $ | – |
|
| $ | 458 |
| $ | 396 |
| $ | 352 |
|
Other long-term assets |
| $ | – |
| $ | – |
| $ | – |
|
| $ | 110 |
| $ | 107 |
| $ | 93 |
|
| $ | 110 |
| $ | 107 |
| $ | 93 |
|
Advance billings and customer deposits |
| $ | (157 | ) | $ | (150 | ) | $ | (153 | ) |
| $ | – |
| $ | – |
| $ | – |
|
| $ | (157 | ) | $ | (150 | ) | $ | (153 | ) |
Deferred income taxes |
| $ | 396 |
| $ | 349 |
| $ | 322 |
|
| $ | 100 |
| $ | 92 |
| $ | 82 |
|
| $ | 496 |
| $ | 441 |
| $ | 404 |
|
Retained earnings |
| $ | 1,072 |
| $ | 947 |
| $ | 876 |
|
| $ | 271 |
| $ | 248 |
| $ | 221 |
|
| $ | 1,343 |
| $ | 1,195 |
| $ | 1,097 |
|
|
|
|
|
|
|
|
| Previously, costs incurred to obtain or fulfill a contract with a customer were expensed as incurred. The new standard requires that such costs be capitalized and subsequently recognized as an expense over the life of the contract on a rational, systematic basis consistent with the pattern of the transfer of goods or services to which the asset relates. Increases in the amount of costs capitalized in the period arising from contracts with customers entered into during the period are offset by the amortization of capitalized costs arising from contracts with customers entered into in previous periods. |
| |||||||||||||||||||||
| Previously, a “limitation cap” constrained the recognition of revenue in a multiple element arrangement to an amount that was not contingent upon either delivering additional items or meeting other specified performance conditions. The new standard requires that amounts contingently billable and collectible in the future be recognized currently as revenue to the extent we have currently satisfied our performance obligations to the customer; this is the new standard’s most significant effect on us. The difference between the revenue recognized currently and the amount currently collected/collectible is recognized on the statement of financial position as a contract asset. The contract asset recorded at January 1, 2017, represents revenues that will not be, and have not been, reflected at any time in our periodic results of operations, but would have been if not for the transition to the new standard; the effect of this “pulling forward” of revenues is expected to be somewhat muted by the composite ongoing inception, maturation and expiration of millions of multi-year contracts with our customers. |
| ||||||||||||||||||||||||||||
TELUS 2018 ANNUAL REPORT · 139
IFRS 15, Revenue from Contracts with Customers, affected our Consolidated statements of cash flows as follows:
Years ended December 31 (millions) |
|
| 2018 |
|
| 2017 |
|
| Excluding |
|
| Excluding |
|
|
|
| effects of | IFRS 15 | As currently | effects of | IFRS 15 | As currently |
|
| IFRS 15 | effects | reported | IFRS 15 | effects | reported |
|
Operating Activities |
|
|
|
|
|
|
|
Net income1 | $ 1,476 | $ 148 | $ 1,624 | $ 1,480 | $ 98 | $ 1,578 |
|
Adjustments to reconcile net income to cash provided by operating activities: |
|
|
|
|
|
|
|
Depreciation and amortization | 2,267 | – | 2,267 | 2,169 | – | 2,169 |
|
Deferred income taxes | 19 | 55 | 74 | 430 | 37 | 467 |
|
Share-based compensation expense, net | 6 | – | 6 | 17 | – | 17 |
|
Net employee defined benefit plans expense | 95 | – | 95 | 82 | – | 82 |
|
Employer contributions to employee defined benefit plans | (53) | – | (53) | (67) | – | (67 | ) |
Non-current contract assets | – | (62) | (62) | – | (44) | (44 | ) |
Income from equity accounted investments | (170) | – | (170) | (4) | – | (4 | ) |
Shares settled from Treasury | 100 | – | 100 | – | – | – |
|
Other1 | (76) | (3) | (79) | (18) | (14) | (32 | ) |
Net change in non-cash operating working capital | 394 | (138) | 256 | (142) | (77) | (219 | ) |
Cash provided by operating activities | $ 4,058 | $ – | $ 4,058 | $ 3,947 | $ – | $ 3,947 |
|
1 For the year ended December 31, 2017, net income and other increased and decreased, respectively, by $1 arising from the designation of financial assets as being accounted for either at fair value through net income or at fair value through other comprehensive income. Such designation of financial assets is required due to the retrospective implementation of IFRS 9, Financial Instruments.
|
|
3 | Capital structure financial policies |
|
|
General
Our objective when managing capital is to maintain a flexible capital structure that optimizes the cost and availability of capital at acceptable risk.
In the management of capital and in its definition, we include common equity (excluding accumulated other comprehensive income), long-term debt (including long-term credit facilities, commercial paper backstopped by long-term credit facilities and any hedging assets or liabilities associated with long-term debt items, net of amounts recognized in accumulated other comprehensive income), cash and temporary Investments, and short-term borrowings arising from securitized trade receivables.
We manage our capital structure and make adjustments to it in light of changes in economic conditions and the risk characteristics of our
business. In order to maintain or adjust our capital structure, we may adjust the amount of dividends paid to holders of Common Shares, purchase Common Shares for cancellation pursuant to normal course issuer bids, issue new shares, issue new debt, issue new debt to replace existing debt with different characteristics and/or increase or decrease the amount of trade receivables sold to an arm’s-length securitization trust.
During 2018, our financial objectives, which are reviewed annually, were unchanged from 2017. We believe that our financial objectives are supportive of our long-term strategy.
We monitor capital utilizing a number of measures, including: net debt to earnings before interest, income taxes, depreciation and amortization (EBITDA*) – excluding restructuring and other costs ratio; coverage ratios; and dividend payout ratios.
*EBITDA does not have any standardized meaning prescribed by IFRS-IASB and is therefore unlikely to be comparable to similar measures presented by other issuers; we define EBITDA as operating revenues less goods and services purchased and employee benefits expense. We have issued guidance on, and report, EBITDA because it is a key measure that management uses to evaluate the performance of our business, and it is also utilized in measuring compliance with certain debt covenants.
140 · TELUS 2018 ANNUAL REPORT
CONSOLIDATED FINANCIAL STATEMENTS: NOTE 3
Debt and coverage ratios
Net debt to EBITDA – excluding restructuring and other costs is calculated as net debt at the end of the period, divided by 12-month trailing EBITDA – excluding restructuring and other costs. This measure, historically, is substantially similar to the leverage ratio covenant in our credit facilities. Net debt and EBITDA – excluding restructuring
and other costs are measures that do not have any standardized meanings prescribed by IFRS-IASB and are therefore unlikely to be comparable to similar measures presented by other companies. The calculation of these measures is set out in the following table. Net debt is one component of a ratio used to determine compliance with debt covenants.
As at, or for the 12-month periods ended, December 31 ($ in millions) | Objective | 2018 | 2017 | ||
Components of debt and coverage ratios |
|
|
| ||
Net debt1 |
| $ | 13,770 | $ | 13,422 |
EBITDA – excluding restructuring and other costs2 |
| $ | 5,421 | $ | 5,027 |
Net interest cost3 |
| $ | 644 | $ | 567 |
Debt ratio |
|
|
| ||
Net debt to EBITDA – excluding restructuring and other costs | 2.00–2.504 | 2.54 | 2.67 | ||
Coverage ratios |
|
|
| ||
Earnings coverage5 |
| 4.4 | 4.8 | ||
EBITDA – excluding restructuring and other costs interest coverage6 |
| 8.4 | 8.9 | ||
1 Net debt is calculated as follows:
As at December 31 |
| Note |
| 2018 |
| 2017 |
|
Long-term debt |
| 26 |
| $ 14,101 |
| $ 13,660 |
|
Debt issuance costs netted against long-term debt |
|
|
| 93 |
| 73 |
|
Derivative (assets) liabilities, net |
|
|
| (73 | ) | 93 |
|
Accumulated other comprehensive income amounts arising from financial instruments used to manage interest rate and currency risks associated with U.S. dollar-denominated long-term debt – excluding tax effects |
|
|
| (37 | ) | 5 |
|
Cash and temporary investments, net |
|
|
| (414 | ) | (509 | ) |
Short-term borrowings |
| 22 |
| 100 |
| 100 |
|
Net debt |
|
|
| $ 13,770 |
| $ 13,422 |
|
2 EBITDA – excluding restructuring and other costs is calculated as follows:
Years ended December 31 |
| Note |
| 2018 |
| 2017 |
|
|
|
|
|
|
| (adjusted – |
|
EBITDA |
| 5 |
| $ 5,104 |
| $ 4,910 |
|
Restructuring and other costs |
| 16 |
| 317 |
| 117 |
|
EBITDA – excluding restructuring and other costs |
|
|
| $ 5,421 |
| $ 5,027 |
|
3 Net interest cost is defined as financing costs, excluding employee defined benefit plans net interest, recoveries on long-term debt prepayment premium and repayment of debt, calculated on a 12-month trailing basis (expenses recorded for long-term debt prepayment premium, if any, are included in net interest cost).
4 Our long-term objective range for this ratio is 2.00–2.50 times. The ratio as at December 31, 2018, is outside the long-term objective range. We may permit, and have permitted, this ratio to go outside the objective range (for long-term investment opportunities), but we will endeavour to return this ratio to within the objective range in the medium term, as we believe that this range is supportive of our long-term strategy. We are in compliance with the leverage ratio covenant in our credit facilities, which states that we may not permit our net debt to operating cash flow ratio to exceed 4.00:1.00 (see Note 26(d)); the calculation of the debt ratio is substantially similar to the calculation of the leverage ratio covenant in our credit facilities.
5 Earnings coverage is defined as net income before borrowing costs and income tax expense, divided by borrowing costs (interest on long-term debt; interest on short-term borrowings and other; long-term debt prepayment premium), and adding back capitalized interest.
6 EBITDA – excluding restructuring and other costs interest coverage is defined as EBITDA – excluding restructuring and other costs, divided by net interest cost. This measure is substantially similar to the coverage ratio covenant in our credit facilities.
Net debt to EBITDA – excluding restructuring and other costs was 2.54 times as at December 31, 2018, down from 2.67 times one year earlier. The effect of the increase in net debt was exceeded by the effect of growth in EBITDA – excluding restructuring and other costs. The earnings coverage ratio for the twelve-month period ended December 31, 2018, was 4.4 times, down from 4.8 times one year earlier. Higher borrowing costs reduced the ratio by 0.6 and an increase in income before borrowing costs and income taxes increased the ratio by 0.1. The EBITDA – excluding restructuring and other costs interest coverage ratio for the twelve-month period ended December 31, 2018, was 8.4 times, down from 8.9 times one year earlier. Growth in EBITDA – excluding restructuring and other costs increased the ratio by 0.6, while an increase in net interest costs reduced the ratio by 1.1.
Dividend payout ratio
The dividend payout ratio presented is a historical measure calculated as the sum of the last four quarterly dividends declared per Common Share, as recorded in the financial statements, divided by the sum of basic earnings per share for the most recent four quarters for interim reporting periods (divided by annual basic earnings per share if the reported amount is in respect of a fiscal year). The dividend payout ratio of adjusted net earnings presented, also a historical measure, differs in that it excludes the gain on exchange of wireless spectrum licences net gains and equity income from real estate joint ventures, provisions related to business combinations, immediately vesting transformative compensation expense, long-term debt prepayment premium and income tax-related adjustments.
For the 12-rnonth periods ended |
| Objective |
| 2018 |
| 2017 |
| |
Dividend payout ratio |
| 65%–75%1 |
| 78% |
| 80% |
| |
Dividend payout ratio of adjusted net earnings |
|
|
| 81% |
| 80% |
| |
|
|
|
|
|
|
|
| |
1 | Our objective range for the dividend payout ratio is 65%–75% of sustainable earnings on a prospective basis; we currently expect that we will be within our target guideline on a prospective basis within the medium term. Adjusted net earnings attributable to Common Shares is calculated as follows: |
| ||||||
|
|
|
|
|
|
|
|
|
| 12-rnonth periods ended December 31 |
|
|
| 2018 |
| 2017 |
|
|
|
|
|
|
| (adjusted – |
| |
| Net income attributable to Common Shares |
| $ 1,600 |
| $ 1,559 |
| ||
| Gain and net equity income related to real estate redevelopment project, after income taxes |
| (150 | ) | (1 | ) | ||
| Business combination-related provisions, after income taxes |
| (17 | ) | (22 | ) | ||
| Income tax-related adjustments |
| (7 | ) | 21 |
| ||
| Long-term debt prepayment premium, after income taxes |
| 25 |
| – |
| ||
| Initial and committed donation to TELUS Friendly Future Foundation, after income taxes |
| 90 |
| – |
| ||
| Adjusted net earnings attributable to Common Shares |
| $ 1,541 |
| $ 1,557 |
| ||
|
|
4 | Financial instruments |
|
|
(a) Risks – overview
Our financial instruments, their accounting classification and the nature of certain risks to which they may be subject are set out in the following table.
|
| Risks | ||||
| Accounting classification |
|
| Market risks | ||
Financial instrument | Credit | Liquidity | Currency | Interest rate | Other price | |
Measured at amortized cost |
|
|
|
|
|
|
Accounts receivable | AC1 | X |
| X |
|
|
Contract assets | AC1 | X |
|
|
|
|
Construction credit facilities advances to real estate joint venture | AC1 |
|
|
| X |
|
Short-term obligations | AC1 |
| X | X | X |
|
Accounts payable | AC1 |
| X | X |
|
|
Provisions (including restructuring accounts payable) | AC1 |
| X | X |
| X |
Long-term debt | AC1 |
| X | X | X |
|
Measured at fair value |
|
|
|
|
|
|
Cash and temporary investments | FVTPL2 | X |
| X | X |
|
Long-term investments (not subject to significant influence)3 | FVTPL/FVOCI3 |
|
| X |
| X |
Foreign exchange derivatives4 | FVTPL2 | X | X | X |
|
|
Share-based compensation derivatives4 | FVTPL2 | X | X |
|
| X |
1 For accounting recognition and measurement purposes, classified as amortized cost (AC).
2 For accounting recognition and measurement purposes, classified as fair value through net income (FVTPL). Unrealized changes in the fair values of financial instruments are included in net income unless the instrument is part of a cash flow hedging relationship. The effective portion of unrealized changes in the fair values of financial instruments held for hedging are included in other comprehensive income.
3 Long-term investments over which we do not have significant influence are measured at fair value if those fair values can be reliably measured. For accounting recognition and measurement purposes, on an investment-by-investment basis, long-term investments are classified as either fair value through net income or fair value through other comprehensive income (FVOCI).
4 Use of derivative financial instruments is subject to a policy which requires that no derivative transaction is to be entered into for the purpose of establishing a speculative or leveraged position (the corollary being that all derivative transactions are to be entered into for risk management purposes only) and sets criteria for the creditworthiness of the transaction counterparties.
Derivatives that are part of an established and documented cash flow hedging relationship are accounted for as held for hedging. We believe that classification as held for hedging results in a better matching of the change in the fair value of the derivative financial instrument with the risk exposure being hedged.
In respect of hedges of anticipated transactions, hedge gains/losses are included with the related expenditure and are expensed when the transaction is recognized in our results of operations. We have selected this method as we believe that it results in a better matching of the hedge gains/losses with the risk exposure being hedged.
Derivatives that are not part of a documented cash flow hedging relationship are accounted for as held for trading and thus are measured at fair value through net income.
142 · TELUS 2018 ANNUAL REPORT
CONSOLIDATED FINANCIAL STATEMENTS: NOTE 4
Derivative financial instruments
We apply hedge accounting to financial instruments used to establish hedge accounting relationships for U.S. dollar-denominated transactions and to fix the cost of some share-based compensation. We believe that our use of derivative financial instruments for hedging or arbitrage assists us in managing our financing costs and/or lessening the uncertainty associated with our financing or other business activities. Uncertainty
associated with currency risk and other price risk is lessened through our use of foreign exchange derivatives and share-based compensation derivatives that effectively swap floating currency exchange rates and share prices for fixed rates and prices. When entering into derivative financial instrument contracts, we seek to align the cash flow timing of the hedging items with that of the hedged items. The effects of this risk management strategy and its application are set out in (i) following.
(b) Credit risk
Excluding credit risk, if any, arising from currency swaps settled on a gross basis, the best representation of our maximum exposure (excluding income tax effects) to credit risk, which is a worst-case scenario and does not reflect results we expect, is set out in the following table:
As at (millions) | December 31, 2018 | December 31, 2017 | January 1, 2017 |
|
| (adjusted – Note 2(c)) | (Note 2(c)) |
Cash and temporary investments, net | $ 414 | $ 509 | $ 432 |
Accounts receivable | 1,600 | 1,614 | 1,462 |
Contract assets | 1,318 | 1,153 | 1,052 |
Derivative assets | 103 | 24 | 17 |
| $ 3,435 | $ 3,300 | $ 2,963 |
Cash and temporary investments, net
Credit risk associated with cash and temporary investments is managed by ensuring that these financial assets are placed with: governments; major financial institutions that have been accorded strong investment grade ratings by a primary rating agency; and/or other creditworthy counterparties. An ongoing review evaluates changes in the status of counterparties.
Accounts receivable
Credit risk associated with accounts receivable is inherently managed by the size and diversity of our large customer base, which includes substantially all consumer and business sectors in Canada. We follow
a program of credit evaluations of customers and limit the amount of credit extended when deemed necessary.
As at December 31, 2018, the weighted average age of customer accounts receivable was 30 days (December 31, 2017 – 26 days; January 1, 2017 – 26 days) and the weighted average age of past-due customer accounts receivable was 56 days (December 31, 2017 – 60 days; January 1, 2017 – 61 days). Accounts are considered to be past due (in default) when customers have failed to make the contractually required payments when due, which is generally within 30 days of the billing date. Any late payment charges are levied at an industry-based market or negotiated rate on outstanding non-current customer account balances.
As at (millions) |
| December 31, 2018 |
| December 31, 2017 |
| January 1, 2017 |
| ||||||||||||
|
| Gross |
| Allowance |
| Net | 1 | Gross |
| Allowance |
| Net | 1 | Gross |
| Allowance |
| Net | 1 |
|
|
|
|
|
|
|
|
|
|
|
| (adjusted – |
|
|
|
|
| (Note 2(c)) |
|
Customer accounts receivable, net of allowance for doubtful accounts |
|
|
|
|
|
|
|
|
|
|
|
|
|
|
|
|
|
|
|
Less than 30 days past billing date |
| $ 762 |
| $ (13 | ) | $ 749 |
| $ 905 |
| $ (10 | ) | $ 895 |
| $ 899 |
| $ (11 | ) | $ 888 |
|
30–60 days past billing date |
| 354 |
| (10 | ) | 344 |
| 185 |
| (8 | ) | 177 |
| 185 |
| (9 | ) | 176 |
|
61–90 days past billing date |
| 80 |
| (8 | ) | 72 |
| 60 |
| (8 | ) | 52 |
| 44 |
| (9 | ) | 35 |
|
More than 90 days past billing date |
| 67 |
| (22 | ) | 45 |
| 62 |
| (17 | ) | 45 |
| 80 |
| (25 | ) | 55 |
|
|
| $ 1,263 |
| $ (53 | ) | $ 1,210 |
| $ 1,212 |
| $ (43 | ) | $ 1,169 |
| $ 1,208 |
| $ (54 | ) | $ 1,154 |
|
1 Net amounts represent customer accounts receivable for which an allowance had not been made as at the dates of the Consolidated statements of financial position (see Note 6(b)).
We maintain allowances for lifetime expected credit losses related to doubtful accounts. Current economic conditions (including forward-looking macroeconomic data), historical information (including credit agency reports, if available), reasons for the accounts being past due and the line of business from which the customer accounts receivable arose are all considered when determining whether to make allowances for past-due accounts. The same factors are considered when determining whether to write off amounts charged to the allowance for doubtful accounts against the customer accounts receivable;
amounts charged to the customer accounts receivable allowance for doubtful accounts that were written off but were still subject to enforcement activity as at December 31, 2018, totalled $353 million (December 31, 2017 – $298 million; January 1, 2017 – $231 million). The doubtful accounts expense is calculated on a specific-identification basis for customer accounts receivable above a specific balance threshold and on a statistically derived allowance basis for the remainder. No customer accounts receivable are written off directly to the doubtful accounts expense.
The following table presents a summary of the activity related to our allowance for doubtful accounts.
Years ended December 31 (millions) |
| 2018 |
| 2017 |
|
Balance, beginning of period |
| $ 43 |
| $ 54 |
|
Additions (doubtful accounts expense) |
| 56 |
| 54 |
|
Accounts written off, net of recoveries |
| (55 | ) | (66 | ) |
Other |
| 9 |
| 1 |
|
Balance, end of period |
| $ 53 |
| $ 43 |
|
Contract assets
Credit risk associated with contract assets is inherently managed by the size and diversity of our large customer base, which includes substantially all consumer and business sectors in Canada. We follow a program of credit evaluations of customers and limit the amount of credit extended when deemed necessary.
As at (millions)
|
| December 31, 2018
|
| December 31, 2017
|
| January 1, 2017
| ||||||||||||
|
|
|
|
|
| Net |
|
|
|
|
| Net |
|
|
|
|
| Net |
|
| Gross |
| Allowance |
| (Note 6(c)) |
| Gross |
| Allowance |
| (Note 6(c)) |
| Gross |
| Allowance |
| (Note 6(c)) |
|
|
|
|
|
|
|
|
|
|
|
| (Note 2(c)) |
|
|
|
|
| (Note 2(c)) |
Contract assets, net of impairment allowance |
|
|
|
|
|
|
|
|
|
|
|
|
|
|
|
|
|
|
To be billed and thus reclassified to accounts receivable during: |
|
|
|
|
|
|
|
|
|
|
|
|
|
|
|
|
|
|
The 12-month period ending one year hence |
| $ 1,068 |
| $ (51 | ) | $ 1,017 |
| $ 958 |
| $ (51 | ) | $ 907 |
| $ 901 |
| $ (48 | ) | $ 853 |
The 12-month period ending two years hence |
| 466 |
| (22 | ) | 444 |
| 407 |
| (22 | ) | 385 |
| 359 |
| (21 | ) | 338 |
Thereafter |
| 15 |
| (1 | ) | 14 |
| 11 |
| – |
| 11 |
| 15 |
| (1 | ) | 14 |
|
| $ 1,549 |
| $ (74 | ) | $ 1,475 |
| $ 1,376 |
| $ (73 | ) | $ 1,303 |
| $ 1,275 |
| $ (70 | ) | $ 1,205 |
We maintain allowances for lifetime expected credit losses related to contract assets. Current economic conditions, historical information (including credit agency reports, if available), and the line of business from which the contract asset arose are all considered when determining impairment allowances. The same factors are considered when determining whether to write off amounts charged to the impairment allowance for contract assets against contract assets.
Derivative assets (and derivative liabilities)
Counterparties to our share-based compensation cash-settled equity forward agreements and foreign exchange derivatives are major financial institutions that have been accorded investment grade ratings by a primary credit rating agency. The total dollar amount of credit exposure under contracts with any one financial institution is limited and counter-parties’ credit ratings are monitored. We do not give or receive collateral on swap agreements and hedging items due to our credit rating and those of our counterparties. While we are exposed to the risk of potential credit losses due to the possible non-performance of our counterparties, we consider this risk remote. Our derivative liabilities do not have credit risk-related contingent features.
(c) Liquidity risk
As a component of our capital structure financial policies, discussed further in Note 3, we manage liquidity risk by:
· maintaining a daily cash pooling process that enables us to manage our available liquidity and our liquidity requirements according to our actual needs;
· maintaining an agreement to sell trade receivables to an arm’s-length securitization trust and bilateral bank facilities (Note 22), a commercial paper program (Note 26(c)) and syndicated credit facilities (Note 26(d),(e));
· maintaining an in-effect shelf prospectus;
· continuously monitoring forecast and actual cash flows; and
· managing maturity profiles of financial assets and financial liabilities.
Our debt maturities in future years are as disclosed in Note 26(g). As at December 31, 2018, we could offer $2.5 billion of debt or equity securities pursuant to a shelf prospectus that is in effect until June 2020 (2017 – $1.2 billion pursuant to a shelf prospectus that was in effect until April 2018). We believe that our investment grade credit ratings contribute to reasonable access to capital markets.
We closely match the contractual maturities of our derivative financial liabilities with those of the risk exposures they are being used to manage.
CONSOLIDATED FINANCIAL STATEMENTS: NOTE 4
The expected maturities of our undiscounted financial liabilities do not differ significantly from the contractual maturities, other than as noted below. The contractual maturities of our undiscounted financial liabilities, including interest thereon (where applicable), are set out in the following tables:
|
| Non-derivative |
| Derivative |
|
| ||||||||||||||||
|
|
|
|
|
|
|
| Composite long-term debt |
|
|
|
|
|
|
| |||||||
As at December 31, 2018 (millions)
|
| Non-interest bearing financial liabilities
|
| Short-term borrowings1
|
| Construction credit facilities commitment2 (Note 21)
|
| Long-term debt1 (Note 26)
|
| Finance leases1 (Note 26)
|
|
Currency swap agreement amounts to be exchanged3
|
|
|
| Currency swap agreement amounts to be exchanged
|
|
| ||||
(Receive
| )
| Pay
|
| Other
|
| (Receive
| )
| Pay
|
| Total
| ||||||||||||
2019 |
| $ 2,372 |
| $ 3 |
| $ 45 |
| $ 1,349 |
| $ 55 |
| $ (877 | ) | $ 851 |
| $ – |
| $ (542 | ) | $ 516 |
| $ 3,772 |
2020 |
| 251 |
| 3 |
| – |
| 1,567 |
| 51 |
| (95 | ) | 89 |
| 1 |
| – |
| – |
| 1,867 |
2021 |
| 102 |
| 103 |
| – |
| 1,567 |
| – |
| (95 | ) | 89 |
| – |
| – |
| – |
| 1,766 |
2022 |
| 18 |
| – |
| – |
| 2,086 |
| – |
| (95 | ) | 89 |
| 1 |
| – |
| – |
| 2,099 |
2023 |
| 19 |
| – |
| – |
| 886 |
| – |
| (95 | ) | 89 |
| – |
| – |
| – |
| 899 |
2024–2028 |
| 20 |
| – |
| – |
| 6,240 |
| – |
| (1,917 | ) | 1,847 |
| – |
| – |
| – |
| 6,190 |
Thereafter |
| – |
| – |
| – |
| 7,744 |
| – |
| (1,964 | ) | 1,832 |
| – |
| – |
| – |
| 7,612 |
Total |
| $ 2,782 |
| $ 109 |
| $ 45 |
| $ 21,439 |
| $ 106 |
| $ (5,138 | ) | $ 4,886 |
| $ 2 |
| $ (542 | ) | $ 516 |
| $ 24,205 |
|
|
|
|
|
|
|
| Total (Note 26(h)) |
|
|
| $ 21,293 |
|
|
|
|
|
|
|
| ||
1 Cash outflows in respect of interest payments on our short-term borrowings, commercial paper, finance leases and amounts drawn under our credit facilities (if any) have been calculated based upon the interest rates in effect as at December 31, 2018.
2 The drawdowns on the construction credit facilities are expected to occur as construction progresses through 2019.
3 The amounts included in undiscounted non-derivative long-term debt in respect of U.S. dollar-denominated long-term debt, and the corresponding amounts in the long-term debt currency swaps receive column, have been determined based upon the currency exchange rates in effect as at December 31, 2018. The hedged U.S. dollar-denominated long-term debt contractual amounts at maturity, in effect, are reflected in the long-term debt currency swaps pay column as gross cash flows are exchanged pursuant to the currency swap agreements.
|
| Non-derivative |
| Derivative |
| ||||||||
|
|
|
| Composite long-term debt |
|
|
|
|
| ||||
As at December 31, 2017 (millions) | Non-interest bearing financial liabilities | Short-term borrowings1 | Construction credit facilities commitment2 (Note 21) | Long-term debt1 (Note 26) |
| Currency swap |
|
| Currency swap |
| |||
| agreement amounts |
|
| agreement amounts |
| ||||||||
| to be exchanged3 |
|
| to be exchanged |
| ||||||||
| (Receive) | Pay |
|
| (Receive) | Pay | Total | ||||||
2018 | $ 2,232 | $ 103 | $ 67 | $ 1,928 |
| $ (1,188) | $ 1,206 |
|
| $ (545) | $ 557 | $ 4,360 | |
2019 | 40 | – | – | 1,531 |
| (44) | 46 |
|
| – | – | 1,573 | |
2020 | 19 | – | – | 1,480 |
| (44) | 46 |
|
| – | – | 1,501 | |
2021 | 95 | – | – | 1,480 |
| (44) | 46 |
|
| – | – | 1,577 | |
2022 | 18 | – | – | 1,913 |
| (44) | 46 |
|
| – | – | 1,933 | |
2023–2027 | 16 | – | – | 5,796 |
| (1,591) | 1,679 |
|
| – | – | 5,900 | |
Thereafter | – | – | – | 5,634 |
| – | – |
|
| – | – | 5,634 | |
Total | $ 2,420 | $ 103 | $ 67 | $ 19,762 |
| $ (2,955) | $ 3,069 |
|
| $ (545) | $ 557 | $ 22,478 | |
|
|
|
| Total | $ 19,876 |
|
|
|
|
| |||
1 Cash outflows in respect of interest payments on our short-term borrowings, commercial paper and amounts drawn under our credit facilities (if any) have been calculated based upon the interest rates in effect as at December 31, 2017.
2 The drawdowns on the construction credit facilities were expected to occur as construction progresses through 2019.
3 The amounts included in undiscounted non-derivative long-term debt in respect of U.S. dollar-denominated long-term debt, and the corresponding amounts in the long-term debt currency swaps receive column, have been determined based upon the currency exchange rates in effect as at December 31, 2017. The hedged U.S. dollar-denominated long-term debt contractual amounts at maturity, in effect, are reflected in the long-term debt currency swaps pay column as gross cash flows are exchanged pursuant to the currency swap agreements.
TELUS 2018 ANNUAL REPORT · 145
(d) Currency risk
Our functional currency is the Canadian dollar, but certain routine revenues and operating costs are denominated in U.S. dollars and some inventory purchases and capital asset acquisitions are sourced internationally. The U.S. dollar is the only foreign currency to which we have a significant exposure.
Our foreign exchange risk management includes the use of foreign currency forward contracts and currency options to fix the exchange rates on a varying percentage, typically in the range of 50% to 75%, of our domestic short-term U.S. dollar-denominated transactions and commitments and all U.S. dollar-denominated commercial paper. Other than in respect of U.S. dollar-denominated commercial paper, we designate only the spot element of these instruments as the hedging item; the forward element is wholly immaterial; in respect of U.S. dollar-denominated commercial paper, we designate the forward rate.
As discussed further in Note 26(b) and Note 26(f), we are also exposed to currency risk in that the fair value or future cash flows of our U.S. Dollar Notes and our TELUS International (Cda) Inc. credit facility U.S. dollar borrowings could fluctuate because of changes in foreign exchange rates. Currency hedging relationships have been established for the related semi-annual interest payments and the principal payment at maturity in respect of the U.S. Dollar Notes; we designate only the spot element of these instruments as the hedging item; the forward element is wholly immaterial. As the functional currency of our TELUS International (Cda) Inc. subsidiary is the U.S. dollar, fluctuations in foreign exchange rates affecting its borrowings are reflected as a foreign currency translation adjustment within other comprehensive income.
(e) Interest rate risk
Changes in market interest rates will cause fluctuations in the fair values or future cash flows of temporary investments, construction credit facility advances made to the real estate joint venture, short-term obligations, long-term debt and interest rate swap derivatives.
When we have temporary investments, they have short maturities and fixed interest rates and as a result, their fair values will fluctuate with changes in market interest rates; absent monetization prior to maturity, the related future cash flows will not change due to changes in market interest rates.
If the balance of short-term investments includes dividend-paying equity instruments, we could be exposed to interest rate risk.
Due to the short-term nature of the applicable rates of interest charged, the fair value of the construction credit facility advances made to the real estate joint venture is not materially affected by changes in market interest rates; the associated cash flows representing interest payments will be affected until such advances are repaid.
As short-term obligations arising from bilateral bank facilities, which typically have variable interest rates, are rarely outstanding for periods that exceed one calendar week, interest rate risk associated with this item is not material.
Short-term borrowings arising from the sales of trade receivables to an arm’s-length securitization trust are fixed-rate debt. Due to the short maturities of these borrowings, interest rate risk associated with this item is not material.
All of our currently outstanding long-term debt, other than commercial paper and amounts drawn on our credit facilities (Note 26(c), (e)), is fixed-rate debt. The fair value of fixed-rate debt fluctuates with changes in market interest rates; absent early redemption, the related future cash flows will not change. Due to the short maturities of commercial paper, its fair value is not materially affected by changes in market interest rates, but the associated cash flows representing interest payments may be affected if the commercial paper is rolled over.
Amounts drawn on our short-term and long-term credit facilities will be affected by changes in market interest rates in a manner similar to commercial paper.
(f) Other price risk
Long-term investments
We are exposed to equity price risk arising from investments classified as fair value through other comprehensive income. Such investments are held for strategic rather than trading purposes.
Share-based compensation derivatives
We are exposed to other price risk arising from cash-settled share-based compensation (appreciating Common Share prices increase both the expense and the potential cash outflow). Certain cash-settled equity swap agreements have been entered into that fix the cost associated with our estimate of TELUS Corporation restricted stock units which are expected to vest and are not subject to performance conditions (Note 14(b)).
(g) Market risks
Net income and other comprehensive income for the years ended December 31, 2018 and 2017, could have varied if the Canadian dollar: U.S. dollar exchange rate and our Common Share price varied by reasonably possible amounts from their actual statement of financial position date amounts.
The sensitivity analysis of our exposure to currency risk at the reporting date has been determined based upon a hypothetical change taking place at the relevant statement of financial position date. The U.S. dollar-denominated balances and derivative financial instrument notional amounts as at the statement of financial position dates have been used in the calculations.
The sensitivity analysis of our exposure to other price risk arising from share-based compensation at the reporting date has been determined based upon a hypothetical change taking place at the relevant statement of financial position date. The relevant notional number of Common Shares at the statement of financial position date, which includes those in the cash-settled equity swap agreements, has been used in the calculations.
Income tax expense, which is reflected net in the sensitivity analysis, reflects the applicable statutory income tax rates for the reporting periods.
CONSOLIDATED FINANCIAL STATEMENTS: NOTE 4
Years ended December 31 (increase (decrease) in millions) |
| Net income |
| Other comprehensive income |
| Comprehensive income | ||||||
| 2018 |
| 2017 |
| 2018 |
| 2017 |
| 2018 |
| 2017 | |
Reasonably possible changes in market risks1 |
|
|
|
|
|
|
|
|
|
|
|
|
10% change in C$: US$ exchange rate |
|
|
|
|
|
|
|
|
|
|
|
|
Canadian dollar appreciates |
| $ (1 | ) | $ (1 | ) | $ (33 | ) | $ (15 | ) | $ (34 | ) | $ (16) |
Canadian dollar depreciates |
| $ 1 |
| $ 1 |
| $ 33 |
| $ 15 |
| $ 34 |
| $ 16 |
25 basis point change in interest rates |
|
|
|
|
|
|
|
|
|
|
|
|
Interest rates increase |
| $ (2 | ) | $ (3 | ) | $ 2 |
| $ 1 |
| $ – |
| $ (2) |
Interest rates decrease |
| $ 2 |
| $ 3 |
| $ (1 | ) | $ – |
| $ 1 |
| $ 3 |
25%2 change in Common Share price3 |
|
|
|
|
|
|
|
|
|
|
|
|
Price increases |
| $ – |
| $ (8 | ) | $ (1 | ) | $ 13 |
| $ (1 | ) | $ 5 |
Price decreases |
| $ 5 |
| $ 14 |
| $ 1 |
| $ (13 | ) | $ 6 |
| $ 1 |
1 These sensitivities are hypothetical and should be used with caution. Changes in net income and/or other comprehensive income generally cannot be extrapolated because the relationship of the change in assumption to the change in net income and/or other comprehensive income may not be linear. In this table, the effect of a variation in a particular assumption on the amount of net income and/or other comprehensive income is calculated without changing any other factors; in reality, changes in one factor may result in changes in another, which might magnify or counteract the sensitivities.
The sensitivity analysis assumes that we would realize the changes in exchange rates; in reality, the competitive marketplace in which we operate would have an effect on this assumption.
No consideration has been made for a difference in the notional number of Common Shares associated with share-based compensation awards made during the reporting period that may have arisen due to a difference in the Common Share price.
2 To facilitate ongoing comparison of sensitivities, a constant variance of approximate magnitude has been used. Reflecting a 12-month data period and calculated on a monthly basis, the volatility of our Common Share price as at December 31, 2018, was 10.9% (2017 – 70%).
3 The hypothetical effects of changes in the price of our Common Shares are restricted to those which would arise from our share-based compensation awards that are accounted for as liability instruments and the associated cash-settled equity swap agreements.
(h) Fair values
General
The carrying values of cash and temporary investments, accounts receivable, short-term obligations, short-term borrowings, accounts payable and certain provisions (including restructuring provisions) approximate their fair values due to the immediate or short-term maturity of these financial instruments. The fair values are determined directly by reference to quoted market prices in active markets.
The fair values of our investment financial assets are based on quoted market prices in active markets or other clear and objective evidence of fair value.
The fair value of our long-term debt is based on quoted market prices in active markets.
The fair values of the derivative financial instruments we use to manage our exposure to currency risk are estimated based on quoted market prices in active markets for the same or similar financial instruments or on the current rates offered to us for financial instruments of the same
maturity, as well as discounted future cash flows determined using current rates for similar financial instruments of similar maturities subject to similar risks (such fair value estimates being largely based on the Canadian dollar: U.S. dollar forward exchange rate as at the statement of financial position dates).
The fair values of the derivative financial instruments we use to manage our exposure to increases in compensation costs arising from certain forms of share-based compensation are based on fair value estimates of the related cash-settled equity forward agreements provided by the counterparty to the transactions (such fair value estimates being largely based on our Common Share price as at the statement of financial position dates).
Derivative
The derivative financial instruments that we measure at fair value on a recurring basis subsequent to initial recognition are set out in the following table.
As at December 31 (millions) |
|
|
|
| 2018 |
|
|
| 2017 |
|
|
|
| Fair value1 |
|
|
| Fair value1 |
|
|
| Maximum |
| and |
| Maximum |
| and |
|
|
| maturity | Notional | carrying |
| maturity | Notional | carrying |
|
| Designation | date | amount | value | Price or rate | date | amount | value | Price or rate |
Current Assets2 |
|
|
|
|
|
|
|
|
|
Derivatives used to manage |
|
|
|
|
|
|
|
|
|
Currency risk arising from U.S. dollar-denominated purchases | HFH3 | 2019 | $ 414 | $ 25 | US$1.00: C$1.28 | 2018 | $ 110 | $ 2 | US$1.00: C$1.24 |
Currency risk arising from U.S. dollar revenues | HFT4 | 2019 | $ 74 | 1 | US$1.00: C$1.36 | 2018 | $ 71 | 1 | US$1.00: C$1.25 |
Changes in share-based compensation costs (Note 14(b)) | HFH3 | 2019 | $ 63 | 2 | $ 45.46 | 2018 | $ 73 | 14 | $ 40.91 |
Currency risk arising from U.S. dollar-denominated long-term debt (Note 26(b)–(c)) | HFH3 | 2019 | $ 761 | 21 | US$1.00: C$1.33 | 2018 | $ 124 | 1 | US$1.00: C$1.24 |
|
|
|
| $ 49 |
|
|
| $ 18 |
|
Other Long-Term Assets2 |
|
|
|
|
|
|
|
|
|
Derivatives used to manage |
|
|
|
|
|
|
|
|
|
Changes in share-based compensation costs (Note 14(b)) | HFH3 | – | $ – | $ – | – | 2019 | $ 63 | $ 6 | $ 45.46 |
Currency risks arising from U.S. dollar-denominated long-term debt5 (Note 26(b)–(c)) | HFH3 | 2048 | $ 3,134 | 54 | US$1.00: C$1.28 | – | $ – | – | – |
|
|
|
| $ 54 |
|
|
| $ 6 |
|
Current Liabilities2 |
|
|
|
|
|
|
|
|
|
Derivatives used to manage |
|
|
|
|
|
|
|
|
|
Currency risk arising from U.S. dollar-denominated purchases | HFH3 | 2019 | $ 11 | $ – | US$1.00: C$1.36 | 2018 | $ 376 | $ 14 | US$1.00: C$1.30 |
Currency risk arising from U.S. dollar revenues | HFT4 | 2019 | $ 18 | – | US$1.00: C$1.36 | – | $ – | – | – |
Changes in share-based compensation costs (Note 14(b)) | HFH3 | 2019 | $ 2 | – | $ 47.39 | – | $ – | – | – |
Currency risk arising from U.S. dollar-denominated long-term debt (Note 26(b)–(c)) | HFH3 | – | $ – | – | – | 2018 | $ 1,036 | 18 | US$1.00: C$1.28 |
Interest rate risk associated with non-fixed rate credit facility amounts drawn (Note 26(e)) | HFH3 | 2019 | $ 8 | – | 2.64% | – | $ – | – | – |
Interest rate risk associated with planned refinancing of debt maturing | HFH3 | 2019 | $ 250 | 9 | 2.40%, GOC | 2018 | $ 300 | 1 | 2.14%, GOC |
|
|
|
| $ 9 |
|
|
| $ 33 |
|
Other Long-Term Liabilities2 |
|
|
|
|
|
|
|
|
|
Derivatives used to manage |
|
|
|
|
|
|
|
|
|
Changes in share-based compensation costs (Note 14(b)) | HFH3 | 2020 | $ 67 | $ 3 | $ 48.71 | – | $ – | $ – | – |
Currency risk arising from U.S. dollar-denominated long-term debt5 (Note 26(b)–(c)) | HFH3 | 2027 | $ 991 | 2 | US$1.00: C$1.33 | 2027 | $ 1,910 | 76 | US$1.00: C$1.32 |
Interest rate risk associated with non-fixed rate credit facility amounts drawn (Note 26(e)) | HFH3 | 2022 | $ 145 | 1 | 2.64% | – | $ – | – | – |
|
|
|
| $ 6 |
|
|
| $ 76 |
|
1 Fair value measured at reporting date using significant other observable inputs (Level 2).
2 Derivative financial assets and liabilities are not set off.
3 Designated as held for hedging (HFH) upon initial recognition (cash flow hedging item); hedge accounting is applied. Unless otherwise noted, hedge ratio is 1:1 and is established by assessing the degree of matching between the notional amounts of hedging items and the notional amounts of the associated hedged items.
4 Designated as held for trading (HFT) and classified as fair value through net income upon initial recognition; hedge accounting is not applied.
5 As set out in (d), we designate only the spot element as the hedging item. As at December 31, 2018, the foreign currency basis spread included in the fair value of the derivative instruments, and which is used for purposes of assessing hedge ineffectiveness, was $29 (December 31, 2017 – $4; January 1, 2017 – $(1)).
148 · TELUS 2018 ANNUAL REPORT
CONSOLIDATED FINANCIAL STATEMENTS: NOTE 5
Non-derivative
Our long-term debt, which is measured at amortized cost, and the fair value thereof, are set out in the following table.
As at December 31 (millions) |
| 2018 |
| 2017 |
| Carrying value | Fair value | Carrying value | Fair value |
Long-term debt (Note 26) | $ 14,101 | $ 14,209 | $ 13,660 | $ 14,255 |
(i) Recognition of derivative gains and losses
The following table sets out the gains and losses, excluding income tax effects, arising from derivative instruments that are classified as cash flow hedging items and their location within the Consolidated statements of income and other comprehensive income.
Credit risk associated with such derivative instruments, as discussed further in (b), would be the primary source of hedge ineffectiveness. There was no ineffective portion of derivative instruments classified as cash flow hedging items for the periods presented.
|
| Amount of gain (loss) recognized in other comprehensive income (effective portion) (Note 11) |
| Gain (loss) reclassified from other comprehensive income to income (effective portion) (Note 11) |
| ||||||
|
| Amount |
| ||||||||
Years ended December 31 (millions) | Note | 2018 |
| 2017 |
| Location |
| 2018 |
| 2017 |
|
Derivatives used to manage currency risk |
|
|
|
|
|
|
|
|
|
|
|
Arising from U.S. dollar-denominated purchases |
| $ 39 |
| $ (23 | ) | Goods and services purchased |
| $ 6 |
| $ (5 | ) |
Arising from U.S. dollar-denominated long-term debt1 | 26(b)–(c) | 194 |
| (109 | ) | Financing costs |
| 241 |
| (146 | ) |
|
| 233 |
| (132 | ) |
|
| 247 |
| (151 | ) |
Derivatives used to manage other market risk |
|
|
|
|
|
|
|
|
|
|
|
Arising from changes in share-based compensation costs | 14(b) | (8 | ) | 24 |
| Employee benefits expense |
| 2 |
| 17 |
|
|
| $ 225 |
| $ (108 | ) |
|
| $ 249 |
| $ (134 | ) |
1 Amounts recognized in other comprehensive income are net of the change in the foreign currency basis spread (which is used for purposes of assessing hedge ineffectiveness) included in the fair value of the derivative instruments; such amount for the year ended December 31, 2018, was $25 (2017 – $5).
The following table sets out the gains and losses arising from derivative instruments that are classified as held for trading and that are not designated as being in a hedging relationship, and their location within the Consolidated statements of income and other comprehensive income.
|
| Gain (loss) recognized in income on derivatives |
| ||||
Years ended December 31 (millions) |
| Location |
| 2018 |
| 2017 |
|
Derivatives used to manage currency risk |
| Financing costs |
| $ – |
| $ 3 |
|
|
|
5 | Segment information |
|
|
General
Operating segments are components of an entity that engage in business activities from which they earn revenues and incur expenses (including revenues and expenses related to transactions with the other component(s)), the operations of which can be clearly distinguished and for which the operating results are regularly reviewed by a chief operating decision-maker to make resource allocation decisions and to assess performance. As we do not currently aggregate operating segments, our reportable segments as at December 31, 2018, are also wireless and wireline. The wireless segment includes network revenues and equipment sales arising from mobile technologies. The wireline
segment includes data revenues (which include Internet protocol television; hosting, managed information technology and cloud-based services; customer care and business services (formerly business process outsourcing); certain healthcare solutions; and home and business security), voice and other telecommunications services revenues (excluding wireless arising from mobile technologies), and equipment sales. Segmentation has been based on similarities in technology (mobile versus fixed), the technical expertise required to deliver the services and products, customer characteristics, the distribution channels used and regulatory treatment. Intersegment sales are recorded at the exchange value, which is the amount agreed to by the parties.
The segment information regularly reported to our Chief Executive Officer (our chief operating decision-maker), and the reconciliations thereof to our products and services view of revenues, other revenues and income before income taxes, are set out in the following table.
|
| Wireless |
| Wireline |
| Eliminations |
| Consolidated | ||||||||||||||||
Years ended December 31 (millions) |
| 2018 |
| 2017 |
| 2018 |
| 2017 |
| 2018 |
| 2017 |
| 2018 |
| 2017 | ||||||||
|
|
|
| (adjusted – |
|
|
| (adjusted – |
|
|
|
|
|
|
| (adjusted – | ||||||||
Operating revenues |
|
|
|
|
|
|
|
|
|
|
|
|
|
|
|
| ||||||||
External revenues |
|
|
|
|
|
|
|
|
|
|
|
|
|
|
|
| ||||||||
Service |
| $ | 6,054 |
| $ | 5,896 |
| $ | 5,828 |
| $ | 5,436 |
| $ | – |
| $ | – |
| $ | 11,882 |
| $ | 11,332 |
Equipment |
|
| 1,963 |
|
| 1,739 |
|
| 250 |
|
| 234 |
|
| – |
|
| – |
|
| 2,213 |
|
| 1,973 |
Revenues arising from contracts with customers |
|
| 8,017 |
|
| 7,635 |
|
| 6,078 |
|
| 5,670 |
|
| – |
|
| – |
|
| 14,095 |
|
| 13,305 |
Other operating income |
|
| 118 |
|
| 36 |
|
| 155 |
|
| 67 |
|
| – |
|
| – |
|
| 273 |
|
| 103 |
|
|
| 8,135 |
|
| 7,671 |
|
| 6,233 |
|
| 5,737 |
|
| – |
|
| – |
|
| 14,368 |
|
| 13,408 |
Intersegment revenues |
|
| 47 |
|
| 43 |
|
| 207 |
|
| 206 |
|
| (254 | ) |
| (249 | ) |
| – |
|
| – |
|
| $ | 8,182 |
| $ | 7,714 |
| $ | 6,440 |
| $ | 5,943 |
| $ | (254 | ) | $ | (249 | ) | $ | 14,368 |
| $ | 13,408 |
EBITDA1 |
| $ | 3,431 |
| $ | 3,250 |
| $ | 1,673 |
| $ | 1,660 |
| $ | – |
| $ | – |
| $ | 5,104 |
| $ | 4,910 |
CAPEX, excluding spectrum licences2 |
| $ | 896 |
| $ | 978 |
| $ | 2,018 |
| $ | 2,116 |
| $ | – |
| $ | – |
| $ | 2,914 |
| $ | 3,094 |
|
|
|
|
|
|
|
| Operating revenues – external (above) |
| $ | 14,368 |
| $ | 13,408 | ||||||||||
|
|
|
|
|
|
|
| Goods and services purchased |
|
| 6,368 |
|
| 5,904 | ||||||||||
|
|
|
|
|
|
|
| Employee benefits expense |
|
| 2,896 |
|
| 2,594 | ||||||||||
|
|
|
|
|
|
|
| EBITDA (above) |
|
| 5,104 |
|
| 4,910 | ||||||||||
|
|
|
|
|
|
|
| Depreciation |
|
| 1,669 |
|
| 1,617 | ||||||||||
|
|
|
|
|
|
|
| Amortization |
|
| 598 |
|
| 552 | ||||||||||
|
|
|
|
|
|
|
| Operating income |
|
| 2,837 |
|
| 2,741 | ||||||||||
|
|
|
|
|
|
|
| Financing costs |
|
| 661 |
|
| 573 | ||||||||||
|
|
|
|
|
|
|
| Income before income taxes |
| $ | 2,176 |
| $ | 2,168 | ||||||||||
1 Earnings before interest, income taxes, depreciation and amortization (EBITDA) does not have any standardized meaning prescribed by IFRS-IASB and is therefore unlikely to be comparable to similar measures presented by other issuers; we define EBITDA as operating revenues less goods and services purchased and employee benefits expense. We have issued guidance on, and report, EBITDA because it is a key measure that management uses to evaluate the performance of our business, and it is also utilized in measuring compliance with certain debt covenants.
2 Total capital expenditures (CAPEX); see Note 31(a) for a reconciliation of capital expenditures, excluding spectrum licences to cash payments for capital assets, excluding spectrum licences reported in the Consolidated statements of cash flows.
Geographical information
We attribute revenues from external customers to individual countries on the basis of the location where the goods and/or services are provided We do not have significant revenues that we attribute to countries other
than Canada (our country of domicile), nor do we have significant amounts of property, plant, equipment and/or intangible assets located outside of Canada. As at December 31, 2018, on a historical cost basis, we had $546 million (2017 – $262 million) of goodwill located outside of Canada.
CONSOLIDATED FINANCIAL STATEMENTS: NOTE 6
|
|
6 | Revenue from contracts with customers |
|
|
(a) Revenues
In the determination of the minimum transaction prices in contracts with customers, amounts are allocated to fulfilling, or completion of fulfilling, future contracted performance obligations. These unfulfilled, or partially unfulfilled, future contracted performance obligations are largely in respect of services to be provided over the duration of the contract. The following table sets out our aggregate estimated minimum
transaction prices allocated to remaining unfulfilled, or partially unfulfilled future contracted performance obligations and the timing of when we might expect to recognize the associated revenues; actual amounts could differ from these estimates due to a variety of factors, including the unpredictable nature of: customer behaviour; industry regulation; the economic environments in which we operate; and competitor behaviour.
As at December 31 (millions) | 2018 | 2017 |
Estimated minimum transaction price allocated to remaining unfulfilled, or partially unfulfilled, performance obligations to be recognized as revenue in a future period1,2 |
|
|
During the 12-month period ending one year hence | $ 2,306 | $ 2,075 |
During the 12-month period ending two years hence | 933 | 856 |
Thereafter | 24 | 24 |
| $ 3,263 | $ 2,955 |
1 Excludes constrained variable consideration amounts, amounts arising from contracts originally expected to have a duration of one year or less and, as a permitted practical expedient, amounts arising from contracts that are not affected by revenue recognition timing differences arising from transaction price allocation or from contracts under which we may recognize and bill revenue in an amount that corresponds directly with our completed performance obligations.
2 IFRS-IASB requires the explanation of when we expect to recognize as revenue the amounts disclosed as the estimated minimum transaction price allocated to remaining unfulfilled, or partially unfulfilled, performance obligations. The estimated amounts disclosed are based upon contractual terms and maturities. Actual minimum transaction price revenues recognized, and the timing thereof, will differ from these estimates primarily due to the frequency with which the actual durations of contracts with customers do not match their contractual maturities.
(b) Accounts receivable
As at (millions) |
| Note |
| December 31, 2018 |
| December 31, 2017 |
| January 1, 2017 |
|
Customer accounts receivable |
|
|
|
|
|
|
|
|
|
As previously reported |
|
|
| $ 1,263 |
| $ 1,221 |
| $ 1,217 |
|
Transitional amount |
| 2(c) |
| – |
| (9 | ) | (9 | ) |
As adjusted |
|
|
| 1,263 |
| 1,212 |
| 1,208 |
|
Accrued receivables – customer |
|
|
| 175 |
| 143 |
| 131 |
|
Allowance for doubtful accounts |
| 4(b) |
| (53 | ) | (43 | ) | (54 | ) |
|
|
|
| 1,385 |
| 1,312 |
| 1,285 |
|
Accrued receivables – other |
|
|
| 215 |
| 302 |
| 177 |
|
|
|
|
| $ 1,600 |
| $ 1,614 |
| $ 1,462 |
|
TELUS 2018 ANNUAL REPORT · 151
(c) Contract assets
Years ended December 31 (millions) |
| Note |
| 2018 |
| 2017 |
|
Balance, beginning of period |
|
|
| $ 1,303 |
| $ – |
|
Transitional amount |
| 2(c) |
| – |
| 1,205 |
|
As adjusted |
|
|
| 1,303 |
| 1,205 |
|
Net additions arising from operations |
|
|
| 1,455 |
| 1,270 |
|
Amounts billed in period and thus reclassified to accounts receivable1 |
|
|
| (1,284 | ) | (1,166 | ) |
Change in impairment allowance, net |
| 4(b) |
| (1 | ) | (3 | ) |
Other |
|
|
| 2 |
| (3 | ) |
Balance, end of period |
|
|
| $ 1,475 |
| $ 1,303 |
|
To be billed and thus reclassified to accounts receivable during: |
|
|
|
|
|
|
|
The 12-month period ending one year hence |
|
|
| $ 1,017 |
| $ 907 |
|
The 12-month period ending two years hence |
|
|
| 444 |
| 385 |
|
Thereafter |
|
|
| 14 |
| 11 |
|
Balance, end of period |
|
|
| $ 1,475 |
| $ 1,303 |
|
Reconciliation of contract assets presented in the Consolidated statements of financial position – current |
|
|
|
|
|
|
|
Gross contract assets |
|
|
| $ 1,017 |
| $ 907 |
|
Reclassification to contract liabilities of contracts with contract assets less than contract liabilities |
| 24 |
| (3 | ) | (4 | ) |
Reclassification from contract liabilities of contracts with contract liabilities less than contract assets |
| 24 |
| (154 | ) | (146 | ) |
|
|
|
| $ 860 |
| $ 757 |
|
1 For the year ended December 31, 2018, amounts billed for our wireless segment and reclassified to accounts receivable totalled $1,180 (2017 – $1,060).
|
|
7 | Other operating income |
|
|
Years ended December 31 (millions) |
| Note |
| 2018 |
| 2017 |
|
Government assistance, including deferral account amortization |
|
|
| $ 23 |
| $ 32 |
|
Investment income, gain (loss) on disposal of assets and other |
| 21 |
| 230 |
| 45 |
|
Changes in business combination-related accrued receivable and provisions |
|
|
| 17 |
| 26 |
|
Interest income |
| 21(c) |
| 3 |
| – |
|
|
|
|
| $ 273 |
| $ 103 |
|
We receive government assistance, as defined by IFRS-IASB, from a number of sources and include such amounts received in Other operating income. We recognize such amounts on an accrual basis as the subsidized services are provided or as the subsidized costs are incurred.
CRTC subsidy
Local exchange carriers’ costs of providing the level of residential basic telephone services that the CRTC requires to be provided in high cost serving areas are greater than the amounts the CRTC allows the local exchange carriers to charge for the level of service. To ameliorate the situation, the CRTC directs the collection of contribution payments,
in a central fund, from all registered Canadian telecommunications service providers (including voice, data and wireless service providers) that are then disbursed to incumbent local exchange carriers as subsidy payments to partially offset the costs of providing residential basic telephone services in non-forborne high cost serving areas. The subsidy payment disbursements are based upon a total subsidy requirement calculated on a per network access line/per band subsidy rate. For the year ended December 31, 2018, our subsidy receipts were $18 million (2017 – $19 million).
The CRTC currently determines, at a national level, the total annual contribution requirement necessary to pay the subsidies and then collects contribution payments from the Canadian telecommunications service providers, calculated as a percentage of their CRTC-defined telecommunications service revenue. The final contribution expense rate for 2018 was 0.54% and the interim rate for 2019 has been set at 0.60%.
Government of Quebec
Salaries for qualifying employment positions in the province of Quebec, mainly in the information technology sector, are eligible for tax credits. In respect of such tax credits, for the year ended December 31, 2018, we recorded $4 million (2017 – $7 million).
CONSOLIDATED FINANCIAL STATEMENTS: NOTES 7–10
8 | Employee benefits expense |
Years ended December 31 (millions) |
| Note |
| 2018 |
| 2017 |
|
|
|
|
|
|
| (adjusted – |
|
Employee benefits expense – gross |
|
|
|
|
|
|
|
Wages and salaries |
|
|
| $ 2,800 |
| $ 2,594 |
|
Share-based compensation |
| 14 |
| 136 |
| 128 |
|
Pensions – defined benefit |
| 15(b) |
| 95 |
| 82 |
|
Pensions – defined contribution |
| 15(f) |
| 88 |
| 88 |
|
Restructuring costs |
| 16(a) |
| 126 |
| 26 |
|
Other |
|
|
| 163 |
| 156 |
|
|
|
|
| 3,408 |
| 3,074 |
|
Capitalized internal labour costs, net |
|
|
|
|
|
|
|
Contract acquisition costs |
| 20 |
|
|
|
|
|
Capitalized |
|
|
| (55 | ) | (47 | ) |
Amortized |
|
|
| 45 |
| 48 |
|
Contract fulfilment costs |
| 20 |
|
|
|
|
|
Capitalized |
|
|
| (3 | ) | (4 | ) |
Amortized |
|
|
| 3 |
| 2 |
|
Property, plant and equipment |
|
|
| (332 | ) | (321 | ) |
Intangible assets subject to amortization |
|
|
| (170 | ) | (158 | ) |
|
|
|
| (512 | ) | (480 | ) |
|
|
|
| $ 2,896 |
| $ 2,594 |
|
9 | Financing costs |
Years ended December 31 (millions) |
| Note |
| 2018 |
| 2017 |
|
Interest expense |
|
|
|
|
|
|
|
Interest on long-term debt |
|
|
| $ 598 |
| $ 561 |
|
Interest on short-term borrowings and other |
|
|
| 6 |
| 5 |
|
Interest accretion on provisions |
| 25 |
| 21 |
| 13 |
|
Long-term debt prepayment premium |
| 26(b) |
| 34 |
| – |
|
|
|
|
| 659 |
| 579 |
|
Employee defined benefit plans net interest |
| 15(b), (g) |
| 17 |
| 6 |
|
Foreign exchange |
|
|
| (6 | ) | (5 | ) |
|
|
|
| 670 |
| 580 |
|
Interest income |
|
|
| (9 | ) | (7 | ) |
|
|
|
| $ 661 |
| $ 573 |
|
10 | Income taxes |
(a) Expense composition and rate reconciliation
Years ended December 31 (millions) |
| 2018 |
| 2017 |
|
|
|
|
| (adjusted – |
|
Current income tax expense |
|
|
|
|
|
For the current reporting period |
| $ 483 |
| $ 205 |
|
Adjustments recognized in the current period for income taxes of prior periods |
| (5 | ) | (82 | ) |
|
| 478 |
| 123 |
|
Deferred income tax expense (recovery) |
|
|
|
|
|
Arising from the origination and reversal of temporary differences |
| 75 |
| 361 |
|
Revaluation of deferred income tax liability to reflect future income tax rates |
| – |
| 28 |
|
Adjustments recognized in the current period for income taxes of prior periods |
| (1 | ) | 78 |
|
|
| 74 |
| 467 |
|
|
| $ 552 |
| $ 590 |
|
Our income tax expense and effective income tax rate differ from those calculated by applying the applicable statutory rates for the following reasons:
Years ended December 31 ($ in millions) |
| 2018 |
|
| 2017 |
| |||
|
|
|
|
|
| (adjusted – Note 2(c)) |
| ||
Income taxes computed at applicable statutory rates |
| $ 586 |
| 27.0 | % | $ 578 |
| 26.7% |
|
Revaluation of deferred income tax liability to reflect future income tax rates |
| – |
| – |
| 28 |
| 1.3 |
|
Adjustments recognized in the current period for income taxes of prior periods |
| (6 | ) | (0.3 | ) | (4 | ) | (0.2) |
|
Other |
| (28 | ) | (1.3 | ) | (12 | ) | (0.6) |
|
Income tax expense per Consolidated statements of income and other comprehensive income |
| $ 552 |
| 25.4 | % | $ 590 |
| 27.2% |
|
(b) Temporary differences
We must make significant estimates in respect of the composition of our deferred income tax liability. Our operations are complex and the related
income tax interpretations, regulations, legislation and jurisprudence are continually changing. As a result, there are usually some income tax matters in question.
Temporary differences comprising the net deferred income tax liability and the amounts of deferred income taxes recognized in the Consolidated statements of income and other comprehensive income and the Consolidated statements of changes in owners’ equity are estimated as follows:
|
| Property, plant |
|
|
|
|
| Net |
|
|
|
|
|
|
| Partnership |
|
|
| |||||||||
|
| and equipment |
|
|
|
|
| pension and |
|
|
| Losses |
|
|
| income |
|
|
| |||||||||
|
| and intangible |
| Intangible |
| Contract |
| share-based |
| Provisions |
| available to |
|
|
| unallocated |
| Net deferred |
| |||||||||
|
| assets subject to |
| assets with |
| assets and |
| compensation |
| not currently |
| be carried |
|
|
| for income |
| income tax |
| |||||||||
(millions) |
| amortization |
| indefinite lives |
| liabilities |
| amounts |
| deductible |
| forward | 1 | Other |
| tax purposes |
| liability |
| |||||||||
As at January 1, 2017 |
|
|
|
|
|
|
|
|
|
|
|
|
|
|
|
|
|
|
| |||||||||
As previously reported |
| $ | 870 |
| $ | 1,457 |
| $ | – |
| $ | (48 | ) | $ | (148 | ) | $ | (6 | ) | $ | (18 | ) | $ | (5 | ) | $ | 2,102 |
|
IFRS 15, Revenue from Contracts with Customers transitional amount (Note 2(c)) |
| – |
| – |
| 404 |
| – |
| – |
| – |
| – |
| – |
| 404 |
| |||||||||
As adjusted2 |
| 870 |
| 1,457 |
| 404 |
| (48 | ) | (148 | ) | (6 | ) | (18 | ) | (5 | ) | 2,506 |
| |||||||||
Deferred income tax expense recognized in Net income (Note 2(c)) |
| 348 |
| 84 |
| 37 |
| (11 | ) | 8 |
| (1 | ) | (3 | ) | 5 |
| 467 |
| |||||||||
Other comprehensive income |
| – |
| – |
| – |
| (61 | ) | – |
| – |
| 4 |
| – |
| (57 | ) | |||||||||
Deferred income taxes charged directly to owners’ equity and other |
| 3 |
| 20 |
| – |
| – |
| – |
| – |
| (3 | ) | – |
| 20 |
| |||||||||
As at December 31, 20173 |
| 1,221 |
| 1,561 |
| 441 |
| (120 | ) | (140 | ) | (7 | ) | (20 | ) | – |
| 2,936 |
| |||||||||
Deferred income tax expense recognized in Net income |
| 14 |
| 78 |
| 55 |
| (20 | ) | (10 | ) | 1 |
| (44 | ) | – |
| 74 |
| |||||||||
Other comprehensive income |
| – |
| – |
| – |
| 119 |
| – |
| – |
| (6 | ) | – |
| 113 |
| |||||||||
Deferred income taxes charged directly to owners’ equity and other |
| (2 | ) | 79 |
| – |
| – |
| (54 | ) | – |
| 1 |
| – |
| 24 |
| |||||||||
As at December 31, 20184 |
| $ | 1,233 |
| $ | 1,718 |
| $ | 496 |
| $ | (21 | ) | $ | (204 | ) | $ | (6 | ) | $ | (69 | ) | $ | – |
| $ | 3,147 |
|
1 We expect to be able to utilize our non-capital losses prior to expiry.
2 Deferred tax liability of $2,511, net of deferred tax asset of $5 (included in Other long-term assets).
3 Deferred tax liability of $2,941, net of deferred tax asset of $5 (included in Other long-term assets).
4 Deferred tax liability of $3,152, net of deferred tax asset of $5 (included in Other long-term assets).
IFRS-IASB requires the separate disclosure of temporary differences arising from the carrying value of investments in subsidiaries and partnerships exceeding their tax base, for which no deferred income tax liabilities have been recognized because the parent is able to control the timing of the reversal of the difference and it is probable that it will not reverse in the foreseeable future. In our specific instance, this is relevant to our investments in Canadian subsidiaries and Canadian partnerships. We are not required to recognize such deferred income tax liabilities, as we are in a position to control the timing and manner of the reversal of the temporary differences, which would not be expected to be exigible to income tax, and it is probable that such differences will not reverse in the foreseeable future. We are in a position to control the timing and manner of the reversal of temporary differences in respect of our non-Canadian subsidiaries, and it is probable that such differences will not reverse in the foreseeable future.
(c) Other
We have net capital losses, and such losses may only be applied against realized taxable capital gains. We expect to include a net capital loss carry-forward of $NIL (2017 – $NIL) in our Canadian income tax returns. During the year ended December 31, 2018, we recognized the benefit of $NIL (2017 – $4 million) of net capital losses.
We conduct research and development activities, which are eligible to earn Investment Tax Credits. During the year ended December 31, 2018, we recorded Investment Tax Credits of $10 million (2017 – $12 million). Of this amount, $6 million (2017 – $7 million) was recorded as a reduction of property, plant and equipment and/or intangible assets and the balance was recorded as a reduction of Goods and services purchased.
CONSOLIDATED FINANCIAL STATEMENTS: NOTE 11
11 | Other comprehensive income |
|
| Items that may subsequently be reclassified to income |
| Item never |
|
|
| Item never |
|
|
| ||||||||||||||
|
| Change in unrealized fair value of derivatives designated |
|
|
| reclassified |
|
|
| reclassified |
|
|
| ||||||||||||
|
| as cash flow hedges in current period (Note 4(i)) |
|
|
| to income
|
|
|
| to income |
|
|
| ||||||||||||
|
| Derivatives used to |
| Derivatives used to |
|
|
|
|
|
|
|
|
|
|
|
|
| ||||||||
|
| manage currency risk |
| manage other market risks |
|
|
| Cumulative |
|
|
| Accumulated |
|
|
|
|
| ||||||||
|
|
|
| Prior period |
|
|
|
|
| Prior period |
|
|
|
|
| foreign |
| Change in |
| other |
| Employee |
| Other |
|
|
| Gains |
| (gains) losses |
|
|
| Gains |
| (gains) losses |
|
|
|
|
| currency |
| measurement |
| compre- |
| defined |
| compre- |
|
|
| (losses) |
| transferred to |
|
|
| (losses) |
| transferred to |
|
|
|
|
| translation |
| of investment |
| hensive |
| benefit plan |
| hensive |
|
(millions) |
| arising |
| net income |
| Total |
| arising |
| net income |
| Total |
| Total |
| adjustment |
| financial assets |
| income |
| re-measurements |
| income |
|
Accumulated balance as at January 1, 2017 |
|
|
|
|
|
|
|
|
|
|
|
|
|
|
|
|
|
|
|
|
|
|
|
|
|
As previously reported |
|
|
|
|
| $ (22) |
|
|
|
|
| $ 2 |
| $ (20 | ) | $ 48 |
| $ 16 |
| $ 44 |
|
|
|
|
|
IFRS 9, Financial Instruments transitional amount (Note 2(a)) |
|
|
|
|
| – |
|
|
|
|
| – |
| – |
| – |
| (3 | ) | (3 | ) |
|
|
|
|
As adjusted |
|
|
|
|
| (22) |
|
|
|
|
| 2 |
| (20 | ) | 48 |
| 13 |
| 41 |
|
|
|
|
|
Other comprehensive income (loss) |
|
|
|
|
|
|
|
|
|
|
|
|
|
|
|
|
|
|
|
|
|
|
|
|
|
Amount arising |
| $ (132) |
| $ 151 |
| 19 |
| $ 24 |
| $ (17) |
| 7 |
| 26 |
| 5 |
| (14 | ) | 17 |
| $ (234 | ) | $ (217 | ) |
Income taxes |
| $ (21) |
| $ 27 |
| 6 |
| $ 6 |
| $ (5) |
| 1 |
| 7 |
| – |
| (2 | ) | 5 |
| (62 | ) | (57 | ) |
Net |
|
|
|
|
| 13 |
|
|
|
|
| 6 |
| 19 |
| 5 |
| (12 | ) | 12 |
| $ (172 | ) | $ (160 | ) |
Accumulated balance as at December 31, 2017 |
|
|
|
|
| $ (9) |
|
|
|
|
| $ 8 |
| $ (1 | ) | $ 53 |
| $ 1 |
| $ 53 |
|
|
|
|
|
Accumulated balance as at January 1, 2018 |
|
|
|
|
|
|
|
|
|
|
|
|
|
|
|
|
|
|
|
|
|
|
|
|
|
As previously reported |
|
|
|
|
| $ (9) |
|
|
|
|
| $ 8 |
| $ (1 | ) | $ 53 |
| $ 5 |
| $ 57 |
|
|
|
|
|
IFRS 9, Financial Instruments transitional amount (Note 2(a)) |
|
|
|
|
| – |
|
|
|
|
| – |
| – |
| – |
| (4 | ) | (4 | ) |
|
|
|
|
As adjusted |
|
|
|
|
| (9) |
|
|
|
|
| 8 |
| (1 | ) | 53 |
| 1 |
| 53 |
|
|
|
|
|
Other comprehensive income (loss) |
|
|
|
|
|
|
|
|
|
|
|
|
|
|
|
|
|
|
|
|
|
|
|
|
|
Amount arising |
| $ 233 |
| $ (247) |
| (14) |
| $ (8) |
| $ (2) |
| (10) |
| (24 | ) | (30 | ) | (1 | ) | (55 | ) | $ 452 |
| $ 397 |
|
Income taxes |
| $ 40 |
| $ (44) |
| (4) |
| $ (2) |
| $ – |
| (2) |
| (6 | ) | – |
| – |
| (6 | ) | 119 |
| 113 |
|
Net |
|
|
|
|
| (10) |
|
|
|
|
| (8) |
| (18 | ) | (30 | ) | (1 | ) | (49 | ) | $ 333 |
| $ 284 |
|
Accumulated balance as at December 31, 2018 |
|
|
|
|
| $ (19) |
|
|
|
|
| $ – |
| $ (19 | ) | $ 23 |
| $ – |
| $ 4 |
|
|
|
|
|
Attributable to: |
|
|
|
|
|
|
|
|
|
|
|
|
|
|
|
|
|
|
|
|
|
|
|
|
|
Common Shares |
|
|
|
|
|
|
|
|
|
|
|
|
|
|
|
|
|
|
| $ 12 |
|
|
|
|
|
Non-controlling interests |
|
|
|
|
|
|
|
|
|
|
|
|
|
|
|
|
|
|
| (8 | ) |
|
|
|
|
|
|
|
|
|
|
|
|
|
|
|
|
|
|
|
|
|
|
|
| $ 4 |
|
|
|
|
|
TELUS 2018 ANNUAL REPORT · 155
12 | Per share amounts |
Basic net income per Common Share is calculated by dividing net income attributable to Common Shares by the total weighted average number of Common Shares outstanding during the period. Diluted net income per Common Share is calculated to give effect to share option awards and restricted stock units.
The following table presents reconciliations of the denominators of the basic and diluted per share computations. Net income was equal to diluted net income for all periods presented.
Years ended December 31 (millions) |
| 2018 |
| 2017 |
Basic total weighted average number of Common Shares outstanding |
| 597 |
| 593 |
Effect of dilutive securities |
|
|
|
|
Share option awards |
| – |
| – |
Diluted total weighted average number of Common Shares outstanding |
| 597 |
| 593 |
For the years ended December 31, 2018 and 2017, no outstanding TELUS Corporation share option awards were excluded in the calculation of diluted net income per Common Share.
13 | Dividends per share |
(a) Dividends declared
Years ended December 31 |
|
|
|
|
|
|
|
|
|
|
|
|
|
|
|
|
(millions except per share amounts) |
|
|
|
|
|
|
| 2018 |
|
|
|
|
|
|
| 2017 |
|
| Declared |
| Paid to shareholders |
|
|
| Declared |
| Paid to shareholders |
|
| ||||
Common Share dividends |
| Effective |
| Per share |
|
| Total |
| Effective |
| Per share |
|
| Total | ||
Quarter 1 dividend |
| Mar. 9, 2018 |
| $ 0.5050 |
| Apr. 2, 2018 |
| $ 299 |
| Mar. 10, 2017 |
| $ 0.4800 |
| Apr. 3, 2017 |
| $ 283 |
Quarter 2 dividend |
| June 8, 2018 |
| 0.5250 |
| July 3, 2018 |
| 315 |
| June 9, 2017 |
| 0.4925 |
| July 4, 2017 |
| 293 |
Quarter 3 dividend |
| Sep. 10, 2018 |
| 0.5250 |
| Oct. 1, 2018 |
| 313 |
| Sep. 8, 2017 |
| 0.4925 |
| Oct. 2, 2017 |
| 292 |
Quarter 4 dividend |
| Dec. 10, 2018 |
| 0.5450 |
| Jan. 2, 2019 |
| 326 |
| Dec. 11, 2017 |
| 0.5050 |
| Jan. 2, 2018 |
| 299 |
|
|
|
| $ 2.1000 |
|
|
| $ 1,253 |
|
|
| $ 1.9700 |
|
|
| $ 1,167 |
On February 13, 2019, the Board of Directors declared a quarterly dividend of $0.5450 per share on our issued and outstanding Common Shares payable on April 1, 2019, to holders of record at the close of business on March 11, 2019. The final amount of the dividend payment depends upon the number of Common Shares issued and outstanding at the close of business on March 11, 2019.
(b) Dividend Reinvestment and Share Purchase Plan
We have a Dividend Reinvestment and Share Purchase Plan under which eligible holders of Common Shares may acquire additional Common Shares by reinvesting dividends and by making additional optional cash payments to the trustee. In respect of Common Shares whose eligible shareholders have elected to participate in the plan, dividends declared during the year ended December 31, 2018, of $54 million (2017 – $58 million) were to be reinvested in Common Shares acquired by the trustee from Treasury, with no discount applicable.
CONSOLIDATED FINANCIAL STATEMENTS: NOTES 12-14
14 | Share-based compensation |
(a) Details of share-based compensation expense
Reflected in the Consolidated statements of income and other comprehensive income as Employee benefits expense and in the Consolidated statements of cash flows are the following share-based compensation amounts:
Years ended December 31 (millions) |
|
|
| 2018 |
|
| 2017 |
|
| Employee | Associated | Statement | Employee | Associated | Statement |
|
| benefits | operating | of cash flows | benefits | operating | of cash flows |
| Note | expense | cash outflows | adjustment | expense | cash outflows | adjustment |
Restricted stock units | (b) | $ 99 | $ (98) | $ 1 | $ 83 | $ (67) | $ 16 |
Employee share purchase plan | (c) | 37 | (37) | – | 37 | (37) | – |
Share option awards | (d) | 5 | – | 5 | 1 | – | 1 |
|
| $ 141 | $ (135) | $ 6 | $ 121 | $ (104) | $ 17 |
For the year ended December 31, 2018, the associated operating cash outflows in respect of restricted stock units were net of cash inflows arising from cash-settled equity forward agreements of $9 million (2017 – $14 million). For the year ended December 31, 2018, the income tax benefit arising from share-based compensation was $37 million (2017 – $32 million).
(b) Restricted stock units
General
We use restricted stock units as a form of retention and incentive compensation. Each restricted stock unit is nominally equal in value to one equity share and is nominally entitled to the dividends that would arise thereon if it were an issued and outstanding equity share. The notional dividends are recorded as additional issuances of restricted stock units during the life of the restricted stock unit. Due to the notional dividend mechanism, the grant-date fair value of restricted stock units equals the fair market value of the corresponding equity shares at the grant date. The restricted stock units generally become payable when vesting is complete and typically vest over a period of 33 months
(the requisite service period). The vesting method of restricted stock units, which is determined on or before the date of grant, may be either cliff or graded; the majority of restricted stock units outstanding are cliff-vesting. The associated liability is normally cash-settled.
TELUS Corporation restricted stock units
We also award restricted stock units that largely have the same features as our general restricted stock units, but have a variable payout (0%–200%) that depends upon the achievement of our total customer connections performance condition (with a weighting of 25%) and the total shareholder return on our Common Shares relative to an international peer group of telecommunications companies (with a weighting of 75%). The grant-date fair value of the notional subset of our restricted stock units affected by the total customer connections performance condition equals the fair market value of the corresponding Common Shares at the grant date, and thus the notional subset has been included in the presentation of our restricted stock units with only service conditions. The recurring estimate, which reflects a variable payout, of the fair value of the notional subset of our restricted stock units affected by the relative total shareholder return performance condition is determined using a Monte Carlo simulation.
The following table presents a summary of outstanding TELUS Corporation non-vested restricted stock units.
Number of non-vested restricted stock units as at December 31 |
| 2018 |
| 2017 |
Restricted stock units without market performance conditions |
|
|
|
|
Restricted stock units with only service conditions |
| 3,037,881 |
| 3,327,464 |
Notional subset affected by total customer connections performance condition |
| 155,639 |
| 154,452 |
|
| 3,193,520 |
| 3,481,916 |
Restricted stock units with market performance conditions |
|
|
|
|
Notional subset affected by relative total shareholder return performance condition |
| 466,917 |
| 463,357 |
|
| 3,660,437 |
| 3,945,273 |
TELUS 2018 ANNUAL REPORT · 157
The following table presents a summary of the activity related to TELUS Corporation restricted stock units without market performance conditions.
Years ended December 31 |
|
|
|
|
| 2018 |
|
|
|
|
| 2017 |
|
|
|
|
|
| Weighted |
|
|
|
|
| Weighted |
|
| Number of restricted stock units | 1 | average grant- |
| Number of restricted stock units | 1 | average grant- | ||||
|
| Non-vested |
| Vested |
| date fair value |
| Non-vested |
| Vested |
| date fair value |
Outstanding, beginning of period |
|
|
|
|
|
|
|
|
|
|
|
|
Non-vested |
| 3,481,916 |
| – |
| $ 41.87 |
| 3,390,979 |
| – |
| $ 41.71 |
Vested |
| – |
| 32,848 |
| $ 41.00 |
| – |
| 29,108 |
| $ 38.09 |
Issued |
|
|
|
|
|
|
|
|
|
|
|
|
Initial award |
| 1,769,092 |
| – |
| $ 45.72 |
| 1,825,688 |
| – |
| $ 43.56 |
In lieu of dividends |
| 208,503 |
| 359 |
| $ 46.32 |
| 206,715 |
| 455 |
| $ 43.98 |
Vested |
| (1,963,722 | ) | 1,963,722 |
| $ 40.34 |
| (1,766,680 | ) | 1,766,680 |
| $ 43.73 |
Settled in cash |
| – |
| (1,933,546 | ) | $ 40.08 |
| – |
| (1,698,008 | ) | $ 43.63 |
Forfeited and cancelled |
| (302,269 | ) | – |
| $ 43.16 |
| (174,786 | ) | (65,387 | ) | $ 42.88 |
Outstanding, end of period |
|
|
|
|
|
|
|
|
|
|
|
|
Non-vested |
| 3,193,520 |
| – |
| $ 44.85 |
| 3,481,916 |
| – |
| $ 41.87 |
Vested |
| – |
| 63,383 |
| $ 44.89 |
| – |
| 32,848 |
| $ 41.00 |
1 Excluding the notional subset of restricted stock units affected by the relative total shareholder return performance condition.
With respect to certain issuances of TELUS Corporation restricted stock units, we have entered into cash-settled equity forward agreements that fix our cost; that information, as well as a schedule of non-vested TELUS Corporation restricted stock units outstanding as at December 31, 2018, is set out in the following table.
|
| Number of |
|
|
| Number of |
| Total number of |
|
|
| fixed-cost |
| Our fixed cost |
| variable-cost |
| non-vested |
|
|
| restricted |
| per restricted |
| restricted |
| restricted |
|
Vesting in years ending December 31
|
| stock units |
| stock unit |
| stock units |
| stock units | 1 |
2019 |
| 1,439,418 |
| $ 45.53 |
| 219,443 |
| 1,658,861 |
|
2020 |
| 1,369,272 |
| $ 48.71 |
| 369,734 |
| 1,739,006 |
|
|
| 2,808,690 |
|
|
| 589,177 |
| 3,397,867 |
|
1 Excluding the notional subset of restricted stock units affected by the relative total shareholder return performance condition vesting in the years ending December 31, 2019.
158 · TELUS 2018 ANNUAL REPORT
CONSOLIDATED FINANCIAL STATEMENTS: NOTE 14
TELUS International (Cda) Inc. restricted stock units
We also award restricted stock units that largely have the same features as the TELUS Corporation restricted stock units, but have a variable payout (0%–150%) that depends upon the achievement of TELUS International (Cda) Inc. financial performance and non-market quality-of-service performance conditions.
The following table presents a summary of the activity related to TELUS International (Cda) Inc. restricted stock units.
Years ended December 31 |
|
|
|
|
|
|
| 2018 |
|
|
|
|
|
|
|
|
| 2017 |
|
| US$ denominated |
| Canadian $ denominated |
| US$ denominated |
| Canadian $ denominated | ||||||||||
|
|
|
| Weighted |
|
|
| Weighted |
|
|
|
|
| Weighted |
|
|
| Weighted |
|
| Number of |
| average |
| Number of |
| average |
| Number of |
| average |
| Number of |
| average | ||
|
| restricted |
| grant-date |
| restricted |
| grant-date |
| restricted stock units |
| grant-date |
| restricted |
| grant-date | ||
|
| stock units |
| fair value |
| stock units |
| fair value |
| Non-vested |
| Vested |
| fair value |
| stock units |
| fair value |
Outstanding, beginning of period |
|
|
|
|
|
|
|
|
|
|
|
|
|
|
|
|
|
|
Non-vested |
| 374,786 |
| US$ 24.45 |
| – |
| $ – |
| 163,785 |
| – |
| US$ 21.90 |
| – |
| $ – |
Vested |
| – |
| US$ – |
| 32,299 |
| $ 21.36 |
| – |
| – |
| US$ – |
| 32,299 |
| $ 21.36 |
Issued – initial award |
| 197,495 |
| US$ 28.07 |
| – |
| $ – |
| 213,768 |
| – |
| US$ 26.40 |
| – |
| $ – |
Vested |
| – |
| US$ – |
| – |
| $ – |
| (208 | ) | 208 |
| US$ 24.10 |
| – |
| $ – |
Exercised |
| – |
| US$ – |
| – |
| $ – |
| – |
| (208 | ) | US$ 24.10 |
| – |
| $ – |
Forfeited and cancelled |
| (10,569 | ) | US$ 26.28 |
| – |
| $ – |
| (2,559 | ) | – |
| US$ 24.10 |
| – |
| $ – |
Outstanding, end of period |
|
|
|
|
|
|
|
|
|
|
|
|
|
|
|
|
|
|
Non-vested |
| 561,712 |
| US$ 25.68 |
| – |
| $ – |
| 374,786 |
| – |
| US$ 24.45 |
| – |
| $ – |
Vested |
| – |
| US$ – |
| 32,299 |
| $ 21.36 |
| – |
| – |
| US$ – |
| 32,299 |
| $ 21.36 |
(c) Employee share purchase plan
We have an employee share purchase plan under which eligible employees up to a certain job classification can purchase our Common Shares through regular payroll deductions. In respect of Common Shares held within the employee share purchase plan, Common Share dividends declared during the year ended December 31, 2018, of $34 million (2017 – $31 million) were to be reinvested in Common Shares acquired by the trustee from Treasury, with no discount applicable.
(d) Share option awards
General
We use share option awards as a form of retention and incentive compensation. We apply the fair value method of accounting for share-based compensation awards granted to officers and other employees. Share option awards typically have a three-year vesting period (the requisite service period). The vesting method of share option awards, which is determined on or before the date of grant, may be either cliff or graded; all share option awards granted subsequent to 2004 have been cliff-vesting
The weighted average fair value of share option awards granted is calculated by using the Black-Scholes model (a closed-form option pricing model). The risk-free interest rate used in determining the fair value of
the share option awards is based on a Government of Canada yield curve that is current at the time of grant. The expected lives of the share option awards are based on our historical share option award exercise data. Similarly, expected volatility considers the historical volatility in the price of our Common Shares for TELUS Corporation share options and average historical volatility in the prices of a peer group’s shares in respect of TELUS International (Cda) Inc. share options. The dividend yield is the annualized dividend current at the time of grant divided by the share option award exercise price. Dividends are not paid on unexercised share option awards and are not subject to vesting.
TELUS Corporation share options
Employees may receive options to purchase Common Shares at an exercise price equal to the fair market value at the time of grant. Share option awards granted under the plan may be exercised over specific periods not to exceed seven years from the time of grant. No share option awards were granted in fiscal 2018 or 2017.
These share option awards have a net-equity settlement feature. The optionee does not have the choice of exercising the net-equity settlement feature; it is at our option whether the exercise of a share option award is settled as a share option or settled using the net-equity settlement feature.
The following table presents a summary of the activity related to the TELUS Corporation share option plan.
Years ended December 31
|
|
|
| 2018 |
|
|
| 2017 |
|
|
|
| Weighted |
|
|
| Weighted |
|
| Number of |
| average share |
| Number of |
| average share |
|
| share options |
| option price |
| share options |
| option price |
Outstanding, beginning of period |
| 740,471 |
| $ 26.99 |
| 1,417,693 |
| $ 24.49 |
Exercised1 |
| (402,528 | ) | $ 25.26 |
| (652,926 | ) | $ 21.90 |
Forfeited |
| (2,046 | ) | $ 29.19 |
| (3,908 | ) | $ 27.56 |
Expired |
| (9,733 | ) | $ 23.24 |
| (20,388 | ) | $ 16.31 |
Outstanding, end of period2 |
| 326,164 |
| $ 29.22 |
| 740,471 |
| $ 26.99 |
1 The total intrinsic value of share option awards exercised for the year ended December 31, 2018, was $8 million (2017 – $15 million), reflecting a weighted average price at the dates of exercise of $46.04 per share (2017 – $44.63 per share). The difference between the number of share options exercised and the number of Common Shares issued (as reflected in the Consolidated statements of changes in owners’ equity) is the effect of our choosing to settle share option award exercises using the net-equity settlement feature.
2 All outstanding TELUS Corporation share options are vested, their range of prices is $28.56–$31.69 per share and their weighted average remaining contractual life is 0.4 years.
TELUS International (Cda) Inc. share options
Employees may receive equity share options (equity-settled) to purchase TELUS International (Cda) Inc. common shares at a price equal to, or a multiple of, the fair market value at the time of grant and/or phantom share options (cash-settled) that provide them with exposure to TELUS International (Cda) Inc. common share price appreciation. Share option
awards granted under the plan may be exercised over specific periods not to exceed ten years from the time of grant. All equity share option awards and most phantom share option awards have a variable payout (0%–100%) that depends upon the achievement of TELUS International (Cda) Inc. financial performance and non-market quality-of-service performance conditions.
The following table presents a summary of the activity related to the TELUS International (Cda) Inc. share option plan.
Years ended December 31
|
|
|
|
|
|
|
| 2018
|
|
|
|
|
|
|
| 2017
|
|
| US$ denominated |
| Canadian $ denominated |
| US$ denominated |
| Canadian $ denominated | ||||||||
|
|
|
| Weighted |
|
|
|
|
|
|
| Weighted |
|
|
|
|
|
| Number of |
| average share |
| Number of |
| Share |
| Number of |
| average share |
| Number of |
| Share |
|
| share options |
| option price1 |
| share options |
| option price2 |
| share options |
| option price1 |
| share options |
| option price2 |
Outstanding, beginning of period |
| 748,626 |
| US$ 30.12 |
| 53,832 |
| $ 21.36 |
| 573,354 |
| US$ 30.86 |
| 53,832 |
| $ 21.36 |
Granted |
| 111,281 |
| US$ 27.81 |
| – |
| $ – |
| 175,272 |
| US$ 27.70 |
| – |
| $ – |
Forfeited |
| (1,172 | ) | US$ 27.70 |
| – |
| $ – |
| – |
| US$ – |
| – |
| $ – |
Outstanding, end of period |
| 858,735 |
| US$ 29.83 |
| 53,832 |
| $ 21.36 |
| 748,626 |
| US$ 30.12 |
| 53,832 |
| $ 21.36 |
1 The range of share option prices is US$21.90–US$40.26 per TELUS International (Cda) Inc. equity share and the weighted average remaining contractual life is 8.4 years.
2 The weighted average remaining contractual life is 7.5 years.
15 | Employee future benefits |
We have a number of defined benefit and defined contribution plans that provide pension and other retirement and post-employment benefits to most of our employees. As at December 31, 2018 and 2017, all registered defined benefit pension plans were closed to substantially all new participants and substantially all benefits had vested. The benefit plans in which our employees are participants reflect developments in our corporate history.
TELUS Corporation Pension Plan
Management and professional employees in Alberta who joined us prior to January 1, 2001, and certain unionized employees who joined us prior to June 9, 2011, are covered by this contributory defined benefit pension plan, which comprises slightly more than one-half of our total defined benefit obligation accrued. The plan contains a supplemental benefit account that may provide indexation of up to 70% of the annual increase in a specified cost-of-living index. Pensionable remuneration
is determined by the average of the best five years of remuneration in the last ten years preceding retirement.
Pension Plan for Management and Professional Employees of TELUS Corporation
This defined benefit pension plan, which with certain limited exceptions ceased accepting new participants on January 1, 2006, and which comprises approximately one-quarter of our total defined benefit obligation accrued, provides a non-contributory base level of pension benefits. Additionally, on a contributory basis, employees annually can choose increased and/or enhanced levels of pension benefits above the base level. At an enhanced level of pension benefits, the plan has indexation of 100% of the annual increase in a specified cost-of-living index, to an annual maximum of 2%. Pensionable remuneration is determined by the annualized average of the best 60 consecutive months of remuneration.
CONSOLIDATED FINANCIAL STATEMENTS: NOTE 15
TELUS Québec Defined Benefit Pension Plan
This contributory defined benefit pension plan, which ceased accepting new participants on April 14, 2009, covers any employee not governed by a collective agreement in Quebec who joined us prior to April 1, 2006, any non-supervisory employee governed by a collective agreement who joined us prior to September 6, 2006, and certain other unionized employees. The plan comprises approximately one-tenth of our total defined benefit obligation accrued. The plan has no indexation and pensionable remuneration is determined by the average of the best four years of remuneration.
TELUS Edmonton Pension Plan
This contributory defined benefit pension plan ceased accepting new participants on January 1, 1998. Indexation is 60% of the annual increase in a specified cost-of-living index and pensionable remuneration is determined by the annualized average of the best 60 consecutive months of remuneration. The plan comprises less than one-tenth of our total defined benefit obligation accrued.
Other defined benefit pension plans
In addition to the foregoing plans, we have non-registered, non-contributory supplementary defined benefit pension plans, which have the effect of maintaining the earned pension benefit once the allowable maximums in the registered plans are attained. As is common with non-registered plans of this nature, these plans are typically funded only as benefits are paid. These plans comprise less than 5% of our total defined benefit obligation accrued.
We have three contributory non-indexed defined benefit pension plans arising from a pre-merger acquisition, which comprise less than 1% of our total defined benefit obligation accrued; these plans ceased accepting new participants in September 1989. During the year ended December 31, 2018, these plans were settled.
Telecommunication Workers Pension Plan
Certain employees in British Columbia are covered by a negotiated-cost, target-benefit union pension plan. Our contributions are determined in accordance with provisions of negotiated labour contracts, the current one of which expires December 31, 2021, and are generally based on employee gross earnings. We are not required to guarantee the benefits or assure the solvency of the plan, and we are not liable to the plan for other participating employers’ obligations. For the years ended December 31, 2018 and 2017, our contributions comprised a significant proportion of the employer contributions to the union pension plan; similarly, a significant proportion of the plan participants were our active and retired employees.
British Columbia Public Service Pension Plan
Certain employees in British Columbia are covered by a public service pension plan. Contributions are determined in accordance with provisions of labour contracts negotiated by the Province of British Columbia and are generally based on employee gross earnings.
Defined contribution pension plans
We offer three defined contribution pension plans, which are contributory, and these are the pension plans that we sponsor that are available to our non-unionized and certain of our unionized employees. Employees, annually, can generally choose to contribute to the plans at a rate of between 3% and 6% of their pensionable earnings. Generally, we match
100% of the contributions of employees up to 5% of their pensionable earnings and 80% of employee contributions greater than that. Membership in a defined contribution pension plan is generally voluntary until an employee’s third-year service anniversary. In the event that annual contributions exceed allowable maximums, excess amounts are in certain cases contributed to a non-registered supplementary defined contribution pension plan.
Other defined benefit plans
Other defined benefit plans, which are all non-contributory and, as at December 31, 2018 and 2017, non-funded, are comprised of a healthcare plan for retired employees and a life insurance plan, both of which ceased accepting new participants on January 1, 1997.
(a) Defined benefit pension plans – funded status overview
Information concerning our defined benefit pension plans, in aggregate is as follows:
As at December 31 (millions)
|
| 2018
|
| 2017
|
| ||
Present value of the defined benefit obligations |
|
|
|
|
| ||
Balance, beginning of year |
| $ | 9,419 |
| $ | 8,837 |
|
Current service cost |
| 108 |
| 100 |
| ||
Past service cost |
| 1 |
| (2 | ) | ||
Interest expense |
| 318 |
| 331 |
| ||
Actuarial loss (gain) arising from |
|
|
|
|
| ||
Demographic assumptions |
| (62 | ) | 77 |
| ||
Financial assumptions |
| (588 | ) | 526 |
| ||
Settlements |
| (16 | ) | – |
| ||
Benefits paid |
| (457 | ) | (450 | ) | ||
Balance, end of year |
| 8,723 |
| 9,419 |
| ||
Plan assets |
|
|
|
|
| ||
Fair value, beginning of year |
| 9,195 |
| 8,873 |
| ||
Return on plan assets |
|
|
|
|
| ||
Notional interest income on plan assets at discount rate |
| 306 |
| 330 |
| ||
Actual return on plan assets (less) greater than discount rate |
| (51 | ) | 360 |
| ||
Settlements |
| (16 | ) | – |
| ||
Contributions |
|
|
|
|
| ||
Employer contributions (d) |
| 52 |
| 66 |
| ||
Employees’ contributions |
| 20 |
| 22 |
| ||
Benefits paid |
| (457 | ) | (450 | ) | ||
Administrative fees |
| (6 | ) | (6 | ) | ||
Fair value, end of year |
| 9,043 |
| 9,195 |
| ||
Effect of asset ceiling limit |
|
|
|
|
| ||
Beginning of year |
| (110 | ) | (115 | ) | ||
Change |
| (153 | ) | 5 |
| ||
End of year |
| (263 | ) | (110 | ) | ||
Fair value of plan assets at end of year, net of asset ceiling limit |
| 8,780 |
| 9,085 |
| ||
Funded status – plan surplus (deficit) |
| $ | 57 |
| $ | (334 | ) |
The measurement date used to determine the plan assets and defined benefit obligations accrued was December 31.
(b) Defined benefit pension plans – details
Expense
Our defined benefit pension plan expense (recovery) was as follows:
Years ended December 31 (millions)
|
|
|
|
|
|
|
| 2018 |
|
|
|
|
|
|
| 2017 |
| ||||||||
|
| Employee |
|
|
| Other |
|
|
| Employee |
|
|
| Other |
|
|
| ||||||||
|
| benefits |
| Financing |
| comprehensive |
|
|
| benefits |
| Financing |
| comprehensive |
|
|
| ||||||||
|
| expense |
| costs |
| income |
|
|
| expense |
| costs |
| income |
|
|
| ||||||||
Recognized in |
| (Note 8) |
| (Note 9) |
| (Note 11) |
| Total |
| (Note 8) |
| (Note 9) |
| (Note 11) |
| Total |
| ||||||||
Current service cost |
| $ | 88 |
| $ | – |
| $ | – |
| $ | 88 |
| $ | 78 |
| $ | – |
| $ | – |
| $ | 78 |
|
Past service costs |
| 1 |
| – |
| – |
| 1 |
| (2 | ) | – |
| – |
| (2 | ) | ||||||||
Net interest; return on plan assets |
|
|
|
|
|
|
|
|
|
|
|
|
|
|
|
|
| ||||||||
Interest expense arising from defined benefit obligations accrued |
| – |
| 318 |
| – |
| 318 |
| – |
| 331 |
| – |
| 331 |
| ||||||||
Return, including interest income, on plan assets1 |
| – |
| (306 | ) | 51 |
| (255 | ) | – |
| (330 | ) | (360 | ) | (690 | ) | ||||||||
Interest effect on asset ceiling limit |
| – |
| 4 |
| – |
| 4 |
| – |
| 4 |
| – |
| 4 |
| ||||||||
|
| – |
| 16 |
| 51 |
| 67 |
| – |
| 5 |
| (360 | ) | (355 | ) | ||||||||
Administrative fees |
| 6 |
| – |
| – |
| 6 |
| 6 |
| – |
| – |
| 6 |
| ||||||||
Re-measurements arising from: |
|
|
|
|
|
|
|
|
|
|
|
|
|
|
|
|
| ||||||||
Demographic assumptions |
| – |
| – |
| (62 | ) | (62 | ) | – |
| – |
| 77 |
| 77 |
| ||||||||
Financial assumptions |
| – |
| – |
| (588 | ) | (588 | ) | – |
| – |
| 526 |
| 526 |
| ||||||||
|
| – |
| – |
| (650 | ) | (650 | ) | – |
| – |
| 603 |
| 603 |
| ||||||||
Changes in the effect of limiting net defined benefit assets to the asset ceiling |
| – |
| – |
| 149 |
| 149 |
| – |
| – |
| (9 | ) | (9 | ) | ||||||||
|
| $ | 95 |
| $ | 16 |
| $ | (450 | ) | $ | (339 | ) | $ | 82 |
| $ | 5 |
| $ | 234 |
| $ | 321 |
|
1 The interest income on the plan assets portion of the employee defined benefit plans net interest amount included in Financing costs reflects a rate of return on plan assets equal to the discount rate used in determining the defined benefit obligations accrued.
162 · TELUS 2018 ANNUAL REPORT
CONSOLIDATED FINANCIAL STATEMENTS: NOTE 15
Disaggregation of defined benefit pension plan funding status
Defined benefit obligations accrued are the actuarial present values of benefits attributed to employee services rendered to a particular date. Our disaggregation of defined benefit pension plan surpluses and deficits at year-end is as follows:
As at December 31 (millions)
|
|
|
|
|
|
|
| 2018
|
|
|
|
|
|
|
| 2017
|
| ||||||||
|
| Defined benefit |
|
|
|
|
| PBSR |
| Defined benefit |
|
|
|
|
| PBSR |
| ||||||||
|
| obligations |
|
|
| Difference |
| solvency |
| obligations |
|
|
| Difference |
| solvency |
| ||||||||
|
| accrued |
| Plan assets |
| (Notes 20, 27) |
| position | 1 | accrued |
| Plan assets |
| (Notes 20, 27) |
| position | 1 | ||||||||
Pension plans that have plan assets in excess of defined benefit obligations accrued |
| $ | 7,479 |
| $ | 7,982 |
| $ | 503 |
| $ | 360 |
| $ | 8,116 |
| $ | 8,272 |
| $ | 156 |
| $ | 451 |
|
Pension plans that have defined benefit obligations accrued in excess of plan assets |
|
|
|
|
|
|
|
|
|
|
|
|
|
|
|
|
| ||||||||
Funded |
| 1,038 |
| 798 |
| (240 | ) | (84 | ) | 1,099 |
| 813 |
| (286 | ) | (61 | ) | ||||||||
Unfunded |
| 206 |
| – |
| (206 | ) | N/A | 2 | 204 |
| – |
| (204 | ) | N/A | 2 | ||||||||
|
| 1,244 |
| 798 |
| (446 | ) | (84 | ) | 1,303 |
| 813 |
| (490 | ) | (61 | ) | ||||||||
|
| $ | 8,723 |
| $ | 8,780 |
| $ | 57 |
| $ | 276 |
| $ | 9,419 |
| $ | 9,085 |
| $ | (334 | ) | $ | 390 |
|
Defined benefit obligations accrued owed to: |
|
|
|
|
|
|
|
|
|
|
|
|
|
|
|
|
| ||||||||
Active members |
| $ | 1,960 |
|
|
|
|
|
|
| $ | 2,285 |
|
|
|
|
|
|
| ||||||
Deferred members |
| 469 |
|
|
|
|
|
|
| 560 |
|
|
|
|
|
|
| ||||||||
Pensioners |
| 6,294 |
|
|
|
|
|
|
| 6,574 |
|
|
|
|
|
|
| ||||||||
|
| $ | 8,723 |
|
|
|
|
|
|
| $ | 9,419 |
|
|
|
|
|
|
| ||||||
1 The Office of the Superintendent of Financial Institutions, by way of the Pension Benefits Standards Regulations, 1985 (PBSR) (see (d)), requires that a solvency valuation be performed on a periodic basis. The actual PBSR solvency positions are determined in conjunction with mid-year annual funding reports prepared by actuaries (see (d)); as a result, the PBSR solvency positions in this table as at December 31, 2018 and 2017, are interim estimates and updated estimates, respectively. The interim estimate as at December 31, 2017, was a net surplus of $255.
Interim estimated solvency ratios as at December 31, 2018, ranged from 94% to 106% (2017 – updated estimate is 95% to 108%; interim estimate was 90% to 105%) and the estimated three-year average solvency ratios, adjusted as required by the PBSR, ranged from 95% to 106% (2017 – updated estimate is 94% to 105%; interim estimate was 93% to 104%).
The solvency valuation effectively uses the fair value (excluding any asset ceiling limit effects) of the funded defined benefit pension plan assets (adjusted for theoretical wind-up expenses) to measure the solvency assets. Although the defined benefit obligations accrued and the solvency liabilities are calculated similarly, the assumptions used for each differ, primarily in respect of retirement ages and discount rates, and the solvency liabilities, due to the required assumption that each plan is terminated on the valuation date, do not reflect assumptions about future compensation levels. Relative to the experience-based estimates of retirement ages used for purposes of determining the defined benefit obligations accrued, the minimum no-consent retirement age used for solvency valuation purposes may result in either a greater or lesser pension liability, depending upon the provisions of each plan. The solvency positions in this table reflect composite weighted average discount rates of 3.00% (2017 – 3.00%). A hypothetical decrease of 25 basis points in the composite weighted average discount rate would result in a $303 decrease in the PBSR solvency position as at December 31, 2018 (2017 – $316); these sensitivities are hypothetical, should be used with caution, are calculated without changing any other assumption and generally cannot be extrapolated because changes in amounts may not be linear.
2 PBSR solvency position calculations are not required for the three pension plans arising from a pre-merger acquisition or for the non-registered, unfunded pension plans.
Fair value measurements
Information about the fair value measurements of our defined benefit pension plan assets, in aggregate, is as follows:
|
|
|
|
|
| Fair value measurements at reporting date using |
| ||||||||||||
|
|
|
|
|
| Quoted prices in active |
|
|
|
|
| ||||||||
|
| Total |
| markets for identical items |
| Other |
| ||||||||||||
As at December 31 (millions) |
| 2018 |
| 2017 |
| 2018 |
| 2017 |
| 2018 |
| 2017 |
| ||||||
Asset class |
|
|
|
|
|
|
|
|
|
|
|
|
| ||||||
Equity securities |
|
|
|
|
|
|
|
|
|
|
|
|
| ||||||
Canadian |
| $ | 1,048 |
| $ | 1,385 |
| $ | 821 |
| $ | 1,129 |
| $ | 227 |
| $ | 256 |
|
Foreign |
| 1,943 |
| 1,867 |
| 581 |
| 853 |
| 1,362 |
| 1,014 |
| ||||||
Debt securities |
|
|
|
|
|
|
|
|
|
|
|
|
| ||||||
Issued by national, provincial or local governments |
| 1,494 |
| 1,512 |
| 1,369 |
| 1,389 |
| 125 |
| 123 |
| ||||||
Corporate debt securities |
| 1,243 |
| 1,208 |
| – |
| – |
| 1,243 |
| 1,208 |
| ||||||
Asset-backed securities |
| 30 |
| 31 |
| – |
| – |
| 30 |
| 31 |
| ||||||
Commercial mortgages |
| 1,631 |
| 1,659 |
| – |
| – |
| 1,631 |
| 1,659 |
| ||||||
Cash, cash equivalents and other |
| 338 |
| 486 |
| 8 |
| 38 |
| 330 |
| 448 |
| ||||||
Real estate |
| 1,316 |
| 1,047 |
| – |
| – |
| 1,316 |
| 1,047 |
| ||||||
|
| 9,043 |
| 9,195 |
| $ | 2,779 |
| $ | 3,409 |
| $ | 6,264 |
| $ | 5,786 |
| ||
Effect of asset ceiling limit |
| (263 | ) | (110 | ) |
|
|
|
|
|
|
|
| ||||||
|
| $ | 8,780 |
| $ | 9,085 |
|
|
|
|
|
|
|
|
| ||||
TELUS 2018 ANNUAL REPORT · 163
As at December 31, 2018, pension benefit trusts that we administered held no TELUS Corporation Common Shares and held debt of TELUS Corporation with a fair value of approximately $2 million (2017 – $3 million) (see (c) – Allowable and prohibited investment types). As at December 31, 2018 and 2017, pension benefit trusts that we administered did not lease real estate to us.
Future benefit payments
Estimated future benefit payments from our defined benefit pension plans, calculated as at December 31, 2018, are as follows:
Years ending December 31 (millions) |
|
|
|
2019 |
| $ 455 |
|
2020 |
| 460 |
|
2021 |
| 466 |
|
2022 |
| 472 |
|
2023 |
| 476 |
|
2024–2028 |
| 2,451 |
|
(c) Plan investment strategies and policies
Our primary goal for the defined benefit pension plans is to ensure the security of the retirement income and other benefits of the plan members and their beneficiaries. A secondary goal is to maximize the long-term rate of return on the defined benefit plans’ assets within a level of risk acceptable to us.
Risk management
We consider absolute risk (the risk of contribution increases, inadequate plan surplus and unfunded obligations) to be more important than relative return risk. Accordingly, the defined benefit plans’ designs, the nature and maturity of defined benefit obligations and the characteristics of the plans’ memberships significantly influence investment strategies and policies. We manage risk by specifying allowable and prohibited investment types, setting diversification strategies and determining target asset allocations.
Allowable and prohibited investment types
Allowable and prohibited investment types, along with associated guidelines and limits, are set out in each plan’s required Statement of Investment Policies and Procedures (SIPP), which is reviewed and approved annually by the designated governing body. The SIPP guidelines and limits are further governed by the permitted investments and lending limits set out in the Pension Benefits Standards Regulations, 1985. As well as conventional investments, each fund’s SIPP may provide for the use of derivative products to facilitate investment operations and to manage risk, provided that no short position is taken, no use of leverage is made and no guidelines and limits established in the SIPP are violated. Internally and externally managed funds are not permitted to directly invest in our securities and are prohibited from increasing grandfathered investments in our securities; any such grandfathered investments were made prior to the merger of BC TELECOM Inc. and TELUS Corporation, our predecessors.
Diversification
Our strategy for investments in equity securities is to be broadly diversified across individual securities, industry sectors and geographical regions. A meaningful portion (20%–30% of total plan assets) of the plans’ investment in equity securities is allocated to foreign equity securities with the intent of further diversifying plan assets. Debt securities may include a meaningful allocation to mortgages, with the objective of enhancing
cash flow and providing greater scope for the management of the bond component of the plan assets. Debt securities also may include real return bonds to provide inflation protection, consistent with the indexed nature of some defined benefit obligations. Real estate investments are used to provide diversification of plan assets, hedging of potential long-term inflation and comparatively stable investment income.
Relationship between plan assets and benefit obligations
With the objective of lowering the long-term costs of our defined benefit pension plans, we purposely mismatch plan assets and benefit obligations. This mismatching is effected by including equity investments in the long-term asset mix, as well as fixed income securities and mortgages with durations that differ from those of the benefit obligations.
As at December 31, 2018, the present value-weighted average timing of estimated cash flows for the obligations (duration) of the defined benefit pension plans was 13.0 years (2017 – 13.9 years) and of the other defined benefit plans was 6.4 years (2017 – 6.8 years). Compensation for liquidity issues that may have otherwise arisen from the mismatching of plan assets and benefit obligations is provided by broadly diversified investment holdings (including cash and short-term investments) and cash flows from dividends, interest and rents from those diversified investment holdings.
Asset allocations
Our defined benefit pension plans’ target asset allocations and actual asset allocations are as follows:
|
| Target |
| Percentage of plan |
| ||
|
| allocation |
| assets at end of year |
| ||
Years ended December 31 |
| 2019 |
| 2018 |
| 2017 |
|
Equity securities |
| 25–55% |
| 33% |
| 35% |
|
Debt securities |
| 40–75% |
| 52% |
| 53% |
|
Real estate |
| 10–30% |
| 15% |
| 12% |
|
Other |
| 0–10% |
| – |
| – |
|
|
|
|
| 100% |
| 100% |
|
(d) Employer contributions
The determination of the minimum funding amounts necessary for substantially all of our registered defined benefit pension plans is governed by the Pension Benefits Standards Act, 1985, which requires that, in addition to current service costs being funded, both going-concern and solvency valuations be performed on a specified periodic basis.
· Any excess of plan assets over plan liabilities determined in the going-concern valuation reduces our minimum funding requirement for current service costs, but may not reduce the requirement to an amount less than the employees’ contributions. The going-concern valuation generally determines the excess (if any) of a plan’s assets over its liabilities on a projected benefit basis.
· As of the date of these consolidated financial statements, the solvency valuation generally requires that a plan’s average solvency liabilities, determined on the basis that the plan is terminated on the valuation date, in excess of its assets (if any) be funded, at a minimum, in equal annual amounts over a period not exceeding five years. So as to manage the risk of overfunding the plans, which results from the solvency valuation for funding purposes utilizing average solvency ratios, our funding may include the provision of letters of credit. As at December 31, 2018, undrawn letters of credit in the amount of $174 million (2017 – $188 million) secured certain obligations of the defined benefit pension plans, including non-registered, unfunded plans.
CONSOLIDATED FINANCIAL STATEMENTS: NOTE 15
Our best estimate of fiscal 2019 employer contributions to our defined benefit plans is approximately $36 million for defined benefit pension plans. This estimate is based upon the mid-year 2018 annual funding valuations that were prepared by actuaries using December 31, 2017, actuarial valuations. The funding reports are based on the pension plans’ fiscal years, which are calendar years. The next annual funding valuations are expected to be prepared mid-year 2019.
(e) Assumptions
As referred to in Note 1(b), management is required to make significant estimates related to certain actuarial and economic assumptions that are used in determining defined benefit pension costs, defined benefit obligations accrued and pension plan assets. These significant estimates are of a long-term nature, consistent with the nature of employee future benefits.
Demographic assumptions
In determining the defined benefit pension expense recognized in net income for the years ended December 31, 2018 and 2017, we utilized the Canadian Institute of Actuaries CPM 2014 mortality tables.
Financial assumptions
The discount rate, which is used to determine a plan’s defined benefit obligations accrued, is based upon the yield on long-term, high-quality fixed-term investments, and is set annually. The rate of future increases in compensation is based upon current benefits policies and economic forecasts.
The significant weighted average actuarial assumptions arising from these estimates and adopted in measuring our defined benefit obligations accrued are as follows:
|
| 2018 |
| 2017 |
|
Discount rate1 used to determine: |
|
|
|
|
|
Net benefit costs for the year ended December 31 |
| 3.40% |
| 3.80% |
|
Defined benefit obligations accrued as at December 31 |
| 3.90% |
| 3.40% |
|
Current service cost in subsequent fiscal year |
| 4.00% |
| 3.50% |
|
Rate of future increases in compensation used to determine: |
|
|
|
|
|
Net benefit costs for the year ended December 31 |
| 2.70% |
| 2.51% |
|
Defined benefit obligations accrued as at December 31 |
| 2.80% |
| 2.70% |
|
1 The discount rate disclosed in this table reflects the computation of an average discount rate that replicates the timing of the obligation cash flows.
Sensitivity of key assumptions
The sensitivity of our key assumptions for our defined benefit pension plans was as follows:
Years ended, or as at, December 31 |
|
|
| 2018 |
|
|
| 2017 |
| ||||
|
| Change in |
| Change in |
| Change in |
| Change in |
| ||||
Increase (decrease) (millions) |
| obligations |
| expenses |
| obligations |
| expenses |
| ||||
|
|
|
|
|
|
|
|
|
| ||||
Sensitivity of key demographic assumptions to an increase of one year1 in life expectancy |
| $ | 242 |
| $ | 11 |
| $ | 270 |
| $ | 10 |
|
Sensitivity of key financial assumptions to a hypothetical decrease of 25 basis points1 in: |
|
|
|
|
|
|
|
|
| ||||
Discount rate |
| $ | 292 |
| $ | 16 |
| $ | 337 |
| $ | 16 |
|
Rate of future increases in compensation |
| $ | (27 | ) | $ | (3 | ) | $ | (34 | ) | $ | (3 | ) |
1 These sensitivities are hypothetical and should be used with caution. Favourable hypothetical changes in the assumptions result in decreased amounts, and unfavourable hypothetical changes in the assumptions result in increased amounts, of the obligations and expenses. Changes in amounts based on a variation in assumptions of one year or 25 basis points generally cannot be extrapolated because the relationship of the change in assumption to the change in amounts may not be linear. Also, in this table, the effect of a variation in a particular assumption on the change in obligations or change in expenses is calculated without changing any other assumption; in reality, changes in one factor may result in changes in another (for example, increases in the discount rate may result in changes in expectations about the rate of future increases in compensation), which might magnify or counteract the sensitivities.
(f) Defined contribution plans – expense
Our total defined contribution pension plan costs recognized were as follows:
Years ended December 31 (millions)
|
| 2018
|
| 2017
|
| ||
Union pension plan and public service pension plan contributions |
| $ | 22 |
| $ | 23 |
|
Other defined contribution pension plans |
|
| 66 |
|
| 65 |
|
|
| $ | 88 |
| $ | 88 |
|
We expect that our 2019 union pension plan and public service pension plan contributions will be approximately $22 million.
(g) Other defined benefit plans
For the year ended December 31, 2018, other defined benefit plan current service cost was $NIL (2017 – $NIL), financing cost was $1 million (2017 – $1 million) and other re-measurements recorded in other comprehensive income were $2 million (2017 – $NIL). Estimated future benefit payments from our other defined benefit plans, calculated as at December 31, 2018, are $1 million annually for the five-year period from 2019 to 2023 and $6 million for the five-year period from 2024 to 2028.
|
|
16 | Restructuring and other costs |
|
|
(a) Details of restructuring and other costs
With the objective of reducing ongoing costs, we incur associated incremental non-recurring restructuring costs, as discussed further in (b) following. We may also incur atypical charges when undertaking major or transformational changes to our business or operating models or post-acquisition business integration. We include incremental atypical
external costs incurred in connection with business acquisition or disposition activity, as well as litigation costs, in the context of significant losses or settlements, in other costs.
Restructuring and other costs are presented in the Consolidated statements of income and other comprehensive income, as set out in the following table:
|
| Restructuring (b)
|
| Other (c) |
| Total | ||||||||||||
Years ended December 31 (millions)
|
| 2018 |
| 2017 |
| 2018 |
| 2017 |
| 2018 |
| 2017 | ||||||
|
|
|
|
|
|
|
| (adjusted – |
|
|
| (adjusted – | ||||||
Goods and services purchased |
| $ | 52 |
| $ | 66 |
| $ | 129 |
| $ | 15 |
| $ | 181 |
| $ | 81 |
Employee benefits expense |
| 126 |
| 26 |
| 10 |
| 10 |
| 136 |
| 36 | ||||||
|
| $ | 178 |
| $ | 92 |
| $ | 139 |
| $ | 25 |
| $ | 317 |
| $ | 117 |
(b) Restructuring provisions
Employee-related provisions and other provisions, as presented in Note 25, include amounts in respect of restructuring activities. In 2018, restructuring activities included ongoing and incremental efficiency initiatives, including personnel-related costs and rationalization of real estate. These initiatives were intended to improve our long-term operating productivity and competitiveness.
(c) Other
During the year ended December 31, 2018, incremental external costs were incurred in connection with business acquisition activity. In connection with business acquisitions, non-recurring atypical business integration expenditures that would be considered neither restructuring costs nor part of the fair value of the net assets acquired have been included in other costs. As well, we fundamentally transformed our operating model in respect of our philanthropic giving. We made an initial donation to the TELUS Friendly Future Foundation of $100 million of TELUS Corporation Common Shares; we have committed to subsequent donations of $18 million.
CONSOLIDATED FINANCIAL STATEMENTS: NOTES 16–17
|
|
17 | Property, plant and equipment |
|
|
|
|
|
|
|
| Buildings and |
|
|
|
|
|
|
|
|
| ||||||
|
|
|
| Network |
| leasehold |
|
|
|
|
| Assets under |
|
|
| ||||||
(millions) |
| Note |
| assets1 |
| improvements |
| Other1 |
| Land |
| construction |
| Total |
| ||||||
At cost |
|
|
|
|
|
|
|
|
|
|
|
|
|
|
| ||||||
As at January 1, 2017 |
|
|
| $ | 28,284 |
| $ | 2,954 |
| $ | 1,021 |
| $ | 55 |
| $ | 592 |
| $ | 32,906 |
|
Additions2 |
|
|
| 972 |
| 51 |
| 44 |
| – |
| 1,426 |
| 2,493 |
| ||||||
Additions arising from business acquisitions |
|
|
| 25 |
| 8 |
| 9 |
| – |
| – |
| 42 |
| ||||||
Dispositions, retirements and other |
|
|
| (1,724 | ) | (63 | ) | (48 | ) | (7 | ) | – |
| (1,842 | ) | ||||||
Assets under construction put into service |
|
|
| 1,167 |
| 127 |
| 69 |
| – |
| (1,363 | ) | – |
| ||||||
As at December 31, 2017 |
|
|
| 28,724 |
| 3,077 |
| 1,095 |
| 48 |
| 655 |
| 33,599 |
| ||||||
Additions2 |
|
|
| 1,039 |
| 27 |
| 37 |
| – |
| 1,265 |
| 2,368 |
| ||||||
Additions arising from business acquisitions |
| 18(b) |
| 4 |
| 13 |
| 9 |
| – |
| – |
| 26 |
| ||||||
Dispositions, retirements and other |
|
|
| (767 | ) | 56 |
| (52 | ) | – |
| – |
| (763 | ) | ||||||
Assets under construction put into service |
|
|
| 956 |
| 100 |
| 85 |
| – |
| (1,141 | ) | – |
| ||||||
As at December 31, 2018 |
|
|
| $ | 29,956 |
| $ | 3,273 |
| $ | 1,174 |
| $ | 48 |
| $ | 779 |
| $ | 35,230 |
|
Accumulated depreciation |
|
|
|
|
|
|
|
|
|
|
|
|
|
|
| ||||||
As at January 1, 2017 |
|
|
| $ | 19,950 |
| $ | 1,836 |
| $ | 656 |
| $ | – |
| $ | – |
| $ | 22,442 |
|
Depreciation |
|
|
| 1,396 |
| 106 |
| 115 |
| – |
| – |
| 1,617 |
| ||||||
Dispositions, retirements and other |
|
|
| (1,708 | ) | (58 | ) | (62 | ) | – |
| – |
| (1,828 | ) | ||||||
As at December 31, 2017 |
|
|
| 19,638 |
| 1,884 |
| 709 |
| – |
| – |
| 22,231 |
| ||||||
Depreciation |
|
|
| 1,431 |
| 115 |
| 123 |
| – |
| – |
| 1,669 |
| ||||||
Dispositions, retirements and other |
|
|
| (769 | ) | 51 |
| (43 | ) | – |
| – |
| (761 | ) | ||||||
As at December 31, 2018 |
|
|
| $ | 20,300 |
| $ | 2,050 |
| $ | 789 |
| $ | – |
| $ | – |
| $ | 23,139 |
|
Net book value |
|
|
|
|
|
|
|
|
|
|
|
|
|
|
| ||||||
As at December 31, 2017 |
|
|
| $ | 9,086 |
| $ | 1,193 |
| $ | 386 |
| $ | 48 |
| $ | 655 |
| $ | 11,368 |
|
As at December 31, 2018 |
|
|
| $ | 9,656 |
| $ | 1,223 |
| $ | 385 |
| $ | 48 |
| $ | 779 |
| $ | 12,091 |
|
1 As at December 31, 2018, the net carrying amount of assets under finance leases included in network assets was $100 (2017 – $NIL) and included in other was $1 (2017 – $NIL).
2 For the year ended December 31, 2018, additions include $(15) (2017 – $7) in respect of asset retirement obligations (see Note 25).
As at December 31, 2018, our contractual commitments for the acquisition of property, plant and equipment totalled $177 million over a period ending December 31, 2022 (2017 – $184 million over a period ending December 31, 2019).
TELUS 2018 ANNUAL REPORT · 167
|
|
18 | Intangible assets and goodwill |
|
|
(a) Intangible assets and goodwill, net
|
| Intangible assets subject to amortization |
| Intangible |
|
|
|
|
|
|
| |||||||||||||||||
|
| Customer |
|
|
|
|
|
|
|
|
| assets with |
|
|
|
|
|
|
| |||||||||
|
| contracts, |
|
|
|
|
|
|
|
|
| indefinite lives |
|
|
|
|
| Total |
| |||||||||
|
| related customer |
|
|
| Access to |
|
|
|
|
|
|
| Total |
|
|
| intangible |
| |||||||||
|
| relationships and |
|
|
| rights-of-way |
| Assets under |
|
|
| Spectrum |
| intangible |
|
|
| assets and |
| |||||||||
(millions) |
| subscriber base |
| Software |
| and other |
| construction |
| Total |
| licences |
| assets |
| Goodwill | 1 | goodwill |
| |||||||||
At cost |
|
|
|
|
|
|
|
|
|
|
|
|
|
|
|
|
|
|
| |||||||||
As at January 1, 2017 |
| $ | 485 |
| $ | 4,295 |
| $ | 93 |
| $ | 212 |
| $ | 5,085 |
| $ | 8,693 |
| $ | 13,778 |
| $ | 4,151 |
| $ | 17,929 |
|
Additions |
| – |
| 74 |
| 5 |
| 538 |
| 617 |
| – |
| 617 |
| – |
| 617 |
| |||||||||
Additions arising from business acquisitions |
| 134 |
| 101 |
| – |
| – |
| 235 |
| – |
| 235 |
| 452 |
| 687 |
| |||||||||
Dispositions, retirements and other |
| (61 | ) | (209 | ) | (1 | ) | – |
| (271 | ) | – |
| (271 | ) | – |
| (271 | ) | |||||||||
Assets under construction put into service |
| – |
| 406 |
| – |
| (406 | ) | – |
| – |
| – |
| – |
| – |
| |||||||||
Net foreign exchange differences |
| – |
| – |
| – |
| – |
| – |
| – |
| – |
| (3 | ) | (3 | ) | |||||||||
As at December 31, 2017 |
| 558 |
| 4,667 |
| 97 |
| 344 |
| 5,666 |
| 8,693 |
| 14,359 |
| 4,600 |
| 18,959 |
| |||||||||
Additions |
| – |
| 69 |
| 5 |
| 582 |
| 656 |
| 1 |
| 657 |
| – |
| 657 |
| |||||||||
Additions arising from business acquisitions (b) |
| 219 |
| 19 |
| – |
| – |
| 238 |
| – |
| 238 |
| 456 |
| 694 |
| |||||||||
Dispositions, retirements and other |
| (138 | ) | (248 | ) | 1 |
| – |
| (385 | ) | – |
| (385 | ) | – |
| (385 | ) | |||||||||
Assets under construction put into service |
| – |
| 585 |
| – |
| (585 | ) | – |
| – |
| – |
| – |
| – |
| |||||||||
Net foreign exchange differences |
| (1 | ) | – |
| – |
| – |
| (1 | ) | – |
| (1 | ) | 41 |
| 40 |
| |||||||||
As at December 31, 2018 |
| $ | 638 |
| $ | 5,092 |
| $ | 103 |
| $ | 341 |
| $ | 6,174 |
| $ | 8,694 |
| $ | 14,868 |
| $ | 5,097 |
| $ | 19,965 |
|
Accumulated amortization |
|
|
|
|
|
|
|
|
|
|
|
|
|
|
|
|
|
|
| |||||||||
As at January 1, 2017 |
| $ | 323 |
| $ | 3,032 |
| $ | 59 |
| $ | – |
| $ | 3,414 |
| $ | – |
| $ | 3,414 |
| $ | 364 |
| $ | 3,778 |
|
Amortization |
| 48 |
| 500 |
| 4 |
| – |
| 552 |
| – |
| 552 |
| – |
| 552 |
| |||||||||
Dispositions, retirements and other |
| (61 | ) | (202 | ) | (2 | ) | – |
| (265 | ) | – |
| (265 | ) | – |
| (265 | ) | |||||||||
As at December 31, 2017 |
| 310 |
| 3,330 |
| 61 |
| – |
| 3,701 |
| – |
| 3,701 |
| 364 |
| 4,065 |
| |||||||||
Amortization |
| 56 |
| 538 |
| 4 |
| – |
| 598 |
| – |
| 598 |
| – |
| 598 |
| |||||||||
Dispositions, retirements and other |
| (140 | ) | (247 | ) | – |
| – |
| (387 | ) | – |
| (387 | ) | – |
| (387 | ) | |||||||||
As at December 31, 2018 |
| $ | 226 |
| $ | 3,621 |
| $ | 65 |
| $ | – |
| $ | 3,912 |
| $ | – |
| $ | 3,912 |
| $ | 364 |
| $ | 4,276 |
|
Net book value |
|
|
|
|
|
|
|
|
|
|
|
|
|
|
|
|
|
|
| |||||||||
As at December 31, 2017 |
| $ | 248 |
| $ | 1,337 |
| $ | 36 |
| $ | 344 |
| $ | 1,965 |
| $ | 8,693 |
| $ | 10,658 |
| $ | 4,236 |
| $ | 14,894 |
|
As at December 31, 2018 |
| $ | 412 |
| $ | 1,471 |
| $ | 38 |
| $ | 341 |
| $ | 2,262 |
| $ | 8,694 |
| $ | 10,956 |
| $ | 4,733 |
| $ | 15,689 |
|
1 Accumulated amortization of goodwill is amortization recorded prior to 2002; there are no accumulated impairment losses in the accumulated amortization of goodwill. The goodwill additions arising from business acquisitions for the year ended December 31, 2017, have been adjusted as set out in (c).
As at December 31, 2018, our contractual commitments for the acquisition of intangible assets totalled $59 million over a period ending December 31, 2021 (2017 – $36 million over a period ending December 31, 2020).
168 · TELUS 2018 ANNUAL REPORT
CONSOLIDATED FINANCIAL STATEMENTS: NOTE 18
(b) Business acquisitions
AlarmForce Industries
On January 4, 2018, we acquired the customers, assets and operations of AlarmForce Industries Inc. in British Columbia, Alberta and Saskatchewan, the primary reason for which is to leverage our telecommunications infrastructure and expertise to continue to enhance connected home, business, security and health services for our customers.
The primary factor that contributed to the recognition of goodwill was the earnings capacity of the acquired business in excess of the net tangible and intangible assets acquired (such excess arising from the acquired workforce and the benefits of acquiring an established business). The amount assigned to goodwill is not expected to be deductible for income tax purposes.
Xavient Information Systems
On February 6, 2018, through our TELUS International (Cda) Inc. subsidiary, we acquired 65% of Xavient Information Systems, a group of information technology consulting and software services companies with facilities in the United States and India. The investment was made with a view to enhancing our ability to provide complex and higher-value information technology services, improving our related sales and solutioning capabilities and acquiring multi-site redundancy in support of other facilities.
In respect of the 65% acquired business, we concurrently provided a written put option to the remaining selling shareholders; the written put option for the remaining 35% of the economic interest would become exercisable no later than December 31, 2020. The acquisition-date fair value of the puttable shares held by the non-controlling shareholders has been recorded as a provision (see Note 25). Also concurrent with our
acquisition of the initial 65% interest, the non-controlling shareholders provided us with a purchased call option, which substantially mirrors the written put option.
The primary factor that contributed to the recognition of goodwill was the earnings capacity of the acquired business in excess of the net tangible and intangible assets acquired (such excess arising from the acquired workforce and the benefits of acquiring an established business). Not all of the amount assigned to goodwill is expected to be deductible for income tax purposes.
Medisys Health Group Inc.
On July 19, 2018, we acquired Medisys Health Group Inc., a business complementary to our existing lines of healthcare business. The investment was made with a view to growing the delivery of employee-centred workplace health and wellness services.
The primary factor that contributed to the recognition of goodwill was the earnings capacity of the acquired business in excess of the net tangible and intangible assets acquired (such excess arising from the acquired workforce and the benefits of acquiring an established business). None of the amount assigned to goodwill is expected to be deductible for income tax purposes.
Individually immaterial transactions
During the year ended December 31, 2018, we acquired 100% ownership of businesses complementary to our existing lines of business. The primary factor that gave rise to the recognition of goodwill was the earnings capacity of the acquired businesses in excess of the net tangible and intangible assets acquired (such excess arising from the low level of tangible assets relative to the earnings capacities of the businesses). A portion of the amounts assigned to goodwill may be deductible for income tax purposes.
Acquisition-date fair values
Acquisition-date fair values assigned to the assets acquired and liabilities assumed are set out in the following table:
|
| Home and business security-related |
|
|
| TELUS Health-related |
|
|
|
| |||||||||||||||||
|
|
|
| Individually |
|
|
| Xavient |
| Medisys |
| Individually |
|
|
| Individually |
|
| |||||||||
As at acquisition-date fair values |
| AlarmForce |
| immaterial |
|
|
| Information |
| Health |
| immaterial |
|
|
| immaterial |
|
| |||||||||
(millions) |
| Industries |
| transactions |
| Total |
| Systems |
| Group Inc. | 1 | transactions |
| Total |
| transactions |
| Total | |||||||||
Assets |
|
|
|
|
|
|
|
|
|
|
|
|
|
|
|
|
|
| |||||||||
Current assets |
|
|
|
|
|
|
|
|
|
|
|
|
|
|
|
|
|
| |||||||||
Cash |
| $ | – |
| $ | 1 |
| $ | 1 |
| $ | 8 |
| $ | 3 |
| $ | – |
| $ | 3 |
| $ | – |
| $ | 12 |
Accounts receivable2 |
| – |
| – |
| – |
| 33 |
| 15 |
| 2 |
| 17 |
| 4 |
| 54 | |||||||||
Other |
| 1 |
| – |
| 1 |
| 3 |
| 2 |
| – |
| 2 |
| – |
| 6 | |||||||||
|
| 1 |
| 1 |
| 2 |
| 44 |
| 20 |
| 2 |
| 22 |
| 4 |
| 72 | |||||||||
Non-current assets |
|
|
|
|
|
|
|
|
|
|
|
|
|
|
|
|
|
| |||||||||
Property, plant and equipment |
|
|
|
|
|
|
|
|
|
|
|
|
|
|
|
|
|
| |||||||||
Buildings and leasehold improvements |
| – |
| – |
| – |
| 1 |
| 12 |
| – |
| 12 |
| – |
| 13 | |||||||||
Other |
| 1 |
| – |
| 1 |
| 5 |
| 3 |
| – |
| 3 |
| 4 |
| 13 | |||||||||
Intangible assets subject to amortization3 |
|
|
|
|
|
|
|
|
|
|
|
|
|
|
|
|
|
| |||||||||
Customer contracts and related customer relationships |
| 13 |
| 13 |
| 26 |
| 100 |
| 72 |
| 10 |
| 82 |
| 11 |
| 219 | |||||||||
Software |
| – |
| – |
| – |
| – |
| 4 |
| 10 |
| 14 |
| 5 |
| 19 | |||||||||
Other |
| – |
| – |
| – |
| 4 |
| 1 |
| – |
| 1 |
| – |
| 5 | |||||||||
|
| 14 |
| 13 |
| 27 |
| 110 |
| 92 |
| 20 |
| 112 |
| 20 |
| 269 | |||||||||
Total identifiable assets acquired |
| 15 |
| 14 |
| 29 |
| 154 |
| 112 |
| 22 |
| 134 |
| 24 |
| 341 | |||||||||
Liabilities |
|
|
|
|
|
|
|
|
|
|
|
|
|
|
|
|
|
| |||||||||
Current liabilities |
|
|
|
|
|
|
|
|
|
|
|
|
|
|
|
|
|
| |||||||||
Short-term borrowings |
| – |
| – |
| – |
| 6 |
| 62 |
| – |
| 62 |
| – |
| 68 | |||||||||
Accounts payable and accrued liabilities |
| – |
| – |
| – |
| 29 |
| 13 |
| – |
| 13 |
| 4 |
| 46 | |||||||||
Advance billings and customer deposits |
| 1 |
| 1 |
| 2 |
| – |
| 5 |
| 1 |
| 6 |
| 1 |
| 9 | |||||||||
Provisions |
| – |
| – |
| – |
| – |
| 2 |
| – |
| 2 |
| – |
| 2 | |||||||||
|
| 1 |
| 1 |
| 2 |
| 35 |
| 82 |
| 1 |
| 83 |
| 5 |
| 125 | |||||||||
Non-current liabilities |
|
|
|
|
|
|
|
|
|
|
|
|
|
|
|
|
|
| |||||||||
Provisions |
| – |
| – |
| – |
| – |
| 1 |
| – |
| 1 |
| – |
| 1 | |||||||||
Other long-term liabilities |
| – |
| – |
| – |
| 2 |
| 8 |
| – |
| 8 |
| – |
| 10 | |||||||||
Deferred income taxes |
| 1 |
| 3 |
| 4 |
| – |
| 20 |
| – |
| 20 |
| – |
| 24 | |||||||||
|
| 1 |
| 3 |
| 4 |
| 2 |
| 29 |
| – |
| 29 |
| – |
| 35 | |||||||||
Total liabilities assumed |
| 2 |
| 4 |
| 6 |
| 37 |
| 111 |
| 1 |
| 112 |
| 5 |
| 160 | |||||||||
Net identifiable assets acquired |
| 13 |
| 10 |
| 23 |
| 117 |
| 1 |
| 21 |
| 22 |
| 19 |
| 181 | |||||||||
Goodwill |
| 55 |
| 47 |
| 102 |
| 244 |
| 83 |
| 16 |
| 99 |
| 11 |
| 456 | |||||||||
Net assets acquired |
| $ | 68 |
| $ | 57 |
| $ | 125 |
| $ | 361 |
| $ | 84 |
| $ | 37 |
| $ | 121 |
| $ | 30 |
| $ | 637 |
Acquisition effected by way of: |
|
|
|
|
|
|
|
|
|
|
|
|
|
|
|
|
|
| |||||||||
Cash consideration |
| $ | 68 |
| $ | 54 |
| $ | 122 |
| $ | 125 |
| $ | 3 |
| $ | 29 |
| $ | 32 |
| $ | 11 |
| $ | 290 |
Accounts payable and accrued liabilities |
| – |
| 3 |
| 3 |
| 15 |
| 2 |
| 3 |
| 5 |
| – |
| 23 | |||||||||
Provisions |
| – |
| – |
| – |
| 202 |
| – |
| 5 |
| 5 |
| – |
| 207 | |||||||||
Issue of TELUS Corporation |
|
|
|
|
|
|
|
|
|
|
|
|
|
|
|
|
|
| |||||||||
Common Shares |
| – |
| – |
| – |
| – |
| 79 |
| – |
| 79 |
| 19 |
| 98 | |||||||||
Issue of shares by a subsidiary to a non-controlling interest |
| – |
| – |
| – |
| 19 |
| – |
| – |
| – |
| – |
| 19 | |||||||||
|
| $ | 68 |
| $ | 57 |
| $ | 125 |
| $ | 361 |
| $ | 84 |
| $ | 37 |
| $ | 121 |
| $ | 30 |
| $ | 637 |
1 The purchase price allocation, primarily in respect of customer contracts, related customer relationships and leasehold interests and deferred income taxes, had not been finalized as of the date of issuance of these consolidated financial statements. As is customary in a business acquisition transaction, until the time of acquisition of control, we did not have full access to the books and records of Medisys Health Group Inc. Upon having sufficient time to review the books and records of Medisys Health Group Inc., we expect to finalize our purchase price allocation.
2 The fair value of accounts receivable is equal to the gross contractual amounts receivable and reflects the best estimates at the acquisition dates of the contractual cash flows expected to be collected.
3 Customer contracts and customer relationships (including those related to customer contracts) are expected to be amortized over periods of 6 to 10 years; software is expected to be amortized over a period of 5 years.
170 · TELUS 2018 ANNUAL REPORT
CONSOLIDATED FINANCIAL STATEMENTS: NOTE 18
Pro forma disclosures
The following pro forma supplemental information represents certain results of operations as if the business acquisitions noted above had been completed at the beginning of the fiscal 2018 year.
Year ended December 31, 2018 |
|
|
|
|
| ||
(millions except per share amounts) |
| As reported | 1 | Pro forma | 2 | ||
Operating revenues |
| $ | 14,368 |
| $ | 14,468 |
|
Net income |
| $ | 1,624 |
| $ | 1,628 |
|
Net income per Common Share |
|
|
|
|
|
|
|
Basic |
| $ | 2.68 |
| $ | 2.68 |
|
Diluted |
| $ | 2.68 |
| $ | 2.68 |
|
1 Operating revenues and net income for the year ended December 31, 2018, include: $17 and $NIL, respectively, in respect of AlarmForce Industries; $166 and $2, respectively, in respect of Xavient Information Systems; and $48 and $NIL, respectively, in respect of Medisys Health Group Inc.
2 Pro forma amounts for the year ended December 31, 2018, reflect the acquired businesses. The results of the acquired businesses have been included in our Consolidated statements of income and other comprehensive income effective the dates of acquisition.
The pro forma supplemental information is based on estimates and assumptions that are believed to be reasonable. The pro forma supplemental information is not necessarily indicative of our consolidated financial results in future periods or the actual results that would have been realized had the business acquisitions been completed at the beginning of the periods presented. The pro forma supplemental information includes incremental property, plant and equipment depreciation, intangible asset amortization, financing and other charges as a result of the acquisitions, net of the related tax effects.
(c) Business acquisition – prior period
On August 31, 2017, we acquired 55% of Voxpro Limited, a business process outsourcing and contact centre services company with facilities in Ireland, the United States and Romania. As at December 31, 2017, the purchase price allocation had not been finalized. During the three-month period ended March 31, 2018, preliminary acquisition-date values assigned
for goodwill and provisions were finalized and each was increased by $19 million; as required by IFRS-IASB, comparative amounts have been adjusted so as to reflect those increases effective the acquisition date.
(d) Business acquisition – subsequent to reporting period
On January 14, 2019, we acquired a business complementary to our existing telecommunications lines of business, for consideration consisting of cash of $89 million and TELUS Corporation Common Shares of $38 million. The investment was made with a view to growing our managed network, cloud, security and unified communications services.
As of February 14, 2019, our initial provision for the net identifiable assets acquired is in the range of $30 million – $40 million; as is customary in a business acquisition transaction, until the time of acquisition of control, we did not have full access to the books and records of the acquired business. Upon having sufficient time to review the books and records of the acquired business, as well as obtaining new and additional information about the related facts and circumstances as of the acquisition date, we will adjust the provisional amounts for identifiable assets acquired and liabilities assumed and thus finalize our purchase price allocation.
(e) Intangible assets with indefinite lives – spectrum licences
Our intangible assets with indefinite lives include spectrum licences granted by Innovation, Science and Economic Development Canada, which are used for the provision of both mobile and fixed wireless services. The spectrum licence policy terms indicate that the spectrum licences will likely be renewed. We expect our spectrum licences to be renewed every 20 years following a review of our compliance with licence terms. In addition to current usage, our licensed spectrum can be used for planned and new technologies. As a result of our assessment of the combination of these significant factors, we currently consider our spectrum licences to have indefinite lives and, as referred to in Note 1(b), this represents a significant judgment for us.
(f) Impairment testing of intangible assets with indefinite lives and goodwill
General
As referred to in Note 1(f), the carrying values of intangible assets with indefinite lives and goodwill are periodically tested for impairment and, as referred to in Note 1(b), this test represents a significant estimate for us, while also requiring significant judgments to be made.
The carrying values allocated to intangible assets with indefinite lives and goodwill are set out in the following table.
|
| Intangible assets |
|
|
|
|
|
|
|
| ||
|
| with indefinite lives |
| Goodwill |
| Total | ||||||
As at December 31 (millions) |
| 2018 |
| 2017 |
| 2018 |
| 2017 | 1 | 2018 |
| 2017 |
Wireless |
| $ 8,694 |
| $ 8,693 |
| $ 2,861 |
| $ 2,860 |
| $ 11,555 |
| $ 11,553 |
Wireline |
| – |
| – |
| 1,872 |
| 1,376 |
| 1,872 |
| 1,376 |
|
| $ 8,694 |
| $ 8,693 |
| $ 4,733 |
| $ 4,236 |
| $ 13,427 |
| $ 12,929 |
1 The goodwill balance for wireline as at December 31, 2017, has been adjusted as set out in (c).
The recoverable amounts of the cash-generating units’ assets have been determined based on a fair value less costs of disposal calculation. There is a material degree of uncertainty with respect to the estimates of the recoverable amounts of the cash-generating units’ assets, given the necessity of making key economic assumptions about the future. Recoverable amounts based on fair value less costs of disposal are categorized as Level 3 fair value measures.
We validate our recoverable amount calculation results through a market-comparable approach and an analytical review of industry facts and facts that are specific to us. The market-comparable approach uses current (at time of test) market consensus estimates and equity trading prices for U.S. and Canadian firms in the same industry. In addition, we ensure that the combination of the valuations of the cash-generating units is reasonable based on our current (at time of test) market value.
Key assumptions
The fair value less costs of disposal calculation uses discounted cash flow projections that employ the following key assumptions: future cash flows and growth projections (including judgments about the allocation of future capital expenditures to support both wireless and wireline operations); associated economic risk assumptions and estimates of the likelihood of achieving key operating metrics and drivers; estimates of future generational infrastructure capital expenditures; and the future weighted average cost of capital. We consider a range of reasonably possible amounts to use for key assumptions and decide upon amounts that represent management’s best estimates of market amounts. In the normal course, we make changes to key assumptions so that they reflect current (at time of test) economic conditions, updates of historical information used to develop the key assumptions and changes (if any) in our debt ratings.
The key assumptions for cash flow projections are based upon our approved financial forecasts, which span a period of three years and are discounted, for December 2018 annual impairment test purposes, at a consolidated post-tax notional rate of 7.0% (2017 – 7.0%). For impairment testing valuations, cash flows subsequent to the three-year projection period are extrapolated, for December 2018 annual impairment test purposes, using perpetual growth rates of 2.00% (2017 – 2.25%) for each
of the wireless cash-generating unit and the wireline cash-generating unit; these growth rates do not exceed the long-term average growth rates observed in the markets in which we operate.
We believe that any reasonably possible change in the key assumptions on which the calculation of the recoverable amounts of our cash-generating units is based would not cause the cash-generating units’ carrying values (including the intangible assets with indefinite lives and the goodwill allocated to each cash-generating unit) to exceed their recoverable amounts. If the future were to adversely differ from management’s best estimates for the key assumptions and associated cash flows were to be materially adversely affected, we could potentially experience future material impairment charges in respect of our intangible assets with indefinite lives and goodwill.
Sensitivity testing
Sensitivity testing was conducted as a part of the December 2018 annual impairment test, a component of which was hypothetical changes in the future weighted average cost of capital. Stress testing included a scenario of moderate declines in annual cash flows with all other assumptions being held constant; under this scenario, we would be able to recover the carrying values of our intangible assets with indefinite lives and goodwill for the foreseeable future.
|
|
19 | Leases |
|
|
We occupy leased premises in various locations and have the right of use of land, buildings and equipment under operating leases. Most of our leases for real estate that we use for office or network (including wireless site) purposes typically have extension options which we use to protect our investment in leasehold improvements (including wireless site equipment) and to mitigate relocation risk, and/or which reflect the importance of the underlying right-of-use lease assets to our operations. Our judgment of lease terms for leased real estate utilized in connection
with our telecommunications infrastructure, more so than for any other leased asset, routinely includes periods covered by options to extend the lease terms, as we are reasonably certain to extend such leases.
For the year ended December 31, 2018, operating lease expenses, which are net of the amortization of deferred gains on the sale-leaseback of buildings and the occupancy costs associated with leased real estate were $243 million (2017 – $245 million); occupancy costs associated with leased real estate totalled $99 million (2017 – $90 million).
As referred to in Note 16, we have consolidated our administrative real estate holdings and, in some instances, this has resulted in subletting land and buildings. The future minimum lease payments under operating leases are as follows:
As at December 31 (millions) |
|
|
|
|
| 2018 |
|
|
|
|
| 2017 | ||||||
|
| Operating |
| Operating |
|
|
| Operating |
| Operating |
|
| ||||||
|
| leases with |
| leases with |
|
|
| leases with |
| leases with |
|
| ||||||
|
| arm’s-length |
| related party |
|
|
| arm’s-length |
| related party |
|
| ||||||
Years ending |
| lessors | 1 | lessor | 2 | Total |
| lessors | 1 | lessors | 2 | Total | ||||||
1 year hence |
| $ | 240 |
| $ | 2 |
| $ | 242 |
| $ | 218 |
| $ | 6 |
| $ | 224 |
2 years hence |
| 222 |
| 6 |
| 228 |
| 191 |
| 12 |
| 203 | ||||||
3 years hence |
| 195 |
| 6 |
| 201 |
| 169 |
| 13 |
| 182 | ||||||
4 years hence |
| 161 |
| 6 |
| 167 |
| 147 |
| 13 |
| 160 | ||||||
5 years hence |
| 139 |
| 6 |
| 145 |
| 122 |
| 13 |
| 135 | ||||||
Thereafter |
| 681 |
| 112 |
| 793 |
| 534 |
| 208 |
| 742 | ||||||
|
| $ | 1,638 |
| $ | 138 |
| $ | 1,776 |
| $ | 1,381 |
| $ | 265 |
| $ | 1,646 |
1 Immaterial amounts for minimum lease receipts from sublet land and buildings have been netted against the minimum lease payments in this table. Minimum lease payments exclude occupancy costs and thus will differ from future amounts reported for operating lease expenses. As at December 31, 2018, commitments for occupancy costs under operating leases totalled $813 (2017 – $816).
2 As set out in Note 21(c), we have entered into leases with real estate joint ventures. This table includes 100% of the minimum lease payment amounts due under these leases; of the total, $46 (2017 – $109) is due to our economic interest in the real estate joint venture and $92 (2017 – $156) is due to our partners’ economic interests in the real estate joint venture.
172 · TELUS 2018 ANNUAL REPORT
CONSOLIDATED FINANCIAL STATEMENTS: NOTES 19–20
Of the total amount above as at December 31, 2018:
· Approximately 28% (2017 – 33%) was in respect of our five largest leases, all of which were for office premises over various terms, with expiry dates ranging from 2024 to 2039 (2017 – ranging from 2024 to 2036); the weighted average remaining term of these leases is approximately 13 years (2017 – 13 years).
· Approximately 34% (2017 – 29%) was in respect of wireless site leases; the weighted average remaining term of these leases is approximately 14 years (2017 – 14 years).
See Note 2(b) for details of significant changes to IFRS-IASB which are not yet effective and have not yet been applied, but which will significantly affect the timing of the recognition of operating lease expenses and their recognition in the Consolidated statement of financial position, as well as their classification in the Consolidated statement of income and other comprehensive income and the Consolidated statement of cash flows.
|
|
20 | Other long-term assets |
|
|
As at (millions) |
| Note |
| December 31, 2018 |
| December 31, 2017 |
| January 1, 2017 | |||
|
|
|
|
|
| (adjusted – Note 2(c)) |
| (Note 2(c)) | |||
Pension assets |
| 15(b) |
| $ | 503 |
| $ | 156 |
| $ | 358 |
Costs incurred to obtain or fulfill a contract with a customer |
|
|
| 110 |
| 107 |
| 93 | |||
Portfolio investments1 |
|
|
| 70 |
| 41 |
| 62 | |||
Prepaid maintenance |
|
|
| 55 |
| 57 |
| 62 | |||
Real estate joint venture advances |
| 21(c) |
| 69 |
| 47 |
| 21 | |||
Real estate joint ventures |
| 21(c) |
| 5 |
| 15 |
| 30 | |||
Derivative assets |
| 4(h) |
| 54 |
| 6 |
| 6 | |||
Other |
|
|
| 120 |
| 99 |
| 101 | |||
|
|
|
| $ | 986 |
| $ | 528 |
| $ | 733 |
1 Fair value measured at reporting date using significant other observable inputs (Level 2).
The costs incurred to obtain and fulfill contracts with customers are set out in the following table:
Years ended December 31 (millions) |
|
|
|
|
| 2018 |
|
|
|
|
| 2017 |
| ||||||
|
| Costs incurred to |
|
|
| Costs incurred to |
|
|
| ||||||||||
|
| Obtain |
| Fulfill |
|
|
| Obtain |
| Fulfill |
|
|
| ||||||
|
| contracts with |
| contracts with |
|
|
| contracts with |
| contracts with |
|
|
| ||||||
|
| customers |
| customers |
| Total |
| customers |
| customers |
| Total |
| ||||||
Balance, beginning of period |
|
|
|
|
|
|
|
|
|
|
|
|
| ||||||
As previously reported |
| $ | 329 |
| $ | 11 |
| $ | 340 |
| $ | – |
| $ | – |
| $ | – |
|
Transitional amount |
| – |
| – |
| – |
| 295 |
| 8 |
| 303 |
| ||||||
As adjusted |
| 329 |
| 11 |
| 340 |
| 295 |
| 8 |
| 303 |
| ||||||
Additions |
| 313 |
| 8 |
| 321 |
| 304 |
| 4 |
| 308 |
| ||||||
Amortization |
| (286 | ) | (4 | ) | (290 | ) | (270 | ) | (1 | ) | (271 | ) | ||||||
Balance, end of period |
| $ | 356 |
| $ | 15 |
| $ | 371 |
| $ | 329 |
| $ | 11 |
| $ | 340 |
|
Current1 |
| $ | 256 |
| $ | 5 |
| $ | 261 |
| $ | 230 |
| $ | 3 |
| $ | 233 |
|
Non-current |
| 100 |
| 10 |
| 110 |
| 99 |
| 8 |
| 107 |
| ||||||
|
| $ | 356 |
| $ | 15 |
| $ | 371 |
| $ | 329 |
| $ | 11 |
| $ | 340 |
|
1 Presented on the Consolidated statements of financial position in prepaid expenses.
TELUS 2018 ANNUAL REPORT · 173
|
|
21 | Real estate joint ventures |
|
|
(a) General
In 2011, we partnered, as equals, with an arm’s-length party in a residential condominium, retail and commercial real estate redevelopment project, TELUS Garden, in Vancouver, British Columbia. TELUS is a tenant in TELUS Garden, which is now our global headquarters. During the year ended December 31, 2018, the real estate joint venture sold the income-producing properties and the related net assets.
The purchaser assumed the 3.7% mortgage and the 3.4% bonds secured by the income-producing properties.
In 2013, we partnered, as equals, with two arm’s-length parties (one of which is our TELUS Garden partner) in a residential, retail and commercial real estate redevelopment project, TELUS Sky, in Calgary, Alberta. The new-build tower, scheduled for completion in 2019, is to be built to the LEED Platinum standard.
(b) Real estate joint ventures – summarized financial information
As at December 31 (millions) |
| 2018 |
| 2017 |
| ||
Assets |
|
|
|
|
| ||
Current assets |
|
|
|
|
| ||
Cash and temporary investments, net |
| $ | 11 |
| $ | 20 |
|
Escrowed deposits for tenant inducements and liens |
| 4 |
| 1 |
| ||
Other |
| 2 |
| 4 |
| ||
|
| 17 |
| 25 |
| ||
Non-current assets |
|
|
|
|
| ||
Property under development – investment property |
| 256 |
| 194 |
| ||
Investment property |
| – |
| 221 |
| ||
Other |
| – |
| 35 |
| ||
|
| 256 |
| 450 |
| ||
|
|
|
|
|
| ||
|
|
|
|
|
| ||
|
|
|
|
|
| ||
|
|
|
|
|
| ||
|
|
|
|
|
| ||
|
| $ | 273 |
| $ | 475 |
|
As at December 31 (millions) |
| 2018 |
| 2017 |
| ||
Liabilities and owners’ equity |
|
|
|
|
| ||
Current liabilities |
|
|
|
|
| ||
Accounts payable and accrued liabilities |
| $ | 19 |
| $ | 13 |
|
Current portion of 3.7% mortgage and senior secured 3.4% bonds |
| – |
| 5 |
| ||
Construction holdback liabilities |
| 15 |
| 10 |
| ||
|
| 34 |
| 28 |
| ||
Non-current liabilities |
|
|
|
|
| ||
Construction credit facilities |
| 207 |
| 141 |
| ||
3.7% mortgage due September 2024 |
| – |
| 27 |
| ||
Senior secured 3.4% bonds due July 2025 |
| – |
| 208 |
| ||
|
| 207 |
| 376 |
| ||
|
| 241 |
| 404 |
| ||
Owners’ equity |
|
|
|
|
| ||
TELUS1 |
| 13 |
| 29 |
| ||
Other partners |
| 19 |
| 42 |
| ||
|
| 32 |
| 71 |
| ||
|
| $ | 273 |
| $ | 475 |
|
1 The equity amounts recorded by the real estate joint venture differ from those recorded by us by the amount of the deferred gains on our real estate contributed and the valuation provision we have recorded in excess of that recorded by the real estate joint venture.
Years ended December 31 (millions) |
| 2018 |
| 2017 |
| ||
Revenue |
|
|
|
|
| ||
From investment property |
| $ | 21 |
| $ | 34 |
|
From sale of residential condominiums |
| $ | – |
| $ | 19 |
|
Other operating income |
| $ | 345 |
| $ | – |
|
Depreciation and amortization |
| $ | 5 |
| $ | 8 |
|
Interest expense1 |
| $ | 6 |
| $ | 8 |
|
Net income and comprehensive income2 |
| $ | 322 |
| $ | (6 | ) |
1 During the year ended December 31, 2018, the real estate joint ventures capitalized $8 (2017 – $3) of financing costs.
2 As the real estate joint ventures are partnerships, no provision for income taxes of the partners is made in determining the real estate joint ventures’ net income and comprehensive income.
CONSOLIDATED FINANCIAL STATEMENTS: NOTE 21
(c) Our real estate joint ventures activity
Our real estate joint ventures investment activity is set out in the following table.
Years ended December 31 (millions) |
|
|
|
|
| 2018 |
|
|
|
|
| 2017 |
|
| Loans and |
|
|
|
|
| Loans and |
|
|
|
|
|
| receivables | 1 | Equity | 2 | Total |
| Receivables | 1 | Equity | 2 | Total |
Related to real estate joint ventures’ statements of income and other comprehensive income |
|
|
|
|
|
|
|
|
|
|
|
|
Comprehensive income attributable to us3 |
| $ – |
| $ 171 |
| $ 171 |
| $ – |
| $ 2 |
| $ 2 |
Related to real estate joint ventures’ statements of financial position |
|
|
|
|
|
|
|
|
|
|
|
|
Items not affecting currently reported cash flows |
|
|
|
|
|
|
|
|
|
|
|
|
Recognition of gain deferred on our real estate initially contributed |
| – |
| – |
| – |
| – |
| 1 |
| 1 |
Construction credit facilities financing costs charged by us and other (Note 7) |
| 3 |
| – |
| 3 |
| – |
| – |
| – |
Cash flows in the current reporting period |
|
|
|
|
|
|
|
|
|
|
|
|
Construction credit facilities |
|
|
|
|
|
|
|
|
|
|
|
|
Amounts advanced |
| 22 |
| – |
| 22 |
| 26 |
| – |
| 26 |
Financing costs paid to us |
| (3 | ) | – |
| (3 | ) | – |
| – |
| – |
Funds repaid to us and earnings distributed |
| – |
| (181 | ) | (181 | ) | – |
| (18 | ) | (18) |
Net increase (decrease) |
| 22 |
| (10 | ) | 12 |
| 26 |
| (15 | ) | 11 |
Real estate joint ventures carrying amounts |
|
|
|
|
|
|
|
|
|
|
|
|
Balance, beginning of period |
| 47 |
| 15 |
| 62 |
| 21 |
| 30 |
| 51 |
Balance, end of period |
| $ 69 |
| $ 5 |
| $ 74 |
| $ 47 |
| $ 15 |
| $ 62 |
1 Loans and receivables are included in our Consolidated statements of financial position as Real estate joint venture advances and are comprised of advances under construction credit facilities (see (d)).
2 We account for our interests in the real estate joint ventures using the equity method of accounting.
3 As the real estate joint ventures are partnerships, no provision for income taxes of the partners is made in determining the real estate joint ventures’ net income and comprehensive income; a provision for income taxes is made in determining the comprehensive income attributable to us.
Prior to the sale of the TELUS Garden income-producing properties, during the year ended December 31, 2018, the TELUS Garden real estate joint venture recognized $7 million (2017 – $12 million) of revenue from our TELUS Garden office tenancy; of this amount, one-half was due to our economic interest in the real estate joint venture and one-half was due to our partner’s economic interest in the real estate joint venture.
(d) Commitments and contingent liabilities
Construction commitments
The TELUS Sky real estate joint venture is expected to spend a total of approximately $400 million on the construction of a mixed-use tower. As at December 31, 2018, the real estate joint venture’s construction-related contractual commitments were approximately $35 million through to 2019 (2017 – $82 million through to 2019).
Construction credit facilities
The TELUS Sky real estate joint venture has a credit agreement with three Canadian financial institutions (as 662/3% lender) and TELUS Corporation (as 331/3% lender) to provide $342 million of construction financing for the project. The construction credit facilities contain customary real estate construction financing representations, warranties and covenants and are secured by demand debentures constituting
first fixed and floating charge mortgages over the underlying real estate assets. The construction credit facilities are available by way of bankers’ acceptance or prime loan and bear interest at rates in line with similar construction financing facilities.
As at December 31 (millions) |
| Note |
| 2018 |
| 2017 |
Construction credit facilities commitment – TELUS Corporation |
|
|
|
|
|
|
Undrawn |
| 4(c) |
| $ 45 |
| $ 67 |
Advances |
|
|
| 69 |
| 47 |
|
|
|
| 114 |
| 114 |
Construction credit facilities commitment – other |
|
|
| 228 |
| 228 |
|
|
|
| $ 342 |
| $ 342 |
22 | Short-term borrowings |
On July 26, 2002, one of our subsidiaries, TELUS Communications Inc., entered into an agreement with an arm’s-length securitization trust associated with a major Schedule I bank under which it is able to sell an interest in certain trade receivables up to a maximum of $500 million (2017 –$500 million). The term of this revolving-period securitization agreement ends December 31, 2021 (2017 – December 31, 2018), and it requires minimum cash proceeds of $100 million from monthly sales of interests in certain trade receivables. TELUS Communications Inc. is required to maintain a credit rating of at least BB (2017 – BB) from Dominion Bond Rating Service or the securitization trust may require the sale program to be wound down prior to the end of the term.
Sales of trade receivables in securitization transactions are recognized as collateralized short-term borrowings and thus do not result in our de-recognition of the trade receivables sold. When we sell our trade receivables, we retain reserve accounts, which are retained interests in the securitized trade receivables, and servicing rights. As at December 31, 2018, we had sold to the trust (but continued to recognize) trade receivables of $120 million (2017 – $119 million). Short-term borrowings of $100 million (2017 – $100 million) are comprised of amounts advanced to us by the arm’s-length securitization trust pursuant to the sale of trade receivables.
The balance of short-term borrowings (if any) is comprised of amounts drawn on our bilateral bank facilities.
23 | Accounts payable and accrued liabilities |
As at December 31 (millions) |
| 2018 |
| 2017 |
Accrued liabilities |
| $ 1,159 |
| $ 1,066 |
Payroll and other employee-related liabilities |
| 429 |
| 403 |
Restricted stock units liability |
| 72 |
| 66 |
|
| 1,660 |
| 1,535 |
Trade accounts payable |
| 686 |
| 717 |
Interest payable |
| 157 |
| 147 |
Other |
| 67 |
| 61 |
|
| $ 2,570 |
| $ 2,460 |
24 | Advance billings and customer deposits |
|
| December 31, |
| December 31, |
| January 1, |
As at (millions) |
| 2018 |
| 2017 |
| 2017 |
|
|
|
| (adjusted – |
| (Note 2(c)) |
|
|
|
| Note 2(c)) |
|
|
Advance billings |
| $ 535 |
| $ 506 |
| $ 456 |
Deferred customer activation and connection fees |
| 10 |
| 13 |
| 17 |
Customer deposits |
| 13 |
| 21 |
| 15 |
Regulatory deferral accounts |
| – |
| 1 |
| 8 |
Contract liabilities |
| 558 |
| 541 |
| 496 |
Other |
| 95 |
| 91 |
| 88 |
|
| $ 653 |
| $ 632 |
| $ 584 |
Contract liabilities represent our future performance obligations to customers in respect of services and/or equipment and for which we have received consideration from the customer or for which an amount is due from the customer. Our contract liability balances, and the changes in those balances, are set out in the following table:
Years ended December 31 (millions) |
| Note |
| 2018 |
| 2017 |
|
Balance, beginning of period |
|
|
| $ 780 |
| $ 732 |
|
Revenue deferred in previous period and recognized in current period |
|
|
| (689 | ) | (670 | ) |
Net additions arising from operations |
|
|
| 708 |
| 718 |
|
Regulatory deferral account drawdown |
|
|
| – |
| (7 | ) |
Additions arising from business combinations |
| 18(b) |
| 9 |
| 7 |
|
Balance, end of period |
|
|
| $ 808 |
| $ 780 |
|
Current |
|
|
| $ 715 |
| $ 691 |
|
Non-current |
| 27 |
|
|
|
|
|
Deferred revenues |
|
|
| 78 |
| 71 |
|
Deferred customer activation and connection fees |
|
|
| 15 |
| 18 |
|
|
|
|
| $ 808 |
| $ 780 |
|
Reconciliation of contract liabilities presented in the consolidated statements of financial position – current |
|
|
|
|
|
|
|
Gross contract liabilities |
|
|
| $ 715 |
| $ 691 |
|
Reclassification to contract assets for contracts with contract liabilities less than contract assets |
|
|
| (154 | ) | (146 | ) |
Reclassification from contract assets for contracts with contract assets less than contract liabilities |
|
|
| (3 | ) | (4 | ) |
|
|
|
| $ 558 |
| $ 541 |
|
CONSOLIDATED FINANCIAL STATEMENTS: NOTES 22–25
|
|
25 | Provisions |
|
|
|
| Asset |
|
|
|
|
|
|
|
|
|
|
| retirement |
| Employee- |
| Written put |
|
|
|
|
|
(millions) |
| obligation |
| related |
| Options | 1 | Other |
| Total |
|
As at January 1, 2017 |
| $ 339 |
| $ 77 |
| $ – |
| $ 103 |
| $ 519 |
|
Additions |
| 13 |
| 39 |
| 90 |
| 58 |
| 200 |
|
Reversal |
| (53 | ) | (5 | ) | (11 | ) | (1 | ) | (70 | ) |
Use |
| (6 | ) | (75 | ) | – |
| (40 | ) | (121 | ) |
Interest effect2 |
| 58 |
| – |
| 2 |
| – |
| 60 |
|
Effects of foreign exchange, net |
| – |
| – |
| 1 |
| – |
| 1 |
|
As at December 31, 2017 |
| 351 |
| 36 |
| 82 |
| 120 |
| 589 |
|
Additions |
| 6 |
| 124 |
| 207 |
| 72 |
| 409 |
|
Reversal |
| – |
| – |
| (17 | ) | (5 | ) | (22 | ) |
Use |
| (10 | ) | (72 | ) | (13 | ) | (44 | ) | (139 | ) |
Interest effect2 |
| (11 | ) | – |
| 10 |
| – |
| (1 | ) |
Effects of foreign exchange, net |
| – |
| – |
| 21 |
| – |
| 21 |
|
As at December 31, 2018 |
| $ 336 |
| $ 88 |
| $ 290 |
| $ 143 |
| $ 857 |
|
Current |
| $ 6 |
| $ 35 |
| $ – |
| $ 37 |
| $ 78 |
|
Non-current |
| 345 |
| 1 |
| 82 |
| 83 |
| 511 |
|
As at December 31, 2017 |
| $ 351 |
| $ 36 |
| $ 82 |
| $ 120 |
| $ 589 |
|
Current |
| $ 8 |
| $ 84 |
| $ 9 |
| $ 28 |
| $ 129 |
|
Non-current |
| 328 |
| 4 |
| 281 |
| 115 |
| 728 |
|
As at December 31, 2018 |
| $ 336 |
| $ 88 |
| $ 290 |
| $ 143 |
| $ 857 |
|
1 The additions for the year ended December 31, 2017, for written put options have been adjusted as set out in Note 18(c).
2 The difference of $(22) (2017 – $47) between the asset retirement obligation interest effect in this table and the amount included in the amount disclosed in Note 9 is in respect of the change in the discount rates applicable to the provision, such difference being included in the cost of the associated asset(s) by way of being included with (netted against) the additions detailed in Note 17.
Asset retirement obligation
We establish provisions for liabilities associated with the retirement of property, plant and equipment when those obligations result from the acquisition, construction, development and/or normal operation of the assets. We expect that the cash outflows in respect of the balance accrued as at the financial statement date will occur proximate to the dates these assets are retired.
Employee-related
The employee-related provisions are largely in respect of restructuring activities (as discussed further in Note 16(b)). The timing of the cash outflows in respect of the balance accrued as at the financial statement date is substantially short-term in nature.
Written put options
In connection with certain business acquisitions, we have established provisions for contingent consideration and for written put options in respect of non-controlling interests. Cash outflows for contingent consideration are expected on a current basis. Provisions for written put options are determined based on the net present value of estimated future earnings results and require us to make key economic assumptions about the future. No cash outflows for the written put options are expected prior to their initial exercisability in 2020.
Other
The provisions for other include: legal claims; non-employee-related restructuring activities; and contract termination costs and onerous contracts related to business acquisitions. Other than as set out following, we expect that the cash outflows in respect of the balance accrued as at the financial statement date will occur over an indeterminate multi-year period.
As discussed further in Note 29, we are involved in a number of legal claims and we are aware of certain other possible legal claims.
In respect of legal claims, we establish provisions, when warranted, after taking into account legal assessments, information presently available, and the expected availability of recourse. The timing of cash outflows associated with legal claims cannot be reasonably determined.
In connection with business acquisitions, we have established provisions for contingent consideration, contract termination costs and onerous contracts acquired.
26 | Long-term debt |
(a) Details of long-term debt
As at December 31 (millions) |
| Note |
| 2018 |
| 2017 |
TELUS Corporation notes |
| (b) |
| $ 12,186 |
| $ 11,561 |
TELUS Corporation commercial paper |
| (c) |
| 774 |
| 1,140 |
TELUS Communications Inc. debentures |
| (e) |
| 620 |
| 620 |
TELUS International (Cda) Inc. credit facility |
| (f) |
| 419 |
| 339 |
Finance leases |
| (g) |
| 102 |
| – |
Long-term debt |
|
|
| $ 14,101 |
| $ 13,660 |
Current |
|
|
| $ 836 |
| $ 1,404 |
Non-current |
|
|
| 13,265 |
| 12,256 |
Long-term debt |
|
|
| $ 14,101 |
| $ 13,660 |
(b) TELUS Corporation notes
The notes are senior unsecured and unsubordinated obligations and rank equally in right of payment with all of our existing and future unsecured unsubordinated obligations, are senior in right of payment to all of our existing and future subordinated indebtedness, and are effectively subordinated to all existing and future obligations of, or guaranteed by, our subsidiaries. The indentures governing the notes contain certain covenants that, among other things, place limitations on our ability, and the ability of certain of our subsidiaries, to: grant security in respect of indebtedness; enter into sale-leaseback transactions; and incur new indebtedness.
CONSOLIDATED FINANCIAL STATEMENTS: NOTE 26
|
|
|
|
|
|
|
|
|
| Principal face amount |
| Redemption | ||||
|
|
|
|
|
|
|
| Effective |
|
|
| Outstanding |
| present value spread | ||
|
|
|
|
|
|
|
| interest |
| Originally |
| at financial |
| Basis |
|
|
Series1 |
| Issued |
| Maturity |
| Issue price |
| rate | 2 | issued |
| statement date |
| points |
| Cessation date |
5.05% Notes, Series CG |
| December 2009 |
| December 20193 |
| $994.19 |
| 5.13% |
| $1.0 billion |
| $NIL |
| 45.54 |
| N/A |
5.05% Notes, Series CH |
| July 2010 |
| July 2020 |
| $997.44 |
| 5.08% |
| $1.0 billion |
| $1.0 billion |
| 474 |
| N/A |
3.35% Notes, Series CJ |
| December 2012 |
| March 2023 |
| $998.83 |
| 3.36% |
| $500 million |
| $500 million |
| 405 |
| Dec. 15, 2022 |
3.35% Notes, Series CK |
| April 2013 |
| April 2024 |
| $994.35 |
| 3.41% |
| $1.1 billion |
| $1.1 billion |
| 365 |
| Jan. 2, 2024 |
4.40% Notes, Series CL |
| April 2013 |
| April 2043 |
| $997.68 |
| 4.41% |
| $600 million |
| $600 million |
| 475 |
| Oct. 1, 2042 |
3.60% Notes, Series CM |
| November 2013 |
| January 2021 |
| $997.15 |
| 3.65% |
| $400 million |
| $400 million |
| 355 |
| N/A |
5.15% Notes, Series CN |
| November 2013 |
| November 2043 |
| $995.00 |
| 5.18% |
| $400 million |
| $400 million |
| 505 |
| May 26, 2043 |
3.20% Notes, Series CO |
| April 2014 |
| April 2021 |
| $997.39 |
| 3.24% |
| $500 million |
| $500 million |
| 305 |
| Mar. 5, 2021 |
4.85% Notes, Series CP |
| Multiple6 |
| April 2044 |
| $987.91 | 6 | 4.93% | 6 | $500 million | 6 | $900 million | 6 | 465 |
| Oct. 5, 2043 |
3.75% Notes, Series CQ |
| September 2014 |
| January 2025 |
| $997.75 |
| 3.78% |
| $800 million |
| $800 million |
| 38.55 |
| Oct. 17, 2024 |
4.75% Notes, Series CR |
| September 2014 |
| January 2045 |
| $992.91 |
| 4.80% |
| $400 million |
| $400 million |
| 51.55 |
| July 17, 2044 |
1.50% Notes, Series CS |
| March 2015 |
| March 2018 |
| $999.62 |
| 1.51% |
| $250 million |
| $NIL |
| N/A7 |
| N/A |
2.35% Notes, Series CT |
| March 2015 |
| March 2022 |
| $997.31 |
| 2.39% |
| $1.0 billion |
| $1.0 billion |
| 35.55 |
| Feb. 28, 2022 |
4.40% Notes, Series CU |
| March 2015 |
| January 2046 |
| $999.72 |
| 4.40% |
| $500 million |
| $500 million |
| 60.55 |
| July 29, 2045 |
3.75% Notes, Series CV |
| December 2015 |
| March 2026 |
| $992.14 |
| 3.84% |
| $600 million |
| $600 million |
| 53.55 |
| Dec. 10, 2025 |
2.80% U.S. Dollar Notes8 |
| September 2016 |
| February 2027 |
| US$991.89 |
| 2.89% |
| US$600 million |
| US$600 million |
| 209 |
| Nov. 16, 2026 |
3.70% U.S. Dollar Notes10 |
| March 2017 |
| September 2027 |
| US$998.95 |
| 3.71% |
| US$500 million |
| US$500 million |
| 209 |
| June 15, 2027 |
4.70% Notes, Series CW |
| Multiple11 |
| March 2048 |
| $998.06 | 11 | 4.71% | 11 | $325 million | 11 | $475 million | 11 | 58.55 |
| Sept. 6, 2047 |
3.625% Notes, Series CX |
| February 2018 |
| March 2028 |
| $989.49 |
| 3.75% |
| $600 million |
| $600 million |
| 375 |
| Dec. 1, 2027 |
4.60% U.S. Dollar Notes12 |
| June 2018 |
| November 2048 |
| US$987.60 |
| 4.68% |
| US$750 million |
| US$750 million |
| 259 |
| May 16, 2048 |
1 | Interest is payable semi-annually. The notes require us to make an offer to repurchase the notes at a price equal to 101% of their principal amount plus accrued and unpaid interest to the date of repurchase upon the occurrence of a change in control triggering event, as defined in the supplemental trust indenture. |
2 | The effective interest rate is that which the notes would yield to an initial debt holder if held to maturity. |
3 | On June 28, 2018, we exercised our right to early redeem, on August 1, 2018, all of our 5.05% Notes, Series CG. The long-term debt prepayment premium recorded in the three-month period ended September 30, 2018, was $34 million before income taxes (see Note 9). |
4 | The notes are redeemable at our option, in whole at any time, or in part from time to time, on not fewer than 30 and not more than 60 days’ prior notice. The redemption price is equal to the greater of (i) the present value of the notes discounted at the Government of Canada yield plus the redemption present value spread, or (ii) 100% of the principal amount thereof. In addition, accrued and unpaid interest, if any, will be paid to the date fixed for redemption. |
5 | At any time prior to the respective maturity dates set out in the table, the notes are redeemable at our option, in whole at any time, or in part from time to time, on not fewer than 30 and not more than 60 days’ prior notice. The redemption price is equal to the greater of (i) the present value of the notes discounted at the Government of Canada yield plus the redemption present value spread calculated over the period to maturity, other than in the case of the Series CT, Series CU, Series CW and Series CX notes, for which it is calculated over the period to the redemption present value spread cessation date, or (ii) 100% of the principal amount thereof. In addition, accrued and unpaid interest, if any, will be paid to the date fixed for redemption. On or after the respective redemption present value spread cessation dates set out in the table, the notes are redeemable at our option, in whole but not in part, on not fewer than 30 and not more than 60 days’ prior notice, at redemption prices equal to 100% of the principal amounts thereof. |
6 | $500 million of 4.85% Notes, Series CP were issued in April 2014 at an issue price of $998.74 and an effective interest rate of 4.86%. This series of notes was reopened in December 2015 and a further $400 million of notes were issued at an issue price of $974.38 and an effective interest rate of 5.02%. |
7 | The notes were not redeemable at our option, other than in the event of certain changes in tax laws. |
8 | We have entered into a foreign exchange derivative (a cross currency interest rate exchange agreement) that effectively converted the principal payments and interest obligations to Canadian dollar obligations with a fixed interest rate of 2.95% and an issued and outstanding amount of $792 million (reflecting a fixed exchange rate of $1.3205). |
9 | At any time prior to the respective maturity dates set out in the table, the notes are redeemable at our option, in whole at any time, or in part from time to time, on not fewer than 30 and not more than 60 days’ prior notice. The redemption price is equal to the greater of (i) the present value of the notes discounted at the U.S. Adjusted Treasury Rate plus the redemption present value spread calculated over the period to the redemption present value spread cessation date, or (ii) 100% of the principal amount thereof. In addition, accrued and unpaid interest, if any, will be paid to the date fixed for redemption. On or after the respective redemption present value spread cessation dates set out in the table, the notes are redeemable at our option, in whole but not in part, on not fewer than 30 and not more than 60 days’ prior notice, at redemption prices equal to 100% of the principal amounts thereof. |
10 | We have entered into a foreign exchange derivative (a cross currency interest rate exchange agreement) that effectively converted the principal payments and interest obligations to Canadian dollar obligations with a fixed interest rate of 3.41% and an issued and outstanding amount of $667 million (reflecting a fixed exchange rate of $1.3348). |
11 | $325 million of 4.70% Notes, Series CW were issued in March 2017 at an issue price of $990.65 and an effective interest rate of 4.76%. This series of notes was reopened in February 2018 and a further $150 million of notes were issued at an issue price of $1,014.11 and an effective interest rate of 4.61%. |
12 | We have entered into a foreign exchange derivative (a cross currency interest rate exchange agreement) that effectively converted the principal payments and interest obligations to Canadian dollar obligations with a fixed interest rate of 4.41% and an issued and outstanding amount of $974 million (reflecting a fixed exchange rate of $1.2985). |
(c) TELUS Corporation commercial paper
TELUS Corporation has an unsecured commercial paper program, which is backstopped by our $2.25 billion syndicated credit facility (see (d)) and is to be used for general corporate purposes, including capital expenditures and investments. This program enables us to issue commercial paper, subject to conditions related to debt ratings, up to a maximum aggregate amount at any one time of $1.4 billion (2017 – $1.4 billion). Foreign currency forward contracts are used to manage currency risk arising from issuing commercial paper denominated
in U.S. dollars. Commercial paper debt is due within one year and is classified as a current portion of long-term debt, as the amounts are fully supported, and we expect that they will continue to be supported, by the revolving credit facility, which has no repayment requirements within the next year. As at December 31, 2018, we had $774 million of commercial paper outstanding, all of which was denominated in U.S. dollars (US$569 million), with an effective weighted average interest rate of 3.02%, maturing through June 2019.
(d) TELUS Corporation credit facility
As at December 31, 2018, TELUS Corporation had an unsecured revolving $2.25 billion bank credit facility, renewed in May 2018 and expiring on May 31, 2023 (2017 – expiring on May 31, 2021), with a syndicate of financial institutions, which is to be used for general corporate purposes, including the backstopping of commercial paper.
TELUS Corporation’s credit facility bears interest at prime rate, U.S. Dollar Base Rate, a bankers’ acceptance rate or London interbank offered rate (LIBOR) (all such terms as used or defined in the credit facility), plus applicable margins. The credit facility contains customary representations, warranties and covenants, including two financial quarter-end ratio tests. These tests are that our net debt to operating cash flow ratio must not exceed 4.00:1.00 and our operating cash flow to interest expense ratio must not be less than 2.00:1.00, all as defined in the credit facility.
Continued access to TELUS Corporation’s credit facility is not contingent upon TELUS Corporation maintaining a specific credit rating.
As at December 31 (millions)
|
| 2018
|
| 2017
|
|
Net available |
| $ 1,476 |
| $ 1,110 |
|
Backstop of commercial paper |
| 774 |
| 1,140 |
|
Gross available |
| $ 2,250 |
| $ 2,250 |
|
We had $184 million of letters of credit outstanding as at December 31, 2018 (2017 – $224 million), issued under various uncommitted facilities; such letter of credit facilities are in addition to the ability to provide letters of credit pursuant to our committed bank credit facility; We have arranged incremental letters of credit to allow us to participate in Innovation, Science and Economic Development Canada’s 600 MHz wireless spectrum auction that is to be held in March 2019. Under the terms of the auction, communications between bidders that would provide insights into bidding strategies, including reference to preferred blocks, technologies or valuations, are precluded until the deadline for the final payment in the auction. Disclosure of the precise amount of our letters of credit could be interpreted as a signal of bidding intentions. The maximum amount of letters of credit that any individual participant could be required to deliver is approximately $880 million.
(e) TELUS Communications Inc. debentures
The Series 3 and 5 Debentures were issued by a predecessor corporation of TELUS Communications Inc., BC TEL, under a Trust Indenture dated May 31, 1990. The Series B Debentures were issued by a predecessor corporation of TELUS Communications Inc., AGT Limited, under a Trust Indenture dated August 24, 1994, and a supplemental trust indenture dated September 22, 1995.
|
|
|
|
|
|
|
| Principal face amount |
|
|
| ||
|
|
|
|
|
|
|
|
|
| Outstanding |
| Redemption |
|
|
|
|
|
|
|
|
|
|
| at financial |
| present value spread |
|
Series1 |
| Issued |
| Maturity |
| Issue price |
| Originally issued |
| statement date |
| (basis points) |
|
10.65% Debentures, Series 3 |
| June 1991 |
| June 2021 |
| $998.00 |
| $175 million |
| $175 million |
| N/A (non-redeemable) |
|
9.65% Debentures, Series 52 |
| April 1992 |
| April 2022 |
| $972.00 |
| $150 million |
| $249 million |
| N/A (non-redeemable) |
|
8.80% Debentures, Series B |
| September 1995 |
| September 2025 |
| $995.10 |
| $200 million |
| $200 million |
| 15 | 3 |
1 Interest is payable semi-annually.
2 Series 4 Debentures were exchangeable, at the holder’s option, effective on April 8 of any year during the four-year period from 1996 to 1999, for Series 5 Debentures; $99 million of Series 4 Debentures were exchanged for Series 5 Debentures.
3 At any time prior to the maturity date set out in the table, the debentures are redeemable at our option, in whole at any time, or in part from time to time, on not less than 30 days’ prior notice. The redemption price is equal to the greater of (i) the present value of the debentures discounted at the Government of Canada yield plus the redemption present value spread, or (ii) 100% of the principal amount thereof. In addition, accrued and unpaid interest, if any, will be paid to the date fixed for redemption.
The debentures became obligations of TELUS Communications Inc. pursuant to an amalgamation on January 1, 2001, are not secured by any mortgage, pledge or other charge and are governed by certain covenants, including a negative pledge and a limitation on issues of additional debt, subject to a debt to capitalization ratio and an interest coverage test. Effective June 12, 2009, TELUS Corporation guaranteed the payment of the debentures’ principal and interest.
(f) TELUS International (Cda) Inc. credit facility
As at December 31, 2018, TELUS International (Cda) Inc. had a bank credit facility, secured by its assets, expiring on December 20, 2022, with a syndicate of financial institutions. The credit facility is comprised of a US$350 million (2017 – US$350 million) revolving component and an amortizing US$120 million (2017 – US$120 million) term loan component. The credit facility is non-recourse to TELUS Corporation. As at December 31, 2018, $427 million ($419 million net of unamortized issue costs) was outstanding, all of which was denominated in U.S. dollars (US$313 million), with the revolving component having a weighted average interest rate of 4.22%.
As at December 31 (millions)
|
|
|
|
|
| 2018 |
|
|
|
|
| 2017 |
|
| Revolving |
| Term loan |
|
|
| Revolving |
| Term loan |
|
|
|
| component
|
| component | 1 | Total |
| component |
| component |
| Total |
Available |
| US$ 150 |
| US$ N/A |
| US$ 150 |
| US$ 193 |
| US$ N/A |
| US$ 193 |
Outstanding
|
| 200 |
| 113 |
| 313 |
| 157 |
| 119 |
| 276 |
|
| US$ 350 |
| US$ 113 |
| US$ 463 |
| US$ 350 |
| US$ 119 |
| US$ 469 |
1 We have entered into a receive-floating interest rate, pay-fixed interest rate exchange agreement that effectively converts our interest obligations on the debt to a fixed rate of 2.64%.
180 · TELUS 2018 ANNUAL REPORT
CONSOLIDATED FINANCIAL STATEMENTS: NOTE 27
TELUS International (Cda) Inc.’s credit facility bears interest at prime rate, U.S. Dollar Base Rate, a bankers’ acceptance rate or London interbank offered rate (LIBOR) (all such terms as used or defined in the credit facility), plus applicable margins. The credit facility contains customary representations, warranties and covenants, including two financial quarter-end ratio tests. These tests are that TELUS International (Cda) Inc.’s net debt to operating cash flow ratio must not exceed 3.25:1.00 and its operating cash flow to debt service (interest and scheduled principal repayment) ratio must not be less than 1.50:1.00, all as defined in the credit facility.
The term loan is subject to an amortization schedule which requires that 5% of the principal advanced be repaid each year of the term of the agreement, with the balance due at maturity.
(g) Finance leases
Finance leases are subject to amortization schedules, which results in the principal being repaid over various periods of approximately two years. The weighted average interest rate on finance leases was 2.87% as at December 31, 2018. See Note 2(b) for details of significant changes to IFRS-IASB that are not yet effective and have not yet been applied.
(h) Long-term debt maturities
Anticipated requirements to meet long-term debt repayments, calculated upon such long-term debts owing as at December 31, 2018, are as follows:
Composite long-term debt denominated in |
| Canadian dollars |
|
| U.S. dollars |
|
| ||||||||||
|
|
|
|
|
|
|
|
|
| Currency swap agreement |
|
|
|
| |||
|
| Long-term |
| Finance |
|
|
| Long-term |
| amounts to be exchanged |
|
|
|
| |||
Years ending December 31 (millions)
|
| debt |
| leases |
| Total |
| debt |
| (Receive) | 1 | Pay |
| Total |
| Total | |
2019 |
| $ – |
| $ 52 |
| $ 52 |
| $ 784 |
| $ (776) |
| $ 755 |
| $ 763 |
| $ 815 | |
2020 |
| 1,000 |
| 50 |
| 1,050 |
| 8 |
| – |
| – |
| 8 |
| 1,058 | |
2021 |
| 1,075 |
| – |
| 1,075 |
| 8 |
| – |
| – |
| 8 |
| 1,083 | |
2022 |
| 1,249 |
| – |
| 1,249 |
| 402 |
| – |
| – |
| 402 |
| 1,651 | |
2023 |
| 500 |
| – |
| 500 |
| – |
| – |
| – |
| – |
| 500 | |
2024–2028 |
| 3,300 |
| – |
| 3,300 |
| 1,501 |
| (1,501) |
| 1,459 |
| 1,459 |
| 4,759 | |
Thereafter |
| 3,275 |
| – |
| 3,275 |
| 1,023 |
| (1,023) |
| 974 |
| 974 |
| 4,249 | |
Future cash outflows in respect of composite long-term debt principal repayments |
| 10,399 |
| 102 |
| 10,501 |
| 3,726 |
| (3,300) |
| 3,188 |
| 3,614 |
| 14,115 | |
Future cash outflows in respect of associated interest and like carrying costs2 |
| 5,408 |
| 4 |
| 5,412 |
| 1,906 |
| (1,838) |
| 1,698 |
| 1,766 |
| 7,178 | |
Undiscounted contractual maturities (Note 4(c)) |
| $ 15,807 |
| $ 106 |
| $ 15,913 |
| $ 5,632 |
| $ (5,138) |
| $ 4,886 |
| $ 5,380 |
| $ 21,293 | |
1 Where applicable, principal-related cash flows reflect foreign exchange rates at December 31, 2018.
2 Future cash outflows in respect of associated interest and like carrying costs for commercial paper and amounts drawn under our credit facilities (if any) have been calculated based upon the rates in effect at December 31, 2018.
|
|
27 | Other long-term liabilities |
|
|
As at December 31 (millions) |
| Note |
| 2018 |
| 2017 |
Contract liabilities |
| 24 |
| $ 78 |
| $ 71 |
Other |
|
|
| 7 |
| 10 |
Deferred revenues |
|
|
| 85 |
| 81 |
Pension benefit liabilities |
| 15(b) |
| 446 |
| 490 |
Other post-employment benefit liabilities |
| 15(g) |
| 45 |
| 47 |
Restricted stock unit and deferred share unit liabilities |
|
|
| 63 |
| 68 |
Derivative liabilities |
| 4(h) |
| 6 |
| 76 |
Other |
|
|
| 78 |
| 67 |
|
|
|
| 723 |
| 829 |
Deferred customer activation and connection fees |
| 24 |
| 15 |
| 18 |
|
|
|
| $ 738 |
| $ 847 |
|
|
28 | Common Share capital |
|
|
(a) General
Our authorized share capital is as follows:
As at December 31 |
| 2018 |
| 2017 |
First Preferred Shares |
| 1 billion |
| 1 billion |
Second Preferred Shares |
| 1 billion |
| 1 billion |
Common Shares
|
| 2 billion
|
| 2 billion
|
Only holders of Common Shares may vote at our general meetings, with each holder of Common Shares entitled to one vote per Common Share held at all such meetings so long as not less than 662/3% of the issued and outstanding Common Shares are owned by Canadians. With respect to priority in payment of dividends and in the distribution of assets in the event of our liquidation, dissolution or winding-up, whether voluntary or involuntary, or any other distribution of our assets among our shareholders for the purpose of winding up our affairs, preferences are as follows: First Preferred Shares; Second Preferred Shares; and finally Common Shares.
As at December 31, 2018, approximately 47 million Common Shares were reserved for issuance, from Treasury, under a share option plan (see Note 14(d)).
(b) Purchase of Common Shares for cancellation pursuant to normal course issuer bid
As referred to in Note 3, we may purchase a portion of our Common Shares for cancellation pursuant to normal course issuer bids in order to maintain or adjust our capital structure. In November 2017, we received approval for a normal course issuer bid to purchase and cancel up to 8 million of our Common Shares (up to a maximum amount of $250 million) from November 13, 2017, to November 12, 2018. In July 2018, we received approval to amend the normal course issuer bid to allow a wholly owned subsidiary to purchase our Common Shares, to a maximum amount of $105 million, for donation to a charitable foundation we have established (see Note 16(c)). In December 2018, we received approval for a normal course issuer bid to purchase and cancel up to 8 million of our Common Shares (up to a maximum amount of $250 million) from January 2, 2019, to January 1, 2020.
Common Share transactions by our wholly owned subsidiary are presented in the Consolidated statement of changes in owners’ equity as treasury share transactions.
|
|
29 | Contingent liabilities |
|
|
(a) Claims and lawsuits
General
A number of claims and lawsuits (including class actions and intellectual property infringement claims) seeking damages and other relief are pending against us and, in some cases, other wireless carriers and telecommunications service providers. As well, we have received notice of, or are aware of, certain possible claims (including intellectual property infringement claims) against us and, in some cases, other wireless carriers and telecommunications service providers.
It is not currently possible for us to predict the outcome of such claims, possible claims and lawsuits due to various factors, including: the preliminary nature of some claims; uncertain damage theories and demands; an incomplete factual record; uncertainty concerning legal theories and procedures and their resolution by the courts, at both the trial and the appeal levels; and the unpredictable nature of opposing parties and their demands.
However, subject to the foregoing limitations, management is of the opinion, based upon legal assessments and information presently available, that it is unlikely that any liability, to the extent not provided for through insurance or otherwise, would have a material effect on our financial position and the results of our operations, including cash flows, with the exception of the items enumerated following.
Certified class actions
Certified class actions against us include the following:
Per minute billing class action
In 2008 a class action was brought in Ontario against us alleging breach of contract, breach of the Ontario Consumer Protection Act, breach of the Competition Act and unjust enrichment, in connection with our practice of “rounding up” wireless airtime to the nearest minute and charging for the full minute. The action sought certification of a national class. In November 2014, an Ontario class only was certified by the Ontario Superior Court of Justice in relation to the breach of contract, breach of Consumer Protection Act, and unjust enrichment claims; all appeals of the certification decision have now been exhausted. At the same time, the Ontario Superior Court of Justice declined to stay the claims of our business customers notwithstanding an arbitration clause in our customer service agreements with those customers. This latter decision was appealed and on May 31, 2017, the Ontario Court of Appeal; dismissed our appeal. The Supreme Court of Canada granted us leave to appeal this decision and has now heard our appeal we are awaiting the Court’s decision.
Call set-up time class actions
In 2005 a class action was brought against us in British Columbia alleging that we have engaged in deceptive trade practices in charging for incoming calls from the moment the caller connects to the network, and not from the moment the incoming call is connected to the recipient.
CONSOLIDATED FINANCIAL STATEMENTS: NOTES 28–29
In 2011, the Supreme Court of Canada upheld a stay of all of the causes of action advanced by the plaintiff in this class action, with one exception, based on the arbitration clause that was included in our customer service agreements. The sole exception was the cause of action based on deceptive or unconscionable practices under the British Columbia Business Practices and Consumer Protection Act, which the Supreme Court of Canada declined to stay. In January 2016, the British Columbia Supreme Court certified this class action in relation to the claim under the Business Practices and Consumer Protection Act. The class is limited to residents of British Columbia who contracted wireless services with us in the period from January 21, 1999, to April 2010. We have appealed the certification decision. A companion class action was brought against us in Alberta at the same time as the British Columbia class action. The Alberta class action duplicates the allegations in the British Columbia action, but has not proceeded to date and is not certified. Subject to a number of conditions, including court approval, we have now settled both the British Columbia and the Alberta class actions.
Uncertified class actions
Uncertified class actions against us include:
9-1-1 class actions
In 2008 a class action was brought in Saskatchewan against us and other Canadian telecommunications carriers alleging that, among other matters, we failed to provide proper notice of 9-1-1 charges to the public, have been deceitfully passing them off as government charges, and have charged 9-1-1 fees to customers who reside in areas where 9-1-1 service is not available. The plaintiffs advance causes of action in breach of contract, misrepresentation and false advertising and seek certification of a national class. A virtually identical class action was filed in Alberta at the same time, but the Alberta Court of Queen’s Bench declared that class action expired against us as of 2009. No steps have been taken in this proceeding since 2016.
Electromagnetic field radiation class actions
In 2013 a class action was brought in British Columbia against us, other telecommunications carriers, and cellular telephone manufacturers alleging that prolonged usage of cellular telephones causes adverse health effects. The British Columbia class action alleges: strict liability; negligence; failure to warn; breach of warranty; breach of competition, consumer protection and trade practices legislation; negligent misrepresentation; breach of a duty not to market the products in question; and waiver of tort. Certification of a national class is sought. No steps have been taken in this proceeding since 2014. In 2015 a class action was brought in Quebec against us, other telecommunications carriers, and various other defendants alleging that electromagnetic field radiation causes adverse health effects, contravenes the Quebec Environmental Quality Act, creates a nuisance, and constitutes an abuse of right pursuant to the Quebec Civil Code. The authorization hearing for this matter occurred in May 2018 and on June 27, 2018, the Quebec Superior Court dismissed the authorization application. That decision is now final.
Public Mobile class actions
In 2014 class actions were brought against us in Quebec and Ontario on behalf of Public Mobile’s customers, alleging that changes to the technology, services and rate plans made by us contravene our statutory and common law obligations. In particular, the Quebec action alleges that our actions constitute a breach of the Quebec Consumer Protection Act, the Quebec Civil Code, and the Ontario Consumer Protection Act.
It has not yet proceeded to an authorization hearing. The Ontario class action alleges negligence, breach of express and implied warranty, breach of the Competition Act, unjust enrichment, and waiver of tort. No steps have been taken in this proceeding since it was filed and served.
Handset subsidy class action
In 2016 a class action was brought in Quebec against us and other telecommunications carriers alleging that we breached the Quebec Consumer Protection Act and the Civil Code of Quebec by making false or misleading representations relating to the handset subsidy provided to our wireless customers, and by charging our wireless customers inflated rate plan prices and termination fees higher than those permitted under the Act. The claim was later amended to also seek compensation for amounts paid by class members to unlock their mobile devices. This action has not yet proceeded to an authorization hearing.
Intellectual property infringement claims
Claims and possible claims received by us include:
4G LTE network patent infringement claim
A patent infringement claim was filed in Ontario in 2016 alleging that communications between devices, including cellular telephones, and base stations on our 4G LTE network infringe three third-party patents. The Plaintiff has since abandoned its claims in respect of two of the three patents. The claims based on the third patent are set to be tried in the fourth quarter of 2019.
Other claims
Claims and possible claims received by us include:
Area code 867 blocking claim
In 2018 a claim was brought against us alleging breach of a Direct Connection Call Termination Services Agreement, breach of a duty of good faith, and intentional interference with economic relations. The plaintiffs allege that we have improperly blocked calls to area code 867 (including to customers of a plaintiff), for which a second plaintiff provides wholesale session initiation trunking services. The plaintiffs seek damages of $135 million.
Summary
We believe that we have good defences to the above matters. Should the ultimate resolution of these matters differ from management’s assessments and assumptions, a material adjustment to our financial position and the results of our operations, including cash flows, could result. Management’s assessments and assumptions include that reliable estimates of any such exposure cannot be made considering the continued uncertainty about: the nature of the damages that may be sought by the plaintiffs; the causes of action that are being, or may ultimately be, pursued; and, in the case of the uncertified class actions, the causes of action that may ultimately be certified.
(b) Indemnification obligations
In the normal course of operations, we provide indemnification in conjunction with certain transactions. The terms of these indemnification obligations range in duration. These indemnifications would require us to compensate the indemnified parties for costs incurred as a result of failure to comply with contractual obligations, or litigation claims or statutory sanctions, or damages that may be suffered by an indemnified party. In some cases, there is no maximum limit on these indemnification obligations. The overall maximum amount of an indemnification obligation
will depend on future events and conditions and therefore cannot be reasonably estimated. Where appropriate, an indemnification obligation is recorded as a liability. Other than obligations recorded as liabilities at the time of the related transactions, historically we have not made significant payments under these indemnifications.
See Note 21(d) for details regarding our guarantees to the real estate joint ventures.
As at December 31, 2018, we had no liability recorded in respect of our indemnification obligations.
|
|
30 | Related party transactions |
|
|
(a) Transactions with key management personnel
Our key management personnel have authority and responsibility for overseeing, planning, directing and controlling our activities and consist of our Board of Directors and our Executive Leadership Team.
Total compensation expense for key management personnel, and the composition thereof, is as follows:
Years ended December 31 (millions) |
| 2018 |
| 2017 |
Short-term benefits |
| $ 12 |
| $ 12 |
Post-employment pension1 and other benefits |
| 8 |
| 4 |
Share-based compensation2 |
| 44 |
| 34 |
|
| $ 64 |
| $ 50 |
1 Our Executive Leadership Team members are members of our Pension Plan for Management and Professional Employees of TELUS Corporation and certain other non-registered, non-contributory supplementary defined benefit pension plans.
2 For the year ended December 31, 2018, share-based compensation expense is net of $NIL (2017 – $4) of the effects of derivatives used to manage share-based compensation costs (Note 14(b)).
As disclosed in Note 14, we made initial awards of share-based compensation in 2018 and 2017, including, as set out in the following table, to our key management personnel. As most of these awards are cliff-vesting or graded-vesting and have multi-year requisite service periods, the related expense will be recognized rateably over a period of years and thus only a portion of the 2018 and 2017 initial awards are included in the amounts in the table above.
Years ended December 31
|
|
|
|
|
| 2018 |
|
|
|
|
| 2017 |
|
|
| Number of |
|
|
|
|
| Number of |
|
|
|
|
|
|
| restricted |
| Notional |
| Grant-date |
| restricted |
| Notional |
| Grant-date |
|
($ in millions)
|
| stock units |
| value | 1 | fair value | 1 | stock units |
| value | 1 | fair value | 1 |
Awarded in period |
| 608,849 |
| $ 28 |
| $ 36 |
| 686,595 |
| $ 30 |
| $ 30 |
|
1 Notional value is determined by multiplying the Common Share price at the time of award by the number of units awarded. The grant-date fair value differs from the notional value because the fair values of some awards have been determined using a Monte Carlo simulation (see Note 14(b)).
The liability amounts accrued for share-based compensation awards to key management personnel are as follows:
As at December 31 (millions)
|
| 2018 |
| 2017 |
Restricted stock units |
| $ 41 |
| $ 40 |
Deferred share units1 |
| 21 |
| 24 |
|
| $ 62 |
| $ 64 |
1 Our Directors’ Deferred Share Unit Plan provides that, in addition to his or her annual equity grant of deferred share units, a director may elect to receive his or her annual retainer and meeting fees in deferred share units, Common Shares or cash. Deferred share units entitle directors to a specified number of, or a cash payment based on the value of, our Common Shares. Deferred share units are paid out when a director ceases to be a director, for any reason, at a time elected by the director in accordance with the Directors’ Deferred Share Unit Plan; during the year ended December 31, 2018, $6 (2017 – $14) was paid out.
Employment agreements with members of the Executive Leadership Team typically provide for severance payments if an executive’s employment is terminated without cause: generally 18–24 months of base salary,
benefits and accrual of pension service in lieu of notice, and 50% of base salary in lieu of an annual cash bonus. In the event of a change in control, Executive Leadership Team members are not entitled to treatment any different than that given to our other employees with respect to non-vested share-based compensation.
(b) Transactions with defined benefit pension plans
During the year ended December 31, 2018, we provided management and administrative services to our defined benefit pension plans; the charges for these services were on a cost recovery basis and amounted to $6 million (2017 – $6 million).
(c) Transactions with real estate joint ventures
During the years ended December 31, 2018 and 2017, we had transactions with the real estate joint ventures, which are related parties, as set out in Note 21.
CONSOLIDATED FINANCIAL STATEMENTS: NOTES 30–31
|
|
31 | Additional statement of cash flow information |
|
|
(a) Statements of cash flows – operating activities, investing activities and financing activities
Years ended December 31 (millions) |
| 2018 |
| 2017 |
|
|
|
|
| (adjusted – |
|
Operating activities |
|
|
|
|
|
Net change in non-cash operating working capital |
|
|
|
|
|
Accounts receivable |
| $ 74 |
| $ (70 | ) |
Inventories |
| 4 |
| (60 | ) |
Contract assets |
| (103 | ) | (57 | ) |
Prepaid expenses |
| (46 | ) | (50 | ) |
Accounts payable and accrued liabilities |
| (11 | ) | 126 |
|
Income and other taxes receivable and payable, net |
| 277 |
| (90 | ) |
Advance billings and customer deposits |
| 12 |
| 41 |
|
Provisions |
| 49 |
| (59 | ) |
|
| $ 256 |
| $ (219 | )
|
Years ended December 31 (millions) |
| Note |
| 2018 |
| 2017 |
|
Investing activities |
|
|
|
|
|
|
|
Cash payments for capital assets, excluding spectrum licences |
|
|
|
|
|
|
|
Capital asset additions |
|
|
|
|
|
|
|
Gross capital expenditures |
|
|
|
|
|
|
|
Property, plant and equipment |
| 17 |
| $ (2,383 | ) | $ (2,486 | ) |
Intangible assets |
| 18 |
| (657 | ) | (617 | ) |
|
|
|
| (3,040 | ) | (3,103 | ) |
Additions arising from finance leases |
|
|
| 102 |
| – |
|
Additions arising from non-monetary transactions |
|
|
| 24 |
| 9 |
|
Capital expenditures |
|
|
| (2,914 | ) | (3,094 | ) |
Asset retirement obligations netted (included) in additions |
|
|
| 15 |
| (7 | ) |
|
|
|
| (2,899 | ) | (3,101 | ) |
Other non-cash items included above |
|
|
|
|
|
|
|
Change in associated non-cash investing working capital |
|
|
| 47 |
| (27 | ) |
Non-cash change in asset retirement obligation |
|
|
| (22 | ) | 47 |
|
|
|
|
| 25 |
| 20 |
|
|
|
|
| $ (2,874 | ) | $ (3,081 | ) |
|
|
|
|
|
|
|
|
Financing activities |
|
|
|
|
|
|
|
Issue of shares by subsidiary to non-controlling interests Issue of shares |
|
|
| $ 43 |
| $ – |
|
Non-monetary issue of shares in business combination |
| 18(b) |
| (19 | ) | – |
|
Cash proceeds on share issuance |
|
|
| 24 |
| – |
|
Transaction costs and other |
|
|
| – |
| (1 | ) |
|
|
|
| $ 24 |
| $ (1 | )
|
(b) Changes in liabilities arising from financing activities
|
|
|
| Year ended December 31, 2017 |
|
|
| Year ended December 31, 2018 |
|
|
| ||||||||||||||
|
|
|
| Statement of cash flows |
| Non-cash changes |
|
|
| Statement of cash flows |
| Non-cash changes |
|
|
| ||||||||||
|
|
|
|
|
| Redemptions, |
|
| Foreign |
|
|
|
|
|
|
| Redemptions, |
|
| Foreign |
|
|
|
|
|
|
| As at |
|
|
| repayments |
|
| exchange |
|
|
| As at |
|
|
| repayments |
|
| exchange |
|
|
| As at |
|
|
| Jan. 1, |
| Issued or |
| or |
|
| movement |
|
|
| Dec. 31, |
| Issued or |
| or |
|
| movement |
|
|
| Dec. 31, |
|
(millions) |
| 2017 |
| received |
| payments |
|
| (Note 4(i)) |
| Other |
| 2017 |
| received |
| payments |
|
| (Note 4(i)) |
| Other |
| 2018 |
|
Dividends payable to holders of Common Shares |
| $ 284 |
| $ – |
| $ (1,152 | ) |
| $ – |
| $ 1,167 |
| $ 299 |
| $ – |
| $ (1,226 | ) |
| $ – |
| $ 1,253 |
| $ 326 |
|
Dividends reinvested in shares from Treasury |
| – |
| – |
| 70 |
|
| – |
| (70 | ) | – |
| – |
| 85 |
|
| – |
| (85 | ) | – |
|
|
| $ 284 |
| $ – |
| $ (1,082 | ) |
| $ – |
| $ 1,097 |
| $ 299 |
| $ – |
| $ (1,141 | ) |
| $ – |
| $ 1,168 |
| $ 326 |
|
Short-term borrowings |
| $ 100 |
| $ – |
| $ – |
|
| $ – |
| $ – |
| $ 100 |
| $ 26 |
| $ (93 | ) |
| $ (1 | ) | $ 68 |
| $ 100 |
|
Long-term debt |
|
|
|
|
|
|
|
|
|
|
|
|
|
|
|
|
|
|
|
|
|
|
|
|
|
TELUS Corporation notes |
| $ 11,367 |
| $ 990 |
| $ (700 | ) |
| $ (91 | ) | $ (5 | ) | $ 11,561 |
| $ 1,725 |
| $ (1,250 | ) |
| $ 170 |
| $ (20 | ) | $ 12,186 |
|
TELUS Corporation commercial paper |
| 613 |
| 5,295 |
| (4,710 | ) |
| (58 | ) | – |
| 1,140 |
| 3,678 |
| (4,115 | ) |
| 71 |
| – |
| 774 |
|
TELUS Communications Inc. debentures |
| 619 |
| – |
| – |
|
| – |
| 1 |
| 620 |
| – |
| – |
|
| – |
| – |
| 620 |
|
TELUS International (Cda) Inc. credit facility |
| 332 |
| 82 |
| (56 | ) |
| (20 | ) | 1 |
| 339 |
| 97 |
| (50 | ) |
| 33 |
| – |
| 419 |
|
Finance leases |
| – |
| – |
| – |
|
| – |
| – |
| – |
| – |
| (3 | ) |
| – |
| 105 |
| 102 |
|
Derivatives used to manage currency risk arising from U.S. dollar-denominated long-term debt – liability (asset) |
| 20 |
| 4,710 |
| (4,746 | ) |
| 149 |
| (40 | ) | 93 |
| 4,115 |
| (4,074 | ) |
| (241 | ) | 34 |
| (73 | ) |
|
| 12,951 |
| 11,077 |
| (10,212 | ) |
| (20 | ) | (43 | ) | 13,753 |
| 9,615 |
| (9,492 | ) |
| 33 |
| 119 |
| 14,028 |
|
To eliminate effect of gross settlement of derivatives used to manage currency risk arising from U.S. dollar-denominated long-term debt |
| – |
| (4,710 | ) | 4,710 |
|
| – |
| – |
| – |
| (4,115 | ) | 4,115 |
|
| – |
| – |
| – |
|
|
| $ 12,951 |
| $ 6,367 |
| $ (5,502 | ) |
| $ (20 | ) | $ (43 | ) | $ 13,753 |
| $ 5,500 |
| $ (5,377 | ) |
| $ 33 |
| $ 119 |
| $ 14,028 |
|
186 · TELUS 2018 ANNUAL REPORT
GLOSSARY
Glossary
4G (fourth generation): Wireless technologies, including HSPA+, LTE, LTE advanced and LTE advanced pro, as defined by the International Telecommunications Union.
5G (fifth generation): The next generation of converged wireless technologies, expected to provide higher speeds, improved coverage and lower latency, which is critical as the number of connected devices continues to increase rapidly. Technical standards for 5G remain in development.
Fibre-optic network: Hair-thin glass fibres along which light pulses are transmitted. Optical fibre networks are used to transmit large amounts of data between locations at high upload and download speeds.
FTTx (fibre to the x): A collective term for any broadband network architecture using optical fibre to replace all or part of the existing copper local loops. FTTH denotes fibre to the home, FTTP denotes fibre to the premises and FTTN denotes fibre to the node or neighbourhood.
GPON (gigabit-capable passive optical network): A fibre-based transmission technology that can deliver data download speeds of up to 2.4 Gbps and upload speeds of up to 1.2 Gbps.
HSPA+ (high-speed packet access plus): A 4G technology capable of delivering manufacturer-rated wireless data download speeds of up to 21 Mbps (typical speeds of 4 to 6 Mbps). HSPA+ dual-cell technology can double those download speeds.
ILEC (incumbent local exchange carrier): An established telecommunications company providing local telephone service. Non-ILEC refers to the telecommunications operations of TELUS outside its traditional ILEC operating territories, where TELUS competes with the incumbent telephone company (e.g. Ontario and most of Quebec).
IoT (Internet of Things): A network of uniquely identifiable end points (or things) that interact without human intervention, most commonly over a wireless network. These systems collect, analyze and act on information in real time and can be deployed to enable the creation of smart connected businesses, homes, cars and cities.
IP (Internet protocol): A packet-based protocol for delivering data across networks.
IP-based network: A network designed using IP and QoS (quality of service) technology to reliably and efficiently support all types of customer traffic, including voice, data and video. An IP-based network allows a variety of IP devices and advanced applications to communicate over a single common network.
IP TV (Internet protocol television): A television service (offered as Optik TV and Pik TV at TELUS) that uses a two-way digital broadcast signal sent through a network by way of a streamed broadband connection to a dedicated set-top box (or through an app for Pik TV).
LAA (licensed assisted access): An LTE feature that makes use of unlicensed spectrum in combination with licensed spectrum to deliver a performance boost for mobile device users.
LTE (long-term evolution): The leading 4G global wireless technology standard. LTE advanced (LTE-A) and LTE advanced pro offer higher speeds and greater capacity, moving networks closer to 5G. LTE is capable of delivering manufacturer-rated wireless data download speeds of up to 150 Mbps (typical speeds of 12 to 45 Mbps), and LTE-A can offer speeds nearly 10 times higher (in select regions).
M2M (machine-to-machine): Technologies and networked devices that are able to exchange information and perform actions without human intervention.
NCIB (normal course issuer bid): A program that enables a company to purchase its own shares, typically for cancellation, through exchanges or private purchases over a set period of time.
OTT (over-the-top): Content, services and applications in a video format, for which delivery occurs through a medium other than the established video delivery infrastructure.
Small cell: Low-powered radio access nodes that can operate in licensed and unlicensed spectrum within a limited range to provide densification and capacity to a macro wireless network.
Spectrum: The range of electromagnetic radio frequencies used in the transmission of voice, data and video. The capacity of a wireless network is in part a function of the amount of spectrum licensed and utilized by the carrier.
VoIP (voice over Internet protocol): The transmission of voice signals over the Internet or IP network.
Wave 3 solutions: Next-generation wireless offerings that use loT technology to provide solutions for businesses and consumers.
Wi-Fi (wireless fidelity): Networking technology that allows any user with an enabled device to connect to a wireless access point or hotspot in high-traffic locations.
xDSL: A fibre-to-the-node IP technology that allows existing telephone lines to carry voice, data and video.
For financial definitions, see Section 11 of Management’s discussion and analysis
|
|
Investor information
Stock exchanges and TELUS trading symbols
Toronto Stock Exchange (TSX)
Common shares T CUSIP: 87971M103
New York Stock Exchange (NYSE)
Common shares TU CUSIP: 87971M103
Member of
· S&P/TSX Composite Index · S&P/TSX 60 Index · S&P/TSX Telecom Index | · MSCI World Telecom Index · Jantzi Social Index · FTSE4Good Index |
· Dow Jones Sustainability World Index · Dow Jones Sustainability North America Index · STOXX Global ESG Leaders indices · Euronext Vigeo Index: World 120 | |
Share ownership facts as at December 31, 2018
| · Total outstanding shares were 598,673,961 · TELUS team members held 15,629,208 shares in employee share plans, equivalent to 2.6% of the total number of outstanding shares, which collectively made team members our third largest TELUS shareholder · We estimate that approximately 70% of TELUS shares were held by institutional investors and 30% by retail investors · Registered shareholders of common shares totalled 38,211. The Canadian Depository for Securities (CDS) represents one registration and holds securities for many non-registered shareholders. We estimate that TELUS had more than 605,000 non-registered shareholders at year-end. |
Dividend policy and dividend growth programs
The January 2019 quarterly dividend paid was $0.5450, or $2.18 on an annualized basis, representing an 8% increase over the previous year.
Our long-term dividend payout ratio guideline is 65 to 75% of prospective sustainable net earnings. In May 2016, we provided shareholders with additional clarity on our intentions regarding our dividend growth program. We plan to continue with two dividend increases per year through 2019, normally announced in May and November, and are targeting the increase to be circa seven to 10% annually. Since 2004, we have raised our dividend 23 times; 16 of these have occurred since 2011, when we introduced our dividend growth program.
Notwithstanding this, dividend decisions will continue to be dependent on earnings and free cash flow and subject to the Board’s assessment and determination of TELUS’ financial situation, capital requirements and economic outlook on a quarterly basis. There can be no assurance that the Company will maintain its dividend growth program through 2019.
TELUS advises that, unless noted otherwise, all quarterly dividends paid since January 2006 are eligible dividends under the Income Tax Act. Under this legislation, Canadian residents may be entitled to enhanced dividend tax credits that reduce the income tax otherwise payable. For more information, visit telus.com/dividends.

Dividend reinvestment and share purchase plan
Investors may take advantage of the automatic dividend reinvestment and share purchase plan to acquire additional common shares without fees. Under this plan, eligible shareholders can have their dividends reinvested automatically into additional shares. TELUS may elect to purchase common shares in the open market or by issuance from treasury (less a discount, if any, of up to 5%). TELUS will provide advance notification to participants if and when an election is made to change the method of purchasing common shares. Currently, shares are being issued from treasury with no discount. We also offer a share purchase feature, under which eligible shareholders can, on a monthly basis, buy TELUS shares (maximum $20,000 per calendar year and minimum $100 per transaction) without brokerage commissions or service charges. |
|
|
|
|
|
| |
| Visit telus.com/drisp or contact Computershare for information and enrolment forms |
| |
|
|
| |
This plan is managed by Computershare Trust Company of Canada. |
|
| |
2019 expected dividend1 and earnings dates
| Ex-dividend dates2 | Dividend record dates | Dividend payment dates | Earnings release dates |
Quarter 1 | March 8 | March 11 | April 1 | May 9 |
Quarter 2 | June 7 | June 10 | July 2 | August 2 |
Quarter 3 | September 9 | September 10 | October 1 | November 7 |
Quarter 4 | December 10 | December 11 | January 2, 2020 | February 13, 2020 |
1 Dividends are subject to Board of Directors’ approval.
2 Shares purchased on this date forward will not be entitled to the dividend payable on the corresponding dividend payment date.
188 · TELUS 2018 ANNUAL REPORT
INVESTOR INFORMATION
Normal course issuer bid programs
Our 2018 normal course issuer bid (NCIB) program, under which we purchased, but did not cancel, 2.1 million common shares for $100 million, concluded in November. Further, we received TSX approval for our 2019 NCIB program to purchase and cancel up to eight million of our out-standing shares valued up to $250 million over the 12-month period ending January 1, 2020.
Since beginning our multi-year share purchase program in May 2013 through to the end of 2018, we have purchased a total of 70 million shares for $2.6 billion. Of these amounts, 1.0 million shares were purchased
in 2016 for $45 million on behalf of an employee benefit plan, where substantially all were distributed to team members. In addition, 2.1 million shares were purchased in 2018 for $100 million and subsequently donated to the TELUS Friendly Future Foundation. All other shares purchased were cancelled.
We will purchase shares only when and if we consider it opportunistic. The share purchase program is subject to the Board’s assessment and determination and there can be no assurance that the share purchase program will be completed or maintained.
Per-share data
| Applying IFRS 9 and IFRS 15 |
|
|
|
|
| |
| 2018 | 2017 | 2016 | 2015 | 2014 | 2013 | 2012 |
Basic earnings | $ 2.68 | $ 2.63 | $ 2.06 | $ 2.29 | $ 2.31 | $ 2.02 | $ 1.85 |
Dividends declared | $ 2.10 | $ 1.97 | $ 1.84 | $ 1.68 | $ 1.52 | $ 1.36 | $ 1.22 |
Dividends declared as per cent of basic earnings | 78% | 75% | 89% | 73% | 66% | 67% | 66% |
Free cash flow1 | $ 2.01 | $ 1.63 | $ 0.24 | $ 1.79 | $ 1.72 | $ 1.64 | $ 2.04 |
|
|
|
|
|
|
|
|
Common shares |
|
|
|
|
|
|
|
Closing price | $ 45.25 | $ 47.62 | $ 42.75 | $ 38.26 | $ 41.89 | $ 36.56 | $ 32.55 |
Dividend yield | 4.6% | 4.1% | 4.3% | 4.4% | 3.6% | 3.7% | 3.7% |
Price to earnings ratio | 17 | 18 | 21 | 17 | 18 | 18 | 18 |
1 For a definition of free cash flow, see Section 11 of Management’s discussion and analysis in this report.
Share prices and volumes
Toronto Stock Exchange
Common shares (T) |
|
|
|
| 2018 |
|
|
|
| 2017 |
(C$ except volume) | Year 2018 | Q4 | Q3 | Q2 | Q1 | Year 2017 | Q4 | Q3 | Q2 | Q1 |
High | 49.15 | 48.37 | 49.15 | 47.15 | 47.60 | 48.94 | 48.94 | 46.10 | 46.29 | 44.41 |
Low | 43.88 | 43.88 | 46.20 | 44.14 | 44.18 | 42.22 | 44.60 | 43.30 | 42.93 | 42.22 |
Close | 45.25 | 45.25 | 47.61 | 46.70 | 45.24 | 47.62 | 47.62 | 44.88 | 44.77 | 43.17 |
Volume (millions) | 249.8 | 76.0 | 48.9 | 58.8 | 66.1 | 245.0 | 56.9 | 51.3 | 66.9 | 69.9 |
Dividend declared (per share) | 2.10 | 0.5450 | 0.5250 | 0.5250 | 0.5050 | 1.97 | 0.5050 | 0.4925 | 0.4925 | 0.4800 |
New York Stock Exchange
Common shares (TU) |
|
|
|
| 2018 |
|
|
|
| 2017 |
(US$ except volume) | Year 2018 | Q4 | Q3 | Q2 | Q1 | Year 2017 | Q4 | Q3 | Q2 | Q1 |
High | 38.20 | 37.24 | 37.70 | 36.23 | 38.20 | 38.50 | 38.50 | 36.94 | 34.84 | 33.89 |
Low | 32.46 | 32.46 | 35.19 | 34.37 | 34.28 | 31.28 | 35.47 | 34.04 | 32.06 | 31.28 |
Close | 33.14 | 33.14 | 36.84 | 35.51 | 35.16 | 37.87 | 37.87 | 35.97 | 34.52 | 32.48 |
Volume (millions) | 95.2 | 26.5 | 20.9 | 20.9 | 26.9 | 102.5 | 25.1 | 25.9 | 27.3 | 24.2 |
Dividend declared (per share) | 1.620 | 0.410 | 0.403 | 0.405 | 0.402 | 1.518 | 0.397 | 0.395 | 0.365 | 0.361 |
TELUS 2018 ANNUAL REPORT · 189
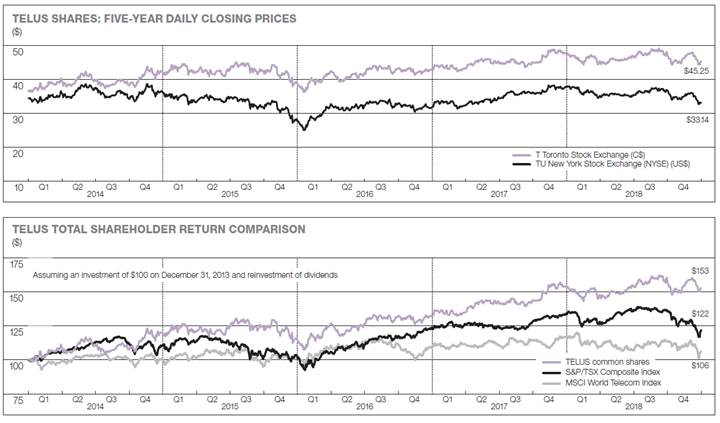
TELUS Corporation notes
|
| Coupon rate |
| Face value |
| Maturing |
Canadian dollar Notes |
|
|
|
|
|
|
Series CH |
| 5.05% |
| $1.0 billion |
| July 2020 |
Series CJ |
| 3.35% |
| $500 million |
| March 2023 |
Series CK |
| 3.35% |
| $1.1 billion |
| April 2024 |
Series CL |
| 4.40% |
| $600 million |
| April 2043 |
Series CM |
| 3.60% |
| $400 million |
| January 2021 |
Series CN |
| 5.15% |
| $400 million |
| November 2043 |
Series CO |
| 3.20% |
| $500 million |
| April 2021 |
Series CP1 |
| 4.85% |
| $900 million |
| April 2044 |
Series CQ |
| 3.75% |
| $800 million |
| January 2025 |
Series CR |
| 4.75% |
| $400 million |
| January 2045 |
Series CT |
| 2.35% |
| $1.0 billion |
| March 2022 |
Series CU |
| 4.40% |
| $500 million |
| January 2046 |
Series CV |
| 3.75% |
| $600 million |
| March 2026 |
Series CW2 |
| 4.70% |
| $475 million |
| March 2048 |
Series CX |
| 3.625% |
| $600 million |
| March 2028 |
U.S. dollar Notes |
| 2.80% |
| US$600 million |
| February 2027 |
U.S. dollar Notes |
| 3.70% |
| US$500 million |
| September 2027 |
U.S. dollar Notes |
| 4.60% |
| US$750 million |
| November 2048 |
1 Includes $500 million originally issued in April 2014 and $400 million issued in December 2015.
2 Includes $325 million originally issued in March 2017 and $150 million issued in February 2018.
Credit rating summary
|
|
|
| Standard & |
| Moody’s |
|
|
|
|
|
| Poor’s Rating |
| Investors |
| Fitch |
As of December 31, 2018 |
| DBRS Ltd. |
| Services |
| Service |
| Ratings |
TELUS Corporation |
|
|
|
|
|
|
|
|
Notes |
| BBB (high) |
| BBB+ |
| Baal |
| BBB+ |
Commercial paper |
| R-2 (high) |
| A-2 |
| P-2 |
| – |
TELUS Communications Inc. |
|
|
|
|
|
|
|
|
Debentures |
| BBB (high) |
| BBB+ |
| – |
| BBB+ |

At the end of 2018, the average term to maturity of our long-term debt (excluding commercial paper, the revolving component of the TELUS International credit facility and finance leases) was 12.2 years, compared to 10.7 years at the end of 2017. For a detailed list of long-term debt of the Company and our subsidiaries, see Note 26 of the Consolidated financial statements.
INVESTOR INFORMATION
Key TELUS events for investors
· Announced two quarterly dividend increases consistent with our dividend growth program, with 2018 dividends declared of $2.10
· Issued a total of $1.7 billion in senior unsecured notes in 2018, in several financings, with 10-year and 30-year maturities. We also early redeemed $1 billion in senior unsecured 5.05% notes with a December 2019 maturity
· Ended the year with a net debt to EBITDA ratio of 2.54 times
· Acquired all of the customers, assets and operations of AlarmForce Industries Inc. in B.C., Alberta and Saskatchewan from BCE Inc., providing us with a unique opportunity to accelerate our entry into smart home solutions
· Acquired 65% of Xavient Information Systems (Xavient), a group of information technology consulting and software services companies with facilities in the United States and India. This investment enhances TELUS International’s ability to provide complex and higher-value information technology services, improves our related sales and solutioning capabilities, and gives us multi-site redundancy in support of other facilities
· Acquired Medisys Health Group Inc., a leading provider of preventative healthcare and wellness services for workplaces across Canada. This acquisition will enable TELUS Health to deliver employee-centred care, backed by TELUS’ broadband network and supported by digital tools such as patient portals, virtual care, wellness and mental health applications, electronic prescribing, electronic benefit claims and secure messaging
Awards
· Earned the top spot in four major network awards, including OpenSignal, J.D. Power, Ookla and PCMag, for the quality, speed and/or reliability of our wireless network
· Recognized for annual reporting excellence in the 2018 Annual Report on Annual Reports by ReportWatch for the TELUS 2017 annual report and ranked as one of the top 20 reports in the world
· Acknowledged for corporate social responsibility by being included in the
· Dow Jones Sustainability World Index for the third year in a row
· Dow Jones Sustainability North America Index for the 18th consecutive year
· Corporate Knights Best 50 Corporate Citizens in Canada for the 12th time
· Business as a Force for Good awards by the INSEAD National Alumni Association Canada in the category of corporate social responsibility
· Received the BEST Award for excellence in employee learning and development from the Association for Talent Development for the 13th time
· Earned global recognition as one of the Achievers 50 Most Engaged Workplaces.
Analyst coverage
As of February 2019, 19 equity analysts covered TELUS. For a full list, see analyst coverage on telus.com/investors.
Information for security holders outside of Canada
Cash dividends paid to shareholders resident in countries with which Canada has an income tax convention are usually subject to Canadian non-resident withholding tax of 15%. If you have any questions, contact Computershare. For individual investors who are U.S. citizens and/or U.S. residents, quarterly dividends paid on TELUS shares are considered qualified dividends under the Internal Revenue Code and may be eligible for special U.S. tax treatment.
Foreign ownership monitoring – non-Canadian common shares
Under federal legislation, total non-Canadian ownership of common shares of Canadian telecommunications companies, including TELUS, is limited to 331/3%.
For registered shareholders and shares trading on the TSX, a reservation system controls and monitors this level. This system requires non-Canadian purchasers of common shares to obtain a reservation number from Computershare by contacting the Reservations Unit at 1-877-267-2236 (toll-free) or telusreservations@computershare.com. The purchaser is notified within two hours if common shares are available for registration.
For shares trading on the NYSE, non-Canadian ownership is monitored by utilizing the Depository Trust & Clearing Corporation’s SEG-100 Account program. All TELUS common shares held by non-Canadians must be transferred to this account (no reservation application is required).
Mergers and acquisitions – shareholder impacts
Visit telus.com/m&a for information on how your shareholdings have been affected by various merger and acquisition transactions. Information is also available regarding capital gains, valuation dates and share prices for 1971 and 1994.
e-delivery of shareholder documents We invite you to sign up for electronic delivery of TELUS information by visiting telus.com/electronicdelivery. The benefits of e-delivery include access to important Company documents in a convenient, timely and environmentally friendly way that also reduces printing and mailing costs. Approximately 37,000 of our shareholders receive the annual report by e-delivery.
|
For more information For questions regarding: · Direct registration system (DRS) advice or accounts · Dividend payments and the dividend reinvestment and share purchase plan · Change of address and e-delivery of shareholder documents · Transfer or loss of share certificates and estate settlements · Exchange of share certificates due to a merger or acquisition
Contact the transfer agent and registrar: Computershare Trust Company of Canada 1-800-558-0046 or 1 (514) 982-7129 (outside North America) email: telus@computershare.com visit: computershare.com
|
|
For questions regarding additional financial or statistical information, industry and Company developments, or the latest news releases and investor presentations, contact:
TELUS Investor Relations 1-800-667-4871 or +1 (604) 643-4113 (outside North America) email: ir@telus.com visit: telus.com/investors
|
TELUS executive office |
| TELUS general information |
| Ethics Line |
510 West Georgia Street Vancouver, British Columbia Canada V6B 0M3 phone: (604) 697-8044 |
| phone: 1-800-308-5992 (604) 432-2151 Auditors Deloitte LLP |
| As part of our ethics policy, this hotline allows team members and others to anonymously and confidentially raise accounting, internal controls and ethical inquiries or complaints. phone: 1-888-265-4112 visit: telus.ethicspoint.com |
192 · TELUS 2018 ANNUAL REPORT

WHY INVEST IN TELUS

Putting customers first Focusing relentlessly on delivering exceptional customer experiences to further differentiate our competitive position
Proven growth strategy Driving profitable revenue and customer growth through the collective efforts of our highly engaged team
Commitment to operational efficiency Amplifying our cost efficiency efforts and enhancing our effectiveness in serving our growing customer base |
| Our social purpose Leveraging our technology to create meaningful outcomes for the benefit of our customers and communities
Technology leadership Enhancing our world-class broadband networks to elevate the customer experience, enhance reliability and sustain future growth
Disciplined capital allocation Balancing investments to support long-term growth with returning capital to shareholders |
| Robust shareholder returns Delivering on our multi-year dividend growth model by returning more than $1.2 billion to our shareholders in 2018
Strong financial profile Maintaining a strong balance sheet and investment grade credit ratings, enabling ready access to capital markets
Transparent disclosure Providing award-winning financial, corporate governance and sustainability disclosure |

telus.com/annualreport
telus.com/rapportannuel