TELUS Corporation — Management’s discussion and analysis — 2019
Caution regarding forward-looking statements
The terms TELUS, the Company, we, us and our refer to TELUS Corporation and, where the context of the narrative permits or requires, its subsidiaries.
This document contains forward-looking statements about expected events and our financial and operating performance. Forward-looking statements include any statements that do not refer to historical facts. They include, but are not limited to, statements relating to our objectives and our strategies to achieve those objectives, our targets, outlook, updates, and our multi-year dividend growth program. Forward-looking statements are typically identified by the words assumption, goal, guidance, objective, outlook, strategy, target and other similar expressions, or future or conditional verbs such as aim, anticipate, believe, could, expect, intend, may, plan, predict, seek, should, strive and will. These statements are made pursuant to the “safe harbour” provisions of applicable securities laws in Canada and the United States Private Securities Litigation Reform Act of 1995.
By their nature, forward-looking statements are subject to inherent risks and uncertainties and are based on assumptions, including assumptions about future economic conditions and courses of action. These assumptions may ultimately prove to have been inaccurate and, as a result, our actual results or events may differ materially from expectations expressed in or implied by the forward-looking statements. Our general outlook and assumptions for 2020 are presented in Section 9 General trends, outlook and assumptions, and regulatory developments and proceedings in this Management’s discussion and analysis (MD&A).
Risks and uncertainties that could cause actual performance or events to differ materially from the forward-looking statements made herein and in other TELUS filings include, but are not limited to, the following:
· Regulatory decisions and developments including changes to our regulatory regime (the timing of announcement or implementation of which are uncertain) or the outcomes of proceedings, cases or inquiries relating to its application, including but not limited to those set out in Section 9.4 Communications industry regulatory developments and proceedings in this MD&A, such as the potential for government intervention to further increase competition, for example, through mandated wholesale access; the potential for additional government intervention on pricing as committed in the 2019 federal election; federal and provincial consumer protection legislation and regulation; amendments to existing federal legislation; potential threats to unitary federal regulatory authority over telecommunications; regulatory action by the Competition Bureau or other regulatory agencies; spectrum and compliance with licences, including our compliance with licence conditions, changes to spectrum licence fees, spectrum policy determinations such as restrictions on the purchase, sale, subordination and transfer of spectrum licences, the cost and availability of spectrum, and ongoing and future consultations and decisions on spectrum allocation; the impact on us and other Canadian telecommunications carriers of government or regulatory actions with respect to certain countries or suppliers, including the executive order signed by U.S. President Donald Trump permitting the Secretary of Commerce to block certain technology transactions deemed to constitute national security risks and the imposition of additional licence requirements on the export, re-export and transfer of goods, services and technology to Huawei Technologies Co. Ltd. and its non-U.S. affiliates; restrictions on non-Canadian ownership and control of TELUS Common Shares and the ongoing monitoring of and compliance with such restrictions; unanticipated changes to the current copyright regime; and our ability to comply with complex and changing regulation of the healthcare and medical devices industry in the jurisdictions in which we operate, including as an operator of health clinics.
· Competitive environment including: our ability to continue to retain customers through an enhanced customer service experience, including through the deployment and operation of evolving wireless and wireline infrastructure; intense wireless competition, including the ability of industry competitors to successfully combine a mix of internet services and, in some cases, wireless services under one bundled and/or discounted monthly rate, along with their existing broadcast or satellite-based TV services; the success of new products, services and supporting systems, such as home automation security and Internet of Things (IoT) services for internet-connected devices; wireline voice and data competition, including continued intense rivalry across all services among wireless and wireline telecommunications companies, cable companies, other communications companies and over-the-top (OTT) services, which, among other things, places pressures on current and future mobile phone average billing per subscriber per month (ABPU), mobile phone average revenue per subscriber per month (ARPU), cost of acquisition, cost of retention and churn rate for all services, as do customer usage patterns, increased data bucket sizes or flat-rate pricing trends for voice and data, such as our Peace of Mind™ plans and comparable plans recently launched, inclusive rate plans for voice and data and availability of Wi-Fi networks for data; mergers and acquisitions of industry competitors; pressures on internet and TV ARPU and churn rate resulting from market conditions, government actions and customer usage patterns; residential voice and business network access line losses; subscriber additions and retention volumes, and associated costs for wireless, TV and internet services; our ability to obtain and offer content on a timely basis across multiple devices on wireless and TV platforms at a reasonable cost as content costs per unit continue to grow; vertical integration in the broadcasting industry resulting in competitors owning broadcast content services, and timely and effective enforcement of related regulatory safeguards; our ability to compete successfully in customer care and business services (CCBS) given our competitors’ brand recognition, consolidation and strategic alliances, as well as technology development; in our TELUS Health business, our ability to compete with other providers of electronic medical records and pharmacy management products, systems integrators and health service providers including those that own a vertically integrated mix of health services delivery, IT solutions, and related services, and global providers that could achieve expanded Canadian footprints; and our ability to successfully develop our smart data solutions business.
![]()
· Technological substitution including: reduced utilization and increased commoditization of traditional wireline voice services (local and long distance) resulting from impacts of OTT applications and wireless substitution; a declining overall market for paid TV services, including as a result of content piracy and signal theft, a rise in OTT direct-to-consumer video offerings and virtual multichannel video programming distribution platforms; the increasing number of households that have only wireless and/or internet-based telephone services; potential declines in mobile phone ABPU and ARPU as a result of, among other factors, substitution by messaging and OTT applications; substitution by increasingly available Wi-Fi services; and disruptive technologies, such as OTT IP services, including software-defined networks in the business market, that may displace or cause us to reprice our existing data services.
· Challenges to our ability to deploy technology including: high subscriber demand for data that challenges wireless networks and spectrum capacity levels and may be accompanied by increases in delivery cost; our reliance on information technology and our ability to streamline our legacy systems; the roll-out and evolution of wireless broadband technologies and systems, including video distribution platforms and telecommunications network technologies (broadband initiatives, such as fibre to the premises (FTTP), wireless small-cell deployment, 5G wireless and availability of resources and our ability to build out adequate broadband capacity); our reliance on wireless network access agreements, which have facilitated our deployment of wireless technologies; our choice of suppliers and those suppliers’ ability to maintain and service their product lines, which could affect the success of upgrades to, and evolution of, technology that we offer; supplier limitations and concentration and market power for products such as network equipment, TELUS TV® and wireless handsets; our expected long-term need to acquire additional spectrum capacity through future spectrum auctions and from third parties to address increasing demand for data and our ability to utilize spectrum we acquire; deployment and operation of new wireline broadband network technologies at a reasonable cost and the availability and success of new products and services to be rolled out using such network technologies; network reliability and change management; and our deployment of self-learning tools and automation that may change the way we interact with customers.
· Capital expenditure levels and potential outlays for spectrum licences in auctions or purchases from third parties, affect and are affected by: our broadband initiatives, including connecting more homes and businesses directly to fibre; our ongoing deployment of newer wireless technologies, including wireless small cells to improve coverage and capacity and prepare for a more efficient and timely evolution to 5G wireless services; investments in network resiliency and reliability; the allocation of resources to acquisitions and future wireless spectrum auctions held by Innovation, Science and Economic Development Canada (ISED), including the 3500 MHz and millimetre wave spectrum auctions expected to take place in 2020 and 2021, respectively, and the announcement of a formal consultation on the auctioning of 3800 MHz spectrum, expected to take place in 2022. Our capital expenditure levels could be impacted if we do not achieve our targeted operational and financial results or by changes to our regulatory environment.
· Operational performance and business combination risks including: our reliance on legacy systems and ability to implement and support new products and services and business operations in a timely manner; our ability to manage the requirements of large enterprise deals; our ability to implement effective change management for system replacements and upgrades, process redesigns and business integrations (such as our ability to successfully integrate acquisitions, complete divestitures or establish partnerships in a timely manner and realize expected strategic benefits, including those following compliance with any regulatory orders); our ability to identify and manage new risks inherent in new service offerings that we may provide, including as a result of acquisitions, which could result in damage to our brand, our business in the relevant area or as a whole, and additional exposure to litigation or regulatory proceedings.
· Data protection including risks that malfunctions or unlawful acts could result in unauthorized access to, change, loss, or distribution of data, which may compromise the privacy of individuals and could result in financial loss and harm to our reputation and brand.
· Security threats including intentional damage or unauthorized access to our physical assets or our IT systems and networks, which could prevent us from providing reliable service or result in unauthorized access to our information or that of our customers.
· Ability to successfully implement cost reduction initiatives and realize planned savings, net of restructuring and other costs, without losing customer service focus or negatively affecting business operations. Examples of these initiatives are: our operating efficiency and effectiveness program to drive improvements in financial results; business integrations; business product simplification; business process automation and outsourcing; offshoring and reorganizations; procurement initiatives; and real estate rationalization.
· Foreign operations and our ability to successfully manage operations in foreign jurisdictions, including managing risks such as currency fluctuations.
· Business continuity events including: our ability to maintain customer service and operate our network in the event of human error or human-caused threats, such as cyberattacks and equipment failures that could cause various degrees of network outages; supply chain disruptions, delays and economics, including as a result of government restrictions or trade actions; natural disaster threats; epidemics; pandemics; political instability in certain international locations; information security and privacy breaches, including data loss or theft of data; and the completeness and effectiveness of business continuity and disaster recovery plans and responses.
· Human resource matters including: recruitment, retention and appropriate training in a highly competitive industry, and the level of our employee engagement.
· Financing and debt requirements including: our ability to carry out financing activities, refinance our maturing debt and/or maintain investment grade credit ratings in the range of BBB+ or the equivalent. Our business plans and growth could be negatively affected if existing financing is not sufficient to cover our funding requirements.
![]()
· Lower than planned free cash flow could constrain our ability to invest in operations, reduce leverage or return capital to shareholders, and could affect our ability to sustain our dividend growth program through 2022. This program may be affected by factors such as the competitive environment, economic performance in Canada, our earnings and free cash flow, our levels of capital expenditures and spectrum licence purchases, acquisitions, the management of our capital structure, and regulatory decisions and developments. Quarterly dividend decisions are subject to assessment and determination by our Board of Directors based on our financial position and outlook. Shares may be purchased under our normal course issuer bid (NCIB) when and if we consider it opportunistic, based on our financial position and outlook, and the market price of TELUS Common Shares. There can be no assurance that our dividend growth program or any NCIB will be maintained, not changed and/or completed.
· Taxation matters including: interpretation of complex domestic and foreign tax laws by the relevant tax authorities that may differ from our interpretations; the timing and character of income and deductions, such as tax depreciation and operating expenses; tax credits or other attributes; changes in tax laws, including tax rates; tax expenses being materially different than anticipated, including the taxability of income and deductibility of tax attributes; elimination of income tax deferrals through the use of different tax year-ends for operating partnerships and corporate partners; and changes to the interpretation of tax laws, including those resulting from changes to applicable accounting standards or the adoption of more aggressive auditing practices by tax authorities , tax reassessments or adverse court decisions impacting the tax payable by us.
· Litigation and legal matters including: our ability to successfully respond to investigations and regulatory proceedings; our ability to defend against existing and potential claims and lawsuits (including intellectual property infringement claims and class actions based on consumer claims, data, privacy or security breaches and secondary market liability), or to negotiate and execute upon indemnity rights or other protections in respect of such claims and lawsuits; and the complexity of legal compliance in domestic and foreign jurisdictions, including compliance with competition, anti-bribery and foreign corrupt practices laws.
· Health, safety and the environment including: lost employee work time resulting from illness or injury, public concerns related to radio frequency emissions, environmental issues affecting our business, including climate change, waste and waste recycling, risks relating to fuel systems on our properties, and changing government and public expectations regarding environmental matters and our responses.
· Economic growth and fluctuations including: the state of the economy in Canada, which may be influenced by economic and other developments outside of Canada, including potential outcomes of yet unknown policies and actions of foreign governments; expectations of future interest rates; inflation; unemployment levels; effects of fluctuating oil prices; effects of low business spending (such as reducing investments and cost structure); pension investment returns, funding and discount rates; fluctuations in foreign exchange rates of the currencies in the regions in which we operate; the impact of tariffs on trade between Canada and the U.S., and global implications of the trade dynamic between major world economies.
These risks are described in additional detail in Section 9 General trends, outlook and assumptions, and regulatory developments and proceedings and Section 10 Risks and risk management in this MD&A. Those descriptions are incorporated by reference in this cautionary statement but are not intended to be a complete list of the risks that could affect the Company.
Many of these factors are beyond our control or our current expectations or knowledge. Additional risks and uncertainties not currently known to us or that we currently deem to be immaterial may also have a material adverse effect on our financial position, financial performance, cash flows, business or reputation. Except as otherwise indicated in this document, the forward-looking statements made herein do not reflect the potential impact of any non-recurring or special items or any mergers, acquisitions, dispositions or other business combinations or transactions that may be announced or that may occur after the date of this document.
Readers are cautioned not to place undue reliance on forward-looking statements. Forward-looking statements in this document describe our expectations, and are based on our assumptions, as at the date of this document and are subject to change after this date. Except as required by law, we disclaim any intention or obligation to update or revise any forward-looking statements.
This cautionary statement qualifies all of the forward-looking statements in this MD&A.
![]()
Management’s discussion and analysis (MD&A)
February 13, 2020
Contents
Section |
| Page |
| Subsection | ||
1. |
| Introduction |
| 6 |
| 1.1 Preparation of the MD&A |
|
|
|
| 6 |
| 1.2 The environment in which we operate |
|
|
|
| 7 |
| 1.3 Highlights of 2019 |
|
|
|
| 13 |
| 1.4 Performance scorecard (key performance measures) |
2. |
| Core business and strategy |
| 16 |
| 2.1 Core business |
|
|
|
| 75 |
| 2.2 Strategic imperatives |
3. |
| Corporate priorities |
| 17 |
|
|
4. |
| Capabilities |
| 21 |
| 4.1 Principal markets addressed and competition |
|
|
|
| 24 |
| 4.2 Operational resources |
|
|
|
| 28 |
| 4.3 Liquidity and capital resources |
|
|
|
| 30 |
| 4.4 Disclosure controls and procedures and changes in internal control over financial reporting |
5. |
| Discussion of operations |
| 31 |
| 5.1 General |
|
|
|
| 33 |
| 5.2 Summary of consolidated quarterly results, trends and fourth quarter recap |
|
|
|
| 37 |
| 5.3 Consolidated operations |
|
|
|
| 41 |
| 5.4 Wireless segment |
|
|
|
| 45 |
| 5.5 Wireline segment |
6. |
| Changes in financial position |
| 49 |
|
|
7. |
| Liquidity and capital resources |
| 50 |
| 7.1 Overview |
|
|
|
| 51 |
| 7.2 Cash provided by operating activities |
|
|
|
| 51 |
| 7.3 Cash used by investing activities |
|
|
|
| 52 |
| 7.4 Cash provided (used) by financing activities |
|
|
|
| 54 |
| 7.5 Liquidity and capital resource measures |
|
|
|
| 56 |
| 7.6 Credit facilities |
|
|
|
| 58 |
| 7.7 Sale of trade receivables |
|
|
|
| 58 |
| 7.8 Credit ratings |
|
|
|
| 58 |
| 7.9 Financial instruments, commitments and contingent liabilities |
|
|
|
| 60 |
| 7.10 Outstanding share information |
|
|
|
| 60 |
| 7.11 Transactions between related parties |
8. |
| Accounting matters |
| 61 |
| 8.1 Critical accounting estimates and judgments |
|
|
|
| 65 |
| 8.2 Accounting policy developments |
9. |
| General trends, outlook and assumptions, and regulatory developments and proceedings |
| 66 |
| 9.1 Telecommunications industry in 2019 |
67 |
| 9.2 Telecommunications industry general outlook and trends | ||||
70 |
| 9.3 TELUS assumptions for 2020 | ||||
71 |
| 9.4 Communications industry regulatory developments and proceedings | ||||
10. |
| Risks and risk management |
| 75 |
| 10.1 Overview |
|
|
|
| 75 |
| 10.2 Principal risks and uncertainties |
|
|
|
| 77 |
| 10.3 Regulatory matters |
|
|
|
| 79 |
| 10.4 Competitive environment |
|
|
|
| 81 |
| 10.5 Technology |
|
|
|
| 83 |
| 10.6 Suppliers |
|
|
|
| 84 |
| 10.7 Organizational change |
|
|
|
| 84 |
| 10.8 Customer service delivery |
|
|
|
| 85 |
| 10.9 Our systems and processes |
|
|
|
| 86 |
| 10.10 Security and data protection |
|
|
|
| 87 |
| 10.11 Our team |
|
|
|
| 88 |
| 10.12 Our environment |
|
|
|
| 89 |
| 10.13 Financing, debt and dividends |
|
|
|
| 90 |
| 10.14 Tax matters |
|
|
|
| 91 |
| 10.15 The economy |
|
|
|
| 92 |
| 10.16 Litigation and legal matters |
11. |
| Definitions and reconciliations |
| 93 |
| 11.1 Non-GAAP and other financial measures |
|
|
|
| 96 |
| 11.2 Operating indicators |
Copyright © 2020 TELUS Corporation. All rights reserved. Certain products and services named in this report are trademarks. The symbols TM and ® indicate those owned by TELUS Corporation or its subsidiaries. All other trademarks are the property of their respective owners.
![]()
1. Introduction
The forward-looking statements in this section, including estimates regarding economic growth, unemployment rates and housing starts, are qualified by the Caution regarding forward-looking statements at the beginning of this Management’s discussion and analysis (MD&A).
1.1 Preparation of the MD&A
The following sections are a discussion of our consolidated financial position and financial performance for the year ended December 31, 2019, and should be read together with our December 31, 2019, audited consolidated statements of income and other comprehensive income, statements of financial position, statements of changes in owners’ equity and statements of cash flows, and the related notes (collectively referred to as the Consolidated financial statements). The generally accepted accounting principles (GAAP) that we use are International Financial Reporting Standards (IFRS) as issued by the International Accounting Standards Board (IASB) and Canadian GAAP. In this MD&A, the term IFRS refers to these standards. We adopted IFRS 16, Leases, on January 1, 2019, with retrospective application, and the cumulative effect of the initial application of the new standard was recognized at the date of initial application, January 1, 2019. This method of application does not result in the retrospective adjustment of amounts reported for periods prior to fiscal 2019. The most significant effect of the new standard is the lessee’s recognition of the initial present value of unavoidable future lease payments as right-of-use lease assets and lease liabilities, including those for most leases that would previously have been accounted for as operating leases. This results in depreciation of right-of-use lease assets and financing costs arising from lease liabilities, rather than as part of Goods and services purchased. The adoption of the new standard has resulted in an increase of approximately $1.0 billion in Property, plant and equipment and an increase of approximately $1.4 billion in long-term debt as at January 1, 2019. However, the implementation of IFRS 16 does not have any impact on economics or cash flows. In our discussion, we also use certain non-GAAP financial measures to evaluate our performance, monitor compliance with debt covenants and manage our capital structure. These measures are defined, qualified and reconciled with their nearest GAAP measures in Section 11.1. All currency amounts are in Canadian dollars, unless otherwise specified.
Additional information relating to the Company, including our annual information form and other filings with securities commissions or similar regulatory authorities in Canada, is available on SEDAR (sedar.com). Our filings with the Securities and Exchange Commission in the United States, including Form 40-F, are available on EDGAR (sec.gov).
Our disclosure controls and procedures are designed to provide reasonable assurance that all relevant information is gathered and reported to senior management on a timely basis, so that appropriate decisions can be made regarding public disclosure. This MD&A and the Consolidated financial statements were reviewed by our Audit Committee and authorized by our Board of Directors (Board) for issuance on February 13, 2020.
In this MD&A, unless otherwise indicated, results for the year ended December 31, 2019, are compared with results for the year ended December 31, 2018.
1.2 The environment in which we operate
The success of our business and the challenges we face can best be understood with reference to the environment in which we operate, including broader economic factors that affect our customers and us, and the competitive nature of our operations. Our estimates regarding our environment, including economic growth, unemployment rates and housing starts, also form an important part of the assumptions on which our targets are based. The extent to which these estimates affect us and the timing of their impact will depend upon the actual experience of specific sectors of the Canadian economy.
2019 Canadian telecom |
| TELUS 2019 revenues |
| TELUS subscriber |
| TELUS 2019 dividends | |
Est. 2% |
| $ | 14.7 billion |
| 15.2 million |
| $1.4 billion / 8.4% |
![]()
|
| Economic growth |
| Unemployment |
| Housing starts |
| ||||||||||||
|
| (Percentage points) |
| (Percentage points) |
| (000s of units) |
| ||||||||||||
|
| Estimated gross |
| Our |
| Unemployment rates |
| Our |
| Seasonally adjusted |
| Our estimated |
| ||||||
|
|
|
|
|
|
|
| For the month of |
|
|
| For the month of |
|
|
| ||||
|
|
|
|
|
|
|
| December |
| December |
|
|
| December |
| December |
|
|
|
|
| 2020 |
| 2019 |
| 2020 |
| 20193 |
| 20183 |
| 2020 |
| 2019 |
| 2018 |
| 2020 |
|
Canada |
| 1.6 | 4 | 1.5 | 4 | 1.6 |
| 5.6 |
| 5.6 |
| 5.9 |
| 197 |
| 214 |
| 201 |
|
B.C. |
| 1.9 | 5 | 1.7 | 5 | 2.3 |
| 4.8 |
| 4.4 |
| 4.7 |
| 43 |
| 51 |
| 39 |
|
Alberta |
| 2.7 | 5 | 0.6 | 5 | 1.9 |
| 7.0 |
| 6.4 |
| 6.9 |
| 40 |
| 19 |
| 27 |
|
Ontario |
| 1.6 | 5 | 1.4 | 5 | 1.6 |
| 5.3 |
| 5.4 |
| 5.7 |
| 57 |
| 70 |
| 73 |
|
Quebec |
| 1.5 | 5 | 1.8 | 5 | 1.6 |
| 5.3 |
| 5.5 |
| 5.0 |
| 37 |
| 53 |
| 46 |
|
(1) Assumptions are as of October 25, 2019 and are based on a composite of estimates from Canadian banks and other sources.
(2) Source: Statistics Canada. Table 34-10-0158-01 Canada Mortgage and Housing Corporation, housing starts, all areas, Canada and provinces, seasonally adjusted at annual rates, monthly (x 1,000).
(3) Source: Statistics Canada Labour Force Survey, December 2019 and December 2018, respectively.
(4) Source: Bank of Canada Monetary Policy Report, January 2020.
(5) Source: British Columbia Ministry of Finance, 2019/20 First Quarterly Report, September 2019; Alberta Ministry of Treasury Board and Finance, 2019 — 23 Fiscal Plan, October 2019; Ontario Ministry of Finance, 2019 Ontario Budget, April 2019; and Ministère des Finances du Québec, Budget 2019 — 2020, March 2019, respectively.
Canadian telecommunications industry growth
We estimate that Canadian telecommunications industry revenues (including TV revenue and excluding media revenue) grew by approximately 2% in 2019 (4% in 2018). We estimate that the Canadian wireless industry added approximately 1.9 million subscribers in 2019 and experienced network revenue growth of approximately 1.6%. Wireless revenues continued to account for the largest portion of telecommunications sector revenues. Key drivers of subscriber growth included the increased demand for data services; immigration and population growth; the trend toward multiple devices, including tablets and Internet of Things (IoT) offerings; the expanding functionality of data and related applications; and mobile adoption by both younger and older generations. With respect to the wireline industry, the Western Canadian consumer high-speed internet penetration rate grew by approximately 1% to 87% in 2019 and subscriber growth is expected to continue. More Canadians are subscribing to internet services, as they continued to use more data, subscribe to faster and larger packages, and allocate more money to internet services. Competitive pressures continued in both the wireline consumer and business markets, while declines in higher-margin legacy voice services were ongoing, partially attributable to technological substitution. (See Section 9 General trends, outlook and assumptions, and regulatory developments and proceedings, Section 10.4 Competitive environment and Section 10.15 The economy.)
1.3 Highlights of 2019
Spectrum
On April 10, 2019, we announced that we were the successful bidder on 12 wireless spectrum licences in B.C., Alberta, Saskatchewan, Ontario and Quebec in the Innovation, Science and Economic Development Canada (ISED) 600 MHz wireless spectrum auction. The 600 MHz band is important for its ability to travel long distances in rural areas and infiltrate barriers to better reach in-building locations, such as elevators and parking garages, making it highly conducive to 5G deployment. The licences, acquired for $931 million ($2.35 per MHz-pop, where pop refers to the population in a licence area), equate to a national average of 11.3 MHz and will enable us to deliver enhanced mobile broadband connectivity as the industry transitions from 4G LTE to 5G. The design of the combinatorial clock auction (CCA), coupled with a 30 MHz set-aside for regional carriers (representing 43% of the spectrum at auction), led to national carriers paying a 134% premium over regional operators, and according to our analysis, the highest prices for 600 MHz spectrum in the world. Outside of Canada, set-asides are very rare, and in the few instances of CCAs with set-asides, the set-asides have represented only approximately 5% of the spectrum at auction.
During the third quarter of 2019, we obtained the use of certain AWS-4 spectrum licences from the original licensee (for approximately $1.16 per MHz-pop) and have accounted for them as intangible assets with indefinite lives; such subordination of licences has been approved by ISED. Additionally, we obtained AWS-1 and AWS-3 spectrum licences in Northern Ontario.
![]()
Telecommunications business acquisition
On January 14, 2019, we acquired a telecommunications business that is complementary to our existing lines of business, for consideration consisting of cash and accounts payable and accrued liabilities of $75 million and TELUS Corporation Common Shares of $38 million. The investment was made with a view to growing our managed network, cloud, security and unified communications services.
Smart data solutions business acquisition
On August 12, 2019, we acquired a business that is complementary to, and with a view to growing, our existing smart data solutions business, for consideration consisting of cash and accounts payable and accrued liabilities of $135 million.
ADT Security Services Canada, Inc.
On November 5, 2019, we acquired the customers, assets and operations of ADT Security Services Canada, Inc. (ADT Canada) for approximately $700 million. This acquisition furthers our commitment to leverage the power of technology to enhance convenience, control and safety in the lives, homes and businesses of more Canadians.
Business acquisition — subsequent to 2019
On December 4, 2019, we announced that we had entered into an agreement to acquire 100% of German-headquartered Competence Call Center (CCC) for approximately $1.3 billion (€915 million), less debt assumed and subject to customary closing conditions, including regulatory approvals. Subsequently, the requisite regulatory approvals were obtained and the transaction closed on January 31, 2020. CCC is a provider of higher-value-added business services with a focus on customer relationship management and content moderation. CCC offers its services across 11 European countries and partners with industry-leading global brands primarily from fast-growing technology, media and telecommunications, retail, and travel and hospitality sectors.
Endless data, device financing and family discounts
As part of our commitment to putting customers first, on July 3, 2019, we introduced mobile phone endless data in combination with device financing and family discounts. Our Peace of Mind rate plans give customers access to endless data starting at $75 per month for 10 GB of high-speed data. If a customer reaches their high-speed data threshold within the monthly billing cycle, data speeds will be reduced to 512 Kbps without the customer being charged for any overages. TELUS Easy Payment®, our device financing program, gives customers access to any smartphone for as little as $0 upfront, with financing options over 24 months. TELUS Family Discounts provide incremental savings, ranging from $5 to $15, off the monthly rate plan with every new family member who signs up (up to a maximum of nine lines).
Long-term debt issue and early redemption of 2020 Notes, lengthening our average term to maturity and lowering our weighted average cost
On April 3, 2019, we issued $1.0 billion of senior unsecured 3.30% Notes, Series CY, which will mature on May 2, 2029. The net proceeds were used to repay outstanding indebtedness, including outstanding commercial paper, for the reduction of cash amounts outstanding under an arm’s-length securitization trust and for general corporate purposes.
On May 28, 2019, we issued US$500 million of senior unsecured 4.30% Notes, which will mature on June 15, 2049. The net proceeds were used to repay outstanding indebtedness, including outstanding commercial paper, to redeem $650 million of the $1.0 billion aggregate principal amount of our 5.05% Notes, Series CH, due July 23, 2020, and for general corporate purposes. We have fully hedged the principal and interest obligations of the notes by entering into a foreign exchange derivative (a cross currency interest rate exchange agreement), which effectively converted the principal payments and interest obligations to Canadian dollar obligations with a fixed interest rate of 4.27% and an issued and outstanding amount of $672 million (reflecting a fixed exchange rate of $1.3435).
On July 2, 2019, we issued $800 million of senior unsecured 2.75% Notes, Series CZ, which will mature on July 8, 2026. The net proceeds were used to redeem the remaining $350 million of our 5.05% Notes, Series CH, to repay outstanding indebtedness, including outstanding commercial paper, and for general corporate purposes.
On December 16, 2019, we issued $600 million of senior unsecured 3.15% Notes, Series CAA, which will mature on February 19, 2030, and $400 million of senior unsecured 3.95% Notes, Series CAB, which will mature on February 16, 2050. The net proceeds were used to repay outstanding indebtedness, to finance the acquisition of ADT Canada, to fund capital expenditures and for general corporate purposes.
On July 23, 2019, we early redeemed $650 million of our 5.05% Notes, Series CH. On August 7, 2019, we early redeemed the remaining $350 million that was not redeemed on July 23, 2019. The long-term debt prepayment premium for the entire $1.0 billion Series CH notes redemption was $28 million before income taxes ($0.03 per share after income taxes) (pre-share split — see Share split — subsequent to 2019 in Section 1.3 below). Subsequent to this early redemption, we no longer have any TELUS Corporation notes maturing in 2020.
![]()
Collectively, these transactions lengthened the average term to maturity of our long-term debt (excluding commercial paper, the revolving component of the TELUS International (Cda) Inc. credit facility, lease liabilities and other long-term debt) from approximately 12.2 years at December 31, 2018, to approximately 12.8 years at December 31, 2019, and lowered the weighted average cost of our long-term debt (excluding commercial paper, the revolving component of the TELUS International (Cda) Inc. credit facility, lease liabilities and other long-term debt) from 4.18% at December 31, 2018 to 3.94% at December 31, 2019.
Multi-year dividend growth program
On May 9, 2019, we announced our intention to target ongoing semi-annual dividend increases, with the annual increase in the range of 7 to 10% from 2020 through to the end of 2022. This announcement further extends our dividend program, which was originally announced in May 2011 and extended for three additional years in each of May 2013 and May 2016. So as to be consistent with the way we manage our business, we have revised our target guideline, effective January 1, 2020, to be calculated as 60 to 75% of free cash flow on a prospective basis (free cash flow is a non-GAAP measure, see Section 11.1). Notwithstanding this target, dividend decisions will continue to be subject to our Board’s assessment and the determination of our financial situation and outlook on a quarterly basis. There can be no assurance that we will maintain a dividend growth program through 2022. See Section 4.3 Liquidity and capital resources.
Changes to the Board of Directors
Bill MacKinnon retired from our Board in May 2019. Bill had been a director since 2009, and served as the chair of the Audit Committee from 2011 to May 2018 and as a member of the Corporate Governance Committee from 2013 to 2015.
Sabi Marwah also retired from our Board in May 2019. Sabi joined the Board in 2015 and served on both the Audit and Corporate Governance Committees.
During the third quarter of 2019, Claude Mongeau stepped down from our Board. Claude joined the Board in 2017 and served on both the Audit and Corporate Governance Committees.
We thank Bill, Sabi and Claude for their outstanding contributions and service to TELUS.
Share split — subsequent to 2019
Subsequent to December 31, 2019, we announced a subdivision of our Common Shares on a two-for-one basis to be effected March 17, 2020. In all instances, unless otherwise indicated, the number of shares authorized, the number of shares outstanding, the number of shares reserved, per share amounts and share-based compensation information in the MD&A have not been retrospectively restated to reflect the impact of the subdivision; such restatement would take place subsequent to the subdivision.
![]()
Consolidated highlights
Years ended December 31 ($ millions, except footnotes and unless noted otherwise) |
| 2019 |
| 2018 |
| Change |
|
Consolidated statements of income |
|
|
|
|
|
|
|
Revenues arising from contracts with customers |
| 14,589 |
| 14,095 |
| 3.5 | % |
Other operating income1 |
| 69 |
| 273 |
| (74.7 | )% |
Operating revenues1 |
| 14,658 |
| 14,368 |
| 2.0 | % |
Operating income2 |
| 2,977 |
| 2,837 |
| 4.9 | % |
Income before income taxes2 |
| 2,244 |
| 2,176 |
| 3.1 | % |
Net income2 |
| 1,776 |
| 1,624 |
| 9.4 | % |
Net income attributable to Common Shares2 |
| 1,746 |
| 1,600 |
| 9.1 | % |
Adjusted Net income3 |
| 1,727 |
| 1,703 |
| 1.4 | % |
|
|
|
|
|
|
|
|
Earnings per share (EPS)4 ($) |
|
|
|
|
|
|
|
Basic EPS2 |
| 2.90 |
| 2.68 |
| 8.2 | % |
Adjusted basic EPS3 |
| 2.86 |
| 2.85 |
| 0.4 | % |
Diluted EPS |
| 2.90 |
| 2.68 |
| 8.2 | % |
Dividends declared per Common Share4 ($) |
| 2.2525 |
| 2.1000 |
| 7.3 | % |
|
|
|
|
|
|
|
|
Basic weighted-average Common Shares outstanding (millions) |
| 602 |
| 597 |
| 0.8 | % |
Consolidated statements of cash flows |
|
|
|
|
|
|
|
Cash provided by operating activities |
| 3,927 |
| 4,058 |
| (3.2 | )% |
|
|
|
|
|
|
|
|
Cash used by investing activities |
| (5,044 | ) | (2,977 | ) | 69.4 | % |
Acquisitions |
| (1,105 | ) | (280 | ) | n/m |
|
Capital expenditures5 |
| (2,906 | ) | (2,914 | ) | (0.3 | )% |
|
|
|
|
|
|
|
|
Cash provided (used) by financing activities |
| 1,238 |
| (1,176 | ) | n/m |
|
Other highlights |
|
|
|
|
|
|
|
Subscriber connections6,7 (thousands) |
| 15,166 |
| 13,947 |
| 8.7 | % |
Earnings before interest, income taxes, depreciation and amortization (EBITDA)2,3 |
| 5,554 |
| 5,104 |
| 8.8 | % |
Restructuring and other costs3.8 |
| 134 |
| 317 |
| (57.7 | )% |
Adjusted EBITDA3,9 |
| 5,693 |
| 5,250 |
| 8.4 | % |
Adjusted EBITDA margin3,10 (%) |
| 38.8 |
| 37.0 |
| 1.8 | pts. |
Free cash flow3 |
| 932 |
| 1,207 |
| (22.8 | )% |
Net debt to EBITDA — excluding restructuring and other costs3 (times) |
| 3.20 |
| 2.54 |
| 0.66 |
|
Notations used in MD&A: n/m — not meaningful; pts. — percentage points.
(1) In the third quarter of 2018, we recorded equity income related to real estate joint ventures of $171 million arising from the sale of TELUS Garden. Excluding the effect of this third quarter 2018 equity income, Other operating income decreased by 32.4% in 2019, and Operating revenues increased by 3.2% in 2019.
(2) Excluding the third quarter 2018 equity income described in footnote 1 and the third quarter 2018 donation described in footnote 8, in 2019, Operating income increased by 6.9%, Income before income taxes increased by 5.7%, Net income increased by 13.6%, Net income attributable to Common Shares increased by 13.4%, basic EPS increased by 12.4% (pre-share split) and EBITDA increased by 10.0%.
(3) �� These are non-GAAP and other financial measures. See Section 11.1 Non-GAAP and other financial measures.
(4) Pre-share split — see Share split — subsequent to 2019 in Section 1.3.
(5) Capital expenditures include assets purchased, excluding right-of-use lease assets, but not yet paid for, and consequently differ from Cash payments for capital assets, excluding spectrum licences, as reported in the Consolidated financial statements. Refer to Note 31 of the Consolidated financial statements for further information.
(6) The sum of active mobile phone subscribers, mobile connected device subscribers, internet subscribers, residential voice subscribers, TV subscribers and security subscribers, measured at the end of the respective periods based on information in billing and other source systems. During the first quarter of 2019, we adjusted cumulative internet subscriber connections to add approximately 16,000 subscribers from acquisitions undertaken during the quarter. Effective for the third quarter of 2019, with retrospective application to the launch of TELUS-branded security services at the beginning of the third quarter of 2018, we have added security subscriber connections to our total subscriber connections. December 31, 2019 security subscriber connections have been increased to include approximately 490,000 subscribers related to our acquisition of ADT Canada (acquired on November 5, 2019).
(7) Effective for the first quarter of 2019, with retrospective application, we revised our definition of a wireless subscriber and now report mobile phones and mobile connected devices as separate subscriber bases so as to be consistent with the way we manage our business and to align with global peers. As a result of the change, total subscribers and associated operating statistics (gross additions, net additions, churn, average billing per subscriber per month or ABPU, and average revenue per subscriber per month or ARPU) were adjusted to reflect (i) the movement of certain subscribers from the mobile phones subscriber base to the newly created mobile connected devices subscriber base, and (ii) the inclusion of previously undisclosed IoT and mobile health subscribers in our mobile connected devices subscriber base. For additional information on our subscriber definitions, see Section 11.2 Operating indicators.
(8) In the third quarter of 2018, we recorded a donation to the TELUS Friendly Future Foundation™ of $118 million as part of other costs.
(9) Adjusted EBITDA for all periods excludes restructuring and other costs (see Section 11.1 for restructuring and other costs amounts). Adjusted EBITDA for all periods excludes non-recurring losses and equity losses (gains and equity income) related to real estate joint ventures.
(10) Adjusted EBITDA margin is Adjusted EBITDA divided by Operating revenues, where the calculation of Operating revenues excludes non-recurring gains and equity income related to real estate joint ventures.
![]()
Operating highlights
· Consolidated operating revenues increased by $290 million in 2019. Excluding the effect of the non-recurring third quarter 2018 equity income related to real estate joint ventures arising from the sale of TELUS Garden of $171 million, consolidated operating revenues increased by $461 million in 2019:
Service revenues increased by $518 million in 2019, due to growth in wireless network revenue and wireline data services revenue. This growth was partly offset by the ongoing declines in wireline legacy voice and legacy data service revenues.
Equipment revenues decreased by $24 million in 2019, reflecting lower wireless contracted volumes and lower wireline data and voice equipment sales.
Other operating income decreased by $204 million in 2019, primarily due to the non-recurrence of third quarter 2018 equity income related to real estate joint ventures arising from the sale of TELUS Garden of $171 million, in addition to the non-recurrence of gains on sale of certain assets in the fourth quarter of 2018.
For additional details on operating revenues, see Section 5.4 Wireless segment and Section 5.5 Wireline segment.
· During 2019, our total subscriber connections increased by 1,219,000, reflecting a 3.2% increase in mobile phone subscribers, a 21.6% increase in mobile connected device subscribers, a 6.6% increase in internet subscribers, a 6.1% increase in TV subscribers and an increase of 536,000 security subscribers, partly offset by a 3.5% decline in residential voice subscribers.
Effective for the first quarter of 2019, with retrospective application, we have revised our definition of a mobile phone subscriber. (See Section 11.2 Operating indicators for definitions.) Our mobile phone net additions were 274,000 in 2019, up 10,000 driven by growth in high-value customer additions, growth in the Canadian population, successful promotions and expanded channels, partly offset by higher mobile phone churn. Mobile connected device net additions were 263,000 in 2019, up 70,000 due to growth in our IoT offerings, including the connected device growth arising from our subscribers expanding their IoT services to their growing customer bases, partially offset by reduced loading of low or negative-margin tablets. Our mobile phone churn rate was 1.08% in 2019, up slightly from 1.06% in 2018, reflecting heightened competitive intensity. (See Section 5.4 Wireless segment for additional details.)
Internet net additions were 107,000 in 2019, down 8,000, as continued net new demand from consumers and businesses was offset by increased deactivations resulting from heightened competitive intensity. TV net additions were 67,000 in 2019, up 4,000, in contrast with market-reported declines in traditional television viewing habits, reflecting higher gross additions as a result of our diverse product offerings, partly offset by heightened competitive intensity. Our continued focus on expanding our addressable high-speed internet and Optik TV® footprint, connecting more homes and businesses directly to fibre, diversifying our product offerings, and bundling these products and services together, as well as our ongoing focus on our customer service and reliability, contributed to combined internet and TV subscriber growth of 190,000 or 6.4% over the last 12 months. We had made TELUS PureFibre® available to approximately 70% of our broadband footprint by the end of 2019. Residential voice net losses improved by 13.7% in 2019 due to our expanding fibre footprint and bundled product offerings and the success of our stronger retention efforts, including lower-priced offerings. Excluding the effects of ADT Canada, security net additions were 46,000, reflecting strong organic growth. (See Section 5.5 Wireline segment for additional details.)
· Operating income increased by $140 million in 2019. Excluding the effects of the third quarter 2018 equity income related to real estate joint ventures arising from the sale of TELUS Garden of $171 million and the non-recurring third quarter 2018 donation to the TELUS Friendly Future Foundation of $118 million, Operating income increased by $193 million in 2019, reflecting higher wireless network growth driven by a growing subscriber base, in addition to growth in wireline data service margins and a higher EBITDA contribution from our customer care and business services (CCBS) and health businesses, and the effects of implementing IFRS 16 described in Section 1.1. All of these factors were partly offset by declines in wireline legacy voice and legacy data services, as well as lower gains on sales of certain assets.
EBITDA, which includes restructuring and other costs and non-recurring losses and equity losses (or gains and equity income) related to real estate joint ventures, increased by $450 million or 8.8% in 2019. Excluding the effects of the third quarter 2018 equity income related to real estate joint ventures arising from the sale of TELUS Garden of $171 million and the third quarter 2018 donation to the TELUS Friendly Future Foundation of $118 million, EBITDA increased by $503 million or 10.0% in 2019. The impact of IFRS 16 on EBITDA was an increase of $301 million in 2019.
![]()
Adjusted EBITDA, which excludes restructuring and other costs and non-recurring losses and equity losses (or gains and equity income) related to real estate joint ventures, increased by $443 million or 8.4% in 2019, reflecting higher wireless network revenue driven by a growing subscriber base, growth in wireline data service margins and a higher EBITDA contribution from our CCBS and health businesses. Additionally, upon the application of IFRS 16, Goods and services purchased decreased and, correspondingly, Adjusted EBITDA increased. These factors were partly offset by declines in wireline legacy voice and legacy data services and a decline in the EBITDA contribution from our legacy business services. Applying a retrospective IFRS 16 simulation to fiscal 2018 results, which are cash-based proxy adjustments, all as used by our Chief Executive Officer (our chief operating decision-maker) to assess performance, pro forma consolidated Adjusted EBITDA growth was approximately 4.0% in 2019. (See Section 5.3 Consolidated operations for additional details.)
· Income before income taxes increased by $68 million in 2019. Excluding the effects of the third quarter 2018 equity income related to real estate joint ventures arising from the sale of TELUS Garden of $171 million and the third quarter 2018 donation to the TELUS Friendly Future Foundation of $118 million, Income before income taxes increased by $121 million in 2019. Higher Operating income, as noted above, was partly offset by an increase in Financing costs. The increase in Financing costs resulted primarily from the financing costs recorded that arose from lease liabilities upon the application of IFRS 16 (described in Section 1.1) and from higher average long-term debt outstanding. (See Financing costs in Section 5.3.)
· Income taxes decreased by $84 million in 2019. The effective tax rate decreased from 25.4% to 20.8% predominantly attributable to the revaluation of the deferred income tax liability for the multi-year reduction in the Alberta provincial corporate tax rate that was substantively enacted in the second quarter of 2019.
· Net income attributable to Common Shares increased by $146 million in 2019. Excluding the effects of the third quarter 2018 equity income related to real estate joint ventures arising from the sale of TELUS Garden of $171 million and the third quarter 2018 donation to the TELUS Friendly Future Foundation of $118 million, Net income attributable to Common Shares increased by $206 million, driven by higher Operating income and lower Income taxes, partly offset by increased Financing costs.
Adjusted Net income, which excludes the effects of restructuring and other costs, income tax-related adjustments, non-recurring losses and equity losses (or gains and equity income) related to real estate joint ventures, and long-term debt prepayment premiums, increased by $24 million or 1.4% in 2019.
Reconciliation of adjusted Net income
Years ended December 31 ($ millions) |
| 2019 |
| 2018 |
| Change |
|
Net income attributable to Common Shares |
| 1,746 |
| 1,600 |
| 146 |
|
Add (deduct): |
|
|
|
|
|
|
|
Restructuring and other costs, after income taxes1 |
| 98 |
| 235 |
| (137 | ) |
Favourable income tax-related adjustments |
| (142 | ) | (7 | ) | (135 | ) |
Non-recurring losses and equity losses (gains and equity income) related to real estate joint ventures, after income taxes2 |
| 5 |
| (150 | ) | 155 |
|
Long-term debt prepayment premium, after income taxes |
| 20 |
| 25 |
| (5 | ) |
Adjusted Net income |
| 1,727 |
| 1,703 |
| 24 |
|
(1) Includes our third quarter 2018 committed donation to the TELUS Friendly Future Foundation of $90 million after income taxes.
(2) Includes equity income arising from the third quarter 2018 sale of TELUS Garden of $150 million after income taxes.
· Basic EPS increased by $0.22 or 8.2% (pre-share split — see Share split — subsequent to 2019 in Section 1.3) in 2019. Excluding the effects of the third quarter 2018 equity income related to real estate joint ventures arising from the sale of TELUS Garden of $171 million and the third quarter 2018 donation to the TELUS Friendly Future Foundation of $118 million, basic EPS increased by $0.32 or 12.4% (pre-share split), driven by higher Operating income and lower Income taxes, partly offset by increased Financing costs and the effect of a higher number of Common Shares outstanding.
Adjusted basic EPS, which excludes the effects of restructuring and other costs, income tax-related adjustments, non-recurring gains and equity income related to real estate joint ventures, and long-term debt prepayment premiums, increased by $0.01 or 0.4% (pre-share split) in 2019.
![]()
Reconciliation of adjusted basic EPS1
Years ended December 31 ($) |
| 2019 |
| 2018 |
| Change |
|
Basic EPS |
| 2.90 |
| 2.68 |
| 0.22 |
|
Add (deduct): |
|
|
|
|
|
|
|
Restructuring and other costs, after income taxes, per share2 |
| 0.16 |
| 0.39 |
| (0.23 | ) |
Favourable income-tax related adjustments, per share |
| (0.24 | ) | (0.01 | ) | (0.23 | ) |
Non-recurring losses and equity losses (gains and equity income) related to real estate joint ventures, after income taxes3 |
| 0.01 |
| (0.25 | ) | 0.26 |
|
Long-term debt prepayment premium, after income taxes, per share |
| 0.03 |
| 0.04 |
| (0.01 | ) |
Adjusted basic EPS |
| 2.86 |
| 2.85 |
| 0.01 |
|
(1) Pre-share split — see Share split — subsequent to 2019 in Section 1.3.
(2) Includes our third quarter 2018 committed donation to the TELUS Friendly Future Foundation of $0.15 per share after income taxes (pre-share split).
(3) Includes equity income arising from the third quarter 2018 sale of TELUS Garden of $0.25 per share after income taxes (pre share split).
· Dividends declared per Common Share were $2.2525 (pre-share split — see Share split — subsequent to 2019 in Section 1.3) in 2019, up 7.3% from 2018. Consistent with our target of increasing dividends between 7 to 10% in the near term, the Board declared a first quarter dividend of $0.5825 per share (pre-share split) on our issued and outstanding Common Shares, payable on April 1, 2020, to shareholders of record at the close of business on March 11, 2020. The first quarter dividend increased by $0.0375 per share (pre-share split) or 6.9% from the $0.5450 (pre-share split) per share dividend declared one year earlier, consistent with our multi-year dividend growth program described in Section 4.3 Liquidity and capital resources.
Liquidity and capital resource highlights
· Net debt to EBITDA — excluding restructuring and other costs ratio was 3.20 times at December 31, 2019, up from 2.54 times at December 31, 2018, as the increase in net debt, partly attributed to the acquisition of spectrum licences, and which includes the $1.7 billion recognition of lease liabilities upon the application of IFRS 16, exceeded the effect of the increase in EBITDA — excluding restructuring and other costs. As at December 31, 2019, the acquisition of spectrum licences increased the ratio by approximately 0.22; business acquisitions over the last 12 months increased the ratio by approximately 0.18; and the implementation of IFRS 16 had the effect of increasing the ratio by approximately 0.14. (See Section 4.3 Liquidity and capital resources and Section 7.5 Liquidity and capital resource measures.)
· Cash provided by operating activities decreased by $131 million in 2019, largely attributable to increased income tax payments, which mainly reflected a higher final income tax payment of $270 million in the first quarter of 2019 for the 2018 income tax year; other operating working capital changes; higher restructuring and other costs disbursements, net of expense and Shares settled from Treasury; and increased interest paid. All of these were partially offset by growth in EBITDA. Additionally, repayments of lease liabilities under IFRS 16 increased Cash provided by operating activities by $236 million in 2019, as described in Section 7.2 Cash provided by operating activities.
· Cash used by investing activities increased by $2,067 million in 2019, largely attributable to acquisitions and the cash payment for the 600 MHz spectrum acquisition of $931 million. Acquisitions increased by $825 million in 2019 as we made larger cash payments for business acquisitions including ADT Canada on November 5, 2019. Capital expenditures decreased by $8 million in 2019, primarily due to the timing of our fibre build activities, partially offset by increased 5G investments, which began in the fourth quarter of 2018. We had made TELUS PureFibre available to approximately 70% of our broadband footprint by December 31, 2019. (See Section 7.3 Cash used by investing activities.)
· Cash provided by financing activities increased by $2,414 million in 2019, primarily reflecting increased issues of long-term debt, net of redemptions and repayment. (See Section 7.4 Cash provided (used) by financing activities.)
· Free cash flow decreased by $275 million in 2019, resulting primarily from increased income tax payments, which mainly reflected a higher final income tax payment of $270 million in the first quarter of 2019 for the 2018 income tax year, as described in Cash provided by operating activities, and increased interest paid. The free cash flow decrease in 2019 was partly offset by higher Adjusted EBITDA, the timing related to device subsidy repayments and associated revenue recognition and our TELUS Easy Payment device financing program, and lower capital expenditures. Our definition of free cash flow, for which there is no industry alignment, is unaffected by accounting changes that do not impact cash, such as IFRS 15 and IFRS 16. (See calculation in Section 11.1 Non-GAAP and other financial measures.)
![]()
1.4 Performance scorecard (key performance measures)
In 2019, we achieved three of four consolidated targets, which were announced on February 14, 2019.
We achieved our consolidated revenue target, primarily due to growth in wireless network revenue resulting from growth in our wireless subscriber base. Additionally, we experienced increased wireline data service revenues resulting from growth in CCBS business volumes, increased internet and third-wave data services, increased health revenues inclusive of acquisitions, increased home and business smart technology (including security) revenues, and increased TV revenues, partly offset by the ongoing decline in legacy wireline voice revenue.
We met our Adjusted EBITDA target largely from higher wireless network revenue growth driven by a growing customer base, in addition to growth in EBITDA contribution from our CCBS and health business. These factors were partly offset by declines in wireline legacy voice and legacy data services and a decline in EBITDA contribution from our legacy business services. Although we experienced an increase in Adjusted EBITDA due to the adoption of IFRS 16 on January 1, 2019, our 2019 Adjusted EBITDA target incorporated the effects of the new accounting standard.
Our basic EPS fell within our target range, driven by higher Operating income and lower income taxes, partly offset by increased Financing costs.
Our capital expenditures in 2019 exceeded our consolidated target by 2.0%, as we advanced the timing of certain investments in our broadband infrastructure and made incremental capital expenditures related to our various business acquisitions in 2019. Our investments in broadband infrastructure, including connecting more homes and businesses directly to our fibre-optic infrastructure, resulted in TELUS PureFibre reaching approximately 70% of our broadband footprint at year-end. These investments also support our systems reliability and operational efficiency and effectiveness efforts, as well as our small-cell technology strategy to improve coverage and prepare for a more efficient and timely evolution to 5G.
Our capital structure financial policies and report on financing and capital structure management plans are included in Section 4.3.
The following scorecard compares TELUS’ performance to our consolidated 2019 targets. For information related to our 2019 targets, see Section 9 General trends, outlook and assumptions, and regulatory developments and proceedings.
Scorecard
|
| 2019 performance | ||||
|
| Consolidated targets and growth |
| Actual results |
| Result |
Consolidated |
|
|
|
|
|
|
Revenues1 |
| An increase of |
| $14.66 billion |
| Ö |
Adjusted EBITDA2 |
| An increase of |
| $5.69 billion |
| Ö |
Basic EPS4 |
| An increase of |
| $2.90 |
| Ö |
Capital expenditures (excluding spectrum licences) |
| Approx. $2.85 billion |
| $2.91 billion |
| X |
Met target Ö
Missed target X
(1) The 2019 revenue target and actual results were calculated using operating revenues, excluding the non-recurring third quarter 2018 equity income related to real estate joint ventures arising from the sale of TELUS Garden of $171 million.
(2) See description in Section 11.1 Non-GAAP and other financial measures.
(3) The 2019 Adjusted EBITDA target reflected the non-cash impacting implementation of IFRS 16, Leases on January 1, 2019.
(4) Pre-share split — see Share split — subsequent to 2019 in Section 1.3.
![]()
We made the following key assumptions when we announced the 2019 targets in February 2019.
Assumptions for 2019 targets and results
· Our economic assumptions are based on a composite of estimates from Canadian banks and other sources. Our original assumptions for 2019 were: (i) slightly slower rate of economic growth in Canada of 2.0%; (ii) for our incumbent local exchange carrier (ILEC) provinces in Western Canada, economic growth in B.C. of 2.3%, and economic growth in Alberta of 2.1%.
In our first quarter 2019 MD&A, we revised our 2019 economic growth assumptions to 1.5% in Canada and 1.2% in Alberta. In our third quarter 2019 MD&A, we further revised our 2019 economic growth assumptions for 1.6% in Canada, 1.9% in B.C. and 0.7% in Alberta.
We estimate that economic growth in 2019 was 1.6% in Canada, 1.9% in B.C. and 0.7% in Alberta.
· With respect to unemployment rates, our original assumptions for 2019 were 5.8% in Canada, 4.9% in B.C. and 6.2% in Alberta.
In our first quarter 2019 MD&A, we revised our 2019 unemployment rate assumptions to 4.5% in B.C. and 6.8% in Alberta. In our third quarter 2019 MD&A, we further revised our 2019 unemployment rate assumptions to 5.7% in Canada and 4.6% in B.C.
We estimate that unemployment rates in 2019 were 5.7% in Canada, 4.6% in B.C. and 6.8% in Alberta.
· With respect to the pace of housing starts, on an unadjusted basis, our original assumption for 2019 was 196,000 units in Canada.
In our third quarter 2019 MD&A, on an unadjusted basis, we revised our 2019 assumption for the pace of housing starts to 207,000 in Canada.
We estimate that the annual rate of housing starts on an unadjusted basis for 2019 was 207,000 units.
· Our assumption for 2019 restructuring and other costs was approximately $100 million. Our actual 2019 restructuring and other costs was $134 million, as we incurred costs for continuing operational effectiveness initiatives, with margin enhancement initiatives to mitigate pressures related to intense competition, technological substitution, repricing of our services, increasing subscriber growth and retention costs, and integration costs associated with business acquisitions.
· Our assumption was for stabilization in the average Canadian dollar: U.S. dollar exchange rate, which was $1.30 in 2018. The average Canadian dollar: U.S. dollar exchange rate was $1.33 in 2019 and closed at $1.30 on December 31, 2019, compared to $1.36 on December 31, 2018.
Confirmed:
· No material adverse regulatory rulings or government actions. See Section 9.4 for further information.
· Continued intense wireless and wireline competition in both consumer and business markets.
· Continued increase in wireless industry penetration of the Canadian market.
· Ongoing subscriber adoption of, and upgrades to, data-intensive smartphones, as customers seek more mobile connectivity to the internet.
· Wireless revenue growth resulting from improvements in subscriber loading, with continued competitive pressure on blended ARPU.
· Continued pressure on wireless acquisition and retention expenses, dependent on gross loading and customer renewal volumes, competitive intensity and customer preferences.
· Continued growth in wireline data revenue, reflecting an increase in internet and TV subscribers, speed upgrades, rate plans with larger data usage and expansion of our broadband infrastructure, as well as growth in CCBS, healthcare solutions and home and business security offerings.
· Continued erosion of wireline voice revenues, resulting from technological substitution and greater use of inclusive long distance.
· Continued focus on our customers first initiatives and maintaining our customers’ likelihood-to-recommend.
· Pension plans assumptions for 2019: defined benefit pension plan expense of approximately $79 million recorded in Employee benefits expense; a rate of 3.90% for discounting the obligation (2018 — 3.90%) and a rate of 4.00% for current service costs for employee defined benefit pension plan accounting purposes (2018 — 3.50%); and defined benefit pension plan funding of approximately $52 million. Actual results were: $78 million recorded in Employee benefits expense, a rate of 3.90% for discounting the obligation, a rate of 3.90% for current service costs for employee defined benefit pension plan accounting purposes, and defined benefit pension plan funding of $41 million.
· Our assumption for 2019 income taxes was computed at a statutory rate of 26.7 to 27.3%, and cash income tax payments of approximately $600 million to $680 million. Our actual results were at a statutory income tax rate of 26.9% and cash income tax payments in respect of comprehensive income were $629 million.
· Further investments in broadband infrastructure, as we have reached approximately 70% of our broadband footprint at December 31, 2019, including fibre-optic network expansion and 4G LTE capacity and upgrades, as well as investments in network and systems resiliency and reliability.
· Participation in ISED’s 600 MHz wireless spectrum auction in March to April 2019. We acquired 12 wireless spectrum licences in B.C., Alberta, Saskatchewan, Ontario and Quebec which equate to a national average of 11.3 MHz.
· Continued deployment of access-agnostic technology in our network.
![]()
2. Core business and strategy
2.1 Core business
We provide a wide range of telecommunications products and services. Wireless products and services include network revenue (data and voice) and equipment sales arising from mobile technologies. Wireline products and services include data revenues (which include revenues from internet protocol; television; hosting, managed information technology and cloud-based services; customer care and business services (CCBS) (formerly business process outsourcing); home and business smart technology (including security); and certain healthcare solutions), voice revenues, and other telecommunications services and equipment revenues. We currently earn the majority of our revenue from access to, and usage of, our telecommunications infrastructure, and from providing services and products that facilitate access to, and usage of, our infrastructure.
2.2 Strategic imperatives
Since 2000, we have maintained a proven national growth strategy. Our strategic intent is to unleash the power of the internet to deliver the best solutions to Canadians at home, in the workplace and on the move.
We also developed six strategic imperatives in 2000 that remain relevant for future growth, despite changing regulatory, technological and competitive environments. We believe that a consistent focus on these imperatives guides our actions and contributes to the achievement of our financial goals. To advance these long-term strategic imperatives and address near-term opportunities and challenges, we confirm or set new corporate priorities each year, as further described in Section 3. Our six strategic imperatives are listed below.
· Focusing relentlessly on growth markets of data, IP and wireless
· Providing integrated solutions that differentiate TELUS from our competitors
· Building national capabilities across data, IP, voice and wireless
· Partnering, acquiring and divesting to accelerate the implementation of our strategy and focus our resources on core business
· Going to market as one team under a common brand, executing a single strategy
· Investing in internal capabilities to build a high-performance culture and efficient operation.
![]()
3. Corporate priorities
We confirm or set new corporate priorities each year in order to advance our long-term strategic imperatives (see Section 2.2) and address near-term opportunities and challenges. The following table provides a discussion of activities and initiatives that relate to our 2019 corporate priorities.
Honouring our customers, communities and social purpose by our team delivering on our brand promise
· Each year, we conduct team member Pulsecheck engagement surveys to gather confidential team member feedback about TELUS as a place to work in order to measure our progress in creating a high-performance culture. Following each survey, leaders share results with team members and use fair process to build and refine action plans focused on high-priority areas where improvement is required based on Pulsecheck results. In 2019, our employee engagement score was 84%, which is an encouraging accomplishment against a backdrop of change across our organization over the course of the past year. This result continues to place our Company within the top 10% of all employers surveyed on a global basis.
· In November 2019, the Commission for Complaints for Telecom-television Services (CCTS) issued its annual report for the 12-month period ended July 31, 2019, and TELUS again was the subject of the fewest customer complaints among national carriers, while Koodo® again was the subject of the fewest complaints among the national flanker brands. TELUS, Koodo and Public Mobile were named in 8.3%, 3.9% and 1.0% of the total customer complaints accepted by the CCTS, respectively, or 13.2% of total customer complaints, in aggregate. Additionally, TELUS had the highest rate of complaint resolution of any national carrier at 91.5%.
· We were named one of Canada’s Top 100 Employers (2020) by Mediacorp Canada Inc.
· Throughout 2019, we continued to expand our Connecting for Good™ program portfolio to build stronger, more resilient communities.
· We expanded our Mobility for Good™ program to support 10,000 more youth in B.C., Alberta, Manitoba and New Brunswick. Mobility for Good provides youth transitioning out of foster care with fully subsidized smartphones and data plans to stay connected to their vital support networks.
· Through our Internet for Good™ program and in support of the federal government’s Connecting Families program, an additional 198,000 Internet for Good offers were mailed to eligible households in B.C., Alberta and Quebec. Internet for Good offers low-income families access to low-cost high-speed internet and a computer.
· We piloted our Welcome to Canada initiative, which offers our Internet and Mobility for Good programs to government-assisted refugees arriving in B.C. TELUS provides refurbished phones, wireless plans and internet service to enable refugees to stay in touch with family abroad and access support networks and employment opportunities in Canada. The program aims to ensure a warmer welcome and smoother transition, enabling better outcomes for newcomers to Canada.
· We expanded our Health for Good™ program by establishing seven new strategic partnerships to deploy new mobile health clinics. Our Health for Good program funds TELUS Mobile Health Clinics, powered by TELUS Health technology, to improve the way health practitioners deliver care to the most vulnerable among us.
· We introduced our Tech for Good™ program to help Canadians with disabilities use smartphones and wireless devices so they can live more independent, connected lives. Currently available in B.C. and Alberta, this program is designed to help people with disabilities who require a customized solution involving assistive technology to independently access their TELUS smartphone or tablet.
· At the end of 2019, close to 65,000 Canadians had participated in our Connecting for Good programs.
· We continued to evolve our TELUS Wise® program during 2019 to build digital literacy and safety in our connected world.
· Close to 64,000 Canadians participated in TELUS Wise workshops, up from 52,000 in 2018. These workshops are free of charge and help foster the safe and responsible use of technology in our digital world. Approximately 88% of participants felt more empowered to stay safe online as a result of attending the workshop.
· We launched online versions of our youth workshops, enabling educators and students, especially those in rural communities, to more easily access program information.
· We also continued to work with our peers in TELUS International, extending TELUS Wise messaging and resources to youth around the world, and delivering 15 workshops in other countries, including the Philippines, Bulgaria, Romania, El Salvador and Guatemala.
· We launched a new workshop for teens, TELUS Wise happiness, in February 2019. In August 2019, the workshop became available online, coinciding with the start of the new school year. The workshop engages teens in grades 9 through 12 in a conversation about building and maintaining a healthy relationship with technology and offers tips on ensuring resiliency and well-being.
· Throughout 2019, we inspired Canadians from coast to coast to join Team #EndBullying.
· We partnered with 2019 World Juniors Team Canada captain Maxime Comtois, who was cyberbullied after the hockey tournament.
· At WE Day events across Canada, we shared Maxime’s story, the devastating impacts of online negativity and how Maxime was able to rise above with positive support from his network. We rallied over 70,000 youth to take a stand
![]()
and to help eradicate bullying.
· We integrated Maxime’s story into our 2020 World Juniors campaign, including a commercial TV spot. We encouraged Canadians to join our #EndBullying plight and share messages of support for Team Canada online. We also showcased The Code — a program developed in partnership between TELUS and Hockey Canada — designed specifically for the hockey community. The Code is an extension of the TELUS Wise program, offering customized education tools, resources and workshops to help hockey fans, players and families safely and respectfully navigate digital spaces.
· In the second half of 2019, we launched #EndBullying All-Stars with our five Canadian Football League (CFL) partner teams. #EndBullying All-Stars is an umbrella program that promotes the importance of good sportsmanship both on the field and online, while bringing TELUS Wise workshops to local schools.
· During 2019, over 40,000 global volunteers participated in our TELUS Days of Giving® and collectively contributed 1.1 million volunteer hours. Both results represent year-over-year increases of 10%.
· In the third quarter of 2019, we launched our integrated Pride campaign under our TELUS #ShareLove platform, promoting and celebrating our long-standing commitment to fostering a diverse and inclusive culture. Close to 43,000 team members, family and friends celebrated diversity in nearly 20 Pride events in communities from coast to coast. Last year marked our 13th year of being an active sponsor and participant in Pride events and activities across Canada.
· In September 2019, we were recognized for corporate social responsibility by being named to the Dow Jones Sustainability North American Index for the 19th consecutive year. Additionally, we were named to the Dow Jones Sustainability World Index for the fourth year in a row, one of only nine telecommunications companies globally and the only North American telecommunications company included in the World Index this year.
· We received the BEST Award for excellence in employee learning and development from the Association for Talent Development for the 14th consecutive year.
· The TELUS Quebec team earned the 2019 Highest Customer Service by Industry Award in the telecommunications/TV sector, a North American distinction awarded by SQM Group.
· As noted in Section 1.3 we launched Peace of Mind rate plans and our TELUS Easy Payment device financing program, together with TELUS Family Discounts, offering Canadians endless data with no overage charges.
· During the third quarter of 2019, we launched unlimited home internet data across all speed tiers available to new and renewing customers. Western Canadians can enjoy the freedom of unlimited home internet data, bringing them peace of mind without worrying about data overages.
· In 2019, we successfully celebrated the first year of the TELUS Friendly Future Foundation. Together with the 13 Canadian TELUS Community Boards, the foundation provided nearly $8 million in support of more than 500 projects for vulnerable youth in Canada.
· In December 2019, we launched TELUS’ Donate the Change™ program. Donate the Change is a unique, self-serve program that allows customers to automatically round up their monthly TELUS bill and donate 100% of the difference to the TELUS Friendly Future Foundation. This program is available for both mobility and home solutions customers.
· We ended the year by leading our national peers in likelihood-to-recommend within each wireless tier (premium, flanker and value), as well as in the small business space for both wireless and wireline.
· In January 2020, we were named to the Corporate Knights 2020 Global 100 Most Sustainable Corporations in the World for the eighth time since inception of the recognition in 2005.
Leveraging our broadband networks to drive TELUS’ growth
· We continued to invest in our leading-edge broadband technology, which has enabled the success of our internet, Optik TV and Pik TV® offerings and business services, as well as our Mobility solutions, and helps ready our network for 5G deployment in the future.
· Our 4G LTE infrastructure covered 99% of Canada’s population at December 31, 2019.
· Our high-speed broadband footprint covered approximately 3.2 million households and businesses in B.C., Alberta and Eastern Quebec at December 31, 2019, including 2.22 million households and businesses covered with fibre-optic cable (representing approximately 70% of our total high-speed broadband footprint), which provides these premises with immediate access to our fibre-optic infrastructure. This is up from 1.89 million households and businesses at December 31, 2018.
· In Opensignal’s Mobile Network Experience Canada report released in February 2019, we were recognized as being number one for LTE download speeds, latency and network availability, and we tied for number one for LTE upload speeds and video experience. In Opensignal’s Mobile Network Experience: Canada Report (August 2019), we won the top spot in four awards (4G Availability, Video Experience, Download Speed Experience and Latency Experience) and tied for number one in the fifth award (Upload Speed Experience). We were also the first Canadian operator to surpass the 90% milestone in 4G Availability.
· In the report Canada: State of Mobile Networks March 2019, published by Tutela, a Canadian independent mobile network data company, TELUS was ranked as number one for latency and tied for first place for consistent quality.
· In the J.D. Power 2019 Canada Wireless Network Quality Study, TELUS was recognized for the Highest Wireless Network Quality Performance in Canada.
· We won two Speedtest Awards from Ookla for Canada’s Fastest Mobile Network and Canada’s Best Mobile Coverage.
![]()
· According to PCMag’s Fastest Mobile Network Canada 2019 report released in September 2019, we were recognized as having the fastest mobile network nationally, for the third consecutive year. We were also recognized as having the fastest network in Victoria, Calgary, Edmonton, Regina, Winnipeg, Toronto, Ottawa, Montreal, Quebec City, Saint John, Halifax and Prince Edward Island. Additionally, TELUS was recognized as having the best wireless plan in Canada.
· In March 2019, we completed construction on a new wireless communications site in the Village of Port Clements on Haida Gwaii. This provided residents, visitors and local businesses with access to high-speed wireless voice and internet services over 4G LTE for the first time.
· We were the successful auction participant on 12 wireless spectrum licences across B.C., Alberta, Saskatchewan, Ontario and Quebec in the Innovation, Science and Economic Development Canada 600 MHz wireless spectrum auction. The acquisition of 600 MHz spectrum will enable us to deliver enhanced urban and rural connectivity and advance our national 5G growth strategy.
· We launched TELUS Home Assistant, a platform that enables Optik TV customers the ability to control their entertainment experience hands-free using voice commands, at no additional cost.
· Upon the opening of the O-Train Confederation line in Ottawa in September 2019, we commenced providing free Wi-Fi service in three downtown, underground Line 1 station’s platforms and door-to-door cellular service, including through the downtown tunnel. This continuous cellular connection between stations and in the tunnel ensures that customers will not miss calls or be disconnected during their time underground.
· In September 2019, we entered into a long-term arrangement with Zú, a Montreal-based organization with the mission to develop leading-edge innovative projects in the entertainment sector, to launch an experimental 5G laboratory entirely dedicated to the creative and entertainment industry.
· In September 2019, we launched our TELUS IoT Shop, a self-serve online portal that enables businesses to easily purchase and manage prepaid Internet of Things (IoT) connectivity. Ideal for businesses such as start-ups and developer labs, the TELUS IoT Shop makes it easy for them to connect their IoT devices to our network.
· We reached a reciprocal roaming agreement with AT&T in September 2019. For customers on a qualifying rate plan, this agreement will allow their IoT devices to roam in the United States.
· We launched our new Managed Detection and Response service, which provides mid-sized Canadian organizations with technology that delivers rapid detection and targeted responses to cybersecurity threats.
· We built a new cell site in Ahousaht, a remote community off Tofino on the west coast of Vancouver Island, and were the first provider to bring high-speed wireless voice, text and internet service to the community.
· In November 2019, we announced that, thanks to an innovation based on LTE advanced technology, we provided families and businesses from the communities of Brador, Middle Bay, Pakua Shipu, Saint-Augustin and Old Fort in Quebec’s Lower North Shore with access to high-speed internet and wireless phone services.
· Together with MobiledgeX, in November 2019, we announced the MobiledgeX Early Access Program, which allows developers to build, experiment and test applications and experiences using next-generation, low-latency edge computing powered by MobiledgeX.
· Throughout the year, we made a series of announcements regarding the connection of more homes and businesses to our TELUS PureFibre infrastructure, including:
· The city of Nanaimo and district of Lantzville, B.C., including the Snuneymuxw and Snaw-Naw-As Nations, to connect by the spring of 2021
· The city of Airdrie, Alberta to connect by the end of 2020
· The city of Nelson, B.C.
· A further investment in our wireless and fibre-optic infrastructure across rural communities in the Greater Quebec City and Eastern Quebec regions. This investment was made with support from the federal government’s Connect to Innovate program and the provincial government’s Québec branché program. With this support, we will connect 34,000 new families and businesses in 80 remote communities
· The city of St. Albert, Alberta, including neighbouring communities in Sturgeon County, to connect by the end of 2020
· The city of Prince George, B.C., including the North Side of Lheidli T’enneh First Nation’s Fort George 2 reserve, to connect by the beginning of 2022
· The city of Pitt Meadows, B.C., including Katzie First Nation’s IR #1 reserve, to connect by the end of the summer of 2020.
· In January 2020, we acquired a 28% basic equity interest in Miovision Technologies Incorporated (Miovision), with a view to advancing our IoT and smart cities strategy. Miovision is a developer of intelligent mobility systems and traffic management solutions for municipalities worldwide.
Fuelling our future through recurring efficiency gains
· We are continuing to focus on expanding customer self-serve adoption, which enhances both customer satisfaction and company productivity through virtual assistants and digital platforms, while improving team member productivity by utilizing robotic process automation.
· We have established an ongoing program that integrates our acquisitions, advances stakeholder relationships and simplifies
![]()
our business. This program improves our overall organizational efficiency while driving cost savings and working capital benefits to be reinvested in our customers first strategy.
· In 2019, we undertook four debt offerings of $1.0 billion, US$500 million, $800 million, and $1.0 billion. These offerings lowered the weighted average cost of our long-term debt from 4.18% to 3.94% and lengthened its average term to maturity from 12.2 years to 12.8 years, providing us with additional flexibility to manage and grow our business.
· With our Peace of Mind rate plans and TELUS Easy Payment device financing options, in addition to our TELUS Family Discounts, we have streamlined our suite of offerings. Now, instead of having to choose between voluminous market-wide offerings, this simplification has made it easier for our customers to select what they want, while also enabling our team members to better assist them, saving time and effort. This simplification is also supporting growth in digital transactions, while Peace of Mind is providing customers with billing certainty, reducing the number of calls to our call centres and lowering credits and refunds.
Driving emerging opportunities to build scale in TELUS Health and TELUS International
· In March 2019, we launched Babylon by TELUS Health, a virtual healthcare solution that provides access to doctors and healthcare information where and when they need it through a new smartphone app. B.C. residents have been the first to have access to the app’s one-on-one video consultation feature, allowing them to speak directly and privately with a B.C.-licensed family doctor. Canadians across the country can also create a personal health record and use the app’s artificial intelligence chatbot Symptom Checker, which draws on more than 500 million streams of medical knowledge and asks patients questions about their symptoms and provides information on possible causes or courses of action.
· We continue to build scale in TELUS Health through expanded services for existing customers, as well as business acquisitions and strategic partnerships that can support our demonstrated speed-to-market, and our complementary ecosystems are delivering efficiencies and synergies in an exciting growth market.
· In November 2019, Walmart Canada announced that it had selected TELUS Health’s pharmacy management solution, Ubik®, for all of its 68 Accès pharma franchised locations across the province of Quebec.
· In December 2019, TELUS Health announced plans for the national expansion of its LivingWell Companion™ personal emergency response service (PERS) to support more aging Canadians across the country through the acquisition of the Quebec-based bilingual PERS company DirectAlert, which is currently operating as DirectAlert by TELUS Health, and eventually will be backed by the LivingWell Companion brand nationally and supported by increased service capabilities, including multi-lingual support and proactive alerting.
· By leveraging Xavient Digital, TELUS International continues to enhance its next-generation digital solutions, including artificial intelligence, robotic process automation, big data and analytics, in order to meet the digital transformation needs of fast-growing tech, fintech and financial services, games, travel and hospitality, telecom and healthcare industries.
· With the opening of a sixth site in Manila, Philippines, the expansion of customer care locations in Noida, India and Guatemala City, Guatemala, and the opening of a new delivery centre in Chengdu, China, TELUS International continues to expand its global customer experience and digital IT operations to meet the geographical, digital and language support needs of its growing global customer base.
· As noted in Section 1.3, we announced that we had entered into an agreement to acquire 100% of Competence Call Center, which will add significant scale to TELUS International and result in a sizeable diversification of its operations and client base in Europe.
Our 2020 corporate priorities are provided in the table below.
2020 corporate priorities
· Honouring our customers, communities and social purpose by our team delivering on our brand promise
· Leveraging our broadband networks to drive TELUS’ growth
· Fuelling our future through recurring efficiency gains
· Driving emerging opportunities to build scale in TELUS Health and TELUS Agriculture
· Driving growth in TELUS International to fuel further scaling opportunities.
![]()
4. Capabilities
The forward-looking statements in this section, including statements regarding our dividend growth program and our financial objectives in Section 4.3, are qualified by the Caution regarding forward-looking statements at the beginning of this MD&A.
4.1 Principal markets addressed and competition
Wireless products and services for consumers and businesses across Canada
Our products and services
· Data and voice — Fast internet access for video, social networking, messaging and new mobile applications such as TELUS SmartHome, Babylon by TELUS Health, PharmaConnect™, Pik TV and TELUS Drive+®; Internet of Things (IoT) solutions, including machine-to-machine (M2M) connectivity; clear and reliable voice services; push-to-talk solutions, including TELUS Business Connect®; and international roaming.
· Devices — The latest smartphones, tablets, mobile internet keys, mobile Wi-Fi devices, M2M modems, digital life devices and wearable technology, such as smart watches and our LivingWell Companion.
· Suite of IoT solutions to support Canadian businesses locally and internationally, including asset tracking, fleet management, remote monitoring, digital signage and security.
Our capabilities
· Licensed gross national wireless spectrum holdings averaging 172 MHz.
· During 2019, we acquired 12 wireless spectrum licences in the Innovation, Science and Economic Development Canada (ISED) 600 MHz wireless spectrum auction, as well as two wireless spectrum licences (AWS-1 and AWS-3) in a secondary market transaction. We expect to begin deployment of the 600 MHz spectrum into our existing network over the next several years as over-the-air television stations transition to new frequencies to complete the band’s repurposing for mobile use.
· Coast-to-coast digital 4G LTE access technology:
· Overall coverage of 99% of Canada’s population, with LTE advanced (LTE-A) technology covering more than 93% of Canada’s population at December 31, 2019. Coverage includes domestic roaming agreements.
· Coverage and capacity were enhanced with the deployment of the 700 MHz wireless spectrum licences acquired in 2014 and the deployment of the 2500 MHz wireless spectrum licences acquired in 2015. We plan to utilize other spectrum licences purchased in recent years, in combination with unlicensed supplementary spectrum, as network and device ecosystems evolve.
· Manufacturer’s rated download speeds: LTE-A, up to 1.35 Gbps; LTE, up to 150 Mbps; HSPA+, up to 42 Mbps. Average expected speeds: LTE-A, 12-250 Mbps; LTE, 12-45 Mbps; HSPA+, 4-14 Mbps.1
· Reverts to HSPA+ technology and speeds when customers are outside LTE coverage areas.
· International voice and data roaming capabilities in more than 225 destinations including voice over LTE (VoLTE) roaming now available with three major U.S. carriers and one international carrier.
· IoT technology:
· LTE-machine (LTE-M) technology across Canada, which supports large numbers of devices that transmit infrequent short bursts of data.
· Multi-service multi-billing capabilities provides the ability to separately classify, rate and bill data traffic across IoT devices.
· Specialized automated vehicle location IoT solutions that support municipalities, construction, utilities and speciality transport.
Competition overview
· Facilities-based national competitors Rogers Wireless and Bell Mobility, as well as provincial or regionally focused telecommunications companies Shaw, Quebecor, SaskTel, Eastlink, Tbaytel and Xplornet.
· Fixed wireless services.
· Resellers of competitors’ wireless networks.
· Services offered by cable and wireless competitors over wireless and metropolitan Wi-Fi networks.
· Competition for our IoT solutions include other providers of LTE-M low-power wide area network capabilities, IoT connectivity tools and platforms, and automated vehicle location and transportation solutions.
(1) Network speeds vary with location, signal and customer device. Compatible device required.
![]()
Wireline products and services: Residential services in British Columbia, Alberta and Eastern Quebec; healthcare solutions; automation and security solutions; business services across Canada; and customer care and business services (CCBS) solutions offered internationally
Our products and services
· Internet — Comprehensive high-speed internet access with TELUS PureFibre, which covers approximately 70% of our broadband footprint at December 31, 2019; fixed high-speed internet access (HSIA) service, with email and a comprehensive suite of security solutions; and wireless HSIA, with reliable Wi-Fi and cloud storage. TELUS offers multiple plans, including 940 Mbps symmetrical download and upload speeds.
· Television — High-definition entertainment service with Optik TV and Pik TV. Optik TV offers extensive content options, including 4K and 4K HDR live TV, On Demand content and streaming services such as Netflix, YouTube and hayu. Optik TV also delivers innovative features, including voice assistant that allows you to control your TV, a wireless digital box, large PVR capacity and the ability to restart live TV in progress or from the past 30 hours. In addition, our Optik TV app allows customers to watch live TV, set recordings and access On Demand content from a smartphone, tablet or computer. Pik TV delivers a streamlined offer for customers through our Pik TV media box or Apple TV, and is also accessible through an internet browser or our Android or iOS mobile applications. Pik TV embraces the changing environment, where content is increasingly available from over-the-top (OTT) services.
· Voice — Reliable fixed phone service with long distance and calling features such as Call Control, which helps subscribers avoid nuisance calls; voice over IP (VoIP) supporting voice services into the future.
· Security technology to support central monitoring and guard response service (where available), integrated with automated smart devices. Field services capabilities to install, upgrade and repair security technology at customers’ premises.
· IP connectivity for businesses — Converged voice, video and data services and internet access, offered on a high-performing network. Also includes software-defined wide area network (SD-WAN) offerings.
· Cloud and managed information technology (IT) services — Suite of hybrid IT solutions provides traditional and cloud technologies, network connectivity, security, managed IT and cloud advisory services.
· Security consulting and managed services — Cloud and on-premises solutions ensuring security for data, email, websites, networks and applications.
· Unified Communications conferencing and collaboration — Full range of equipment and application solutions, including Unified Communications as a Service (UCaaS), to support meetings and webcasts by means of phone, video and internet. Recent acquisitions are bolstering our capabilities in the small and mid-market business segments.
· With the January 31, 2020 closing of the acquisition of Competence Call Center (CCC), TELUS International, a customer experience provider that designs, builds and delivers next-generation digital solutions for some of the world’s most established and disruptive brands, will have almost 50,000 team members, providing services in over 50 languages from 50 delivery centres across 20 countries in North and Central America, Europe and Asia. Now a leader in the global business services space, TELUS International’s solutions include customer experience, digital transformation, IT life cycle, advisory and digital consulting, risk management, and back-office support, serving global customers from fast-growing tech, fintech and financial services, games, e-commerce, travel and hospitality, communications and utilities and healthcare industries.
· Healthcare — TELUS Health’s services, including pharmacy management, electronic medical records (EMR) and mobile EMR, electronic health records, drug information systems, regional clinical information systems, personal health record systems, remote patient monitoring, online settlement claims management solutions, e-prescribing services, TELUS Health Exchange Platform and MedDialog®, as well as employee wellness, comprehensive primary care, and workplace health and well-being services.
· �� Fixed wireless services — Wireless HSIA and wireless home phone.
· Home and business security and automation — Real-time 24/7 central monitoring station, guard response service (where available), and wireless and hard-wired security accessibility, integrated with smart internet-connected devices, including cameras and sensors. These services are enabling smart homes and smart businesses by allowing customers to remotely monitor and manage appliances and systems for enhanced security, comfort, convenience, and energy efficiency .
![]()
Our capabilities
· High-speed broadband footprint covered approximately 3.2 million households and businesses in B.C., Alberta and Eastern Quebec at December 31, 2019.
· Ongoing connection of households and businesses directly to fibre-optic cable; 2.22 million households and businesses covered with TELUS PureFibre in B.C., Alberta and Eastern Quebec at December 31, 2019, and we have reached approximately 70% of our total high-speed broadband footprint.
· Broadcasting distribution licences allowing us to offer digital television services in incumbent territories, as well as a licence to offer commercial video-on-demand services.
· Security technology to support central monitoring and guard response service (where available), integrated with automated smart devices. Field services capabilities to install, upgrade and repair security technology at customers’ premises.
· An IP-based national network overlaying an extensive switched network in B.C., Alberta and Eastern Quebec, as well as global interconnection arrangements.
· Seven data centres in six communities directly connected to the national TELUS IP network, creating an advanced and regionally diverse computing infrastructure in Canada.
· Provide access for businesses across Canada through our extensive network, and product capabilities bolstered by our national delivery teams.
· CCBS solutions, next-generation IT and digital business services with global delivery capabilities through our multinational, multi-language programs, supported by more than 38,000 employees across North and Central America, Europe and Asia, as at December 31, 2019.
· Technology solutions to assist health regions, hospitals, insurers, consumers and employers; also to improve connectivity and collaboration among healthcare providers, including physicians, nurses, pharmacists and physiotherapists.
Competition overview
· Cable competitors for internet, telephone and entertainment services, such as Shaw Communications (in B.C. and Alberta) and Cogeco Cable and Videotron (in Eastern Quebec).
· Substitution of wireless services, including our own wireless offerings, for residential local and long distance services. The percentage of households with wireless-only telephone services (among all providers, including TELUS) is estimated to be 52% in B.C. and Alberta, and 20% in Eastern Quebec in 2019, compared to 48% and 19%, respectively, in 2018.
· Our national telecommunications competitors Rogers Communications Inc. and BCE Inc. also offer telecommunications services for business and enterprise customers, as do various suppliers that are increasingly selling directly to customers.
· Various other small, non-traditional companies offering OTT business solutions, including SD-WAN and UCaaS solutions. These competitors are more prevalent in the small and medium-sized business segments.
· Various others offering VoIP-based local and long distance, as well as internet and data services, or reselling those services.
· OTT and direct-to-consumer voice and/or entertainment services, such as Skype, Netflix, Amazon Prime Video, Disney+, CBS All Access and YouTube.
· Satellite-based entertainment and internet services offered by Bell Canada, Shaw Communications and Xplornet.
· Competitors for our CCBS business include customized managed outsourcing solutions competitors, such as system integrators CGI Group Inc., IBM and the EDS division of HP Enterprise Services. Competitors for contact centre and IT digital services include companies such as Convergys, Teleperformance, Sykes, Atento, Genpact and Sitel.
· Competitors for TELUS Health include providers of EMR and pharmacy management products, such as Omnimed, Familiprix, Medfar, Fillware, ARI and Logipharm. Competitors also include systems integrators; health service providers, such as Loblaws, McKesson and the Jean Coutu Group, that have also become vertically integrated and own a mix of health services delivery, IT solutions and related services; and potentially, global providers, such as EPIC and Cerner, that could achieve expanded Canadian footprints. Competitors for TELUS Health’s corporate and preventative health service offerings include Medcan, Cleveland Clinic, Dialogue and Wellpoint.
· Competitors for home and business security range from local to national companies, such as BCE Inc., Rogers Communications Inc., Chubb-Edwards, Stanley Security, Fluent Home and Brinks Home Security.
![]()
4.2 Operational resources
Resources
Our team
· Approximately 65,600 employees at December 31, 2019, with 27,600 employees located in Canada and 38,000 employees located internationally. We also use external contractors and consultants.
· Approximately 8,970 of our employees are covered by collective agreements. The agreement with the Telecommunications Workers Union (TWU), United Steel Workers Local Union 1944, which covers approximately 7,560 employees, expires on December 31, 2021. The agreement with the Syndicat québécois des employés de TELUS (SQET), which covers approximately 750 employees, expires on December 31, 2022. The agreement with the Syndicat des agents de maîtrise de TELUS (SAMT), which covers approximately 605 employees in the TELUS Quebec region, expires on March 31, 2022. Our TELUS Employer Solutions Inc. subsidiary is signatory to a collective agreement with the B.C. Government and Services Employees’ Union, which covers less than 100 employees and expires on July 31, 2023.
· As a result of our acquisition of ADT Security Services Canada, Inc. (ADT Canada) on November 5, 2019, approximately 250 employees are covered by collective agreements between ADT Canada and a number of unions, including multiple collective agreements with the International Brotherhood of Electrical Workers (IBEW) in B.C., Alberta, Saskatchewan, Manitoba and Ontario, a collective agreement with Syndicat des salariés des services d’alarme (CSD) in Quebec, and a collective agreement with Unifor in Ontario. This group of 250 unionized employees also includes a number of Quebec-based employees covered by sectoral collective agreements specific to the Quebec construction industry (Commission de la Construction du Québec). The expiry dates of these collective agreements vary. ADT Canada is currently in the process of negotiating renewal agreements for two collective agreements that have expired.
· Operations at Canadian and international locations to support CCBS solutions and digital business services for external customers, as well as for certain internal functions. Additionally, for our CCBS solutions, we have ready access to labour in the United States for management and support positions, and in various international locations for contact centres.
· Employee compensation programs that support a high-performance culture and contain market-driven and performance-based components (bonus and share-based compensation) to attract and retain key employees.
· Succession management and talent reviews for our team, which continue to cover attrition and ongoing sourcing strategies for ready access to labour in Canada, with competition for talent in specialized or emerging skill areas presenting a challenge. To address this challenge, we continue to proactively attract and engage candidates with an innovative sourcing strategy.
· Learning and development programs to improve employee engagement levels and enhance our customers’ experiences.
![]()
Resources
Our brands and distribution channels
· TELUS — A national communications and information technology company serving customers across wireless, data, IP, voice, television, entertainment, video and security, driven by a social purpose to connect all Canadians for good.
· Koodo Mobile® — A national provider of postpaid and prepaid wireless voice and data services with a broad distribution network, including TELUS-owned stores, dealers and third-party electronics retailers.
· Public Mobile — A prepaid wireless service provider with web-based and physical distribution, providing customers with a SIM-only service.
· Optik TV, launched in mid-2010. Pik TV®, launched in mid-2017.
· TELUS PureFibre, our next-generation fibre-optic network.
· TELUS International — A customer experience provider that designs, builds and delivers digital solutions for global and disruptive brands.
· TELUS Health (enterprise), a national provider of electronic medical and health records, benefits management, pharmacy management and preventive healthcare services, further expanded through acquisitions including Medisys Health Group Inc. (Medisys).
· TELUS Health (consumer) has grown to offer personal home health monitoring (e.g. LivingWell Companion) and better support for rural and indigenous communities through Babylon by TELUS Health and Health for Good mobile health clinics.
· TELUS SmartHome Security and TELUS Secure Business — Full-service security offerings for residential and business customers; further expanded with the 2019 acquisition of ADT Canada, currently operating as ADT by TELUS.
· TELUS Ventures — A corporate venture capital fund that has invested in more than 70 market-transforming companies since 2001.
· Our sales and support distribution channels:
· Wireless services are supported through a broad network of TELUS-owned and branded stores, including our 50% ownership of the kiosk channel WOW! Mobile, and an extensive distribution network of exclusive dealers and large third-party national retail partners (e.g. Best Buy, Walmart and London Drugs), as well as online self-serve applications, intuitive virtual-assistant chatbots, mass marketing campaigns and customer care telephone agents.
· Wireline residential services are supported through TELUS-owned and branded stores, customer care telephone agents, digital home technicians and partners and online and TV-based self-serve applications.
· Through telus.com, we sell wireless, wireline, SmartHome Security, health and business products and services. We also provide online account management tools (e.g. My TELUS), enabling wireless and wireline customers to manage their accounts through our website or mobile applications.
· TELUS Health provides some of its consumer services — personal health records and home health monitoring (e.g. Babylon by TELUS Health and LivingWell Companion) — in partnership with provincial governments.
· Business services, including healthcare, across wireless and wireline are supported through certain dedicated stores for business, TELUS sales representatives, product specialists, independent dealers and online self-serve applications for small and medium-sized businesses.
· CCBS solutions and digital business services are supported through sales representatives and client relationship management teams.
· Dedicated direct-to-consumer channel with approximately 500 field sales agents.
![]()
Resources
Our technology, systems and properties
· We are a technology-enabled company with a multitude of IT systems and processes. We are focused on driving innovation and making generational investments to deliver state-of-the-art broadband solutions in an increasingly digital society.
· Broadband consumer and business networks
· In 2012, we launched our 4G LTE wireless technology capable of speeds of up to 110 Mbps, and today, our wireless technology covers 99% of Canada’s population. Our LTE technology allows customers to take advantage of the newest mobile devices and enjoy a seamless experience across multiple devices. In 2015, we launched the newest LTE advanced (LTE-A) network technology, and we have been working to expand our LTE capabilities with this technology since then. In April 2016, we enhanced our LTE-A technology with the first global implementation of frequency division duplex (FDD) 4x4 multiple-input-multiple-output (MIMO) technology. We implemented another key enhancement to our LTE-A infrastructure in June 2017 by introducing quad-band LTE-A carrier aggregation technology — this technology covers 93% of Canada’s population and enables theoretical peak speeds of 1.35 Gbps. Our LTE CAT-M1 IoT network now covers 97.9% of Canada’s population. See Leveraging our broadband networks to drive TELUS’ growth in Section 3 Corporate priorities for additional information.
· In 2014, we deployed a centralized radio access technology (C-RAN) in Vancouver, and in 2016, launched VoLTE service in B.C. and Alberta communities. Both deployments were key transformations in our wireless capabilities. We were also the first national operator to provide high-speed internet service over our LTE infrastructure for rural customers in B.C., Alberta and Quebec through our Smart Hub wireless internet solution. Today, we serve nearly 60,000 households in rural Canada that do not have the same level of access to broadband service that urban Canadians have, continuing to make progress toward our objective of providing broadband internet access to all Canadians.
· We have made significant investments in heterogeneous network (HetNet) technology, one of the key building blocks for 5G. HetNet combines multiple types of cells, such as outdoor macro cells and microcells, as well as indoor pico cells, to enhance coverage and capacity in crowded urban areas and inside buildings. By taking continuous strides to evolve our small-cell technology concurrent with the evolution of network technologies to LTE-A pro (i.e. 4.5G), in 2017, we became the first operator in Canada to introduce licensed assisted access (LAA) small cells for both outdoor and indoor environments, capable of speeds of up to 970 Mbps. In 2019, we continued advancing LAA technology with speeds of up to 1.2 Gbps.
· In 2018, we became the first operator globally to introduce LTE FDD Massive MIMO 32TRx technology on the B7 band as part of the LTE-A pro technology evolution. This technology will further enhance the capacity of our wireless infrastructure and enable a stronger customer experience.
· In 2019, we progressed the virtualization of our core network infrastructure with the voice core, providing a stepping stone into 5G service readiness. The network virtualization improves our network scalability, resiliency and cost efficiency.
· Our investments to deploy our gigabit-enabled TELUS PureFibre technology have brought fibre-optic connectivity further into our infrastructure and directly to homes and businesses. At the end of 2019, 2.22 million homes and businesses in communities across B.C., Alberta and Quebec had access to ultra-fast, symmetrical 150/150 and 750/750 internet download and upload speeds with TELUS PureFibre. Recognizing the need for highly reliable, high-capacity connectivity with low latency to support emerging services such as virtualized networks and IoT applications, we have also begun rolling out a next-generation nationwide optical backbone network.
· We started the next evolution of our wireline IP and optical core/edge technology, collapsed metro architecture. This architecture enables significant per-port cost improvement to support network growth and evolution.
· We continue to roll-out our third-generation national dense wavelength division multiplexing (DWDM) transport backbone (packet transport 3.0) CDC (colourless, directionless and contentionless) network overlay that will connect from B.C. to Quebec and into the U.S. This architecture will allow network growth without the need for costly re-generation, enable optimal optical rerouting during a fibre cut and improve network growth costs.
· We are evolving our world-class emergency services to harness the power of IP through our implementation of Next-gen 9-1-1.
· As Canada’s primary provider, we delivered on our regulatory commitment to upgrade our Message Relay and IP Relay service, enhancing customer experience for the deaf and hard of hearing community with improved smartphone-friendly operator services.
· We have continued to innovate for our customers through our Optik TV and Pik TV platforms. In 2018, we introduced HDR (high dynamic range) colour capability to our 4K Optik TV customers, making us the first operator in Canada to deliver 4K HDR video across live TV, video-on-demand and Netflix services. We also launched an Apple TV application for Pik TV and gave customers the option to purchase Pik TV using only a web browser. By investing in the cloudification of video infrastructure and innovative applications, we will continue to advance our priority of enabling “anytime, everywhere” access to content and entertainment, thereby continuing to deliver an exceptional customer experience.
· In 2018, we also launched TELUS Boost Wi-Fi, a network of boosters that extends the reach of strong and reliable in-home Wi-Fi signals.
![]()
Resources
Our technology, systems and properties (continued)
· Real estate — Our network facilities are constructed under or along streets and highways, pursuant to rights-of-way granted by the owners of land, including municipalities and the Crown, or on freehold land we own.
· Our real estate properties (owned or leased) also include administrative office spaces, work centres and space for telecommunications equipment. Some buildings are constructed on leasehold land and the majority of wireless radio antennae are on towers that are situated on lands or are on buildings held under leases or licences with varying terms. We also participate in two real estate joint ventures. (See Section 7.11.)
· Intangible assets — Our intangible assets include wireless spectrum licences from Innovation, Science and Economic Development Canada (ISED), which are essential to providing wireless services. We have assets averaging 172 MHz nationally. We have deployed 700 MHz, 2300 MHz, 2500 MHz, 1900 MHz, AWS-1, AWS-3 and 850 MHz spectrum to evolve our wireless infrastructure, and we are looking to the introduction of new bands that will enable the realization of 5G technology, including the 600 MHz spectrum acquired in the 2019 auction. We intend to continue acquiring spectrum within the rules set out by ISED to meet our future capacity requirements.
· Intellectual property, which we own or which we have been granted the right to use, is an essential asset for us. Intellectual property enables us to be known and recognized in the marketplace through our brand style, trade dress, domain names and trademarks. It protects our know-how and software, systems, processes and method of doing business through copyrights, patents and information treated as confidential. It also helps us to improve our competitiveness by fostering an innovative work environment. Each form of intellectual property is important to our success. For instance, the TELUS brand plays a key role in product positioning and our Company’s reputation. We aim to maximize the value of our intangible assets in the areas of innovation and invention by ensuring that they are appropriately used, protected and valued. To protect our intellectual property assets, we rely on a combination of legal protections afforded under copyright, trademark, patent and other intellectual property laws, as well as contractual provisions under licensing arrangements. Further information on recognized tangible and intangible assets can be found in Section 8.1 Critical accounting estimates and judgments.
· Our broadcasting distribution licences enable us to provide entertainment services. See Broadcasting-related issues in Section 9.4, which discusses developments relating to these licences.
· Future technologies — In addition to evolving our existing wireless and wireline infrastructure, we are investing in the technologies of the future that will serve as the foundation to provide next-generation services to Canadians. By way of example, we are building the next generation of 5G wireless technologies and capitalizing on the promise of convergent wireless and wireline network technologies. As mobile operators globally work to develop 5G, we have achieved groundbreaking wireless speeds of nearly 30 Gbps — 200 times faster than today’s LTE standard — in our Living Lab. In 2017, we broke new ground by piloting 5G wireless-to-the-premises (WTTx) technology and achieved download speeds of 2 Gbps in a live-environment test using 3.5 GHz spectrum.
· In 2018, we achieved the first 3GPP-based 5G non-standalone (NSA) technology field trial in HetNet architecture in Canada, which included both outdoor macro cells on 3.5 GHz spectrum and 28 GHz spectrum microcells. We also demonstrated a number of 5G experience use cases, including live video distribution, facial identification, and home security during the seventh next-generation mobile networks (NGMN) Industry Conference & Exhibition held in Vancouver in November 2018. These are key milestones in our ongoing effort to unleash the benefits of 5G for Canadians.
· We continue to invest in enabling systems such as our Jasper connected device platform (CDP) and our dedicated machine-to-machine virtual evolved packet core (M2M vEPC) to support IoT applications, where the ease of onboarding partners is crucial for emerging services such as connected vehicles, fleet management and more.
· In 2017, we launched our Network as a Service (NaaS) solution, the first Canadian network function virtualization (NFV) infrastructure that will power the virtualized networks of the future and enable Canadian businesses to better serve their customers with improved total cost of ownership. Looking ahead, we will continue on our journey of network virtualization in support of bringing services to customers faster.
· In 2018, we deployed our LTE-machine (LTE-M) technology across Canada. LTE-M is a low-power wide area network (LPWAN) technology, which is ideal for IoT because it supports large numbers of devices that transmit infrequent short bursts of data, like IoT sensors. It will enable a plethora of IoT applications through long-range connectivity, extended battery life and carrier-grade security and quality of service.
· Through TELUS Health’s services — such as pharmacy management, electronic medical records (EMRs) (including mobile EMRs), electronic health records, personal health records, clinical information systems, remote patient monitoring, virtual care and online claims settlement management software solutions, including the online renewal of prescriptions, e-prescribing services and MedDialog — TELUS Health facilitates the integration of electronic health records from the home to the doctor’s office to the hospital, making critical health information available to healthcare providers over our wireless and wireline broadband network.
· Through its Medisys clinics, TELUS Health also provides executive benefits, occupational health, employee health and wellness services, and individual preventive health services. With its preventive health assessments, 24/7 virtual care support and health specialists, Medisys provides proactive health services to individuals and their families.
· Through TELUS International, we continue to provide a wide array of customer experience and digital transformation products and services, as described in Section 4.1. These services are provided from facilities located in North and Central America, Europe and Asia.
![]()
4.3 Liquidity and capital resources
Capital structure financial policies
Our objective when managing capital is to maintain a flexible capital structure that optimizes the cost and availability of capital at acceptable risk.
In the management of capital and in its definition, we include Common Share equity (excluding Accumulated other comprehensive income), Long-term debt (including long-term credit facilities, commercial paper backstopped by long-term credit facilities and any hedging assets or liabilities associated with Long-term debt items, net of amounts recognized in Accumulated other comprehensive income), Cash and temporary investments, and short-term borrowings arising from securitized trade receivables.
We manage our capital structure and make adjustments to it in light of changes in economic conditions and the risk characteristics of our business. In order to maintain or adjust our capital structure, we may adjust the amount of dividends paid to holders of Common Shares, purchase Common Shares for cancellation pursuant to normal course issuer bid (NCIB) programs, issue new shares, issue new debt, issue new debt to replace existing debt with different characteristics, and/or increase or decrease the amount of trade receivables sold to an arm’s-length securitization trust.
We monitor capital utilizing a number of measures, including our net debt to EBITDA — excluding restructuring and other costs ratio, coverage ratios and dividend payout ratios. (See definitions in Section 11.1 Non-GAAP and other financial measures.)
Financing and capital structure management plans
Report on financing and capital structure management plans
Pay dividends to the holders of Common Shares under our multi-year dividend growth program
· In May 2019, we announced our intention to target ongoing semi-annual dividend increases, with the annual increase in the range of 7 to 10% from 2020 through to the end of 2022, thereby extending the policy first announced in May 2011. Notwithstanding this target, dividend decisions will continue to be subject to our Board’s assessment and the determination of our financial position and outlook on a quarterly basis. (See Section 7.5 Liquidity and capital resource measures.) There can be no assurance that we will maintain a dividend growth program or that it will be unchanged through 2022. (See Caution regarding forward-looking statements — Ability to sustain our dividend growth program through 2022 and Section 10.13 Financing, debt and dividends.)
· Dividends declared in 2019 totalled $2.2525 per-share (pre-share split — see Share split — subsequent to 2019 in Section 1.3), an increase of $0.1525 per share or 7.3% (pre-share split) compared to the dividends declared in 2018. On February 12, 2020, the Board declared a first quarter dividend of $0.5825 per share (pre-share split), payable on April 1, 2020, to shareholders of record at the close of business on March 11, 2020. The first quarter dividend for 2020 reflects a cumulative increase of $0.0375 per share (pre-share split) or 6.9% from the $0.5450 per share (pre-share split) dividend declared one year earlier.
· Our dividend reinvestment and share purchase (DRISP) plan trustee acquired shares from Treasury for the DRISP plan, rather than acquiring Common Shares in the stock market. We may, at our discretion, offer Common Shares at a discount of up to 5% from the market price under the plan. Effective with the dividends paid on October 1, 2019, we offered Common Shares from Treasury at a discount of 2%. During 2019, our DRISP plan trustee acquired from Treasury 3.9 million dividend reinvestment Common Shares for $183 million. For the dividends paid on January 2, 2020, the DRISP participation rate, calculated as the DRISP investment of $131 million (including the employee share purchase plan) as a percentage of gross dividends, was approximately 37%. The DRISP has been filed with the U.S. Securities and Exchange Commission as an exhibit to our registration statement on Form F-3D registering the Common Shares issuable thereunder (Commission File No. 333-232967).
Purchase Common Shares
· In December 2019, we received approval from the Toronto Stock Exchange (TSX) for a new 2020 NCIB to purchase and cancel up to 8 million Common Shares for an aggregate purchase price of up to $250 million over a 12-month period, from January 2, 2020 to January 1, 2021, through the facilities of the TSX, the New York Stock Exchange and alternative trading platforms, or as otherwise permitted by applicable securities laws. TELUS will purchase Common Shares only when and if we consider it opportunistic, subject to any purchases that may be made under an automatic share purchase plan (ASPP). As of February 13, 2020, we have not completed any transactions pursuant to our 2020 NCIB.
· Our 2019 NCIB, for which we had received approval to purchase up to 8 million Common Shares for an aggregate purchase price of up to $250 million, concluded on January 1, 2020, and we did not purchase any shares pursuant to the 2019 NCIB.
· We may also enter into an ASPP with a broker for the purpose of permitting us to purchase our Common Shares under our NCIB at times when we would not be permitted to trade in our shares, including regularly scheduled quarterly blackout periods. Such purchases will be determined by the broker in its sole discretion based on parameters that we have established prior to any blackout period, in accordance with TSX rules and applicable securities laws. The ASPP has been approved by the TSX and may be implemented from time to time in the future.
![]()
Report on financing and capital structure management plans
Use proceeds from securitized trade receivables (Short-term borrowings), bank facilities and commercial paper as needed, to supplement free cash flow and meet other cash requirements
· Our issued and outstanding commercial paper was $1,015 million at December 31, 2019, all of which was denominated in U.S. dollars (US$781 million), compared to $774 million (US$569 million) at December 31, 2018.
· Our net draws on the TELUS International (Cda) Inc. credit facility were US$336 million at December 31, 2019, compared to US$313 million at December 31, 2018. The credit facility is non-recourse to TELUS Corporation.
· Proceeds from securitized trade receivables were $100 million at December 31, 2019, unchanged from December 31, 2018.
Maintain compliance with financial objectives
· Maintain investment grade credit ratings in the range of BBB+ or the equivalent — On February 13, 2020, investment grade credit ratings from the four rating agencies that cover TELUS were in the desired range. (See Section 7.8 Credit ratings.)
· Net debt to EBITDA — excluding restructuring and other costs ratio of 2.20 to 2.70 times — As measured at December 31, 2019, this ratio was 3.20 times, outside of the objective range (which reflected a 0.20 shift in the range subsequent to December 31, 2019 to reflect an accommodation for the effects of implementing IFRS 16), primarily due to the acquisition of spectrum licences, the application of IFRS 16 effective January 1, 2019, and business acquisitions. Given the cash demands of the 2019 and upcoming spectrum auctions, the assessment of the guideline and return to the objective range remains to be determined; however, it is our intent to return to a ratio below 2.70 times in the medium term (following upcoming spectrum auctions), consistent with our long-term strategy. (See Section 7.5 Liquidity and capital resource measures.)
· Dividend payout ratio of 65 to 75% of net earnings per share for 2019 on a prospective basis — The dividend payout ratio we present in this MD&A is a historical measure utilizing the last four quarters of dividends declared and earnings per share, and is disclosed for illustrative purposes in evaluating our target guideline. As at December 31, 2019, the historical ratio of 78% and the adjusted historical ratio of 84% exceeded the objective range. So as to be consistent with the way we manage our business, we have revised our target guideline, effective January 1, 2020, to be calculated as 60 to 75% of free cash flow on a prospective basis. (See Section 7.5 Liquidity and capital resource measures.)
· Generally maintain a minimum of $1 billion in unutilized liquidity — As at December 31, 2019, our unutilized liquidity on a consolidated basis was approximately $1.8 billion. (See Section 7.6 Credit facilities.)
Financing and capital structure management plans for 2020
At the end of 2019, our senior unsecured debt (excluding unamortized discount) was $16.2 billion. For our long-term debt, the weighted average term to maturity was approximately 12.8 years (excluding commercial paper, the revolving component of the TELUS International (Cda) Inc. credit facility, lease liabilities and other long-term debt). Our weighted average interest rate on long-term debt (excluding commercial paper, the revolving component of the TELUS International (Cda) Inc. credit facility, lease liabilities and other long-term debt) was 3.94% at December 31, 2019, down from 4.18% one year ago. Aside from Short-term borrowings of $100 million, commercial paper of $1,015 million (US$781 million), the utilized revolving component of the TELUS International (Cda) Inc. credit facility of $297 million (US$229 million) and lease liabilities of $1,661 million, all of our debt was on a fixed-rate basis.
During 2020 we may issue notes to fund spectrum purchases, to accelerate future debt by prepaying certain notes, to refinance maturing debt or to use for general corporate purposes. Anticipated free cash flow and sources of capital are expected to be more than sufficient to meet requirements. For the related risk discussion, see Section 10.13 Financing, debt and dividends.
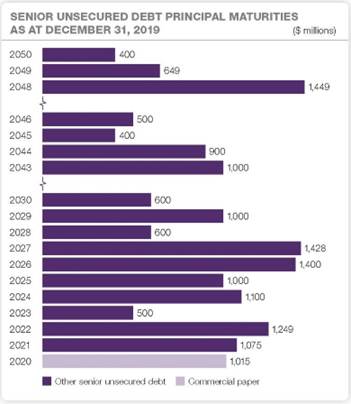
![]()
4.4 Disclosure controls and procedures and changes in internal control over financial reporting
Disclosure controls and procedures
Disclosure controls and procedures are designed to provide reasonable assurance that all relevant information is gathered and reported to senior management, including the President and Chief Executive Officer (CEO) and the Executive Vice-President and Chief Financial Officer (CFO), on a timely basis so that appropriate decisions can be made regarding public disclosure.
The CEO and the CFO have assessed the effectiveness of our disclosure controls and procedures related to the preparation of this MD&A and the December 31, 2019, Consolidated financial statements. They have concluded that our disclosure controls and procedures were effective, at a reasonable assurance level, in ensuring that material information relating to TELUS and its consolidated subsidiaries would be made known to them by others within those entities, particularly during the period in which the MD&A and the Consolidated financial statements were being prepared.
Internal control over financial reporting
Internal control over financial reporting is a process designed to provide reasonable assurance regarding the reliability of financial reporting and the preparation of financial statements in accordance with IFRS-IASB and the requirements of the Securities and Exchange Commission in the United States, as applicable. TELUS’ CEO and CFO have assessed the effectiveness of our internal control over financial reporting as of December 31, 2019, in accordance with the criteria established in Internal Control — Integrated Framework (2013), issued by the Committee of Sponsoring Organizations of the Treadway Commission (COSO). Based on this assessment, TELUS’ CEO and CFO have concluded that our internal control over financial reporting is effective as of December 31, 2019, and have certified TELUS’ annual filings within our annual report on Form 40-F, as required by the United States’ Sarbanes-Oxley Act of 2002, and TELUS’ Annual Information Form, as required by National Instrument 52-109 Certification of Disclosure in Issuers’ Annual and Interim Filings.
Deloitte LLP, our auditor, has audited our internal control over financial reporting as of December 31, 2019.
Changes in internal control over financial reporting
There were no changes in internal control over financial reporting that have materially affected, or are reasonably likely to materially affect, our internal control over financial reporting in 2019.
![]()
5. Discussion of operations
This section contains forward-looking statements, including those with respect to mobile phone average billing per subscriber per month (ABPU) and mobile phone average revenue per subscriber per month (ARPU) growth, wireless trends regarding loading and retention spending, equipment margins, internet subscriber growth and various future trends. There can be no assurance that we have accurately identified these trends based on past results or that these trends will continue. See Caution regarding forward-looking statements at the beginning of this MD&A.
5.1 General
A significant judgment we make is in respect of distinguishing between our wireless and wireline operations and cash flows (and this extends to allocations of both direct and indirect expenses and capital expenditures). The clarity of this distinction has been increasingly affected by the convergence and integration of our wireless and wireline telecommunications infrastructure technology and operations. Recently, our judgment was that our wireless and wireline telecommunications infrastructure technology and operations had not experienced sufficient convergence to objectively make their respective operations and cash flows practically indistinguishable. The continued build-out of our technology-agnostic fibre-optic infrastructure, in combination with converged edge network technology, has significantly affected this judgment, as have the commercialization of fixed-wireless telecommunications solutions for customers and the consolidation of our non-customer facing operations. As a result, it has become increasingly difficult and impractical to objectively and clearly distinguish between our wireless and wireline operations and cash flows, and the assets from which those cash flows arise. Our judgment as to whether these operations can continue to be judged to be individual components of the business and discrete operating segments has changed; effective January 1, 2020, we embarked upon modifying our internal and external reporting processes, systems and internal controls to accommodate the technology convergence-driven cessation of the historical distinction between our wireless and wireline operations at the level of regularly reported discrete performance measures that are provided to our Chief Executive Officer (CEO) (our chief operating decision-maker). We anticipate transitioning to a new segment reporting structure during 2020 but do not anticipate a substantive change to our products and services revenue and related performance indicator reporting from such transition; we will continue to report wireless and wireline operations until such transition is substantially completed. As we do not currently aggregate operating segments, our reportable segments as at December 31, 2019, are also wireless and wireline. Segmented information in Note 5 of the Consolidated financial statements is regularly reported to our CEO.
We adopted IFRS 16, Leases, on January 1, 2019, with retrospective application, with the cumulative effect of the initial application of the new standard recognized at the date of initial application, January 1, 2019. This method of application does not result in the retrospective adjustment of amounts reported for periods prior to fiscal 2019. The most significant effect of the new standard is the lessee’s recognition of the initial present value of unavoidable future lease payments as right-of-use lease assets and lease liabilities, including those for most leases that would have previously been accounted for as operating leases. This results in depreciation of right-of-use lease assets and financing costs arising from lease liabilities, rather than as part of Goods and services purchased. The adoption of the new standard has resulted in increases to Property, plant and equipment of approximately $1.0 billion and long-term debt of approximately $1.4 billion as at January 1, 2019.
![]()
Selected annual information
Years ended December 31 ($ in millions, except per share amounts) |
| 2019 |
| 2018 |
| 2017 |
|
Operating revenues |
| 14,658 |
| 14,368 |
| 13,408 |
|
Net income |
| 1,776 |
| 1,624 |
| 1,578 |
|
Net income attributable to Common Shares |
| 1,746 |
| 1,600 |
| 1,559 |
|
Net income per Common Share1 |
|
|
|
|
|
|
|
Basic earnings per share |
| 2.90 |
| 2.68 |
| 2.63 |
|
Diluted earnings per share |
| 2.90 |
| 2.68 |
| 2.63 |
|
Cash dividends declared per Common Share1 |
| 2.2525 |
| 2.1000 |
| 1.9700 |
|
At December 31 ($ millions) |
| 2019 |
| 2018 |
| 2017 |
|
Total assets |
| 37,975 |
| 33,057 |
| 31,053 |
|
Current maturities of long-term debt |
| 1,332 |
| 836 |
| 1,404 |
|
Non-current financial liabilities2 |
|
|
|
|
|
|
|
Provisions |
| 43 |
| 395 |
| 152 |
|
Long-term debt |
| 17,142 |
| 13,265 |
| 12,256 |
|
Other long-term financial liabilities |
| 113 |
| 162 |
| 224 |
|
Total non-current liabilities |
| 17,298 |
| 13,822 |
| 12,632 |
|
Deferred income taxes |
| 3,204 |
| 3,148 |
| 2,941 |
|
Common equity |
| 10,548 |
| 10,259 |
| 9,416 |
|
(1) Pre-share split – see Share split – subsequent to 2019 in Section 1.3.
(2) In our specific current instance, financial liabilities do not include liabilities that are excluded by definition (e.g. employee benefits and share-based compensation liabilities) or liabilities that do not involve a future outlay of economic resources (e.g. deferred recognition of customer activation and connection fees; deferred gains on sale-leaseback of buildings).
Operating revenues: Combined wireless revenue and wireline data revenue represented approximately 91% of consolidated revenues in 2019, approximately 90% in 2018 and approximately 89% in 2017.
Total assets: Growth in Total assets includes increases in Property, plant and equipment and Intangible assets, which increased by a combined $4,019 million in 2019 and $999 million in 2018. These increases resulted primarily from our ongoing investments in broadband infrastructure, connecting additional homes and businesses directly to our fibre-optic technology, acquisition of spectrum licences and business acquisitions. See Section 7.3 Cash used by investing activities.
For changes in Long-term debt, see Section 6 Changes in financial position and Section 7.4 Cash provided (used) by financing activities.
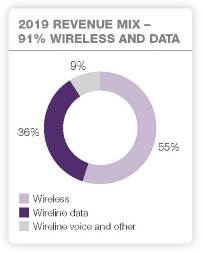
![]()
5.2 Summary of consolidated quarterly results, trends and fourth quarter recap
Summary of quarterly results
($ millions, except per share amounts) |
| 2019 Q4 |
| 2019 Q3 |
| 2019 Q2 |
| 2019 Q1 |
| 2018 Q4 |
| 2018 Q3 |
| 2018 Q2 |
| 2018 Q1 |
|
Operating revenues1 |
| 3,858 |
| 3,697 |
| 3,597 |
| 3,506 |
| 3,764 |
| 3,774 |
| 3,453 |
| 3,377 |
|
Operating expenses |
|
|
|
|
|
|
|
|
|
|
|
|
|
|
|
|
|
Goods and services purchased2,3 |
| 1,681 |
| 1,502 |
| 1,466 |
| 1,421 |
| 1,784 |
| 1,685 |
| 1,491 |
| 1,408 |
|
Employee benefits expense2 |
| 809 |
| 761 |
| 758 |
| 706 |
| 745 |
| 740 |
| 711 |
| 700 |
|
Depreciation and amortization |
| 678 |
| 649 |
| 633 |
| 617 |
| 586 |
| 572 |
| 559 |
| 550 |
|
Total operating expenses |
| 3,168 |
| 2,912 |
| 2,857 |
| 2,744 |
| 3,115 |
| 2,997 |
| 2,761 |
| 2,658 |
|
Operating income |
| 690 |
| 785 |
| 740 |
| 762 |
| 649 |
| 777 |
| 692 |
| 719 |
|
Financing costs before long-term debt prepayment premium |
| 175 |
| 173 |
| 189 |
| 168 |
| 159 |
| 162 |
| 150 |
| 156 |
|
Long-term debt prepayment premium |
| — |
| 28 |
| — |
| — |
| — |
| 34 |
| — |
| — |
|
Income before income taxes |
| 515 |
| 584 |
| 551 |
| 594 |
| 490 |
| 581 |
| 542 |
| 563 |
|
Income taxes |
| 136 |
| 144 |
| 31 |
| 157 |
| 122 |
| 134 |
| 145 |
| 151 |
|
Net income |
| 379 |
| 440 |
| 520 |
| 437 |
| 368 |
| 447 |
| 397 |
| 412 |
|
Net income attributable to Common Shares |
| 368 |
| 433 |
| 517 |
| 428 |
| 357 |
| 443 |
| 390 |
| 410 |
|
Net income per Common Share4: |
|
|
|
|
|
|
|
|
|
|
|
|
|
|
|
|
|
Basic earnings per share (EPS) |
| 0.61 |
| 0.72 |
| 0.86 |
| 0.71 |
| 0.60 |
| 0.74 |
| 0.66 |
| 0.69 |
|
Adjusted basic EPS5 |
| 0.67 |
| 0.76 |
| 0.69 |
| 0.75 |
| 0.69 |
| 0.74 |
| 0.70 |
| 0.73 |
|
Diluted EPS |
| 0.61 |
| 0.72 |
| 0.86 |
| 0.71 |
| 0.60 |
| 0.74 |
| 0.66 |
| 0.69 |
|
Dividends declared per Common Share4 |
| 0.5825 |
| 0.5625 |
| 0.5625 |
| 0.5450 |
| 0.5450 |
| 0.5250 |
| 0.5250 |
| 0.5050 |
|
Additional information: |
|
|
|
|
|
|
|
|
|
|
|
|
|
|
|
|
|
EBITDA5 |
| 1,368 |
| 1,434 |
| 1,373 |
| 1,379 |
| 1,235 |
| 1,349 |
| 1,251 |
| 1,269 |
|
Restructuring and other costs3,5 |
| 40 |
| 29 |
| 29 |
| 36 |
| 75 |
| 173 |
| 35 |
| 34 |
|
Non-recurring (losses and equity losses) gains and equity income related to real estate joint ventures |
| (5 | ) | — |
| — |
| — |
| — |
| 171 |
| — |
| — |
|
Adjusted EBITDA5 |
| 1,413 |
| 1,463 |
| 1,402 |
| 1,415 |
| 1,310 |
| 1,351 |
| 1,286 |
| 1,303 |
|
Cash provided by operating activities |
| 829 |
| 1,148 |
| 1,160 |
| 790 |
| 948 |
| 1,066 |
| 1,206 |
| 838 |
|
Free cash flow5 |
| 135 |
| 320 |
| 324 |
| 153 |
| 132 |
| 303 |
| 329 |
| 443 |
|
(1) In the third quarter of 2018, we recorded equity income related to real estate joint ventures of $171 million arising from the sale of TELUS Garden.
(2) Goods and services purchased and Employee benefits expense amounts include restructuring and other costs.
(3) In the third quarter of 2018, we recorded a donation to the TELUS Friendly Future Foundation of $118 million as part of other costs.
(4) Pre-share split — see Share split — subsequent to 2019 in Section 1.3.
(5) See Section 11.1 Non-GAAP and other financial measures.
Trends
The trend of year-over-year increases in consolidated revenue reflects: (i) wireless network revenue generated from growth in our subscriber base; (ii) growth in wireline service revenue; this segment includes customer care and business services (CCBS) revenues, internet and third wave data services revenues, health revenues, TV revenues, home and business smart technology (including security) revenues, and other advanced application offerings; and (iii) a general increase in equipment revenues. Increased wireline data services revenues also include revenues from business acquisitions, including our recent acquisition of ADT Security Services Canada, Inc. (ADT Canada) on November 5, 2019. There will be significant integration and customer retention costs throughout 2019, 2020 and early 2021, the full expected operations rate is expected after that time. Subsequent to year-end, we acquired Competence Call Center (CCC) on January 31, 2020, which will also increase future wireline data services revenues. Increased internet and TV service revenues are being generated by subscriber growth and higher internet revenue per customer, and there has been increased customer adoption of our home and business smart technology (including security). For additional information on wireless and wireline revenue and subscriber trends, see Section 5.4 Wireless segment and Section 5.5 Wireline segment.
![]()
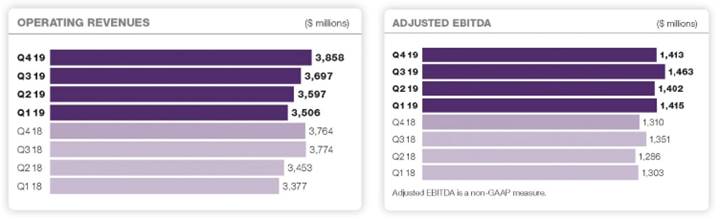
The trend of year-over-year increases in Goods and services purchased, excepting the effects of the application of IFRS 16 first evidenced in the first quarter of 2019, reflects higher wireless equipment expenses associated with higher-value smartphones in the sales mix and a general increase in new contracts; increases in external labour, administrative and other expenses to support growth in our CCBS business, our subscriber base and business acquisitions; and increased wireline TV costs of sales associated with a growing subscriber base.
In the third quarter of 2018, Operating revenues included equity income related to real estate joint ventures of $171 million arising from the sale of TELUS Garden. Additionally, in the third quarter of 2018, Goods and services purchased included a non-recurring $118 million donation to the TELUS Friendly Future Foundation. There have also been, and will continue to be, less significant asset dispositions.
The trend of year-over-year increases in net Employee benefits expense reflects increases in the number of employees related to business acquisitions and those supporting CCBS revenue growth, the expansion of our health offerings and growth in our other complementary businesses. This was partly offset by moderating salaries expense resulting from reductions in the number of full-time equivalent (FTE) domestic employees, excluding business acquisitions, related to cost efficiency and effectiveness programs. We experienced year-over-year increases in net Employee benefits expense in 2019 related to 2019 compensation increases.
The trend of year-over-year increases in Depreciation and amortization reflects increases due to growth in capital assets, which is supporting the expansion of our broadband footprint, including our generational investment to connect homes and businesses to TELUS PureFibre and enhanced LTE technology coverage, and growth in business acquisitions. The investments in our fibre-optic technology also support our small-cell technology strategy to improve coverage and capacity while preparing for a more efficient and timely evolution to 5G. Depreciation and amortization under the application of IFRS 16 are higher than would have been the case prior to IFRS 16 (see Note 2 of the Consolidated financial statements for further information.)
The trend of year-over-year increases in Financing costs reflects an increase in long-term debt outstanding, mainly associated with our investments in spectrum, fibre and wireless technology, and our business acquisitions. Financing costs include a long-term debt prepayment premium of $28 million in the third quarter of 2019 and $34 million in the third quarter of 2018. Moreover, Financing costs are net of capitalized interest related to spectrum licences acquired during the 600 MHz wireless spectrum auction, which we expect to deploy into our existing network in future periods. Financing costs also includes Interest accretion on provisions (asset retirement obligations and written put options) and Employee defined benefit plans net interest. Additionally, for the eight periods shown, Financing costs include varying amounts of foreign exchange gains or losses and varying amounts of interest income. Under the application of IFRS 16, commencing in 2019, Financing costs are higher than would have been the case prior to IFRS 16, driven by interest on lease liabilities.
The trend in Net income reflects the items noted above, as well as non-cash adjustments arising from substantively enacted income tax changes and adjustments recognized in the current periods for income taxes of prior periods. Historically, the trend in basic EPS has reflected trends in Net income.
![]()
The general trend of year-over-year decreases in Cash provided by operating activities reflects higher year-over-year income taxes paid, including a higher final income tax payment of $270 million in the first quarter of 2019 for the 2018 income tax year, and higher interest payments arising from increases in debt outstanding and year-over-year variations in fixed-term interest rates. Cash provided by operating activities was impacted by IFRS 16, which prospectively results in the principal component of lease payments being reflected as a financing activity use of cash. The general trend of year-over-year increases in free cash flow reflects the factors affecting Cash provided by operating activities, except that the implementation of IFRS 16 (and the implementation of IFRS 15 on January 1, 2018) does not affect the determination of free cash flow. For further discussion on these trends, see Section 5.4 Wireless segment and Section 5.5 Wireline segment.
Fourth quarter recap
Results for the fourth quarter of 2019 (three-month period ended December 31, 2019) are discussed in our February 13, 2020, news release and are compared with results from the fourth quarter of 2018 (three-month period ended December 31, 2018).
· Consolidated operating revenues in the fourth quarter of 2019 were $3,858 million, an increase of $94 million.
· Service revenues in the fourth quarter of 2019 were $3,156 million, an increase of $142 million, reflecting growth in wireless network revenue and wireline data services revenues, partly offset by the continuing declines in wireline legacy voice and legacy data service revenues. The wireless network revenue increase reflects a growing wireless subscriber base, partly offset by lower wireless wholesale roaming revenue. The increase in wireline data services revenues reflects increased CCBS revenue growth, as well as increases in internet and third wave data services from subscriber growth and higher internet revenue per customer, revenues from our home and business smart technology (including security) lines of business, health revenues, and TV revenue resulting from subscriber growth, partly offset by decreased legacy data service revenues.
· Equipment revenues in the fourth quarter of 2019 were $670 million, a decrease of $29 million, reflecting lower wireless contracted volumes, due to market offers including the industry introduction of device financing programs, which provide transparency of full device costs resulting in customers deferring device upgrade purchases, as well as lower prices on certain handsets.
· Other operating income in the fourth quarter of 2019 was $32 million, a decrease of $19 million, largely due to the non-recurrence of 2018 gains on sale of certain assets.
· Consolidated operating expenses in the fourth quarter of 2019 were $3,168 million, an increase of $53 million.
· Goods and services purchased in the fourth quarter of 2019 were $1,681 million, a decrease of $103 million, driven by the application of IFRS 16, lower advertising costs, and lower equipment sales expense related to lower wireless contracted volumes. In the fourth quarter of 2019, the decrease in Goods and services purchased was partially offset by higher administrative and other costs supporting CCBS revenue growth and business acquisitions, and higher TV content costs. Under the new IFRS 16 accounting standard, depreciation of right-of-use lease assets and financing costs arising from lease liabilities are not part of Goods and services purchased and we did not retrospectively adjust amounts reported for periods prior to fiscal 2019. As a result, the impact of IFRS 16 on Goods and services purchased was a decrease of $86 million in the fourth quarter of 2019.
· Employee benefits expense in the fourth quarter of 2019 was $809 million, an increase of $64 million, primarily due to higher compensation and benefit costs resulting from an increase in the number of employees supporting CCBS revenue growth, business acquisitions, higher share-based compensation, and a net increase in domestic internal labour costs arising from compensation increases, partly offset by a decrease in the number of domestic FTEs, excluding business acquisitions. This Employee benefits expense increase was partly offset by higher capitalized labour costs and lower labour-related restructuring and other costs.
· Depreciation in the fourth quarter of 2019 was $500 million, an increase of $72 million, primarily due to the application of IFRS 16. Under the new accounting standard, we recognize the depreciation of right-of-use lease assets, largely related to our real estate leases (including cell site leases and retail store leases), and we did not retrospectively adjust amounts reported for periods prior to fiscal 2019. As a result, the impact of IFRS 16 on Depreciation was an increase of $51 million in the fourth quarter of 2019. Total Depreciation also increased due to growth in capital assets over the last 12 months, including our expanded fibre footprint and business acquisitions.
· Amortization of intangible assets in the fourth quarter of 2019 was $178 million, an increase of $20 million, reflecting higher expenditures associated with the intangible asset base over the last 12 months, including those arising from business acquisitions.
![]()
· EBITDA, which includes restructuring and other costs and non-recurring losses and equity losses (or gains and equity income) related to real estate joint ventures, was $1,368 million in the fourth quarter of 2019, an increase of $133 million or 10.8%. The impact of IFRS 16 on EBITDA was an increase of $86 million in the fourth quarter of 2019.
· Adjusted EBITDA, which excludes restructuring and other costs and non-recurring losses and equity losses (or gains and equity income) related to real estate joint ventures, was $1,413 million, an increase of $103 million or 7.9%, reflecting higher wireless network revenue driven by a growing subscriber base, growth in wireline data service margins, a higher EBITDA contribution from our CCBS and health businesses, and the effects of implementing IFRS 16. These factors were partly offset by declines in wireline legacy voice and legacy data services and a decline in the EBITDA contribution from our legacy business services.
· For purposes of our CEO’s assessment of performance during the 2019 fiscal year relative to the fiscal 2018 year, we have simulated IFRS 16 adjustments to the fiscal 2018 results in calculating pro forma results. This IFRS 16 simulation to fiscal 2018 results, which are cash-based proxy adjustments and used by our CEO to assess performance, resulted in pro forma consolidated Adjusted EBITDA growth of approximately 3.0% in the fourth quarter of 2019.
· Net income attributable to Common Shares in the fourth quarter of 2019 was $368 million, an increase of $11 million, driven by higher Operating income, partly offset by increased Financing costs and increased Income taxes. Adjusted Net income excludes the effects of restructuring and other costs, income tax-related adjustments and non-recurring losses and equity losses related to real estate joint ventures. Adjusted Net income in the fourth quarter of 2019 was $400 million, a decrease of $9 million or 2.2%.
· Basic EPS was $0.61 (pre-share split — see Share split — subsequent to 2019 in Section 1.3) in the fourth quarter of 2019, an increase of $0.01 (pre-share split) or 1.7%, driven by higher Operating income, partly offset by increased Financing costs and increased Income taxes. Adjusted basic EPS excludes the effects of restructuring and other costs, income tax-related adjustments, and non-recurring losses and equity losses related to real estate joint ventures. Adjusted basic EPS in the fourth quarter of 2019 was $0.67 (pre-share split), a decrease of $0.02 (pre-share split) or 2.9%.
· Cash provided by operating activities was $829 million in the fourth quarter of 2019, a decrease of $119 million, primarily due to other operating working capital changes, increased interest paid, higher restructuring and other costs disbursements, net of expense and increased income taxes paid, partly offset by growth in EBITDA.
· Cash used by investing activities was $1,611 million in the fourth quarter of 2019, an increase of $982 million, mainly due to higher cash payments for business acquisitions and higher cash payments for capital assets. Capital expenditures were $742 million, an increase of $31 million, due to increased investments in our network and support IT infrastructure to improve its reliability and capability, and increased investments related to 5G, which ramped up throughout 2019, in addition to expenditures related to business acquisitions, including ADT Canada.
· Cash provided by financing activities was $947 million in the fourth quarter of 2019, an increase of $1,285 million, primarily reflecting increased issuances of long-term debt, net of redemptions and repayment.
· In the fourth quarter of 2019, we had net additions of 130,000 wireless subscribers.
· Mobile phone gross additions were 382,000 in the fourth quarter of 2019, an increase of 32,000, driven by growth in high-value customer additions, growth in the Canadian population, successful promotions and expanded channels.
· Our mobile phone churn rate was 1.20% in the fourth quarter of 2019, compared to 1.11% in the fourth quarter of 2018, reflecting heightened competitive intensity during the seasonal promotional period. The increase in the mobile phone churn rate was partially mitigated by the utilization of our innovative TELUS Easy Payment device financing program, Peace of Mind endless data plans, Bring-It-Back™ and TELUS Family Discount offerings, our focus on executing customers first initiatives and retention programs, and our leading network quality.
· Our mobile phone net additions were 70,000 in the fourth quarter of 2019, down 7,000, as higher mobile phone gross additions were offset by higher mobile phone churn, as described above. We continue to focus on profitable growth and away from lower economic loading in the mobile phone market. Mobile connected device net additions were 60,000 in the fourth quarter of 2019 and decreased by 5,000, driven by less low or negative-margin tablet loading, partly offset by growth in our Internet of Things (IoT) offerings, including the connected device growth arising from our subscribers expanding their IoT services to their growing customer bases.
· In the fourth quarter of 2019, we had net additions of 46,000 wireline subscribers.
![]()
· Internet net additions were 28,000 in the fourth quarter of 2019, flat compared to the prior year, as continued net new demand from consumers and businesses was offset by increased deactivations resulting from heightened competitive intensity.
· TV net additions were 15,000 in the fourth quarter of 2019, a decrease of 9,000, mainly due to heightened competitive intensity and the changing landscape of increased streaming services.
· Residential voice net losses were limited to 12,000 in the fourth quarter of 2019, compared to net losses of 13,000 in the fourth quarter of 2018. The residential voice subscriber losses continue to reflect the trend of substitution by wireless and internet-based services, partially mitigated by our expanding fibre footprint and bundled product offerings, and the success of our stronger retention efforts, including lower-priced offerings.
· Security net additions were 15,000 in the fourth quarter of 2019, an increase of 11,000 resulting from strong organic growth. With the launch of our SmartHome Security and Secure Business lines of business in July 2018, we were able to combine security products and services with enhanced bundling opportunities, which positively impacted security net additions in the fourth quarter of 2019. ADT Canada net additions are not included in these numbers, but will be included in 2020.
· Free cash flow was $135 million in the fourth quarter of 2019, an increase of $3 million, reflecting higher Adjusted EBITDA that was partly offset by increases in interest paid, income taxes paid and capital expenditures.
5.3 Consolidated operations
The following is a discussion of our consolidated financial performance. Segment information in Note 5 of the Consolidated financial statements is regularly reported to our CEO. We discuss the performance of our segments in Section 5.4 Wireless segment and Section 5.5 Wireline segment.

Operating revenues
Years ended December 31 ($ in millions) |
| 2019 |
| 2018 |
| Change |
|
Service |
| 12,400 |
| 11,882 |
| 4.4 | % |
Equipment |
| 2,189 |
| 2,213 |
| (1.1 | )% |
Revenues arising from contracts with customers |
| 14,589 |
| 14,095 |
| 3.5 | % |
Other operating income1 |
| 69 |
| 273 |
| (74.7 | )% |
Operating revenues1 |
| 14,658 |
| 14,368 |
| 2.0 | % |
(1) Includes equity income related to real estate joint ventures of $171 million arising from the sale of TELUS Garden recorded in the third quarter of 2018. Excluding the effect of this third quarter 2018 equity income, operating revenues increased by 3.2% in 2019.
Consolidated operating revenues increased by $290 million in 2019. Excluding the effect of the non-recurring third quarter 2018 equity income related to real estate joint ventures arising from the sale of TELUS Garden of $171 million, consolidated operating revenues increased by $461 million in 2019.
· Service revenues increased by $518 million in 2019, reflecting growth in wireless network revenue and wireline data services revenues, partly offset by the continuing declines in wireline legacy voice and legacy data service revenues. The wireless network revenue increase reflects a growing wireless subscriber base. The increase in wireline data services revenues reflects increased CCBS revenue growth, as well as increases in internet and third wave data services revenues resulting from subscriber growth and higher internet revenue per customer, health revenues, revenues from our home and business smart technology (including security, which has included ADT Canada since November 5, 2019), and TV revenue resulting from subscriber growth, partly offset by decreased legacy data service revenues.
· Equipment revenues decreased by $24 million in 2019, reflecting lower wireless contracted volumes and lower wireline data and voice equipment sales.
![]()
· Other operating income decreased by $204 million in 2019, primarily due to the non-recurrence of equity income related to real estate joint ventures arising from the sale of TELUS Garden of $171 million in the third quarter of 2018, in addition to the non-recurrence of 2018 gains on sale of certain assets in the fourth quarter.
Operating expenses
Years ended December 31 ($ in millions) |
| 2019 |
| 2018 |
| Change |
|
Goods and services purchased1 |
| 6,070 |
| 6,368 |
| (4.7 | )% |
Employee benefits expense |
| 3,034 |
| 2,896 |
| 4.8 | % |
Depreciation |
| 1,929 |
| 1,669 |
| 15.6 | % |
Amortization of intangible assets |
| 648 |
| 598 |
| 8.4 | % |
Operating expenses1 |
| 11,681 |
| 11,531 |
| 1.3 | % |
(1) Includes a donation to the TELUS Friendly Future Foundation of $118 million recorded in other costs in the third quarter of 2018. Excluding the effect of this third quarter 2018 donation, operating expenses increased by 2.3% in 2019.
Consolidated operating expenses increased by $150 million in 2019. Excluding the effect of the non-recurring third quarter 2018 donation to the TELUS Friendly Future Foundation of $118 million, consolidated operating expenses increased by $268 million in 2019.
· Goods and services purchased decreased by $298 million, primarily arising from the non-recurrence of a $118 million donation to the TELUS Friendly Future Foundation in the third quarter of 2018. Excluding the effect of the donation, Goods and services purchased decreased by $180 million in 2019, driven by the application of IFRS 16. In 2019, the decrease in Goods and services purchased was partially offset by higher wireline product costs associated with health services, higher administrative and other costs supporting CCBS revenue growth and business acquisitions, and higher TV content costs. Under the new IFRS 16 accounting standard, depreciation of right-of-use lease assets and financing costs arising from lease liabilities are not part of Goods and services purchased and we did not retrospectively adjust amounts reported for periods prior to fiscal 2019. As a result, the impact of IFRS 16 on Goods and services purchased was a decrease of $299 million in 2019.
· Employee benefits expense increased by $138 million in 2019, primarily due to higher compensation and benefit costs resulting from an increase in the number of employees supporting CCBS revenue growth, business acquisitions, and a net increase in domestic internal labour costs arising from compensation increases, partially offset by a decrease in the number of domestic FTEs, excluding business acquisitions. This Employee benefits expense increase was partly offset by higher capitalized labour costs and lower labour-related restructuring and other costs.
· Depreciation increased by $260 million 2019, primarily due to the application of IFRS 16. Under the new accounting standard, we recognize the depreciation of right-of-use lease assets, largely related to our real estate leases (including cell site leases and retail store leases), and we did not retrospectively adjust amounts reported for periods prior to fiscal 2019. As a result, the impact of IFRS 16 on Depreciation was an increase of $187 million in 2019. Total Depreciation also increased due to growth in capital assets over the last 12 months, including our expanded fibre footprint and business acquisitions.
· Amortization of intangible assets increased by $50 million in 2019, reflecting higher expenditures associated with the intangible asset base over the last 12 months, including those arising from business acquisitions.
Operating income
Years ended December 31 ($ in millions) |
| 2019 |
| 2018 |
| Change |
|
Wireless EBITDA1,4 (see Section 5.4) |
| 3,693 |
| 3,431 |
| 7.6 | % |
Wireline EBITDA2,4 (see Section 5.5) |
| 1,861 |
| 1,673 |
| 11.2 | % |
EBITDA3,4 |
| 5,554 |
| 5,104 |
| 8.8 | % |
Depreciation and amortization (discussed above) |
| (2,577 | ) | (2,267 | ) | 13.7 | % |
Operating income3 |
| 2,977 |
| 2,837 |
| 4.9 | % |
(1) Includes equity income related to real estate joint ventures allocated to the wireless segment of $85 million (50% of the total of $171 million) arising from the sale of TELUS Garden recorded in the third quarter of 2018. Also includes a donation to the TELUS Friendly Future Foundation allocated to the wireless segment of $59 million (50% of the total of $118 million) recorded in other costs in the third quarter of 2018. Excluding the effects of this third quarter 2018 equity income and donation, wireless EBITDA increased by 8.5% in 2019.
(2) Includes equity income allocated to the wireline segment of $86 million (50% of the total of $171 million) described in footnote 1. Also includes a donation allocated to the wireline segment of $59 million (50% of the total of $118 million) described in footnote 1. Excluding the effects of this third quarter 2018 equity income and donation, wireline EBITDA increased by 13.1% in 2019.
(3) Includes equity income related to real estate joint ventures of $171 million described in footnote 1. Also includes a donation of $118 million described in footnote 1. Excluding the effects of this third quarter 2018 equity income and donation, consolidated EBITDA increased by 10.0% in 2019, and Operating income increased by 6.9% in 2019.
(4) See Section 11.1 Non-GAAP and other financial measures.
![]()
Operating income increased by $140 million in 2019, while EBITDA increased by $450 million in 2019. Excluding the effects of non-recurring third quarter 2018 equity income related to real estate joint ventures arising from the sale of TELUS Garden of $171 million and the third quarter 2018 donation to the TELUS Friendly Future Foundation of $118 million, Operating income increased by $193 million in 2019, while EBITDA increased by $503 million in 2019. These increases reflect higher wireless network revenue growth driven by a growing subscriber base, in addition to growth in wireline data service margins and an increased EBITDA contribution from our CCBS and health businesses, as well as the effects of implementing IFRS 16. These factors were partly offset by declines in wireline legacy voice and legacy data services.
Adjusted EBITDA1
Years ended December 31 ($ in millions) |
| 2019 |
| 2018 |
| Change |
|
Wireless Adjusted EBITDA1 (see Section 5.4) |
| 3,728 |
| 3,461 |
| 7.7 | % |
Wireline Adjusted EBITDA1 (see Section 5.5) |
| 1,965 |
| 1,789 |
| 9.8 | % |
Adjusted EBITDA1 |
| 5,693 |
| 5,250 |
| 8.4 | % |
(1) See Section 11.1 Non-GAAP and other financial measures.
Adjusted EBITDA increased by $443 million or 8.4% in 2019, reflecting higher wireless network revenue driven by a growing subscriber base, growth in wireline data service margins, an increased EBITDA contribution from our CCBS and health businesses, and the effects of implementing IFRS 16. These factors were partly offset by declines in wireline legacy voice and legacy data services and a decline in the EBITDA contribution from our legacy business services.
For purposes of our CEO’s (our chief operating decision-maker) assessment of performance during the 2019 fiscal year relative to the fiscal 2018 year, we have simulated IFRS 16 adjustments to the fiscal 2018 results in calculating pro forma results. This IFRS 16 simulation to fiscal 2018 results, which are cash-based proxy adjustments and used by our CEO to assess performance, resulted in pro forma consolidated Adjusted EBITDA growth of approximately 4.0% in 2019.
Financing costs
Years ended December 31 ($ in millions) |
| 2019 |
| 2018 |
| Change |
|
Gross interest on long-term debt, excluding lease liabilities |
| 634 |
| 598 |
| 6.0 | % |
Capitalized long-term debt interest, excluding lease liabilities |
| (23 | ) | — |
| n/m |
|
Interest on lease liabilities |
| 67 |
| — |
| n/m |
|
Interest on short-term borrowings and other |
| 8 |
| 6 |
| 33.3 | % |
Interest accretion on provisions |
| 22 |
| 21 |
| 4.8 | % |
Long-term debt prepayment premium |
| 28 |
| 34 |
| (17.6 | )% |
Interest expense |
| 736 |
| 659 |
| 11.7 | % |
Employee defined benefit plans net interest |
| 1 |
| 17 |
| (94.1 | )% |
Foreign exchange losses (gains) |
| 3 |
| (6 | ) | n/m |
|
Interest income |
| (7 | ) | (9 | ) | (22.2 | )% |
Financing costs |
| 733 |
| 661 |
| 10.9 | % |
Financing costs increased by $72 million in 2019, mainly due to the following factors:
· Interest expense increased by $77 million in 2019, resulting from:
· Gross interest on long-term debt, excluding lease liabilities, increased by $36 million 2019, driven by an increase in average long-term debt balances outstanding in part attributable to the acquisition of spectrum licences, partially offset by a decrease in the effective interest rate. Our weighted average interest rate on long-term debt (excluding commercial paper, the revolving component of the TELUS International (Cda) Inc. credit facility, lease liabilities and other long-term debt) was 3.94% at December 31, 2019, as compared to 4.18% one year earlier. (See Long-term debt issues and repayments in Section 7.4.)
· Capitalized long-term debt interest is in respect of debt incurred for the purchase of spectrum licences during the 600 MHz wireless spectrum auction held by Innovation, Science and Economic Development Canada (ISED), which we expect to deploy in our existing network in future periods. Capitalization of long-term debt interest will continue until substantially all of the activities necessary to prepare the spectrum for its intended use are complete.
· Interest on lease liabilities of $67 million in 2019 represents the financing costs increase arising from lease liabilities upon the application of IFRS 16 as we did not retrospectively adjust amounts reported for periods prior to fiscal 2019. This interest on lease liabilities was largely related to our real estate leases (including cell site leases and retail store leases), whereas prior to the application of IFRS 16, these costs would have been accounted for in Goods and services purchased.
![]()
· Interest on short-term borrowings and other was relatively flat in 2019. (See Long-term debt issues and repayments in Section 7.4.)
· Interest accretion on provisions was relatively flat in 2019.
· In the third quarter of 2019, we recorded a long-term debt prepayment premium of $28 million related to the early redemption of all our $1.0 billion of senior unsecured 5.05% Notes, Series CH due July 23, 2020. In the third quarter of 2018, we recorded a long-term debt prepayment premium of $34 million before income taxes related to the early redemption of all our $1.0 billion of senior unsecured 5.05% Notes, Series CG.
· Employee defined benefit plans net interest decreased by $16 million in 2019, primarily due to the change in the defined benefit plan surplus as at December 31, 2018, to $57 million (net of the plan asset ceiling limit of $263 million), compared to a defined benefit plan deficit of $334 million (net of the plan asset ceiling limit of $110 million) one year earlier, partly offset by an increase in the discount rate.
· Foreign exchange losses (gains) have fluctuated, primarily reflecting changes in the value of the Canadian dollar relative to the U.S. dollar.
· Interest income was relatively flat in 2019.
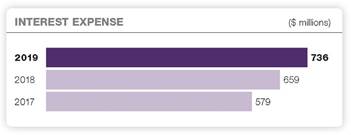
Income taxes |
|
|
|
|
|
|
|
|
|
|
|
|
|
|
|
Years ended December 31 ($ in millions, except tax rates) |
| 2019 |
| 2018 |
| Change |
|
Income tax computed at applicable statutory rates |
| 604 |
| 586 |
| 3.1 | % |
Revaluation of deferred income tax liability to reflect future income tax rates |
| (124 | ) | — |
| n/m |
|
Adjustments recognized in the current period for income taxes of prior periods |
| (17 | ) | (6 | ) | n/m |
|
Other |
| 5 |
| (28 | ) | n/m |
|
Income taxes |
| 468 |
| 552 |
| (15.2 | )% |
Income taxes computed at applicable statutory rates (%) |
| 26.9 |
| 27.0 |
| (0.1 | )pts. |
Revaluation of deferred income tax liability to reflect future income tax rates (%) |
| (5.5 | ) | — |
| (5.5 | )pts. |
Adjustments recognized in the current period for income taxes of prior periods (%) |
| (0.8 | ) | (0.3 | ) | (0.5 | )pts. |
Other (%) |
| 0.2 |
| (1.3 | ) | 1.5 | pts. |
Effective tax rate (%) |
| 20.8 |
| 25.4 |
| (4.6 | )pts. |
Total income tax expense decreased by $84 million in 2019. The effective tax rate decreased from 25.4% to 20.8% in 2019, predominantly attributable to the revaluation of the deferred income tax liability for the multi-year reduction in the Alberta provincial corporate tax rate that was substantively enacted in the second quarter of 2019.
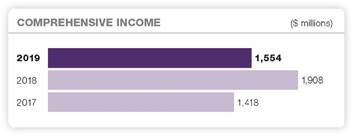
![]()
Comprehensive income |
|
|
|
|
|
|
|
|
|
|
|
|
|
|
|
Years ended December 31 ($ in millions) |
| 2019 |
| 2018 |
| Change |
|
Net income |
| 1,776 |
| 1,624 |
| 9.4 | % |
Other comprehensive income (net of income taxes): |
|
|
|
|
|
|
|
Items that may be subsequently reclassified to income |
| 104 |
| (48 | ) | n/m |
|
Items never subsequently reclassified to income |
| (326 | ) | 332 |
| n/m |
|
Comprehensive income |
| 1,554 |
| 1,908 |
| (18.6 | )% |
Comprehensive income decreased by $354 million in 2019, primarily as a result of changes in employee defined benefit plan re-measurement amounts arising from decreases in the discount rate, which were partly offset by the return on plan assets. This was partially offset by increases in Net income, changes in the unrealized fair value of derivatives designated as cash flow hedges and foreign currency translation adjustments arising from translating financial statements of foreign operations. Items that may subsequently be reclassified to income are composed of changes in the unrealized fair value of derivatives designated as cash flow hedges and foreign currency translation adjustments arising from translating financial statements of foreign operations. Items never subsequently reclassified to income are composed of employee defined benefit plans re-measurement amounts and changes in the measurement of investment financial assets.
5.4 Wireless segment
Mobile phone subscribers 2019: 8,733,000 +3.2% 2018: 8,459,000 | Mobile phone ABPU 2019: $73.37 +0.2% 2018: $73.19 | Mobile phone blended churn 2019: 1.08 +0.02 pts. 2018: 1.06 | Mobile connected device subscribers 2019: 1,480,000 +21.6% 2018: 1,217,000 |
Wireless trends and seasonality
The historical trend over the last eight quarters in wireless network revenue reflects growth in our subscriber base, as well as higher-value smartphones in the sales mix of gross additions and retention units. There has been a general year-over-year increase in equipment revenues resulting from higher-value smartphones in the sales mix and a higher volume of new contracts; however, this trend is moderating, with heightened market aggression, the improving quality and increasing cost of iconic devices that result in customers deferring upgrades in addition to the industry introduction of device financing programs which provide transparency of full device costs and result in customers also deferring device upgrades. The general trend of year-over-year increases in mobile phone subscriber net additions resulted from: the success of our promotions; the effects of market growth arising from a growing population, changing population demographics and an increasing number of customers with multiple devices; and continuous improvements in the speed and quality of our network, combined with our low churn rate, which reflect our focus on customers first initiatives. Our capital expenditures on network improvements increase capacity and coverage, allowing us to grow revenue through net additions of wireless subscribers. Although there have historically been significant third and fourth quarter seasonal effects that result in increased loading, competitive intensity in both the consumer and business markets, launches of new devices, rate plans, device financing programs, and the strategic decision to focus on profitable loading rather than low or negative-margin tablet loading and non-accretive prepaid-to-postpaid migrations, may impact subscriber addition results and trends for future periods.
Mobile phone ABPU growth has been moderating, primarily due to: (i) carriers offering larger allotments of data, as well as rate plans that include plans with bonus data and unlimited data plans, data sharing and international roaming features, and (ii) consumer behavioural response to more frequent customer data usage notifications and offloading of data traffic to increasingly available Wi-Fi hotspots; partly offset by (iii) an increased mix of higher-value rate plans, in addition to an increase in higher-value smartphones in the sales mix, including the effects of customers financing more of the cost of these devices through our TELUS Easy Payment program, which we launched in the third quarter of 2019, and an increased proportion of higher-value customers in the subscriber mix. As a result of changing industry dynamics, customers have been able to gain access to higher network speeds and larger allotments of data included for a given price point, further limiting mobile phone ABPU expansion, as customers are continuing to obtain lower cost per megabyte plans. The economic environment, consumer behaviour, the regulatory environment, device selection and other factors also impact mobile phone ABPU, and as a consequence, there can be no assurance that mobile phone ABPU will return to growth in the coming quarters.
The trend of our comparatively low mobile phone blended churn rate reflects our customers first efforts, retention programs and focus on building, maintaining and enhancing our high-quality network. We may experience pressure on our mobile phone blended churn rate if the level of competitive intensity increases (in part due to increased promotional activity), if there is an increase in customers on expired or no contracts (compared to current experience), or as a result of regulatory changes. Accordingly, our wireless segment historical operating results and trends may not be reflective of results and trends for future periods.
![]()
Our connected device subscriber base has been growing primarily through our expanded IoT offerings, partly offset by our strategic decision to reduce loading of low or negative-margin tablets. IoT technologies are expected to continue to grow and IoT customers, along with other connected device subscribers, will be able to realize greater benefits that are dependent upon 5G deployment.
The trends in wireless EBITDA-based operating metrics have been impacted by our adoption of IFRS 16 effective January 1, 2019, as discussed further in Note 2 of the Consolidated financial statements.
Wireless operating indicators |
|
|
|
|
|
|
|
|
|
|
|
|
|
|
|
As at December 31 |
| 2019 |
| 2018 |
| Change |
|
Subscribers1 (000s): |
|
|
|
|
|
|
|
Mobile phones |
| 8,733 |
| 8,459 |
| 3.2 | % |
Mobile connected devices |
| 1,480 |
| 1,217 |
| 21.6 | % |
Total |
| 10,213 |
| 9,676 |
| 5.5 | % |
HSPA+ population coverage2 (millions) |
| 37.0 |
| 37.0 |
| — | % |
LTE population coverage2 (millions) |
| 36.9 |
| 36.9 |
| — | % |
Years ended December 31 |
| 2019 |
| 2018 |
| Change |
|
Mobile phones gross additions1 (000s): |
| 1,375 |
| 1,289 |
| 6.7 | % |
Subscriber net additions1 (000s): |
|
|
|
|
|
|
|
Mobile phones |
| 274 |
| 264 |
| 3.8 | % |
Mobile connected devices |
| 263 |
| 193 |
| 36.3 | % |
Total |
| 537 |
| 457 |
| 17.5 | % |
Mobile phones ABPU, per month1,3 ($) |
| 73.37 |
| 73.19 |
| 0.2 | % |
Mobile phones ARPU, per month1,3 ($) |
| 60.14 |
| 60.98 |
| (1.4 | )% |
Mobile phones churn, per month1,3 (%) |
| 1.08 |
| 1.06 |
| 0.02 | pts. |
(1) Effective for the first quarter of 2019, with retrospective application, we revised our definition of a wireless subscriber and now report mobile phones and mobile connected devices (e.g. tablets, internet keys, IoT, wearables, connected automobile systems) as separate subscriber bases, so as to be consistent with the way we manage our business and to align with global peers. As a result of the change, total subscribers and associated operating statistics (gross additions, net additions, churn, ABPU and ARPU) were adjusted to reflect (i) the movement of certain subscribers from the mobile phones subscriber base to the newly created mobile connected devices subscriber base, and (ii) the inclusion of previously undisclosed IoT and mobile health subscribers in our mobile connected devices subscriber base. For additional information on our subscriber definitions, see Section 11.2 Operating indicators.
(2) Including network access agreements with other Canadian carriers.
(3) See Section 11.2 Operating indicators. These are industry measures useful in assessing operating performance of a wireless company, but are not measures defined under IFRS-IASB.
Operating revenues — Wireless segment |
|
|
|
|
|
|
|
|
|
|
|
|
|
|
|
Years ended December 31 ($ in millions) |
| 2019 |
| 2018 |
| Change |
|
Network revenue |
| 6,124 |
| 6,025 |
| 1.6 | % |
Equipment and other service revenues |
| 2,005 |
| 1,992 |
| 0.7 | % |
Revenues arising from contracts with customers |
| 8,129 |
| 8,017 |
| 1.4 | % |
Other operating income1 |
| 20 |
| 118 |
| (83.1 | )% |
External operating revenues1 |
| 8,149 |
| 8,135 |
| 0.2 | % |
Intersegment revenues |
| 53 |
| 47 |
| 12.8 | % |
Wireless operating revenues1 |
| 8,202 |
| 8,182 |
| 0.2 | % |
(1) Includes equity income related to real estate joint ventures allocated to the wireless segment of $85 million (50% of the total of $171 million) arising from the sale of TELUS Garden recorded in the third quarter of 2018. Excluding the effect of this third quarter 2018 equity income, wireless operating revenues increased by 1.3% in 2019.
Excluding the effect of the non-recurring third quarter 2018 equity income related to real estate joint ventures arising from the sale of TELUS Garden allocated to the wireless segment of $85 million (50% of the total of $171 million), wireless operating revenues increased by $105 million in 2019. As reported, wireless operating revenues increased by $20 million in 2019.
![]()
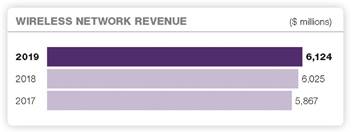
Network revenue increased by $99 million or 1.6% in 2019, reflecting growth of 5.5% in the subscriber base over the last 12 months, partly offset by declining mobile phone ARPU, as discussed below. Mobile phone ABPU was $73.37 in 2019, an increase of $0.18 or 0.2% for 2019. The increase reflects growth resulting from our combined TELUS Easy Payment device financing, Peace of Mind endless data plans and TELUS Family Discount offerings, which we introduced in the third quarter of 2019, with customers selecting plans with endless data or larger data buckets and higher-value smartphones in the sales mix; this growth was partly offset by declines in chargeable usage and the impact of the competitive environment putting pressure on base rate plan prices in the current and prior periods. Mobile phone ARPU was $60.14 in 2019, a decrease of $0.84 or 1.4% for 2019, as declines in chargeable usage and competitive pressures on base rate plan prices more than offset the increased number of customers selecting plans with endless data or larger data buckets.
· Mobile phone gross additions were 1,375,000 in 2019, an increase of 86,000, driven by growth in high-value customer additions, growth in the Canadian population, successful promotions and expanded channels.
· Our mobile phone churn rate was 1.08% in 2019, compared to 1.06% in 2018, reflecting heightened competitive intensity during the seasonal promotional period while TELUS remained disciplined. The increase in the mobile phone churn rate was partially mitigated by the utilization of our innovative TELUS Easy Payment device financing program, Peace of Mind endless data plans, Bring-It-Back and TELUS Family Discount offerings, our focus on executing customers first initiatives and retention programs, and our leading network quality.
· Net subscriber additions were 537,000 in 2019, compared to 457,000 in 2018. Mobile phone net additions increased by 10,000 in 2019, driven by higher mobile phone gross additions, partly offset by higher mobile phone churn, as described above. We continue to focus on profitable growth and away from lower economic loading in the mobile phone market. Mobile connected device net additions improved by 70,000 in 2019, driven by growth in our IoT offerings, including the connected device growth arising from our subscribers expanding their IoT services to their growing customer bases, partly offset by less low or negative-margin tablet loading.
Equipment and other service revenues increased by $13 million in 2019, due to greater volumes of higher-value smartphones in the sales mix.
Other operating income decreased by $98 million in 2019, largely resulting from the non-recurrence of equity income related to real estate joint ventures arising from the sale of TELUS Garden in the third quarter of 2018, of which 50% of the total of $171 million was allocated to each of the wireless and wireline segments. Excluding the effect of this third quarter 2018 equity income, Other operating income decreased by $13 million in 2019, mainly due to the non-recurrence of 2018 gains from the sale of certain assets and a decrease in the provision related to written put options in respect of non-controlling interests.
Intersegment revenues represent network services that are eliminated upon consolidation, along with the associated wireline expenses.
Operating expenses — Wireless segment |
|
|
|
|
|
|
|
|
|
|
|
|
|
|
|
Years ended December 31 ($ in millions) |
| 2019 |
| 2018 |
| Change |
|
Goods and services purchased: |
|
|
|
|
|
|
|
Equipment sales expenses |
| 1,959 |
| 1,960 |
| (0.1 | )% |
Network operating expenses |
| 789 |
| 841 |
| (6.2 | )% |
Marketing expenses |
| 394 |
| 393 |
| 0.3 | % |
Other1,2 |
| 702 |
| 867 |
| (19.0 | )% |
Employee benefits expense1 |
| 665 |
| 690 |
| (3.6 | )% |
Wireless operating expenses2 |
| 4,509 |
| 4,751 |
| (5.1 | )% |
(1) Includes restructuring and other costs. See Section 11.1 Non-GAAP and other financial measures.
(2) Includes a donation to the TELUS Friendly Future Foundation allocated to the wireless segment of $59 million (50% of the total of $118 million)
![]()
recorded in other costs in the third quarter of 2018. Excluding the effect of this third quarter 2018 donation, wireless operating expenses decreased by 3.9% in 2019.
Wireless operating expenses decreased by $242 million in 2019. Excluding the effect of the non-recurring third quarter 2018 donation to the TELUS Friendly Future Foundation allocated to the wireless segment of $59 million (50% of the total of $118 million), wireless operating expenses decreased by $183 million in 2019.
Equipment sales expenses decreased by $1 million, as lower volumes were largely offset by higher-value smartphones in the sales mix.
Network operating expenses decreased by $52 million in 2019, mainly due to the application of IFRS 16.
Marketing expenses increased by $1 million as higher commissions expense was largely offset by lower advertising costs.
Other goods and services purchased decreased by $165 million in 2019, mainly due to the non-recurrence of a donation to the TELUS Friendly Future Foundation in the third quarter of 2018, of which 50% of the total of $118 million was allocated to each of the wireless and wireline segments. Excluding the effect of this third quarter 2018 donation, Other goods and services purchased decreased by $106 million in 2019, primarily driven by the application of IFRS 16, lower non-labour-related restructuring and other costs related to efficiency initiatives, and savings from cost efficiency programs, partly offset by higher external labour costs.
Employee benefits expense decreased by $25 million in 2019, primarily due to higher capitalized labour costs and lower labour-related restructuring and other costs, partly offset by higher internal labour costs resulting from compensation increases.
EBITDA — Wireless segment |
|
|
|
|
|
|
|
|
|
|
|
|
|
|
|
Years ended December 31 ($ in millions, except margins) |
| 2019 |
| 2018 |
| Change |
|
EBITDA1,4 |
| 3,693 |
| 3,431 |
| 7.6 | % |
Add restructuring and other costs included in EBITDA2 |
| 32 |
| 115 |
| n/m |
|
Add (deduct) non-recurring losses and equity losses (gains and equity income) related to real estate joint ventures3 |
| 3 |
| (85 | ) | n/m |
|
Adjusted EBITDA4 |
| 3,728 |
| 3,461 |
| 7.7 | % |
EBITDA margin4 (%) |
| 45.0 |
| 41.9 |
| 3.1 | pts. |
Adjusted EBITDA margin4,5 (%) |
| 45.4 |
| 42.7 |
| 2.7 | pts. |
(1) Excluding the third quarter 2018 equity income described in footnote 3 and the third quarter 2018 donation described in footnote 2, EBITDA increased by 8.5% in 2019.
(2) Includes a donation to the TELUS Friendly Future Foundation allocated to the wireless segment of $59 million (50% of the total of $118 million) recorded in other costs in the third quarter of 2018.
(3) Includes equity income related to real estate joint ventures allocated to the wireless segment of $85 million (50% of the total of $171 million) arising from the sale of TELUS Garden recorded in the third quarter of 2018.
(4) See description under EBITDA in Section 11.1 Non-GAAP and other financial measures.
(5) Adjusted EBITDA margin is Adjusted EBITDA divided by Operating revenues, where the calculation of Operating revenues excludes non-recurring losses and equity losses (gains and equity income) related to real estate joint ventures.
Wireless EBITDA increased by $262 million or 7.6% in 2019. Excluding the effects of the non-recurring third quarter 2018 equity income related to real estate joint ventures arising from the sale of TELUS Garden allocated to the wireless segment of $85 million (50% of the total of $171 million) and the third quarter 2018 donation to the TELUS Friendly Future Foundation allocated to the wireless segment of $59 million (50% of the total of $118 million), wireless EBITDA increased by $288 million or 8.5% in 2019. Wireless Adjusted EBITDA increased by $267 million or 7.7% in 2019, reflecting higher network revenue growth, driven by a larger subscriber base, lower employee benefits expense, savings from cost efficiency programs and the implementation of IFRS 16.
Applying a retrospective IFRS 16 simulation to fiscal 2018 results (see Section 5.3), pro forma wireless Adjusted EBITDA growth was approximately 4.3% in 2019.
![]()
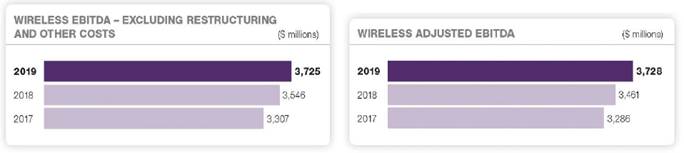
5.5 Wireline segment
Internet subscriber net additions 2019: 107,000 (7.0)% 2018: 115,000 |
| TV subscriber net additions 2019: 67,000 +6.3% 2018: 63,000 |
| Security net additions 2019: 46,000 2018: 6,000 |
| Total wireline subscriber net additions 2019: 176,000 +32.3% 2018: 133,000 |
Wireline trends
The trend over the last eight quarters of increases in wireline service revenue reflects growth in internet and third wave data services, CCBS revenues, TV revenues, health revenues, and home and business smart technology (including security) revenues, and is partly offset by declining wireline legacy voice and legacy data revenues. As well, increased wireline data services revenues also include revenues from business acquisitions, including our recent acquisition of ADT Canada on November 5, 2019. There will be significant integration and customer retention costs throughout 2019, 2020 and early 2021, the full expected operations rate is expected after that time. Subsequent to year-end, we acquired CCC on January 31, 2020, which will also increase future wireline data services revenues. The increases in internet and TV service revenues are being generated by subscriber growth and higher internet revenue per customer resulting from upgrades to faster speeds, larger data usage rate plans and the expansion of our fibre footprint. We expect continued internet subscriber base growth as the economy grows and as we continue our investments in expanding our fibre-optic infrastructure, including our pre-positioning for 5G. The total number of TV subscribers has increased as a result of higher net additions in response to diverse product offerings, fibre expansion and bundled product offerings, combined with our low customer churn rate. Security subscriber base growth is increasing as a result of business acquisitions and organic growth. Residential voice subscriber losses continue to reflect the ongoing trend of substitution by wireless and internet-based services, but have been partly mitigated by the success of our bundled service offerings and lower-priced offerings. The trend of declining legacy wireline voice revenues is due to technological substitution, greater use of inclusive long distance coupled with lower long distance minutes used, and intensification of competition in the small and medium-sized business market; however, our rate of decline has been moderating with our utilization of bundled product offerings and successful retention efforts. The migration of business products and services offerings to IP services and the introduction of new competitors yield inherently lower margins compared to some legacy business products and service offerings.
The trends in wireline EBITDA-based operating metrics have been impacted by our adoption of IFRS 16 effective January 1, 2019, as discussed further in Note 2 of the Consolidated financial statements.
![]()
Wireline operating indicators
At December 31 (000s) |
| 2019 |
| 2018 |
| Change |
|
Subscriber connections: |
|
|
|
|
|
|
|
Internet1 |
| 1,981 |
| 1,858 |
| 6.6 | % |
TV |
| 1,160 |
| 1,093 |
| 6.1 | % |
Residential voice |
| 1,204 |
| 1,248 |
| (3.5 | )% |
Security2,3 |
| 608 |
| 72 |
| n/m |
|
Total wireline subscriber connections1,2,3 |
| 4,953 |
| 4,271 |
| 16.0 | % |
Years ended December 31 (000s) |
| 2019 |
| 2018 |
| Change |
|
Subscriber connection net additions (losses): |
|
|
|
|
|
|
|
Internet |
| 107 |
| 115 |
| (7.0 | )% |
TV |
| 67 |
| 63 |
| 6.3 | % |
Residential voice |
| (44 | ) | (51 | ) | 13.7 | % |
Security2 |
| 46 |
| 6 |
| n/m |
|
Total wireline subscriber connection net additions3 |
| 176 |
| 133 |
| 32.3 | % |
(1) During the first quarter of 2019, we adjusted cumulative subscriber connections to add approximately 16,000 subscribers from acquisitions undertaken during the quarter.
(2) Effective for the third quarter of 2019, with retrospective application to the launch of TELUS-branded security services at the beginning of the third quarter of 2018, we have added security subscriber connections to our total wireline subscriber connections.
(3) December 31, 2019 security subscriber connections have been increased to include approximately 490,000 subscribers related to our acquisition of ADT Canada (acquired on November 5, 2019).
Operating revenues — Wireline segment |
| |||||||
|
| |||||||
Years ended December 31 ($ in millions) |
| 2019 |
| 2018 |
| Change |
| |
Data services |
| 5,080 |
| 4,588 |
| 10.7 | % | |
Voice services |
| 986 |
| 1,084 |
| (9.0 | )% | |
Other services and equipment |
| 394 |
| 406 |
| (3.0 | )% | |
Revenues arising from contracts with customers |
| 6,460 |
| 6,078 |
| 6.3 | % | |
Other operating income1 |
| 49 |
| 155 |
| n/m |
| |
External operating revenues1 |
| 6,509 |
| 6,233 |
| 4.4 | % | |
Intersegment revenues |
| 251 |
| 207 |
| 21.3 | % | |
Wireline operating revenues1 |
| 6,760 |
| 6,440 |
| 5.0 | % | |
(1) Includes equity income related to real estate joint ventures allocated to the wireline segment of $86 million (50% of the total of $171 million) arising from the sale of TELUS Garden recorded in the third quarter of 2018. Excluding the effect of this third quarter 2018 equity income, wireline operating revenues increased by 6.4% in 2019.
Excluding the effect of the non-recurring third quarter 2018 equity income related to real estate joint ventures arising from the sale of TELUS Garden allocated to the wireline segment of $86 million (50% of the total of $171 million), wireline operating revenues increased by $406 million in 2019. As reported, wireline operating revenues increased by $320 million in 2019.
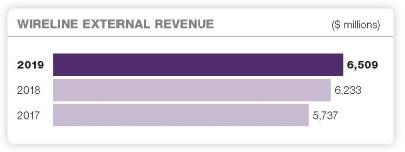
![]()
· Data services revenues increased by $492 million in 2019. The increase was driven by: (i) growth in CCBS revenues primarily due to growth in business volumes resulting from expanded services for existing customers, as well as customer growth; (ii) increased internet and third wave data service revenues, reflecting a 6.6% increase in our internet subscribers over the last 12 months and higher revenue per customer from faster internet speed upgrades, larger data usage internet rate plans, and rate changes; (iii) increased health revenues, driven by expanded services for existing customers and growth in business volumes; (iv) increased revenues from home and business smart technology (including security), driven by business acquisitions (including ADT Canada since November 5, 2019) and expanded services; and (v) increased TV revenues, reflecting subscriber growth of 6.1% over the last 12 months. This growth was partly offset by the ongoing decline in legacy data service revenues.
· Voice services revenues decreased by $98 million in 2019, reflecting the ongoing decline in legacy voice revenues resulting from technological substitution, greater use of inclusive long distance plans and price plan changes. We experienced a 3.5% decline in residential voice subscribers over the last 12 months, compared to a 3.9% decline in residential voice subscribers for the 12-month period ended December 31, 2018.
· Other services and equipment revenues decreased by $12 million in 2019, mainly due to lower data and voice equipment sales, partly offset by growth from our growing security business.
· Wireline subscriber connection net additions were 176,000 in 2019, an increase of 43,000.
· Internet net additions were 107,000 in 2019, a decrease of 8,000, as continued net new demand from consumers and businesses was offset by increased deactivations resulting from heightened competitive intensity. Our continued focus on connecting more homes and businesses directly to fibre (with TELUS PureFibre available to approximately 70% of our broadband footprint at the end of the third quarter of 2019), expanding and enhancing our addressable high-speed internet and Optik TV footprint, and bundling these services together contributed to combined internet and TV subscriber growth of 190,000 over the last 12 months.
· TV net additions were 67,000 in 2019, an increase of 4,000 in contrast to market-reported declines in traditional television viewing habits, mainly due to higher gross additions as a result of our diverse product offerings, partly offset by heightened competitive intensity.
· Residential voice net losses were limited to 44,000 in 2019, as compared to residential voice net losses of 51,000 in 2018. The residential voice subscriber losses continue to reflect the trend of substitution by wireless and internet-based services, partially mitigated by our expanding fibre footprint and bundled product offerings, and the success of our stronger retention efforts, including lower-priced offerings.
· Security net additions were 46,000 in 2019 resulting from strong organic growth. With the launch of our SmartHome Security and Secure Business lines of business in July 2018, we were able to combine security products and services with enhanced bundling opportunities, and any comparison prior to July 2018 would not be consistent. ADT Canada net additions are not included in these numbers, but will be included in 2020.
Other operating income decreased by $106 million in 2019, mainly due to the non-recurrence of third quarter 2018 equity income related to real estate joint ventures arising from the sale of TELUS Garden. Excluding the effect of this third quarter 2018 equity income related to real estate joint ventures arising from the sale of TELUS Garden, Other operating income decreased by $20 million in 2019, due to the non-recurrence of 2018 gains on sale of certain assets and lower gains on sale of investments.
Intersegment revenues represent services provided to the wireless segment, including those from CCBS. Such revenue is eliminated upon consolidation together, with the associated expenses in wireless.
Operating expenses — Wireline segment |
|
|
|
|
|
|
|
|
|
|
|
|
|
|
|
Years ended December 31 ($ in millions) |
| 2019 |
| 2018 |
| Change |
|
Goods and services purchased1,2 |
| 2,530 |
| 2,561 |
| (1.2 | )% |
Employee benefits expense1 |
| 2,369 |
| 2,206 |
| 7.4 | % |
Wireline operating expenses2 |
| 4,899 |
| 4,767 |
| 2.8 | % |
(1) Includes restructuring and other costs. See Section 11.1 Non-GAAP and other financial measures.
(2) Includes a donation to the TELUS Friendly Future Foundation allocated to the wireline segment of $59 million (50% of the total of $118 million) recorded in other costs in the third quarter of 2018. Excluding the effect of this third quarter 2018 donation, wireline operating expenses increased by 4.1% in 2019.
Wireline operating expenses increased by $132 million in 2019. Excluding the effect of the non-recurring third quarter 2018 donation to the TELUS Friendly Future Foundation allocated to the wireline segment of $59 million (50% of the total of $118 million), wireline operating expenses increased by $191 million in 2019.
![]()
Goods and services purchased decreased by $31 million in 2019, mainly due to the non-recurrence of a donation to the TELUS Friendly Future Foundation in the third quarter of 2018. Excluding the effect of this third quarter 2018 donation, Goods and services purchased increased by $28 million due to higher product costs associated with growth in health services, higher external labour and other administrative costs supporting CCBS revenue growth and business acquisitions, and higher marketing costs. The increase in Goods and services purchased was partly offset by the application of IFRS 16.
Employee benefits expense increased by $163 million in 2019, primarily due to increases in compensation and benefits costs resulting from an increase in the number of employees supporting CCBS revenue growth and business acquisitions, and higher internal labour costs resulting from compensation increases. These factors were partly offset by lower labour-related restructuring and other costs and a decrease in the number of domestic FTEs, excluding business acquisitions.
EBITDA — Wireline segment
Years ended December 31 ($ in millions, except margins) |
| 2019 |
| 2018 |
| Change |
|
EBITDA1, 4 |
| 1,861 |
| 1,673 |
| 11.2 | % |
Add restructuring and other costs included in EBITDA2 |
| 102 |
| 202 |
| n/m |
|
Add (deduct) non-recurring losses and equity losses (gains and equity income) related to real estate joint ventures3 |
| 2 |
| (86 | ) | n/m |
|
Adjusted EBITDA4 |
| 1,965 |
| 1,789 |
| 9.8 | % |
EBITDA margin4 (%) |
| 27.5 |
| 26.0 |
| 1.5 | pts. |
Adjusted EBITDA margin4, 5 (%) |
| 29.1 |
| 28.2 |
| 0.9 | pts. |
(1) Excluding the third quarter 2018 equity income described in footnote 3 and the third quarter 2018 donation described in footnote 2, EBITDA increased by 13.1% in 2019.
(2) Includes a donation to the TELUS Friendly Future Foundation allocated to the wireline segment of $59 million (50% of the total of $118 million) recorded in other costs in the third quarter of 2018.
(3) Includes equity income related to real estate joint ventures allocated to the wireline segment of $86 million (50% of the total of $171 million) arising from the sale of TELUS Garden recorded in the third quarter of 2018.
(4) See description under EBITDA in Section 11.1 Non-GAAP and other financial measures.
(5) Adjusted EBITDA margin is Adjusted EBITDA divided by Operating revenues, where the calculation of Operating revenues excludes non-recurring losses and equity losses (gains and equity income) related to real estate joint ventures.
Wireline EBITDA increased by $188 million or 11.2% in 2019, and this includes our estimated impact of the CRTC’s decision on wholesale internet service rates recorded in the third quarter of 2019. Excluding the effects of the non-recurring third quarter 2018 equity income related to real estate joint ventures arising from the sale of TELUS Garden allocated to the wireline segment of $86 million (50% of the total of $171 million) and the donation to the TELUS Friendly Future Foundation allocated to the wireline segment of $59 million (50% of the total of $118 million), wireline EBITDA increased by $215 million or 13.1% in 2019. Wireline Adjusted EBITDA increased by $176 million or 9.8% in 2019. These increases reflect: an increased contribution resulting from our CCBS business from expanded services for existing customers and customer growth; higher internet margins; higher health margins, mainly resulting from expanded services for existing customers, operational efficiencies and business acquisitions; growth from our home and business smart technology (including security); and the implementation of IFRS 16. These factors were partly offset by the continued declines in legacy voice and legacy data services, higher employee benefits expense and other costs related to business acquisitions, and a decline in the EBITDA contribution from our legacy business services, as well as lower gains on sales of certain assets.
Applying a retrospective IFRS 16 simulation to fiscal 2018 results (see Section 5.3), pro forma wireline Adjusted EBITDA growth was approximately 3.4% in 2019.
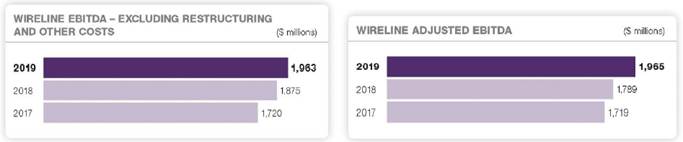
![]()
6. Changes in financial position
Financial position at: |
| December 31 |
|
|
|
|
| ||
($ millions) |
| 2019 |
| 2018 |
| Change |
| Change includes: |
|
Current assets |
|
|
|
|
|
|
|
|
|
Cash and temporary investments, net |
| 535 |
| 414 |
| 121 |
| See Section 7 Liquidity and capital resources |
|
Accounts receivable |
| 1,962 |
| 1,600 |
| 362 |
| Increases due to unbilled customer finance receivables from the Bring-It-Back program and TELUS Easy Payment device financing program, as well as an increase due to the timing of wireless wholesale customer receipts, partly offset by a decrease in postpaid receivables |
|
Income and other taxes receivable |
| 127 |
| 3 |
| 124 |
| Instalments to date are greater than the expense |
|
Inventories |
| 437 |
| 376 |
| 61 |
| An increase in the volume of handsets, partly offset by a decrease in average handset cost |
|
Contract assets |
| 737 |
| 860 |
| (123 | ) | Refer to description in non-current contract assets |
|
Prepaid expenses |
| 547 |
| 539 |
| 8 |
| An increase in prepayment of maintenance contracts net of amortization |
|
Current derivative assets |
| 8 |
| 49 |
| (41 | ) | An decrease in the notional amount of U.S. currency hedging items. |
|
Current liabilities |
|
|
|
|
|
|
|
|
|
Short-term borrowings |
| 100 |
| 100 |
| — |
| See Section 7.7 Sale of trade receivables |
|
Accounts payable and accrued liabilities |
| 2,749 |
| 2,570 |
| 179 |
| Increase in payables due to payment timing and an increase in commodity taxes, partly offset by a decrease in accrued liabilities. See Note 23 of the Consolidated financial statements |
|
Income and other taxes payable |
| 55 |
| 218 |
| (163 | ) | Decrease due to final instalment payments for the previous year, partially offset by current income tax expense in excess of instalments for the current year |
|
Dividends payable |
| 352 |
| 326 |
| 26 |
| Effects of increases in the dividend rate as well as the number of shares outstanding |
|
Advance billings and customer deposits |
| 675 |
| 656 |
| 19 |
| An increase in advance billings reflecting increased wireless subscriber growth during the year. See Note 24 of the Consolidated financial statements |
|
Provisions |
| 288 |
| 129 |
| 159 |
| An increase due to a written put provision reclassified from non-current liabilities, partly offset by restructuring disbursements exceeding new restructuring provisions. See Note 25 of the Consolidated financial statements |
|
Current maturities of long-term debt |
| 1,332 |
| 836 |
| 496 |
| An increase in outstanding commercial paper, as well as the initial recognition of lease liabilities resulting from the implementation of IFRS 16 |
|
Current derivative liabilities |
| 23 |
| 9 |
| 14 |
| An increase in the notional amount of U.S. currency hedging items. |
|
Working capital |
| (1,221 | ) | (1,003 | ) | (218 | ) | TELUS normally has a negative working capital position. See Financing and capital structure management plans in Section 4.3 and Note 4(c) of the Consolidated financial statements. |
|
![]()
Financial position at: |
| December 31 |
|
|
|
|
| ||
($ millions) |
| 2019 |
| 2018 |
| Change |
| Change includes: |
|
Non-current assets |
|
|
|
|
|
|
|
|
|
Property, plant and equipment, net |
| 14,232 |
| 12,091 |
| 2,141 |
| See Capital expenditures in Section 7.3 Cash used by investing activities and Depreciation in Section 5.3 Consolidated operations |
|
Intangible assets, net |
| 12,812 |
| 10,934 |
| 1,878 |
| See Capital expenditures in Section 7.3 Cash used by investing activities and Amortization of intangible assets in Section 5.3 Consolidated operations |
|
Goodwill, net |
| 5,331 |
| 4,747 |
| 584 |
| Acquisitions including ADT Security Services Canada, Inc. See Note 18 of the Consolidated financial statements. |
|
Contract assets |
| 328 |
| 458 |
| (130 | ) | A decrease primarily driven by the introduction of our TELUS Easy Payment device financing program |
|
Other long-term assets |
| 919 |
| 986 |
| (67 | ) | A decrease in pension and post-retirement assets resulting from actuarial losses in pension plans, partly offset by an increase in unbilled customer finance receivables and an increase in portfolio investments. See Note 20 of the Consolidated financial statements. |
|
Non-current liabilities |
|
|
|
|
|
|
|
|
|
Provisions |
| 590 |
| 728 |
| (138 | ) | A decrease due to a written put provision reclassified to current liabilities, partly offset by an increase in asset retirement obligations arising from a decrease in discount rates and from the implementation of IFRS 16 |
|
Long-term debt |
| 17,142 |
| 13,265 |
| 3,877 |
| See Section 7.4 Cash provided (used) by financing activities |
|
Other long-term liabilities |
| 806 |
| 731 |
| 75 |
| An increase in pension and post-retirement liabilities resulting from actuarial losses arising from a decrease in the discount rate partly offset by actual returns being in excess of the discount rate. A decrease as a result of a change in balance sheet presentation of non-executory tenant inducement allowances due to IFRS 16 implementation as well as a decrease in the accrual for share-based compensation. See Note 27 of the Consolidated financial statements |
|
Deferred income taxes |
| 3,204 |
| 3,148 |
| 56 |
| An overall increase in temporary differences between the accounting and tax basis of assets and liabilities, partially offset by the revaluation for the lower Alberta corporate income tax rate. |
|
Owners’ equity |
|
|
|
|
|
|
|
|
|
Common equity |
| 10,548 |
| 10,259 |
| 289 |
| See Consolidated statements of changes in owners’ equity in the Consolidated financial statements |
|
Non-controlling interests |
| 111 |
| 82 |
| 29 |
| See Consolidated statements of changes in owners’ equity in the Consolidated financial statements. |
|
7. Liquidity and capital resources
This section contains forward-looking statements, including those with respect to our dividend payout ratio and net debt to EBITDA — excluding restructuring and other costs ratio. See Caution regarding forward-looking statements at the beginning of this MD&A.
7.1 Overview
Our capital structure financial policies and financing and capital structure management plans are described in Section 4.3.
Cash flows
Years ended December 31 ($ millions) |
| 2019 |
| 2018 |
| Change |
|
Cash provided by operating activities |
| 3,927 |
| 4,058 |
| (131 | ) |
Cash used by investing activities |
| (5,044 | ) | (2,977 | ) | (2,067 | ) |
Cash provided (used) by financing activities |
| 1,238 |
| (1,176 | ) | 2,414 |
|
Increase (decrease) in Cash and temporary investments, net |
| 121 |
| (95 | ) | 216 |
|
Cash and temporary investments, net, beginning of period |
| 414 |
| 509 |
| (95 | ) |
Cash and temporary investments, net, end of period |
| 535 |
| 414 |
| 121 |
|
![]()
7.2 Cash provided by operating activities
Analysis of changes in cash provided by operating activities
Years ended December 31 ($ millions) |
| 2019 |
| 2018 |
| Change |
|
EBITDA1 (see Section 5.4 and Section 5.5) |
| 5,554 |
| 5,104 |
| 450 |
|
Restructuring and other costs, net of disbursements2 |
| (36 | ) | 178 |
| (214 | ) |
Employee defined benefit plans expense, net of employer contributions |
| 37 |
| 42 |
| (5 | ) |
Share-based compensation expense, net of payments |
| (2 | ) | 16 |
| (18 | ) |
Interest paid, net of interest received |
| (707 | ) | (599 | ) | (108 | ) |
Income taxes paid, net of recoveries received |
| (644 | ) | (197 | ) | (447 | ) |
Other operating working capital changes |
| (275 | ) | (486 | ) | (211 | ) |
Cash provided by operating activities |
| 3,927 |
| 4,058 |
| (131 | ) |
(1) See description under EBITDA in Section 11.1 Non-GAAP and other financial measures.
(2) Includes Shares settled from Treasury of $100 million in 2018 related to the non-recurring donation to the TELUS Friendly Future Foundation in the third quarter of 2018.
· Restructuring and other costs, net of disbursements, represented a net change of $214 million in 2019. This was largely attributable to the non-recurring donation to the TELUS Friendly Future Foundation in the third quarter of 2018, in addition to higher restructuring and other costs disbursements net of expense and Shares settled from Treasury, related to improving our overall cost structure and operational effectiveness.
· Interest paid, net of interest received, increased by $108 million in 2019, largely due to interest paid on lease liabilities, and an increase in the average long-term debt balance, which was partly offset by a lower weighted-average interest rate on long-term debt.
· Income taxes paid, net of recoveries received, increased by $447 million in 2019, primarily due to a higher final income tax payment of $270 million in the first quarter of 2019 for the 2018 income tax year, and higher required instalment payments.
· For a discussion of Other operating working capital changes, see Section 6 Changes in financial position and Note 31(a) of the Consolidated financial statements.
· Cash provided by operating activities was impacted by the implementation of IFRS 16, as the repayments of lease liabilities, where the principal component of leases that were previously accounted for as operating leases, and previously classified within Cash provided by operating activities, is reflected as Cash used by financing activities under the new accounting standard. These repayments were $236 million in 2019.
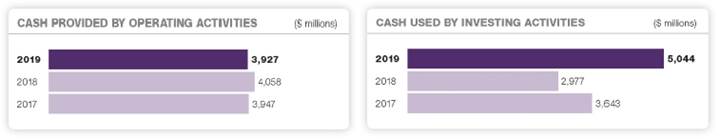
7.3 Cash used by investing activities
Analysis of changes in cash used by investing activities |
|
|
|
|
|
|
|
Years ended December 31 ($ millions) |
| 2019 |
| 2018 |
| Change |
|
Cash payments for capital assets, excluding spectrum licences |
| (2,952 | ) | (2,874 | ) | (78 | ) |
Cash payments for spectrum licences |
| (942 | ) | (1 | ) | (941 | ) |
Cash payments for acquisitions, net |
| (1,105 | ) | (280 | ) | (825 | ) |
Real estate joint ventures (advances, net of receipts) receipts, net of advances |
| (28 | ) | 162 |
| (190 | ) |
Proceeds on dispositions and Other |
| (17 | ) | 16 |
| (33 | ) |
Cash used by investing activities |
| (5,044 | ) | (2,977 | ) | (2,067 | ) |
· The increase in Cash payments for capital assets, excluding spectrum licences for 2019 was primarily composed of:
· A decrease in capital expenditures of $8 million in 2019 (see Capital expenditure measures table and discussion below).
· Higher capital expenditure payments with respect to payment timing differences, as the change in associated Accounts payable and accrued liabilities decreased by $78 million in 2019.
![]()
· Cash payments for spectrum licences in 2019 includes $931 million for the 600 MHz spectrum purchased in the 2019 wireless spectrum auction, as noted in Section 1.3.
· In 2019, we made cash payments for business acquisitions that include a telecommunications business, a smart data solutions business, ADT Security Services Canada, Inc. (ADT Canada) and other individually immaterial acquisitions complementary to our existing lines of business. This is compared to business acquisition activity in 2018 that included Medisys Health Group Inc., certain assets of AlarmForce Industries Inc., Xavient Information Systems and other individually immaterial acquisitions complementary to our existing lines of business.
· Real estate joint ventures receipts, net of advances decreased by $190 million in 2019, primarily attributable to the 2018 earnings distributed from the TELUS Garden real estate joint venture arising from the sale of TELUS Garden.
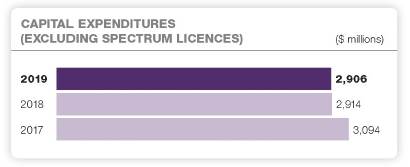
Capital expenditure measures
Years ended December 31 ($ millions, except capital intensity) |
| 2019 |
| 2018 |
| Change |
|
Capital expenditures1 |
|
|
|
|
|
|
|
Wireless segment |
| 889 |
| 896 |
| (0.8 | )% |
Wireline segment |
| 2,017 |
| 2,018 |
| — | % |
Consolidated |
| 2,906 |
| 2,914 |
| (0.3 | )% |
Wireless segment capital intensity (%) |
| 11 |
| 11 |
| — | pts. |
Wireline segment capital intensity (%) |
| 30 |
| 31 |
| (1 | )pts. |
Consolidated capital intensity2 (%) |
| 20 |
| 20 |
| — | pts. |
(1) Capital expenditures include assets purchased, excluding right-of-use lease assets, but not yet paid for, and therefore differ from Cash payments for capital assets, excluding spectrum licences, as reported in the Consolidated statements of cash flows. Refer to Note 31 of the Consolidated financial statements for further information.
(2) See Section 11.1 Non-GAAP and other financial measures.
Consolidated capital expenditures decreased by $8 million in 2019 primarily due to the timing of our fibre build activities, partially offset by increased investments related to 5G that began in the fourth quarter of 2018 and expenditures related to business acquisitions. In 2019, we reduced our incremental investments in 4G technology, as our 5G investments were expanding. Additionally, we made investments in systems development to support our TELUS Easy Payment and Peace of Mind rate plan offerings. With our ongoing investments, we are advancing wireless speeds and coverage, including pre-positioning for 5G, continuing to connect additional homes and businesses directly to our fibre-optic technology, and supporting systems reliability and operational efficiency and effectiveness efforts. These investments also support our internet and TV subscriber growth, address our customers’ demand for faster internet speeds, and extend the reach and functionality of our business and healthcare solutions. By December 31, 2019, we had made TELUS PureFibre available to approximately 70% of our broadband footprint.
7.4 Cash provided (used) by financing activities
Analysis of changes in cash provided (used) by financing activities
Years ended December 31 ($ millions) |
| 2019 |
| 2018 |
| Change |
|
Dividends paid to holders of Common Shares |
| (1,149 | ) | (1,141 | ) | (8 | ) |
Treasury shares acquired |
| — |
| (100 | ) | 100 |
|
Issue (repayment) of short-term borrowings, net |
| (1 | ) | (67 | ) | 66 |
|
Long-term debt issued, net of redemptions and repayment |
| 2,444 |
| 123 |
| 2,321 |
|
Shares of subsidiary (purchased from) issued to non-controlling interests |
| (9 | ) | 24 |
| (33 | ) |
Other |
| (47 | ) | (15 | ) | (32 | ) |
Cash provided (used) provided by financing activities |
| 1,238 |
| (1,176 | ) | 2,414 |
|
![]()
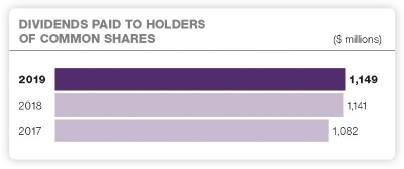
Dividends paid to holders of Common Shares
Cash dividends paid to the holders of Common Shares increased by $8 million in 2019, which reflects higher dividend rates under our dividend growth program (see Section 4.3) and an increase in the number of shares outstanding. Our dividend reinvestment and share purchase (DRISP) plan trustee acquired shares from Treasury for the DRISP plan, rather than acquiring Common Shares in the stock market. Effective with the dividends paid on October 1, 2019, we offered Common Shares from Treasury at a discount of 2%. During 2019, our DRISP plan trustee acquired Common Shares for $183 million.
In January 2020, we paid dividends of $221 million to the holders of Common Shares and the trustee acquired dividend reinvestment Common Shares from Treasury for $131 million, totalling $352 million.
Treasury shares acquired
In 2018, our initial donation of $100 million to the TELUS Friendly Future Foundation was made in TELUS Common Shares acquired in the market.
Issue (repayment) of short-term borrowings, net
In connection with our third quarter 2018 acquisition of Medisys Health Group Inc., we repaid short-term borrowings of $62 million.
Long-term debt issues and repayments
In 2019, long-term debt issues, net of repayments, were $2,444 million, a change of $2,321 million, compared to long-term debt issues, net of repayments, of $123 million in 2018, primarily composed of:
· A net increase in commercial paper outstanding, including foreign exchange effects, of $241 million to a balance of $1,015 million (US$781 million) at December 31, 2019, from a balance of $774 million (US$569 million) at December 31, 2018. Our commercial paper program, when utilized, provides low-cost funds and is fully backstopped by the five-year committed credit facility (see Section 7.6 Credit facilities).
· An increase in net draws on the TELUS International (Cda) Inc. credit facility, including foreign exchange effects, of $12 million. As at December 31, 2019, net draws were US$336 million, whereas as at December 31, 2018, net draws were US$313 million. The credit facility is non-recourse to TELUS Corporation. In connection with the acquisition of Competence Call Center (CCC) subsequent to December 31, 2019, as described in Section 1.3, incremental amounts of $1,036 million (US$798 million) were drawn, in U.S. dollars, on the facility.
· The April 3, 2019, issue of $1.0 billion of senior unsecured 3.30% Notes, Series CY, due May 2, 2029. The net proceeds from this offering were used to repay outstanding indebtedness, including outstanding commercial paper, for the reduction of cash amounts outstanding under an arm’s-length securitization trust, and for general corporate purposes.
· The May 28, 2019, issue of US$500 million of senior unsecured 4.30% Notes, due June 15, 2049. The net proceeds from this offering were used to repay outstanding indebtedness, including outstanding commercial paper, to redeem $650 million of the $1.0 billion aggregate principal amount on our 5.05% Notes, Series CH, due July 23, 2020, and for general corporate purposes. We have fully hedged the principal and interest obligations of the notes by entering into a foreign exchange derivative (a cross currency interest rate exchange agreement), which effectively converted the principal payments and interest obligations to Canadian dollar obligations with a fixed interest rate of 4.27% and an issued and outstanding amount of $672 million (reflecting a fixed exchange rate of $1.3435).
· The July 2, 2019, issue of $800 million of senior unsecured 2.75% Notes, Series CZ, due July 8, 2026. The net proceeds from this offering were used to redeem the remaining $350 million of our 5.05% Notes, Series CH, to repay outstanding indebtedness, including outstanding commercial paper, and for general corporate purposes.
· The December 16, 2019, issues of $600 million of senior unsecured 3.15% Notes, Series CAA, due February 19, 2030, and $400 million of senior unsecured 3.95% Notes, Series CAB, due February 16, 2050. The net
![]()
proceeds of this offering were used to repay outstanding indebtedness, to finance the acquisition of ADT Canada, to fund capital expenditures, and for general corporate purposes.
· The early full redemption of $1 billion of 5.05% Notes, Series CH, due July 23, 2020. The long-term debt prepayment premium was $28 million before income taxes.
In comparison, in 2018, long-term debt issues net of repayments were $123 million and were primarily composed of:
· A net decrease in commercial paper outstanding, including foreign exchange effects, of $366 million from a balance of $1,140 million (US$908 million) at December 31, 2017.
· An increase in net draws on the TELUS International (Cda) Inc. credit facility, including foreign exchange effects, of $80 million. As at December 31, 2018, net draws were US$313 million, whereas as at December 31, 2017, net draws were US$276 million.
· The March 1, 2018, issues of $600 million of senior unsecured 3.625% Notes, Series CX, due March 1, 2028, and $150 million through the re-opening of 4.70% Notes, Series CW, due March 6, 2048.
· �� The June 2018 issue of US$750 million of senior unsecured 4.60% Notes, due November 16, 2048.
· The March 2018 repayment of $250 million of Series CS notes.
· The August 1, 2018, early full redemption of $1 billion of 5.05% Notes, Series CG, due December 4, 2019. The long-term debt prepayment premium was $34 million before income taxes.
The average term to maturity of our long-term debt (excluding commercial paper, the revolving component of the TELUS International (Cda) Inc. credit facility, lease liabilities and other long-term debt) was approximately 12.8 years as at December 31, 2019, increasing from approximately 12.2 years as at December 31, 2018. Additionally, the weighted average cost of our long-term debt (excluding commercial paper, the revolving component of the TELUS International (Cda) Inc. credit facility, lease liabilities and other long-term debt) was 3.94% as at December 31, 2019, a decrease from 4.18% as at December 31, 2018.

Shares of subsidiary (purchased from) issued to non-controlling interests
In 2019, our TELUS International (Cda) Inc. subsidiary purchased shares from a non-controlling interest related to the acquisition of the remaining 45% interest of Voxpro Limited. In the comparative period, in connection with our first quarter 2018 acquisition of 65% of Xavient, our TELUS International (Cda) Inc. subsidiary issued shares to non-controlling interests.
7.5 Liquidity and capital resource measures
Net debt was $18.2 billion at December 31, 2019, an increase of $4.4 billion compared to one year earlier, resulting mainly from the recognition of lease liabilities of $1.7 billion upon the application of IFRS 16, the issuances of the $1.0 billion of Series CY notes, US$500 million of senior unsecured 4.30% Notes, $800 million of Series CZ notes, $600 million of Series CAA notes and $400 million of Series CAB notes, as described in Section 7.4, and an increase in commercial paper. These factors were partially offset by the early redemption of Series CH notes, as described in Section 7.4, and higher Cash and temporary investments.
Fixed-rate debt as a proportion of total indebtedness excludes lease liabilities and was 92% as at December 31, 2019, up from 91% one year earlier, mainly due to the issuances of Series CY notes, US$500 million notes, Series CZ notes, Series CAA notes and Series CAB notes, partly offset by the early redemption of Series CH notes, all as described in Section 7.4. In addition, there was an increase in the amounts drawn on the TELUS International (Cda) Inc. credit facility, which is non-recourse to TELUS Corporation, and a net increase in commercial paper outstanding, which emulates floating-rate debt.
![]()
Net debt to EBITDA — excluding restructuring and other costs ratio was 3.20 times, as measured at December 31, 2019, up from 2.54 times one year earlier, largely attributable to the recognition of lease liabilities of $1.7 billion upon the application of IFRS 16, as we did not retrospectively adjust amounts reported for periods prior to fiscal 2019 (see Note 2(a) of the Consolidated financial statements). Our long-term objective for this measure is within a range of 2.20 to 2.70 times, reflecting a 0.20 shift in the range subsequent to December 31, 2019, to reflect an accommodation for the effects of implementing IFRS 16, which we believe is consistent with maintaining investment grade credit ratings in the range of BBB+, or the equivalent, and providing reasonable access to capital. As at December 31, 2019, this ratio remains outside of the long-term objective range due to prior issuances of incremental debt, primarily due to the acquisition of spectrum licences and business acquisitions, partially offset by growth in EBITDA — excluding restructuring and other costs. As at December 31, 2019, the acquisition of spectrum licences increased the ratio by approximately 0.22; business acquisitions over the last 12 months increased the ratio by approximately 0.18; and the implementation of IFRS 16 had the effect of increasing the ratio by approximately 0.14. Our acquired spectrum licences have more than doubled our national spectrum holdings and represent an investment to extend our network capacity to support continuing data consumption growth, as well as growth in our wireless subscriber base. Given the cash demands of the 2019 and upcoming spectrum auctions, the assessment of the guideline and return to the objective range remains to be determined; however, it is our intent to return to a ratio below 2.70 times in the medium term (following upcoming spectrum auctions), consistent with our long-term strategy. While this ratio exceeds our long-term objective range, we are well in compliance with the leverage ratio covenant in our credit facilities, which states that we may not permit our net debt to operating cash flow ratio to exceed 4.00 to 1.00 (see Section 7.6 Credit facilities).
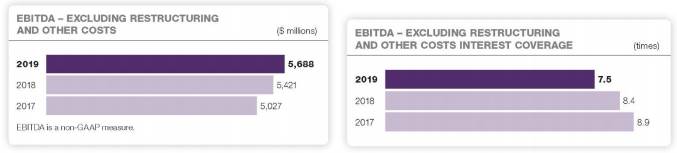
Liquidity and capital resource measures
As at, or years ended, December 31 |
| 2019 |
| 2018 |
| Change |
|
Components of debt and coverage ratios1 ($ millions) |
|
|
|
|
|
|
|
Net debt |
| 18,199 |
| 13,770 |
| 4,429 |
|
EBITDA — excluding restructuring and other costs |
| 5,688 |
| 5,421 |
| 267 |
|
Net interest cost |
| 755 |
| 644 |
| 111 |
|
Debt ratios |
|
|
|
|
|
|
|
Fixed-rate debt as a proportion of total indebtedness (excluding lease liabilities) (%) |
| 92 |
| 91 |
| 1 | pts. |
Average term to maturity of long-term debt (excluding commercial paper, the revolving component of the TELUS International (Cda) Inc. credit facility, lease liabilities and other long-term debt) (years) |
| 12.8 |
| 12.2 |
| 0.6 |
|
Weighted average interest rate on long-term debt (excluding commercial paper, the revolving component of the TELUS International (Cda) Inc. credit facility, lease liabilities and other long-term debt) (%) |
| 3.94 |
| 4.18 |
| (0.24 | )pts. |
Net debt to EBITDA — excluding restructuring and other costs1 (times) |
| 3.20 |
| 2.54 |
| 0.66 |
|
Coverage ratios1 (times) |
|
|
|
|
|
|
|
Earnings coverage |
| 4.0 |
| 4.4 |
| (0.4 | ) |
EBITDA — excluding restructuring and other costs interest coverage |
| 7.5 |
| 8.4 |
| (0.9 | ) |
Other measures1 (%) |
|
|
|
|
|
|
|
Dividend payout ratio |
| 78 |
| 78 |
| — | pts. |
Dividend payout ratio of adjusted net earnings |
| 84 |
| 81 |
| 3 | pts. |
(1) See Section 11.1 Non-GAAP and other financial measures.
Earnings coverage ratio for 2019 was 4.0 times, down from 4.4 times one year earlier. An increase in income before borrowing costs and income taxes increased the ratio by 0.2, while an increase in borrowing costs, including the recognition of interest on lease liabilities upon the application of IFRS 16, reduced the ratio by 0.6.
![]()
EBITDA — excluding restructuring and other costs interest coverage ratio for 2019 was 7.5 times, down from 8.4 times one year earlier. Growth in EBITDA — excluding restructuring and other costs increased the ratio by 0.4, while an increase in net interest costs, including the recognition of interest on lease liabilities upon the application of IFRS 16, reduced the ratio by 1.3.
Dividend payout ratios: Actual dividend payout decisions will continue to be subject to our Board’s assessment and the determination of our financial position and outlook, as well as our dividend payout objective range of 65 to 75% of prospective net earnings per share for 2019. The disclosed basic and adjusted dividend payout ratios are historical measures utilizing the last four quarters of dividends declared and earnings per share. So as to be consistent with the way we manage our business, we have revised our target guideline, effective January 1, 2020, to be calculated as 60 to 75% of free cash flow on a prospective basis. The historical measures for the 12-month period ended December 31, 2019, are presented for illustrative purposes in evaluating our target guideline, and both exceeded the objective range.
7.6 Credit facilities
At December 31, 2019, we had approximately $1.2 billion of available liquidity from the TELUS revolving credit facility and approximately $157 million of available liquidity from the TELUS International (Cda) Inc. credit facility. In addition, we had $400 million available under our trade receivables securitization program (see Section 7.7 Sale of trade receivables). We are well within our objective of generally maintaining at least $1.0 billion of available liquidity.
TELUS revolving credit facility
We have a $2.25 billion (or U.S. dollar equivalent) unsecured revolving credit facility with a syndicate of financial institutions, expiring May 31, 2023. The revolving credit facility is used for general corporate purposes, including the backstop of commercial paper, as required.
TELUS revolving credit facility at December 31, 2019
($ millions) |
| Expiry |
| Size |
| Drawn |
| Outstanding undrawn letters of credit |
| Backstop for commercial paper program |
| Available liquidity |
|
Revolving credit facility 1 |
| May 31, 2023 |
| 2,250 |
| — |
| — |
| (1,015 | ) | 1,235 |
|
(1) Canadian dollars or U.S. dollar equivalent.
Our revolving credit facility contains customary covenants, including a requirement that we not permit our consolidated leverage ratio to exceed 4.00 to 1.00 and that we not permit our consolidated coverage ratio to be less than 2.00 to 1.00 at the end of any financial quarter. As at December 31, 2019, our consolidated leverage ratio was approximately 3.20 to 1.00 and our consolidated coverage ratio was approximately 7.53 to 1.00. These ratios are expected to remain well within the covenants. There are certain minor differences in the calculation of the leverage ratio and coverage ratio under the revolving credit facility, as compared with the calculation of Net debt to EBITDA — excluding restructuring and other costs and EBITDA — excluding restructuring and other costs interest coverage. Historically, the calculations have not been materially different. The covenants are not impacted by revaluation, if any, of Property, plant and equipment, Intangible assets or Goodwill for accounting purposes. Continued access to our credit facilities is not contingent on maintaining a specific credit rating.
Commercial paper
TELUS Corporation has an unsecured commercial paper program, which is backstopped by our revolving credit facility, enabling us to issue commercial paper up to a maximum aggregate amount at any one time of $1.4 billion as at December 31, 2019. Foreign currency forward contracts are used to manage currency risk arising from issuing commercial paper denominated in U.S. dollars. The commercial paper program is to be used for general corporate purposes, including, but not limited to, capital expenditures and investments. Our ability to reasonably access the commercial paper market in the U.S. is dependent on our credit ratings (see Section 7.8 Credit ratings).
TELUS International (Cda) Inc. credit facility
As at December 31, 2019, TELUS International (Cda) Inc. had a bank credit facility, secured by its assets, expiring on December 20, 2022, with a syndicate of financial institutions. The credit facility is composed of a US$350 million revolving component and an amortizing US$120 million term loan component. The credit facility is non-recourse to TELUS Corporation. The outstanding revolving component had a weighted average interest rate of 3.25% as at December 31, 2019.
Subsequent to December 31, 2019, the bank credit facility was amended, with an expiry date of January 28, 2025, the revolving and amortizing term loan components were each increased to US$600 million and TELUS Corporation (as 12.5% lender) joined the lending syndicate.
![]()
Other letter of credit facilities
At December 31, 2019, we had $184 million of letters of credit outstanding, issued under various uncommitted facilities; such letter of credit facilities are in addition to the ability to provide letters of credit pursuant to our committed bank credit facility. Available liquidity under various uncommitted letters of credit facilities was $131 million at December 31, 2019. We had arranged $880 million of incremental letters of credit to allow us to participate in the Innovation, Science and Economic Development Canada 600 MHz wireless spectrum auction that was held from March to April 2019, as discussed further in Note 18(a) of the Consolidated financial statements. Concurrent with funding the purchase of the spectrum licences, these incremental letters of credit were extinguished.
Other long-term debt
Other long-term debt liabilities bear interest at 3.29%, are secured by the associated AWS-4 spectrum licences, and are subject to an amortization schedule that results in the principal being repaid over the period to maturity, March 31, 2035.
Other short-term borrowings
At December 31, 2019, TELUS Corporation has received a commitment letter for a $750 million unsecured, single-drawdown, non-revolving credit facility, maturing one year from the completion of documentation, which is to be used for general corporate purposes. The facility will be available upon completion of documentation and satisfaction of conditions precedent; once available, we will have 30 days to draw upon the facility, after which time the undrawn committed amount will be cancelled. As at February 13, 2020, documentation had not been completed. The credit facility will bear interest at prime rate or bankers’ acceptance rate (as such terms are used or defined in the credit facility), plus applicable margins; representations, warranties and covenants generally will not differ from those of the existing TELUS revolving credit facility.
7.7 Sale of trade receivables
TELUS Communications Inc., a wholly owned subsidiary of TELUS, is a party to an agreement with an arm’s-length securitization trust associated with a major Schedule I Canadian bank, under which it is able to sell an interest in certain trade receivables for an amount up to a maximum of $500 million. The agreement is in effect until December 31, 2021, and available liquidity was $400 million as at December 31, 2019. (See Note 22 of the Consolidated financial statements.) Sales of trade receivables in securitization transactions are recognized as collateralized Short-term borrowings and thus do not result in our de-recognition of the trade receivables sold.
TELUS Communications Inc. is required to maintain a credit rating of at least a BB by DBRS Ltd. or the securitization trust may require the sale program to be wound down prior to the end of the term. The minimum credit rating was exceeded as of February 13, 2020.
7.8 Credit ratings
There were no changes to our investment grade credit ratings during 2019, or as of February 13, 2020. We believe adherence to most of our stated financial policies (see Section 4.3), coupled with our efforts to maintain a constructive relationship with banks, investors and credit rating agencies, continue to provide reasonable access to capital markets. (See discussion of risks in Section 10.13 Financing, debt and dividends.)
7.9 Financial instruments, commitments and contingent liabilities
Financial instruments
Our financial instruments, their accounting classification and the nature of certain risks that they may be subject to are described in Note 4 of the Consolidated financial statements. Our policies in respect of the recognition and measurement of financial instruments are described in Note 1(c) of the Consolidated financial statements.
![]()
|
|
|
| Risks |
| ||||||||
|
| Accounting |
|
|
|
|
| Market risks |
| ||||
Financial instrument |
| classification |
| Credit |
| Liquidity |
| Currency |
| Interest rate |
| Other price |
|
Measured at amortized cost |
|
|
|
|
|
|
|
|
|
|
|
|
|
Accounts receivable |
| AC1 |
| X |
|
|
| X |
|
|
|
|
|
Contract assets |
| AC1 |
| X |
|
|
|
|
|
|
|
|
|
Construction credit facilities advances to real estate joint venture |
| AC1 |
|
|
|
|
|
|
| X |
|
|
|
Short-term borrowings |
| AC1 |
|
|
| X |
| X |
| X |
|
|
|
Accounts payable |
| AC1 |
|
|
| X |
| X |
|
|
|
|
|
Provisions (including restructuring accounts payable) |
| AC1 |
|
|
| X |
| X |
|
|
| X |
|
Long-term debt |
| AC1 |
|
|
| X |
| X |
| X |
|
|
|
Measured at fair value |
|
|
|
|
|
|
|
|
|
|
|
|
|
Cash and temporary investments |
| FVTPL2 |
| X |
|
|
| X |
| X |
|
|
|
Long-term investments (not subject to significant influence)3 |
| FVTPL/FVOCI3 |
|
|
|
|
| X |
|
|
| X |
|
Foreign exchange derivatives4 |
| FVTPL2 |
| X |
| X |
| X |
|
|
|
|
|
Share-based compensation derivatives4 |
| FVTPL2 |
| X |
| X |
|
|
|
|
| X |
|
(1) For accounting recognition and measurement purposes, classified as amortized cost (AC).
(2) For accounting recognition and measurement purposes, classified as fair value through net income (FVTPL). Unrealized changes in the fair values of financial instruments are included in net income unless part of a cash flow hedging relationship. The effective portions of unrealized changes in the fair values of financial instruments held for hedging are included in other comprehensive income.
(3) Long-term investments over which we do not have significant influence are measured at fair value if those fair values can be reliably measured. For accounting recognition and measurement purposes, on an investment-by-investment basis, long-term investments are classified as either fair value through net income or fair value through other comprehensive income (FVOCI).
(4) Use of derivative financial instruments is subject to a policy which requires that no derivative transaction is to be entered into for the purpose of establishing a speculative or leveraged position (the corollary being that all derivative transactions are to be entered into for risk management purposes only) and sets criteria for the creditworthiness of the transaction counterparties.
Derivatives that are part of an established and documented cash flow hedging relationship are accounted for as held for hedging. We believe that classification as held for hedging results in a better matching of the change in the fair value of the derivative financial instrument with the risk exposure being hedged.
In respect of hedges of anticipated transactions, hedge gains/losses are included with the expenditure and are expensed when the transaction is recognized in our results of operations. We have selected this method as we believe that it results in a better matching of the hedge gains/losses with the risk exposure being hedged.
Derivatives that are not part of a documented cash flow hedging relationship are accounted for as held for trading and thus are measured at fair value through net income.
Refer to Note 4 of the Consolidated financial statements for further information regarding our financial instruments.
![]()
Commitments and contingent liabilities
Contractual obligations as at December 31, 2019
($ millions) |
| 2020 |
| 2021 |
| 2022 |
| 2023 |
| 2024 |
| 2025 - |
| Thereafter |
| Total |
|
Short-term borrowings |
|
|
|
|
|
|
|
|
|
|
|
|
|
|
|
|
|
Interest obligations |
| 3 |
| 3 |
| — |
| — |
| — |
| — |
| — |
| 6 |
|
Principal obligations1 |
| — |
| 100 |
| — |
| — |
| — |
| — |
| — |
| 100 |
|
|
| 3 |
| 103 |
| — |
| — |
| — |
| — |
| — |
| 106 |
|
Long-term debt |
|
|
|
|
|
|
|
|
|
|
|
|
|
|
|
|
|
Interest obligations |
| 622 |
| 602 |
| 552 |
| 507 |
| 480 |
| 1,796 |
| 4,090 |
| 8,649 |
|
Principal maturities |
| 1,035 |
| 1,096 |
| 1,683 |
| 514 |
| 1,115 |
| 5,515 |
| 6,012 |
| 16,970 |
|
|
| 1,657 |
| 1,698 |
| 2,235 |
| 1,021 |
| 1,595 |
| 7,311 |
| 10,102 |
| 25,619 |
|
Leases |
|
|
|
|
|
|
|
|
|
|
|
|
|
|
|
|
|
Interest obligations |
| 69 |
| 55 |
| 45 |
| 39 |
| 32 |
| 107 |
| 102 |
| 449 |
|
Principal maturities |
| 304 |
| 283 |
| 162 |
| 150 |
| 125 |
| 322 |
| 286 |
| 1,632 |
|
|
| 373 |
| 338 |
| 207 |
| 189 |
| 157 |
| 429 |
| 388 |
| 2,081 |
|
Construction credit facilities commitment2 |
| 10 |
| — |
| — |
| — |
| — |
| — |
| — |
| 10 |
|
Occupancy costs2 |
| 127 |
| 119 |
| 105 |
| 103 |
| 90 |
| 226 |
| 105 |
| 875 |
|
Purchase obligations3 |
|
|
|
|
|
|
|
|
|
|
|
|
|
|
|
|
|
Operating expenditures |
| 1,232 |
| 1,218 |
| 357 |
| 82 |
| 83 |
| 186 |
| 193 |
| 3,351 |
|
Property, plant and equipment, and Intangible assets |
| 157 |
| 10 |
| 5 |
| 4 |
| 5 |
| — |
| — |
| 181 |
|
|
| 1,389 |
| 1,228 |
| 362 |
| 86 |
| 88 |
| 186 |
| 193 |
| 3,532 |
|
Non-interest bearing financial liabilities |
| 2,639 |
| 43 |
| 7 |
| 5 |
| 5 |
| 4 |
| — |
| 2,703 |
|
Other obligations |
| 31 |
| (1 | ) | 7 |
| (1 | ) | (1 | ) | 25 |
| 1 |
| 61 |
|
Total |
| 6,229 |
| 3,528 |
| 2,923 |
| 1,403 |
| 1,934 |
| 8,181 |
| 10,789 |
| 34,987 |
|
(1) See Section 7.7 Sale of trade receivables.
(2) Construction credit facilities reflect loan amounts for a real estate joint venture, a related party, and occupancy costs include transactions with real estate joint ventures. See Section 7.11 Transactions between related parties.
(3) Where applicable, purchase obligations reflect foreign exchange rates at December 31, 2019. Purchase obligations include future operating and capital expenditures that have been contracted for at the current year-end and include the most likely estimates of prices and volumes, where necessary. As purchase obligations reflect market conditions at the time the obligation was incurred for the items being purchased, they may not be representative of future years. Obligations from personnel supply contracts and other such labour agreements have been excluded.
Claims and lawsuits
A number of claims and lawsuits (including class actions and intellectual property infringement claims) seeking damages and other relief are pending against us and, in some cases, other wireless carriers and telecommunications service providers. As well, we have received notice of, or are aware of, certain possible claims (including intellectual property infringement claims) against us and, in some cases, other wireless carriers and telecommunications service providers. (See the related risk discussion in Section 10.16 Litigation and legal matters.)
It is not currently possible for us to predict the outcome of such claims, possible claims and lawsuits due to various factors, including: the preliminary nature of some claims; uncertain damage theories and demands; an incomplete factual record; uncertainty concerning legal theories and procedures and their resolution by the courts, at both the trial and the appeal levels; and the unpredictable nature of opposing parties and their demands.
However, subject to the foregoing limitations, management is of the opinion, based upon legal assessments and information presently available, that it is unlikely that any liability, to the extent not provided for through insurance or otherwise, would have a material effect on our financial position and the results of our operations, including cash flows, with the exception of the items disclosed in Note 29(a) of the Consolidated financial statements. This is a significant judgment for us (see Section 8.1 Critical accounting estimates and judgments).
Indemnification obligations
In the normal course of operations, we provide indemnification in conjunction with certain transactions. The terms of these indemnification obligations range in duration. These indemnifications would require us to compensate the indemnified parties for costs incurred as a result of failure to comply with contractual obligations, or litigation claims or statutory sanctions, or damages that may be suffered by an indemnified party. In some cases, there is no maximum limit on these indemnification obligations. The overall maximum amount of an indemnification obligation will depend on future
![]()
events and conditions and therefore cannot be reasonably estimated. Where appropriate, an indemnification obligation is recorded as a liability. Other than obligations recorded as liabilities at the time of the related transactions, historically we have not made significant payments under these indemnifications.
As at December 31, 2019, we had no liability recorded in respect of our indemnification obligations.
7.10 Outstanding share information
Outstanding shares (millions)1 |
| December 31, 2019 |
| January 31, 2020 |
|
Common Shares |
| 605 |
| 607 |
|
(1) Pre-share split – see Share split – subsequent to 2019 in Section 1.3.
7.11 Transactions between related parties
Transactions with key management personnel
Our key management personnel have authority and responsibility for overseeing, planning, directing and controlling our activities and consist of our Board of Directors and our Executive Leadership Team. Total compensation expense for key management personnel was $53 million in 2019, compared to $64 million in 2018. The decrease in compensation expense for key management personnel was due to greater share-based compensation in 2018 primarily arising from metrics affecting performance condition-based restricted stock units. See Note 30(a) of the Consolidated financial statements for additional details.
Transactions with defined benefit pension plans
We provided management and administrative services to our defined benefit pension plans. Charges for these services were on a cost recovery basis and were immaterial.
Transactions with real estate joint ventures
In 2019, we had transactions with real estate joint ventures, which are related parties to us, as set out in Note 21 of the Consolidated financial statements.
For the TELUS Sky real estate joint venture, commitments and contingent liabilities include construction-related contractual commitments through to 2020 (approximately $37 million at December 31, 2019) and construction financing ($342 million, with three Canadian financial institutions as 66-2/3% lender and TELUS as 33-1/3% lender) under a credit agreement maturing August 31, 2021. We have entered into a lease agreement with the TELUS Sky real estate joint venture; for lease accounting purposes, the lease commenced during the three-month period ended March 31, 2019.
![]()
8. Accounting matters
8.1 Critical accounting estimates and judgments
Our significant accounting policies are described in Note 1 of the Consolidated financial statements for the year ended December 31, 2019. The preparation of financial statements in conformity with generally accepted accounting principles (GAAP) requires management to make estimates, assumptions and judgments that affect: the reported amounts of assets and liabilities at the date of the financial statements; the disclosure of contingent assets and liabilities at the date of the financial statements; and the reported amounts of revenues and expenses during the reporting period. Actual results could differ from those estimates. Our critical accounting estimates and significant judgments are generally discussed with the Audit Committee each quarter.
Refer to Note 1 of the Consolidated financial statements for further information on our critical accounting estimates, including examples of the significant estimates and judgments that we make, and their relative significance and degree of difficulty, as illustrated in the graphic.
General
· In determining our critical accounting estimates, we consider trends, commitments, events or uncertainties that we reasonably expect to materially affect our methodology or assumptions. Our statements in this MD&A regarding such consideration are made subject to the Caution regarding forward-looking statements.
· In the normal course, we make changes to assumptions underlying all critical accounting estimates so that they reflect current economic conditions, updated historical information used to develop the assumptions, and changes in our credit ratings, where applicable. Unless indicated otherwise in the discussion below, we expect that no material changes in overall financial performance and financial statement line items would arise either from reasonably likely changes in material assumptions underlying the estimate or from selection of a different estimate from within a range of valid estimates.
· Our critical accounting estimates affect the Consolidated statements of income and other comprehensive income, and the Consolidated statements of financial position, as follows:
|
| Consolidated statements of income and other comprehensive income | ||||||||||||
|
|
|
| Operating expenses |
|
|
| Employee | ||||||
|
|
|
| Goods and |
| Employee |
|
|
| Amortization |
|
|
| defined benefit |
Consolidated statements |
| Operating |
| services |
| benefits |
|
|
| of intangible |
| Financing |
| plans re- |
of financial position |
| revenues |
| purchased |
| expense |
| Depreciation |
| assets |
| costs |
| measurements1 |
Intangible assets, net, and Goodwill, net |
|
|
|
|
|
|
|
|
| X2 |
|
|
|
|
Employee defined benefit pension plans |
|
|
|
|
| X |
| X3 |
| X3 |
| X |
| X |
Property, plant and equipment, net |
|
|
|
|
|
|
| X |
|
|
|
|
|
|
Provisions for asset retirement obligations |
|
|
| X |
|
|
| X |
|
|
| X |
|
|
Provisions related to business combinations |
| X |
|
|
|
|
|
|
|
|
| X |
|
|
Investments |
| X |
|
|
|
|
|
|
|
|
|
|
|
|
Accounts receivable |
|
|
| X |
|
|
|
|
|
|
|
|
|
|
Contract assets |
| X |
| X |
|
|
|
|
|
|
|
|
|
|
Inventories |
|
|
| X |
|
|
|
|
|
|
|
|
|
|
(1) Other comprehensive income — Item never subsequently reclassified to income.
(2) Accounting estimate, as applicable to Intangible assets with indefinite lives and Goodwill, primarily relates to spectrum holdings and accordingly affects our wireless cash-generating unit.
(3) Accounting estimate impact due to internal labour capitalization rates.
![]()
· All critical accounting estimates are uncertain at the time an estimate is made and affect the following Consolidated statements of income and other comprehensive income line items: Income taxes (except for estimates about Goodwill) and Net income. Similarly, all critical accounting estimates affect the following Consolidated statements of financial position line items: Current assets (Income and other taxes receivable), Current liabilities (Income and other taxes payable), Deferred income taxes and Common equity (retained earnings) and Non-controlling interests. The discussion of each critical accounting estimate does not differ between our two segments, wireless and wireline, unless explicitly noted.
Intangible assets, net; Goodwill, net; and Property, plant and equipment, net
General
· The Intangible assets, net, line item represents approximately 34% of Total assets as at December 31, 2019 (33% as at December 31, 2018). Included in Intangible assets are spectrum licences, which represent approximately 26% of Total assets as at December 31, 2019 and 2018.
· The Goodwill, net, line item represents approximately 14% of Total assets as at December 31, 2019 and approximately 14% of Total assets as at December 31, 2018.
· The Property, plant and equipment, net, line item on our Consolidated statements of financial position represents approximately 37% of Total assets as at December 31, 2019 and 2018.
· If our estimates of the useful lives of assets were incorrect, we could experience increased or decreased charges for amortization or depreciation in the future. If the future were to differ adversely from our best estimate of key economic assumptions and associated cash flows were to materially decrease, we could potentially experience future material impairment charges in respect of our Property, plant and equipment assets, Intangible assets or Goodwill. If Intangible assets with indefinite lives were determined to have finite lives at some point in the future, we could experience increased charges for amortization of Intangible assets. Such charges in and of themselves do not result in a cash outflow and would not immediately affect our liquidity.
The recoverability of Intangible assets with indefinite lives; the recoverability of Goodwill
· The carrying values of Intangible assets with indefinite lives and Goodwill are periodically tested for impairment, and this test represents a significant estimate for us.
· The recoverable amounts of the cash-generating units’ assets have been determined based on a fair value less costs of disposal calculation. There is a material degree of uncertainty with respect to the estimates of the recoverable amounts of the cash-generating units’ assets, given the necessity of making key economic assumptions about the future. The fair value less costs of disposal and value-in-use calculations both use future cash flows and growth projections (including judgments about the allocation of future capital expenditures to support both wireless and wireline operations); associated economic risk assumptions and estimates of the likelihood of achieving key operating metrics and drivers; estimates of future generational infrastructure capital expenditures; and the future weighted average cost of capital.
· See Note 18(f) of the Consolidated financial statements for further discussion of methodology and sensitivity testing.
The estimated useful lives of assets; the recoverability of tangible assets
· The estimated useful lives of assets are determined by a continuing program of asset life studies. The recoverability of assets with finite lives is significantly impacted by the estimated useful lives of assets.
· Assumptions underlying the estimated useful lives of assets include the timing of technological obsolescence, competitive pressures and future infrastructure utilization plans.
![]()
Employee defined benefit pension plans
Certain actuarial and economic assumptions used in determining defined benefit pension costs, accrued pension benefit obligations and pension plan assets
· We review industry practices, trends, economic conditions and data provided by actuaries when developing assumptions used in the determination of defined benefit pension costs and accrued pension benefit obligations. Pension plan assets are generally valued using market prices; however, some assets are valued using market estimates when market prices are not readily available. Actuarial support is obtained for interpolations of experience gains and losses that affect the employee defined benefit plan actuarial gains and losses and accrued pension benefit obligations. The discount rate used to determine the accrued benefit obligation is based upon the yield on long-term, high-quality, fixed-term investments. The discount rate is set annually at the end of each calendar year, based upon yields on long-term corporate bond indices in consultation with actuaries. Future increases in compensation are based upon the current benefits policies and economic forecasts. We have examined our respective pension obligation and current service cost durations and observed an approximate 10-year difference in duration. As individual discount rates more accurately reflect the obligation and current service cost, commencing in 2016, we applied a dual discount rate methodology.
· On an annual basis, at a minimum, the defined benefit pension plan assumptions are assessed and revised as appropriate. Assumptions used in determining defined benefit pension costs, accrued pension benefit obligations and pension plan assets include life expectancy, discount rates, market estimates and rates of future compensation increases. Material changes in overall financial performance and financial statement line items would arise from reasonably likely changes in the material assumptions underlying this estimate, since certain assumptions may have been revised to reflect updated historical information and updated economic conditions. See Note 15 of the Consolidated financial statements for further analysis.
· This accounting estimate related to employee defined benefit pension plans is in respect of components of the Operating expenses line item, Financing costs line item and Other comprehensive income line item on our Consolidated statements of income and other comprehensive income. If the future were to adversely differ from our best estimate of assumptions used in determining defined benefit pension costs, accrued benefit obligations and pension plan assets, we could experience future increased (or decreased) defined benefit pension expense, financing costs and charges to Other comprehensive income.
Income tax assets and liabilities
The amount and composition of income tax assets and income tax liabilities, including the amount of unrecognized tax benefits
· Assumptions underlying the composition of income tax assets and liabilities are based upon an assessment of the technical merits of tax positions. Income tax benefits on uncertain tax positions are recognized only when it is more likely than not that the ultimate determination of the tax treatment of a position will result in the related benefit being realizable; however, this does not mean that tax authorities cannot challenge these positions. Income tax assets and liabilities are measured at the amount that is expected to be realized or incurred upon ultimate settlement with taxation authorities. Such assessments are based upon the applicable income tax legislation, regulations, interpretations and jurisprudence, all of which in turn are subject to change and interpretation.
· Current income tax assets and liabilities are estimated based upon the amount of income tax that is calculated as being owed to taxation authorities, net of periodic instalment payments. Deferred income tax liabilities are composed of the tax effect of temporary differences between the carrying amount and tax basis of assets and liabilities, as well as the income tax effect of undeducted income tax losses. The timing of the reversal of temporary differences is estimated and the income tax rate substantively enacted for the periods of reversal is applied to the temporary differences. The carrying amounts of assets and liabilities are based upon the amounts recorded in the financial statements and are, therefore, subject to accounting estimates that are inherent in those balances. The tax basis of assets and liabilities, as well as the amount of undeducted income tax losses, are based upon the assessment and measurement of tax positions, as noted above. Assumptions as to the timing of reversal of temporary differences include expectations about the future results of operations and future cash flows. The composition of income tax liabilities is reasonably likely to change from period to period because of changes in the estimation of these significant uncertainties.
· This accounting estimate is in respect of material asset and liability line items on our Consolidated statements of financial position comprising less than 1% of Total assets as at December 31, 2019 and 2018, and approximately 9% of Total liabilities and owners’ equity as at December 31, 2019 (2018 — approximately 10%). If the future were to adversely differ from our best estimate of the likelihood of tax positions being sustained, the amount of tax expected to be incurred, the future results of operations, the timing of reversal of deductible temporary differences and taxable temporary differences, and the tax rates applicable to future years, we could experience material current income tax
![]()
adjustments and deferred income tax adjustments. Such current and deferred income tax adjustments could result in an increase or acceleration of cash outflows at an earlier time than might otherwise be expected.
Provisions for asset retirement obligations
Certain economic assumptions used in provisioning for asset retirement obligations
· Asset retirement obligation provisions are recognized for statutory, contractual or legal obligations, normally when incurred, associated with the retirement of Property, plant and equipment (primarily certain items of outside plant and wireless site equipment) when those obligations result from the acquisition, construction, development and/or normal operation of the assets. The obligations are measured initially at fair value, determined using present value methodology, and the resulting costs are capitalized as a part of the carrying value of the related asset.
· On an annual basis, at a minimum, assumptions underlying the provisions for asset retirement obligations include expectations about inflation, discount rates and any changes in the amount or timing of the underlying future cash flows, which may span numerous decades. Material changes in financial position would arise from reasonably likely changes in the material assumptions underlying this estimate, since certain assumptions may have been revised to reflect updated historical information and updated economic conditions. The capitalized asset retirement cost is depreciated on the same basis as the related asset, and the discount accretion is included in the Consolidated statements of income and other comprehensive income as a component of Financing costs.
· This accounting estimate is in respect of the asset retirement obligations component of the Provisions line item on our Consolidated statements of financial position, and this component comprises approximately 1% of Total liabilities and owners’ equity as at December 31, 2019 and 2018. If the provisions for asset retirement obligations were to be inadequate, we could experience a charge to Goods and services purchased in the future. A charge for an inadequate asset retirement obligation provision would result in a cash outflow proximate to the time that the asset retirement obligation is satisfied.
Provisions related to business combinations
Provisions for written put options
· In connection with certain business acquisitions, we have established provisions for written put options in respect of non-controlling interests. We provide written put options to the remaining selling shareholders under which they could put the remaining non-controlling interests at, or after, a specified date. The acquisition-date fair values of the puttable shares held by the non-controlling shareholders are recorded as provisions.
· On an annual basis, at a minimum, the provisions for written put options are assessed and revised as appropriate. The provisions for written put options have been determined based on the net present values of estimated future earnings results; there is a material degree of uncertainty with respect to the estimates of future earnings results, given the necessity of making significant economic assumptions about the future. The amounts of provisions for written put options are reasonably likely to change from period to period because of changes in the estimation of future earnings and foreign exchange rate movements.
· This accounting estimate is in respect of the provisions for written put options related to the non-controlling interests component of the Provisions line item on our Consolidated statements of financial position, and this component comprises approximately 1% of Total liabilities and owners’ equity as at December 31, 2019 and 2018. If the provisions for written put options were to be inadequate, we could experience a charge to Operating revenues in the future. A charge for an inadequate written put option provision would result in a cash outflow proximate to the time that the written put option is exercised.
Investments
The recoverability of long-term investments
· We assess the recoverability of our long-term investments on a regular, recurring basis. The recoverability of investments is assessed on a specific-identification basis, taking into consideration expectations about future performance of the investments and comparison of historical results to past expectations.
· The most significant assumptions underlying the recoverability of long-term investments are related to the achievement of future cash flow and operating expectations. Our estimate of the recoverability of long-term investments could change from period to period due to the recurring nature of the recoverability assessment and due to the nature of long-term investments (we do not control the investees).
· Investments are included in the Other long-term assets line item on our Consolidated statements of financial position, which itself comprises approximately 2% of Total assets as at December 31, 2019 (2018 — 3%). If the allowance for recoverability of long-term investments were to be inadequate, we could experience an increased charge to Other operating income in the future. Such a provision for recoverability of long-term investments does not result in a cash outflow. When there is clear and objective evidence of an increase in the fair value of an investment,
![]()
which may be indicated by either a recent sale of shares by another current investor or the injection of new cash into the entity by a new or current investor, we recognize the after-tax increase in value in Other comprehensive income.
Accounts receivable
General
· When determining our allowance for doubtful accounts, we consider the business area that gave rise to the Accounts receivable, conduct a statistical analysis of portfolio delinquency trends and perform specific account identification.
· These accounting estimates are in respect of the Accounts receivable line item on our Consolidated statements of financial position, which comprises approximately 5% of Total assets as at December 31, 2019 and 2018. If the future were to differ adversely from our best estimates of the fair value of the residual cash flows and the allowance for doubtful accounts, we could experience an increase in doubtful accounts expense in the future. Such doubtful accounts expense in and of itself does not result in a cash outflow.
The allowance for doubtful accounts
· The estimate of our allowance for doubtful accounts could materially change from period to period because the allowance is a function of the balance and composition of Accounts receivable, which can vary on a month-to-month basis. The variability of the balance of Accounts receivable arises from the variability of the amount and composition of Operating revenues and from the variability of Accounts receivable collection performance.
Contract assets
General
· We maintain allowances for lifetime expected credit losses related to contract assets. Current economic conditions, historical information (including credit agency reports, if available), and the line of business from which the contract asset arose are all considered when determining impairment allowances. The same factors are considered when determining whether to write off amounts charged to the impairment allowance for contract assets against contract assets.
The impairment allowance
· These accounting estimates are in respect of the Contract assets line items on our Consolidated statements of financial position, which comprise approximately 3% of Total assets as at December 31, 2019 (2018 — 4%). If the future were to differ adversely from our best estimates of the fair value of the residual cash flows and the impairment allowance for contract assets, we could experience an increase in the impairment allowance for contract assets against contract assets in the future. Such impairment allowance in and of itself does not result in a cash outflow.
Inventories
The allowance for inventory obsolescence
· We determine our allowance for inventory obsolescence based upon expected inventory turnover, inventory aging, and current and future expectations with respect to product offerings.
· Assumptions underlying the allowance for inventory obsolescence include future sales trends and offerings and the expected inventory requirements and inventory composition necessary to support these future offerings. Our estimate of the allowance for inventory obsolescence could change materially from period to period due to changes in product offerings and the level of consumer acceptance of those products.
· This accounting estimate is in respect of the Inventories line item on our Consolidated statements of financial position, which comprises approximately 1% of Total assets as at December 31, 2019 and 2018. If the allowance for inventory obsolescence were to be inadequate, we could experience a charge to Goods and services purchased in the future. Such an inventory obsolescence charge does not result in a cash outflow.
8.2 Accounting policy developments
Refer to Note 2 of the Consolidated financial statements for a description of current and future changes in accounting policies, including:
· Initial application of standards, interpretations and amendments to standards and interpretations in the reporting period.
· Standards, interpretations and amendments to standards not yet effective and not yet applied.
· Impacts of application of new standard in fiscal 2019.
![]()
9. General trends, outlook and assumptions, and regulatory developments and proceedings
This section contains forward-looking statements, which should be read together with the Caution regarding forward-looking statements at the beginning of this MD&A.
9.1 Telecommunications industry in 2019
We estimate that Canadian telecommunications industry revenues (including TV and excluding media) grew by approximately 2% in 2019. Wireless and data services continue to drive ongoing industry growth. Consumer communications and data consumption behaviours continue to demonstrate a strong preference for data-rich applications and data-intensive devices, including smartphones and tablets.
TELUS reported revenues of $14.7 billion, with wireless products and services representing 56% of our total revenues. In our wireline business, growth in high-speed internet access, enhanced data, TV, healthcare, customer care and business services (CCBS) solutions, and home and business security more than offset the decline in demand for legacy voice and data services.
Wireless
Based on publicly reported results and estimates, in 2019, the Canadian wireless industry experienced network revenue growth of approximately 1.6% and adjusted EBITDA growth of approximately 7.7%. TELUS wireless network revenue growth was 1.6%, and TELUS wireless Adjusted EBITDA grew by 7.7%.
We estimate that the Canadian wireless industry added approximately 1.9 million new subscriber units in 2019, inclusive of TELUS’ mobile phone net additions, compared to approximately 1.5 million in 2018. This was supported by immigration and population growth; the trend toward multiple devices, including tablets; the expanding functionality of data and related applications; and the adoption of mobile devices and services by both younger and older generations. Effective for the first quarter of 2019, with retrospective application, we have revised our definition of a mobile phone subscriber (see Section 11.2 Operating indicators for definitions). The wireless penetration rate increased to approximately 92% in Canada in 2019, with further increases in penetration expected in 2020. By comparison, the wireless penetration rate in the U.S. is well over 100%, while in Europe and Asia it is even higher, suggesting an opportunity for continued growth in Canada.
The Canadian wireless market continues to be characterized by high levels of acquisition and retention activities and the associated high costs of device subsidies on two-year contracts, heightened competitive intensity, and the continued adoption of higher-value, data-centric smartphones. Growth in blended average billing per subscriber unit per month (ABPU) has moderated, due to declines in chargeable usage and larger allotments of data driven by competitive pressures, in addition to other moderating factors, such as: the launch of unlimited wireless data plans and the popularity of data sharing plans; more frequent customer-friendly data usage notifications; and an evolving shift in the customer mix towards non-traditional wireless devices. These factors are being offset by continuing robust customer growth and growing overall data usage, including customers selecting plans with larger data buckets on high-value smartphones, and a larger proportion of postpaid customers in the subscriber mix.
While the general trend towards moderation in ABPU growth compared to past years was anticipated, we continue to work diligently to better monetize robust growth in data services, while simultaneously delivering a strong value for money proposition to our customers. To this end, we are focusing intensely on profitable customer growth and strong ABPU performance through our consistent strategic execution of premium smartphone loading, which includes driving higher-value data and share plan adoption. Moreover, we are also focusing on the other levers available to us in an environment of moderating ABPU growth to ensure we continue to deliver on our wireless EBITDA growth objectives, including:
· Evolving our approach to wireless plans and device sales, through the simultaneous launch of our Peace of Mind endless data rate plans, TELUS Easy Payment device financing and TELUS Family Discount offerings, which have resulted in simplification for both customers and team members, while supporting growth in digital transactions
· Continuing to drive volume growth through high-quality loading on the back of strong ongoing industry growth
· Seeking new sources of wireless revenue, such as Internet of Things (IoT) or Internet of Everything, machine-to-machine (M2M) and security applications
· Exploring and securing new channel strategies associated with attractive economic characteristics
· Pursuing smart bundling opportunities across wireless and wireline to achieve better economies of scope and enhance lifetime revenue per customer
· Driving roaming growth by continuing to encourage customers travelling abroad to adopt and use our Easy Roam® offering, which now covers more than 125 countries, as well as securing in-roaming opportunities for those travelling to Canada
![]()
· Working persistently to enhance the efficiency of the flow from revenue to EBITDA, or the flow from ABPU to average margin per subscriber unit per month (AMPU), in order to buttress and enhance our operating margins, including ongoing efficiency and effectiveness initiatives.
The Canadian wireless industry continues to be highly competitive and capital-intensive, with carriers continuing to expand and enhance their broadband wireless networks, including material investments in spectrum.
Wireline
Although the consumer high-speed internet market is maturing, with a penetration rate of approximately 87% in Western Canada and 87% across Canada, subscriber growth is expected to continue over the coming years. The four major cable-TV companies had an estimated 7.0 million internet subscribers at the end of 2019 (49% market share), up 3% from approximately 6.9 million at the end of 2018. Telecommunications companies had approximately 7.0 million internet subscribers (49% market share), up 4% from approximately 6.7 million at the end of 2018. We continue to make moderate gains in market share as a result of the expansion of our fibre-optic infrastructure and the pull-through of subscribers from our IP-based TELUS TV service, as well as significant growth in home security and automation.
While Canadians still watch conventional TV, digital platforms are playing an increasingly important role in the broadcasting industry and in respect of content. Popular online video services are providing Canadians with more choice about where, when and how to access their video content. In 2019, Canadian IP TV providers increased their subscriber base by an estimated 5% to 3.0 million as a result of expanded network coverage, enhanced differentiated service offerings, and marketing and promotions focused on IP TV. Despite this IP TV growth, the combined cable-TV and satellite-TV subscriber penetration rate declined. We estimate that the four major cable-TV companies have approximately 5.3 million TV subscribers or a 49% market share, a decrease from 51% at the end of 2018. The balance of industry subscribers were served by satellite-TV and regional providers.
In recent years, including in 2019, three of the largest Canadian cable-TV companies have launched new TV services based on the Comcast X1 TV platform, including Shaw, Rogers and most recently Quebecor’s Videotron brand. Our IP-based Optik TV platform continues to offer numerous service advantages over this cable platform, including: flexible pricing plans and packaging available to all customers; picture clarity and quality; content depth and breadth; and the number of ways customers can access content, including wireless set-top boxes, Restart TV, higher-capacity PVR and the Optik TV app, which offers more than twice as many live TV channels at home or on the go compared to our cable competitor. Notably, we are the only Canadian TV service provider offering live 4K HDR channels and 4K HDR on-demand movies, including the latest Hollywood blockbusters and the latest movies and series from Netflix, which has named TELUS’ PureFibre network the number one network for streaming Netflix throughout 2019 (based on the Netflix ISP Speed Index rankings for Canadian Providers released monthly), as well as 4K sports content, more HD content, more on-demand content and more over-the-top (OTT) content with Netflix, YouTube, TED Talks and the National Film Board of Canada, and we are the multicultural content leader in Western Canada.
The national Canadian telecom providers continue to acquire and otherwise develop capabilities in home security and automation. In the fourth quarter of 2019, we acquired ADT Security Services Canada, Inc., one of Canada’s leading providers of security and automation solutions for residential and business customers. In 2018, we acquired all of the customers, assets and operations of AlarmForce Industries Inc. in B.C., Alberta and Saskatchewan, as well as other smaller home and business security companies. These acquisitions further our commitment to leverage the power of technology to bring state-of-the-art convenience, control and safety into the lives, homes and businesses of more Canadians, while also providing opportunities to offer attractive bundled solutions and advance our connected home strategy while accelerating our entry into smart home solutions. Our SmartHome Security and TELUS Secure Business service offerings complement our industry-leading customer service and build on our strategy and commitment to leverage our world-leading wireless and PureFibre network, to continue to enhance connected home, business, security, IoT, cybersecurity, smart buildings, smart cities and health services for customers in Canada.
Canada’s four major cable-TV companies had an estimated base of approximately 3.6 million telephony subscribers at the end of 2019. This represents a national consumer market share of approximately 43%, up from approximately 42% in 2018. Other non-facilities-based competitors also offer local and long distance voice over IP (VoIP) services and resell high-speed internet solutions. This competition, along with technological substitution by wireless services, is continuing to erode the number of residential voice subscribers and associated local and long distance revenues, as expected.
9.2 Telecommunications industry general outlook and trends
Wireless
Wireless growth continues to be driven by increasing data usage and adoption, including: higher-value smartphones, unlimited data offerings, shared family data plans and tablets, and growth in IoT and M2M devices. In addition, consumers continue to replace wireline access with wireless access and related data services. These trends are
![]()
expected to continue to drive a growing demand for wireless data services for the foreseeable future. Industry ABPU is expected to continue growing at a more moderate rate than in recent years.
While LTE and LTE advanced (LTE-A) technologies increase download speeds, encourage data usage and improve the customer experience, growth in data traffic poses challenges to wireless access technology. To better manage this data traffic, Canadian providers continue to evolve their networks. Innovation, Science, and Economic Development Canada (ISED) held its 600 MHz spectrum auction in March to April 2019 via a combinatorial clock auction (CCA) format. The design of the CCA, coupled with a 30 MHz set-aside for regional carriers (representing 43% of the spectrum at auction), led to national carriers paying a 134% premium over regional operators, and according to our analysis, the highest prices for 600 MHz in the world. Further auctions for 3500 MHz spectrum and millimetre wave spectrum are expected in 2020 and 2021, respectively.
M2M and IoT technologies connect communications-enabled remote devices via wireless technologies, allowing them to exchange key information and share processes. Advanced platforms and networks are already in place in industries such as healthcare, utilities, agriculture and fleet management, with deployment ongoing in other industries, including vehicle insurance, retail, food services and consumer utilities. These and other industries are looking to IoT, combined with other applications, to generate value from their connections. IoT represents a meaningful opportunity for growth in mobility products and services, with secure connectivity, customer value and efficiency. While M2M applications generally have lower average revenue per subscriber unit per month (ARPU), they tend to generate high service volumes with low or no subsidy costs, thereby supporting both revenue growth and margins. In 2019, we added 263,000 mobile connected devices, bringing our connected device subscriber base to approximately 1.5 million, up 22% from 2018.
5G has begun to play a mainstream role in technology evolution and innovation globally, and is an important component of meeting Canada’s and TELUS’ efforts to further bridge the digital divide and connect rural Canadians. Investing in 5G will drive capital expenditure savings by allowing us to provide high-speed internet services over wireless in less urban areas, as well as improved cost savings and innovative services in industrial automation, transportation and telehealth. Driven by significantly faster speeds, lower latencies, improved reliability and attractive economics, 5G will enable a host of new applications: for industries, 5G will enable remote operations, industrial control and manufacturing automation; for consumers, home automation, autonomous vehicles, and wireless-to-the-home connectivity with speeds comparable to wired access technologies; and for healthcare, converged solutions for hospitals, clinics and remote patient monitoring. 5G is essential to Canada’s digital future and is expected to generate significant innovation, growth and productivity. Mobile 5G wireless technology is up to 100 times faster than 4G technology.
Enabling a robust and reliable 5G experience for Canadians will require complementary wireless spectrum bands to support the needs of a diverse subscriber base and consist of a portfolio of low, mid and high-band spectrum. Low-band spectrum, such as 600 MHz, covers wide areas and penetrates well into buildings, thus improving coverage in urban and suburban areas. This low-band spectrum will play a vital role in bringing 5G to Canadians and as such, it is an important resource for Canada as wireless operators build out 5G in rural areas. High-band spectrum such as millimetre wave (mmWave) can enable speeds up to 100 times faster than 600 MHz spectrum; however, it does not have the same coverage characteristics to penetrate well into buildings. This high-bandwidth spectrum and the associated faster connection speeds will help unlock new technologies such as virtual and augmented reality. Current trials show that mmWave delivers the richest 5G experience, albeit in a localized fashion. Mid-band spectrum, such as 3.5 GHz, is important to the 5G ecosystem as it is able to support both the coverage characteristics of low-band spectrum with the speed characteristics of mmWave spectrum, albeit at slightly lower speeds. This spectrum will be integral to low-latency communications services, including autonomous monitoring and vehicle-to-everything communication. Current trials show 3.5 GHz is key for broader 5G coverage and is increasingly being used globally for 5G coverage. We believe that the meaningful deployment of 5G technology should progress from where the best LTE-A is today. See Section 9.4 Communications industry regulatory developments and proceedings for further details on upcoming spectrum auctions.
Wireline
The traditional wireline telecommunications market is expected to remain very competitive in 2020, as technology substitution — such as the broad deployment of higher-speed internet; the use of email, messaging and social media as alternatives to voice services; and the growth of wireless and VoIP services — continues to replace higher-margin legacy voice revenues. In our incumbent operating areas of B.C. and Alberta, it is estimated that, in 2019, 52% of households no longer have a fixed line and 32% of households no longer have a broadcast TV service. While we are a key provider of these substitution services, the decline in this legacy business is continuing as expected, although residential voice losses slowed considerably in 2019. Our long-standing growth strategy remains focused on wireless, data and IP-centric wireline capabilities.
The popularity of viewing TV and on-demand content anywhere, particularly on handheld devices, is expected to continue to grow as customers adopt services that enable them to view content on multiple screens. Streaming media
![]()
providers continue to enhance OTT streaming services in order to compete for a share of viewership, as viewing habits and consumer demand evolve. Studies suggest that 46% of Canadian households had a subscription to Netflix at the end of 2019. The launch of streaming TV services is expected to continue in Canada, with the most recent and notable launch being Disney Plus in the fourth quarter of 2019.
Conventional TV content providers are monitoring OTT developments and evolving their content and market strategy to compete with these non-traditional offerings. Bell Media offers a content streaming service through its expanded Crave TV offering. We view OTT as an opportunity to add further capabilities to our linear and on-demand assets, providing customers with flexible options to choose the content they want and encourage greater customer use of TELUS high-speed internet and wireless services. We continue to enhance our Optik TV service by adding content and capabilities, including ultra-high-definition 4K content, and by entering into multicultural content and distribution deals with OTT content providers such as Netflix and Crave TV. TELUS continues to offer Pik TV, an attractive OTT-friendly basic TV offering that allows customers to access live TV and streaming services like Netflix and YouTube conveniently and affordably through a self-install media box, Apple TV, internet browser or our Android and iOS mobile applications.
Consistent with facilities-based competition, telecommunications companies continue to make significant capital investments in broadband networks, with a focus on fibre to the premises or home (FTTP/FTTH) to maintain and enhance their ability to support enhanced IP-based services and higher broadband speeds. Cable-TV companies continue to evolve their cable networks with the gradual roll-out of the DOCSIS 3.1 platform. Although this platform increases speed in the near term and is cost-efficient, it does not offer the same advanced capabilities as FTTP over the longer term, such as fast symmetrical upload and download speeds. At the end of 2019, our fibre-optic infrastructure was available to 2.22 million homes and businesses, reaching approximately 70% of our broadband footprint. Advances in LTE wireless technology and our extensive LTE infrastructure also allow us to target otherwise underserved areas with a fixed wireless solution, and 5G is widely expected to offer vastly expanded opportunities in this regard.
Combining wireline local and long distance voice services with wireless and high-speed internet access and entertainment services, telecommunications companies can focus on offering bundled products to achieve competitive differentiation and provide customers with more flexibility and choice on networks that can reliably support these services. Our broadband investments, including the build-out of our FTTP broadband network and our premium differentiated IP-based Optik TV service, as well as lower-cost Pik TV service, home security and automation and integrated bundled service offerings, continue to enhance our competitive position and customer loyalty relative to our main cable-TV competitor.
As the industry moves to 5G wireless in the coming years, we expect to be operating on, and providing services over, a more converged network. The lines between wireline access and wireless access will continue to blur, as the way we deliver services to customers — and the way our customers use those services — continues to evolve. As our broadband network continues to expand and 5G begins to be commercialized in the coming years, we expect to benefit from the flexibility of being able to select the most efficient way to deliver services across our footprint. We do not expect to have to build fibre to every home; instead, we believe that there will be opportunities to deliver services to some areas within our broadband footprint wirelessly with 5G.
Additional wireline capabilities
In the business market (enterprise and small and medium-sized businesses, or SMB), the convergence of IT and telecommunications, facilitated by the ubiquity of IP, continues to shape the competitive environment, with non-traditional providers increasingly blurring the lines of competition and business models. Cable-TV companies continue to make investments to better compete in the highly contested SMB space. Telecommunications companies like TELUS are providing network-centric managed applications that leverage their significant FTTP investments, while IT service providers are bundling network connectivity with their proprietary software as service offerings. In 2018, while our business-to-business (B2B) line of business was dilutive to our EBITDA, in 2019 we aggressively pursued opportunities to stabilize this business, and we expect to return to growth and enhance margins in future years.
The development of IP-based platforms providing combined IP voice, data and video solutions creates potential cost efficiencies that compensate, in part, for the loss of margins resulting from the migration from legacy to IP-based services. New opportunities exist for integrated solutions, as well as business process and IT outsourcing that could have a greater business impact than traditional telecommunications services. Data security represents both a challenge and an opportunity for TELUS to provide customers with our data security solutions. Increasingly, businesses are looking to partner with their communications service provider to address their business goals and challenges, and to tailor cloud-based solutions for their needs that leverage telecommunications in ways not imagined a decade ago. Cloud computing is changing service delivery to always-on and everything-as-a-service, and strong growth is expected in this area. TELUS offers Network as a Service capabilities for businesses with the option of an IT network as a service over the internet, mirrored across multiple locations, based on a self-serve platform that reduces deployment cycles and reliance
![]()
on IT specialists. Our home and business security offerings in Western Canada are powered by our broadband network and integrate the latest smart devices to improve the lives of Canadians.
Healthcare is expected to be a continued growth area in future years, based on an aging population in Canada, an increasing emphasis on chronic disease management, and the potential benefits that technology can deliver in terms of efficiency and effectiveness within the sector. We are leveraging our expanding broadband network to increase access, integration and effectiveness of innovative healthcare tools and applications across the primary care ecosystem in order to position ourselves to compete for this anticipated growth. These tools span personal health records to empower self-management of healthcare data, electronic drug prescriptions with online insurance validation by the physician, and home health monitoring devices and data capture with caregiver oversight. The digitization of everyday functions within the healthcare ecosystem, combined with increased broadband network connectivity, provides an opportunity to support the development and delivery of even more advanced health applications to benefit Canadians and improve health outcomes. Following the 2018 acquisition of Medisys Health Group Inc., we were able to provide virtual care services through Medisys on Demand, and we further expanded those virtual care capabilities with the 2019 acquisition of Akira, allowing patients access to the care they need via a nurse practitioner. In the first quarter of 2019, TELUS Health and Babylon launched a future-forward virtual healthcare service called Babylon by TELUS Health, to further expand and revolutionize access to healthcare. With an innovative AI-powered Symptom Checker, users can get information about their condition and, if required, speak directly with a licensed physician from the convenience of a smartphone. Together, these virtual care solutions and capabilities are empowering Canadians to better manage their health and get the care and information they need when it’s convenient for them — a huge step forward in the evolution of Canada’s healthcare system and the current status quo. In 2020 and beyond, TELUS Health will leverage these and other digital health tools to expand access to care for Canadians across the country.
TELUS International (TI), our global business services and digital services provider, continues its expansion through organic growth and strategic acquisitions (see Section 1.3 Highlights of 2019 for further details). TI is a global customer experience innovator that designs, builds and delivers next-generation digital services for some of the world’s most demanding, discerning and disruptive brands. TELUS Corporation remains TI’s largest customer. From TI’s successful inception 15 years ago in the Philippines, established to support TELUS’ growing customer service needs, TI has grown exponentially in size, scope and geographic diversity to deliver exceptional customer experiences for clients from sites in North and Central America, Europe and Asia. In 2020, TI added significant scale through the acquisition on January 31, 2020 of Competence Call Center (CCC), a leading provider of higher-value-added business services with a focus on customer relationship management and content moderation, for approximately €915 million (approximately C$1.3 billion), less debt assumed. This acquisition, which has closed, adds significant scale and diversity to TI. Post-merger, TI’s size, scope and reach will grow to encompass almost 50,000 team members globally, providing customer experience, digital transformation, content moderation, IT life cycle, advisory and digital consulting, risk management, and back-office support in over 50 languages from more than 50 delivery centres across 20 countries. The acquisition further bolsters the continued advancement of TI’s successful growth strategy by positioning it well for a potential future initial public offering targeted in the next 12 to 24 months, positioning the organization for continued growth in the years to come.
As technology continues to change our industry rapidly, customer demand continues to evolve and grow, and Canada shifts to a more digital economy, we are committed to evolving our business and offering innovative and reliable services and thought leadership in core future growth areas that are complementary to our current operations. This, along with our constant focus on leadership in delivering an enhanced customer experience, positions us for continued differentiation and growth.
9.3 TELUS assumptions for 2020
In 2020, we expect growth in EBITDA, driven by the increasing demand for data in our mobile and fixed products and services, as customers want access to faster speeds; our consistent strategic focus on our core mobile and fixed capabilities (see Section 2.2 Strategic imperatives, Section 3 Corporate priorities and Section 4 Capabilities); significant ongoing investments in our leading broadband network as we evolve to 5G; continued efforts to enhance operational simplicity and efficiency; and our constant focus on an enhanced customer experience across all areas of our operations, with the objective of simplifying our customers’ interaction with us while reducing our overall cost structure.
Our assumptions in support of our 2020 outlook are generally based on industry analysis, including our estimates regarding economic and telecom industry growth (see Section 1.2 The environment in which we operate), as well as our 2019 results and trends discussed in Section 5. Our key assumptions include the following:
· Estimated economic growth rates in Canada, B.C., Alberta, Ontario and Quebec of 1.6%, 2.3%, 1.9%, 1.6% and 1.6%, respectively.
· Estimated annual unemployment rates in Canada, B.C., Alberta, Ontario and Quebec of 5.9%, 4.7%, 6.9%, 5.7% and 5.0%, respectively.
![]()
· Estimated annual rates of housing starts on an unadjusted basis in Canada, B.C., Alberta, Ontario and Quebec of 201,000 units, 39,000 units, 27,000 units, 73,000 units and 46,000 units, respectively.
· No material adverse regulatory rulings or government actions.
· Continued intense mobile products and services competition and fixed products and services competition in both consumer and business markets.
· Continued increase in mobile phone industry penetration of the Canadian market.
· Ongoing subscriber adoption of, and upgrades to, data-intensive smartphones, as customers seek more mobile connectivity to the internet at faster speeds.
· Wireless revenue growth resulting from improvements in subscriber loading, with continued competitive pressure on blended ARPU.
· Continued pressure on mobile products and services acquisition and retention expenses, arising from gross loading and customer renewal volumes, competitive intensity and customer preferences. Continued mobile connected devices growth, as our IoT offerings diversify and expand.
· Continued growth in fixed products and services data revenue, reflecting an increase in internet, TV and security subscribers, speed upgrades, rate plans with larger data buckets or endless data usage, and expansion of our broadband infrastructure, healthcare solutions, and home and business security offerings.
· Continued erosion of residential voice revenue, resulting from technological substitution and greater use of inclusive long distance.
· Continued growth of TELUS International revenue and EBITDA generated by expanded services for existing customers and business acquisitions.
· Continued focus on our customers first initiatives and maintaining our customers’ likelihood-to-recommend.
· Employee defined benefit pension plans: Pension plan expense of approximately $101 million recorded in Employee benefits expense; a rate of 3.10% for discounting the obligation and a rate of 3.20% for current service costs for employee defined benefit pension plan accounting purposes; and defined benefit pension plan funding of approximately $46 million.
· Restructuring and other costs of approximately $150 million for continuing operational effectiveness initiatives, with margin enhancement initiatives to mitigate pressures related to intense competition, technological substitution, repricing of our services, increasing subscriber growth and retention costs, and integration costs associated with business acquisitions.
· Depreciation and Amortization of intangible assets of approximately $2.85 billion to $2.95 billion.
· Income taxes: Income taxes computed at applicable statutory rate of 26.2 to 26.8% and cash income tax payments of approximately $390 million to $470 million (2019 — $629 million).
· Further investments in broadband infrastructure as we have reached approximately 70% of our broadband footprint at December 31, 2019, including fibre-optic network expansion and 4G LTE capacity and upgrades, as well as investments in network and systems resiliency and reliability.
· Participation in the ISED wireless spectrum auction for 3500 MHz spectrum band, currently expected in late 2020 (specific date unknown as of February 13, 2020).
· Continued stabilization in the average Canadian dollar: U.S. dollar exchange rate ($1.33 in 2019).
· Continued deployment of access-agnostic technology in our network.
9.4 Communications industry regulatory developments and proceedings
Our telecommunications, broadcasting and radiocommunication services are regulated under federal laws by various authorities, including the Canadian Radio-television and Telecommunications Commission (CRTC), ISED, Canadian Heritage and the Competition Bureau.
The following is a summary of certain significant regulatory developments and proceedings relevant to our business and our industry. This summary is not intended to be a comprehensive legal analysis or description of all of the specific issues described. Although we have indicated those issues for which we do not currently expect the outcome of a development or proceeding to be material to us, there can be no assurance that the expected outcome will occur or that our current assessment of its likely impact on us will be accurate. See Section 10.3 Regulatory matters.
![]()
Radiocommunication licences and spectrum-related matters
ISED regulates, among other matters, the allocation and use of radio spectrum in Canada and licenses radio apparatus, frequency bands and/or radio channels within various frequency bands to service providers and private users. The department also establishes the terms and conditions attached to such radio authorizations, including restrictions on licence transfers, coverage obligations, research and development obligations, annual reporting, and obligations concerning mandated roaming and antenna site sharing with competitors.
3500 MHz spectrum auction to support 5G
On June 5, 2019, ISED released its Decision on Revisions to the 3500 MHz Band to Accommodate Flexible Use and Preliminary Decisions on Changes to the 3800 MHz Band and its Consultation on a Policy and Licensing Framework for Spectrum in the 3500 MHz Band to define a licensing framework (i.e. auction rules and conditions of licence) for the 3500 MHz band. The Minister of Innovation, Science and Industry indicated that the 3500 MHz spectrum auction will take place in late 2020 (specific date unknown as of February 13, 2020) and the 3800 MHz spectrum auction is currently envisioned to take place in 2022. Although the transition decision, by way of a clawback, ensures a portion on the band is available for auction in all markets, there is a risk that the auction rules will favour certain carriers over us and impact our ability to acquire 3500 MHz band spectrum.
Repurposing mmWave spectrum to support 5G
On June 5, 2019, ISED released its Decision on Releasing Millimetre Wave Spectrum to Support 5G, repurposing several tranches of mmWave spectrum for mobile use. ISED will consult on a licensing framework (i.e. auction rules and conditions of licence) for these mmWave bands in the future and is targeting an auction for this spectrum in 2021. There is a risk that the auction rules will favour certain carriers over us and impact our ability to acquire an adequate quantity of mmWave band spectrum.
Regulatory and federal government reviews
The CRTC and the federal government have initiated public proceedings to review various matters. They are discussed below.
Review of mobile wireless services
On February 28, 2019, the CRTC released its anticipated consultation to review the regulatory framework for mobile wireless services. The review will examine three major issues — the level of competition in the retail market, the current wholesale mobile wireless service regulatory framework, with a focus on wholesale mobile virtual network operator (MVNO) access, and the future of mobile wireless services in Canada, with a focus on reducing barriers to infrastructure deployment. The CRTC also provided a preliminary view that there should be more opportunity for MVNOs. We have intervened in this proceeding and filed evidence to demonstrate the high performance of Canadian wireless services on dimensions including network coverage, network quality, availability of service and pricing. We will participate in all stages of this proceeding, which is scheduled to proceed to an oral hearing beginning on February 18, 2020. The impact of this proceeding on us will not be known until a decision is issued by the CRTC. That decision is not expected until mid-2020, at the earliest.
Wireline wholesale services follow-up
On July 22, 2015, the CRTC released Review of wholesale wireline services and associated policies, Telecom Regulatory Policy CRTC 2015-326 (TRP 2015-326). The major component of this decision was that the CRTC ordered the introduction of a disaggregated wholesale high-speed internet access service for internet service provider (ISP) competitors. This includes access to FTTP facilities. This requirement is being phased in geographically beginning in the largest markets in Ontario and Quebec (i.e. in the serving territories of Bell, Cogeco, Rogers and Videotron). The CRTC initiated a follow-up proceeding to determine the technical configurations, appropriate costs and wholesale cost-based rates in those regions. The FTTP follow-up activities directed in TRP 2015-326 remain ongoing. For the second phase, which involves FTTP wholesale services for the rest of Canada (including our serving territories), a proceeding on technical configurations for disaggregated wholesale services commenced in 2017, and the associated cost study and tariff review will follow.
The timing of the implementation of disaggregated wholesale services may also be affected by an application to the CRTC filed by the Canadian Network Operators Consortium Inc. (CNOC) to review and vary TRP 2015-326 and to seek, among other things, interim relief that would remove a speed cap pursuant to which the existing aggregated wholesale access regime will not apply to speeds in excess of 100 Mbps pending the introduction of disaggregated service; and permanent relief granting wholesale access to FTTP facilities on an aggregated basis. On March 20, 2019, the CRTC granted CNOC’s application for interim relief. We have been granted leave to appeal that decision to the Federal Court of Appeal, with a decision expected in 2020. The CRTC’s decision with respect to the permanent relief sought by CNOC remains under reserve. We anticipate no material adverse impact in the short term with respect to CNOC’s application for interim relief. Given the phased implementation of the mandated provision of wholesale access to our FTTP network, it is too early to determine the impact TRP 2015-326 will have on us in the longer term.
![]()
Final rates for aggregated wholesale internet access services
On August 15, 2019, the CRTC released Telecom Order CRTC 2019-288, which finalized rates for the aggregated wholesale internet services of the incumbent local exchange carriers (ILEC) and incumbent cable companies. The final rates were considerably lower than the interim rates, and the CRTC ordered the rates to apply retroactively to October 6, 2016. The financial impact of this decision was not material to us, given the volume of wholesale internet customers we currently serve.
On September 13, 2019, Bell Canada and affiliated companies and a collection of cable companies filed separate applications with the Federal Court of Appeal to seek leave to appeal Telecom Order CRTC 2019-288. Bell Canada and the cable companies also sought a stay of the order. On November 22, 2019, the Federal Court of Appeal allowed both leave applications and granted a stay pending the disposition of the appeal. We anticipate that the appeal will be heard in 2020.
Separately, on November 13, 2019, we filed a petition to the Governor in Council seeking to refer back to Telecom Order CRTC 2019-288 for redetermination of the rates and seeking to vary Telecom Order CRTC 2019-288 to remove its retroactive effect, all on the basis that the rates and retroactive component of the order will threaten future investment. Bell Canada and a coalition of cable companies filed similar petitions on the same day. Also, on November 13, 2019, we filed an application to the CRTC to review and vary Telecom Order CRTC 2019-288, primarily on the basis that the CRTC made errors in calculating the carriers’ costs. Finally, on December 13, 2019, Bell Canada and a collection of cable companies also brought applications to the CRTC to review and vary Telecom Order CRTC 2019-288.
Follow-up proceedings further to the CRTC report on sales practices of large telecommunications carriers
On February 20, 2019, the CRTC released its Report on Aggressive or Misleading Communications Retail Sales Practices. The CRTC published this report further to a proceeding it commenced, at the direction of the Governor in Council, to examine claims of aggressive or misleading sales practices concerning telecommunications services, the prevalence and impact on consumers, and potential solutions. While the report itself is not a legally binding direction or order, it does note that the CRTC may commence certain follow-up proceedings and activities, including, but not limited to, a new secret shopper program, enhanced consumer information tools and complaints disclosure, and a proceeding to determine whether mandatory compliance measures and enhanced public reporting measures should be imposed on providers that fall below a threshold of acceptable behaviour. Until the CRTC releases further details on its follow-up activities, we are unable to determine any new potential impacts on us.
Phase-out of the local service subsidy regime
On June 26, 2018, the CRTC issued Phase-out of the local service subsidy regime, Telecom Regulatory Policy CRTC 2018-213. In this decision, the CRTC determined that it would phase out the existing local service subsidy over three years, from January 1, 2019, to December 31, 2021. In September 2018, the Independent Telecommunications Providers Association (ITPA), which represents small ILECs, brought an application to the CRTC to review and vary this decision. In its application, the ITPA seeks to keep the existing local service subsidy regime in place. On February 4, 2020, the CRTC issued Independent Telecommunications Providers Association – Application to review and vary Telecom Regulatory Policy 2018-213, Telecom Decision CRTC 2020-41, in which it denied the ITPA’s application. The impact of this decision is not material.
Review of the price cap and local forbearance regimes
Simultaneously with the release of the Phase-out of the local service subsidy regime decision noted above, the CRTC issued Review of the price cap and local forbearance regimes, Telecom Notice of Consultation CRTC 2018-214. In this proceeding, the CRTC is reviewing, among other things: pricing constraints for residential local exchange services; whether compensation to ILECs is required given that the local service subsidy is being eliminated further to the Phase-out of the local service subsidy regime decision; whether there is still a need for an exogenous factor mechanism in the price cap regimes; and whether changes are necessary to test for local forbearance. On February 4, 2020, the CRTC released Review of the price cap and local forbearance regimes, Telecom Regulatory Policy CRTC 2020-40, in which it affirmed its 2018 determination to phase-out the local service subsidy regime by 2021, and declined to provide compensation in the form of additional pricing flexibility for regulated primary exchange services in high-cost serving areas, including making no changes to the local forbearance regime. The impact of this decision is not material.
5G security review — Public Safety Canada
In September 2018, the federal government announced a review of national cybersecurity requirements for Canada’s 5G networks. When complete, the review is expected to provide policy clarity on what security controls or restrictions the government intends to impose on 5G networks in Canada. The timelines for the conclusion of this review have not been released by the federal government, and the government has not indicated its intentions regarding 5G cybersecurity requirements. Given the range of potential government or regulatory action that may result from this review, the impact on ourselves, and on Canadian wireless service providers generally, cannot currently be predicted.
U.S. security developments
On May 16, 2019, U.S. President Donald Trump signed an executive order permitting the Secretary of Commerce to block certain technology transactions deemed to constitute national security risks. Additionally, the Bureau of Industry and Security of the United States Department of Commerce (BIS) amended the U.S. Export Administration Regulations to add Huawei Technologies Co. Ltd. and its non-U.S. affiliates (collectively, Huawei) to the BIS’ Entity List, which
![]()
resulted in the imposition of additional licence requirements (the Restrictions) on the export, re-export and transfer of goods, services and technology to Huawei by persons subject to the Restrictions. Subsequently, on May 20, 2019, the BIS adopted a final rule creating a 90-day temporary general licence (TGL) partially restoring the BIS’ former licensing requirements for exports, re-exports and transfer to Huawei in connection with certain transactions, including in connection with the continued operation of existing networks and equipment and the provision of support to existing handsets. On August 19, 2019, a final rule extended the TGL’s validity for an additional 90 days to November 18, 2019, and on November 18, 2019, a further final rule extended the TGL’s validity for a further 90 days to February 16, 2020. Given the range of potential government or regulatory actions by the U.S. government with respect to Huawei, the impact on ourselves, and on Canadian wireless service providers generally, cannot currently be predicted.
CRTC proceeding regarding device financing
On August 30, 2019, the CRTC commenced a proceeding to inquire into device financing plans for wireless handsets and asked certain parties, including ourselves, to show cause why their device financing plans are permitted under the Wireless Code. This proceeding follows the introduction of device financing plans by ourselves, Rogers and Bell in July 2019, including, for Rogers and ourselves, plans with terms longer than 24 months. Under these plans, customers who cancel wireless services contracts are required to repay immediately the outstanding financing balance in full. On August 2, 2019, the CRTC issued a letter stating that wireless service providers were to stop offering device financing plans beyond 24 months so it could review the practice. In the proceeding, the CRTC sought comment on the effects on consumers of financing plans beyond 24 months and how the provisions of the Wireless Code apply to device financing. We intervened to inform the CRTC that: device financing is desired by customers; customers benefit from longer financing periods because upfront device costs are lower and the cost of devices can be spread over a longer period, thereby reducing the monthly cost; the objective of the Wireless Code should be to benefit customers; and longer device financing periods further the federal government’s affordability agenda for wireless services. Until the CRTC issues a decision on its intended treatment of financing plans, it is too early to determine the impact of this proceeding on us.
CRTC proceeding regarding potential barriers to the deployment of broadband-capable networks in underserved areas in Canada
On December 10, 2019, the CRTC issued Call for comments regarding potential barriers to the deployment of broadband-capable networks in underserved areas in Canada, Telecom Notice of Consultation CRTC 2019-406. In this proceeding, the CRTC is seeking comment on barriers that service providers and communities face in building new facilities, or interconnecting to or accessing existing facilities, to extend networks into underserved areas in order to offer universal service objective-level services. The CRTC has specifically identified access to affordable transport services and efficient use of support structures as potential barriers. We are reviewing the Notice of Consultation and intend to participate fully in the proceeding. It is too early to determine the impact of the proceeding on us.
Government affordability election commitment
Affordability of wireless was a campaign topic during the October 2019 federal election. The newly elected Liberal government committed to reducing cell phone plan prices by 25% over the next two years through collaboration with wireless service providers. We are unable to determine the impact of this commitment on us until the government releases more information on what measures, if any, it will take. We continue to work with ISED to advance our understanding of their priorities and to determine the impact this will have on our business. The announcement or implementation of specific regulations or other actions intended to reduce cell phone plan prices could precipitate a material reduction in capital expenditures and operating expenditures in the form of staffing levels to ameliorate this impact.
Broadcasting-related issues
Broadcasting licences held by TELUS
Our regional licences to operate broadcasting distribution undertakings in B.C. and Alberta were granted renewals in Broadcasting Decision CRTC 2018-267, which extends the licence terms to August 31, 2023. Our licence to operate a regional broadcasting distribution undertaking in areas of Quebec was renewed on June 28, 2019 in Broadcasting Decision CRTC 2019-230, extending the licence term to August 31, 2024. Our licence to operate a national video-on-demand service was renewed to August 31, 2023, as part of Broadcasting Decision CRTC 2018-20.
Review of the Telecommunications Act, the Radiocommunication Act and the Broadcasting Act
On January 29, 2020, the Broadcasting and Telecommunications Legislative Review panel released its final report entitled Canada’s Communications Future: Time to Act. The report contains 97 recommendations to update legislation governing broadcasting, telecommunications and radiocommunication for the Government of Canada to consider, and which may, or may not, be implemented. Although no immediate changes or legal consequences flow from the release of the report, the Ministers of Canadian Heritage and Innovation, Science and Industry have signaled their intention to act quickly to modernize the communications legislative framework. It is too early to determine if the report will have a material impact on us.
Review of the Copyright Act and Copyright Board reforms
The Copyright Act’s statutorily mandated five-year review was due in 2017, and a process for conducting the review via parliamentary committee was announced in December 2017. The Standing Committee on Industry, Science and
![]()
Technology (INDU Committee), with the assistance of the Standing Committee on Canadian Heritage, completed the review early in 2019, and both committees presented reports to the House of Commons in May/June of 2019. Although the INDU Committee had requested that a comprehensive government response be tabled by September 1, 2019, the government did not respond. Following the October 2019 federal election, the timeline for potential changes to the Copyright Act is therefore uncertain. The policy approach for copyright has traditionally been based on a balance of interests of creators and consumers, and as a result, any changes to the Copyright Act are not expected to have a negative material impact on us.
10. Risks and risk management
10.1 Overview
Risk is the uncertainty that arises due to events, actions and our business activities that may have a negative impact or create positive opportunities. Risk oversight and management processes are integral elements of our risk governance and strategic planning practices.
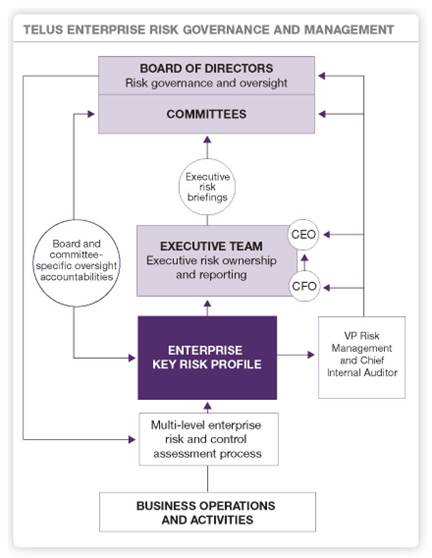
Risk governance, oversight and culture
We maintain strong risk governance and oversight practices, with risk oversight responsibilities outlined in the Board policy manual. Our Board is responsible for ensuring that material risks to our business are identified and overseeing the implementation of systems and processes to effectively identify, monitor and manage material risks.
Our risk governance culture starts with clear risk management leadership and transparent communications, supported by our Board and Executive Team. In our approach to risk governance, accountability for the management of risks and reporting of risk information is clearly defined. Training and awareness programs, appropriate resources and risk champions help to ensure that we have the risk management competencies necessary to support effective decision-making across the organization. Ethics are integral to our risk governance culture, and our code of ethics and conduct directs team members to meet the highest standards of integrity in all business decisions and actions.
Responsibilities for risk management
We take a multi-step approach to managing risks, sharing responsibility across the organization and recognizing that effective risk management is dynamic and integral to the achievement of our strategic and operational objectives. The first line of assurance is executive and operating management, and these team members are expected to integrate risk management into core decision-making processes (including strategic planning processes) and day-to-day operations. We have risk management and compliance functions across the organization, in areas that include Finance, Legal, Data and Trust (which includes Privacy), Security and other business operational areas, and these form the second line of assurance. These teams establish policies, provide guidance and expertise, and work collaboratively with management to monitor the design and operation of controls. Internal Audit is the third line of assurance, providing independent assurance regarding the effectiveness and efficiency of risk management and controls across all areas of our business.
Risk and control assessment process
Events within and outside of TELUS present us with both risks and opportunities. We strive to avoid taking on undue risk and we work to ensure alignment of risks with business strategies, objectives, values and risk tolerances; in turn, we also seek to take advantage of opportunities that may emerge. We strive to proactively mitigate our risk exposures through
![]()
performance planning, business operational management and risk response strategies, which can include mitigating, transferring, retaining and/or avoiding risks.
We have in place multi-level enterprise risk and control assessment processes that solicit and incorporate insights from leaders across all areas of TELUS and enable us to track multi-year trends in key risks and the control environment. A comprehensive annual risk and control assessment is conducted with leaders and an annual assessment is completed by Board members to provide perspective on key enterprise risks. Results of the assessments are shared with senior management, our Board of Directors and the Audit Committee, and inform the development of our risk-focused internal audit program. The risk information is incorporated into our strategic planning, operational risk management and performance management processes. In addition, key enterprise risks are reviewed on a quarterly basis in order to capture and communicate any changes and detailed risk assessments are conducted for various risk management, strategic and operational initiatives throughout the year.
10.2 Principal risks and uncertainties
This section describes our principal risks and uncertainties. The significance of these risks is such that they alone or in combination may have material impacts on our business operations, results, reputation and brand, as well as the approaches taken by investment analysts when evaluating or valuing TELUS. These risks and the associated risk mitigation activities are addressed further in the following sections.
Although we believe the measures we take to identify and mitigate risks are reasonable, there can be no expectation or assurance that they will effectively mitigate or fully address the risks described or that new developments and risks will not materially affect our operations or financial results. Despite our efforts to implement controls in our domestic and international operations, there can be no assurance that these controls will prove to be effective in all instances. Forward-looking statements in this section and elsewhere in this MD&A are based on the assumption that our risk mitigation measures and controls will be effective. See Caution regarding forward-looking statements.
Strategic risks
These strategic risks arise from uncertainties that may shape the nature and focus of our strategic direction as an organization and our ability to sustain profitable revenue growth.
Risk |
| Potential impact |
| Mitigations |
Regulatory matters |
| Constraining of domestic telecom practices by elected officials and regulatory decisions, reviews and government activity, domestically and internationally, may have strategic, financial or operational impacts. |
| · Advocacy · Spectrum acquisition strategies · Non-regulated, diversified revenue streams · Prudent investment and cost efficiency planning decisions commensurate with our regulatory environment. |
|
|
|
|
|
Competitive environment |
| Competitor expansion, activity and intensity (pricing, bundling), as well as non-traditional competitors, disruptive technology and disintermediation, may alter the nature of the market and impact our market share. |
| · Customers first strategy · Bundling of services · Competitive monitoring · Product portfolio innovation and acquisition · Product life cycle management |
|
|
|
|
|
Technology |
| Consumer adoption of alternative technologies (such as over-the-top (OTT) offerings, software-defined networks and mobile virtual network operators) and changing customer expectations (such as expectations for broad publicly available Wi-Fi) have the potential to impact our revenue streams and customer churn. |
| · Technology road map · Fibre deployment · Spectrum acquisition strategies |
|
|
|
|
|
Suppliers |
| We may be impacted by supply chain practices, disruptions and lack of resiliency in relation to global or localized events. Dependence on a single supplier for products, components, service delivery or support may impact our ability to meet constantly changing and rising customer expectations while maintaining our quality of service. |
| · Supplier risk profiling · Vendor partnerships, contracts and agreements · Supplier code of conduct · Business continuity management plans |
|
|
|
|
|
Organizational change |
| Momentum of both internal and external integration activities may impact customer experience, the achievement of our strategic objectives and synergies associated with our change initiatives. |
| · Investment and acquisition strategy · Pre and post-acquisition due diligence · TELUS Ventures investments · Innovation partnerships |
![]()
Operational risks and uncertainties
Operational risks arise from uncertainties we face in our day-to-day operations. Our approach is guided by our code of ethics and conduct, while our operations are supported by policies, procedures and internal controls.
Risk |
| Potential impact |
| Mitigations |
Customer service delivery |
| Customer interactions and our service delivery directly impact customer experience, customer churn, and likelihood to recommend outcomes. |
| · Process simplification and digitization · Customer experience management |
|
|
|
|
|
Our systems and processes |
| Systems and technology innovation, maintenance and management may impact our IT systems and network reliability, as well as our operating costs. |
| · Life cycle management and adoption of emerging solutions · Project management · Change management · Continuous monitoring and response programs · Disaster recovery program and plans |
|
|
|
|
|
Security and data protection |
| Our awareness of security issues and the effectiveness of our security controls influence our ability to identify potential threats and vulnerabilities, protect our environment, detect breaches, respond to attacks and restore normal operations. A successful disruption may impact the operations of our network or allow the unauthorized interception, destruction, use or dissemination of customer, team member or business information. |
| · Security policies, standards and methodologies · Privacy and security impact assessments · Vulnerability assessments · Continuous monitoring and response programs |
|
|
|
|
|
Our team |
| The rapidly evolving and highly competitive nature of our business and changing workforce demographics, as well as the sufficiency of internal training, development and succession programs, may impact our ability to attract, develop and retain team members with the skills required to meet the changing needs of our customers and our business. |
| · Performance development program · Health and well-being strategy · Compensation and benefits program · Retention and succession planning · Work Styles program |
|
|
|
|
|
Our environment |
| Natural disasters, climate change impacts and disruptive events may impact our operations, customer satisfaction and team member experience. |
| · Business continuity and disaster recovery program and plans
|
Financial risks and uncertainties
Financial risks arise from uncertainties involved in maintaining appropriate levels of liquidity, financing and debt to sustain operations and support future growth.
Risk |
| Potential impact |
| Mitigations |
Financing, debt and dividends |
| Our access to capital markets may be impacted by general market conditions and assessments by investors of TELUS cash generation capability. Our current intention to return capital to shareholders could constrain our ability to invest in our operations to support future growth. |
| · Shelf prospectus in effect until August 2022 · Investment grade credit ratings · Credit facility and commercial paper program · Foreign currency forward contracts |
|
|
|
|
|
Tax matters |
| Complexity of domestic and foreign tax laws, regulations and reporting requirements related to TELUS and our international operating subsidiaries may our impact financial results, effective governance of tax considerations and compliance. |
| · Tax strategy · Internal taxation professionals · External advisors |
|
|
|
|
|
The economy |
| Changing global economic conditions, as well as our effectiveness in monitoring and revising growth assumptions and contingency plans, may impact the achievement of our corporate objectives. |
| · Pension investment governance and monitoring · Foreign currency forward contracts · Diverse product sets · Efficient business operations |
![]()
Compliance risks and uncertainties
Compliance risks arise from uncertainties related to compliance with laws and regulations spanning the many jurisdictions in which we operate. We have policies, controls, processes and contractual arrangements in place, as well as insurance coverage, that are designed to enable compliance and limit our exposure to compliance risks.
Risk |
| Potential impact |
| Mitigations |
Litigation and legal matters |
| Complexity of, and compliance with, laws, regulations and commitments may have a financial and reputational impact. |
| · Customer contracts and agreements |
10.3 Regulatory matters
Risk category: Strategic
The regulatory regime under which we operate, including the laws, regulations, and decisions in regulatory proceedings and court cases, reviews, appeals, policy announcements and other developments, such as those described in Section 9.4 Communications industry regulatory developments and proceedings, imposes conditions on the products and services that we provide and the ways in which we provide them. The regulatory regime sets forth, among other matters, rates, terms and conditions for the provision of telecommunications services, licensing of broadcast services, licensing of spectrum and radio apparatus, and restrictions on ownership and control by non-Canadians.
The allocation and use of spectrum in Canada are governed by Innovation, Science and Economic Development Canada (ISED), which establishes spectrum policies, determines spectrum auction frameworks, issues licences and sets radio authorization conditions.
Canadian ownership and control restrictions, including restrictions on the ownership of our Common Shares by non-Canadians, are imposed by the Canadian Telecommunications Common Carrier Ownership and Control Regulations under the Telecommunications Act (collectively, the Telecommunications Regulations) and the Direction to the CRTC (Ineligibility of Non-Canadians), as ordered by the Governor in Council pursuant to the Broadcasting Act (the Broadcasting Direction).
With our Internet of Things (IoT), health, business and international footprint spanning North America and Central America, Europe and Asia, our operations must also comply with the laws, regulations and decisions in effect in these jurisdictions.
Potential impact
Changes to the regulatory regime under which we operate, including changes to laws and regulations and ownership rules or the enactment of laws or regulations by provinces or municipalities that threaten unitary federal regulatory authority over telecommunications, could materially and adversely affect our business. These changes may increase our costs, restrict or impede the way we provide our services, limit the range of services we provide, and otherwise cause us to reduce our capital and operational expenditures, including investment in our network, and alter customer perceptions of our operations. The further regulation of our broadband, wireless and other activities and any related regulatory decisions could also restrict our ability to compete in the marketplace and limit the return we can expect to achieve on past and future investments in our network. Such changes may not be anticipated or, when they are anticipated, our assessment of their impact on us and our business may not be accurate.
Our ability to provide competitive services, including our ability to enhance our current services and offer new services on a timely basis, is also dependent on our ability to obtain access to new spectrum licences at a reasonable cost as they are made available. The revocation of, or a material limitation on obtaining, spectrum licences could have a material adverse effect on our business and our operations, including the quality and reliability of our network and service offerings, as well as our financial condition.
Government or regulatory actions with respect to certain countries or suppliers may also impact us, and other Canadian telecommunications carriers generally, and may have material, non-recurring, incremental cost consequences for TELUS.
Changes over the past 12 months
The Government of Canada is currently conducting a cybersecurity review of international suppliers of next-generation network equipment and technologies, focused on Huawei Technologies, to evaluate potential risks involved in the development of 5G networks in Canada. Over the past decade, our partnership with Huawei has allowed us to utilize the most advanced technology in a cost-effective manner in our advanced 3G and 4G networks, without any security-related
![]()
incidents. In building our 3G and 4G national networks, we have collaborated closely with the Government of Canada for many years to ensure robust protections across all equipment used.
The CRTC is currently reviewing the regulatory framework for wireless services. The review will examine three major issues: the level of competition in the retail market; the current wholesale mobile wireless service regulatory framework, with a focus on wholesale mobile virtual network operator (MVNO) access; and the future of mobile wireless services in Canada, with a focus on removing barriers to infrastructure deployment. The CRTC has provided a preliminary opinion that there should be more opportunities for MVNOs. We have intervened in, and will participate in all stages of, this proceeding, and have filed evidence to demonstrate the high performance of Canadian wireless services on metrics that include network coverage, network quality, availability of service and pricing. A decision for this proceeding is not expected until mid-2020, at the earliest. The public hearing commences on February 18, 2020.
In August 2019, the CRTC issued a decision that significantly reduced wholesale internet rates charged by incumbent local exchange carriers for wholesale digital subscriber line and cable companies’ third-party internet access services to competitor internet service providers. In response, we brought a petition to the Governor in Council to refer the decision back to the CRTC for reconsideration in light of the negative ramifications that it will have on investment and related social outcomes, such as health, environmental policy and rural development. We also filed an application for the CRTC to review and vary certain costing errors that the CRTC made in the decision. BCE and a coalition of cable companies have separately been granted leave to appeal the decision to the Federal Court of Appeal. The CRTC decision has been stayed pending the disposition of the appeal.
In October 2019, a federal Liberal government was re-elected. The newly elected Liberal government committed to reducing cell phone plan prices by 25% over the next two years through collaboration with wireless service providers. We continue to work to demonstrate that Canadian wireless prices remain low to moderate in the context of Canada’s low population density, challenging geography and very high spectrum costs. The announcement or implementation of specific regulations or other actions intended to reduce cell phone plan prices could precipitate a material reduction in capital expenditures and operating expenditures in the form of staffing levels to ameliorate this impact.
Mitigation
We advocate at all levels of government, including: our participation in CRTC and federal government proceedings, studies, reviews and other consultations; representations before provincial and municipal governments pertaining to telecommunications issues; legal proceedings impacting our operations at all levels of the courts; and other relevant inquiries (such as those relating to the exclusive federal jurisdiction over telecommunications), as described in Section 9.4 Communications industry regulatory developments and proceedings.
We will continue to monitor regulatory developments and may need to reconsider our investment decisions with a view to generating a necessary return on capital. Our risk mitigating strategies for investment decisions, may include, but are not limited to, reducing capital and operational expenditures and reducing employment.
We continue to strive to comply with all radio authorization and spectrum licence and renewal conditions and plan to participate in future spectrum auctions. We continue to advocate with the federal government for fair spectrum auction rules, so that companies like TELUS can bid on an equal footing with other competitors for spectrum blocks available at auction and can purchase spectrum licences available for sale from competitors. We also continue to strongly advocate that preferential treatment is not required for regional carriers, including for 5G services, most notably for entrants that are currently part of established, sophisticated and well-financed cable companies.
As a holding corporation of Canadian carriers, the Telecommunications Regulations give us certain powers to monitor and control the level of non-Canadian ownership of our Common Shares. These powers have been incorporated into our Articles and extended to ensure compliance under both the Broadcasting Act and the Radiocommunication Act (under which the requirements for Canadian ownership and control are cross-referenced to the Telecommunications Act).
10.4 Competitive environment
Risk category: Strategic
As the telecommunications industry continues to evolve, we have expanded on the delivery of traditional voice and data services for consumer and business customers to focus on security, healthcare and customer care and business services (CCBS) (see Competition overview in Section 4.1).
Wireless markets are characterized by aggressive competition from established players and regional entrants, with competitors using various promotional offers to attract and retain customers.
In the consumer market, cable companies and other competitors continue to offer a mix of residential local voice over IP (VoIP), long distance, internet access and, in some cases, wireless services under one bundled and/or discounted monthly rate, along with their existing broadcast or satellite-based TV services. Some of our competitors own and continue to acquire broadcast content assets, which could result in content being withheld from us or being made available to us at inflated prices or on unattractive terms.
![]()
In the business market, traditional facilities-based competitors continue to compete based on network footprint and reliability, while OTT service providers emphasize price, flexibility and convenience. OTT service providers do not invest in, or own, networks or other infrastructure but compete directly with pay-TV, video, voice and messaging services across both the consumer and business market segments.
TELUS Health competes with other providers of electronic medical records and pharmacy management products, claims adjudicators, systems integrators and health service providers, including those that own a vertically integrated mix of health services delivery, IT solutions and related services, and global providers. With consumer-facing health products, we compete in the provision of virtual healthcare services (with access to general practitioners, nurse practitioners, mental health therapists and dieticians provided through virtual consultations), preventative health services, and personal emergency response services.
TELUS International is a CCBS provider with a focus on customer experience and transformation innovation that designs, builds and delivers next-generation digital solutions and content moderation. We compete with other customized managed outsourcing solutions companies, as well as other providers of contact centre and IT digital services.
Potential impact
Our customers’ loyalty and their likelihood to recommend TELUS are both dependent upon our ability to provide a service experience that meets or exceeds their expectations.
Intense competition from wireless competitors, traditional telephony, data, IP and IT service providers and VoIP-focused competitors in both the consumer and business markets, along with the use of various promotional offers and inclusive bundles / rate plans, places pressures on average revenue per subscriber per month (ARPU), churn and costs of acquisition and retention.
Changes over the past 12 months
Continued wireless promotional activity, device financing, unlimited data plans and substitution by increasingly available Wi-Fi networks are impacting chargeable usage, ARPU and customer churn (see Wireless trends and seasonality in Section 5.4), while the use of unlicensed spectrum and high-throughput satellites to deliver higher-speed data services is intensifying competition (see Communications industry regulatory developments and proceedings in Section 9.4).
We face technological substitution across all key business lines and market segments, including the consumer, small and medium-sized business and large enterprise markets, TELUS Health and TELUS International, and technological advances have blurred the boundaries between broadcasting, internet and telecommunications sectors (see Section 10.5 Technology).
Canadian cable competitors are investing in next-generation TV platforms while continuing to increase the speed of their internet offerings and their roll-out of Wi-Fi services in metropolitan areas. OTT services, such as Netflix, Amazon Prime Video, Disney+ and YouTube, are also competing for share of viewership, which may accelerate the disconnection of TV services or affect subscriber and revenue growth in our TV and entertainment services.
Erosion of our residential voice lines and the decline of legacy voice revenues are expected to continue, due to competition and ongoing technological substitution by wireless and VoIP. Legacy data revenues and margins also continue to decline. This has been only partially offset by growth in demand and/or migration of customers to IP-based platforms, as IP-based solutions are also experiencing downward pricing pressure, lower margins and technological evolution.
Non-traditional competitors such as Amazon and Microsoft are entering the business market and are able to leverage their global scale to offer low-cost data storage and cloud computing services. In addition, rapidly advancing technologies, such as software-defined networks and virtualized network functions, enable the layering of new services in cloud-centric solutions.
Mitigation
Our top corporate priority is putting customers first and earning industry leadership in the likelihood to recommend. In fact, 60% of our internal corporate scorecard is weighted to team member engagement and customer experience. To enhance customer experience, we continue to invest in our products and services, system and network reliability, team members, and system and process improvements. Additionally, with our product life cycle management processes, we endeavour to introduce innovative products and services through both research and development and acquisition, enhance our current services with integrated bundled offers and invest in customer-focused initiatives to bring greater transparency and simplicity to our customers, all to help differentiate ourselves from our competition.
Our 4G technology covers approximately 99% of Canada’s population, enabling us to establish and maintain a strong position in smartphone and data device selection and expand roaming capability to more than 225 destinations. To compete effectively across customer segments, we offer a wide range of services across our TELUS, Koodo and Public
![]()
Mobile brands. Each brand has a unique value proposition and web-based channel (see Our capabilities in Section 4.1 and Our brand and distribution channels in Section 4.2).
We are making significant investments in our broadband infrastructure, including connecting more homes and businesses directly to our fibre-optic network. Our broadband investments extend the reach and functionality of our IP TV services and business and healthcare solutions, and are also enabling a more efficient and timely evolution to a converged 5G network (see Our technology, systems and properties in Section 4.2).
Our IP TV and OTT multimedia initiatives support the next generation of IP TV and, importantly, tie our OTT environment to one platform, which allows us to be agile in the delivery of OTT services, such as Netflix and YouTube, while also strengthening our leadership position in Western Canada in the provision of high-definition linear channels, video-on-demand services and ultra-high definition 4K HDR content. Our strategy is to aggregate, integrate and make content and applications accessible for our customers’ enjoyment, on a timely basis across multiple devices. We have demonstrated that it is not necessary to own content in order to make it accessible to customers on an economically attractive basis, provided there is timely and strict enforcement of the CRTC’s regulatory safeguards to prevent abusive practices by vertically integrated competitors. In addition, as more OTT service providers launch services and offer higher-resolution video over the internet, we continue to make investments in our network. Throughout 2019, TELUS PureFibre was the leader in Canada in the Netflix Internet Service Provider Speed Index, a measure of prime-time Netflix performance on particular internet service providers around the globe, and was ranked first in network coverage, speed, reliability or experience by Opensignal, J.D. Power, PC Mag, Ookla and Tutela.
Our SmartHome Security and Secure Business solutions offerings, expanded through the recent acquisition of ADT Security Services Canada, Inc. (see Telecommunications industry in 2019 in Section 9.1 and Organizational change in Section 10.7), further leverage our infrastructure investments and our strong customer experience capabilities to enhance the suite of services we offer with video surveillance and analytics, home and business automation and related safety and security monitoring. These services are provided over smartphone applications and leverage our leading PureFibre and wireless networks, while providing multi-service bundling and retention profiles.
Through TELUS Health, we have leveraged our systems, proprietary solutions and third-party solutions to extend our footprint in healthcare and benefit from the investments in eHealth being made by governments and employers. With the introduction of health products and services for Canadians, we are seeing evidence of a positive shift in perception, driving overall interest and sales of TELUS services, and differentiating TELUS from our traditional competitors.
Additionally, through our TELUS International customer experience, digital transformation and business services and our multi-site customer service centres, we enable experiences that realize efficiencies, cost savings and business growth for our customers. We are further diversifying our international operations with the acquisition of Competence Call Center (see Telecommunications industry general outlook and trends in Section 9.2 and Organizational change in Section 10.7).
We continue to add to our capabilities in the business market through product development, acquisitions and partnerships and investments in software-defined networks, unified communications and IoT.
We are continuing our disciplined long-term strategy of investing in our growth areas and delivering on our customers first priority. We intend to continue to market and distribute innovative and differentiated services; offer bundled services across our product portfolio; invest in our extensive network and systems to support customer service; evolve technologies; invest in our distribution channels; and acquire the use of spectrum to facilitate service development and the expansion of our subscriber base, as well as to address the accelerating growth in demand for data usage.
10.5 Technology
Risk category: Strategic
We are a technology-enabled company and we maintain short-term and long-term strategies to optimize our selection, costs and use of technology, minimize risks and uncertainties and diversify our product and service offerings. Our 4G LTE network, LTE advanced (LTE-A) and TELUS PureFibre technology are foundational to our future growth (see Our technology, systems and properties in Section 4.2).
A paradigm shift involving consumer adoption of alternative technologies, such as video and voice OTT offerings (e.g. Netflix and FaceTime) and increasingly available Wi-Fi networks, could negatively affect our revenue streams. For example, Wi-Fi networks are being used to deliver entertainment services to customers outside the home, while OTT content providers are competing for a share of entertainment viewership. OTT technology may also impact business segment services by enabling capabilities that in the past were associated with telecommunications service providers (e.g. Skype, cloud-based services and roaming). On the other hand, the proliferation of low-power wide-area (LPWA) IoT networks presents new revenue opportunities, along with the challenges of very low bandwidth usage. These factors, including the growing customer demand for access to Wi-Fi outside the home and access to OTT services on demand
![]()
on any device, may drive increased churn rates for our wireless, TV and high-speed internet services, and add further pressure on our revenue streams (see Section 10.4 Competitive environment). Advanced self-learning technologies and automation (e.g. artificial intelligence and robotic process automation) will change the way we manage our operations and will support customer experience innovation. In addition, we are constantly focused on advances in cybersecurity, so that we can identify any opportunities they may offer.
Potential impact
Our business depends on the deployment of technology and maintaining sufficient access to spectrum to deliver services. Rising data traffic levels and the fast pace of data device innovation present challenges to providing adequate capacity and maintaining high service levels at competitive cost structures.
Ongoing investments in fibre-to-the-premises should enable further evolution of IP-based telephony, and as those services evolve, we will continue to assess opportunities to further consolidate separate technologies within a single voice service environment. The overall convergence of wireless and wireline services in a common IP-based network provides opportunities for cost savings and for the rapid development and deployment of new and advanced services.
Changes over the past 12 months
The demand for wireless data services continues to grow rapidly. According to the CRTC Communications Monitoring Report 2019, the average data usage per subscriber increased by 26.3% in 2018 over the 2017 result, while wireless data revenue decreased for the first time by 8.2% over the same period.
5G technology is evolving rapidly and the world’s first standards-based commercial launches occurred in 2019. Most early 5G ecosystems operate on three distinct spectrum bands: 3.5 GHz, millimetre wave (mmWave) spectrum (28 GHz and 37 to 40 GHz) and 600 MHz. Globally, 3.5 GHz spectrum is becoming the primary band for 5G mobile coverage. In Canada, 3.5 GHz spectrum was auctioned for fixed wireless access between 2004 and 2009; it is currently not licensed for mobile applications and is largely held by Inukshuk (a joint venture owned by Bell and Rogers) in most urban markets. In 2019, ISED issued a decision to claw back a portion of Inukshuk’s 3.5 GHz spectrum holdings and re-auction it for flexible use (permitting its deployment for mobile applications, such as 5G). In 2019, ISED initiated public consultation on the licensing framework for the 3.5 GHz spectrum auction, which is expected to take place in late 2020. Depending on the auction rules, there is a risk that we could end up with less 3.5 GHz spectrum than certain other carriers and not be able to compete equally in the provision of higher network speeds and 5G capacity.
Spectrum in the mmWave band is expected to be used for very high data demand locations in which customers are very close to the antenna and have an unobstructed view of the transmitting site. Services using this particular spectrum are expected to be an alternative to fibre-to-the-home deployments.
Mitigation
Our 4G LTE access technology covers 99.4% of Canada’s population, while our LTE-A access technology covers 93.4%. Our ongoing investments in 4G LTE technology, including LTE-A technology and early 5G capabilities, allow us to manage data capacity demands by more effectively utilizing our spectrum holdings. The evolution to LTE-A technologies is supported by our investments in our IP network, IP/fibre back-haul to cell sites, including our small-cell infrastructure, and a software-upgradeable radio infrastructure. The LTE-A expansion is expected to further increase network capacity and speed, reduce delivery costs per megabyte, enable richer multimedia applications and services, and deliver a superior subscriber experience.
Mobile network infrastructure investments will increasingly be directed to systems based on network function virtualization (NFV), which offer greater capacity for computing and storage, higher levels of resiliency and more flexible software design. Our large-scale move to national, geographically distributed data centres that use commercial off-the-shelf computing and storage solutions enables the utilization of broad-scale NFV and software-defined network technologies, which will allow us to virtualize much of our infrastructure and will also facilitate a common control plane for coordination of our virtualized and non-virtualized network assets. The architecture of our intelligence and content capabilities is located at the edge of our network, close to our customers. The distributed smaller-scale computing power and storage deliver services faster while managing the ongoing need to continually scale the IP/fibre core network infrastructure.
Rapid growth of data volumes requires efficient utilization of our spectrum holdings of 700 MHz, AWS-3 and 2500 MHz spectrum licences. We are now deploying those licences as required to provide additional capacity in order to mitigate risks from growing data traffic. We also plan to combine our licensed spectrum with unlicensed supplementary spectrum, as network and device ecosystems evolve to support licensed assisted access (LAA) technology. The spectrum licences previously used for our CDMA access technology have been repurposed for use with LTE technology. Our public Wi-Fi service increasingly integrates seamlessly with our 4G access technology, automatically shifting our smartphone customers to Wi-Fi, offloading data traffic from our spectrum and extending service and channel
![]()
opportunities. Our deployment of small-cell technology, coupled with both licensed and licence-exempt spectrum technologies, is helping us achieve a more efficient utilization of our spectrum holdings.
In order to influence the timing, rules and policies regarding 3.5 GHz spectrum, we have emphasized to ISED the need for early, fair and timely access to 3.5 GHz spectrum for all operators in order to ensure that Canada continues to lead all G7 countries in terms of data speeds and capabilities. We are advocating for a fair treatment of this spectrum band and for its accelerated release by ISED to all industry players for mobile use (refer to Section 10.3 Regulatory matters). ISED is currently expected to auction the spectrum in late 2020, and assuming our successful participation in the auction, we will begin operationalizing the spectrum in 2021.
In order to prepare for the future deployment of mmWave spectrum, we continue to conduct 5G trials in the mmWave spectrum bands. Our trials have established a platform that will form the basis for evaluating our future 5G use cases and help us prepare for network planning in the mmWave bands. Additionally, we continue to collaborate with ISED, sharing trial results in discussions to help guide our regulator as it finalizes its decisions on establishing the policy and timing for the release of mmWave spectrum for 5G. The auction for mmWave spectrum is expected to occur in 2021. Furthermore, our investment in small-cell technology will help us densify our network and mitigate any potential speed and capacity disadvantages created by 3.5 GHz availability, as well as improve future mmWave deployment feasibility, cost and time to market.
Since early 2014, we have worked with numerous businesses and many major sports and entertainment venues as we continue to expand our public Wi-Fi infrastructure. This public Wi-Fi service is a part of our network strategy of deploying small cells that integrate seamlessly with our 4G wireless access technology, automatically shifting our smartphone customers to Wi-Fi and offloading data traffic from our wireless spectrum. Integrated public Wi-Fi infrastructure build-out activity also extends service and channel opportunities with small and medium-sized enterprises and improves customers’ likelihood to recommend. Integration of home Wi-Fi increases the propensity for higher data usage on smartphones within and outside the home, helping to drive the uptake of our internet service. In addition to the availability of our Wi-Fi service, our IoT portfolio is also growing, with the addition of services such as GEOTrac, TELUS Alert and Assist, and a wide variety of featured IoT solutions. Our customer service delivery sites are experimenting with different automation and self-learning tools to assess the impact such technology may have on customer experiences and operating efficiencies. We are also maintaining a constant focus on cybersecurity solutions, because we view cybersecurity as an ecosystem of technologies and processes working together to provide greater visibility and guide better security decisions for organizations across Canada.
To support convergence in a common IP-based application environment, we are leveraging modular architectures, lab investments and employee trials. We are partnering with system integrators where appropriate, purchasing hardware that is common to most other North American IP-based technology deployments and introducing virtualization technologies, where feasible. We are also active in a number of standards bodies, such as the Metro Ethernet Forum and IP Sphere, in order to influence a new IP infrastructure strategy that leverages standards-based functionality, which could further simplify our network.
10.6 Suppliers
Risk category: Strategic
We have relationships with multiple vendors, including large suppliers such as Amazon, Apple, Google, Microsoft and Samsung, which are important in supporting network and service evolution plans and our delivery of services to our customers. Our suppliers and vendors may experience business difficulties, privacy and/or security incidents, external events such as epidemics or pandemics, as well as government or regulatory pressures. They may restructure their operations, be consolidated with other suppliers, discontinue certain products or sell their operations or products to other vendors. In addition, various suppliers may sell products or services directly to our customers.
In certain cases, the number of suppliers of a product, service or technology that we use is limited. In addition, government or regulatory actions with respect to certain countries or suppliers may affect our relationship with certain vendors and our future use of their products and services.
Potential impact
Our agility in the delivery of products and services is directly linked to our ability to engage or replace a supplier or vendor on a timely basis and without incurring additional cost. Reliance on certain manufacturers may increase their market power and adversely affect our ability to purchase certain products at an affordable cost. Ultimately, the success of upgrades and the evolution of technology that we offer our customers, including our IP TV solutions and the roll-out and evolution of our broadband technologies and systems, may be impacted, as well as the cost of acquisition or the time required to deploy technology and systems.
![]()
There is no guarantee that our vendor strategies and agreements will not be impacted by vendor operational difficulties or government / regulatory pressures, or that we will not incur additional costs or delays in continuing to provide services or in deploying our technologies and systems.
Changes over the past 12 months
Over the course of 2019, Huawei, a leading global telecom supplier and phone manufacturer, continued to come under scrutiny. With continued international focus on telecom suppliers, additional business continuity plans have been formalized to ensure availability of supply in compliance with U.S. Bureau of Industry and Security (BIS) Entity List restrictions.
Mitigation
As a leading network aggregator, we partner with several network equipment suppliers and work with numerous international and domestic vendors to deliver the best possible experience for our customers. We consider possible vendor strategies and/or restructuring outcomes when planning for our future growth, as well as the maintenance and support of existing equipment and services. We have reasonable contingency plans for different scenarios, including working with multiple vendors, maintaining ongoing strong vendor relationships with periodic reviews of vendor performance, and working closely with other product and service users to influence vendors’ product or service development plans.
In addition, we regularly monitor the risk profile of our key vendors and review the applicable terms and conditions of our agreements to determine whether additional contractual safeguards are required, and we promote our Supplier Code of Conduct, which is based on generally accepted standards of ethical business conduct.
In respect of supplier market power, we offer and promote alternative devices to provide greater choice for consumers and to help limit our reliance on a few key suppliers.
10.7 Organizational change
Risk category: Strategic
We will partner, acquire and divest as necessary to accelerate the implementation of our strategy.
Potential impact
Business combination transactions add complexity to our organization’s structure, product and service offerings and operational systems and processes. If pre-acquisition due diligence is insufficient or ineffective, our investment may not realize potential synergies or generate strategic growth.
Given the rapid rate of technological change, we may also look to partner and invest in emerging opportunities that may not yet be fully viable and established. These investments may require high levels of initial funding and experience low levels of initial adoption, growth and returns, all of which could impact our financial position in the short term.
Changes over the past 12 months
Over the course of 2019, we made a number of acquisitions, building on our strategy and commitment to leverage our world-leading network by extending our industry-leading customer service as we continue to enhance our connected home, business, security, IoT, cybersecurity, smart buildings, smart cities, agriculture and health service offerings for our customers. Notably, in November 2019, we completed the acquisition of ADT Security Services Canada, Inc., one of Canada’s leading providers of security and automation solutions for residential and business customers, expanding our security service offerings and customer base. In addition, in December 2019, we announced an agreement to acquire Competence Call Center, a leading provider of higher-value-added business services with a focus on customer relationship management and content moderation.
Mitigation
To support ongoing investment in leading-edge and innovative technology, we have diversified our approach to allow for varied levels of commitment, which we determine based on the relative maturity of that technology in its life cycle, its alignment with our strategy and its linkage with our value proposition. Our TELUS Ventures investments include more than 20 active companies, and we continue to build on our commitment to help develop exciting new technologies with the potential to deliver benefits for our customers, stakeholders and shareholders. In addition, we continue to engage in partnerships in order to research and develop leading-edge innovative technology in sectors such as entertainment, agriculture and healthcare services.
Over the course of time, we have built a disciplined corporate development and ventures expertise, including due diligence and post-acquisition integration planning rigour, reinforced by a well-defined process and governance approach to evaluating investments and acquisitions. Where a larger-scale business combination is contemplated, our teams follow a well-established and collaborative due-diligence review process, with oversight by our senior leadership and
![]()
Board. In addition, formal post-acquisition processes are in place to support on-boarding, engagement and operational integration with our risk monitoring and management practices.
10.8 Customer service delivery
Risk category: Operational
Our top priority is putting our customers first, with our service delivery team focused on driving excellence in operations and operational efficiency, implementing radical simplification and becoming best in class solution advisors, with the goal of minimizing the effort involved when our customers interact with us.
Potential impact
Sub-optimal experiences when our customers engage with us for services or support may negatively impact customer satisfaction, the TELUS brand and our net customer base growth. Inadequate or inefficient customer interactions (e.g. order taking, support contact, service delivery and billing accuracy) may increase customer dissatisfaction and churn. Failure to continue to execute effectively on organizational initiatives, such as customers first, solutions advisor support, digitization and simplification, may impact the customer experience we provide. As well, any significant or prolonged systems and service disruptions or outages may negatively impact customer satisfaction and the TELUS brand. Regulatory decisions may also impact our ability to invest in our customer experience.
Changes over the past 12 months
In December 2018, a reorganization of the call centre, field delivery and digital support teams was undertaken to create a more aligned end-to-end customer service experience team to drive better service levels in our call centres, online and onsite in our customer’s homes and premises. In addition, the amalgamation of our Business Transformation office and Technology Strategy team has supported an integrated approach to developing and deploying services as we evolve toward a software-defined networking and services paradigm. During 2019, the team has been defining, standardizing and deploying merged and common networking, computing and storage infrastructure at both our internet data centres and central offices. These changes are part of a vital transformation intended to capitalize on the promise of new technologies while enhancing service and speed to market for our customers in an increasingly competitive landscape.
Mitigation
Putting customers first remains our top priority. By way of simplification and digitization, including our ongoing work on conversational interactive voice response and enhanced call-back capabilities, we have improved first-time interaction experiences by reducing the number of call transfers and shortening customer wait times. We continue to enhance the reliability and functionality of our websites and applications, while promoting digital engagement to minimize effort for our customers and reduce the volume of calls related to basic transactions and activities.
Truck roll reduction efforts are driving an improved customer experience and operational efficiencies that allow us to redirect resources, in order to keep accelerating our customer first improvements. In addition, the expansion of our fibre footprint has increased network reliability and performance, resulting in fewer repairs and truck rolls.
Development of a formal cost of outage model to quantify the impact of outages and help inform and prioritize investments and initiatives, along with a tighter focus on defect reduction, is driving year-over-year improvements in our system outage rates.
We continue to be ranked favourably in third-party reports based on customer and network experience. In 2019, we were ranked first in network coverage, speed, reliability or experience by Opensignal, J.D. Power, PC Mag, Ookla and Tutela. This successful performance was the result of continuing to evolve our coverage across Canada, increasing accessibility to our network, and working to better understand the emerging network methodologies that can enhance coverage and LTE availability, all of which won us recognition for providing the best network coverage among our competitors.
10.9 Our systems and processes
Risk category: Operational
We are a key provider of essential telecommunication services in Canada. Our success depends on our ability to offer reliable and continuous services to our customers.
We have a large number of interconnected operational and business support systems. Acquisitions, business combinations and the development and launch of new services typically require significant systems development and integration efforts. As next-generation services are introduced, they must work with next-generation systems, frameworks and IT infrastructures, while also being compatible with legacy services and support systems. In addition, large enterprise deals may involve complex and multi-faceted customer-specific enterprise requirements, including customized systems and reporting requirements in support of service delivery.
![]()
Potential impact
Our network, technology, infrastructure, supply chain, team members and operations may be materially impacted by natural hazards (see Section 10.12 Our environment), disruptions of critical infrastructure due to intentional threats (see Section 10.10 Security and data protection), health threats (such as epidemics or pandemics) or labour disruptions (see Section 10.11 Our team) or unintentional threats.
As the complexity of our systems increases, system stability and availability may be affected. There can be no assurance that any of our proposed IT systems or process change initiatives will be implemented successfully, that they will be implemented in accordance with anticipated timelines, or that sufficiently skilled personnel will be available to complete such initiatives. If we fail to implement and maintain appropriate IT systems on a timely basis, fail to create and maintain an effective governance and operating framework to support the management of staff, or fail to understand and streamline our significant number of legacy systems and proactively meet constantly evolving business requirements, we could experience an adverse effect on our business and financial performance.
Changes over the past 12 months
Increasingly, IT services are being delivered by cloud-based vendors as either Software as a Service (SaaS) or Infrastructure as a Service (IaaS). While this can result in benefits in terms of speed to market, reliability, performance and agility, it requires adjustments to our operations. Operational support processes and vendor negotiations must now take into account that the delivery of hardware and software services is occurring outside of our own infrastructure, and therefore controls need to be incorporated into our operational support processes and tools.
In addition, we routinely have numerous integration activities, complex system and process change initiatives and development projects underway.
Mitigation
In line with industry best practice, our approach is to separate business support systems (BSS) from operational support systems (OSS) and underlying network technology. Our aim is to decouple the introduction of new network technologies from the services we sell to customers so that both can evolve independently. This allows us to optimize network investments while limiting the impact on customer services, and also facilitates the introduction of new services. In addition, due to the maturing nature of telecommunications vendor software, we adopt industry-standard software for BSS/OSS functions, leverage SaaS and IaaS, and avoid custom development where possible. This enables us to leverage vendor knowledge and industry practices acquired through the installation of those platforms at numerous global telecommunications companies. We have established a next-generation BSS/OSS framework to ensure that, as new services and technologies are developed, they are part of the next-generation framework that will ease the retirement of legacy systems in accordance with TeleManagement Forum’s next-generation operations systems and software program. As part of our ongoing fibre roll-out, we have invested in new operational support systems that are consolidating our legacy systems and simplifying our current environment. This will improve our ability to support and maintain our systems with newer, more resilient technology. We also continue to make significant investments in system resiliency and reliability in support of our ongoing customer first initiatives.
For each new large enterprise deal, we look to leverage systems and processes developed in previous contract wins while incorporating others as required, using a controlled methodology to draft a new custom solution and following standard industry practices for project management.
We have change management policies, processes and controls in place that are based upon industry best practices. In general, we strive to ensure that system development and process changes are prioritized, and we apply a project management approach to such initiatives that includes reasonable risk identification and contingency planning, scope and change control, and resource and quality management. We generally also complete reasonable functional, performance and revenue assurance testing, as well as capturing and applying any lessons learned. Where a change involves major system and process conversions, we often move our business continuity planning and emergency management operations centre to a heightened state of readiness in advance of the change.
We conduct ongoing monitoring of our networks, systems and critical applications. Risk-based disaster recovery capabilities are leveraged to help prevent outages and limit impacts on customers and our operations. In addition, enterprise-wide business continuity programs are in place to support monitoring, preparedness, mitigation, response and recovery. However, there can be no assurance that specific events, or a combination of events, will not disrupt our operations.
10.10 Security and data protection
Risk category: Operational
As a national provider of information and communications services, we have visibility beyond that of individual organizations. We leverage this visibility and understanding to monitor and identify security trends as they evolve in the
![]()
wider threat landscape. The risks outlined below reflect both our experience and the trends observed in the wider ecosystem.
We have a number of assets that are subject to intentional threats. These include physical assets that are subject to security risks such as vandalism and/or theft, including (but not limited to) distributive copper cable, corporate stores, network and telephone switch centres, and elements of corporate infrastructure.
Additionally, we operate data centres and collect and manage data in our business and on behalf of our customers (including, in the case of TELUS Health, sensitive health information) that may move across our interconnected operational and business support systems and networks. Depending on the nature of the data, it may be restricted for use within Canada or leveraged by our teams or outsourcing partners in Canada or abroad.
Potential impact
Physical security threats can place both our team members and our infrastructure, systems and networks at risk of incurring significant harm, including personal injury, destruction of property, loss of service and/or data. Our systems and networks are also subject to cyberattacks. The risk and consequences of cyberattacks on our assets could surpass physical security risks and consequences due to the rapidly evolving nature and sophistication of these threats.
We, and our partners, may also be subject to software, equipment or other system malfunctions that could result in unauthorized access to, or change, loss or destruction of, our data. These malfunctions could compromise the privacy of individuals, including our customers, team members and suppliers, and could expose other sensitive information.
A successful disruption of our systems, network and infrastructure, or those of our third parties, suppliers, vendors and partners, may prevent us from providing reliable service, impact the operations of our network or allow for the unauthorized interception, destruction, use or dissemination of our information or our customers’ information. Such disruption, physical or logical, or unauthorized access to our data could cause us to lose customers or revenue, incur expenses or experience reputational and goodwill damages. Additionally, such damages could result in TELUS incurring costs associated with investigation efforts, replacement or restoration of assets and potential civil lawsuits or fines from regulatory bodies.
Changes over the past 12 months
With our visibility and monitoring capabilities, we have observed that the frequency and sophistication of cyberattacks continue to increase. These attacks may use a variety of techniques that include the targeting of individuals and the use of sophisticated malicious software and hardware, or a combination of both, to evade the technical and administrative safeguards that are in place (including firewalls, intrusion prevention systems, active monitoring, etc.).
Mitigation
Our security program addresses risk through a number of mechanisms, including:
· Controls based on policies, standards and methodologies that are aligned with recognized industry frameworks and practices
· Monitoring of external activities by potential attackers
· Regular security evaluations of our most important assets
· The identification and regular re-evaluation of our known security risks
· Regular reviews of our standards and policies to ensure they address current needs and threats
· Regular review of our business continuity and recovery planning processes that would be invoked in the event of a disruption
· A privacy and security impact assessment process
· A secure-by-design process that incorporates security provisions into new initiatives across TELUS.
Our technical capabilities help us identify security-related events, respond to possible threats and adjust our security posture appropriately. Additionally, our approach to cyber-hygiene includes regular vulnerability assessments and the prioritization and remediation of any identified exposure through patching or other mechanisms. Our security office also works with law enforcement and other agencies to address ongoing threats and disruptions.
10.11 Our team
Risk category: Operational
Our success depends on the abilities, experience, well-being and engagement of our team members. Each year, we carry out a number of unique initiatives that are intended to improve our productivity and competitiveness. These include acquisitions, operational business integrations, efficiency programs, business process automation and/or outsourcing, offshoring and reorganizations.
![]()
Potential impact
Lost work time resulting from team member illness or injury can negatively affect organizational productivity and employee benefit costs. The loss of key team members through attrition and retirement, the inability to attract and retain team members with essential or evolving skills, including familiarity with legacy systems, or any deterioration in overall team member morale and engagement resulting from organizational changes, unresolved collective agreements or ongoing cost reduction initiatives, could have an adverse impact on our growth, business and profitability and our efforts to enhance the customer experience. In addition, changes in technology are shifting the set of skills needed by our team and driving competition for resources among global players.
Changes over the past 12 months
Every week, half a million Canadians are unable to work due to mental health challenges, as depression, burnout and lack of social connection in the workplace become more common.
Mitigation
To support team members’ overall well-being and to achieve a positive effect on absenteeism in the workplace, we take a holistic and proactive approach to team members’ health that involves risk prevention, early intervention, team member and family assistance, assessment and support services, disability management, and accommodation and return to work services. Our health and well-being strategy encourages our team members to develop optimal personal health through five dimensions of well-being: physical, psychological, financial, social and environmental. To promote safe work practices, we offer training and orientation programs for team members and contractors who access our facilities.
We aim to attract and retain key team members through both monetary and non-monetary approaches. Our compensation and benefits program is designed to support our high-performance culture and is both market-driven and performance-based. Where required, we implement targeted retention solutions for employees with critical skills or talents that are scarce in the marketplace, and we have a succession planning process to identify top talent for senior-level positions.
We focus on and manage organizational change through a formalized business transformation function by leveraging the expertise, key learnings and effective practices developed in recent years during the implementation of mergers, business integrations and efficiency-related reorganizations.
We have a post-merger integration team that works with our business units and the operations they acquire, applying an integration model based on learnings from previous integrations, while also focusing on the unique attributes and employee cultures of the acquired companies, which enhances the standardization of our business processes and is intended to preserve the unique qualities of each acquired operation.
Additionally, we continuously strive to raise the level of our team member engagement. We believe that our strong team member engagement continues to be supported by our focus on the customer and team member experience, our success in the marketplace and our social purpose. We plan to continue our focus on other non-monetary factors that are clearly aligned with our team member engagement, including performance development, career opportunities, learning and development, recognition, diversity and inclusiveness, health and wellness programs, our Work Styles program (e.g. enabling team members to work where and how they will be most effective and equipping them with robust digital collaboration tools to stay connected), and our community volunteerism, including TELUS Days of Giving. The level of our team member engagement continues to place our organization within the top 10% of all employers surveyed.
10.12 Our environment
Risk category: Operational
Our operations, infrastructure and team members may be exposed to climate-related physical risks such as extreme weather events and natural hazards. We may also be exposed to transition risks related to climate change, such as the impact of changes in policy or the deployment of lower-emission technology.
Certain areas of our operations are subject to environmental considerations, such as handling and disposing of waste, electronic waste or other residual materials, managing our water use, and responding to spills and releases. Some areas of our operations are also subject to evolving and increasingly stringent federal, provincial and local environmental and health and safety laws and regulations. Such laws and regulations impose requirements with respect to matters such as the release of certain substances into the environment, corrective and remedial action concerning such releases, and the proper handling and management of certain substances, including wastes.
Potential impact
Evolving public expectations and increasingly stringent laws and regulations could result in increased costs of compliance, while failure to recognize and adequately respond to the same could result in penalties, regulatory scrutiny or damage to our reputation and brand.
![]()
Changes over the past 12 months
Potential impacts associated with low levels of non-ionizing radio frequency (RF) emissions from mobile phones and cell towers continue to be a matter of public concern, and will remain a public concern as we move toward a 5G environment, in which the number of small cells is expected to increase as we upgrade our network.
Along with the continued and widely shared concerns about climate-related changes and the environmental impacts of business operations, there is an increasing focus on the disclosure of environmental and sustainability governance strategies, targets and risk management practices.
Mitigation
Canada’s federal government is responsible for establishing safe limits for signal levels of radio devices. We are confident that the mobile handsets and devices we sell, and our cell towers and other associated devices, comply, in all material respects, with all applicable Canadian and U.S. government safety standards. We continue to monitor new published studies, government regulations and public concerns about the health impacts of RF exposure.
As a social capitalism company, we are committed to following sustainable and responsible business practices and making decisions that balance economic growth with social and environmental benefits. See Section 5.1(e) of our 2019 Annual Information Form for a description of Task Force on Climate-Related Financial Disclosures. Additionally, a detailed report of our environmental risk mitigation activities can be found in our sustainability report at telus.com/sustainability.
Disclosure in our sustainability report and other financial filings includes information pertaining to the governance of climate-related risks and opportunities, as well as strategies for addressing impacts of these risks, risk management practices pertaining to these risks, and the metrics and targets used to manage them. Our corporate targets include having 100% of our electricity requirements coming from renewable sources by 2025 and becoming net carbon neutral by 2030. We have signed power purchase agreements for renewable energy to help us reach these targets.
An ISO 14001:2015 certified environmental management system is in place to identify and control environmental impacts associated with our operations and support compliance with regulatory requirements. We continue to identify new ways to reduce our environmental impact and we have a corporate target of diverting 90% of waste from landfills by the end of 2025.
Business continuity and disaster recovery programs are also in place that encompass provisions for monitoring and preparedness, mitigation, response and recovery. These programs enhance the safety of our team members, minimize the potential impact of threats to our facilities, infrastructure and business operations, support the maintenance of service to our customers and help keep our communities connected.
10.13 Financing, debt and dividends
Risk category: Financial
Risk factors, such as fluctuations in capital markets, the economic environment or regulatory requirements pertaining to bank capitalization, lending activity or changes in the number of Canadian chartered banks, may impact the availability of capital and the cost of such capital for investment grade corporate issuers, including us.
Our financial instruments, and the nature of the credit risks, liquidity risks and market risks to which they may be subject, are described in Section 7.9 Financial instruments, commitments and contingent liabilities.
Potential impact
Our business plans and growth could be negatively affected if existing financing is not sufficient to cover funding requirements. External capital market conditions could potentially affect our ability to make strategic investments or meet ongoing capital funding requirements, and may prohibit the roll-over of commercial paper at low rates.
There can be no assurance that we will maintain or improve our current credit ratings. Our cost of capital could increase and our access to capital could be affected by a reduction in the credit ratings of TELUS and/or TELUS Communications Inc. (TCI). A reduction in our ratings from the current BBB+ or equivalent could result in an increase in our cost of capital.
While future free cash flow and sources of capital are expected to be sufficient to meet current requirements, our current intention to return capital to shareholders could constrain our ability to invest in our operations for future growth.
Changes over the past 12 months
At December 31, 2019, our senior unsecured debt was approximately $16.2 billion (see the Senior unsecured debt principal maturities chart in Section 4.3). We operate a commercial paper program (maximum of $1.4 billion) that currently provides access to low-cost funding. At December 31, 2019, we had $1,015 million of commercial paper
![]()
outstanding, all of which was denominated in U.S. dollars (US$781 million). When we issue commercial paper, it must be refinanced on an ongoing basis in order to realize the cost savings relative to borrowing on the $2.25 billion credit facility.
Mitigation
We may finance future capital funding requirements with internally generated funds, borrowings under the unutilized portion of our bank credit facilities, use of securitized trade receivables, use of commercial paper and/or the issuance of debt or equity securities. We have a shelf prospectus in effect until August 2022, under which we can offer up to $2.0 billion of debt or equity securities as of the date of this MD&A. We believe that our investment grade credit ratings, coupled with our efforts to maintain a constructive relationship with banks, investors and credit rating agencies, continue to provide reasonable access to capital markets.
To enable us to meet our financial objective of generally maintaining $1.0 billion of available liquidity, we have a $2.25 billion credit facility that expires on May 31, 2023 ($1.2 billion available at December 31, 2019), as well as availability under other bank credit facilities (see Section 7.6 Credit facilities). In addition, our TCI subsidiary has an agreement with an arm’s-length securitization trust until December 31, 2021, under which it is able to sell an interest in certain of its trade receivables up to a maximum of $500 million, of which $400 million was available at December 31, 2019 (see Section 7.7 Sale of trade receivables).
We successfully completed a number of debt transactions in 2018 and 2019 (see Section 7.4). As a result, the average term to maturity of our long-term debt (excluding commercial paper, the revolving component of the TELUS International credit facility, lease liabilities and other long-term debt) was 12.8 years at December 31, 2019 (as compared to 12.2 years at December 31, 2018) and our average cost of long-term debt was 3.94 per cent. Foreign currency forward contracts are used to manage currency risk arising from issuing commercial paper and long-term debt denominated in U.S. dollars (excluding the TELUS International credit facility). Our commercial paper program is fully backstopped by our $2.25 billion credit facility.
We manage our capital structure and adjust it in light of changes in economic conditions and the risk characteristics of our business and telecommunications infrastructure. We have financial policies in place that are reviewed annually and are intended to help maintain our existing investment grade credit ratings in the range of BBB+ or the equivalent. Four credit rating agencies currently have ratings that are in line with this target. Access to our $2.25 billion credit facility would be maintained, even if our ratings were reduced to below BBB+.
Funding of future spectrum licence purchases, defined benefit pension plans and any increases in corporate income tax rates will reduce the after-tax cash flow otherwise available to return to our shareholders as capital. Should actual results differ from our expectations, there can be no assurance that we will not change our financing plans, including our intention to pay dividends according to our payout policy guidelines and to maintain our multi-year dividend growth program. We may repurchase shares under our normal course issuer bid (NCIB) when and if we consider it advantageous, based on our financial position and outlook, and the market price of our Common Shares. No shares were purchased in 2019 under the NCIB program. For further details on our multi-year dividend growth program and NCIB program, see Section 4.3 Liquidity and capital resources.
Our Board of Directors reviews and approves the declaration of a dividend each quarter, and the amount of the dividend, based on a number of factors, including our financial position and outlook. This assessment is subject to various assumptions and the impact of various risks and uncertainties, including those described here in Section 10.
10.14 Tax matters
Risk category: Financial
We collect and pay significant amounts of indirect taxes, such as goods and services taxes, harmonized sales taxes, provincial sales taxes, sales and use taxes and value-added taxes, to various tax authorities. As our operations are complex and the related tax interpretations, regulations, legislation and jurisprudence that pertain to our activities are subject to continual change and evolving interpretation, the final determination of the taxation of many transactions is uncertain. Moreover, the implementation of new legislation in itself has its own complexities, including those of execution where multiple systems are involved and the interpretation of new rules as they apply to specific transactions, products and services.
TELUS International operates in a number of foreign jurisdictions, including Austria, Barbados, Bosnia and Herzegovina, Bulgaria, China, El Salvador, Germany, Guatemala, France, India, Ireland, Latvia, Philippines, Poland, Romania, Slovakia, Spain, Switzerland, Turkey, the United Kingdom and the United States, which increases our exposure to multiple forms of taxation. Generally, each jurisdiction has taxation peculiarities in the forms of taxation imposed (e.g. value-added tax, gross receipts tax, stamp and transfer tax, and income tax), and differences in the applicable tax base and tax rates, legislation and tax treaties, where applicable, as well as currency and language
![]()
differences. In addition, the telecommunications industry faces unique issues that lead to uncertainty in the application of tax laws and the division of tax between domestic and foreign jurisdictions.
Potential impact
We are subject to the risk that income and indirect tax amounts, including tax expense, may be materially different than anticipated, and that a general tendency by domestic and foreign tax collection authorities to adopt more interpretations and aggressive auditing practices could adversely affect our financial condition and operating results.
We have significant current and deferred income tax assets and liabilities, income tax expenses and cash tax payments. Income tax amounts are based on our estimates, applying accounting principles that recognize the benefit of income tax positions only when it is more likely than not that the ultimate determination of the tax treatment of a position will result in the related benefit being realized. The assessment of the likelihood and amount of income tax benefits, as well as the timing of realization of such amounts, can materially affect the determination of Net income or cash flows. We expect the income taxes calculated at applicable statutory rates to range between 26.2% and 26.8% in 2020. These expectations can change as a result of changes in interpretations, regulations, legislation or jurisprudence.
The timing of the monetization of deferred income tax accounts is uncertain, as it is dependent on our future earnings and other events. The amounts of deferred income tax liabilities are also uncertain, as the amounts are based upon substantively enacted future income tax rates that were in effect at the time of deferral, which can be changed by tax authorities. As well, the amounts of cash tax payments and current and deferred income tax liabilities are also based upon our anticipated mix of revenues among the jurisdictions in which we operate, which is also subject to change.
The audit and review activities of tax authorities affect the ultimate determination of the actual amounts of indirect taxes payable or receivable, income taxes payable or receivable, deferred income tax liabilities, taxes on certain items included within capital and income tax expense. Therefore, there can be no assurance that taxes will be payable as anticipated and/or that the amount and timing of receipt or use of the tax-related assets will be as currently expected.
Changes over the past 12 months
There continues to be an intense focus by the media and by political and tax authorities on taxation, both domestically and internationally, with an intent to enhance tax transparency and to address perceived tax abuses. Accordingly, our activities may increase our exposure to tax risks, from both a financial and reputational perspective.
Mitigation
We follow a comprehensive tax strategy that has been adopted by our Board. This strategy outlines the principles underlying and guiding the roles of team members, their responsibilities and personal conduct, the method of conducting business in relation to tax law and the approaches to working relationships with external tax authorities and external advisors. This strategy recognizes the requirement to comply with all relevant tax laws. The components necessary to manage tax risk are outlined in the strategy.
In giving effect to this strategy, we maintain an internal Taxation department composed of professionals who stay current on domestic and foreign tax obligations, supplemented where appropriate with external advisors. This team reviews systems and process changes for compliance with applicable domestic and international taxation laws and regulations. Its members are also responsible for the specialized accounting required for income taxes.
Material transactions are reviewed by our Taxation department so that transactions of an unusual or non-recurring nature are assessed from multiple risk-based perspectives. As a matter of regular practice, large transactions are reviewed by external tax advisors, while other third-party advisors may also be engaged to express their views as to the potential for tax liability. We continue to review and monitor our activities, so that we can take action to comply with any related regulatory, legal and tax obligations. In some cases, we also engage external advisors to review our systems and processes for tax-related compliance. The advice provided and tax returns prepared by such advisors and counsel are reviewed for reasonableness by our internal Taxation department.
10.15 The economy
Risk category: Financial
Risks to the Canadian economy include fluctuating oil prices, interest rates and levels of consumer and mortgage debt, fluctuations in the housing market and uncertainty related to trade issues, including the ongoing imposition of tariffs. Meanwhile, trade conflicts between countries, as well as other economic and political uncertainties and developments outside of Canada, may have global implications, as supply chains become increasingly integrated.
Potential impact
Economic uncertainty may cause consumers and business customers to reduce discretionary spending, impacting new service purchases, volumes of use and substitution by lower-priced alternatives.
![]()
Fluctuations in the Canadian economy could adversely impact our customer growth, revenue, profitability and free cash flow, and could potentially require us to record impairments in the carrying values of our assets, including, but not limited to, our intangible assets with indefinite lives (spectrum licences and goodwill). Impairments in the carrying values of our assets would result in a charge to earnings and a reduction in owners’ equity, but would not affect cash flow.
With certain revenues, capital acquisitions and operating costs denominated in U.S. dollars, fluctuations in the Canadian dollar exchange rate may impact our financial and operating results.
Economic and capital market fluctuations could also adversely affect the investment performance, funding and expense associated with our defined benefit pension plans, as obligations are based on certain actuarial assumptions relating to expected plan asset returns, salary escalation, retirement ages, life expectancy, the performance of the financial markets and future interest rates.
Changes over the past 12 months
See Section 1.2 The environment in which we operate for a comparison of growth rates.
In 2019, the Canadian dollar exchange rate with the U.S. dollar was volatile, with the Canadian dollar generally strengthening over the year, from $1.36 at the end of 2018 to $1.30 at the end of 2019.
The employee defined benefit pension plans, in aggregate with the application of the asset ceiling, were in a $425 million deficit position at December 31, 2019 (compared to a $57 million surplus position at the end of 2018). Our solvency position, as determined under the Pension Benefits Standards Act, 1985, was estimated to be a surplus of $568 million (compared to a $401 million surplus position at the end of 2018).
Mitigation
While economic risks cannot be completely mitigated, our top priority of putting customers first and pursuing global leadership in the likelihood of our clients to recommend our products, services and people also supports our efforts to acquire and retain customers through the economic fluctuations that affect them and us. We also continue to pursue cost reduction and efficiency initiatives in our own business (see discussion in Section 3 Corporate priorities). See Section 4.3 Liquidity and capital resources for our capital structure financial policies and plans.
Foreign currency forward contracts and currency options are leveraged to fix the exchange rates on U.S. dollar-denominated transactions, commitments, commercial paper and U.S. Dollar Notes in order to help mitigate exchange rate fluctuations and we seek to mitigate pension risk through the application of policies and procedures designed to control investment risk and through ongoing monitoring of our funding position. Our best estimate of cash contributions to our defined benefit pension plans in 2020 is $30 million ($41 million in 2019.)
10.16 Litigation and legal matters
Risk category: Compliance
Given the size of our organization, investigations, claims and lawsuits seeking damages and other relief are regularly threatened or pending against us. The expansion of our product and service offerings into areas such as healthcare, security and managed services has also added to our compliance requirements, the risk of litigation and the possibility of damages, sanctions and fines. We may also be the target of class actions due to our millions of consumer customer relationships. In addition, like other public companies, we may be subject to civil liability for misrepresentations in written disclosure and oral statements, and liability for fraud and market manipulation.
The intellectual property and proprietary rights of owners and developers of hardware, software, business processes and other technologies may be protected under statute, such as patent, copyright and industrial design legislation, or under common law, such as trade secrets. Significant damages may be awarded in intellectual property infringement claims and defendants may incur significant costs to defend or settle such claims.
Potentially material certified and uncertified class actions, intellectual property litigation and other claims against us are detailed in Note 29(a) of the Consolidated financial statements.
With operations in foreign jurisdictions, we are required to comply not just with Canadian laws and regulations, but also with local laws and regulations, which may differ substantially from Canadian laws and add to our regulatory, legal and tax exposures. In certain cases, foreign laws with extra-territorial application may also impose obligations on us.
Potential impact
It is not currently possible to predict the outcome of such legal matters due to various factors, including: the preliminary nature of some claims; uncertain damage theories and demands; incomplete factual records; the uncertain nature of legal theories and procedures and their resolution by the courts, at both the trial and appellate levels; and the unpredictable nature of opposing parties and their demands.
![]()
The adoption by governments of increasingly stringent consumer protection and privacy legislation may increase the number of class actions by creating new causes of action, or may decrease the number of class actions by improving clarity in the areas of consumer marketing and contracting and the protection of privacy. A successful class action lawsuit, by its nature, could result in a sizable damage award that could negatively affect a defendant’s financial or operating results.
There can be no assurance that our financial or operating results will not be negatively impacted by any of these factors.
Changes over the past 12 months
As our TELUS Health team and recently acquired medical clinics offer new services (such as virtual care and electronic prescription), including in some cases to consumers and in other cases through third-party partnerships, new risks arise across parameters such as dependence on third-party suppliers for legal compliance and/or compliance with medical professional standards, as well as a heightened possibility of political intervention.
With the growth and development of technology-based industries, the value of intellectual property and proprietary rights has increased. Due to trends in awarding of damages, costs to defend and the likeliness of settlements, property rights holders may be encouraged to aggressively pursue infringement claims. Given the vast array of technologies and systems that we use to deliver products and services, and the rapid change and complexity of such technologies, the number of disputes over intellectual property and proprietary rights can reasonably be expected to increase.
We have continued to observe a willingness on the part of claimants to launch class actions whereby a representative plaintiff seeks to pursue a legal claim on behalf of a large group of persons. The number of class actions filed against us varies from year to year, with claimants continually looking to expand the matters in respect of which they file class actions.
Mitigation
We believe that we have in place reasonable policies, controls, processes and contractual arrangements, as well as insurance coverage, designed to enable compliance and reduce our exposure. We have a designated Chief Data and Trust Officer, whose role is to work across the enterprise to ensure that the business has appropriate processes and controls in place in order to facilitate legal compliance and to report on compliance to the Audit Committee.
Our team of legal professionals advise on and manage risks related to claims and possible claims, vigorously defend class actions, pursue settlements in appropriate cases, regularly assess our business practices and monitor class action developments. They seek and obtain contractual protections consistent with standard industry practices to help mitigate the risks of intellectual property infringements and work to protect our intellectual property rights through litigation and other means.
We have a corporate disclosure policy that restricts the role of Company spokesperson, provides a protocol for communicating with investment analysts, investors and others and outlines our communication approach.
We rely on our team members, officers, Board of Directors, key suppliers and other business partners to demonstrate behaviour consistent with applicable legal and ethical standards in all jurisdictions within which we operate. We have an anti-bribery and corruption policy, a comprehensive code of ethics and conduct for our team members, including TELUS International, and Board of Directors, and mandatory annual integrity training for all team members and identified contractors.
Subject to the foregoing limitations, management is of the opinion, based upon legal assessments and the information presently available, that it is unlikely that any liability relating to existing investigations, claims and lawsuits, to the extent not provided for through insurance or otherwise, would have a material effect on our financial position and the results of our operations, excepting the items disclosed herein and in Note 29(a) of the Consolidated financial statements.
11. Definitions and reconciliations
11.1 Non-GAAP and other financial measures
We have issued guidance on and report certain non-GAAP measures that are used to evaluate the performance of TELUS, as well as to determine compliance with debt covenants and to manage our capital structure. As non-GAAP measures generally do not have a standardized meaning, they may not be comparable to similar measures presented by other issuers. Securities regulations require such measures to be clearly defined, qualified and reconciled with their nearest GAAP measure. Certain of the metrics do not have generally accepted industry definitions.
![]()
Adjusted Net income and adjusted basic earnings per share: These measures are used to evaluate performance at a consolidated level and exclude items that may obscure the underlying trends in business performance. These measures should not be considered alternatives to Net income and basic earnings per share in measuring TELUS’ performance. Items that may, in management’s view, obscure the underlying trends in business performance include significant gains or losses associated with real estate development partnerships, gains on exchange of wireless spectrum licences, restructuring and other costs, long-term debt prepayment premiums (when applicable), income tax-related adjustments, asset retirements related to restructuring activities and gains arising from business combinations. (See Reconciliation of adjusted Net income and Reconciliation of adjusted basic EPS in Section 1.3.)
Capital intensity: This measure is calculated as capital expenditures (excluding spectrum licences) divided by total operating revenues. This measure provides a basis for comparing the level of capital expenditures to those of other companies of varying size within the same industry.
Dividend payout ratio: This is a historical measure calculated as the sum of the last four quarterly dividends declared per Common Share, as reported in the financial statements, divided by the sum of basic earnings per share for the most recent four quarters for interim reporting periods. For fiscal years, the denominator is annual basic earnings per share. Our objective range for the annual dividend payout ratio is on a prospective basis, rather than on a trailing basis. (See Section 7.5 Liquidity and capital resource measures.)
Calculation of Dividend payout ratio1
Years ended December 31 ($) |
| 2019 |
| 2018 |
|
Numerator — Sum of the last four quarterly dividends declared per Common Share |
| 2.2525 |
| 2.10 |
|
Denominator — Net income per Common Share |
| 2.90 |
| 2.68 |
|
Ratio (%) |
| 78 |
| 78 |
|
(1) Pre-share split – see Share split – subsequent to 2019 in Section 1.3.
Dividend payout ratio of adjusted net earnings: This ratio is a historical measure calculated as the sum of the last four quarterly dividends declared per Common Share, as reported in the financial statements, divided by adjusted net earnings per share. Adjusted net earnings per share is basic earnings per share, as used in the Dividend payout ratio, adjusted to exclude the gain on the exchange of wireless spectrum licences, gains and equity income related to real estate joint ventures, provisions related to business combinations, long-term debt prepayment premium (when applicable) and income tax-related adjustments.
Calculation of Dividend payout ratio of adjusted net earnings1
Years ended December 31 ($) |
| 2019 |
| 2018 |
|
Numerator — Sum of the last four quarterly dividends declared per Common Share |
| 2.2525 |
| 2.10 |
|
Adjusted net earnings ($ millions): |
|
|
|
|
|
Net income attributable to Common Shares |
| 1,746 |
| 1,600 |
|
Add non-recurring losses and equity losses (deduct non-recurring gains and equity income) related to real estate joint ventures, after income taxes |
| 5 |
| (150 | ) |
Provisions related to business combinations, after income taxes |
| (13 | ) | (17 | ) |
Deduct net favourable income tax-related adjustments |
| (142 | ) | (7 | ) |
Add long-term debt prepayment premium, after income taxes |
| 20 |
| 25 |
|
Add initial and committed donation to TELUS Friendly Future Foundation, after income taxes |
| — |
| 90 |
|
|
| 1,616 |
| 1,541 |
|
Denominator — Adjusted net earnings per Common Share |
| 2.68 |
| 2.58 |
|
Adjusted ratio (%) |
| 84 |
| 81 |
|
(1) Pre-share split – see Share split – subsequent to 2019 in Section 1.3.
Earnings coverage: This measure is defined in the Canadian Securities Administrators’ National Instrument 41-101 and related instruments, and is calculated as follows:
Calculation of Earnings coverage
Years ended December 31 ($ millions, except ratio) |
| 2019 |
| 2018 |
|
Net income attributable to Common Shares |
| 1,746 |
| 1,600 |
|
Income taxes (attributable to Common Shares) |
| 455 |
| 542 |
|
Borrowing costs (attributable to Common Shares)1 |
| 724 |
| 630 |
|
Numerator |
| 2,925 |
| 2,772 |
|
Denominator — Borrowing costs |
| 724 |
| 630 |
|
Ratio (times) |
| 4.0 |
| 4.4 |
|
(1) Interest on Long-term debt plus Interest on short-term borrowings and other plus long-term debt prepayment premium, adding capitalized interest and deducting borrowing costs attributable to non-controlling interests.
![]()
EBITDA (earnings before interest, income taxes, depreciation and amortization): We have issued guidance on and report EBITDA because it is a key measure used to evaluate performance at a consolidated level. EBITDA is commonly reported and widely used by investors and lending institutions as an indicator of a company’s operating performance and ability to incur and service debt, and as a valuation metric. EBITDA should not be considered an alternative to Net income in measuring TELUS’ performance, nor should it be used as a measure of cash flow. EBITDA as calculated by TELUS is equivalent to Operating revenues less the total of Goods and services purchased expense and Employee benefits expense.
We calculate EBITDA — excluding restructuring and other costs, as it is a component of the EBITDA — excluding restructuring and other costs interest coverage ratio and the Net debt to EBITDA — excluding restructuring and other costs ratio.
We also calculate Adjusted EBITDA to exclude items of an unusual nature that do not reflect our ongoing operations and should not, in our opinion, be considered in a long-term valuation metric or should not be included in an assessment of our ability to service or incur debt.
EBITDA reconciliation
Years ended December 31 ($ millions) |
| 2019 |
| 2018 |
|
Net income |
| 1,776 |
| 1,624 |
|
Financing costs |
| 733 |
| 661 |
|
Income taxes |
| 468 |
| 552 |
|
Depreciation |
| 1,929 |
| 1,669 |
|
Amortization of intangible assets |
| 648 |
| 598 |
|
EBITDA |
| 5,554 |
| 5,104 |
|
Add restructuring and other costs included in EBITDA |
| 134 |
| 317 |
|
EBITDA — excluding restructuring and other costs |
| 5,688 |
| 5,421 |
|
Add non-recurring losses and equity losses (deduct non-recurring gains and equity income) related to real estate joint ventures |
| 5 |
| (171 | ) |
Adjusted EBITDA |
| 5,693 |
| 5,250 |
|
EBITDA — excluding restructuring and other costs interest coverage: This measure is defined as EBITDA —excluding restructuring and other costs, divided by Net interest cost, calculated on a 12-month trailing basis. This measure is similar to the coverage ratio covenant in our credit facilities, as described in Section 7.6 Credit facilities.
Free cash flow: We report this measure as a supplementary indicator of our operating performance, and there is no generally accepted industry definition of free cash flow. It should not be considered an alternative to the measures in the Consolidated statements of cash flows. Free cash flow excludes certain working capital changes (such as trade receivables and trade payables), proceeds from divested assets and other sources and uses of cash, as found in the Consolidated statements of cash flows. It provides an indication of how much cash generated by operations is available after capital expenditures (excluding purchases of spectrum licences) that may be used to, among other things, pay dividends, repay debt, purchase shares or make other investments. We exclude impacts of accounting changes that do not impact cash, such as IFRS 15 and IFRS 16. Free cash flow may be supplemented from time to time by proceeds from divested assets or financing activities.
![]()
Free cash flow calculation
Years ended December 31 ($ millions) |
| 2019 |
| 2018 |
|
EBITDA |
| 5,554 |
| 5,104 |
|
Deduct non-cash gains from the sale of property, plant and equipment |
| (21 | ) | (49 | ) |
Restructuring and other costs, net of disbursements |
| (36 | ) | 78 |
|
Effects of contract asset, acquisition and fulfilment (IFRS 15 impact) and TELUS Easy Payment device financing |
| (118 | ) | (203 | ) |
Effects of lease principal (IFRS 16 impact) |
| (333 | ) | — |
|
Leases formerly accounted for as finance leases (IFRS 16 impact) |
| 108 |
| — |
|
Deduct non-recurring gains and equity income related to real estate joint ventures |
| — |
| (171 | ) |
Donation to TELUS Friendly Future Foundation in TELUS Common Shares |
| — |
| 100 |
|
Items from the Consolidated statements of cash flows: |
|
|
|
|
|
Share-based compensation, net |
| (2 | ) | 16 |
|
Net employee defined benefit plans expense |
| 78 |
| 95 |
|
Employer contributions to employee defined benefit plans |
| (41 | ) | (53 | ) |
Interest paid1 |
| (714 | ) | (608 | ) |
Interest received |
| 7 |
| 9 |
|
Capital expenditures (excluding spectrum licences)2 |
| (2,906 | ) | (2,914 | ) |
Free cash flow before income taxes |
| 1,576 |
| 1,404 |
|
Income taxes paid, net of refunds |
| (644 | ) | (197 | ) |
Free cash flow |
| 932 |
| 1,207 |
|
(1) Includes $64 million interest paid on lease liabilities in 2019.
(2) Refer to Note 31 of the Consolidated financial statements for further information.
The following reconciles our definition of free cash flow with cash provided by operating activities.
Free cash flow reconciliation with Cash provided by operating activities
Years ended December 31 ($ millions) |
| 2019 |
| 2018 |
|
Free cash flow |
| 932 |
| 1,207 |
|
Add (deduct): |
|
|
|
|
|
Capital expenditures (excluding spectrum licences) |
| 2,906 |
| 2,914 |
|
Adjustments to reconcile to Cash provided by operating activities |
| 89 |
| (63 | ) |
Cash provided by operating activities |
| 3,927 |
| 4,058 |
|
Net debt: We believe that net debt is a useful measure because it represents the amount of Short-term borrowings and long-term debt obligations that are not covered by available Cash and temporary investments. The nearest IFRS measure to net debt is Long-term debt, including Current maturities of Long-term debt. Net debt is a component of the Net debt to EBITDA — excluding restructuring and other costs ratio.
Calculation of Net debt
As at December 31 ($ millions) |
| 2019 |
| 2018 |
|
Long-term debt including current maturities |
| 18,474 |
| 14,101 |
|
Debt issuance costs netted against long-term debt |
| 87 |
| 93 |
|
Derivative (assets) liabilities, net |
| (37 | ) | (73 | ) |
Accumulated other comprehensive income amounts arising from financial instruments used to manage interest rate and currency risks associated with U.S. dollar-denominated long-term debt (excluding tax effects) |
| 110 |
| (37 | ) |
Cash and temporary investments, net |
| (535 | ) | (414 | ) |
Short-term borrowings |
| 100 |
| 100 |
|
Net debt |
| 18,199 |
| 13,770 |
|
Net debt to EBITDA — excluding restructuring and other costs: This measure is defined as net debt at the end of the period divided by 12-month trailing EBITDA — excluding restructuring and other costs. (See discussion in Section 7.5 Liquidity and capital resource measures.) This measure is similar to the leverage ratio covenant in our credit facilities, as described in Section 7.6 Credit facilities.
Net interest cost: This measure is the denominator in the calculation of EBITDA — excluding restructuring and other costs interest coverage. Net interest cost is defined as financing costs, excluding capitalized long-term debt interest, employee defined benefit plans net interest and recoveries on redemption and repayment of debt, calculated on a 12-month trailing basis. Expenses recorded for the long-term debt prepayment premium, if any, are included in net interest cost. Net interest cost was $755 million in 2019 and $644 million in 2018.
![]()
Restructuring and other costs: With the objective of reducing ongoing costs, we incur associated incremental, non-recurring restructuring costs. We may also incur atypical charges, which are included in other costs, when undertaking major or transformational changes to our business or operating models or post-acquisition business integration. In other costs, we include incremental atypical external costs incurred in connection with business acquisition or disposition activity, as well as significant litigation costs in respect of losses or settlements, and adverse retrospective regulatory decisions.
Components of restructuring and other costs
Years ended December 31 ($ millions) |
| 2019 |
| 2018 |
|
Goods and services purchased |
| 65 |
| 181 |
|
Employee benefits expense |
| 69 |
| 136 |
|
Restructuring and other costs included in EBITDA |
| 134 |
| 317 |
|
11.2 Operating indicators
As a result of our subscriber definition changes effective the first quarter 2019, certain subscribers were moved from the mobile phones subscriber base to the newly created mobile connected devices subscriber base. Specifically, data-centric devices intended for limited or no cellular voice capabilities (such as tablets, internet keys, connected cars and wearables) were moved to the mobile connected devices subscriber base in alignment with the revised definitions. Our newly created mobile connected devices subscriber base combines these data-centric devices moved from mobile phone subscribers with previously undisclosed Internet of Things and mobile health subscribers.
The following measures are industry metrics that are useful in assessing the operating performance of a wireless and wireline telecommunications entity, but do not have a standardized meaning under IFRS-IASB.
Mobile phone average billing per subscriber per month (ABPU) is calculated as network revenue derived from monthly service plan, roaming and usage charges, as well as monthly re-payments of the outstanding device balance owing from customers on contract; divided by the average number of mobile phone subscribers on the network during the period, and is expressed as a rate per month.
Mobile phone average revenue per subscriber per month (ARPU) is calculated as network revenue derived from monthly service plan, roaming and usage charges; divided by the average number of mobile phone subscribers on the network during the period, and is expressed as a rate per month.
Churn is calculated as the number of subscribers deactivated during a given period divided by the average number of subscribers on the network during the period, and is expressed as a rate per month. Mobile phone churn refers to the aggregate average of both prepaid and postpaid mobile phone churn. A TELUS, Koodo or Public Mobile brand prepaid mobile phone subscriber is deactivated when the subscriber has no usage for 90 days following expiry of the prepaid credits.
Mobile connected device subscriber means a TELUS subscriber on an active service plan with a recurring revenue-generating portable unit (e.g. tablets, internet keys, Internet of Things, wearables and connected cars) that is connected to the TELUS network and is intended for limited or no cellular voice capability.
Mobile phone subscriber means a TELUS subscriber on an active service plan with a recurring revenue-generating portable unit (e.g. feature phones and smartphones) that is connected to the TELUS network and provides voice, text and/or data connectivity.
Internet subscriber means a TELUS subscriber on an active internet plan with a recurring revenue-generating fixed unit that is connected to the TELUS network and provides internet connectivity.
Residential voice subscriber means a TELUS subscriber on an active phone plan with a recurring revenue-generating fixed unit that is connected to the TELUS network and provides voice service.
Security subscriber means a TELUS subscriber on an active security plan with a recurring revenue-generating fixed unit that is connected to the TELUS security and automation platform.
TV subscriber means a TELUS subscriber on an active TV plan with a recurring revenue-generating fixed unit subscription for video services from a TELUS TV platform (e.g. Optik TV and Pik TV).
![]()