UNITED STATES
SECURITIES AND EXCHANGE COMMISSION
Washington, D.C. 20549
____________________________________________________
FORM 10-K
____________________________________________________
(Mark One)
| | | | | |
| x | ANNUAL REPORT PURSUANT TO SECTION 13 OR 15(d) OF THE SECURITIES EXCHANGE ACT OF 1934 |
For the fiscal year ended December 31, 2024
OR
| | | | | |
| o | TRANSITION REPORT PURSUANT TO SECTION 13 OR 15(d) OF THE SECURITIES EXCHANGE ACT OF 1934 |
For the transition period from ______ to ______
Commission file number 0-18914
____________________________________________________
DORMAN PRODUCTS, INC.
(Exact name of registrant as specified in its charter)
____________________________________________________
| | | | | |
| Pennsylvania | 23-2078856 |
(State or other jurisdiction of
incorporation or organization) | (I.R.S Employer
Identification No.) |
3400 East Walnut Street, Colmar, Pennsylvania 18915
(Address of principal executive offices) (Zip Code)
(215) 997-1800
(Registrant’s telephone number, including area code)
Securities registered pursuant to Section 12(b) of the Act:
| | | | | | | | | | | | | | |
| Title of each class: | | Trading Symbol(s) | | Name of each exchange on which registered: |
| Common Stock, $0.01 Par Value | | DORM | | The NASDAQ Stock Market LLC |
Securities registered pursuant to Section 12(g) of the Act: None
____________________________________________________
Indicate by check mark if the registrant is a well-known seasoned issuer, as defined in Rule 405 of the Securities Act. Yes x No o
Indicate by check mark if the registrant is not required to file reports pursuant to Section 13 or Section 15(d) of the Act. Yes o No x
Indicate by check mark whether the registrant (1) has filed all reports required to be filed by Section 13 or 15(d) of the Securities Exchange Act of 1934 during the preceding 12 months (or for such shorter period that the registrant was required to file such reports), and (2) has been subject to such filing requirements for the past 90 days. Yes x No o
Indicate by check mark whether the registrant has submitted electronically every Interactive Data File required to be submitted pursuant to Rule 405 of Regulation S-T (§232.405 of this chapter) during the preceding 12 months (or for such shorter period that the registrant was required to submit such files). Yes x No o
Indicate by check mark whether the registrant is a large accelerated filer, an accelerated filer, a non-accelerated filer, a smaller reporting company, or an emerging growth company. See the definitions of "large accelerated filer," "accelerated filer," “smaller reporting company,” and “emerging growth company” in Rule 12b-2 of the Exchange Act:
| | | | | | | | | | | |
| Large Accelerated Filer | x | Accelerated filer | o |
| | | |
| Non-accelerated filer | o | Smaller reporting company | o |
| | | |
| | Emerging growth company | o |
If an emerging growth company, indicate by check mark if the registrant has elected not to use the extended transition period for complying with any new or revised financial accounting standards provided pursuant to Section 13(a) of the Exchange Act.☐
Indicate by check mark whether the registrant has filed a report on and attestation to its management’s assessment of the effectiveness of its internal control over financial reporting under Section 404(b) of the Sarbanes-Oxley Act (15 U.S.C. 7262(b)) by the registered public accounting firm that prepared or issues its audit report. x
If securities are registered pursuant to Section 12(b) of the Act, indicate by check mark whether the financial statements of the registrant included in the filing reflect the correction of an error to previously issued financial statements. o
Indicate by check mark whether any of those error corrections are restatements that required a recovery analysis of incentive-based compensation received by any of the registrant’s executive officers during the relevant recovery period pursuant to §240.10D-1(b). o
Indicate by check mark whether the registrant is a shell company (as defined in Rule 12b-2 of the Act). Yes o No x
The aggregate market value of the voting and non-voting common equity held by non-affiliates of the registrant as of June 28, 2024 was $1,965,492,670.
As of February 24, 2025, the registrant had 30,581,562 shares of common stock, $0.01 par value, outstanding.
DOCUMENTS INCORPORATED BY REFERENCE
Certain portions of the registrant's definitive proxy statement, in connection with its 2025 Annual Meeting of Shareholders, to be filed with the Securities and Exchange Commission within 120 days after December 31, 2024, are incorporated by reference into PART III of this Annual Report on Form 10-K.
DORMAN PRODUCTS, INC.
INDEX TO ANNUAL REPORT ON FORM 10-K
December 31, 2024
As used herein, unless the context otherwise requires, “Dorman,” “the Company,” “we,” “us,” or “our” refers to Dorman Products, Inc. and its subsidiaries.
This Annual Report on Form 10-K contains the registered and unregistered trademarks or service marks that are the property of Dorman Products, Inc. and/or its affiliates. This Annual Report on Form 10-K also may contain additional trade names, trademarks or service marks belonging to other companies. We do not intend our use or display of other parties’ trademarks, trade names or service marks to imply, and such use or display should not be construed to imply, a relationship with, or endorsement or sponsorship of us by these parties.
Statement Regarding Forward-Looking Statements
Certain statements in this document constitute “forward-looking statements” within the meaning of the Private Securities Litigation Reform Act of 1995, including statements related to net sales, diluted earnings per share, gross profit, gross margin, selling, general and administrative expenses, income tax expense, income before income taxes, net income, segment income from operations, cash and cash equivalents, indebtedness, liquidity, the Company’s share repurchase program, the Company’s outlook, the Company’s growth opportunities and future business prospects, operational costs and productivity initiatives, inflation, interest rates, customs duties and tariffs, long-term value, acquisitions and acquisition opportunities, investments, cost offsets, quarterly fluctuations, new product development, customer concessions, and fluctuations in foreign currency. Words such as “may,” “believe,” “demonstrate,” “expect,” “estimate,” “forecast,” “project,” “plan,” “anticipate,” “intend,” “should,” “will” and “likely” and similar expressions identify forward-looking statements. However, the absence of these words does not mean the statements are not forward-looking. In addition, statements that are not historical should also be considered forward-looking statements. Readers are cautioned not to place undue reliance on those forward-looking statements, which speak only as of the date the statement was made. Such forward-looking statements are based on current expectations that involve known and unknown risks, uncertainties and other factors (many of which are outside of our control) which may cause actual events to be materially different from those expressed or implied by such forward-looking statements. Should one or more of these risks or uncertainties materialize, or should underlying assumptions prove incorrect, actual results may vary materially from those anticipated, estimated or projected. For information concerning factors that could cause actual results to differ materially from the information contained in this report, reference is made to the information in PART I, ITEM 1A, “Risk Factors.” The Company is under no obligation to (and expressly disclaims any such obligation to) update any of the information in this report if any forward-looking statement later turns out to be inaccurate whether as a result of new information, future events or otherwise.
PART I
ITEM 1. Business.
General
We are one of the leading suppliers of replacement and upgrade parts in the motor vehicle aftermarket industry, serving passenger cars, light-, medium-, and heavy-duty trucks, as well as specialty vehicles, including utility terrain vehicles (UTVs) and all-terrain vehicles (ATVs). As of December 31, 2024, we marketed approximately 138,000 distinct parts compared to approximately 133,000 as of December 31, 2023, many of which we designed and engineered. This number excludes private label stock keeping units and other variations in how we market, package, and distribute our products, includes distinct parts of acquired companies, and reflects distinct parts that have been discontinued at the end of their lifecycle. Our products are sold under our various brand names, under our customers’ private label brands, or in bulk. We are one of the leading aftermarket suppliers of parts that were traditionally available to professional installers and consumers only from original equipment manufacturers (OEMs) or salvage yards. These parts include, among other parts, leaf springs, intake manifolds, exhaust manifolds, oil filters and coolers, window regulators, radiator fan assemblies, tire pressure monitor sensors, exhaust gas recirculation (EGR) coolers, driveshafts, UTV windshields, and complex electronics modules. For 2024, approximately 81% of our products were sold under brands that we own, and the remainder of our products were sold for resale under customers' private labels, other brands, or in bulk. We generate most of our net sales from customers in North America, primarily in the United States. Our products are sold primarily through aftermarket retailers, including through their online platforms; dealers; national, regional, and local wholesale distributors and specialty markets; and salvage yards. We also distribute aftermarket parts outside the United States, with sales primarily into Canada and Mexico, and to a lesser extent, Europe, the Middle East, and Australia.
The Motor Vehicle Aftermarket Industry
We sell our parts in three different sectors of the motor vehicle aftermarket industry: light-duty, heavy-duty, and powersports (i.e., specialty vehicles). Combined, we estimate that these three sectors had a total addressable market of over $165 billion in 2024, according to information we have derived from the 2025 Auto Care Association Factbook and other industry data.
Light-Duty Vehicle Sector
The majority of our products are designed for light-duty vehicles, which are passenger cars and light-duty trucks. Two distinct groups of end-users buy replacement and upgrade vehicle parts for this sector: (i) individual consumers, who purchase parts to perform "do-it-yourself" repairs and upgrades on their own vehicles; and (ii) professional installers. Professional installers include: (i) individual vehicle repair shops, representing approximately 70% of the total aftermarket vehicle repair industry according to the Motor & Equipment Manufacturers Association, which generally service a variety of OEM vehicle makes and models and sell and install non-OEM aftermarket parts; and (ii) dealership service departments, which generally only service specific brands of OEM vehicles and sell and install those same OEM brand aftermarket parts. Individual consumers typically are supplied through retailers and the retail arms of warehouse distributors. Vehicle repair shops generally purchase parts through local independent parts wholesalers and national parts distributors. Automobile dealership service departments generally obtain parts through the distribution systems of vehicle manufacturers and specialized national and regional parts distributors.
Spending in the light-duty vehicle sector generally can be grouped into three categories: discretionary, maintenance, and repair. Discretionary, such as upgrade accessories and performance, tends to align with consumer discretionary spending. Maintenance is composed of products and services, such as oil and oil changes, and tends to be less correlated with discretionary spending. Repair consists mainly of replacement parts that fail over time. While some repair work may be influenced by factors such as extreme weather in the summer or winter months, this work tends to be less cyclical as it is largely comprised of parts necessary for a vehicle to function properly or safely. The majority of our net sales are from products that fall into the repair category.
The increasing complexity and the number of different makes and models of light-duty vehicles have resulted in a significant increase in the number of products required to service domestic and foreign automotive fleets. The requirement to include more products in inventory and the significant consolidation among
distributors of automotive replacement parts have in turn resulted in larger distributors. See ITEM 1A, “Risk Factors – Risks Related to Our Business – Our Industry, Operations and Competition” for information regarding the potential impacts of consolidation on our business.
Retailers and others who purchase light-duty aftermarket parts for resale often are constrained to a finite amount of space in which to display and stock products. Thus, the reputation for quality, customer service, and line profitability that a supplier provides typically are significant factors in a retailer’s or other reseller’s decision as to which product lines to carry in the limited space available. Further, because of the efficiencies achieved through the ability to order all or part of a complete line of products from one supplier (with possible volume discounts), as opposed to satisfying the same requirements through a variety of different sources, retailers and other resellers of light-duty aftermarket parts often seek to purchase products from fewer but stronger suppliers.
Heavy-Duty Vehicle Sector
The heavy-duty vehicle sector is focused on medium- and heavy-duty vehicles. The largest purchasers of aftermarket parts for this sector are independent distributors, including organizations associated with large buying groups and other distributors, as well as independent component specialists and rebuilders, and auto parts stores. The service work performed on medium- and heavy-duty vehicles is generally completed by end-user businesses that utilize these vehicles in their operations, fleets, and independent garages and distributors, who buy parts from the purchasers above or in some instances directly from suppliers like us. The majority of our sales in the heavy-duty vehicle sector are related to replacement parts.
Specialty Vehicle Sector
The specialty vehicle sector generally consists of parts for powersport vehicles, such as UTVs and ATVs, for both functional and upgrade accessories as well as replacement parts. Functional and upgrade accessories include parts such as engine performance upgrades, lighting and electronics, storage and cargo, tires and wheels, cabs, roofs and windshields, and other cosmetic parts. Nondiscretionary repair parts consist of brake systems, engine systems, electronics, frame and body parts, and driveline and transmission parts and are critical given the significant wear and tear often placed on those parts during normal use. Given the critical nature of repair parts to ensure a vehicle functions properly, purchases of those parts are generally nondiscretionary purchases. Currently, approximately half of our sales of specialty vehicle parts constitute nondiscretionary repair parts.
This sector consists of direct-to-consumer and direct-to-dealer channels through both retail and e-commerce platforms. Key purchasing decisions of customers in this sector include ease of ordering, ease of installation, the price and availability of products, delivery times, and overall product quality.
Brands and Products
We market our products under the Dorman®, Dayton Parts®, and SuperATV® names, along with several sub-brands, which identify products that address specific segments of the motor vehicle aftermarket industry.
Some of our most popular brands include:
DORMAN® – Reliable replacement automotive parts and components. A brand mechanics have trusted for more than 100 years.
DORMAN® OE FIX™ – Dorman products that are designed to be better repair solutions than the OE alternative. These parts are made to help save the service technician time and money, and increase reliability and serviceability.
HELP!® – Parts and components designed to help the automotive do-it-yourself customer, or DIYer, save time and money. A fixture in auto parts store aisles for decades.
Conduct-Tite® – Electrical tools, materials, and accessories designed to help DIYers fix and customize vehicles. This brand includes the Builders Series line of premium wiring solutions.
Dayton Parts® – An extensive product offering of heavy-duty commercial vehicle repair solutions, from cab to trailer.
SuperATV® – UTV and ATV parts and accessories designed by riders for riders.
Keller Performance Products – High-quality ball joints for specialty vehicles.
Assault Industries – West Coast-style powersports products built for the cool factor and designed with an edge.
Gboost – Clutching products for specialty vehicles.
GDP – Premium quality transmission, portals, differentials and more for UTVs and ATVs.
We offer bumper-to-bumper aftermarket solutions covering everything from engine, undercar, steering and suspension, body, electronics, and hardware. Our engine products include intake and exhaust manifolds, oil filters and coolers, fans, thermostat housings, and throttle bodies. Our undercar products include fluid lines, fluid reservoirs, connectors, 4-wheel drive components and axles, drain plugs, and other engine, transmission, and axle components. Our steering and suspension products include control arms, ball joints, tie-rod ends, brake hardware and hydraulics, wheel and axle hardware, suspension arms, knuckles, links, bushings, leaf springs, and other suspension, steering, and brake components. Our body products include door handles and hinges, window lift motors, window regulators, switches and handles, wiper components, lighting, electrical, and other interior and exterior vehicle body components, including windshields for UTVs. Our electronics products include new and remanufactured modules, clusters, and sensors. Our hardware products include threaded bolts and auto body fasteners, automotive and home electrical wiring components, and other hardware assortments and merchandise.
We warrant our products against certain defects in material and workmanship when used as designed on the vehicle on which it was originally installed. We offer a limited lifetime warranty on most of our products in the light- and medium-duty parts categories, with more limited warranties for our heavy-duty and specialty vehicle products. Our standard warranties provide for the repair or replacement of the non-performing part.
Product Development
We are committed to product development and innovation with a customer-first approach keeping owners and installers in mind. Our engineers and designers focus on solutions designed to help save repair technicians time, save vehicle owners money, and provide sought-after vehicle enhancements and differentiation.
We have dedicated teams devoted solely to ideation and innovation in support of our objective to develop new products, many of which are first to the aftermarket. Our teams of researchers, field analysts, and product specialists visit repair shop technicians and spend time with customers to listen to and understand their repair challenges and vehicle needs.
We categorize our product development opportunities across three different spectrums: (1) alternative parts - direct aftermarket replacements for factory parts, (2) upgraded parts (including our "OE FIX" line) – parts with enhanced design, functionality, or features based on identifying what made original parts problematic and developing new solutions that address the original failure modes, and (3) new parts - identifying parts that are not available from the OE or in the aftermarket that can enhance vehicle performance and user experience. Some of these opportunities are new to the aftermarket whereas others continue to expand our current portfolio offering. The following table represents the number of distinct parts we introduced for each of the last three years:
| | | | | | | | | | | | | | | | | |
| Year Ended December 31, |
| 2024 | | 2023 | | 2022 |
| New to the aftermarket | 1,659 | | 1,791 | | 1,762 |
| Line extensions | 3,676 | | 4,315 | | 3,667 |
| Total distinct parts introduced | 5,335 | | 6,106 | | 5,429 |
In 2024, we introduced a range of innovative, first-to-the-aftermarket repair solutions for the light-duty vehicle sector, designed to fit a wide variety of vehicles. Our product launches included “OE FIX” solutions such as loaded magnetic strut assemblies, turbo line replacement kits, and fully loaded knuckle assemblies. We also expanded our investment in our emerging technology solutions portfolio to support repairs for complex automotive electronic components. This included the release of transmission control modules, electronic power steering racks, and various other control modules and sensors. Additionally, we made significant additions to our industry-leading lines of turbo accessories, coolers, and chassis components.
In 2024, we significantly expanded our heavy-duty product portfolio, introducing a comprehensive range of brake components—including drums and rotors—along with a new king pin program for connecting trucks and trailers and enhancements to our leaf spring coverage. Additionally, we launched several aftermarket-exclusive products, including EGR coolers, after-treatment injectors, and engine sensors. Most notably, we proudly debuted our Dayton Exhaust components line, delivering innovative solutions for both above and below-chassis applications for Class 7 and Class 8 trucks.
In the specialty vehicles sector, in 2024 we released many first-to-the-aftermarket products covering accessories and nondiscretionary repair parts, including a complete line of geared reverse direct replacement transmissions for multiple makes and models of ATVs and UTVs. We expanded our Ready Fit® winch line, which is designed to significantly reduce installation time for the customer. We also continued our investment in innovative solutions to enhance the rider experience like a rear steer kit, driver-adjustable electronic power steering, and creature comfort items that provide improved heat and air flow within the cab, such as our electronic thermostat bypass heaters and roof-mounted fan system.
Sales and Marketing
We market our products to purchasers, many of whom in turn supply individual consumers and professional installers. Our products are available in our customers’ retail stores, on our website and our customers’ websites, and through dealers and warehouse distributors.
As of December 31, 2024, we had a sales and sales support team of approximately 300 people selling our products either directly to our customers or, for certain select customers, indirectly using independent manufacturers’ representative agencies worldwide.
Our sales efforts are not directed merely at selling individual products, but more broadly towards selling our entire product portfolio. Our sales strategy includes increasing sales not only by securing new customers, but also by adding new product lines and expanding product selection within existing customers in an effort to make our customers a destination for our aftermarket products.
Among other things, we use digital advertising, social media, email, catalogs, and brochures to describe and promote our products. Our websites include DormanProducts.com, DaytonParts.com, and SuperATV.com. These sites are not and should not be considered part of this Form 10-K and are not incorporated by reference in this Form 10-K.
As of December 31, 2024, we serviced approximately 10,000 active accounts. During 2024, two customers each accounted for more than 10% of net sales and in the aggregate accounted for approximately 39% of net sales.
Manufacturing and Procurement
Most of our light-duty vehicle products are manufactured by third parties, as are the majority of our heavy-duty vehicle products. The remainder of our heavy-duty vehicle products are manufactured in our facilities in the United States. The majority of our specialty vehicle products are manufactured in our facilities in the United States and China. We engage third-party manufacturers around the world to develop and manufacture products according to our performance and design requirements, oftentimes using tooling that we own. In 2024, as a percentage of our total dollar volume of purchases, approximately 28% of our products were purchased from third-party suppliers throughout the United States and the balance of our purchases were from third-party suppliers outside of the United States. In 2024, approximately 45% of our products were purchased from third-party suppliers located in China. Our global supplier network provides access to a broad array of manufacturing capabilities and technologies, and coupled with our diverse product portfolio, limits our dependency on any single source of supply. While our supplier selection and sourcing programs will continue to leverage our strategic manufacturers for a substantial portion of our product portfolio, we also continue to qualify alternative sources available to provide additional support and capacity, if needed. We make a concerted effort to build and nurture strong, healthy relationships with our suppliers. In 2024, we purchased motor vehicle products in substantial volumes from over 400 suppliers, and no single supplier accounted for more than 10% of our total product purchases. For more information on risks relating to our supply chain, see ITEM 1A. "Risk Factors - Risks Related to Our Business - Our Industry, Operations and Competition."
Packaging, Inventory, and Shipping
Finished products acquired from third-party suppliers or our owned manufacturing sites are received at one or more of our company or third-party-operated facilities in the United States and Canada for sorting and distribution to our customers, depending on the type of part. It is our practice to inspect samples of shipments based on supplier performance. If cleared, these shipments of finished parts are logged into our computerized production tracking systems and staged for packaging, if necessary.
We employ a variety of custom-designed packaging machines which include blister sealing, skin film sealing, clamshell sealing, bagging, and boxing lines. Packaged product generally contains our label (or a private label), a part number, a universal packaging bar code suitable for electronic scanning, a description of the part, and if appropriate, installation instructions. Products are also sold in bulk to automotive parts manufacturers and packagers. Computerized tracking systems, mechanical counting devices, and experienced
workers combine to help ensure that the proper variety and numbers of parts meet the correct packaging materials at the appropriate places and times to produce the required quantities of finished products.
Packaged inventory is either stocked in the warehouse portions of our facilities or in distribution centers maintained by our third-party logistics providers and is organized to facilitate the most efficient methods of retrieving product to fill customer orders. We strive to maintain a level of inventory to adequately meet current customer order demand with additional inventory to satisfy new customer orders and special programs.
We ship our products by contract carrier, common carrier, or parcel service. Products are generally shipped to each customer's main warehouses for redistribution within its network or to dealers for further resale. In addition to utilizing our dealer networks, our specialty vehicle products that are ordered through SuperATV websites may be shipped directly to customers. In certain circumstances, at the request of a customer, we ship directly to that customer's warehouses, stores, or other locations, either via smaller direct ship orders or consolidated store orders that are cross-docked.
Remanufacturing and Recycling Parts
Certain products we sell contain parts that can be recycled, or as more commonly referred to in our industry, remanufactured. We refer to the used product that is ultimately remanufactured as core. A used core is remanufactured and sold to the customer as a replacement for a unit on a vehicle. Customers and end-users that purchase a remanufactured replacement part will generally return the used core to us, which we then use in the remanufacturing process to make another finished good. Our core inventory consists of used cores purchased and held in our facilities, used cores that are in the process of being returned from our customers and end-users, and remanufactured cores held in finished goods inventory at our facilities. Our products that utilize cores include electronic control modules and complex mechatronics. We believe our remanufactured parts offer end-users an economical and safe way to maintain their cars on the road, while also reducing the impact on the environment.
Competition
The motor vehicle aftermarket industry is highly competitive on factors including price, product quality, breadth of product line, range of applications, and customer service. Substantially all our products are subject to competition with similar products offered by other providers. Some of these competitors are divisions and subsidiaries of companies much larger than ours that possess a longer history of operations and greater financial and other resources than we do. We also face competition from OE manufacturers who sell through their dealerships many of the same replacement parts that we sell, although these manufacturers generally sell parts only for vehicles they produce. Some of our current or former suppliers may compete with us by supplying directly to our customers. Further, some of our private label customers also compete with us. For more information on risks relating to our competition, see ITEM 1A, “Risk Factors – Risks Related to Our Business – Our Industry, Operations and Competition.”
Seasonality
Our business can be affected by weather conditions. Extremely hot or cold weather generally results in an increase in parts failure at an accelerated rate, which generally leads to an increase in our sales for the duration of the extreme weather event.
Patents, Trademarks, and Other Intellectual Property
We own patents important to our business, and we expect to continue to file patent applications to protect our research and development investments in new products.
As of December 31, 2024, we held 127 patents and 94 pending patent applications worldwide. In addition, we hold numerous trademarks in the United States and other countries. We also have licenses to intellectual property for the manufacture, use, and sale of certain of our products.
We obtain patent and other intellectual property rights used in connection with our business when practicable and when we deem it appropriate. Historically, we have done so organically, through commercial relationships, or in connection with acquisitions.
For more information concerning the risks related to patents, trademarks, and other intellectual property, see ITEM 1A, "Risk Factors – Risks Related to Our Business – Our Intellectual Property and Information Security.”
Product Safety & Regulatory Affairs
Our products and the vehicles in which they are used may be subject to safety laws and regulations promulgated by federal, state/provincial, and local governments around the world. For example, the National Highway Traffic Safety Administration (“NHTSA”) has federal oversight over product safety issues related to automobiles in the United States, and the Consumer Product Safety Commission (“CPSC”) has federal oversight over product safety issues related to off-road vehicles. While we are currently managing compliance with these various regulatory schemes and standards, changes in the regulatory climate in any of the jurisdictions where we operate could have a material adverse effect on our business, financial condition, and results of operations. For a more detailed discussion of these risks, please see ITEM 1A, "Risk Factors – Risks Related to Our Business – Product Development, Acceptance, and Quality and Regulations.”
Human Capital Resources
General
As of December 31, 2024, we had 3,787 employees worldwide, substantially all of whom were employed full-time. Our employees are categorized by various functions. “Operations” consists of employees engaged in production, product distribution, and inventory quality control. “Product Development” includes employees involved in product development and purchasing. “Quality and Engineering” consists of employees involved in internal and external quality management, manufacturing, engineering, design, and testing. “Sales” includes employees employed in sales and customer service. “Administration” includes executive officers and individuals employed in finance, legal, information technology, human resources, and other functions supporting our business. The following table shows employees by function and region.
| | | | | | | | | | | | | | | | | |
| December 31, 2024 |
| U.S. | | Non-U.S. | | Total |
| Operations | 2,604 | | 232 | | 2,836 |
| Product Development | 210 | | 1 | | 211 |
| Quality and Engineering | 176 | | 79 | | 255 |
| Sales | 265 | | 14 | | 279 |
| Administration | 197 | | 9 | | 206 |
| Total Employees | 3,452 | | 335 | | 3,787 |
None of our global employees is covered by a collective bargaining agreement. We consider our relations with our employees to be generally good.
Health and Safety
We maintain a safety culture grounded on the premise of eliminating workplace incidents, risks, and hazards. We have created and implemented processes to help eliminate safety events and reduce their frequency and severity. We also review and monitor our safety performance closely. We have adopted an environmental, health, and safety policy outlining our commitment to policies and practices that support the health and safety of our employees, contractors, and the community, and the protection of the environment in the communities where we operate. We also maintain a human rights policy for the organization outlining our commitment to operating with respect for human rights.
Culture of Contribution
We refer to our employees as “Contributors” because we are a team of innovators, collaborators, and problem-solvers working toward meaningful and mutual goals. We believe our reputation as a leader in the motor vehicle aftermarket industry can be attributed to, among other things, the diverse viewpoints and life experiences of our valued workforce. We empower and celebrate new ideas throughout our organization because new ideas are integral to our product development process and our evolution as a company. Investing in
our Contributors and promoting an environment where they feel valued and empowered is an essential part of our culture. We believe developing talented, successful people helps drive the long-term performance of our business.
Talent and Development
Our talent strategy is focused on attracting the best talent, developing their skill sets and experiences, and rewarding their performance. We focus significant attention on attracting and retaining talented and experienced individuals to manage and support our operations, and our leadership team routinely reviews employee turnover rates at various levels of the organization. Leadership also participates in a robust annual talent review and succession planning process. In addition, leadership reviews employee engagement surveys to monitor employee morale and receive feedback on a variety of issues.
Compensation
We pay our employees competitively and offer a broad range of company-paid benefits, which we believe are competitive with others in our industry and in the geographies in which we compete for talent. We conduct an executive compensation benchmarking review annually to help ensure we are providing market-based compensation, including base salary, and short-term and long-term incentives. We also participate in annual compensation surveys for all positions and strive to compensate our top talent and key roles competitively. Moreover, our equity awards are designed to promote retention of key employees by utilizing vesting schedules that are time-based as well as vesting conditions that are performance-based and tied to the achievement of the Company’s long-term goals.
For information on risks relating to our human capital resources, see ITEM 1A, “Risk Factors – General Risk Factors – Losing the services of our executive officers or other highly qualified and experienced employees, or failing to attract and retain any of such officers or employees, could adversely affect our business.”
Available Information
Our Internet address is dormanproducts.com. The information on the website is not and should not be considered part of this Form 10-K and is not incorporated by reference in this Form 10-K. The website is, and is only intended to be, for reference purposes only. We make available free of charge on or through our website our Annual Report on Form 10-K, quarterly reports on Form 10-Q and current reports on Form 8-K, and amendments to those reports filed or furnished pursuant to Section 13(a) or 15(d) of the Securities Exchange Act of 1934, as amended (the “Exchange Act”), as soon as reasonably practicable after we electronically file such material with, or furnish it to, the Securities and Exchange Commission (the “SEC”). In addition, we will provide, at no cost, paper or electronic copies of our reports and other filings made with the SEC. Requests should be directed to: Attention: Secretary, Dorman Products, Inc., 3400 East Walnut Street, Colmar, Pennsylvania 18915.
ITEM 1A. Risk Factors
In addition to the other information set forth in this report, you should carefully consider the following factors, which could materially affect our business, financial condition, or future results. The risks described below are not the only risks we face. Additional risks and uncertainties not currently known to us or that we currently deem to be immaterial also may materially affect our business, financial condition, or results of operations. The risks are listed below in no particular order.
Risks Related to Our Business
Our Industry, Operations, and Competition
Our business is impacted by the age, condition, and number of vehicles that need servicing and by improvements in the quality of new vehicle parts.
The size of the motor vehicle aftermarket industry depends, in part, upon the number of vehicles on the road, average vehicle age, change in total miles driven per year, new or modified environmental and vehicle safety regulations, including fuel-efficiency and emissions reduction standards, pricing of new and used vehicles, and new vehicle quality and related warranties. We believe the motor vehicle aftermarket industry has been negatively
impacted by the fact that the quality of certain motor vehicles and their component parts (and related warranties) has improved, thereby lengthening the repair cycle. Generally, if parts last longer, there will be less demand for our products, and the average useful life of motor vehicle parts has been steadily increasing in recent years due to innovations in products and technology. In addition, the introduction by original equipment manufacturers of increased warranty and maintenance initiatives has the potential to decrease the demand for our products. These factors could have a material adverse effect on our business, financial condition, and results of operations.
Our industry is highly competitive, and our success depends on our ability to compete with suppliers of motor vehicle aftermarket products, some of which may have greater financial, marketing, and other resources than we do.
The motor vehicle aftermarket industry is highly competitive, and our success depends on our ability to compete with domestic and international suppliers of aftermarket products. Due to the diversity of our product offering, we compete against a large cross-section of aftermarket companies and brands, including, but not limited to, Cardone Industries, Inc., Standard Motor Products, Inc., Tenneco, Inc., Bosch Auto Parts, First Brands Group, LLC, Gates Corporation, Continental Automotive Systems, Inc. (VDO), MevoTech LP, ACDelco (owned by General Motors Company), Motorcraft (owned by Ford Motor Company), Cummins Inc. (following its acquisition of Meritor, Inc.), Automann Inc., WARN Industries, Rocky Mountain ATV/MC and numerous category specific competitors. In addition, we face competition from original equipment manufacturers, which, through their dealers or dealerships, supply many of the same types of parts we sell. Further, some of our private label customers also compete with us.
Some of our competitors may have larger customer bases and greater financial, technical, and marketing resources than we do. These factors may allow our competitors to:
• respond more quickly than we can to new or emerging technologies and changes in customer requirements by devoting greater resources than we can to the development, promotion, and sale of motor vehicle aftermarket products;
• engage in more extensive research and development;
• sell products at lower prices than we do;
• undertake more extensive marketing campaigns; and
• make more attractive offers to existing and potential customers and strategic partners.
We cannot assure you that our competitors or others in our industry will not (i) adopt fast follower strategies, based on the Company's new product launches, (ii) develop products or services that are equal or superior to our products, or that achieve greater market acceptance than our products, or (iii) expand their operations into product lines produced and sold by us. We also cannot assure you that additional entrants will not enter our industry or that companies in our industry will not consolidate. Any such competitive pressures could cause us to lose market share or could result in significant price decreases and could have a material adverse effect on our business, financial condition, and results of operations.
The loss or decrease in sales among one of our top customers, or a material change in the terms on which they are willing to buy from us, could have a substantial negative impact on our sales and operating results.
A significant percentage of our sales has been, and is expected to be, concentrated among a relatively small number of customers. During 2024, two customers each accounted for more than 10% of net sales and in the aggregate accounted for approximately 39% of net sales. We anticipate that this concentration of sales among these customers will continue in the future. The loss of a significant customer, changes in customer buying behaviors, or a substantial decrease in sales to such a customer could have a material adverse effect on our sales and operating results. In addition, any consolidation among our key customers may further increase our customer concentration risk.
Also, while we may enter into long-term agreements with certain of our significant customers, those agreements generally do not contain purchase commitments, which instead are set forth in individual purchase orders submitted by customers based on their then-current or projected needs. We have in the past, and may in the future, lose customers or lose a particular product line of a customer due to the highly competitive conditions in the motor vehicle aftermarket industry, consolidation of customers, and customer initiatives to buy direct from foreign suppliers or other business considerations. In addition, given the size and scale of some of our customers, there is a risk that they may establish and grow direct relationships with our suppliers or other suppliers in the marketplace and reduce
their purchases or cease purchasing from us. A decision by any significant customer, whether motivated by competitive conditions, financial difficulties, or otherwise, to materially decrease the amount of products purchased from us or the number of our product lines they choose to carry, to change their manner of doing business with us, or to stop doing business with us, could have a material adverse effect on our business, financial condition, and results of operations.
Because our sales are concentrated, and the industry in which we operate is very competitive, we are under ongoing pressure from our customers to offer lower prices, extend payment terms, increase marketing and transportation allowances, provide enhanced rebates, discounts, rights of return and credits and offer other terms more favorable to these customers. These customer demands have put continued pressure on our operating margins and profitability and in the future could have a material adverse effect on our business, financial condition, and results of operations.
There is substantial price competition in our industry, and our success and profitability will partially depend on our ability to maintain a competitive cost and price structure.
Given the substantial price competition in our industry, our success and profitability will partially depend on our ability to maintain a competitive cost and price structure. This is the result of several industry trends, including the consolidated purchasing power of large customers, the growth of e-commerce, and actions taken by some of our competitors to attract new business, including efforts to enhance their online presence. In addition, some of our competitors may source their products from countries with more favorable U.S. tariff and trade treatment than the countries from which we source our products, enabling those competitors to offer lower prices than we do. Price reductions may be required to remain competitive, and such reductions may impact our sales and profit margins. Our future profitability will depend in part upon our ability to respond to changes in product and distribution channel mix, to continue to improve our manufacturing and distribution efficiencies, and to increase prices to address increasing costs, including costs such as tariffs that are outside of our control. In addition, our future profitability will depend in part upon our ability to generate cost reductions, including reductions in the cost of components purchased from outside suppliers, and to maintain a cost structure that will enable us to offer competitive prices. Our inability to maintain a competitive cost structure or to pass through increases in costs to our customers could have a material adverse effect on our business, financial condition, and results of operations.
The inability of our customers to grow their businesses and compete effectively may adversely affect our business.
Our products are sold primarily to aftermarket retailers; dealers; national, regional, and local wholesale distributors; professional installers; specialty markets; and salvage yards. The growth of our business depends, in part, on the ability of our customers to grow their businesses and compete effectively in their respective markets. If our customers are unable to grow while maintaining or improving their competitive position, it could adversely affect their demand for our products and services.
Factors that could impact our customers' growth and competitiveness include:
•Technological Changes: Technological advancements and the complexity of motor vehicles may render our customers less competitive if they do not make adequate investments in their businesses, including, but not limited to, investments in training and tools;
•Competitive Pressures: Increased competition from existing or new market entrants (e.g., the growth of e-commerce) could erode our customers' market share, impacting their business performance and, consequently, their demand for our products; and
•Shelf Space Limitations: The amount of space available to retailers and other resellers of our products is limited, and, therefore, our products compete with other motor vehicle aftermarket products, some of which are entirely dissimilar and otherwise non-competitive (such as car waxes and engine oil), for shelf and floor space. The failure of our customers to increase shelf space or grow in new locations may adversely impact their demand for our products.
If our customers are unable to grow their businesses and compete effectively, it could lead to reduced sales, increased credit risk, and potential loss of business for those customers, which could have a material adverse effect on our business, financial condition, and results of operations.
Customer consolidation in the motor vehicle aftermarket industry may lead to customer contract terms less favorable to us, which may negatively impact our financial results.
The motor vehicle aftermarket industry has been consolidating over the past several years. As a result of such consolidations, many of our non-end user customers have grown larger and therefore have more leverage in negotiating agreements to buy products from us. Such customers may require us to provide extended payment terms, issue customer credits, and accept returns of slow-moving product to obtain new, or retain existing, business. Although we attempt to avoid or minimize such concessions, in some cases customer payment terms have been extended, enhanced credits have been issued and returns of product have exceeded historical levels. The product returns and customer credits primarily affect our net sales and profit levels while payment term extensions and additional factoring costs generally reduce operating cash flow and require additional capital to finance our business. We expect these trends to continue for the foreseeable future.
Our growth in the specialty vehicle category depends upon our continued ability to expand our product sales into specialty vehicles, including, but not limited to, those that require performance-defining products, and the expansion of the market for these vehicles.
With our acquisition of SuperATV, a portion of our sales are generated from providing aftermarket parts and accessories for specialty vehicles, such as UTVs and ATVs, that require performance-defining products. Our success depends, in part, on the growth of the market for such vehicles. Such market growth includes the creation of new classes of vehicles that can benefit from our products and our ability to create products for these vehicles. If these markets do not expand or if they contract due to economic factors, changes in consumer preferences, or other reasons, or we are unsuccessful in creating new products for these markets or other competitors successfully enter these markets, we may fail to achieve future growth or our sales could decrease, which could have a material adverse effect on our business, financial condition, and results of operations.
If we fail to maintain sufficient inventory to meet current customer demands, or if we fail to anticipate future changes in customer demands, our financial results could be adversely affected.
We must maintain sufficient in-stock inventory and anticipate future changes in customer demands to be successful. If we fail to do so, our financial results could be adversely affected. Fluctuations in demand may result from several factors, including, but not limited to, global economic conditions, global pandemics, the age, condition, and number of vehicles that need servicing, motor vehicle parts failure rates, loss of market share, and improvements in product designs that result in enhanced quality and reliability of new vehicle parts. As a result of these and other factors, we have experienced and expect to continue to experience fluctuating levels of demand that require us to monitor, and, where appropriate, adjust our operations, including our inventory levels and staffing at our facilities. If we cannot accurately forecast future reductions in demand, we may accumulate excess or obsolete inventory and be forced to reduce hours or lay off or furlough employees. Conversely, if we cannot accurately forecast future increases in demand, we may have inventory shortfalls or inadequate staffing levels to meet demand, which may result in our inability to fill orders on a timely basis or at all and could result in penalties owed to our customers and the loss of net sales.
Our profitability may be materially adversely affected because of overstock inventory-related returns by our customers in excess of anticipated amounts.
In certain instances, we permit overstock returns of inventory that may be new, non-defective, or non-obsolete. To the extent our customer agreements permit overstock returns, those customers are generally limited to returning overstocked inventory according to a specified percentage of their annual purchases from us. We accrue for overstock returns as a percentage of net sales, after considering recent historical returns. While we believe that we make reasonable estimates for overstock returns in accordance with our revenue recognition policies, actual returns may differ from our estimates. To the extent that overstocked returns materially exceed our projections, our business, results of operations, and financial condition may be materially adversely affected.
Our operations would be materially and adversely affected if our suppliers fail to perform or if we cannot manage our supply chain effectively.
Because we purchase various types of raw materials, finished goods, equipment, and manufactured component parts from suppliers, we may be materially and adversely affected by the failure of those suppliers to perform as expected. This non-performance may consist of delivery delays or failures caused by production issues or delivery of non-conforming products. The risk of non-performance may also result from the insolvency or
bankruptcy of one or more of our suppliers. Our suppliers’ ability to supply products to us is also subject to risks, including, but not limited to, availability and cost of raw materials, political instability, new regulations or tariffs, military conflict, destruction of their facilities caused by natural and other disasters, work stoppages, and health crises.
Furthermore, because certain products we sell contain parts that are or can be recycled and remanufactured -- parts more commonly referred to in our industry as “core” – our ability to sell those products may be materially and adversely affected if we are unable to obtain those core parts from our suppliers on favorable terms, if at all.
Our efforts to protect against and minimize these risks may not always be effective. If any of our key suppliers fails to meet our needs or if our relationships with any of our key suppliers are not maintained, it may not be possible to replace such supplier without disruptions in our operations. In addition, we may not be able to consolidate or diversify our supply chain as business needs dictate, and our operations may be adversely impacted as a result. For example, we may experience delays as new suppliers are qualified or as tooling is moved or replaced. Furthermore, the replacement of a key supplier or transitioning to a new supplier in a different geography may result in production delays, product quality issues, or increased expenses, which could result in inventory shortages or lower profit margins and could have a material adverse effect on our business, financial condition, and results of operations.
Our operating results are sensitive to the availability and cost of third-party logistics providers, which are important in the manufacture and transport of our products.
We depend upon third-party logistics providers, such as ocean freight, port operators, railroad, and trucking carriers, for shipments to and from our suppliers and for delivery of our products to us and our customers. Our access to third-party logistics providers is not guaranteed, and, even if we have access to logistics providers, we may be unable to transport our products at economically attractive rates in certain circumstances, particularly in cases of adverse market conditions or disruptions to transportation infrastructure. Fluctuations in demand for third-party logistics providers and other events impacting transportation capacity and costs, such as strikes, political events, international trade disputes, war, terrorism, natural disasters, adverse weather conditions, congestion, increases in fuel prices, public health issues, including pandemics, and other events, may impact the availability of third-party logistics providers to ship our products or the cost to ship our products. For example, logistics costs and transit times for product from our suppliers were adversely impacted during 2024 by disruptive conflict around the Suez Canal, resulting in changes to our shipping routes and increased shipping costs. To the extent we enter into long-term agreements with logistics providers, our forecasts of expected capacity needed in future periods may be inaccurate because of unforeseen fluctuations in demand for these logistics services, which could result in us paying for capacity that is not needed or result in us having to purchase additional capacity on a spot-market basis. To the extent our transportation mix changes between contracted and market volume, driven by market conditions or other variables, we may observe impacts that create favorability or unfavorability in our end-to-end logistics cost structure. In addition, our business, financial position, results of operations, or cash flows could be materially and adversely affected if we are unable to pass along increased logistics costs to our customers, or if third-party transportation capacity were to decline significantly or otherwise become unavailable.
Significant inflation could adversely affect our business and financial results.
Inflation can adversely affect us by increasing our operating costs, which could have an adverse impact on our business or financial results. For example, while inflation declined in 2024, we experienced broad-based inflationary impacts during the year ended December 31, 2023 due primarily to global transportation and logistics constraints, which resulted in significantly higher transportation costs, tariffs, material costs, and wage inflation from an increasingly competitive labor market. In a highly inflationary environment, we may attempt to offset inflationary pressures with cost-saving initiatives, price increases to customers, or the use of alternative suppliers. Such initiatives, however, may not provide immediate relief from such pressures. For example, in 2023 we implemented pass-through price increases to offset inflationary cost impacts, but, given the amount of time necessary to implement those increases, there was a lag effect to the full recovery of these costs. Furthermore, in general, pricing increases that we implemented to pass through the increased costs had no added profit dollars and consequently did not fully offset the impact that the increased costs had on our gross and operating margin percentages. Moreover, pricing actions such as these may have a negative impact on customers’ willingness to purchase our products. There can be no assurance that inflationary pressures will ease or that we will be successful in implementing pricing increases in the future to recover increased inflationary costs, and such inflationary pressures could have a material adverse effect on our business, financial condition, and results of operations.
Changes in U.S. trade policy, including the imposition and enforcement of tariffs and the resulting consequences, could adversely affect our results of operations.
In 2024, approximately 72% of our products were purchased from suppliers in a variety of non-U.S. countries. The U.S. government’s trade policy with countries where we source or sell our products may change based on several factors, including, but not limited to, political and economic factors. The new political administration in the United States has signaled an intention to use tariffs more robustly in pursuing government policy and has already implemented some new tariffs. For instance, the U.S. government has imposed tariffs on certain foreign goods, including steel and aluminum, and on certain vehicle parts, which have resulted in increased costs for goods imported into the United States. When increases are made to U.S. duty rates or tariffs, reciprocal action by other countries sometimes occurs, and any such increases could impact the price of our products and cause a decline in the demand for our products. If we are unable to pass price increases on to our customer base or otherwise mitigate the costs, or if demand for our products decreases due to the higher cost, our results of operations could be materially adversely affected. In addition, further tariffs have been proposed by the United States and its trading partners and additional trade restrictions could be implemented on a broader range of products or raw materials. The resulting environment of retaliatory trade or other practices could have a material adverse effect on our business, financial condition, results of operations, customers, suppliers, and the global economy.
We have in the past, and expect to continue to, incur significant costs to comply with trade laws imposing tariffs on products imported into the U.S. However, our competitors may not comply and may engage in transshipping to avoid tariffs and import competing products at lower costs than ours. If illegal transshipments are not monitored and enforcement is not effective to limit them, these shipments could have a material adverse effect on our business, financial condition, and results of operations.
In addition to duties and tariffs, any actions taken by the United States or by foreign countries to further implement trade policy changes, including limiting foreign investment or trade, increasing regulatory requirements, or other actions that impact our ability to obtain necessary licenses or approvals could negatively impact our business. These actions are unpredictable, and any of them could also have a material adverse effect on global economic conditions and the stability of global financial markets, significantly reduce global trade, restrict our access to suppliers or customers, and have a material adverse effect on our business, financial condition and results of operations.
Our business, results of operations, and financial condition could be materially adversely affected by the effects of widespread public health pandemics that are beyond our control.
Any outbreaks of contagious diseases, public health pandemics, and other adverse public health developments in countries where we, our customers, or our suppliers operate could have a material and adverse effect on our business, results of operations, and financial condition. For example, the COVID-19 pandemic adversely impacted businesses around the world, adversely affected supply chain logistics, and contributed to increases in raw material, freight, labor, and other costs. Uncertain factors relating to pandemics include the duration, spread, and severity of the pandemic, the efficacy and distribution of vaccines and treatments designed to combat the pandemic, the effects on our customers, vendors, suppliers, and employees, and the actions, or perception of actions that may be taken, to contain or treat its impact, including declarations of states of emergency, workplace mandates, business closures, manufacturing restrictions and any prolonged period of travel, commercial and/or other similar restrictions and limitations.
Any such pandemic and the measures designed to contain its spread may negatively impact demand for our products, which could have a material and adverse effect on our business, results of operations, and financial condition. Similarly, our suppliers may not have the materials, capacity, or capability to manufacture our products according to our schedule and specifications. If our suppliers’ operations are impacted, we may need to seek alternate suppliers, which may be more expensive, may not be available, or may result in delays in shipments to us and subsequently to our customers, each of which would affect our results of operations. Further, in the event any members of our workforce, or those of our suppliers, become sick because of any pandemic or are otherwise compelled to quarantine, or refuse to comply with any related workplace mandates, we may experience shortages in labor and services that we require for our operations. The increased use of remote work environments and virtual platforms in response to any such pandemic may also increase our risk of cyber-attacks and data security breaches.
The duration of the disruption to our customers, our supply chain, and our employees, and the related financial and operational impacts to us, because of any such pandemic, cannot be estimated at this time. Should any
such disruption continue for an extended period, the impact could have a material adverse effect on our business, results of operations, and financial condition.
Product Development, Acceptance, Quality, and Regulations
If we do not continue to develop new products and bring them to market, our business, financial condition, and results of operations could be materially impacted.
Our historical growth and profitability have depended, in part, on the introduction of new parts to the motor vehicle aftermarket industry. In addition to growth through acquisitions, we invest in research and development to sustain or enhance our existing product portfolio. In certain circumstances, there may be a lengthy period between commencing these development initiatives and bringing new or improved products to market. In other instances, factors beyond our control may impact our ability to further our research and development activities. During any period of delay in research and development activities, technology advancements, customer demand and the markets for our products may move in directions that we had not anticipated. There is no guarantee that our new products or product enhancements will achieve market acceptance or that the timing of market adoption will be as predicted. As a result, there is a significant possibility that some of our development decisions, including significant expenditures on acquisitions, research and development, or investments in technologies, will not meet our expectations, and that our investment in some projects will be unprofitable. There is also a possibility that we may miss a market opportunity because we failed to invest or invested too late in a technology, product, or enhancement sought by our customers or the markets into which we sell. If we fail to make the right investments or fail to make them at the right time, competing solutions may be more attractive in the market. Investments in artificial intelligence (“AI”) also may impact our ability to develop new products. If we fail to invest in or utilize AI capabilities in our product development activities, or if our competitors adopt or use such AI capabilities more effectively in developing their own new products, our competitive position may suffer, and our revenue and profitability could be adversely affected.
The development and production of any new products are often accompanied by design and production delays and related costs. While we expect and plan for such delays and related costs, we cannot predict with precision the time and expense required to overcome these initial problems so that the products comply with specifications. Moreover, as a supplier in the motor vehicle aftermarket industry, we face additional challenges in designing and producing replacement products as original equipment manufacturers may design parts that contain enhanced technology features or proprietary technologies that are required to interface with other vehicle systems to work properly. There is a risk that we may not be able to introduce or bring to full-scale production new products as quickly as we expected in our product introduction plans, which could have a material adverse effect on our business, financial condition, and results of operations.
We may be adversely impacted by changes in, or restrictions on access to, motor vehicle technology.
The motor vehicle aftermarket industry is experiencing a period of significant technological change because of the trends toward the integration of advanced electronics into traditional products and the increase in the number of vehicles powered by fuel cells or electricity. Software, firmware, and hardware increasingly are becoming functionally integrated with, and inseparable from, physical parts. While, traditionally, repair shops and vehicle owners could diagnose and repair their vehicles with mechanical adjustments, today they often need access to vehicles’ control units using laptops, complex diagnostic tools, and software. Restrictions on access to testing and diagnostic tools, software, telematics, data, and repair information imposed by the original vehicle manufacturers or by governmental regulations may force vehicle owners to rely on dealers to perform maintenance and repairs. This in turn could limit our customers' ability to service vehicles as well as our ability to design, manufacture, and sell new products, which could have a material adverse effect on our business, financial condition, and results of operations.
These trends have led to an increase in the significance of technology to our current and future products and the amount of capital we need to invest to develop these new technologies, as well as an increase in the amount of competition we face from technology-focused new market entrants. If we misjudge the amount of capital to invest or are otherwise unable to continue providing products that meet our customers’ needs in this environment of rapid technological change, our market competitiveness could be adversely affected, which could have a material adverse effect on our business, financial condition, and results of operations.
Design and quality problems with our products could damage our reputation and adversely affect our business.
We have experienced, and in the future may experience, reliability, quality, or compatibility problems in products after their production and sale to customers. Product design and quality problems and any associated product recalls could result in damage to our reputation, loss of customers, a decrease in revenue, litigation, unexpected expenses, and a loss of market share. We have invested and will continue to invest in our engineering, design, manufacturing, and quality infrastructure to help reduce these problems; however, there can be no assurance that we can successfully remedy these issues. To the extent we experience significant quality problems in the future, it could have a material adverse effect on our business, financial condition, and results of operations.
Failure to comply with safety regulations could result in regulatory enforcement, litigation, and product recalls that damage our reputation and adversely affect our business.
Our products and the vehicles in which they are used may be subject to safety laws and regulations promulgated by federal, state/provincial, and local governments around the world. For example, the National Highway Traffic Safety Administration (“NHTSA”) has federal oversight over product safety issues related to automobiles in the United States, and the Consumer Product Safety Commission (“CPSC”) has federal oversight over product safety issues related to off-road vehicles. Changes in the regulatory climate in any of the jurisdictions where we operate could result in additional compliance costs or require us to redesign impacted products. In addition, we could become subject to regulatory enforcement actions or litigation if our products fail to comply with these regulations. Moreover, we could be required to conduct product recalls that could damage our reputation and result in additional costs. Overall, to the extent we fail to comply with safety regulations, it could have a material adverse effect on our business, financial condition, and results of operations.
Our Intellectual Property and Information Security
Cyber-attacks or other breaches of information technology security could adversely impact our business and operations.
Cyber-attacks or other breaches of network or information technology security may cause equipment failure, disruption to our operations, or the loss or theft of sensitive data relating to our Company and our employees, customers, suppliers, and business partners, including intellectual property, proprietary business information, and other sensitive material. Such attacks, which include the use of malware, encryption, computer viruses, and other means for disruption or unauthorized access, on companies have increased in frequency, scope, and potential harm in recent years. In addition, the rapid evolution and increased adoption of AI technologies may intensify our cybersecurity risks. We take preventive actions to reduce the risk of cyber incidents and protect our information technology and networks, including the data that is maintained within them. However, such preventative actions may be insufficient to repel a cyber-attack or other network breach in the future. Furthermore, because the techniques used to carry out cyber-attacks change frequently and in many instances are not recognized until after they are used against a target, we may be unable to anticipate these changes or implement adequate preventative measures. Moreover, we utilize third-party vendors that provide information technology services for various areas, including human resources functions (e.g., payroll), and parts of our operations rely upon third-party logistics providers that maintain their own information technology systems on which we rely. While we generally require these third parties to monitor and protect their information technology systems against cyber-attacks and other breaches, their efforts may not be effective. To the extent that any cyber-attack or other security breach of one of these third-party systems causes a disruption in a third-party’s operations or results in a loss or damage to our data, loss or theft of our intellectual property, or unauthorized disclosure of confidential information, including information regarding our customers and the ultimate purchasers of our products, it could disrupt our operations or cause significant damage to our reputation, affect our relationship with our customers, suppliers and employees, and lead to claims against us and ultimately harm our business. Moreover, intruders that gain access to our intellectual property and trade secrets may attempt to use that information to harm our business, by developing competing or counterfeit products. Additionally, we may be required to incur significant costs to protect against damage caused by these disruptions or security breaches in the future. Any such cyber-attacks and loss or theft of our intellectual property or unauthorized disclosure of confidential information could have a material adverse effect on our business, financial condition, and results of operations.
We are dependent, in part, on our intellectual property. If we are not able to protect our proprietary rights or if those rights are invalidated or circumvented, our business may be adversely affected.
Our business is dependent, in part, on our ability to innovate, and, as a result, we rely on our intellectual property. We generally protect our intellectual property through patents, trademarks, copyrights, trade secrets, confidentiality and nondisclosure agreements, information security practices, and other measures to the extent our budget permits. There can be no assurance that patents will be issued from pending applications that we have filed or that our patents will be sufficient to protect our key technology from misappropriation or falling into the public domain, nor can assurances be made that any of our patents, patent applications, trademarks or our other intellectual property or proprietary rights will not be misappropriated, challenged, invalidated, or circumvented. In addition, the level of protection of our proprietary technology varies by country and may be uncertain in countries that do not have well-developed judicial systems or laws that adequately protect intellectual property rights. Patent litigation and other challenges to our patents and other proprietary rights are costly and unpredictable and may prevent us from gaining and/or maintaining market exclusivity for a product in a particular geographic area. Financial considerations may also preclude us from seeking patent protection in every country where infringement litigation could arise. Our inability to predict our intellectual property requirements in all geographies and affordability constraints may also impact our intellectual property protection investment decisions. If we are unable to adequately protect our proprietary rights, we may be at a disadvantage to others who do not incur the substantial time and expense we incur to create our products. Preventing unauthorized use or infringement of our intellectual property is inherently difficult. Moreover, it may be difficult or practically impossible to detect theft or unauthorized use of our intellectual property. Any of the foregoing could have a material adverse effect on our business, financial condition, and results of operations.
Claims of intellectual property infringement by original equipment manufacturers and others could adversely affect our business and negatively impact our ability to develop new products.
From time to time in the ordinary course of our business, we are subject to claims that we are infringing the intellectual property rights of original equipment manufacturers, competitors, non-practicing entities, or others. Any such infringement claim could have a material adverse effect on our business, financial condition, and results of operations due to an increase in legal expense, a time burden on employees involved in the defense of such claim, or slowed development and/or production of an accused product. This may be true whether they are with or without merit and whether they are covered by insurance or not. An adverse finding against us in these or similar intellectual property disputes may have a material adverse effect on our business, financial condition, and results of operations if we are not able to successfully develop or license non-infringing alternatives. In addition, an unfavorable ruling in intellectual property litigation could subject us to significant liability, increased legal expense, and require us to cease developing or selling the affected products. Any significant restriction that impedes our ability to develop and commercialize our products could have a material adverse effect on our business, financial condition, and results of operations.
Failure to maintain the value of our brands could have an adverse effect on our reputation, cause us to incur significant costs, and negatively impact our business.
Our brands are an important component of our value proposition and serve to distinguish our products from those of our competitors. We believe that our success depends, in part, on maintaining and enhancing the value of our brands and executing our brand strategies, which are designed to drive demand for our products and, where we do not sell direct to end-users of our products, make us a valued business partner to our customers through the support of their marketing initiatives. A decline in the reputation of our brands because of events, such as deficiencies or defects in the design or manufacture of our products, from legal proceedings, product recalls or warranty claims resulting from such deficiencies or defects, or from failures to meet stakeholder expectations regarding environmental, social, and governance matters may harm our reputation, reduce demand for our products, and adversely affect our business. Moreover, our business may be adversely affected if we fail to develop adequate branding strategies following acquisitions of companies with their own established brands. In addition to the foregoing, certain of our customer agreements require us to supply them with private-label branded products. To the extent we use our own products to promote the brands of our customers over our own brands, our business may be adversely affected.
Risks Related to Our Capital Structure and Finances
Increasing our indebtedness could negatively affect our financial health.
We have a credit agreement with Bank of America, N.A., as administrative agent, under which we borrowed $500.0 million in the form of a term loan and through which we have a $600.0 million revolving credit facility. As of December 31, 2024, there was $468.8 million in outstanding borrowings under the term loan and $14.0 million in
outstanding borrowings under the revolving portion of the credit agreement, and as of such date, we had three outstanding letters of credit for $1.2 million in the aggregate.
Our outstanding indebtedness and any additional indebtedness we incur may have negative consequences on our business, including, among others: requiring us to use cash to pay the principal of and interest on our indebtedness, thereby reducing the amount of cash available for other purposes; limiting our ability to obtain additional financing for working capital, capital expenditures, acquisitions, stock repurchases, and general corporate or other purposes; and limiting our flexibility in planning for, or reacting to, changes in our business, industries, or the market.
Our ability to make payments of principal and interest on our indebtedness depends upon our future performance, which is subject to economic conditions, interest rates, industry cycles, and financial, business, and other factors, many of which are beyond our control. If we are unable to generate sufficient cash flow from operations to service our indebtedness, we may be required to, among other things: refinance or restructure all or a portion of our indebtedness; reduce or delay planned capital or operating expenditures; reduce, suspend, or eliminate our stock repurchase program; or sell selected assets. Such measures might not be sufficient to enable us to service our indebtedness. In addition, any such refinancing, restructuring, or sale of assets might not be available on economically favorable terms or at all, and if prevailing interest rates at the time of any such refinancing or restructuring are higher than our current rates, interest expense related to such refinancing or restructuring would increase. The occurrence of any of such events could have a material adverse effect on our business, financial condition, and results of operations.
Our credit agreement contains covenants that restrict our operational flexibility. If we cannot comply with these covenants, we may be in default under our credit agreement.
Our credit agreement contains affirmative and negative covenants, including requirements that we maintain specified financial ratios, which limit and restrict our operations and may hamper our ability to engage in activities that may be in our long-term best interests. Events beyond our control could affect our ability to meet these and other covenants under the credit agreement. Moreover, our credit agreement is guaranteed by our material domestic subsidiaries and is supported by a security interest in substantially all our and their personal property and assets, subject to certain exceptions.
Our failure to comply with our covenants and other obligations under the credit agreement may result in an event of default thereunder. A default, if not cured or waived, may permit acceleration of our indebtedness and provide our lenders with the ability to foreclose on the collateral securing their loans. If our indebtedness is accelerated, we cannot be certain that we will have sufficient funds available to pay down the indebtedness (together with accrued interest and fees), or that we will have the ability to refinance the accelerated indebtedness on terms favorable to us or at all. This could have a material adverse effect on our business, financial condition, and results of operations.
We are exposed to risks related to accounts receivable sales agreements.
We have entered into several customer-sponsored programs administered by unrelated financial institutions that permit us to sell certain accounts receivable at discounted rates to the financial institutions without recourse. These agreements permit us to recover on our accounts receivable sooner than if they were not in place and help reduce the risk of non-payment by customers. The financial institutions with which we have these agreements may experience financial difficulties or may modify or terminate these agreements because of changes in our customers’ credit profiles, market conditions, or otherwise. The modification, termination, or other loss of these arrangements could have a material and adverse effect on our liquidity and our financial condition, results of operations, and cash flows. Certain of our customers, however, do not offer the ability to participate in such sponsored programs. If we do not enter into these agreements, our financial condition, results of operations, and cash flows could be materially and adversely affected by delays or failures in collecting trade accounts receivables.
Interest rate increases may adversely affect our financial condition and results of operations.
Borrowings under our credit agreement are at variable rates of interest and expose us to interest rate risk. If interest rates increase, our debt service obligations on the variable rate indebtedness will increase even though the amount borrowed remains the same. As a result, our net income, and cash flows, including cash available for servicing our indebtedness, will correspondingly decrease. A one-percentage-point increase in the interest rates on
outstanding borrowings under our credit agreement would have increased our interest expense by approximately $5.6 million for the year ended December 31, 2024.
Our accounts receivable sales agreements are variable rate instruments impacted by reference interest rates, such as the Term Secured Overnight Financing Rate ("Term SOFR"), which are components of the discount rate applicable to each arrangement. A one-percentage-point increase in the discount rates on these arrangements would have increased our factoring costs by approximately $8.8 million for the year ended December 31, 2024. Rising interest rates increase the costs associated with these arrangements and result in us collecting less on our accounts receivable serviced through them. If interest rates increase such that the cost of these arrangements becomes more than the cost of servicing our receivables with existing debt, we may not be able to rely on such arrangements, which could have a material adverse effect on our business, financial condition, and results of operations.
We extend credit to our customers, some of whom may be unable to pay in the future.
We regularly extend credit to our customers. A significant percentage of our accounts receivable have been, and are expected to continue to be, concentrated among a relatively small number of retailers, dealers, and distributors in the United States. Our four largest customers accounted for 78% of total accounts receivable as of December 31, 2024, and 74% of total accounts receivable as of December 31, 2023. In the ordinary course of business, management monitors, among other things, credit terms and credit limits for these and other customers. In addition, from time to time, some of our customers request increases in their credit limits. Such requests may pose incremental risks to us, either by increasing the credit limit for a customer and accepting additional financial risk of non-payment or maintaining the credit limit and risking the customer redirecting business to another supplier offering better credit terms. If any of our customers were unable to pay, or if any of those customers redirect their business to other suppliers offering better credit terms, it could have a material adverse effect on our business, financial condition, and results of operations.
Our business may be negatively impacted by our dependence on foreign suppliers and by foreign currency fluctuations.
In 2024, approximately 72% of our products were purchased from suppliers in a variety of non-U.S. countries, with the largest portion of our overseas purchases being made in China. As a result of the magnitude of our foreign sourcing, our business may be subject to various risks, including the following:
a.uncertainty caused by the elimination of import quotas and the possible imposition of additional quotas, bans on importing goods or materials from certain countries or regions, or other retaliatory or punitive trade measures;
b.imposition of duties, tariffs, taxes, and other charges on imports;
c.significant devaluation of the U.S. dollar against foreign currencies;
d.restrictions on the transfer of funds to or from foreign countries;
e.political instability, military conflict, or terrorism involving the United States or any of the countries where our products are manufactured or sold, which could cause labor shortages, a delay in transportation, or an increase in costs of transportation, labor, raw materials, or finished product or otherwise disrupt our business operations; and
f.disease, epidemics, and health-related concerns could result in closed factories, reduced workforces, scarcity of raw materials, and scrutiny and embargoing of goods produced in infected areas.
In addition to the foregoing, the products we purchase from our foreign suppliers generally are purchased through purchase orders with the purchase price specified in U.S. dollars. Accordingly, we generally do not have exposure to fluctuations in the relationship between the U.S. dollar and various foreign currencies between the time of execution of the purchase order and payment for the product. To the extent that the U.S. dollar changes in value relative to those foreign currencies in the future, the prices charged by our suppliers under new purchase orders may change in equivalent U.S. dollars. For example, the Chinese yuan to U.S. dollar exchange rate has fluctuated over the past several years. Any future changes in the value of the Chinese yuan relative to the U.S. dollar may result in a change in the cost of products that we purchase from China in the future.
If these risks limit or prevent us from acquiring products from foreign suppliers or significantly increase the cost of our products, our operations could be seriously disrupted until alternative suppliers are found, which could have a material adverse effect on our business, financial condition, and results of operations.
Dorman’s Non-Executive Chairman and his family members own a significant portion of the Company.
As of February 24, 2025, Steven L. Berman, our Non-Executive Chairman, and his family members beneficially owned approximately 15% of the Company’s outstanding common stock. As such, Mr. Berman and his family members could influence matters requiring the approval of shareholders, including the election of the Board of Directors and the approval of significant transactions. Such concentration of ownership may have the effect of delaying, preventing, or deterring a change in control of the Company, could deprive shareholders of an opportunity to receive a premium for their common stock as part of a sale of the Company, and might ultimately affect the market price of our common stock. Moreover, sales of substantial amounts of the shares beneficially owned by Mr. Berman and his family members, including shares held in family trusts and foundations, or the perception that such sales could occur, may lower the prevailing market price of our common stock.
General Risk Factors
Unfavorable economic conditions may adversely affect our business.
Adverse changes in economic conditions, including inflation, recession, increases in fuel prices, decreased transportation capacity, rising interest rates, tariffs, labor shortages and unemployment levels, availability of consumer credit, taxation, or instability in the financial markets or credit markets may either lower demand for our products or increase our operational costs, or both. Such conditions may also materially impact our customers, suppliers, dealers, and other parties with whom we do business. Our revenue will be adversely affected if demand for our products declines. The impact of unfavorable economic conditions may also limit discretionary spending or otherwise impair the ability of our customers to pay for products they have purchased. As a result, reserves for doubtful accounts and write-offs of accounts receivables may increase and failure to collect a significant portion of amounts due on those receivables could have a material adverse effect on our business, financial condition, and results of operations.
Our operations, revenues, and operating results, and the operations of our third-party manufacturers, suppliers, warehouse and distribution providers, and customers, may be subject to quarter-over-quarter fluctuations and disruptions from events beyond our or their control.
Our operations, revenues, and operating results, as well as the operations of our third-party manufacturers, suppliers, warehouse, distribution and logistics providers, and customers, may be subject to quarter-over-quarter fluctuations and disruptions from a variety of causes outside of our or their control, including work stoppages, market volatility, fuel and transportation prices, acts of war, terrorism, cyber incidents, pandemics, power outages, fires, earthquakes, flooding, changes in weather patterns, weather or seasonal fluctuations or other climate-based changes, including hurricanes or tornadoes, or other natural disasters. If a major disruption were to occur at our operations or the operations of our third-party manufacturers, suppliers, warehouse and distribution providers, or customers, it could result in harm to people or the natural environment, delays in shipments of products to customers, or suspension of operations. In addition, such events could result in our inability to fill orders on a timely basis or at all and result in penalties owed to our customers and the loss of net sales. Any of the foregoing could have a material adverse effect on our business, financial condition, and results of operations.
We rely extensively on computer systems to manage inventory, process transactions, and timely provide products to our customers. These systems are subject to damage or interruption from power outages, telecommunications failures, computer viruses, security breaches, cyber-attacks, or other catastrophic events. If these systems are damaged or fail to function properly, we may experience loss of critical data and interruptions or delays in our ability to manage inventories or process customer transactions. Such a disruption to these systems could negatively impact net sales and could have a material adverse effect on our business, financial condition, and results of operations.
Unfavorable results of legal proceedings could materially adversely affect us.
We are subject to various legal proceedings and claims that arise out of the ordinary course of our business, such as those involving contracts, employment matters, competitive practices, and intellectual property infringement. In addition, if our products are defective or installed or used incorrectly by customers, bodily injury, property damage, or other injury, including death, may result and could give rise to product liability claims against us. Legal
proceedings and claims may be time-consuming and expensive to prosecute, defend, or conduct. This may be true whether they are with or without merit and whether they are covered by insurance or not. They also may divert management’s attention and other resources; inhibit our ability to sell our products; result in adverse judgments for damages, injunctive relief, penalties, and fines; and negatively affect our reputation, business, financial condition, and results of operations. There can be no assurance regarding the outcome of current or future legal proceedings, claims, or investigations.
The market price of our common stock may be volatile and could expose us to securities class action litigation and increased shareholder activism.
The stock market and the price of our common stock may be subject to wide fluctuations based on general economic and market conditions. The market price for our common stock also may be affected by our ability to meet analysts’ expectations. Failure to meet such expectations, even slightly, could negatively affect the market price of our common stock. In addition, stock market volatility has had a significant effect on the market prices of securities issued by many companies for reasons unrelated to the operating performance of these companies. Downturns in the stock market may cause the price of our common stock to decline.
Following periods of volatility in the market price of a company’s securities, securities class action litigation has often been instituted against such companies. If similar litigation were instituted against us, it could result in substantial costs and a diversion of our management’s attention and resources, which could have a material adverse effect on our business, financial condition, and results of operations. In addition, market price volatility may attract shareholder activism, which could take many forms, including potential proxy contests and public information campaigns. Shareholder activism could cause us to incur substantial costs, adversely affect our relationships with suppliers, customers, and regulators, and adversely impact our stock price.
Losing the services of our executive officers or other highly qualified and experienced employees or failing to attract and retain any of such officers or employees could adversely affect our business.
Our future success depends upon the continued contributions of our executive officers and senior management, many of whom have numerous years of experience and would be extremely difficult to replace. We must also attract and retain experienced and highly skilled engineering, sales and marketing, finance, logistics, information technology, and operations personnel. Although we periodically conduct compensation benchmarking and surveys, competition for qualified personnel is often intense, our compensation programs may not be adequately designed, and we may not be successful in hiring and retaining these people. To the extent we experience increases in demand for labor, because of competition or otherwise, such increases in demand may drive higher wages for impacted roles and our ability to attract talent and maintain a competitive cost structure may be challenged. If we lose the services of our key employees, cannot attract and retain other qualified personnel, or cannot maintain a competitive cost structure because of any of the foregoing, it could have a material adverse effect on our business, financial condition, and results of operations.
Our growth may be impacted by acquisitions. We may not be able to identify suitable acquisition candidates, complete acquisitions or integrate acquisitions successfully.
Our future growth may depend in part on our ability to acquire and successfully integrate new businesses. We may not be able to identify suitable acquisition candidates, complete acquisitions, or integrate acquisitions successfully. We may seek additional acquisition opportunities, both to further diversify our businesses and to penetrate or expand important product offerings, geographies, or markets. There are no assurances, however, that we will be able to successfully identify suitable candidates, negotiate appropriate terms, obtain financing on acceptable terms, complete proposed acquisitions, successfully integrate acquired businesses, or expand into new geographies or markets. Once acquired, operations may not achieve anticipated levels of revenues or profitability. Acquisitions involve risks, including difficulties in the integration of the operations, technologies, services, and products of the acquired companies and the diversion of management's attention from other business concerns. Although our management will endeavor to evaluate the risks inherent in any particular transaction, there are no assurances that we will properly ascertain all such risks. Difficulties encountered with acquisitions could have a material adverse effect on our business, financial condition, and results of operations.
Changes in tax laws or exposure to additional income tax liabilities could have a material adverse effect on our business, financial condition, and results of operations.
We are subject to income taxes, as well as non-income-based taxes, at the federal, state, and local levels. We are subject to tax audits in various jurisdictions. Tax authorities may disagree with certain positions we have taken and assess additional taxes. We regularly assess the likely outcomes of these audits to determine the appropriateness of our tax provisions. However, there can be no assurance that we will accurately predict the outcomes of these audits, and the actual outcomes of these audits could have a material adverse effect on our business, financial condition, and results of operations. Additionally, changes in tax laws or tax rulings could materially impact our effective tax rate.
Global climate change and related regulations could negatively affect our business.
The effects of climate change, such as extreme weather conditions, create financial risks to our business. For example, the demand for our products may be affected by unseasonable weather conditions. The effects of climate change could also disrupt our operations by impacting the availability and cost of materials needed for manufacturing and could increase insurance and other operating costs. We could also face indirect financial risks passed through the supply chain and disruptions that could result in increased prices for our products and the resources needed to produce them.
Climate change is continuing to receive ever-increasing attention worldwide. Many scientists, legislators, and others attribute climate change to increased levels of greenhouse gases, including carbon dioxide, which could lead to additional legislative and regulatory efforts to limit greenhouse gas emissions. New international, federal, or state legislative or regulatory restrictions or standards adopted regarding emissions of carbon dioxide that may be imposed on motor vehicles and related fuels could adversely affect demand for motor vehicles, annual miles driven, or the products we sell and could lead to or require changes in motor vehicle technology or increased costs. For example, California recently enacted a climate-focused disclosure law. We will be required to spend significant time and resources to comply with this type of new law. Compliance with any new or more stringent laws, regulations, or standards, or stricter interpretations of existing laws, regulations, or standards, could require us to incur increased capital expenditures. While we have been committed to continuous improvements to our product portfolio to meet and exceed anticipated laws, regulations, and standards, there can be no assurance that our actions will be successful, that our products will be accepted by the market, that proposed regulation or deregulation will not have a negative competitive impact, or that economic returns will reflect our investments in new product development.
We could be adversely affected by violations of the U.S. Foreign Corrupt Practices Act and similar anti- bribery laws around the world.
The U.S. Foreign Corrupt Practices Act (the "FCPA") and similar anti-bribery laws in other jurisdictions generally prohibit companies and their intermediaries from making improper payments to government officials or other persons for the purpose of obtaining or retaining business. Recent years have seen a substantial increase in anti-bribery law enforcement activity, with more frequent and aggressive investigations and enforcement proceedings by both U.S. and non-U.S. regulators, and increases in criminal and civil proceedings brought against companies and individuals. Our policies mandate compliance with these anti-bribery laws. We operate in parts of the world that are recognized as having governmental and commercial corruption and local customs and practices that can be inconsistent with anti-bribery laws. We cannot assure you that our internal control policies and procedures will always protect us from reckless or criminal acts committed by our employees or third-party intermediaries. If we believe or have reason to believe that our employees or agents have or may have violated applicable anti-corruption laws, or if we are subject to allegations of any such violations, we may be required to investigate or have outside counsel investigate the relevant facts and circumstances, which can be expensive and require significant time and attention from senior management. Violations of these laws may result in criminal or civil sanctions, which could disrupt our business and result in a material adverse effect on our reputation, business, financial condition, and results of operations. In addition, we could be subject to commercial impacts such as lost revenue from customers who decline to do business with us because of such compliance matters, or we could be subject to lawsuits brought by private litigants, each of which could have a material adverse effect on our reputation, business, financial condition, and results of operations.
Our products are subject to import and export controls and economic sanctions laws and regulations in various jurisdictions, and violations could adversely affect us.
Import and export controls and economic sanctions laws and regulations include restrictions and prohibitions on the sale or supply of certain products and on our transfer of parts, components, and related technical information and know-how to certain countries, regions, governments, persons, and entities. Various countries regulate the importation of certain products through import permitting and licensing requirements and have enacted laws that could limit our ability to distribute our products. The exportation, re-exportation, transfers within foreign countries, and importation of our products, including by our suppliers and vendors, must comply with these laws and regulations, and any violations may result in reputational harm, government investigations and penalties, and denial or curtailment of importing or exporting activities. Complying with export control and sanctions laws for a particular sale may be time-consuming, may increase our costs, and may result in the delay or loss of sales opportunities. If we are found to be in violation of U.S. sanctions or export control laws, or similar laws in other jurisdictions, we and the individuals working for us could incur substantial fines and penalties. Changes in export, sanctions, or import laws or regulations may delay the introduction and sale of our products in the U.S. and international markets, require us to spend resources to seek necessary government authorizations or to develop different versions of our products, or, in some cases, prevent the export or import of our products to certain countries, regions, governments, persons, or entities, which could adversely affect our business, financial condition, and operating results.
ITEM 1B. Unresolved Staff Comments.
None
ITEM 1C. Cybersecurity
Risk Assessment
We depend on a variety of information systems and technologies (including cloud technologies) (collectively, “IT Systems”) to manage our business. We rely on these IT Systems to provide information for substantially all of our business operations, including supply chain, order processing, e-commerce, human resources, legal, compliance, marketing, finance, and accounting. Our core IT Systems consist mostly of purchased and licensed software programs that integrate together and with our internally developed solutions. As part of our risk management program, we monitor and assess the risks posed by cybersecurity threats to those internal and external systems and solutions and maintain an information security program designed to mitigate such risks.
Our information security program includes development, implementation, and improvement of policies and procedures to safeguard information to help ensure availability of critical data and systems. To the extent we utilize third-party vendors to provide information technology services for various areas, including human resources functions (e.g., payroll), we generally require these vendors to monitor and protect their information technology systems against cyber-attacks and other breaches. The Company's technology environment is managed by an experienced team of professionals who follow an extensive set of policies and procedures related to data security. Our program further includes review and assessment by external, independent third parties, who assess and report on our internal incident response preparedness and help identify areas for continued focus and improvement. With the assistance of one such reputable third party, the Company conducts biannual maturity assessments of its IT Systems against the National Institute of Standards of Technology (NIST) Cybersecurity Framework. We also carry insurance that provides protection against the risks from cybersecurity threats. To our knowledge, during 2024, there were no material cybersecurity incidents or threats that materially affected or are reasonably likely to materially affect the Company’s business strategy, results of operations, or financial condition.
Governance
Pursuant to its charter, the Audit Committee of the Board of Directors (the “Board”) has oversight of the Company's information security program, including, but not limited to, risks regarding cybersecurity threats. In particular, the Audit Committee reviews with management the Company’s key IT Systems and evaluates the adequacy of the Company’s information security program, compliance, and controls.
The Company's Senior Vice President and Chief Information Officer (“CIO”), who reports to the Company’s Chief Executive Officer, is responsible for the operation of the Company’s information security program. Our CIO is an IT veteran with over 25 years of experience in building and maturing cyber programs for large public companies. The CIO is supported by an internal team of certified security analysts who work in conjunction with leading security operations managed service providers to manage detection and response.
On at least an annual basis, a cyber risk report that highlights program governance, risks, and opportunities is provided to the Audit Committee and the full Board.
The Company maintains a Security Committee, which is led by the CIO and is comprised of individuals from the Company’s IT department – including dedicated security team members with various security certifications. The Security Committee regularly reviews information security program governance and key performance indicators. These reviews typically include the number of events, number of investigations, mean response time, and cyber trends. The Security Committee oversees the Company’s security roadmap and ensures the monitoring of information security policies and procedures covering areas such as back-up and retention, acceptable use, disaster recovery, incident management, and passwords.
The success of the Company’s information security program relies not only on ownership by the CIO’s organization but also on an active and collaborative relationship within the business. The Company requires all employees to complete cyber training annually. For 2024, the Company maintained a security learning management system with phishing simulations distributed regularly to enhance cyber resiliency. Additionally, the Company leverages communications, contests, policies, videos, and visuals to continuously raise awareness among employees.
ITEM 2. Properties.
Facilities
As of December 31, 2024, we had 38 warehouse and office facilities located throughout the United States, Canada, China, Taiwan, and India. Five of these facilities are owned and the remainder are leased. Our principal facilities are as follows:
| | | | | | | | | | | | | | | | | | | | | | | | | | | | | |
| Location | | Description | | Size | | Ownership |
| Portland, TN | | Warehouse and office | | 997,310 | | sq. ft. | | Leased | |
| Whiteland, IN | | Warehouse and office | | 827,180 | | sq. ft. | | Leased | |
| Warsaw, KY | | Warehouse and office | | 710,500 | | sq. ft. | | Owned | |
| Shepherdsville, KY | | Warehouse | | 436,716 | | sq. ft. | | Leased | |
| Colmar, PA | | Corporate headquarters
Warehouse and office | | 342,000 | | sq. ft. | | Leased | |
| Madison, IN | | Warehouse and office | | 333,000 | | sq. ft. | | Leased | (1) |
| Shiremanstown, PA | | Warehouse and office | | 318,872 | | sq. ft. | | Leased | |
| Durant, OK | | Warehouse and office | | 208,000 | | sq. ft. | | Owned | |
| Lewisberry, PA | | Warehouse and office | | 170,500 | | sq. ft. | | Leased | (2) |
| Madison, IN | | Warehouse | | 145,000 | | sq. ft. | | Leased | (1) |
| Las Vegas, NV | | Warehouse and office | | 122,071 | | sq. ft. | | Leased | |
| Jiangsu Province, China | | Warehouse and office | | 105,911 | | sq. ft. | | Leased | |
| Harrisburg, PA | | Warehouse and office | | 101,750 | | sq. ft. | | Leased | |
| Harrisburg, PA | | Manufacturing Facility | | 101,132 | | sq. ft. | | Owned | |
| Lewisville, TX | | Warehouse and office | | 101,029 | | sq. ft. | | Leased | |
| Virginia Beach, VA | | Warehouse and office | | 101,000 | | sq. ft. | | Leased | |
| Warsaw, KY | | Warehouse | | 80,000 | | sq. ft. | | Leased | |
| Shreveport, LA | | Warehouse and office | | 65,000 | | sq. ft. | | Leased | (1) |
| Reno, NV | | Warehouse and office | | 54,354 | | sq. ft. | | Leased | |
| Kankakee, IL | | Manufacturing Facility | | 53,574 | | sq. ft. | | Owned | |
(1)We lease two facilities in Madison and one facility in Shreveport (consisting of an aggregate of approximately 543,000 square feet) from limited liability companies in which Ms. Lindsay Hunt, our President, Specialty Vehicles, and members of her family are owners. Under the three lease agreements, we paid an aggregate rent of $2.8 million in 2024. The rent payable under each lease will increase by 2% on October 4th of each year. Each of the three leases commenced in October 2022 in connection with the SuperATV acquisition and will expire on October 4, 2027.
(2)We lease one of our two Lewisberry facilities (consisting of approximately 142,500 square feet) from a limited liability company of which our Non-Executive Chairman, Steven L. Berman, and certain of his family members are owners. Under this lease agreement, we paid rent of $0.7 million in 2024. The rent payable will be increased by 3% on July 1st of each year. This lease commenced in September 2020 and will expire on December 31, 2027.
ITEM 3. Legal Proceedings.
The information set forth under the heading “Other Contingencies” appearing in Note 11, “Commitments and Contingencies,” to the Notes to Consolidated Financial Statements contained in PART II, ITEM 8 of this report is incorporated herein by reference.
ITEM 4. Mine Safety Disclosures.
Not Applicable
ITEM 4.1. Information about Our Executive Officers.
The following table sets forth certain information with respect to our executive officers as of February 27, 2025:
| | | | | | | | | | | | | | |
| Name | | Age | | Position with the Company |
| Kevin M. Olsen | | 53 | | President and Chief Executive Officer |
| Brian J. Borradaile | | 47 | | Senior Vice President, Strategy and Corporate Development |
| Joseph P. Braun | | 51 | | Senior Vice President, General Counsel and Secretary |
| Jeffrey L. Darby | | 57 | | Senior Vice President, Sales and Marketing |
| David M. Hession | | 56 | | Senior Vice President, Chief Financial Officer and Treasurer |
| Lindsay Hunt | | 39 | | President and Chief Executive Officer, Specialty Vehicles |
| Scott D. Leff | | 53 | | Senior Vice President, Chief Human Resources Officer |
| Donna M. Long | | 57 | | Senior Vice President, Chief Information Officer |
| Eric B. Luftig | | 51 | | Senior Vice President, Product |
| John R. McKnight | | 56 | | President, Heavy Duty |
| Tayfun Uner | | 52 | | President, Light Duty |
Kevin M. Olsen joined the Company in July 2016 as Senior Vice President and Chief Financial Officer. He became Executive Vice President, Chief Financial Officer in June 2017, President and Chief Operating Officer in August 2018 and President and Chief Executive Officer in January 2019. Prior to joining the Company, Mr. Olsen was Chief Financial Officer of Colfax Fluid Handling, a division of Colfax Corporation, a diversified global manufacturing and engineering company that provides gas and fluid-handling and fabrication technology products and services to commercial and governmental customers around the world, from January 2013 through June 2016. Prior to joining Colfax, he served in progressively responsible management roles at the Forged Products Aero Turbine Division of Precision Castparts Corp, Crane Energy Flow Solutions, a division of Crane Co., Netshape Technologies, Inc., and Danaher Corporation. Prior thereto, Mr. Olsen performed public accounting work at PricewaterhouseCoopers LLP. Mr. Olsen is also a director of Twin Disc, Inc., a publicly traded international manufacturer and worldwide distributor of heavy-duty off-highway and marine power transmission equipment and related products.
Brian J. Borradaile was appointed to serve as the Company’s Senior Vice President, Strategy and Corporate Development in February 2023. Mr. Borradaile previously served as Vice President, Corporate Development when he joined the Company in December 2017. Prior to that time, Mr. Borradaile worked in the automotive, technology, and industrial manufacturing industries, including positions at Aptiv Plc (formerly Delphi Automotive Plc), a leading global technology and mobility architecture company primarily serving the automotive sector, TE Connectivity Ltd., a publicly traded global industrial technology leader, and various private equity companies.
Joseph P. Braun joined the Company in April 2019 as Senior Vice President and General Counsel, and he was appointed Corporate Secretary in May 2019. Prior to joining the Company, Mr. Braun served as Chief Legal Officer and Corporate Secretary of Avantor, Inc., a leading global provider of products and services to customers in the life sciences and advanced technologies and applied materials industries. Prior to joining Avantor, he worked at Tyco International plc (now known as Johnson Controls International plc), a leading global provider of security, fire detection and suppression, and life safety products and services, where he served in positions of increasing responsibility, including, most recently, as Vice President, Mergers & Acquisitions. Mr. Braun began his legal career in private practice at various law firms, where he advised public and private companies on mergers and acquisitions and securities and corporate governance matters.
Jeffrey L. Darby joined the Company in November 1998 as a National Account Manager. He became Senior Vice President, Sales and Marketing in February 2011. He previously held the positions of Group Vice President from 2008 to 2010 and Vice President of Sales – Traditional and Key Accounts from 2006 to 2008. Prior to joining the Company, Mr. Darby worked for Federal-Mogul Corporation/Moog Automotive, an automotive parts supplier, beginning in 1990 and held positions in sales and marketing management.
David M. Hession joined the Company in February 2019 and was appointed to serve as the Company’s Senior Vice President and Chief Financial Officer effective March 2019. Mr. Hession was also appointed Treasurer in May 2019. Mr. Hession was Vice President, Chief Financial Officer of Johnsonville, LLC, a privately held manufacturer of sausage and other protein products, from May 2013 to January 2019. Prior to that time, Mr. Hession worked at McCormick & Company, Inc., a global leader in the manufacture, marketing and distribution of spices, seasonings and flavors to the entire food industry, where he served in various positions of increasing responsibility including, most recently, as Vice President Finance & Administration. Mr. Hession also previously held positions with Tradeout, Inc., a business-to-business Internet exchange for surplus inventory and fixed assets, and Xylum Corporation, a development stage medical device manufacturer, and he performed management consulting work for Ernst & Young, LLP and Peterson Consulting LP.
Lindsay B. Hunt joined the Company in October 2022 as President and Chief Executive Officer, Specialty Vehicles, in connection with the Company’s acquisition of Super ATV, LLC, a leading supplier to the powersports aftermarket (“SuperATV”). Ms. Hunt most recently served as President and Chief Executive Officer of SuperATV, a role that she held beginning in April 2021. Prior to that time, Ms. Hunt served SuperATV in roles of increasing responsibility, including leadership positions in sales and marketing, new product development and operations. Ms. Hunt joined SuperATV in 2009.
Scott D. Leff joined the Company in April 2019 as Senior Vice President, Chief Human Resources Officer. Prior to joining Dorman, Mr. Leff held a variety of global divisional human resources roles at HP Inc. and its subsequent spin‐off, Hewlett‐Packard Enterprise Company, both multinational information technology companies. He served as Chief Human Resources Officer of Hewlett‐Packard Financial Services from March 2010 to March 2018 and Vice President of HPE Pointnext from March 2018 to April 2019. Prior to that, Mr. Leff held chief human resources officer roles and divisional human resource and employee relations roles within various publicly and privately held companies. Mr. Leff began his career as a lawyer in a New Jersey County Prosecutor’s office and a New Jersey-based law firm.
Donna M. Long joined the Company in April 2015 as Senior Vice President, Chief Information Officer. Prior to joining the Company, she served as Chief Information Officer of Veritiv Corporation, a business-to-business provider of packaging, publishing, and hygiene products (“Veritiv”), from July 2014 to April 2015. Veritiv was formed as a result of the merger of Unisource Worldwide, Inc., a distributor of printing paper, packaging and supplies (“Unisource”) with xpedx, a division of International Paper Co. Prior to July 2014, Ms. Long held roles of increasing responsibility within Unisource, including as its Chief Information Officer, and she previously was a Manager at Accenture plc, a professional services company.
Eric B. Luftig joined the Company in December 2021 as Senior Vice President, Product. Previously, he was the founder and Managing Partner of EBL Consulting LLC, a provider of executive management and leadership consulting services, from June 2020 to December 2021. From October 2009 to June 2020, Mr. Luftig served as Vice President and Marketing Officer for Victaulic Company, a leading producer of mechanical pipe joining solutions. Prior to that, Mr. Luftig served in various engineering, sales and marketing roles for publicly and privately held companies, including General Electric, a leader in the power, renewable energy, aviation and healthcare industries, and Nordson Corporation, a designer and manufacturer of dispensing equipment for consumer and industrial adhesives, sealants and coatings.
John R. McKnight joined the Company in November 2019 as Senior Vice President, Operations and on March 10, 2023, Mr. McKnight was appointed President, Heavy Duty. Prior to joining the Company, he served as Chief Operating Officer of Morgan Corporation, a leading producer of truck and van bodies in North America, from January 2019 to September 2019, and as Chief Operating Officer of Consolidated Glass Holdings, Inc., a holding company for architectural, security, and custom glass and metal fabrication businesses, from September 2017 to July 2018. Prior to September 2017, Mr. McKnight held various roles with the Colfax Corporation, a diversified global manufacturing and engineering company (“Colfax”), including most recently as Executive Director of its Howden Industrial Fans division. Before Colfax, he held various leadership roles with Danaher, a designer, manufacturer, and marketer of professional, medical, industrial, and commercial products and services.
Tayfun Uner joined the Company in January 2025 as President, Light Duty. Prior to joining the Company, he served as Senior Vice President of three business units of Newell Brands Inc., a global consumer goods company, from 2018 to 2024. Prior to that, he served as the General Manager for Carlsberg Group, a worldwide brewery group, from 2012 to 2017, and prior to that as its Vice President, Group Strategy from 2008 to 2012. Prior to that time, Mr. Uner also held strategic positions with increasing responsibility at McKinsey & Company, a global management consulting firm, and The Procter & Gamble Company, a worldwide consumer goods company.
PART II
ITEM 5. Market for Registrant's Common Equity, Related Shareholder Matters, and Issuer Purchases of Equity Securities.
Our shares of common stock are traded publicly on the NASDAQ Global Select Market under the ticker symbol “DORM.” At February 24, 2025, there were 288 holders of record of our common stock.
We do not anticipate paying cash dividends on our common stock in the foreseeable future. Any payment of dividends in the future will be at the discretion of our board of directors and will depend upon, among other things, our earnings, financial condition, capital requirements, level of indebtedness, provisions of our existing credit agreement, and other factors that our board of directors deems relevant.
For information regarding our equity compensation plans, see PART III ITEM 12, “Security Ownership of Certain Beneficial Owners and Management and Related Shareholder Matters.”
Stock Performance Graph. Below is a line graph comparing the cumulative total shareholder return for our common stock with the cumulative total shareholder return for the NASDAQ US Benchmark Auto Parts index and the NASDAQ Composite Market Index for the period from December 28, 2019 to December 31, 2024.
The NASDAQ US Benchmark Auto Parts index is comprised of 21 public companies and the information was furnished by Zacks Investment Research, Inc. The NASDAQ Composite Market Index is comprised of more than 3,200 public companies and the information was furnished by Zacks Investment Research, Inc. The graph assumes $100 was invested on December 28, 2019 in our common stock and each of the indices, and that dividends were reinvested when and as paid. In calculating the cumulative total shareholder returns, the companies included are weighted according to the stock market capitalization of such companies. The stock price performance shown in the graph is not necessarily indicative of future price performance.
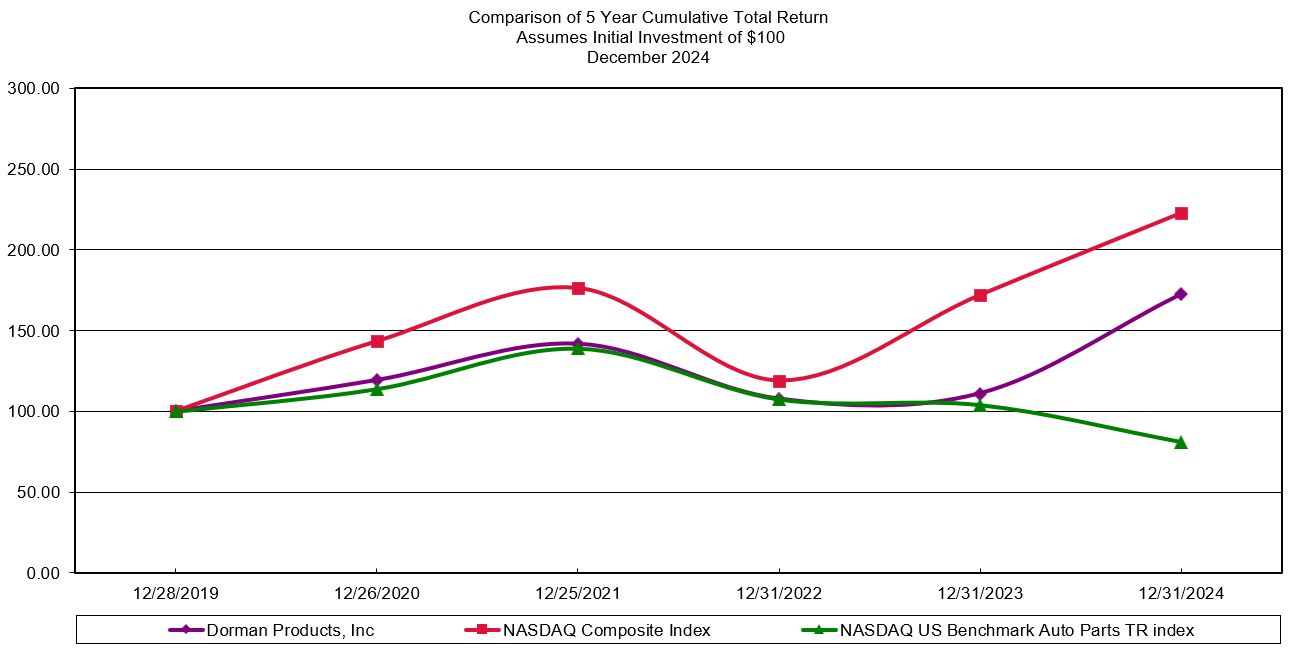
The performance graph and the information set forth therein shall not be deemed to be filed for purposes of Section 18 of the Exchange Act and shall not be deemed to be incorporated by reference in any filing made by us with the U.S. Securities and Exchange Commission, except as shall be expressly set forth by specific reference in such a filing.
Stock Repurchases
During the three months ended December 31, 2024, we purchased shares of our common stock as follows:
| | | | | | | | | | | | | | | | | | | | | | | |
| Period | Total Number
of Shares
Purchased | | Average
Price Paid
per Share | | Total Number of Shares Purchased as Part of Publicly Announced Plans or Programs (3) | | Maximum Number (or Approximate Dollar Value) of Shares that May Yet Be Purchased Under the Plans or Programs (3) |
| September 29, 2024 through October 26, 2024 | — | | $ | — | | | — | | | $ | 134,565,161 | |
October 27, 2024 through November 23, 2024 (1) | 4,808 | | $ | 124.13 | | | — | | | $ | 134,565,161 | |
November 24, 2024 through December 31, 2024 (2) | 2,235 | | $ | 129.89 | | | — | | | $ | 134,565,161 | |
| Total | 7,043 | | | | — | | | $ | 134,565,161 | |
(1)Includes 4,808 shares purchased from the Dorman Products, Inc. 401(k) Plan and Trust (as described in Note 12, "Capital Stock", to the Notes to Consolidated Financial Statements included in this Annual Report on Form 10-K, the “401(k) Plan”).
(2)Includes 2,235 shares purchased from the 401(k) Plan.
(3)On December 12, 2013 we announced that our Board of Directors authorized a share repurchase program, authorizing the repurchase of up to $10 million of our outstanding common stock by the end of 2014. Through several actions taken since that time, our Board of Directors expanded the program to $600 million and extended the program through December 31, 2024 (the “Existing Program”). At December 31, 2024, $134.6 million was available for repurchase under the Existing Program. The Existing Program expired on December 31, 2024, along with all amounts that remained available for use under the Existing Program as of that date.
In October 2024, the Company’s Board of Directors authorized the purchase of up to $500 million of our common stock under a new share repurchase program effective as of January 1, 2025 through December 31, 2027 (the “New Program”).
ITEM 6. [Reserved]
ITEM 7. Management's Discussion and Analysis of Financial Condition and Results of Operations.
“Management’s Discussion and Analysis of Financial Condition and Results of Operations” should be read in conjunction with the Consolidated Financial Statements and related notes thereto included in PART II, ITEM 8 of this Annual Report on Form 10-K. The matters discussed in “Management’s Discussion and Analysis of Financial Condition and Results of Operations” contain certain forward-looking statements within the meaning of the Private Securities Litigation Reform Act of 1995. Forward-looking statements involve significant risks and uncertainties. See the “Statement Regarding Forward-Looking Statements” above and PART I, ITEM 1A, “Risk Factors” in this Annual Report on Form 10-K for additional information regarding forward-looking statements and the factors that could cause actual results to differ materially from those anticipated in the forward-looking statements. In ITEM 7, we discuss 2024 and 2023 results and comparisons of 2024 results to 2023 results. Discussions of 2022 results and comparisons of 2022 results to 2023 results can be found in “Management’s Discussion and Analysis of Financial Condition and Results of Operations” in PART II, ITEM 7 of the Company’s Annual Report on Form 10-K for the year ended December 31, 2023.
Overview
We are one of the leading suppliers of replacement and upgrade parts in the motor vehicle aftermarket industry, serving passenger cars, light-, medium-, and heavy-duty trucks, as well as specialty vehicles, including utility terrain vehicles (UTVs) and all-terrain vehicles (ATVs). We operate through three business segments: Light Duty, Heavy Duty, and Specialty Vehicle, consistent with the sectors of the motor vehicle aftermarket industry in which we operate. For more information on our segments, refer to Note 8, “Segment Information,” to the Consolidated Financial Statements, included under ITEM 8.
As of December 31, 2024, we marketed approximately 138,000 distinct parts compared to approximately 133,000 as of December 31, 2023, many of which we designed and engineered. This number excludes private label stock keeping units and other variations in how we market, package, and distribute our products, includes distinct parts of acquired companies, and reflects distinct parts that have been discontinued at the end of their lifecycle. Our products are sold under our various brand names, under our customers’ private label brands, or in bulk. We are one of the leading aftermarket suppliers of parts that were traditionally available to consumers only from OE manufacturers or salvage yards. These parts include, among other parts, leaf springs, intake manifolds, exhaust manifolds, oil filters and coolers, window regulators, radiator fan assemblies, tire pressure monitor sensors, exhaust gas recirculation (EGR) coolers, driveshafts, UTV windshields, and complex electronics modules.
We generate most of our net sales from customers in North America, primarily in the United States. Our products are sold primarily through aftermarket retailers, including through their online platforms; dealers; national, regional, and local warehouse distributors and specialty markets; and salvage yards. We also distribute aftermarket parts outside the United States, with sales primarily into Canada and Mexico, and to a lesser extent, Europe, the Middle East, and Australia.
We may experience significant fluctuations from quarter to quarter in our results of operations due to the timing of orders placed by our customers as well as our ability and the ability of our suppliers to deliver products ordered by our customers. The introduction of new products and product lines to customers, as well as business acquisitions, may also cause significant fluctuations from quarter to quarter.
Our 2024 fiscal year was a 52-week period that ended on December 31, 2024, our 2023 fiscal year was a 52-week period that ended on December 31, 2023 and our fiscal 2022 was a 53-week period that ended on December 31, 2022.
Business Performance Summary
Net sales increased 4% to $2,009.2 million in 2024 from $1,929.8 million in 2023. Net income increased 47% to $190.0 million in 2024 from $129.3 million in 2023. Additionally, in 2024 we generated $231.0 million of cash flows from operations, repaid a total of $94.4 million of outstanding debt obligations, and repurchased 865,283 common shares under a share repurchase program for $78.9 million.
New Product Development
New product development is an important success factor for us and has been a source of growth for us. We have made incremental investments to increase our new product development efforts to grow our business and strengthen our relationships with our customers. The investments primarily have been in the form of increased product development resources, increased customer and end-user awareness programs, and customer service improvements. These investments historically have enabled us to provide an expanding array of new product offerings and grow revenues at levels that generally have exceeded market growth rates.
In 2024, we introduced 5,335 new distinct parts to our customers and end-users, including 1,659 “New-to-the-Aftermarket” parts. Please see ITEM 1, “Business – Product Development” for a year-over-year comparison of new product introductions.
One area of focus for the light-duty sector has been our complex electronics program, which capitalizes on the growing number of electronic components being utilized on today’s OE platforms. New vehicles contain an average of approximately 100 electronic modules, with some high-end luxury vehicles exceeding that. Our complex electronics products are designed and developed in-house and tested to help ensure consistent performance, and our product portfolio is focused on further developing our leadership position in this category.
Another area of focus has been on products we market for the heavy-duty sector. We believe that this sector provides many of the same growth opportunities that the light-duty sector has provided us. We specialize in offering parts to this sector that were traditionally only available from OE manufacturers or salvage yards, similar to how we approach the light-duty sector.
Within the specialty vehicle sector, we focus on providing performance parts and accessories and nondiscretionary repair parts for UTVs and ATVs. We are dedicated to developing better and more innovative materials that will be compatible across a wide variety of makes and models to enhance both the performance and appearance of customers’ vehicles.
Acquisitions
A key component of our strategy is growth through acquisitions. On October 4, 2022, we acquired Super ATV, a leading independent supplier to the powersports aftermarket with a family of highly respected brands spanning functional accessories and upgrades, as well as replacement parts for specialty vehicles. See Note 2, "Business Acquisitions and Investments", to the Consolidated Financial Statements, included under ITEM 8 for additional information. We may acquire businesses in the future to supplement our financial growth, increase our customer base, add to our distribution capabilities, or enhance our product development resources, among other reasons.
Industry Factors
The Company’s financial results are also impacted by various industry factors, including, but not limited to the number, age, and condition of vehicles in operation at any one time, and the miles driven by those vehicles.
Vehicles in Operation
The Company’s products are primarily purchased and installed on a subsegment of the passenger and light-duty vehicles in operation in the United States (“VIO”), specifically weighted towards vehicles aged 7 to 14 years old. Each year, the United States seasonally adjusted annual rate (“US SAAR”) of new vehicles purchased adds a new year to the VIO. According to data from the Auto Care Association (“Auto Care”), the US SAAR experienced a decline from 2008 to 2011 as consumers purchased fewer new vehicles as a result of the Great Recession of 2008. We believe that the declining US SAAR during that period resulted in a follow-on decline in our primary VIO subsegment (7-to-14-year-old vehicles) commencing in 2016. However, following 2011 and the impact of the Great Recession of 2008, U.S. consumers began to increase their purchases of new vehicles which over time caused the US SAAR to recover and return to more historical levels. The 7-to-14-year-old vehicle car parc has continued to grow over the past several years, which we expect will expand demand for aftermarket replacement parts as more vehicles remain in operation.
In addition, we believe that vehicle owners generally are operating their current vehicles longer than they did several years ago, performing necessary repairs and maintenance to keep those vehicles well maintained. We believe this trend has supported an increase in VIO, which increased to 298.5 million, a 1% increase in 2024 over 2023. According to data published by Polk, a division of IHS Automotive, the average age of VIO increased to 12.8 years as of October 2024 from 12.6 years as of October 2023.
Miles Driven
The number of miles driven is another important statistic that impacts our business. Generally, as vehicles are driven more miles, the more likely it is that parts will fail and there will be increased demand for replacement parts, including our parts. According to the U.S. Department of Transportation, the number of miles driven through October 2024 increased 1.0% year over year in the light-duty sector. However, global gasoline prices remained high during 2024 and, if they continue, they may negatively impact miles driven as consumers reduce travel or seek alternative methods of transportation.
Brand Protection
We operate in a highly competitive market. As a result, we are continuously evaluating our approach to brand, pricing, and terms to our different customers and channels. For example, we maintain brand protection policies, which are designed to ensure that certain of our branded products are not advertised below certain approved pricing levels. In addition, we may pursue legal remedies when we see third parties violating our intellectual property rights, including those that violate our patents, wrongfully represent our products as their own, or use our product images for their own marketing efforts.
Discounts, Allowances, and Incentives
We offer a variety of customer discounts, rebates, defective and slow-moving product returns, and other incentives. We may offer cash discounts for paying invoices in accordance with the specified discount terms of the invoice. In addition, we may offer pricing discounts based on volume purchased from us or other pricing discounts related to programs under a customer’s agreement. These incentives can be in the form of “off-invoice” discounts that are immediately deducted from sales at the time of sale. For those customers that choose to receive their incentives on a quarterly or annual basis instead of “off-invoice,” we provide rebates and accrue for such incentives as the related sales are made and reduce sales accordingly. Additionally, rebates and discounts are provided to customers to support promotional activities such as advertising and sales force allowances.
Our customers, particularly our larger retail customers, regularly seek more favorable pricing and product return provisions, and extended payment terms when negotiating with us. We attempt to avoid or minimize these concessions as much as possible, but we have granted pricing concessions, indemnification rights, and extended customer payment terms, and allowed a higher level of product returns in certain cases. These concessions impact net sales as well as our profit levels and may require additional capital to finance the business. We expect our customers to continue to exert pressure on our margins.
Customer Acquisition Costs
We may incur customer acquisition costs where we incur change-over costs to induce a customer to switch from a competitor’s brand, including expanding new product lines into our existing customers. Change-over costs include the costs related to removing the customer’s inventory of competitor products and replacing it with our products, which is commonly referred to as a stock lift. Customer acquisition costs are recorded as a reduction to revenue when incurred.
Product Warranty and Overstock Returns
We warrant our products against certain defects in material and workmanship when used as designed on the vehicle on which it was originally installed. We offer a limited lifetime warranty on most of our products in the light-duty parts categories, with more limited warranties for our heavy-duty and specialty vehicle products. In addition to warranty returns, we may permit our customers to return new, undamaged products to us within customer-specific limits if they have overstocked their inventories. At the time products are sold, we accrue a liability for product warranties and overstock returns as a percentage of sales based upon estimates established
using historical information on the nature, frequency, and average cost of the claim and the probability of the customer return. Significant judgments and estimates must be made and used in connection with establishing the sales returns and other allowances in any accounting period. Revisions to these estimates are made when necessary, based upon changes in these factors. We regularly study trends of such claims.
Foreign Currency
Many of our products and related raw materials and components are purchased from suppliers in a variety of non-U.S. countries. The products generally are purchased through purchase orders with the purchase price specified in U.S. dollars. Accordingly, we generally do not have exposure to fluctuations in the relationship between the U.S. dollar and various foreign currencies between the time of execution of the purchase order and payment for the product.
To the extent that the U.S. dollar changes in value relative to those foreign currencies in the future, the prices charged by our suppliers for goods under new purchase orders may change in equivalent U.S. dollars. The largest portion of our overseas purchases comes from China. The Chinese yuan to U.S. dollar exchange rate has fluctuated over the past several years. Any future changes in the value of the Chinese yuan relative to the U.S. dollar may result in a change in the cost of goods that we purchase from China. However, the cost of the goods we procure is also affected by other factors, including raw material availability, labor costs, tariffs, and transportation costs.
We have operations located outside the United States with various functional currencies. Because our consolidated financial statements are denominated in U.S. dollars, the assets, liabilities, net sales, and expenses that are denominated in currencies other than the U.S. dollar must be converted into U.S. dollars using exchange rates for the current period. As a result, fluctuations in foreign currency exchange rates may impact our financial results.
Impact of Labor Market and Inflationary Costs
We experienced broad-based inflationary impacts during the year ended December 31, 2023, due primarily to global transportation and logistics constraints, which resulted in significantly higher transportation costs; tariffs; material costs; and wage inflation from an increasingly competitive labor market. Higher labor costs and material inflation resulting from geopolitical events, rising interest rates, disruptions to supply chain and logistics networks, and the trade policies of the U.S. or the countries where we source or sell our products may negatively impact our results in the future. We attempt to offset inflationary pressures with cost-saving initiatives, price increases to customers, and the use of alternative suppliers. There can be no assurance that we will be successful in implementing such cost-saving initiatives, pricing increases, or supplier diversification in the future to offset increased inflationary costs.
Impact of Interest Rates
Our business is subject to interest rate risk under the terms of our customer accounts receivable sales programs, as a change in the Term Secured Overnight Financing Rate (“Term SOFR”) or alternative discount rate affects the cost incurred to factor eligible accounts receivable. Additionally, our outstanding borrowings under our credit facility bear interest at variable rates tied to Term SOFR or the applicable base rate. Under the terms of the credit facility, a change in interest rates affects the rate at which we can borrow funds thereunder and also impacts the interest cost on existing borrowings. Interest rates may hold steady at their current rates for prolonged periods or may increase in the future, resulting in increased costs associated with our accounts receivable sales programs and outstanding borrowings. During the year ended December 31, 2023, we saw significant increases in Term SOFR and other reference rates. Interest rates remained elevated throughout much of 2024, but began to decline starting in the second half of 2024.
Impact of Tariffs
We source the majority of our raw materials and parts from suppliers in a variety of non-U.S. countries. Prior to 2025, the U.S. government imposed tariffs on certain foreign goods, including steel and aluminum and certain vehicle parts, which resulted in increased costs for importing those goods into the United States. Those tariffs primarily impacted raw materials and parts that we source from China. We have taken several actions to
mitigate the impact of those tariffs, including, but not limited to, passing along price increases to our customers and negotiating cost concessions from our suppliers. We are actively monitoring recent trade policy and tariff announcements, including the executive orders issued by the President of the United States in February 2025. Among other things, those executive orders directed the United States to impose new tariffs on imports from Canada, Mexico, and China, subsequently paused the imposition of tariffs on Canada and Mexico for a month, announced tariffs on steel and aluminum imported into the United States, and directed federal agencies to investigate how to adjust U.S. tariffs to match those of other countries. We are currently evaluating the potential impact of the announced tariffs on our business and financial condition and actions we may take to mitigate the impact. In addition, we are currently monitoring the potential impact, if any, of actions taken by these countries in response to the announced tariffs. There can be no assurance that the recently announced tariffs or future imposition of any tariffs, changes thereto, or potential actions taken by countries in response to the tariffs will not have a material adverse effect on our business, results of operations, financial condition, or liquidity in any period or that any actions we take to mitigate the impact of the tariffs will be effective.
Results of Operations
The following table sets forth, for the periods indicated, the dollar value and percentage of net sales represented by certain items in our Consolidated Statements of Operations:
| | | | | | | | | | | | | | | | | | | | | | | |
| For the Year Ended December 31, |
| (in thousands, except percentage data) | 2024 | | 2023 |
| Net sales | $ | 2,009,197 | | | 100.0 | % | | $ | 1,929,788 | | | 100.0 | % |
| Cost of goods sold | 1,202,838 | | | 59.9 | % | | 1,244,365 | | | 64.5 | % |
| Gross profit | 806,359 | | | 40.1 | % | | 685,423 | | | 35.5 | % |
| Selling, general and administrative expenses | 513,450 | | | 25.6 | % | | 470,663 | | | 24.4 | % |
| Income from operations | 292,909 | | | 14.6 | % | | 214,760 | | | 11.1 | % |
| Interest expense, net | 39,727 | | | 2.0 | % | | 48,061 | | | 2.5 | % |
| Other income, net | 3,070 | | | 0.2 | % | | 1,804 | | | 0.1 | % |
| Income before income taxes | 256,252 | | | 12.8 | % | | 168,503 | | | 8.7 | % |
| Provision for income taxes | 66,248 | | | 3.3 | % | | 39,244 | | | 2.0 | % |
| Net income | $ | 190,004 | | | 9.5 | % | | $ | 129,259 | | | 6.7 | % |
*Percentage of sales information may not add due to rounding
Year Ended December 31, 2024 Compared to Year Ended December 31, 2023
Net sales increased $79.4 million, or 4.1%, for the year ended December 31, 2024 compared to the prior year, driven primarily by volume, including from new product introductions.
Gross profit as a percentage of net sales increased 460 basis points compared to the prior year primarily due to sales of lower-cost inventory and cost savings initiatives.
Selling, general and administrative expenses (“SG&A”) increased $42.8 million, or 120 basis points as a percentage of net sales for the year ended December 31, 2024, compared to the prior year, primarily due to $20.5 million of favorable fair value adjustments in the prior year period to the estimated contingent consideration obligation for an acquisition and higher compensation and benefits costs in the current year period.
Our effective tax rate increased to 25.9% in the year ended December 31, 2024 from 23.3% in the year ended December 31, 2023, primarily due to recording a reserve in 2024 in connection with a state tax dispute.
Segment Operating Results
Segment operating results were as follows:
| | | | | | | | | | | |
| For the Year Ended December 31, |
| (in thousands) | 2024 | | 2023 |
| Net Sales: | | | |
| Light Duty | $ | 1,565,601 | | | $ | 1,462,474 | |
| Heavy Duty | 231,515 | | | 256,913 | |
| Specialty Vehicle | 212,081 | | | 210,401 | |
| Total | $ | 2,009,197 | | | $ | 1,929,788 | |
| | | |
| Segment income from operations: | | | |
| Light Duty | $ | 284,165 | | | $ | 187,159 | |
| Heavy Duty | 6,479 | | | 14,505 | |
| Specialty Vehicle | 32,335 | | | 31,618 | |
| Total | $ | 322,979 | | | $ | 233,282 | |
Light Duty
Light Duty net sales increased $103.1 million, or 7.1%, for the year ended December 31, 2024 compared to the prior year, primarily due to volume increases, including sales of new products launched.
Light Duty segment income from operations as a percentage of net sales increased to 18.2% for the year ended December 31, 2024, from 12.8% for the year ended December 31, 2023. This increase was primarily driven by the sell-through of lower-cost inventory and operational excellence initiatives delivering cost-savings, partially offset by higher compensation and benefits costs.
Heavy Duty
Heavy Duty net sales decreased $25.4 million, or 9.9%, for the year ended December 31, 2024 compared to the prior year. The decrease in net sales primarily reflects reduced customer demand from lower freight industry shipping volumes in the year ended December 31, 2024, as well as sales performance in the year ended December 31, 2023 driven by customers’ inventory restocking at the end of the global pandemic.
Heavy Duty segment income from operations as a percentage of net sales decreased by 280 basis points for the year ended December 31, 2024, compared to the prior year. This decrease was primarily driven by the deleveraging of fixed costs on lower net sales and the impact of investments we made as part of initiatives to grow sales and improve margins on a long-term basis.
Specialty Vehicle
Specialty Vehicle net sales increased $1.7 million, or 0.8%, for the year ended December 31, 2024 compared to the prior year, primarily due to volume increases, including sales of new products launched.
Specialty Vehicle segment income from operations as a percentage of net sales increased to 15.2% for the year ended December 31, 2024, from 15.0% for the year ended December 31, 2023. This increase was primarily driven by the sell-through of lower-cost inventory and cost savings initiatives compared to the year ended December 31, 2023.
Liquidity and Capital Resources
Historically, our primary sources of liquidity have been our invested cash and the cash flow we generate from our operations, including accounts receivable sales programs facilitated by certain customers. The following table presents key liquidity and capital resource metrics as of December 31, 2024 and 2023.
| | | | | | | | | | | |
| (in thousands) | December 31, 2024 | | December 31, 2023 |
| Cash and cash equivalents | $ | 57,137 | | | $ | 36,814 | |
| Working capital | $ | 805,958 | | | $ | 686,558 | |
| Shareholders' equity | $ | 1,293,470 | | | $ | 1,168,203 | |
Based on our current operating plan, we believe that our sources of available capital are adequate to meet our ongoing cash needs for at least the next twelve months. However, our liquidity could be negatively affected by extending payment terms to customers, a decrease in demand for our products, higher interest rates, the outcome of contingencies, or other factors. See Note 11, “Commitments and Contingencies”, to the Consolidated Financial Statements, included under ITEM 8, for additional information regarding commitments and contingencies that may affect our liquidity.
At December 31, 2024, our long-term cash requirements under our various contractual obligations include non-cancellable operating leases and outstanding borrowings under our credit agreement as follows:
•Operating leases – total obligations under non-cancellable operating leases were $146.0 million, with $25.1 million due over the next twelve months. Refer to Note 5, “Leases”, to the Consolidated Financial Statements, included under ITEM 8, for additional information regarding our leases.
•Credit agreement – total obligations under our credit agreement were $482.8 million, with $28.1 million due over the next twelve months. Refer to Note 7, “Long-Term Debt”, to the Consolidated Financial Statements, included under ITEM 8, for additional information regarding our credit agreement.
Tariffs
Tariffs increase our use of cash since we pay for the tariffs upon the arrival of our goods in the United States but collect the cash on any passthrough price increases from our customers on a delayed basis according to the payment terms negotiated with our customers.
Payment Terms and Accounts Receivable Sales Programs
Over the past several years, we have continued to extend payment terms to certain customers as a result of customer requests and market demands. These extended terms have resulted in increased accounts receivable levels and significant uses of cash. Where available and when we deem appropriate, we participate in accounts receivable sales programs with several customers that allow us to sell our accounts receivable to financial institutions to offset the negative cash flow impact of these payment term extensions. However, any sales of accounts receivable through these programs ultimately result in us receiving a lesser amount of cash upfront than if we collected those accounts receivable ourselves in due course, resulting in accounts receivable factoring costs. Moreover, since these accounts receivable sales programs bear interest at rates tied to the Term SOFR or other reference rates, increases in these applicable rates increase our cost to sell our receivables and reduce the amount of cash we receive. See ITEM 7A, “Quantitative and Qualitative Disclosures about Market Risk” for more information. Further extensions of customer payment terms would result in additional uses of cash or increased costs associated with the sales of accounts receivable.
During the years ended December 31, 2024 and 2023, we sold approximately $1,106.4 million and $949.5 million, respectively, under these programs. If receivables had not been sold, $853.6 million and $526.4 million of additional receivables would have been outstanding at December 31, 2024 and 2023, respectively, based on standard payment terms. We had capacity to sell more accounts receivable under these programs if the needs of the business warranted. Further extensions of customer payment terms would result in additional uses of cash or increased costs associated with the sales of accounts receivable.
During the years ended December 31, 2024 and 2023, factoring costs associated with these accounts receivable sales programs were $51.3 million and $50.2 million, respectively. The increase in factoring costs year over year was primarily driven by higher accounts receivable sold under these programs.
Credit Agreement
We have a credit agreement which consists of a $600.0 million revolving credit facility and a $500.0 million term loan. The credit agreement matures on October 4, 2027, is guaranteed by the Company’s material domestic subsidiaries, and is supported by a security interest in substantially all of the Company’s material domestic subsidiaries’ personal property and assets, subject to certain exceptions.
As of December 31, 2024, we were not in default with respect to the credit agreement. As of December 31, 2024, there was $14.0 million in outstanding borrowings under the revolving credit facility, and $468.8 million in outstanding borrowings under the term loan portion of the credit agreement, and as of such date we had outstanding letters of credit for $1.2 million in the aggregate. Net of outstanding borrowings and letters of credit, we had $584.8 million available under the credit agreement as of December 31, 2024.
Refer to Note 7, "Long-Term Debt", to the Consolidated Financial Statements, included under ITEM 8, for additional information regarding the credit agreement.
Cash Flows
Below is a table setting forth the key lines of our Consolidated Statements of Cash Flows:
| | | | | | | | | | | |
| For the Year Ended December 31, |
| (in thousands) | 2024 | | 2023 |
| Cash provided by operating activities | $ | 231,047 | | | $ | 208,758 | |
| Cash used in investing activities | (39,321) | | | (43,901) | |
| Cash used in financing activities | (170,979) | | | (174,109) | |
| Effect of foreign exchange on cash and cash equivalents | (424) | | | 32 | |
| Net increase (decrease) in cash and cash equivalents | $ | 20,323 | | | $ | (9,220) | |
During the year ended December 31, 2024, cash provided by operating activities was $231.0 million compared to $208.8 million during the year ended December 31, 2023. The $22.3 million increase was primarily driven by higher net income, partially offset by working capital changes, primarily higher inventory balances.
Investing activities used $39.3 million and $43.9 million of cash in the years ended December 31, 2024 and 2023, respectively. The decrease in cash used in investing activities during the year ended December 31, 2024 compared to the prior year was primarily due to higher additions for property, plant and equipment in the prior year.
Financing activities in the year ended December 31, 2024 included $78.9 million paid to repurchase 865,283 shares of common stock under our share repurchase plan, and the repayments of $78.8 million of outstanding borrowings under our revolving credit facility and $15.6 of our term loan balance under our credit agreement. During the year ended December 31, 2023, we repaid $146.6 million of outstanding borrowings under our revolving credit facility and $12.5 million of our term loan balance under our credit agreement. The remaining uses of cash from financing activities in each period resulted primarily from the repurchase of our common stock from our 401(k) Plan and income tax withholding in connection with the vesting of restricted stock awards (“RSAs”) and restricted stock units (“RSUs”), and proceeds from the exercise of stock options.
Off-Balance Sheet Arrangements
Off-balance sheet arrangements are transactions, agreements, or other contractual arrangements with an unconsolidated entity for which we have an obligation to the entity that is not recorded in our consolidated financial statements. We historically have not utilized off-balance sheet financial instruments, and currently do not plan to utilize off-balance sheet arrangements in the future to fund our working capital requirements, operations, or growth plans.
We may issue standby letters of credit under our credit agreement. Letters of credit totaling $1.2 million and $1.3 million were outstanding at December 31, 2024 and 2023, respectively. Those letters of credit are
issued primarily to satisfy the requirements of workers' compensation, general liability, and other insurance policies. Each of the outstanding letters of credit has a one-year term from the date of issuance.
We do not have any off-balance sheet financing that has, or is reasonably likely to have, a material, current or future effect on our financial condition, revenues, expenses, cash flows, results of operations, liquidity, capital expenditures, or capital resources.
Related-Party Transactions
Prior to December 1, 2023, we leased our Colmar, PA facility from an entity in which Steven Berman, our Non-Executive Chairman, and certain of his family members are owners. On December 1, 2023, the Colmar facility was sold to a third party, subject to our lease. We currently lease a portion of our Lewisberry, PA facility from an entity in which Mr. Berman and certain of his family members are owners. The Colmar lease was, and the Lewisberry lease is, a non-cancelable operating lease. The Lewisberry lease expires December 31, 2027.
We also lease our facilities in Madison, IN, and Shreveport, LA, from entities in which Lindsay Hunt, our President, Specialty Vehicle, and certain of her family members are owners. Each lease is a non-cancelable operating lease, was renewed in October 2022 in connection with the acquisition of Super ATV, LLC, a leading supplier to the powersports aftermarket ("SuperATV"), and will expire on October 31, 2027.
We have service agreements with counterparties that are majority-owned by a family member of Ms. Hunt. These agreements provide for various warehouse and facility-related services at agreed-upon rates.
The following table represents the total payments for the years ended December 31, 2024, 2023, and 2022, under the related party agreements described above:
| | | | | | | | | | | | | | | | | |
| For the Year Ended December 31, |
| (in thousands) | 2024 | | 2023 | | 2022 |
| Facility leases with Steven Berman-related entities | $ | 715 | | | $ | 2,918 | | | $ | 2,458 | |
| Facility leases with Lindsay Hunt-related entities | $ | 2,757 | | | $ | 2,603 | | | $ | 519 | |
| Service agreements with Lindsay Hunt-related entities | $ | 54 | | | $ | 200 | | | $ | 67 | |
We are a partner in a joint venture with one of our suppliers and own minority interest investments in two other suppliers. Aggregate purchases from both of these companies were $18.4 million, $22.7 million, and $24.9 million in the years ended December 31, 2024, 2023, and 2022, respectively.
Critical Accounting Policies and Estimates
Our discussion and analysis of our financial condition and results of operations are based upon the Consolidated Financial Statements, which have been prepared in accordance with U.S. generally accepted accounting principles. The preparation of these financial statements requires us to make estimates, judgments, and assumptions that affect the reported amounts of assets and liabilities, the disclosure of contingent liabilities, and the reported amounts of revenues and expenses. Estimates and judgments are based upon historical experience and on various other assumptions believed to be accurate and reasonable under the circumstances. Actual results may differ materially from these estimates due to different assumptions or conditions. The following areas all require the use of subjective or complex estimates, judgments, and assumptions.
Accrued Customer Rebates and Returns. We record estimates for cash discounts, defective and slow-moving product returns, promotional rebates, core return deposits, and other discounts in the period of the sale ("Customer Credits"). The provision for Customer Credits is recorded as a reduction from gross sales and reserves for Customer Credits are shown as an increase of accrued customer rebates and returns, which is included in current liabilities. Customer Credits are estimated based on contractual provisions, historical experience, and our assessment of current market conditions. Historically, actual Customer Credits have not differed materially from estimated amounts.
Excess and Obsolete Inventory Reserves. We must make estimates of potential future excess and obsolete inventory costs. We provide reserves for discontinued and excess inventory based upon historical demand, forecasted usage, estimated customer requirements, and product line updates. We maintain contact
with our customer base to understand buying patterns, customer preferences, and the life cycle of our products. Changes in customer requirements are factored into the reserves, as needed.
Purchase Accounting. The purchase price of an acquired business is allocated to the underlying tangible and intangible assets acquired and liabilities assumed based upon their respective fair market values, with any excess recorded as goodwill. Such fair market value assessments require judgments and estimates which may change over time and may cause the final amounts to differ materially from original estimates. Any adjustments to fair value assessments are recorded to goodwill over the purchase price allocation period which cannot exceed twelve months from the date of acquisition. Refer to Note 2, "Business Acquisitions and Investments”, in the accompanying consolidated financial statements for additional information.
Recently Issued Accounting Pronouncements
Refer to Note 1, “Summary of Significant Accounting Policies” in the accompanying consolidated financial statements for additional information on recently issued accounting pronouncements.
ITEM 7A. Quantitative and Qualitative Disclosures about Market Risk.
Our market risk is the potential loss arising from adverse changes in interest rates. Accounts receivable factored under our customer-sponsored accounts receivable sales programs bear interest at rates tied to Term SOFR or alternative discount rates and result in us incurring costs as those accounts receivable are factored. Additionally, interest expense from our variable rate debt is impacted by reference rates.
Under the terms of our customer-sponsored programs to sell accounts receivable, a change in the reference rate would affect the amount of financing costs we incur, and the amount of cash we receive upon the sales of accounts receivable under these programs. A one-percentage-point increase in Term SOFR or the discount rates on the accounts receivable sales programs would have increased our factoring costs and reduced the amount of cash we would have received by approximately $8.8 million, $7.9 million, and $8.7 million in the years ended December 31, 2024, 2023, and 2022, respectively.
Under the terms of our credit agreement, a change in the reference rate or the lender’s base rate would affect the rate at which we could borrow funds thereunder. A one-percentage-point increase in the reference rate or base rate would have increased our interest expense on our variable rate debt under our credit agreement by approximately $5.6 million, $6.8 million, and $2.4 million in the years ended December 31, 2024, 2023, and 2022, respectively.
These estimates assume that our level of sales of accounts receivable and variable rate debt balance remains constant for an annual period and the interest rate change occurs at the beginning of the period. The hypothetical changes and assumptions may be different from what occurs in the future. See ITEM 1A, “Risk Factors – Risks Related to Our Capital Structure and Finances” for information regarding the risks relating to our indebtedness, our accounts receivable sales agreements, and interest rates.
ITEM 8. Financial Statements and Supplementary Data.
Our financial statement schedule that is filed with this Annual Report on Form 10-K is listed in PART IV –ITEM 15, “Exhibits, Financial Statement Schedules.”
Report of Independent Registered Public Accounting Firm
To the Shareholders and Board of Directors
Dorman Products, Inc.:
Opinion on the Consolidated Financial Statements
We have audited the accompanying consolidated balance sheets of Dorman Products, Inc. and subsidiaries (the Company) as of December 31, 2024 and 2023, the related consolidated statements of operations and comprehensive income, shareholders’ equity, and cash flows for each of the years in the three-year period ended December 31, 2024, and the related notes and financial statement schedule II (collectively, the consolidated financial statements). In our opinion, the consolidated financial statements present fairly, in all material respects, the financial position of the Company as of December 31, 2024 and 2023, and the results of its operations and its cash flows for each of the years in the three-year period ended December 31, 2024, in conformity with U.S. generally accepted accounting principles.
We also have audited, in accordance with the standards of the Public Company Accounting Oversight Board (United States) (PCAOB), the Company’s internal control over financial reporting as of December 31, 2024, based on criteria established in Internal Control – Integrated Framework (2013) issued by the Committee of Sponsoring Organizations of the Treadway Commission, and our report dated February 27, 2025 expressed an unqualified opinion on the effectiveness of the Company’s internal control over financial reporting.
Basis for Opinion
These consolidated financial statements are the responsibility of the Company’s management. Our responsibility is to express an opinion on these consolidated financial statements based on our audits. We are a public accounting firm registered with the PCAOB and are required to be independent with respect to the Company in accordance with the U.S. federal securities laws and the applicable rules and regulations of the Securities and Exchange Commission and the PCAOB.
We conducted our audits in accordance with the standards of the PCAOB. Those standards require that we plan and perform the audit to obtain reasonable assurance about whether the consolidated financial statements are free of material misstatement, whether due to error or fraud. Our audits included performing procedures to assess the risks of material misstatement of the consolidated financial statements, whether due to error or fraud, and performing procedures that respond to those risks. Such procedures included examining, on a test basis, evidence regarding the amounts and disclosures in the consolidated financial statements. Our audits also included evaluating the accounting principles used and significant estimates made by management, as well as evaluating the overall presentation of the consolidated financial statements. We believe that our audits provide a reasonable basis for our opinion.
Critical Audit Matter
The critical audit matter communicated below is a matter arising from the current period audit of the consolidated financial statements that was communicated or required to be communicated to the audit committee and that: (1) relates to accounts or disclosures that are material to the consolidated financial statements and (2) involved our especially challenging, subjective, or complex judgments. The communication of a critical audit matter does not alter in any way our opinion on the consolidated financial statements, taken as a whole, and we are not, by communicating the critical audit matter below, providing a separate opinion on the critical audit matter or on the accounts or disclosures to which it relates.
Accrual for customer credits for defective product returns
As disclosed in Notes 1 and 12 to the consolidated financial statements, the Company estimates customer credits for defective product returns and other items. The accrual for customer credits to be issued for defective product returns includes assumptions about the length of time between when a sale occurs and a credit is issued. The provision for customer credits is reflected in the consolidated financial statements as a reduction from gross
sales and accruals for customer credits are a portion of accrued customer rebates and returns. At December 31, 2024, accrued customer rebates and returns were $204.4 million.
We identified the evaluation of the accrual for customer credits for defective product returns as a critical audit matter. Subjective auditor judgment was required to evaluate the Company’s determination of the impact of market conditions on the length of time between when a sale occurs and a credit is issued for defective product returns.
The following are the primary procedures we performed to address this critical audit matter. We evaluated the design and tested the operating effectiveness of certain internal controls related to the Company’s process to record the accrual for customer credits for defective product returns. This included a control related to the determination of the impact of market conditions on the length of time between when a sale occurs and a credit is issued for defective product returns. We assessed the Company’s accrual for customer credits for defective product returns by evaluating (1) the historical relationship between sales and customer credits for defective product returns, (2) the Company’s internal data, (3) certain external market data, and (4) a sample of executed third-party contracts. We inquired of personnel within the Company’s quality control department regarding the impact of current market conditions on the length of time between when a sale occurs and a credit is issued for defective product returns. We analyzed a sample of customer credits issued after year-end and evaluated their effect on the accrual.
/s/ KPMG LLP
We have served as the Company’s auditor since 2002.
Philadelphia, Pennsylvania
February 27, 2025
DORMAN PRODUCTS, INC. AND SUBSIDIARIES
CONSOLIDATED STATEMENTS OF OPERATIONS AND COMPREHENSIVE INCOME
| | | | | | | | | | | | | | | | | |
| For the Year Ended December 31, |
| (in thousands, except per share data) | 2024 | | 2023 | | 2022 |
| Net sales | $ | 2,009,197 | | | $ | 1,929,788 | | | $ | 1,733,749 | |
| Cost of goods sold | 1,202,838 | | | 1,244,365 | | | 1,169,299 | |
| Gross profit | 806,359 | | | 685,423 | | | 564,450 | |
| Selling, general and administrative expenses | 513,450 | | | 470,663 | | | 393,402 | |
| Income from operations | 292,909 | | | 214,760 | | | 171,048 | |
| Interest expense, net | 39,727 | | | 48,061 | | | 15,582 | |
| Other income, net | 3,070 | | | 1,804 | | | 735 | |
| Income before income taxes | 256,252 | | | 168,503 | | | 156,201 | |
| Provision for income taxes | 66,248 | | | 39,244 | | | 34,652 | |
| Net income | $ | 190,004 | | | $ | 129,259 | | | $ | 121,549 | |
| Other comprehensive income: | | | | | |
| Change in foreign currency translation adjustment | $ | (4,185) | | | $ | 713 | | | $ | (1,863) | |
| Comprehensive Income | $ | 185,819 | | | $ | 129,972 | | | $ | 119,686 | |
| | | | | |
| Earnings per share: | | | | | |
| Basic | $ | 6.17 | | | $ | 4.11 | | | $ | 3.87 | |
| Diluted | $ | 6.14 | | | $ | 4.10 | | | $ | 3.85 | |
| Weighted average shares outstanding: | | | | | |
| Basic | 30,797 | | 31,455 | | 31,434 |
| Diluted | 30,956 | | 31,533 | | 31,543 |
See accompanying Notes to Consolidated Financial Statements.
DORMAN PRODUCTS, INC. AND SUBSIDIARIES
CONSOLIDATED BALANCE SHEETS
| | | | | | | | | | | |
| December 31, |
| (in thousands, except share data) | 2024 | | 2023 |
| Assets | | | |
| Current assets: | | | |
| Cash and cash equivalents | $ | 57,137 | | | $ | 36,814 | |
| Accounts receivable, less allowance for doubtful accounts of $1,619 and $3,518 | 573,787 | | | 526,867 | |
| Inventories | 707,977 | | | 637,375 | |
| Prepaids and other current assets | 30,859 | | | 32,653 | |
| Total current assets | 1,369,760 | | | 1,233,709 | |
| Property, plant and equipment, net | 164,499 | | | 160,113 | |
| Operating lease right-of-use assets | 118,499 | | | 103,476 | |
| Goodwill | 442,886 | | | 443,889 | |
| Intangible assets, net | 278,213 | | | 301,556 | |
| Deferred tax assets | 5,786 | | | — | |
| Other assets | 44,878 | | | 49,664 | |
| Total assets | $ | 2,424,521 | | | $ | 2,292,407 | |
| Liabilities and shareholders' equity | | | |
| Current liabilities: | | | |
| Accounts payable | $ | 231,814 | | | $ | 176,664 | |
| Accrued compensation | 44,002 | | | 23,971 | |
| Accrued customer rebates and returns | 204,355 | | | 204,495 | |
| Revolving credit facility | 13,960 | | | 92,760 | |
| Current portion of long-term debt | 28,125 | | | 15,625 | |
| Other accrued liabilities | 41,546 | | | 33,636 | |
| Total current liabilities | 563,802 | | | 547,151 | |
| Long-term debt | 439,513 | | | 467,239 | |
| Long-term operating lease liabilities | 105,142 | | | 91,262 | |
| Deferred tax liabilities | 3,700 | | | 8,925 | |
| Other long-term liabilities | 18,894 | | | 9,627 | |
| Commitments and contingencies (Note 11) | | | |
| Shareholders' equity: | | | |
| Common stock, par value $0.01; authorized 50,000,000 shares; issued and outstanding 30,565,855 and 31,299,770 shares in 2024 and 2023, respectively | 306 | | | 313 | |
| Additional paid-in capital | 119,077 | | | 101,045 | |
| Retained earnings | 1,180,862 | | | 1,069,435 | |
| Accumulated other comprehensive loss | (6,775) | | | (2,590) | |
| Total shareholders' equity | 1,293,470 | | | 1,168,203 | |
| Total liabilities and shareholders' equity | $ | 2,424,521 | | | $ | 2,292,407 | |
See accompanying Notes to Consolidated Financial Statements.
DORMAN PRODUCTS, INC. AND SUBSIDIARIES
CONSOLIDATED STATEMENTS OF SHAREHOLDERS' EQUITY
| | | | | | | | | | | | | | | | | | | | | | | | | | | | | | | | | | | |
| Common Stock | | Additional
Paid-In
Capital | | Retained
Earnings | | Accumulated Other Comprehensive Loss | | Total |
| (in thousands, except share data) | Shares
Issued | | Par
Value | | | | |
| Balance at December 25, 2021 | 31,607,509 | | $ | 316 | | | $ | 77,451 | | | $ | 856,409 | | | $ | (1,440) | | | $ | 932,736 | |
| Exercise of stock options | 18,515 | | — | | | 1,046 | | | — | | | — | | | 1,046 | |
| Compensation expense under incentive stock plan | — | | — | | | 9,370 | | | — | | | — | | | 9,370 | |
| Purchase and cancellation of common stock | (203,765) | | (2) | | | (367) | | | (19,565) | | | — | | | (19,934) | |
| Issuance of non-vested stock, net of cancellations | 27,224 | | — | | | 2,032 | | | — | | | — | | | 2,032 | |
| Other stock-related activity, net of tax | (18,851) | | — | | | (782) | | | (1,523) | | | — | | | (2,305) | |
| Other comprehensive loss | — | | — | | | — | | | — | | | (1,863) | | | (1,863) | |
| Net income | — | | — | | | — | | | 121,549 | | | — | | | 121,549 | |
| Balance at December 31, 2022 | 31,430,632 | | 314 | | | 88,750 | | | 956,870 | | | (3,303) | | | 1,042,631 | |
| Exercise of stock options | 17,489 | | — | | | 1,167 | | | — | | | — | | | 1,167 | |
| Compensation expense under incentive stock plan | — | | — | | | 11,484 | | | — | | | — | | | 11,484 | |
| Purchase and cancellation of common stock | (215,410) | | (2) | | | (387) | | | (16,104) | | | — | | | (16,493) | |
| Issuance of non-vested stock, net of cancellations | 93,437 | | 1 | | | 1,985 | | | — | | | — | | | 1,986 | |
| Other stock-related activity, net of tax | (26,378) | | — | | | (1,954) | | | (590) | | | — | | | (2,544) | |
| Other comprehensive loss | — | | — | | | — | | | — | | | 713 | | | 713 | |
| Net income | — | | — | | | — | | | 129,259 | | | — | | | 129,259 | |
| Balance at December 31, 2023 | 31,299,770 | | 313 | | | 101,045 | | | 1,069,435 | | | (2,590) | | | 1,168,203 | |
| Exercise of stock options | 63,605 | | 1 | | | 4,711 | | | — | | | — | | | 4,712 | |
| Compensation expense under incentive stock plan | — | | — | | | 15,012 | | | — | | | — | | | 15,012 | |
| Purchase and cancellation of common stock | (874,428) | | (9) | | | (1,574) | | | (78,444) | | | — | | | (80,027) | |
| Issuance of non-vested stock, net of cancellations | 100,778 | | 1 | | | 2,120 | | | — | | | — | | | 2,121 | |
| Other stock-related activity, net of tax | (23,870) | | — | | | (2,237) | | | (133) | | | — | | | (2,370) | |
| Other comprehensive loss | — | | — | | | — | | | — | | | (4,185) | | | (4,185) | |
| Net income | — | | — | | | — | | | 190,004 | | | — | | | 190,004 | |
| Balance at December 31, 2024 | 30,565,855 | | $ | 306 | | | $ | 119,077 | | | $ | 1,180,862 | | | $ | (6,775) | | | $ | 1,293,470 | |
See accompanying Notes to Consolidated Financial Statements.
DORMAN PRODUCTS, INC. AND SUBSIDIARIES
CONSOLIDATED STATEMENTS OF CASH FLOWS
| | | | | | | | | | | | | | | | | |
| For the Year Ended December 31, |
| (in thousands) | 2024 | | 2023 | | 2022 |
| Cash Flows from Operating Activities: | | | | | |
| Net income | $ | 190,004 | | | $ | 129,259 | | | $ | 121,549 | |
| Adjustments to reconcile net income to cash provided by operating activities: | | | | | |
| Depreciation, amortization, and accretion | 56,700 | | | 54,729 | | | 44,677 | |
| Provision for doubtful accounts | 90 | | | 4,592 | | | 86 | |
| Benefit from deferred income taxes | (10,838) | | | (2,960) | | | (5,880) | |
| Provision for stock-based compensation | 15,012 | | | 11,484 | | | 9,370 | |
| Fair value adjustment to contingent consideration | — | | | (20,468) | | | — | |
| Payment of contingent consideration | — | | | — | | | (120) | |
| Changes in assets and liabilities: | | | | | |
| Accounts receivable | (47,232) | | | (104,020) | | | 48,479 | |
| Inventories | (72,087) | | | 118,606 | | | (133,790) | |
| Prepaids and other current assets | (4,866) | | | 15,324 | | | (11,150) | |
| Other assets | 796 | | | (4,931) | | | (28) | |
| Accounts payable | 55,713 | | | (3,138) | | | (5,542) | |
| Accrued customer rebates and returns | (120) | | | 12,372 | | | 2,433 | |
| Accrued compensation and other liabilities | 47,875 | | | (2,091) | | | (28,396) | |
| Cash provided by operating activities | 231,047 | | | 208,758 | | | 41,688 | |
| Cash Flows from Investing Activities: | | | | | |
| Acquisitions, net of divestitures | 100 | | | 67 | | | (488,956) | |
| Property, plant and equipment additions | (39,421) | | | (43,968) | | | (37,883) | |
| Cash used in investing activities | (39,321) | | | (43,901) | | | (526,839) | |
| Cash Flows from Financing Activities: | | | | | |
| Proceeds of revolving credit line | — | | | — | | | 10,000 | |
| Payments of revolving credit line | (78,800) | | | (146,600) | | | (10,000) | |
| Proceeds of long-term debt | — | | | — | | | 500,000 | |
| Payments of long-term debt | (15,625) | | | (12,500) | | | (3,125) | |
| Payment of deferred acquisition consideration | (200) | | | — | | | — | |
| Payment of contingent consideration | — | | | — | | | (1,705) | |
| Payment of debt issuance costs | — | | | — | | | (3,918) | |
| Proceeds from exercise of stock options | 4,711 | | | 1,167 | | | 1,046 | |
| Purchase and cancellation of common stock | (80,811) | | | (15,709) | | | (19,934) | |
| Other stock-related activity | (254) | | | (467) | | | 132 | |
| Cash (used in) provided by financing activities | (170,979) | | | (174,109) | | | 472,496 | |
| Effect of exchange rate changes on Cash and Cash Equivalents | (424) | | | 32 | | | (93) | |
| Net Increase (Decrease) in Cash and Cash Equivalents | 20,323 | | | (9,220) | | | (12,748) | |
| Cash and Cash Equivalents, Beginning of Period | 36,814 | | | 46,034 | | | 58,782 | |
| Cash and Cash Equivalents, End of Period | $ | 57,137 | | | $ | 36,814 | | | $ | 46,034 | |
| Supplemental Cash Flow Information | | | | | |
| Cash paid for interest expense | $ | 38,713 | | | $ | 49,507 | | | $ | 11,647 | |
| Cash paid for income taxes | $ | 56,705 | | | $ | 35,465 | | | $ | 62,861 | |
See accompanying Notes to Consolidated Financial Statements.
DORMAN PRODUCTS, INC. AND SUBSIDIARIES
NOTES TO CONSOLIDATED FINANCIAL STATEMENTS
DECEMBER 31, 2024
1. Summary of Significant Accounting Policies
Dorman Products, Inc. ("Dorman", the "Company", “we”, “us”, or “our”) is a supplier of replacement and upgrade parts in the motor vehicle aftermarket industry, serving passenger cars, light-, medium-, and heavy-duty trucks as well as specialty vehicles, including utility terrain vehicles (UTVs) and all-terrain vehicles (ATVs). We operate through three business segments: Light Duty, Heavy Duty, and Specialty Vehicle, consistent with the sectors of the motor vehicle aftermarket industry in which we operate. For more information on our segments, refer to Note 8, "Segment Information," to the Consolidated Financial Statements.
Principles of Consolidation. The Consolidated Financial Statements include our accounts and the accounts of our wholly owned subsidiaries. All material intercompany accounts and transactions have been eliminated in consolidation.
Use of Estimates in the Preparation of Financial Statements. The preparation of financial statements in accordance with accounting principles generally accepted in the United States (“GAAP”) requires management to make estimates and assumptions that affect the reported amounts of assets and liabilities and disclosure of contingent assets and liabilities at the date of the financial statements, and the reported amounts of revenues and expenses during the reporting period. Actual results could differ from those estimates.
Cash and Cash Equivalents. We consider all highly liquid short-term investments with original maturities of three months or less to be cash equivalents.
Sales of Accounts Receivable. We have entered into several customer-sponsored programs administered by unrelated financial institutions that permit us to sell certain accounts receivable at discounted rates to the financial institutions. Transactions under these programs were accounted for as sales of accounts receivable and were removed from our Consolidated Balance Sheet at the time of the sales transactions. Sales of accounts receivable under these agreements, and related factoring costs, which were included in selling, general and administrative expenses, were as follows:
| | | | | | | | | | | | | | | | | |
| For the Year Ended December 31, |
| (in thousands) | 2024 | | 2023 | | 2022 |
| Sales of accounts receivable | $ | 1,106,400 | | | $ | 949,517 | | | $ | 1,048,671 | |
| Factoring costs | $ | 51,252 | | | $ | 50,231 | | | $ | 37,188 | |
Inventories. Inventories are stated at the lower of cost or net realizable value. Cost is determined by the first-in, first-out method. Inventories include the cost of material, freight, direct labor, and overhead utilized in the processing of our products. We provide reserves for discontinued and excess inventory based upon historical demand, forecasted usage, estimated customer requirements, and product line updates.
Property, Plant and Equipment. Property, plant and equipment are recorded at cost and depreciated over the estimated useful lives, which range from 1 to 39 years, using the straight-line method for financial statement reporting purposes and accelerated methods for income tax purposes. The costs of maintenance and repairs are expensed as incurred. Renewals and betterments are capitalized. Gains and losses on disposals are included in operating results.
Estimated useful lives by major asset category are as follows:
| | | | | |
| Buildings and building improvements | 10 to 39 years |
| Machinery, equipment, and tooling | 3 to 10 years |
| Software and computer equipment | 3 to 10 years |
| Furniture, fixtures, and leasehold improvements | 1 to 39 years |
Long-Lived Assets Including Goodwill and Other Acquired Intangible Assets. Long-lived assets, including property, plant, and equipment and amortizable identifiable intangibles, are reviewed for impairment
whenever events or changes in circumstances indicate that the carrying amount of an asset or asset group may not be recoverable. The impairment review is a two-step process. First, recoverability is measured by comparing the carrying amount of an asset to the estimated undiscounted future cash flows expected to be generated by the asset. If the carrying amount exceeds the estimated undiscounted future cash flows, the second step of the impairment test is performed, and an impairment charge is recognized in the amount by which the carrying amount of the asset exceeds its fair value. The assets and liabilities of a disposal group classified as held for sale would be separately presented in the balance sheet and reported at the lower of the carrying amount or fair value less costs to sell, and would no longer be depreciated.
Goodwill is reviewed for impairment on an annual basis or whenever events or changes in circumstances indicate the carrying value of the goodwill may be impaired. For the annual test, we have the option to first assess qualitative factors to determine whether the existence of events or circumstances leads to a determination that it is more likely than not that the fair value of a reporting unit is less than its carrying amount (“Step 0”). If through the Step 0 test we determine it is more likely than not that the fair value of a reporting unit is less than its carrying amount (or if the Company elects to not perform Step 0), then we would perform a quantitative test (“Step 1”) to determine whether an impairment charge was necessary. During 2023 and 2024, we elected to perform a Step 1 test of our goodwill for the purpose of assessing goodwill for impairment. For both the years ended December 31, 2024 and 2023, we determined that goodwill was not impaired.
Purchase Accounting. The purchase price of an acquired business is allocated to the underlying tangible and intangible assets acquired and liabilities assumed based on their respective fair market values, with the excess recorded as goodwill. Such fair market value assessments require judgments and estimates which may change over time and may cause the final amounts to differ materially from their original estimates. These adjustments to fair value assessments are recorded to goodwill over the purchase price allocation period which cannot exceed 12 months from the date of acquisition.
Other Assets. Other assets include primarily core inventory, deposits, and equity method investments.
Certain products we sell contain parts that can be recycled, or as more commonly referred to in our industry, remanufactured. We refer to these parts as cores. A used core is remanufactured and sold to a customer. Customers and end-users will generally return used cores to us, which we then use in the remanufacturing process to make another finished good.
Core inventory was $15.4 million and $20.0 million as of December 31, 2024 and 2023, respectively, and is classified as long-term based on our view that the value of the cores is not expected to be consumed or realized in cash during our normal annual operating cycle.
We have investments that we account for according to the equity method of accounting. The total book value of these investments was $11.2 million and $10.8 million at December 31, 2024 and 2023, respectively. These investments provided $5.3 million, $5.7 million, and $5.5 million of income during the year ended December 31, 2024, 2023, and 2022, respectively. Additionally, we have an investment that we account for according to the cost method of accounting. The carrying book value of this investment was $5.0 million as of both December 31, 2024 and 2023.
Other Accrued Liabilities. Other accrued liabilities include primarily accrued commissions, accrued income taxes, insurance liabilities, and other current liabilities.
Revenue Recognition and Accrued Customer Rebates and Returns. Revenue is recognized when performance obligations under the terms of a contract with a customer are satisfied, in an amount representing the consideration the Company expects to receive in exchange for selling products to its customers. We record estimates for cash discounts, defective and slow-moving product returns, promotional rebates, core return deposits, and other discounts in the period of the sale ("Customer Credits"). The provision for Customer Credits is recorded as a reduction from gross sales and reserves for Customer Credits are shown as an increase of accrued customer rebates and returns, which is included in current liabilities. The provision for Customer Credits is estimated based on contractual provisions, historical experience, and our assessment of current market conditions and includes various assumptions including, but not limited to, the length of time between when a sale occurs and a credit is issued. Actual Customer Credits have not differed materially from estimated amounts.
Amounts billed to customers for shipping and handling are included in net sales. Costs associated with shipping and handling are included in cost of goods sold.
As noted above, Customer Credits include core return deposits which are an estimate of the amount we believe we will refund to our customers when used cores are returned to us. The price we invoice to customers for remanufactured cores contains both the amount we charge to remanufacture the part and a deposit for the core. We charge a core deposit to encourage the customer to return the used core to us so that it can be used in our remanufacturing process. We allow our customers up to twenty-four months to return the used core to us. Core return deposits are reserved based on the expected deposits to be issued to customers based on historical returns.
Research and Development. Research and development costs are expensed as incurred. Research and development costs totaling $32.1 million, $32.3 million, and $24.8 million have been recorded in selling, general and administrative expenses in the Consolidated Statements of Operations for the years ended December 31, 2024, 2023, and 2022, respectively.
Stock-Based Compensation. At December 31, 2024, we had awards outstanding under a stock-based employee compensation plan, which is described more fully in Note 13, "Capital Stock." We record compensation expense for all awards granted. The value of time-based restricted stock awards (“RSAs”) and restricted stock units (“RSUs”) issued was based on the fair value of our common stock on the grant date. The fair value of performance-based RSUs, for which the performance measure is total shareholder return relative to a defined peer group, is determined using a Monte Carlo simulation model. The fair value of performance-based RSUs for which the performance measure is return on invested capital over the performance period was based on the fair value of our common stock on the grant date. The fair value of stock options granted is determined using the Black-Scholes option valuation model on the grant date.
Income Taxes. We follow the asset and liability method of accounting for deferred income taxes. Deferred tax assets and liabilities are determined based on the difference between the financial statement and tax bases of assets and liabilities. Deferred tax assets or liabilities at the end of each period are determined using the enacted tax rate expected to be in effect when taxes are paid or recovered.
Unrecognized income tax benefits represent income tax positions taken on income tax returns that have not been recognized in the consolidated financial statements. The Company recognizes the benefit of an income tax position only if it is more likely than not (greater than 50%) that the tax position will be sustained upon tax examination, based solely on the technical merits of the tax position. Otherwise, no benefit is recognized. The tax benefits recognized are measured based on the largest benefit that has a greater than 50% likelihood of being realized upon ultimate settlement. Additionally, we accrue interest and related penalties, if applicable, on all tax exposures for which reserves have been established consistent with jurisdictional tax laws. Interest and penalties are classified as income tax expense in the Consolidated Statements of Operations.
Concentrations of Risk. Financial instruments that potentially subject us to concentrations of credit risk consist primarily of cash equivalents and accounts receivable. All cash equivalents are managed within established guidelines that limit the amount that may be invested with one issuer. A significant percentage of our accounts receivable have been, and will continue to be, concentrated among a relatively small number of automotive retailers and warehouse distributors in the United States. Our 4 largest customers accounted for 78% and 74% of net accounts receivable as of December 31, 2024 and 2023, respectively. We continually monitor the credit terms and credit limits for these and other customers.
For the years ended December 31, 2024 and 2023, approximately 72% and 70%, respectively, of our products were purchased from suppliers in a variety of non-U.S. countries, with the largest portion of our overseas purchases being made in China.
Fair Value Disclosures. The carrying value of financial instruments such as cash and cash equivalents, accounts receivable, accounts payable, and other current assets and liabilities approximate their fair value based on the short-term nature of these instruments. The carrying value of our long-term debt approximates its fair value because it bears interest at a rate indexed to a market rate (Term SOFR). Additionally, the fair value of assets acquired and liabilities assumed are determined at the date of acquisition. Contingent consideration
associated with an acquisition is recorded at fair value at the acquisition date and is adjusted to fair value at each reporting period.
Recent Accounting Pronouncements. In November 2023, the FASB issued Accounting Standards Update (“ASU”) 2023-07, Improvements to Reportable Segment Disclosures. The ASU requires additional disclosures about reportable segments’ significant expenses on an interim and annual basis. The ASU was effective for fiscal years beginning after December 15, 2023, and interim periods within fiscal years beginning after December 15, 2024 on a retrospective basis. We adopted this guidance for our annual report on Form 10-K for the year ended December 31, 2024 and applied the amendments retrospectively to all prior periods presented. The disclosures for interim periods will be adopted in our fiscal year beginning on January 1, 2025. The adoption of this standard did not have a material impact on our results of operations or financial condition. See Note 8, "Segment Information," for further details on segment information.
In December 2023, the FASB issued ASU 2023-09, Improvements to Income Tax Disclosures. The ASU expands disclosures in the income tax rate reconciliations table and cash taxes paid and is effective for annual periods beginning after December 15, 2024.
In November 2024, the FASB issued ASU 2024-03, Disaggregation of Income Statement Expenses. The ASU requires additional disclosures about categories of expenses, including, among other things, quantitative disclosures for employee compensation, depreciation, intangible asset amortization, selling expenses, and purchases of inventory. The updated guidance is effective for annual reporting periods beginning after December 15, 2026 and interim reporting periods within annual reporting periods beginning after December 15, 2027.
We expect to implement these new standards by their effective dates, and do not expect their adoption to have an impact on our results of operations, financial condition or cash flows.
2. Business Acquisitions and Investments
Super ATV, LLC (“SuperATV”)
On October 4, 2022, Dorman acquired 100% of the issued and outstanding equity interests of SuperATV (the “Transaction”), for aggregate consideration of $509.8 million (net of $6.8 million cash acquired), plus a potential earn-out payment to the sellers of SuperATV not to exceed $100 million in the aggregate, subject to the achievement by SuperATV of certain revenue and gross margin targets in the years ended December 31, 2023 and December 31, 2024. See Note 11, "Commitments and Contingencies," for additional information on contingent consideration associated with the Transaction. In the year ended December 31, 2023, we received $0.3 million in cash as proceeds from the closing net working capital adjustments. SuperATV is a leading independent supplier to the powersports aftermarket with a family of highly respected brands spanning functional accessories and upgrades, as well as replacement parts for specialty vehicles.
The Transaction was funded in cash through the refinancing of our existing credit facility discussed further in Note 7, "Long-Term Debt."
The Transaction was accounted for as a business combination under the acquisition method of accounting. We have allocated the purchase price to tangible and identifiable intangible assets acquired and liabilities assumed based on their estimated fair values. Our purchase price allocation for SuperATV assets acquired and liabilities assumed was complete as of September 30, 2023.
The table below details the fair values of the assets acquired and the liabilities assumed at the acquisition date:
| | | | | |
| (in thousands) | |
| Accounts receivable | $ | 3,317 | |
| Inventories | 90,428 | |
| Prepaids and other current assets | 5,293 | |
| Property, plant and equipment | 23,776 | |
| Goodwill | 247,474 | |
| Identifiable intangible assets | 157,500 | |
| Operating lease right-of-use assets | 11,661 | |
| Other Assets | 3,001 | |
| Accounts payable | (7,436) | |
| Accrued compensation | (2,086) | |
| Accrued customer rebates and returns | (1,609) | |
| Other current liabilities | (8,726) | |
| Long-term operating lease liabilities | (9,508) | |
| Other long-term liabilities | (3,307) | |
| Net cash consideration | 509,778 | |
The financial results of the Transaction have been included in the consolidated financial statements from the date of acquisition. The net sales and net income of SuperATV included in the consolidated financial statements for the year ended December 31, 2022 were $49.6 million and $2.3 million, respectively.
The unaudited pro forma information for the periods set forth below gives effect to the Transaction as if it had occurred as of December 26, 2021 the beginning of the fiscal 2022 period.
The pro forma information is presented for informational purposes only and is not necessarily indicative of the results of operations that would have been achieved had the acquisition been consummated as of that time.
| | | | | |
| For the Year Ended |
| (in thousands, except per share data, unaudited) | December 31, 2022 |
| Net sales | $ | 1,888,379 | |
| Net income | $ | 130,375 | |
| Diluted earnings per share | $ | 4.13 | |
The fiscal 2022 unaudited pro forma net income set forth above was adjusted to exclude the impact of acquisition date fair value adjustments to inventory and to remove acquisition-related transaction costs.
3. Inventories
Inventories were as follows :
| | | | | | | | | | | |
| December 31, |
| (in thousands) | 2024 | | 2023 |
| Raw materials | $ | 29,233 | | | $ | 29,750 | |
| Bulk product | 246,604 | | | 211,805 | |
| Finished product | 421,734 | | | 387,668 | |
| Packaging materials | 10,406 | | | 8,152 | |
| Total | $ | 707,977 | | | $ | 637,375 | |
4. Property, Plant and Equipment
Property, plant and equipment include the following:
| | | | | | | | | | | |
| December 31, |
| (in thousands) | 2024 | | 2023 |
| Buildings | $ | 67,040 | | | $ | 62,434 | |
| Machinery, equipment, and tooling | 223,807 | | | 208,086 | |
| Furniture, fixtures, and leasehold improvements | 18,390 | | | 17,083 | |
| Software and computer equipment | 127,578 | | | 113,148 | |
| Total | 436,815 | | | 400,751 | |
| Less-accumulated depreciation and amortization | (272,316) | | | (240,638) | |
| Property, plant and equipment, net | $ | 164,499 | | | $ | 160,113 | |
Depreciation and amortization expenses associated with property, plant, and equipment were $34.0 million, $31.9 million, and $28.6 million in the years ended December 31, 2024, 2023, and 2022, respectively.
Net property, plant and equipment outside the United States was $4.6 million and $4.3 million as of December 31, 2024 and 2023, respectively.
5. Leases
We determine whether an arrangement is a lease at inception. This determination generally depends on whether the arrangement conveys the right to control the use of an identified fixed asset explicitly or implicitly for a period of time in exchange for consideration. Control of an underlying asset is conveyed if we obtain the rights to direct the use of the asset and to obtain substantially all of the economic benefit from its use. We have operating leases for distribution centers, sales offices, and certain warehouse and office equipment. Our operating leases have remaining lease terms of 1 to 9 years, many of which include one or more renewal options. We consider these renewal options in determining the lease term used to establish our right-of-use assets and lease liabilities when it is determined that it is reasonably certain that the renewal option will be exercised. Substantially all of our equipment leases and some of our real estate leases have terms of less than one year. Some of our operating lease agreements include variable lease costs, primarily taxes, insurance, common area maintenance, or increases in rental costs related to inflation.
Operating leases are included in the right-of-use lease assets, other current liabilities, and long-term lease liabilities on the Consolidated Balance Sheet. Right-of-use assets and lease liabilities are recognized at each lease’s commencement date based on the present values of its lease payments over its respective lease term. When a borrowing rate is not explicitly available for a lease, our incremental borrowing rate is used based on information available at the lease’s commencement date to determine the present value of its lease payments. The incremental borrowing rate is not commonly quoted and is derived through a combination of inputs including our credit rating and the impact of full collateralization. The incremental borrowing rate is based on our collateralized borrowing capabilities over a similar term to the lease payments. We utilized the consolidated group borrowing rate for all leases as we operate a centralized treasury operation. Operating lease payments are recognized on a straight-line basis over the lease term. We had no material finance leases as of December 31, 2024 or 2023.
Practical Expedients and Accounting Policy Elections
We have made certain accounting policy elections and are using certain practical expedients permitted under GAAP, as follows:
•Include both lease and non-lease components as a single lease component, as non-lease components of contracts have not historically been material.
•Account for leases with terms of one year or less as short-term leases and, as such, are not included in the right-of-use assets or lease liabilities.
As of December 31, 2024 and 2023, there were no material variable lease costs or sublease income. Cash paid for operating leases was $22.8 million, $21.2 million, and $16.8 million during the years ended December 31, 2024, 2023, and 2022, respectively, which is classified in operating activities on the Consolidated Statements of Cash Flows. The following table summarizes the lease expense:
| | | | | | | | | | | | | | | | | |
| For the Year Ended December 31, |
| (in thousands) | 2024 | | 2023 | | 2022 |
| Operating lease expense | $ | 23,926 | | | $ | 21,747 | | | $ | 17,340 | |
| Short-term lease expense | 4,159 | | | 7,169 | | | 5,838 | |
| Total lease expense | $ | 28,085 | | | $ | 28,916 | | | $ | 23,178 | |
Supplemental balance sheet information related to our operating leases is as follows:
| | | | | | | | | | | |
| December 31, |
| (in thousands) | 2024 | | 2023 |
| Operating lease right-of-use assets | $ | 118,499 | | | $ | 103,476 | |
| | | |
| Other accrued liabilities | $ | 19,717 | | | $ | 16,917 | |
| Long-term operating lease liabilities | 105,142 | | | 91,262 | |
| Total operating lease liabilities | $ | 124,859 | | | $ | 108,179 | |
| | | |
| Weighted average remaining lease term (years) | 6.33 | | 6.85 |
| Weighted average discount rate | 5.09 | % | | 4.20 | % |
The following table summarizes the maturities of our lease liabilities for all operating leases as of December 31, 2024:
| | | | | |
| (in thousands) | |
| 2025 | $ | 25,090 | |
| 2026 | 25,820 | |
| 2027 | 24,095 | |
| 2028 | 17,864 | |
| 2029 | 15,915 | |
| Thereafter | 37,215 | |
| Total lease payments | 145,999 | |
| Less: Imputed interest | (21,140) | |
| Present value of lease liabilities | $ | 124,859 | |
6. Goodwill and Intangible Assets
Goodwill
Goodwill included the following:
| | | | | | | | | | | | | | | | | | | | | | | |
| (in thousands) | Light Duty | | Heavy Duty | | Specialty Vehicle | | Consolidated |
| Balance at December 31, 2022 | $ | — | | | $ | — | | | $ | — | | | $ | 443,035 | |
| Measurement period adjustments | — | | | — | | | — | | | 233 | |
| Foreign currency translation | — | | | — | | | — | | | 621 | |
| Reporting unit reorganization | 313,704 | | | 57,876 | | | 72,309 | | | — | |
| Balance at December 31, 2023 | 313,704 | | | 57,876 | | | 72,309 | | | 443,889 | |
| Goodwill acquired | — | | | — | | | 1,167 | | | 1,167 | |
| Foreign currency translation | — | | | (2,170) | | | — | | | (2,170) | |
| Balance at December 31, 2024 | $ | 313,704 | | | $ | 55,706 | | | $ | 73,476 | | | $ | 442,886 | |
Intangible Assets
Intangible assets, subject to amortization, included the following:
| | | | | | | | | | | | | | | | | | | | | | | | | | | | | | | | | | | | | | | | | | | | |
| | | | December 31, |
| | | | 2024 | | 2023 |
| Intangible assets subject to amortization | | Weighted Average Amortization Period (years) | | Gross Carrying Value | | Accumulated Amortization | | Net Carrying Value | | Gross Carrying Value | | Accumulated Amortization | | Net Carrying Value |
| (dollars in thousands) | | | | | | | | | | | | | | |
| Customer relationships | | 15.4 | | $ | 173,430 | | | $ | 41,358 | | | $ | 132,072 | | | $ | 175,430 | | | $ | 31,678 | | | $ | 143,752 | |
| Trade names | | 14.1 | | 67,690 | | | 14,999 | | | 52,691 | | | 67,690 | | | 10,676 | | | 57,014 | |
| Product Portfolio | | 13.7 | | 107,800 | | | 16,522 | | | 91,278 | | | 107,800 | | | 9,720 | | | 98,080 | |
| Technology | | 3.8 | | 2,167 | | | 1,318 | | | 849 | | | 2,167 | | | 1,069 | | | 1,098 | |
| Patents and Other | | 7.3 | | 2,350 | | | 1,027 | | | 1,323 | | | 2,230 | | | 618 | | | 1,612 | |
| Total | | | | $ | 353,437 | | | $ | 75,224 | | | $ | 278,213 | | | $ | 355,317 | | | $ | 53,761 | | | $ | 301,556 | |
Amortization expense associated with intangible assets was $22.8 million, $22.1 million, and $14.2 million in the years ended December 31, 2024, 2023, and 2022, respectively. The estimated future amortization expense for intangible assets as of December 31, 2024 is summarized as follows:
| | | | | |
| (in thousands) | |
| 2025 | $ | 21,649 | |
| 2026 | 20,492 | |
| 2027 | 20,081 | |
| 2028 | 19,856 | |
| 2029 | 19,770 | |
| Thereafter | 176,365 | |
| Total | $ | 278,213 | |
7. Long-Term Debt
We have a credit agreement which consists of a $600.0 million revolving credit facility and a $500.0 million term loan. The credit agreement matures on October 4, 2027, is guaranteed by the Company’s material domestic subsidiaries, and is supported by a security interest in substantially all of the Company’s material domestic subsidiaries’ personal property and assets, subject to certain exceptions.
Borrowings under the credit agreement bear interest at a rate per annum equal to, at our option, either a term Secured Overnight Financing Rate (“Term SOFR”) or a base rate (as defined in the credit agreement), in each case plus an applicable margin, based on the Total Net Leverage Ratio (as defined in the credit agreement).
Unutilized revolving credit facility capacity incurs a commitment fee based on the Total Net Leverage Ratio (as defined in the credit agreement). As of December 31, 2024, the interest rate on the outstanding borrowings under the credit agreement was 5.71% and the commitment fee was 0.15%.
The term loan portion of the credit agreement contains mandatory repayment provisions that require quarterly principal amortization payments. The following table presents the principal amortization payments and maturities on the term loan for each of the years noted, as of December 31, 2024:
| | | | | |
| (in thousands) | December 31, 2024 |
| 2025 | $ | 28,125 | |
| 2026 | 37,500 | |
| 2027 | 403,125 | |
| Total | $ | 468,750 | |
Long-term debt on the consolidated balance sheets is presented net of unamortized debt issuance costs, which totaled $1.1 million and $1.5 million as of December 31, 2024 and 2023, respectively.
The credit agreement contains affirmative and negative covenants, including, but not limited to, covenants regarding capital expenditures, share repurchases, and financial covenants related to the ratio of consolidated interest expense to consolidated EBITDA and the ratio of total net indebtedness to consolidated EBITDA, each as defined by the credit agreement. As of December 31, 2024, we were not in default of the covenants contained in the credit agreement.
8. Segment Information
We operate and report our results in three business segments, Light Duty, Heavy Duty, and Specialty Vehicle, consistent with the three sectors of the motor vehicle aftermarket industry in which we participate. The Light Duty segment designs and markets replacement parts and fasteners primarily for passenger cars and light trucks with sales to retailers and wholesale distributors who primarily serve passenger car and light truck customers. The Heavy Duty segment designs and markets replacement parts primarily for medium and heavy trucks with sales to independent distributors, independent component specialists and rebuilders, and auto parts stores that focus on the heavy-duty market. The Specialty Vehicle segment designs, markets, and manufactures aftermarket parts and accessories for the powersports market with sales through direct-to-consumer, dealers, and installers.
The Company's chief operating decision maker ("CODM") is the chief executive officer. The CODM uses income from operations to assess segment performance. The CODM utilizes this measure for each segment in the annual budget and forecasting cycles and considers performance against established targets for purposes of allocating Company resources to each segment and in the determination of compensation for certain Contributors. We measure segment income from operations based on income from operations excluding acquisition-related intangible assets amortization, acquisition-related transaction and other costs, and other special charges. Corporate expenses are allocated to the segments based on segment net sales as a percentage of consolidated net sales. Segment assets consist of inventories, accounts receivable, and property, plant and equipment, net. Intersegment sales are not material.
Segment results are as follows: | | | | | | | | | | | | | | | | | | | | | | | |
| For the Year Ended December 31, 2024 |
| (in thousands) | Light Duty | | Heavy Duty | | Specialty Vehicle | | Total |
| Net sales | $ | 1,565,601 | | | $ | 231,515 | | | $ | 212,081 | | | $ | 2,009,197 | |
| Cost of goods sold | 925,319 | | | 171,732 | | | 104,994 | | | 1,202,045 | |
| Factoring expense | 51,252 | | | — | | | — | | | 51,252 | |
| Other segment expenses | 304,866 | | | 53,303 | | | 74,752 | | | 432,921 | |
| Segment income from operations | $ | 284,164 | | | $ | 6,480 | | | $ | 32,335 | | | $ | 322,979 | |
| | | | | | | |
| Segment assets | $ | 1,203,165 | | | $ | 157,493 | | | $ | 85,606 | | | $ | 1,446,264 | |
| Depreciation | $ | 26,485 | | | $ | 3,725 | | | $ | 3,750 | | | $ | 33,960 | |
| Capital expenditures | $ | 34,164 | | | $ | 2,421 | | | $ | 2,836 | | | $ | 39,421 | |
| | | | | | | |
| For the Year Ended December 31, 2023 |
| (in thousands) | Light Duty | | Heavy Duty | | Specialty Vehicle | | Total |
| Net sales | $ | 1,462,474 | | | $ | 256,913 | | | $ | 210,401 | | | $ | 1,929,788 | |
| Cost of goods sold | 928,983 | | | 192,729 | | | 110,840 | | | 1,232,552 | |
| Factoring expense | 50,231 | | | — | | | — | | | 50,231 | |
| Other segment expenses | 296,101 | | | 49,679 | | | 67,943 | | | 413,723 | |
| Segment income from operations | $ | 187,159 | | | $ | 14,505 | | | $ | 31,618 | | | $ | 233,282 | |
| | | | | | | |
| Segment assets | $ | 1,083,347 | | | $ | 162,583 | | | $ | 78,424 | | | $ | 1,324,354 | |
| Depreciation | $ | 25,239 | | | $ | 3,239 | | | $ | 3,420 | | | $ | 31,898 | |
| Capital expenditures | $ | 33,445 | | | $ | 3,581 | | | $ | 6,942 | | | $ | 43,968 | |
| | | | | | | |
| For the Year Ended December 31, 2022 |
| (in thousands) | Light Duty | | Heavy Duty | | Specialty Vehicle | | Total |
| Net sales | $ | 1,425,892 | | | $ | 258,215 | | | $ | 49,642 | | | $ | 1,733,749 | |
| Cost of goods sold | 949,918 | | | 183,233 | | | 25,078 | | | 1,158,229 | |
| Factoring expense | 37,188 | | | — | | | — | | | 37,188 | |
| Other segment expenses | 269,207 | | | 45,244 | | | 16,027 | | | 330,478 | |
| Segment income from operations | $ | 169,579 | | | $ | 29,738 | | | $ | 8,537 | | | $ | 207,854 | |
| | | | | | | |
| Segment assets | $ | 1,047,987 | | | $ | 177,557 | | | $ | 106,219 | | | $ | 1,331,763 | |
| Depreciation | $ | 25,062 | | | $ | 2,772 | | | $ | 798 | | | $ | 28,632 | |
| Capital expenditures | $ | 31,682 | | | $ | 4,769 | | | $ | 1,432 | | | $ | 37,883 | |
In the preceding segment tables, Other segment expenses consist of selling, general and administrative expenses including salaries and benefits for product development, research, sales, marketing and administrative functions, facility costs, information technology costs, and other general expenses.
A reconciliation of segment income from operations to consolidated income before income taxes is as follows:
| | | | | | | | | | | | | | | | | |
| For the Year Ended December 31, |
| (in thousands) | 2024 | | 2023 | | 2022 |
| Segment income from operations | $ | 322,979 | | | $ | 233,282 | | | $ | 207,854 | |
| Acquisition-related intangible assets amortization | (22,476) | | | (21,817) | | | (14,070) | |
| Acquisition-related transaction and other costs | (2,621) | | | (15,373) | | | (22,736) | |
| Fair value adjustment to contingent consideration | — | | | 20,469 | | | — | |
| Executive transition services expenses | — | | | (1,801) | | | — | |
| Pretax reduction in workforce costs | (4,973) | | | — | | | — | |
| Interest expense, net | (39,727) | | | (48,061) | | | (15,582) | |
| Other income, net | 3,070 | | | 1,804 | | | 735 | |
| Consolidated income before income taxes | $ | 256,252 | | | $ | 168,503 | | | $ | 156,201 | |
A reconciliation of segment assets to consolidated assets is as follows:
| | | | | | | | | | | | | | | | | |
| December 31, |
| (in thousands) | 2024 | | 2023 | | 2022 |
| Segment assets | $ | 1,446,264 | | | $ | 1,324,354 | | | $ | 1,331,763 | |
| Other current assets | 87,968 | | | 69,468 | | | 85,834 | |
| Other non-current assets | 890,289 | | | 898,585 | | | 924,189 | |
| Consolidated assets | $ | 2,424,521 | | | $ | 2,292,407 | | | $ | 2,341,786 | |
9. Related Party Transactions
Prior to December 1, 2023, we leased our Colmar, PA facility from an entity in which Steven Berman, our Non-Executive Chairman, and certain of his family members are owners. On December 1, 2023, the Colmar facility was sold to a third party, subject to our lease. We also lease a portion of our Lewisberry, PA facility from an entity in which Mr. Berman and certain of his family members are owners. The Colmar lease was, and the Lewisberry lease is, a non-cancelable operating lease. The Lewisberry lease expires December 31, 2027.
We also lease our facilities in Madison, IN, and Shreveport, LA, from entities in which Lindsay Hunt, our President, Specialty Vehicle, and certain of her family members are owners. Each lease is a non-cancelable operating lease, was renewed in October 2022 in connection with the acquisition of Super ATV, LLC, a leading supplier to the powersports aftermarket ("SuperATV"), and will expire on October 31, 2027.
We have service agreements with counterparties that are majority-owned by a family member of Ms. Hunt. These agreements provide for various warehouse and facility-related services at agreed-upon rates.
The following table represents the total payments for the years ended December 31, 2024, 2023, and 2022, under the related party agreements described above:
| | | | | | | | | | | | | | | | | |
| For the Year Ended December 31, |
| (in thousands) | 2024 | | 2023 | | 2022 |
| Facility leases with Steven Berman-related entities | $ | 715 | | | $ | 2,918 | | | $ | 2,458 | |
| Facility leases with Lindsay Hunt-related entities | $ | 2,757 | | | $ | 2,603 | | | $ | 519 | |
| Service agreements with Lindsay Hunt-related entities | $ | 54 | | | $ | 200 | | | $ | 67 | |
We are a partner in a joint venture with one of our suppliers and own a minority interest in two other suppliers. Aggregate purchases from both of these companies were $18.4 million, $22.7 million, and $24.9 million in the years ended December 31, 2024, 2023, and 2022, respectively.
10. Income Taxes
The components of the provision for income taxes are as follows:
| | | | | | | | | | | | | | | | | |
| For the Year Ended December 31, |
| (in thousands) | 2024 | | 2023 | | 2022 |
| Current: | | | | | |
| Federal | $ | 56,879 | | | $ | 34,600 | | | $ | 31,683 | |
| State | 17,907 | | | 5,602 | | | 7,141 | |
| Foreign | 2,300 | | | 2,002 | | | 1,708 | |
| 77,086 | | | 42,204 | | | 40,532 | |
| Deferred: | | | | | |
| Federal | (7,407) | | | (1,936) | | | (4,003) | |
| State | (2,618) | | | (338) | | | (1,022) | |
| Foreign | (813) | | | (686) | | | (855) | |
| (10,838) | | | (2,960) | | | (5,880) | |
| Provision for income taxes | $ | 66,248 | | | $ | 39,244 | | | $ | 34,652 | |
The following is a reconciliation of income taxes at the statutory tax rate to the Company's effective tax rate:
| | | | | | | | | | | | | | | | | |
| For the Year Ended December 31, |
| 2024 | | 2023 | | 2022 |
| Federal taxes at statutory rate | 21.0 | % | | 21.0 | % | | 21.0 | % |
| State taxes, net of federal tax benefit | 2.4 | | | 2.1 | | | 2.5 | |
| Uncertain tax positions | 2.9 | | | 0.2 | | | 0.3 | |
| Research and development tax credit | (0.5) | | | (0.7) | | | (0.7) | |
| Federal permanent items | — | | | 0.3 | | | (0.2) | |
| Effect of foreign operations | 0.1 | | | 0.3 | | | — | |
| Other | — | | | 0.1 | | | (0.7) | |
| Effective tax rate | 25.9 | % | | 23.3 | % | | 22.2 | % |
At December 31, 2024, we had $10.3 million of unrecognized tax benefits, all of which would affect our effective tax rate if recognized.
The following table summarizes the change in unrecognized tax benefits for the three years ended December 31:
| | | | | | | | | | | | | | | | | |
| For the Year Ended December 31, |
| (in thousands) | 2024 | | 2023 | | 2022 |
| Balance at beginning of year | $ | 4,539 | | | $ | 3,856 | | | $ | 1,204 | |
| Reductions due to lapses in statutes of limitations | (174) | | | (716) | | | (139) | |
| Reductions due to tax positions settled | (180) | | | — | | | — | |
| Additions related to positions taken during a prior period | — | | | — | | | 2,136 | |
| Reductions due to reversals of prior year positions | (1,125) | | | — | | | — | |
| Additions based on tax positions taken during the current period | 7,253 | | | 1,399 | | | 655 | |
| Balance at end of year | 10,313 | | | 4,539 | | | 3,856 | |
We recognize interest and penalties related to unrecognized tax benefits in income tax expense. The total amount of interest and penalties related to unrecognized tax benefits recorded within tax expense was $3.1 million for the year ended December 31, 2024, and was immaterial for the year ended December 31, 2023. As of December 31, 2024, accrued interest and penalties related to unrecognized tax benefits were $3.5 million.
The Company does not anticipate material changes in the amount of unrecognized income tax benefits over the next year.
Deferred income taxes result from timing differences in the recognition of revenue and expense between tax and financial statement purposes. The sources of temporary differences are as follows:
| | | | | | | | | | | |
| December 31, |
| (in thousands) | 2024 | | 2023 |
| Assets: | | | |
| Inventories | $ | 15,111 | | | $ | 17,829 | |
| Accounts receivable | 24,723 | | | 20,472 | |
| Operating lease liability | 31,850 | | | 26,261 | |
| Accrued expenses | 10,932 | | | 7,002 | |
| Capitalized research and development expenses | 16,840 | | | 12,263 | |
| Net operating losses | 295 | | | 289 | |
| Foreign tax credits | 469 | | | 469 | |
| State tax credits | 427 | | | 379 | |
| Capital loss carryforward | 474 | | | 478 | |
| Total deferred tax assets | 101,121 | | | 85,442 | |
| Valuation allowance | (1,429) | | | (1,354) | |
| Net deferred tax assets | 99,692 | | | 84,088 | |
| Liabilities: | | | |
| Depreciation | 12,938 | | | 16,481 | |
| Goodwill and intangible assets | 52,564 | | | 49,798 | |
| Operating lease right of use asset | 30,146 | | | 25,142 | |
| Other | 1,958 | | | 1,592 | |
| Gross deferred tax liabilities | 97,606 | | | 93,013 | |
| Net deferred tax assets (liabilities) | $ | 2,086 | | | $ | (8,925) | |
A valuation allowance, if needed, reduces deferred tax assets to the amount expected to be realized. When determining the amount of net deferred tax assets that are more likely than not to be realized, the Company assesses all positive and negative evidence. This evidence includes, but is not limited to, prior earnings history, expected future earnings, carryback and carryforward periods, and the feasibility of ongoing tax strategies that could potentially enhance the likelihood of the realization of the deferred tax asset. Management has determined it was necessary to establish a valuation allowance against the foreign tax credits, various state tax credits, and a capital loss carryforward.
Based on our history of taxable income and our projection of future earnings, we believe that it is more likely than not that sufficient taxable income will be generated in the foreseeable future to realize the remaining net deferred tax assets.
During 2024, we increased the valuation allowance against the deferred tax assets noted above by an immaterial amount.
As of December 31, 2024, the Company has tax-effected net operating loss carryforwards of $0.2 million and $0.1 million for U.S. federal and state jurisdictions, respectively. Tax-effected federal net operating losses of $0.1 million begin to expire in 2036. The remaining federal net operating losses do not expire. The state net operating loss carryforwards expire in various years starting in 2037.
We file income tax returns in the United States, Canada, China, India, and Mexico. The statute of limitations for tax years before 2021 is closed for U.S. federal income tax purposes. The statute of limitations for tax years before 2017 is closed for the states in which we file. The statute of limitations for tax years before 2021 is closed for income tax purposes in Canada, China, and India. The statute of limitations for tax years before 2019 is closed for income tax purposes in Mexico.
11. Commitments and Contingencies
Shareholders’ Agreement. A shareholders’ agreement was entered into in September 1990 and amended and restated on July 1, 2006. Under the agreement, each of the late Richard Berman, Steven Berman, Jordan Berman, Marc Berman, Fred Berman, Deanna Berman, and additional shareholders named in the agreement has, among other things, granted the others of them rights of first refusal, exercisable on a pro-rata basis or in such other proportions as the exercising shareholders may agree, to purchase shares of our common stock which any of them, or upon their deaths their respective estates, proposes to sell to third parties. We have agreed with these shareholders that, upon their deaths, to the extent that any of their shares are not purchased by any of these surviving shareholders and may not be sold without registration under the Securities Act of 1933, as amended (the "1933 Act"), we will use our best efforts to cause those shares to be registered under the 1933 Act. The expenses of any such registration will be borne by the estate of the deceased shareholder. The additional shareholders that are a party to the agreement are trusts affiliated with the late Richard Berman, Steven Berman, Jordan Berman, Marc Berman, or Fred Berman, or each person’s respective spouse or children.
Acquisitions. We have contingent consideration related to prior acquisitions due to the uncertainty of the ultimate amount of any payments that will become due as earnout payments if performance targets are achieved. If the remaining performance targets for the acquisitions are fully achieved, the maximum additional contingent payments to be made under the transaction documents would be $102.0 million in the aggregate.
As of December 31, 2024 and December 31, 2023, we estimated that zero payments are expected to become due in connection with the acquisitions, and therefore accrued no liability.
For the year ended December 31, 2023, we recorded a net decrease of $20.0 million to the contingent consideration liability for a prior acquisition, comprising a $20.5 million decrease in fair value based on the modeling of a range of performance outcomes relative to the achievement of targets established in the purchase agreement, partially offset by $0.5 million of accretion on the liability resulting from the passage of time. The net benefit was included in selling, general and administrative expenses in the Condensed Consolidated Statements of Operations.
For the year ended December 31, 2022, we recorded a charge of $1.8 million in connection with earnout provisions under a prior acquisition, with the charge included in selling, general and administrative expenses in the Condensed Consolidated Statements of Operations. During the year ended December 31, 2022, we paid $1.8 million to fully settle this earnout provision associated with the prior acquisition.
Other Contingencies. We are a party to or otherwise involved in legal proceedings that arise in the ordinary course of business, such as various claims and legal actions involving contracts, employment claims, competitive practices, intellectual property infringement, product liability claims, and other matters arising out of the conduct of our business. In the opinion of management, none of the actions, individually or in the aggregate, taking into account relevant insurance coverage, would likely have a material financial impact on the Company and we believe the range of reasonably possible losses from current matters, taking into account relevant insurance coverage, is immaterial. However, legal matters are subject to inherent uncertainties and there exists the possibility that the ultimate resolution of any of these matters could have a material adverse impact on the Company’s cash flows, financial position, and results of operations in the period in which any such effects are recorded.
12. Revenue Recognition
Our primary source of revenue is from contracts with and purchase orders from customers. In most instances, our contract with a customer is the customer’s purchase order. Upon acceptance of the purchase order, a contract exists with a customer, as a sales agreement indicates the approval and commitment of the parties, identifies the rights of both parties, identifies the payment terms, and has commercial substance. At this point, we believe it is probable that we will collect the consideration to which we will be entitled in exchange for the goods transferred to the customer.
For certain customers, we may also enter into a sales agreement that outlines pricing considerations as well as the framework of terms and conditions that apply to future purchase orders for that customer. In these situations, our contract with the customer is both the sales agreement as well as the specific customer purchase
order. As our contract with a customer is typically for a single transaction or customer purchase order, the duration of the contract is typically one year or less. As a result, we have elected to apply certain practical expedients and omit certain disclosures of remaining performance obligations for contracts that have an initial term of one year or less as permitted by GAAP.
Revenue is recognized when performance obligations under the terms of a contract with a customer are satisfied, in an amount representing the consideration the Company expects to receive in exchange for selling products to its customers. We estimate the transaction price at the inception of a contract or upon fulfilling a purchase order, including any variable consideration, and will update the estimate for changes in circumstances.
We record estimates for cash discounts, defective and slow-moving product returns, promotional rebates, core return deposits, and other discounts in the period the related product revenue is recognized (“Customer Credits”). The provision for Customer Credits is recorded as a reduction from gross sales and reserves for Customer Credits are shown as an increase in accrued customer rebates and returns. Customer Credits are estimated based on contractual provisions, historical experience, and our assessment of current market conditions. Actual Customer Credits have not differed materially from estimated amounts for each period presented. Amounts billed to customers for shipping and handling are included in net sales. Costs associated with shipping and handling are included in cost of goods sold. We have concluded that our estimates of variable consideration are not constrained according to the definition in the standard.
All of our revenue was recognized under the point-of-time approach during the years ended December 31, 2024, 2023, and 2022. Also, we do not have significant financing arrangements with our customers. Our credit terms are all less than one year. Lastly, we do not receive noncash consideration (such as materials or equipment) from our customers to facilitate the fulfillment of our contracts.
Practical Expedients and Accounting Policy Elections
We have made certain accounting policy elections and are using certain practical expedients permitted under GAAP, as follows:
•Do not adjust the promised amount of consideration for the effects of a significant financing component as we expect, at contract inception, that the period between when we transfer a promised good or service to the customer and when the customer pays for that good or service will be one year or less.
•Expense costs to obtain a contract as incurred when the expected period of benefit, and therefore the amortization period, is one year or less.
•Exclude from the measurement of the transaction price all taxes assessed by a governmental authority that are both imposed on and concurrent with a specific revenue-producing transaction and collected by the entity for a customer, including sales, use, value-added, excise, and various other taxes.
•Account for shipping and handling activities that occur after the customer has obtained control of a good as a fulfillment activity rather than a separate performance obligation.
Disaggregated Revenue
For disaggregation of net sales by operating segments, refer to Note 8, "Segment Information", to the Consolidated Financial Statements.
The following table presents our disaggregated net sales by geography.
| | | | | | | | | | | | | | | | | |
| For the Year Ended December 31, |
| (in thousands) | 2024 | | 2023 | | 2022 |
| Net Sales to U.S. Customers | $ | 1,848,420 | | | $ | 1,772,092 | | | $ | 1,606,472 | |
| Net Sales to Non-U.S. Customers | 160,777 | | | 157,696 | | | 127,277 | |
| Net Sales | $ | 2,009,197 | | | $ | 1,929,788 | | | $ | 1,733,749 | |
During the year ended December 31, 2024, two customers each accounted for more than 10% of net sales, and for the years ended December 31, 2023 and 2022, three customers each accounted for more than 10% of net sales. In the aggregate, these customers accounted for 39%, 44%, and 49% of net sales in the years ended December 31, 2024, 2023, and 2022, respectively. Sales to these customers are included in the Light Duty segment.
13. Capital Stock
Controlling Interest by Officers, Directors and Family Members. As of December 31, 2024 and 2023, Steven Berman, the Non-Executive Chairman of the Company, and members of his family beneficially owned approximately 15% and 16%, respectively, of the outstanding shares of our common stock, and could influence matters requiring approval of shareholders, including the election of the Board of Directors and the approval of significant transactions.
Undesignated Stock. We have 50,000,000 shares authorized of undesignated capital stock for future issuance. The designation, rights, and preferences of such shares will be determined by our Board of Directors.
Incentive Stock Plan. Prior to May 16, 2018, we issued stock compensation grants under our 2008 Stock Option and Stock Incentive Plan. On May 16, 2018, our shareholders approved our 2018 Stock Option and Stock Incentive Plan (the “2018 Plan” or the “Plan”), which supersedes our 2008 Stock Option and Stock Incentive Plan. All future stock compensation grants will be issued under the 2018 Plan. Under the terms of the Plan, our Board of Directors may grant up to 1,200,000 shares of common stock in the form of shares of restricted stock, restricted stock units, stock appreciation rights, and stock options, or combinations thereof, to officers, directors, employees, consultants, and advisors. Grants under the Plan must be made on or before the tenth anniversary of the date the Plan was approved. Stock options are exercisable upon the terms set forth in each grant agreement approved by the Board of Directors, but in no event more than ten years from the date of grant. Restricted stock and restricted stock units vest in accordance with the terms set forth in each applicable award agreement approved by our Board of Directors. At December 31, 2024, 329,263 shares were available for grant under the Plan.
Restricted Stock Awards (“RSAs”) and Restricted Stock Units (“RSUs”)
Prior to March 2020, we issued RSAs to certain employees and members of our Board of Directors. Grants were made in the form of time-based RSAs and performance-based RSAs. For all RSAs, we retain the restricted stock, and any dividends paid thereon, until the vesting restrictions have been met. For time-based RSAs, compensation cost is recognized on a straight-line basis over the vesting period and is calculated using the closing price per share of our common stock on the grant date. Compensation cost related to those performance-based RSAs was recognized over the performance period and was calculated using the closing price per share of our common stock on the grant date and an estimate of the probable outcome of the performance conditions as of the reporting date. In 2019, we introduced performance-based RSAs that vest based on our total shareholder return ranking relative to the S&P Mid-Cap 400 Growth Index over a three-year performance period (market condition). For those awards containing a market condition, compensation cost is recognized on a straight-line basis over the performance period and is calculated using the simulated fair value per share of our common stock based on the application of a Monte Carlo simulation model. This valuation technique includes estimating the movement of stock prices and the effects of volatility, interest rates, and dividends.
We issue RSUs to certain employees and members of our Board of Directors. For time-based RSUs, compensation cost is recognized on a straight-line basis over the vesting period and is calculated using the closing price per share of our common stock on the grant date. Performance-based RSUs granted starting in the year ended December 31, 2024 included certain grants that vest based on our total shareholder return ranking relative to the Nasdaq US Benchmark Auto Parts Index over a three-year performance period (market condition), and other grants that vest based upon achievement of return on invested capital targets over a three-year performance period (performance condition).
For performance-based RSUs with a market condition, compensation cost is recognized on a straight-line basis over the performance period and is calculated using the simulated fair value per share of our common
stock based on the application of a Monte Carlo simulation model as discussed in the paragraph above. For performance-based RSUs with a performance condition, compensation cost is recognized over the performance period and is calculated using the closing price per share of our common stock on the grant date and an estimate of the probable outcome of the performance conditions as of the reporting date.
The following table summarizes the weighted average valuation assumptions used to calculate the fair value of total shareholder return performance-based RSUs containing a market condition granted:
| | | | | | | | | | | | | | | | | |
| For the Year Ended December 31, |
| 2024 | | 2023 | | 2022 |
| Share price | $ | 90.47 | | | $ | 91.28 | | | $ | 96.36 | |
| Expected dividend yield | 0.0 | % | | 0.0 | % | | 0.0 | % |
| Expected stock price volatility | 33.4 | % | | 32.8 | % | | 38.3 | % |
| Risk-free interest rate | 4.4 | % | | 4.6 | % | | 1.6 | % |
| Expected life | 2.8 years | | 2.8 years | | 2.8 years |
The share price is the Company’s closing share price as of the valuation date. The risk-free interest rate is based on the U.S. Treasury security with terms equal to the expected time of vesting as of the grant date. The weighted-average grant-date fair value of the RSUs containing a market condition granted during the years ended December 31, 2024, 2023, and 2022, were $138.58, $113.15, and $111.31, respectively.
Compensation cost related to performance-based and time-based RSAs and RSUs was $12.3 million, $9.1 million, and $7.2 million in the years ended December 31, 2024, 2023, and 2022, respectively, and was included in selling, general and administrative expenses in the Consolidated Statements of Operations. No cost was capitalized during the years ended December 31, 2024, 2023, and 2022.
The following table summarizes our RSA and RSU activity for the three years ended December 31, 2024:
| | | | | | | | | | | |
| Shares | | Weighted
Average Fair Value |
| Balance at December 25, 2021 | 206,677 | | $ | 85.97 | |
| Granted | 130,131 | | $ | 96.32 | |
| Vested | (55,255) | | $ | 83.70 | |
| Canceled | (42,631) | | $ | 85.89 | |
| Balance at December 31, 2022 | 238,922 | | $ | 92.07 | |
| Granted | 112,893 | | $ | 95.34 | |
| Vested | (73,169) | | $ | 80.63 | |
| Canceled | (21,092) | | $ | 85.00 | |
| Balance at December 31, 2023 | 257,554 | | $ | 97.33 | |
| Granted | 188,620 | | $ | 99.08 | |
| Vested | (75,305) | | $ | 89.84 | |
| Canceled | (30,291) | | $ | 111.29 | |
| Balance at December 31, 2024 | 340,578 | | $ | 97.84 | |
As of December 31, 2024, there was approximately $18.4 million of unrecognized compensation cost related to unvested RSUs, which is expected to be recognized over a weighted-average period of approximately 1.9 years.
Cash flows resulting from tax deductions in excess of the tax effect of compensation cost recognized in the financial statements are classified as operating cash flows. The excess tax benefit generated from RSAs and RSUs was immaterial for all periods presented.
Stock Options
We grant stock options to certain employees. We expense the grant-date fair value of stock options as compensation cost over the vesting or performance period. Compensation cost charged against income for stock options was $1.6 million, $2.0 million, and $1.7 million in the years ended December 31, 2024, 2023, and 2022, respectively, and was included in selling, general and administrative expense in the Consolidated Statements of Operations. No cost was capitalized during the years ended December 31, 2024, 2023, and 2022.
We used the Black-Scholes option valuation model to estimate the fair value of stock options granted. Expected volatility and expected dividend yield are based on the actual historical experience of our common stock. The expected life represents the period of time that options granted are expected to be outstanding and was calculated using historical option exercise data. The risk-free rate is based on the U.S. Treasury security with terms equal to the expected time of exercise as of the grant date.
There were no stock options granted in 2024. The following table summarizes the weighted-average valuation assumptions used to calculate the fair value of options granted and the associated weighted-average grant-date fair values:
| | | | | | | | | | | |
| For the Year Ended December 31, |
| 2023 | | 2022 |
| Expected dividend yield | 0 | % | | 0 | % |
| Expected stock price volatility | 35 | % | | 34 | % |
| Risk-free interest rate | 4.3 | % | | 1.8 | % |
| Expected life of options | 5.3 years | | 5.3 years |
| Weighted-average grant-date fair value | $ | 35.93 | | | $ | 32.55 | |
The following table summarizes our stock option activity for the three years ended December 31, 2024:
| | | | | | | | | | | | | | | | | | | | | | | | | | | | | |
| Shares | | Option Price
per Share | | Weighted
Average
Price | | Weighted
Average
Remaining
Terms
(years) | | Aggregate
Intrinsic
Value (in thousands) |
| Balance at December 25, 2021 | 233,396 | | $61.68– $103.61 | | $ | 77.85 | | | | | |
| Granted | 79,749 | | $83.81 – $111.53 | | $ | 96.96 | | | | | |
| Exercised | (32,201) | | $61.68 – $83.06 | | $ | 71.74 | | | | | |
| Canceled | (12,162) | | $61.68 – $101.45 | | $ | 82.19 | | | | | |
| Balance at December 31, 2022 | 268,119 | | $61.68 –$111.53 | | $ | 84.03 | | | | | |
| Granted | 79,404 | | $86.63 – $91.28 | | $ | 91.13 | | | | | |
| Exercised | (24,297) | | $61.68 – $82.94 | | $ | 72.33 | | | | | |
| Expired | (7,488) | | $81.91 – $101.45 | | $ | 91.24 | | | | | |
| Canceled | (4,521) | | $82.94– $101.45 | | $ | 88.52 | | | | | |
| Balance at December 31, 2023 | 311,217 | | $61.68– $111.53 | | $ | 86.52 | | | | | |
| | | | | | | | | |
| Exercised | (65,180) | | $61.68 – $111.53 | | $ | 74.34 | | | | | |
| Expired | (7,228) | | $91.28 – $101.45 | | $ | 94.71 | | | | | |
| Canceled | (4,520) | | $91.28 – $101.45 | | $ | 97.64 | | | | | |
| Balance at December 31, 2024 | 234,289 | | $61.68 – $111.53 | | $ | 89.44 | | | 4.6 | | $ | 9,398 | |
| Exercisable at | 135,471 | | $61.68 – $103.61 | | $ | 85.73 | | | 3.9 | | $ | 5,936 | |
As of December 31, 2024, there was approximately $2.1 million of unrecognized compensation cost related to unvested stock options, which is expected to be recognized over a weighted-average period of approximately 1.9 years.
Cash received from option exercises was $4.7 million, $1.2 million, and $1.0 million in the years ended December 31, 2024, 2023, and 2022, respectively. The tax benefit generated from option exercises was immaterial for all periods presented.
Employee Stock Purchase Plan. Our shareholders approved the Dorman Products, Inc. Employee Stock Purchase Plan (the “ESPP”), which makes available 1,000,000 shares of our common stock for sale to eligible employees. The purpose of the ESPP, which is qualified under Section 423 of the Internal Revenue Service Code of 1986, as amended, is to encourage stock ownership through payroll deductions and limited cash contributions by our employees. These contributions are used to purchase shares of the Company’s common stock at a 15% discount from the lower of the market price at the beginning or end of the purchase window. The two purchase windows are January to June and July to December. There were 28,674 shares, 29,650 shares, and 25,600 shares purchased under this plan during the years ended December 31, 2024, 2023, and 2022, respectively. Compensation cost under the ESPP plan was $1.1 million, $0.4 million, and $0.4 million in the years ended December 31, 2024, 2023, and 2022, respectively. The tax benefit generated from ESPP purchases was immaterial in the years ended December 31, 2024, 2023, and 2022, respectively.
Common Stock Repurchases. We periodically repurchase, at the then current market price, and cancel common stock issued to the Dorman Products, Inc. 401(k) Plan and Trust (the “401(k) Plan”). 401(k) Plan participants can no longer purchase shares of Dorman common stock as an investment option under the 401(k) Plan. Shares are generally purchased from the 401(k) Plan when participants sell units as permitted by the 401(k) Plan or elect to leave the 401(k) Plan upon retirement, termination, or other reasons. The following table summarizes the repurchase and cancellation of common stock:
| | | | | | | | | | | | | | | | | |
| For the Year Ended December 31, |
| 2024 | | 2023 | | 2022 |
| Shares repurchased and canceled | 18,457 | | 13,778 | | 23,015 |
| Total cost of shares repurchased and canceled (in thousands) | $ | 1,935 | | | $ | 1,160 | | | $ | 2,357 | |
| Average price per share | $ | 104.86 | | | $ | 84.22 | | | $ | 102.40 | |
At December 31, 2024, the 401(k) Plan held 128,666 shares of our common stock.
Share Repurchase Program. Our Board of Directors previously authorized a share repurchase program. Under that program, and subsequent authorizations (the “Existing Program”), the Board authorized the repurchase of up to $600 million of our outstanding common stock through December 31, 2024. At December 31, 2024, $134.6 million was available for repurchase under this program. The Existing Program expired on December 31, 2024, along with all amounts that remained available for use under the Existing Program as of that date.
In October 2024, the Company’s Board of Directors authorized the purchase of up to $500 million of our common stock under a new share repurchase program effective as of January 1, 2025 through December 31, 2027 (the “New Program”).
The New Program will operate just as the Existing Program had operated in that share repurchases may be made from time to time depending on market conditions, share price, share availability, and other factors at the Company’s discretion. The New Program, similar to the Existing Program, will not obligate the Company to acquire any specific number of shares.
The following table summarizes the repurchase and cancellation of common stock:
| | | | | | | | | | | | | | | | | |
| For the Year Ended December 31, |
| 2024 | | 2023 | | 2022 |
| Shares repurchased and canceled | 855,971 | | 201,632 | | 180,750 |
| Total cost of shares repurchased and canceled (in thousands) | $ | 78,091 | | | $ | 15,333 | | | $ | 17,577 | |
| Average price per share | $ | 91.23 | | | $ | 76.05 | | | $ | 97.24 | |
401(k) Retirement Plans. We have a 401(k) plan that cover substantially all of our employees as of December 31, 2024. Annual company contributions are discretionary in nature, in accordance with the
respective plan documents. Total expense related to the plans was $13.1 million, $9.1 million, and $8.2 million in the years ended December 31, 2024, 2023, and 2022, respectively.
14. Earnings Per Share
Basic earnings per share was calculated by dividing our net income by the weighted average number of common shares outstanding during the period, excluding unvested RSAs which are considered to be contingently issuable. To calculate diluted earnings per share, common share equivalents are added to the weighted average number of common shares outstanding. Common share equivalents are calculated using the treasury stock method and are computed based on outstanding stock-based awards. Stock-based awards of approximately 190,000 shares, 297,500 shares, and 63,500 shares were excluded from the calculation of diluted earnings per share for the years ended December 31, 2024, 2023, and 2022, respectively, as their effect would have been anti-dilutive.
The following table sets forth the computation of basic earnings per share and diluted earnings per share:
| | | | | | | | | | | | | | | | | |
| For the Year Ended December 31, |
| (in thousands, except per share data) | 2024 | | 2023 | | 2022 |
| Numerator: | | | | | |
| Net income | $ | 190,004 | | | $ | 129,259 | | | $ | 121,549 | |
| Denominator: | | | | | |
| Weighted average basic shares outstanding | 30,797 | | 31,455 | | 31,434 |
| Effect of compensation awards | 159 | | 78 | | 109 |
| Weighted average diluted shares outstanding | 30,956 | | 31,533 | | 31,543 |
| Earnings Per Share: | | | | | |
| Basic | $ | 6.17 | | | $ | 4.11 | | | $ | 3.87 | |
| Diluted | $ | 6.14 | | | $ | 4.10 | | | $ | 3.85 | |
ITEM 9. Changes in and Disagreements with Accountants on Accounting and Financial Disclosure.
None
ITEM 9A. Controls and Procedures.
Conclusion Regarding the Effectiveness of Disclosure Controls and Procedures
We maintain disclosure controls and procedures designed to provide reasonable assurance that information required to be disclosed in reports filed or submitted under the Exchange Act is recorded, processed, summarized, and reported within the time periods specified in the Securities and Exchange Commission’s rules and forms and accumulated and communicated to our management, including our Chief Executive Officer and Chief Financial Officer, or persons performing similar functions, as appropriate to allow timely decisions regarding required disclosures.
Our management, with the participation of our Chief Executive Officer and our Chief Financial Officer, conducted an evaluation, as of the end of the period covered by this report, of the effectiveness of our disclosure controls and procedures, as such term is defined in Exchange Act Rule 13a-15(e). Based on this evaluation, our Chief Executive Officer and our Chief Financial Officer have concluded that, as of the end of the period covered by this report, our disclosure controls and procedures, as defined in Rule 13a-15(e), were effective at the reasonable assurance level.
Management's Report on Internal Control Over Financial Reporting
Our management is responsible for establishing and maintaining adequate internal control over financial reporting, as defined in Exchange Act Rule 13a-15(f). Management, with the participation of our Chief Executive Officer and Chief Financial Officer, conducted an evaluation, as of December 31, 2024, of the effectiveness of our internal control over financial reporting based on the framework in Internal Control - Integrated Framework (2013) issued by the Committee of Sponsoring Organizations of the Treadway Commission. Based on this evaluation, management concluded that our internal control over financial reporting was effective as of December 31, 2024.
Our independent registered public accounting firm, KPMG LLP, has issued an attestation report on our internal control over financial reporting. Their report appears below.
Changes in Internal Control Over Financial Reporting
There was no change in our internal control over financial reporting (as defined in Rule 13a-15(f) under the Exchange Act) that occurred during the quarter ended December 31, 2024, that has materially affected, or is reasonably likely to materially affect, our internal control over financial reporting.
Report of Independent Registered Public Accounting Firm
To the Shareholders and Board of Directors
Dorman Products, Inc.:
Opinion on Internal Control Over Financial Reporting
We have audited Dorman Products, Inc. and subsidiaries' (the Company) internal control over financial reporting as of December 31, 2024, based on criteria established in Internal Control – Integrated Framework (2013) issued by the Committee of Sponsoring Organizations of the Treadway Commission. In our opinion, the Company maintained, in all material respects, effective internal control over financial reporting as of December 31, 2024, based on criteria established in Internal Control – Integrated Framework (2013) issued by the Committee of Sponsoring Organizations of the Treadway Commission.
We also have audited, in accordance with the standards of the Public Company Accounting Oversight Board (United States) (PCAOB), the consolidated balance sheets of the Company as of December 31, 2024 and 2023, the related consolidated statements of operations and comprehensive income, shareholders’ equity, and cash flows for each of the years in the three-year period ended December 31, 2024, and the related notes and financial statement schedule II (collectively, the consolidated financial statements), and our report dated February 27, 2025 expressed an unqualified opinion on those consolidated financial statements.
Basis for Opinion
The Company’s management is responsible for maintaining effective internal control over financial reporting and for its assessment of the effectiveness of internal control over financial reporting, included in the accompanying Management's Report on Internal Control Over Financial Reporting. Our responsibility is to express an opinion on the Company’s internal control over financial reporting based on our audit. We are a public accounting firm registered with the PCAOB and are required to be independent with respect to the Company in accordance with the U.S. federal securities laws and the applicable rules and regulations of the Securities and Exchange Commission and the PCAOB.
We conducted our audit in accordance with the standards of the PCAOB. Those standards require that we plan and perform the audit to obtain reasonable assurance about whether effective internal control over financial reporting was maintained in all material respects. Our audit of internal control over financial reporting included obtaining an understanding of internal control over financial reporting, assessing the risk that a material weakness exists, and testing and evaluating the design and operating effectiveness of internal control based on the assessed risk. Our audit also included performing such other procedures as we considered necessary in the circumstances. We believe that our audit provides a reasonable basis for our opinion.
Definition and Limitations of Internal Control Over Financial Reporting
A company’s internal control over financial reporting is a process designed to provide reasonable assurance regarding the reliability of financial reporting and the preparation of financial statements for external purposes in accordance with generally accepted accounting principles. A company’s internal control over financial reporting includes those policies and procedures that (1) pertain to the maintenance of records that, in reasonable detail, accurately and fairly reflect the transactions and dispositions of the assets of the company; (2) provide reasonable assurance that transactions are recorded as necessary to permit preparation of financial statements in accordance with generally accepted accounting principles, and that receipts and expenditures of the company are being made only in accordance with authorizations of management and directors of the company; and (3) provide reasonable assurance regarding prevention or timely detection of unauthorized acquisition, use, or disposition of the company’s assets that could have a material effect on the financial statements.
Because of its inherent limitations, internal control over financial reporting may not prevent or detect misstatements. Also, projections of any evaluation of effectiveness to future periods are subject to the risk that
controls may become inadequate because of changes in conditions, or that the degree of compliance with the policies or procedures may deteriorate.
/s/ KPMG LLP
Philadelphia, Pennsylvania
February 27, 2025
ITEM 9B. Other Information.
Amended and Restated Cash Bonus Plan
On February 21, 2025, the Board of Directors of the Company amended and restated the Dorman Products, Inc. 2018 Cash Bonus Plan. Among other things, the revised plan, referred to as the Amended and Restated Cash Bonus Plan, removes the $2 million limit placed on amounts paid to any participant in any plan year. A copy of the Amended and Restated Cash Bonus Plan is filed as Exhibit 10.5 to this Annual Report on Form 10-K.
Rule 10b5-1 Trading Plans
The following table describes contracts, instructions, or written plans for the purchase or sale of the Company’s common stock intended to satisfy the affirmative defense conditions of Rule 10b5-1(c) (each, a “Rule 10b5-1 Plan”) entered into or terminated during the quarter ended December 31, 2024 by our directors and officers (as defined under Rule 16b-1(f) of the Exchange Act). There were no non-Rule 10b5-1 trading arrangements entered into or terminated by our directors and officers during the quarter ended December 31, 2024.
| | | | | | | | | | | |
| Name and Title of Director or Officer | Date of Adoption of Agreement | Expiration Date of Agreement1 | Aggregate Number of Securities to be Purchased or Sold |
Donna M. Long SVP, Chief Information Officer | November 19, 2024 | December 31, 2025 | 13,2202 |
Jeffrey L. Darby SVP, Sales and Marketing | December 5, 2024 | June 30, 2025 | 11,6463 |
Steven L. Berman4 Non-Executive Chairman of the Board | December 13, 2024 | March 16, 2026 | 540,000 |
1 Each Rule 10b5-1 Plan expires upon the date shown or, if earlier, upon completion of all authorized transactions under such plan.
2 Plan includes (i) the sale of up to 10,263 shares of the Company’s common stock , (ii) the sale of up to 2,150 shares of the Company’s common stock upon the vesting of time-based restricted stock units (“RSUs”) and (iii) the acquisition of up to 807 shares of common stock upon the exercise of up to 807 vested stock options . The actual number of shares sold may be less based on tax withholdings.
3 Plan includes (i) the sale of up to 4,540 shares of the Company’s common stock upon the vesting of time-based RSUs, (ii) the sale of up 1,369 shares of the Company’s common stock upon the vesting of performance-based restricted stock units (“PRSUs”),and (iii) the potential exercise of vested stock options and the associated sale of up to 5,737 shares of the Company’s common stock. The number of shares included assumes that the PRSU vests at 100% of the target award amount. The actual number of PRSUs that may vest can vary between 0% - 200% of the target award of PRSUs, subject to the achievement of certain performance conditions as set forth in the PRSU award agreement, less shares to be withheld for tax withholding obligations. The actual number of shares sold may vary based on tax withholdings and performance and vesting conditions of the awards.
4 Plan covers shares of the Company’s common stock owned (i) by certain family trusts for which Mr. Berman serves as co-trustee, and (ii) by certain family trusts for the benefit of Mr. Berman’s children. Plan does not include shares owned directly by Mr. Berman.
ITEM 9C. Disclosure Regarding Foreign Jurisdictions that Prevent Inspections.
None
PART III
ITEM 10. Directors, Executive Officers, and Corporate Governance.
Except for the information provided in PART I – ITEM 4.1, “Executive Officers of the Registrant” and as set forth below, the required information is incorporated by reference from our definitive proxy statement for our 2025 Annual Meeting of Shareholders, including, but not necessarily limited to, the sections entitled “Proposal I: Election of Directors,” and “Committees of the Board of Directors – Audit Committee.”
In addition, information regarding the Company’s insider trading policies and procedures governing the purchase, sale, and/or other dispositions of the Company’s securities is incorporated by reference from our definitive proxy statement for our 2025 Annual Meeting of Shareholders under the section entitled “Executive Compensation: Compensation Discussion and Analysis – Insider Trading Policy.”
We have adopted a written code of ethics, the “Code of Ethics for Senior Financial Officers,” which applies to our Chief Executive Officer, Chief Financial Officer, Principal Accounting Officer, Controller, and any other person performing similar functions (the “Code”). The Code is posted on our website DormanProducts.com. We intend to disclose any changes in or waivers from the Code on our website at DormanProducts.com. The information on the website is not and should not be considered part of this Form 10-K and is not incorporated by reference in this Form 10-K.
ITEM 11. Executive Compensation.
The required information is incorporated by reference from our definitive proxy statement for our 2025 Annual Meeting of Shareholders, including, but not necessarily limited to, the sections entitled “Director Compensation,” “Executive Compensation: Compensation Discussion and Analysis,” “Executive Compensation: Compensation Tables,” “Risk Assessment in Compensation Policies and Practices for Employees,” and “Compensation Committee Interlocks and Insider Participation.”
ITEM 12. Security Ownership of Certain Beneficial Owners and Management and Related Shareholder Matters.
Except for the information set forth below, the required information is incorporated by reference from our definitive proxy statement for our 2025 Annual Meeting of Shareholders, including, but not necessarily limited to, the section entitled “Security Ownership of Certain Beneficial Owners and Management – Security Ownership Table.”
Equity Compensation Plan Information
The following table details information regarding our existing equity compensation plans as of December 31, 2024:
| | | | | | | | | | | | | | | | | | | | |
| Plan Category | | (a)
Number of
securities to be
issued upon
exercise of
outstanding
options, warrants
and rights | | (b)
Weighted-
average exercise
price of
outstanding
options, warrants
and rights | | (c)
Number of
securities
remaining
available for
future issuance
under equity
compensation
plans (excluding
securities
reflected
in column (a)) |
| Equity compensation plans approved by security holders | | | | | | |
| 2018 Stock Option and Stock Incentive Plan | | 234,289 | | $ | 89.44 | | | 329,263 |
| Dorman Products, Inc. Employee Stock Purchase Plan | | — | | — | | | 754,309 |
| Equity compensation plans not approved by security holders | | — | | — | | | — |
| Total | | 234,289 | | $ | 89.44 | | | 1,083,572 |
ITEM 13. Certain Relationships and Related Transactions, and Director Independence.
The required information is incorporated by reference from our definitive proxy statement for our 2025 Annual Meeting of Shareholders, including, but not necessarily limited to, the sections entitled “Certain Relationships and Related Transactions” and “Corporate Governance - The Board of Directors and Director Independence.”
ITEM 14. Principal Accounting Fees and Services.
The required information is incorporated by reference from our definitive proxy statement for our 2025 Annual Meeting of Shareholders, including, but not necessarily limited to, the sections entitled “Principal Accountant Fees and Services” and “Pre-Approval Policies and Procedures.”
PART IV
ITEM 15. Exhibits, Financial Statement Schedules.
(a)(1)Consolidated Financial Statements. Our Consolidated Financial Statements and related documents are provided in PART II - ITEM 8, “Financial Statements and Supplementary Data” of this Annual Report on Form 10-K:
Report of Independent Registered Public Accounting Firm (PCAOB ID: 185).
Consolidated Statements of Operations for the years ended December 31, 2024, December 31, 2023, and December 31, 2022.
Consolidated Balance Sheets as of December 31, 2024 and December 31, 2023.
Consolidated Statements of Shareholders' Equity for the years ended December 31, 2024, December 31, 2023, and December 31, 2022.
Consolidated Statements of Cash Flows for the years ended December 31, 2024, December 31, 2023, and December 31, 2022.
Notes to Consolidated Financial Statements.
(a)(2)Consolidated Financial Statement Schedules. The following consolidated financial statement schedule of the Company and related documents are filed with this Annual Report on Form 10-K:
Schedule II - Valuation and Qualifying Accounts.
(a)(3)Exhibits. Reference is made to ITEM 15(b) below.
(b)Exhibits. The Exhibit Index, which immediately precedes the signature page, is incorporated by reference into this Report.
(c)Financial Statement Schedule. Reference is made to ITEM 15(a)(2) above.
ITEM 16. Form 10-K Summary
None
| | | | | | | | |
| Number | | Title |
| | |
| 2.1 | | |
| | |
| 2.1.1 | | Unit Purchase Agreement, dated August 17, 2022, by and among Dorman Products, Inc., Super ATV, LLC, the Sellers listed on the signature pages thereto, and Lindsay Hunt, in her capacity as the Sellers’ Representative. Incorporated by reference to Exhibit 2.1 to the Company’s Current Report on Form 8-K filed on August 18, 2022. + |
| | |
| 2.1.2 | | Amendment, dated as of October 4, 2022 to Unit Purchase Agreement, dated August 17, 2022, by and among Dorman Products, Inc., Super ATV, LLC, the Sellers listed on the signature pages thereto, and Lindsay Hunt, in her capacity as the Sellers’ Representative. Incorporated by reference to Exhibit 2.1 to the Company’s Current Report on Form 8-K filed on October 4, 2022 . + |
| | |
| 3.1 | | |
| | |
| 3.2 | | |
| | | | | | | | |
| Number | | Title |
| | |
| 4.1 | | |
| | |
| 4.2 | | |
| | |
| 4.3 | | |
| | |
| 10.1 | | |
| | |
| 10.1.1 | | |
| | |
| 10.1.2 | | |
| | |
| 10.2† | | |
| | |
| 10.2.1† | | |
| | |
| 10.2.2† | | |
| | |
| 10.2.3† | | |
| | |
| 10.2.4† | | |
| | |
| 10.2.5† | | |
| | |
| 10.3† | | |
| | |
| | | | | | | | |
| Number | | Title |
| 10.3.1† | | |
| | |
| 10.3.2† | | |
| | |
| 10.3.3† | | |
| | |
| 10.3.4† | | |
| | |
| 10.3.5† | | |
| | |
| 10.3.6† | | |
| | |
| 10.3.7† | | |
| | |
| 10.3.8† | | |
| | |
| 10.3.9† | | |
| | |
| 10.3.10† | | |
| | |
| 10.3.11† | | |
| | |
| 10.3.12† | | |
| | |
| 10.3.13† | | |
| | |
| | | | | | | | |
| Number | | Title |
| 10.3.14† | | |
| | |
| 10.3.15† | | |
| | |
| 10.3.16† | | |
| | |
| 10.3.17† | | |
| | |
| 10.3.18† | | |
| | |
| 10.4† | | |
| | |
| 10.5† | | |
| | |
| 10.6† | | |
| | |
| 10.7† | | |
| | |
| 10.8† | | |
| | |
| 10.9† | | |
| | |
| 10.10† | | |
| | |
| 10.11† | | |
| | |
| 19 | | |
| | |
| 21 | | |
| | |
| 23 | | |
| | | | | | | | |
| Number | | Title |
| | |
| 31.1 | | |
| | |
| 31.2 | | |
| | |
| 32 | | |
| | |
| 97 | | |
| | |
| 101 | | The financial statements from the Dorman Products, Inc. Annual Report on Form 10-K for the year ended December 31, 2024, formatted Inline XBRL (eXtensible Business Reporting Language): (i) the Consolidated Statements of Operations for the years ended December 31, 2024, December 31, 2023, and December 31, 2022; (ii) the Consolidated Balance Sheets as of December 31, 2024 and December 31, 2023; (iii) the Consolidated Statements of Shareholders’ Equity for the years ended December 31, 2024, December 31, 2023, and December 31, 2022; (iv) the Consolidated Statements of Cash Flows for the years ended December 31, 2024, December 31, 2023, and December 31, 2022; and (v) the Notes to Consolidated Financial Statements. |
| | |
| 104 | | The cover page from the Company’s Annual Report on Form 10-K as of and for the year ended December 31, 2024, formatted in Inline XBRL (included as Exhibit 101). |
* Filed herewith
† Management Contracts and Compensatory Plans, Contracts or Arrangements
+ The schedules and exhibits have been omitted pursuant to Item 601(b)(2) of Regulation S-K. The Company agrees to furnish a copy of such schedules and exhibits, or any section thereof, to the SEC upon request.
SIGNATURES
Pursuant to the requirements of Section 13 or 15(d) of the Securities Exchange Act of 1934, the registrant has duly caused this report to be signed on its behalf by the undersigned thereunto duly authorized.
| | | | | |
| Dorman Products, Inc. |
| |
| By: /s/ Kevin M. Olsen |
| Date: February 27, 2025 | Kevin M. Olsen
President and Chief Executive Officer |
Pursuant to the requirements of the Securities Exchange Act of 1934, this report has been signed below by the following persons on behalf of the registrant and in the capacities and on the dates indicated.
| | | | | | | | | | | | | | |
| Signature | | Title | | Date |
| | | | |
| /s/ Kevin M. Olsen | | President, Chief Executive Officer and Director | | February 27, 2025 |
| Kevin M. Olsen | | (principal executive officer) | | |
| | | | |
| /s/ David M. Hession | | Senior Vice President, Chief Financial Officer and Treasurer | | February 27, 2025 |
| David M. Hession | | (principal financial and accounting officer) | | |
| | | | |
| /s/ Lisa M. Bachmann | | Director | | February 27, 2025 |
| Lisa M. Bachmann | | | | |
| | | | |
| /s/ Steven L. Berman | | Non-Executive Chairman | | |
| Steven L. Berman | | | | February 27, 2025 |
| | | | |
| /s/ John J. Gavin | | Director | | |
| John J. Gavin | | | | February 27, 2025 |
| | | | |
| /s/ Richard T. Riley | | Director | | |
| Richard T. Riley | | | | February 27, 2025 |
| | | | |
| /s/ Kelly A. Romano | | Director | | |
| Kelly A. Romano | | | | February 27, 2025 |
| | | | |
| /s/ G. Michael Stakias | | Director | | |
| G. Michael Stakias | | | | February 27, 2025 |
| | | | |
| /s/ J. Darrell Thomas | | Director | | |
| J. Darrell Thomas | | | | February 27, 2025 |
SCHEDULE II: Valuation and Qualifying Accounts
| | | | | | | | | | | | | | | | | |
| For the Year Ended December 31, |
| (in thousands) | 2024 | | 2023 | | 2022 |
| Allowance for doubtful accounts: | | | | | |
| Balance, beginning of period | $ | 3,518 | | | $ | 1,363 | | | $ | 1,326 | |
| Provision | 90 | | | 4,592 | | | 56 | |
| Charge-offs | (1,989) | | | (2,437) | | | (19) | |
| | | | | |
| Balance, end of period | $ | 1,619 | | | $ | 3,518 | | | $ | 1,363 | |
| Allowance for customer credits: | | | | | |
| Balance, beginning of period | $ | 204,495 | | | $ | 192,116 | | | $ | 188,080 | |
| Provision | 419,611 | | | 407,328 | | | 373,157 | |
| Charge-offs | (419,751) | | | (394,949) | | | (369,121) | |
| Balance, end of period | $ | 204,355 | | | $ | 204,495 | | | $ | 192,116 | |