| FORM 20-F |
| o | REGISTRATION STATEMENT PURSUANT TO SECTION 12(b) OR (g) OF THE SECURITIES EXCHANGE ACT OF 1934 |
| OR | |
| x | ANNUAL REPORT PURSUANT TO SECTION 13 OR 15(d) OF THE SECURITIES EXCHANGE ACT OF 1934 |
For fiscal year ended December 31, 2011 | |
| OR | |
| o | TRANSITION REPORT PURSUANT TO SECTION 13 OR 15(d) OF THE SECURITIES EXCHANGE ACT OF 1934 |
| For the transition period from ____ to ______ | |
| OR | |
| o | SHELL COMPANY REPORT PURSUANT TO SECTION 13 OR 15(d) OF THE SECURITIES EXCHANGE ACT OF 1934 |
| Date of event requiring this shell company report: | |
| Commission file number: 0-18860 |

| Large accelerated filer o | Accelerated filer o | Non-accelerated filer þ |
| U.S. GAAP o | International Financial Reporting Standards as issued by the International Accounting Standards Board þ | Other o |
| PART I | 6 | |
| ITEM 1. | IDENTITY OF DIRECTORS, SENIOR MANAGEMENT AND ADVISERS | 6 |
| ITEM 2. | OFFER STATISTICS AND EXPECTED TIMETABLE | 6 |
| ITEM 3. | KEY INFORMATION | 6 |
| 3.A | Selected Financial Data | 6 |
| 3.B | Capitalization and Indebtedness | 8 |
| 3.C | Reasons for the Offer and Use of Proceeds | 8 |
| 3.D | Risk Factors | 8 |
| ITEM 4. | INFORMATION ON THE COMPANY | 15 |
| 4.A | History and Development of the Company | 15 |
| 4.B | Business Overview | 18 |
| 4.C | Organizational Structure | 20 |
| 4.D | Property, Plants and Equipment | 20 |
| ITEM 4A. | UNRESOLVED STAFF COMMENTS | 29 |
| ITEM 5. | OPERATING AND FINANCIAL REVIEW AND PROSPECTS | 29 |
| 5.A | Operating Results | 29 |
| 5.B | Liquidity and Capital Resources | 34 |
| 5.C | Research and Development, Patents and Licenses, etc. | 35 |
| 5.D | Trend Information | 35 |
| 5.E | Off-Balance Sheet Arrangements | 36 |
| 5.F | Tabular Disclosure of Contractual Obligations | 36 |
| 5.G | Safe Harbor | 37 |
| ITEM 6. | DIRECTORS, SENIOR MANAGEMENT AND EMPLOYEES | 38 |
| 6.A | Directors and Senior Management | 38 |
| 6.B | Compensation | 39 |
| 6.C | Board Practices | 44 |
| 6.D | Employees | 47 |
| 6.E | Share Ownership | 47 |
| ITEM 7. | MAJOR SHAREHOLDERS AND RELATED PARTY TRANSACTIONS | 51 |
| 7.A | Major Shareholders | 51 |
| 7.B | Related Party Transactions | 52 |
| 7.C | Interests of Experts and Counsel | 53 |
| ITEM 8. | FINANCIAL INFORMATION | 53 |
| 8.A | Consolidated Statements and Other Financial Information | 53 |
| 8.B | Significant Changes | 55 |
| ITEM 9. | THE OFFER AND LISTING | 55 |
| 9.A | Offer and Listing Details | 55 |
| 9.B | Plan of Distribution | 56 |
| 9.C | Markets | 56 |
| 9.D | Selling Shareholders | 57 |
| 9.E | Dilution | 57 |
| 9.F | Expenses of the Issue | 57 |
| ITEM 10. | ADDITIONAL INFORMATION | 57 |
| 10.A | Share Capital | 57 |
| 10.B | Notice of Articles and Articles of Association | 57 |
| 10.C | Material Contracts | 62 |
| 10.D | Exchange Controls | 62 |
| 10.E | Taxation | 63 |
| 10.F | Dividends and Paying Agents | 67 |
| 10.G | Statement by Experts | 68 |
| 10.H | Documents on Display | 68 |
| 10.I | Subsidiary Information | 68 |
| ITEM 11. | QUANTITATIVE AND QUALITATIVE DISCLOSURES ABOUT MARKET RISK | 68 |
| ITEM 12. | DESCRIPTION OF SECURITIES OTHER THAN EQUITY SECURITIES | 68 |
| PART II | 69 | |
| ITEM 13. | DEFAULTS, DIVIDEND ARREARAGES AND DELINQUENCIES | 69 |
| ITEM 14. | MATERIAL MODIFICATIONS TO THE RIGHTS OF SECURITY HOLDERS AND USE OF PROCEEDS | 69 |
| ITEM 15. | CONTROLS AND PROCEDURES | 69 |
| ITEM 16. | AUDIT COMMITTEE FINANCIAL EXPERT, CODE OF ETHICS AND PRINCIPAL ACCOUNTANT FEES AND SERVICES | 70 |
| 16.A | Audit Committee Financial Expert | 70 |
| 16.B | Code of Ethics | 71 |
| 16.C | Principal Accountant Fees and Services | 71 |
| 16.D | Exemptions from the Listing Standards for Audit Committees | 72 |
| 16.E | Purchases of Equity Securities by the Registrant and Affiliated Purchasers | 72 |
| 16.F | Change in Registrant’s Certifying Accountant | 72 |
| 16.G | Corporate Governance | 72 |
| 16.H | Mine Safety Disclosure | 72 |
| PART III | 73 | |
| ITEM 17. | FINANCIAL STATEMENTS | 73 |
| ITEM 18. | FINANCIAL STATEMENTS | 73 |
| ITEM 19. | EXHIBITS | 73 |
| ● | risks related to our exploration and development activities; |
| ● | risks related to the financing needs of our planned operations; |
| ● | risks related to estimates of mineral deposits, resources and reserves; |
| ● | risks related to fluctuations in mineral prices; |
| ● | risks related to the titles of our properties; |
| ● | risks related to competition in the mineral exploration and mining industry; |
| ● | risks related to potential conflicts of interest with our officers and directors; |
| ● | risks related to environmental and regulatory requirements; |
| ● | risks related to foreign currency fluctuations; |
| ● | risks related to our possible status as a passive foreign investment company; |
| ● | risks related to the volatility of our common stock; and |
| ● | risks related to the possible dilution of our common stock. |
1933 Act - means the United States Securities Act of 1933, as amended. |
adit – a horizontal tunnel in an underground mine driven from a hillside surface. |
Ag – silver. |
alluvial mining - mining of gold bearing stream gravels using gravity methods to recover the gold, also known as placer mining. |
andesite - a volcanic rock of intermediate composition, the extrusive equivalent of diorite. |
arsenopyrite – an ore mineral of arsenic, iron, and sulphur, often containing gold. |
assay – a precise and accurate analysis of the metal contents in an ore or rock sample. |
Au - gold. |
auger drill – a handheld machine that produces small, continuous core samples in unconsolidated materials. |
autoclave – a mineral processing vessel operated at high temperature and pressure in order to oxidize sulfide and carbon compounds, so the contained metals can be leached and concentrated. |
Banka drilling - a hand operated drill specifically designed for sampling alluvial deposits. The drill rods (10-12 centimetres in diameter) are forced into the gravel and then the core sample is extracted from the rods. |
Commission - United States Securities and Exchange Commission, or S.E.C. |
concentrate – a concentrate of minerals produced by crushing, grinding and processing methods such as gravity or flotation. |
contained gold – total measurable gold in grams or ounces estimated to be contained within a mineral deposit. Makes no allowance for economic criteria, mining dilution or recovery losses. |
Cu – copper. |
cut-off grade – deemed grade of mineralization, established by reference to economic factors, above which material is considered ore and below which is considered waste. |
diamond drill – a large machine that produces a continuous core sample of the rock or material being drilled. |
diorite – a plutonic rock of intermediate composition, the intrusive equivalent of andesite. |
dorë – bullion of gold, with minor silver and copper produced by smelting, prior to refining. |
epithermal – used to describe hydrothermal mineral deposits, typically in veins, formed at lower temperatures and pressures within 1 km of the earth surface. |
Exchange Act – means the United States Securities Exchange Act of 1934, as amended. |
feasibility study – a detailed report assessing the feasibility, economics and engineering of placing a mineral deposit into commercial production. |
flotation – a mineral recovery process using soapy compounds to float finely ground metallic minerals into a concentrate. |
garimpeiros – a Brazilian term used in South America referring to small scale, artisanal miners and prospectors. |
gold deposit - means a mineral deposit mineralised with gold. |
gold equivalent - a method of presenting combined gold and silver concentrations or weights for comparison purposes. Commonly involves expressing silver as its proportionate value in gold based on the relative values of the two metals. |
gold resource – see mineral resource. |
gpt - grams per tonne. |
grams per cubic meter - alluvial mineralisation measured by grams of gold contained per cubic meter of material, a measure of gold content by volume not by weight. |
greenstone - a field term for any compact dark-green altered or metamorphosed basic igneous rock that owes its colour to green minerals such as chlorite, actinolite or epidote. |
indicated resource - means that part of a mineral resource for which quantity, grade or quality, densities, shape and physical characteristics, can be estimated with a level of confidence sufficient to allow the appropriate application of technical and economic parameters, to support mine planning and evaluation of the economic viability of the deposit. The estimate is based on detailed and reliable exploration and testing information gathered through appropriate techniques from locations such as outcrops, trenches, pits, workings and drill holes that are spaced closely enough for geological and grade continuity to be reasonably assumed. |
inferred resource - means that part of a mineral resource for which quantity and grade or quality can be estimated on the basis of geological evidence and limited sampling and reasonably assumed, but not verified, geological and grade continuity. The estimate is based on limited information and sampling gathered through appropriate techniques from locations such as outcrops, trenches, pits, workings and drill holes. |
laterite - highly weathered residual superficial soils and decomposed rocks, rich in iron and aluminum oxides, that are characteristically developed in tropical climates. |
lode mining – mining of ore, typically in the form of veins or stockworks. |
measured resource means that part of a mineral resource for which quantity, grade or quality, densities, shape, physical characteristics are so well established that they can be estimated with confidence sufficient to allow the appropriate application of technical and economic parameters, to support production planning and evaluation of the economic viability of the deposit. The estimate is based on detailed and reliable exploration, sampling and testing information gathered through appropriate techniques from locations such as outcrops, trenches, pits, workings and drill holes that are spaced closely enough to confirm both geological and grade continuity. |
mesothermal – used to describe hydrothermal mineral deposits, typically in veins, formed at higher temperatures and pressures deeper than 1 km of the earth’s surface. |
mineral reserve means the economically mineable part of a measured or indicated resource demonstrated by at least a preliminary feasibility study. This study must include adequate information on mining, processing, metallurgical, economic and other relevant factors that demonstrate, at the time of reporting, that economic extraction can be justified. A mineral reserve includes diluting materials and allowances for losses that may occur when the material is mined. |
mineral resource – a body of mineralized material which has not yet been determined to be ore, and the potential for mining of which has not yet been determined; categorized as possible, probable and proven, according to the degree of certainty with which their grade and tonnage are known; sometimes referred to as a “geological resource” or “mineral inventory”. |
net profits interest or NPI – a royalty based on the net profits generated after recovery of all costs. |
net smelter royalty or NSR - a royalty based on the gross proceeds received from the sale of minerals less the cost of smelting, refining, freight and other related costs. |
nugget effect – an effect of high variability of gold assays, due to the gold occurring in discreet coarse grains such that their content in any given sample is highly variable. |
ore – a naturally occurring rock or material from which economic minerals can be extracted at a profit. |
ounce or oz. - a troy ounce or 20 pennyweights or 480 grains or 31.103 grams. |
opt – troy ounces per ton. |
porknockers - a local term used in Guyana and Suriname to refer to small scale artisanal miners and prospectors. |
porphyry – an igneous rock containing coarser crystals in a finer matrix. |
probable reserve - the economically mineable part of an indicated, and in some circumstances a measured resource demonstrated by at least a preliminary feasibility study. This study must include adequate information on mining, processing, metallurgical, economic, and other relevant factors that demonstrate, at the time of reporting, that economic extraction can be justified. |
professional association, for the purposes of the definition of a Qualified Person below, means a self-regulatory organization of engineers, geoscientists or both engineers and geoscientists that (a) has been given authority or recognition by statute; (b) admits members primarily on the basis of their academic qualifications and experience; (c) requires compliance with the professional standards of competence and ethics established by the organization; and (d) has disciplinary powers, including the power to suspend or expel a member. |
prospect – an area prospective for economic minerals based on geological, geophysical, geochemical and other criteria |
proven reserve means the economically mineable part of a measured resource demonstrated by at least a preliminary feasibility study. This study must include adequate information on mining, processing, metallurgical, economic, and other relevant factors that demonstrate, at the time of reporting, that economic extraction is justified. |
pyrite – an ore mineral of iron and sulphur. |
Qualified Person means an individual who (a) is an engineer or geoscientist with at least five years of experience in mineral exploration, mine development or operation or mineral project assessment, or any combination of these; (b) has experience relevant to the subject matter of the mineral project and the technical report; and (c) is a member in good standing of a professional association. |
quartz – a rock-forming mineral of silica and oxygen, often found in veins also. |
raise – a vertical or inclined tunnel in an underground mine driven upwards from below. |
ramp – an inclined tunnel in an underground mine driven downwards from surface. |
reverse circulation drill – a large machine that produces a continuous chip sample of the rock or material being drilled. |
saprolite - a soft, earthy, clay rich and thoroughly decomposed rock with its original textures intact, formed in place by chemical weathering of igneous, sedimentary or metamorphic rocks. |
scoping study – a conceptual report assessing the scope, economics and engineering of placing a mineral deposit into commercial production. |
shaft – a vertical or inclined tunnel in an underground mine driven downward from surface. |
shear – a tabular zone of faulting within which the rocks are crushed and flattened. |
stibnite – an ore mineral of antimony and sulphur. |
stock or pluton – a body of intrusive rock that covers less than 40 square miles, has steep dips and is discordant with surrounding rock. |
stockwork – multiple small veins of mineralisation that have so penetrated a rock mass that the whole rock mass can be considered mineralised. |
strike length - the longest horizontal dimensions of a body or zone of mineralisation. |
stripping ratio - the ratio of waste material to ore that is estimated for or experienced in mining an ore body. |
sulphide – an ore mineral compound linking sulphur with one or more metals. |
ton - short ton (2,000 pounds). |
tonne - metric tonne (2,204.6 pounds). |
trenching – the surface excavation of a linear trench to expose mineralization for sampling. |
vein – a tabular body of rock typically of narrow thickness and often mineralized occupying a fault, shear, fissure or fracture crosscutting another pre-existing rock. |
winze – an internal shaft in an underground mine. |
| 1 mile | = 1.609 kilometres | 1 pound | = 0.4535 kilogram |
| 1 yard | = 0.9144 meter | 2,000 pounds/1 short ton | = 0.907 tonne |
| 1 acre | = 0.405 hectare | 1 troy ounce | = 31.103 grams |
| As at and for the years ended December 31 | |||||||||||||||||||
| Selected Financial Information | IFRS | Canadian GAAP | |||||||||||||||||
(stated in thousands of U.S. dollars, except per share amounts) | 2011 | 2010 | 2009 | 2008 | 2007 | ||||||||||||||
| (a) | Total revenues (1) | $ | — | $ | — | $ | — | $ | — | $ | — | ||||||||
| (b) | Income (loss before) extraordinary items: | ||||||||||||||||||
| (i Total) | $ | (1,209 | ) | $ | (1,396 | ) | $ | (1,579 | ) | $ | (6,963 | ) | $ | 1,515 | |||||
| (ii Basic earnings) (loss per share) | $ | (0.01 | ) | $ | (0.02 | ) | $ | (0.02 | ) | $ | (0.10 | ) | $ | 0.02 | |||||
| (c) | Net income (loss: ) | ||||||||||||||||||
| (i Total) | $ | (1,209 | ) | $ | (1,396 | ) | $ | (1,579 | ) | $ | (6,963 | ) | $ | 1,515 | |||||
| (ii Basic earnings) (loss per share) | $ | (0.01 | ) | $ | (0.02 | ) | $ | (0.02 | ) | $ | (0.10 | ) | $ | 0.02 | |||||
| (iii Diluted earnings) (loss per share: ) | $ | (0.01 | ) | $ | (0.01 | ) | $ | (0.02 | ) | $ | (0.10 | ) | $ | 0.02 | |||||
| (d) | Total assets | $ | 13,277 | $ | 13,900 | $ | 13,167 | $ | 12,829 | $ | 20,115 | ||||||||
| (e) | Total long-term debt (2) | $ | — | $ | — | $ | — | $ | — | $ | — | ||||||||
| (f) | Shareholders' equity (net assets) | $ | 12,470 | $ | 11,979 | $ | 12,168 | $ | 12,523 | $ | 19,480 | ||||||||
| (g) | Dividends per shares (3) | No cash dividends declared in any of these periods. | |||||||||||||||||
| (h) | Shares: | ||||||||||||||||||
| Diluted number of | |||||||||||||||||||
| common shares | 108,461,171 | 107,335,010 | 94,248,775 | 81,433,505 | 80,308,505 | ||||||||||||||
| Number of common shares | 94,096,171 | 90,985,890 | 81,969,655 | 72,704,505 | 71,734,505 | ||||||||||||||
| (1) | Revenues are comprised of gains from the disposition of marketable securities and investment and other income. Canarc has no sources of operating revenues. |
| (2) | Canarc has no preferred shares. |
| (3) | On June 25, 2008, Canarc did close a Plan of Arrangement (the “Arrangement”) with Caza Gold Corp. (“Caza”) whereby approximately 83% of Canarc’s interest in Caza was distributed to the shareholders of Canarc. |
| Month | Year | High (CAD$) | Low (CAD$) |
| October | 2011 | 1.0253 | 1.0149 |
| November | 2011 | 1.0297 | 1.0219 |
| December | 2011 | 1.0274 | 1.0197 |
| January | 2012 | 1.0161 | 1.0099 |
| February | 2012 | 0.9997 | 0.9950 |
| March | 2012 | 0.9963 | 0.9915 |
| Year | High (CAD$) | Low (CAD$) | Average Rate (CAD$) | Close (CAD$) |
| 2007 | 1.1878 | 0.9066 | 1.0750 | 0.9913 |
| 2008 | 1.3008 | 0.9711 | 1.0660 | 1.2180 |
| 2009 | 1.3066 | 1.0251 | 1.1420 | 1.0510 |
| 2010 | 1.0848 | 0.9931 | 1.0299 | 0.9946 |
| 2011 | 1.0658 | 0.9407 | 0.9891 | 1.0170 |
| ● | environmental hazards, |
| ● | power outages, |
| ● | metallurgical and other processing problems, |
| ● | unusual or unexpected geological formations, |
| ● | structural cave-ins or slides, |
| ● | flooding, fire, explosions, cave-ins, landslides and rock-bursts, |
| ● | inability to obtain suitable or adequate machinery, equipment, or labour, |
| ● | metals losses, and |
| ● | periodic interruptions due to inclement or hazardous weather conditions. |
| Office address: | Suite #301, 700 West Pender Street Vancouver, British Columbia, Canada, V6C 1G8 Phone: (604) 685 9700 |
| Registered address: | #1040 – 999 West Hastings Street Vancouver, British Columbia, Canada, V6C 2W2 Phone: (604) 683-1102 |
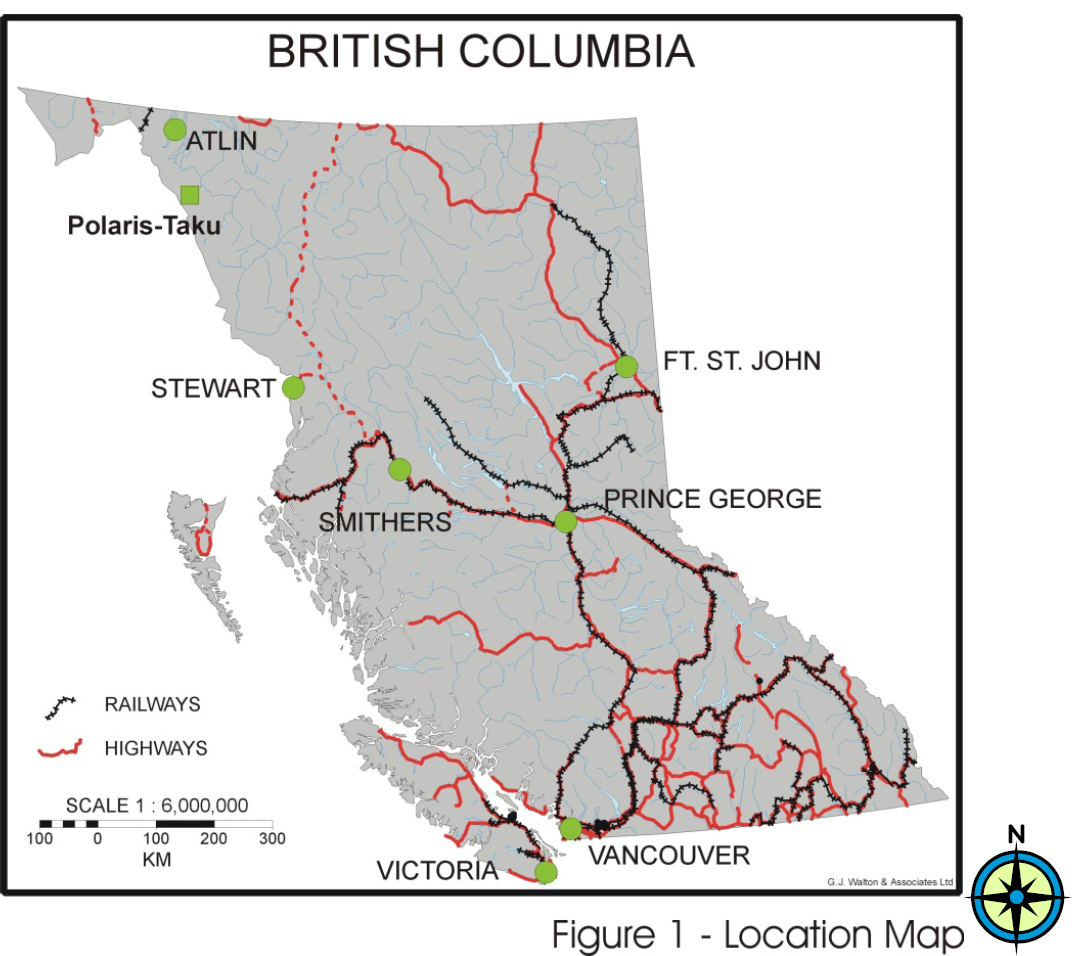
| - | New Polaris property in British Columbia, |
| - | Tay-LP property in the Yukon, |
| - | Windfall Hills properties, British Columbia, |
| - | Devils’ Thumb property, British Columbia, and |
| - | Eskay Creek property in British Columbia, |
| 2011 | 2010 | ||||||||||||||||||
| (in terms of $000s) | Acquisition Costs | Exploration/Development | Acquisition Total | Costs | Exploration/Development | Total | |||||||||||||
| British Columbia (Canada): | |||||||||||||||||||
| New Polaris | $ | 3,900 | $ | 8,285 | $ | 12,185 | $ | 3,605 | $ | 8,660 | $ | 12,265 | |||||||
| Windfall Hills | 67 | 106 | 173 | — | — | — | |||||||||||||
| Devil's Thumb | 6 | 15 | 21 | — | — | — | |||||||||||||
| Yukon (Canada): | |||||||||||||||||||
| Tay-LP | 146 | 423 | 569 | 74 | 385 | 459 | |||||||||||||
| $ | 4,119 | $ | 8,829 | $ | 12,948 | $ | 3,679 | $ | 9,045 | $ | 12,724 | ||||||||
| - | One private placement was for 4,000,000 flow through shares at CAD$0.12 per share for gross proceeds of CAD$480,000. Finders fees were comprised of CAD$25,523 in cash and 241,570 warrants, of which 39,410 warrants have an exercise price of CAD$0.15 and an expiry date of April 22, 2011 and the remaining 202,160 warrants have an exercise price of CAD$0.15 and an expiry date of October 22, 2011. |
| - | The second private placement was for 4,800,000 units at CAD$0.10 per unit for gross proceeds of CAD$480,000. Each unit was comprised of one common share and one-half of a share purchase warrant; each whole share purchase warrant was exercisable to acquire one common share at CAD$0.15 until April 22, 2011. Finders fees were comprised of CAD$18,011 in cash and 168,140 warrants which have the same terms as the warrants in the private placement for units. |
| Property Name | Location | Maximum% Interest Held (or to be earned) (1) | Capitalized Acquisition Expenditures (3) | Capitalized Exploration Expenditures (3) | Total Capitalized Expenditures (3) | |||||||||||
New Polaris (2) | BC, Canada | 100.00% | $ | 3,900,000 | $ | 8,285,000 | $ | 12,185,000 | ||||||||
Tay-LP (4) | Yukon, Canada | 100.00% | $ | 146,000 | $ | 423,000 | $ | 569,000 | ||||||||
| Windfall Hills | BC, Canada | 100.00% | $ | 67,000 | $ | 106,000 | $ | 173,000 | ||||||||
| Devil's Thumb | BC, Canada | 100.00% | $ | 6,000 | $ | 15,000 | $ | 21,000 | ||||||||
| Eskay Creek | BC, Canada | 33.33% | $ | 0 | $ | 0 | $ | 0 | ||||||||
| 4 | On March 22, 2010, Canarc entered into an option agreement with Cap-Ex whereby Cap-Ex can acquire 50% of Canarc’s interest in the Tay-LP property. In March 2011, Cap-Ex terminated its option agreement with the Company. Item 4.D provides further details. |
| Claim Name | Lot No. | Folio # | Claim Name | Lot No. | Folio # |
| Polaris No.1 | 6109 | 4472 | Snow | 3497 | 4545 |
| Polaris No.2 | 6140 | 5223 | Snow #2 | 3495 | 5088 |
| Polaris No.3 | 6141 | 5223 | Snow #3 | 3494 | 5495 |
| Polaris No.4 | 3498 | 4545 | Snow #4 | 3499 | 5495 |
| Polaris No.5 | 6143 | 5223 | Snow #5 | 6105 | 4472 |
| Polaris No.6 | 6144 | 5223 | Snow #8 | 6107 | 4472 |
| Polaris No.7 | 6145 | 5223 | Snow #7 | 3500 | 4472 |
| Polaris No.8 | 6146 | 5223 | Snow #6 | 6106 | 4472 |
| Polaris No.9 | 6147 | 5223 | Snow #9 | 6108 | 4472 |
| Polaris No.10 | 6148 | 5290 | Black Diamond | 3491 | 4472 |
| Polaris No.11 | 6149 | 5290 | Black Diamond No.3 | 6030 | 4944 |
| Polaris No.12 Fr | 6150 | 5290 | Blue Bird No.1 | 5708 | 4545 |
| Polaris No.13 Fr | 6151 | 5290 | Blue Bird No.2 | 5707 | 4545 |
| Polaris No.14 | 6152 | 5290 | Lloyd | 6035 | 5010 |
| Polaris No.15 | 6153 | 5290 | Lloyd No.2 | 6036 | 5010 |
| Silver King No.1 | 5489 | 4804 | Rand No.1 | 6039 | 5010 |
| Silver King No.2 | 5490 | 4804 | Rand No.2 | 6040 | 5010 |
| Silver King No.3 | 5493 | 4804 | Minto No.2 | 6033 | 4944 |
| Silver King No.4 | 5494 | 4804 | Minto No.3 | 6034 | 4944 |
| Silver King No.5 | 5491 | 4804 | Jumbo No.5 | 6031 | 4944 |
| Silver King No.6 | 5492 | 4804 | Ready Bullion | 6032 | 4944 |
| Silver King No.7 | 5495 | 4804 | Roy | 6042 | 5088 |
| Silver King No.8 | 5717 | 4545 | Frances | 6041 | 5010 |
| Sliver Queen No 1 | 6026 | 4545 | Eve Fraction | 6170 | 5495 |
| Sliver Queen No 2 | 6027 | 4545 | Eve No.1 Fraction | 6171 | 5495 |
| Sliver Queen No 3 | 6028 | 4944 | P.T. Fraction | 3493 | 5495 |
| Sliver Queen No 4 | 6029 | 4944 | Ant Fraction | 3492 | 5088 |
| Silver Strand | 6037 | 5010 | Atlin Fraction | 3496 | 5088 |
| Silver Strand No.2 | 6038 | 5010 | Powder Fraction | 6043 | 5088 |
| F.M Fraction | 6044 | 5088 | Jay Fraction | 6045 | 5088 |
| Par Fraction | 6154 | 5290 |

| British Columbia (Canada) | Yukon (Canada) | |||||||||||||||
| (in $000s) | New Polaris | Windfall Hills | Devil's Thumb | Tay-LP | Total | |||||||||||
| Acquisition Costs: | ||||||||||||||||
| Balance, January 1, 2010 | $ | 3,605 | $ | — | $ | — | $ | 25 | $ | 3,630 | ||||||
| Additions | — | — | — | 49 | 49 | |||||||||||
| Balance, December 31, 2010 | 3,605 | — | — | 74 | 3,679 | |||||||||||
| Additions | — | 67 | 6 | 72 | 145 | |||||||||||
| Adjustments from change in | ||||||||||||||||
| functional currency | 295 | — | — | — | 295 | |||||||||||
| Balance, December 31, 2011 | 3,900 | 67 | 6 | 146 | 4,119 | |||||||||||
| Deferred Exploration Expenditures: | ||||||||||||||||
| Balance, January 1, 2010 | 8,556 | — | — | 440 | 8,996 | |||||||||||
| Additions, net of recoveries | 104 | — | — | (55 | ) | 49 | ||||||||||
| Balance, December 31, 2010 | 8,660 | — | — | 385 | 9,045 | |||||||||||
| Additions | 166 | 106 | 15 | 48 | 335 | |||||||||||
| Adjustments from change in | ||||||||||||||||
| functional currency | (541 | ) | — | — | (10 | ) | (551 | ) | ||||||||
| Balance, December 31, 2011 | 8,285 | 106 | 15 | 423 | 8,829 | |||||||||||
| Mineral property interests, December 31, 2011 | $ | 12,185 | $ | 173 | $ | 21 | $ | 569 | $ | 12,948 | ||||||
Option Payments | Option Payments | Exploration Commitments (1) | Advance Royalty Payments | Net Smelter Reduction | Number of Shares | ||||||||||||||
| (CAD$000s) | (US$000s) | (CAD$000s) | (CAD$000s) | (US$000s) | |||||||||||||||
| New Polaris: | |||||||||||||||||||
| Net profit interest reduction or buydown | 150,000 | ||||||||||||||||||
| Tay-LP: | |||||||||||||||||||
| October 31, 2012 | $ | 25 | $ | 215 | |||||||||||||||
| October 31, 2013 | 850 | 600 | |||||||||||||||||
| Annual advance royalty payments until commercial production | $ | 25 | |||||||||||||||||
| Net smelter reduction from 3% to 1.5% | $ | 1,950 | |||||||||||||||||
| Windfall Hills: | |||||||||||||||||||
| Atna properties: | |||||||||||||||||||
| April 12, 2012 | $ | 100 | |||||||||||||||||
| April 12, 2013 | 150 | ||||||||||||||||||
| April 12, 2014 | 200 | ||||||||||||||||||
| April 12, 2015 | 250 | ||||||||||||||||||
| Dunn properties: | |||||||||||||||||||
| April 20, 2012 | 25 | ||||||||||||||||||
| April 20, 2013 | 35 | ||||||||||||||||||
| April 20, 2014 | 50 | ||||||||||||||||||
| April 20, 2015 | 125 | ||||||||||||||||||
| $ | 1,110 | $ | 700 | $ | 815 | $ | 25 | $ | 1,950 | 150,000 | |||||||||
| (1) | Exploration commitments for the Tay-LP property are adjusted for management fees of 5% and 10% and exploration expenditures incurred by Cap-Ex. |
| December 31, | ||||||||
| (in $000s) | 2011 | 2010 | ||||||
| Cash | $ | 45 | $ | 592 | ||||
| Working capital (deficiency) | $ | (577 | ) | $ | (1,149 | ) | ||
| Payments due by Period | Payments due by Period | |||||||||||||||||||||||||||||||||||||||
| (CAD$ 000s ) | (US$ 000s ) | Others | ||||||||||||||||||||||||||||||||||||||
| Total | Less than 1 year | 1-3 years | 3-5 years | More than 5 years | To tal | Less than 1 year | 1-3 years | 3-5 years | More than 5 years | Amount CAD$ ($ 000s ) | Amount US$ ($ 000s ) | Number of Shares | ||||||||||||||||||||||||||||
| New Polaris : | ||||||||||||||||||||||||||||||||||||||||
| Net profit interest reduction or buydown | $ | — | $ | — | $ | — | $ | — | $ | — | $ | — | $ | — | $ | — | $ | — | $ | — | $ | — | $ | — | 150,000 | |||||||||||||||
| Tay-LP : | ||||||||||||||||||||||||||||||||||||||||
| Option payments | 875 | 25 | 850 | — | — | — | — | — | — | — | — | — | — | |||||||||||||||||||||||||||
| Exploration expenditures | 815 | 215 | 600 | — | — | — | — | — | — | — | — | — | — | |||||||||||||||||||||||||||
| Annual advance royalty payments | ||||||||||||||||||||||||||||||||||||||||
| until commercial production | — | — | — | — | — | — | — | — | — | — | 25 | — | — | |||||||||||||||||||||||||||
| Net smelter reduction from 3% to 1.5% | — | — | — | — | — | — | — | — | — | — | — | 1,950 | — | |||||||||||||||||||||||||||
| Windfall Hills : | ||||||||||||||||||||||||||||||||||||||||
| Atna properties : | ||||||||||||||||||||||||||||||||||||||||
| Option payments | — | — | — | — | — | 700 | 75 | 625 | — | — | — | — | ||||||||||||||||||||||||||||
| Dunn properties : | ||||||||||||||||||||||||||||||||||||||||
| Option payments | 235 | 25 | 210 | — | — | — | — | — | — | — | — | — | — | |||||||||||||||||||||||||||
| Total | $ | 1,925 | $ | 265 | $ | 1,660 | $ | — | $ | — | $ | 700 | $ | 75 | $ | 625 | $ | — | $ | — | $ | 25 | $ | 1,950 | 150,000 | |||||||||||||||
| ● | risks related to our exploration and development activities; |
| ● | risks related to the ongoing financing of our planned operations; |
| ● | risks related estimates of mineral deposits; |
| ● | risks related to fluctuations in mineral prices; |
| ● | risks related to the title of our properties; |
| ● | risks related to the highly competitive mineral exploration and mining industry; |
| ● | risks related to potential conflicts of interest with our officers and directors; |
| ● | risks related to environmental and regulatory requirements; |
| ● | risks related to foreign currency fluctuations; |
| ● | risks related to the Registrant’s possible status as a passive foreign investment company; |
| ● | risks related to the volatility of the Registrant’s common stock; and |
| ● | risks related to the possible dilution of our common stock, |
Name and Province/State and Country of Residence | Principal Occupation and Occupation during the Past 5 Years (1) | Current Position with the Registrant and Period of Service | ||
COOKE, Bradford British Columbia, Canada | Chief Executive Officer and Director of Canarc Resource Corp. (since January 22, 1987); Chairman of Canarc Resource Corp. (since January 1, 2006); President of Canarc Resource Corp. (from January 22, 1987 to January 1, 2006); Chairman, Chief Executive Officer and Director of Endeavour Silver Corp. (since July 25, 2002). | Chief Executive Officer and Director (since January 22, 1987); Chairman (since January 1, 2006) | ||
BULLOCK, Derek (2) Ontario, Canada | Mining Consultant | Director (since March 12, 1996) | ||
HARRIS, Leonard (2) Colorado, U.S.A. | Retired | Director (since June 5, 2001) | ||
PRICE, William (2) California, U.S.A. | Retired; Chairman of William L. Price Charitable Foundation; Formerly Chairman, CEO and Chief Investment Officer of RCM Capital Management LLC (formerly Dresdner RCM Global Investors LLC); Formerly Global Equity Chief Investment Officer of Allianz Global Investors AG | Director (since May 31, 2005) | ||
BRIED, Bruce (2) British Columbia, Canada | President and Chief Operating Officer of Canarc Resource Corp. (from February 15, 2007 to May 31, 2008); Vice-President, Mining, for Endeavour Silver Corp. (from March 2005 to February 2007) | Director (since June 1, 2008) |
Name and Province/State and Country of Residence | Principal Occupation and Occupation during the Past 5 Years (1) | Current Position with the Registrant and Period of Service | ||
BILES, Garry British Columbia, Canada | Vice-President, Mining, of Canarc Resource Corp. (from March 1, 2007 to May 31, 2008); General Manager of Glencairn Gold Corp. (from April 2005 to January 2007) | President and Chief Operating Officer (since June 1, 2008) | ||
MOORS, James British Columbia, Canada | Exploration Manager for Canarc Resource Corp. (from April 2002 to May 2005) | Vice-President, Exploration (since June 2005) | ||
LOCKWOOD, Stewart British Columbia, Canada | Barrister & Solicitor, Vector Corporate Finance Lawyers | Secretary (since 1994) | ||
WILSON, Gregg British Columbia, Canada | Manager (Investor Relations) of Canarc Resource Corp. (from January 2000 to May 2011); Vice-President and/or Manager of Investor Relations of Caza Gold Corp. (since June 2008) | Vice-President (Investor Relations) (since June 2011) | ||
YEE, Philip British Columbia, Canada | Chief Financial Officer, Vice-President (Finance) and Director of Caza Gold Corp. (since November 2007); Chief Financial Officer and Vice-President (Finance) of Parallel Resources Ltd. (since November 2009 to October 2011); Finance Manager and/or Controller for Canarc Resource Corp. (from May 2003 to June 2005); Chief Financial Officer, Finance Manager and/or Controller for Endeavour Silver Corp. (from May 2003 to February 2007) | Chief Financial Officer and Vice-President (Finance) (since June 2005) |
| (1) | Unless otherwise stated above, each of the above-named persons has held the principal occupation or employment indicated for at least five years. |
| (2) | Members of the Audit Committee. |
Name and principal position | Year | Salary(1) ($) | Share-based awards($) | Option-based awards(2) ($) | Non-equity incentive plan compensation(3) ($) | Pension value(5) ($) | All other compensation(6) ($) | Total compensation(7) ($) | |
Annual Incentive plans(3) | Long-term incentive plans(4) | ||||||||
Bradford J. Cooke Director, Chairman and CEO | 2011 | $35,843 | Nil | $40,466 | Nil | Nil | Nil | $8,000 | $84,309 |
| 2010 | $42,819 | Nil | $27,805 | Nil | Nil | Nil | $8,000 | $78,624 | |
Derek Bullock Director | 2011 | Nil | Nil | $18,321 | Nil | Nil | Nil | $8,000 | $26,321 |
| 2010 | Nil | Nil | $10,384 | Nil | Nil | Nil | $8,000 | $18,384 | |
Leonard Harris Director | 2011 | Nil | Nil | $18,321 | Nil | Nil | Nil | $8,000 | $26,321 |
| 2010 | Nil | Nil | $10,384 | Nil | Nil | Nil | $8,000 | $18,384 | |
William Price Director | 2011 | Nil | Nil | $18,321 | Nil | Nil | Nil | $8,000 | $26,321 |
| 2010 | Nil | Nil | $10,384 | Nil | Nil | Nil | $8,000 | $18,384 | |
Bruce Bried Director | 2011 | Nil | Nil | $18,321 | Nil | Nil | Nil | $8,000 | $26,321 |
| 2010 | Nil | Nil | $10,384 | Nil | Nil | Nil | $8,000 | $18,384 | |
Garry D. Biles President and COO | 2011 | $199,480 | Nil | $30,186 | Nil | Nil | Nil | Nil | $229,666 |
| 2010 | $180,107 | Nil | $18,691 | Nil | Nil | Nil | Nil | $198,798 | |
James Moors Vice-President, Exploration | 2011 | $103,734 | Nil | $22,030 | Nil | Nil | Nil | Nil | $125,764 |
| 2010 | $36,257 | Nil | $15,022 | Nil | Nil | Nil | Nil | $51,279 | |
Gregg Wilson Vice-President, Investor Relations (9) | 2011 | $36,958 | Nil | $18,533 | Nil | Nil | Nil | Nil | $55,491 |
| 2010 | N/A | N/A | N/A | N/A | N/A | N/A | N/A | N/A | |
Stewart Lockwood Secretary | 2011 | Nil | Nil | $12,665 | Nil | Nil | Nil | $71,375 (8) | $84,040 |
| 2010 | Nil | Nil | $6,740 | Nil | Nil | Nil | $73,535 (8) | $80,275 | |
Philip Yee Chief Financial Officer and Vice-President, Finance | 2011 | $91,339 | Nil | $25,316 | Nil | Nil | Nil | Nil | $116,655 |
| 2010 | $40,325 | Nil | $16,776 | Nil | Nil | Nil | Nil | $57,101 | |
| (1) | Includes the dollar value of cash and non-cash base salary earned during a financial year covered. |
| (2) | The amount represents the fair value, on the date of grant and on each vesting date, as applicable, of awards made under the Company’s Stock Option Plan. The grant date fair value has been calculated using the Black Scholes Option Pricing Model in accordance with IFRS. |
| (3) | These amounts include annual non-equity incentive plan compensation, such as bonuses and discretionary amounts for the year ended December 31, 2011. |
| (4) | N/A. |
| (5) | N/A. |
| (6) | These amounts cover all compensation other than amounts already set out in the table for the year ended December 31, 2011 and include directors fees, as applicable, and annual bonuses for prior year’s performance, if any. |
| (7) | These amounts include dollar value of total compensation for the covered year. This is the sum of all amounts reported in columns with footnotes 1 to 6 above for each director and officer. |
| (8) | Legal fees charged to the Company by a law firm in which Mr. Stewart Lockwood is a partner. |
| (9) | Mr. Gregg Wilson was appointed Vice-President (Investor Relations) in June 2011. |
Name and Principal Position | Date of Grant | Title of Underlying Security | Number of Underlying Security | Exercise Price per Share (CAD$) | Expiry Date | ||||||
Bradford J. Cooke Chief Executive Officer, Chairman and Director | July 6, 2011 | Common shares | 350,000 | $ | 0.135 | July 6, 2016 | |||||
Derek Bullock Director | July 6, 2011 | Common shares | 175,000 | $ | 0.135 | July 6, 2016 | |||||
Leonard Harris Director | July 6, 2011 | Common shares | 175,000 | $ | 0.135 | July 6, 2016 | |||||
William Price Director | July 6, 2011 | Common shares | 175,000 | $ | 0.135 | July 6, 2016 | |||||
Bruce Bried Director | July 6, 2011 | Common shares | 175,000 | $ | 0.135 | July 6, 2016 | |||||
Garry Biles President and Chief Operating Officer | July 6, 2011 | Common shares | 275,000 | $ | 0.135 | July 6, 2016 | |||||
James Moors Vice-President, Exploration | July 6, 2011 | Common shares | 200,000 | $ | 0.135 | July 6, 2016 | |||||
Stewart Lockwood Secretary | July 6, 2011 | Common shares | 125,000 | $ | 0.135 | July 6, 2016 | |||||
Gregg Wilson Vice-President (Investor Relations) | July 6, 2011 | Common shares | 175,000 | $ | 0.135 | July 6, 2016 | |||||
Philip Yee Chief Financial Officer and Vice-President (Finance) | July 6, 2011 | Common shares | 225,000 | $ | 0.135 | July 6, 2016 | |||||
| Note: | The above stock option grant is subject to a vesting provision in which 20% of the options vest immediately and 20% vest every six months. |
| Director | Other Reporting Issuers |
| Bradford Cooke | Endeavour Silver Corp. |
| Radius Gold Inc. | |
| Caza Gold Corp. | |
| Derek Bullock | IAMGOLD Corporation |
| Leonard Harris | Cardero Resource Corp. |
| Coronet Metals Inc. | |
| Solitario Exploration & Royalty Corp. | |
| Sulliden Gold Corporation Ltd. | |
| Endeavour Silver Corp. | |
| Abzu Gold Ltd. | |
| Golden Arrow Resources Corporation | |
| Indico Resources Ltd. | |
| Wealth Minerals Ltd. | |
| Trevali Mining Corporation | |
| Golden Alliance Resources Corp. | |
| William Price | n/a |
| Bruce Bried | International Montoro Resources Inc. |
The independent directors do not hold regularly scheduled meetings at which non-independent directors and members of management are not in attendance. However, during the course of a directors’ meeting, if a matter is more effectively dealt with without the presence of members of management, the independent directors ask members of management to leave the meeting, and the independent directors then meet.
| ● | the strategic planning process of the Registrant; |
| ● | identification and management of the principal risks associated with the business of the Registrant; |
| ● | planning for succession of management; |
| ● | the Registrant's policies regarding communications with its shareholders and others; and |
| ● | the integrity of the internal controls and management information systems of the Registrant. |
| Committee | Members | Mandate |
| Nomination | Derek Bullock (Chairman) | The function of the Nominating Committee (the “Committee”) is to identify individuals qualified to become board members and to select, or to recommend that the Board of Directors select, the director nominees for the next annual meeting of stockholders, to oversee the selection and composition of committees of the Board of Directors and to oversee management continuity planning processes. |
| William Price | ||
| Compensation | Leonard Harris (Chairman) | The Compensation Committee shall advise and make recommendations to the Board of Directors in its oversight role with respect to the Company’s strategy, policies and programs on the compensation and development of senior management and directors. |
| William Price | ||
| Technical, Environmental, Social, Safety | Bruce Bried | The Technical, Environmental, Social and Safety Committee shall advise and make recommendations in its oversight role with respect to technical, environmental, social and safety issues affecting the Company and its advanced mineral exploration projects. |
| Members | Mandate |
| Chief Executive Officer or President, and Vice-President or Manager of Investor Relations | A Disclosure Policy Committee oversees corporate disclosure practices and ensures implementation and adherence to this policy. The Disclosure Policy Committee's responsibilities include:
ascertaining whether corporate developments constitute material information and, if so, ensuring compliance with the procedures outlined in this policy. |
Share Ownership | Number of Stock Options | |||||||
Name and Principal Position | Number of Shares | Percentage (1) | Number of Underlying Security (2) | Exercise Prices per Share (CAD$) | Expiry Dates | |||
Bradford J. Cooke Chairman, Chief Executive Officer and Director | 3,592,980 | 3.80% | 200,000 | $0.54 | June 15, 2012 | |||
| 750,000 | $0.46 | September 26, 2012 | ||||||
| 400,000 | $0.29 | May 15, 2013 | ||||||
| 300,000 | $0.11 | July 15, 2014 | ||||||
| 500,000 | $0.10 | September 8, 2015 | ||||||
| 350,000 | $0.135 | July 6, 2016 | ||||||
| 100,000 | $0.10 | March 23, 2013 | ||||||
Derek Bullock Director | 5 | 0.00% | 100,000 | $0.54 | June 15, 2012 | |||
| 125,000 | $0.29 | May 15, 2013 | ||||||
| 100,000 | $0.11 | July 15, 2014 | ||||||
| 90,000 | $0.10 | September 8, 2015 | ||||||
| 175,000 | $0.135 | July 6, 2016 | ||||||
Leonard Harris Director | 465,000 | 0.49% | 100,000 | $0.54 | June 15, 2012 | |||
| 125,000 | $0.29 | May 15, 2013 | ||||||
| 80,000 | $0.10 | September 8, 2015 | ||||||
| 140,000 | $0.135 | July 6, 2016 | ||||||
| 100,000 | $0.10 | March 23, 2013 | ||||||
William Price Director | 5,556,000 | 5.88% | 100,000 | $0.54 | June 15, 2012 | |||
| 125,000 | $0.29 | May 15, 2013 | ||||||
| 100,000 | $0.11 | July 15, 2014 | ||||||
| 175,000 | $0.135 | July 6, 2016 | ||||||
| 200,000 | $0.10 | September 8, 2015 | ||||||
Bruce Bried Director | 554,500 | 0.59% | 100,000 | $0.54 | June 15, 2012 | |||
| 125,000 | $0.29 | May 15, 2013 | ||||||
| 40,000 | $0.10 | September 8, 2015 | ||||||
| 175,000 | $0.135 | July 6, 2016 | ||||||
| 100,000 | $0.10 | March 23, 2013 | ||||||
Garry Biles President and Chief Operating Officer | 100,000 | 0.11% | 50,000 | $0.54 | June 15, 2012 | |||
| 200,000 | $0.29 | May 15, 2013 | ||||||
| 200,000 | $0.11 | July 15, 2014 | ||||||
| 350,000 | $0.10 | September 8, 2015 | ||||||
| 275,000 | $0.135 | July 6, 2016 | ||||||
| 100,000 | $0.10 | March 23, 2013 | ||||||
Share Ownership | Number of Stock Options | |||||||
Name and Principal Position | Number of Shares | Percentage (1) | Number of Underlying Security (2) | Exercise Prices per Share (CAD$) | Expiry Dates | |||
James Moors Vice-President, Exploration | 32,012 | 0.03% | 100,000 | $0.54 | June 15, 2012 | |||
| 175,000 | $0.29 | May 15, 2013 | ||||||
| 200,000 | $0.11 | July 15, 2014 | ||||||
| 250,000 | $0.10 | September 8, 2015 | ||||||
| 200,000 | $0.135 | July 6, 2016 | ||||||
Stewart Lockwood Secretary | 236,674 | 0.25% | 50,000 | $0.54 | June 15, 2012 | |||
| 40,000 | $0.29 | May 15, 2013 | ||||||
| 75,000 | $0.11 | July 15, 2014 | ||||||
| 130,000 | $0.10 | September 8, 2015 | ||||||
| 125,000 | $0.135 | July 6, 2016 | ||||||
Gregg Wilson Vice-President (Investor Relations) | 234,241 | 0.25% | 100,000 | $0.54 | June 15, 2012 | |||
| 150,000 | $0.29 | May 15, 2013 | ||||||
| 150,000 | $0.11 | July 15, 2014 | ||||||
| 200,000 | $0.10 | September 8, 2015 | ||||||
| 175,000 | $0.135 | July 6, 2016 | ||||||
Philip Yee Chief Financial Officer and Vice-President (Finance) | Nil | Nil | 100,000 | $0.54 | June 15, 2012 | |||
| 175,000 | $0.29 | May 15, 2013 | ||||||
| 200,000 | $0.11 | July 15, 2014 | ||||||
| 300,000 | $0.10 | September 8, 2015 | ||||||
| 225,000 | $0.135 | July 6, 2016 |
| Amount Outstanding | Exercise Prices (CAD$) | Dates Granted | Expiry Dates |
| 1,065,000 | $0.54 | June 15, 2007 | June 15, 2012 |
| 750,000 | $0.46 | September 26, 2007 | September 26, 2012 |
| 1,730,000 | $0.29 | May 15, 2008 | May 15, 2013 |
| 1,440,000 | $0.11 | July 15, 2009 | July 15, 2014 |
| 2,274,000 | $0.10 | September 8, 2010 | September 8, 2015 |
| 2,185,000 | $0.135 | July 6, 2011 | July 6, 2016 |
| 1,400,000 | $0.10 | March 23, 2012 | March 23, 2013 |
| 10,844,000 | TOTAL |
| Amount Outstanding | Exercise Price (CAD$) | Date Issued | Expiry Dates |
| 4,250,000 | $0.22 | December 13, 2010 | June 13, 2012 |
| 4,250,000 | TOTAL |
| (a) | all options granted shall be non-assignable; |
| (b) | an option must be exercisable during a period not extending beyond 10 years from the time of grant; and |
| Title of Class | Identity of Person or Group | Shares Owned (1) | Percentage of Class (2) |
| Common Shares | CDS & Co. Toronto, Ontario | 54,887,485 (3), (4) | 59.18% |
| Common Shares | CEDE & Co. New York, New York, U.S.A. | 30,366,390 (3), (4) | 32.15% |
| Common Shares | William Price (5) Atherton, California, U.S.A. | 5,556,000 (6) | 5.88% |
| Common Shares | Officers and Directors as a group | 10,771,412 (6) | 11.40% |
| (1) | Common shares. |
| (2) | As at April 27, 2012, the Registrant had 94,442,171 common shares issued and outstanding. |
| (3) | Owners of record only. CDS & Co. is a clearing agency through which Canadian brokers and dealers hold their securities. CEDE & Co. is a U.S. clearing agency. The Registrant believes that all of these shares are held by the registered holder in a fiduciary, trustee, or nominee capacity, and the identities of the beneficial owners of such shares are not known to the Registrant and, except for named individuals and the officers and directors as a group, the Registrant is not aware of any person or group of persons which beneficially owns more than 5% of the Registrant’s outstanding common shares. |
| (4) | Certain of these shares may be held in “street form” and may be included in the shares registered in the name of CDS & Co. or CEDE & Co. |
| (5) | As at April 27, 2012, William Price controlled, either directly or indirectly, 5,556,000 common shares of the Registrant, representing 5.88% of the Registrant at that time; William Price directly controls 4,556,000 common shares and indirectly controls 1,000,000 common shares through The William L Price Charitable Foundation. William Price became a director of the Registrant at May 31, 2005, but exerts no direct control over any board member and is unrelated to any board member and is not active in the operations of the Registrant. |
| (6) | William Price was elected to the Board of Directors at the Registrant’s annual general meeting held on May 31, 2005, and as at April 27, 2012, his shareholdings of 5,556,000 common shares are included in the 10,771,412 common shares held by officers and directors as a group. |
| Net balance receivable (payable) | |||||||
| Year ended December 31, | as at December 31, | ||||||
| 2011 | 2010 | 2011 | 2010 | ||||
| Key management compensation: | |||||||
| Executive salaries and remuneration | $ 473 | $ 291 | $ (14) | $ - | |||
| Directors fees | 40 | 39 | (146) | (109) | |||
| Share-based payments | 212 | 116 | - | - | |||
$ 725 | $ 446 | $ (160) | $ (109) | ||||
| Legal fees incurred to a law firm in which a senior officer of the Company is a partner | $ 72 | $ 71 | $ 83 | $ 62 | |||
| Net office, sundry, rent and salary allocations recovered from (incurred to) company(s) sharing certain common director(s) | $ 55 | $ 88 | $ 16 | $ (4) | |||
| (a) | Consolidated Statements of Financial Position as of December 31, 2011 and 2010; |
| (b) | Consolidated Statements of Comprehensive (Loss) Income for each of the years ended December 31, 2011 and 2010; |
| (c) | Consolidated Statements of Shareholders’ Equity for each of the years ended December 31, 2011 and 2010; |
| (d) | Consolidated Statements of Cash Flows for each of the years ended December 31, 2011 and 2010; and |
| (e) | Notes to the consolidated financial statements. |
| Fiscal Year | High (CAD$) | Low (CAD$) |
| 2011 | $0.30 | $0.09 |
| 2010 | $0.29 | $0.07 |
| 2009 | $0.21 | $0.06 |
| 2008 | $0.44 | $0.04 |
| 2007 | $0.83 | $0.33 |
| Quarter | High (CAD$) | Low (CAD$) |
| 2012 | ||
| 1st Quarter | $0.19 | $0.09 |
| 2011 | ||
| 4th Quarter | $0.16 | $0.09 |
| 3rd Quarter | $0.18 | $0.11 |
| 2nd Quarter | $0.18 | $0.14 |
| 1st Quarter | $0.30 | $0.17 |
| 2010 | ||
| 4th Quarter | $0.29 | $0.09 |
| 3rd Quarter | $0.10 | $0.07 |
| 2nd Quarter | $0.13 | $0.07 |
| 1st Quarter | $0.19 | $0.11 |
| Month | High (CAD$) | Low (CAD$) |
| 2012 | ||
| March | $0.19 | $0.10 |
| February | $0.12 | $0.10 |
| January | $0.12 | $0.09 |
| 2010 | ||
| December | $0.13 | $0.09 |
| November | $0.16 | $0.12 |
| October | $0.15 | $0.12 |
| (a) | Director’s power to vote on a proposal, arrangement or contract in which the director is materially interested: A director who holds a disclosable interest in a contract or transaction into which the Registrant has entered or proposes to enter is not entitled to vote on any directors' resolution to approve that contract or transaction, unless all the directors have a disclosable interest in that contract or transaction, in which case any or all of those directors may vote on such resolution. |
| (b) | Directors’ power, in the absence of an independent quorum, to vote compensation to themselves or any members of their body: |
| See (a), above. A director does not hold a disclosable interest in a contract or transaction merely because the contract or transaction relates to the remuneration of the director in that person's capacity as director, officer, employee or agent of the Registrant or of an affiliate of the Registrant. |
| (c) | Borrowing powers exercisable by the directors and how such borrowing powers can be varied: |
| The Registrant, if authorized by the directors, may: |
| (i) | borrow money in the manner and amount, on the security, from the sources and on the terms and conditions that they consider appropriate; |
| (ii) | issue bonds, debentures and other debt obligations either outright or as security for any liability or obligation of the Registrant or any other person and at such discounts or premiums and on such other terms as they consider appropriate; |
| (iii) | guarantee the repayment of money by any other person or the performance of any obligation of any other person; and |
| (iv) | mortgage, charge, whether by way of specific or floating charge, grant a security interest in, or give other security on, the whole or any part of the present and future assets and undertaking of the Registrant. |
| (d) | Retirement or non-retirement of directors under an age limit requirement: |
| The directors are not required to retire upon reaching a specific age. |
| (e) | Number of shares, if any, required for director’s qualification: |
A director is not required to hold any shares of the Registrant.
| (a) | It is made to all holders of voting shares of the Registrant of a particular class and for all those voting shares. |
| (b) | No voting shares can be taken up and paid for before the close of business on the “Permitted Bid Expiry Date”, as described below, and unless more than 50% of voting shares held by shareholders independent of the offeror are tendered and not withdrawn. |
| (c) | Voting shares may be tendered at any time until the Permitted Bid Expiry Date and may be withdrawn until taken up and paid for. |
| (d) | If the condition described in (b) above is met, there will be a public announcement and the take-over bid will be open for a further period of 10 business days. |
Permitted Bid Expiry Date
| - | An Executive Employment Agreement between Canarc and Mr. Garry Biles was signed on June 1, 2011 in respect of Mr. Biles’ capacity as Chief Operating Officer and President for Canarc. The employment agreement provides that Mr. Biles’ base remuneration is CAD$200,000 per annum plus a bonus based upon the achievement of performance targets as determined by the Compensation Committee. |
| - | An Executive Employment Agreement between Canarc and Mr. James Moors was signed on June 1, 2011 in respect of Mr. Moors’ capacity as Vice-President of Exploration for Canarc. The employment agreement provides that Mr. Moors’ base remuneration is CAD$120,000 per annum plus a bonus based upon the achievement of performance targets as determined by the Compensation Committee. |
| - | An Executive Employment Agreement between Caza and Mr. Gregg Wilson was signed on June 1, 2011 in respect of Mr. Wilson’s capacity as Vice-President of Investor Relations for both Canarc and Caza. The employment agreement provides that Mr. Wilson’s base remuneration is CAD$90,000 per annum plus a bonus based upon the achievement of performance targets as determined by the Compensation Committee. Mr. Wilson’s remuneration is allocated between Canarc and Caza. |
| - | An Executive Employment Agreement between Caza and Mr. Philip Yee was signed on June 1, 2011 in respect of Mr. Yee’s capacity as Chief Financial Officer and Vice-President of Finance for both Canarc and Caza. The employment agreement provides that Mr. Yee’s base remuneration is CAD$180,000 per annum plus a bonus based upon the achievement of performance targets as determined by the Compensation Committee. Mr. Yee’s remuneration is allocated between Canarc and Caza. |
| - | pertain to the maintenance of records that, in reasonable detail, accurately and fairly reflect the transactions and dispositions of the assets of the Registrant; |
| - | provide reasonable assurance that transactions are recorded as necessary to permit preparation of financial statements in accordance with IFRS; and |
| - | provide reasonable assurance regarding prevention or timely detection of unauthorized acquisition, use or disposition of the Registrant’s assets that could have a material effect on the annual financial statements or interim financial statements. |
Mining Engineering, Colorado School of Mines, Golden, CO. His significant experience in the last ten years has been VP Operations for Endeavour Silver Corp. and General Manager for Kinross Gold USA Inc., at the Lupin Mine, General Manager of the Lead Mine in South Dakota and the Snip Mine in British Columbia for Homestake Mining Company.
| - | act with honesty and integrity and in an ethical manner resolve any actual or apparent conflicts of interest between personal and professional relationships; |
| - | ensure that any public filings or announcements, whether they are statutory or regulatory filings or other documents submitted for public disclosure and communication, are accurate, complete, fair, timely and understandable in all material respects, taking into consideration applicable standards and regulations; |
| - | compliance with applicable laws, rules and regulations; and |
| - | prompt internal reporting of any violations, whether actual or potential, in the code of ethics. |
Type of Services Rendered | 2011 Fiscal Year (CAD$) | 2010 Fiscal Year (CAD$) |
| (a) Audit Fees | $65,000 | $58,100 |
| (b) Audit-Related Fees | Nil | $10,000 |
| (c) Tax Fees | $2,500 | Nil |
| (d) All Other Fees | Nil | Nil |
| Financial Statements | Page # in Sequential Numbering System |
| 1.1 Report of Independent Registered Public Accounting Firm dated March 23, 2012 | 79 |
| 1.2 Consolidated statements of financial position as at December 31, 2011 and 2010 together with the consolidated statements of comprehensive loss, shareholders’ equity and cash flows for each of the years in the two year period ended December 31, 2011 and 2010. | 80 |
| Exhibits | Page # in Sequential Numbering System | ||
| Exhibit # | Description | ||
| 1-1 | Notice of Articles and Articles (Business Corporations Act of British Columbia) | Previously filed as Exhibit 2.1 in the Form 20-F with the SEC on July 12, 2005 | |
| 1-2 | Shareholders Right Plan dated April 30, 2005 | Previously filed as Exhibit 2.2 in the Form 20-F with the SEC on July 12, 2005 | |
| 8-1 | List of Material Subsidiaries | 126 | |
| 12-1 | Certification pursuant to Section 302 of the Sarbanes-Oxley Act of 2002 (Bradford J. Cooke) | 76 | |
| 12-2 | Certification pursuant to Section 302 of the Sarbanes-Oxley Act of 2002 (Philip Yee) | 77 | |
| 13-1. | Certification pursuant to Title 18, United States Code, Section 1350 as adopted pursuant to Section 906 of the Sarbanes-Oxley Act of 2002 (Bradford J. Cooke) | 127 | |
| 13-2 | Certification pursuant to Title 18, United States Code, Section 1350 as adopted pursuant to Section 906 of the Sarbanes-Oxley Act of 2002 (Philip Yee) | 127 | |
| 15-1 | Resource Potential, New Polaris Project (dated March 14, 2007) | Previously filed on Form 6-K with the SEC in July 2008 | |
| 15-2 | New Polaris Project, Preliminary Assessment (dated December 23, 2009) | Previously filed on Form 6-K with the SEC in July 2010 | |
| 15-3 | New Polaris Project, Preliminary Assessment (dated April 10, 2011) | Previously filed on Form 6-K with the SEC in July 2011 | |
| 15-4 | 2009 Diamond Drilling Program on the Tay-LP Property (dated March 30, 2010) | Previously filed on Form 6-K with the SEC in July 2010 | |
| CANARC RESOURCE CORP. | ||
| Per: | ||
| /s/ Bradford J. Cooke | ||
| Bradford J. Cooke, Chief Executive Officer and Director |
| 1. | I have reviewed this annual report on Form 20-F of Canarc Resource Corp.; |
| 2. | Based on my knowledge, this report does not contain any untrue statement of a material fact or omit to state a material fact necessary to make the statements made, in light of the circumstances under which such statements were made, not misleading with respect to the period covered by this report; |
| 3. | Based on my knowledge, the financial statements, and other financial information included in this report, fairly present in all material respects the financial condition, results of operations and cash flows of the Company as of, and for, the periods presented in this report; |
| 4. | The Company’s other certifying officer(s) and I are responsible for establishing and maintaining disclosure controls and procedures (as defined in Exchange Act Rules 13a-15(e) and 15d-15(e)) and internal control over financial reporting (as defined in Exchange Act Rules 13a-15(f) and 15d-15(f)) for the Company and have: |
| a. | Designed such disclosure controls and procedures, or caused such disclosure controls and procedures to be designed under our supervision, to ensure that material information relating to the Company, including its consolidated subsidiaries, is made known to us by others within those entities, particularly during the period in which this report is being prepared; |
| b. | Designed such internal control over financial reporting, or caused such internal control over financial reporting to be designed under our supervision, to provide reasonable assurance regarding the reliability of financial reporting and the preparation of financial statements for external purposes in accordance with generally accepted accounting principles; |
| c. | Evaluated the effectiveness of the Company’s disclosure controls and procedures and presented in this report our conclusions about the effectiveness of the disclosure controls and procedures, as of the end of the period covered by this report based on such evaluation; and |
| d. | Disclosed in this report any change in the Company’s internal control over financial reporting that occurred during the period covered by the annual report that has materially affected, or is reasonably likely to materially affect, the Company’s internal control over financial reporting; and |
| 5. | The Company’s other certifying officer(s) and I have disclosed, based on our most recent evaluation of internal control over financial reporting, to the Company’s auditors and the audit committee of the Company’s board of directors (or persons performing the equivalent functions): |
| a. | All significant deficiencies and material weaknesses in the design or operation of internal control over financial reporting which are reasonably likely to adversely affect the Company’s ability to record, process, summarize and report financial information; and |
| b. | Any fraud, whether or not material, that involves management or other employees who have a significant role in the Company’s internal control over financial reporting. |
| /s/ Philip Yee | ||
| Philip Yee, Chief Financial Officer |

| 2011 | 2010 | ||||||||||||||||
| Notes | December 31 | December 31 | January 1 | ||||||||||||||
| ASSETS | |||||||||||||||||
| CURRENT ASSETS | |||||||||||||||||
| Cash | $ | 45 | $ | 592 | $ | 155 | |||||||||||
| Receivables and prepaids | 15 | 92 | 105 | 193 | |||||||||||||
| Marketable securities | 6 | 93 | 25 | - | |||||||||||||
| Royalty receivable - current portion | 7(b) | - | 50 | 50 | |||||||||||||
| Total Current Assets | 230 | 772 | 398 | ||||||||||||||
| NON-CURRENT ASSETS | |||||||||||||||||
| Mineral properties | 7 | 12,948 | 12,724 | 12,626 | |||||||||||||
| Deposit on asset acquisition | 7(c ) | - | 300 | - | |||||||||||||
| Equipment | 8 | 7 | 10 | 2 | |||||||||||||
| Royalty receivable - long-term portion | 7(b) | - | - | 46 | |||||||||||||
| Long-term investments | 9 | 92 | 94 | 143 | |||||||||||||
| Total Non-Current Assets | 13,047 | 13,128 | 12,817 | ||||||||||||||
| Total Assets | $ | 13,277 | $ | 13,900 | $ | 13,215 | |||||||||||
| LIABILITIES AND SHAREHOLDERS' EQUITY | |||||||||||||||||
| CURRENT LIABILITIES | |||||||||||||||||
| Accounts payable and accrued liabilities | 15 | $ | 524 | $ | 532 | $ | 607 | ||||||||||
| Notes payable | 10 | 88 | 81 | 63 | |||||||||||||
| Flow-through obligations | 11 | 195 | 226 | 377 | |||||||||||||
| Derivative liability for warrants | 12 | - | 1,082 | 193 | |||||||||||||
| Total Liabilities | 807 | 1,921 | 1,240 | ||||||||||||||
| SHAREHOLDERS' EQUITY | |||||||||||||||||
| Share capital | 13 | 58,258 | 57,685 | 56,436 | |||||||||||||
| Reserve for share-based payments | 1,081 | 1,259 | 1,316 | ||||||||||||||
| Accumulated other comprehensive income | (54 | ) | 10 | - | |||||||||||||
| Deficit | (46,815 | ) | (46,975 | ) | (45,777 | ) | |||||||||||
| Total Shareholders' Equity | 12,470 | 11,979 | 11,975 | ||||||||||||||
| Total Liabilities and Shareholders' Equity | $ | 13,277 | $ | 13,900 | $ | 13,215 | |||||||||||
| Refer to the accompanying notes to the consolidated financial statements. |
| /s/ Bradford Cooke | /s/ William Price | ||
| Director | Director |
| Years ended December 31, | ||||||||||||
| Notes | 2011 | 2010 | ||||||||||
| Expenses: | ||||||||||||
| Amortization | $ | 3 | $ | 1 | ||||||||
| Corporate development | 46 | 12 | ||||||||||
| Employee and director remuneration | 15 | 424 | 383 | |||||||||
| Foreign exchange loss | 15 | 43 | ||||||||||
| General and administrative | 14 and 15 | 296 | 308 | |||||||||
| Shareholder relations | 80 | 62 | ||||||||||
| Share-based payments | 13(c ) and 15 | 241 | 143 | |||||||||
| Loss before the undernoted | (1,105 | ) | (952 | ) | ||||||||
| Gain on disposition of long-term investment | - | 257 | ||||||||||
| Accretion of royalty receivable | 7(b) | - | 4 | |||||||||
| Write-off of equipment | 8 | - | (1 | ) | ||||||||
| Write-off of GST recoveries | (25 | ) | - | |||||||||
| Due diligence costs on asset acquisition | 7(c ) | (60 | ) | (20 | ) | |||||||
| Interest expense | 10 and 11 | (20 | ) | (14 | ) | |||||||
| Flow-through financing costs | 11 | - | 150 | |||||||||
| Unrealized loss from derivative warrant liability | - | (913 | ) | |||||||||
| Loss before income tax | (1,210 | ) | (1,489 | ) | ||||||||
| Deferred income tax recovery | 13(b) and 17 | 1 | 93 | |||||||||
| Net loss for the year | (1,209 | ) | (1,396 | ) | ||||||||
| Other comprehensive (loss) income: | ||||||||||||
| Unrealized gain on available-for-sale securities | 6 | 71 | 10 | |||||||||
| Foreign currency translation adjustment | (135 | ) | - | |||||||||
| Comprehensive loss for the year | $ | (1,273 | ) | $ | (1,386 | ) | ||||||
| Basic and diluted loss per share | $ | (0.01 | ) | $ | (0.02 | ) | ||||||
| Weighted average number of common shares outstanding | 93,162,401 | 82,446,825 | ||||||||||
| Refer to the accompanying notes to the consolidated financial statements. |
| Accumulated | ||||||||||||||||||||||||
| Share Capital | Reserve for | Other | ||||||||||||||||||||||
| Number of | Share-Based | Comprehensive | ||||||||||||||||||||||
| Shares | Amount | Payments | Income (Loss) | Deficit | Total | |||||||||||||||||||
| Balance, January 1, 2010 | 81,969,655 | $ | 56,436 | $ | 1,316 | $ | - | $ | (45,777 | ) | $ | 11,975 | ||||||||||||
| Private placement, net of share issuance costs | 8,500,000 | 1,244 | - | - | - | 1,244 | ||||||||||||||||||
| Property acquisition | 221,235 | 24 | - | - | - | 24 | ||||||||||||||||||
| Exercise of stock options | 20,000 | 4 | (2 | ) | - | - | 2 | |||||||||||||||||
| Exercise of warrants | 275,000 | 66 | - | - | - | 66 | ||||||||||||||||||
| Renunciation of flow-through expenditures | - | (89 | ) | - | - | - | (89 | ) | ||||||||||||||||
| Share-based payments | - | - | 143 | - | - | 143 | ||||||||||||||||||
| Expiry of stock options | - | - | (198 | ) | - | 198 | - | |||||||||||||||||
| Other comprehensive income | - | - | - | 10 | - | 10 | ||||||||||||||||||
| Net loss for the year | - | - | - | - | (1,396 | ) | (1,396 | ) | ||||||||||||||||
| Balance, December 31, 2010 | 90,985,890 | 57,685 | 1,259 | 10 | (46,975 | ) | 11,979 | |||||||||||||||||
| Conversion of convertible debenture | 1,282,051 | 291 | - | - | - | 291 | ||||||||||||||||||
| Property acquisition | 215,580 | 24 | - | - | - | 24 | ||||||||||||||||||
| Exercise of stock options | 299,000 | 54 | (22 | ) | - | - | 32 | |||||||||||||||||
| Exercise of warrants | 1,313,650 | 205 | - | - | - | 205 | ||||||||||||||||||
| Renunciation of flow-through expenditures | - | (1 | ) | - | - | - | (1 | ) | ||||||||||||||||
| Share-based payments | - | - | 241 | - | - | 241 | ||||||||||||||||||
| Expiry of stock options | - | - | (397 | ) | - | 397 | - | |||||||||||||||||
| Effect from change in functional currency | - | - | - | - | (110 | ) | (110 | ) | ||||||||||||||||
| Other comprehensive income: | ||||||||||||||||||||||||
| Unrealized gain on available-for-sale securities | - | - | - | 71 | - | 71 | ||||||||||||||||||
| Foreign currency translation adjustment | - | - | - | (135 | ) | - | (135 | ) | ||||||||||||||||
| Elimination of derivative liability (Note 12) | - | - | - | - | 1,082 | 1,082 | ||||||||||||||||||
| Net loss for the year | - | - | - | - | (1,209 | ) | (1,209 | ) | ||||||||||||||||
| Balance, December 31, 2011 | 94,096,171 | $ | 58,258 | $ | 1,081 | $ | (54 | ) | $ | (46,815 | ) | $ | 12,470 | |||||||||||
| Years ended December 31, | ||||||||
| 2011 | 2010 | |||||||
| Cash provided from (used for): | ||||||||
| Operations: | ||||||||
| Net loss for the year | $ | (1,209 | ) | $ | (1,396 | ) | ||
| Items not involving cash: | ||||||||
| Accretion of royalty receivables | - | (4 | ) | |||||
| Accrued interest | 10 | 14 | ||||||
| Amortization | 3 | 1 | ||||||
| Share-based payments | 241 | 143 | ||||||
| Gain on disposition of long term investments | - | (257 | ) | |||||
| Flow through financing costs | - | (150 | ) | |||||
| Deferred income tax recovery | (1 | ) | (93 | ) | ||||
| Unrealized gain on derivative liability for warrants | - | 913 | ||||||
| Unrealized currency translation gain | - | 8 | ||||||
| Write-off of GST recoveries | 25 | - | ||||||
| Write-off of equipment | - | 1 | ||||||
| (931 | ) | (820 | ) | |||||
| Changes in non-cash working capital items: | ||||||||
| Receivables and prepaids | (12 | ) | 25 | |||||
| Accounts payable and accrued liabilities | (8 | ) | (85 | ) | ||||
| Flow through obligations | (39 | ) | - | |||||
| Cash used by operating activities | (990 | ) | (880 | ) | ||||
| Financing: | ||||||||
| Issuance of common shares, net of share issuance costs | 528 | 1,287 | ||||||
| Investing: | ||||||||
| Proceeds from royalty receivable | 50 | 50 | ||||||
| Proceeds from disposition of long term investments | - | 306 | ||||||
| Mineral properties, net of recoveries | (435 | ) | (26 | ) | ||||
| Disposition of asset held for sale, net of acquisition | 300 | (300 | ) | |||||
| Cash (used by) provided from investing activities | (85 | ) | 30 | |||||
| (Decrease) increase in cash | (547 | ) | 437 | |||||
| Cash, beginning of year | 592 | 155 | ||||||
| Cash, end of year | $ | 45 | $ | 592 | ||||
| Years ended December 31, | |||||||||
| Notes | 2011 | 2010 | |||||||
| Non-cash financing and investing activities: | |||||||||
| Accrual of acquisition of equipment | $ | - | $ | 10 | |||||
| Available-for-sale securities received from optioned mineral property interests | 7(a)(ii) | - | 15 | ||||||
| Issuance of shares for mineral property interests | 7(a)(ii) | 24 | 24 | ||||||
| Accounts receivable adjustment to mineral property interests | - | (63 | ) | ||||||
| Fair value of allocated to shares issued on exercise of: | |||||||||
| Stock options | 22 | 2 | |||||||
| Warrants | - | 24 | |||||||
| Expiration of stock options | 397 | 198 | |||||||
| Income taxes paid | - | - | |||||||
| Interest paid | 9 | - | |||||||
CANARC RESOURCE CORP. Notes to the Consolidated Financial Statements Years ended December 31, 2011 and 2010 (tabular dollar amounts expressed in thousands of United States dollars, except per share amounts) |
CANARC RESOURCE CORP. Notes to the Consolidated Financial Statements Years ended December 31, 2011 and 2010 (tabular dollar amounts expressed in thousands of United States dollars, except per share amounts) |
| Ÿ | Revenue and expense items at the rate of exchange in effect on the transaction date; |
| Ÿ | Non-monetary assets and liabilities at historical exchange rates, unless such items are carried at market, in which case they are translated at the exchange rate in effect on the statement of financial position date; and |
| Ÿ | Monetary assets and liabilities at the exchange rate at the statement of financial position date. |
| Ÿ | Revenue and expense items at the rate of exchange in effect on the transaction date; |
| Ÿ | Monetary assets and liabilities at the exchange rate at the statement of financial position date; |
| Ÿ | Non-monetary assets and liabilities at the historical exchange rates, unless such items are carried at fair value, in which case they are translated at the date when the fair value was determined; and |
| Ÿ | Shareholders’ equity items at historical exchange rates. |
CANARC RESOURCE CORP. Notes to the Consolidated Financial Statements Years ended December 31, 2011 and 2010 (tabular dollar amounts expressed in thousands of United States dollars, except per share amounts) |
| (e) | Critical accounting estimates: |
CANARC RESOURCE CORP. Notes to the Consolidated Financial Statements Years ended December 31, 2011 and 2010 (tabular dollar amounts expressed in thousands of United States dollars, except per share amounts) |
| · | Debt instruments meeting both a “business model” test and a “cash flow characteristics” test are measured at amortized cost (the use of fair value is optional in some limited circumstances). |
| · | Investments in equity instruments can be designated as “fair value through other comprehensive income” with only dividends being recognized in profit or loss. |
| · | All other instruments (including all derivatives) are measured at fair value with changes recognized in the profit or loss. |
| · | The concept of “embedded derivatives” does not apply to financial assets within the scope of the standard and the entire instrument must be classified and measured in accordance with the above guidelines. |
CANARC RESOURCE CORP. Notes to the Consolidated Financial Statements Years ended December 31, 2011 and 2010 (tabular dollar amounts expressed in thousands of United States dollars, except per share amounts) |
| · | A joint operation is a joint arrangement whereby the parties that have joint control of the arrangement (joint operators) have rights to the assets, and obligations for the liabilities, relating to the arrangement. Joint operators recognize their assets, liabilities, revenue and expenses in relation to its interest in a joint operation (including their share of any such items arising jointly). |
| · | A joint venture is a joint arrangement whereby the parties that have joint control of the arrangement (joint venturers) have rights to the net assets of the arrangement. A joint venturer applies the equity method of accounting for its investment in a joint venture in accordance with IAS 28 Investments in Associates and Joint Ventures (2011). Unlike IAS 31, the use of “proportionate consolidation” to account for joint ventures is not permitted. |
CANARC RESOURCE CORP. Notes to the Consolidated Financial Statements Years ended December 31, 2011 and 2010 (tabular dollar amounts expressed in thousands of United States dollars, except per share amounts) |
| · | Significant judgments and assumptions - such as how control, joint control, significant influence has been determined. |
| · | Interests in subsidiaries - including details of the structure of the group, risks associated with structured entities, changes in control, and so on. |
| · | Interests in joint arrangements and associates - the nature, extent and financial effects of interests in joint arrangements and associates (including names, details and summarized financial information). |
| · | Interests in unconsolidated structured entities - information to allow an understanding of the nature and extent of interests in unconsolidated structured entities and to evaluate the nature of, and changes in, the risks associated with its interests in unconsolidated structured entities. |
CANARC RESOURCE CORP. Notes to the Consolidated Financial Statements Years ended December 31, 2011 and 2010 (tabular dollar amounts expressed in thousands of United States dollars, except per share amounts) |
| · | Level 1 - quoted prices in active markets for identical assets or liabilities that the entity can access at the measurement date. |
| · | Level 2 - inputs other than quoted market prices included within Level 1 that are observable for the asset or liability, either directly or indirectly. |
| · | Level 3 - unobservable inputs for the asset or liability. |
CANARC RESOURCE CORP. Notes to the Consolidated Financial Statements Years ended December 31, 2011 and 2010 (tabular dollar amounts expressed in thousands of United States dollars, except per share amounts) |
| (xi) | Severe Hyperinflation and Removal of Fixed Dates for First-time Adopters (Amendments to IFRS 1) |
| · | Replace references to a fixed date of “January 1, 2004” with “the date of transition to IFRSs”, thus eliminating the need for companies adopting IFRSs for the first time to restate de-recognition transactions that occurred before the date of transition to IFRSs |
| · | Provide guidance on how an entity should resume presenting financial statements in accordance with IFRSs after a period when the entity was unable to comply with IFRSs because its functional currency was subject to severe hyperinflation. |
CANARC RESOURCE CORP. Notes to the Consolidated Financial Statements Years ended December 31, 2011 and 2010 (tabular dollar amounts expressed in thousands of United States dollars, except per share amounts) |
| · | Preserve the amendments made to IAS 1 in 2007 to require profit or loss and OCI to be presented together, i.e., either as a single “statement of profit or loss and comprehensive income”, or a separate “statement of profit or loss' and a 'statement of comprehensive income” – rather than requiring a single continuous statement as was proposed in the exposure draft. |
| · | Require entities to group items presented in OCI based on whether they are potentially reclassifiable to profit or loss subsequently. i.e., those that might be reclassified and those that will not be reclassified. |
| · | Require tax associated with items presented before tax to be shown separately for each of the two groups of OCI items (without changing the option to present items of OCI either before tax or net of tax). |
CANARC RESOURCE CORP. Notes to the Consolidated Financial Statements Years ended December 31, 2011 and 2010 (tabular dollar amounts expressed in thousands of United States dollars, except per share amounts) |
| (b) | Financial instruments: |
CANARC RESOURCE CORP. Notes to the Consolidated Financial Statements Years ended December 31, 2011 and 2010 (tabular dollar amounts expressed in thousands of United States dollars, except per share amounts) |
| (b) | Financial instruments: (continued) |
CANARC RESOURCE CORP. Notes to the Consolidated Financial Statements Years ended December 31, 2011 and 2010 (tabular dollar amounts expressed in thousands of United States dollars, except per share amounts) |
| (b) | Financial instruments: (continued) |
CANARC RESOURCE CORP. Notes to the Consolidated Financial Statements Years ended December 31, 2011 and 2010 (tabular dollar amounts expressed in thousands of United States dollars, except per share amounts) |
| (h) | Share-based payments: |
CANARC RESOURCE CORP. Notes to the Consolidated Financial Statements Years ended December 31, 2011 and 2010 (tabular dollar amounts expressed in thousands of United States dollars, except per share amounts) |
| (h) | Share-based payments: (continued) |
| (i) | Environmental rehabilitation: |
CANARC RESOURCE CORP. Notes to the Consolidated Financial Statements Years ended December 31, 2011 and 2010 (tabular dollar amounts expressed in thousands of United States dollars, except per share amounts) |
| (k) | Provisions: |
| (l) | Income taxes: |
| 4. | Management of Capital |
| 4. | Management of Capital (continued) |
CANARC RESOURCE CORP. Notes to the Consolidated Financial Statements Years ended December 31, 2011 and 2010 (tabular dollar amounts expressed in thousands of United States dollars, except per share amounts) |
| 5. | Management of Financial Risk |
| 5. | Management of Financial Risk (continued) |
CANARC RESOURCE CORP. Notes to the Consolidated Financial Statements Years ended December 31, 2011 and 2010 (tabular dollar amounts expressed in thousands of United States dollars, except per share amounts) |
| 5. | Management of Financial Risk (continued) |
CANARC RESOURCE CORP. Notes to the Consolidated Financial Statements Years ended December 31, 2011 and 2010 (tabular dollar amounts expressed in thousands of United States dollars, except per share amounts) |
| Held in Canadian dollars | ||||
| Cash | $ | 32 | ||
| Accounts payable and accrued liabilities | (74 | ) | ||
| Net assets (liabilities) | $ | (42 | ) | |
| (iii) | Other price risk: |
CANARC RESOURCE CORP. Notes to the Consolidated Financial Statements Years ended December 31, 2011 and 2010 (tabular dollar amounts expressed in thousands of United States dollars, except per share amounts) |
| 2011 | 2010 | |||||||||||
| December 31 | December 31 | January 1 | ||||||||||
| Balance, begin of period | $ | 25 | $ | - | $ | - | ||||||
| Available-for-sale securities received from property option agreement | - | 14 | - | |||||||||
| Unrealized gain on available-for-sale securities | 71 | 10 | - | |||||||||
| Foreign currency translation adjustment | (3 | ) | 1 | - | ||||||||
| Balance, end of period | $ | 93 | $ | 25 | $ | - | ||||||
| British Columbia (Canada) | Yukon (Canada) | |||||||||||||||||||
| New Polaris | Windfall Hills | Devil's Thumb | Tay-LP | Total | ||||||||||||||||
| (Note 7(a)(i)) | (Note 7(a)(iii)) | (Note 7(a)(iv)) | (Note 7(a)(ii)) | |||||||||||||||||
| Acquisition Costs: | ||||||||||||||||||||
| Balance, January 1, 2010 | $ | 3,605 | $ | - | $ | - | $ | 25 | $ | 3,630 | ||||||||||
| Additions | - | - | - | 49 | 49 | |||||||||||||||
| Balance, December 31, 2010 | 3,605 | - | - | 74 | 3,679 | |||||||||||||||
| Additions | - | 67 | 6 | 72 | 145 | |||||||||||||||
| Adjustments from change in functional currency | 295 | - | - | - | 295 | |||||||||||||||
| Balance, December 31, 2011 | $ | 3,900 | $ | 67 | $ | 6 | $ | 146 | $ | 4,119 | ||||||||||
| Deferred Exploration Expenditures: | ||||||||||||||||||||
| Balance, January 1, 2010 | $ | 8,556 | $ | - | $ | - | $ | 440 | $ | 8,996 | ||||||||||
| Additions, net of recoveries | 104 | - | - | (55 | ) | 49 | ||||||||||||||
| Balance, December 31, 2010 | 8,660 | - | - | 385 | 9,045 | |||||||||||||||
| Additions | 166 | 106 | 15 | 48 | 335 | |||||||||||||||
| Adjustments from change in functional currency | (541 | ) | - | - | (10 | ) | (551 | ) | ||||||||||||
| Balance, December 31, 2011 | $ | 8,285 | $ | 106 | $ | 15 | $ | 423 | $ | 8,829 | ||||||||||
| Mineral property interests: | ||||||||||||||||||||
| Balance, January 1, 2010 | $ | 12,161 | $ | - | $ | - | $ | 465 | $ | 12,626 | ||||||||||
| Balance, December 31, 2010 | 12,265 | - | - | 459 | 12,724 | |||||||||||||||
| Balance, December 31, 2011 | 12,185 | 173 | 21 | 569 | 12,948 | |||||||||||||||
CANARC RESOURCE CORP. Notes to the Consolidated Financial Statements Years ended December 31, 2011 and 2010 (tabular dollar amounts expressed in thousands of United States dollars, except per share amounts) |
CANARC RESOURCE CORP. Notes to the Consolidated Financial Statements Years ended December 31, 2011 and 2010 (tabular dollar amounts expressed in thousands of United States dollars, except per share amounts) |
CANARC RESOURCE CORP. Notes to the Consolidated Financial Statements Years ended December 31, 2011 and 2010 (tabular dollar amounts expressed in thousands of United States dollars, except per share amounts) |
| Present value of expected cash flows from royalties as at January 1, 2010 | $ | 96 | ||
| Add: Accretion for the year | 4 | |||
| Less: Royalty received during the year | (50 | ) | ||
| Present value of expected cash flows from royalties as at December 31, 2010 | 50 | |||
| Less: Royalty received during the year | (50 | ) | ||
| Royalty receivable as at December 31, 2011 | $ | - | ||
CANARC RESOURCE CORP. Notes to the Consolidated Financial Statements Years ended December 31, 2011 and 2010 (tabular dollar amounts expressed in thousands of United States dollars, except per share amounts) |
| Option | Option | Exploration | Advance Royalty | Net Smelter | Number of | |||||||||||||||||||
| Payments | Payments | Commitments (1) | Payments | Reduction | Shares | |||||||||||||||||||
| (CAD$000s) | (US$000s) | (CAD$000s) | (CAD$000s) | (US$000s) | ||||||||||||||||||||
| New Polaris (Note 7(a)(i)): | ||||||||||||||||||||||||
| Net profit interest reduction | 150,000 | |||||||||||||||||||||||
| or buydown | ||||||||||||||||||||||||
| Tay-LP (Note 7(a)(ii)): | ||||||||||||||||||||||||
| October 31, 2012 | $ | 25 | $ | 215 | ||||||||||||||||||||
| October 31, 2013 | 850 | 600 | ||||||||||||||||||||||
| Annual advance royalty payments | ||||||||||||||||||||||||
| until commercial production | $ | 25 | ||||||||||||||||||||||
| Net smelter reduction from 3% to 1.5% | $ | 1,950 | ||||||||||||||||||||||
| Windfall Hills (Note 7(a)(iii)): | ||||||||||||||||||||||||
| Atna properties: | ||||||||||||||||||||||||
| April 12, 2012 | $ | 100 | ||||||||||||||||||||||
| April 12, 2013 | 150 | |||||||||||||||||||||||
| April 12, 2014 | 200 | |||||||||||||||||||||||
| April 12, 2015 | 250 | |||||||||||||||||||||||
| Dunn properties: | ||||||||||||||||||||||||
| April 20, 2012 | 25 | |||||||||||||||||||||||
| April 20, 2013 | 35 | |||||||||||||||||||||||
| April 20, 2014 | 50 | |||||||||||||||||||||||
| April 20, 2015 | 125 | |||||||||||||||||||||||
| $ | 1,110 | $ | 700 | $ | 815 | $ | 25 | $ | 1,950 | 150,000 | ||||||||||||||
| (1) | Exploration commitments for the Tay-LP property are adjusted for management fees of 5% and 10% and exploration expenditures incurred by Cap-Ex. |
CANARC RESOURCE CORP. Notes to the Consolidated Financial Statements Years ended December 31, 2011 and 2010 (tabular dollar amounts expressed in thousands of United States dollars, except per share amounts) |
CANARC RESOURCE CORP. Notes to the Consolidated Financial Statements Years ended December 31, 2011 and 2010 (tabular dollar amounts expressed in thousands of United States dollars, except per share amounts) |
| Accumulated | Net Book | |||||||||||
| Cost | Amortization | Value | ||||||||||
| Balance, January 1, 2010 | $ | 140 | $ | 138 | $ | 2 | ||||||
| Additions | 10 | - | 10 | |||||||||
| Dispositions | (140 | ) | (138 | ) | (2 | ) | ||||||
| Balance, December 31, 2010 | 10 | - | 10 | |||||||||
| Additions | - | 3 | (3 | ) | ||||||||
| Balance, December 31, 2011 | $ | 10 | $ | 3 | $ | 7 | ||||||
| Balance, January 1, 2010 | $ | 63 | ||
| Add: | ||||
| Accrued interest during the year | 7 | |||
| Loan bonus | 7 | |||
| Currency translation adjustment | 4 | |||
| Balance, December 31, 2010 | 81 | |||
| Add: Accrued interest during the year | 9 | |||
| Less: Currency translation adjustment | (2 | ) | ||
| Balance, December 31, 2011 | $ | 88 | ||
CANARC RESOURCE CORP. Notes to the Consolidated Financial Statements Years ended December 31, 2011 and 2010 (tabular dollar amounts expressed in thousands of United States dollars, except per share amounts) |
| Balance, January 1, 2010 | $ | 193 | ||
| Add: Unrealized gain from derivative warrants | 913 | |||
| Less: Fair value from the exercise of derivative warrants | (24 | ) | ||
| Balance, December 31, 2010 | 1,082 | |||
| Less: Elimination of derivative liability for warrants due to change in functional currency | (1,082 | ) | ||
| Balance, December 31, 2011 | $ | - | ||
CANARC RESOURCE CORP. Notes to the Consolidated Financial Statements Years ended December 31, 2011 and 2010 (tabular dollar amounts expressed in thousands of United States dollars, except per share amounts) |
| (i) | In February 2011, the Company issued a convertible debenture for CAD$300,000 to Effisolar for the interest-free loan from Effisolar, which was then converted into 1,282,051 common shares of the Company on March 2, 2011. Note 7(c) provides further details. |
| (ii) | In February 2010, the Company renounced CAD$475,200 in exploration expenditures from the proceeds of the flow-through private placements in 2009, resulting in the recognition of a deferred income tax recovery of approximately $113,000. |
CANARC RESOURCE CORP. Notes to the Consolidated Financial Statements Years ended December 31, 2011 and 2010 (tabular dollar amounts expressed in thousands of United States dollars, except per share amounts) |
| 2011 | 2010 | |||||||||||||||
| Weighted | Weighted | |||||||||||||||
| average | average | |||||||||||||||
| exercise | exercise | |||||||||||||||
| Number | price | Number | price | |||||||||||||
| of Shares | (CAD$) | of Shares | (CAD$) | |||||||||||||
| Outstanding balance, beginning of year | 9,410,000 | $ | 0.31 | 8,665,000 | $ | 0.38 | ||||||||||
| Granted | 2,220,000 | $ | 0.14 | 2,740,000 | $ | 0.10 | ||||||||||
| Exercised | (299,000 | ) | $ | 0.11 | (20,000 | ) | $ | 0.11 | ||||||||
| Forfeited | (16,000 | ) | $ | 0.10 | (115,000 | ) | $ | 0.23 | ||||||||
| Expired | (1,200,000 | ) | $ | 0.69 | (1,860,000 | ) | $ | 0.32 | ||||||||
| Outstanding balance, end of year | 10,115,000 | $ | 0.24 | 9,410,000 | $ | 0.31 | ||||||||||
| Exercise price range (CAD$) | $ | 0.10 - $0.74 | $ | 0.10 - $0.74 | ||||||||||||
CANARC RESOURCE CORP. Notes to the Consolidated Financial Statements Years ended December 31, 2011 and 2010 (tabular dollar amounts expressed in thousands of United States dollars, except per share amounts) |
| Options Outstanding | Options Exercisable | |||||||||||
| Weighted | Weighted | Weighted | Weighted | |||||||||
| Average | Average | Average | Average | |||||||||
| Exercise | Number | Remaining | Exercise | Number | Remaining | Exercise | ||||||
| Prices | Outstanding at | Contractual Life | Prices | Exercisable at | Contractual Life | Prices | ||||||
| (CAD$) | Dec 31, 2011 | (Number of Years) | (CAD$) | Dec 31, 2011 | (Number of Years) | (CAD$) | ||||||
| $0.74 | 325,000 | 0.07 | $0.74 | 325,000 | 0.07 | $0.74 | ||||||
| $0.54 | 1,065,000 | 0.46 | $0.54 | 1,065,000 | 0.46 | $0.54 | ||||||
| $0.46 | 750,000 | 0.74 | $0.46 | 750,000 | 0.74 | $0.46 | ||||||
| $0.29 | 1,730,000 | 1.37 | $0.29 | 1,730,000 | 1.37 | $0.29 | ||||||
| $0.11 | 1,540,000 | 2.54 | $0.11 | 1,540,000 | 2.54 | $0.11 | ||||||
| $0.10 | 2,520,000 | 3.69 | $0.10 | 1,448,000 | 3.69 | $0.10 | ||||||
| $0.135 | 2,185,000 | 4.51 | $0.135 | 409,000 | 4.51 | $0.135 | ||||||
| 10,115,000 | 2.62 | $0.24 | 7,267,000 | 2.00 | $0.28 |
| 2011 | 2010 | |||||||
| Directors and officers | $ | 225 | $ | 133 | ||||
| Employees | 16 | 10 | ||||||
| $ | 241 | $ | 143 | |||||
CANARC RESOURCE CORP. Notes to the Consolidated Financial Statements Years ended December 31, 2011 and 2010 (tabular dollar amounts expressed in thousands of United States dollars, except per share amounts) |
| 2011 | 2010 | |||||||
| Number of stock options granted | 2,220,000 | 2,740,000 | ||||||
| Fair value of stock options granted (CAD$) | $ | 0.11 | $ | 0.08 | ||||
| Market price of shares on grant date (CAD$) | $ | 0.14 | $ | 0.10 | ||||
| Pre-vest forfeiture rate | 1.43 | % | 0.73 | % | ||||
| Risk-free interest rate | 2.22 | % | 2.16 | % | ||||
| Expected dividend yield | 0 | % | 0 | % | ||||
| Expected stock price volatility | 108 | % | 105 | % | ||||
| Expected option life in years | 4.86 | 4.87 | ||||||
| Exercise | |||||||||||||||||||||
| Prices | Oustanding at | Oustanding at | |||||||||||||||||||
| (CAD$) | Expiry Dates | December 31, 2010 | Issued | Exercised | Expired | December 31, 2011 | |||||||||||||||
| $0.15 | April 22, 2011 | 39,410 | - | (31,675 | ) | (7,735 | ) | - | |||||||||||||
| $0.15 | October 22, 2011 | 202,160 | - | - | (202,160 | ) | - | ||||||||||||||
| $0.15 | April 22, 2011 | 2,319,140 | - | (1,185,975 | ) | (1,133,165 | ) | - | |||||||||||||
| $0.165 | May 9, 2011 | 128,410 | - | (96,000 | ) | (32,410 | ) | - | |||||||||||||
| $0.22 | June 13, 2012 | 4,250,000 | - | - | - | 4,250,000 | |||||||||||||||
| 6,939,120 | - | (1,313,650 | ) | (1,375,470 | ) | 4,250,000 | |||||||||||||||
CANARC RESOURCE CORP. Notes to the Consolidated Financial Statements Years ended December 31, 2011 and 2010 (tabular dollar amounts expressed in thousands of United States dollars, except per share amounts) |
| Exercise | |||||||||||||||||||||
| Prices | Oustanding at | Oustanding at | |||||||||||||||||||
| (CAD$) | Expiry Dates | December 31, 2009 | Issued | Exercised | Expired | December 31, 2010 | |||||||||||||||
| $0.15 | June 1, 2010 | 500,000 | - | - | (500,000 | ) | - | ||||||||||||||
| $0.15 | April 22, 2011 | 39,410 | - | - | - | 39,410 | |||||||||||||||
| $0.15 | October 22, 2011 | 202,160 | - | - | - | 202,160 | |||||||||||||||
| $0.15 | April 22, 2011 | 2,568,140 | - | (249,000 | ) | - | 2,319,140 | ||||||||||||||
| $0.165 | May 9, 2011 | 154,410 | - | (26,000 | ) | - | 128,410 | ||||||||||||||
| $0.220 | June 13, 2012 | - | 4,250,000 | - | - | 4,250,000 | |||||||||||||||
| 3,464,120 | 4,250,000 | (275,000 | ) | (500,000 | ) | 6,939,120 | |||||||||||||||
| Number of Shares | ||||
| Stock options (Note 13(c)) | 10,115,000 | |||
| Warrants (Note 13(d)) | 4,250,000 | |||
| Balance, December 31, 2011 | 14,365,000 | |||
CANARC RESOURCE CORP. Notes to the Consolidated Financial Statements Years ended December 31, 2011 and 2010 (tabular dollar amounts expressed in thousands of United States dollars, except per share amounts) |
| Years ended December 31, | ||||||||
| 2011 | 2010 | |||||||
| General and Administrative: | ||||||||
| Accounting and audit | $ | 71 | $ | 69 | ||||
| Legal | 80 | 62 | ||||||
| Office and sundry | 93 | 121 | ||||||
| Regulatory | 52 | 56 | ||||||
| $ | 296 | $ | 308 | |||||
| Net balance receivable (payable) | ||||||||||||||||
| Years ended December 31, | as at December 31, | |||||||||||||||
| 2011 | 2010 | 2011 | 2010 | |||||||||||||
| Key management compensation: | ||||||||||||||||
| Executive salaries and remuneration | $ | 473 | $ | 291 | $ | (14 | ) | $ | - | |||||||
| Directors fees | 40 | 39 | (146 | ) | (109 | ) | ||||||||||
| Share-based payments | 212 | 116 | - | - | ||||||||||||
| $ | 725 | $ | 446 | $ | (160 | ) | $ | (109 | ) | |||||||
| Legal fees incurred to a law firm in which a senior officer of the Company is a partner | $ | 72 | $ | 71 | $ | 83 | $ | 62 | ||||||||
| Net office, sundry, rent and salary allocations recovered from (incurred to) company(s) sharing certain common director(s) | $ | 55 | $ | 88 | $ | 16 | $ | (4 | ) | |||||||
CANARC RESOURCE CORP. Notes to the Consolidated Financial Statements Years ended December 31, 2011 and 2010 (tabular dollar amounts expressed in thousands |
| 2011 | 2010 | |||||||||||||||||||||||
| Canada | U.S.A. | Total | Canada | U.S.A. | Total | |||||||||||||||||||
| Mineral property interests | $ | 12,910 | $ | - | $ | 12,910 | $ | 12,724 | $ | - | $ | 12,724 | ||||||||||||
| Deposit on asset acquisition | - | - | - | - | 300 | 300 | ||||||||||||||||||
| Equipment | 7 | - | 7 | 10 | - | 10 | ||||||||||||||||||
| Total assets | 13,239 | - | 13,239 | 13,600 | 300 | 13,900 | ||||||||||||||||||
| (a) | A reconciliation of income tax provision computed at Canadian statutory rates to the reported income tax provision is provided as follows: |
| 2011 | 2010 | |||||||
| Loss for the year | $ | (1,210 | ) | $ | (1,489 | ) | ||
| Canadian statutory tax rate | 26.5 | % | 28.5 | % | ||||
| Income tax benefit computed at statutory rates | $ | (321 | ) | $ | (424 | ) | ||
| Temporary differences | 17 | (74 | ) | |||||
| Items non-deductible for income tax purposes | 70 | 238 | ||||||
| Benefits of tax attributes and other items | 14 | 398 | ||||||
| Unused tax losses and tax offsets not recognized in tax asset | 206 | 26 | ||||||
| Effect of change in tax rate | 13 | 37 | ||||||
| Effect of foreign exchange | - | (294 | ) | |||||
| Deferred income tax recovery | $ | (1 | ) | $ | (93 | ) | ||
CANARC RESOURCE CORP. Notes to the Consolidated Financial Statements Years ended December 31, 2011 and 2010 (tabular dollar amounts expressed in thousands |
| (b) | The tax effected items that give rise to significant portions of the deferred income tax assets and deferred income liabilities at December 31, 2011, December 31, 2010 and January 1, 2010 are presented below: |
| December 31, | December 31, | January 1, | ||||||||||
| 2011 | 2010 | 2010 | ||||||||||
| Deferred tax assets | ||||||||||||
| Capital losses carried forward | $ | 7 | $ | - | $ | - | ||||||
| Tax value over book value of equipment | 101 | 102 | - | |||||||||
| Deferred tax assets | 108 | 102 | - | |||||||||
| Deferred tax liabilities | ||||||||||||
| Book value over tax value of marketable securities | (7 | ) | - | - | ||||||||
| Book value over tax value of mineral properties | (101 | ) | (102 | ) | - | |||||||
| Deferred tax liabilities | (108 | ) | (102 | ) | ||||||||
| Net deferred tax assets | $ | - | $ | - | $ | - | ||||||
| (c) | The Company recognizes tax benefits on losses or other deductible amounts where the probable criteria for the recognition of deferred tax assets have been met. The Company’s unrecognized deductible temporary differences and unused tax losses for which no deferred tax asset is recognized consist of the following amounts: |
| December 31, | December 31, | January 1, | ||||||||||
| 2011 | 2010 | 2010 | ||||||||||
| Non-capital losses | $ | 7,455 | $ | 6,746 | $ | 6,512 | ||||||
| Capital losses | 20 | 49 | 46 | |||||||||
| Share issue costs | 70 | 99 | 213 | |||||||||
| Tax value over book value of mineral properties | 716 | 732 | 480 | |||||||||
| Tax value over book value of equipment | 1,226 | 1,256 | 1,526 | |||||||||
| Unrecognized deductible temporary differences | $ | 9,487 | $ | 8,882 | $ | 8,777 | ||||||
CANARC RESOURCE CORP. Notes to the Consolidated Financial Statements Years ended December 31, 2011 and 2010 (tabular dollar amounts expressed in thousands |
| 2014 | $ | 705 | ||
| 2015 | 86 | |||
| 2026 | 766 | |||
| 2027 | 1,690 | |||
| 2028 | 774 | |||
| 2029 | 1,645 | |||
| 2030 | 932 | |||
| 2031 | 857 | |||
| $ | 7,455 | |||
CANARC RESOURCE CORP. Notes to the Consolidated Financial Statements Years ended December 31, 2011 and 2010 (tabular dollar amounts expressed in thousands |
CANARC RESOURCE CORP. Notes to the Consolidated Financial Statements Years ended December 31, 2011 and 2010 (tabular dollar amounts expressed in thousands of United States dollars, except per share amounts) |
| (i) | Warrants: |
| (ii) | Share-based payments: |
| (iii) | Income tax: |
CANARC RESOURCE CORP. Notes to the Consolidated Financial Statements Years ended December 31, 2011 and 2010 (tabular dollar amounts expressed in thousands of United States dollars, except per share amounts) |
| (c) | Reconciliation from Canadian GAAP to IFRS: |
CANARC RESOURCE CORP. Notes to the Consolidated Financial Statements Years ended December 31, 2011 and 2010 (tabular dollar amounts expressed in thousands of United States dollars, except per share amounts) |
| (c) | Reconciliation from Canadian GAAP to IFRS: (continued) |
| (i) | The January 1, 2010 Canadian GAAP consolidated statement of financial position has been reconciled to IFRS as follows: |
| January 1, 2010 | ||||||||||||||||
| Notes | Canadian GAAP | Effect of Transition to IFRS | IFRS | |||||||||||||
| ASSETS | ||||||||||||||||
| CURRENT ASSETS | ||||||||||||||||
| Cash | $ | 155 | $ | — | $ | 155 | ||||||||||
| Receivables and prepaids | 193 | 193 | ||||||||||||||
| Royalty receivable - current portion | 50 | 50 | ||||||||||||||
| Total Current Assets | 398 | — | 398 | |||||||||||||
| NON-CURRENT ASSETS | ||||||||||||||||
| Mineral properties | 12,626 | 12,626 | ||||||||||||||
| Equipment | 2 | 2 | ||||||||||||||
| Royalty receivable - long-term portion | 46 | 46 | ||||||||||||||
| Long-term investments | 143 | 143 | ||||||||||||||
| Total Non-Current Assets | 12,817 | — | 12,817 | |||||||||||||
| Total Assets | $ | 13,215 | $ | — | $ | 13,215 | ||||||||||
| LIABILITIES AND SHAREHOLDERS' EQUITY CURRENT LIABILITIES | ||||||||||||||||
| Accounts payable and accrued liabilities | $ | 607 | $ | — | $ | 607 | ||||||||||
| Notes payable | 63 | 63 | ||||||||||||||
| Flow-through obligation | 377 | 377 | ||||||||||||||
| Derivative liability for warrants | 18(b)(i) | — | 193 | 193 | ||||||||||||
| Total Current Liabilities | 1,047 | 193 | 1,240 | |||||||||||||
| SHAREHOLDERS' EQUITY | ||||||||||||||||
| Share capital | 56,436 | 56,436 | ||||||||||||||
| Contributed surplus | 18(b(ii) | 2,354 | (2,354 | ) | — | |||||||||||
| Reserve for share-based payments | 18(b(ii) | — | 1,316 | 1,316 | ||||||||||||
| Deficit | 18(b(i and (ii) | (46,622 | ) | 845 | (45,777 | ) | ||||||||||
| Total Shareholders' Equity | 12,168 | (193 | ) | 11,975 | ||||||||||||
| Total Liabilities and Shareholders' Equity | $ | 13,215 | $ | — | $ | 13,215 | ||||||||||
| (c) | Reconciliation from Canadian GAAP to IFRS: (continued) |
CANARC RESOURCE CORP. Notes to the Consolidated Financial Statements Years ended December 31, 2011 and 2010 (tabular dollar amounts expressed in thousands of United States dollars, except per share amounts) |
| (ii) | The December 31, 2010 Canadian GAAP consolidated statement of financial position has been reconciled to IFRS as follows: |
| December 31, 2010 | ||||||||||||||||
| Canadian | Effect of Transition | |||||||||||||||
| Notes | GAAP | to IFRS | IFRS | |||||||||||||
| ASSETS | ||||||||||||||||
| CURRENT ASSETS | ||||||||||||||||
| Cash | $ | 592 | $ | - | $ | 592 | ||||||||||
| Receivables and prepaids | 105 | 105 | ||||||||||||||
| Marketable securities | 25 | 25 | ||||||||||||||
| Royalty receivable - current portion | 50 | 50 | ||||||||||||||
| Total Current Assets | 772 | - | 772 | |||||||||||||
| NON-CURRENT ASSETS | ||||||||||||||||
| Mineral properties | 12,724 | 12,724 | ||||||||||||||
| Deposit on asset acquisition | 300 | 300 | ||||||||||||||
| Equipment | 10 | 10 | ||||||||||||||
| Royalty receivable - long-term portion | - | - | ||||||||||||||
| Long-term investments | 94 | 94 | ||||||||||||||
| Total Non-Current Assets | 13,128 | - | 13,128 | |||||||||||||
| Total Assets | $ | 13,900 | $ | - | $ | 13,900 | ||||||||||
LIABILITIES AND SHAREHOLDERS' EQUITY CURRENT LIABILITIES | ||||||||||||||||
| Accounts payable and accrued liabilities | $ | 532 | $ | - | $ | 532 | ||||||||||
| Notes payable | 81 | 81 | ||||||||||||||
| Flow-through obligation | 226 | 226 | ||||||||||||||
| Derivative liability for warrants | 18(b)(i) | - | 1,082 | 1,082 | ||||||||||||
| Total Current Liabilities | 839 | 1,082 | 1,921 | |||||||||||||
| Future income tax liability | 18(b)(iii) | 120 | (120 | ) | - | |||||||||||
| Total Liabilities | 959 | 962 | 1,921 | |||||||||||||
| SHAREHOLDERS' EQUITY | ||||||||||||||||
| Share capital | 18(b) | 57,660 | 25 | 57,685 | ||||||||||||
| Contributed surplus | 18(b)(ii) | 2,483 | (2,483 | ) | - | |||||||||||
| Accumulated other comprehensive income | 10 | 10 | ||||||||||||||
| Reserve for share-based payments | 18(b)(ii) | - | 1,259 | 1,259 | ||||||||||||
| Deficit | 18(b) | (47,212 | ) | 237 | (46,975 | ) | ||||||||||
| Total Shareholders' Equity | 12,941 | (962 | ) | 11,979 | ||||||||||||
| Total Liabilities and Shareholders' Equity | $ | 13,900 | $ | - | $ | 13,900 | ||||||||||
| (c) | Reconciliation from Canadian GAAP to IFRS: (continued) |
CANARC RESOURCE CORP. Notes to the Consolidated Financial Statements Years ended December 31, 2011 and 2010 (tabular dollar amounts expressed in thousands of United States dollars, except per share amounts) |
| (iii) | The Canadian GAAP consolidated statement of comprehensive loss for the year ended December 31, 2010 has been reconciled to IFRS as follows: |
| December 31, 2010 | ||||||||||||||||
| Notes | Canadian GAAP | Effect of Transition to IFRS | IFRS | |||||||||||||
| Expenses: | ||||||||||||||||
| Amortization | $ | 1 | $ | — | $ | 1 | ||||||||||
| Corporate development | 12 | 12 | ||||||||||||||
| Employee and director remuneration | 383 | 383 | ||||||||||||||
| Foreign exchange loss | 43 | 43 | ||||||||||||||
| General and administrative | 308 | 308 | ||||||||||||||
| Shareholder relations | 62 | 62 | ||||||||||||||
| Share-based payments | 18(b(ii) | 130 | 13 | 143 | ||||||||||||
| Loss before the undernoted | (939 | ) | (13 | ) | (952 | ) | ||||||||||
| Gain on disposition of long-term investment | 257 | 257 | ||||||||||||||
| Accretion of royalty receivable | 4 | 4 | ||||||||||||||
| Write-off of equipment | (1 | ) | (1 | ) | ||||||||||||
| Unrealized loss from derivative liability for warrants | 18(b(i) | — | (913 | ) | (913 | ) | ||||||||||
| Due diligence costs on asset acquisition | (20 | ) | (20 | ) | ||||||||||||
| Interest expense | (14 | ) | (14 | ) | ||||||||||||
| Flow-through financing costs | 150 | 150 | ||||||||||||||
| Loss before income tax | (563 | ) | (926 | ) | (1,489 | ) | ||||||||||
| Future income tax expense | 18(b(iii) | (27 | ) | 120 | 93 | |||||||||||
| Net loss for the year | (590 | ) | (806 | ) | (1,396 | ) | ||||||||||
| Other comprehensive (loss) income: | ||||||||||||||||
| Unrealized gain on available-for-sale securities | 10 | 10 | ||||||||||||||
| Comprehensive loss for the year | $ | (580 | ) | $ | (806 | ) | $ | (1,386 | ) | |||||||
| Basic and diluted loss per share | $ | (0.01 | ) | $ | (0.02 | ) | ||||||||||
| Weighted average number of common shares outstanding | 82,446,825 | 82,446,825 | ||||||||||||||
| 1. | The Annual Report on Form 20-F of Canarc Resource Corp. for the year ended December 31, 2011 (the "Report") fully complies with the requirements of Section 13(a) or 15(d) of the Securities Exchange Act of 1934 (15 U.S.C. 78m(a) or 78o(d)); and |
| 2. | The information contained in the Report fairly presents, in all material respects, the financial condition and results of operations of Canarc. |
| /s/ Bradford Cooke | |
Vancouver, Canada May 14, 2012 | Bradford Cooke Chairman and Chief Executive Officer |
| 1. | The Annual Report on Form 20-F of Canarc Resource Corp. for the year ended December 31, 2011 (the "Report") fully complies with the requirements of Section 13(a) or 15(d) of the Securities Exchange Act of 1934 (15 U.S.C. 78m(a) or 78o(d)); and |
| 2. | The information contained in the Report fairly presents, in all material respects, the financial condition and results of operations of Canarc. |
| by: | /s/ Philip Yee | |
Vancouver, Canada May 14, 2012 | Philip Yee Chief Financial Officer |