UNITED STATES
SECURITIES AND EXCHANGE COMMISSION
Washington, D.C. 20549
FORM N-CSR
CERTIFIED SHAREHOLDER REPORT OF REGISTERED
MANAGEMENT INVESTMENT COMPANIES
Investment Company Act file number 811-08657
Pioneer Equity Income Fund
(Exact name of registrant as specified in charter)
60 State Street, Boston, MA 02109
(Address of principal executive offices) (ZIP code)
Christopher J. Kelley, Amundi Asset Management, Inc.,
60 State Street, Boston, MA 02109
(Name and address of agent for service)
Registrant’s telephone number, including area code: (617) 742-7825
Date of fiscal year end: October 31, 2023
Date of reporting period: November 1, 2022 through April 30, 2023
Form N-CSR is to be used by management investment companies to file reports with the Commission not later than 10 days after the transmission to stockholders of any report that is required to be transmitted to stockholders under Rule 30e-1 under the Investment Company Act of 1940 (17 CFR 270.30e-1). The Commission may use the information provided on Form N-CSR in its regulatory, disclosure review, inspection, and policymaking roles.
A registrant is required to disclose the information specified by Form N-CSR, and the Commission will make this information public. A registrant is not required to respond to the collection of information contained in Form N-CSR unless the Form displays a currently valid Office of Management and Budget (“OMB”) control number. Please direct comments concerning the accuracy of the information collection burden estimate and any suggestions for reducing the burden to Secretary, Securities and Exchange Commission, 450 Fifth Street, NW, Washington, DC 20549-0609. The OMB has reviewed this collection of information under the clearance requirements of 44 U.S.C. ss. 3507.
ITEM 1. REPORTS TO STOCKHOLDERS.
Pioneer Equity Income Fund
Semiannual Report | April 30, 2023
| | | | | |
| A: PEQIX | C: PCEQX | K: PEQKX | R: PQIRX | Y: PYEQX |
visit us: www.amundi.com/us
Pioneer Equity Income Fund | Semiannual Report | 4/30/231
President’s Letter
Dear Shareholders,
On February 13, 2023, Amundi US celebrated the 95th anniversary of Pioneer Fund, the second-oldest mutual fund in the United States. We recognized the anniversary with ringing of the closing bell at the New York Stock Exchange, which seemed fitting for this special milestone.
Pioneer Fund was launched on February 13, 1928 by Phil Carret, one of the earliest proponents of value investing and a leading innovator in the asset management industry. Mr. Carret began investing in the 1920s and founded Pioneer Investments (now Amundi US) in 1928, and was one of the first investors to realize he could uncover value through rigorous, innovative, fundamental research techniques.
Consistent with Mr. Carret’s investment approach and employing many of the same techniques utilized in the 1920s, Amundi US's portfolio managers have adapted Mr. Carret’s philosophy to a new age of “active” investing.
The last few years have seen investors face some unprecedented challenges, from a global pandemic that shuttered much of the world’s economy for months, to geopolitical strife, to rising inflation that has reached levels not seen in decades. Now, more than ever, Amundi US believes active management – that is, making active investment decisions across all of our portfolios – can help mitigate risk during periods of market volatility.
At Amundi US, active management begins with our own fundamental, bottom-up research process. Our team of dedicated research analysts and portfolio managers analyzes each security under consideration, communicating frequently with the management teams of the companies and other entities issuing the securities, and working together to identify those securities that we believe best meet our investment criteria for our family of funds. Our risk management approach begins with each security under consideration, as we strive to develop a deep understanding of the potential opportunity, while considering any potential risk factors.
Today, as shareholders, we have many options. It is our view that active management can serve shareholders well, not only when markets are thriving, but also during periods of market stress. As you consider your long-term investment goals, we encourage you to work with your financial professional to develop an investment plan that paves the way for you to pursue both your short-term and long-term goals.
2Pioneer Equity Income Fund | Semiannual Report | 4/30/23
We greatly appreciate the trust you have placed in us and look forward to continuing to serve you in the future.
Lisa M. Jones
Head of the Americas, President and CEO of US
Amundi Asset Management US, Inc.
June 2023
Any information in this shareowner report regarding market or economic trends or the factors influencing the Fund’s historical or future performance are statements of opinion as of the date of this report. Past performance is no guarantee of future results.
Pioneer Equity Income Fund | Semiannual Report | 4/30/233
Portfolio Management Discussion | 4/30/23
In the following interview, Sammi Truong and John A. Carey* discuss the market environment for equities and the factors that affected the performance of Pioneer Equity Income Fund during the six-month period ended April 30, 2023. Mr. Carey, Managing Director, Director of Equity Income, US, and a portfolio manager at Amundi Asset Management US, Inc. (Amundi US), is responsible for the day-to-day management of the Fund’s portfolio, along with Ms. Truong, a vice president and a portfolio manager at Amundi US.
| Q | How did the Fund perform over the six-month period ended April 30, 2023? |
| A | Pioneer Equity Income Fund’s Class A shares returned 4.09% at net asset value during the six-month period ended April 30, 2023, while the Fund’s benchmark, the Russell 1000 Value Index, returned 4.54%. During the same period, the average return of the 1,233 mutual funds in Morningstar’s Large Value Funds category was 3.89%. |
| Q | How would you describe the market environment for US equities during the six-month period ended April 30, 2023? |
| A | Following a difficult prior 12-month period, the US stock market experienced a bounce during the past six months, generating a total return of 8.63%, as measured by the Standard and Poor’s 500 Index (the S&P 500). However, the advances in the equity market did not occur without investors having to climb a “wall of worry.” The corporate earnings of companies within the S& P 500 contracted, in general, and fears of a recession mounted as the Federal Reserve (Fed) continued with its fastest pace of interest-rate increases since the 1980s in an effort to combat inflation, which has remained well above the Fed’s target rate. Financial stress also emerged during the period, as depositors seeking better interest rates moved their deposits to higher-yielding accounts, exposing the risks of mismatches in assets and liabilities within the banking system. Silicon Valley Bank, Signature Bank, and then First Republic Bank failed during the period, despite efforts by regulators to shore up confidence. |
*Note to shareholders: John A. Carey will retire from portfolio management effective in May 2024. He remains a member of the Fund's current portfolio management team. In addition, effective May 24, 2023, John Arege, a vice president and portfolio manager at Amundi US, became a portfolio manager of the Fund.
4Pioneer Equity Income Fund | Semiannual Report | 4/30/23
On anticipation that the Fed could be close to reaching the end of its monetary tightening cycle, growth stocks, as measured by the Russell 1000 Growth Index, rallied and gained 11.51% for the period, aided by the resurgence in mega-cap technology stocks. The Fund’s benchmark, the Russell 1000 Value Index (the Russell Index), which has more exposure to cyclical sectors of the economy, trailed growth stocks and the overall market due to investors’ uneasiness about an economic slowdown, and returned 4.54% during the six-month period.
| Q | Could you please discuss the main factors affecting the Fund’s benchmark-relative performance during the six-month period ended April 30, 2023, and any investments or strategies significantly helping or hurting benchmark-relative returns? |
| A | Sector allocation results contributed positively to the Fund’s benchmark-relative return for the six-month period, driven by the portfolio’s underweight exposures to the poor-performing financials and energy sectors. Partially offsetting the positive allocation results was the portfolio’s underweight versus the Russell Index to the strong-performing communication services sector. The main detractor from the Fund’s relative performance within the communication services sector was not holding shares of Meta Platforms, which, as a non-dividend* payer, does not fit our investment criteria. |
| | With regard to stock selection, the Fund’s positions in Lincoln National, Raymond James Financial, and Charles Schwab, all in the financials sector, were negative performance attributors versus the benchmark for the six-month period. The financials sector faced deposit outflows, increased funding costs, and the need to shore up capital, particularly in the wake of the bank failures mentioned previously. We have eliminated the portfolio’s holdings of Lincoln National and Schwab, as we saw diminished prospect for growth, and retained the position in Raymond James. Another detractor from the Fund’s benchmark-relative returns was Alexandria Real Estate, a life-science real estate company that saw its share price decrease during the period due to increased interest rates, and because a pullback in funding for |
| * | Dividends are not guaranteed. |
Pioneer Equity Income Fund | Semiannual Report | 4/30/235
| | biotech companies has led investors to forecast reduced demand for Alexandria’s lab spaces. |
| | On the positive side, the Fund’s positions in Novo Nordisk, Reliance Steel & Aluminum, Materion, Sun Life Financial, and Borg Warner aided benchmark-relative performance for the six-month period. Novo Nordisk, in the health care sector, has been displaying better-than-expected growth in its diabetic and weight-loss drugs. In the materials sector, Reliance Steel & Aluminum and Materion saw strong demand for their products during the period. Sun Life Financial, in financials, which offers insurance and wealth-and-asset-management products, proved to be more resilient, due to the company’s strong balance sheet. Finally, BorgWarner, in the consumer discretionary sector, has demonstrated progress in its pivot towards providing automotive components for electric vehicles. |
| Q | Could you highlight some of the more notable changes you made to the Fund’s portfolio during the six-month period ended April 30, 2023? |
| A | During the six-month period, we added 22 positions to the portfolio and eliminated 19, with some of the more notable buys and sells discussed below. |
| | Within the financials sector, we added Truist Financial and Regions Financial, which we believe have attractive geographic footprints, and CME, in order to gain exposure to the exchange market, which we think could benefit from heightened market volatility. We sold the Fund’s shares of Chubb, and, as previously mentioned, stepped aside from positions in Lincoln National and Charles Schwab, as well as a position in M&T Bank. Those moves resulted in the Fund’s having a larger benchmark-relative underweight to financials stocks. |
| | We also exited ConocoPhillips in favor of a position in Shell, an integrated energy company, as we saw better value and development opportunities for the latter. In addition, we initiated positions in Coterra Energy and EQT, both of which have been trading at discounts after a warmer-than-expected winter, but we also see long-term prospects for potential growth in natural gas demand, driven by Europe, as the region looks for alternative |
6Pioneer Equity Income Fund | Semiannual Report | 4/30/23
| | sources to Russian gas. The trades, in aggregate, reduced the portfolio’s underweight to energy versus the Russell Index. |
| | During the period, we increased the Fund’s weighting in the health care sector with the additions of Bruker, Thermo Fisher Scientific, and Merck, partially offset by the elimination of positions in Abbott Laboratories and Organon. We view the medical tools space as attractive over the longer term, and see potential growth prospects for Bruker and Thermo Fisher Scientific with their analytical instrument offerings. With regard to Merck, we see potential opportunities for the company to deliver on its pipeline. We eliminated the Fund’s shares of Abbott Laboratories during the period as the benefits the company derived from COVID-19 testing waned. We eliminated the portfolio’s Organon position, as we became more concerned with the company’s debt burden in the higher interest-rate environment. |
| | In the communication services sector, we traded out of AT&T and Verizon, on increased competition for consumer wireless subscriptions, and added Comcast, as we like the company’s quality assets of theme parks and its broadband business. We also believe the market has overly discounted the competition Comcast faces from fixed-wireless solutions. |
| Q | Did the Fund have any derivatives exposure during the six-month period ended April 30, 2023? |
| A | No, the Fund held no derivatives during the period. |
| Q | What is your outlook for equities heading into the second half of the Fund’s fiscal year? |
| A | Most economic indicators have continued to point to slower growth over the next several quarters. The Fed’s interest-rate increases over the past year are just starting to affect the real economy, and while inflation has probably peaked —and could decline from here, in our view — profit-margin contraction could continue to hurt corporate earnings. |
| | We believe the recent dislocations in the regional banking sector may cause further stress to financial conditions over the coming months as banks tighten their lending standards to preserve |
Pioneer Equity Income Fund | Semiannual Report | 4/30/237
| | liquidity. As a result, the Fed could reduce the scale of further interest-rate increases. However, we think the market’s hopes of rate cuts later in the year may prove to be premature, as persistent labor-market strength could lead the Fed to keep interest rates at an elevated level for an extended period in order to prevent inflation from rebounding. If the Fed does reduce interest rates, we feel it would be the result of greater-than-expected economic weakness, which would likely be detrimental to corporate earnings. The stock market tends to react negatively in such an environment. |
| | A mild recession, in our view, is more likely than a “soft landing” for the economy. In either scenario, earnings estimates could very well decline as companies take a more cautious approach to 2023, given economic uncertainty. In mid-2023, if the market adequately discounts a potential recession, we anticipate becoming more constructive. While expectations are for volatility in 2023 to remain high, the market may look forward to an earnings recovery in 2024 and end the year higher than where it began. |
| | The Fund currently has benchmark-relative overweight allocations to the cyclical sectors – or sectors more exposed to the ebbs and flows of the economic cycle – that we anticipate could do well during an economic recovery, including industrials, materials, and consumer discretionary. The portfolio has a large absolute sector weighting to financials, but is underweight to the sector, and to the banking industry, relative to the Russell Index. To balance the Fund’s cyclical positioning, given the uncertain trajectory of the economic recovery, we also have maintained exposures to the more defensive areas of the market, such as the consumer staples, real estate, and health care sectors. |
8Pioneer Equity Income Fund | Semiannual Report | 4/30/23
Please refer to the Schedule of Investments on pages 19-24 for a full listing of Fund securities.
All investments are subject to risk, including the possible loss of principal. In the past several years, financial markets have experienced increased volatility and heightened uncertainty. The market prices of securities may go up or down, sometimes rapidly or unpredictably, due to general market conditions, such as real or perceived adverse economic, political, or regulatory conditions, recessions, inflation, changes in interest or currency rates, lack of liquidity in the bond markets, the spread of infectious illness or other public health issues, armed conflict including Russia's military invasion of Ukraine, sanctions against Russia, other nations or individuals or companies and possible countermeasures, market disruptions caused by tariffs, trade disputes or other government actions, or adverse investor sentiment. These conditions may continue, recur, worsen or spread.
Investing in foreign and/or emerging markets securities involves risks relating to interest rates, currency exchange rates, economic, and political conditions.
The Fund invests in REIT securities, the value of which can fall for a variety of reasons, such as declines in rental income, fluctuating interest rates, poor property management, environmental liabilities, uninsured damage, increased competition, or changes in real estate tax laws.
For more information on this or any Pioneer fund, please visit amundi.com/usinvestors or call 1-800-622-9876. This material must be preceded or accompanied by the Fund's current prospectus or summary prospectus. Before investing, consider the product's investment objectives, risks, charges, and expenses. Read it carefully.
Any information in this shareholder report regarding market or economic trends or the factors influencing the Fund’s historical or future performance are statements of opinion as of the date of this report. Past performance is not a guarantee of future results.
Pioneer Equity Income Fund | Semiannual Report | 4/30/239
Portfolio Summary | 4/30/23
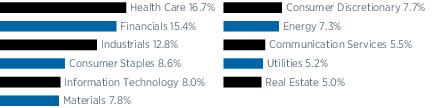
Portfolio Diversification
(As a percentage of total investments)*
10 Largest Holdings
| (As a percentage of total investments)* |
| 1. | Sun Life Financial, Inc. | 2.62% |
| 2. | Exxon Mobil Corp. | 2.21 |
| 3. | Reliance Steel & Aluminum Co. | 2.02 |
| 4. | Chevron Corp. | 1.94 |
| 5. | Materion Corp. | 1.85 |
| 6. | Mondelez International, Inc., Class A | 1.80 |
| 7. | Becton Dickinson & Co. | 1.72 |
| 8. | JPMorgan Chase & Co. | 1.69 |
| 9. | Stryker Corp. | 1.66 |
| 10. | Raytheon Technologies Corp. | 1.62 |
| | |
| * | Excludes short-term investments and all derivative contracts except for options purchased. The Fund is actively managed, and current holdings may be different. The holdings listed should not be considered recommendations to buy or sell any securities. |
10Pioneer Equity Income Fund | Semiannual Report | 4/30/23
Prices and Distributions | 4/30/23
Net Asset Value per Share
| Class | 4/30/23 | 10/31/22 |
| A | $33.51 | $35.99 |
| C | $32.79 | $35.30 |
| K | $33.56 | $36.03 |
| R | $34.42 | $36.85 |
| Y | $34.10 | $36.56 |
| | | |
Distributions per Share: 11/1/22 - 4/30/23
| Class | Net
Investment
Income | Short-Term
Capital Gains | Long-Term
Capital Gains |
| A | $0.4397 | $— | $3.5451 |
| C | $0.3194 | $— | $3.5451 |
| K | $0.4955 | $— | $3.5451 |
| R | $0.3648 | $— | $3.5451 |
| Y | $0.4753 | $— | $3.5451 |
Index Definition
The Russell 1000 Value Index is an unmanaged measure of the performance of large-cap U.S. value stocks. Indices are unmanaged and their returns assume reinvestment of dividends and do not reflect any fees or expenses. It is not possible to invest directly in an index.
The index defined here pertains to the “Value of $10,000 Investment” and “Value of $5 Million Investment” charts on pages 12 - 16.
Pioneer Equity Income Fund | Semiannual Report | 4/30/2311
| Performance Update | 4/30/23 | Class A Shares |
Investment Returns
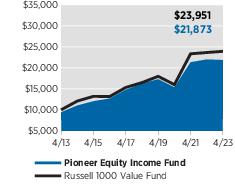
The mountain chart on the right shows the change in value of a $10,000 investment made in Class A shares of Pioneer Equity Income Fund at public offering price during the periods shown, compared to that of the Russell 1000 Value Index.
Average Annual Total Returns
(As of April 30, 2023) |
| Period | Net
Asset
Value
(NAV) | Public
Offering
Price
(POP) | Russell
1000
Value
Index |
| 10 Years | 8.78% | 8.14% | 9.13% |
| 5 Years | 6.06 | 4.81 | 7.75 |
| 1 Year | -0.65 | -6.37 | 1.21 |
Expense Ratio
(Per prospectus dated March 1, 2023) |
| Gross |
| 0.99% |
Value of $10,000 Investment
Call 1-800-225-6292 or visit www.amundi.com/us for the most recent month-end performance results. Current performance may be lower or higher than the performance data quoted.
The performance data quoted represents past performance, which is no guarantee of future results. Investment return and principal value will fluctuate, and shares, when redeemed, may be worth more or less than their original cost.
NAV results represent the percent change in net asset value per share. POP returns reflect deduction of maximum 5.75% sales charge. All results are historical and assume the reinvestment of dividends and capital gains. Other share classes are available for which performance and expenses will differ.
Performance results reflect any applicable expense waivers in effect during the periods shown. Without such waivers Fund performance would be lower. Waivers may not be in effect for all funds. Certain fee waivers are contractual through a specified period. Otherwise, fee waivers can be rescinded at any time. See the prospectus and financial statements for more information.
The performance table and graph do not reflect the deduction of fees and taxes that a shareowner would pay on Fund distributions or the redemption of Fund shares.
Please refer to the financial highlights for a more current expense ratio.
12Pioneer Equity Income Fund | Semiannual Report | 4/30/23
| Performance Update | 4/30/23 | Class C Shares |
Investment Returns
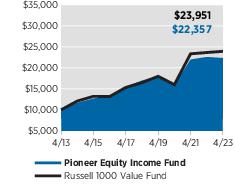
The mountain chart on the right shows the change in value of a $10,000 investment made in Class C shares of Pioneer Equity Income Fund during the periods shown, compared to that of the Russell 1000 Value Index.
Average Annual Total Returns
(As of April 30, 2023) |
| Period | If
Held | If
Redeemed | Russell
1000
Value
Index |
| 10 Years | 7.99% | 7.99% | 9.13% |
| 5 Years | 5.28 | 5.28 | 7.75 |
| 1 Year | -1.40 | -2.28 | 1.21 |
Expense Ratio
(Per prospectus dated March 1, 2023) |
| Gross |
| 1.73% |
Value of $10,000 Investment
Call 1-800-225-6292 or visit www.amundi.com/us for the most recent month-end performance results. Current performance may be lower or higher than the performance data quoted.
The performance data quoted represents past performance, which is no guarantee of future results. Investment return and principal value will fluctuate, and shares, when redeemed, may be worth more or less than their original cost.
Class C shares held for less than one year are also subject to a 1% contingent deferred sales charge (CDSC). “If Held” results represent the percent change in net asset value per share. “If Redeemed” returns reflect deduction of the CDSC for the one-year period, assuming a complete redemption of shares at the last price calculated on the last business day of the period, and no CDSC for the five- and 10-year periods. All results are historical and assume the reinvestment of dividends and capital gains. Other share classes are available for which performance and expenses will differ.
Performance results reflect any applicable expense waivers in effect during the periods shown. Without such waivers Fund performance would be lower. Waivers may not be in effect for all funds. Certain fee waivers are contractual through a specified period. Otherwise, fee waivers can be rescinded at any time. See the prospectus and financial statements for more information.
The performance table and graph do not reflect the deduction of fees and taxes that a shareowner would pay on Fund distributions or the redemption of Fund shares.
Please refer to the financial highlights for a more current expense ratio.
Pioneer Equity Income Fund | Semiannual Report | 4/30/2313
| Performance Update | 4/30/23 | Class K Shares |
Investment Returns
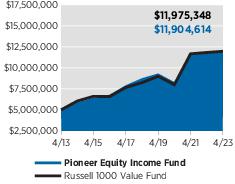
The mountain chart on the right shows the change in value of a $5 million investment made in Class K shares of Pioneer Equity Income Fund during the periods shown, compared to that of the Russell 1000 Value Index.
Average Annual Total Returns
(As of April 30, 2023) |
| Period | Net
Asset
Value
(NAV) | Russell
1000
Value
Index |
| 10 Years | 9.19% | 9.13% |
| 5 Years | 6.44 | 7.75 |
| 1 Year | -0.31 | 1.21 |
Expense Ratio
(Per prospectus dated March 1, 2023) |
| Gross |
| 0.66% |
Value of $5 Million Investment
Call 1-800-225-6292 or visit www.amundi.com/us for the most recent month-end performance results. Current performance may be lower or higher than the performance data quoted.
The performance data quoted represents past performance, which is no guarantee of future results. Investment return and principal value will fluctuate, and shares, when redeemed, may be worth more or less than their original cost.
Class K shares are not subject to sales charges and are available for limited groups of eligible investors, including institutional investors. All results are historical and assume the
reinvestment of dividends and capital gains. Other share classes are available for which performance and expenses will differ.
Performance results reflect any applicable expense waivers in effect during the periods shown. Without such waivers Fund performance would be lower. Waivers may not be in effect for all funds. Certain fee waivers are contractual through a specified period. Otherwise, fee waivers can be rescinded at any time. See the prospectus and financial statements for more information.
The performance table and graph do not reflect the deduction of fees and taxes that a shareowner would pay on Fund distributions or the redemption of Fund shares.
Please refer to the financial highlights for a more current expense ratio.
14Pioneer Equity Income Fund | Semiannual Report | 4/30/23
| Performance Update | 4/30/23 | Class R Shares |
Investment Returns
The mountain chart on the right shows the change in value of a $10,000 investment made in Class R shares of Pioneer Equity Income Fund during the periods shown, compared to that of the Russell 1000 Value Index.
Average Annual Total Returns
(As of April 30, 2023) |
| Period | Net
Asset
Value
(NAV) | Russell
1000
Value
Index |
| 10 Years | 8.38% | 9.13% |
| 5 Years | 5.66 | 7.75 |
| 1 Year | -1.10 | 1.21 |
Expense Ratio
(Per prospectus dated March 1, 2023) |
| Gross |
| 1.40% |
Value of $10,000 Investment
Call 1-800-225-6292 or visit www.amundi.com/us for the most recent month-end performance results. Current performance may be lower or higher than the performance data quoted.
The performance data quoted represents past performance, which is no guarantee of future results. Investment return and principal value will fluctuate, and shares, when redeemed, may be worth more or less than their original cost.
Class R shares are not subject to sales charges and are available for limited groups of eligible investors, including institutional investors. All results are historical and assume the reinvestment of dividends and capital gains. Other share classes are available for which performance and expenses will differ.
Performance results reflect any applicable expense waivers in effect during the periods shown. Without such waivers Fund performance would be lower. Waivers may not be in effect for all funds. Certain fee waivers are contractual through a specified period. Otherwise, fee waivers can be rescinded at any time. See the prospectus and financial statements for more information.
The performance table and graph do not reflect the deduction of fees and taxes that a shareowner would pay on Fund distributions or the redemption of Fund shares.
Please refer to the financial highlights for a more current expense ratio.
Pioneer Equity Income Fund | Semiannual Report | 4/30/2315
| Performance Update | 4/30/23 | Class Y Shares |
Investment Returns
The mountain chart on the right shows the change in value of a $5 million investment made in Class Y shares of Pioneer Equity Income Fund during the periods shown, compared to that of the Russell 1000 Value Index.
Average Annual Total Returns
(As of April 30, 2023) |
| Period | Net
Asset
Value
(NAV) | Russell
1000
Value
Index |
| 10 Years | 9.06% | 9.13% |
| 5 Years | 6.31 | 7.75 |
| 1 Year | -0.46 | 1.21 |
Expense Ratio
(Per prospectus dated March 1, 2023) |
| Gross |
| 0.78% |
Value of $5 Million Investment
Call 1-800-225-6292 or visit www.amundi.com/us for the most recent month-end performance results. Current performance may be lower or higher than the performance data quoted.
The performance data quoted represents past performance, which is no guarantee of future results. Investment return and principal value will fluctuate, and shares, when redeemed, may be worth more or less than their original cost.
Class Y shares are not subject to sales charges and are available for limited groups of eligible investors, including institutional investors. All results are historical and assume the reinvestment of dividends and capital gains. Other share classes are available for which performance and expenses will differ.
Performance results reflect any applicable expense waivers in effect during the periods shown. Without such waivers Fund performance would be lower. Waivers may not be in effect for all funds. Certain fee waivers are contractual through a specified period. Otherwise, fee waivers can be rescinded at any time. See the prospectus and financial statements for more information.
The performance table and graph do not reflect the deduction of fees and taxes that a shareowner would pay on Fund distributions or the redemption of Fund shares.
Please refer to the financial highlights for a more current expense ratio.
16Pioneer Equity Income Fund | Semiannual Report | 4/30/23
Comparing Ongoing Fund Expenses
As a shareowner in the Fund, you incur two types of costs:
| (1) | ongoing costs, including management fees, distribution and/or service (12b-1) fees, and other Fund expenses; and |
| (2) | transaction costs, including sales charges (loads) on purchase payments. |
This example is intended to help you understand your ongoing expenses (in dollars) of investing in the Fund and to compare these costs with the ongoing costs of investing in other mutual funds. The example is based on an investment of $1,000 at the beginning of the Fund’s latest six-month period and held throughout the six months.
Using the Tables
Actual Expenses
The first table below provides information about actual account values and actual expenses. You may use the information in this table, together with the amount you invested, to estimate the expenses that you paid over the period as follows:
| (1) | Divide your account value by $1,000
Example: an $8,600 account value ÷ $1,000 = 8.6 |
| (2) | Multiply the result in (1) above by the corresponding share class’s number in the third row under the heading entitled “Expenses Paid During Period” to estimate the expenses you paid on your account during this period. |
Expenses Paid on a $1,000 Investment in Pioneer Equity Income Fund
Based on actual returns from November 1, 2022 through April 30, 2023.
| Share Class | A | C | K | R | Y |
Beginning Account
Value on 11/1/22 | $1,000.00 | $1,000.00 | $1,000.00 | $1,000.00 | $1,000.00 |
Ending Account Value
(after expenses) on 4/30/23 | $1,040.90 | $1,037.10 | $1,042.90 | $1,039.10 | $1,041.90 |
Expenses Paid
During Period* | $5.16 | $8.94 | $3.44 | $7.08 | $4.30 |
| | |
| * | Expenses are equal to the Fund’s annualized expense ratio of 1.02%, 1.77%, 0.68%, 1.40%, and 0.85% for Class A, Class C, Class K, Class R, and Class Y shares, respectively, multiplied by the average account value over the period, multiplied by 181/365 (to reflect the one-half year period). |
Pioneer Equity Income Fund | Semiannual Report | 4/30/2317
Comparing Ongoing Fund Expenses (continued)
Hypothetical Example for Comparison Purposes
The table below provides information about hypothetical account values and hypothetical expenses based on the Fund’s actual expense ratio and an assumed rate of return of 5% per year before expenses, which is not the Fund’s actual return. The hypothetical account values and expenses may not be used to estimate the actual ending account balance or expenses you paid for the period.
You may use this information to compare the ongoing costs of investing in the Fund and other funds. To do so, compare this 5% hypothetical example with the 5% hypothetical examples that appear in the shareholder reports of the other funds.
Please note that the expenses shown in the tables are meant to highlight your ongoing costs only and do not reflect any transaction costs, such as sales charges (loads) that are charged at the time of the transaction. Therefore, the table below is useful in comparing ongoing costs only and will not help you determine the relative total costs of owning different funds. In addition, if these transaction costs were included, your costs would have been higher.
Expenses Paid on a $1,000 Investment in Pioneer Equity Income Fund
Based on a hypothetical 5% return per year before expenses, reflecting the period from November 1, 2022 through April 30, 2023.
| Share Class | A | C | K | R | Y |
Beginning Account
Value on 11/1/22 | $1,000.00 | $1,000.00 | $1,000.00 | $1,000.00 | $1,000.00 |
Ending Account Value
(after expenses) on 4/30/23 | $1,019.74 | $1,016.02 | $1,021.42 | $1,017.85 | $1,020.58 |
Expenses Paid
During Period* | $5.11 | $8.85 | $3.41 | $7.00 | $4.26 |
| | |
| * | Expenses are equal to the Fund’s annualized expense ratio of 1.02%, 1.77%, 0.68%, 1.40%, and 0.85% for Class A, Class C, Class K, Class R, and Class Y shares, respectively, multiplied by the average account value over the period, multiplied by 181/365 (to reflect the one-half year period). |
18Pioneer Equity Income Fund | Semiannual Report | 4/30/23
Schedule of Investments | 4/30/23
(unaudited)
| Shares | | | | | | Value |
| | UNAFFILIATED ISSUERS — 99.9% | |
| | Common Stocks — 99.9% of Net Assets | |
| | Aerospace & Defense — 2.8% | |
| 100,144 | L3Harris Technologies, Inc. | $ 19,543,102 |
| 265,414 | Raytheon Technologies Corp. | 26,514,858 |
| | Total Aerospace & Defense | $46,057,960 |
|
|
| | Air Freight & Logistics — 1.5% | |
| 109,443 | CH Robinson Worldwide, Inc. | $ 11,039,516 |
| 71,436 | United Parcel Service, Inc., Class B | 12,844,907 |
| | Total Air Freight & Logistics | $23,884,423 |
|
|
| | Automobile Components — 1.9% | |
| 66,101 | Autoliv, Inc. | $ 5,672,127 |
| 518,467 | BorgWarner, Inc. | 24,953,817 |
| | Total Automobile Components | $30,625,944 |
|
|
| | Automobiles — 0.8% | |
| 501,230 | Honda Motor Co., Ltd. (A.D.R.) | $ 13,322,693 |
| | Total Automobiles | $13,322,693 |
|
|
| | Banks — 5.3% | |
| 786,333 | Bank of America Corp. | $ 23,023,830 |
| 200,322 | JPMorgan Chase & Co. | 27,692,513 |
| 132,251 | PNC Financial Services Group, Inc. | 17,225,693 |
| 518,518 | Regions Financial Corp. | 9,468,139 |
| 268,533 | Truist Financial Corp. | 8,748,805 |
| | Total Banks | $86,158,980 |
|
|
| | Capital Markets — 7.0% | |
| 406,426 | Bank of New York Mellon Corp. | $ 17,309,683 |
| 77,474 | CME Group, Inc. | 14,392,345 |
| 177,444 | Morgan Stanley | 15,964,637 |
| 221,649 | Northern Trust Corp. | 17,324,086 |
| 221,124 | Raymond James Financial, Inc. | 20,018,356 |
| 155,383 | State Street Corp. | 11,227,975 |
| 168,214 | T Rowe Price Group, Inc. | 18,895,479 |
| | Total Capital Markets | $115,132,561 |
|
|
| | Chemicals — 2.7% | |
| 58,679 | Air Products and Chemicals, Inc. | $ 17,272,750 |
| 157,112 | Celanese Corp. | 16,691,579 |
| 177,592 | Corteva, Inc. | 10,854,423 |
| | Total Chemicals | $44,818,752 |
|
|
The accompanying notes are an integral part of these financial statements.
Pioneer Equity Income Fund | Semiannual Report | 4/30/2319
Schedule of Investments | 4/30/23
(unaudited) (continued)
| Shares | | | | | | Value |
| | Commercial Services & Supplies — 0.5% | |
| 67,746 | MSA Safety, Inc. | $ 8,790,044 |
| | Total Commercial Services & Supplies | $8,790,044 |
|
|
| | Communications Equipment — 0.5% | |
| 161,947 | Cisco Systems, Inc. | $ 7,651,996 |
| | Total Communications Equipment | $7,651,996 |
|
|
| | Consumer Staples Distribution & Retail — 1.7% | |
| 113,432 | Target Corp. | $ 17,893,898 |
| 63,069 | Walmart, Inc. | 9,521,527 |
| | Total Consumer Staples Distribution & Retail | $27,415,425 |
|
|
| | Diversified Telecommunication Services — 0.7% | |
| 231,788 | BCE, Inc. | $ 11,142,049 |
| | Total Diversified Telecommunication Services | $11,142,049 |
|
|
| | Electric Utilities — 3.7% | |
| 144,661 | American Electric Power Co., Inc. | $ 13,369,569 |
| 307,654 | Eversource Energy | 23,877,027 |
| 296,887 | NextEra Energy, Inc. | 22,750,451 |
| | Total Electric Utilities | $59,997,047 |
|
|
| | Electrical Equipment — 0.5% | |
| 50,899 | Eaton Corp. Plc | $ 8,506,241 |
| | Total Electrical Equipment | $8,506,241 |
|
|
| | Electronic Equipment, Instruments & Components —
0.8% | |
| 78,535 | CDW Corp. | $ 13,318,751 |
| | Total Electronic Equipment, Instruments & Components | $13,318,751 |
|
|
| | Food Products — 6.2% | |
| 293,367 | Campbell Soup Co. | $ 15,929,828 |
| 111,410 | John B Sanfilippo & Son, Inc. | 11,581,070 |
| 281,758 | McCormick & Co., Inc., Non-Voting Shares | 24,752,440 |
| 383,924 | Mondelez International, Inc., Class A | 29,454,649 |
| 154,539 | Nestle S.A. (A.D.R.) | 19,821,172 |
| | Total Food Products | $101,539,159 |
|
|
| | Ground Transportation — 1.1% | |
| 52,209 | Canadian National Railway Co. | $ 6,226,967 |
| 30,578 | Union Pacific Corp. | 5,984,115 |
| 131,155 | Werner Enterprises, Inc. | 5,924,271 |
| | Total Ground Transportation | $18,135,353 |
|
|
The accompanying notes are an integral part of these financial statements.
20Pioneer Equity Income Fund | Semiannual Report | 4/30/23
| Shares | | | | | | Value |
| | Health Care Equipment & Supplies — 3.4% | |
| 106,658 | Becton Dickinson & Co. | $ ���28,190,776 |
| 90,579 | Stryker Corp. | 27,141,997 |
| | Total Health Care Equipment & Supplies | $55,332,773 |
|
|
| | Health Care Providers & Services — 3.6% | |
| 72,328 | AmerisourceBergen Corp. | $ 12,067,927 |
| 192,340 | Cardinal Health, Inc. | 15,791,114 |
| 234,932 | CVS Health Corp. | 17,222,865 |
| 27,267 | Humana, Inc. | 14,464,871 |
| | Total Health Care Providers & Services | $59,546,777 |
|
|
| | Health Care REITs — 0.4% | |
| 368,630 | Healthcare Realty Trust, Inc. | $ 7,291,501 |
| | Total Health Care REITs | $7,291,501 |
|
|
| | Hotels, Restaurants & Leisure — 0.6% | |
| 65,661 | Darden Restaurants, Inc. | $ 9,975,876 |
| | Total Hotels, Restaurants & Leisure | $9,975,876 |
|
|
| | Household Products — 1.9% | |
| 52,393 | Clorox Co. | $ 8,677,329 |
| 273,309 | Colgate-Palmolive Co. | 21,810,058 |
| | Total Household Products | $30,487,387 |
|
|
| | Industrial REITs — 1.3% | |
| 169,581 | Prologis, Inc. | $ 21,240,020 |
| | Total Industrial REITs | $21,240,020 |
|
|
| | Insurance — 3.0% | |
| 113,920 | MetLife, Inc. | $ 6,986,714 |
| 875,020 | Sun Life Financial, Inc. | 42,945,981 |
| | Total Insurance | $49,932,695 |
|
|
| | IT Services — 1.0% | |
| 129,627 | International Business Machines Corp. | $ 16,386,149 |
| | Total IT Services | $16,386,149 |
|
|
| | Life Sciences Tools & Services — 2.4% | |
| 255,866 | Bruker Corp. | $ 20,246,677 |
| 34,489 | Thermo Fisher Scientific, Inc. | 19,137,946 |
| | Total Life Sciences Tools & Services | $39,384,623 |
|
|
| | Machinery — 5.6% | |
| 31,009 | Caterpillar, Inc. | $ 6,784,769 |
| 28,220 | Deere & Co. | 10,667,724 |
| 1,020,614 | Gorman-Rupp Co. | 25,056,074 |
| 90,086 | Oshkosh Corp. | 6,893,381 |
The accompanying notes are an integral part of these financial statements.
Pioneer Equity Income Fund | Semiannual Report | 4/30/2321
Schedule of Investments | 4/30/23
(unaudited) (continued)
| Shares | | | | | | Value |
| | Machinery — (continued) | |
| 343,507 | PACCAR, Inc. | $ 25,656,538 |
| 211,986 | Timken Co. | 16,291,124 |
| | Total Machinery | $91,349,610 |
|
|
| | Media — 4.8% | |
| 372,914 | Comcast Corp., Class A | $ 15,427,452 |
| 461,721 | Fox Corp., Class A | 15,356,841 |
| 688,893 | Interpublic Group of Cos., Inc. | 24,614,147 |
| 255,337 | Omnicom Group, Inc. | 23,125,872 |
| | Total Media | $78,524,312 |
|
|
| | Metals & Mining — 5.1% | |
| 200,797 | Freeport-McMoRan, Inc. | $ 7,612,214 |
| 279,104 | Materion Corp. | 30,229,754 |
| 133,372 | Reliance Steel & Aluminum Co. | 33,049,582 |
| 256,662 | Teck Resources, Ltd., Class B | 11,960,449 |
| | Total Metals & Mining | $82,851,999 |
|
|
| | Multi-Utilities — 0.8% | |
| 221,849 | CMS Energy Corp. | $ 13,812,319 |
| | Total Multi-Utilities | $13,812,319 |
|
|
| | Office REITs — 1.2% | |
| 163,070 | Alexandria Real Estate Equities, Inc. | $ 20,250,033 |
| | Total Office REITs | $20,250,033 |
|
|
| | Oil, Gas & Consumable Fuels — 7.3% | |
| 188,736 | Chevron Corp. | $ 31,817,115 |
| 333,384 | Coterra Energy, Inc. | 8,534,631 |
| 259,624 | EQT Corp. | 9,045,300 |
| 305,742 | Exxon Mobil Corp. | 36,181,508 |
| 157,250 | Phillips 66 | 15,567,750 |
| 288,197 | Shell Plc (A.D.R.) | 17,862,450 |
| | Total Oil, Gas & Consumable Fuels | $119,008,754 |
|
|
| | Pharmaceuticals — 7.3% | |
| 277,595 | AstraZeneca Plc (A.D.R.) | $ 20,325,506 |
| 59,960 | Eli Lilly & Co. | 23,735,766 |
| 161,840 | Johnson & Johnson | 26,493,208 |
| 166,950 | Merck & Co., Inc. | 19,277,716 |
| 126,822 | Novo Nordisk AS (A.D.R.) | 21,190,688 |
| 209,768 | Pfizer, Inc. | 8,157,877 |
| | Total Pharmaceuticals | $119,180,761 |
|
|
The accompanying notes are an integral part of these financial statements.
22Pioneer Equity Income Fund | Semiannual Report | 4/30/23
| Shares | | | | | | Value |
| | Residential REITs — 1.1% | |
| 161,948 | Camden Property Trust | $ 17,822,377 |
| | Total Residential REITs | $17,822,377 |
|
|
| | Semiconductors & Semiconductor Equipment — 4.5% | |
| 131,383 | Analog Devices, Inc. | $ 23,633,174 |
| 48,143 | KLA Corp. | 18,609,195 |
| 112,720 | Microchip Technology, Inc. | 8,227,433 |
| 89,652 | MKS Instruments, Inc. | 7,519,113 |
| 95,336 | Texas Instruments, Inc. | 15,940,179 |
| | Total Semiconductors & Semiconductor Equipment | $73,929,094 |
|
|
| | Software — 1.2% | |
| 63,303 | Microsoft Corp. | $ 19,450,480 |
| | Total Software | $19,450,480 |
|
|
| | Specialized REITs — 0.9% | |
| 57,265 | Crown Castle, Inc. | $ 7,048,749 |
| 86,267 | Digital Realty Trust, Inc. | 8,553,373 |
| | Total Specialized REITs | $15,602,122 |
|
|
| | Specialty Retail — 2.2% | |
| 63,336 | Home Depot, Inc. | $ 19,035,001 |
| 217,108 | TJX Cos., Inc. | 17,112,453 |
| | Total Specialty Retail | $36,147,454 |
|
|
| | Textiles, Apparel & Luxury Goods — 1.1% | |
| 141,510 | Carter's, Inc. | $ 9,873,152 |
| 77,020 | Ralph Lauren Corp. | 8,841,126 |
| | Total Textiles, Apparel & Luxury Goods | $18,714,278 |
|
|
| | Trading Companies & Distributors — 0.8% | |
| 96,182 | Ferguson Plc | $ 13,544,349 |
| | Total Trading Companies & Distributors | $13,544,349 |
|
|
| | Water Utilities — 0.7% | |
| 278,835 | Essential Utilities, Inc. | $ 11,906,255 |
| | Total Water Utilities | $11,906,255 |
|
|
| | Total Common Stocks
(Cost $1,237,306,348) | $1,638,169,376 |
|
|
| | TOTAL INVESTMENTS IN UNAFFILIATED ISSUERS — 99.9%
(Cost $1,237,306,348) | $1,638,169,376 |
| | OTHER ASSETS AND LIABILITIES — 0.1% | $ 1,542,298 |
| | net assets — 100.0% | $1,639,711,674 |
| | | | | | | |
The accompanying notes are an integral part of these financial statements.
Pioneer Equity Income Fund | Semiannual Report | 4/30/2323
Schedule of Investments | 4/30/23
(unaudited) (continued)
| (A.D.R.) | American Depositary Receipts. |
Purchases and sales of securities (excluding short-term investments) for the six months ended April 30, 2023, aggregated $338,177,593 and $522,242,871, respectively.
At April 30, 2023, the net unrealized appreciation on investments based on cost for federal tax purposes of $1,238,176,198 was as follows:
| Aggregate gross unrealized appreciation for all investments in which there is an excess of value over tax cost | $430,609,667 |
| Aggregate gross unrealized depreciation for all investments in which there is an excess of tax cost over value | (30,616,489) |
| Net unrealized appreciation | $399,993,178 |
Various inputs are used in determining the value of the Fund's investments. These inputs are summarized in the three broad levels below.
| Level 1 | – | unadjusted quoted prices in active markets for identical securities. |
| Level 2 | – | other significant observable inputs (including quoted prices for similar securities, interest rates, prepayment speeds, credit risks, etc.). See Notes to Financial Statements — Note 1A. |
| Level 3 | – | significant unobservable inputs (including the Adviser's own assumptions in determining fair value of investments). See Notes to Financial Statements — Note 1A. |
The following is a summary of the inputs used as of April 30, 2023, in valuing the Fund's investments:
| | Level 1 | Level 2 | Level 3 | Total |
| Common Stocks | $1,638,169,376 | $— | $— | $1,638,169,376 |
| Total Investments in Securities | $ 1,638,169,376 | $ — | $ — | $ 1,638,169,376 |
During the period ended April 30, 2023, there were no transfers in or out of Level 3.
The accompanying notes are an integral part of these financial statements.
24Pioneer Equity Income Fund | Semiannual Report | 4/30/23
Statement of Assets and Liabilities | 4/30/23 (unaudited)
| ASSETS: | |
| Investments in unaffiliated issuers, at value (cost $1,237,306,348) | $1,638,169,376 |
| Receivables — | |
| Fund shares sold | 1,509,685 |
| Dividends | 3,057,285 |
| Interest | 27,039 |
| Other assets | 67,113 |
| Total assets | $ 1,642,830,498 |
| LIABILITIES: | |
| Overdraft due to custodian | $ 1,012,538 |
| Payables — | |
| Fund shares repurchased | 1,320,166 |
| Distributions | 2,983 |
| Trustees' fees | 11,920 |
| Transfer agent fees | 461,624 |
| Management fees | 133,319 |
| Administrative expenses | 42,966 |
| Distribution fees | 33,392 |
| Accrued expenses | 99,916 |
| Total liabilities | $ 3,118,824 |
| NET ASSETS: | |
| Paid-in capital | $1,109,968,195 |
| Distributable earnings | 529,743,479 |
| Net assets | $1,639,711,674 |
| NET ASSET VALUE PER SHARE: | |
| No par value (unlimited number of shares authorized) | |
| Class A (based on $716,946,119/21,396,385 shares) | $ 33.51 |
| Class C (based on $47,200,264/1,439,354 shares) | $ 32.79 |
| Class K (based on $222,472,040/6,629,578 shares) | $ 33.56 |
| Class R (based on $39,957,598/1,160,958 shares) | $ 34.42 |
| Class Y (based on $613,135,653/17,982,229 shares) | $ 34.10 |
| MAXIMUM OFFERING PRICE PER SHARE: | |
| Class A (based on $33.51 net asset value per share/100%-5.75% maximum sales charge) | $ 35.55 |
The accompanying notes are an integral part of these financial statements.
Pioneer Equity Income Fund | Semiannual Report | 4/30/23 25
Statement of Operations (unaudited)
FOR THE SIX MONTHS ENDED 4/30/23
| INVESTMENT INCOME: | | |
| Dividends from unaffiliated issuers (net of foreign taxes withheld $312,407) | $ 21,539,060 | |
| Interest from unaffiliated issuers | 6,980 | |
| Total Investment Income | | $ 21,546,040 |
| EXPENSES: | | |
| Management fees | $ 5,118,190 | |
| Administrative expenses | 283,873 | |
| Transfer agent fees | | |
| Class A | 274,403 | |
| Class C | 18,819 | |
| Class K | 354 | |
| Class R | 43,760 | |
| Class Y | 537,615 | |
| Distribution fees | | |
| Class A | 913,957 | |
| Class C | 250,304 | |
| Class R | 102,874 | |
| Shareowner communications expense | 79,421 | |
| Custodian fees | 10,518 | |
| Registration fees | 45,250 | |
| Professional fees | 56,434 | |
| Printing expense | 24,917 | |
| Officers' and Trustees' fees | 58,170 | |
| Insurance expense | 9,675 | |
| Miscellaneous | 181,919 | |
| Total expenses | | $ 8,010,453 |
| Net investment income | | $ 13,535,587 |
| REALIZED AND UNREALIZED GAIN (LOSS) ON INVESTMENTS: | | |
| Net realized gain (loss) on: | | |
| Investments in unaffiliated issuers | $130,238,679 | |
| Other assets and liabilities denominated in foreign currencies | 3,086 | $130,241,765 |
| Change in net unrealized appreciation (depreciation) on: | | |
| Investments in unaffiliated issuers | $ (70,779,932) | |
| Other assets and liabilities denominated in foreign currencies | 37,474 | $ (70,742,458) |
| Net realized and unrealized gain (loss) on investments | | $ 59,499,307 |
| Net increase in net assets resulting from operations | | $ 73,034,894 |
The accompanying notes are an integral part of these financial statements.
26Pioneer Equity Income Fund | Semiannual Report | 4/30/23
Statements of Changes in Net Assets
| | Six Months
Ended
4/30/23
(unaudited) | Year
Ended
10/31/22 |
| FROM OPERATIONS: | | |
| Net investment income (loss) | $ 13,535,587 | $ 33,367,486 |
| Net realized gain (loss) on investments | 130,241,765 | 165,368,417 |
| Change in net unrealized appreciation (depreciation) on investments | (70,742,458) | (349,850,575) |
| Net increase (decrease) in net assets resulting from operations | $ 73,034,894 | $ (151,114,672) |
| DISTRIBUTIONS TO SHAREOWNERS: | | |
| Class A ($3.99 and $3.85 per share, respectively) | $ (80,834,408) | $ (78,936,753) |
| Class C ($3.87 and $3.58 per share, respectively) | (5,553,814) | (5,771,572) |
| Class K ($4.05 and $3.99 per share, respectively) | (26,408,063) | (27,593,300) |
| Class R ($3.91 and $3.69 per share, respectively) | (4,403,589) | (4,539,376) |
| Class Y ($4.03 and $3.92 per share, respectively) | (75,856,236) | (99,581,307) |
| Total distributions to shareowners | $ (193,056,110) | $ (216,422,308) |
| FROM FUND SHARE TRANSACTIONS: | | |
| Net proceeds from sales of shares | $ 88,239,406 | $ 277,146,279 |
| Reinvestment of distributions | 186,145,392 | 209,794,473 |
| Cost of shares repurchased | (295,105,165) | (768,286,292) |
| Net decrease in net assets resulting from Fund share transactions | $ (20,720,367) | $ (281,345,540) |
| Net decrease in net assets | $ (140,741,583) | $ (648,882,520) |
| NET ASSETS: | | |
| Beginning of period | $1,780,453,257 | $2,429,335,777 |
| End of period | $1,639,711,674 | $ 1,780,453,257 |
The accompanying notes are an integral part of these financial statements.
Pioneer Equity Income Fund | Semiannual Report | 4/30/2327
Statements of Changes in Net Assets (continued)
| | Six Months
Ended
4/30/23
Shares
(unaudited) | Six Months
Ended
4/30/23
Amount
(unaudited) | Year
Ended
10/31/22
Shares | Year
Ended
10/31/22
Amount |
| Class A | | | | |
| Shares sold | 857,635 | $ 29,280,833 | 1,625,345 | $ 63,032,773 |
| Reinvestment of distributions | 2,244,636 | 76,729,092 | 1,958,991 | 75,082,572 |
| Less shares repurchased | (2,046,445) | (70,078,954) | (3,826,468) | (147,980,660) |
Net increase
(decrease) | 1,055,826 | $ 35,930,971 | (242,132) | $ (9,865,315) |
| Class C | | | | |
| Shares sold | 82,030 | $ 2,710,465 | 184,468 | $ 6,974,688 |
| Reinvestment of distributions | 156,389 | 5,238,345 | 144,937 | 5,458,663 |
| Less shares repurchased | (246,227) | (8,198,682) | (552,139) | (20,980,036) |
| Net decrease | (7,808) | $ (249,872) | (222,734) | $ (8,546,685) |
| Class K | | | | |
| Shares sold | 486,770 | $ 16,625,563 | 1,601,110 | $ 62,498,755 |
| Reinvestment of distributions | 763,550 | 26,129,182 | 709,741 | 27,229,561 |
| Less shares repurchased | (1,177,920) | (39,876,346) | (2,779,686) | (107,667,109) |
Net increase
(decrease) | 72,400 | $ 2,878,399 | (468,835) | $ (17,938,793) |
| Class R | | | | |
| Shares sold | 45,172 | $ 1,571,940 | 144,900 | $ 5,729,158 |
| Reinvestment of distributions | 125,400 | 4,403,135 | 115,539 | 4,537,977 |
| Less shares repurchased | (150,289) | (5,291,685) | (356,596) | (14,045,087) |
Net increase
(decrease) | 20,283 | $ 683,390 | (96,157) | $ (3,777,952) |
| Class Y | | | | |
| Shares sold | 1,102,863 | $ 38,050,605 | 3,536,861 | $ 138,910,905 |
| Reinvestment of distributions | 2,116,793 | 73,645,638 | 2,502,650 | 97,485,700 |
| Less shares repurchased | (4,907,251) | (171,659,498) | (12,314,328) | (477,613,400) |
| Net decrease | (1,687,595) | $ (59,963,255) | (6,274,817) | $(241,216,795) |
The accompanying notes are an integral part of these financial statements.
28Pioneer Equity Income Fund | Semiannual Report | 4/30/23
| | Six Months
Ended
4/30/23
(unaudited) | Year
Ended
10/31/22 | Year
Ended
10/31/21 | Year
Ended
10/31/20 | Year
Ended
10/31/19 | Year
Ended
10/31/18 |
| Class A | | | | | | |
| Net asset value, beginning of period | $ 35.99 | $ 42.74 | $ 31.38 | $ 35.59 | $ 34.39 | $ 35.68 |
| Increase (decrease) from investment operations: | | | | | | |
| Net investment income (loss) (a) | $ 0.25 | $ 0.56 | $ 0.55 | $ 0.58 | $ 0.72 | $ 0.72 |
| Net realized and unrealized gain (loss) on investments | 1.26 | (3.46) | 11.32 | (3.35) | 2.85 | (0.04) |
| Net increase (decrease) from investment operations | $ 1.51 | $ (2.90) | $ 11.87 | $ (2.77) | $ 3.57 | $ 0.68 |
| Distributions to shareowners: | | | | | | |
| Net investment income | $ (0.44) | $ (0.59) | $ (0.51) | $ (0.61) | $ (0.79) | $ (0.57) |
| Net realized gain | (3.55) | (3.26) | — | (0.83) | (1.58) | (1.40) |
| Total distributions | $ (3.99) | $ (3.85) | $ (0.51) | $ (1.44) | $ (2.37) | $ (1.97) |
| Net increase (decrease) in net asset value | $ (2.48) | $ (6.75) | $ 11.36 | $ (4.21) | $ 1.20 | $ (1.29) |
| Net asset value, end of period | $ 33.51 | $ 35.99 | $ 42.74 | $ 31.38 | $ 35.59 | $ 34.39 |
| Total return (b) | 4.09%(c) | (7.22)% | 37.99% | (8.00)% | 11.15% | 1.84% |
| Ratio of net expenses to average net assets | 1.02%(d) | 0.99% | 1.02% | 1.06% | 1.00% | 1.00% |
| Ratio of net investment income (loss) to average net assets | 1.50%(d) | 1.47% | 1.41% | 1.78% | 2.14% | 2.00% |
| Portfolio turnover rate | 20%(c) | 30% | 25% | 8% | 23% | 27% |
| Net assets, end of period (in thousands) | $716,946 | $731,964 | $879,753 | $703,864 | $884,809 | $835,012 |
| (a) | The per-share data presented above is based on the average shares outstanding for the period presented. |
| (b) | Assumes initial investment at net asset value at the beginning of each period, reinvestment of all distributions, the complete redemption of the investment at net asset value at the end of each period and no sales charges. Total return would be reduced if sales charges were taken into account. |
| (c) | Not annualized. |
| (d) | Annualized. |
The accompanying notes are an integral part of these financial statements.
Pioneer Equity Income Fund | Semiannual Report | 4/30/2329
Financial Highlights (continued)
| | Six Months
Ended
4/30/23
(unaudited) | Year
Ended
10/31/22 | Year
Ended
10/31/21 | Year
Ended
10/31/20 | Year
Ended
10/31/19 | Year
Ended
10/31/18 |
| Class C | | | | | | |
| Net asset value, beginning of period | $ 35.30 | $ 42.01 | $ 30.85 | $ 35.00 | $ 33.80 | $ 35.06 |
| Increase (decrease) from investment operations: | | | | | | |
| Net investment income (loss) (a) | $ 0.13 | $ 0.27 | $ 0.27 | $ 0.35 | $ 0.46 | $ 0.48 |
| Net realized and unrealized gain (loss) on investments | 1.23 | (3.40) | 11.12 | (3.29) | 2.79 | (0.05) |
| Net increase (decrease) from investment operations | $ 1.36 | $ (3.13) | $ 11.39 | $ (2.94) | $ 3.25 | $ 0.43 |
| Distributions to shareowners: | | | | | | |
| Net investment income | $ (0.32) | $ (0.32) | $ (0.23) | $ (0.38) | $ (0.47) | $ (0.29) |
| Net realized gain | (3.55) | (3.26) | — | (0.83) | (1.58) | (1.40) |
| Total distributions | $ (3.87) | $ (3.58) | $ (0.23) | $ (1.21) | $ (2.05) | $ (1.69) |
| Net increase (decrease) in net asset value | $ (2.51) | $ (6.71) | $ 11.16 | $ (4.15) | $ 1.20 | $ (1.26) |
| Net asset value, end of period | $ 32.79 | $ 35.30 | $ 42.01 | $ 30.85 | $ 35.00 | $ 33.80 |
| Total return (b) | 3.71%(c) | (7.92)% | 37.00% | (8.64)% | 10.27% | 1.14% |
| Ratio of net expenses to average net assets | 1.77%(d) | 1.73% | 1.75% | 1.75% | 1.78% | 1.72% |
| Ratio of net investment income (loss) to average net assets | 0.75%(d) | 0.73% | 0.69% | 1.11% | 1.38% | 1.35% |
| Portfolio turnover rate | 20%(c) | 30% | 25% | 8% | 23% | 27% |
| Net assets, end of period (in thousands) | $47,200 | $51,086 | $70,156 | $68,832 | $103,483 | $111,558 |
| Ratios with no waiver of fees and assumption of expenses by the Adviser and no reduction for fees paid indirectly: | | | | | | |
| (a) | The per-share data presented above is based on the average shares outstanding for the period presented. |
| (b) | Assumes initial investment at net asset value at the beginning of each period, reinvestment of all distributions, the complete redemption of the investment at net asset value at the end of each period and no sales charges. Total return would be reduced if sales charges were taken into account. |
| (c) | Not annualized. |
| (d) | Annualized. |
The accompanying notes are an integral part of these financial statements.
30Pioneer Equity Income Fund | Semiannual Report | 4/30/23
| | Six Months
Ended
4/30/23
(unaudited) | Year
Ended
10/31/22 | Year
Ended
10/31/21 | Year
Ended
10/31/20 | Year
Ended
10/31/19 | Year
Ended
10/31/18 |
| Class K | | | | | | |
| Net asset value, beginning of period | $ 36.03 | $ 42.81 | $ 31.44 | $ 35.65 | $ 34.47 | $ 35.75 |
| Increase (decrease) from investment operations: | | | | | | |
| Net investment income (loss) (a) | $ 0.31 | $ 0.69 | $ 0.70 | $ 0.71 | $ 0.83 | $ 0.85 |
| Net realized and unrealized gain (loss) on investments | 1.27 | (3.48) | 11.33 | (3.36) | 2.85 | (0.04) |
| Net increase (decrease) from investment operations | $ 1.58 | $ (2.79) | $ 12.03 | $ (2.65) | $ 3.68 | $ 0.81 |
| Distributions to shareowners: | | | | | | |
| Net investment income | $ (0.50) | $ (0.73) | $ (0.66) | $ (0.73) | $ (0.92) | $ (0.69) |
| Net realized gain | (3.55) | (3.26) | — | (0.83) | (1.58) | (1.40) |
| Total distributions | $ (4.05) | $ (3.99) | $ (0.66) | $ (1.56) | $ (2.50) | $ (2.09) |
| Net increase (decrease) in net asset value | $ (2.47) | $ (6.78) | $ 11.37 | $ (4.21) | $ 1.18 | $ (1.28) |
| Net asset value, end of period | $ 33.56 | $ 36.03 | $ 42.81 | $ 31.44 | $ 35.65 | $ 34.47 |
| Total return (b) | 4.29%(c) | (6.94)% | 38.49% | (7.62)% | (11.53)% | 2.21% |
| Ratio of net expenses to average net assets | 0.68%(d) | 0.66% | 0.66% | 0.66% | 0.66% | 0.66% |
| Ratio of net investment income (loss) to average net assets | 1.84%(d) | 1.80% | 1.77% | 2.18% | 2.46% | 2.38% |
| Portfolio turnover rate | 20%(c) | 30% | 25% | 8% | 23% | 27% |
| Net assets, end of period (in thousands) | $222,472 | $236,277 | $300,778 | $242,250 | $276,921 | $212,103 |
| (a) | The per-share data presented above is based on the average shares outstanding for the period presented. |
| (b) | Assumes initial investment at net asset value at the beginning of each period, reinvestment of all distributions and the complete redemption of the investment at net asset value at the end of each period. |
| (c) | Not annualized. |
| (d) | Annualized. |
The accompanying notes are an integral part of these financial statements.
Pioneer Equity Income Fund | Semiannual Report | 4/30/2331
Financial Highlights (continued)
| | Six Months
Ended
4/30/23
(unaudited) | Year
Ended
10/31/22 | Year
Ended
10/31/21 | Year
Ended
10/31/20 | Year
Ended
10/31/19 | Year
Ended
10/31/18 |
| Class R | | | | | | |
| Net asset value, beginning of period | $ 36.85 | $ 43.67 | $ 32.04 | $ 36.28 | $ 34.98 | $ 36.24 |
| Increase (decrease) from investment operations: | | | | | | |
| Net investment income (loss) (a) | $ 0.20 | $ 0.41 | $ 0.43 | $ 0.48 | $ 0.61 | $ 0.56 |
| Net realized and unrealized gain (loss) on investments | 1.28 | (3.54) | 11.56 | (3.42) | 2.90 | (0.02) |
| Net increase (decrease) from investment operations | $ 1.48 | $ (3.13) | $ 11.99 | $ (2.94) | $ 3.51 | $ 0.54 |
| Distributions to shareowners: | | | | | | |
| Net investment income | $ (0.36) | $ (0.43) | $ (0.36) | $ (0.47) | $ (0.63) | $ (0.40) |
| Net realized gain | (3.55) | (3.26) | — | (0.83) | (1.58) | (1.40) |
| Total distributions | $ (3.91) | $ (3.69) | $ (0.36) | $ (1.30) | $ (2.21) | $ (1.80) |
| Net increase (decrease) in net asset value | $ (2.43) | $ (6.82) | $ 11.63 | $ (4.24) | $ 1.30 | $ (1.26) |
| Net asset value, end of period | $ 34.42 | $ 36.85 | $ 43.67 | $ 32.04 | $ 36.28 | $ 34.98 |
| Total return (b) | 3.91%(c) | (7.61)% | 37.54% | (8.33)% | 10.71% | 1.42% |
| Ratio of net expenses to average net assets | 1.40%(d) | 1.40% | 1.37% | 1.41% | 1.39% | 1.44% |
| Ratio of net investment income (loss) to average net assets | 1.13%(d) | 1.06% | 1.07% | 1.44% | 1.77% | 1.55% |
| Portfolio turnover rate | 20%(c) | 30% | 25% | 8% | 23% | 27% |
| Net assets, end of period (in thousands) | $39,958 | $42,033 | $54,015 | $48,198 | $69,435 | $74,323 |
| (a) | The per-share data presented above is based on the average shares outstanding for the period presented. |
| (b) | Assumes initial investment at net asset value at the beginning of each period, reinvestment of all distributions and the complete redemption of the investment at net asset value at the end of each period. |
| (c) | Not annualized. |
| (d) | Annualized. |
The accompanying notes are an integral part of these financial statements.
32Pioneer Equity Income Fund | Semiannual Report | 4/30/23
| | Six Months
Ended
4/30/23
(unaudited) | Year
Ended
10/31/22 | Year
Ended
10/31/21 | Year
Ended
10/31/20 | Year
Ended
10/31/19 | Year
Ended
10/31/18 |
| Class Y | | | | | | |
| Net asset value, beginning of period | $ 36.56 | $ 43.35 | $ 31.82 | $ 36.05 | $ 34.82 | $ 36.10 |
| Increase (decrease) from investment operations: | | | | | | |
| Net investment income (loss) (a) | $ 0.29 | $ 0.65 | $ 0.66 | $ 0.69 | $ 0.81 | $ 0.86 |
| Net realized and unrealized gain (loss) on investments | 1.28 | (3.52) | 11.48 | (3.42) | 2.88 | (0.08) |
| Net increase (decrease) from investment operations | $ 1.57 | $ (2.87) | $ 12.14 | $ (2.73) | $ 3.69 | $ 0.78 |
| Distributions to shareowners: | | | | | | |
| Net investment income | $ (0.48) | $ (0.66) | $ (0.61) | $ (0.67) | $ (0.88) | $ (0.66) |
| Net realized gain | (3.55) | (3.26) | — | (0.83) | (1.58) | (1.40) |
| Total distributions | $ (4.03) | $ (3.92) | $ (0.61) | $ (1.50) | $ (2.46) | $ (2.06) |
| Net increase (decrease) in net asset value | $ (2.46) | $ (6.79) | $ 11.53 | $ (4.23) | $ 1.23 | $ (1.28) |
| Net asset value, end of period | $ 34.10 | $ 36.56 | $ 43.35 | $ 31.82 | $ 36.05 | $ 34.82 |
| Total return (b) | 4.19%(c) | (7.04)% | 38.36% | (7.76)% | 11.41% | 2.09% |
| Ratio of net expenses to average net assets | 0.85%(d) | 0.78% | 0.78% | 0.77% | 0.78% | 0.76% |
| Ratio of net investment income (loss) to average net assets | 1.69%(d) | 1.67% | 1.65% | 2.08% | 2.37% | 2.37% |
| Portfolio turnover rate | 20%(c) | 30% | 25% | 8% | 23% | 27% |
| Net assets, end of period (in thousands) | $613,136 | $719,094 | $1,124,634 | $934,973 | $1,302,212 | $1,255,700 |
| (a) | The per-share data presented above is based on the average shares outstanding for the period presented. |
| (b) | Assumes initial investment at net asset value at the beginning of each period, reinvestment of all distributions and the complete redemption of the investment at net asset value at the end of each period. |
| (c) | Not annualized. |
| (d) | Annualized. |
The accompanying notes are an integral part of these financial statements.
Pioneer Equity Income Fund | Semiannual Report | 4/30/2333
Notes to Financial Statements | 4/30/23
(unaudited)
1. Organization and Significant Accounting Policies
Pioneer Equity Income Fund (the “Fund”) is a Delaware statutory trust. The Fund is registered under the Investment Company Act of 1940, as amended (the "1940 Act") as a diversified, open-end management investment company. The investment objective of the Fund is current income and long-term growth of capital from a portfolio consisting primarily of income producing equity securities of U.S. corporations.
The Fund offers five classes of shares designated as Class A, Class C, Class K, Class R and Class Y shares. Each class of shares represents an interest in the same portfolio of investments of the Fund and has identical rights (based on relative net asset values) to assets and liquidation proceeds. Share classes can bear different rates of class-specific fees and expenses such as transfer agent and distribution fees. Differences in class-specific fees and expenses will result in differences in net investment income and, therefore, the payment of different dividends from net investment income earned by each class. The Amended and Restated Declaration of Trust of the Fund gives the Board of Trustees the flexibility to specify either per-share voting or dollar-weighted voting when submitting matters for shareholder approval. Under per-share voting, each share of a class of the Fund is entitled to one vote. Under dollar-weighted voting, a shareholder’s voting power is determined not by the number of shares owned, but by the dollar value of the shares on the record date. Each share class has exclusive voting rights with respect to matters affecting only that class, including with respect to the distribution plan for that class. There is no distribution plan for Class K or Class Y shares.
Amundi Asset Management US, Inc., an indirect, wholly owned subsidiary of Amundi and Amundi’s wholly owned subsidiary, Amundi USA, Inc., serves as the Fund’s investment adviser (the “Adviser”). Amundi Distributor US, Inc., an affiliate of the Adviser, serves as the Fund’s
distributor (the “Distributor”).
In March 2020, FASB issued an Accounting Standard Update, ASU 2020-04, Reference Rate Reform (Topic 848) — Facilitation of the Effects of Reference Rate Reform on Financial Reporting (“ASU 2020-04”), which provides optional, temporary relief with respect to the financial reporting of contracts subject to certain types of modifications due to the planned discontinuation of the London Interbank Offered Rate (“LIBOR”) and other LIBOR-based reference rates at the end of 2021. The temporary relief provided by ASU 2020-04 is effective for certain reference rate-related
34Pioneer Equity Income Fund | Semiannual Report | 4/30/23
contract modifications that occur during the period from March 12, 2020 through December 31, 2023. Management is evaluating the impact of ASU 2020-04 on the Fund's investments, derivatives, debt and other contracts, if applicable, that will undergo reference rate-related modifications as a result of the reference rate reform.
The Fund is required to comply with Rule 18f-4 under the 1940 Act, which governs the use of derivatives by registered investment companies. Rule 18f-4 permits funds to enter into derivatives transactions (as defined in Rule 18f-4) and certain other transactions notwithstanding the restrictions on the issuance of “senior securities” under Section 18 of the 1940 Act. Rule 18f-4 requires a fund to establish and maintain a comprehensive derivatives risk management program, appoint a derivatives risk manager and comply with a relative or absolute limit on fund leverage risk calculated based on value-at-risk ("VaR"), unless the fund uses derivatives in only a limited manner (a "limited derivatives user"). The Fund is currently a limited derivatives user for purposes of Rule 18f-4.
The Fund is an investment company and follows investment company accounting and reporting guidance under U.S. Generally Accepted Accounting Principles (“U.S. GAAP”). U.S. GAAP requires the management of the Fund to make estimates and assumptions that affect the reported amounts of assets and liabilities, the disclosure of contingent assets and liabilities at the date of the financial statements, and the reported amounts of income, expenses and gain or loss on investments during the reporting period. Actual results could differ from those estimates.
The following is a summary of significant accounting policies followed by the Fund in the preparation of its financial statements:
| A. | Security Valuation |
| | The net asset value of the Fund is computed once daily, on each day the New York Stock Exchange (“NYSE”) is open, as of the close of regular trading on the NYSE. |
| | Equity securities that have traded on an exchange are valued by using the last sale price on the principal exchange where they are traded. Equity securities that have not traded on the date of valuation, or securities for which sale prices are not available, generally are valued using the mean between the last bid and asked prices or, if both last bid and asked prices are not available, at the last quoted bid price. Last sale and bid and asked prices are provided by independent third party pricing services. In the case of equity securities not traded on an exchange, prices are typically determined by independent third party pricing services using a variety of techniques and methods. |
Pioneer Equity Income Fund | Semiannual Report | 4/30/2335
| | The value of foreign securities is translated into U.S. dollars based on foreign currency exchange rate quotations supplied by a third party pricing source. Trading in non-U.S. equity securities is substantially completed each day at various times prior to the close of the NYSE. The values of such securities used in computing the net asset value of the Fund's shares are determined as of such times. The Adviser may use a fair value model developed by an independent pricing service to value non-U.S. equity securities. |
| | Forward foreign currency exchange contracts are valued daily using the foreign exchange rate or, for longer term forward contract positions, the spot currency rate and the forward points on a daily basis, in each case provided by a third party pricing service. Contracts whose forward settlement date falls between two quoted days are valued by interpolation. |
| | Shares of open-end registered investment companies (including money market mutual funds) are valued at such funds’ net asset value. |
| | Securities for which independent pricing services or broker-dealers are unable to supply prices or for which market prices and/or quotations are not readily available or are considered to be unreliable are valued by a fair valuation team comprised of certain personnel of the Adviser. The Adviser is designated as the valuation designee for the Fund pursuant to Rule 2a-5 under the 1940 Act. The Adviser’s fair valuation team is responsible for monitoring developments that may impact fair valued securities. |
| | Inputs used when applying fair value methods to value a security may include credit ratings, the financial condition of the company, current market conditions and comparable securities. The Adviser may use fair value methods if it is determined that a significant event has occurred after the close of the exchange or market on which the security trades and prior to the determination of the Fund's net asset value. Examples of a significant event might include political or economic news, corporate restructurings, natural disasters, terrorist activity or trading halts. Thus, the valuation of the Fund's securities may differ significantly from exchange prices, and such differences could be material. |
| B. | Investment Income and Transactions |
| | Dividend income is recorded on the ex-dividend date, except that certain dividends from foreign securities where the ex-dividend date may have passed are recorded as soon as the Fund becomes aware of the ex-dividend data in the exercise of reasonable diligence. |
36Pioneer Equity Income Fund | Semiannual Report | 4/30/23
| | Interest income, including interest on income-bearing cash accounts, is recorded on the accrual basis. Dividend and interest income are reported net of unrecoverable foreign taxes withheld at the applicable country rates and net of income accrued on defaulted securities. |
| | Interest and dividend income payable by delivery of additional shares is reclassified as PIK (payment-in-kind) income upon receipt and is included in interest and dividend income, respectively. |
| | Security transactions are recorded as of trade date. Gains and losses on sales of investments are calculated on the identified cost method for both financial reporting and federal income tax purposes. |
| C. | Foreign Currency Translation |
| | The books and records of the Fund are maintained in U.S. dollars. Amounts denominated in foreign currencies are translated into U.S. dollars using current exchange rates. |
| | Net realized gains and losses on foreign currency transactions, if any, represent, among other things, the net realized gains and losses on foreign currency exchange contracts, disposition of foreign currencies and the difference between the amount of income accrued and the U.S. dollars actually received. Further, the effects of changes in foreign currency exchange rates on investments are not segregated on the Statement of Operations from the effects of changes in the market prices of those securities, but are included with the net realized and unrealized gain or loss on investments. |
| D. | Federal Income Taxes |
| | It is the Fund's policy to comply with the requirements of the Internal Revenue Code applicable to regulated investment companies and to distribute all of its net taxable income and net realized capital gains, if any, to its shareowners. Therefore, no provision for federal income taxes is required. As of April 30, 2023, the Fund did not accrue any interest or penalties with respect to uncertain tax positions, which, if applicable, would be recorded as an income tax expense on the Statement of Operations. Tax returns filed within the prior three years remain subject to examination by federal and state tax authorities. |
| | The amount and character of income and capital gain distributions to shareowners are determined in accordance with federal income tax rules, which may differ from U.S. GAAP. Distributions in excess of net investment income or net realized gains are temporary over distributions for financial statement purposes resulting from differences in the recognition or classification of income or distributions for financial |
Pioneer Equity Income Fund | Semiannual Report | 4/30/2337
| | statement and tax purposes. Capital accounts within the financial statements are adjusted for permanent book/tax differences to reflect tax character, but are not adjusted for temporary differences. |
| | A portion of the dividend income recorded by the Fund is from distributions by publicly traded real estate investment trusts (“REITs”), and such distributions for tax purposes may also consist of capital gains and return of capital. The actual return of capital and capital gains portions of such distributions will be determined by formal notifications from the REITs subsequent to the calendar year-end. Distributions received from the REITs that are determined to be a return of capital are recorded by the Fund as a reduction of the cost basis of the securities held and those determined to be capital gain are reflected as such on the Statement of Operations. |
| | The tax character of current year distributions payable will be determined at the end of the current taxable year. The tax character of distributions paid during the year ended October 31, 2022 was as follows: |
| | 2022 |
| Distributions paid from: | |
| Ordinary income | $ 34,827,647 |
| Long-term capital gains | 181,594,525 |
| Total | $216,422,172 |
The following shows the components of distributable earnings (losses) on a federal income tax basis at October 31, 2022:
| | 2022 |
| Distributable earnings/(losses): | |
| Undistributed ordinary income | $ 8,811,087 |
| Undistributed long-term capital gains | 170,180,636 |
| Other book/tax temporary differences | (136) |
| Net unrealized appreciation | 470,773,108 |
| Total | $649,764,695 |
The difference between book-basis and tax-basis net unrealized appreciation is attributable to the tax deferral of losses on wash sales and tax basis adjustments on real estate investment trust (REIT) holdings, partnerships and common stock holdings.
| E. | Fund Shares |
| | The Fund records sales and repurchases of its shares as of trade date. The Distributor earned $24,271 in underwriting commissions on the sale of Class A shares during the six months ended April 30, 2023. |
38Pioneer Equity Income Fund | Semiannual Report | 4/30/23
| F. | Class Allocations |
| | Income, common expenses and realized and unrealized gains and losses are calculated at the Fund level and allocated daily to each class of shares based on its respective percentage of adjusted net assets at the beginning of the day. |
| | Distribution fees are calculated based on the average daily net asset value attributable to Class A, Class C and Class R shares of the Fund, respectively (see Note 5). Class K and Class Y shares do not pay distribution fees. All expenses and fees paid to the Fund’s transfer agent for its services are allocated among the classes of shares based on the number of accounts in each class and the ratable allocation of related out-of-pocket expenses (see Note 4). |
| | Distributions to shareowners are recorded as of the ex-dividend date. Distributions paid by the Fund with respect to each class of shares are calculated in the same manner and at the same time, except that net investment income dividends to Class A, Class C, Class K, Class R and Class Y shares can reflect different transfer agent and distribution
expense rates. |
| G. | Risks |
| | The value of securities held by the Fund may go up or down, sometimes rapidly or unpredictably, due to general market conditions, such as real or perceived adverse economic, political or regulatory conditions, recessions, the spread of infectious illness or other public health issues, inflation, changes in interest rates, armed conflict including Russia's military invasion of Ukraine, sanctions against Russia, other nations or individuals or companies and possible countermeasures, lack of liquidity in the bond markets or adverse investor sentiment. In the past several years, financial markets have experienced increased volatility, depressed valuations, decreased liquidity and heightened uncertainty. These conditions may continue, recur, worsen or spread. Recently, inflation and interest rates have increased and may rise further. These circumstances could adversely affect the value and liquidity of the Fund's investments, impair the Fund's ability to satisfy redemption requests, and negatively impact the Fund's performance. |
| | The global pandemic of the novel coronavirus respiratory disease designated COVID-19 has resulted in major disruption to economies and markets around the world, including the United States. Global financial markets have experienced extreme volatility and severe losses, and trading in many instruments has been disrupted. Liquidity for many instruments has been greatly reduced for periods of time. Some sectors |
Pioneer Equity Income Fund | Semiannual Report | 4/30/2339
| | of the economy and individual issuers have experienced particularly large losses. These circumstances may continue to affect adversely the value and liquidity of the Fund's investments. Following Russia’s invasion of Ukraine, Russian securities have lost all, or nearly all, their market value. Other securities or markets could be similarly affected by past or future political, geopolitical or other events or conditions. |
| | Governments and central banks, including the U.S. Federal Reserve, have taken extraordinary and unprecedented actions to support local and global economies and the financial markets. These actions have resulted in significant expansion of public debt, including in the U.S. The consequences of high public debt, including its future impact on the economy and securities markets, may not be known for some time. |
| | The U.S. and other countries are periodically involved in disputes over trade and other matters, which may result in tariffs, investment restrictions and adverse impacts on affected companies and securities. For example, the U.S. has imposed tariffs and other trade barriers on Chinese exports, has restricted sales of certain categories of goods to China, and has established barriers to investments in China. Trade disputes may adversely affect the economies of the U.S. and its trading partners, as well as companies directly or indirectly affected and financial markets generally. If the political climate between the U.S. and China does not improve or continues to deteriorate, if China were to attempt unification of Taiwan by force, or if other geopolitical conflicts develop or get worse, economies, markets and individual securities may be severely affected both regionally and globally, and the value of the Fund's assets may go down. |
| | At times, the Fund’s investments may represent industries or industry sectors that are interrelated or have common risks, making the Fund more susceptible to any economic, political, or regulatory developments or other risks affecting those industries and sectors. |
| | Normally, the Fund invests at least 80% of its net assets in equity securities of large companies. Large companies may fall out of favor with investors and underperform the overall equity market. |
| | The Fund’s investments in foreign markets and countries with limited developing markets may subject the Fund to a greater degree of risk than investments in a developed market. These risks include disruptive political or economic conditions, military conflicts and sanctions, terrorism, sustained economic downturns, financial instability, less liquid trading markets, extreme price volatility, currency risks, reduction of government or central bank support, inadequate accounting standards, tariffs, tax disputes or other tax burdens, nationalization or |
40Pioneer Equity Income Fund | Semiannual Report | 4/30/23
| | expropriation of assets, and the imposition of adverse governmental laws, arbitrary application of laws and regulations or lack of rule of law and investment and repatriation restrictions. Lack of information and less market regulation also may affect the value of these securities. Withholding and other non-U.S. taxes may decrease the Fund’s return. Non-U.S. issuers may be located in parts of the world that have historically been prone to natural disasters. Investing in depositary receipts is subject to many of the same risks as investing directly in non-U.S. issuers. Depositary receipts may involve higher expenses and may trade at a discount (or premium) to the underlying security. |
| | Russia launched a large-scale invasion of Ukraine on February 24, 2022. In response to the military action by Russia, various countries, including the U.S., the United Kingdom, and European Union issued broad-ranging economic sanctions against Russia and Belarus and certain companies and individuals. Since then, Russian securities have lost all, or nearly all, their market value, and many other issuers, securities and markets have been adversely affected. The United States and other countries may impose sanctions on other countries, companies and individuals in light of Russia’s military invasion. The extent and duration of the military action or future escalation of such hostilities, the extent and impact of existing and future sanctions, market disruptions and volatility, and the result of any diplomatic negotiations cannot be predicted. These and any related events could have a significant impact on the value and liquidity of certain Fund investments, on Fund performance and the value of an investment in the Fund, particularly with respect to securities and commodities, such as oil, natural gas and food commodities, as well as other sectors with exposure to Russian issuers or issuers in other countries affected by the invasion, and are likely to have collateral impacts on market sectors globally. |
| | As of the date of this report, a significant portion of the Fund’s net asset value is attributable to net unrealized capital gains on portfolio securities. If the Fund realizes capital gains in excess of realized capital losses and any available capital loss carryforwards in any fiscal year, it generally will be required to distribute that excess to shareholders. You may receive distributions that are attributable to appreciation that was present in the Fund’s portfolio securities at the time you made your investment but had not been realized at that time, or that are attributable to capital gains or other income that, although realized by the Fund, had not yet been distributed at the time you made your investment. Unless you purchase shares through a tax-advantaged account (such as an IRA or 401(k) plan), these distributions will be |
Pioneer Equity Income Fund | Semiannual Report | 4/30/2341
| | taxable to you. You should consult your tax adviser about the tax consequences of your investment in the Fund. |
| | The Fund may invest in REIT securities, the value of which can fall for a variety of reasons, such as declines in rental income, fluctuating interest rates, poor property management, environmental liabilities, uninsured damage, increased competition, or changes in real estate tax laws. |
| | With the increased use of technologies such as the Internet to conduct business, the Fund is susceptible to operational, information security and related risks. While the Fund’s Adviser has established business continuity plans in the event of, and risk management systems to prevent, limit or mitigate, such cyber-attacks, there are inherent limitations in such plans and systems, including the possibility that certain risks have not been identified. Furthermore, the Fund cannot control the cybersecurity plans and systems put in place by service providers to the Fund such as the Fund’s custodian and accounting agent, and the Fund’s transfer agent. In addition, many beneficial owners of Fund shares hold them through accounts at broker-dealers, retirement platforms and other financial market participants over which neither the Fund nor the Adviser exercises control. Each of these may in turn rely on service providers to them, which are also subject to the risk of cyber-attacks. Cybersecurity failures or breaches at the Adviser or the Fund’s service providers or intermediaries have the ability to cause disruptions and impact business operations, potentially resulting in financial losses, interference with the Fund’s ability to calculate its net asset value, impediments to trading, the inability of Fund shareowners to effect share purchases, redemptions or exchanges or receive distributions, loss of or unauthorized access to private shareowner information and violations of applicable privacy and other laws, regulatory fines, penalties, reputational damage, or additional compliance costs. Such costs and losses may not be covered under any insurance. In addition, maintaining vigilance against cyber-attacks may involve substantial costs over time, and system enhancements may themselves be subject to cyber-attacks. |
| | The Fund’s prospectus contains unaudited information regarding the Fund’s principal risks. Please refer to that document when considering the Fund’s principal risks. |
2. Management Agreement
The Adviser manages the Fund’s portfolio. Management fees payable under the Fund's Investment Management Agreement with the Adviser are calculated daily and paid monthly at the annual rate of 0.60% of the Fund’s average daily net assets up to $10 billion and 0.575% on assets over
42Pioneer Equity Income Fund | Semiannual Report | 4/30/23
$10 billion. For the six months ended April 30, 2023, the effective management fee (excluding waivers and/or assumption of expenses) was equivalent to 0.60% of the Fund’s average daily net assets.
In addition, under the management and administration agreements, certain other services and costs, including accounting, regulatory reporting and insurance premiums, are paid by the Fund as administrative reimbursements.
3. Compensation of Officers and Trustees
The Fund pays an annual fee to its Trustees. The Adviser reimburses the Fund for fees paid to the Interested Trustees. Except for the chief compliance officer, the Fund does not pay any salary or other compensation to its officers. The Fund pays a portion of the chief compliance officer's compensation for his services as the Fund's chief compliance officer. Amundi US pays the remaining portion of the chief compliance officer's compensation. For the six months ended April 30, 2023, the Fund paid $58,170 in Officers' and Trustees' compensation, which is reflected on the Statement of Operations as Officers' and Trustees' fees. At April 30, 2023, on its Statement of Assets and Liabilities, the Fund had a payable for Trustees' fees of $11,920 and a payable for administrative expenses of $42,966, which includes the payable for Officers' compensation.
4. Transfer Agent
BNY Mellon Investment Servicing (US) Inc. serves as the transfer agent to the Fund at negotiated rates. Transfer agent fees and payables shown on the Statement of Operations and the Statement of Assets and Liabilities, respectively, include sub-transfer agent expenses incurred through the Fund’s omnibus relationship contracts.
In addition, the Fund reimbursed the transfer agent for out-of-pocket expenses incurred by the transfer agent related to shareowner communications activities such as proxy and statement mailings, and outgoing phone calls. For the six months ended April 30, 2023, such out-of-pocket expenses by class of shares were as follows:
| Shareowner Communications: | |
| Class A | $47,951 |
| Class C | 4,014 |
| Class K | 2,442 |
| Class R | 910 |
| Class Y | 24,104 |
| Total | $79,421 |
Pioneer Equity Income Fund | Semiannual Report | 4/30/2343
5. Distribution and Service Plans
The Fund has adopted a distribution plan (the “Plan”) pursuant to Rule 12b-1 of the Investment Company Act of 1940 with respect to its Class A, Class C and Class R shares. Pursuant to the Plan, the Fund pays the Distributor 0.25% of the Fund's average daily net assets attributable to Class A shares as compensation for personal services and/or account maintenance services or distribution services with regard to Class A shares. Pursuant to the Plan, the Fund also pays the Distributor 1.00% of the average daily net assets attributable to Class C shares. The fee for Class C shares consists of a 0.25% service fee and a 0.75% distribution fee paid as compensation for personal services and/or account maintenance services or distribution services with regard to Class C shares. Pursuant to the Plan, the Fund further pays the Distributor 0.50% of the average daily net assets attributable to Class R shares for distribution services.
The Fund also has adopted a separate service plan for Class R shares (the “Service Plan”). The Service Plan authorizes the Fund to pay securities dealers, plan administrators or other service organizations that agree to provide certain services to retirement plans or plan participants holding shares of the Fund a service fee of up to 0.25% of the Fund’s average daily net assets attributable to Class R shares held by such plans.
In addition, redemptions of Class A and Class C shares may be subject to a contingent deferred sales charge (“CDSC”). A CDSC of 1.00% may be imposed on redemptions of certain net asset value purchases of Class A shares within 12 months of purchase. Redemptions of Class C shares within 12 months of purchase are subject to a CDSC of 1.00% based on the lower of cost or market value of shares being redeemed. Shares purchased as part of an exchange remain subject to any CDSC that applied to the original purchase of those shares. There is no CDSC for Class K, Class R or Class Y shares. Proceeds from the CDSCs are paid to the Distributor. For the six months ended April 30, 2023, CDSCs in the amount of $9,086 were paid to the Distributor.
6. Line of Credit Facility
The Fund, along with certain other funds in the Pioneer Family of Funds, participates in a committed, unsecured revolving line of credit (“credit facility”). Borrowings are used solely for temporary or emergency purposes. The Fund may borrow up to the lesser of the amount available under the credit facility or the limits set for borrowing by the Fund’s prospectus and the 1940 Act. The Fund participates in a facility in the amount of $380 million. Under such credit facility, depending on the type of loan, interest on borrowings is payable at the Secured Overnight Financing Rate ("SOFR") plus a credit spread. The Fund also pays both an upfront fee and
44Pioneer Equity Income Fund | Semiannual Report | 4/30/23
an annual commitment fee to participate in the credit facility. The upfront fee in the amount of 0.15% of the total credit facility and the commitment fee in the amount of 0.30% of the daily unused portion of each lender's commitment are allocated among participating funds based on an allocation schedule set forth in the credit agreement. For the six months ended April 30, 2023, the Fund had no borrowings under the credit facility.
Pioneer Equity Income Fund | Semiannual Report | 4/30/2345
Trustees, Officers and Service Providers
Trustees
Thomas J. Perna, Chairman
John E. Baumgardner, Jr.
Diane Durnin
Benjamin M. Friedman
Lisa M. Jones
Craig C. MacKay
Lorraine H. Monchak
Marguerite A. Piret
Fred J. Ricciardi
Kenneth J. Taubes
Officers
Lisa M. Jones, President and
Chief Executive Officer
Anthony J. Koenig, Jr., Treasurer
and Chief Financial and
Accounting Officer
Christopher J. Kelley, Secretary and
Chief Legal Officer
Investment Adviser and Administrator
Amundi Asset Management US, Inc.
Custodian and Sub-Administrator
The Bank of New York Mellon Corporation
Independent Registered Public Accounting Firm
Ernst & Young LLP
Principal Underwriter
Amundi Distributor US, Inc.
Legal Counsel
Morgan, Lewis & Bockius LLP
Transfer Agent
BNY Mellon Investment Servicing (US) Inc.
Proxy Voting Policies and Procedures of the Fund are available without charge, upon request, by calling our toll free number (1-800-225-6292). Information regarding how the Fund voted proxies relating to portfolio securities during the most recent 12-month period ended June 30 is publicly available to shareowners at www.amundi.com/us. This information is also available on the Securities and Exchange Commission’s web site at www.sec.gov.
46Pioneer Equity Income Fund | Semiannual Report | 4/30/23
How to Contact Amundi
We are pleased to offer a variety of convenient ways for you to contact us for assistance or information.
Call us for:
Account Information, including existing accounts,
new accounts, prospectuses, applications
and service forms
1-800-225-6292
FactFoneSM for automated fund yields, prices,
account information and transactions
1-800-225-4321
| Retirement plans information | 1-800-622-0176 |
Write to us:
Amundi
P.O. Box 534427
Pittsburgh, PA 15253-4427
| Our toll-free fax | 1-800-225-4240 |
| Our internet e-mail address | us.askamundi@amundi.com
(for general questions about Amundi only) |
Visit our web site: www.amundi.com/us
This report must be preceded or accompanied by a prospectus.
The Fund files a complete schedule of portfolio holdings with the Securities and Exchange Commission for the first and third quarters of each fiscal year as an exhibit to its reports on Form N-PORT. Shareholders may view the filed Form N-PORT by visiting the Commission’s web site at https://www.sec.gov.
Amundi Asset Management US, Inc.
60 State Street
Boston, MA 02109
www.amundi.com/us
Securities offered through Amundi Distributor US, Inc.
60 State Street, Boston, MA 02109
Underwriter of Pioneer Mutual Funds, Member SIPC
© 2023 Amundi Asset Management US, Inc. 19381-17-0623
ITEM 2. CODE OF ETHICS.
(a) Disclose whether, as of the end of the period covered by the report, the registrant has adopted a code of ethics that applies to the registrant’s principal executive officer, principal financial officer, principal accounting officer or controller, or persons performing similar functions, regardless of whether these individuals are employed by the registrant or a third party. If the registrant has not adopted such a code of ethics, explain why it has not done so.
The registrant has adopted, as of the end of the period covered by this report, a code of ethics that applies to the registrant’s principal executive officer, principal financial officer, principal accounting officer and controller.
(b) For purposes of this Item, the term “code of ethics” means written standards that are reasonably designed to deter wrongdoing and to promote:
(1) Honest and ethical conduct, including the ethical handling of actual or apparent conflicts of interest between personal and professional relationships;
(2) Full, fair, accurate, timely, and understandable disclosure in reports and documents that a registrant files with, or submits to, the Commission and in other public communications made by the registrant;
(3) Compliance with applicable governmental laws, rules, and regulations;
(4) The prompt internal reporting of violations of the code to an appropriate person or persons identified in the code; and
(5) Accountability for adherence to the code.
(c) The registrant must briefly describe the nature of any amendment, during the period covered by the report, to a provision of its code of ethics that applies to the registrant’s principal executive officer, principal financial officer, principal accounting officer or controller, or persons performing similar functions, regardless of whether these individuals are employed by the registrant or a third party, and that relates to any element of the code of ethics definition enumerated in paragraph (b) of this Item. The registrant must file a copy of any such amendment as an exhibit pursuant to Item 10(a), unless the registrant has elected to satisfy paragraph (f) of this Item by posting its code of ethics on its website pursuant to paragraph (f)(2) of this Item, or by undertaking to provide its code of ethics to any person without charge, upon request, pursuant to paragraph (f)(3) of this Item.
The registrant has made no amendments to the code of ethics during the period covered by this report.
(d) If the registrant has, during the period covered by the report, granted a waiver, including an implicit waiver, from a provision of the code of ethics to the registrant’s principal executive officer, principal financial officer, principal accounting officer or controller, or persons performing similar functions, regardless of whether these individuals are employed by the registrant or a third party, that relates to one or more of the items set forth in paragraph (b) of this Item, the registrant must briefly describe the nature of the waiver, the name of the person to whom the waiver was granted, and the date of the waiver.
Not applicable.
(e) If the registrant intends to satisfy the disclosure requirement under paragraph (c) or (d) of this Item regarding an amendment to, or a waiver from, a provision of its code of ethics that applies to the registrant’s principal executive officer, principal financial officer, principal accounting officer or controller, or persons performing similar functions and that relates to any element of the code of ethics definition enumerated in paragraph (b) of this Item by posting such information on its Internet website, disclose the registrant’s Internet address and such intention.
Not applicable.
(f) The registrant must:
(1) File with the Commission, pursuant to Item 12(a)(1), a copy of its code of ethics that applies to the registrant’s principal executive officer, principal financial officer, principal accounting officer or controller, or persons performing similar functions, as an exhibit to its annual report on this Form N-CSR (see attachment);
(2) Post the text of such code of ethics on its Internet website and disclose, in its most recent report on this Form N-CSR, its Internet address and the fact that it has posted such code of ethics on its Internet website; or
(3) Undertake in its most recent report on this Form N-CSR to provide to any person without charge, upon request, a copy of such code of ethics and explain the manner in which such request may be made. See Item 10(2)
ITEM 3. AUDIT COMMITTEE FINANCIAL EXPERT.
(a) (1) Disclose that the registrant’s Board of Trustees has determined that the registrant either:
(i) Has at least one audit committee financial expert serving on its audit committee; or
(ii) Does not have an audit committee financial expert serving on its audit committee.
The registrant’s Board of Trustees has determined that the registrant has at least one audit committee financial expert.
(2) If the registrant provides the disclosure required by paragraph (a)(1)(i) of this Item, it must disclose the name of the audit committee financial expert and whether that person is “independent.” In order to be considered “independent” for purposes of this Item, a member of an audit committee may not, other than in his or her capacity as a member of the audit committee, the Board of Trustees, or any other board committee:
(i) Accept directly or indirectly any consulting, advisory, or other compensatory fee from the issuer; or
(ii) Be an “interested person” of the investment company as defined in Section 2(a)(19) of the Act (15 U.S.C. 80a-2(a)(19)).
Mr. Fred J. Ricciardi, an independent Trustee, is such an audit committee financial expert.
(3) If the registrant provides the disclosure required by paragraph (a)(1) (ii) of this Item, it must explain why it does not have an audit committee financial expert.
Not applicable.
ITEM 4. PRINCIPAL ACCOUNTANT FEES AND SERVICES.
(a) Disclose, under the caption AUDIT FEES, the aggregate fees billed for each of the last two fiscal years for professional services rendered by the principal accountant for the audit of the registrant’s annual financial statements or services that are normally provided by the accountant in connection with statutory and regulatory filings or engagements for those fiscal years.
N/A
(b) Disclose, under the caption AUDIT-RELATED FEES, the aggregate fees billed in each of the last two fiscal years for assurance and related services by the principal accountant that are reasonably related to the performance of the audit of the registrant’s financial statements and are not reported under paragraph (a) of this Item. Registrants shall describe the nature of the services comprising the fees disclosed under this category.
N/A
(c) Disclose, under the caption TAX FEES, the aggregate fees billed in each of the last two fiscal years for professional services rendered by the principal accountant for tax compliance, tax advice, and tax planning. Registrants shall describe the nature of the services comprising the fees disclosed under this category.
N/A
(d) Disclose, under the caption ALL OTHER FEES, the aggregate fees billed in each of the last two fiscal years for products and services provided by the principal accountant, other than the services reported in paragraphs (a) through (c) of this Item. Registrants shall describe the nature of the services comprising the fees disclosed under this category.
N/A
(e) (1) Disclose the audit committee’s pre-approval policies and procedures described in paragraph (c)(7) of Rule 2-01 of Regulation S-X.
PIONEER FUNDS
APPROVAL OF AUDIT, AUDIT-RELATED, TAX AND OTHER SERVICES
PROVIDED BY THE INDEPENDENT AUDITOR
SECTION I - POLICY PURPOSE AND APPLICABILITY
The Pioneer Funds recognize the importance of maintaining the independence of their outside auditors. Maintaining independence is a shared responsibility involving Amundi Asset Management US, Inc., the audit committee and the independent auditors.
The Funds recognize that a Fund’s independent auditors: 1) possess knowledge of the Funds, 2) are able to incorporate certain services into the scope of the audit, thereby avoiding redundant work, cost and disruption of Fund personnel and processes, and 3) have expertise that has value to the Funds. As a result, there are situations where it is desirable to use the Fund’s independent auditors for services in addition to the annual audit and where the potential for conflicts of interests are minimal. Consequently, this policy, which is intended to comply with Rule 210.2-01(C)(7), sets forth guidelines and procedures to be followed by the Funds when retaining the independent audit firm to perform audit, audit-related tax and other services under those circumstances, while also maintaining independence.
Approval of a service in accordance with this policy for a Fund shall also constitute approval for any other Fund whose pre-approval is required pursuant to Rule 210.2-01(c)(7)(ii).
In addition to the procedures set forth in this policy, any non-audit services that may be provided consistently with Rule 210.2-01 may be approved by the Audit Committee itself and any pre-approval that may be waived in accordance with Rule 210.2-01(c)(7)(i)(C) is hereby waived.
Selection of a Fund’s independent auditors and their compensation shall be determined by the Audit Committee and shall not be subject to this policy.
SECTION II - POLICY
| | | | |
| SERVICE CATEGORY | | SERVICE CATEGORY DESCRIPTION | | SPECIFIC PRE-APPROVED SERVICE SUBCATEGORIES |
| | |
| I. AUDIT SERVICES | | Services that are directly related to performing the independent audit of the Funds | | • Accounting research assistance • SEC consultation, registration statements, and reporting |
| | |
| | | | • Tax accrual related matters |
| | |
| | | | • Implementation of new accounting standards |
| | |
| | | | • Compliance letters (e.g. rating agency letters) |
| | |
| | | | • Regulatory reviews and assistance regarding financial matters |
| | |
| | | | • Semi-annual reviews (if requested) |
| | |
| | | | | • Comfort letters for closed end offerings |
| | |
II. AUDIT-RELATED SERVICES | | Services which are not prohibited under Rule 210.2-01(C)(4) (the “Rule”) and are related extensions of the audit services support the audit, or use the knowledge/expertise gained from the audit procedures as a foundation to complete the project. In most cases, if the Audit-Related Services are not performed by the Audit firm, the scope of the Audit Services would likely increase. The Services are typically well-defined and governed by accounting professional standards (AICPA, SEC, etc.) | | • AICPA attest and agreed-upon procedures • Technology control assessments • Financial reporting control assessments • Enterprise security architecture assessment |
| | |
| AUDIT COMMITTEE APPROVAL POLICY | | AUDIT COMMITTEE REPORTING POLICY |
| |
• “One-time” pre-approval for the audit period for all pre-approved specific service subcategories. Approval of the independent auditors as auditors for a Fund shall constitute pre approval for these services. | | • A summary of all such services and related fees reported at each regularly scheduled Audit Committee meeting. |
| |
• “One-time” pre-approval for the fund fiscal year within a specified dollar limit for all pre-approved specific service subcategories | | • A summary of all such services and related fees (including comparison to specified dollar limits) reported quarterly. |
| | |
• Specific approval is needed to exceed the pre-approved dollar limit for these services (see general Audit Committee approval policy below for details on obtaining specific approvals) • Specific approval is needed to use the Fund’s auditors for Audit-Related Services not denoted as “pre-approved”, or to add a specific service subcategory as “pre-approved” | | |
SECTION III - POLICY DETAIL, CONTINUED
| | | | |
| SERVICE CATEGORY | | SERVICE CATEGORY DESCRIPTION | | SPECIFIC PRE-APPROVED SERVICE SUBCATEGORIES |
| III. TAX SERVICES | | Services which are not prohibited by the Rule, if an officer of the Fund determines that using the Fund’s auditor to provide these services creates significant synergy in the form of efficiency, minimized disruption, or the ability to maintain a desired level of confidentiality. | | • Tax planning and support • Tax controversy assistance • Tax compliance, tax returns, excise tax returns and support • Tax opinions |
| | |
| AUDIT COMMITTEE APPROVAL POLICY | | AUDIT COMMITTEE REPORTING POLICY |
| |
• “One-time” pre-approval for the fund fiscal year within a specified dollar limit | | • A summary of all such services and related fees (including comparison to specified dollar limits) reported quarterly. |
| |
• Specific approval is needed to exceed the pre-approved dollar limits for these services (see general Audit Committee approval policy below for details on obtaining specific approvals) | | |
| |
• Specific approval is needed to use the Fund’s auditors for tax services not denoted as pre-approved, or to add a specific service subcategory as “pre-approved” | | |
SECTION III - POLICY DETAIL, CONTINUED
| | | | |
| SERVICE CATEGORY | | SERVICE CATEGORY DESCRIPTION | | SPECIFIC PRE-APPROVED SERVICE SUBCATEGORIES |
IV. OTHER SERVICES A. SYNERGISTIC, UNIQUE QUALIFICATIONS | | Services which are not prohibited by the Rule, if an officer of the Fund determines that using the Fund’s auditor to provide these services creates significant synergy in the form of efficiency, minimized disruption, the ability to maintain a desired level of confidentiality, or where the Fund’s auditors posses unique or superior qualifications to provide these services, resulting in superior value and results for the Fund. | | • Business Risk Management support • Other control and regulatory compliance projects |
| | |
| AUDIT COMMITTEE APPROVAL POLICY | | AUDIT COMMITTEE REPORTING POLICY |
| |
• “One-time” pre-approval for the fund fiscal year within a specified dollar limit | | • A summary of all such services and related fees (including comparison to specified dollar limits) reported quarterly. |
| |
• Specific approval is needed to exceed the pre-approved dollar limits for these services (see general Audit Committee approval policy below for details on obtaining specific approvals) | | |
| |
• Specific approval is needed to use the Fund’s auditors for “Synergistic” or “Unique Qualifications” Other Services not denoted as pre-approved to the left, or to add a specific service subcategory as “pre-approved” | | |
SECTION III - POLICY DETAIL, CONTINUED
| | | | |
| SERVICE CATEGORY | | SERVICE CATEGORY DESCRIPTION | | SPECIFIC PROHIBITED SERVICE SUBCATEGORIES |
| PROHIBITED SERVICES | | Services which result in the auditors losing independence status under the Rule. | | 1. Bookkeeping or other services related to the accounting records or financial statements of the audit client* |
| | |
| | | | 2. Financial information systems design and implementation* |
| | |
| | | | 3. Appraisal or valuation services, fairness* opinions, or contribution-in-kind reports |
| | |
| | | | 4. Actuarial services (i.e., setting actuarial reserves versus actuarial audit work)* |
| | |
| | | | 5. Internal audit outsourcing services* |
| | |
| | | | 6. Management functions or human resources |
| | |
| | | | 7. Broker or dealer, investment advisor, or investment banking services |
| | |
| | | | 8. Legal services and expert services unrelated to the audit |
| | |
| | | | | 9. Any other service that the Public Company Accounting Oversight Board determines, by regulation, is impermissible |
| | |
| AUDIT COMMITTEE APPROVAL POLICY | | AUDIT COMMITTEE REPORTING POLICY |
• These services are not to be performed with the exception of the(*) services that may be permitted if they would not be subject to audit procedures at the audit client (as defined in rule 2-01(f)(4)) level the firm providing the service. | | • A summary of all services and related fees reported at each regularly scheduled Audit Committee meeting will serve as continual confirmation that has not provided any restricted services. |
GENERAL AUDIT COMMITTEE APPROVAL POLICY:
| | • | | For all projects, the officers of the Funds and the Fund’s auditors will each make an assessment to determine that any proposed projects will not impair independence. |
| | • | | Potential services will be classified into the four non-restricted service categories and the “Approval of Audit, Audit-Related, Tax and Other Services” Policy above will be applied. Any services outside the specific pre-approved service subcategories set forth above must be specifically approved by the Audit Committee. |
| | • | | At least quarterly, the Audit Committee shall review a report summarizing the services by service category, including fees, provided by the Audit firm as set forth in the above policy. |
(2) Disclose the percentage of services described in each of paragraphs (b) through (d) of this Item that were approved by the audit committee pursuant to paragraph (c)(7)(i)(C) of Rule 2-01 of Regulation S-X.
N/A
(f) If greater than 50 percent, disclose the percentage of hours expended on the principal accountants engagement to audit the registrant’s financial statements for the most recent fiscal year that were attributed to work performed by persons other than the principal accountant’s full-time, permanent employees.
N/A
(g) Disclose the aggregate non-audit fees billed by the registrants accountant for services rendered to the registrant, and rendered to the registrants investment adviser (not including any sub-adviser whose role is primarily portfolio management and is subcontracted with or overseen by another investment adviser), and any entity controlling, controlled by, or under common control with the adviser that provides ongoing services to the registrant for each of the last two fiscal years of the registrant.
N/A
(h) Disclose whether the registrants audit committee of the Board of Trustees has considered whether the provision of non-audit services that were rendered to the registrants investment adviser (not including any subadviser whose role is primarily portfolio management and is subcontracted with or overseen by another investment adviser), and any entity controlling, controlled by, or under common control with the investment adviser that provides ongoing services to the registrant that were not pre-approved pursuant to paragraph (c)(7)(ii) of Rule 2-01 of Regulation S-X is compatible with maintaining the principal accountant’s independence.
The Fund’s audit committee of the Board of Trustees has considered whether the provision of non-audit services that were rendered to the Affiliates (as defined) that were not pre- approved pursuant to paragraph (c)(7)(ii) of Rule 2-01 of Regulation S-X is compatible with maintaining the principal accountant’s independence.
ITEM 5. AUDIT COMMITTEE OF LISTED REGISTRANTS
(a) If the registrant is a listed issuer as defined in Rule 10A-3 under the Exchange Act (17 CFR 240.10A-3), state whether or not the registrant has a separately-designated standing audit committee established in accordance with Section 3(a)(58)(A) of the Exchange Act (15 U.S.C. 78c(a)(58)(A)). If the registrant has such a committee, however designated, identify each committee member. If the entire board of directors is acting as the registrant’s audit committee as specified in Section 3(a)(58)(B) of the Exchange Act (15 U.S.C. 78c(a)(58)(B)), so state.
N/A
(b) If applicable, provide the disclosure required by Rule 10A-3(d) under the Exchange Act (17 CFR 240.10A-3(d)) regarding an exemption from the listing standards for audit committees.
N/A
ITEM 6. SCHEDULE OF INVESTMENTS.
File Schedule of Investments in securities of unaffiliated issuers as of the close of the reporting period as set forth in 210.1212 of Regulation S-X [17 CFR 210.12-12], unless the schedule is included as part of the report to shareholders filed under Item 1 of this Form.
Included in Item 1
ITEM 7. DISCLOSURE OF PROXY VOTING POLICIES AND PROCEDURES FOR CLOSED-END MANAGEMENT INVESTMENT COMPANIES.
A closed-end management investment company that is filing an annual report on this Form N-CSR must, unless it invests exclusively in non-voting securities, describe the policies and procedures that it uses to determine how to vote proxies relating to portfolio securities, including the procedures that the company uses when a vote presents a conflict between the interests of its shareholders, on the one hand, and those of the company’s investment adviser; principal underwriter; or any affiliated person (as defined in Section 2(a)(3) of the Investment Company Act of 1940 (15 U.S.C. 80a-2(a)(3)) and the rules thereunder) of the company, its investment adviser, or its principal underwriter, on the other. Include any policies and procedures of the company’s investment adviser, or any other third party, that the company uses, or that are used on the company’s behalf, to determine how to vote proxies relating to portfolio securities.
N/A
ITEM 8. PORTFOLIO MANAGERS OF CLOSED-END MANAGEMENT INVESTMENT COMPANIES.
(a) If the registrant is a closed-end management investment company that is filing an annual report on this Form N-CSR, provide the following information:
(1) State the name, title, and length of service of the person or persons employed by or associated with the registrant or an investment adviser of the registrant who are primarily responsible for the day-to-day management of the registrant’s portfolio (“Portfolio Manager”). Also state each Portfolio Manager’s business experience during the past 5 years.
N/A
ITEM 9. PURCHASES OF EQUITY SECURITIES BY CLOSED-END MANAGEMENT INVESTMENT COMPANY AND AFFILIATED PURCHASERS.
(a) If the registrant is a closed-end management investment company, in the following tabular format, provide the information specified in paragraph (b) of this Item with respect to any purchase made by or on behalf of the registrant or any affiliated purchaser, as defined in Rule 10b-18(a)(3) under the Exchange Act (17 CFR 240.10b-18(a)(3)), of shares or other units of any class of the registrant’s equity securities that is registered by the registrant pursuant to Section 12 of the Exchange Act (15 U.S.C. 781).
N/A
ITEM 10. SUBMISSION OF MATTERS TO A VOTE OF SECURITY HOLDERS.
Describe any material changes to the procedures by which shareholders may recommend nominees to the registrant’s board of directors, where those changes were implemented after the registrant last provided disclosure in response to the requirements of Item 407(c)(2)(iv) of Regulation S-R(17 CFR 229.407)(as required by Item 22(b)(15)) of Schedule 14A (17 CFR 240.14a-101), or this Item.
There have been no material changes to the procedures by which the shareholders may recommend nominees to the registrant’s board of directors since the registrant last provided disclosure in response to the requirements of Item 407(c)(2)(iv) of Regulation S-R of Schedule 14(A) in its definitive proxy statement, or this item.
ITEM 11. CONTROLS AND PROCEDURES.
(a) Disclose the conclusions of the registrant’s principal executive and principal financials officers, or persons performing similar functions, regarding the effectiveness of the registrant’s disclosure controls and procedures (as defined in Rule 30a-3(c) under the Act (17 CFR 270.30a-3(c))) as of a date within 90 days of the filing date of the report that includes the disclosure required by this paragraph, based on the evaluation of these controls and procedures required by Rule 30a-3(b) under the Act (17 CFR 270.30(a)-3(b) and Rules 13a-15(b) or 15d-15(b) under the Exchange Act (17 CFR 240.13a-15(b) or 240.15d-15(b)).
The registrant’s principal executive officer and principal financial officer have concluded that the registrant’s disclosure controls and procedures are effective based on the evaluation of these controls and procedures as of a date within 90 days of the filing date of this report.
(b) Disclose any change in the registrant’s internal control over financial reporting (as defined in Rule 30a-3(d) under the Act (17CFR 270.30a-3(d)) that occurred during the period covered by this report that has materially affected, or is reasonably likely to materially affect, the registrant’s internal control over financial reporting.
There were no significant changes in the registrant’s internal control over financial reporting that occurred during the period covered by this report that have materially affected, or are reasonably likely to materially affect, the registrant’s internal control over financial reporting.
Item 12. Disclosure of Securities Lending Activities for Closed-End Management Investment Companies.
(a) If the registrant is a closed-end management investment company, provide the following dollar amounts of income and compensation related to the securities lending activities of the registrant during its most recent fiscal year:
N/A
(1) Gross income from securities lending activities;
N/A
(2) All fees and/or compensation for each of the following securities lending activities and related services: any share of revenue generated by the securities lending program paid to the securities lending agent(s) (revenue split); fees paid for cash collateral management services (including fees deducted from a pooled cash collateral reinvestment vehicle) that are not included in the revenue split; administrative fees that are not included in the revenue split; fees for indemnification that are not included in the revenue split; rebates paid to borrowers; and any other fees relating to the securities lending program that are not included in the revenue split, including a description of those other fees;
N/A
(3) The aggregate fees/compensation disclosed pursuant to paragraph (2); and
N/A
(4) Net income from securities lending activities (i.e., the dollar amount in paragraph (1) minus the dollar amount in paragraph (3)).
If a fee for a service is included in the revenue split, state that the fee is included in the revenue split.
N/A
(b) If the registrant is a closed-end management investment company, describe the services provided to the registrant by the securities lending agent in the registrants most recent fiscal year.
N/A
ITEM 13. EXHIBITS.
(a) File the exhibits listed below as part of this Form. Letter or number the exhibits in the sequence indicated.
(1) Any code of ethics, or amendment thereto, that is the subject of the disclosure required by Item 2, to the extent that the registrant intends to satisfy the Item 2 requirements through filing of an exhibit.
(2) A separate certification for each principal executive officer and principal financial officer of the registrant as required by Rule 30a-2(a) under the Act (17 CFR 270.30a-2(a)) , exactly as set forth below: Filed herewith.
(b) Certifications pursuant to Rule 30a-2(b) under the 1940 Act and Section 906 of the Sarbanes-Oxley Act of 2002 are attached hereto.
SIGNATURES
[See General Instruction F]
Pursuant to the requirements of the Securities Exchange Act of 1934 and the Investment Company Act of 1940, the registrant has duly caused this report to be signed on its behalf by the undersigned, thereunto duly authorized.
(Registrant) Pioneer Equity Income Fund
By (Signature and Title)* /s/ Lisa M. Jones
Lisa M. Jones, President and Chief Executive Officer
Date July 7, 2023
Pursuant to the requirements of the Securities Exchange Act of 1934 and the Investment Company Act of 1940, this report has been signed below by the following persons on behalf of the registrant and in the capacities and on the dates indicated.
By (Signature and Title)* /s/ Lisa M. Jones
Lisa M. Jones, President and Chief Executive Officer
Date July 7, 2023
By (Signature and Title)* /s/ Anthony J. Koenig, Jr.
Anthony J. Koenig, Jr., Managing Director, Chief Operations Officer & Treasurer of the Funds
Date July 7, 2023
| * | Print the name and title of each signing officer under his or her signature. |