UNITED STATES
SECURITIES AND EXCHANGE COMMISSION
Washington, D.C. 20549
FORM N-CSR
CERTIFIED SHAREHOLDER REPORT OF REGISTERED
MANAGEMENT INVESTMENT COMPANIES
Investment Company Act file number 811- 08657
Pioneer Equity Income Fund
(Exact name of registrant as specified in charter)
60 State Street, Boston, MA 02109
(Address of principal executive offices) (ZIP code)
Terrence J. Cullen, Amundi Pioneer Asset Management, Inc.,
60 State Street, Boston, MA 02109
(Name and address of agent for service)
Registrant’s telephone number, including area code: (617) 742-7825
Date of fiscal year end: October 31, 2020
Date of reporting period: November 1, 2019 through October 31, 2020
Form N-CSR is to be used by management investment companies to file reports with the Commission not later than 10 days after the transmission to stockholders of any report that is required to be transmitted to stockholders under Rule 30e-1 under the Investment Company Act of 1940 (17 CFR 270.30e-1). The Commission may use the information provided on Form N-CSR in its regulatory, disclosure review, inspection, and policymaking roles.
A registrant is required to disclose the information specified by Form N-CSR, and the Commission will make this information public. A registrant is not required to respond to the collection of information contained in Form N-CSR unless the Form displays a currently valid Office of Management and Budget (“OMB”) control number. Please direct comments concerning the accuracy of the information collection burden estimate and any suggestions for reducing the burden to Secretary, Securities and Exchange Commission, 450 Fifth Street, NW, Washington, DC 20549-0609. The OMB has reviewed this collection of information under the clearance requirements of 44 U.S.C. ss. 3507.
Pioneer Equity Income Fund
Annual Report | October 31, 2020
| | | | | |
| A: PEQIX | C: PCEQX | K: PEQKX | R: PQIRX | Y: PYEQX |
Beginning in or after April 2021, as permitted by regulations adopted by the Securities and Exchange Commission, paper copies of the Fund’s shareholder reports like this one will no longer be sent by mail, unless you specifically request paper copies of the reports from the Fund or from your financial intermediary, such as a broker-dealer, bank or insurance company. Instead, the reports will be made available on the Fund’s website, and you will be notified by mail each time a report is posted and provided with a website link to access the report.
If you already elected to receive shareholder reports electronically, you will not be affected by this change and you need not take any action. You may elect to receive shareholder reports and other communications electronically by contacting your financial intermediary or, if you invest directly with the Fund, by calling 1-800-225-6292.
You may elect to receive all future reports in paper free of charge. If you invest directly with the Fund, you can inform the Fund that you wish to continue receiving paper copies of your shareholder reports by calling 1-800-225-6292. If you invest through a financial intermediary, you can contact your financial intermediary to request that you continue to receive paper copies of your shareholder reports. Your election to receive reports in paper will apply to all funds held in your account if you invest through your financial intermediary or all funds held within the Pioneer Fund complex if you invest directly.
visit us: www.amundipioneer.com/us
| | |
Table of Contents | |
| | |
| 2 |
| | |
| 4 |
| | |
| 9 |
| | |
| 10 |
| | |
| 11 |
| | |
| 16 |
| | |
| 18 |
| | |
| 24 |
| | |
| 33 |
| | |
| 43 |
| | |
| 45 |
| | |
| 46 |
| | |
| 51 |
| | |
| 53 |
Pioneer Equity Income Fund | Annual Report | 10/31/20 1
President’s LetterDear Shareholders,
The new decade has arrived delivering a calendar year that will go down in the history books. The beginning of 2020 seemed to extend the positive market environment of 2019. Then, March roared in like a lion and the COVID-19 pandemic became a global crisis impacting lives and life as we know it. As the fourth quarter of 2020 got underway, it appeared that the long-anticipated “second wave” of COVID-19 cases was occurring, both in some U.S. states and in Europe. In response, some governments began retightening restrictions on both business and personal activities.
However, as the fourth quarter continued, we began to read some encouraging news on the vaccine front, as multiple pharmaceutical companies announced successful clinical trials for their COVID-19 vaccinations and applied for emergency-use approval for the drugs with the Food and Drug Administration. Government officials followed up on the positive news by announcing that deployment of at least one of the vaccines to frontline workers could begin even before the end of this calendar year, with the potential for widespread distribution by mid-2021.
While there may finally be a light visible at the end of the pandemic tunnel as 2020 comes to a close, the long-term impact on the global economy from COVID-19, while currently unknown, is likely to be considerable. It is clear that several industries have already felt greater effects than others, and the markets, which do not thrive on uncertainty, have been volatile, delivering significantly negative performance in the first quarter, and then recovering most of those losses throughout the following quarters. Despite the rebound, volatility has remained elevated, with momentum rising and falling on seemingly every bit of positive or negative news about the virus, from vaccines to spikes in the number of cases as well as rising hospitalization rates in some areas. In addition, the U.S. Presidential Election was in high gear as we entered the fourth quarter. This election contributed to the market volatility as investors pondered the possible outcomes and their potential effects on the economic outlook.
With the advent of COVID-19 last winter, we implemented our business continuity plan according to the new COVID-19 guidelines, and most of our employees have been working remotely since March. To date, our operating environment has faced no interruption. I am proud of the careful planning that has taken place and confident we can maintain this environment for as long as is prudent. History in the making for a company that first opened its doors way back in 1928.
2 Pioneer Equity Income Fund | Annual Report | 10/31/20
Since 1928, Amundi’s investment process has been built on a foundation of fundamental research and active management, principles which have guided our investment decisions for more than 90 years. We believe active management – that is, making active investment decisions – can help mitigate the risks during periods of market volatility. As 2020 has reminded us, investment risk can arise from a number of factors in today’s global economy, including slower or stagnating growth, changing U.S. Federal Reserve policy, oil price shocks, political and geopolitical factors and, unfortunately, major public health concerns such as a viral pandemic.
At Amundi, active management begins with our own fundamental, bottom-up research process. Our team of dedicated research analysts and portfolio managers analyzes each security under consideration, communicating directly with the management teams of the companies issuing the securities and working together to identify those securities that best meet our investment criteria for our family of funds. Our risk management approach begins with each and every security, as we strive to carefully understand the potential opportunity, while considering any and all risk factors.
Today, as investors, we have many options. It is our view that active management can serve shareholders well, not only when markets are thriving, but also during periods of market stress.
As you consider your long-term investment goals, we encourage you to work with your financial professional to develop an investment plan that paves the way for you to pursue both your short-term and long-term goals.
We remain confident that the current crisis, like others in human history, will pass, and we greatly appreciate the trust you have placed in us and look forward to continuing to serve you in the future.
Sincerely,
Lisa M. Jones
Head of the Americas, President and CEO of U.S.
Amundi Pioneer Asset Management USA, Inc.
December 18, 2020
Any information in this shareowner report regarding market or economic trends or the factors influencing the Fund’s historical or future performance are statements of opinion as of the date of this report. Past performance is no guarantee of future results.
Pioneer Equity Income Fund | Annual Report | 10/31/20 3
Portfolio Management Discussion |
10/31/20 In the following interview, John A. Carey discusses the market environment for equities and the factors that affected the performance of Pioneer Equity Income Fund during the 12-month period ended October 31, 2020. Mr. Carey, Managing Director, Director of Equity Income, U.S., and a portfolio manager at Amundi Pioneer Asset Management, Inc. (Amundi)*, is responsible for the day-to-day management of the Fund’s portfolio, along with Sammi Truong, a vice president and a portfolio manager at Amundi, and Walter Hunnewell, Jr., a vice president and a portfolio manager at Amundi.
Q How did the Fund perform over the 12-month period ended October 31, 2020?
A Pioneer Equity Income Fund’s Class A shares returned -8.00% at net asset value during the 12-month period ended October 31, 2020, while the Fund’s benchmark, the Russell 1000 Value Index, returned -7.57%. During the same period, the average return of the 1,196 mutual funds in Morningstar’s Large Value Funds category was -7.37%.
Q How would you describe the market for equities during the 12-month period ended October 31, 2020, particularly for the types of equities deemed appropriate for the Fund?
A The 12-month period ended October 31, 2020, was a memorable one. Through the middle of February, the stock market rose moderately and appeared quite stable. Then the COVID-19 virus hit, and the market took a deep plunge as the economy almost completely shut down, unemployment rose dramatically, and prospects for continued growth darkened. The market low was reached on March 23. As abruptly as the market had fallen, however, it turned around and began climbing. The U.S. government stepped in with dramatic personal-income and business support measures, and the Federal Reserve (Fed) dropped the target range of the federal funds rate to near zero, while also undertaking extensive debt purchases to restore confidence in financial markets. Investors also took heart from optimistic predictions for vaccines and treatments for COVID-19 and hoped that the masking, social distancing, and other restrictions enforced or encouraged would be effective in keeping the virus in check in the meantime. By early June, though, skepticism re-emerged, and the market moved largely sideways through the end of October. Concerning investors as well was the upcoming national election in early November and the uncertainties for future public policy.
* See Notes to Financial Statements Note 6.
4 Pioneer Equity Income Fund | Annual Report | 10/31/20
A steady theme throughout the time of preoccupation with the pandemic was a preference among investors for companies with growth potential and less dependence on the business cycle; in fact with potential enhanced, if anything, by the new, stay-at-home work routine and “cocooned” life style for many individuals. Over the whole 12-month period, the gulf in performance between growth and value stocks was among the widest on record. From October 31, 2019, to October 31, 2020, the Russell 1000 Growth Index showed a total return of 29.22%, versus a return of -7.57% for the Fund’s benchmark, the Russell 1000 Value Index, an advantage of almost 37%. From the market lows on March 23, 2020, the Russell 1000 Growth Index achieved a total return of 60.38% through October 31, 2020, while the Russell 1000 Value Index gained 39.40%. Investors were particularly enamored with the high-growth potential of the so-called FAANG stocks (Facebook, Amazon, Apple, Netflix, and Google [Alphabet]) and their close kin. (None of the FAANG stocks were held in the Fund’s portfolio as of October 31, 2020).
In our investment universe of value stocks – the non-FAANG world, if you will – there were some companies that attracted investors, notably providers of cleaning supplies, packaged foods, and medical tests, as well as potential treatments and vaccines for COVID-19. Many other value stocks, however, in sectors ranging from consumer cyclicals and financial services to energy and industrials, took a backseat to the favored growth names.
Q Could you please discuss the main factors that affected the Fund’s benchmark-relative performance during the 12-month period ended October 31, 2020, and discuss any investments or strategies that significantly helped or hurt benchmark-relative returns?
A Performance for the Fund was roughly in line with, though just slightly behind, the benchmark’s performance for the 12-month period.
On the plus side, the Fund had overweight positions in several of the stocks that sparkled during the market’s pandemic-focused period, which aided benchmark-relative returns. For example, Abbott Laboratories pioneered quick tests for the virus; Clorox sold all the cleaning supplies it could make; Progressive enjoyed good profits on its auto insurance business line as driving declined; and Eli Lilly tested treatments for patients sick with the COVID-19 virus. We also managed to avoid investing the Fund in a couple of stocks that struggled significantly during the 12-month period, and that avoidance contributed positively to relative performance.
On the negative side, detractors from the Fund’s benchmark-relative results included shares of Cedar Fair, which suffered from the total shutdown of its amusement parks; refiners Phillips 66 and Valero Energy,
Pioneer Equity Income Fund | Annual Report | 10/31/20 5
which saw their businesses plummet with the collapse of air travel and the decline in commuting; Kaiser Aluminum, a supplier to aerospace manufacturers, which experienced a big slowdown; and Nordstrom, which opened a major department store in New York City just in time to see the virus arrive in the U.S., and the resulting restrictions on retailing. In the case of Nordstrom, we sold the Fund’s position out of concern that the finances of the company were becoming strained. We are watching all of the portfolio’s positions for signs of stress during this difficult time.
Q Could you highlight some of the more notable changes you made to the Fund’s portfolio during the 12-month period ended October 31, 2020?
A A sector in which the Fund has typically been overweighted, going all the way back to its inception in 1990, is utilities. The regulated nature of utilities had provided investors with above-average confidence in the sustainability of dividend** payments. However, in recent years, as interest rates declined to very low levels and investors became desirous of securities providing higher income yields, utilities stocks, we thought, became expensive, and we moved the portfolio to an underweight exposure to the sector versus the benchmark. During this recent 12-month period, utility stocks performed quite modestly, and we began to see potential opportunities again in the sector. In response, we added positions in American Electric Power, Nextera Energy, PPL, and American Water Works, resulting in a portfolio overweight once again in the sector.
Another sector where we were active during the 12-month period was information technology, where we added Fund positions in the payroll-processing companies Paychex and Automatic Data Processing; Fidelity National Information Services, a payment-services provider; and CDW, a technology-solutions supplier to businesses.
With regard to sales during the 12-month period, we exited some Fund positions that we felt could be impaired longer than average as a result of the COVID-19-caused slowdown, including Raytheon Technologies, Johnson Matthey, Hasbro, National Fuel Gas, and ExxonMobil.
Q Did the Fund have any exposure to derivatives during the 12-month period ended October 31, 2020?
A No. The Fund had no exposure to derivatives during the period.
** Dividends are not guaranteed.
6 Pioneer Equity Income Fund | Annual Report | 10/31/20
Q The Fund typically places emphasis on dividend-paying stocks. How would you describe the environment for dividends during the 12-month period ended October 31, 2020?
A At a time when companies were clearly worried about the economy and the spread of the virus, many managements were understandably focused on conserving financial resources. Few companies raised their dividends, and some reduced or even omitted dividend payments. While we have customarily focused the Fund’s investments on companies with dividends covered by earnings and have, as a result, seen some of the portfolio’s holdings not only sustain but also regularly increase dividends over time, in the environment which predominated during the 12 months ended October 31, 2020, we saw even companies we had considered quite strong financially encounter extremely difficult business conditions. In a small number of cases, we have continued holding stocks where managements took adverse action on the company’s dividend during the period. Those instances have been ones where we felt that the conditions were beyond the control of management rather than the consequence of management missteps. Nonetheless, we are watching all of the Fund’s holdings quite closely and shall take decisions we think are appropriate when financial strains on companies force changes in their business plans.
We should also say that we shall be watching closely the new political environment in Washington, D.C., post the recent election. Changes in federal tax rates on dividend payments could affect companies’ views with respect to the amount of dividend income they believe is beneficial for them to distribute to shareholders. Higher corporate tax rates, too, could reduce the growth of companies’ earnings and dividends.
Q What is your outlook for equities as the U.S. economy continues to deal with the effects of the COVID-19 situation?
A As we write, there is a great deal of optimism surrounding several vaccines that appear likely to be approved for use very shortly. Assuming that the vaccines are worthwhile and can be distributed and administered over the next six months or so to large numbers of people in the U.S. and elsewhere in the world (and a smooth process is by no means sure), there will still be many questions about the U.S. economy in particular as well as the enduring ramifications of what we have been going through over the past several months. Will work and leisure patterns snap back; will higher costs of doing business persist; what shifts might occur in time horizons for investments; how quickly will people feel comfortable with saving less?
Pioneer Equity Income Fund | Annual Report | 10/31/20 7
The market bounce-back from the March 23 nadir was for sure impressive, and the frequent forecasting successes of the market historically have been noteworthy. However, there are no guarantees whatsoever that the market has gauged this or any other situation correctly and has taken adequately into account all of the variables and potential outcomes.
As always, we intend during the coming months to focus our attention closely on individual companies and their potential both for meeting the probable challenges and capturing the possible opportunities.
Thank you for your support.
Please refer to the Schedule of Investments on pages 18–23 for a full listing of Fund securities.
All investments are subject to risk, including the possible loss of principal. In the past several years, financial markets have experienced increased volatility and heightened uncertainty. The market prices of securities may go up or down, sometimes rapidly or unpredictably, due to general market conditions, such as real or perceived adverse economic, political, or regulatory conditions, recessions, inflation, changes in interest or currency rates, lack of liquidity in the bond markets, the spread of infectious illness or other public health issues or adverse investor sentiment. These conditions may continue, recur, worsen or spread.
Investing in foreign and/or emerging markets securities involves risks relating to interest rates, currency exchange rates, economic, and political conditions.
The Fund invests in REIT securities, the value of which can fall for a variety of reasons, such as declines in rental income, fluctuating interest rates, poor property management, environmental liabilities, uninsured damage, increased competition, or changes in real estate tax laws.
At times, the Fund’s investments may represent industries or industry sectors that are interrelated or have common risks, making the Fund more susceptible to any economic, political, or regulatory developments or other risks affecting those industries and sectors.
These risks may increase share price volatility.
Before investing, consider the product’s investment objectives, risks, charges and expenses. Contact your advisor or Amundi for a prospectus or summary prospectus containing this information. Read it carefully.
Any information in this shareholder report regarding market or economic trends or the factors influencing the Fund’s historical or future performance are statements of opinion as of the date of this report. Past performance is no guarantee of future results.
8 Pioneer Equity Income Fund | Annual Report | 10/31/20
Portfolio Summary |
10/31/20 Sector Distribution
(As a percentage of total investments)*
| | | |
| 10 Largest Holdings | |
(As a percentage of total investments)* | |
| 1. | Verizon Communications, Inc. | 2.49% |
| 2. | AstraZeneca Plc (A.D.R.) | 2.40 |
| 3. | Abbott Laboratories | 2.34 |
| 4. | WEC Energy Group, Inc. | 2.12 |
| 5. | Alliant Energy Corp. | 2.04 |
| 6. | Target Corp. | 1.98 |
| 7. | Gorman-Rupp Co. | 1.90 |
| 8. | Sun Life Financial, Inc. | 1.87 |
| 9. | Alexandria Real Estate Equities, Inc. | 1.85 |
| 10. | Mondelez International, Inc. | 1.85 |
* | Excludes temporary cash investments and all derivative contracts except for options purchased. The Fund is actively managed, and current holdings may be different. The holdings listed should not be considered recommendations to buy or sell any securities. |
Pioneer Equity Income Fund | Annual Report | 10/31/20 9
Prices and Distributions |
10/31/20 Net Assets Value per Share
| Class | 10/31/20 | 10/31/19 |
A | $31.38 | $35.59 |
C | $30.85 | $35.00 |
K | $31.44 | $35.65 |
R | $32.04 | $36.28 |
Y | $31.82 | $36.05 |
| Distributions per Share: 11/1/19–10/31/20 | |
|
| Net Investment | Short-Term | Long-Term |
| Class | Income | Capital Gains | Capital Gains |
A | $0.6061 | $ — | $0.8286 |
C | $0.3816 | $ — | $0.8286 |
K | $0.7258 | $ — | $0.8286 |
R | $0.4668 | $ — | $0.8286 |
Y | $0.6683 | $ — | $0.8286 |
Index Definitions
The Russell 1000 Value Index is an unmanaged index that measures the performance of large-cap U.S. value stocks. Index returns are calculated monthly, assume reinvestment of dividends and, unlike Fund returns, do not reflect any fees, expenses or sales charges. It is not possible to invest directly in an index.
The index defined here pertains to the “Value of $10,000 Investment” and “Value of $5 Million Investment” charts on pages 11–15.
10 Pioneer Equity Income Fund | Annual Report | 10/31/20
| | |
Performance Update | 10/31/20 | Class A Shares |
Investment Returns
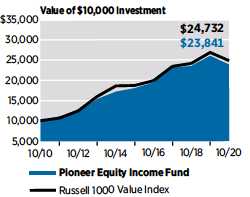
The mountain chart on the right shows the change in value of a $10,000 investment made in Class A shares of Pioneer Equity Income Fund at public offering price during the periods shown, compared to that of the Russell 1000 Value Index.
| Average Annual Total Returns | |
(As of October 31, 2020) | |
| Net | Public | Russell |
| Asset | Offering | 1000 |
| Value | Price | Value |
| Period | (NAV) | (POP) | Index |
10 years | 9.46% | 8.82% | 9.48% |
5 years | 6.15 | 4.90 | 5.82 |
1 year | -8.00 | -13.29 | -7.57 |
|
| Expense Ratio | | |
(Per prospectus dated March 1, 2020) |
| Gross | | | |
1.00% | | | |
Call 1-800-225-6292 or visit www.amundipioneer.com/us for the most recent month-end performance results. Current performance may be lower or higher than the performance data quoted.The performance data quoted represents past performance, which is no guarantee of future results. Investment return and principal value will fluctuate, and shares, when redeemed, may be worth more or less than their original cost.
NAV results represent the percent change in net asset value per share. POP returns reflect deduction of maximum 5.75% sales charge. NAV returns would have been lower had sales charges been reflected. All results are historical and assume the reinvestment of dividends and capital gains. Other share classes are available for which performance and expenses will differ.
Performance results reflect any applicable expense waivers in effect during the periods shown. Without such waivers Fund performance would be lower. Waivers may not be in effect for all funds. Certain fee waivers are contractual through a specified period. Otherwise, fee waivers can be rescinded at any time. See the prospectus and financial statements for more information.
The performance table and graph do not reflect the deduction of fees and taxes that a shareowner would pay on Fund distributions or the redemption of Fund shares.
Please refer to the financial highlights for a more current expense ratio.
Pioneer Equity Income Fund | Annual Report | 10/31/20 11
| | |
Performance Update | 10/31/20 | Class C Shares |
Investment Returns
The mountain chart on the right shows the change in value of a $10,000 investment made in Class C shares of Pioneer Equity Income Fund during the periods shown, compared to that of the Russell 1000 Value Index.
| | | | |
| Average Annual Total Returns | |
(As of October 31, 2020) | |
| | | Russell |
| | | 1000 |
| If | If | Value |
| Period | Held | Redeemed | Index
|
10 years | 8.66% | 8.66% | 9.48% |
5 years | 5.37 | 5.37 | 5.82 |
1 year | -8.64 | -8.64 | -7.57 |
|
| Expense Ratio | | |
(Per prospectus dated March 1, 2020) |
| Gross | | | |
1.78% | | | |
Call 1-800-225-6292 or visit www.amundipioneer.com/us for the most recent month-end performance results. Current performance may be lower or higher than the performance data quoted.
The performance data quoted represents past performance, which is no guarantee of future results. Investment return and principal value will fluctuate, and shares, when redeemed, may be worth more or less than their original cost.
Class C shares held for less than one year are also subject to a 1% contingent deferred sales charge (CDSC). “If Held” results represent the percent change in net asset value per share. NAV returns would have been lower had sales charges been reflected. All results are historical and assume the reinvestment of dividends and capital gains. Other share classes are available for which performance and expenses will differ.
Performance results reflect any applicable expense waivers in effect during the periods shown. Without such waivers Fund performance would be lower. Waivers may not be in effect for all funds. Certain fee waivers are contractual through a specified period. Otherwise, fee waivers can be rescinded at any time. See the prospectus and financial statements for more information.
The performance table and graph do not reflect the deduction of fees and taxes that a shareowner would pay on Fund distributions or the redemption of Fund shares.
Please refer to the financial highlights for a more current expense ratio.
12 Pioneer Equity Income Fund | Annual Report | 10/31/20
| | |
Performance Update | 10/31/20 | Class K Shares |
Investment Returns
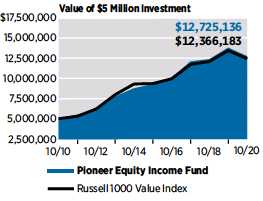
The mountain chart on the right shows the change in value of a $5 million investment made in Class K shares of Pioneer Equity Income Fund during the periods shown, compared to that of the Russell 1000 Value Index.
| | | |
| Average Annual Total Returns |
(As of October 31, 2020) | |
| Net | Russell |
| Asset | 1000 |
| Value | Value |
| Period | (NAV) | Index |
10 years | 9.79% | 9.48% |
5 years | 6.53 | 5.82 |
1 year | -7.62 | -7.57 |
|
| Expense Ratio | | |
(Per prospectus dated March 1, 2020) |
| Gross | | |
0.66% | | |
Call 1-800-225-6292 or visit www.amundipioneer.com/us for the most recent month-end performance results. Current performance may be lower or higher than the performance data quoted.
The performance data quoted represents past performance, which is no guarantee of future results. Investment return and principal value will fluctuate, and shares, when redeemed, may be worth more or less than their original cost.
The performance shown for Class K shares for the period prior to the commencement of operations of Class K shares on December 20, 2012, is the net asset value performance of the Fund’s Class A shares, which has not been restated to reflect any differences in expenses, including Rule 12b-1 fees applicable to Class A shares. Since fees for Class A shares generally are higher than those of Class K shares, the performance of Class K shares prior to their inception on December 20, 2012, would have been higher than the performance shown. For the period beginning December 20, 2012, the actual performance of Class K shares is reflected. Class K shares are not subject to sales charges and are available for limited groups of eligible investors, including institutional investors. All results are historical and assume the reinvestment of dividends and capital gains.
Performance results reflect any applicable expense waivers in effect during the periods shown. Without such waivers Fund performance would be lower. Waivers may not be in effect for all funds. Certain fee waivers are contractual through a specified period. Otherwise, fee waivers can be rescinded at any time. See the prospectus and financial statements for more information.
The performance table and graph do not reflect the deduction of fees and taxes that a shareowner would pay on Fund distributions or the redemption of Fund shares.
Please refer to the financial highlights for a more current expense ratio.
Pioneer Equity Income Fund | Annual Report | 10/31/20 13
| | |
Performance Update | 10/31/20 | Class R Shares |
Investment Returns
The mountain chart on the right shows the change in value of a $10,000 investment made in Class R shares of Pioneer Equity Income Fund during the periods shown, compared to that of the Russell 1000 Value Index.
| | | |
| Average Annual Total Returns |
(As of October 31, 2020) | |
| Net | Russell |
| Asset | 1000 |
| Value | Value |
| Period | (NAV) | Index |
10 years | 9.08% | 9.48% |
5 years | 5.74
| 5.82 |
1 year | -8.33 | -7.57 |
|
| Expense Ratio | | |
(Per prospectus dated March 1, 2020) |
| Gross | | |
1.39% | | |
Call 1-800-225-6292 or visit www.amundipioneer.com/us for the most recent month-end performance results. Current performance may be lower or higher than the performance data quoted.
The performance data quoted represents past performance, which is no guarantee of future results. Investment return and principal value will fluctuate, and shares, when redeemed, may be worth more or less than their original cost.
Class R shares are not subject to sales charges and are available for limited groups of eligible investors, including institutional investors. All results are historical and assume the reinvestment of dividends and capital gains. Other share classes are available for which performance and expenses will differ.
Performance results reflect any applicable expense waivers in effect during the periods shown. Without such waivers Fund performance would be lower. Waivers may not be in effect for all funds. Certain fee waivers are contractual through a specified period. Otherwise, fee waivers can be rescinded at any time. See the prospectus and financial statements for more information.
The performance table and graph do not reflect the deduction of fees and taxes that a shareowner would pay on Fund distributions or the redemption of Fund shares.
Please refer to the financial highlights for a more current expense ratio.
14 Pioneer Equity Income Fund | Annual Report | 10/31/20
| | |
Performance Update | 10/31/20 | Class Y Shares |
Investment Returns
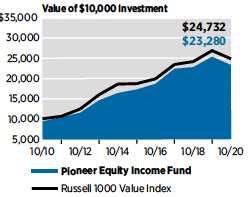
The mountain chart on the right shows the change in value of a $5 million investment made in Class Y shares of Pioneer Equity Income Fund during the periods shown, compared to that of the Russell 1000 Value Index.
| | | |
| Average Annual Total Returns |
(As of October 31, 2020) | |
| Net | Russell |
| Asset | 1000 |
| Value | Value |
| Period | (NAV) | Index |
10 years | 9.79% | 9.48% |
5 years | 6.41 | 5.82 |
1 year | -7.76 | -7.57 |
|
| Expense Ratio | | |
(Per prospectus dated March 1, 2020) |
| Gross | | |
0.78% | | |
Call 1-800-225-6292 or visit www.amundipioneer.com/us for the most recent month-end performance results. Current performance may be lower or higher than the performance data quoted.
The performance data quoted represents past performance, which is no guarantee of future results. Investment return and principal value will fluctuate, and shares, when redeemed, may be worth more or less than their original cost.
Class Y shares are not subject to sales charges and are available for limited groups of eligible investors, including institutional investors. All results are historical and assume the reinvestment of dividends and capital gains. Other share classes are available for which performance and expenses will differ.
Performance results reflect any applicable expense waivers in effect during the periods shown. Without such waivers Fund performance would be lower. Waivers may not be in effect for all funds. Certain fee waivers are contractual through a specified period. Otherwise, fee waivers can be rescinded at any time. See the prospectus and financial statements for more information.
The performance table and graph do not reflect the deduction of fees and taxes that a shareowner would pay on Fund distributions or the redemption of Fund shares.
Please refer to the financial highlights for a more current expense ratio.
Pioneer Equity Income Fund | Annual Report | 10/31/20 15
Comparing Ongoing Fund Expenses
As a shareowner in the Fund, you incur two types of costs:
(1) | ongoing costs, including management fees, distribution and/or service (12b-1) fees, and other Fund expenses; and |
(2) | transaction costs, including sales charges (loads) on purchase payments. |
This example is intended to help you understand your ongoing expenses (in dollars) of investing in the Fund and to compare these costs with the ongoing costs of investing in other mutual funds. The example is based on an investment of $1,000 at the beginning of the Fund’s latest six-month period and held throughout the six months.
Using the Tables
Actual Expenses
The first table below provides information about actual account values and actual expenses. You may use the information in this table, together with the amount you invested, to estimate the expenses that you paid over the period as follows:
(1) | Divide your account value by $1,000 |
| Example: an $8,600 account value ÷ $1,000 = 8.6 |
(2) | Multiply the result in (1) above by the corresponding share class’s number in the third row under the heading entitled “Expenses Paid During Period” to estimate the expenses you paid on your account during this period. |
Expenses Paid on a $1,000 Investment in Pioneer Equity Income Fund
Based on actual returns from May 1, 2020 through October 31, 2020.
| | | | | | |
| Share Class | A | C | K | R | Y |
Beginning Account | $1,000.00 | $1,000.00 | $1,000.00 | $1,000.00 | $1,000.00 |
Value on 5/1/20 | | | | | |
Ending Account Value | $1,068.03 | $1,064.06 | $1,070.33 | $1,065.93 | $1,069.45 |
(after expenses) on | | | | | |
10/31/20 | | | | | |
Expenses Paid | $5.51 | $9.08 | $3.43 | $7.32 | $4.01 |
During Period* | | | | | |
* | Expenses are equal to the Fund’s annualized expense ratio of 1.06%, 1.75%, 0.66% 1.41%, and 0.77%, for Class A, C, K, R and Y shares, respectively, multiplied by the average account value over the period, multiplied by 184/366 (to reflect the partial year period). |
16 Pioneer Equity Income Fund | Annual Report | 10/31/20
Hypothetical Example for Comparison Purposes
The table below provides information about hypothetical account values and hypothetical expenses based on the Fund’s actual expense ratio and an assumed rate of return of 5% per year before expenses, which is not the Fund’s actual return. The hypothetical account values and expenses may not be used to estimate the actual ending account balance or expenses you paid for the period.
You may use this information to compare the ongoing costs of investing in the Fund and other funds. To do so, compare this 5% hypothetical example with the 5% hypothetical examples that appear in the shareholder reports of the other funds.
Please note that the expenses shown in the tables are meant to highlight your ongoing costs only and do not reflect any transaction costs, such as sales charges (loads) that are charged at the time of the transaction. Therefore, the table below is useful in comparing ongoing costs only and will not help you determine the relative total costs of owning different funds. In addition, if these transaction costs were included, your costs would have been higher.
Expenses Paid on a $1,000 Investment in Pioneer Equity Income Fund
Based on a hypothetical 5% return per year before expenses, reflecting the period from May 1, 2020 through October 31, 2020.
| | | | | | |
| Share Class | A | C | K | R | Y |
Beginning Account | $1,000.00 | $1,000.00 | $1,000.00 | $1,000.00 | $1,000.00 |
Value on 5/1/20 | | | | | |
Ending Account Value | $1,019.81 | $1,016.34 | $1,021.82 | $1,018.05 | $1,021.27 |
(after expenses) on | | | | | |
10/31/20 | | | | | |
Expenses Paid | $5.38 | $8.87 | $3.35 | $7.15 | $3.91 |
During Period* | | | | | |
* | Expenses are equal to the Fund’s annualized expense ratio of 1.06%, 1.75%, 0.66% 1.41%, and 0.77%, for Class A, C, K, R and Y shares, respectively, multiplied by the average account value over the period, multiplied by 184/366 (to reflect the partial year period). |
Pioneer Equity Income Fund | Annual Report | 10/31/20 17
Schedule of Investments | 10/31/20 |
| Shares | | | Value |
| | UNAFFILIATED ISSUERS — 99.8% | |
| | COMMON STOCKS — 99.8% of Net Assets | |
| | Air Freight & Logistics — 0.7% | |
| 149,127 | | CH Robinson Worldwide, Inc. | $ 13,187,301 |
| | Total Air Freight & Logistics | $ 13,187,301 |
| | Auto Components — 1.3% | |
| 776,565 | | BorgWarner, Inc. | $ 27,164,244 |
| | Total Auto Components | $ 27,164,244 |
| | Automobiles — 0.1% | |
| 85,649 | | Honda Motor Co. Ltd. (A.D.R.) | $ 2,023,029 |
| | Total Automobiles | $ 2,023,029 |
| | Banks — 6.8% | |
| 1,434,663 | | Bank of America Corp. | $ 34,001,513 |
| 141,203 | | Canadian Imperial Bank of Commerce | 10,536,568 |
| 228,631 | | JPMorgan Chase & Co. | 22,414,984 |
| 182,386 | | M&T Bank Corp. | 18,891,542 |
| 215,980 | | PNC Financial Services Group, Inc. | 24,163,842 |
| 596,307 | | Truist Financial Corp. | 25,116,451 |
| | Total Banks | $ 135,124,900 |
| | Capital Markets — 5.6% | |
| 487,622 | | Bank of New York Mellon Corp. | $ 16,754,692 |
| 42,939 | | CME Group, Inc. | 6,471,766 |
| 410,478 | | Morgan Stanley | 19,764,516 |
| 249,279 | | Northern Trust Corp. | 19,511,067 |
| 254,906 | | State Street Corp. | 15,013,964 |
| 272,005 | | T Rowe Price Group, Inc. | 34,452,153 |
| | Total Capital Markets | $ 111,968,158 |
| | Chemicals — 3.5% | |
| 266,892 | | Celanese Corp. | $ 30,294,911 |
| 156,776 | | Corteva, Inc. | 5,170,472 |
| 203,744 | | Dow, Inc. | 9,268,314 |
| 186,859 | | DuPont de Nemours, Inc. | 10,628,540 |
| 20,543 | | Ecolab, Inc. | 3,771,489 |
| 88,761 | | FMC Corp. | 9,119,305 |
| | Total Chemicals | $ 68,253,031 |
| | | Commercial Services & Supplies — 1.2% | |
| 182,037 | | MSA Safety, Inc. | $ 24,014,321 |
| | Total Commercial Services & Supplies | $ 24,014,321 |
| | Communications Equipment — 0.6% | |
| 351,324 | | Cisco Systems, Inc. | $ 12,612,531 |
| | Total Communications Equipment | $ 12,612,531 |
The accompanying notes are an integral part of these financial statements.
18 Pioneer Equity Income Fund | Annual Report | 10/31/20
| | | | | |
| Shares | | | Value
|
| | Distributors — 1.0% | | |
| 228,769 | | Genuine Parts Co. | $ 20,687,581 |
| | Total Distributors | $ 20,687,581 |
| | Diversified Telecommunication Services — 3.0% | | |
| 239,216 | | BCE, Inc. | $ 9,621,268 |
| 870,357 | | Verizon Communications, Inc. | 49,601,645 |
| | Total Diversified Telecommunication Services | $ 59,222,913 |
| | Electric Utilities — 3.8% | | |
| 736,065 | | Alliant Energy Corp. | $ 40,689,673 |
| 195,821 | | American Electric Power Co., Inc. | 17,610,183 |
| 149,236 | | NextEra Energy, Inc. | 10,925,568 |
| 300,929 | | PPL Corp. | 8,275,547 |
| | Total Electric Utilities | $ 77,500,971 |
| | Electrical Equipment — 0.6% | | |
| 190,361 | | Emerson Electric Co. | $ 12,333,489 |
| | Total Electrical Equipment | $ 12,333,489 |
| | Electronic Equipment, Instruments & | | |
| | Components — 1.2% | | |
| 52,948 | | CDW Corp. | $ 6,491,425 |
| 187,402 | | TE Connectivity, Ltd. | 18,155,506 |
| | Total Electronic Equipment, Instruments & Components | $ 24,646,931 |
| | Equity Real Estate Investment Trusts (REITs) — 3.5% | | |
| 243,829 | | Alexandria Real Estate Equities, Inc. | $ 36,944,970 |
| 167,138 | | Camden Property Trust | 15,416,809 |
| 74,632 | | Digital Realty Trust, Inc. | 10,769,398 |
| 74,501 | | Prologis, Inc. | 7,390,499 |
| | Total Equity Real Estate Investment Trusts (REITs) | $ 70,521,676 |
| | Financials — 0.4% | | |
| 198,293 | | Charles Schwab Corp. | $ 8,151,825 |
| | Total Financials | $ 8,151,825 |
| | Food & Staples Retailing — 1.0% | | |
| 149,795 | | Wal-Mart, Inc. | $ 20,784,056 |
| | Total Food & Staples Retailing | $ 20,784,056 |
| | Food Products — 7.8% | | |
| 37,288 | | Calavo Growers, Inc. | $ 2,503,143 |
| 328,426 | | General Mills, Inc. | 19,416,545 |
| 59,906 | | Hershey Co. | 8,234,679 |
| 45,110 | | JM Smucker Co. | 5,061,342 |
| 113,542 | | John B Sanfilippo & Son, Inc. | 8,261,316 |
| 353,209 | | Kellogg Co. | 22,213,314 |
| 302,306 | | Lamb Weston Holdings, Inc. | 19,181,316 |
| 105,974 | | McCormick & Co., Inc., Class VTG | 19,129,367 |
The accompanying notes are an integral part of these financial statements. | |
Pioneer Equity Income Fund | Annual Report | 10/31/20 19
Schedule of Investments | 10/31/20 (continued)
| | | | | |
Shares
| | | Value |
| | | Food Products — (continued) | |
| 693,870 | | Mondelez International, Inc. | $ 36,858,374 |
| 141,468 | | Nestle S.A. (A.D.R.) | 15,882,612 |
| | | Total Food Products | $ 156,742,008 |
| | | | Health Care Equipment & Supplies — 3.9% | |
| 444,342 | | Abbott Laboratories
| $ 46,704,787 |
| 58,774 | | Becton Dickinson and Co. | 13,584,435 |
| 503,649 | | Smith & Nephew Plc (A.D.R.) | 17,662,970 |
| | | Total Health Care Equipment & Supplies | $ 77,952,192 |
| | | Health Care Providers & Services — 4.3% | |
| 185,811 | | AmerisourceBergen Corp. | $ 17,850,863 |
| 44,979 | | Anthem, Inc. | 12,270,271 |
| 233,840 | | CVS Health Corp. | 13,116,086 |
| 48,337 | | Humana, Inc. | 19,299,997 |
| 181,608 | | Quest Diagnostics, Inc. | 22,181,601 |
| | | Total Health Care Providers & Services | $ 84,718,818 |
| | | Hotels, Restaurants & Leisure — 0.5% | |
| 391,729 | | Cedar Fair LP | $ 10,188,872 |
| | | Total Hotels, Restaurants & Leisure | $ 10,188,872 |
| | | Household Products — 1.4% | |
| 133,132 | | Clorox Co. | $ 27,591,607 |
| | | Total Household Products | $ 27,591,607 |
| | | Industrial Conglomerates — 1.2% | |
| 140,484 | | Honeywell International, Inc. | $ 23,172,836 |
| | | Total Industrial Conglomerates | $ 23,172,836 |
| | | Insurance — 6.4% | |
| 251,417 | | Chubb, Ltd. | $ 32,661,582 |
| 214,432 | | First American Financial Corp. | 9,561,523 |
| 447,424 | | Lincoln National Corp. | 15,704,582 |
| 352,810 | | Progressive Corp. | 32,423,239 |
| 935,513 | | Sun Life Financial, Inc. | 37,252,128 |
| | | Total Insurance | $ 127,603,054 |
| | | IT Services — 2.6% | |
| 46,648 | | Accenture Plc | $ 10,118,418 |
| 57,164 | | Automatic Data Processing, Inc. | 9,029,625 |
| 70,105 | | Fidelity National Information Services, Inc. | 8,734,382 |
| 196,248 | | Leidos Holdings, Inc. | 16,288,584 |
| 115,712 | | Paychex, Inc. | 9,517,312 |
| | | Total IT Services | $ 53,688,321 |
The accompanying notes are an integral part of these financial statements.
20 Pioneer Equity Income Fund | Annual Report | 10/31/20
| | | | | |
| Shares | | | Value
|
| | Machinery — 5.9% | | |
| 112,288 | | Caterpillar, Inc. | $ 17,634,830 |
| 1,223,146 | | Gorman Rupp Co. | 37,978,683 |
| 460,202 | | Komatsu, Ltd. (A.D.R.) | 10,432,779 |
| 429,237 | | PACCAR, Inc. | 36,648,255 |
| 248,937 | | Timken Co. | 14,861,539 |
| | Total Machinery | $ 117,556,086 |
| | Media — 0.8% | | |
| 356,916 | | Comcast Corp. | $ 15,076,132 |
| | Total Media | $ 15,076,132 |
| | Metals & Mining — 4.7% | | |
| 280,442 | | Kaiser Aluminum Corp. | $ 17,648,215 |
| 298,694 | | Materion Corp. | 15,290,146 |
| 527,498 | | Nucor Corp. | 25,193,305 |
| 328,400 | | Reliance Steel & Aluminum Co. | 35,792,316 |
| | Total Metals & Mining | $ 93,923,982 |
| | Multiline Retail — 2.0% | | |
| 259,439 | | Target Corp. | $ 39,491,804 |
| | Total Multiline Retail | $ 39,491,804 |
| | Multi-Utilities — 4.1% | | |
| 281,908 | | Ameren Corp. | $ 22,868,377 |
| 249,515 | | CMS Energy Corp. | 15,801,785 |
| 420,620 | | WEC Energy Group, Inc. | 42,293,341 |
| | Total Multi-Utilities | $ 80,963,503 |
| | Oil, Gas & Consumable Fuels — 1.9% | | |
| 309,580 | | ConocoPhillips | $ 8,860,180 |
| 379,855 | | Phillips 66 | 17,724,034 |
| 304,593 | | Valero Energy Corp. | 11,760,336 |
| | Total Oil, Gas & Consumable Fuels | $ 38,344,550 |
| | Pharmaceuticals — 7.3% | | |
| 954,066 | | AstraZeneca Plc (A.D.R.) | $ 47,855,951 |
| 271,156 | | Eli Lilly & Co. | 35,375,012 |
| 456,102 | | Merck & Co., Inc. | 34,303,431 |
| 444,993 | | Novo Nordisk AS (A.D.R.) | 28,430,603 |
| | Total Pharmaceuticals | $ 145,964,997 |
| | Semiconductors & Semiconductor Equipment — 5.0% | | |
| 185,800 | | Analog Devices, Inc. | $ 22,022,874 |
| 88,129 | | CMC Materials, Inc. | 12,531,062 |
| 185,777 | | KLA-Tencor Corp. | 36,631,509 |
| 201,592 | | Texas Instruments, Inc. | 29,148,187 |
| | Total Semiconductors & Semiconductor Equipment | $ 100,333,632 |
The accompanying notes are an integral part of these financial statements.
| |
Pioneer Equity Income Fund | Annual Report | 10/31/20 21
Schedule of Investments | 10/31/20 (continued)
| | | | | |
Shares
| | | Value |
| | | Specialty Retail — 1.1% | |
| 44,156 | | Home Depot, Inc. | $ 11,776,847 |
| 204,362 | | TJX Cos., Inc. | 10,381,590 |
| | | Total Specialty Retail | $ 22,158,437 |
| | | | Textiles, Apparel & Luxury Goods — 2.2% | |
| 260,446 | | Carter’s, Inc. | $ 21,213,327 |
| 336,370 | | VF Corp. | 22,604,064 |
| | | Total Textiles, Apparel & Luxury Goods | $ 43,817,391 |
| | | | Trading Companies & Distributors — 2.0% | |
| 497,333 | | Fastenal Co. | $ 21,499,706 |
| 1,710,967 | | Ferguson Plc (A.D.R.) | 17,126,780 |
| | | Total Trading Companies & Distributors | $ 38,626,486 |
| | | Water Utilities — 0.4% | |
| 57,472 | | American Water Works Co., Inc. | $ 8,650,111 |
| | | Total Water Utilities | $ 8,650,111 |
| | | TOTAL COMMON STOCKS | |
| | | (Cost $1,574,293,230) | $ 1,994,761,776 |
| | | TOTAL INVESTMENTS IN UNAFFILIATED ISSUERS — 99.8% | |
| | | (Cost $1,574,293,230) | $ 1,994,761,776 |
| | | OTHER ASSETS AND LIABILITIES — 0.2% | $ 3,354,939 |
| | | NET ASSETS — 100.0% | $ 1,998,116,715 |
REIT | Real Estate Investment Trust. |
(A.D.R.) | American Depositary Receipts. |
^
| Investment held by the Fund representing 5% or more of the outstanding voting stock of such company. |
Purchases and sales of securities (excluding temporary cash investments) for the year ended October 31, 2020, aggregated $169,157,209 and $559,682,643, respectively.
The Fund is permitted to engage in purchase and sale transactions (“cross trades”) with certain funds and accounts for which Amundi Pioneer Asset Management, Inc. (the “Adviser”) serves as the Fund’s investment adviser, as set forth in Rule 17a-7 under the Investment Company Act of 1940, pursuant to procedures adopted by the Board of Trustees. Under these procedures, cross trades are effected at current market prices. During the year ended October 31, 2020, the Fund did not engage in any cross trade activity.
At October 31, 2020, the net unrealized appreciation on investments based on cost for federal tax purposes of $1,561,397,085 was as follows:
| Aggregate gross unrealized appreciation for all investments in which | |
| there is an excess of value over tax cost | $532,758,331 |
| Aggregate gross unrealized depreciation for all investments in which | |
| there is an excess of tax cost over value | (99,393,640) |
| Net unrealized appreciation | $433,364,691 |
The accompanying notes are an integral part of these financial statements.
22 Pioneer Equity Income Fund | Annual Report | 10/31/20
Various inputs are used in determining the value of the Fund’s investments. These inputs are summarized in the three broad levels below.
Level 1 – quoted prices in active markets for identical securities.
Level 2 – other significant observable inputs (including quoted prices for similar securities, interest rates, prepayment speeds, credit risks, etc.). See Notes to Financial Statements — Note 1A.
Level 3 – significant unobservable inputs (including the Fund’s own assumptions in determining fair value of investments). See Notes to Financial Statements — Note 1A.
The following is a summary of the inputs used as of October 31, 2020, in valuing the Fund’s investments:
| Level 1 | Level 2 | Level 3 | Total |
Common Stocks | $1,994,761,776 | $ — | $ — | $ 1,994,761,776 |
| Total Investments in Securities | $1,994,761,776 | $ — | $ — | $ 1,994,761,776 |
During the year ended October 31, 2020, there were no transfers between Levels 1, 2 and 3.
The accompanying notes are an integral part of these financial statements.
Pioneer Equity Income Fund | Annual Report | 10/31/20 23
Statement of Assets and Liabilities |
10/31/20 | | | | |
| ASSETS: | | | |
| Investments in unaffiliated issuers, at value (cost $1,574,293,230) | | $ | 1,994,761,776 | |
| Foreign currencies, at value (cost $57,606) | | | 48,186 | |
| Receivables — | | | | |
| Investment securities sold | | | 3,922,311 | |
| Fund shares sold | | | 3,161,614 | |
| Dividends | | | 4,375,606 | |
| Other assets | | | 76,343 | |
| Total assets | | $ | 2,006,345,836 | |
| LIABILITIES: | | | | |
| Due to custodian | | $ | 3,440,533 | |
| Payables — | | | | |
| Fund shares repurchased | | | 3,888,107 | |
| Distributions | | | 37 | |
| Trustees’ fees | | | 12,193 | |
| Transfer agent fees | | | 555,461 | |
| Due to affiliates | | | 161,057 | |
| Accrued expenses | | | 171,733 | |
| Total liabilities | | $ | 8,229,121 | |
| NET ASSETS: | | | | |
| Paid-in capital | | $ | 1,688,868,574 | |
| Distributable earnings | | | 309,248,141 | |
| Net assets | | $ | 1,998,116,715 | |
| NET ASSET VALUE PER SHARE: | | | | |
No par value (unlimited number of shares authorized) | | | | |
| Class A (based on $703,864,329/22,432,108 shares) | | $ | 31.38 | |
| Class C (based on $68,831,674/2,231,187 shares) | | $ | 30.85 | |
| Class K (based on $242,249,732/7,706,127 shares) | | $ | 31.44 | |
| Class R (based on $48,198,333/1,504,097 shares) | | $ | 32.04 | |
| Class Y (based on $934,972,647/29,379,853 shares) | | $ | 31.82 | |
| MAXIMUM OFFERING PRICE PER SHARE: | | | | |
| Class A (based on $31.38 net asset value per share/100%-5.75% | | | | |
| maximum sales charge) | | $ | 33.29 | |
The accompanying notes are an integral part of these financial statements.
24 Pioneer Equity Income Fund | Annual Report | 10/31/20
| | | |
| Statement of Operations | | |
| FOR THE YEAR ENDED 10/31/20 | | |
| INVESTMENT INCOME: | | | | | | |
| Dividends from unaffiliated issuers (net of foreign taxes | | | | | | |
| withheld $536,357) | | $ | 63,563,664 | | | | |
| Dividends from affiliated issuers | | | 585,645 | | | | |
| Interest from unaffiliated issuers | | | 24,655 | | | | |
| Total investment income | | | | | | $ | 64,173,964 | |
| EXPENSES: | | | | | | | | |
| Management fees | | $ | 13,533,463 | | | | | |
| Administrative expense | | | 614,869 | | | | | |
| Transfer agent fees | | | | | | | | |
| Class A | | | 1,048,674 | | | | | |
| Class C | | | 64,752 | | | | | |
| Class K | | | 2,001 | | | | | |
| Class R | | | 141,376 | | | | | |
| Class Y | | | 1,219,296 | | | | | |
| Distribution fees | | | | | | | | |
| Class A | | | 1,941,117 | | | | | |
| Class C | | | 853,955 | | | | | |
| Class R | | | 282,937 | | | | | |
| Shareowner communications expense | | | 205,194 | | | | | |
| Custodian fees | | | 29,822 | | | | | |
| Registration fees | | | 133,936 | | | | | |
| Professional fees | | | 152,224 | | | | | |
| Printing expense | | | 50,410 | | | | | |
| Trustees’ fees | | | 127,016 | | | | | |
| Insurance expense | | | 35,206 | | | | | |
| Interest expense | | | 1,832 | | | | | |
| Miscellaneous | | | 124,355 | | | | | |
| Total expenses | | | | | | $ | 20,562,435 | |
| Net investment income | | | | | | $ | 43,611,529 | |
| REALIZED AND UNREALIZED GAIN (LOSS) ON INVESTMENTS: | | | | | |
| Net realized gain (loss) on: | | | | | | | | |
| Investments in unaffiliated issuers | | $ | (134,734,178 | ) | | | | |
| Investments in affiliated issuers | | | 826,941 | | | | | |
| Other assets and liabilities denominated in | | | | | | | | |
| foreign currencies | | | (131 | ) | | $ | (133,907,368 | ) |
| Change in net unrealized appreciation (depreciation) on: | | | | | | | | |
| Investments in unaffiliated issuers | | $ | (115,564,956 | ) | | | | |
| Other assets and liabilities denominated in | | | | | | | | |
| foreign currencies | | | 51,230 | | | $ | (115,513,726 | ) |
| Net realized and unrealized gain (loss) on investments | | | | | | $ | (249,421,094 | ) |
| Net decrease in net assets resulting from operations | | | | | | $ | (205,809,565 | ) |
The accompanying notes are an integral part of these financial statements.
Pioneer Equity Income Fund | Annual Report | 10/31/20 25
Statements of Changes in Net Assets
| | | | | | | |
| | Year Ended | | | Year Ended | |
| | 10/31/20 | | | 10/31/19 | |
| FROM OPERATIONS: | | | | | | |
Net investment income (loss) | | $ | 43,611,529 | | | $ | 57,570,590 | |
Net realized gain (loss) on investments | | | (133,907,368 | ) | | | 58,390,912 | |
Change in net unrealized appreciation (depreciation) | | | | | | | | |
| on investments | | | (115,513,726 | ) | | | 157,434,753 | |
| Net increase (decrease) in net assets resulting | | | | | | | | |
| from operations | | $ | (205,809,565 | ) | | $ | 273,396,255 | |
| DISTRIBUTIONS TO SHAREOWNERS: | | | | | | | | |
| Class A ($1.44 and $2.37 per share, respectively) | | $ | (34,920,415 | ) | | $ | (58,422,930 | ) |
| Class C ($1.21 and $2.05 per share, respectively) | | | (3,457,576 | ) | | | (6,733,274 | ) |
| Class K ($1.56 and $2.50 per share, respectively) | | | (12,271,255 | ) | | | (17,273,284 | ) |
| Class R ($1.30 and $2.21 per share, respectively) | | | (2,364,835 | ) | | | (4,711,818 | ) |
| Class Y ($1.50 and $2.46 per share, respectively) | | | (51,519,600 | ) | | | (89,683,660 | ) |
| Total distributions to shareowners | | $ | (104,533,681 | ) | | $ | (176,824,966 | ) |
| FROM FUND SHARE TRANSACTIONS: | | | | | | | | |
Net proceeds from sales of shares | | $ | 382,990,687 | | | $ | 637,299,678 | |
Reinvestment of distributions | | | 98,373,957 | | | | 163,620,328 | |
Cost of shares repurchased | | | (809,764,893 | ) | | | (749,328,297 | ) |
| Net increase (decrease) in net assets resulting from | | | | | | | | |
| Fund share transactions | | $ | (328,400,249 | ) | | $ | 51,591,709 | |
| Net increase (decrease) in net assets | | $ | (638,743,495 | ) | | $ | 148,162,998 | |
| NET ASSETS: | | | | | | | | |
Beginning of year | | $ | 2,636,860,210 | | | $ | 2,488,697,212 | |
End of year | | $ | 1,998,116,715 | | | $ | 2,636,860,210 | |
The accompanying notes are an integral part of these financial statements.
26 Pioneer Equity Income Fund | Annual Report | 10/31/20
| | | | | | | | | | | | | |
| | Year | | | Year | | | Year | | | Year | |
| | Ended | | | Ended | | | Ended | | | Ended | |
| | 10/31/20 | | | 10/31/20 | | | 10/31/19 | | | 10/31/19 | |
| | Shares | | | Amount | | | Shares | | | Amount | |
| Class A | | | | | | | | | | | | |
Shares sold | | | 2,092,282 | | | $ | 67,006,953 | | | | 3,860,473 | | | $ | 128,716,526 | |
Reinvestment of distributions | | | 991,808 | | | | 33,256,359 | | | | 1,704,512 | | | | 55,644,813 | |
Less shares repurchased | | | (5,510,282 | ) | | | (177,240,555 | ) | | | (4,985,241 | ) | | | (167,269,473 | ) |
| Net increase (decrease) | | | (2,426,192 | ) | | $ | (76,977,243 | ) | | | 579,744 | | | $ | 17,091,866 | |
| Class C | | | | | | | | | | | | | | | | |
Shares sold | | | 306,030 | | | $ | 9,667,533 | | | | 583,924 | | | $ | 18,847,145 | |
Reinvestment of distributions | | | 93,391 | | | | 3,131,717 | | | | 190,828 | | | | 6,123,011 | |
Less shares repurchased | | | (1,124,645 | ) | | | (34,913,994 | ) | | | (1,119,272 | ) | | | (36,569,594 | ) |
| Net decrease | | | (725,224 | ) | | $ | (22,114,744 | ) | | | (344,520 | ) | | $ | (11,599,438 | ) |
| Class K | | | | | | | | | | | | | | | | |
Shares sold | | | 2,192,771 | | | $ | 69,678,672 | | | | 2,911,029 | | | $ | 97,030,242 | |
Reinvestment of distributions | | | 361,676 | | | | 12,045,730 | | | | 485,199 | | | | 15,876,272 | |
Less shares repurchased | | | (2,615,608 | ) | | | (84,197,750 | ) | | | (1,782,664 | ) | | | (60,341,813 | ) |
| Net increase (decrease) | | | (61,161 | ) | | $ | (2,473,348 | ) | | | 1,613,564 | | | $ | 52,564,701 | |
| Class R | | | | | | | | | | | | | | | | |
Shares sold | | | 238,799 | | | $ | 7,756,125 | | | | 424,145 | | | $ | 14,456,410 | |
Reinvestment of distributions | | | 67,453 | | | | 2,337,266 | | | | 135,746 | | | | 4,526,960 | |
Less shares repurchased | | | (715,913 | ) | | | (23,094,963 | ) | | | (771,063 | ) | | | (26,297,517 | ) |
| Net decrease | | | (409,661 | ) | | $ | (13,001,572 | ) | | | (211,172 | ) | | $ | (7,314,147 | ) |
| Class Y | | | | | | | | | | | | | | | | |
Shares sold | | | 7,090,869 | | | $ | 228,881,404 | | | | 11,132,147 | | | $ | 378,249,355 | |
Reinvestment of distributions | | | 1,408,643 | | | | 47,602,885 | | | | 2,463,226 | | | | 81,449,272 | |
Less shares repurchased | | | (15,242,046 | ) | | | (490,317,631 | ) | | | (13,533,650 | ) | | | (458,849,900 | ) |
| Net increase (decrease) | | | (6,742,534 | ) | | $ | (213,833,342 | ) | | | 61,723 | | | $ | 848,727 | |
The accompanying notes are an integral part of these financial statements.
Pioneer Equity Income Fund | Annual Report | 10/31/20 27
| | Year | | | Year | | | Year | | | Year | | | Year | |
| | Ended | | | Ended | | | Ended | | | Ended | | | Ended | |
| | 10/31/20 | | | 10/31/19 | | | 10/31/18 | | | 10/31/17 | | | 10/31/16* | |
| Class A | | | | | | | | | | | | | |
| |
Net asset value, beginning of period | | $ | 35.59 | | | $ | 34.39 | | | $ | 35.68 | | | $ | 33.76 | | | $ | 34.41 | |
Increase (decrease) from investment operations: (a) | | | | | | | | | | | | | | | | | | | | |
| Net investment income (loss) | | $ | 0.58 | | | $ | 0.72 | | | $ | 0.72 | | | $ | 0.55 | | | $ | 0.68 | |
| Net realized and unrealized gain (loss) on investments | | | (3.35 | ) | | | 2.85 | | | | (0.04 | ) | | | 5.58 | | | | 1.89 | |
| Net increase (decrease) from investment operations | | $ | (2.77 | ) | | $ | 3.57 | | | $ | 0.68 | | | $ | 6.13 | | | $ | 2.57 | |
Distributions to shareowners: | | | | | | | | | | | | | | | | | | | | |
| Net investment income | | $ | (0.61 | ) | | $ | (0.79 | ) | | $ | (0.57 | ) | | $ | (0.51 | ) | | $ | (0.64 | ) |
| Net realized gain | | | (0.83 | ) | | | (1.58 | ) | | | (1.40 | ) | | | (3.70 | ) | | | (2.58 | ) |
| Total distributions | | $ | (1.44 | ) | | $ | (2.37 | ) | | $ | (1.97 | ) | | $ | (4.21 | ) | | $ | (3.22 | ) |
| Net increase (decrease) in net asset value | | $ | (4.21 | ) | | $ | 1.20 | | | $ | (1.29 | ) | | $ | 1.92 | | | $ | (0.65 | ) |
Net asset value, end of period | | $ | 31.38 | | | $ | 35.59 | | | $ | 34.39 | | | $ | 35.68 | | | $ | 33.76 | |
| Total return (b) | | | (8.00 | )% | | | 11.15 | % | | | 1.84 | % | | | 19.68 | %(c) | | | 8.11 | % |
Ratio of net expenses to average net assets | | | 1.06 | % | | | 1.00 | % | | | 1.00 | % | | | 1.02 | % | | | 1.04 | % |
Ratio of net investment income (loss) to average net assets | | | 1.78 | % | | | 2.14 | % | | | 2.00 | % | | | 1.62 | % | | | 2.10 | % |
Portfolio turnover rate | | | 8 | % | | | 23 | % | | | 27 | % | | | 33 | % | | | 35 | % |
Net assets, end of period (in thousands) | | $ | 703,864 | | | $ | 884,809 | | | $ | 835,012 | | | $ | 858,764 | | | $ | 757,158 | |
* | The Fund was audited by an independent registered public accounting firm other than Ernst & Young LLP. |
(a) | The per-share data presented above is based on the average shares outstanding for the period presented. |
(b) | Assumes initial investment at net asset value at the beginning of each period, reinvestment of all distributions, the complete redemption of the investment at net asset value at the end of each period and no sales charges. Total return would be reduced if sales charges were taken into account. |
(c) | If the Fund had not recognized gains in the settlement of class action lawsuits during the year ended October 31, 2017, the total return would have been 19.64%. |
The accompanying notes are an integral part of these financial statements.
28 Pioneer Equity Income Fund | Annual Report | 10/31/20
| | Year | | | Year | | | Year | | | Year | | | Year | |
| | Ended | | | Ended | | | Ended | | | Ended | | | Ended | |
| | 10/31/20 | | | 10/31/19 | | | 10/31/18 | | | 10/31/17 | | | 10/31/16* | |
| Class C | | | | | | | | | | | | | |
| |
Net asset value, beginning of period | | $ | 35.00 | | | $ | 33.80 | | | $ | 35.06 | | | $ | 33.24 | | | $ | 33.91 | |
Increase (decrease) from investment operations: (a) | | | | | | | | | | | | | | | | | | | | |
| Net investment income (loss) | | $ | 0.35 | | | $ | 0.46 | | | $ | 0.48 | | | $ | 0.30 | | | $ | 0.43 | |
| Net realized and unrealized gain (loss) on investments | | | (3.29 | ) | | | 2.79 | | | | (0.05 | ) | | | 5.47 | | | | 1.87 | |
| Net increase (decrease) from investment operations | | $ | (2.94 | ) | | $ | 3.25 | | | $ | 0.43 | | | $ | 5.77 | | | $ | 2.30 | |
Distributions to shareowners: | | | | | | | | | | | | | | | | | | | | |
| Net investment income | | $ | (0.38 | ) | | $ | (0.47 | ) | | $ | (0.29 | ) | | $ | (0.25 | ) | | $ | (0.39 | ) |
| Net realized gain | | | (0.83 | ) | | | (1.58 | ) | | | (1.40 | ) | | | (3.70 | ) | | | (2.58 | ) |
| Total distributions | | $ | (1.21 | ) | | $ | (2.05 | ) | | $ | (1.69 | ) | | $ | (3.95 | ) | | $ | (2.97 | ) |
| Net increase (decrease) in net asset value | | $ | (4.15 | ) | | $ | 1.20 | | | $ | (1.26 | ) | | $ | 1.82 | | | $ | (0.67 | ) |
Net asset value, end of period | | $ | 30.85 | | | $ | 35.00 | | | $ | 33.80 | | | $ | 35.06 | | | $ | 33.24 | |
| Total return (b) | | | (8.64 | )% | | | 10.27 | % | | | 1.14 | % | | | 18.77 | % | | | 7.34 | %(c) |
Ratio of net expenses to average net assets | | | 1.75 | % | | | 1.78 | % | | | 1.72 | % | | | 1.75 | % | | | 1.77 | % |
Ratio of net investment income (loss) to average net assets | | | 1.11 | % | | | 1.38 | % | | | 1.35 | % | | | 0.89 | % | | | 1.34 | % |
Portfolio turnover rate | | | 8 | % | | | 23 | % | | | 27 | % | | | 33 | % | | | 35 | % |
Net assets, end of period (in thousands) | | $ | 68,832 | | | $ | 103,483 | | | $ | 111,558 | | | $ | 148,417 | | | $ | 140,199 | |
* | The Fund was audited by an independent registered public accounting firm other than Ernst & Young LLP. |
(a) | The per-share data presented above is based on the average shares outstanding for the period presented. |
(b) | Assumes initial investment at net asset value at the beginning of each period, reinvestment of all distributions, the complete redemption of the investment at net asset value at the end of each period and no sales charges. Total return would be reduced if sales charges were taken into account. |
(c) | If the Fund had not recognized gains in settlement of class action lawsuits during year ended October 31, 2016, the total return would have been 7.30%. |
The accompanying notes are an integral part of these financial statements.
Pioneer Equity Income Fund | Annual Report | 10/31/20 29
| | | | | | | |
Financial Highlights (continued) | | | | | | |
| | Year | | | Year | | | Year | | | Year | | | Year | |
| | Ended | | | Ended | | | Ended | | | Ended | | | Ended | |
| | 10/31/20 | | | 10/31/19 | | | 10/31/18 | | | 10/31/17 | | | 10/31/16* | |
| Class K | | | | | | | | | | | | | | | |
Net asset value, beginning of period | | $ | 35.65 | | | $ | 34.47 | | | $ | 35.75 | | | $ | 33.81 | | | $ | 34.44 | |
Increase (decrease) from investment operations: (a) | | | | | | | | | | | | | | | | | | | | |
| Net investment income (loss) | | $ | 0.71 | | | $ | 0.83 | | | $ | 0.85 | | | $ | 0.67 | | | $ | 0.80 | |
| Net realized and unrealized gain (loss) on investments | | | (3.36 | ) | | | 2.85 | | | | (0.04 | ) | | | 5.60 | | | | 1.89 | |
| Net increase (decrease) from investment operations | | $ | (2.65 | ) | | $ | 3.68 | | | $ | 0.81 | | | $ | 6.27 | | | $ | 2.69 | |
Distributions to shareowners: | | | | | | | | | | | | | | | | | | | | |
| Net investment income | | $ | (0.73 | ) | | $ | (0.92 | ) | | $ | (0.69 | ) | | $ | (0.63 | ) | | $ | (0.74 | ) |
| Net realized gain | | | (0.83 | ) | | | (1.58 | ) | | | (1.40 | ) | | | (3.70 | ) | | | (2.58 | ) |
| Total distributions | | $ | (1.56 | ) | | $ | (2.50 | ) | | $ | (2.09 | ) | | $ | (4.33 | ) | | $ | (3.32 | ) |
| Net increase (decrease) in net asset value | | $ | (4.21 | ) | | $ | 1.18 | | | $ | (1.28 | ) | | $ | 1.94 | | | $ | (0.63 | ) |
Net asset value, end of period | | $ | 31.44 | | | $ | 35.65 | | | $ | 34.47 | | | $ | 35.75 | | | $ | 33.81 | |
| Total return (b) | | | (7.62 | )% | | | 11.53 | % | | | 2.21 | % | | | 20.12 | % | | | 8.50 | % |
Ratio of net expenses to average net assets | | | 0.66 | % | | | 0.66 | % | | | 0.66 | % | | | 0.66 | % | | | 0.67 | % |
Ratio of net investment income (loss) to average net assets | | | 2.18 | % | | | 2.46 | % | | | 2.38 | % | | | 1.96 | % | | | 2.42 | % |
Portfolio turnover rate | | | 8 | % | | | 23 | % | | | 27 | % | | | 33 | % | | | 35 | % |
Net assets, end of period (in thousands) | | $ | 242,250 | | | $ | 276,921 | | | $ | 212,103 | | | $ | 94,915 | | | $ | 48,194 | |
* The Fund was audited by an independent registered public accounting firm other than Ernst & Young LLP.
(a) The per-share data presented above is based on the average shares outstanding for the period presented.
(b) Assumes initial investment at net asset value at the beginning of each period, reinvestment of all distributions and the complete redemption of the investment at net asset value at the end of each period.
The accompanying notes are an integral part of these financial statements.
30 Pioneer Equity Income Fund | Annual Report | 10/31/20
| | Year | | | Year | | | Year | | | Year | | | Year | |
| | Ended | | | Ended | | | Ended | | | Ended | | | Ended | |
| | 10/31/20 | | | 10/31/19 | | | 10/31/18 | | | 10/31/17 | | | 10/31/16* | |
| Class R | | | | | | | | | | | | | | | |
Net asset value, beginning of period | | $ | 36.28 | | | $ | 34.98 | | | $ | 36.24 | | | $ | 34.24 | | | $ | 34.83 | |
Increase (decrease) from investment operations: (a) | | | | | | | | | | | | | | | | | | | | |
| Net investment income (loss) | | $ | 0.48 | | | $ | 0.61 | | | $ | 0.56 | | | $ | 0.43 | | | $ | 0.57 | |
| Net realized and unrealized gain (loss) on investments | | | (3.42 | ) | | | 2.90 | | | | (0.02 | ) | | | 5.65 | | | | 1.92 | |
| Net increase (decrease) from investment operations | | $ | (2.94 | ) | | $ | 3.51 | | | $ | 0.54 | | | $ | 6.08 | | | $ | 2.49 | |
Distributions to shareowners: | | | | | | | | | | | | | | | | | | | | |
| Net investment income | | $ | (0.47 | ) | | $ | (0.63 | ) | | $ | (0.40 | ) | | $ | (0.38 | ) | | $ | (0.50 | ) |
| Net realized gain | | | (0.83 | ) | | | (1.58 | ) | | | (1.40 | ) | | | (3.70 | ) | | | (2.58 | ) |
| Total distributions | | $ | (1.30 | ) | | $ | (2.21 | ) | | $ | (1.80 | ) | | $ | (4.08 | ) | | $ | (3.08 | ) |
| Net increase (decrease) in net asset value | | $ | (4.24 | ) | | $ | 1.30 | | | $ | (1.26 | ) | | $ | 2.00 | | | $ | (0.59 | ) |
Net asset value, end of period | | $ | 32.04 | | | $ | 36.28 | | | $ | 34.98 | | | $ | 36.24 | | | $ | 34.24 | |
| Total return (b) | | | (8.33 | )% | | | 10.71 | % | | | 1.42 | % | | | 19.19 | % | | | 7.73 | % |
Ratio of net expenses to average net assets | | | 1.41 | % | | | 1.39 | % | | | 1.44 | % | | | 1.41 | % | | | 1.40 | % |
Ratio of net investment income (loss) to average net assets | | | 1.44 | % | | | 1.77 | % | | | 1.55 | % | | | 1.24 | % | | | 1.73 | % |
Portfolio turnover rate | | | 8 | % | | | 23 | % | | | 27 | % | | | 33 | % | | | 35 | % |
Net assets, end of period (in thousands) | | $ | 48,198 | | | $ | 69,435 | | | $ | 74,323 | | | $ | 92,870 | | | $ | 85,307 | |
* | The Fund was audited by an independent registered public accounting firm other than Ernst & Young LLP. |
(a) | The per-share data presented above is based on the average shares outstanding for the period presented. |
(b) | Assumes initial investment at net asset value at the beginning of each period, reinvestment of all distributions and the complete redemption of the investment at net asset value at the end of each period. |
The accompanying notes are an integral part of these financial statements.
Pioneer Equity Income Fund | Annual Report | 10/31/20 31
| | | | | | | | | | |
Financial Highlights (continued)
| | | | | | |
| | Year | | | Year | | | Year | | | Year | | | Year | |
| | Ended | | | Ended | | | Ended | | | Ended | | | Ended | |
| | 10/31/20 | | | 10/31/19 | | | 10/31/18 | | | 10/31/17 | | | 10/31/16* | |
| Class Y | | | | | | | | | | | | | |
| |
Net asset value, beginning of period | | $ | 36.05 | | | $ | 34.82 | | | $ | 36.10 | | | $ | 34.10 | | | $ | 34.71 | |
Increase (decrease) from investment operations: (a) | | | | | | | | | | | | | | | | | | | | |
| Net investment income (loss) | | $ | 0.69 | | | $ | 0.81 | | | $ | 0.86 | | | $ | 0.64 | | | $ | 0.77 | |
| Net realized and unrealized gain (loss) on investments | | | (3.42 | ) | | | 2.88 | | | | (0.08 | ) | | | 5.65 | | | | 1.92 | |
| Net increase (decrease) from investment operations | | $ | (2.73 | ) | | $ | 3.69 | | | $ | 0.78 | | | $ | 6.29 | | | $ | 2.69 | |
Distributions to shareowners: | | | | | | | | | | | | | | | | | | | | |
| Net investment income | | $ | (0.67 | ) | | $ | (0.88 | ) | | $ | (0.66 | ) | | $ | (0.59 | ) | | $ | (0.72 | ) |
| Net realized gain | | | (0.83 | ) | | | (1.58 | ) | | | (1.40 | ) | | | (3.70 | ) | | | (2.58 | ) |
| Total distributions | | $ | (1.50 | ) | | $ | (2.46 | ) | | $ | (2.06 | ) | | $ | (4.29 | ) | | $ | (3.30 | ) |
| Net increase (decrease) in net asset value | | $ | (4.23 | ) | | $ | 1.23 | | | $ | (1.28 | ) | | $ | 2.00 | | | $ | (0.61 | ) |
Net asset value, end of period | | $ | 31.82 | | | $ | 36.05 | | | $ | 34.82 | | | $ | 36.10 | | | $ | 34.10 | |
| Total return (b) | | | (7.76 | )% | | | 11.41 | % | | | 2.09 | % | | | 19.99 | %(c) | | | 8.40 | % |
Ratio of net expenses to average net assets | | | 0.77 | % | | | 0.78 | % | | | 0.76 | % | | | 0.77 | % | | | 0.77 | % |
Ratio of net investment income (loss) to average net assets | | | 2.08 | % | | | 2.37 | % | | | 2.37 | % | | | 1.86 | % | | | 2.34 | % |
Portfolio turnover rate | | | 8 | % | | | 23 | % | | | 27 | % | | | 33 | % | | | 35 | % |
Net assets, end of period (in thousands) | | $ | 934,973 | | | $ | 1,302,212 | | | $ | 1,255,700 | | | $ | 1,030,526 | | | $ | 684,969 | |
* | The Fund was audited by an independent registered public accounting firm other than Ernst & Young LLP. |
(a) | The per-share data presented above is based on the average shares outstanding for the period presented. |
(b) | Assumes initial investment at net asset value at the beginning of each period, reinvestment of all distributions and the complete redemption of the investment at net asset value at the end of each period. |
(c) | If the Fund had not recognized gains in the settlement of class action lawsuits during the year ended October 31, 2017, the total return would have been 19.96%. |
The accompanying notes are an integral part of these financial statements.
32 Pioneer Equity Income Fund | Annual Report | 10/31/20
Notes to Financial Statements |
10/31/20 1. Organization and Significant Accounting Policies
Pioneer Equity Income Fund (the “Fund”) is a Delaware statutory trust. The Fund is registered under the Investment Company Act of 1940 as a diversified, open-end management investment company. The investment objective of the Fund is current income and long-term growth of capital from a portfolio consisting primarily of income producing equity securities of U.S. corporations.
The Fund offers five classes of shares designated as Class A, Class C, Class K, Class R and Class Y shares. Each class of shares represents an interest in the same portfolio of investments of the Fund and has identical rights (based on relative net asset values) to assets and liquidation proceeds. Share classes can bear different rates of class-specific fees and expenses such as transfer agent and distribution fees. Differences in class-specific fees and expenses will result in differences in net investment income and, therefore, the payment of different dividends from net investment income earned by each class. The Amended and Restated Declaration of Trust of the Fund gives the Board of Trustees the flexibility to specify either per-share voting or dollar-weighted voting when submitting matters for shareholder approval. Under per-share voting, each share of a class of the Fund is entitled to one vote. Under dollar-weighted voting, a shareholder’s voting power is determined not by the number of shares owned, but by the dollar value of the shares on the record date. Each share class has exclusive voting rights with respect to matters affecting only that class, including with respect to the distribution plan for that class. There is no distribution plan for Class K or Class Y shares.
Amundi Pioneer Asset Management, Inc., an indirect, wholly owned subsidiary of Amundi and Amundi’s wholly owned subsidiary, Amundi USA, Inc., serves as the Fund’s investment adviser (the “Adviser”). Amundi Pioneer Distributor, Inc., an affiliate of Amundi Pioneer Asset Management, Inc., serves as the Fund’s distributor (the “Distributor”).
In March 2020, FASB issued an Accounting Standard Update, ASU 2020-04, Reference Rate Reform (Topic 848) — Facilitation of the Effects of Reference Rate Reform on Financial Reporting (“ASU 2020-04”), which provides optional, temporary relief with respect to the financial reporting of contracts subject to certain types of modifications due to the planned discontinuation of the London Interbank Offered Rate (“LIBOR”) and other LIBOR-based reference rates at the end of 2021. The temporary relief provided by ASU 2020-04 is effective for certain reference rate-related contract modifications that occur during the period from March 12, 2020
Pioneer Equity Income Fund | Annual Report | 10/31/20 33
through December 31, 2022. Management is evaluating the impact of ASU 2020-04 on the Fund’s investments, derivatives, debt and other contracts that will undergo reference rate-related modifications as a result of the reference rate reform.
The Fund is an investment company and follows investment company accounting and reporting guidance under U.S. Generally Accepted Accounting Principles (“U.S. GAAP”). U.S. GAAP requires the management of the Fund to make estimates and assumptions that affect the reported amounts of assets and liabilities, the disclosure of contingent assets and liabilities at the date of the financial statements, and the reported amounts of income, expenses and gain or loss on investments during the reporting period. Actual results could differ from those estimates.
The following is a summary of significant accounting policies followed by the Fund in the preparation of its financial statements:
A. Security Valuation
The net asset value of the Fund is computed once daily, on each day the New York Stock Exchange (“NYSE”) is open, as of the close of regular trading on the NYSE.
Equity securities that have traded on an exchange are valued by using the last sale price on the principal exchange where they are traded. Equity securities that have not traded on the date of valuation, or securities for which sale prices are not available, generally are valued using the mean between the last bid and asked prices or, if both last bid and asked prices are not available, at the last quoted bid price. Last sale and bid and asked prices are provided by independent third party pricing services. In the case of equity securities not traded on an exchange, prices are typically determined by independent third party pricing services using a variety of techniques and methods.
The value of foreign securities is translated into U.S. dollars based on foreign currency exchange rate quotations supplied by a third party pricing source. Trading in non-U.S. equity securities is substantially completed each day at various times prior to the close of the NYSE. The values of such securities used in computing the net asset value of the Fund’s shares are determined as of such times. The Fund may use a fair value model developed by an independent pricing service to value non-U.S. equity securities.
Fixed-income securities are valued by using prices supplied by independent pricing services, which consider such factors as market prices, market events, quotations from one or more brokers, Treasury spreads, yields, maturities and ratings, or may use a pricing matrix or other fair value methods or techniques to provide an estimated value of the security or
34 Pioneer Equity Income Fund | Annual Report | 10/31/20
instrument. A pricing matrix is a means of valuing a debt security on the basis of current market prices for other debt securities, historical trading patterns in the market for fixed-income securities and/or other factors. Non-U.S. debt securities that are listed on an exchange will be valued at the bid price obtained from an independent third party pricing service. When independent third party pricing services are unable to supply prices, or when prices or market quotations are considered to be unreliable, the value of that security may be determined using quotations from one or more broker-dealers.
Securities for which independent pricing services or broker-dealers are unable to supply prices or for which market prices and/or quotations are not readily available or are considered to be unreliable are valued by a fair valuation team comprised of certain personnel of the Adviser pursuant to procedures adopted by the Fund’s Board of Trustees. The Adviser’s fair valuation team uses fair value methods approved by the Valuation Committee of the Board of Trustees. The Adviser’s fair valuation team is responsible for monitoring developments that may impact fair valued securities and for discussing and assessing fair values on an ongoing basis, and at least quarterly, with the Valuation Committee of the Board of Trustees.
Inputs used when applying fair value methods to value a security may include credit ratings, the financial condition of the company, current market conditions and comparable securities. The Fund may use fair value methods if it is determined that a significant event has occurred after the close of the exchange or market on which the security trades and prior to the determination of the Fund’s net asset value. Examples of a significant event might include political or economic news, corporate restructurings, natural disasters, terrorist activity or trading halts. Thus, the valuation of the Fund’s securities may differ significantly from exchange prices, and such differences could be material.
At October 31, 2020, no securities were valued using fair value methods (other than securities valued using prices supplied by independent pricing services, broker-dealers or using a third party insurance industry pricing model).
B. Investment Income and Transactions
Dividend income is recorded on the ex-dividend date, except that certain dividends from foreign securities where the ex-dividend date may have passed are recorded as soon as the Fund becomes aware of the ex-dividend data in the exercise of reasonable diligence.
Pioneer Equity Income Fund | Annual Report | 10/31/20 35
Interest income, including interest on income-bearing cash accounts, is recorded on the accrual basis. Dividend and interest income are reported net of unrecoverable foreign taxes withheld at the applicable country rates and net of income accrued on defaulted securities.
Interest and dividend income payable by delivery of additional shares is reclassified as PIK (payment-in-kind) income upon receipt and is included in interest and dividend income, respectively.
Security transactions are recorded as of trade date. Gains and losses on sales of investments are calculated on the identified cost method for both financial reporting and federal income tax purposes.
C. Foreign Currency Translation
The books and records of the Fund are maintained in U.S. dollars. Amounts denominated in foreign currencies are translated into U.S. dollars using current exchange rates.
Net realized gains and losses on foreign currency transactions, if any, represent, among other things, the net realized gains and losses on foreign currency exchange contracts, disposition of foreign currencies and the difference between the amount of income accrued and the U.S. dollars actually received. Further, the effects of changes in foreign currency exchange rates on investments are not segregated on the Statement of Operations from the effects of changes in the market prices of those securities, but are included with the net realized and unrealized gain or loss on investments.
D. Federal Income Taxes
It is the Fund’s policy to comply with the requirements of the Internal Revenue Code applicable to regulated investment companies and to distribute all of its net taxable income and net realized capital gains, if any, to its shareowners. Therefore, no provision for federal income taxes is required. As of October 31, 2020, the Fund did not accrue any interest or penalties with respect to uncertain tax positions, which, if applicable, would be recorded as an income tax expense on the Statement of Operations. Tax returns filed within the prior three years remain subject to examination by federal and state tax authorities.
The amount and character of income and capital gain distributions to shareowners are determined in accordance with federal income tax rules, which may differ from U.S. GAAP. Distributions in excess of net investment income or net realized gains are temporary over distributions for financial statement purposes resulting from differences in the recognition or classification of income or distributions for financial statement and tax
36 Pioneer Equity Income Fund | Annual Report | 10/31/20
purposes. Capital accounts within the financial statements are adjusted for permanent book/tax differences to reflect tax character, but are not adjusted for temporary differences.
At October 31, 2020, the Fund reclassified $116,078 to increase distributable earnings and $116,078 to decrease paid-in capital to reflect permanent book/tax differences. These adjustments have no impact on net assets or the results of operations.
At October 31, 2020, the Fund was permitted to carry forward indefinitely $125,342,863 of long-term losses.
The tax character of distributions paid during the years ended October 31, 2020 and October 31, 2019, were as follows:
| | | 2020 | | | 2019 | |
| Distributions paid from: | | | | | | |
| Ordinary income | | $ | 44,110,443 | | | $ | 62,285,134 | |
| Long-term capital gain | | | 60,423,238 | | | | 114,539,832 | |
| Total | | $ | 104,533,681 | | | $ | 176,824,966 | |
The following shows the components of distributable earnings on a federal income tax basis at October 31, 2020:
| | | 2020 | |
| Distributable earnings/(losses): | | | |
| Undistributed ordinary income | | $ | 1,392,691 | |
| Capital loss carryover | | | (125,342,863 | ) |
| Net unrealized appreciation | | | 433,198,313 | |
| Total | | $ | 309,248,141 | |
The difference between book-basis and tax-basis net unrealized appreciation is attributable to the tax deferral of losses on wash sales and tax basis adjustments on Real Estate Investment Trust (REIT) holdings, partnerships and common stock holdings.
E. Fund Shares
The Fund records sales and repurchases of its shares as of trade date. The Distributor earned $60,983 in underwriting commissions on the sale of Class A shares during the year ended October 31, 2020.
F. Class Allocations
Income, common expenses and realized and unrealized gains and losses are calculated at the Fund level and allocated daily to each class of shares based on its respective percentage of adjusted net assets at the beginning of the day.
Pioneer Equity Income Fund | Annual Report | 10/31/20 37
Distribution fees are calculated based on the average daily net asset value attributable to Class A, Class C and Class R shares of the Fund, respectively (see Note 4). Class K and Class Y shares do not pay distribution fees. All expenses and fees paid to the Fund’s transfer agent for its services are allocated among the classes of shares based on the number of accounts in each class and the ratable allocation of related out-of-pocket expenses (see Note 3).
Distributions to shareowners are recorded as of the ex-dividend date. Distributions paid by the Fund with respect to each class of shares are calculated in the same manner and at the same time, except that net investment income dividends to Class A, Class C, Class K, Class R and Class Y shares can reflect different transfer agent and distribution expense rates.
G. Risks
The value of securities held by the Fund may go up or down, sometimes rapidly or unpredictably, due to general market conditions, such as real or perceived adverse economic, political or regulatory conditions, recessions, the spread of infectious illness or other public health issues, inflation, changes in interest rates, lack of liquidity in the bond markets or adverse investor sentiment. In the past several years, financial markets have experienced increased volatility, depressed valuations, decreased liquidity and heightened uncertainty. These conditions may continue, recur, worsen or spread.
At times, the Fund’s investments may represent industries or industry sectors that are interrelated or have common risks, making the Fund more susceptible to any economic, political, or regulatory developments or other risks affecting those industries and sectors. The Fund’s investments in foreign markets and countries with limited developing markets may subject the Fund to a greater degree of risk than investments in a developed market. These risks include disruptive political or economic conditions and the imposition of adverse governmental laws or currency exchange restrictions. The Fund may invest in REIT securities, the value of which can fall for a variety of reasons, such as declines in rental income, fluctuating interest rates, poor property management, environmental liabilities, uninsured damage, increased competition, or changes in real estate tax laws.
With the increased use of technologies such as the Internet to conduct business, the Fund is susceptible to operational, information security and related risks. While the Fund’s Adviser has established business continuity plans in the event of, and risk management systems to prevent, limit or mitigate, such cyber-attacks, there are inherent limitations in such plans
38 Pioneer Equity Income Fund | Annual Report | 10/31/20
and systems, including the possibility that certain risks have not been identified. Furthermore, the Fund cannot control the cybersecurity plans and systems put in place by service providers to the Fund such as Brown Brothers Harriman & Co., the Fund’s custodian and accounting agent, and DST Asset Manager Solutions, Inc., the Fund’s transfer agent. In addition, many beneficial owners of Fund shares hold them through accounts at broker-dealers, retirement platforms and other financial market participants over which neither the Fund nor Amundi exercises control. Each of these may in turn rely on service providers to them, which are also subject to the risk of cyber-attacks. Cybersecurity failures or breaches at Amundi or the Fund’s service providers or intermediaries have the ability to cause disruptions and impact business operations, potentially resulting in financial losses, interference with the Fund’s ability to calculate its net asset value, impediments to trading, the inability of Fund shareowners to effect share purchases, redemptions or exchanges or receive distributions, loss of or unauthorized access to private shareowner information and violations of applicable privacy and other laws, regulatory fines, penalties, reputational damage, or additional compliance costs. Such costs and losses may not be covered under any insurance. In addition, maintaining vigilance against cyber-attacks may involve substantial costs over time, and system enhancements may themselves be subject to cyber-attacks.
COVID-19
The respiratory illness COVID-19 caused by a novel coronavirus has resulted in a global pandemic and major disruption to economies and markets around the world, including the United States. Global financial markets have experienced extreme volatility and severe losses, and trading in many instruments has been disrupted. Liquidity for many instruments has been greatly reduced for periods of time. Some interest rates are very low and in some cases yields are negative. Some sectors of the economy and individual issuers have experienced particularly large losses. These circumstances may continue for an extended period of time, and may continue to affect adversely the value and liquidity of the Fund’s investments. The ultimate economic fallout from the pandemic, and the long-term impact on economies, markets, industries and individual issuers, are not known. Governments and central banks, including the Federal Reserve in the U.S., have taken extraordinary and unprecedented actions to support local and global economies and the financial markets. These actions have resulted in significant expansion of public debt, including in the U.S. The impact of these measures, and whether they will be effective to mitigate the economic and market disruption, will not be known for some time. The consequences of high public debt, including its future impact on the economy and securities markets, likewise may not be known for some time.
Pioneer Equity Income Fund | Annual Report | 10/31/20 39
The Fund’s prospectus contains unaudited information regarding the Fund’s principal risks. Please refer to that document when considering the Fund’s principal risks.
2. Management Agreement
The Adviser manages the Fund’s portfolio. Management fees are calculated daily and paid monthly at the annual rate of 0.60% of the Fund’s average daily net assets up to $10 billion and 0.575% of the fund’s average daily net assets over $10 billion. For the year ended October 31, 2020, the effective management fee (excluding waivers and/or assumption of expenses) was equivalent to 0.60% (annualized) of the Fund’s average daily net assets.
In addition, under the management and administration agreements, certain other services and costs, including accounting, regulatory reporting and insurance premiums, are paid by the Fund as administrative reimbursements. Included in “Due to affiliates” reflected on the Statement of Assets and Liabilities is $130,253 in management fees, administrative costs and certain other reimbursements payable to the Adviser at October 31, 2020.
3. Transfer Agent
DST Asset Manager Solutions, Inc. serves as the transfer agent to the Fund at negotiated rates. Transfer agent fees and payables shown on the Statement of Operations and the Statement of Assets and Liabilities, respectively, include sub-transfer agent expenses incurred through the Fund’s omnibus relationship contracts.
In addition, the Fund reimbursed the transfer agent for out-of-pocket expenses incurred by the transfer agent related to shareowner communications activities such as proxy and statement mailings, and outgoing phone calls. For the year ended October 31, 2020, such out-of-pocket expenses by class of shares were as follows:
| Shareowner Communications | |
Class A | $144,066 |
Class C | 14,434 |
Class K | 2,696 |
Class R | 2,988 |
Class Y | 41,010 |
| Total | $205,194 |
4. Distribution and Service Plans
The Fund has adopted a distribution plan (the “Plan”) pursuant to Rule 12b-1 of the Investment Company Act of 1940 with respect to its Class A, Class C and Class R shares. Pursuant to the Plan, the Fund pays the Distributor 0.25% of the average daily net assets attributable to Class A
40 Pioneer Equity Income Fund | Annual Report | 10/31/20
shares as compensation for personal services and/or account maintenance services or distribution services with regard to Class A shares. Pursuant to the Plan, the Fund also pays the Distributor 1.00% of the average daily net assets attributable to Class C shares. The fee for Class C shares consists of a 0.25% service fee and a 0.75% distribution fee paid as compensation for personal services and/or account maintenance services or distribution services with regard to Class C shares. Pursuant to the Plan, the Fund further pays the Distributor 0.50% of the average daily net assets attributable to Class R shares for distribution services. Included in “Due to affiliates” reflected on the Statement of Assets and Liabilities is $30,804 in distribution fees payable to the Distributor at October 31, 2020.
The Fund also has adopted a separate service plan for Class R shares (the “Service Plan”). The Service Plan authorizes the Fund to pay securities dealers, plan administrators or other service organizations that agree to provide certain services to retirement plans or plan participants holding shares of the Fund a service fee of up to 0.25% of the Fund’s average daily net assets attributable to Class R shares held by such plans.
In addition, redemptions of Class A and Class C shares may be subject to a contingent deferred sales charge (“CDSC”). A CDSC of 1.00% may be imposed on redemptions of certain net asset value purchases of Class A shares within 12 months of purchase. Redemptions of Class C shares within 12 months of purchase are subject to a CDSC of 1.00%, based on the lower of cost or market value of shares being redeemed. Shares purchased as part of an exchange remain subject to any CDSC that applied to the original purchase of those shares. There is no CDSC for Class K, Class R or Class Y shares. Proceeds from the CDSCs are paid to the Distributor. For the year ended October 31, 2020, CDSCs in the amount of $8,601 were paid to the Distributor.
5. Line of Credit Facility
The Fund, along with certain other funds in the Pioneer Family of Funds (the “Funds”), participates in a committed, unsecured revolving line of credit facility. Borrowings are used solely for temporary or emergency purposes. The Fund may borrow up to the lesser of the amount available under the facility or the limits set for borrowing by the Fund’s prospectus and the 1940 Act. Effective March 11, 2020, the Fund participates in a facility in the amount of $300 million. Prior to March 11, 2020, the Fund participated in a facility in the amount of $250 million. Under such facility, depending on the type of loan, interest on borrowings is payable at the London Interbank Offered Rate “LIBOR”) plus a credit spread. The Fund also pays an annual commitment fee in the amount of 0.30% of the daily
Pioneer Equity Income Fund | Annual Report | 10/31/20 41
unused portion of each lender’s commitment to participate in the credit facility. The commitment fee is allocated among participating Funds based on an allocation schedule set forth in the credit agreement.
For the year ended October 31, 2020, the average daily amount of borrowings outstanding during the year were as follows:
| Weighted | | |
| Average | | |
| daily | | Total |
| Average Daily | annualized | Number | interest on |
| amount of | interest for | of days | expense |
| borrowings | the period | outstanding | borrowings* |
$8,325,000 | 1.98% | 4 | $1,832 |
* Interest expense is recorded on the Statement of Operations.
6. Affiliated Issuer
An affiliated issuer is a company in which the fund has a direct or indirect ownership of, control of, or voting power of 5 percent or more of the outstanding voting shares. At October 31, 2020, the value of the Fund’s investment in affiliated issuers was $0, which represents 0% of the Fund’s net assets. Transactions in affiliated issuers by the Fund for the year ended were as follows:
| | | Change | | | | |
| | | | in Net
| | | | |
| | | Unrealized | Net | | | |
| | | Appreciation/ | Realized | | | |
| | | (Depreciation)
| Gain/(Loss)
| Dividends | | |
| Name | | | from | From | from | Shares | |
| of the | Value at | | Investments | Investments | Investments | held at | Value at |
| Affiliated | October 31, | Purchase | in Affiliated | in Affiliated | in Affiliated | October 31, | October 31, |
| Issuer | 2019 | Costs | Issuers | Issuers | Issuers | 2020 | 2020 |
Gorman | | | | | | | |
| Rupp Co. (*) | $50,362,629 | $6,956,764 | $(12,383,946) | $826,941 | $585,645 | 1,223,146 | $37,978,683 |
(*) This security is not an affiliated issuer as of October 31, 2020
7. Subsequent Event
On November 19, 2020, Amundi Pioneer Asset Management announced it will be rebranding the US business of Amundi as Amundi US effective January 1, 2021. The new brand identity will replace Amundi Pioneer, which was first adopted in July 2017 following the acquisition of Pioneer Investments by Amundi. In connection with these changes, Amundi Pioneer Asset Management. Inc., the investment adviser to the Pioneer funds, will change its name to Amundi Asset Management US, Inc. In addition, Amundi Pioneer Distributor, Inc., the Pioneer funds’ distributor, will change its name to Amundi Distributor US, Inc. The names of the Pioneer funds will not change in connection with this rebranding.
42 Pioneer Equity Income Fund | Annual Report | 10/31/20
Report of Independent
Registered Public Accounting Firm
To the Board of Trustees and the Shareholders of Pioneer Equity Income Fund:
Opinion on the Financial Statements
We have audited the accompanying statement of assets and liabilities of Pioneer Equity Income Fund (the “Fund”), including the schedule of investments, as of October 31, 2020, and the related statement of operations for the year then ended, the statements of changes in net assets for each of the two years in the period then ended, the financial highlights for each of the four years in the period then ended and the related notes (collectively referred to as the “financial statements”). The financial highlights for the period ended October 31, 2016 were audited by another independent registered public accounting firm whose report, dated December 23, 2016, expressed an unqualified opinion on those financial highlights. In our opinion, the financial statements present fairly, in all material respects, the financial position of the Fund at October 31, 2020, the results of its operations for the year then ended, the changes in its net assets for each of the two years in the period then ended, and its financial highlights for each of the four years in the period then ended, in conformity with U.S. generally accepted accounting principles.
Basis for Opinion
These financial statements are the responsibility of the Fund’s management. Our responsibility is to express an opinion on the Fund’s financial statements based on our audits. We are a public accounting firm registered with the Public Company Accounting Oversight Board (United States) (“PCAOB”) and are required to be independent with respect to the Fund in accordance with the U.S. federal securities laws and the applicable rules and regulations of the Securities and Exchange Commission and the PCAOB.
We conducted our audits in accordance with the standards of the PCAOB. Those standards require that we plan and perform the audit to obtain reasonable assurance about whether the financial statements are free of material misstatement, whether due to error or fraud. The Fund is not required to have, nor were we engaged to perform, an audit of the Fund’s internal control over financial reporting. As part of our audits, we are required to obtain an understanding of internal control over financial reporting, but not for the purpose of expressing an opinion on the effectiveness of the Fund’s internal control over financial reporting. Accordingly, we express no such opinion.
Pioneer Equity Income Fund | Annual Report | 10/31/20 43
Our audits included performing procedures to assess the risks of material misstatement of the financial statements, whether due to error or fraud, and performing procedures that respond to those risks. Such procedures included examining, on a test basis, evidence regarding the amounts and disclosures in the financial statements. Our procedures included confirmation of securities owned as of October 31, 2020, by correspondence with the custodian and brokers or by other appropriate auditing procedures where replies from brokers were not received. Our audits also included evaluating the accounting principles used and significant estimates made by management, as well as evaluating the overall presentation of the financial statements. We believe that our audits provide a reasonable basis for our opinion.
We have served as the auditor of one or more Amundi Pioneer investment companies since 2017.
Boston, Massachusetts
December 18, 2020
44 Pioneer Equity Income Fund | Annual Report | 10/31/20
Additional Information (unaudited)
For the year ended October 31, 2020, certain dividends paid by the Fund may be subject to a maximum tax rate of 20%, as provided for by the Jobs and Growth Tax Relief Reconciliation Act (the Act) of 2003. The Fund intends to designate up to the maximum amount of such dividends allowable under the Act, as taxed at a maximum rate of 20%. Complete information will be computed and reported in conjunction with your 2020 form 1099-DIV.
The qualifying percentage of the Fund’s ordinary income dividends for the purpose of the corporate dividends received deduction was 100.0%.
Pioneer Equity Income Fund | Annual Report | 10/31/20 45
Approval of Investment
Management Agreement
Amundi Pioneer Asset Management, Inc. (“APAM”) serves as the investment adviser to Pioneer Equity Income Fund (the “Fund”) pursuant to an investment management agreement between APAM and the Fund. In order for APAM to remain the investment adviser of the Fund, the Trustees of the Fund must determine annually whether to renew the investment management agreement for the Fund.
The contract review process began in January 2020 as the Trustees of the Fund agreed on, among other things, an overall approach and timeline for the process. Contract review materials were provided to the Trustees in March 2020, July 2020 and September 2020. In addition, the Trustees reviewed and discussed the Fund’s performance at regularly scheduled meetings throughout the year, and took into account other information related to the Fund provided to the Trustees at regularly scheduled meetings, in connection with the review of the Fund’s investment management agreement.
In March 2020, the Trustees, among other things, discussed the memorandum provided by Fund counsel that summarized the legal standards and other considerations that are relevant to the Trustees in their deliberations regarding the renewal of the investment management agreement, and reviewed and discussed the qualifications of the investment management teams for the Fund, as well as the level of investment by the Fund’s portfolio managers in the Fund. In July 2020, the Trustees, among other things, reviewed the Fund’s management fees and total expense ratios, the financial statements of APAM and its parent companies, profitability analyses provided by APAM, and analyses from APAM as to possible economies of scale. The Trustees also reviewed the profitability of the institutional business of APAM and APAM’s affiliate, Amundi Pioneer Institutional Asset Management, Inc. (“APIAM” and, together with APAM, “Amundi Pioneer”), as compared to that of APAM’s fund management business, and considered the differences between the fees and expenses of the Fund and the fees and expenses of APAM’s and APIAM’s institutional accounts, as well as the different services provided by APAM to the Fund and by APAM and APIAM to the institutional accounts. The Trustees further considered contract review materials, including additional materials received in response to the Trustees’ request, in September 2020.
At a meeting held on September 15, 2020, based on their evaluation of the information provided by APAM and third parties, the Trustees of the Fund, including the Independent Trustees voting separately, unanimously
46 Pioneer Equity Income Fund | Annual Report | 10/31/20
approved the renewal of the investment management agreement for another year. In approving the renewal of the investment management agreement, the Trustees considered various factors that they determined were relevant, including the factors described below. The Trustees did not identify any single factor as the controlling factor in determining to approve the renewal of the agreement.
Nature, Extent and Quality of Services
The Trustees considered the nature, extent and quality of the services that had been provided by APAM to the Fund, taking into account the investment objective and strategy of the Fund. The Trustees also reviewed APAM’s investment approach for the Fund and its research process. The Trustees considered the resources of APAM and the personnel of APAM who provide investment management services to the Fund. They also reviewed the amount of non-Fund assets managed by the portfolio managers of the Fund. They considered the non-investment resources and personnel of APAM that are involved in APAM’s services to the Fund, including APAM’s compliance, risk management, and legal resources and personnel. The Trustees noted the substantial attention and high priority given by APAM’s senior management to the Pioneer Fund complex. The Trustees considered the implementation and effectiveness of APAM’s business continuity plan in response to the COVID-19 pandemic.
The Trustees considered that APAM supervises and monitors the performance of the Fund’s service providers and provides the Fund with personnel (including Fund officers) and other resources that are necessary for the Fund’s business management and operations. The Trustees also considered that, as administrator, APAM is responsible for the administration of the Fund’s business and other affairs. The Trustees considered the fees paid to APAM for the provision of administration services.
Based on these considerations, the Trustees concluded that the nature, extent and quality of services that had been provided by APAM to the Fund were satisfactory and consistent with the terms of the investment management agreement.
Performance of the Fund
In considering the Fund’s performance, the Trustees regularly review and discuss throughout the year data prepared by APAM and information comparing the Fund’s performance with the performance of its peer group of funds, as classified by Morningstar, Inc. (Morningstar), and with the performance of the Fund’s benchmark index. They also discuss the Fund’s performance with APAM on a regular basis. The Trustees’ regular reviews and discussions were factored into the Trustees’ deliberations concerning the renewal of the investment management agreement.
Pioneer Equity Income Fund | Annual Report | 10/31/20 47
Management Fee and Expenses
The Trustees considered information showing the fees and expenses of the Fund in comparison to the management fees of its peer group of funds as classified by Morningstar and also to the expense ratios of a peer group of funds selected on the basis of criteria determined by the Independent Trustees for this purpose using data provided by Strategic Insight Mutual Fund Research and Consulting, LLC (Strategic Insight), an independent third party. The peer group comparisons referred to below are organized in quintiles. Each quintile represents one-fifth of the peer group. In all peer group comparisons referred to below, first quintile is most favorable to the Fund’s shareowners. The Trustees noted that they separately review and consider the impact of the Fund’s transfer agency and Fund- and APAM-paid expenses for sub-transfer agency and intermediary arrangements, and that the results of the most recent such review were considered in the consideration of the Fund’s expense ratio.
The Trustees considered that the Fund’s management fee for the most recent fiscal year was in the third quintile relative to the management fees paid by other funds in its Morningstar category for the comparable period. The Trustees considered that the expense ratio of the Fund’s Class A shares for the most recent fiscal year was in the second quintile relative to its Strategic Insight peer group for the comparable period. The Trustees considered that the expense ratio of the Fund’s Class Y shares for the most recent fiscal year was in the third quintile relative to its Strategic Insight peer group for the comparable period.
The Trustees reviewed management fees charged by APAM and APIAM to institutional and other clients, including publicly offered European funds sponsored by APAM’s affiliates, unaffiliated U.S. registered investment companies (in a sub-advisory capacity), and unaffiliated foreign and domestic separate accounts. The Trustees also considered APAM’s costs in providing services to the Fund and APAM’s and APIAM’s costs in providing services to the other clients and considered the differences in management fees and profit margins for fund and non-fund services. In evaluating the fees associated with APAM’s and APIAM’s client accounts, the Trustees took into account the respective demands, resources and complexity associated with the Fund and other client accounts. The Trustees noted that, in some instances, the fee rates for those clients were lower than the management fee for the Fund and considered that, under the investment management agreement with the Fund, APAM performs additional services for the Fund that it does not provide to those other clients or services that are broader in scope, including oversight of the Fund’s other service providers and activities related to compliance and the extensive regulatory and tax regimes to which the Fund is subject. The Trustees also considered the entrepreneurial risks associated with APAM’s management of the Fund.
48 Pioneer Equity Income Fund | Annual Report | 10/31/20
The Trustees concluded that the management fee payable by the Fund to APAM was reasonable in relation to the nature and quality of the services provided by APAM.
Profitability
The Trustees considered information provided by APAM regarding the profitability of APAM with respect to the advisory services provided by APAM to the Fund, including the methodology used by APAM in allocating certain of its costs to the management of the Fund. The Trustees also considered APAM’s profit margin in connection with the overall operation of the Fund. They further reviewed the financial results, including the profit margins, realized by APAM and APIAM from non-fund businesses. The Trustees considered APAM’s profit margins in comparison to the limited industry data available and noted that the profitability of any adviser was affected by numerous factors, including its organizational structure and method for allocating expenses. The Trustees concluded that APAM’s profitability with respect to the management of the Fund was not unreasonable.
Economies of Scale
The Trustees considered APAM’s views relating to economies of scale in connection with the Pioneer Funds as fund assets grow and the extent to which any such economies of scale are shared with the Fund and Fund shareholders. The Trustees recognize that economies of scale are difficult to identify and quantify, and that, among other factors that may be relevant, are the following: fee levels, expense subsidization, investment by APAM in research and analytical capabilities and APAM’s commitment and resource allocation to the Fund. The Trustees noted that profitability also may be an indicator of the availability of any economies of scale, although profitability may vary for other reasons including due to reductions in expenses. The Trustees concluded that economies of scale, if any, were being appropriately shared with the Fund.
Other Benefits
The Trustees considered the other benefits that APAM enjoys from its relationship with the Fund. The Trustees considered the character and amount of fees paid or to be paid by the Fund, other than under the investment management agreement, for services provided by APAM and its affiliates. The Trustees further considered the revenues and profitability of APAM’s businesses other than the Fund business. To the extent applicable, the Trustees also considered the benefits to the Fund and to APAM and its affiliates from the use of “soft” commission dollars generated by the Fund to pay for research and brokerage services.
Pioneer Equity Income Fund | Annual Report | 10/31/20 49
The Trustees considered that Amundi Pioneer is the principal U.S. asset management business of Amundi, which is one of the largest asset managers globally. Amundi’s worldwide asset management business manages over $1.7 trillion in assets (including the Pioneer Funds). The Trustees considered that APAM’s relationship with Amundi creates potential opportunities for APAM, APIAM and Amundi that derive from APAM’s relationships with the Fund, including Amundi’s ability to market the services of APAM globally. The Trustees noted that APAM has access to additional research and portfolio management capabilities as a result of its relationship with Amundi and Amundi’s enhanced global presence that may contribute to an increase in the resources available to APAM. The Trustees considered that APAM and the Fund receive reciprocal intangible benefits from the relationship, including mutual brand recognition and, for the Fund, direct and indirect access to the resources of a large global asset manager. The Trustees concluded that any such benefits received by APAM as a result of its relationship with the Fund were reasonable.
Conclusion
After consideration of the factors described above as well as other factors, the Trustees, including the Independent Trustees, concluded that the investment management agreement for the Fund, including the fees payable thereunder, was fair and reasonable and voted to approve the proposed renewal of the investment management agreement.
50 Pioneer Equity Income Fund | Annual Report | 10/31/20
Statement Regarding
Liquidity Risk Management Program
As required by law, the Fund has adopted and implemented a liquidity risk management program (the “Program”) that is designed to assess and manage liquidity risk. Liquidity risk is the risk that the Fund could not meet requests to redeem its shares without significant dilution of remaining investors’ interests in the Fund. The Fund’s Board of Trustees designated a liquidity risk management committee (the “Committee”) consisting of employees of Amundi Pioneer Asset Management, Inc. (the “Adviser”) to administer the Program.
The Committee provided the Board of Trustees with a report that addressed the operation of the Program and assessed its adequacy and effectiveness of implementation (the “Report”). The Report covered the period from December 1, 2018 through March 31, 2020 (the “Reporting Period”).
The Report confirmed that, throughout the Reporting Period, the Committee had monitored the Fund’s portfolio liquidity and liquidity risk on an ongoing basis, as described in the Program and in Board reporting throughout the Reporting Period.
The Report discussed the Committee’s annual review of the Program, which addressed, among other things, the following elements of the Program:
The Committee reviewed the Fund’s investment strategy and liquidity of portfolio investments during both normal and reasonably foreseeable stressed conditions. The Committee noted that the Fund’s investment strategy continues to be appropriate for an open-end fund, taking into account, among other things, whether and to what extent the Fund held less liquid and illiquid assets and the extent to which any such investments affected the Fund’s ability to meet redemption requests. In managing and reviewing the Fund’s liquidity risk, the Committee also considered the extent to which the Fund’s investment strategy involves a relatively concentrated portfolio or large positions in particular issuers, the extent to which the Fund uses borrowing for investment purposes, and the extent to which the Fund uses derivatives (including for hedging purposes). The Committee also reviewed the Fund’s short-term and long-term cash flow projections during both normal and reasonably foreseeable stressed conditions. In assessing the Fund’s cash flow projections, the Committee considered, among other factors, historical net redemption activity, redemption policies, ownership concentration, distribution channels, and the degree of certainty associated with the Fund’s short-term and long-term cash flow projections. The Committee also considered the Fund’s
Pioneer Equity Income Fund | Annual Report | 10/31/20 51
holdings of cash and cash equivalents, as well as borrowing arrangements and other funding sources, including, if applicable, the Fund’s participation in a credit facility, as components of the Fund’s ability to meet redemption requests. The Fund has adopted an in-kind redemption policy which may be utilized to meet larger redemption requests.
The Committee reviewed the Program’s liquidity classification methodology for categorizing the Fund’s investments into one of four liquidity buckets. In reviewing the Fund’s investments, the Committee considered, among other factors, whether trading varying portions of a position in a particular portfolio investment or asset class in sizes the Fund would reasonably anticipate trading, would be reasonably expected to significantly affect liquidity.
The Committee performed an analysis to determine whether the Fund is required to maintain a Highly Liquid Investment Minimum, and determined that no such minimum is required because the Fund primarily holds highly liquid investments.
The Report stated that the Committee concluded the Program operates adequately and effectively, in all material respects, to assess and manage the Fund’s liquidity risk throughout the Reporting Period.
52 Pioneer Equity Income Fund | Annual Report | 10/31/20
Trustees, Officers and Service Providers
Investment Adviser and Administrator
Amundi Pioneer Asset Management, Inc.
Custodian and Sub-Administrator
Brown Brothers Harriman & Co.
Independent Registered Public Accounting Firm
Ernst & Young LLP
Principal Underwriter
Amundi Pioneer Distributor, Inc.
Legal Counsel
Morgan, Lewis & Bockius LLP
Transfer Agent
DST Asset Manager Solutions, Inc.
Proxy Voting Policies and Procedures of the Fund are available without charge, upon request, by calling our toll free number (1-800-225-6292). Information regarding how the Fund voted proxies relating to portfolio securities during the most recent 12-month period ended June 30 is publicly available to shareowners at www.amundipioneer.com/us. This information is also available on the Securities and Exchange Commission’s web site at www.sec.gov.
Trustees and Officers
The Fund’s Trustees and officers are listed below, together with their principal occupations and other directorships they have held during at least the past five years. Trustees who are interested persons of the Fund within the meaning of the 1940 Act are referred to as Interested Trustees. Trustees who are not interested persons of the Fund are referred to as Independent Trustees. Each of the Trustees serves as a Trustee of each of the 45 U.S. registered investment portfolios for which Amundi serves as investment adviser (the “Pioneer Funds”). The address for all Trustees and all officers of the Fund is 60 State Street, Boston, Massachusetts 02109.
The Statement of Additional Information of the Fund includes additional information about the Trustees and is available, without charge, upon request, by calling 1-800-225-6292.
Pioneer Equity Income Fund | Annual Report | 10/31/20 53
| | | | |
| Independent Trustees | | |
|
| Name, Age and Position | Term of Office and | | Other Directorships |
| Held With the Fund | Length of Service | Principal Occupation | Held by Trustee |
| Thomas J. Perna (70) | Trustee since 2006. | Private investor (2004 – 2008 and 2013 – present); Chairman (2008 – 2013) | Director, Broadridge Financial |
Chairman of the Board | Serves until a successor | and Chief Executive Officer (2008 – 2012), Quadriserv, Inc. (technology | Solutions, Inc. (investor |
and Trustee | trustee is elected or | products for securities lending industry); and Senior Executive Vice | communications and securities |
| earlier retirement | President, The Bank of New York (financial and securities services) | processing provider for financial |
| or removal. | (1986 – 2004) | services industry) (2009 – present); |
| | | Director, Quadriserv, Inc. (2005 – |
| | | 2013); and Commissioner, New |
| | | Jersey State Civil Service |
| | | Commission (2011 – 2015) |
| John E. | Trustee since 2019. | Of Counsel (2019 – present), Partner (1983-2018), Sullivan & | Chairman, The Lakeville Journal |
| Baumgardner, Jr. (69) | Serves until a successor | Cromwell LLP (law firm). | Company, LLC, (privately-held |
Trustee | trustee is elected or | | community newspaper group) |
| earlier retirement | | (2015-present) |
| or removal. | | |
| Diane Durnin (63) | Trustee since 2019. | Managing Director - Head of Product Strategy and Development, BNY | None |
Trustee | Serves until a successor | Mellon Investment Management (investment management firm) (2012-2018); | |
| trustee is elected or | Vice Chairman – The Dreyfus Corporation (2005 – 2018): Executive Vice | |
| earlier retirement | President Head of Product, BNY Mellon Investment Management | |
| or removal. | (2007-2012); Executive Director- Product Strategy, Mellon Asset Management | |
| | (2005-2007); Executive Vice President Head of Products, Marketing and | |
| | Client Service, Dreyfus Corporation (investment management firm) | |
| | (2000-2005); and Senior Vice President Strategic Product and Business | |
| | Development, Dreyfus Corporation (1994-2000) | |
54 Pioneer Equity Income Fund | Annual Report | 10/31/20
| | | | |
| Name, Age and Position | Term of Office and | | Other Directorships |
| Held With the Fund | Length of Service | Principal Occupation | Held by Trustee |
| Benjamin M. Friedman (76) | Trustee since 2008. | William Joseph Maier Professor of Political Economy, Harvard University | Trustee, Mellon Institutional Funds |
Trustee | Serves until a successor | (1972 – present) | Investment Trust and Mellon |
| trustee is elected or | | Institutional Funds Master Portfolio |
| earlier retirement | | (oversaw 17 portfolios in fund |
| or removal. | | complex) (1989 - 2008) |
| Lorraine H. Monchak (64) | Trustee since 2017. | Chief Investment Officer, 1199 SEIU Funds (healthcare workers union | None |
Trustee | (Advisory Trustee from | pension funds) (2001 – present); Vice President – International Investments | |
| 2014 - 2017). Serves | Group, American International Group, Inc. (insurance company) | |
| until a successor trustee | (1993 – 2001); Vice President – Corporate Finance and Treasury Group, | |
| is elected or earlier | Citibank, N.A. (1980 – 1986 and 1990 – 1993); Vice President – Asset/Liability | |
| retirement or removal. | Management Group, Federal Farm Funding Corporation | |
| | (government-sponsored issuer of debt securities) (1988 – 1990); Mortgage | |
| | Strategies Group, Shearson Lehman Hutton, Inc. (investment bank) | |
| | (1987 – 1988); and Mortgage Strategies Group, Drexel Burnham Lambert, | |
| | Ltd. (investment bank) (1986 – 1987) | |
| Marguerite A. Piret (72) | Trustee since 1990. | Chief Financial Officer, American Ag Energy, Inc. (controlled environment | Director of New America High |
Trustee | Serves until a successor | and agriculture company) (2016 – present); and President and Chief | Income Fund, Inc. (closed-end |
| trustee is elected or | Executive Officer, Metric Financial Inc. (formerly known as Newbury Piret | investment company) |
| earlier retirement | Company) (investment banking firm) (1981 – 2019) | (2004 – present); and Member, |
| or removal. | | Board of Governors, Investment |
| | | Company Institute (2000 – 2006) |
Pioneer Equity Income Fund | Annual Report | 10/31/20 55
| | | | |
Independent Trustees (continued) | |
|
| Name, Age and Position | Term of Office and | | Other Directorships |
| Held With the Fund | Length of Service | Principal Occupation | Held by Trustee |
| Fred J. Ricciardi (73) | Trustee since 2014. | Private investor (2020 – present); Consultant (investment company services) | None |
Trustee | Serves until a successor | (2012 – 2020); Executive Vice President, BNY Mellon (financial and | |
| trustee is elected or | investment company services) (1969 – 2012); Director, BNY International | |
| earlier retirement | Financing Corp. (financial services) (2002 – 2012); Director, Mellon | |
| or removal. | Overseas Investment Corp. (financial services) (2009 – 2012); Director, | |
| | Financial Models (technology) (2005-2007); Director, BNY Hamilton Funds, | |
| | Ireland (offshore investment companies) (2004-2007); Chairman/Director, | |
| | AIB/BNY Securities Services, Ltd., Ireland (financial services) (1999-2006); | |
| | and Chairman, BNY Alternative Investment Services, Inc. (financial services) | |
| | (2005-2007) | |
56 Pioneer Equity Income Fund | Annual Report | 10/31/20
| | | | |
| Interested Trustees | | |
|
| Name, Age and Position | Term of Office and | | Other Directorships |
| Held With the Fund | Length of Service | Principal Occupation | Held by Trustee |
| Lisa M. Jones (58)* | Trustee since 2017. | Director, CEO and President of Amundi Pioneer Asset Management USA, | None |
Trustee, President and | Serves until a successor | Inc. (investment management firm) (since September 2014); Director, CEO | |
Chief Executive Officer | trustee is elected or | and President of Amundi Pioneer Asset Management, Inc. (since | |
| earlier retirement | September 2014); Director, CEO and President of Amundi Pioneer | |
| or removal | Distributor, Inc. (since September 2014); Director, CEO and President of | |
| | Amundi Pioneer Institutional Asset Management, Inc. (since September 2014); | |
| | Chair, Amundi Pioneer Asset Management USA, Inc., Amundi Pioneer | |
| | Distributor, Inc. and Amundi Pioneer Institutional Asset Management, Inc. | |
| | (September 2014 – 2018); Managing Director, Morgan Stanley Investment | |
| | Management (investment management firm) (2010 – 2013); Director of | |
| | Institutional Business, CEO of International, Eaton Vance Management | |
| | (investment management firm) (2005 – 2010); and Director of | |
| | Amundi USA, Inc. (since 2017) | |
| Kenneth J. Taubes (62)* | Trustee since 2014. | Director and Executive Vice President (since 2008) and Chief Investment | None |
Trustee | Serves until a successor | Officer, U.S. (since 2010) of Amundi Asset Management USA, Inc. | |
| trustee is elected or | (investment management firm); Director and Executive Vice President and | |
| earlier retirement | Chief Investment Officer, U.S. of Amundi (since 2008); Executive | |
| or removal | Vice President and Chief Investment Officer, U.S. of Amundi Pioneer | |
| | Institutional Asset Management, Inc. (since 2009); Portfolio Manager of | |
| | Amundi (since 1999); and Director of Amundi USA, Inc. (since 2017) | |
| * Ms. Jones and Mr. Taubes are Interested Trustees because they are officers or directors of the Fund’s investment adviser and certain of its affiliates. |
Pioneer Equity Income Fund | Annual Report | 10/31/20 57
| | | | |
Fund Officers
| | |
|
| Name, Age and Position | Term of Office and | | Other Directorships |
| Held With the Fund | Length of Service | Principal Occupation | Held by Officer
|
| Christopher J. Kelley (55) | Since 2003. Serves at | Vice President and Associate General Counsel of Amundi since January | None |
Secretary and Chief | the discretion of | 2008; Secretary and Chief Legal Officer of all of the Pioneer Funds | |
Legal Officer | the Board | since June 2010; Assistant Secretary of all of the Pioneer Funds from | |
| | September 2003 to May 2010; and Vice President and Senior Counsel of | |
| | Amundi from July 2002 to December 2007 | |
| Carol B. Hannigan (59) | Since 2010. Serves at | Fund Governance Director of Amundi since December 2006 and | None |
Assistant Secretary | the discretion of | Assistant Secretary of all the Pioneer Funds since June 2010; | |
| the Board | Manager – Fund Governance of Amundi from December 2003 to | |
| | November 2006; and Senior Paralegal of Amundi from | |
| | January 2000 to November 2003 | |
| Thomas Reyes (57) | Since 2010. Serves at | Assistant General Counsel of Amundi since May 2013 and Assistant | None |
Assistant Secretary | the discretion of | Secretary of all the Pioneer Funds since June 2010; and Counsel of | |
| the Board | Amundi from June 2007 to May 2013 | |
| Mark E. Bradley (60) | Since 2008. Serves at | Vice President – Fund Treasury of Amundi; Treasurer of all of the | None |
Treasurer and | the discretion of | Pioneer Funds since March 2008; Deputy Treasurer of Amundi from | |
Chief Financial and | the Board | March 2004 to February 2008; and Assistant Treasurer of all of the | |
Accounting Officer | | Pioneer Funds from March 2004 to February 2008 | |
| Luis I. Presutti (55) | Since 2000. Serves at | Director – Fund Treasury of Amundi; and Assistant Treasurer of | None |
Assistant Treasurer | the discretion of | all of the Pioneer Funds | |
| the Board | | |
| Gary Sullivan (62) | Since 2002. Serves at | Senior Manager – Fund Treasury of Amundi; and Assistant Treasurer | None |
Assistant Treasurer | the discretion of | of all of the Pioneer Funds | |
| the Board | | |
58 Pioneer Equity Income Fund | Annual Report | 10/31/20
| | | | |
| Name, Age and Position | Term of Office and | | Other Directorships |
| Held With the Fund | Length of Service | Principal Occupation | Held by Officer
|
| Antonio Furtado (38) | Since 2020. Serves at | Fund Oversight Manager – Fund Treasury of Amundi; and Assistant | None |
Assistant Treasurer | the discretion of | Treasurer of all of the Pioneer Funds | |
| the Board | | |
| John Malone (48) | Since 2018. Serves at | Managing Director, Chief Compliance Officer of Amundi Pioneer Asset | None |
Chief Compliance Officer | the discretion of | Management; Amundi Pioneer Institutional Asset Management, Inc.; and | |
| the Board | the Pioneer Funds since September 2018; and Chief Compliance Officer of | |
| | Amundi Pioneer Distributor, Inc. since January 2014. | |
| Kelly O’Donnell (49) | Since 2006. Serves at | Vice President – Amundi Asset Management; and Anti-Money | None |
Anti-Money | the discretion of | Laundering Officer of all the Pioneer Funds since 2006 | |
Laundering Officer | the Board | | |
Pioneer Equity Income Fund | Annual Report | 10/31/20 59
This page was intentionally left blank.
60 Pioneer Equity Income Fund | Annual Report | 10/31/20
How to Contact Amundi
We are pleased to offer a variety of convenient ways for you to contact us for assistance or information.
| | | |
| Call us for: | | |
Account Information, including existing accounts, | |
new accounts, prospectuses, applications | |
and service forms | | 1-800-225-6292 |
| | |
FactFoneSM for automated fund yields, prices, | |
account information and transactions | 1-800-225-4321 |
| | | |
| Retirement plans information | | 1-800-622-0176 |
|
| Write to us: | | |
Amundi | | |
P.O. Box 219427 | | |
Kansas City, MO 64121-9427 | | |
| | | |
| Our toll-free fax | | 1-800-225-4240 |
| | |
| Our internet e-mail address | us.askamundipioneer@amundipioneer.com |
(for general questions about Amundi only) | |
|
| Visit our web site: www.amundipioneer.com/us | |
This report must be preceded or accompanied by a prospectus.
The Fund files a complete schedule of portfolio holdings with the Securities and Exchange Commission for the first and third quarters of each fiscal year as an exhibit to its reports on Form N-PORT. Shareholders may view the filed Form N-PORT by visiting the Commission’s web site at https://www.sec.gov.

Amundi Pioneer Asset Management, Inc.
60 State Street
Boston, MA 02109
www. amundipioneer. com/us
Securities offered through Amundi Pioneer Distributor, Inc.
60 State Street, Boston, MA 02109
Underwriter of Pioneer Mutual Funds, Member SIPC
© 2020 Amundi Pioneer Asset Management 19439-14-1220
ITEM 2. CODE OF ETHICS.
(a) Disclose whether, as of the end of the period covered by the report, the registrant has adopted a code of ethics that applies to the registrant’s principal executive officer, principal financial officer, principal accounting officer or controller, or persons performing similar functions, regardless of whether these individuals are employed by the registrant or a third party. If the registrant has not adopted such a code of ethics, explain why it has not done so.
The registrant has adopted, as of the end of the period covered by this report, a code of ethics that applies to the registrant’s principal executive officer, principal financial officer, principal accounting officer and controller.
(b) For purposes of this Item, the term “code of ethics” means written standards that are reasonably designed to deter wrongdoing and to promote:
(1) Honest and ethical conduct, including the ethical handling of actual or apparent conflicts of interest between personal and professional relationships;
(2) Full, fair, accurate, timely, and understandable disclosure in reports and documents that a registrant files with, or submits to, the Commission and in other public communications made by the registrant;
(3) Compliance with applicable governmental laws, rules, and regulations;
(4) The prompt internal reporting of violations of the code to an appropriate person or persons identified in the code; and
(5) Accountability for adherence to the code.
(c) The registrant must briefly describe the nature of any amendment, during the period covered by the report, to a provision of its code of ethics that applies to the registrant’s principal executive officer, principal financial officer, principal accounting officer or controller, or persons performing similar functions, regardless of whether these individuals are employed by the registrant or a third party, and that relates to any element of the code of ethics definition enumerated in paragraph (b) of this Item. The registrant must file a copy of any such amendment as an exhibit pursuant to Item 10(a), unless the registrant has elected to satisfy paragraph (f) of this Item by posting its code of ethics on its website pursuant to paragraph (f)(2) of this Item, or by undertaking to provide its code of ethics to any person without charge, upon request, pursuant to paragraph (f)(3) of this Item.
The registrant has made no amendments to the code of ethics during the period covered by this report.
(d) If the registrant has, during the period covered by the report, granted a waiver, including an implicit waiver, from a provision of the code of ethics to the registrant’s principal executive officer, principal financial officer, principal accounting officer or controller, or persons performing similar functions, regardless of whether these individuals are employed by the registrant or a third party, that relates to one or more of the items set forth in paragraph (b) of this Item, the registrant must briefly describe the nature of the waiver, the name of the person to whom the waiver was granted, and the date of the waiver.
Not applicable.
(e) If the registrant intends to satisfy the disclosure requirement under paragraph (c) or (d) of this Item regarding an amendment to, or a waiver from, a provision of its code of ethics that applies to the registrant’s principal executive officer, principal financial officer, principal accounting officer or controller, or persons performing similar functions and that relates to any element of the code of ethics definition
enumerated in paragraph (b) of this Item by posting such information on its Internet website, disclose the registrant’s Internet address and such intention.
Not applicable.
(f) The registrant must:
(1) File with the Commission, pursuant to Item 12(a)(1), a copy of its code of ethics that applies to the registrant’s principal executive officer, principal financial officer, principal accounting officer or controller, or persons performing similar functions, as an exhibit to its annual report on this Form N-CSR (see attachment);
(2) Post the text of such code of ethics on its Internet website and disclose, in its most recent report on this Form N-CSR, its Internet address and the fact that it has posted such code of ethics on its Internet website; or
(3) Undertake in its most recent report on this Form N-CSR to provide to any person without charge, upon request, a copy of such code of ethics and explain the manner in which such request may be made. See Item 10(2)
ITEM 3. AUDIT COMMITTEE FINANCIAL EXPERT.
(a) (1) Disclose that the registrant’s board of trustees has determined that the registrant either:
(i) Has at least one audit committee financial expert serving on its audit committee; or
(ii) Does not have an audit committee financial expert serving on its audit committee.
The registrant’s Board of Trustees has determined that the registrant has at least one audit committee financial expert.
(2) If the registrant provides the disclosure required by paragraph (a)(1)(i) of this Item, it must disclose the name of the audit committee financial expert and whether that person is “independent.” In order to be considered “independent” for purposes of this Item, a member of an audit committee may not, other than in his or her capacity as a member of the audit committee, the board of trustees, or any other board committee:
(i) Accept directly or indirectly any consulting, advisory, or other compensatory fee from the issuer; or
(ii) Be an “interested person” of the investment company as defined in Section 2(a)(19) of the Act (15 U.S.C. 80a-2(a)(19)).
Mr. Fred J. Ricciardi, an independent trustee, is such an audit committee financial expert.
(3) If the registrant provides the disclosure required by paragraph (a)(1) (ii) of this Item, it must explain why it does not have an audit committee financial expert.
Not applicable.
ITEM 4. PRINCIPAL ACCOUNTANT FEES AND SERVICES.
(a) Disclose, under the caption AUDIT FEES, the aggregate fees billed for each of the last two fiscal years for professional services rendered by the principal accountant for the audit of the registrant’s annual financial statements or services that are normally provided by the accountant in connection with statutory and regulatory filings or engagements for those fiscal years.
The audit fees for the Fund were $23,460 payable to Ernst & Young LLP for the year ended October 31, 2020 and $23,000 for the year ended October 31, 2019.
(b) Disclose, under the caption AUDIT-RELATED FEES, the aggregate fees billed in each of the last two fiscal years for assurance and related services by the principal accountant that are reasonably related to the performance of the audit of the registrant’s financial statements and are not reported under paragraph (a) of this Item. Registrants shall describe the nature of the services comprising the fees disclosed under this category.
There were no audit-related services in 2020 or 2019.
(c) Disclose, under the caption TAX FEES, the aggregate fees billed in each of the last two fiscal years for professional services rendered by the principal accountant for tax compliance, tax advice, and tax planning. Registrants shall describe the nature of the services comprising the fees disclosed under this category.
The Fund paid aggregate non-audit fees to Ernst & Young LLP for tax services of $8,189 and $8,028 during the fiscal years ended October 31, 2020 and 2019, respectively.
(d) Disclose, under the caption ALL OTHER FEES, the aggregate fees billed in each of the last two fiscal years for products and services provided by the principal accountant, other than the services reported in paragraphs (a) through (c) of this Item. Registrants shall describe the nature of the services comprising the fees disclosed under this category.
There were no other fees in 2020 or 2019.
(e) (1) Disclose the audit committee’s pre-approval policies and procedures described in paragraph (c)(7) of Rule 2-01 of Regulation S-X.
PIONEER FUNDS
APPROVAL OF AUDIT, AUDIT-RELATED, TAX AND OTHER SERVICES
PROVIDED BY THE INDEPENDENT AUDITOR
SECTION I - POLICY PURPOSE AND APPLICABILITY
The Pioneer Funds recognize the importance of maintaining the independence of their outside auditors. Maintaining independence is a shared responsibility involving Amundi Pioneer Asset Management, Inc, the audit committee and the independent auditors.
The Funds recognize that a Fund’s independent auditors: 1) possess knowledge of the Funds, 2) are able to incorporate certain services into the scope of the audit, thereby avoiding redundant work, cost and disruption of Fund personnel and processes, and 3) have expertise that has value to the Funds. As a result, there are situations where it is desirable to use the Fund’s independent auditors for services in addition to the annual audit and where the potential for conflicts of interests are minimal. Consequently, this policy, which is intended to comply with Rule 210.2-01(C)(7), sets forth guidelines and procedures to
be followed by the Funds when retaining the independent audit firm to perform audit, audit-related tax and other services under those circumstances, while also maintaining independence.
Approval of a service in accordance with this policy for a Fund shall also constitute approval for any other Fund whose pre-approval is required pursuant to Rule 210.2-01(c)(7)(ii).
In addition to the procedures set forth in this policy, any non-audit services that may be provided consistently with Rule 210.2-01 may be approved by the Audit Committee itself and any pre-approval that may be waived in accordance with Rule 210.2-01(c)(7)(i)(C) is hereby waived.
Selection of a Fund’s independent auditors and their compensation shall be determined by the Audit Committee and shall not be subject to this policy.
| | | |
| SECTION II - POLICY |
| |
| SERVICE CATEGORY | SERVICE CATEGORY DESCRIPTION | SPECIFIC PRE-APPROVED SERVICE SUBCATEGORIES |
| | | |
| I. AUDIT SERVICES | Services that are directly | o Accounting research assistance |
| | related to performing the | o SEC consultation, registration |
| | independent audit of the Funds | statements, and reporting |
| | | o Tax accrual related matters |
| | | o Implementation of new accounting standards |
| | | o Compliance letters (e.g. rating agency letters) |
| | | o Regulatory reviews and assistance |
| | | regarding financial matters |
| | | o Semi-annual reviews (if requested) |
| | | o Comfort letters for closed end offerings |
| II. AUDIT-RELATED | Services which are not | o AICPA attest and agreed-upon procedures |
| SERVICES | prohibited under Rule | o Technology control assessments |
| | 210.2-01(C)(4) (the “Rule”) | o Financial reporting control assessments |
| | and are related extensions of | o Enterprise security architecture |
| | the audit services support the | assessment |
| | audit, or use the knowledge/expertise | |
| | gained from the audit procedures as a | |
| | foundation to complete the project. | |
| | In most cases, if the Audit-Related | |
| | Services are not performed by the | |
| | Audit firm, the scope of the Audit | |
| | Services would likely increase. | |
| | The Services are typically well-defined | |
| | and governed by accounting | |
| | professional standards (AICPA, | |
| | SEC, etc.) | |
| | |
| AUDIT COMMITTEE APPROVAL POLICY | AUDIT COMMITTEE REPORTING POLICY |
| o “One-time” pre-approval | o A summary of all such |
| for the audit period for all | services and related fees |
| pre-approved specific service | reported at each regularly |
| subcategories. Approval of the | scheduled Audit Committee |
| independent auditors as | meeting. |
| auditors for a Fund shall | |
| constitute pre approval for | |
| these services. | |
| |
| o “One-time” pre-approval | o A summary of all such |
| for the fund fiscal year within | services and related fees |
| a specified dollar limit | (including comparison to |
| for all pre-approved | specified dollar limits) |
| specific service subcategories | reported quarterly. |
| |
| o Specific approval is | |
| needed to exceed the | |
| pre-approved dollar limit for | |
| these services (see general | |
| Audit Committee approval policy | |
| below for details on obtaining | |
| specific approvals) | |
| |
| o Specific approval is | |
| needed to use the Fund’s | |
| auditors for Audit-Related | |
| Services not denoted as | |
| “pre-approved”, or | |
| to add a specific service | |
| subcategory as “pre-approved” | |
SECTION III - POLICY DETAIL, CONTINUED
| | |
| SERVICE CATEGORY | SERVICE CATEGORY DESCRIPTION | SPECIFIC PRE-APPROVED SERVICE |
| | | SUBCATEGORIES |
| III. TAX SERVICES | Services which are not | o Tax planning and support |
| | prohibited by the Rule, | o Tax controversy assistance |
| | if an officer of the Fund | o Tax compliance, tax returns, excise |
| | determines that using the | tax returns and support |
| | Fund’s auditor to provide | o Tax opinions |
| | these services creates | |
| | significant synergy in | |
| | the form of efficiency, | |
| | minimized disruption, or | |
| | the ability to maintain a | |
| | desired level of | |
| | confidentiality. | |
| | |
| AUDIT COMMITTEE APPROVAL POLICY | AUDIT COMMITTEE REPORTING POLICY |
| o “One-time” pre-approval | o A summary of |
| for the fund fiscal year | all such services and |
| within a specified dollar limit | related fees |
| | (including comparison |
| | to specified dollar |
| | limits) reported |
| | quarterly. |
| |
| o Specific approval is | |
| needed to exceed the | |
| pre-approved dollar limits for | |
| these services (see general | |
| Audit Committee approval policy | |
| below for details on obtaining | |
| specific approvals) | |
| |
| o Specific approval is | |
| needed to use the Fund’s | |
| auditors for tax services not | |
| denoted as pre-approved, or to | |
| add a specific service subcategory as | |
| “pre-approved” | |
SECTION III - POLICY DETAIL, CONTINUED
| |
| SERVICE CATEGORY | SERVICE CATEGORY DESCRIPTION | SPECIFIC PRE-APPROVED SERVICE |
| | | SUBCATEGORIES |
| IV. OTHER SERVICES | Services which are not | o Business Risk Management support |
| | prohibited by the Rule, | o Other control and regulatory |
| A. SYNERGISTIC, | if an officer of the Fund | compliance projects |
| UNIQUE QUALIFICATIONS | determines that using the | |
| | Fund’s auditor to provide | |
| | these services creates | |
| | significant synergy in | |
| | the form of efficiency, | |
| | minimized disruption, | |
| | the ability to maintain a | |
| | desired level of | |
| | confidentiality, or where | |
| | the Fund’s auditors | |
| | posses unique or superior | |
| | qualifications to provide | |
| | these services, resulting | |
| | in superior value and | |
| | results for the Fund. | |
| | |
| AUDIT COMMITTEE APPROVAL POLICY | AUDIT COMMITTEE REPORTING POLICY |
| o “One-time” pre-approval | o A summary of |
| for the fund fiscal year within | all such services and |
| a specified dollar limit | related fees |
| | (including comparison |
| | to specified dollar |
| | limits) reported |
| | quarterly. |
| o Specific approval is | |
| needed to exceed the | |
| pre-approved dollar limits for | |
| these services (see general | |
| Audit Committee approval policy | |
| below for details on obtaining | |
| specific approvals) | |
| |
| o Specific approval is | |
| needed to use the Fund’s | |
| auditors for “Synergistic” or | |
| “Unique Qualifications” Other | |
| Services not denoted as | |
| pre-approved to the left, or to | |
| add a specific service | |
| subcategory as “pre-approved” | |
SECTION III - POLICY DETAIL, CONTINUED
| |
| SERVICE CATEGORY | SERVICE CATEGORY DESCRIPTION | SPECIFIC PROHIBITED SERVICE |
| | | SUBCATEGORIES |
| PROHIBITED SERVICES | Services which result | 1. Bookkeeping or other services |
| | in the auditors losing | related to the accounting records or |
| | independence status | financial statements of the audit |
| | under the Rule. | client* |
| | | 2. Financial information systems design |
| | | and implementation* |
| | | 3. Appraisal or valuation services, |
| | | fairness* opinions, or |
| | | contribution-in-kind reports |
| | | 4. Actuarial services (i.e., setting |
| | | actuarial reserves versus actuarial |
| | | audit work)* |
| | | 5. Internal audit outsourcing services* |
| | | 6. Management functions or human |
| | | resources |
| | | 7. Broker or dealer, investment |
| | | advisor, or investment banking services |
| | | 8. Legal services and expert services |
| | | unrelated to the audit |
| | | 9. Any other service that the Public |
| | | Company Accounting Oversight Board |
| | | determines, by regulation, is |
| | | impermissible |
| | |
| AUDIT COMMITTEE APPROVAL POLICY | AUDIT COMMITTEE REPORTING POLICY |
| o These services are not to be | o A summary of all |
| performed with the exception of the(*) | services and related |
| services that may be permitted | fees reported at each |
| if they would not be subject to audit | regularly scheduled |
| procedures at the audit client (as | Audit Committee meeting |
| defined in rule 2-01(f)(4)) level | will serve as continual |
| the firm providing the service. | confirmation that has |
| | not provided any |
| | restricted services. |
GENERAL AUDIT COMMITTEE APPROVAL POLICY:
o For all projects, the officers of the Funds and the Fund’s auditors will each make an assessment to determine that any proposed projects will not impair independence.
o Potential services will be classified into the four non-restricted service categories and the “Approval of Audit, Audit-Related, Tax and Other Services” Policy above will be applied. Any services outside the specific pre-approved service subcategories set forth above must be specifically approved by the Audit Committee.
o At least quarterly, the Audit Committee shall review a report summarizing the services by service category, including fees, provided by the Audit firm as set forth in the above policy.
(2) Disclose the percentage of services described in each of paragraphs (b) through (d) of this Item that were approved by the audit committee pursuant to paragraph (c)(7)(i)(C) of Rule 2-01 of Regulation S-X.
Non-Audit Services
Beginning with non-audit service contracts entered into on or after May 6, 2003, the effective date of the
new SEC pre-approval rules, the Fund’s audit committee is required to pre-approve services to affiliates defined by SEC rules to the extent that the services are determined to have a direct impact on the operations or financial reporting of the Fund. For the years ended October 31, 2020 and 2019, there were no services provided to an affiliate that required the Fund’s audit committee pre-approval.
(f) If greater than 50 percent, disclose the percentage of hours expended on the principal accountants engagement to audit the registrant’s financial statements for the most recent fiscal year that were attributed to work performed by persons other than the principal accountant’s full-time, permanent employees.
N/A
(g) Disclose the aggregate non-audit fees billed by the registrants accountant for services rendered to the registrant, and rendered to the registrants investment adviser (not including any sub-adviser whose role is primarily portfolio management and is subcontracted with or overseen by another investment adviser), and any entity controlling, controlled by, or under common control with the adviser that provides ongoing services to the registrant for each of the last two fiscal years of the registrant.
The Fund paid aggregate non-audit fees to Ernst & Young LLP for tax services of $8,189 and $8,028 during the fiscal years ended October 31, 2020 and 2019, respectively.
(h) Disclose whether the registrants audit committee of the board of trustees has considered whether the provision of non-audit services that were rendered to the registrants investment adviser (not including any subadviser whose role is primarily portfolio management and is subcontracted with or overseen by another investment adviser), and any entity controlling, controlled by, or under common control with the investment adviser that provides ongoing services to the registrant that were not pre-approved pursuant to paragraph (c)(7)(ii) of Rule 2-01 of Regulation S-X is compatible with maintaining the principal accountant’s independence.
The Fund’s audit committee of the Board of Trustees has considered whether the provision of non-audit services that were rendered to the Affiliates (as defined) that were not pre- approved pursuant to paragraph (c)(7)(ii) of Rule 2-01 of Regulation S-X is compatible with maintaining the principal accountant’s independence.
ITEM 5. AUDIT COMMITTEE OF LISTED REGISTRANTS
(a) If the registrant is a listed issuer as defined in Rule 10A-3 under the Exchange Act (17 CFR 240.10A-3), state whether or not the registrant has a separately-designated standing audit committee established in accordance with Section 3(a)(58)(A) of the Exchange Act (15 U.S.C. 78c(a)(58)(A)). If the registrant has such a committee, however designated, identify each committee member. If the entire board of directors is acting as the registrant’s audit committee as specified in Section 3(a)(58)(B) of the Exchange Act (15 U.S.C. 78c(a)(58)(B)), so state.
N/A
(b) If applicable, provide the disclosure required by Rule 10A-3(d) under the Exchange Act (17 CFR 240.10A-3(d)) regarding an exemption from the listing standards for audit committees.
N/A
ITEM 6. SCHEDULE OF INVESTMENTS.
File Schedule of Investments in securities of unaffiliated issuers as of the close of the reporting period as set forth in 210.1212 of Regulation S-X [17 CFR 210.12-12], unless the schedule is included as part of the report to shareholders filed under Item 1 of this Form.
Included in Item 1
ITEM 7. DISCLOSURE OF PROXY VOTING POLICIES AND PROCEDURES FOR CLOSED-END MANAGEMENT INVESTMENT COMPANIES.
A closed-end management investment company that is filing an annual report on this Form N-CSR must, unless it invests exclusively in non-voting securities, describe the policies and procedures that it uses to determine how to vote proxies relating to portfolio securities, including the procedures that the company uses when a vote presents a conflict between the interests of its shareholders, on the one hand, and those of the company’s investment adviser; principal underwriter; or any affiliated person (as defined in Section 2(a)(3) of the Investment Company Act of 1940 (15 U.S.C. 80a-2(a)(3)) and the rules thereunder) of the company, its investment adviser, or its principal underwriter, on the other. Include any policies and procedures of the company’s investment adviser, or any other third party, that the company uses, or that are used on the company’s behalf, to determine how to vote proxies relating to portfolio securities.
N/A
ITEM 8. PORTFOLIO MANAGERS OF CLOSED-END MANAGEMENT INVESTMENT COMPANIES.
(a) If the registrant is a closed-end management investment company that is filing an annual report on this Form N-CSR, provide the following information:
(1) State the name, title, and length of service of the person or persons employed by or associated with the registrant or an investment adviser of the registrant who are primarily responsible for the day-to-day management of the registrant’s portfolio (“Portfolio Manager”). Also state each Portfolio Manager’s business experience during the past 5 years.
N/A
ITEM 9. PURCHASES OF EQUITY SECURITIES BY CLOSED-END MANAGEMENT INVESTMENT COMPANY AND AFFILIATED PURCHASERS.
(a) If the registrant is a closed-end management investment company, in the following tabular format, provide the information specified in paragraph (b) of this Item with respect to any purchase made by or on behalf of the registrant or any affiliated purchaser, as defined in Rule 10b-18(a)(3) under the Exchange Act (17 CFR 240.10b-18(a)(3)), of shares or other units of any class of the registrant’s equity securities that is registered by the registrant pursuant to Section 12 of the Exchange Act (15 U.S.C. 781).
N/A
ITEM 10. SUBMISSION OF MATTERS TO A VOTE OF SECURITY HOLDERS.
Describe any material changes to the procedures by which shareholders may recommend nominees to the registrant’s board of directors, where those changes were implemented after the registrant last provided disclosure in response to the requirements of Item 407(c)(2)(iv) of Regulation S-R(17 CFR 229.407)(as required by Item 22(b)(15)) of Schedule 14A (17 CFR 240.14a-101), or this Item.
There have been no material changes to the procedures by which the shareholders may recommend nominees to the registrant’s board of directors since the registrant last provided disclosure in response to the requirements of Item 407(c)(2)(iv) of Regulation S-R of Schedule 14(A) in its definitive proxy statement, or this item.
ITEM 11. CONTROLS AND PROCEDURES.
(a) Disclose the conclusions of the registrant’s principal executive and principal financials officers, or persons performing similar functions, regarding the effectiveness of the registrant’s disclosure controls and procedures (as defined in Rule 30a-3(c) under the Act (17 CFR 270.30a-3(c))) as of a date within 90 days of the filing date of the report that includes the disclosure required by this paragraph, based on the evaluation of these controls and procedures required by Rule 30a-3(b) under the Act (17 CFR 270.30(a)-3(b) and Rules 13a-15(b) or 15d-15(b) under the Exchange Act (17 CFR 240.13a-15(b) or 240.15d-15(b)).
The registrant’s principal executive officer and principal financial officer have concluded that the registrant’s disclosure controls and procedures are effective based on the evaluation of these controls and procedures as of a date within 90 days of the filing date of this report.
(b) Disclose any change in the registrant’s internal control over financial reporting (as defined in Rule 30a-3(d) under the Act (17CFR 270.30a-3(d)) that occured during the second fiscal quarter of the period covered by this report that has materially affected, or is reasonably likely to materially affect, the registrant’s internal control over financial reporting.
There were no significant changes in the registrant’s internal control over financial reporting that occurred during the second fiscal quarter of the period covered by this report that have materially affected, or are reasonably likely to materially affect, the registrant’s internal control over financial reporting.
Item 12. Disclosure of Securities Lending Activities for Closed-End Management Investment Companies.
(a) If the registrant is a closed-end management investment company, provide the following dollar amounts of income and compensation related to the securities lending activities of the registrant during its most recent fiscal year:
N/A
(1) Gross income from securities lending activities;
N/A
(2) All fees and/or compensation for each of the following securities lending activities and related services: any share of revenue generated by the securities lending program paid to the securities lending agent(s) (revenue split); fees paid for cash collateral management services (including fees deducted from a pooled cash collateral reinvestment vehicle) that are not included in the revenue split; administrative fees that are not included in the revenue split; fees for indemnification that are not included in the revenue split; rebates paid to borrowers; and any other fees relating to the securities lending program that are not included in the revenue split, including a description of those other fees;
N/A
(3) The aggregate fees/compensation disclosed pursuant to paragraph (2); and
N/A
(4) Net income from securities lending activities (i.e., the dollar amount in paragraph (1) minus the dollar amount in paragraph (3)).
If a fee for a service is included in the revenue split, state that the fee is included in the revenue split.
N/A
(b) If the registrant is a closed-end management investment company, describe the services provided to the registrant by the securities lending agent in the registrants most recent fiscal year.
N/A
ITEM 13. EXHIBITS.
(a) File the exhibits listed below as part of this Form. Letter or number the exhibits in the sequence indicated.
SIGNATURES
[See General Instruction F]
Pursuant to the requirements of the Securities Exchange Act of 1934 and the Investment Company Act of 1940, the registrant has duly caused this report to be signed on its behalf by the undersigned, thereunto duly authorized.
(Registrant) Pioneer Equity Income Fund
By (Signature and Title)* /s/ Lisa M. Jones
Lisa M. Jones, President & Chief Executive Officer
Date December 30, 2020
Pursuant to the requirements of the Securities Exchange Act of 1934 and the Investment Company Act of 1940, this report has been signed below by the following persons on behalf of the registrant and in the capacities and on the dates indicated.
By (Signature and Title)* /s/ Lisa M. Jones
Lisa M. Jones, President & Chief Executive Officer
Date December 30, 2020
By (Signature and Title)* /s/ Mark E. Bradley
Mark E. Bradley, Treasurer & Chief Accounting & Financial Officer
Date December 30, 2020
* Print the name and title of each signing officer under his or her signature.