UNITED STATES
SECURITIES AND EXCHANGE COMMISSION
Washington, D.C. 20549
FORM N-CSR
CERTIFIED SHAREHOLDER REPORT OF REGISTERED
MANAGEMENT INVESTMENT COMPANIES
Investment Company Act file number: 811-6200
Schwab Investments – Schwab Taxable Bond Funds and Schwab Municipal Bond Funds
(Exact name of registrant as specified in charter)
211 Main Street, San Francisco, California 94105
(Address of principal executive offices) (Zip code)
Jonathan de St. Paer
Schwab Investments – Schwab Taxable Bond Funds and Schwab Municipal Bond Funds
211 Main Street, San Francisco, California 94105
(Name and address of agent for service)
Registrant’s telephone number, including area code: (415) 636-7000
Date of fiscal year end: August 31
Date of reporting period: August 31, 2021
Item 1: Report(s) to Shareholders.
Annual Report | August 31, 2021
Schwab Taxable Bond Funds
Schwab Treasury Inflation
Protected Securities Index Fund
Schwab U.S. Aggregate
Bond Index Fund
Schwab Short-Term
Bond Index Fund
This page is intentionally left blank.
Three ways for investors to include bond funds in an asset allocation strategy.
Fund investment adviser: Charles Schwab Investment Management, Inc. (CSIM)
Distributor: Charles Schwab & Co., Inc. (Schwab)
Schwab Taxable Bond Funds | Annual Report
Schwab Taxable Bond Funds
The performance data quoted represents past performance. Past performance does not guarantee future results. Investment returns and principal value of an investment will fluctuate so that an investor’s shares may be worth more or less than their original cost. Current performance may be lower or higher than performance data quoted. To obtain performance information current to the most recent month end, please visit www.schwabassetmanagement.com/schwabfunds_prospectus.
| Total Returns for the 12 Months Ended August 31, 2021 |
| Schwab Treasury Inflation Protected Securities Index Fund (Ticker Symbol: SWRSX) | 5.48% |
| Bloomberg US Treasury Inflation-Linked Bond Index (Series-L)SM | 5.56% |
| Fund Category: Morningstar Inflation Protected Bond1 | 5.86% |
| Performance Details | pages 7-9 |
| |
| Schwab U.S. Aggregate Bond Index Fund (Ticker Symbol: SWAGX) | -0.30% |
| Bloomberg US Aggregate Bond Index | -0.08% |
| Fund Category: Morningstar Intermediate Core Bond1 | 0.55% |
| Performance Details | pages 10-12 |
| |
| Schwab Short-Term Bond Index Fund (Ticker Symbol: SWSBX) | 0.18% |
| Bloomberg US Government/Credit 1-5 Year Index | 0.33% |
| Fund Category: Morningstar Short-Term Bond1 | 1.82% |
| Performance Details | pages 13-15 |
All total return figures on this page assume dividends and distributions were reinvested. Index figures do not include trading and management costs, which would lower performance. Indices are unmanaged and cannot be invested in directly. Performance results less than one year are not annualized.
For index definitions, please see the Glossary.
Performance does not reflect the deduction of taxes that a shareholder would pay on fund distributions or on the redemption of fund shares.
Index ownership — Bloomberg Index Services Limited. BLOOMBERG® is a trademark and service mark of Bloomberg Finance L.P. and its affiliates (collectively “Bloomberg”). Bloomberg or Bloomberg’s licensors own all proprietary rights in the Bloomberg Indices. Neither Bloomberg nor Bloomberg’s licensors approves or endorses this material, or guarantees the accuracy or completeness of any information herein, or makes any warranty, express or implied, as to the results to be obtained therefrom and, to the maximum extent allowed by law, neither shall have any liability or responsibility for injury or damages arising in connection therewith.
| 1 | Source for category information: Morningstar, Inc. The Morningstar Category return represents all active and index mutual funds within the category as of the report date. |
Schwab Taxable Bond Funds | Annual Report
Schwab Taxable Bond Funds
Jonathan de St. Paer
President of Charles Schwab
Investment Management, Inc.
and the funds covered
in this report.
Dear Shareholder,
Despite the hopes of last winter and spring that large-scale vaccine distribution would bring the COVID-19 pandemic under control, the spread of the Delta variant of the virus continues to pose significant social, health, and economic challenges across the United States and the world. Nevertheless, during the 12-month period ended August 31, 2021, the U.S. economy made dramatic progress toward reopening and renewed growth backed by continued monetary and fiscal support by the U.S. Congress and U.S. Federal Reserve. The U.S. gross domestic product (GDP) growth rate increased by over 6% during the first half of 2021 after declining in 2020. U.S. equity markets rallied sharply as well, with the S&P 500® Index, a bellwether for the overall U.S. stock market, returning 31.2% for the reporting period and repeatedly reaching new record territory. Bond prices, which typically move in the opposite direction of yields, struggled in early 2021 due to the increasing inflationary pressures of the improving economy and pandemic-constrained supply chains, then recovered in the second quarter of the year as the U.S. Federal Reserve opined that the acceleration in inflation was likely to prove transitory. The broad U.S. bond market, as measured by the Bloomberg US Aggregate Bond Index, struggled in this uncertain environment, ending the reporting period flat.
However, a closer look at bond market performance during the reporting period provides a more complicated picture, with short-term securities generally maintaining their value better than their longer-term counterparts, and U.S. Treasury inflation-protected bonds producing solid, positive returns. At Charles Schwab Investment Management, we believe these varied results reinforce the importance of establishing and maintaining a diversified, long-term investing plan that reflects your risk tolerance and long-term financial goals. Each of the Schwab Taxable Bond Funds focuses on a different segment of the U.S. bond market, including U.S. investment grade bonds, short-term bonds, or U.S. Treasury inflation-protected securities. The funds are intended to offer simple, low-cost access to the fixed-income market and can serve as part of the core of a diversified portfolio.
Thank you for investing with Charles Schwab Investment Management. For more information about the Schwab Taxable Bond Funds, please continue reading this report. In addition, you can find further details about these funds by visiting our website at www.schwabassetmanagement.com. We are also happy to hear from you at 1-877-824-5615.
Sincerely,
“ At Charles Schwab Investment Management, we believe these varied results reinforce the importance of establishing and maintaining a diversified, long-term investing plan that reflects your risk tolerance and long-term financial goals. ”
Past performance is no guarantee of future results.
Diversification and asset allocation strategies do not ensure a profit and cannot protect against losses in a declining market.
Management views may have changed since the report date.
Schwab Taxable Bond Funds | Annual Report
Schwab Taxable Bond Funds
The Investment Environment
For the 12-month reporting period ended August 31, 2021, fixed-income markets were mixed. Despite persisting COVID-19 pandemic-driven stresses on the U.S. economy and a resurgence of COVID-19 cases in the fall and into the winter, along with the emergence and rapid spread of the Delta variant during the summer, equity markets continued to rise on economic recovery, strong earnings, ongoing fiscal stimulus measures, and optimism related to the rapid rollout of COVID-19 vaccines that began in December 2020. Taxable bond yields remained relatively flat for the first four months of the reporting period before demand waned and yields rose in January and February of 2021. (Bond yields and bond prices typically move in opposite directions.) Demand began to recover and yields dipped again over the second half of the reporting period. For the reporting period, the Bloomberg US Aggregate Bond Index, representing the broad U.S. bond market, returned -0.08%, while the Bloomberg US Government/Credit 1-5 Year Index returned 0.33%. The Bloomberg US Treasury Inflation-Linked Bond Index (Series-L)SM returned 5.56% for the reporting period.
Bolstered by the extensive emergency rescue and fiscal stimulus measures passed by the U.S. Congress and U.S. Federal Reserve (Fed) beginning in March 2020, the U.S. economy began to recover from the dramatic impact of the COVID-19 pandemic. After falling by an annualized rate of 31.4% in the second quarter of 2020, U.S. gross domestic product (GDP) jumped by an annualized rate of 33.4% for the third quarter of 2020, reflecting pent-up consumer demand and government support. GDP growth stabilized beginning in the fourth quarter of 2020, growing at an annualized rate of 4.3% for the fourth quarter of 2020, 6.3% for the first quarter of 2021, and 6.7% for the second quarter of 2021. Unemployment, which skyrocketed in April 2020 but began falling starting in May 2020, fell over the reporting period. Inflation, which had remained well below the Fed’s traditional 2% target until March 2021, when it jumped, continued to rise through June 2021 and remained elevated through August 2021, largely due to supply and demand imbalances in the labor market, supply chain bottlenecks, increased consumer demand, particularly for travel-related services over most of the reporting period, and higher energy costs.
For the most part, central banks around the world maintained the low—and for some international central banks, negative—interest rates instituted prior to, and in response to, the COVID-19 pandemic. In the U.S., despite improving economic data, the Fed reiterated several times during the reporting period its intention to continue its support of the economy for as long as is needed to achieve a full recovery, while acknowledging that it was keeping an eye on rising inflation. The Fed maintained the federal funds rate in a range of 0.00% to 0.25% throughout the reporting period. By
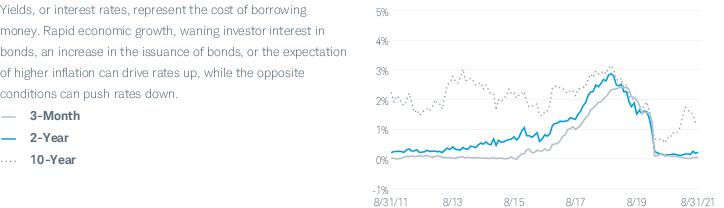
Yields of U.S. Treasury Securities: Effective Yields of Three-Month, Two-Year and Ten-Year Treasuries
Index figures assume dividends and distributions were reinvested. Index figures do not include trading and management costs, which would lower performance. Indices are unmanaged and cannot be invested in directly. Performance results less than one year are not annualized. Past performance is not an indication of future results.
For index definitions, please see the Glossary.
Data source: Bloomberg L.P.
Nothing in this report represents a recommendation of a security by the investment adviser.
Management views may have changed since the report date.
Schwab Taxable Bond Funds | Annual Report
Schwab Taxable Bond Funds
The Investment Environment (continued)
the end of the reporting period, the Fed indicated that it would likely begin reducing its bond purchases as early as late 2021 with Fed Chair Jerome Powell noting that the Fed’s bond tapering should not be seen as an indication of an imminent interest rate hike. In developed international markets, most central banks were similarly accommodative. The European Central Bank held its interest rate at 0.00%, unchanged since March 2016, and confirmed it would continue its asset purchase program to help counter the economic impacts of the COVID-19 pandemic. The Bank of Japan upheld its short-term interest rate target of -0.1%, also unchanged since 2016, and maintained its ongoing program of purchasing exchange-traded funds (ETFs) and other assets. The Bank of England maintained its key official bank rate at 0.1% and also reiterated its commitment to its bond-buying program.
After languishing at historically low levels since the onset of the COVID-19 pandemic, U.S. bond yields climbed in the first half of the reporting period as the likelihood of another stimulus package rose and investors anticipated an accelerated economic recovery resulting from the rollout of COVID-19 vaccines. Over the second half of the reporting period, yields drifted lower on tepid employment reports and growing inflation concerns. The yield on the 10-year U.S. Treasury began the reporting period at 0.72% and ended the reporting period at 1.30%. Short-term rates ended the period lower, with the yield on the three-month U.S. Treasury beginning the reporting period at 0.11% and ending the reporting period at 0.04%. Outside the U.S., bond yields generally remained low.
Schwab Taxable Bond Funds | Annual Report
Schwab Taxable Bond Funds
 | Matthew Hastings, CFA, Managing Director and Head of Taxable Bond Strategies, leads the portfolio management team for the Schwab Taxable Bond Funds and Schwab Fixed-Income ETFs. He also has overall responsibility for all aspects of the management of the funds. Prior to joining Schwab in 1999, Mr. Hastings was in fixed-income sales and trading at Lehman Brothers. He has worked in the fixed-income securities industry since 1996. |
 | Steven Hung, Senior Portfolio Manager, is responsible for the day-to-day co-management of each of the funds, except for the Schwab Treasury Inflation Protected Securities Index Fund. His primary focus is on corporate bonds. Prior to joining Schwab in 1999, Mr. Hung was an associate in Schwab’s management training program for nine months. In that role, he worked as a clerk on the options trading floor of the Pacific Coast Stock Exchange. |
 | Mark McKissick, CFA, Senior Portfolio Manager, is responsible for the day-to-day co-management of the funds. Prior to joining Schwab in 2016, Mr. McKissick worked at Denver Investments for 17 years, most recently as a director of fixed income and portfolio manager. In this role he co-managed multiple bond strategies, as well as oversaw the firm’s fixed-income business including the investment process, client service, and other administrative functions. He also served as a credit/security analyst from 1999 to 2005. Prior to that, he worked as a senior research analyst with Hotchkis & Wiley, a portfolio manager at Payden & Rygel, and a vice president in fixed income at Salomon Brothers. |
 | Alfonso Portillo, Jr., Senior Portfolio Manager, is responsible for the day-to-day co-management of the Schwab U.S. Aggregate Bond Index Fund. His primary focus is securitized products. Prior to joining Schwab in 2007, Mr. Portillo worked for ten years at Pacific Investment Management Company, most recently as a vice president and member of the mortgage- and asset-backed portfolio management team. He has worked in fixed-income asset management since 1996. |
Schwab Taxable Bond Funds | Annual Report
Schwab Treasury Inflation Protected Securities Index Fund as of August 31, 2021
The Schwab Treasury Inflation Protected Securities Index Fund (the fund) seeks to track as closely as possible, before fees and expenses, the total return of an index composed of inflation-protected U.S. Treasury securities. To pursue its investment objective, the fund generally invests in securities that are included in the Bloomberg US Treasury Inflation-Linked Bond Index (Series-L)SM (the comparative index). Under normal circumstances, the fund will invest at least 90% of its net assets (including, for this purpose, any borrowings for investment purposes) in securities included in the comparative index. For more information about the fund’s investment objective and principal investment strategies, please see the fund’s prospectus.
Market Highlights. Fixed-income markets were mixed for the 12-month reporting period ended August 31, 2021, as the U.S. economy struggled with the continuing fallout from the COVID-19 pandemic. Despite persistent COVID-19 pandemic-driven stresses on the U.S. economy and a resurgence of COVID-19 cases in the fall and into the winter, along with the emergence and rapid spread of the Delta variant during the summer, equity markets continued to rise, with several key equity market indices ending the reporting period just off record highs. Markets continued to be buoyed by the extensive emergency rescue and fiscal stimulus measures passed by the U.S. Congress and U.S. Federal Reserve (Fed) beginning in March 2020 in response to the onset of the COVID-19 pandemic. Over the reporting period, the Fed maintained the federal funds rate in a range of 0.00% to 0.25%. By the end of the reporting period, the Fed indicated that it would likely begin reducing its bond purchases as early as late 2021 on signs of a strengthening economy and rising inflation, despite ongoing challenges. Taxable bond yields were relatively flat for the first four months of the period before demand waned in January and February and yields rose. Demand began to recover over the second half of the reporting period, driving yields lower, on tepid employment reports and anticipation of a Fed response to growing inflation concerns.
U.S. Treasury yields generally remained low. The yield on the 10-year U.S. Treasury began the reporting period at 0.72% and ended the reporting period at 1.30%. The yield on the three-month U.S. Treasury began the period at 0.11% and ended the reporting period at 0.04%. For the reporting period, U.S. treasury inflation-protected securities generally outperformed both shorter- and longer-term U.S. Treasuries as inflation, which had remained well below the Fed’s traditional 2% target until March, rose through July, largely due to supply and demand imbalances in the labor market, increased demand, particularly for travel-related services over most of the reporting period, as well as higher energy costs.
Performance. The fund returned 5.48% for the 12-month period ended August 31, 2021, while the comparative index returned 5.56%.
Contributors and Detractors. Consistent with its objective and strategies, the fund closely tracked the primary risk exposures of the comparative index, which meant keeping the fund’s duration and maturity allocations similarly aligned. The fund’s slight underperformance was primarily attributable to expenses.
Management views and portfolio holdings may have changed since the report date.
Schwab Taxable Bond Funds | Annual Report
Schwab Treasury Inflation Protected Securities Index Fund
Performance and Fund Facts as of August 31, 2021
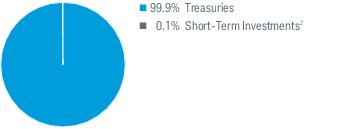
Portfolio Composition % of investments
These charts show two different views of the fund’s portfolio: by type of security and credit quality of the security.
By Security Type1
| Weighted Average Maturity3 | 8.3 Yrs |
| Weighted Average Duration3 | 7.8 Yrs |
Portfolio holdings may have changed since the report date.
U.S. Treasury Inflation-Protected Securities (TIPS) generally have lower yields than conventional fixed rate bonds and will likely decline in price during periods of deflation, which could result in losses.
| 1 | The percentage may differ from the Portfolio Holdings because the above calculation is based on a percentage of total investments, whereas the calculation in the Portfolio Holdings is based on a percentage of net assets. |
| 2 | Includes the fund’s position(s) in money market mutual funds registered under the Investment Company Act of 1940, as amended. |
| 3 | See Glossary for definitions of maturity and duration. |
| 4 | Bloomberg Index Rating: Based on the middle rating of Moody’s, S&P and Fitch; when a rating from only two agencies is available, the lower is used; when only one agency rates a bond, that rating is used. In cases where explicit bond level ratings may not be available, other sources may be used to classify securities by credit quality. Source: Bloomberg Index Service Ltd. |
Schwab Taxable Bond Funds | Annual Report
Schwab Treasury Inflation Protected Securities Index Fund
Performance and Fund Facts as of August 31, 2021 (continued)
The performance data quoted represents past performance. Past performance does not guarantee future results. Investment returns and principal value of an investment will fluctuate so that an investor’s shares may be worth more or less than their original cost. Current performance may be lower or higher than performance data quoted. To obtain performance information current to the most recent month end, please visit www.schwabassetmanagement.com/schwabfunds_prospectus.
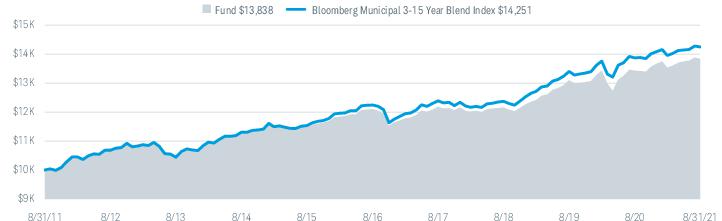
Performance of Hypothetical $10,000 Investment (August 31, 2011 – August 31, 2021)1
| Fund and Inception Date | 1 Year | 5 Years | 10 Years |
| Fund: Schwab Treasury Inflation Protected Securities Index Fund (3/31/06) | 5.48% | 4.51% | 3.00% |
| Bloomberg US Treasury Inflation-Linked Bond Index (Series-L)SM | 5.56% | 4.60% | 3.17% |
| Fund Category: Morningstar Inflation Protected Bond 2 | 5.86% | 4.26% | 2.65% |
| Fund Expense Ratio3: 0.05% |
| 30-Day SEC Yield | 9.40% |
| 12-Month Distribution Yield | 2.24% |
All total returns on this page assume dividends and distributions were reinvested. Index figures do not include trading and management costs, which would lower performance. Indices are unmanaged and cannot be invested in directly. Performance results less than one year are not annualized.
For index definitions, please see the Glossary.
Index ownership — Bloomberg® and Bloomberg US Treasury Inflation-Linked Bond Index (Series-L)SM are service marks of Bloomberg Finance L.P. and its affiliates, including Bloomberg Index Services Limited (“BISL”), the administrator of the indices (collectively, “Bloomberg”). Bloomberg is not affiliated with Charles Schwab Investment Management, Inc., and Bloomberg does not approve, endorse, review, or recommend Schwab Treasury Inflation Protected Securities Index Fund. Bloomberg does not guarantee the timeliness, accurateness, or completeness of any data or information relating to Schwab Treasury Inflation Protected Securities Index Fund.
| 1 | Performance does not reflect the deduction of taxes that a shareholder would pay on fund distributions or on the redemption of fund shares. |
| 2 | Source for category information: Morningstar, Inc. The Morningstar Category return represents all active and index mutual funds within the category as of the report date. |
| 3 | As stated in the prospectus. |
Schwab Taxable Bond Funds | Annual Report
Schwab U.S. Aggregate Bond Index Fund as of August 31, 2021
The Schwab U.S. Aggregate Bond Index Fund (the fund) seeks to track as closely as possible, before fees and expenses, the total return of an index that measures the performance of the broad U.S. investment-grade bond market. To pursue its goal, the fund generally invests in securities that are included in the Bloomberg US Aggregate Bond Index (the comparative index). For more information about the fund’s investment objective, strategy, and risks, please see the fund’s prospectus.
Market Highlights. Fixed-income markets were mixed for the 12-month reporting period ended August 31, 2021, as the U.S. economy struggled with the continuing fallout from the COVID-19 pandemic. Despite persistent COVID-19 pandemic-driven stresses on the U.S. economy and a resurgence of COVID-19 cases in the fall and into the winter, along with the emergence and rapid spread of the Delta variant during the summer, equity markets continued to rise, with several key equity market indices ending the reporting period just off record highs. Markets continued to be buoyed by the extensive emergency rescue and fiscal stimulus measures passed by the U.S. Congress and U.S. Federal Reserve (Fed) beginning in March 2020 in response to the onset of the COVID-19 pandemic. Over the reporting period, the Fed maintained the federal funds rate in a range of 0.00% to 0.25%. By the end of the reporting period, the Fed indicated that it would likely begin reducing its bond purchases as early as late 2021 on signs of a strengthening economy and rising inflation, despite ongoing challenges. Taxable bond yields were relatively flat for the first four months of the period before demand waned in January and February and yields rose. Demand began to recover over the second half of the reporting period, driving yields lower, on tepid employment reports and anticipation of a Fed response to growing inflation concerns.
U.S. Treasury yields generally remained low. The yield on the 10-year U.S. Treasury began the reporting period at 0.72% and ended the reporting period at 1.30%. The yield on the three-month U.S. Treasury began the period at 0.11% and ended the reporting period at 0.04%.
Among bond markets, high-yield bonds were in particularly high demand during the reporting period and outperformed all other categories. Corporate bonds also posted positive returns, while mortgage-backed securities were down modestly. U.S Treasuries generally underperformed, with the exception of U.S. Treasury inflation-protected securities, which posted strong gains. Credit spreads on investment-grade securities and mortgage-backed securities generally declined over the reporting period.
Performance. The fund returned -0.30% for the 12-month period ended August 31, 2021, while the comparative index returned -0.08%.
Contributors and Detractors. Consistent with its objective and strategies, the fund closely tracked the primary risk exposures of the comparative index, which meant keeping the fund’s duration and maturity allocations similarly aligned. The fund’s underperformance was attributable to expenses, net asset value (NAV) rounding, and other operational residuals.
In addition, the fund held positions in TBAs, or “to-be-announced” securities, which are mortgage-backed bonds that settle on a forward date. The fund’s average month-end position in these securities was 1.5%, with a minimum exposure of 1.2% and maximum exposure of 1.9% over the period.
Management views and portfolio holdings may have changed since the report date.
Schwab Taxable Bond Funds | Annual Report
Schwab U.S. Aggregate Bond Index Fund
Performance and Fund Facts as of August 31, 2021
Portfolio Composition % of investments
These charts show two different views of the fund’s portfolio: by type of security and credit quality of the security.
By Security Type1
| Weighted Average Maturity4 | 8.4 Yrs |
| Weighted Average Duration4 | 6.7 Yrs |
Portfolio holdings may have changed since the report date.
| 1 | The percentage may differ from the Portfolio Holdings because the above calculation is based on a percentage of total investments, whereas the calculation in the Portfolio Holdings is based on a percentage of net assets. |
| 2 | The fund may seek to obtain exposure to U.S. agency mortgage pass-through securities, in part or in full, through the use of “to-be-announced” or “TBA” transactions, which are standardized contracts for future delivery of mortgage pass-through securities in which the exact mortgage pools to be delivered are not specified until a few days prior to settlement. These transactions represented approximately 1.9% of net assets on August 31, 2021. |
| 3 | Includes the fund’s position(s) in money market mutual funds registered under the Investment Company Act of 1940, as amended. |
| 4 | See Glossary for definitions of maturity and duration. |
| 5 | Bloomberg Index Rating: Based on the middle rating of Moody’s, S&P and Fitch; when a rating from only two agencies is available, the lower is used; when only one agency rates a bond, that rating is used. In cases where explicit bond level ratings may not be available, other sources may be used to classify securities by credit quality. Source: Bloomberg Index Service Ltd. |
| 6 | Less than 0.05%. |
Schwab Taxable Bond Funds | Annual Report
Schwab U.S. Aggregate Bond Index Fund
Performance and Fund Facts as of August 31, 2021 (continued)
The performance data quoted represents past performance. Past performance does not guarantee future results. Investment returns and principal value of an investment will fluctuate so that an investor’s shares may be worth more or less than their original cost. Current performance may be lower or higher than performance data quoted. To obtain performance information current to the most recent month end, please visit www.schwabassetmanagement.com/schwabfunds_prospectus.
Performance of Hypothetical $10,000 Investment (February 23, 2017 – August 31, 2021)1
| Fund and Inception Date | 1 Year | 3 Years | Since Inception |
| Fund: Schwab U.S. Aggregate Bond Index Fund (2/23/17) | -0.30% | 5.30% | 3.87% |
| Bloomberg US Aggregate Bond Index | -0.08% | 5.43% | 4.04% |
| Fund Category: Morningstar Intermediate Core Bond 2 | 0.55% | 5.38% | N/A |
| Fund Expense Ratio3: 0.04% |
| 30-Day SEC Yield | 1.25% |
| 12-Month Distribution Yield | 2.12% |
All total returns on this page assume dividends and distributions were reinvested. Index figures do not include trading and management costs, which would lower performance. Indices are unmanaged and cannot be invested in directly. Performance results less than one year are not annualized.
For index definitions, please see the Glossary.
Index ownership — Bloomberg® and Bloomberg US Aggregate Bond Index are service marks of Bloomberg Finance L.P. and its affiliates, including Bloomberg Index Services Limited (“BISL”), the administrator of the indices (collectively, “Bloomberg”). Bloomberg is not affiliated with Charles Schwab Investment Management, Inc., and Bloomberg does not approve, endorse, review, or recommend Schwab U.S. Aggregate Bond Index Fund. Bloomberg does not guarantee the timeliness, accurateness, or completeness of any data or information relating to Schwab U.S. Aggregate Bond Index Fund.
| 1 | Performance does not reflect the deduction of taxes that a shareholder would pay on fund distributions or on the redemption of fund shares. |
| 2 | Source for category information: Morningstar, Inc. The Morningstar Category return represents all active and index mutual funds within the category as of the report date. |
| 3 | As stated in the prospectus. |
Schwab Taxable Bond Funds | Annual Report
Schwab Short-Term Bond Index Fund as of August 31, 2021
The Schwab Short-Term Bond Index Fund (the fund) seeks to track as closely as possible, before fees and expenses, the total return of an index composed of U.S. investment-grade government related and corporate bonds with maturities between 1-5 years. To pursue its goal, the fund generally invests in securities that are included in the Bloomberg US Government/Credit 1-5 Year Index (the comparative index). For more information about the fund’s investment objective, strategy, and risks, please see the fund’s prospectus.
Market Highlights. Fixed-income markets were mixed for the 12-month reporting period ended August 31, 2021, as the U.S. economy struggled with the continuing fallout from the COVID-19 pandemic. Despite persistent COVID-19 pandemic-driven stresses on the U.S. economy and a resurgence of COVID-19 cases in the fall and into the winter, along with the emergence and rapid spread of the Delta variant during the summer, equity markets continued to rise, with several key equity market indices ending the reporting period just off record highs. Markets continued to be buoyed by the extensive emergency rescue and fiscal stimulus measures passed by the U.S. Congress and U.S. Federal Reserve (Fed) beginning in March 2020 in response to the onset of the COVID-19 pandemic. Over the reporting period, the Fed maintained the federal funds rate in a range of 0.00% to 0.25%. By the end of the reporting period, the Fed indicated that it would likely begin reducing its bond purchases as early as late 2021 on signs of a strengthening economy and rising inflation, despite ongoing challenges. Taxable bond yields were relatively flat for the first four months of the period before demand waned in January and February and yields rose. Demand began to recover over the second half of the reporting period, driving yields lower, on tepid employment reports and anticipation of a Fed response to growing inflation concerns.
U.S. Treasury yields generally remained low. The yield on the 10-year U.S. Treasury began the reporting period at 0.72% and ended the reporting period at 1.30%. The yield on the three-month U.S. Treasury began the period at 0.11% and ended the reporting period at 0.04%.
Among bond markets, high-yield bonds were in particularly high demand during the reporting period and outperformed all other categories. Corporate bonds also posted positive returns, while mortgage-backed securities were down modestly. U.S Treasuries generally underperformed, with the exception of U.S. Treasury inflation-protected securities, which posted strong gains. Credit spreads on investment-grade securities and mortgage-backed securities generally declined over the reporting period.
Performance. The fund returned 0.18% for the 12-month period ended August 31, 2021, while the comparative index returned 0.33%.
Contributors and Detractors. Consistent with its objective and strategies, the fund closely tracked the primary risk exposures of the comparative index, which meant keeping the fund’s duration and maturity allocations similarly aligned. The fund’s underperformance was attributable to expenses, net asset value (NAV) rounding, and other operational residuals.
Management views and portfolio holdings may have changed since the report date.
Schwab Taxable Bond Funds | Annual Report
Schwab Short-Term Bond Index Fund
Performance and Fund Facts as of August 31, 2021
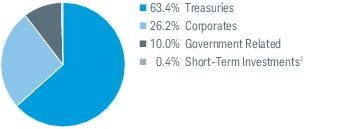
Portfolio Composition % of investments
These charts show two different views of the fund’s portfolio: by type of security and credit quality of the security.
By Security Type1
| Weighted Average Maturity3 | 2.9 Yrs |
| Weighted Average Duration3 | 2.8 Yrs |
Portfolio holdings may have changed since the report date.
| 1 | The percentage may differ from the Portfolio Holdings because the above calculation is based on a percentage of total investments, whereas the calculation in the Portfolio Holdings is based on a percentage of net assets. |
| 2 | Includes the fund’s position(s) in money market mutual funds registered under the Investment Company Act of 1940, as amended. |
| 3 | See Glossary for definitions of maturity and duration. |
| 4 | Bloomberg Index Rating: Based on the middle rating of Moody’s, S&P and Fitch; when a rating from only two agencies is available, the lower is used; when only one agency rates a bond, that rating is used. In cases where explicit bond level ratings may not be available, other sources may be used to classify securities by credit quality. Source: Bloomberg Index Service Ltd. |
| 5 | Less than 0.05%. |
Schwab Taxable Bond Funds | Annual Report
Schwab Short-Term Bond Index Fund
Performance and Fund Facts as of August 31, 2021 (continued)
The performance data quoted represents past performance. Past performance does not guarantee future results. Investment returns and principal value of an investment will fluctuate so that an investor’s shares may be worth more or less than their original cost. Current performance may be lower or higher than performance data quoted. To obtain performance information current to the most recent month end, please visit www.schwabassetmanagement.com/schwabfunds_prospectus.
Performance of Hypothetical $10,000 Investment (February 23, 2017 – August 31, 2021)1
| Fund and Inception Date | 1 Year | 3 Years | Since Inception |
| Fund: Schwab Short-Term Bond Index Fund (2/23/17) | 0.18% | 3.53% | 2.49% |
| Bloomberg US Government/Credit 1-5 Year Index | 0.33% | 3.64% | 2.63% |
| Fund Category: Morningstar Short-Term Bond 2 | 1.82% | 3.42% | N/A |
| Fund Expense Ratio3: 0.06% |
| 30-Day SEC Yield | 0.46% |
| 12-Month Distribution Yield | 0.97% |
All total returns on this page assume dividends and distributions were reinvested. Index figures do not include trading and management costs, which would lower performance. Indices are unmanaged and cannot be invested in directly. Performance results less than one year are not annualized.
For index definitions, please see the Glossary.
Index ownership — Bloomberg® and Bloomberg US Government/Credit 1-5 Year Index are service marks of Bloomberg Finance L.P. and its affiliates, including Bloomberg Index Services Limited (“BISL”), the administrator of the indices (collectively, “Bloomberg”). Bloomberg is not affiliated with Charles Schwab Investment Management, Inc., and Bloomberg does not approve, endorse, review, or recommend Schwab Short-Term Bond Index Fund. Bloomberg does not guarantee the timeliness, accurateness, or completeness of any data or information relating to Schwab Short-Term Bond Index Fund.
| 1 | Performance does not reflect the deduction of taxes that a shareholder would pay on fund distributions or on the redemption of fund shares. |
| 2 | Source for category information: Morningstar, Inc. The Morningstar Category return represents all active and index mutual funds within the category as of the report date. |
| 3 | As stated in the prospectus. |
Schwab Taxable Bond Funds | Annual Report
Schwab Taxable Bond Funds
Fund Expenses (Unaudited)
Examples for a $1,000 Investment
As a fund shareholder, you may incur two types of costs: (1) transaction costs; and (2) ongoing costs, including management fees.
The expense examples below are intended to help you understand your ongoing cost (in dollars) of investing in a fund and to compare this cost with the ongoing cost of investing in other mutual funds. These examples are based on an investment of $1,000 invested for six months beginning March 1, 2021 and held through August 31, 2021.
Actual Return lines in the table below provide information about actual account values and actual expenses. You may use this information, together with the amount you invested, to estimate the expenses that you paid over the period. To do so, simply divide your account value by $1,000 (for example, an $8,600 account value ÷ $1,000 = 8.6), then multiply the result by the number given for your fund under the heading entitled “Expenses Paid During Period.”
Hypothetical Return lines in the table below provide information about hypothetical account values and hypothetical expenses based on a fund’s actual expense ratio and an assumed return of 5% per year before expenses. Because the return used is not an actual return, it may not be used to estimate the actual ending account value or expenses you paid for the period.
You may use this information to compare the ongoing costs of investing in the fund and other funds. To do so, compare this 5% hypothetical example with the 5% hypothetical examples that appear in the shareholder reports of the other funds.
Please note that the expenses shown in the table are meant to highlight your ongoing costs only, and do not reflect any transactional costs. Therefore, the hypothetical return lines of the table are useful in comparing ongoing costs only, and will not help you determine the relative total costs of owning different funds. In addition, if these transactional costs were included, your costs would have been higher.
| | Expense Ratio
(Annualized)1 | Beginning
Account Value
at 3/1/21 | Ending
Account Value
(Net of Expenses)
at 8/31/21 | Expenses Paid
During Period
3/1/21-8/31/212 |
| Schwab Treasury Inflation Protected Securities Index Fund | | | | |
| Actual Return | 0.05% | $1,000.00 | $1,055.40 | $0.26 |
| Hypothetical 5% Return | 0.05% | $1,000.00 | $1,024.95 | $0.26 |
| Schwab U.S. Aggregate Bond Index Fund | | | | |
| Actual Return | 0.04% | $1,000.00 | $1,014.20 | $0.20 |
| Hypothetical 5% Return | 0.04% | $1,000.00 | $1,025.00 | $0.20 |
| Schwab Short-Term Bond Index Fund | | | | |
| Actual Return | 0.06% | $1,000.00 | $1,002.50 | $0.30 |
| Hypothetical 5% Return | 0.06% | $1,000.00 | $1,024.90 | $0.31 |
| 1 | Based on the most recent six-month expense ratio. |
| 2 | Expenses for each fund are equal to its annualized expense ratio, multiplied by the average account value over the period, multiplied by 184 days of the period, and divided by 365 days of the fiscal year. |
Schwab Taxable Bond Funds | Annual Report
Schwab Treasury Inflation Protected Securities Index Fund
Financial Statements
Financial Highlights
| | 9/1/20–
8/31/21 | 9/1/19–
8/31/20 | 9/1/18–
8/31/19 | 9/1/17–
8/31/18 | 9/1/16–
8/31/17 | |
| Per-Share Data |
| Net asset value at beginning of period | $12.33 | $11.50 | $10.97 | $11.18 | $11.39 | |
| Income (loss) from investment operations: | | | | | | |
| Net investment income (loss)1 | 0.59 | 0.12 | 0.25 | 0.36 | 0.23 | |
| Net realized and unrealized gains (losses) | 0.07 | 0.88 | 0.55 | (0.28) | (0.20) | |
| Total from investment operations | 0.66 | 1.00 | 0.80 | 0.08 | 0.03 | |
| Less distributions: | | | | | | |
| Distributions from net investment income | (0.28) | (0.17) | (0.27) | (0.29) | (0.24) | |
| Distributions from net realized gains | (0.01) | — | — | — | — | |
| Total distributions | (0.29) | (0.17) | (0.27) | (0.29) | (0.24) | |
| Net asset value at end of period | $12.70 | $12.33 | $11.50 | $10.97 | $11.18 | |
| Total return | 5.48% | 8.88% | 7.42% | 0.71% | 0.35% | |
| Ratios/Supplemental Data |
| Ratios to average net assets: | | | | | | |
| Total expenses | 0.05% | 0.05% | 0.05% | 0.05% | 0.28% 2 | |
| Net operating expenses | N/A | N/A | N/A | N/A 3 | 0.11% 2 | |
| Net investment income (loss) | 4.83% | 1.05% | 2.27% | 3.29% | 2.07% | |
| Portfolio turnover rate | 25% | 29% | 25% | 18% | 17% | |
| Net assets, end of period (x 1,000,000) | $2,397 | $1,429 | $923 | $746 | $565 | |
| |
1
Calculated based on the average shares outstanding during the period.
2
Effective March 1, 2017 the annual operating expense ratio was reduced. The ratio presented for the period ended 8/31/17 is a blended ratio.
3
Effective March 1, 2017, the fund instituted a new fee structure and the contractual expense limitation was terminated.
Schwab Taxable Bond Funds | Annual Report
Schwab Treasury Inflation Protected Securities Index Fund
Portfolio Holdings as of August 31, 2021
This section shows all the securities in the fund’s portfolio and their values as of the report date.
The fund files its complete schedule of portfolio holdings with the U.S. Securities and Exchange Commission (SEC) for the first and third quarters of each fiscal year on Form N-PORT Part F. The fund’s Form N-PORT Part F is available on the SEC’s website at www.sec.gov. You can also obtain this information at no cost on the fund’s website at www.schwabassetmanagement.com/schwabfunds_prospectus, by calling 1-866-414-6349, or by sending an email request to orders@mysummaryprospectus.com. The fund also makes available its complete schedule of portfolio holdings 15 to 20 days after the end of the month on the fund’s website.
For fixed-rate obligations, the rate shown is the interest rate (the rate established when the obligation was issued). For variable-rate obligations, the rate shown is the rate as of the report date based on each security’s rate reset date. The reference rate and spread used is shown parenthetically in the security description, if available; if not, the reference rate is described in a footnote. The maturity date shown for all the securities is the final legal maturity. Inflation-protected securities are fixed-income securities whose principal value is periodically adjusted to the rate of inflation. The interest rate on these instruments is generally fixed at issuance at a rate lower than typical bonds or notes. Over the life of an inflation-indexed instrument interest will be paid based on a principal value, which is adjusted for any inflation or deflation.
Security
Rate, Maturity Date | Face
Amount ($) | Value ($) |
| Treasuries 99.9% of net assets |
| U.S. Treasury Inflation Protected Securities |
| 0.13%, 01/15/23 | 86,802,646 | 90,053,073 |
| 0.63%, 04/15/23 | 73,563,950 | 77,256,014 |
| 0.38%, 07/15/23 | 84,042,721 | 88,838,150 |
| 0.63%, 01/15/24 | 80,524,735 | 86,292,479 |
| 0.50%, 04/15/24 | 44,722,333 | 47,984,675 |
| 0.13%, 07/15/24 | 74,339,097 | 79,765,283 |
| 0.13%, 10/15/24 | 63,789,360 | 68,549,331 |
| 0.25%, 01/15/25 | 73,362,051 | 79,301,238 |
| 2.38%, 01/15/25 | 47,740,871 | 55,236,728 |
| 0.13%, 04/15/25 | 52,627,238 | 56,787,006 |
| 0.38%, 07/15/25 | 73,601,292 | 80,857,901 |
| 0.13%, 10/15/25 | 63,613,937 | 69,406,144 |
| 0.63%, 01/15/26 | 64,239,380 | 71,540,754 |
| 2.00%, 01/15/26 | 33,911,742 | 39,944,984 |
| 0.13%, 04/15/26 | 60,142,125 | 65,720,645 |
| 0.13%, 07/15/26 | 60,889,631 | 67,093,428 |
| 0.38%, 01/15/27 | 57,152,703 | 63,817,417 |
| 2.38%, 01/15/27 | 27,869,709 | 34,317,093 |
| 0.38%, 07/15/27 | 61,950,235 | 69,782,426 |
| 0.50%, 01/15/28 | 64,290,789 | 72,926,849 |
| 1.75%, 01/15/28 | 26,367,953 | 32,165,482 |
| 3.63%, 04/15/28 | 27,010,356 | 36,655,171 |
| 0.75%, 07/15/28 | 55,704,451 | 64,689,686 |
| 0.88%, 01/15/29 | 47,390,295 | 55,585,394 |
| 2.50%, 01/15/29 | 24,903,910 | 32,399,731 |
| 3.88%, 04/15/29 | 32,468,806 | 46,032,674 |
| 0.25%, 07/15/29 | 56,960,620 | 64,324,711 |
| 0.13%, 01/15/30 | 63,019,223 | 70,305,274 |
| 0.13%, 07/15/30 | 69,698,639 | 78,165,724 |
Security
Rate, Maturity Date | Face
Amount ($) | Value ($) |
| 0.13%, 01/15/31 | 73,747,833 | 82,426,871 |
| 0.13%, 07/15/31 | 30,528,904 | 34,253,233 |
| 3.38%, 04/15/32 | 11,330,437 | 16,909,643 |
| 2.13%, 02/15/40 | 14,692,951 | 22,366,509 |
| 2.13%, 02/15/41 | 21,123,553 | 32,539,930 |
| 0.75%, 02/15/42 | 34,743,201 | 43,347,738 |
| 0.63%, 02/15/43 | 26,867,296 | 32,833,996 |
| 1.38%, 02/15/44 | 37,064,667 | 52,210,928 |
| 0.75%, 02/15/45 | 40,842,965 | 51,624,285 |
| 1.00%, 02/15/46 | 21,291,303 | 28,510,744 |
| 0.88%, 02/15/47 | 25,971,532 | 34,315,024 |
| 1.00%, 02/15/48 | 19,175,617 | 26,260,878 |
| 1.00%, 02/15/49 | 17,841,626 | 24,643,580 |
| 0.25%, 02/15/50 | 26,896,710 | 31,316,362 |
| 0.13%, 02/15/51 | 30,592,201 | 34,709,743 |
| Total Treasuries |
| (Cost $2,237,701,498) | | 2,394,064,929 |
| Security | Number
of Shares | Value ($) |
| Short-Term Investment 0.1% of net assets |
| |
| Money Market Fund 0.1% |
| State Street Institutional U.S. Government Money Market Fund, Premier Class 0.03% (a) | 3,217,128 | 3,217,128 |
| Total Short-Term Investment |
| (Cost $3,217,128) | | 3,217,128 |
| (a) | The rate shown is the 7-day yield. |
Schwab Taxable Bond Funds | Annual Report
Schwab Treasury Inflation Protected Securities Index Fund
Portfolio Holdings as of August 31, 2021 (continued)
The following is a summary of the inputs used to value the fund’s investments as of August 31, 2021 (see financial note 2(a) for additional information):
| Description | Quoted Prices in
Active Markets for
Identical Assets
(Level 1) | Other Significant
Observable Inputs
(Level 2) | Significant
Unobservable Inputs
(Level 3) | Total | |
| Assets | | | | | |
| Treasuries | $— | $2,394,064,929 | $— | $2,394,064,929 | |
| Short-Term Investment1 | 3,217,128 | — | — | 3,217,128 | |
| Total | $3,217,128 | $2,394,064,929 | $— | $2,397,282,057 | |
| 1 | As categorized in the Portfolio Holdings. |
Fund investments in mutual funds are classified as Level 1, without consideration to the classification level of the underlying securities held by the mutual funds, which could be Level 1, Level 2 or Level 3.
Schwab Taxable Bond Funds | Annual Report
Schwab Treasury Inflation Protected Securities Index Fund
Statement of Assets and Liabilities
As of August 31, 2021
| Assets |
| Investments in securities, at value - unaffiliated (cost $2,240,918,626) | | $2,397,282,057 |
| Receivables: | | |
| Investments sold | | 14,905,449 |
| Fund shares sold | | 3,571,350 |
| Interest | | 2,488,735 |
| Dividends | + | 34 |
| Total assets | | 2,418,247,625 |
| Liabilities |
| Payables: | | |
| Investments bought | | 19,518,235 |
| Investment adviser fees | | 100,113 |
| Fund shares redeemed | + | 1,337,640 |
| Total liabilities | | 20,955,988 |
| Net Assets |
| Total assets | | 2,418,247,625 |
| Total liabilities | – | 20,955,988 |
| Net assets | | $2,397,291,637 |
| Net Assets by Source | | |
| Capital received from investors | | 2,194,324,362 |
| Total distributable earnings | | 202,967,275 |
| Net Asset Value (NAV) |
| Net Assets | ÷ | Shares
Outstanding | = | NAV |
| $2,397,291,637 | | 188,730,233 | | $12.70 |
| | | | | |
Schwab Taxable Bond Funds | Annual Report
Schwab Treasury Inflation Protected Securities Index Fund
Statement of Operations
For the period September 1, 2020 through August 31, 2021
| Investment Income (Loss) |
| Interest received from securities — unaffiliated | | $89,981,970 |
| Dividends received from securities — unaffiliated | + | 359 |
| Total investment income | | 89,982,329 |
| Expenses |
| Investment adviser fees | | 922,144 |
| Total expenses | – | 922,144 |
| Net investment income | | 89,060,185 |
| Realized and Unrealized Gains (Losses) |
| Net realized gains on sales of securities — unaffiliated | | 1,484,103 |
| Net change in unrealized appreciation (depreciation) on securities — unaffiliated | + | 21,212,225 |
| Net realized and unrealized gains | | 22,696,328 |
| Increase in net assets resulting from operations | | $111,756,513 |
Schwab Taxable Bond Funds | Annual Report
Schwab Treasury Inflation Protected Securities Index Fund
Statement of Changes in Net Assets
For the current and prior report periods
| Operations | |
| | 9/1/20-8/31/21 | 9/1/19-8/31/20 |
| Net investment income | | $89,060,185 | $11,518,578 |
| Net realized gains | | 1,484,103 | 1,278,452 |
| Net change in unrealized appreciation (depreciation) | + | 21,212,225 | 89,469,313 |
| Increase in net assets from operations | | 111,756,513 | 102,266,343 |
| Distributions to Shareholders | |
| Total distributions | | ($43,476,635) | ($14,928,816) |
| Transactions in Fund Shares | | | |
| | | 9/1/20-8/31/21 | 9/1/19-8/31/20 |
| | | SHARES | VALUE | SHARES | VALUE |
| Shares sold | | 112,727,113 | $1,390,004,640 | 64,991,716 | $758,806,135 |
| Shares reinvested | | 2,679,572 | 32,957,366 | 1,092,527 | 12,302,672 |
| Shares redeemed | + | (42,542,382) | (522,986,216) | (30,488,166) | (352,832,230) |
| Net transactions in fund shares | | 72,864,303 | $899,975,790 | 35,596,077 | $418,276,577 |
| Shares Outstanding and Net Assets | | | |
| | | 9/1/20-8/31/21 | 9/1/19-8/31/20 |
| | | SHARES | NET ASSETS | SHARES | NET ASSETS |
| Beginning of period | | 115,865,930 | $1,429,035,969 | 80,269,853 | $923,421,865 |
| Total increase | + | 72,864,303 | 968,255,668 | 35,596,077 | 505,614,104 |
| End of period | | 188,730,233 | $2,397,291,637 | 115,865,930 | $1,429,035,969 |
Schwab Taxable Bond Funds | Annual Report
Schwab U.S. Aggregate Bond Index Fund
Financial Statements
Financial Highlights
| | 9/1/20–
8/31/21 | 9/1/19–
8/31/20 | 9/1/18–
8/31/19 | 9/1/17–
8/31/18 | 2/23/17 1–
8/31/17 | |
| Per-Share Data |
| Net asset value at beginning of period | $10.84 | $10.46 | $9.78 | $10.16 | $10.00 | |
| Income (loss) from investment operations: | | | | | | |
| Net investment income (loss)2 | 0.18 | 0.25 | 0.28 | 0.25 | 0.12 | |
| Net realized and unrealized gains (losses) | (0.22) | 0.40 | 0.69 | (0.37) | 0.17 | |
| Total from investment operations | (0.04) | 0.65 | 0.97 | (0.12) | 0.29 | |
| Less distributions: | | | | | | |
| Distributions from net investment income | (0.22) | (0.27) | (0.29) | (0.26) | (0.13) | |
| Distributions from net realized gains | (0.01) | — | — | — | — | |
| Total distributions | (0.23) | (0.27) | (0.29) | (0.26) | (0.13) | |
| Net asset value at end of period | $10.57 | $10.84 | $10.46 | $9.78 | $10.16 | |
| Total return | (0.30%) | 6.33% | 10.15% | (1.17%) | 2.88% 3 | |
| Ratios/Supplemental Data |
| Ratios to average net assets: | | | | | | |
| Total expenses | 0.04% | 0.04% | 0.04% | 0.04% | 0.04% 4 | |
| Net investment income (loss) | 1.66% | 2.32% | 2.86% | 2.52% | 2.32% 4 | |
| Portfolio turnover rate5 | 56% | 81% | 91% | 97% | 39% 3,6 | |
| Net assets, end of period (x 1,000,000) | $5,510 | $4,697 | $2,971 | $2,006 | $1,445 | |
| |
1
Commencement of operations.
2
Calculated based on the average shares outstanding during the period.
3
Not annualized.
4
Annualized.
5
Includes to-be-announced (TBA) transactions (if any). See financial note 2.
6
Portfolio turnover rate excludes in-kind transactions.
Schwab Taxable Bond Funds | Annual Report
Schwab U.S. Aggregate Bond Index Fund
Portfolio Holdings as of August 31, 2021
This section shows all the securities in the fund’s portfolio and their values as of the report date.
The fund files its complete schedule of portfolio holdings with the U.S. Securities and Exchange Commission (SEC) for the first and third quarters of each fiscal year on Form N-PORT Part F. The fund’s Form N-PORT Part F is available on the SEC’s website at www.sec.gov. You can also obtain this information at no cost on the fund’s website at www.schwabassetmanagement.com/schwabfunds_prospectus, by calling 1-866-414-6349, or by sending an email request to orders@mysummaryprospectus.com. The fund also makes available its complete schedule of portfolio holdings 15 to 20 days after the end of the month on the fund’s website.
For fixed-rate obligations, the rate shown is the interest rate (the rate established when the obligation was issued). For variable-rate obligations, the rate shown is the rate as of the report date based on each security’s rate reset date. The reference rate and spread used is shown parenthetically in the security description, if available; if not, the reference rate is described in a footnote. The maturity date shown for all the securities is the final legal maturity.
Security
Rate, Maturity Date | Face
Amount ($) | Value ($) |
| Corporates 26.1% of net assets |
| |
| Financial Institutions 8.0% |
| Banking 5.5% |
| Ally Financial, Inc. |
| 3.05%, 06/05/23 (a) | 200,000 | 208,012 |
| 1.45%, 10/02/23 (a) | 500,000 | 507,815 |
| 3.88%, 05/21/24 (a) | 200,000 | 215,696 |
| 5.13%, 09/30/24 | 150,000 | 168,786 |
| 5.80%, 05/01/25 (a) | 150,000 | 173,651 |
| 8.00%, 11/01/31 | 450,000 | 655,176 |
| American Express Co. |
| 2.65%, 12/02/22 | 200,000 | 206,070 |
| 3.40%, 02/27/23 (a) | 450,000 | 469,300 |
| 3.70%, 08/03/23 (a) | 500,000 | 530,465 |
| 3.40%, 02/22/24 (a) | 200,000 | 213,386 |
| 2.50%, 07/30/24 (a) | 350,000 | 368,697 |
| 3.00%, 10/30/24 (a) | 450,000 | 482,067 |
| 4.20%, 11/06/25 (a) | 150,000 | 170,274 |
| 3.13%, 05/20/26 (a) | 150,000 | 163,845 |
| 4.05%, 12/03/42 | 150,000 | 182,457 |
| American Express Credit Corp. |
| 3.30%, 05/03/27 (a) | 450,000 | 498,888 |
| Australia & New Zealand Banking Group Ltd. |
| 2.05%, 11/21/22 | 250,000 | 255,518 |
| 3.70%, 11/16/25 | 250,000 | 279,739 |
| Banco Bilbao Vizcaya Argentaria S.A. |
| 0.88%, 09/18/23 | 200,000 | 201,066 |
| 1.13%, 09/18/25 | 200,000 | 199,084 |
| Banco Santander S.A. |
| 3.13%, 02/23/23 | 200,000 | 207,652 |
| 3.85%, 04/12/23 | 200,000 | 210,626 |
| 2.71%, 06/27/24 | 200,000 | 211,374 |
| 0.70%, 06/30/24 (a)(b) | 200,000 | 200,672 |
| 2.75%, 05/28/25 | 200,000 | 210,936 |
| 5.18%, 11/19/25 | 400,000 | 457,516 |
| 1.85%, 03/25/26 | 400,000 | 406,724 |
| 4.25%, 04/11/27 | 200,000 | 226,710 |
| 3.80%, 02/23/28 | 200,000 | 221,906 |
| 4.38%, 04/12/28 | 200,000 | 229,714 |
| 3.31%, 06/27/29 | 200,000 | 219,602 |
| 3.49%, 05/28/30 | 200,000 | 217,792 |
| 2.75%, 12/03/30 | 400,000 | 402,336 |
| 2.96%, 03/25/31 | 200,000 | 207,786 |
| BancorpSouth Bank |
| 4.13%, 11/20/29 (a)(b) | 50,000 | 52,791 |
| Bank of America Corp. |
| 2.50%, 10/21/22 (a) | 500,000 | 501,525 |
| 3.30%, 01/11/23 | 800,000 | 833,264 |
Security
Rate, Maturity Date | Face
Amount ($) | Value ($) |
| 4.10%, 07/24/23 | 500,000 | 535,340 |
| 3.00%, 12/20/23 (a)(b) | 1,150,000 | 1,187,398 |
| 4.13%, 01/22/24 | 500,000 | 542,675 |
| 3.55%, 03/05/24 (a)(b) | 650,000 | 679,133 |
| 4.00%, 04/01/24 | 500,000 | 543,810 |
| 1.49%, 05/19/24 (a)(b) | 200,000 | 203,350 |
| 0.52%, 06/14/24 (a)(b) | 150,000 | 149,921 |
| 3.86%, 07/23/24 (a)(b) | 450,000 | 477,171 |
| 4.20%, 08/26/24 | 650,000 | 713,037 |
| 0.81%, 10/24/24 (a)(b) | 700,000 | 702,968 |
| 4.00%, 01/22/25 | 350,000 | 383,134 |
| 3.46%, 03/15/25 (a)(b) | 450,000 | 480,667 |
| 3.95%, 04/21/25 | 450,000 | 493,047 |
| 0.98%, 04/22/25 (a)(b) | 500,000 | 503,090 |
| 3.88%, 08/01/25 | 450,000 | 499,918 |
| 0.98%, 09/25/25 (a)(b) | 750,000 | 752,595 |
| 3.09%, 10/01/25 (a)(b) | 250,000 | 266,348 |
| 2.46%, 10/22/25 (a)(b) | 350,000 | 366,775 |
| 3.37%, 01/23/26 (a)(b) | 450,000 | 483,606 |
| 2.02%, 02/13/26 (a)(b) | 250,000 | 257,465 |
| 4.45%, 03/03/26 | 600,000 | 677,214 |
| 3.50%, 04/19/26 | 500,000 | 550,825 |
| 1.32%, 06/19/26 (a)(b) | 600,000 | 602,286 |
| 4.25%, 10/22/26 | 250,000 | 283,952 |
| 1.20%, 10/24/26 (a)(b) | 700,000 | 697,466 |
| 1.66%, 03/11/27 (a)(b) | 500,000 | 505,830 |
| 3.56%, 04/23/27 (a)(b) | 750,000 | 822,915 |
| 1.73%, 07/22/27 (a)(b) | 1,000,000 | 1,013,840 |
| 3.25%, 10/21/27 (a) | 650,000 | 709,618 |
| 4.18%, 11/25/27 (a) | 350,000 | 393,631 |
| 3.82%, 01/20/28 (a)(b) | 400,000 | 445,524 |
| 3.71%, 04/24/28 (a)(b) | 500,000 | 554,615 |
| 3.59%, 07/21/28 (a)(b) | 400,000 | 442,596 |
| 3.42%, 12/20/28 (a)(b) | 1,200,000 | 1,319,076 |
| 3.97%, 03/05/29 (a)(b) | 500,000 | 563,950 |
| 2.09%, 06/14/29 (a)(b) | 500,000 | 507,705 |
| 4.27%, 07/23/29 (a)(b) | 550,000 | 632,241 |
| 3.97%, 02/07/30 (a)(b) | 500,000 | 568,155 |
| 3.19%, 07/23/30 (a)(b) | 400,000 | 432,968 |
| 2.88%, 10/22/30 (a)(b) | 350,000 | 370,856 |
| 2.50%, 02/13/31 (a)(b) | 800,000 | 823,576 |
| 2.59%, 04/29/31 (a)(b) | 700,000 | 725,256 |
| 1.90%, 07/23/31 (a)(b) | 600,000 | 588,156 |
| 1.92%, 10/24/31 (a)(b) | 500,000 | 490,235 |
| 2.65%, 03/11/32 (a)(b) | 500,000 | 518,695 |
| 2.69%, 04/22/32 (a)(b) | 950,000 | 989,102 |
| 2.30%, 07/21/32 (a)(b) | 750,000 | 755,025 |
| 6.11%, 01/29/37 | 400,000 | 551,384 |
| 4.24%, 04/24/38 (a)(b) | 450,000 | 534,514 |
| 7.75%, 05/14/38 | 320,000 | 507,728 |
| 4.08%, 04/23/40 (a)(b) | 350,000 | 412,702 |
| 2.68%, 06/19/41 (a)(b) | 1,050,000 | 1,035,667 |
| 5.88%, 02/07/42 | 300,000 | 438,693 |
Schwab Taxable Bond Funds | Annual Report
Schwab U.S. Aggregate Bond Index Fund
Portfolio Holdings as of August 31, 2021 (continued)
Security
Rate, Maturity Date | Face
Amount ($) | Value ($) |
| 3.31%, 04/22/42 (a)(b) | 750,000 | 811,230 |
| 5.00%, 01/21/44 | 450,000 | 604,822 |
| 4.88%, 04/01/44 | 100,000 | 132,366 |
| 4.75%, 04/21/45 | 100,000 | 127,428 |
| 4.44%, 01/20/48 (a)(b) | 350,000 | 442,687 |
| 3.95%, 01/23/49 (a)(b) | 200,000 | 235,942 |
| 4.33%, 03/15/50 (a)(b) | 550,000 | 688,556 |
| 4.08%, 03/20/51 (a)(b) | 1,200,000 | 1,452,600 |
| 2.83%, 10/24/51 (a)(b) | 250,000 | 246,060 |
| 3.48%, 03/13/52 (a)(b) | 250,000 | 277,922 |
| 2.97%, 07/21/52 (a)(b) | 500,000 | 505,140 |
| Bank of America NA |
| 6.00%, 10/15/36 | 418,000 | 583,624 |
| Bank of Montreal |
| 2.35%, 09/11/22 | 250,000 | 255,563 |
| 2.55%, 11/06/22 (a) | 250,000 | 256,343 |
| 0.45%, 12/08/23 | 100,000 | 100,115 |
| 3.30%, 02/05/24 | 250,000 | 266,750 |
| 2.50%, 06/28/24 | 200,000 | 210,562 |
| 0.63%, 07/09/24 | 250,000 | 250,028 |
| 1.85%, 05/01/25 | 350,000 | 361,893 |
| 0.95%, 01/22/27 (a)(b) | 350,000 | 346,629 |
| 4.34%, 10/05/28 (a)(b) | 250,000 | 267,440 |
| 3.80%, 12/15/32 (a)(b) | 200,000 | 221,344 |
| BankUnited, Inc. |
| 4.88%, 11/17/25 (a) | 100,000 | 113,911 |
| 5.13%, 06/11/30 (a) | 100,000 | 116,907 |
| Barclays Bank PLC |
| 3.75%, 05/15/24 | 200,000 | 217,012 |
| Barclays PLC |
| 3.68%, 01/10/23 (a) | 250,000 | 252,943 |
| 4.34%, 05/16/24 (a)(b) | 200,000 | 212,306 |
| 4.38%, 09/11/24 | 200,000 | 218,514 |
| 1.01%, 12/10/24 (a)(b) | 250,000 | 251,225 |
| 3.65%, 03/16/25 | 350,000 | 379,596 |
| 3.93%, 05/07/25 (a)(b) | 600,000 | 646,746 |
| 4.38%, 01/12/26 | 500,000 | 562,805 |
| 2.85%, 05/07/26 (a)(b) | 350,000 | 370,321 |
| 5.20%, 05/12/26 | 500,000 | 575,480 |
| 4.34%, 01/10/28 (a) | 200,000 | 225,402 |
| 4.84%, 05/09/28 (a) | 450,000 | 510,246 |
| 4.97%, 05/16/29 (a)(b) | 250,000 | 294,147 |
| 5.09%, 06/20/30 (a)(b) | 300,000 | 350,616 |
| 2.65%, 06/24/31 (a)(b) | 300,000 | 306,333 |
| 2.67%, 03/10/32 (a)(b) | 200,000 | 203,514 |
| 3.56%, 09/23/35 (a)(b) | 350,000 | 367,489 |
| 3.81%, 03/10/42 (a)(b) | 200,000 | 217,556 |
| 5.25%, 08/17/45 | 200,000 | 272,114 |
| 4.95%, 01/10/47 | 400,000 | 527,692 |
| BBVA USA |
| 3.88%, 04/10/25 (a) | 250,000 | 275,570 |
| BNP Paribas S.A. |
| 3.25%, 03/03/23 | 95,000 | 99,366 |
| 4.25%, 10/15/24 | 200,000 | 219,594 |
| BPCE S.A. |
| 4.00%, 04/15/24 | 250,000 | 272,538 |
| 3.38%, 12/02/26 | 250,000 | 274,224 |
| Canadian Imperial Bank of Commerce |
| 0.95%, 06/23/23 | 250,000 | 252,355 |
| 3.50%, 09/13/23 | 350,000 | 372,330 |
| 0.50%, 12/14/23 | 200,000 | 199,864 |
| 3.10%, 04/02/24 | 200,000 | 212,472 |
| 2.25%, 01/28/25 | 200,000 | 209,030 |
| 0.95%, 10/23/25 | 200,000 | 199,854 |
| 1.25%, 06/22/26 | 150,000 | 150,051 |
Security
Rate, Maturity Date | Face
Amount ($) | Value ($) |
| Capital One Bank USA NA |
| 3.38%, 02/15/23 | 250,000 | 260,575 |
| 2.28%, 01/28/26 (a)(b) | 350,000 | 364,231 |
| Capital One Financial Corp. |
| 3.20%, 01/30/23 (a) | 250,000 | 259,440 |
| 2.60%, 05/11/23 (a) | 250,000 | 258,908 |
| 3.50%, 06/15/23 | 250,000 | 263,453 |
| 3.90%, 01/29/24 (a) | 150,000 | 161,139 |
| 3.75%, 04/24/24 (a) | 400,000 | 430,692 |
| 3.30%, 10/30/24 (a) | 500,000 | 537,765 |
| 3.20%, 02/05/25 (a) | 250,000 | 268,963 |
| 4.20%, 10/29/25 (a) | 250,000 | 278,887 |
| 3.75%, 07/28/26 (a) | 250,000 | 276,650 |
| 3.75%, 03/09/27 (a) | 400,000 | 447,720 |
| 3.65%, 05/11/27 (a) | 250,000 | 279,192 |
| 3.80%, 01/31/28 (a) | 200,000 | 224,748 |
| Citibank NA |
| 3.65%, 01/23/24 (a) | 500,000 | 536,105 |
| Citigroup, Inc. |
| 2.70%, 10/27/22 (a) | 150,000 | 153,930 |
| 3.38%, 03/01/23 | 200,000 | 209,096 |
| 3.50%, 05/15/23 | 350,000 | 367,685 |
| 3.88%, 10/25/23 | 150,000 | 161,255 |
| 1.68%, 05/15/24 (a)(b) | 250,000 | 255,210 |
| 4.04%, 06/01/24 (a)(b) | 150,000 | 159,158 |
| 3.75%, 06/16/24 | 100,000 | 108,513 |
| 4.00%, 08/05/24 | 150,000 | 163,158 |
| 0.78%, 10/30/24 (a)(b) | 500,000 | 501,665 |
| 3.88%, 03/26/25 | 150,000 | 164,214 |
| 3.35%, 04/24/25 (a)(b) | 650,000 | 693,101 |
| 3.30%, 04/27/25 | 300,000 | 325,518 |
| 0.98%, 05/01/25 (a)(b) | 600,000 | 602,928 |
| 4.40%, 06/10/25 | 650,000 | 723,976 |
| 5.50%, 09/13/25 | 524,000 | 608,956 |
| 3.70%, 01/12/26 | 500,000 | 552,870 |
| 4.60%, 03/09/26 | 345,000 | 393,393 |
| 3.11%, 04/08/26 (a)(b) | 800,000 | 855,680 |
| 3.40%, 05/01/26 | 250,000 | 274,068 |
| 3.20%, 10/21/26 (a) | 850,000 | 925,658 |
| 4.30%, 11/20/26 | 150,000 | 170,193 |
| 1.12%, 01/28/27 (a)(b) | 500,000 | 496,390 |
| 1.46%, 06/09/27 (a)(b) | 400,000 | 400,876 |
| 4.45%, 09/29/27 | 680,000 | 779,654 |
| 3.89%, 01/10/28 (a)(b) | 650,000 | 724,873 |
| 3.67%, 07/24/28 (a)(b) | 550,000 | 609,851 |
| 4.13%, 07/25/28 | 450,000 | 509,238 |
| 3.52%, 10/27/28 (a)(b) | 700,000 | 770,056 |
| 4.08%, 04/23/29 (a)(b) | 450,000 | 510,691 |
| 3.98%, 03/20/30 (a)(b) | 550,000 | 625,421 |
| 2.98%, 11/05/30 (a)(b) | 300,000 | 319,659 |
| 2.67%, 01/29/31 (a)(b) | 600,000 | 624,348 |
| 4.41%, 03/31/31 (a)(b) | 800,000 | 938,864 |
| 2.57%, 06/03/31 (a)(b) | 800,000 | 827,096 |
| 2.56%, 05/01/32 (a)(b) | 650,000 | 669,636 |
| 6.63%, 06/15/32 | 200,000 | 273,888 |
| 5.88%, 02/22/33 | 100,000 | 131,806 |
| 6.00%, 10/31/33 | 150,000 | 200,403 |
| 6.13%, 08/25/36 | 100,000 | 139,695 |
| 3.88%, 01/24/39 (a)(b) | 200,000 | 232,510 |
| 8.13%, 07/15/39 | 270,000 | 465,885 |
| 5.32%, 03/26/41 (a)(b) | 450,000 | 609,930 |
| 5.88%, 01/30/42 | 130,000 | 188,555 |
| 6.68%, 09/13/43 | 200,000 | 312,122 |
| 5.30%, 05/06/44 | 200,000 | 271,434 |
| 4.65%, 07/30/45 | 180,000 | 234,740 |
| 4.75%, 05/18/46 | 430,000 | 553,552 |
Schwab Taxable Bond Funds | Annual Report
Schwab U.S. Aggregate Bond Index Fund
Portfolio Holdings as of August 31, 2021 (continued)
Security
Rate, Maturity Date | Face
Amount ($) | Value ($) |
| 4.28%, 04/24/48 (a)(b) | 150,000 | 189,624 |
| 4.65%, 07/23/48 (a) | 600,000 | 797,088 |
| Citizens Bank NA |
| 3.70%, 03/29/23 (a) | 250,000 | 262,068 |
| Citizens Financial Group, Inc. |
| 2.85%, 07/27/26 (a) | 150,000 | 160,497 |
| 3.25%, 04/30/30 (a) | 250,000 | 272,733 |
| 2.64%, 09/30/32 (a) | 200,000 | 203,948 |
| Comerica, Inc. |
| 3.70%, 07/31/23 (a) | 200,000 | 212,004 |
| 4.00%, 02/01/29 (a) | 250,000 | 289,340 |
| Cooperatieve Rabobank UA |
| 3.95%, 11/09/22 | 250,000 | 260,430 |
| 2.75%, 01/10/23 | 250,000 | 258,475 |
| 4.63%, 12/01/23 | 491,000 | 534,282 |
| 0.38%, 01/12/24 | 250,000 | 249,673 |
| 3.38%, 05/21/25 | 250,000 | 273,593 |
| 4.38%, 08/04/25 | 241,000 | 269,214 |
| 3.75%, 07/21/26 | 300,000 | 332,391 |
| 5.25%, 05/24/41 | 300,000 | 423,165 |
| 5.75%, 12/01/43 | 250,000 | 356,800 |
| 5.25%, 08/04/45 | 250,000 | 339,687 |
| Credit Suisse AG |
| 1.00%, 05/05/23 | 250,000 | 252,578 |
| 0.52%, 08/09/23 | 250,000 | 250,560 |
| 0.50%, 02/02/24 | 250,000 | 249,775 |
| 3.63%, 09/09/24 | 550,000 | 596,161 |
| 2.95%, 04/09/25 | 400,000 | 427,424 |
| 1.25%, 08/07/26 | 250,000 | 248,780 |
| Credit Suisse Group AG |
| 3.80%, 06/09/23 | 500,000 | 527,480 |
| 3.75%, 03/26/25 | 500,000 | 542,640 |
| 4.55%, 04/17/26 | 500,000 | 566,775 |
| 4.88%, 05/15/45 | 500,000 | 643,545 |
| Credit Suisse Group Funding Guernsey Ltd. |
| 3.80%, 09/15/22 | 500,000 | 517,780 |
| Credit Suisse USA, Inc. |
| 7.13%, 07/15/32 | 150,000 | 217,017 |
| Deutsche Bank AG |
| 3.30%, 11/16/22 | 250,000 | 258,335 |
| 3.95%, 02/27/23 | 400,000 | 419,136 |
| 0.90%, 05/28/24 | 300,000 | 300,288 |
| 3.70%, 05/30/24 | 300,000 | 321,225 |
| 2.22%, 09/18/24 (a)(b) | 350,000 | 359,236 |
| 3.96%, 11/26/25 (a)(b) | 350,000 | 380,198 |
| 4.10%, 01/13/26 | 250,000 | 274,762 |
| 2.13%, 11/24/26 (a)(b) | 500,000 | 510,835 |
| Deutsche Bank AG/New York NY |
| 3.55%, 09/18/31 (a)(b) | 350,000 | 378,185 |
| 3.04%, 05/28/32 (a)(b) | 300,000 | 309,621 |
| Discover Bank |
| 3.35%, 02/06/23 (a) | 500,000 | 519,780 |
| 2.45%, 09/12/24 (a) | 250,000 | 261,308 |
| 4.65%, 09/13/28 (a) | 500,000 | 587,370 |
| Discover Financial Services |
| 3.85%, 11/21/22 | 400,000 | 416,732 |
| 3.75%, 03/04/25 (a) | 150,000 | 163,040 |
| 4.10%, 02/09/27 (a) | 150,000 | 168,867 |
| Fifth Third Bancorp |
| 1.63%, 05/05/23 (a) | 175,000 | 178,479 |
| 3.65%, 01/25/24 (a) | 250,000 | 267,470 |
| 2.38%, 01/28/25 (a) | 250,000 | 261,740 |
| 2.55%, 05/05/27 (a) | 200,000 | 212,306 |
| 3.95%, 03/14/28 (a) | 250,000 | 288,250 |
| 8.25%, 03/01/38 | 250,000 | 421,215 |
Security
Rate, Maturity Date | Face
Amount ($) | Value ($) |
| Fifth Third Bank |
| 3.85%, 03/15/26 (a) | 200,000 | 222,580 |
| 2.25%, 02/01/27 (a) | 250,000 | 262,753 |
| First Horizon Bank |
| 5.75%, 05/01/30 (a) | 250,000 | 310,110 |
| First Horizon Corp. |
| 3.55%, 05/26/23 (a) | 200,000 | 209,592 |
| 4.00%, 05/26/25 (a) | 150,000 | 164,853 |
| First Republic Bank |
| 4.63%, 02/13/47 (a) | 250,000 | 324,387 |
| Goldman Sachs Capital l |
| 6.35%, 02/15/34 | 150,000 | 213,161 |
| HSBC Bank USA NA |
| 5.88%, 11/01/34 | 250,000 | 331,022 |
| 7.00%, 01/15/39 | 250,000 | 392,837 |
| HSBC Holdings PLC |
| 3.60%, 05/25/23 | 400,000 | 422,016 |
| 3.03%, 11/22/23 (a)(b) | 200,000 | 206,508 |
| 4.25%, 03/14/24 | 500,000 | 539,405 |
| 3.95%, 05/18/24 (a)(b) | 400,000 | 422,944 |
| 3.80%, 03/11/25 (a)(b) | 450,000 | 482,490 |
| 0.98%, 05/24/25 (a)(b) | 500,000 | 500,525 |
| 4.25%, 08/18/25 | 200,000 | 221,290 |
| 2.63%, 11/07/25 (a)(b) | 400,000 | 418,752 |
| 4.30%, 03/08/26 | 600,000 | 676,290 |
| 1.65%, 04/18/26 (a)(b) | 625,000 | 632,912 |
| 3.90%, 05/25/26 | 650,000 | 722,995 |
| 2.10%, 06/04/26 (a)(b) | 300,000 | 308,547 |
| 4.29%, 09/12/26 (a)(b) | 400,000 | 444,488 |
| 4.38%, 11/23/26 | 309,000 | 348,017 |
| 1.59%, 05/24/27 (a)(b) | 550,000 | 552,101 |
| 4.04%, 03/13/28 (a)(b) | 400,000 | 446,352 |
| 2.01%, 09/22/28 (a)(b) | 350,000 | 353,640 |
| 4.58%, 06/19/29 (a)(b) | 600,000 | 693,642 |
| 2.21%, 08/17/29 (a)(b) | 400,000 | 403,376 |
| 4.95%, 03/31/30 | 400,000 | 483,988 |
| 3.97%, 05/22/30 (a)(b) | 650,000 | 729,917 |
| 2.85%, 06/04/31 (a)(b) | 250,000 | 261,215 |
| 2.36%, 08/18/31 (a)(b) | 450,000 | 452,362 |
| 7.63%, 05/17/32 | 200,000 | 283,972 |
| 2.80%, 05/24/32 (a)(b) | 500,000 | 516,570 |
| 6.50%, 05/02/36 | 200,000 | 278,046 |
| 6.50%, 09/15/37 | 505,000 | 708,222 |
| 6.80%, 06/01/38 | 400,000 | 578,080 |
| 6.10%, 01/14/42 | 200,000 | 295,414 |
| 5.25%, 03/14/44 | 400,000 | 531,316 |
| HSBC USA, Inc. |
| 3.50%, 06/23/24 | 150,000 | 161,723 |
| Huntington Bancshares, Inc. |
| 2.63%, 08/06/24 (a) | 200,000 | 210,510 |
| 2.55%, 02/04/30 (a) | 200,000 | 210,632 |
| 2.49%, 08/15/36 (a)(b)(c) | 250,000 | 250,688 |
| ING Groep N.V. |
| 4.10%, 10/02/23 | 300,000 | 322,146 |
| 3.55%, 04/09/24 | 200,000 | 215,000 |
| 3.95%, 03/29/27 | 200,000 | 225,374 |
| 1.73%, 04/01/27 (a)(b) | 300,000 | 304,188 |
| 4.55%, 10/02/28 | 300,000 | 353,739 |
| 4.05%, 04/09/29 | 200,000 | 230,440 |
| 2.73%, 04/01/32 (a)(b) | 200,000 | 208,224 |
| JPMorgan Chase & Co. |
| 3.25%, 09/23/22 | 580,000 | 598,792 |
| 2.97%, 01/15/23 (a) | 500,000 | 505,030 |
| 3.20%, 01/25/23 | 563,000 | 586,303 |
| 3.38%, 05/01/23 | 450,000 | 471,672 |
| 2.70%, 05/18/23 (a) | 300,000 | 311,181 |
Schwab Taxable Bond Funds | Annual Report
Schwab U.S. Aggregate Bond Index Fund
Portfolio Holdings as of August 31, 2021 (continued)
Security
Rate, Maturity Date | Face
Amount ($) | Value ($) |
| 3.88%, 02/01/24 | 250,000 | 270,240 |
| 0.70%, 03/16/24 (a)(b) | 400,000 | 401,428 |
| 3.56%, 04/23/24 (a)(b) | 250,000 | 262,623 |
| 3.63%, 05/13/24 | 250,000 | 270,343 |
| 1.51%, 06/01/24 (a)(b) | 400,000 | 407,488 |
| 3.80%, 07/23/24 (a)(b) | 450,000 | 477,576 |
| 3.88%, 09/10/24 | 700,000 | 762,083 |
| 0.65%, 09/16/24 (a)(b) | 400,000 | 401,244 |
| 4.02%, 12/05/24 (a)(b) | 450,000 | 483,556 |
| 3.13%, 01/23/25 (a) | 745,000 | 798,014 |
| 0.56%, 02/16/25 (a)(b) | 300,000 | 299,250 |
| 3.22%, 03/01/25 (a)(b) | 250,000 | 265,270 |
| 0.82%, 06/01/25 (a)(b) | 250,000 | 250,418 |
| 0.97%, 06/23/25 (a)(b) | 500,000 | 501,810 |
| 3.90%, 07/15/25 (a) | 450,000 | 496,179 |
| 0.77%, 08/09/25 (a)(b) | 250,000 | 249,550 |
| 2.30%, 10/15/25 (a)(b) | 600,000 | 624,720 |
| 2.01%, 03/13/26 (a)(b) | 500,000 | 515,860 |
| 3.30%, 04/01/26 (a) | 635,000 | 693,496 |
| 2.08%, 04/22/26 (a)(b) | 700,000 | 723,240 |
| 3.20%, 06/15/26 (a) | 250,000 | 272,245 |
| 2.95%, 10/01/26 (a) | 550,000 | 593,147 |
| 1.05%, 11/19/26 (a)(b) | 700,000 | 693,959 |
| 4.13%, 12/15/26 | 450,000 | 511,267 |
| 3.96%, 01/29/27 (a)(b) | 500,000 | 556,630 |
| 1.04%, 02/04/27 (a)(b) | 650,000 | 642,187 |
| 1.58%, 04/22/27 (a)(b) | 750,000 | 757,177 |
| 8.00%, 04/29/27 | 150,000 | 201,228 |
| 4.25%, 10/01/27 | 250,000 | 287,202 |
| 3.63%, 12/01/27 (a) | 150,000 | 165,048 |
| 3.78%, 02/01/28 (a)(b) | 500,000 | 556,820 |
| 3.54%, 05/01/28 (a)(b) | 450,000 | 496,143 |
| 2.18%, 06/01/28 (a)(b) | 300,000 | 309,996 |
| 3.51%, 01/23/29 (a)(b) | 550,000 | 608,096 |
| 4.01%, 04/23/29 (a)(b) | 300,000 | 340,692 |
| 2.07%, 06/01/29 (a)(b) | 450,000 | 456,444 |
| 4.20%, 07/23/29 (a)(b) | 650,000 | 747,903 |
| 4.45%, 12/05/29 (a)(b) | 450,000 | 526,576 |
| 3.70%, 05/06/30 (a)(b) | 450,000 | 504,265 |
| 8.75%, 09/01/30 | 50,000 | 76,060 |
| 2.74%, 10/15/30 (a)(b) | 750,000 | 790,395 |
| 4.49%, 03/24/31 (a)(b) | 650,000 | 771,355 |
| 2.52%, 04/22/31 (a)(b) | 750,000 | 777,547 |
| 2.96%, 05/13/31 (a)(b) | 700,000 | 741,629 |
| 1.76%, 11/19/31 (a)(b) | 250,000 | 242,620 |
| 1.95%, 02/04/32 (a)(b) | 750,000 | 737,055 |
| 2.58%, 04/22/32 (a)(b) | 700,000 | 724,514 |
| 6.40%, 05/15/38 | 650,000 | 964,840 |
| 3.88%, 07/24/38 (a)(b) | 400,000 | 465,368 |
| 5.50%, 10/15/40 | 230,000 | 320,873 |
| 3.11%, 04/22/41 (a)(b) | 250,000 | 263,958 |
| 5.60%, 07/15/41 | 350,000 | 492,919 |
| 2.53%, 11/19/41 (a)(b) | 400,000 | 389,152 |
| 5.40%, 01/06/42 | 300,000 | 420,000 |
| 3.16%, 04/22/42 (a)(b) | 400,000 | 425,872 |
| 5.63%, 08/16/43 | 250,000 | 352,890 |
| 4.85%, 02/01/44 | 100,000 | 133,130 |
| 4.95%, 06/01/45 | 450,000 | 602,023 |
| 4.26%, 02/22/48 (a)(b) | 350,000 | 432,782 |
| 4.03%, 07/24/48 (a)(b) | 250,000 | 298,705 |
| 3.96%, 11/15/48 (a)(b) | 800,000 | 949,848 |
| 3.90%, 01/23/49 (a)(b) | 400,000 | 469,704 |
| 3.11%, 04/22/51 (a)(b) | 400,000 | 419,680 |
| 3.33%, 04/22/52 (a)(b) | 750,000 | 816,532 |
| KeyBank NA |
| 2.30%, 09/14/22 | 250,000 | 255,368 |
| 3.38%, 03/07/23 | 250,000 | 261,515 |
| 1.25%, 03/10/23 | 250,000 | 253,588 |
Security
Rate, Maturity Date | Face
Amount ($) | Value ($) |
| 0.42%, 01/03/24 (a)(b) | 250,000 | 250,150 |
| 3.40%, 05/20/26 | 250,000 | 273,845 |
| 3.90%, 04/13/29 | 250,000 | 282,865 |
| KeyCorp |
| 4.15%, 10/29/25 | 150,000 | 168,744 |
| 4.10%, 04/30/28 | 150,000 | 173,714 |
| 2.55%, 10/01/29 | 150,000 | 158,169 |
| Lloyds Bank PLC |
| 3.50%, 05/14/25 | 200,000 | 217,376 |
| Lloyds Banking Group PLC |
| 4.05%, 08/16/23 | 400,000 | 427,224 |
| 2.91%, 11/07/23 (a)(b) | 450,000 | 462,555 |
| 3.90%, 03/12/24 | 250,000 | 269,990 |
| 0.70%, 05/11/24 (a)(b) | 200,000 | 200,720 |
| 4.50%, 11/04/24 | 200,000 | 220,962 |
| 4.45%, 05/08/25 | 200,000 | 224,032 |
| 3.87%, 07/09/25 (a)(b) | 400,000 | 432,440 |
| 4.58%, 12/10/25 | 200,000 | 225,482 |
| 2.44%, 02/05/26 (a)(b) | 200,000 | 208,536 |
| 4.65%, 03/24/26 | 524,000 | 594,143 |
| 3.75%, 01/11/27 | 400,000 | 443,668 |
| 4.38%, 03/22/28 | 300,000 | 345,441 |
| 4.55%, 08/16/28 | 200,000 | 233,746 |
| 3.57%, 11/07/28 (a)(b) | 200,000 | 219,776 |
| 5.30%, 12/01/45 | 200,000 | 267,726 |
| 4.34%, 01/09/48 | 300,000 | 360,513 |
| Manufacturers & Traders Trust Co. |
| 2.90%, 02/06/25 (a) | 250,000 | 267,348 |
| Mitsubishi UFJ Financial Group, Inc. |
| 3.46%, 03/02/23 | 250,000 | 261,695 |
| 3.76%, 07/26/23 | 250,000 | 265,890 |
| 3.41%, 03/07/24 | 550,000 | 588,208 |
| 2.80%, 07/18/24 | 200,000 | 211,528 |
| 0.85%, 09/15/24 (a)(b) | 750,000 | 753,870 |
| 2.19%, 02/25/25 | 650,000 | 676,266 |
| 1.41%, 07/17/25 | 350,000 | 354,375 |
| 0.95%, 07/19/25 (a)(b) | 400,000 | 401,668 |
| 3.85%, 03/01/26 | 550,000 | 614,042 |
| 2.76%, 09/13/26 | 200,000 | 213,340 |
| 3.68%, 02/22/27 | 200,000 | 223,602 |
| 1.54%, 07/20/27 (a)(b) | 250,000 | 251,568 |
| 3.29%, 07/25/27 | 250,000 | 277,022 |
| 3.96%, 03/02/28 | 250,000 | 284,702 |
| 4.05%, 09/11/28 | 250,000 | 287,715 |
| 3.74%, 03/07/29 | 300,000 | 338,871 |
| 3.20%, 07/18/29 | 200,000 | 217,852 |
| 2.56%, 02/25/30 | 200,000 | 208,800 |
| 2.05%, 07/17/30 | 450,000 | 451,179 |
| 2.31%, 07/20/32 (a)(b) | 400,000 | 403,976 |
| 4.15%, 03/07/39 | 300,000 | 361,119 |
| 3.75%, 07/18/39 | 200,000 | 230,404 |
| Mizuho Financial Group, Inc. |
| 2.60%, 09/11/22 | 250,000 | 255,975 |
| 1.24%, 07/10/24 (a)(b) | 250,000 | 253,023 |
| 0.85%, 09/08/24 (a)(b) | 375,000 | 376,789 |
| 3.92%, 09/11/24 (a)(b) | 250,000 | 266,528 |
| 2.56%, 09/13/25 (a)(b) | 200,000 | 209,788 |
| 2.23%, 05/25/26 (a)(b) | 200,000 | 207,260 |
| 3.66%, 02/28/27 | 200,000 | 222,460 |
| 1.23%, 05/22/27 (a)(b) | 250,000 | 247,998 |
| 1.55%, 07/09/27 (a)(b) | 250,000 | 251,638 |
| 3.17%, 09/11/27 | 300,000 | 326,754 |
| 4.02%, 03/05/28 | 200,000 | 229,240 |
| 3.15%, 07/16/30 (a)(b) | 200,000 | 216,264 |
| 2.87%, 09/13/30 (a)(b) | 200,000 | 211,582 |
| 2.20%, 07/10/31 (a)(b) | 250,000 | 250,875 |
Schwab Taxable Bond Funds | Annual Report
Schwab U.S. Aggregate Bond Index Fund
Portfolio Holdings as of August 31, 2021 (continued)
Security
Rate, Maturity Date | Face
Amount ($) | Value ($) |
| 1.98%, 09/08/31 (a)(b) | 250,000 | 246,163 |
| 2.17%, 05/22/32 (a)(b) | 250,000 | 249,193 |
| 2.26%, 07/09/32 (a)(b) | 200,000 | 199,987 |
| Morgan Stanley |
| 4.88%, 11/01/22 | 250,000 | 262,860 |
| 3.13%, 01/23/23 | 350,000 | 363,517 |
| 3.75%, 02/25/23 | 500,000 | 525,025 |
| 4.10%, 05/22/23 | 600,000 | 636,282 |
| 0.56%, 11/10/23 (a)(b) | 300,000 | 300,519 |
| 0.53%, 01/25/24 (a)(b) | 750,000 | 750,757 |
| 0.73%, 04/05/24 (a)(b) | 250,000 | 250,923 |
| 3.74%, 04/24/24 (a)(b) | 800,000 | 842,224 |
| 3.88%, 04/29/24 | 750,000 | 812,295 |
| 3.70%, 10/23/24 | 500,000 | 544,640 |
| 0.79%, 01/22/25 (a)(b) | 250,000 | 250,400 |
| 0.79%, 05/30/25 (a)(b) | 500,000 | 499,160 |
| 2.72%, 07/22/25 (a)(b) | 350,000 | 367,955 |
| 4.00%, 07/23/25 | 524,000 | 581,399 |
| 0.86%, 10/21/25 (a)(b) | 750,000 | 750,495 |
| 5.00%, 11/24/25 | 324,000 | 373,170 |
| 3.88%, 01/27/26 | 500,000 | 557,575 |
| 2.19%, 04/28/26 (a)(b) | 700,000 | 727,503 |
| 3.13%, 07/27/26 | 500,000 | 542,770 |
| 6.25%, 08/09/26 | 412,000 | 507,053 |
| 4.35%, 09/08/26 | 300,000 | 340,893 |
| 0.99%, 12/10/26 (a)(b) | 500,000 | 494,175 |
| 3.63%, 01/20/27 | 450,000 | 500,724 |
| 3.95%, 04/23/27 | 500,000 | 561,990 |
| 1.59%, 05/04/27 (a)(b) | 700,000 | 707,189 |
| 1.51%, 07/20/27 (a)(b) | 500,000 | 502,280 |
| 3.59%, 07/22/28 (a)(b) | 650,000 | 722,455 |
| 3.77%, 01/24/29 (a)(b) | 650,000 | 727,506 |
| 4.43%, 01/23/30 (a)(b) | 600,000 | 701,688 |
| 2.70%, 01/22/31 (a)(b) | 750,000 | 786,322 |
| 3.62%, 04/01/31 (a)(b) | 500,000 | 560,675 |
| 1.79%, 02/13/32 (a)(b) | 600,000 | 581,634 |
| 7.25%, 04/01/32 | 330,000 | 483,255 |
| 1.93%, 04/28/32 (a)(b) | 500,000 | 489,080 |
| 2.24%, 07/21/32 (a)(b) | 750,000 | 752,580 |
| 3.97%, 07/22/38 (a)(b) | 450,000 | 527,683 |
| 4.46%, 04/22/39 (a)(b) | 250,000 | 310,105 |
| 3.22%, 04/22/42 (a)(b) | 400,000 | 429,444 |
| 6.38%, 07/24/42 | 500,000 | 772,595 |
| 4.30%, 01/27/45 | 555,000 | 693,028 |
| 4.38%, 01/22/47 | 450,000 | 570,411 |
| 5.60%, 03/24/51 (a)(b) | 550,000 | 831,094 |
| 2.80%, 01/25/52 (a)(b) | 250,000 | 249,365 |
| National Australia Bank Ltd. |
| 2.88%, 04/12/23 | 250,000 | 260,383 |
| 3.38%, 01/14/26 | 250,000 | 275,684 |
| 2.50%, 07/12/26 | 500,000 | 534,495 |
| National Bank of Canada |
| 2.10%, 02/01/23 | 250,000 | 256,065 |
| 0.55%, 11/15/24 (a)(b) | 250,000 | 249,660 |
| Natwest Group PLC |
| 3.88%, 09/12/23 | 400,000 | 425,656 |
| 6.00%, 12/19/23 | 550,000 | 612,909 |
| 2.36%, 05/22/24 (a)(b) | 200,000 | 205,620 |
| 5.13%, 05/28/24 | 350,000 | 387,712 |
| 4.52%, 06/25/24 (a)(b) | 200,000 | 213,564 |
| 4.27%, 03/22/25 (a)(b) | 450,000 | 487,552 |
| 4.80%, 04/05/26 | 350,000 | 401,040 |
| 1.64%, 06/14/27 (a)(b) | 300,000 | 301,269 |
| 3.07%, 05/22/28 (a)(b) | 200,000 | 213,490 |
| 4.89%, 05/18/29 (a)(b) | 500,000 | 588,515 |
| 3.75%, 11/01/29 (a)(b) | 200,000 | 212,730 |
| 5.08%, 01/27/30 (a)(b) | 200,000 | 239,590 |
Security
Rate, Maturity Date | Face
Amount ($) | Value ($) |
| 4.45%, 05/08/30 (a)(b) | 200,000 | 231,594 |
| 3.03%, 11/28/35 (a)(b) | 250,000 | 251,608 |
| Northern Trust Corp. |
| 3.95%, 10/30/25 | 250,000 | 281,897 |
| 3.65%, 08/03/28 (a) | 100,000 | 114,090 |
| 3.15%, 05/03/29 (a) | 100,000 | 110,887 |
| 1.95%, 05/01/30 (a) | 200,000 | 204,186 |
| People's United Bank NA |
| 4.00%, 07/15/24 (a) | 250,000 | 267,933 |
| PNC Bank NA |
| 2.70%, 11/01/22 (a) | 250,000 | 256,605 |
| 2.95%, 01/30/23 (a) | 400,000 | 413,868 |
| 2.95%, 02/23/25 (a) | 250,000 | 268,193 |
| 3.25%, 06/01/25 (a) | 250,000 | 271,788 |
| 3.25%, 01/22/28 (a) | 250,000 | 277,097 |
| 4.05%, 07/26/28 | 250,000 | 289,730 |
| 2.70%, 10/22/29 | 250,000 | 266,818 |
| Regions Financial Corp. |
| 2.25%, 05/18/25 (a) | 200,000 | 208,952 |
| 1.80%, 08/12/28 (a) | 250,000 | 249,953 |
| 7.38%, 12/10/37 | 100,000 | 154,977 |
| Royal Bank of Canada |
| 1.95%, 01/17/23 | 200,000 | 204,652 |
| 1.60%, 04/17/23 | 300,000 | 306,393 |
| 3.70%, 10/05/23 | 350,000 | 373,933 |
| 0.50%, 10/26/23 | 500,000 | 501,145 |
| 0.43%, 01/19/24 | 500,000 | 499,290 |
| 2.55%, 07/16/24 | 150,000 | 158,249 |
| 2.25%, 11/01/24 | 200,000 | 209,806 |
| 1.15%, 06/10/25 | 350,000 | 352,394 |
| 0.88%, 01/20/26 | 400,000 | 397,052 |
| 4.65%, 01/27/26 | 150,000 | 171,897 |
| 1.20%, 04/27/26 | 200,000 | 200,422 |
| Santander Holdings USA, Inc. |
| 3.40%, 01/18/23 (a) | 200,000 | 207,356 |
| 3.50%, 06/07/24 (a) | 200,000 | 213,478 |
| 3.45%, 06/02/25 (a) | 200,000 | 214,810 |
| 4.50%, 07/17/25 (a) | 300,000 | 332,514 |
| 3.24%, 10/05/26 (a)(c) | 150,000 | 160,836 |
| 4.40%, 07/13/27 (a) | 150,000 | 169,380 |
| Santander UK Group Holdings PLC |
| 3.37%, 01/05/24 (a)(b) | 300,000 | 310,944 |
| 4.80%, 11/15/24 (a)(b) | 200,000 | 217,498 |
| 1.09%, 03/15/25 (a)(b) | 300,000 | 301,140 |
| 1.53%, 08/21/26 (a)(b) | 400,000 | 401,924 |
| 1.67%, 06/14/27 (a)(b) | 300,000 | 300,819 |
| 3.82%, 11/03/28 (a)(b) | 250,000 | 276,185 |
| Santander UK PLC |
| 4.00%, 03/13/24 | 200,000 | 217,132 |
| 2.88%, 06/18/24 | 200,000 | 212,182 |
| State Street Corp. |
| 3.10%, 05/15/23 | 200,000 | 209,434 |
| 3.78%, 12/03/24 (a)(b) | 200,000 | 214,976 |
| 3.30%, 12/16/24 | 300,000 | 326,016 |
| 2.35%, 11/01/25 (a)(b) | 200,000 | 210,282 |
| 2.90%, 03/30/26 (a)(b) | 200,000 | 213,678 |
| 2.65%, 05/19/26 | 250,000 | 268,528 |
| 4.14%, 12/03/29 (a)(b) | 250,000 | 293,920 |
| 2.40%, 01/24/30 | 100,000 | 105,407 |
| 2.20%, 03/03/31 | 200,000 | 204,400 |
| 3.15%, 03/30/31 (a)(b) | 100,000 | 110,808 |
| Sumitomo Mitsui Banking Corp. |
| 3.95%, 01/10/24 | 250,000 | 269,883 |
Schwab Taxable Bond Funds | Annual Report
Schwab U.S. Aggregate Bond Index Fund
Portfolio Holdings as of August 31, 2021 (continued)
Security
Rate, Maturity Date | Face
Amount ($) | Value ($) |
| Sumitomo Mitsui Financial Group, Inc. |
| 2.78%, 10/18/22 | 250,000 | 257,135 |
| 3.10%, 01/17/23 | 750,000 | 778,777 |
| 3.75%, 07/19/23 | 200,000 | 212,546 |
| 0.51%, 01/12/24 | 200,000 | 199,666 |
| 2.70%, 07/16/24 | 450,000 | 474,394 |
| 2.45%, 09/27/24 | 200,000 | 210,020 |
| 2.35%, 01/15/25 | 200,000 | 209,014 |
| 1.47%, 07/08/25 | 500,000 | 507,265 |
| 3.78%, 03/09/26 | 600,000 | 669,348 |
| 2.63%, 07/14/26 | 400,000 | 426,468 |
| 3.01%, 10/19/26 | 250,000 | 270,883 |
| 3.45%, 01/11/27 | 200,000 | 220,990 |
| 3.36%, 07/12/27 | 200,000 | 220,658 |
| 3.35%, 10/18/27 | 250,000 | 275,910 |
| 3.94%, 07/19/28 | 250,000 | 285,817 |
| 4.31%, 10/16/28 | 250,000 | 292,277 |
| 3.04%, 07/16/29 | 600,000 | 645,744 |
| 3.20%, 09/17/29 | 100,000 | 107,163 |
| 2.72%, 09/27/29 | 200,000 | 210,926 |
| 2.75%, 01/15/30 | 200,000 | 211,940 |
| 2.13%, 07/08/30 | 300,000 | 302,082 |
| 2.14%, 09/23/30 | 250,000 | 245,353 |
| 1.71%, 01/12/31 | 200,000 | 194,740 |
| SVB Financial Group |
| 3.13%, 06/05/30 (a) | 200,000 | 216,770 |
| 1.80%, 02/02/31 (a) | 100,000 | 96,828 |
| Svenska Handelsbanken AB |
| 3.90%, 11/20/23 | 250,000 | 269,848 |
| Synchrony Financial |
| 4.38%, 03/19/24 (a) | 150,000 | 162,500 |
| 4.25%, 08/15/24 (a) | 300,000 | 325,842 |
| 4.50%, 07/23/25 (a) | 250,000 | 278,367 |
| 3.95%, 12/01/27 (a) | 200,000 | 223,298 |
| 5.15%, 03/19/29 (a) | 150,000 | 178,320 |
| Synovus Financial Corp. |
| 3.13%, 11/01/22 (a) | 50,000 | 51,230 |
| The Bank of New York Mellon Corp. |
| 1.95%, 08/23/22 | 200,000 | 203,536 |
| 2.95%, 01/29/23 (a) | 250,000 | 258,990 |
| 3.50%, 04/28/23 | 200,000 | 210,676 |
| 2.20%, 08/16/23 (a) | 250,000 | 258,630 |
| 0.35%, 12/07/23 (a) | 200,000 | 200,060 |
| 3.65%, 02/04/24 (a) | 500,000 | 536,935 |
| 3.25%, 09/11/24 (a) | 200,000 | 215,374 |
| 2.10%, 10/24/24 | 200,000 | 209,424 |
| 1.60%, 04/24/25 (a) | 250,000 | 257,003 |
| 0.75%, 01/28/26 (a) | 500,000 | 496,970 |
| 2.80%, 05/04/26 (a) | 200,000 | 215,662 |
| 2.45%, 08/17/26 (a) | 150,000 | 159,518 |
| 3.25%, 05/16/27 (a) | 250,000 | 275,825 |
| 3.44%, 02/07/28 (a)(b) | 150,000 | 166,115 |
| 3.85%, 04/28/28 | 600,000 | 693,180 |
| 3.00%, 10/30/28 (a) | 150,000 | 164,831 |
| The Bank of Nova Scotia |
| 2.45%, 09/19/22 | 200,000 | 204,722 |
| 2.00%, 11/15/22 | 200,000 | 204,246 |
| 1.95%, 02/01/23 | 200,000 | 204,718 |
| 1.63%, 05/01/23 | 500,000 | 511,165 |
| 0.55%, 09/15/23 | 350,000 | 351,127 |
| 3.40%, 02/11/24 | 150,000 | 160,175 |
| 0.70%, 04/15/24 | 250,000 | 250,595 |
| 2.20%, 02/03/25 | 200,000 | 209,064 |
| 1.30%, 06/11/25 | 400,000 | 404,904 |
| 4.50%, 12/16/25 | 150,000 | 170,055 |
| 1.05%, 03/02/26 | 200,000 | 199,052 |
Security
Rate, Maturity Date | Face
Amount ($) | Value ($) |
| 1.35%, 06/24/26 | 250,000 | 252,100 |
| 2.70%, 08/03/26 | 200,000 | 214,004 |
| The Goldman Sachs Group, Inc. |
| 3.63%, 01/22/23 | 400,000 | 418,432 |
| 0.48%, 01/27/23 (a) | 500,000 | 500,170 |
| 3.20%, 02/23/23 (a) | 350,000 | 363,737 |
| 0.63%, 11/17/23 (a)(b) | 750,000 | 751,230 |
| 3.63%, 02/20/24 (a) | 350,000 | 374,615 |
| 4.00%, 03/03/24 | 500,000 | 541,495 |
| 0.67%, 03/08/24 (a)(b) | 250,000 | 250,423 |
| 3.85%, 07/08/24 (a) | 724,000 | 782,912 |
| 0.66%, 09/10/24 (a)(b) | 200,000 | 199,878 |
| 3.50%, 01/23/25 (a) | 450,000 | 484,920 |
| 3.50%, 04/01/25 (a) | 600,000 | 649,830 |
| 3.75%, 05/22/25 (a) | 550,000 | 599,819 |
| 3.27%, 09/29/25 (a)(b) | 450,000 | 482,332 |
| 4.25%, 10/21/25 | 500,000 | 558,150 |
| 0.86%, 02/12/26 (a)(b) | 250,000 | 248,653 |
| 3.75%, 02/25/26 (a) | 400,000 | 442,256 |
| 3.50%, 11/16/26 (a) | 550,000 | 599,093 |
| 1.09%, 12/09/26 (a)(b) | 500,000 | 496,550 |
| 5.95%, 01/15/27 | 157,000 | 191,311 |
| 3.85%, 01/26/27 (a) | 600,000 | 663,942 |
| 1.43%, 03/09/27 (a)(b) | 650,000 | 651,976 |
| 1.54%, 09/10/27 (a)(b) | 600,000 | 602,880 |
| 3.69%, 06/05/28 (a)(b) | 650,000 | 722,637 |
| 3.81%, 04/23/29 (a)(b) | 450,000 | 504,603 |
| 4.22%, 05/01/29 (a)(b) | 700,000 | 802,774 |
| 2.60%, 02/07/30 (a) | 350,000 | 365,148 |
| 3.80%, 03/15/30 (a) | 600,000 | 677,268 |
| 1.99%, 01/27/32 (a)(b) | 500,000 | 490,690 |
| 2.62%, 04/22/32 (a)(b) | 700,000 | 722,113 |
| 2.38%, 07/21/32 (a)(b) | 900,000 | 910,413 |
| 6.13%, 02/15/33 | 150,000 | 203,817 |
| 6.45%, 05/01/36 | 100,000 | 141,705 |
| 6.75%, 10/01/37 | 1,200,000 | 1,750,884 |
| 4.02%, 10/31/38 (a)(b) | 600,000 | 703,380 |
| 4.41%, 04/23/39 (a)(b) | 300,000 | 368,445 |
| 6.25%, 02/01/41 | 500,000 | 743,160 |
| 3.21%, 04/22/42 (a)(b) | 400,000 | 423,328 |
| 2.91%, 07/21/42 (a)(b) | 350,000 | 354,627 |
| 4.80%, 07/08/44 (a) | 350,000 | 457,716 |
| 5.15%, 05/22/45 | 400,000 | 537,184 |
| 4.75%, 10/21/45 (a) | 500,000 | 660,785 |
| The Huntington National Bank |
| 3.55%, 10/06/23 (a) | 250,000 | 265,738 |
| The PNC Financial Services Group, Inc. |
| 2.85%, 11/09/22 | 200,000 | 206,220 |
| 3.50%, 01/23/24 (a) | 250,000 | 267,288 |
| 3.90%, 04/29/24 (a) | 500,000 | 541,090 |
| 2.20%, 11/01/24 (a) | 250,000 | 262,720 |
| 2.60%, 07/23/26 (a) | 100,000 | 107,132 |
| 3.15%, 05/19/27 (a) | 400,000 | 440,380 |
| 3.45%, 04/23/29 (a) | 350,000 | 391,058 |
| 2.55%, 01/22/30 (a) | 300,000 | 315,654 |
| 2.31%, 04/23/32 (a)(b) | 200,000 | 206,252 |
| The Toronto-Dominion Bank |
| 1.90%, 12/01/22 | 250,000 | 255,323 |
| 0.25%, 01/06/23 | 200,000 | 200,088 |
| 0.30%, 06/02/23 | 250,000 | 249,905 |
| 0.75%, 06/12/23 | 400,000 | 403,024 |
| 3.50%, 07/19/23 | 250,000 | 265,150 |
| 0.45%, 09/11/23 | 400,000 | 400,588 |
| 3.25%, 03/11/24 | 200,000 | 213,680 |
| 2.65%, 06/12/24 | 200,000 | 211,474 |
| 1.15%, 06/12/25 | 250,000 | 252,373 |
| 0.75%, 09/11/25 | 400,000 | 397,160 |
Schwab Taxable Bond Funds | Annual Report
Schwab U.S. Aggregate Bond Index Fund
Portfolio Holdings as of August 31, 2021 (continued)
Security
Rate, Maturity Date | Face
Amount ($) | Value ($) |
| 0.75%, 01/06/26 | 200,000 | 198,178 |
| 1.20%, 06/03/26 | 250,000 | 251,738 |
| 3.63%, 09/15/31 (a)(b) | 300,000 | 332,955 |
| Truist Bank |
| 3.69%, 08/02/24 (a)(b) | 500,000 | 531,835 |
| 2.15%, 12/06/24 (a) | 250,000 | 261,550 |
| 1.50%, 03/10/25 (a) | 300,000 | 307,191 |
| 3.63%, 09/16/25 (a) | 491,000 | 540,345 |
| 4.05%, 11/03/25 (a) | 400,000 | 449,264 |
| 2.25%, 03/11/30 (a) | 250,000 | 256,328 |
| Truist Financial Corp. |
| 2.20%, 03/16/23 (a) | 250,000 | 257,023 |
| 3.75%, 12/06/23 (a) | 100,000 | 107,260 |
| 2.50%, 08/01/24 (a) | 300,000 | 316,227 |
| 2.85%, 10/26/24 (a) | 300,000 | 320,436 |
| 4.00%, 05/01/25 (a) | 200,000 | 221,862 |
| 1.20%, 08/05/25 (a) | 200,000 | 202,744 |
| 1.27%, 03/02/27 (a)(b) | 200,000 | 200,686 |
| 1.13%, 08/03/27 (a) | 500,000 | 493,830 |
| 3.88%, 03/19/29 (a) | 100,000 | 114,348 |
| 1.89%, 06/07/29 (a)(b) | 250,000 | 253,380 |
| 1.95%, 06/05/30 (a) | 200,000 | 203,330 |
| US Bancorp |
| 3.70%, 01/30/24 (a) | 500,000 | 537,460 |
| 3.38%, 02/05/24 (a) | 300,000 | 320,289 |
| 2.40%, 07/30/24 (a) | 200,000 | 210,520 |
| 1.45%, 05/12/25 (a) | 300,000 | 307,092 |
| 2.38%, 07/22/26 (a) | 300,000 | 319,308 |
| 3.15%, 04/27/27 (a) | 600,000 | 661,482 |
| 3.00%, 07/30/29 (a) | 150,000 | 163,536 |
| 1.38%, 07/22/30 (a) | 400,000 | 387,800 |
| US Bank NA |
| 2.85%, 01/23/23 (a) | 250,000 | 258,588 |
| 2.80%, 01/27/25 (a) | 250,000 | 266,958 |
| US Bank NA/Cincinnati OH |
| 3.40%, 07/24/23 (a) | 250,000 | 264,200 |
| 2.05%, 01/21/25 (a) | 250,000 | 260,948 |
| Wachovia Corp. |
| 5.50%, 08/01/35 | 330,000 | 432,076 |
| Webster Financial Corp. |
| 4.10%, 03/25/29 (a) | 50,000 | 55,929 |
| Wells Fargo & Co. |
| 3.07%, 01/24/23 (a) | 200,000 | 202,258 |
| 3.45%, 02/13/23 | 443,000 | 462,629 |
| 4.13%, 08/15/23 | 250,000 | 267,478 |
| 4.48%, 01/16/24 | 150,000 | 163,326 |
| 3.75%, 01/24/24 (a) | 850,000 | 911,820 |
| 1.65%, 06/02/24 (a)(b) | 500,000 | 511,355 |
| 3.30%, 09/09/24 | 424,000 | 456,826 |
| 3.00%, 02/19/25 | 600,000 | 640,224 |
| 0.81%, 05/19/25 (a)(b) | 250,000 | 251,155 |
| 3.55%, 09/29/25 | 600,000 | 658,554 |
| 2.41%, 10/30/25 (a)(b) | 650,000 | 679,438 |
| 2.16%, 02/11/26 (a)(b) | 650,000 | 674,869 |
| 3.00%, 04/22/26 | 850,000 | 920,932 |
| 2.19%, 04/30/26 (a)(b) | 500,000 | 519,540 |
| 4.10%, 06/03/26 | 550,000 | 618,062 |
| 3.00%, 10/23/26 | 850,000 | 919,513 |
| 3.20%, 06/17/27 (a)(b) | 400,000 | 433,120 |
| 4.30%, 07/22/27 | 480,000 | 550,978 |
| 3.58%, 05/22/28 (a)(b) | 700,000 | 776,923 |
| 2.39%, 06/02/28 (a)(b) | 550,000 | 573,584 |
| 4.15%, 01/24/29 (a) | 550,000 | 633,418 |
| 2.88%, 10/30/30 (a)(b) | 750,000 | 797,820 |
| 2.57%, 02/11/31 (a)(b) | 650,000 | 675,987 |
| 4.48%, 04/04/31 (a)(b) | 600,000 | 712,722 |
Security
Rate, Maturity Date | Face
Amount ($) | Value ($) |
| 5.95%, 12/15/36 | 200,000 | 280,296 |
| 3.07%, 04/30/41 (a)(b) | 900,000 | 946,422 |
| 5.38%, 11/02/43 | 400,000 | 540,300 |
| 5.61%, 01/15/44 | 600,000 | 832,458 |
| 4.65%, 11/04/44 | 250,000 | 312,290 |
| 3.90%, 05/01/45 | 430,000 | 513,975 |
| 4.90%, 11/17/45 | 350,000 | 452,364 |
| 4.40%, 06/14/46 | 450,000 | 550,831 |
| 4.75%, 12/07/46 | 400,000 | 510,860 |
| 5.01%, 04/04/51 (a)(b) | 1,100,000 | 1,533,048 |
| Wells Fargo Bank NA |
| 3.55%, 08/14/23 (a) | 500,000 | 530,235 |
| 5.85%, 02/01/37 | 250,000 | 343,797 |
| 6.60%, 01/15/38 | 250,000 | 369,090 |
| Westpac Banking Corp. |
| 2.75%, 01/11/23 | 250,000 | 258,640 |
| 2.00%, 01/13/23 | 250,000 | 256,020 |
| 3.65%, 05/15/23 | 500,000 | 528,725 |
| 3.30%, 02/26/24 | 200,000 | 214,070 |
| 2.35%, 02/19/25 | 250,000 | 263,543 |
| 2.85%, 05/13/26 | 200,000 | 216,894 |
| 1.15%, 06/03/26 | 250,000 | 251,823 |
| 3.35%, 03/08/27 | 150,000 | 166,683 |
| 3.40%, 01/25/28 | 250,000 | 280,620 |
| 2.65%, 01/16/30 | 100,000 | 108,062 |
| 2.89%, 02/04/30 (a)(b) | 200,000 | 208,286 |
| 2.15%, 06/03/31 | 250,000 | 256,080 |
| 4.32%, 11/23/31 (a)(b) | 450,000 | 500,670 |
| 4.11%, 07/24/34 (a)(b) | 250,000 | 276,410 |
| 2.67%, 11/15/35 (a)(b) | 300,000 | 298,017 |
| 4.42%, 07/24/39 | 200,000 | 239,872 |
| 2.96%, 11/16/40 | 200,000 | 200,298 |
| | | 301,753,163 |
| Brokerage/Asset Managers/Exchanges 0.3% |
| Affiliated Managers Group, Inc. |
| 4.25%, 02/15/24 | 100,000 | 108,610 |
| 3.30%, 06/15/30 (a) | 150,000 | 162,899 |
| Ameriprise Financial, Inc. |
| 4.00%, 10/15/23 | 250,000 | 268,820 |
| 3.00%, 04/02/25 (a) | 100,000 | 106,821 |
| 2.88%, 09/15/26 (a) | 200,000 | 215,672 |
| BGC Partners, Inc. |
| 5.38%, 07/24/23 | 100,000 | 107,738 |
| 3.75%, 10/01/24 (a) | 100,000 | 106,404 |
| BlackRock, Inc. |
| 3.50%, 03/18/24 | 424,000 | 457,284 |
| 3.25%, 04/30/29 (a) | 150,000 | 167,348 |
| 2.40%, 04/30/30 (a) | 200,000 | 210,118 |
| 1.90%, 01/28/31 (a) | 250,000 | 252,195 |
| Brookfield Asset Management, Inc. |
| 4.00%, 01/15/25 (a) | 150,000 | 164,231 |
| Brookfield Finance, Inc. |
| 4.00%, 04/01/24 (a) | 100,000 | 107,913 |
| 4.25%, 06/02/26 (a) | 100,000 | 112,918 |
| 3.90%, 01/25/28 (a) | 150,000 | 168,873 |
| 4.85%, 03/29/29 (a) | 400,000 | 477,984 |
| 4.35%, 04/15/30 (a) | 150,000 | 175,398 |
| 4.70%, 09/20/47 (a) | 100,000 | 124,131 |
| 3.45%, 04/15/50 (a) | 100,000 | 104,843 |
| 3.50%, 03/30/51 (a) | 250,000 | 265,297 |
| Cboe Global Markets, Inc. |
| 3.65%, 01/12/27 (a) | 100,000 | 111,566 |
| 1.63%, 12/15/30 (a) | 200,000 | 194,796 |
Schwab Taxable Bond Funds | Annual Report
Schwab U.S. Aggregate Bond Index Fund
Portfolio Holdings as of August 31, 2021 (continued)
Security
Rate, Maturity Date | Face
Amount ($) | Value ($) |
| CI Financial Corp. |
| 3.20%, 12/17/30 (a) | 200,000 | 208,358 |
| 4.10%, 06/15/51 (a) | 150,000 | 162,513 |
| CME Group, Inc. |
| 3.00%, 09/15/22 | 200,000 | 205,662 |
| 3.00%, 03/15/25 (a) | 400,000 | 428,684 |
| 5.30%, 09/15/43 (a) | 200,000 | 287,752 |
| E*TRADE Financial Corp. |
| 2.95%, 08/24/22 (a) | 100,000 | 102,449 |
| 3.80%, 08/24/27 (a) | 150,000 | 168,069 |
| 4.50%, 06/20/28 (a) | 100,000 | 116,423 |
| Eaton Vance Corp. |
| 3.63%, 06/15/23 | 100,000 | 105,455 |
| 3.50%, 04/06/27 (a) | 200,000 | 218,940 |
| Franklin Resources, Inc. |
| 2.85%, 03/30/25 | 100,000 | 106,957 |
| 1.60%, 10/30/30 (a) | 150,000 | 145,089 |
| Intercontinental Exchange, Inc. |
| 2.35%, 09/15/22 (a) | 200,000 | 203,906 |
| 0.70%, 06/15/23 | 200,000 | 200,920 |
| 3.45%, 09/21/23 (a) | 100,000 | 105,928 |
| 3.75%, 12/01/25 (a) | 250,000 | 276,325 |
| 3.10%, 09/15/27 (a) | 100,000 | 109,285 |
| 3.75%, 09/21/28 (a) | 400,000 | 452,024 |
| 2.10%, 06/15/30 (a) | 250,000 | 251,162 |
| 1.85%, 09/15/32 (a) | 250,000 | 241,515 |
| 2.65%, 09/15/40 (a) | 250,000 | 244,555 |
| 4.25%, 09/21/48 (a) | 150,000 | 183,720 |
| 3.00%, 06/15/50 (a) | 400,000 | 405,416 |
| 3.00%, 09/15/60 (a) | 250,000 | 248,230 |
| Invesco Finance PLC |
| 3.75%, 01/15/26 | 230,000 | 254,603 |
| 5.38%, 11/30/43 | 100,000 | 134,077 |
| Jefferies Group LLC |
| 5.13%, 01/20/23 | 150,000 | 159,279 |
| 6.45%, 06/08/27 | 100,000 | 125,355 |
| 2.75%, 10/15/32 (a) | 100,000 | 102,321 |
| 6.25%, 01/15/36 | 100,000 | 135,750 |
| 6.50%, 01/20/43 | 100,000 | 140,074 |
| Jefferies Group LLC/Jefferies Group Capital Finance, Inc. |
| 4.85%, 01/15/27 | 500,000 | 582,960 |
| 4.15%, 01/23/30 | 200,000 | 226,892 |
| Lazard Group LLC |
| 4.50%, 09/19/28 (a) | 150,000 | 174,429 |
| 4.38%, 03/11/29 (a) | 200,000 | 229,794 |
| Legg Mason, Inc. |
| 4.75%, 03/15/26 | 150,000 | 173,737 |
| 5.63%, 01/15/44 | 75,000 | 106,925 |
| Nasdaq, Inc. |
| 0.45%, 12/21/22 (a) | 250,000 | 250,062 |
| 3.85%, 06/30/26 (a) | 150,000 | 167,781 |
| 2.50%, 12/21/40 (a) | 250,000 | 235,042 |
| 3.25%, 04/28/50 (a) | 100,000 | 102,864 |
| Nomura Holdings, Inc. |
| 2.65%, 01/16/25 | 200,000 | 209,620 |
| 1.85%, 07/16/25 | 400,000 | 408,660 |
| 1.65%, 07/14/26 | 200,000 | 200,398 |
| 2.17%, 07/14/28 | 200,000 | 200,368 |
| 3.10%, 01/16/30 | 400,000 | 422,596 |
| 2.68%, 07/16/30 | 300,000 | 306,645 |
| 2.61%, 07/14/31 | 200,000 | 202,312 |
| Raymond James Financial, Inc. |
| 4.65%, 04/01/30 (a) | 100,000 | 120,257 |
| 4.95%, 07/15/46 | 150,000 | 197,148 |
| 3.75%, 04/01/51 (a) | 150,000 | 169,953 |
Security
Rate, Maturity Date | Face
Amount ($) | Value ($) |
| Stifel Financial Corp. |
| 4.25%, 07/18/24 | 100,000 | 109,530 |
| 4.00%, 05/15/30 (a) | 150,000 | 168,210 |
| TD Ameritrade Holding Corp. |
| 3.75%, 04/01/24 (a)(d) | 50,000 | 53,990 |
| 3.63%, 04/01/25 (a)(d) | 100,000 | 109,256 |
| 3.30%, 04/01/27 (a)(d) | 100,000 | 110,396 |
| 2.75%, 10/01/29 (a)(d) | 100,000 | 107,222 |
| The Charles Schwab Corp. |
| 2.65%, 01/25/23 (a)(d) | 150,000 | 154,670 |
| 3.55%, 02/01/24 (a)(d) | 100,000 | 107,332 |
| 0.75%, 03/18/24 (a)(d) | 250,000 | 251,702 |
| 4.20%, 03/24/25 (a)(d) | 100,000 | 111,511 |
| 3.85%, 05/21/25 (a)(d) | 150,000 | 165,626 |
| 0.90%, 03/11/26 (a)(d) | 250,000 | 249,300 |
| 1.15%, 05/13/26 (a)(d) | 200,000 | 201,410 |
| 3.20%, 03/02/27 (a)(d) | 100,000 | 109,889 |
| 3.20%, 01/25/28 (a)(d) | 100,000 | 110,264 |
| 2.00%, 03/20/28 (a)(d) | 150,000 | 154,758 |
| 4.00%, 02/01/29 (a)(d) | 100,000 | 115,666 |
| 3.25%, 05/22/29 (a)(d) | 100,000 | 110,773 |
| 4.63%, 03/22/30 (a)(d) | 100,000 | 122,280 |
| 1.65%, 03/11/31 (a)(d) | 100,000 | 97,913 |
| 2.30%, 05/13/31 (a)(d) | 100,000 | 103,370 |
| | | 17,916,166 |
| Finance Companies 0.3% |
| AerCap Ireland Capital DAC/AerCap Global Aviation Trust |
| 3.30%, 01/23/23 (a) | 150,000 | 154,914 |
| 4.13%, 07/03/23 (a) | 150,000 | 158,376 |
| 4.50%, 09/15/23 (a) | 250,000 | 266,940 |
| 4.88%, 01/16/24 (a) | 300,000 | 325,239 |
| 3.15%, 02/15/24 (a) | 300,000 | 313,779 |
| 3.50%, 01/15/25 (a) | 150,000 | 158,915 |
| 6.50%, 07/15/25 (a) | 300,000 | 350,622 |
| 4.45%, 10/01/25 (a) | 150,000 | 164,526 |
| 4.45%, 04/03/26 (a) | 150,000 | 164,673 |
| 3.65%, 07/21/27 (a) | 250,000 | 266,135 |
| 4.63%, 10/15/27 (a) | 350,000 | 390,435 |
| Air Lease Corp. |
| 2.25%, 01/15/23 | 200,000 | 204,732 |
| 2.75%, 01/15/23 (a) | 100,000 | 102,866 |
| 3.00%, 09/15/23 (a) | 300,000 | 312,765 |
| 0.70%, 02/15/24 (a) | 250,000 | 249,227 |
| 4.25%, 09/15/24 (a) | 150,000 | 163,296 |
| 2.30%, 02/01/25 (a) | 100,000 | 103,392 |
| 3.25%, 03/01/25 (a) | 150,000 | 159,470 |
| 3.38%, 07/01/25 (a) | 125,000 | 133,970 |
| 2.88%, 01/15/26 (a) | 400,000 | 420,684 |
| 3.75%, 06/01/26 (a) | 150,000 | 163,938 |
| 1.88%, 08/15/26 (a) | 250,000 | 250,880 |
| 3.63%, 04/01/27 (a) | 150,000 | 162,156 |
| 3.63%, 12/01/27 (a) | 250,000 | 270,547 |
| 4.63%, 10/01/28 (a) | 100,000 | 113,691 |
| 3.25%, 10/01/29 (a) | 100,000 | 104,788 |
| 3.00%, 02/01/30 (a) | 100,000 | 102,390 |
| 3.13%, 12/01/30 (a) | 150,000 | 154,395 |
| Aircastle Ltd. |
| 4.40%, 09/25/23 (a) | 150,000 | 160,097 |
| 4.13%, 05/01/24 (a) | 100,000 | 106,659 |
| 4.25%, 06/15/26 (a) | 300,000 | 330,057 |
| Ares Capital Corp. |
| 4.20%, 06/10/24 (a) | 250,000 | 268,900 |
| 4.25%, 03/01/25 (a) | 100,000 | 108,096 |
| 3.25%, 07/15/25 (a) | 250,000 | 264,177 |
| 3.88%, 01/15/26 (a) | 450,000 | 484,821 |
Schwab Taxable Bond Funds | Annual Report
Schwab U.S. Aggregate Bond Index Fund
Portfolio Holdings as of August 31, 2021 (continued)
Security
Rate, Maturity Date | Face
Amount ($) | Value ($) |
| 2.15%, 07/15/26 (a) | 150,000 | 151,094 |
| 2.88%, 06/15/28 (a) | 200,000 | 204,056 |
| FS KKR Capital Corp. |
| 4.63%, 07/15/24 (a) | 100,000 | 107,961 |
| 4.13%, 02/01/25 (a) | 100,000 | 106,466 |
| 3.40%, 01/15/26 (a) | 200,000 | 209,100 |
| GATX Corp. |
| 3.25%, 09/15/26 (a) | 200,000 | 216,220 |
| 3.85%, 03/30/27 (a) | 150,000 | 165,864 |
| 3.50%, 03/15/28 (a) | 150,000 | 165,812 |
| 4.70%, 04/01/29 (a) | 150,000 | 176,361 |
| 1.90%, 06/01/31 (a) | 100,000 | 96,324 |
| 3.10%, 06/01/51 (a) | 100,000 | 96,163 |
| GE Capital Funding LLC |
| 3.45%, 05/15/25 (a) | 550,000 | 596,288 |
| 4.05%, 05/15/27 (a) | 200,000 | 226,384 |
| 4.40%, 05/15/30 (a) | 500,000 | 586,660 |
| 4.55%, 05/15/32 (a) | 250,000 | 300,550 |
| GE Capital International Funding Co. |
| 3.37%, 11/15/25 | 500,000 | 546,925 |
| 4.42%, 11/15/35 | 2,305,000 | 2,802,649 |
| Goldman Sachs BDC, Inc. |
| 3.75%, 02/10/25 (a) | 50,000 | 53,444 |
| 2.88%, 01/15/26 (a) | 150,000 | 155,355 |
| Golub Capital BDC, Inc. |
| 2.50%, 08/24/26 (a) | 250,000 | 254,427 |
| Main Street Capital Corp. |
| 5.20%, 05/01/24 | 50,000 | 54,310 |
| 3.00%, 07/14/26 (a) | 100,000 | 103,269 |
| Oaktree Specialty Lending Corp. |
| 3.50%, 02/25/25 (a) | 50,000 | 52,607 |
| 2.70%, 01/15/27 (a) | 50,000 | 50,576 |
| Owl Rock Capital Corp. |
| 5.25%, 04/15/24 (a) | 100,000 | 109,553 |
| 3.75%, 07/22/25 (a) | 100,000 | 105,808 |
| 4.25%, 01/15/26 (a) | 250,000 | 269,790 |
| 3.40%, 07/15/26 (a) | 200,000 | 209,440 |
| 2.88%, 06/11/28 (a) | 150,000 | 150,869 |
| Prospect Capital Corp. |
| 3.36%, 11/15/26 (a) | 200,000 | 203,418 |
| Sixth Street Specialty Lending, Inc. |
| 2.50%, 08/01/26 (a) | 100,000 | 101,554 |
| | | 16,239,845 |
| Financial Other 0.0% |
| Blackstone Secured Lending Fund |
| 3.65%, 07/14/23 | 150,000 | 156,668 |
| 2.75%, 09/16/26 (a) | 200,000 | 206,272 |
| ORIX Corp. |
| 4.05%, 01/16/24 | 100,000 | 107,826 |
| 3.25%, 12/04/24 | 200,000 | 215,418 |
| 3.70%, 07/18/27 | 100,000 | 112,193 |
| 2.25%, 03/09/31 | 100,000 | 101,620 |
| The Andrew W Mellon Foundation |
| 0.95%, 08/01/27 (a) | 250,000 | 246,822 |
| | | 1,146,819 |
| Insurance 1.2% |
| Aegon NV |
| 5.50%, 04/11/48 (a)(b) | 200,000 | 235,198 |
| Aetna, Inc. |
| 2.75%, 11/15/22 (a) | 100,000 | 102,270 |
| 2.80%, 06/15/23 (a) | 450,000 | 466,978 |
Security
Rate, Maturity Date | Face
Amount ($) | Value ($) |
| 3.50%, 11/15/24 (a) | 100,000 | 107,801 |
| 6.63%, 06/15/36 | 100,000 | 146,044 |
| 6.75%, 12/15/37 | 150,000 | 223,389 |
| 4.13%, 11/15/42 (a) | 100,000 | 116,524 |
| 4.75%, 03/15/44 (a) | 150,000 | 189,087 |
| 3.88%, 08/15/47 (a) | 250,000 | 283,922 |
| Aflac, Inc. |
| 3.63%, 11/15/24 | 100,000 | 109,424 |
| 1.13%, 03/15/26 (a) | 200,000 | 201,288 |
| 2.88%, 10/15/26 (a) | 100,000 | 108,449 |
| 3.60%, 04/01/30 (a) | 250,000 | 284,245 |
| 4.75%, 01/15/49 (a) | 200,000 | 268,402 |
| Alleghany Corp. |
| 3.63%, 05/15/30 (a) | 200,000 | 223,084 |
| 3.25%, 08/15/51 (a) | 100,000 | 102,317 |
| Allied World Assurance Co., Holdings Ltd. |
| 4.35%, 10/29/25 (a) | 100,000 | 109,479 |
| American Equity Investment Life Holding Co. |
| 5.00%, 06/15/27 (a) | 90,000 | 102,974 |
| American Financial Group, Inc. |
| 3.50%, 08/15/26 (a) | 150,000 | 164,297 |
| 4.50%, 06/15/47 (a) | 100,000 | 124,859 |
| American International Group, Inc. |
| 4.13%, 02/15/24 | 200,000 | 216,726 |
| 2.50%, 06/30/25 (a) | 350,000 | 368,315 |
| 3.75%, 07/10/25 (a) | 200,000 | 219,468 |
| 3.90%, 04/01/26 (a) | 350,000 | 389,130 |
| 4.20%, 04/01/28 (a) | 150,000 | 172,664 |
| 4.25%, 03/15/29 (a) | 100,000 | 115,808 |
| 3.40%, 06/30/30 (a) | 350,000 | 385,336 |
| 3.88%, 01/15/35 (a) | 228,000 | 261,231 |
| 6.25%, 05/01/36 | 280,000 | 394,699 |
| 4.50%, 07/16/44 (a) | 545,000 | 676,356 |
| 4.80%, 07/10/45 (a) | 100,000 | 129,330 |
| 4.75%, 04/01/48 (a) | 200,000 | 261,226 |
| 5.75%, 04/01/48 (a)(b) | 100,000 | 115,532 |
| 4.38%, 06/30/50 (a) | 200,000 | 251,558 |
| 4.38%, 01/15/55 (a) | 250,000 | 313,742 |
| 8.18%, 05/15/58 (a)(b) | 100,000 | 149,125 |
| Anthem, Inc. |
| 2.95%, 12/01/22 (a) | 200,000 | 206,130 |
| 3.30%, 01/15/23 | 330,000 | 343,180 |
| 3.50%, 08/15/24 (a) | 195,000 | 209,459 |
| 3.35%, 12/01/24 (a) | 100,000 | 108,007 |
| 2.38%, 01/15/25 (a) | 175,000 | 183,204 |
| 3.65%, 12/01/27 (a) | 500,000 | 560,350 |
| 4.10%, 03/01/28 (a) | 150,000 | 171,648 |
| 2.88%, 09/15/29 (a) | 250,000 | 266,995 |
| 2.25%, 05/15/30 (a) | 200,000 | 203,820 |
| 2.55%, 03/15/31 (a) | 200,000 | 208,244 |
| 6.38%, 06/15/37 | 250,000 | 360,417 |
| 4.63%, 05/15/42 | 200,000 | 250,606 |
| 4.65%, 01/15/43 | 150,000 | 188,679 |
| 5.10%, 01/15/44 | 150,000 | 198,534 |
| 4.65%, 08/15/44 (a) | 300,000 | 379,302 |
| 4.38%, 12/01/47 (a) | 250,000 | 310,175 |
| 4.55%, 03/01/48 (a) | 150,000 | 190,091 |
| 3.70%, 09/15/49 (a) | 200,000 | 226,244 |
| 3.13%, 05/15/50 (a) | 200,000 | 208,792 |
| 3.60%, 03/15/51 (a) | 200,000 | 224,808 |
| Aon Corp. |
| 4.50%, 12/15/28 (a) | 150,000 | 175,916 |
| 3.75%, 05/02/29 (a) | 150,000 | 169,443 |
| 2.80%, 05/15/30 (a) | 200,000 | 212,118 |
| 2.05%, 08/23/31 (a) | 200,000 | 199,044 |
| 2.90%, 08/23/51 (a) | 100,000 | 98,738 |
Schwab Taxable Bond Funds | Annual Report
Schwab U.S. Aggregate Bond Index Fund
Portfolio Holdings as of August 31, 2021 (continued)
Security
Rate, Maturity Date | Face
Amount ($) | Value ($) |
| Aon PLC |
| 3.50%, 06/14/24 (a) | 300,000 | 321,828 |
| 3.88%, 12/15/25 (a) | 200,000 | 221,776 |
| 4.60%, 06/14/44 (a) | 150,000 | 190,386 |
| 4.75%, 05/15/45 (a) | 100,000 | 129,275 |
| Arch Capital Finance LLC |
| 4.01%, 12/15/26 (a) | 150,000 | 170,339 |
| 5.03%, 12/15/46 (a) | 100,000 | 133,699 |
| Arch Capital Group Ltd. |
| 3.64%, 06/30/50 (a) | 250,000 | 278,865 |
| Arch Capital Group US, Inc. |
| 5.14%, 11/01/43 | 185,000 | 247,499 |
| Arthur J Gallagher & Co. |
| 3.50%, 05/20/51 (a) | 150,000 | 163,224 |
| Aspen Insurance Holdings Ltd. |
| 4.65%, 11/15/23 | 100,000 | 108,407 |
| Assurant, Inc. |
| 4.20%, 09/27/23 (a) | 150,000 | 160,413 |
| 3.70%, 02/22/30 (a) | 100,000 | 110,154 |
| Assured Guaranty US Holdings, Inc. |
| 3.15%, 06/15/31 (a) | 200,000 | 213,384 |
| Athene Holding Ltd. |
| 4.13%, 01/12/28 (a) | 250,000 | 281,305 |
| 6.15%, 04/03/30 (a) | 100,000 | 127,701 |
| 3.50%, 01/15/31 (a) | 100,000 | 108,886 |
| 3.95%, 05/25/51 (a) | 100,000 | 113,497 |
| AXA S.A. |
| 8.60%, 12/15/30 | 250,000 | 379,022 |
| AXIS Specialty Finance LLC |
| 3.90%, 07/15/29 (a) | 100,000 | 111,280 |
| 4.90%, 01/15/40 (a)(b) | 50,000 | 53,535 |
| Berkshire Hathaway Finance Corp. |
| 1.85%, 03/12/30 (a) | 100,000 | 101,500 |
| 1.45%, 10/15/30 (a) | 150,000 | 146,921 |
| 5.75%, 01/15/40 | 250,000 | 365,050 |
| 4.30%, 05/15/43 | 300,000 | 376,590 |
| 4.20%, 08/15/48 (a) | 600,000 | 752,400 |
| 4.25%, 01/15/49 (a) | 350,000 | 441,535 |
| 2.85%, 10/15/50 (a) | 300,000 | 303,507 |
| 2.50%, 01/15/51 (a) | 100,000 | 94,887 |
| Berkshire Hathaway, Inc. |
| 2.75%, 03/15/23 (a) | 430,000 | 444,727 |
| 3.13%, 03/15/26 (a) | 550,000 | 602,112 |
| 4.50%, 02/11/43 | 100,000 | 128,858 |
| Brighthouse Financial, Inc. |
| 3.70%, 06/22/27 (a) | 250,000 | 274,622 |
| 5.63%, 05/15/30 (a) | 150,000 | 182,955 |
| 4.70%, 06/22/47 (a) | 250,000 | 284,032 |
| Brown & Brown, Inc. |
| 4.20%, 09/15/24 (a) | 100,000 | 109,363 |
| 2.38%, 03/15/31 (a) | 250,000 | 253,022 |
| Chubb INA Holdings, Inc. |
| 2.70%, 03/13/23 | 300,000 | 311,010 |
| 3.15%, 03/15/25 | 150,000 | 162,126 |
| 3.35%, 05/03/26 (a) | 400,000 | 440,020 |
| 1.38%, 09/15/30 (a) | 400,000 | 384,408 |
| 4.15%, 03/13/43 | 400,000 | 494,980 |
| 4.35%, 11/03/45 (a) | 250,000 | 321,405 |
| Cincinnati Financial Corp. |
| 6.13%, 11/01/34 | 250,000 | 347,692 |
| CNA Financial Corp. |
| 3.95%, 05/15/24 (a) | 100,000 | 107,931 |
| 4.50%, 03/01/26 (a) | 150,000 | 170,103 |
| 3.45%, 08/15/27 (a) | 150,000 | 166,034 |
Security
Rate, Maturity Date | Face
Amount ($) | Value ($) |
| 3.90%, 05/01/29 (a) | 100,000 | 113,042 |
| 2.05%, 08/15/30 (a) | 150,000 | 149,277 |
| CNO Financial Group, Inc. |
| 5.25%, 05/30/29 (a) | 150,000 | 178,617 |
| Enstar Group Ltd. |
| 4.95%, 06/01/29 (a) | 100,000 | 114,822 |
| Equitable Holdings, Inc. |
| 3.90%, 04/20/23 (a) | 97,000 | 102,165 |
| 4.35%, 04/20/28 (a) | 350,000 | 402,584 |
| 5.00%, 04/20/48 (a) | 350,000 | 456,018 |
| Everest Reinsurance Holdings, Inc. |
| 4.87%, 06/01/44 | 100,000 | 129,328 |
| 3.50%, 10/15/50 (a) | 250,000 | 272,555 |
| Fairfax Financial Holdings Ltd. |
| 4.85%, 04/17/28 (a) | 100,000 | 115,309 |
| 4.63%, 04/29/30 (a) | 200,000 | 229,500 |
| Fidelity National Financial, Inc. |
| 3.40%, 06/15/30 (a) | 250,000 | 271,220 |
| 2.45%, 03/15/31 (a) | 250,000 | 250,982 |
| First American Financial Corp. |
| 4.00%, 05/15/30 (a) | 100,000 | 111,938 |
| 2.40%, 08/15/31 (a) | 100,000 | 98,841 |
| Globe Life, Inc. |
| 4.55%, 09/15/28 (a) | 100,000 | 117,828 |
| 2.15%, 08/15/30 (a) | 250,000 | 250,812 |
| Humana, Inc. |
| 0.65%, 08/03/23 (a) | 200,000 | 200,132 |
| 3.85%, 10/01/24 (a) | 156,000 | 169,212 |
| 4.50%, 04/01/25 (a) | 200,000 | 223,262 |
| 1.35%, 02/03/27 (a) | 150,000 | 148,930 |
| 3.95%, 03/15/27 (a) | 300,000 | 337,455 |
| 3.13%, 08/15/29 (a) | 150,000 | 162,251 |
| 4.88%, 04/01/30 (a) | 100,000 | 121,302 |
| 2.15%, 02/03/32 (a) | 150,000 | 149,808 |
| 4.95%, 10/01/44 (a) | 100,000 | 131,159 |
| 4.80%, 03/15/47 (a) | 100,000 | 129,270 |
| 3.95%, 08/15/49 (a) | 250,000 | 293,777 |
| Kemper Corp. |
| 4.35%, 02/15/25 (a) | 100,000 | 109,421 |
| 2.40%, 09/30/30 (a) | 150,000 | 151,340 |
| Lincoln National Corp. |
| 3.63%, 12/12/26 (a) | 150,000 | 166,526 |
| 3.80%, 03/01/28 (a) | 250,000 | 281,040 |
| 3.05%, 01/15/30 (a) | 100,000 | 107,989 |
| 3.40%, 01/15/31 (a) | 150,000 | 165,213 |
| 7.00%, 06/15/40 | 100,000 | 156,042 |
| 4.38%, 06/15/50 (a)(e) | 200,000 | 247,334 |
| Loews Corp. |
| 2.63%, 05/15/23 (a) | 200,000 | 206,610 |
| 3.20%, 05/15/30 (a) | 100,000 | 109,137 |
| 4.13%, 05/15/43 (a) | 100,000 | 120,687 |
| Manulife Financial Corp. |
| 4.15%, 03/04/26 | 200,000 | 225,894 |
| 2.48%, 05/19/27 (a) | 200,000 | 211,672 |
| 4.06%, 02/24/32 (a)(b) | 250,000 | 275,517 |
| Markel Corp. |
| 3.50%, 11/01/27 (a) | 150,000 | 166,052 |
| 3.35%, 09/17/29 (a) | 100,000 | 110,337 |
| 5.00%, 04/05/46 | 200,000 | 262,962 |
| 4.30%, 11/01/47 (a) | 150,000 | 180,957 |
| 4.15%, 09/17/50 (a) | 100,000 | 118,780 |
| Marsh & McLennan Cos., Inc. |
| 3.88%, 03/15/24 (a) | 300,000 | 323,877 |
| 3.50%, 06/03/24 (a) | 150,000 | 160,832 |
Schwab Taxable Bond Funds | Annual Report
Schwab U.S. Aggregate Bond Index Fund
Portfolio Holdings as of August 31, 2021 (continued)
Security
Rate, Maturity Date | Face
Amount ($) | Value ($) |
| 3.50%, 03/10/25 (a) | 200,000 | 217,120 |
| 3.75%, 03/14/26 (a) | 150,000 | 166,641 |
| 4.38%, 03/15/29 (a) | 250,000 | 294,040 |
| 2.25%, 11/15/30 (a) | 190,000 | 194,991 |
| 5.88%, 08/01/33 | 100,000 | 136,458 |
| 4.75%, 03/15/39 (a) | 150,000 | 194,558 |
| 4.35%, 01/30/47 (a) | 100,000 | 127,589 |
| 4.20%, 03/01/48 (a) | 150,000 | 187,973 |
| 4.90%, 03/15/49 (a) | 250,000 | 345,042 |
| Mercury General Corp. |
| 4.40%, 03/15/27 (a) | 100,000 | 113,544 |
| MetLife, Inc. |
| 4.37%, 09/15/23 | 250,000 | 269,950 |
| 3.60%, 04/10/24 | 250,000 | 269,772 |
| 3.60%, 11/13/25 (a) | 300,000 | 331,179 |
| 4.55%, 03/23/30 (a) | 200,000 | 240,960 |
| 6.38%, 06/15/34 | 200,000 | 287,820 |
| 5.70%, 06/15/35 | 250,000 | 348,117 |
| 6.40%, 12/15/36 (a) | 230,000 | 295,320 |
| 10.75%, 08/01/39 (a)(b) | 75,000 | 133,161 |
| 5.88%, 02/06/41 | 150,000 | 217,275 |
| 4.13%, 08/13/42 | 200,000 | 242,516 |
| 4.88%, 11/13/43 | 150,000 | 200,977 |
| 4.72%, 12/15/44 | 100,000 | 132,194 |
| 4.05%, 03/01/45 | 350,000 | 425,589 |
| 4.60%, 05/13/46 (a) | 100,000 | 131,714 |
| Nationwide Financial Services, Inc. |
| 6.75%, 05/15/37 (b) | 40,000 | 49,404 |
| Old Republic International Corp. |
| 3.88%, 08/26/26 (a) | 150,000 | 167,897 |
| 3.85%, 06/11/51 (a) | 150,000 | 164,597 |
| PartnerRe Finance B LLC |
| 3.70%, 07/02/29 (a) | 100,000 | 112,147 |
| Principal Financial Group, Inc. |
| 3.10%, 11/15/26 (a) | 250,000 | 271,695 |
| 3.70%, 05/15/29 (a) | 150,000 | 169,620 |
| 2.13%, 06/15/30 (a) | 250,000 | 252,545 |
| 4.30%, 11/15/46 (a) | 237,000 | 293,780 |
| Prudential Financial, Inc. |
| 1.50%, 03/10/26 (a) | 150,000 | 153,038 |
| 3.88%, 03/27/28 (a) | 97,000 | 111,498 |
| 2.10%, 03/10/30 (a) | 200,000 | 204,626 |
| 6.63%, 12/01/37 | 350,000 | 520,478 |
| 3.00%, 03/10/40 (a) | 250,000 | 262,545 |
| 5.88%, 09/15/42 (a)(b) | 150,000 | 157,598 |
| 5.63%, 06/15/43 (a)(b) | 330,000 | 353,080 |
| 5.20%, 03/15/44 (a)(b) | 100,000 | 107,933 |
| 4.60%, 05/15/44 | 300,000 | 387,294 |
| 5.38%, 05/15/45 (a)(b) | 150,000 | 166,760 |
| 4.50%, 09/15/47 (a)(b) | 100,000 | 109,686 |
| 3.91%, 12/07/47 (a) | 350,000 | 415,723 |
| 5.70%, 09/15/48 (a)(b) | 150,000 | 176,762 |
| 3.94%, 12/07/49 (a) | 100,000 | 119,880 |
| 4.35%, 02/25/50 (a) | 150,000 | 192,383 |
| 3.70%, 10/01/50 (a)(b) | 200,000 | 211,394 |
| 3.70%, 03/13/51 (a) | 200,000 | 233,604 |
| Prudential PLC |
| 3.13%, 04/14/30 | 200,000 | 218,580 |
| Reinsurance Group of America, Inc. |
| 3.90%, 05/15/29 (a) | 200,000 | 226,144 |
| 3.15%, 06/15/30 (a) | 200,000 | 215,438 |
| RenaissanceRe Holdings Ltd. |
| 3.60%, 04/15/29 (a) | 150,000 | 166,809 |
Security
Rate, Maturity Date | Face
Amount ($) | Value ($) |
| The Allstate Corp. |
| 3.15%, 06/15/23 | 100,000 | 105,015 |
| 0.75%, 12/15/25 (a) | 150,000 | 149,160 |
| 3.28%, 12/15/26 (a) | 150,000 | 165,906 |
| 5.35%, 06/01/33 | 250,000 | 327,042 |
| 5.55%, 05/09/35 | 150,000 | 205,756 |
| 4.50%, 06/15/43 | 200,000 | 257,192 |
| 4.20%, 12/15/46 (a) | 100,000 | 125,602 |
| 3.85%, 08/10/49 (a) | 100,000 | 121,193 |
| 5.75%, 08/15/53 (a)(b) | 290,000 | 314,981 |
| The Chubb Corp. |
| 6.50%, 05/15/38 | 100,000 | 153,368 |
| The Hanover Insurance Group, Inc. |
| 2.50%, 09/01/30 (a) | 200,000 | 203,488 |
| The Hartford Financial Services Group, Inc. |
| 2.80%, 08/19/29 (a) | 150,000 | 159,555 |
| 6.10%, 10/01/41 | 230,000 | 332,019 |
| 4.40%, 03/15/48 (a) | 100,000 | 125,276 |
| 3.60%, 08/19/49 (a) | 100,000 | 112,154 |
| The Progressive Corp. |
| 2.45%, 01/15/27 | 200,000 | 213,888 |
| 4.00%, 03/01/29 (a) | 150,000 | 173,718 |
| 3.20%, 03/26/30 (a) | 100,000 | 110,744 |
| 6.25%, 12/01/32 | 150,000 | 209,409 |
| 3.70%, 01/26/45 | 200,000 | 233,700 |
| 4.20%, 03/15/48 (a) | 250,000 | 316,010 |
| 3.95%, 03/26/50 (a) | 100,000 | 123,725 |
| The Travelers Cos., Inc. |
| 6.75%, 06/20/36 | 150,000 | 229,417 |
| 5.35%, 11/01/40 | 100,000 | 141,536 |
| 4.60%, 08/01/43 | 200,000 | 265,784 |
| 4.00%, 05/30/47 (a) | 300,000 | 369,474 |
| 4.10%, 03/04/49 (a) | 100,000 | 127,177 |
| 2.55%, 04/27/50 (a) | 400,000 | 392,348 |
| 3.05%, 06/08/51 (a) | 200,000 | 214,962 |
| Transatlantic Holdings, Inc. |
| 8.00%, 11/30/39 | 100,000 | 157,015 |
| UnitedHealth Group, Inc. |
| 2.38%, 10/15/22 | 150,000 | 153,579 |
| 2.75%, 02/15/23 (a) | 195,000 | 200,908 |
| 3.50%, 02/15/24 | 150,000 | 160,982 |
| 0.55%, 05/15/24 (a) | 250,000 | 249,668 |
| 3.75%, 07/15/25 | 480,000 | 533,453 |
| 1.25%, 01/15/26 | 150,000 | 152,007 |
| 3.10%, 03/15/26 | 200,000 | 218,624 |
| 1.15%, 05/15/26 (a) | 200,000 | 201,538 |
| 3.38%, 04/15/27 | 250,000 | 278,235 |
| 2.95%, 10/15/27 | 500,000 | 548,100 |
| 3.85%, 06/15/28 | 250,000 | 286,805 |
| 3.88%, 12/15/28 | 150,000 | 173,124 |
| 2.88%, 08/15/29 | 200,000 | 217,316 |
| 2.00%, 05/15/30 | 250,000 | 254,652 |
| 2.30%, 05/15/31 (a) | 300,000 | 310,899 |
| 4.63%, 07/15/35 | 200,000 | 254,394 |
| 5.80%, 03/15/36 | 393,000 | 557,050 |
| 6.63%, 11/15/37 | 250,000 | 383,047 |
| 6.88%, 02/15/38 | 250,000 | 390,162 |
| 3.50%, 08/15/39 (a) | 250,000 | 283,065 |
| 2.75%, 05/15/40 (a) | 300,000 | 308,781 |
| 5.70%, 10/15/40 (a) | 100,000 | 142,776 |
| 3.05%, 05/15/41 (a) | 300,000 | 318,531 |
| 4.63%, 11/15/41 (a) | 200,000 | 255,468 |
| 3.95%, 10/15/42 (a) | 100,000 | 120,106 |
| 4.25%, 03/15/43 (a) | 100,000 | 124,501 |
| 4.75%, 07/15/45 | 350,000 | 467,243 |
| 4.20%, 01/15/47 (a) | 150,000 | 185,853 |
Schwab Taxable Bond Funds | Annual Report
Schwab U.S. Aggregate Bond Index Fund
Portfolio Holdings as of August 31, 2021 (continued)
Security
Rate, Maturity Date | Face
Amount ($) | Value ($) |
| 4.25%, 04/15/47 (a) | 100,000 | 125,414 |
| 3.75%, 10/15/47 (a) | 200,000 | 234,070 |
| 4.25%, 06/15/48 (a) | 250,000 | 315,802 |
| 4.45%, 12/15/48 (a) | 425,000 | 553,193 |
| 3.70%, 08/15/49 (a) | 300,000 | 349,473 |
| 2.90%, 05/15/50 (a) | 250,000 | 258,885 |
| 3.25%, 05/15/51 (a) | 400,000 | 438,588 |
| 3.88%, 08/15/59 (a) | 250,000 | 303,257 |
| 3.13%, 05/15/60 (a) | 150,000 | 159,119 |
| Unum Group |
| 4.00%, 06/15/29 (a) | 150,000 | 168,668 |
| 5.75%, 08/15/42 | 100,000 | 125,495 |
| 4.50%, 12/15/49 (a) | 100,000 | 107,150 |
| 4.13%, 06/15/51 (a) | 100,000 | 101,769 |
| Voya Financial, Inc. |
| 3.65%, 06/15/26 | 150,000 | 166,227 |
| 5.70%, 07/15/43 | 150,000 | 210,918 |
| 4.70%, 01/23/48 (a)(b) | 100,000 | 105,780 |
| 5.65%, 05/15/53 (a)(b) | 100,000 | 105,935 |
| Willis North America, Inc. |
| 3.60%, 05/15/24 (a) | 200,000 | 214,246 |
| 4.50%, 09/15/28 (a) | 250,000 | 289,195 |
| 2.95%, 09/15/29 (a) | 200,000 | 211,874 |
| 3.88%, 09/15/49 (a) | 150,000 | 169,956 |
| WR Berkley Corp. |
| 4.00%, 05/12/50 (a) | 150,000 | 176,334 |
| 3.55%, 03/30/52 (a) | 100,000 | 109,725 |
| XLIT Ltd. |
| 4.45%, 03/31/25 | 150,000 | 167,900 |
| 5.25%, 12/15/43 | 130,000 | 183,368 |
| | | 65,543,361 |
| REITs 0.7% |
| Agree LP |
| 2.90%, 10/01/30 (a) | 150,000 | 157,827 |
| Alexandria Real Estate Equities, Inc. |
| 3.45%, 04/30/25 (a) | 150,000 | 162,902 |
| 4.50%, 07/30/29 (a) | 150,000 | 177,213 |
| 2.75%, 12/15/29 (a) | 150,000 | 158,346 |
| 4.70%, 07/01/30 (a) | 200,000 | 240,684 |
| 4.90%, 12/15/30 (a) | 150,000 | 184,828 |
| 3.38%, 08/15/31 (a) | 250,000 | 277,080 |
| 2.00%, 05/18/32 (a) | 200,000 | 197,144 |
| 1.88%, 02/01/33 (a) | 250,000 | 239,957 |
| 4.85%, 04/15/49 (a) | 100,000 | 132,666 |
| 4.00%, 02/01/50 (a) | 100,000 | 117,476 |
| 3.00%, 05/18/51 (a) | 200,000 | 199,524 |
| American Campus Communities Operating Partnership LP |
| 4.13%, 07/01/24 (a) | 150,000 | 163,448 |
| 3.30%, 07/15/26 (a) | 100,000 | 107,769 |
| 2.85%, 02/01/30 (a) | 100,000 | 103,970 |
| 3.88%, 01/30/31 (a) | 125,000 | 140,785 |
| American Homes 4 Rent LP |
| 4.25%, 02/15/28 (a) | 100,000 | 114,637 |
| 4.90%, 02/15/29 (a) | 100,000 | 118,351 |
| 2.38%, 07/15/31 (a) | 150,000 | 150,990 |
| AvalonBay Communities, Inc. |
| 3.50%, 11/15/24 (a) | 250,000 | 270,012 |
| 3.45%, 06/01/25 (a) | 150,000 | 163,491 |
| 2.95%, 05/11/26 (a) | 100,000 | 108,115 |
| 2.90%, 10/15/26 (a) | 250,000 | 269,520 |
| 3.30%, 06/01/29 (a) | 200,000 | 220,894 |
| 2.30%, 03/01/30 (a) | 100,000 | 103,022 |
| 2.45%, 01/15/31 (a) | 150,000 | 156,248 |
| 3.90%, 10/15/46 (a) | 150,000 | 179,778 |
Security
Rate, Maturity Date | Face
Amount ($) | Value ($) |
| Boston Properties LP |
| 3.85%, 02/01/23 (a) | 500,000 | 519,345 |
| 3.13%, 09/01/23 (a) | 250,000 | 261,545 |
| 3.80%, 02/01/24 (a) | 195,000 | 207,866 |
| 3.65%, 02/01/26 (a) | 150,000 | 165,207 |
| 2.75%, 10/01/26 (a) | 100,000 | 106,903 |
| 4.50%, 12/01/28 (a) | 150,000 | 175,572 |
| 3.40%, 06/21/29 (a) | 200,000 | 219,426 |
| 2.90%, 03/15/30 (a) | 200,000 | 210,326 |
| 3.25%, 01/30/31 (a) | 200,000 | 215,702 |
| 2.55%, 04/01/32 (a) | 150,000 | 152,178 |
| Brandywine Operating Partnership LP |
| 4.10%, 10/01/24 (a) | 150,000 | 162,248 |
| 4.55%, 10/01/29 (a) | 100,000 | 113,344 |
| Brixmor Operating Partnership LP |
| 3.25%, 09/15/23 | 150,000 | 157,727 |
| 3.85%, 02/01/25 (a) | 150,000 | 162,827 |
| 4.13%, 06/15/26 (a) | 150,000 | 167,913 |
| 4.13%, 05/15/29 (a) | 150,000 | 171,066 |
| 4.05%, 07/01/30 (a) | 450,000 | 509,832 |
| 2.50%, 08/16/31 (a) | 250,000 | 251,322 |
| Camden Property Trust |
| 4.10%, 10/15/28 (a) | 200,000 | 231,548 |
| 3.15%, 07/01/29 (a) | 150,000 | 164,488 |
| 2.80%, 05/15/30 (a) | 100,000 | 106,884 |
| 3.35%, 11/01/49 (a) | 50,000 | 55,851 |
| Columbia Property Trust Operating Partnership LP |
| 4.15%, 04/01/25 (a) | 100,000 | 108,215 |
| Corporate Office Properties LP |
| 2.25%, 03/15/26 (a) | 250,000 | 257,897 |
| CubeSmart LP |
| 3.13%, 09/01/26 (a) | 150,000 | 161,046 |
| 4.38%, 02/15/29 (a) | 100,000 | 115,370 |
| 2.00%, 02/15/31 (a) | 250,000 | 246,900 |
| CyrusOne LP/CyrusOne Finance Corp. |
| 2.90%, 11/15/24 (a) | 100,000 | 105,037 |
| 3.45%, 11/15/29 (a) | 100,000 | 105,327 |
| 2.15%, 11/01/30 (a) | 150,000 | 142,923 |
| Digital Realty Trust LP |
| 4.75%, 10/01/25 (a) | 200,000 | 227,066 |
| 3.70%, 08/15/27 (a) | 150,000 | 168,244 |
| 4.45%, 07/15/28 (a) | 150,000 | 174,348 |
| 3.60%, 07/01/29 (a) | 150,000 | 166,899 |
| Duke Realty LP |
| 3.75%, 12/01/24 (a) | 150,000 | 162,746 |
| 3.25%, 06/30/26 (a) | 230,000 | 250,205 |
| 2.88%, 11/15/29 (a) | 50,000 | 53,280 |
| 1.75%, 07/01/30 (a) | 150,000 | 146,358 |
| 3.05%, 03/01/50 (a) | 50,000 | 50,298 |
| ERP Operating LP |
| 3.38%, 06/01/25 (a) | 100,000 | 108,337 |
| 2.85%, 11/01/26 (a) | 150,000 | 161,142 |
| 3.50%, 03/01/28 (a) | 150,000 | 166,831 |
| 4.15%, 12/01/28 (a) | 150,000 | 173,428 |
| 3.00%, 07/01/29 (a) | 100,000 | 108,536 |
| 2.50%, 02/15/30 (a) | 200,000 | 208,882 |
| 4.50%, 07/01/44 (a) | 150,000 | 192,948 |
| 4.50%, 06/01/45 (a) | 100,000 | 127,964 |
| 4.00%, 08/01/47 (a) | 100,000 | 120,809 |
| Essential Properties LP |
| 2.95%, 07/15/31 (a) | 100,000 | 101,052 |
| Essex Portfolio LP |
| 3.50%, 04/01/25 (a) | 330,000 | 357,512 |
| 4.00%, 03/01/29 (a) | 150,000 | 170,938 |
| 3.00%, 01/15/30 (a) | 100,000 | 106,682 |
Schwab Taxable Bond Funds | Annual Report
Schwab U.S. Aggregate Bond Index Fund
Portfolio Holdings as of August 31, 2021 (continued)
Security
Rate, Maturity Date | Face
Amount ($) | Value ($) |
| 1.65%, 01/15/31 (a) | 150,000 | 143,099 |
| 2.65%, 03/15/32 (a) | 150,000 | 154,884 |
| 2.65%, 09/01/50 (a) | 250,000 | 228,945 |
| Federal Realty Investment Trust |
| 3.95%, 01/15/24 (a) | 175,000 | 187,110 |
| 1.25%, 02/15/26 (a) | 150,000 | 149,816 |
| 3.25%, 07/15/27 (a) | 100,000 | 108,956 |
| 3.50%, 06/01/30 (a) | 100,000 | 110,355 |
| 4.50%, 12/01/44 (a) | 100,000 | 122,645 |
| Healthcare Realty Trust, Inc. |
| 2.05%, 03/15/31 (a) | 250,000 | 246,310 |
| Healthcare Trust of America Holdings LP |
| 3.50%, 08/01/26 (a) | 200,000 | 218,894 |
| 3.10%, 02/15/30 (a) | 150,000 | 160,403 |
| 2.00%, 03/15/31 (a) | 250,000 | 243,170 |
| Healthpeak Properties, Inc. |
| 3.40%, 02/01/25 (a) | 200,000 | 214,792 |
| 3.25%, 07/15/26 (a) | 250,000 | 272,195 |
| 3.50%, 07/15/29 (a) | 150,000 | 166,761 |
| 3.00%, 01/15/30 (a) | 100,000 | 107,198 |
| 2.88%, 01/15/31 (a) | 250,000 | 264,227 |
| Highwoods Realty LP |
| 4.20%, 04/15/29 (a) | 100,000 | 113,558 |
| 3.05%, 02/15/30 (a) | 150,000 | 158,990 |
| 2.60%, 02/01/31 (a) | 150,000 | 153,501 |
| Host Hotels & Resorts LP |
| 3.88%, 04/01/24 (a) | 100,000 | 106,561 |
| 4.00%, 06/15/25 (a) | 180,000 | 194,735 |
| 3.38%, 12/15/29 (a) | 150,000 | 156,579 |
| 3.50%, 09/15/30 (a) | 225,000 | 237,312 |
| Hudson Pacific Properties LP |
| 4.65%, 04/01/29 (a) | 100,000 | 116,553 |
| 3.25%, 01/15/30 (a) | 250,000 | 266,722 |
| Kilroy Realty LP |
| 4.75%, 12/15/28 (a) | 100,000 | 117,289 |
| 4.25%, 08/15/29 (a) | 195,000 | 223,041 |
| 3.05%, 02/15/30 (a) | 150,000 | 160,017 |
| 2.50%, 11/15/32 (a) | 150,000 | 150,837 |
| Kimco Realty Corp. |
| 3.40%, 11/01/22 (a) | 245,000 | 252,367 |
| 3.30%, 02/01/25 (a) | 250,000 | 268,662 |
| 1.90%, 03/01/28 (a) | 200,000 | 201,364 |
| 2.70%, 10/01/30 (a) | 200,000 | 207,418 |
| 4.25%, 04/01/45 (a) | 250,000 | 295,420 |
| 4.13%, 12/01/46 (a) | 100,000 | 117,625 |
| Lexington Realty Trust |
| 2.70%, 09/15/30 (a) | 150,000 | 154,421 |
| Life Storage LP |
| 3.88%, 12/15/27 (a) | 150,000 | 169,407 |
| 4.00%, 06/15/29 (a) | 100,000 | 113,721 |
| 2.20%, 10/15/30 (a) | 150,000 | 150,626 |
| Mid-America Apartments LP |
| 4.00%, 11/15/25 (a) | 100,000 | 111,017 |
| 1.10%, 09/15/26 (a) | 150,000 | 149,828 |
| 3.60%, 06/01/27 (a) | 150,000 | 167,155 |
| 4.20%, 06/15/28 (a) | 150,000 | 173,790 |
| 3.95%, 03/15/29 (a) | 50,000 | 57,065 |
| 2.75%, 03/15/30 (a) | 100,000 | 105,491 |
| 1.70%, 02/15/31 (a) | 150,000 | 144,545 |
| National Health Investors, Inc. |
| 3.00%, 02/01/31 (a) | 100,000 | 99,235 |
| National Retail Properties, Inc. |
| 4.30%, 10/15/28 (a) | 250,000 | 286,295 |
| 2.50%, 04/15/30 (a) | 100,000 | 102,921 |
Security
Rate, Maturity Date | Face
Amount ($) | Value ($) |
| 4.80%, 10/15/48 (a) | 100,000 | 128,021 |
| 3.10%, 04/15/50 (a) | 100,000 | 99,720 |
| Office Properties Income Trust |
| 4.25%, 05/15/24 (a) | 150,000 | 160,181 |
| 4.50%, 02/01/25 (a) | 225,000 | 243,423 |
| 2.65%, 06/15/26 (a) | 50,000 | 51,060 |
| Omega Healthcare Investors, Inc. |
| 4.95%, 04/01/24 (a) | 496,000 | 540,828 |
| 4.75%, 01/15/28 (a) | 100,000 | 113,580 |
| 3.63%, 10/01/29 (a) | 150,000 | 160,314 |
| 3.38%, 02/01/31 (a) | 250,000 | 258,890 |
| Physicians Realty LP |
| 4.30%, 03/15/27 (a) | 100,000 | 114,189 |
| Piedmont Operating Partnership LP |
| 3.40%, 06/01/23 (a) | 100,000 | 103,823 |
| 3.15%, 08/15/30 (a) | 150,000 | 155,283 |
| Prologis LP |
| 2.13%, 04/15/27 (a) | 150,000 | 156,858 |
| 4.38%, 02/01/29 (a) | 150,000 | 177,339 |
| 2.25%, 04/15/30 (a) | 250,000 | 257,935 |
| 1.25%, 10/15/30 (a) | 200,000 | 190,610 |
| 1.63%, 03/15/31 (a) | 100,000 | 98,074 |
| 3.00%, 04/15/50 (a) | 150,000 | 157,548 |
| 2.13%, 10/15/50 (a) | 200,000 | 176,458 |
| Public Storage |
| 0.88%, 02/15/26 (a) | 125,000 | 124,251 |
| 3.09%, 09/15/27 (a) | 150,000 | 165,334 |
| 1.85%, 05/01/28 (a) | 150,000 | 153,477 |
| 3.39%, 05/01/29 (a) | 150,000 | 167,329 |
| 2.30%, 05/01/31 (a) | 100,000 | 103,070 |
| Realty Income Corp. |
| 4.65%, 08/01/23 (a) | 300,000 | 321,057 |
| 3.88%, 04/15/25 (a) | 150,000 | 165,253 |
| 0.75%, 03/15/26 (a) | 250,000 | 245,735 |
| 4.13%, 10/15/26 (a) | 100,000 | 113,381 |
| 3.00%, 01/15/27 (a) | 330,000 | 357,512 |
| 3.25%, 01/15/31 (a) | 200,000 | 221,154 |
| 4.65%, 03/15/47 (a) | 150,000 | 198,525 |
| Regency Centers LP |
| 4.13%, 03/15/28 (a) | 150,000 | 170,448 |
| 3.70%, 06/15/30 (a) | 100,000 | 112,229 |
| 4.40%, 02/01/47 (a) | 100,000 | 120,485 |
| 4.65%, 03/15/49 (a) | 100,000 | 124,973 |
| Retail Properties of America, Inc. |
| 4.75%, 09/15/30 (a) | 200,000 | 224,412 |
| Rexford Industrial Realty LP |
| 2.15%, 09/01/31 (a) | 250,000 | 245,977 |
| Sabra Health Care LP/Sabra Capital Corp. |
| 3.90%, 10/15/29 (a) | 150,000 | 160,880 |
| Simon Property Group LP |
| 2.75%, 02/01/23 | 200,000 | 205,638 |
| 2.00%, 09/13/24 (a) | 250,000 | 259,077 |
| 3.38%, 10/01/24 (a) | 400,000 | 429,644 |
| 3.50%, 09/01/25 (a) | 250,000 | 272,837 |
| 3.30%, 01/15/26 (a) | 250,000 | 271,270 |
| 3.25%, 11/30/26 (a) | 250,000 | 273,302 |
| 3.38%, 12/01/27 (a) | 250,000 | 275,417 |
| 2.45%, 09/13/29 (a) | 250,000 | 258,425 |
| 2.65%, 07/15/30 (a) | 250,000 | 261,132 |
| 2.25%, 01/15/32 (a) | 200,000 | 198,439 |
| 6.75%, 02/01/40 (a) | 250,000 | 377,680 |
| 4.25%, 11/30/46 (a) | 150,000 | 178,776 |
| 3.25%, 09/13/49 (a) | 150,000 | 154,643 |
| 3.80%, 07/15/50 (a) | 250,000 | 282,197 |
Schwab Taxable Bond Funds | Annual Report
Schwab U.S. Aggregate Bond Index Fund
Portfolio Holdings as of August 31, 2021 (continued)
Security
Rate, Maturity Date | Face
Amount ($) | Value ($) |
| SITE Centers Corp. |
| 3.63%, 02/01/25 (a) | 150,000 | 159,128 |
| 4.70%, 06/01/27 (a) | 100,000 | 112,677 |
| SL Green Operating Partnership LP |
| 3.25%, 10/15/22 (a) | 100,000 | 102,694 |
| Spirit Realty LP |
| 4.45%, 09/15/26 (a) | 100,000 | 112,667 |
| 2.10%, 03/15/28 (a) | 100,000 | 100,549 |
| 3.40%, 01/15/30 (a) | 150,000 | 161,195 |
| 3.20%, 02/15/31 (a) | 150,000 | 159,126 |
| STORE Capital Corp. |
| 4.50%, 03/15/28 (a) | 100,000 | 114,090 |
| Sun Communities Operating LP |
| 2.70%, 07/15/31 (a) | 100,000 | 102,003 |
| Tanger Properties LP |
| 3.88%, 07/15/27 (a) | 100,000 | 108,822 |
| UDR, Inc. |
| 2.95%, 09/01/26 (a) | 150,000 | 160,991 |
| 3.50%, 01/15/28 (a) | 250,000 | 275,722 |
| 3.20%, 01/15/30 (a) | 150,000 | 163,106 |
| 2.10%, 08/01/32 (a) | 150,000 | 146,612 |
| Ventas Realty LP |
| 3.50%, 04/15/24 (a) | 100,000 | 106,590 |
| 2.65%, 01/15/25 (a) | 300,000 | 314,805 |
| 3.50%, 02/01/25 (a) | 150,000 | 161,318 |
| 3.25%, 10/15/26 (a) | 100,000 | 108,193 |
| 3.85%, 04/01/27 (a) | 250,000 | 279,325 |
| 4.40%, 01/15/29 (a) | 250,000 | 288,210 |
| 4.75%, 11/15/30 (a) | 100,000 | 119,326 |
| 5.70%, 09/30/43 (a) | 100,000 | 134,781 |
| 4.38%, 02/01/45 (a) | 100,000 | 117,019 |
| VEREIT Operating Partnership LP |
| 4.60%, 02/06/24 (a) | 200,000 | 216,748 |
| 3.95%, 08/15/27 (a) | 150,000 | 169,785 |
| 3.40%, 01/15/28 (a) | 200,000 | 218,514 |
| 2.20%, 06/15/28 (a) | 200,000 | 205,072 |
| 3.10%, 12/15/29 (a) | 100,000 | 107,768 |
| Vornado Realty LP |
| 3.50%, 01/15/25 (a) | 150,000 | 159,915 |
| 2.15%, 06/01/26 (a) | 200,000 | 204,852 |
| Welltower, Inc. |
| 4.50%, 01/15/24 (a) | 200,000 | 216,008 |
| 3.63%, 03/15/24 (a) | 300,000 | 320,481 |
| 4.00%, 06/01/25 (a) | 300,000 | 330,105 |
| 4.25%, 04/01/26 (a) | 350,000 | 393,480 |
| 4.25%, 04/15/28 (a) | 200,000 | 230,038 |
| 4.13%, 03/15/29 (a) | 150,000 | 171,280 |
| 2.75%, 01/15/31 (a) | 250,000 | 260,910 |
| 6.50%, 03/15/41 (a) | 150,000 | 217,899 |
| 4.95%, 09/01/48 (a) | 100,000 | 129,833 |
| WP Carey, Inc. |
| 4.00%, 02/01/25 (a) | 100,000 | 108,979 |
| 4.25%, 10/01/26 (a) | 150,000 | 170,241 |
| 2.40%, 02/01/31 (a) | 200,000 | 201,470 |
| 2.25%, 04/01/33 (a) | 100,000 | 97,686 |
| | | 40,714,951 |
| | | 443,314,305 |
| |
| Industrial 15.9% |
| Basic Industry 0.7% |
| Air Products & Chemicals, Inc. |
| 1.50%, 10/15/25 (a) | 250,000 | 256,630 |
| 2.05%, 05/15/30 (a) | 200,000 | 205,892 |
Security
Rate, Maturity Date | Face
Amount ($) | Value ($) |
| 2.70%, 05/15/40 (a) | 200,000 | 206,000 |
| 2.80%, 05/15/50 (a) | 200,000 | 204,804 |
| Albemarle Corp. |
| 5.45%, 12/01/44 (a) | 50,000 | 65,639 |
| AngloGold Ashanti Holdings PLC |
| 3.75%, 10/01/30 (a) | 200,000 | 210,178 |
| ArcelorMittal S.A. |
| 7.00%, 10/15/39 | 200,000 | 287,500 |
| 6.75%, 03/01/41 (f)(g) | 150,000 | 214,271 |
| Barrick Gold Corp. |
| 5.25%, 04/01/42 | 300,000 | 396,555 |
| Barrick North America Finance LLC |
| 5.70%, 05/30/41 | 100,000 | 138,564 |
| 5.75%, 05/01/43 | 150,000 | 210,809 |
| Barrick PD Australia Finance Pty Ltd. |
| 5.95%, 10/15/39 | 250,000 | 350,805 |
| BHP Billiton Finance (USA) Ltd. |
| 3.85%, 09/30/23 | 200,000 | 214,608 |
| 6.42%, 03/01/26 | 150,000 | 184,341 |
| 4.13%, 02/24/42 | 95,000 | 116,253 |
| 5.00%, 09/30/43 | 600,000 | 830,208 |
| Cabot Corp. |
| 4.00%, 07/01/29 (a) | 150,000 | 164,945 |
| Celanese US Holdings LLC |
| 4.63%, 11/15/22 | 100,000 | 104,874 |
| 3.50%, 05/08/24 (a) | 100,000 | 106,849 |
| 1.40%, 08/05/26 (a) | 100,000 | 99,830 |
| Celulosa Arauco y Constitucion S.A. |
| 4.50%, 08/01/24 (a) | 200,000 | 216,144 |
| 3.88%, 11/02/27 (a) | 200,000 | 216,690 |
| CF Industries, Inc. |
| 3.45%, 06/01/23 | 200,000 | 210,442 |
| 5.15%, 03/15/34 | 200,000 | 249,996 |
| 5.38%, 03/15/44 | 200,000 | 260,274 |
| DuPont de Nemours, Inc. |
| 4.21%, 11/15/23 (a) | 600,000 | 646,230 |
| 4.49%, 11/15/25 (a) | 400,000 | 451,904 |
| 4.73%, 11/15/28 (a) | 400,000 | 477,064 |
| 5.32%, 11/15/38 (a) | 350,000 | 463,694 |
| 5.42%, 11/15/48 (a) | 400,000 | 566,996 |
| Eastman Chemical Co. |
| 3.80%, 03/15/25 (a) | 150,000 | 163,563 |
| 4.50%, 12/01/28 (a) | 250,000 | 292,765 |
| 4.80%, 09/01/42 (a) | 250,000 | 312,282 |
| Ecolab, Inc. |
| 2.38%, 08/10/22 | 150,000 | 152,789 |
| 2.70%, 11/01/26 (a) | 150,000 | 161,325 |
| 3.25%, 12/01/27 (a) | 150,000 | 166,143 |
| 4.80%, 03/24/30 (a) | 200,000 | 245,836 |
| 1.30%, 01/30/31 (a) | 200,000 | 191,510 |
| 2.13%, 08/15/50 (a) | 250,000 | 228,142 |
| 2.75%, 08/18/55 (a)(c) | 150,000 | 148,769 |
| EI du Pont de Nemours & Co. |
| 1.70%, 07/15/25 (a) | 200,000 | 205,364 |
| Fibria Overseas Finance Ltd. |
| 5.50%, 01/17/27 | 200,000 | 231,110 |
| FMC Corp. |
| 3.20%, 10/01/26 (a) | 100,000 | 107,880 |
| 3.45%, 10/01/29 (a) | 100,000 | 109,244 |
| 4.50%, 10/01/49 (a) | 100,000 | 120,021 |
| Georgia-Pacific LLC |
| 7.75%, 11/15/29 | 150,000 | 216,263 |
| 8.88%, 05/15/31 | 100,000 | 159,278 |
Schwab Taxable Bond Funds | Annual Report
Schwab U.S. Aggregate Bond Index Fund
Portfolio Holdings as of August 31, 2021 (continued)
Security
Rate, Maturity Date | Face
Amount ($) | Value ($) |
| Huntsman International LLC |
| 4.50%, 05/01/29 (a) | 100,000 | 114,800 |
| 2.95%, 06/15/31 (a) | 250,000 | 259,165 |
| International Flavors & Fragrances, Inc. |
| 4.45%, 09/26/28 (a) | 100,000 | 116,969 |
| 4.38%, 06/01/47 (a) | 200,000 | 243,914 |
| 5.00%, 09/26/48 (a) | 150,000 | 199,886 |
| International Paper Co. |
| 3.80%, 01/15/26 (a) | 150,000 | 166,680 |
| 5.00%, 09/15/35 (a) | 250,000 | 317,587 |
| 7.30%, 11/15/39 | 100,000 | 157,832 |
| 6.00%, 11/15/41 (a) | 200,000 | 287,168 |
| 4.80%, 06/15/44 (a) | 100,000 | 128,969 |
| 4.40%, 08/15/47 (a) | 200,000 | 251,256 |
| 4.35%, 08/15/48 (a) | 100,000 | 125,656 |
| Kinross Gold Corp. |
| 4.50%, 07/15/27 (a) | 100,000 | 115,019 |
| Linde, Inc. |
| 2.65%, 02/05/25 (a) | 250,000 | 264,837 |
| 3.20%, 01/30/26 (a) | 150,000 | 163,800 |
| 1.10%, 08/10/30 (a) | 200,000 | 189,674 |
| 2.00%, 08/10/50 (a) | 250,000 | 220,727 |
| LYB International Finance BV |
| 4.00%, 07/15/23 | 85,000 | 90,480 |
| 5.25%, 07/15/43 | 150,000 | 197,616 |
| 4.88%, 03/15/44 (a) | 150,000 | 190,605 |
| LYB International Finance II BV |
| 3.50%, 03/02/27 (a) | 250,000 | 275,272 |
| LYB International Finance III LLC |
| 2.88%, 05/01/25 | 100,000 | 106,831 |
| 1.25%, 10/01/25 (a) | 200,000 | 200,320 |
| 3.38%, 05/01/30 (a) | 200,000 | 220,662 |
| 2.25%, 10/01/30 (a) | 250,000 | 254,237 |
| 3.38%, 10/01/40 (a) | 250,000 | 265,002 |
| 4.20%, 10/15/49 (a) | 100,000 | 117,612 |
| 4.20%, 05/01/50 (a) | 250,000 | 294,377 |
| 3.63%, 04/01/51 (a) | 250,000 | 272,482 |
| 3.80%, 10/01/60 (a) | 150,000 | 164,697 |
| LyondellBasell Industries N.V. |
| 4.63%, 02/26/55 (a) | 100,000 | 126,209 |
| NewMarket Corp. |
| 2.70%, 03/18/31 (a) | 200,000 | 203,290 |
| Newmont Corp. |
| 3.70%, 03/15/23 (a) | 127,000 | 132,098 |
| 2.80%, 10/01/29 (a) | 100,000 | 105,339 |
| 2.25%, 10/01/30 (a) | 100,000 | 100,886 |
| 5.88%, 04/01/35 | 100,000 | 135,591 |
| 4.88%, 03/15/42 (a) | 330,000 | 423,637 |
| 5.45%, 06/09/44 (a) | 100,000 | 138,932 |
| Nucor Corp. |
| 2.00%, 06/01/25 (a) | 250,000 | 259,190 |
| 3.95%, 05/01/28 (a) | 250,000 | 285,830 |
| 2.70%, 06/01/30 (a) | 250,000 | 264,495 |
| 2.98%, 12/15/55 (a)(c) | 200,000 | 203,046 |
| Nutrien Ltd. |
| 3.15%, 10/01/22 (a) | 95,000 | 97,210 |
| 1.90%, 05/13/23 | 200,000 | 204,684 |
| 3.63%, 03/15/24 (a) | 200,000 | 213,452 |
| 3.38%, 03/15/25 (a) | 180,000 | 194,148 |
| 4.20%, 04/01/29 (a) | 100,000 | 115,513 |
| 5.88%, 12/01/36 | 200,000 | 274,818 |
| 6.13%, 01/15/41 (a) | 145,000 | 211,139 |
| 4.90%, 06/01/43 (a) | 250,000 | 323,415 |
| 5.25%, 01/15/45 (a) | 150,000 | 202,574 |
Security
Rate, Maturity Date | Face
Amount ($) | Value ($) |
| 5.00%, 04/01/49 (a) | 100,000 | 134,918 |
| 3.95%, 05/13/50 (a) | 150,000 | 176,475 |
| Packaging Corp. of America |
| 4.50%, 11/01/23 (a) | 300,000 | 322,734 |
| 3.40%, 12/15/27 (a) | 100,000 | 110,274 |
| 3.00%, 12/15/29 (a) | 150,000 | 160,611 |
| 4.05%, 12/15/49 (a) | 100,000 | 119,737 |
| PPG Industries, Inc. |
| 3.20%, 03/15/23 (a) | 100,000 | 104,002 |
| 2.40%, 08/15/24 (a) | 100,000 | 104,825 |
| 2.80%, 08/15/29 (a) | 100,000 | 106,480 |
| 2.55%, 06/15/30 (a) | 200,000 | 209,340 |
| Reliance Steel & Aluminum Co. |
| 2.15%, 08/15/30 (a) | 200,000 | 198,532 |
| Rio Tinto Alcan, Inc. |
| 7.25%, 03/15/31 | 100,000 | 143,259 |
| Rio Tinto Finance (USA) Ltd. |
| 3.75%, 06/15/25 (a) | 150,000 | 165,330 |
| 7.13%, 07/15/28 | 100,000 | 135,476 |
| 5.20%, 11/02/40 | 250,000 | 343,937 |
| Rio Tinto Finance (USA) PLC |
| 4.75%, 03/22/42 (a) | 200,000 | 265,894 |
| 4.13%, 08/21/42 (a) | 200,000 | 248,114 |
| RPM International, Inc. |
| 4.55%, 03/01/29 (a) | 100,000 | 115,876 |
| 4.25%, 01/15/48 (a) | 100,000 | 114,375 |
| Southern Copper Corp. |
| 3.88%, 04/23/25 | 250,000 | 272,572 |
| 7.50%, 07/27/35 | 300,000 | 437,475 |
| 6.75%, 04/16/40 | 300,000 | 428,394 |
| 5.25%, 11/08/42 | 250,000 | 321,140 |
| 5.88%, 04/23/45 | 250,000 | 348,297 |
| Steel Dynamics, Inc. |
| 2.80%, 12/15/24 (a) | 100,000 | 105,435 |
| 2.40%, 06/15/25 (a) | 150,000 | 156,527 |
| 5.00%, 12/15/26 (a) | 200,000 | 207,652 |
| 1.65%, 10/15/27 (a) | 150,000 | 150,116 |
| 3.45%, 04/15/30 (a) | 100,000 | 109,687 |
| 3.25%, 10/15/50 (a) | 150,000 | 152,526 |
| Suzano Austria GmbH |
| 6.00%, 01/15/29 (a) | 400,000 | 478,772 |
| 5.00%, 01/15/30 (a) | 200,000 | 227,738 |
| 3.75%, 01/15/31 (a) | 250,000 | 263,225 |
| 3.13%, 01/15/32 (a) | 200,000 | 200,326 |
| Teck Resources Ltd. |
| 3.90%, 07/15/30 (a) | 200,000 | 218,624 |
| 6.13%, 10/01/35 | 75,000 | 97,160 |
| 6.00%, 08/15/40 (a) | 100,000 | 129,291 |
| 6.25%, 07/15/41 (a) | 100,000 | 133,692 |
| 5.20%, 03/01/42 (a) | 150,000 | 180,363 |
| 5.40%, 02/01/43 (a) | 100,000 | 123,637 |
| The Dow Chemical Co. |
| 4.55%, 11/30/25 (a) | 107,000 | 121,731 |
| 3.63%, 05/15/26 (a) | 150,000 | 166,172 |
| 7.38%, 11/01/29 | 174,000 | 243,233 |
| 2.10%, 11/15/30 (a) | 250,000 | 251,877 |
| 4.25%, 10/01/34 (a) | 150,000 | 175,577 |
| 9.40%, 05/15/39 | 100,000 | 183,592 |
| 5.25%, 11/15/41 (a) | 100,000 | 132,632 |
| 4.38%, 11/15/42 (a) | 250,000 | 301,625 |
| 4.63%, 10/01/44 (a) | 100,000 | 124,858 |
| 5.55%, 11/30/48 (a) | 150,000 | 213,461 |
| 4.80%, 05/15/49 (a) | 300,000 | 390,873 |
| 3.60%, 11/15/50 (a) | 250,000 | 275,127 |
Schwab Taxable Bond Funds | Annual Report
Schwab U.S. Aggregate Bond Index Fund
Portfolio Holdings as of August 31, 2021 (continued)
Security
Rate, Maturity Date | Face
Amount ($) | Value ($) |
| The Mosaic Co. |
| 3.25%, 11/15/22 (a) | 300,000 | 309,351 |
| 4.05%, 11/15/27 (a) | 250,000 | 283,097 |
| 4.88%, 11/15/41 (a) | 100,000 | 119,450 |
| 5.63%, 11/15/43 (a) | 100,000 | 134,097 |
| The Sherwin-Williams Co. |
| 3.13%, 06/01/24 (a) | 100,000 | 106,385 |
| 3.45%, 08/01/25 (a) | 200,000 | 217,782 |
| 3.45%, 06/01/27 (a) | 250,000 | 276,665 |
| 2.95%, 08/15/29 (a) | 200,000 | 215,254 |
| 2.30%, 05/15/30 (a) | 100,000 | 102,459 |
| 4.00%, 12/15/42 (a) | 100,000 | 116,919 |
| 4.50%, 06/01/47 (a) | 350,000 | 440,947 |
| 3.80%, 08/15/49 (a) | 100,000 | 115,843 |
| 3.30%, 05/15/50 (a) | 100,000 | 107,739 |
| Vale Overseas Ltd. |
| 6.25%, 08/10/26 | 450,000 | 543,141 |
| 3.75%, 07/08/30 (a) | 400,000 | 426,636 |
| 8.25%, 01/17/34 | 100,000 | 149,240 |
| 6.88%, 11/21/36 | 350,000 | 492,229 |
| 6.88%, 11/10/39 | 200,000 | 286,960 |
| Vale S.A. |
| 5.63%, 09/11/42 | 100,000 | 129,118 |
| Westlake Chemical Corp. |
| 3.60%, 08/15/26 (a) | 100,000 | 110,391 |
| 3.38%, 06/15/30 (a) | 250,000 | 272,370 |
| 5.00%, 08/15/46 (a) | 100,000 | 128,284 |
| 4.38%, 11/15/47 (a) | 100,000 | 117,693 |
| 3.13%, 08/15/51 (a) | 150,000 | 145,325 |
| 3.38%, 08/15/61 (a) | 100,000 | 96,481 |
| WestRock MWV LLC |
| 7.95%, 02/15/31 | 150,000 | 215,114 |
| Weyerhaeuser Co. |
| 4.00%, 11/15/29 (a) | 150,000 | 172,163 |
| 4.00%, 04/15/30 (a) | 150,000 | 171,615 |
| 7.38%, 03/15/32 | 250,000 | 361,182 |
| WRKCo, Inc. |
| 3.75%, 03/15/25 (a) | 300,000 | 326,844 |
| 4.65%, 03/15/26 (a) | 250,000 | 285,135 |
| 4.00%, 03/15/28 (a) | 150,000 | 169,964 |
| 3.90%, 06/01/28 (a) | 100,000 | 112,858 |
| 4.90%, 03/15/29 (a) | 100,000 | 120,083 |
| 3.00%, 06/15/33 (a) | 250,000 | 266,547 |
| | | 39,979,858 |
| Capital Goods 1.5% |
| 3M Co. |
| 2.25%, 03/15/23 (a) | 250,000 | 257,070 |
| 3.25%, 02/14/24 (a) | 250,000 | 266,410 |
| 2.00%, 02/14/25 (a) | 150,000 | 156,078 |
| 2.65%, 04/15/25 (a) | 150,000 | 159,428 |
| 3.00%, 08/07/25 | 100,000 | 108,268 |
| 2.88%, 10/15/27 (a) | 250,000 | 273,507 |
| 3.63%, 09/14/28 (a) | 150,000 | 170,964 |
| 3.38%, 03/01/29 (a) | 350,000 | 391,569 |
| 3.05%, 04/15/30 (a) | 200,000 | 220,082 |
| 3.88%, 06/15/44 | 100,000 | 120,298 |
| 3.13%, 09/19/46 (a) | 100,000 | 107,677 |
| 3.63%, 10/15/47 (a) | 150,000 | 174,830 |
| 4.00%, 09/14/48 (a) | 250,000 | 308,182 |
| 3.25%, 08/26/49 (a) | 200,000 | 220,118 |
| 3.70%, 04/15/50 (a) | 100,000 | 118,908 |
| ABB Finance USA, Inc. |
| 3.80%, 04/03/28 (a) | 200,000 | 229,252 |
Security
Rate, Maturity Date | Face
Amount ($) | Value ($) |
| Acuity Brands Lighting, Inc. |
| 2.15%, 12/15/30 (a) | 100,000 | 99,248 |
| Allegion PLC |
| 3.50%, 10/01/29 (a) | 100,000 | 110,000 |
| Allegion US Holding Co., Inc. |
| 3.20%, 10/01/24 (a) | 250,000 | 265,685 |
| Amcor Finance USA, Inc. |
| 4.50%, 05/15/28 (a) | 100,000 | 116,983 |
| Amcor Flexibles North America, Inc. |
| 2.63%, 06/19/30 (a) | 250,000 | 259,927 |
| Amphenol Corp. |
| 3.20%, 04/01/24 (a) | 100,000 | 105,862 |
| 2.05%, 03/01/25 (a) | 100,000 | 103,760 |
| 2.80%, 02/15/30 (a) | 150,000 | 159,248 |
| Avery Dennison Corp. |
| 2.65%, 04/30/30 (a) | 100,000 | 103,910 |
| Berry Global, Inc. |
| 0.95%, 02/15/24 (a)(c) | 200,000 | 200,686 |
| 1.57%, 01/15/26 (a)(c) | 350,000 | 353,220 |
| Carlisle Cos., Inc. |
| 3.75%, 12/01/27 (a) | 150,000 | 167,402 |
| 2.75%, 03/01/30 (a) | 150,000 | 157,380 |
| Carrier Global Corp. |
| 2.24%, 02/15/25 (a) | 425,000 | 442,650 |
| 2.49%, 02/15/27 (a) | 250,000 | 263,447 |
| 2.72%, 02/15/30 (a) | 400,000 | 420,284 |
| 2.70%, 02/15/31 (a)(c) | 250,000 | 261,262 |
| 3.38%, 04/05/40 (a) | 350,000 | 374,580 |
| 3.58%, 04/05/50 (a)(c) | 325,000 | 354,770 |
| Caterpillar Financial Services Corp. |
| 1.90%, 09/06/22 | 150,000 | 152,585 |
| 1.95%, 11/18/22 | 150,000 | 153,131 |
| 2.63%, 03/01/23 | 100,000 | 103,519 |
| 0.65%, 07/07/23 | 400,000 | 402,664 |
| 0.45%, 09/14/23 | 250,000 | 250,722 |
| 3.65%, 12/07/23 | 250,000 | 268,460 |
| 2.85%, 05/17/24 | 100,000 | 106,270 |
| 3.30%, 06/09/24 | 200,000 | 215,200 |
| 2.15%, 11/08/24 | 150,000 | 157,259 |
| 3.25%, 12/01/24 | 100,000 | 108,622 |
| 1.45%, 05/15/25 | 300,000 | 307,071 |
| 0.80%, 11/13/25 | 200,000 | 199,766 |
| 2.40%, 08/09/26 | 362,000 | 386,156 |
| 1.10%, 09/14/27 | 250,000 | 249,342 |
| Caterpillar, Inc. |
| 3.40%, 05/15/24 (a) | 135,000 | 144,751 |
| 2.60%, 09/19/29 (a) | 100,000 | 106,851 |
| 2.60%, 04/09/30 (a) | 200,000 | 213,614 |
| 1.90%, 03/12/31 (a) | 200,000 | 202,188 |
| 5.20%, 05/27/41 | 150,000 | 208,986 |
| 3.80%, 08/15/42 | 350,000 | 419,335 |
| 4.30%, 05/15/44 (a) | 100,000 | 129,762 |
| 3.25%, 09/19/49 (a) | 100,000 | 111,454 |
| 3.25%, 04/09/50 (a) | 400,000 | 448,276 |
| 4.75%, 05/15/64 (a) | 100,000 | 146,158 |
| CNH Industrial Capital LLC |
| 1.95%, 07/02/23 | 250,000 | 256,180 |
| 4.20%, 01/15/24 | 200,000 | 215,724 |
| 1.88%, 01/15/26 (a) | 250,000 | 255,760 |
| CNH Industrial N.V. |
| 4.50%, 08/15/23 | 100,000 | 107,267 |
| 3.85%, 11/15/27 (a) | 100,000 | 111,703 |
| Crane Co. |
| 4.45%, 12/15/23 (a) | 100,000 | 107,765 |
Schwab Taxable Bond Funds | Annual Report
Schwab U.S. Aggregate Bond Index Fund
Portfolio Holdings as of August 31, 2021 (continued)
Security
Rate, Maturity Date | Face
Amount ($) | Value ($) |
| Deere & Co. |
| 2.75%, 04/15/25 (a) | 150,000 | 159,860 |
| 5.38%, 10/16/29 | 362,000 | 463,295 |
| 3.10%, 04/15/30 (a) | 150,000 | 166,157 |
| 3.90%, 06/09/42 (a) | 100,000 | 121,919 |
| 2.88%, 09/07/49 (a) | 100,000 | 106,426 |
| 3.75%, 04/15/50 (a) | 300,000 | 367,443 |
| Dover Corp. |
| 3.15%, 11/15/25 (a) | 150,000 | 161,661 |
| 5.38%, 03/01/41 (a) | 100,000 | 132,469 |
| Eagle Materials, Inc. |
| 2.50%, 07/01/31 (a) | 250,000 | 252,412 |
| Eaton Corp. |
| 2.75%, 11/02/22 | 350,000 | 359,933 |
| 3.10%, 09/15/27 (a) | 150,000 | 163,700 |
| 4.00%, 11/02/32 | 196,000 | 231,160 |
| 4.15%, 11/02/42 | 150,000 | 181,593 |
| 3.92%, 09/15/47 (a) | 100,000 | 118,206 |
| Emerson Electric Co. |
| 0.88%, 10/15/26 (a) | 250,000 | 246,960 |
| 1.80%, 10/15/27 (a) | 150,000 | 154,236 |
| 5.25%, 11/15/39 | 100,000 | 137,074 |
| 2.75%, 10/15/50 (a) | 200,000 | 202,556 |
| Flowserve Corp. |
| 3.50%, 10/01/30 (a) | 250,000 | 264,000 |
| Fortive Corp. |
| 4.30%, 06/15/46 (a) | 180,000 | 217,249 |
| Fortune Brands Home & Security, Inc. |
| 4.00%, 09/21/23 (a) | 150,000 | 160,170 |
| 3.25%, 09/15/29 (a) | 200,000 | 217,756 |
| General Dynamics Corp. |
| 2.25%, 11/15/22 (a) | 300,000 | 305,745 |
| 3.38%, 05/15/23 (a) | 100,000 | 105,023 |
| 1.88%, 08/15/23 (a) | 250,000 | 256,830 |
| 2.38%, 11/15/24 (a) | 250,000 | 263,310 |
| 3.25%, 04/01/25 (a) | 100,000 | 108,070 |
| 1.15%, 06/01/26 (a)(e) | 100,000 | 100,999 |
| 3.50%, 04/01/27 (a) | 100,000 | 111,644 |
| 3.75%, 05/15/28 (a) | 400,000 | 455,876 |
| 3.63%, 04/01/30 (a) | 150,000 | 170,715 |
| 2.25%, 06/01/31 (a) | 100,000 | 103,739 |
| 4.25%, 04/01/40 (a) | 200,000 | 248,900 |
| 2.85%, 06/01/41 (a) | 100,000 | 104,654 |
| 4.25%, 04/01/50 (a) | 200,000 | 259,474 |
| General Electric Co. |
| 3.38%, 03/11/24 | 200,000 | 213,552 |
| 3.45%, 05/15/24 (a) | 74,000 | 78,939 |
| 5.55%, 01/05/26 | 100,000 | 118,230 |
| 3.45%, 05/01/27 (a) | 350,000 | 386,148 |
| 3.63%, 05/01/30 (a) | 200,000 | 225,000 |
| 6.75%, 03/15/32 | 650,000 | 903,110 |
| 5.88%, 01/14/38 | 200,000 | 274,976 |
| 6.88%, 01/10/39 | 350,000 | 530,456 |
| 4.25%, 05/01/40 (a) | 200,000 | 238,872 |
| 4.50%, 03/11/44 | 225,000 | 277,522 |
| 4.35%, 05/01/50 (a) | 300,000 | 370,371 |
| Honeywell International, Inc. |
| 2.30%, 08/15/24 (a) | 200,000 | 210,504 |
| 1.35%, 06/01/25 (a) | 300,000 | 306,144 |
| 2.50%, 11/01/26 (a) | 300,000 | 320,118 |
| 1.10%, 03/01/27 (a) | 250,000 | 249,445 |
| 2.70%, 08/15/29 (a) | 150,000 | 161,229 |
| 1.95%, 06/01/30 (a) | 200,000 | 204,324 |
| 5.70%, 03/15/37 | 100,000 | 140,726 |
| 3.81%, 11/21/47 (a) | 350,000 | 425,537 |
| 2.80%, 06/01/50 (a) | 150,000 | 157,205 |
Security
Rate, Maturity Date | Face
Amount ($) | Value ($) |
| Hubbell, Inc. |
| 3.50%, 02/15/28 (a) | 100,000 | 110,420 |
| 2.30%, 03/15/31 (a) | 100,000 | 101,535 |
| Huntington Ingalls Industries, Inc. |
| 0.67%, 08/16/23 (a)(c) | 100,000 | 100,054 |
| 3.84%, 05/01/25 (a) | 200,000 | 218,114 |
| 3.48%, 12/01/27 (a) | 100,000 | 109,165 |
| 4.20%, 05/01/30 (a) | 100,000 | 114,714 |
| IDEX Corp. |
| 3.00%, 05/01/30 (a) | 200,000 | 213,200 |
| Illinois Tool Works, Inc. |
| 3.50%, 03/01/24 (a) | 150,000 | 160,076 |
| 2.65%, 11/15/26 (a) | 200,000 | 215,180 |
| 3.90%, 09/01/42 (a) | 300,000 | 360,960 |
| John Deere Capital Corp. |
| 2.15%, 09/08/22 | 500,000 | 509,940 |
| 0.25%, 01/17/23 | 150,000 | 150,147 |
| 2.80%, 03/06/23 | 200,000 | 207,764 |
| 0.40%, 10/10/23 | 300,000 | 300,567 |
| 3.45%, 01/10/24 | 150,000 | 160,412 |
| 2.60%, 03/07/24 | 150,000 | 158,003 |
| 0.45%, 06/07/24 | 250,000 | 250,040 |
| 3.35%, 06/12/24 | 100,000 | 107,837 |
| 2.05%, 01/09/25 | 100,000 | 104,533 |
| 0.70%, 01/15/26 | 100,000 | 99,256 |
| 2.65%, 06/10/26 | 200,000 | 215,540 |
| 1.05%, 06/17/26 | 250,000 | 250,482 |
| 1.75%, 03/09/27 | 200,000 | 206,060 |
| 3.05%, 01/06/28 | 250,000 | 275,462 |
| 3.45%, 03/07/29 | 100,000 | 113,013 |
| 2.80%, 07/18/29 | 150,000 | 163,041 |
| 2.45%, 01/09/30 | 100,000 | 105,756 |
| 1.45%, 01/15/31 | 200,000 | 195,046 |
| Johnson Controls International PLC |
| 3.63%, 07/02/24 (a) | 195,000 | 209,323 |
| 6.00%, 01/15/36 | 100,000 | 142,404 |
| 4.63%, 07/02/44 (a) | 195,000 | 243,968 |
| 5.13%, 09/14/45 (a) | 169,000 | 227,036 |
| 4.95%, 07/02/64 (a) | 100,000 | 138,540 |
| Johnson Controls International plc / Tyco Fire & Security Finance SCA |
| 1.75%, 09/15/30 (a) | 150,000 | 147,522 |
| Kennametal, Inc. |
| 4.63%, 06/15/28 (a) | 100,000 | 113,824 |
| L3Harris Technologies, Inc. |
| 3.85%, 06/15/23 (a) | 100,000 | 105,807 |
| 3.83%, 04/27/25 (a) | 150,000 | 164,297 |
| 4.40%, 06/15/28 (a) | 450,000 | 520,406 |
| 2.90%, 12/15/29 (a) | 150,000 | 159,788 |
| 1.80%, 01/15/31 (a) | 200,000 | 195,404 |
| 6.15%, 12/15/40 | 95,000 | 139,484 |
| 5.05%, 04/27/45 (a) | 100,000 | 133,786 |
| Leggett & Platt, Inc. |
| 3.80%, 11/15/24 (a) | 100,000 | 107,755 |
| 3.50%, 11/15/27 (a) | 100,000 | 109,564 |
| 4.40%, 03/15/29 (a) | 100,000 | 115,429 |
| Lennox International, Inc. |
| 1.35%, 08/01/25 (a) | 200,000 | 201,608 |
| 1.70%, 08/01/27 (a) | 150,000 | 150,911 |
| Lockheed Martin Corp. |
| 3.10%, 01/15/23 (a) | 250,000 | 258,380 |
| 2.90%, 03/01/25 (a) | 150,000 | 160,220 |
| 3.55%, 01/15/26 (a) | 450,000 | 497,907 |
| 3.60%, 03/01/35 (a) | 100,000 | 115,720 |
| 4.50%, 05/15/36 (a) | 150,000 | 189,854 |
| 4.07%, 12/15/42 | 200,000 | 246,004 |
Schwab Taxable Bond Funds | Annual Report
Schwab U.S. Aggregate Bond Index Fund
Portfolio Holdings as of August 31, 2021 (continued)
Security
Rate, Maturity Date | Face
Amount ($) | Value ($) |
| 3.80%, 03/01/45 (a) | 150,000 | 177,578 |
| 4.70%, 05/15/46 (a) | 250,000 | 335,345 |
| 2.80%, 06/15/50 (a) | 250,000 | 256,327 |
| 4.09%, 09/15/52 (a) | 538,000 | 681,049 |
| Martin Marietta Materials, Inc. |
| 0.65%, 07/15/23 (a) | 150,000 | 150,405 |
| 4.25%, 07/02/24 (a) | 100,000 | 108,957 |
| 3.45%, 06/01/27 (a) | 50,000 | 54,905 |
| 3.50%, 12/15/27 (a) | 200,000 | 222,178 |
| 2.50%, 03/15/30 (a) | 100,000 | 103,422 |
| 2.40%, 07/15/31 (a) | 200,000 | 204,954 |
| 4.25%, 12/15/47 (a) | 100,000 | 119,110 |
| 3.20%, 07/15/51 (a) | 150,000 | 154,005 |
| Masco Corp. |
| 2.00%, 10/01/30 (a) | 250,000 | 246,860 |
| 4.50%, 05/15/47 (a) | 300,000 | 367,233 |
| Mohawk Industries, Inc. |
| 3.85%, 02/01/23 (a) | 100,000 | 103,964 |
| 3.63%, 05/15/30 (a) | 160,000 | 177,400 |
| Northrop Grumman Corp. |
| 2.93%, 01/15/25 (a) | 500,000 | 531,740 |
| 3.20%, 02/01/27 (a) | 100,000 | 109,199 |
| 3.25%, 01/15/28 (a) | 500,000 | 546,880 |
| 4.40%, 05/01/30 (a) | 150,000 | 178,256 |
| 5.15%, 05/01/40 (a) | 100,000 | 132,747 |
| 5.05%, 11/15/40 | 400,000 | 528,520 |
| 4.75%, 06/01/43 | 150,000 | 194,926 |
| 4.03%, 10/15/47 (a) | 500,000 | 601,830 |
| 5.25%, 05/01/50 (a) | 100,000 | 142,589 |
| nVent Finance Sarl |
| 4.55%, 04/15/28 (a) | 150,000 | 166,923 |
| Oshkosh Corp. |
| 3.10%, 03/01/30 (a) | 100,000 | 106,907 |
| Otis Worldwide Corp. |
| 2.06%, 04/05/25 (a) | 200,000 | 207,340 |
| 2.29%, 04/05/27 (a) | 100,000 | 104,813 |
| 2.57%, 02/15/30 (a) | 250,000 | 261,530 |
| 3.11%, 02/15/40 (a) | 225,000 | 236,713 |
| 3.36%, 02/15/50 (a) | 125,000 | 136,235 |
| Owens Corning |
| 4.20%, 12/01/24 (a) | 150,000 | 164,241 |
| 3.95%, 08/15/29 (a) | 300,000 | 340,896 |
| 3.88%, 06/01/30 (a) | 100,000 | 112,070 |
| 4.30%, 07/15/47 (a) | 100,000 | 118,247 |
| 4.40%, 01/30/48 (a) | 100,000 | 120,143 |
| Parker-Hannifin Corp. |
| 2.70%, 06/14/24 (a) | 150,000 | 157,644 |
| 3.30%, 11/21/24 (a) | 250,000 | 268,570 |
| 3.25%, 03/01/27 (a) | 150,000 | 163,200 |
| 3.25%, 06/14/29 (a) | 150,000 | 163,223 |
| 6.25%, 05/15/38 | 150,000 | 213,058 |
| 4.45%, 11/21/44 (a) | 100,000 | 124,410 |
| 4.10%, 03/01/47 (a) | 100,000 | 118,974 |
| 4.00%, 06/14/49 (a) | 100,000 | 117,687 |
| Pentair Finance Sarl |
| 4.50%, 07/01/29 (a) | 75,000 | 87,407 |
| Precision Castparts Corp. |
| 2.50%, 01/15/23 (a) | 250,000 | 256,410 |
| 3.25%, 06/15/25 (a) | 100,000 | 108,524 |
| 4.38%, 06/15/45 (a) | 100,000 | 124,382 |
| Raytheon Technologies Corp. |
| 3.70%, 12/15/23 (a) | 100,000 | 106,598 |
| 3.20%, 03/15/24 (a) | 200,000 | 212,490 |
| 3.95%, 08/16/25 (a) | 350,000 | 388,136 |
| 2.65%, 11/01/26 (a) | 150,000 | 160,383 |
Security
Rate, Maturity Date | Face
Amount ($) | Value ($) |
| 3.50%, 03/15/27 (a) | 350,000 | 387,040 |
| 3.13%, 05/04/27 (a) | 200,000 | 218,126 |
| 4.13%, 11/16/28 (a) | 650,000 | 748,754 |
| 7.50%, 09/15/29 | 100,000 | 140,462 |
| 2.25%, 07/01/30 (a) | 250,000 | 255,750 |
| 6.05%, 06/01/36 | 500,000 | 704,035 |
| 6.13%, 07/15/38 | 450,000 | 644,085 |
| 4.45%, 11/16/38 (a) | 200,000 | 245,064 |
| 4.88%, 10/15/40 (c) | 150,000 | 193,392 |
| 4.70%, 12/15/41 | 100,000 | 127,189 |
| 4.50%, 06/01/42 | 650,000 | 812,831 |
| 4.80%, 12/15/43 (a) | 100,000 | 128,610 |
| 4.15%, 05/15/45 (a) | 100,000 | 119,640 |
| 3.75%, 11/01/46 (a) | 150,000 | 170,864 |
| 4.35%, 04/15/47 (a) | 150,000 | 185,724 |
| 4.05%, 05/04/47 (a) | 100,000 | 118,752 |
| 4.63%, 11/16/48 (a) | 450,000 | 583,191 |
| 3.13%, 07/01/50 (a) | 200,000 | 208,662 |
| 2.82%, 09/01/51 (a) | 200,000 | 196,943 |
| Republic Services, Inc. |
| 4.75%, 05/15/23 (a) | 82,000 | 87,133 |
| 2.50%, 08/15/24 (a) | 300,000 | 315,096 |
| 0.88%, 11/15/25 (a) | 200,000 | 198,410 |
| 2.90%, 07/01/26 (a) | 200,000 | 214,798 |
| 3.38%, 11/15/27 (a) | 150,000 | 165,558 |
| 3.95%, 05/15/28 (a) | 100,000 | 113,875 |
| 2.30%, 03/01/30 (a) | 300,000 | 307,881 |
| 1.45%, 02/15/31 (a) | 250,000 | 238,147 |
| 3.05%, 03/01/50 (a) | 100,000 | 105,056 |
| Rockwell Automation, Inc. |
| 3.50%, 03/01/29 (a) | 100,000 | 112,817 |
| 1.75%, 08/15/31 (a) | 150,000 | 148,772 |
| 4.20%, 03/01/49 (a) | 100,000 | 127,737 |
| 2.80%, 08/15/61 (a) | 150,000 | 149,872 |
| Roper Technologies, Inc. |
| 3.13%, 11/15/22 (a) | 150,000 | 153,960 |
| 3.65%, 09/15/23 (a) | 100,000 | 106,215 |
| 1.00%, 09/15/25 (a) | 250,000 | 249,565 |
| 3.85%, 12/15/25 (a) | 100,000 | 110,747 |
| 3.80%, 12/15/26 (a) | 150,000 | 167,925 |
| 1.40%, 09/15/27 (a) | 250,000 | 249,250 |
| 2.95%, 09/15/29 (a) | 100,000 | 107,553 |
| 2.00%, 06/30/30 (a) | 250,000 | 249,232 |
| 1.75%, 02/15/31 (a) | 250,000 | 242,352 |
| Snap-on, Inc. |
| 4.10%, 03/01/48 (a) | 100,000 | 125,154 |
| 3.10%, 05/01/50 (a) | 200,000 | 216,574 |
| Sonoco Products Co. |
| 3.13%, 05/01/30 (a) | 400,000 | 433,096 |
| 5.75%, 11/01/40 (a) | 150,000 | 205,410 |
| Stanley Black & Decker, Inc. |
| 4.25%, 11/15/28 (a) | 250,000 | 293,772 |
| 2.30%, 03/15/30 (a) | 200,000 | 208,986 |
| 5.20%, 09/01/40 | 100,000 | 135,145 |
| 4.85%, 11/15/48 (a) | 150,000 | 205,374 |
| 4.00%, 03/15/60 (a)(b) | 100,000 | 107,399 |
| Teledyne Technologies, Inc. |
| 0.65%, 04/01/23 | 200,000 | 200,096 |
| 2.25%, 04/01/28 (a) | 500,000 | 514,845 |
| Textron, Inc. |
| 4.00%, 03/15/26 (a) | 100,000 | 111,472 |
| 3.38%, 03/01/28 (a) | 200,000 | 217,910 |
| 3.00%, 06/01/30 (a) | 100,000 | 106,452 |
| 2.45%, 03/15/31 (a) | 250,000 | 254,182 |
Schwab Taxable Bond Funds | Annual Report
Schwab U.S. Aggregate Bond Index Fund
Portfolio Holdings as of August 31, 2021 (continued)
Security
Rate, Maturity Date | Face
Amount ($) | Value ($) |
| The Boeing Co. |
| 1.17%, 02/04/23 (a) | 250,000 | 250,667 |
| 2.80%, 03/01/23 (a) | 250,000 | 257,825 |
| 4.51%, 05/01/23 (a) | 820,000 | 869,372 |
| 1.95%, 02/01/24 | 275,000 | 282,023 |
| 1.43%, 02/04/24 (a) | 500,000 | 501,250 |
| 2.80%, 03/01/24 (a) | 200,000 | 208,428 |
| 4.88%, 05/01/25 (a) | 600,000 | 671,040 |
| 2.60%, 10/30/25 (a) | 50,000 | 52,042 |
| 2.75%, 02/01/26 (a) | 250,000 | 261,397 |
| 2.20%, 02/04/26 (a) | 950,000 | 957,780 |
| 3.10%, 05/01/26 (a) | 350,000 | 371,420 |
| 2.25%, 06/15/26 (a) | 50,000 | 51,172 |
| 2.80%, 03/01/27 (a) | 200,000 | 208,206 |
| 5.04%, 05/01/27 (a) | 450,000 | 519,138 |
| 3.25%, 02/01/28 (a) | 250,000 | 266,320 |
| 3.45%, 11/01/28 (a) | 150,000 | 160,515 |
| 3.20%, 03/01/29 (a) | 150,000 | 157,560 |
| 2.95%, 02/01/30 (a) | 150,000 | 154,383 |
| 5.15%, 05/01/30 (a) | 800,000 | 949,176 |
| 3.63%, 02/01/31 (a) | 350,000 | 379,834 |
| 3.60%, 05/01/34 (a) | 100,000 | 106,030 |
| 3.25%, 02/01/35 (a) | 150,000 | 153,819 |
| 6.63%, 02/15/38 | 200,000 | 272,742 |
| 3.55%, 03/01/38 (a) | 200,000 | 205,810 |
| 3.50%, 03/01/39 (a) | 150,000 | 152,061 |
| 6.88%, 03/15/39 | 230,000 | 322,812 |
| 5.88%, 02/15/40 | 100,000 | 129,831 |
| 5.71%, 05/01/40 (a) | 600,000 | 777,144 |
| 3.65%, 03/01/47 (a) | 150,000 | 151,466 |
| 3.63%, 03/01/48 (a) | 50,000 | 50,255 |
| 3.85%, 11/01/48 (a) | 100,000 | 104,132 |
| 3.90%, 05/01/49 (a) | 100,000 | 105,295 |
| 3.75%, 02/01/50 (a) | 175,000 | 181,948 |
| 5.81%, 05/01/50 (a) | 1,000,000 | 1,362,310 |
| 3.83%, 03/01/59 (a) | 150,000 | 152,201 |
| 3.95%, 08/01/59 (a) | 150,000 | 156,662 |
| 5.93%, 05/01/60 (a) | 800,000 | 1,113,160 |
| The Timken Co. |
| 4.50%, 12/15/28 (a) | 100,000 | 113,426 |
| Trane Technologies Global Holding Co., Ltd. |
| 4.25%, 06/15/23 | 150,000 | 159,855 |
| 3.75%, 08/21/28 (a) | 100,000 | 112,616 |
| 5.75%, 06/15/43 | 100,000 | 146,965 |
| 4.30%, 02/21/48 (a) | 150,000 | 184,779 |
| Trane Technologies Luxembourg Finance S.A. |
| 3.55%, 11/01/24 (a) | 150,000 | 161,876 |
| 3.50%, 03/21/26 (a) | 200,000 | 219,202 |
| 3.80%, 03/21/29 (a) | 100,000 | 113,481 |
| United Rentals North America, Inc. |
| 3.88%, 11/15/27 (a) | 200,000 | 210,320 |
| Valmont Industries, Inc. |
| 5.00%, 10/01/44 (a) | 100,000 | 123,075 |
| Vontier Corp. |
| 1.80%, 04/01/26 (a)(c) | 200,000 | 200,496 |
| 2.95%, 04/01/31 (a)(c) | 200,000 | 202,696 |
| Vulcan Materials Co. |
| 3.90%, 04/01/27 (a) | 100,000 | 113,236 |
| 3.50%, 06/01/30 (a) | 200,000 | 222,688 |
| 4.50%, 06/15/47 (a) | 150,000 | 185,343 |
| 4.70%, 03/01/48 (a) | 100,000 | 127,289 |
| Waste Connections, Inc. |
| 4.25%, 12/01/28 (a) | 100,000 | 116,737 |
| 3.50%, 05/01/29 (a) | 100,000 | 111,076 |
| 2.60%, 02/01/30 (a) | 150,000 | 157,121 |
Security
Rate, Maturity Date | Face
Amount ($) | Value ($) |
| Waste Management, Inc. |
| 2.90%, 09/15/22 (a) | 150,000 | 153,105 |
| 3.13%, 03/01/25 (a) | 250,000 | 268,602 |
| 0.75%, 11/15/25 (a) | 100,000 | 99,285 |
| 3.15%, 11/15/27 (a) | 200,000 | 219,950 |
| 1.15%, 03/15/28 (a) | 100,000 | 97,560 |
| 4.10%, 03/01/45 (a) | 262,000 | 319,040 |
| 4.15%, 07/15/49 (a) | 100,000 | 125,318 |
| 2.50%, 11/15/50 (a) | 250,000 | 238,252 |
| Westinghouse Air Brake Technologies Corp. |
| 4.40%, 03/15/24 (a)(f)(g) | 100,000 | 107,944 |
| 3.20%, 06/15/25 (a) | 200,000 | 213,394 |
| 3.45%, 11/15/26 (a) | 200,000 | 215,072 |
| 4.95%, 09/15/28 (a)(f)(g) | 250,000 | 291,740 |
| WW Grainger, Inc. |
| 1.85%, 02/15/25 (a) | 250,000 | 258,435 |
| 4.60%, 06/15/45 (a) | 100,000 | 132,042 |
| 4.20%, 05/15/47 (a) | 200,000 | 252,506 |
| Xylem, Inc. |
| 3.25%, 11/01/26 (a) | 200,000 | 219,210 |
| 1.95%, 01/30/28 (a) | 200,000 | 203,606 |
| 2.25%, 01/30/31 (a) | 150,000 | 152,459 |
| | | 81,195,854 |
| Communications 2.4% |
| Activision Blizzard, Inc. |
| 3.40%, 09/15/26 (a) | 150,000 | 165,297 |
| 1.35%, 09/15/30 (a) | 250,000 | 235,380 |
| 4.50%, 06/15/47 (a) | 100,000 | 124,370 |
| 2.50%, 09/15/50 (a) | 250,000 | 223,570 |
| America Movil, S.A.B. de CV |
| 3.63%, 04/22/29 (a) | 200,000 | 220,194 |
| 2.88%, 05/07/30 (a) | 200,000 | 211,346 |
| 6.38%, 03/01/35 | 200,000 | 288,144 |
| 6.13%, 03/30/40 | 430,000 | 619,557 |
| 4.38%, 07/16/42 | 400,000 | 489,828 |
| 4.38%, 04/22/49 (a) | 200,000 | 251,616 |
| American Tower Corp. |
| 3.50%, 01/31/23 | 100,000 | 104,331 |
| 3.00%, 06/15/23 | 150,000 | 156,585 |
| 0.60%, 01/15/24 | 250,000 | 249,938 |
| 5.00%, 02/15/24 | 350,000 | 385,917 |
| 3.38%, 05/15/24 (a) | 100,000 | 106,786 |
| 2.95%, 01/15/25 (a) | 150,000 | 159,224 |
| 2.40%, 03/15/25 (a) | 250,000 | 261,055 |
| 4.00%, 06/01/25 (a) | 150,000 | 164,823 |
| 4.40%, 02/15/26 (a) | 200,000 | 225,530 |
| 3.38%, 10/15/26 (a) | 150,000 | 163,355 |
| 2.75%, 01/15/27 (a) | 150,000 | 158,697 |
| 3.13%, 01/15/27 (a) | 130,000 | 139,836 |
| 3.55%, 07/15/27 (a) | 200,000 | 220,232 |
| 3.60%, 01/15/28 (a) | 100,000 | 110,248 |
| 1.50%, 01/31/28 (a) | 250,000 | 245,235 |
| 3.95%, 03/15/29 (a) | 100,000 | 112,538 |
| 3.80%, 08/15/29 (a) | 250,000 | 279,342 |
| 2.90%, 01/15/30 (a) | 150,000 | 157,991 |
| 1.88%, 10/15/30 (a) | 250,000 | 243,000 |
| 3.70%, 10/15/49 (a) | 100,000 | 110,269 |
| 3.10%, 06/15/50 (a) | 300,000 | 298,377 |
| 2.95%, 01/15/51 (a) | 250,000 | 243,323 |
| AT&T, Inc. |
| 2.63%, 12/01/22 (a) | 250,000 | 255,803 |
| 4.05%, 12/15/23 | 200,000 | 216,056 |
| 0.90%, 03/25/24 (a) | 250,000 | 250,535 |
| 4.45%, 04/01/24 (a) | 150,000 | 163,263 |
| 3.95%, 01/15/25 (a) | 300,000 | 330,303 |
Schwab Taxable Bond Funds | Annual Report
Schwab U.S. Aggregate Bond Index Fund
Portfolio Holdings as of August 31, 2021 (continued)
Security
Rate, Maturity Date | Face
Amount ($) | Value ($) |
| 3.40%, 05/15/25 (a) | 480,000 | 521,328 |
| 3.60%, 07/15/25 (a) | 200,000 | 218,898 |
| 4.13%, 02/17/26 (a) | 550,000 | 616,236 |
| 1.70%, 03/25/26 (a) | 450,000 | 456,142 |
| 2.95%, 07/15/26 (a) | 100,000 | 107,766 |
| 3.80%, 02/15/27 (a) | 150,000 | 167,556 |
| 4.25%, 03/01/27 (a) | 200,000 | 228,146 |
| 2.30%, 06/01/27 (a) | 500,000 | 521,585 |
| 1.65%, 02/01/28 (a) | 300,000 | 300,231 |
| 4.10%, 02/15/28 (a) | 327,000 | 373,264 |
| 4.35%, 03/01/29 (a) | 600,000 | 696,672 |
| 4.30%, 02/15/30 (a) | 547,000 | 635,948 |
| 2.75%, 06/01/31 (a) | 750,000 | 786,450 |
| 2.25%, 02/01/32 (a) | 550,000 | 547,057 |
| 2.55%, 12/01/33 (a)(c) | 857,000 | 861,816 |
| 6.15%, 09/15/34 | 200,000 | 270,346 |
| 4.50%, 05/15/35 (a) | 550,000 | 652,833 |
| 5.25%, 03/01/37 (a) | 500,000 | 635,160 |
| 4.90%, 08/15/37 (a) | 250,000 | 310,325 |
| 4.85%, 03/01/39 (a) | 350,000 | 429,369 |
| 6.00%, 08/15/40 (a) | 250,000 | 345,452 |
| 5.35%, 09/01/40 | 250,000 | 324,860 |
| 3.50%, 06/01/41 (a) | 550,000 | 581,185 |
| 5.15%, 03/15/42 | 200,000 | 254,692 |
| 4.90%, 06/15/42 | 150,000 | 187,695 |
| 4.30%, 12/15/42 (a) | 200,000 | 231,578 |
| 3.10%, 02/01/43 (a) | 350,000 | 348,054 |
| 4.65%, 06/01/44 (a) | 150,000 | 180,303 |
| 4.80%, 06/15/44 (a) | 200,000 | 245,334 |
| 4.35%, 06/15/45 (a) | 300,000 | 347,874 |
| 4.75%, 05/15/46 (a) | 300,000 | 368,295 |
| 5.15%, 11/15/46 (a) | 250,000 | 324,120 |
| 5.65%, 02/15/47 (a) | 150,000 | 205,197 |
| 5.45%, 03/01/47 (a) | 250,000 | 334,235 |
| 4.50%, 03/09/48 (a) | 400,000 | 477,760 |
| 4.55%, 03/09/49 (a) | 200,000 | 240,066 |
| 5.15%, 02/15/50 (a) | 300,000 | 389,931 |
| 3.65%, 06/01/51 (a) | 500,000 | 530,020 |
| 3.30%, 02/01/52 (a) | 550,000 | 548,630 |
| 3.50%, 09/15/53 (a)(c) | 1,485,000 | 1,526,372 |
| 3.55%, 09/15/55 (a)(c) | 1,473,000 | 1,508,190 |
| 3.80%, 12/01/57 (a)(c) | 1,311,000 | 1,397,985 |
| 3.65%, 09/15/59 (a)(c) | 1,274,000 | 1,312,921 |
| 3.85%, 06/01/60 (a) | 300,000 | 320,640 |
| 3.50%, 02/01/61 (a) | 350,000 | 348,064 |
| British Telecommunications PLC |
| 4.50%, 12/04/23 (a) | 200,000 | 216,516 |
| 5.13%, 12/04/28 (a) | 250,000 | 296,427 |
| 9.63%, 12/15/30 (f)(g) | 600,000 | 927,864 |
| CC Holdings GS V LLC/Crown Castle GS III Corp. |
| 3.85%, 04/15/23 | 200,000 | 210,756 |
| Charter Communications Operating LLC/Charter Communications Operating Capital |
| 4.50%, 02/01/24 (a) | 250,000 | 271,513 |
| 4.91%, 07/23/25 (a) | 1,000,000 | 1,132,670 |
| 3.75%, 02/15/28 (a) | 200,000 | 221,382 |
| 4.20%, 03/15/28 (a) | 200,000 | 226,296 |
| 5.05%, 03/30/29 (a) | 300,000 | 355,635 |
| 2.80%, 04/01/31 (a) | 350,000 | 359,128 |
| 2.30%, 02/01/32 (a) | 200,000 | 195,230 |
| 6.38%, 10/23/35 (a) | 480,000 | 642,019 |
| 5.38%, 04/01/38 (a) | 150,000 | 185,711 |
| 3.50%, 06/01/41 (a) | 300,000 | 303,666 |
| 6.48%, 10/23/45 (a) | 850,000 | 1,188,495 |
| 5.38%, 05/01/47 (a) | 450,000 | 555,232 |
| 5.75%, 04/01/48 (a) | 500,000 | 646,660 |
| 5.13%, 07/01/49 (a) | 200,000 | 241,860 |
Security
Rate, Maturity Date | Face
Amount ($) | Value ($) |
| 4.80%, 03/01/50 (a) | 500,000 | 587,625 |
| 3.70%, 04/01/51 (a) | 600,000 | 604,710 |
| 3.90%, 06/01/52 (a) | 300,000 | 310,467 |
| 6.83%, 10/23/55 (a) | 100,000 | 149,458 |
| 3.85%, 04/01/61 (a) | 400,000 | 398,460 |
| 4.40%, 12/01/61 (a) | 400,000 | 438,076 |
| Comcast Cable Communications Holdings, Inc. |
| 9.46%, 11/15/22 | 200,000 | 222,150 |
| Comcast Corp. |
| 3.60%, 03/01/24 | 100,000 | 107,678 |
| 3.70%, 04/15/24 (a) | 600,000 | 648,018 |
| 3.38%, 02/15/25 (a) | 200,000 | 216,354 |
| 3.10%, 04/01/25 (a) | 100,000 | 107,536 |
| 3.38%, 08/15/25 (a) | 150,000 | 163,412 |
| 3.95%, 10/15/25 (a) | 650,000 | 725,211 |
| 3.15%, 03/01/26 (a) | 550,000 | 598,152 |
| 2.35%, 01/15/27 (a) | 350,000 | 369,327 |
| 3.30%, 02/01/27 (a) | 300,000 | 329,739 |
| 3.30%, 04/01/27 (a) | 200,000 | 220,510 |
| 3.15%, 02/15/28 (a) | 350,000 | 384,513 |
| 3.55%, 05/01/28 (a) | 200,000 | 224,058 |
| 4.15%, 10/15/28 (a) | 850,000 | 987,819 |
| 2.65%, 02/01/30 (a) | 300,000 | 316,206 |
| 3.40%, 04/01/30 (a) | 250,000 | 277,943 |
| 4.25%, 10/15/30 (a) | 350,000 | 413,269 |
| 1.95%, 01/15/31 (a) | 300,000 | 298,899 |
| 1.50%, 02/15/31 (a) | 400,000 | 382,904 |
| 4.25%, 01/15/33 | 250,000 | 299,295 |
| 7.05%, 03/15/33 | 350,000 | 514,587 |
| 4.20%, 08/15/34 (a) | 250,000 | 298,052 |
| 5.65%, 06/15/35 | 100,000 | 136,461 |
| 4.40%, 08/15/35 (a) | 150,000 | 182,649 |
| 6.50%, 11/15/35 | 295,000 | 432,240 |
| 3.20%, 07/15/36 (a) | 100,000 | 109,193 |
| 6.45%, 03/15/37 | 100,000 | 148,461 |
| 3.90%, 03/01/38 (a) | 250,000 | 291,625 |
| 4.60%, 10/15/38 (a) | 400,000 | 501,880 |
| 3.25%, 11/01/39 (a) | 200,000 | 217,624 |
| 3.75%, 04/01/40 (a) | 500,000 | 575,150 |
| 4.65%, 07/15/42 | 200,000 | 254,448 |
| 4.75%, 03/01/44 | 150,000 | 195,725 |
| 4.60%, 08/15/45 (a) | 100,000 | 129,015 |
| 3.40%, 07/15/46 (a) | 200,000 | 218,510 |
| 4.00%, 08/15/47 (a) | 100,000 | 118,609 |
| 3.97%, 11/01/47 (a) | 500,000 | 590,255 |
| 4.00%, 03/01/48 (a) | 200,000 | 237,524 |
| 4.70%, 10/15/48 (a) | 600,000 | 791,754 |
| 4.00%, 11/01/49 (a) | 400,000 | 477,180 |
| 3.45%, 02/01/50 (a) | 400,000 | 439,844 |
| 2.80%, 01/15/51 (a) | 400,000 | 394,296 |
| 2.89%, 11/01/51 (a)(c) | 944,000 | 940,469 |
| 2.45%, 08/15/52 (a) | 400,000 | 368,968 |
| 4.05%, 11/01/52 (a) | 202,000 | 243,483 |
| 2.94%, 11/01/56 (a)(c) | 1,151,000 | 1,141,216 |
| 4.95%, 10/15/58 (a) | 200,000 | 287,316 |
| 2.65%, 08/15/62 (a) | 300,000 | 279,237 |
| 2.99%, 11/01/63 (a)(c) | 689,000 | 679,685 |
| Crown Castle International Corp. |
| 3.15%, 07/15/23 (a) | 150,000 | 157,119 |
| 1.35%, 07/15/25 (a) | 200,000 | 201,684 |
| 4.45%, 02/15/26 (a) | 195,000 | 219,736 |
| 3.70%, 06/15/26 (a) | 100,000 | 110,144 |
| 1.05%, 07/15/26 (a) | 150,000 | 147,741 |
| 3.65%, 09/01/27 (a) | 200,000 | 221,702 |
| 3.80%, 02/15/28 (a) | 150,000 | 167,091 |
| 4.30%, 02/15/29 (a) | 100,000 | 115,383 |
| 3.10%, 11/15/29 (a) | 200,000 | 213,618 |
Schwab Taxable Bond Funds | Annual Report
Schwab U.S. Aggregate Bond Index Fund
Portfolio Holdings as of August 31, 2021 (continued)
Security
Rate, Maturity Date | Face
Amount ($) | Value ($) |
| 3.30%, 07/01/30 (a) | 200,000 | 216,198 |
| 2.25%, 01/15/31 (a) | 200,000 | 198,858 |
| 2.10%, 04/01/31 (a) | 200,000 | 196,196 |
| 2.50%, 07/15/31 (a) | 150,000 | 152,385 |
| 2.90%, 04/01/41 (a) | 250,000 | 246,313 |
| 4.75%, 05/15/47 (a) | 100,000 | 125,404 |
| 5.20%, 02/15/49 (a) | 150,000 | 197,262 |
| 4.15%, 07/01/50 (a) | 150,000 | 174,699 |
| 3.25%, 01/15/51 (a) | 200,000 | 203,232 |
| Deutsche Telekom International Finance BV |
| 8.75%, 06/15/30 (f)(g) | 750,000 | 1,128,930 |
| 9.25%, 06/01/32 | 150,000 | 246,600 |
| Discovery Communications LLC |
| 3.80%, 03/13/24 (a) | 250,000 | 267,293 |
| 3.95%, 06/15/25 (a) | 250,000 | 273,960 |
| 4.90%, 03/11/26 (a) | 100,000 | 114,111 |
| 3.95%, 03/20/28 (a) | 250,000 | 279,685 |
| 4.13%, 05/15/29 (a) | 300,000 | 339,249 |
| 3.63%, 05/15/30 (a) | 250,000 | 274,475 |
| 5.00%, 09/20/37 (a) | 150,000 | 183,677 |
| 4.88%, 04/01/43 | 150,000 | 181,214 |
| 5.20%, 09/20/47 (a) | 260,000 | 327,655 |
| 5.30%, 05/15/49 (a) | 150,000 | 191,774 |
| 4.65%, 05/15/50 (a) | 200,000 | 237,066 |
| 4.00%, 09/15/55 (a) | 457,000 | 491,472 |
| Electronic Arts, Inc. |
| 2.95%, 02/15/51 (a) | 250,000 | 247,765 |
| Fox Corp. |
| 4.03%, 01/25/24 (a) | 250,000 | 269,408 |
| 3.05%, 04/07/25 (a) | 100,000 | 106,978 |
| 4.71%, 01/25/29 (a) | 400,000 | 471,700 |
| 3.50%, 04/08/30 (a) | 200,000 | 220,612 |
| 5.48%, 01/25/39 (a) | 300,000 | 390,039 |
| 5.58%, 01/25/49 (a) | 250,000 | 344,037 |
| Grupo Televisa S.A.B. |
| 6.63%, 03/18/25 | 200,000 | 236,110 |
| 6.63%, 01/15/40 | 200,000 | 288,716 |
| 5.00%, 05/13/45 (a) | 300,000 | 372,540 |
| 5.25%, 05/24/49 (a) | 200,000 | 264,880 |
| Koninklijke KPN N.V. |
| 8.38%, 10/01/30 | 100,000 | 143,894 |
| NBCUniversal Media LLC |
| 5.95%, 04/01/41 | 100,000 | 148,640 |
| 4.45%, 01/15/43 | 230,000 | 286,785 |
| Omnicom Group, Inc. |
| 2.45%, 04/30/30 (a) | 200,000 | 205,292 |
| 4.20%, 06/01/30 (a) | 100,000 | 115,881 |
| 2.60%, 08/01/31 (a) | 200,000 | 206,462 |
| Omnicom Group, Inc./Omnicom Capital, Inc. |
| 3.65%, 11/01/24 (a) | 130,000 | 140,976 |
| 3.60%, 04/15/26 (a) | 250,000 | 276,518 |
| Orange S.A. |
| 9.00%, 03/01/31 | 600,000 | 949,656 |
| 5.38%, 01/13/42 | 150,000 | 205,580 |
| 5.50%, 02/06/44 (a) | 150,000 | 211,484 |
| Rogers Communications, Inc. |
| 3.00%, 03/15/23 (a) | 150,000 | 154,857 |
| 4.10%, 10/01/23 (a) | 150,000 | 159,671 |
| 3.63%, 12/15/25 (a) | 300,000 | 329,451 |
| 2.90%, 11/15/26 (a) | 150,000 | 160,734 |
| 4.50%, 03/15/43 (a) | 100,000 | 117,570 |
| 5.45%, 10/01/43 (a) | 200,000 | 265,790 |
| 5.00%, 03/15/44 (a) | 330,000 | 415,312 |
| 4.30%, 02/15/48 (a) | 100,000 | 115,469 |
Security
Rate, Maturity Date | Face
Amount ($) | Value ($) |
| 4.35%, 05/01/49 (a) | 150,000 | 175,953 |
| 3.70%, 11/15/49 (a) | 150,000 | 160,175 |
| T-Mobile USA, Inc. |
| 3.50%, 04/15/25 (a) | 500,000 | 540,735 |
| 1.50%, 02/15/26 (a) | 250,000 | 252,083 |
| 3.75%, 04/15/27 (a) | 750,000 | 832,612 |
| 2.05%, 02/15/28 (a) | 550,000 | 559,691 |
| 3.88%, 04/15/30 (a) | 1,300,000 | 1,456,520 |
| 2.55%, 02/15/31 (a) | 650,000 | 664,319 |
| 2.25%, 11/15/31 (a) | 250,000 | 249,010 |
| 4.38%, 04/15/40 (a) | 550,000 | 644,176 |
| 3.00%, 02/15/41 (a) | 550,000 | 546,408 |
| 4.50%, 04/15/50 (a) | 500,000 | 600,860 |
| 3.30%, 02/15/51 (a) | 550,000 | 552,392 |
| 3.40%, 10/15/52 (a)(c) | 300,000 | 304,452 |
| 3.60%, 11/15/60 (a)(c) | 150,000 | 153,548 |
| 3.60%, 11/15/60 (a) | 200,000 | 206,304 |
| TCI Communications, Inc. |
| 7.13%, 02/15/28 | 30,000 | 40,024 |
| Telefonica Emisiones S.A. |
| 4.10%, 03/08/27 | 450,000 | 508,567 |
| 7.05%, 06/20/36 | 365,000 | 531,841 |
| 4.67%, 03/06/38 | 150,000 | 178,347 |
| 5.21%, 03/08/47 | 500,000 | 631,145 |
| 4.90%, 03/06/48 | 300,000 | 365,976 |
| 5.52%, 03/01/49 (a) | 300,000 | 396,318 |
| Telefonica Europe BV |
| 8.25%, 09/15/30 | 100,000 | 146,616 |
| TELUS Corp. |
| 3.70%, 09/15/27 (a) | 350,000 | 395,342 |
| 4.30%, 06/15/49 (a) | 150,000 | 183,237 |
| The Bell Telephone Co of Canada |
| 0.75%, 03/17/24 | 100,000 | 100,409 |
| 4.46%, 04/01/48 (a) | 300,000 | 374,004 |
| 4.30%, 07/29/49 (a) | 100,000 | 121,511 |
| 3.65%, 03/17/51 (a) | 100,000 | 110,795 |
| 3.20%, 02/15/52 (a) | 200,000 | 206,522 |
| The Interpublic Group of Cos., Inc. |
| 4.75%, 03/30/30 (a) | 150,000 | 179,606 |
| 2.40%, 03/01/31 (a) | 100,000 | 102,188 |
| 3.38%, 03/01/41 (a) | 100,000 | 105,304 |
| 5.40%, 10/01/48 (a) | 100,000 | 136,625 |
| The Walt Disney Co. |
| 1.65%, 09/01/22 | 200,000 | 202,872 |
| 3.00%, 09/15/22 | 150,000 | 154,266 |
| 1.75%, 08/30/24 (a) | 150,000 | 155,300 |
| 3.70%, 09/15/24 (a) | 300,000 | 325,746 |
| 3.35%, 03/24/25 | 250,000 | 271,795 |
| 3.70%, 10/15/25 (a) | 200,000 | 220,862 |
| 1.75%, 01/13/26 | 400,000 | 413,376 |
| 3.70%, 03/23/27 | 250,000 | 282,630 |
| 2.20%, 01/13/28 | 200,000 | 208,708 |
| 2.00%, 09/01/29 (a) | 350,000 | 356,800 |
| 3.80%, 03/22/30 | 200,000 | 231,070 |
| 2.65%, 01/13/31 | 500,000 | 532,205 |
| 6.55%, 03/15/33 | 300,000 | 431,166 |
| 6.20%, 12/15/34 | 150,000 | 213,023 |
| 6.40%, 12/15/35 | 230,000 | 340,002 |
| 6.15%, 03/01/37 | 150,000 | 216,596 |
| 6.65%, 11/15/37 | 200,000 | 305,764 |
| 4.63%, 03/23/40 (a) | 350,000 | 447,853 |
| 3.50%, 05/13/40 (a) | 500,000 | 562,530 |
| 4.13%, 12/01/41 | 150,000 | 182,141 |
| 4.75%, 09/15/44 (a) | 150,000 | 197,274 |
| 4.95%, 10/15/45 (a) | 200,000 | 270,732 |
| 4.75%, 11/15/46 (a) | 100,000 | 133,005 |
Schwab Taxable Bond Funds | Annual Report
Schwab U.S. Aggregate Bond Index Fund
Portfolio Holdings as of August 31, 2021 (continued)
Security
Rate, Maturity Date | Face
Amount ($) | Value ($) |
| 2.75%, 09/01/49 (a) | 350,000 | 348,897 |
| 4.70%, 03/23/50 (a) | 300,000 | 402,765 |
| 3.60%, 01/13/51 (a) | 600,000 | 693,948 |
| 3.80%, 05/13/60 (a) | 300,000 | 358,908 |
| Time Warner Cable LLC |
| 6.55%, 05/01/37 | 200,000 | 273,638 |
| 7.30%, 07/01/38 | 300,000 | 437,646 |
| 6.75%, 06/15/39 | 250,000 | 350,577 |
| 5.88%, 11/15/40 (a) | 324,000 | 417,769 |
| 5.50%, 09/01/41 (a) | 250,000 | 313,302 |
| 4.50%, 09/15/42 (a) | 300,000 | 337,206 |
| Time Warner Entertainment Co. LP |
| 8.38%, 03/15/23 | 357,000 | 399,308 |
| 8.38%, 07/15/33 | 200,000 | 299,262 |
| TWDC Enterprises 18 Corp. |
| 2.35%, 12/01/22 | 200,000 | 205,176 |
| 3.00%, 02/13/26 | 350,000 | 379,176 |
| 1.85%, 07/30/26 | 150,000 | 155,643 |
| 2.95%, 06/15/27 | 200,000 | 219,238 |
| 4.38%, 08/16/41 | 100,000 | 124,408 |
| 4.13%, 06/01/44 | 250,000 | 305,697 |
| 3.00%, 07/30/46 | 100,000 | 104,273 |
| Verizon Communications, Inc. |
| 4.15%, 03/15/24 (a) | 100,000 | 108,283 |
| 0.75%, 03/22/24 | 500,000 | 502,120 |
| 3.50%, 11/01/24 (a) | 330,000 | 356,832 |
| 3.38%, 02/15/25 | 500,000 | 541,825 |
| 0.85%, 11/20/25 (a) | 700,000 | 694,869 |
| 1.45%, 03/20/26 (a) | 200,000 | 202,762 |
| 2.63%, 08/15/26 | 450,000 | 479,232 |
| 4.13%, 03/16/27 | 650,000 | 743,125 |
| 3.00%, 03/22/27 (a) | 150,000 | 162,329 |
| 2.10%, 03/22/28 (a) | 500,000 | 513,605 |
| 4.33%, 09/21/28 | 800,000 | 933,848 |
| 3.88%, 02/08/29 (a) | 200,000 | 228,134 |
| 4.02%, 12/03/29 (a) | 800,000 | 921,800 |
| 3.15%, 03/22/30 (a) | 250,000 | 271,190 |
| 1.50%, 09/18/30 (a) | 350,000 | 337,582 |
| 1.68%, 10/30/30 (a) | 317,000 | 306,209 |
| 7.75%, 12/01/30 | 52,000 | 75,989 |
| 1.75%, 01/20/31 (a) | 500,000 | 484,005 |
| 2.55%, 03/21/31 (a) | 1,000,000 | 1,033,360 |
| 4.50%, 08/10/33 | 650,000 | 787,865 |
| 4.40%, 11/01/34 (a) | 630,000 | 760,479 |
| 4.27%, 01/15/36 | 505,000 | 603,743 |
| 5.25%, 03/16/37 | 400,000 | 530,576 |
| 4.81%, 03/15/39 | 350,000 | 444,997 |
| 2.65%, 11/20/40 (a) | 500,000 | 484,835 |
| 3.40%, 03/22/41 (a) | 750,000 | 803,692 |
| 4.75%, 11/01/41 | 274,000 | 343,582 |
| 3.85%, 11/01/42 (a) | 200,000 | 228,204 |
| 6.55%, 09/15/43 | 100,000 | 160,474 |
| 4.13%, 08/15/46 | 200,000 | 235,400 |
| 4.86%, 08/21/46 | 800,000 | 1,044,752 |
| 5.50%, 03/16/47 | 100,000 | 141,940 |
| 4.52%, 09/15/48 | 850,000 | 1,071,323 |
| 5.01%, 04/15/49 | 225,000 | 301,230 |
| 4.00%, 03/22/50 (a) | 150,000 | 174,533 |
| 2.88%, 11/20/50 (a) | 500,000 | 481,460 |
| 3.55%, 03/22/51 (a) | 1,000,000 | 1,087,970 |
| 5.01%, 08/21/54 | 250,000 | 345,055 |
| 4.67%, 03/15/55 | 350,000 | 455,574 |
| 2.99%, 10/30/56 (a) | 646,000 | 624,120 |
| 3.00%, 11/20/60 (a) | 650,000 | 626,743 |
| 3.70%, 03/22/61 (a) | 750,000 | 824,737 |
Security
Rate, Maturity Date | Face
Amount ($) | Value ($) |
| ViacomCBS, Inc. |
| 3.88%, 04/01/24 (a) | 150,000 | 160,746 |
| 3.70%, 08/15/24 (a) | 250,000 | 269,233 |
| 3.50%, 01/15/25 (a) | 330,000 | 355,159 |
| 4.75%, 05/15/25 (a) | 200,000 | 225,802 |
| 2.90%, 01/15/27 (a) | 150,000 | 160,224 |
| 3.38%, 02/15/28 (a) | 250,000 | 275,130 |
| 4.20%, 06/01/29 (a) | 150,000 | 172,973 |
| 7.88%, 07/30/30 | 50,000 | 71,416 |
| 4.95%, 01/15/31 (a) | 200,000 | 242,102 |
| 4.20%, 05/19/32 (a) | 300,000 | 347,121 |
| 6.88%, 04/30/36 | 250,000 | 361,647 |
| 4.38%, 03/15/43 | 250,000 | 293,230 |
| 5.85%, 09/01/43 (a) | 350,000 | 486,038 |
| 5.25%, 04/01/44 (a) | 100,000 | 129,102 |
| 4.90%, 08/15/44 (a) | 195,000 | 240,731 |
| 4.60%, 01/15/45 (a) | 130,000 | 156,961 |
| 4.95%, 05/19/50 (a) | 200,000 | 254,808 |
| Vodafone Group PLC |
| 2.50%, 09/26/22 | 250,000 | 255,698 |
| 3.75%, 01/16/24 | 200,000 | 215,490 |
| 4.13%, 05/30/25 | 250,000 | 278,472 |
| 4.38%, 05/30/28 | 750,000 | 871,950 |
| 7.88%, 02/15/30 | 150,000 | 216,552 |
| 6.15%, 02/27/37 | 400,000 | 560,104 |
| 5.00%, 05/30/38 | 250,000 | 318,880 |
| 4.38%, 02/19/43 | 350,000 | 416,185 |
| 5.25%, 05/30/48 | 600,000 | 800,220 |
| 4.88%, 06/19/49 | 350,000 | 449,365 |
| 4.25%, 09/17/50 | 250,000 | 296,097 |
| 5.13%, 06/19/59 | 100,000 | 134,279 |
| Weibo Corp. |
| 3.50%, 07/05/24 (a) | 200,000 | 209,448 |
| 3.38%, 07/08/30 (a) | 200,000 | 204,412 |
| WPP Finance 2010 |
| 3.75%, 09/19/24 | 100,000 | 108,780 |
| | | 131,832,419 |
| Consumer Cyclical 1.8% |
| Advance Auto Parts, Inc. |
| 1.75%, 10/01/27 (a) | 150,000 | 150,608 |
| 3.90%, 04/15/30 (a) | 100,000 | 111,900 |
| Alibaba Group Holding Ltd. |
| 2.80%, 06/06/23 (a) | 150,000 | 155,720 |
| 3.60%, 11/28/24 (a) | 400,000 | 431,516 |
| 3.40%, 12/06/27 (a) | 500,000 | 545,140 |
| 2.13%, 02/09/31 (a) | 400,000 | 393,160 |
| 4.50%, 11/28/34 (a) | 250,000 | 295,210 |
| 4.00%, 12/06/37 (a) | 200,000 | 224,010 |
| 2.70%, 02/09/41 (a) | 250,000 | 237,300 |
| 4.20%, 12/06/47 (a) | 200,000 | 231,916 |
| 3.15%, 02/09/51 (a) | 300,000 | 294,450 |
| 4.40%, 12/06/57 (a) | 200,000 | 239,276 |
| 3.25%, 02/09/61 (a) | 200,000 | 194,098 |
| Amazon.com, Inc. |
| 2.50%, 11/29/22 (a) | 230,000 | 235,184 |
| 2.40%, 02/22/23 (a) | 200,000 | 206,086 |
| 0.25%, 05/12/23 | 300,000 | 300,276 |
| 0.40%, 06/03/23 | 250,000 | 250,640 |
| 0.45%, 05/12/24 | 500,000 | 500,350 |
| 2.80%, 08/22/24 (a) | 450,000 | 479,002 |
| 3.80%, 12/05/24 (a) | 195,000 | 213,921 |
| 0.80%, 06/03/25 (a) | 250,000 | 250,673 |
| 5.20%, 12/03/25 (a) | 100,000 | 117,066 |
| 1.00%, 05/12/26 (a) | 500,000 | 502,675 |
| 1.20%, 06/03/27 (a) | 300,000 | 301,137 |
Schwab Taxable Bond Funds | Annual Report
Schwab U.S. Aggregate Bond Index Fund
Portfolio Holdings as of August 31, 2021 (continued)
Security
Rate, Maturity Date | Face
Amount ($) | Value ($) |
| 3.15%, 08/22/27 (a) | 600,000 | 664,176 |
| 1.65%, 05/12/28 (a) | 500,000 | 508,560 |
| 1.50%, 06/03/30 (a) | 450,000 | 442,921 |
| 2.10%, 05/12/31 (a) | 600,000 | 616,176 |
| 4.80%, 12/05/34 (a) | 150,000 | 194,486 |
| 3.88%, 08/22/37 (a) | 600,000 | 716,658 |
| 2.88%, 05/12/41 (a) | 400,000 | 419,620 |
| 4.95%, 12/05/44 (a) | 330,000 | 454,879 |
| 4.05%, 08/22/47 (a) | 750,000 | 927,127 |
| 2.50%, 06/03/50 (a) | 550,000 | 529,133 |
| 3.10%, 05/12/51 (a) | 650,000 | 700,973 |
| 4.25%, 08/22/57 (a) | 550,000 | 717,579 |
| 2.70%, 06/03/60 (a) | 400,000 | 388,864 |
| 3.25%, 05/12/61 (a) | 500,000 | 545,980 |
| American Honda Finance Corp. |
| 2.05%, 01/10/23 | 150,000 | 153,620 |
| 1.95%, 05/10/23 | 200,000 | 205,314 |
| 0.88%, 07/07/23 | 250,000 | 252,245 |
| 0.65%, 09/08/23 | 250,000 | 251,395 |
| 2.90%, 02/16/24 | 290,000 | 306,315 |
| 2.40%, 06/27/24 | 300,000 | 314,652 |
| 2.15%, 09/10/24 | 250,000 | 260,757 |
| 1.20%, 07/08/25 | 250,000 | 252,438 |
| 1.00%, 09/10/25 | 250,000 | 250,578 |
| 2.30%, 09/09/26 | 300,000 | 316,482 |
| 2.35%, 01/08/27 | 50,000 | 52,734 |
| 3.50%, 02/15/28 | 100,000 | 111,992 |
| 2.00%, 03/24/28 | 250,000 | 257,362 |
| Aptiv Corp. |
| 4.15%, 03/15/24 (a) | 100,000 | 107,863 |
| Aptiv PLC |
| 4.25%, 01/15/26 (a) | 100,000 | 112,616 |
| 4.35%, 03/15/29 (a) | 150,000 | 174,260 |
| 5.40%, 03/15/49 (a) | 100,000 | 139,738 |
| AutoNation, Inc. |
| 3.50%, 11/15/24 (a) | 150,000 | 161,130 |
| 4.75%, 06/01/30 (a) | 250,000 | 295,227 |
| AutoZone, Inc. |
| 2.88%, 01/15/23 (a) | 250,000 | 256,752 |
| 3.13%, 07/15/23 (a) | 100,000 | 104,379 |
| 3.25%, 04/15/25 (a) | 200,000 | 215,156 |
| 3.75%, 04/18/29 (a) | 150,000 | 168,614 |
| 4.00%, 04/15/30 (a) | 150,000 | 172,124 |
| 1.65%, 01/15/31 (a) | 250,000 | 240,670 |
| Best Buy Co., Inc. |
| 4.45%, 10/01/28 (a) | 100,000 | 116,730 |
| 1.95%, 10/01/30 (a) | 250,000 | 247,048 |
| Block Financial LLC |
| 5.25%, 10/01/25 (a) | 100,000 | 114,314 |
| 3.88%, 08/15/30 (a) | 250,000 | 273,450 |
| Booking Holdings, Inc. |
| 2.75%, 03/15/23 (a) | 250,000 | 258,955 |
| 3.60%, 06/01/26 (a) | 150,000 | 166,212 |
| 4.63%, 04/13/30 (a) | 450,000 | 538,951 |
| BorgWarner, Inc. |
| 3.38%, 03/15/25 (a) | 100,000 | 107,832 |
| 2.65%, 07/01/27 (a) | 250,000 | 265,960 |
| 4.38%, 03/15/45 (a) | 100,000 | 119,528 |
| CBRE Services, Inc. |
| 4.88%, 03/01/26 (a) | 100,000 | 115,217 |
| Choice Hotels International, Inc. |
| 3.70%, 12/01/29 (a) | 100,000 | 108,073 |
| 3.70%, 01/15/31 (a) | 250,000 | 271,980 |
Security
Rate, Maturity Date | Face
Amount ($) | Value ($) |
| Costco Wholesale Corp. |
| 2.75%, 05/18/24 (a) | 200,000 | 211,746 |
| 3.00%, 05/18/27 (a) | 300,000 | 330,183 |
| 1.38%, 06/20/27 (a) | 250,000 | 252,947 |
| 1.60%, 04/20/30 (a) | 100,000 | 99,343 |
| 1.75%, 04/20/32 (a) | 400,000 | 398,892 |
| Cummins, Inc. |
| 0.75%, 09/01/25 (a) | 150,000 | 149,528 |
| 1.50%, 09/01/30 (a) | 250,000 | 242,375 |
| 4.88%, 10/01/43 (a) | 150,000 | 203,192 |
| 2.60%, 09/01/50 (a) | 250,000 | 242,288 |
| D.R. Horton, Inc. |
| 5.75%, 08/15/23 (a) | 250,000 | 271,862 |
| 2.60%, 10/15/25 (a) | 175,000 | 184,903 |
| 1.40%, 10/15/27 (a) | 150,000 | 148,677 |
| Daimler Finance North America LLC |
| 8.50%, 01/18/31 | 200,000 | 306,986 |
| Darden Restaurants, Inc. |
| 3.85%, 05/01/27 (a) | 200,000 | 222,194 |
| Dollar General Corp. |
| 3.25%, 04/15/23 (a) | 100,000 | 103,890 |
| 3.88%, 04/15/27 (a) | 200,000 | 225,084 |
| 4.13%, 05/01/28 (a) | 100,000 | 115,166 |
| 3.50%, 04/03/30 (a) | 200,000 | 223,118 |
| 4.13%, 04/03/50 (a) | 100,000 | 119,845 |
| Dollar Tree, Inc. |
| 3.70%, 05/15/23 (a) | 100,000 | 105,166 |
| 4.00%, 05/15/25 (a) | 300,000 | 329,637 |
| 4.20%, 05/15/28 (a) | 250,000 | 284,637 |
| eBay, Inc. |
| 2.75%, 01/30/23 (a) | 200,000 | 206,338 |
| 3.45%, 08/01/24 (a) | 200,000 | 214,764 |
| 1.90%, 03/11/25 (a) | 250,000 | 258,692 |
| 1.40%, 05/10/26 (a) | 200,000 | 201,888 |
| 3.60%, 06/05/27 (a) | 150,000 | 167,603 |
| 2.70%, 03/11/30 (a) | 100,000 | 104,812 |
| 2.60%, 05/10/31 (a) | 150,000 | 154,746 |
| 4.00%, 07/15/42 (a) | 150,000 | 171,129 |
| 3.65%, 05/10/51 (a) | 200,000 | 218,680 |
| Expedia Group, Inc. |
| 3.60%, 12/15/23 (a) | 200,000 | 212,214 |
| 4.50%, 08/15/24 (a) | 150,000 | 163,500 |
| 5.00%, 02/15/26 (a) | 200,000 | 226,094 |
| 4.63%, 08/01/27 (a) | 200,000 | 226,406 |
| 3.80%, 02/15/28 (a) | 200,000 | 216,070 |
| 3.25%, 02/15/30 (a) | 200,000 | 207,378 |
| 2.95%, 03/15/31 (a) | 100,000 | 101,787 |
| General Motors Co. |
| 4.88%, 10/02/23 | 462,000 | 501,113 |
| 5.40%, 10/02/23 | 250,000 | 273,662 |
| 6.13%, 10/01/25 (a) | 450,000 | 531,252 |
| 4.20%, 10/01/27 (a) | 300,000 | 336,282 |
| 6.80%, 10/01/27 (a) | 300,000 | 378,045 |
| 5.00%, 10/01/28 (a) | 250,000 | 292,570 |
| 5.00%, 04/01/35 | 200,000 | 241,088 |
| 6.60%, 04/01/36 (a) | 300,000 | 411,021 |
| 5.15%, 04/01/38 (a) | 250,000 | 303,230 |
| 6.25%, 10/02/43 | 350,000 | 479,521 |
| 5.20%, 04/01/45 | 250,000 | 309,897 |
| 6.75%, 04/01/46 (a) | 100,000 | 144,935 |
| 5.40%, 04/01/48 (a) | 75,000 | 95,231 |
| 5.95%, 04/01/49 (a) | 200,000 | 272,380 |
| General Motors Financial Co., Inc. |
| 3.25%, 01/05/23 (a) | 250,000 | 258,430 |
| 5.20%, 03/20/23 | 450,000 | 480,694 |
| 3.70%, 05/09/23 (a) | 312,000 | 326,224 |
Schwab Taxable Bond Funds | Annual Report
Schwab U.S. Aggregate Bond Index Fund
Portfolio Holdings as of August 31, 2021 (continued)
Security
Rate, Maturity Date | Face
Amount ($) | Value ($) |
| 4.15%, 06/19/23 (a) | 250,000 | 264,615 |
| 1.70%, 08/18/23 | 350,000 | 357,122 |
| 5.10%, 01/17/24 (a) | 200,000 | 219,058 |
| 1.05%, 03/08/24 | 250,000 | 251,678 |
| 3.95%, 04/13/24 (a) | 150,000 | 160,931 |
| 3.50%, 11/07/24 (a) | 150,000 | 160,734 |
| 4.00%, 01/15/25 (a) | 100,000 | 108,760 |
| 2.90%, 02/26/25 (a) | 200,000 | 211,390 |
| 4.35%, 04/09/25 (a) | 150,000 | 165,450 |
| 4.30%, 07/13/25 (a) | 200,000 | 220,860 |
| 1.25%, 01/08/26 (a) | 200,000 | 198,670 |
| 5.25%, 03/01/26 (a) | 450,000 | 518,143 |
| 4.35%, 01/17/27 (a) | 200,000 | 225,540 |
| 2.70%, 08/20/27 (a) | 350,000 | 365,676 |
| 3.85%, 01/05/28 (a) | 150,000 | 164,663 |
| 5.65%, 01/17/29 (a) | 100,000 | 121,904 |
| 3.60%, 06/21/30 (a) | 500,000 | 543,035 |
| 2.35%, 01/08/31 (a) | 200,000 | 198,084 |
| 2.70%, 06/10/31 (a) | 200,000 | 203,042 |
| Genuine Parts Co. |
| 1.88%, 11/01/30 (a) | 125,000 | 122,049 |
| GLP Capital LP/GLP Financing II, Inc. |
| 5.38%, 11/01/23 (a) | 250,000 | 271,350 |
| 5.25%, 06/01/25 (a) | 100,000 | 112,358 |
| 5.38%, 04/15/26 (a) | 150,000 | 172,118 |
| 5.75%, 06/01/28 (a) | 100,000 | 119,478 |
| 5.30%, 01/15/29 (a) | 100,000 | 117,346 |
| 4.00%, 01/15/30 (a) | 100,000 | 108,763 |
| 4.00%, 01/15/31 (a) | 400,000 | 434,456 |
| Harley-Davidson, Inc. |
| 3.50%, 07/28/25 (a) | 100,000 | 107,442 |
| Harman International Industries, Inc. |
| 4.15%, 05/15/25 (a) | 75,000 | 82,712 |
| Hyatt Hotels Corp. |
| 3.38%, 07/15/23 (a) | 200,000 | 207,950 |
| 5.38%, 04/23/25 (a) | 100,000 | 111,741 |
| 4.38%, 09/15/28 (a) | 150,000 | 164,466 |
| JD.com, Inc. |
| 3.88%, 04/29/26 | 200,000 | 219,524 |
| 3.38%, 01/14/30 (a) | 200,000 | 214,434 |
| 4.13%, 01/14/50 (a) | 200,000 | 218,310 |
| Kohl's Corp. |
| 3.38%, 05/01/31 (a) | 100,000 | 105,171 |
| 5.55%, 07/17/45 (a) | 100,000 | 124,355 |
| Las Vegas Sands Corp. |
| 3.20%, 08/08/24 (a) | 250,000 | 260,350 |
| 2.90%, 06/25/25 (a) | 400,000 | 413,196 |
| 3.50%, 08/18/26 (a) | 150,000 | 157,515 |
| 3.90%, 08/08/29 (a) | 150,000 | 158,010 |
| Lear Corp. |
| 3.80%, 09/15/27 (a) | 50,000 | 55,667 |
| 4.25%, 05/15/29 (a) | 50,000 | 56,786 |
| 3.50%, 05/30/30 (a) | 150,000 | 162,786 |
| 5.25%, 05/15/49 (a) | 250,000 | 318,967 |
| Lennar Corp. |
| 4.75%, 11/15/22 (a) | 350,000 | 364,017 |
| 4.75%, 05/30/25 (a) | 350,000 | 391,769 |
| 4.75%, 11/29/27 (a) | 250,000 | 291,002 |
| Lowe's Cos., Inc. |
| 3.88%, 09/15/23 (a) | 100,000 | 106,261 |
| 3.13%, 09/15/24 (a) | 100,000 | 106,862 |
| 3.38%, 09/15/25 (a) | 474,000 | 517,561 |
| 2.50%, 04/15/26 (a) | 200,000 | 212,790 |
| 3.10%, 05/03/27 (a) | 250,000 | 273,377 |
| 1.30%, 04/15/28 (a) | 250,000 | 245,553 |
Security
Rate, Maturity Date | Face
Amount ($) | Value ($) |
| 3.65%, 04/05/29 (a) | 400,000 | 449,300 |
| 4.50%, 04/15/30 (a) | 200,000 | 237,574 |
| 1.70%, 10/15/30 (a) | 250,000 | 242,793 |
| 2.63%, 04/01/31 (a) | 250,000 | 260,887 |
| 5.00%, 04/15/40 (a) | 100,000 | 129,910 |
| 4.65%, 04/15/42 (a) | 195,000 | 244,860 |
| 4.38%, 09/15/45 (a) | 100,000 | 121,683 |
| 3.70%, 04/15/46 (a) | 150,000 | 167,618 |
| 4.05%, 05/03/47 (a) | 250,000 | 292,770 |
| 4.55%, 04/05/49 (a) | 300,000 | 379,080 |
| 5.13%, 04/15/50 (a) | 250,000 | 343,397 |
| 3.00%, 10/15/50 (a) | 250,000 | 250,885 |
| Magna International, Inc. |
| 3.63%, 06/15/24 (a) | 200,000 | 215,932 |
| 2.45%, 06/15/30 (a) | 200,000 | 206,808 |
| Marriott International, Inc. |
| 3.75%, 03/15/25 (a) | 330,000 | 355,060 |
| 5.75%, 05/01/25 (a) | 300,000 | 344,802 |
| 3.13%, 06/15/26 (a) | 150,000 | 160,460 |
| 4.00%, 04/15/28 (a) | 100,000 | 110,611 |
| 4.63%, 06/15/30 (a) | 200,000 | 230,594 |
| 3.50%, 10/15/32 (a) | 350,000 | 374,398 |
| McDonald's Corp. |
| 3.35%, 04/01/23 (a) | 150,000 | 156,680 |
| 3.38%, 05/26/25 (a) | 150,000 | 162,533 |
| 3.30%, 07/01/25 (a) | 100,000 | 108,466 |
| 1.45%, 09/01/25 (a) | 150,000 | 153,068 |
| 3.70%, 01/30/26 (a) | 430,000 | 476,474 |
| 3.50%, 03/01/27 (a) | 200,000 | 221,138 |
| 3.50%, 07/01/27 (a) | 200,000 | 222,470 |
| 3.80%, 04/01/28 (a) | 350,000 | 396,315 |
| 2.63%, 09/01/29 (a) | 100,000 | 105,664 |
| 2.13%, 03/01/30 (a) | 250,000 | 254,690 |
| 3.60%, 07/01/30 (a) | 150,000 | 169,541 |
| 4.70%, 12/09/35 (a) | 250,000 | 313,442 |
| 6.30%, 03/01/38 | 250,000 | 363,167 |
| 5.70%, 02/01/39 | 150,000 | 208,182 |
| 4.88%, 07/15/40 | 100,000 | 128,820 |
| 3.70%, 02/15/42 | 200,000 | 226,096 |
| 4.60%, 05/26/45 (a) | 100,000 | 126,839 |
| 4.88%, 12/09/45 (a) | 420,000 | 553,909 |
| 4.45%, 03/01/47 (a) | 100,000 | 125,046 |
| 4.45%, 09/01/48 (a) | 250,000 | 314,362 |
| 3.63%, 09/01/49 (a) | 300,000 | 338,136 |
| 4.20%, 04/01/50 (a) | 100,000 | 123,002 |
| MDC Holdings, Inc. |
| 2.50%, 01/15/31 (a) | 150,000 | 147,224 |
| 6.00%, 01/15/43 (a) | 150,000 | 193,286 |
| NIKE, Inc. |
| 2.25%, 05/01/23 (a) | 100,000 | 102,862 |
| 2.40%, 03/27/25 (a) | 150,000 | 158,946 |
| 2.38%, 11/01/26 (a) | 100,000 | 106,636 |
| 2.75%, 03/27/27 (a) | 350,000 | 378,997 |
| 2.85%, 03/27/30 (a) | 350,000 | 382,480 |
| 3.25%, 03/27/40 (a) | 300,000 | 335,304 |
| 3.38%, 11/01/46 (a) | 350,000 | 399,563 |
| 3.38%, 03/27/50 (a) | 200,000 | 230,070 |
| Nordstrom, Inc. |
| 6.95%, 03/15/28 | 200,000 | 236,594 |
| 4.25%, 08/01/31 (a) | 150,000 | 156,458 |
| 5.00%, 01/15/44 (a) | 200,000 | 198,904 |
| NVR, Inc. |
| 3.95%, 09/15/22 (a) | 100,000 | 102,826 |
| 3.00%, 05/15/30 (a) | 200,000 | 212,336 |
Schwab Taxable Bond Funds | Annual Report
Schwab U.S. Aggregate Bond Index Fund
Portfolio Holdings as of August 31, 2021 (continued)
Security
Rate, Maturity Date | Face
Amount ($) | Value ($) |
| O'Reilly Automotive, Inc. |
| 3.80%, 09/01/22 (a) | 150,000 | 153,795 |
| 3.60%, 09/01/27 (a) | 150,000 | 168,573 |
| 4.35%, 06/01/28 (a) | 200,000 | 232,876 |
| 4.20%, 04/01/30 (a) | 100,000 | 116,322 |
| 1.75%, 03/15/31 (a) | 250,000 | 242,668 |
| PACCAR Financial Corp. |
| 2.00%, 09/26/22 | 100,000 | 101,946 |
| 2.65%, 04/06/23 | 150,000 | 155,649 |
| 0.35%, 08/11/23 | 150,000 | 150,170 |
| 0.35%, 02/02/24 | 100,000 | 99,739 |
| 0.50%, 08/09/24 | 250,000 | 249,695 |
| 1.80%, 02/06/25 | 200,000 | 207,030 |
| PulteGroup, Inc. |
| 5.50%, 03/01/26 (a) | 250,000 | 292,557 |
| 7.88%, 06/15/32 | 200,000 | 292,164 |
| PVH Corp. |
| 4.63%, 07/10/25 (a)(c) | 250,000 | 278,210 |
| Ralph Lauren Corp. |
| 2.95%, 06/15/30 (a) | 150,000 | 160,782 |
| Ross Stores, Inc. |
| 0.88%, 04/15/26 (a) | 250,000 | 246,130 |
| Sands China Ltd. |
| 4.60%, 08/08/23 (a) | 500,000 | 529,035 |
| 5.13%, 08/08/25 (a) | 200,000 | 222,798 |
| 5.40%, 08/08/28 (a) | 400,000 | 462,976 |
| 4.38%, 06/18/30 (a) | 200,000 | 218,266 |
| Starbucks Corp. |
| 3.10%, 03/01/23 (a) | 100,000 | 103,893 |
| 3.85%, 10/01/23 (a) | 245,000 | 260,406 |
| 3.80%, 08/15/25 (a) | 300,000 | 331,539 |
| 2.00%, 03/12/27 (a) | 200,000 | 206,878 |
| 4.00%, 11/15/28 (a) | 150,000 | 173,349 |
| 3.55%, 08/15/29 (a) | 200,000 | 224,614 |
| 2.25%, 03/12/30 (a) | 100,000 | 102,161 |
| 2.55%, 11/15/30 (a) | 195,000 | 203,613 |
| 3.75%, 12/01/47 (a) | 250,000 | 282,302 |
| 4.50%, 11/15/48 (a) | 300,000 | 380,871 |
| 4.45%, 08/15/49 (a) | 150,000 | 189,546 |
| 3.35%, 03/12/50 (a) | 100,000 | 107,178 |
| 3.50%, 11/15/50 (a) | 200,000 | 219,702 |
| Stellantis N.V. |
| 5.25%, 04/15/23 | 250,000 | 267,880 |
| Tapestry, Inc. |
| 4.25%, 04/01/25 (a) | 150,000 | 162,630 |
| 4.13%, 07/15/27 (a) | 100,000 | 109,628 |
| Target Corp. |
| 3.50%, 07/01/24 | 263,000 | 285,260 |
| 2.25%, 04/15/25 (a) | 300,000 | 315,507 |
| 2.50%, 04/15/26 | 200,000 | 215,022 |
| 3.38%, 04/15/29 (a) | 150,000 | 168,765 |
| 2.35%, 02/15/30 (a) | 250,000 | 263,092 |
| 2.65%, 09/15/30 (a) | 350,000 | 377,954 |
| 4.00%, 07/01/42 | 75,000 | 94,456 |
| 3.90%, 11/15/47 (a) | 400,000 | 506,264 |
| The Ford Foundation |
| 2.42%, 06/01/50 (a) | 100,000 | 98,678 |
| The Home Depot, Inc. |
| 2.70%, 04/01/23 (a) | 150,000 | 154,928 |
| 3.75%, 02/15/24 (a) | 195,000 | 209,276 |
| 3.35%, 09/15/25 (a) | 400,000 | 437,952 |
| 3.00%, 04/01/26 (a) | 150,000 | 163,155 |
| 2.13%, 09/15/26 (a) | 200,000 | 210,652 |
| 2.50%, 04/15/27 (a) | 200,000 | 214,050 |
| 2.80%, 09/14/27 (a) | 150,000 | 163,406 |
Security
Rate, Maturity Date | Face
Amount ($) | Value ($) |
| 3.90%, 12/06/28 (a) | 300,000 | 348,489 |
| 2.95%, 06/15/29 (a) | 350,000 | 383,404 |
| 2.70%, 04/15/30 (a) | 200,000 | 214,988 |
| 1.38%, 03/15/31 (a) | 250,000 | 241,440 |
| 5.88%, 12/16/36 | 755,000 | 1,084,399 |
| 3.30%, 04/15/40 (a) | 450,000 | 499,504 |
| 5.40%, 09/15/40 (a) | 100,000 | 139,278 |
| 4.20%, 04/01/43 (a) | 230,000 | 284,558 |
| 4.88%, 02/15/44 (a) | 195,000 | 263,273 |
| 4.40%, 03/15/45 (a) | 150,000 | 192,242 |
| 4.25%, 04/01/46 (a) | 350,000 | 441,479 |
| 3.90%, 06/15/47 (a) | 300,000 | 361,473 |
| 4.50%, 12/06/48 (a) | 350,000 | 460,729 |
| 3.13%, 12/15/49 (a) | 200,000 | 214,762 |
| 3.35%, 04/15/50 (a) | 400,000 | 446,528 |
| 2.38%, 03/15/51 (a) | 250,000 | 234,470 |
| 3.50%, 09/15/56 (a) | 150,000 | 171,714 |
| The Rockefeller Foundation |
| 2.49%, 10/01/50 (a) | 250,000 | 250,415 |
| The TJX Cos., Inc. |
| 2.50%, 05/15/23 (a) | 250,000 | 258,162 |
| 2.25%, 09/15/26 (a) | 200,000 | 211,214 |
| 1.15%, 05/15/28 (a) | 150,000 | 146,558 |
| 3.88%, 04/15/30 (a) | 250,000 | 288,920 |
| Toyota Motor Corp. |
| 3.42%, 07/20/23 | 200,000 | 211,868 |
| 0.68%, 03/25/24 (a) | 250,000 | 250,838 |
| 1.34%, 03/25/26 (a) | 200,000 | 202,702 |
| 3.67%, 07/20/28 | 150,000 | 170,712 |
| Toyota Motor Credit Corp. |
| 2.15%, 09/08/22 | 500,000 | 509,815 |
| 2.63%, 01/10/23 | 100,000 | 103,218 |
| 2.90%, 03/30/23 | 450,000 | 468,486 |
| 0.40%, 04/06/23 | 250,000 | 250,428 |
| 0.50%, 08/14/23 | 450,000 | 451,624 |
| 1.35%, 08/25/23 | 200,000 | 203,938 |
| 3.45%, 09/20/23 | 100,000 | 106,274 |
| 3.35%, 01/08/24 | 150,000 | 159,930 |
| 0.45%, 01/11/24 | 250,000 | 249,913 |
| 2.90%, 04/17/24 | 200,000 | 212,196 |
| 0.50%, 06/18/24 | 100,000 | 99,823 |
| 2.00%, 10/07/24 | 100,000 | 104,082 |
| 1.80%, 02/13/25 | 400,000 | 412,756 |
| 3.00%, 04/01/25 | 300,000 | 322,002 |
| 0.80%, 10/16/25 | 250,000 | 248,488 |
| 0.80%, 01/09/26 | 150,000 | 148,496 |
| 1.13%, 06/18/26 | 250,000 | 250,910 |
| 3.20%, 01/11/27 | 150,000 | 165,323 |
| 1.15%, 08/13/27 | 450,000 | 447,061 |
| 3.65%, 01/08/29 | 150,000 | 171,635 |
| 2.15%, 02/13/30 | 100,000 | 103,413 |
| 3.38%, 04/01/30 | 200,000 | 225,456 |
| Tractor Supply Co. |
| 1.75%, 11/01/30 (a) | 125,000 | 121,764 |
| VF Corp. |
| 2.40%, 04/23/25 (a) | 250,000 | 261,970 |
| 2.95%, 04/23/30 (a) | 200,000 | 213,642 |
| Walgreen Co. |
| 3.10%, 09/15/22 | 150,000 | 154,214 |
| Walgreens Boots Alliance, Inc. |
| 3.80%, 11/18/24 (a) | 430,000 | 467,075 |
| 3.45%, 06/01/26 (a) | 300,000 | 327,738 |
| 3.20%, 04/15/30 (a) | 150,000 | 162,219 |
| 4.80%, 11/18/44 (a) | 250,000 | 308,602 |
| 4.10%, 04/15/50 (a) | 150,000 | 170,558 |
Schwab Taxable Bond Funds | Annual Report
Schwab U.S. Aggregate Bond Index Fund
Portfolio Holdings as of August 31, 2021 (continued)
Security
Rate, Maturity Date | Face
Amount ($) | Value ($) |
| Walmart, Inc. |
| 2.35%, 12/15/22 (a) | 250,000 | 256,512 |
| 2.55%, 04/11/23 (a) | 500,000 | 516,125 |
| 3.40%, 06/26/23 (a) | 600,000 | 632,928 |
| 3.30%, 04/22/24 (a) | 250,000 | 267,062 |
| 2.85%, 07/08/24 (a) | 400,000 | 426,080 |
| 2.65%, 12/15/24 (a) | 200,000 | 213,272 |
| 3.55%, 06/26/25 (a) | 250,000 | 275,305 |
| 3.05%, 07/08/26 (a) | 350,000 | 383,498 |
| 3.70%, 06/26/28 (a) | 500,000 | 571,445 |
| 3.25%, 07/08/29 (a) | 300,000 | 337,038 |
| 2.38%, 09/24/29 (a) | 100,000 | 106,604 |
| 5.25%, 09/01/35 | 450,000 | 620,887 |
| 6.50%, 08/15/37 | 150,000 | 229,250 |
| 6.20%, 04/15/38 | 250,000 | 375,157 |
| 3.95%, 06/28/38 (a) | 250,000 | 303,627 |
| 5.63%, 04/01/40 | 100,000 | 144,945 |
| 5.00%, 10/25/40 | 150,000 | 204,573 |
| 5.63%, 04/15/41 | 200,000 | 293,626 |
| 4.30%, 04/22/44 (a) | 500,000 | 637,910 |
| 3.63%, 12/15/47 (a) | 150,000 | 178,115 |
| 4.05%, 06/29/48 (a) | 700,000 | 888,447 |
| 2.95%, 09/24/49 (a) | 150,000 | 162,000 |
| | | 96,849,801 |
| Consumer Non-Cyclical 4.1% |
| Abbott Laboratories |
| 3.40%, 11/30/23 (a) | 200,000 | 212,380 |
| 2.95%, 03/15/25 (a) | 350,000 | 375,060 |
| 3.75%, 11/30/26 (a) | 400,000 | 452,620 |
| 1.15%, 01/30/28 (a) | 250,000 | 246,702 |
| 1.40%, 06/30/30 (a) | 200,000 | 195,366 |
| 4.75%, 11/30/36 (a) | 500,000 | 648,620 |
| 5.30%, 05/27/40 | 100,000 | 140,427 |
| 4.75%, 04/15/43 (a) | 150,000 | 200,429 |
| 4.90%, 11/30/46 (a) | 726,000 | 1,008,966 |
| AbbVie, Inc. |
| 3.25%, 10/01/22 (a) | 300,000 | 307,254 |
| 2.90%, 11/06/22 | 600,000 | 617,754 |
| 3.20%, 11/06/22 (a) | 200,000 | 205,720 |
| 2.30%, 11/21/22 | 500,000 | 511,555 |
| 2.85%, 05/14/23 (a) | 300,000 | 311,112 |
| 3.75%, 11/14/23 (a) | 300,000 | 320,322 |
| 3.85%, 06/15/24 (a) | 300,000 | 323,952 |
| 2.60%, 11/21/24 (a) | 575,000 | 606,406 |
| 3.80%, 03/15/25 (a) | 750,000 | 818,025 |
| 3.60%, 05/14/25 (a) | 800,000 | 870,312 |
| 3.20%, 05/14/26 (a) | 350,000 | 380,086 |
| 2.95%, 11/21/26 (a) | 850,000 | 916,189 |
| 4.25%, 11/14/28 (a) | 300,000 | 347,991 |
| 3.20%, 11/21/29 (a) | 1,150,000 | 1,257,467 |
| 4.55%, 03/15/35 (a) | 350,000 | 426,562 |
| 4.50%, 05/14/35 (a) | 400,000 | 486,780 |
| 4.30%, 05/14/36 (a) | 450,000 | 537,880 |
| 4.05%, 11/21/39 (a) | 850,000 | 998,257 |
| 4.63%, 10/01/42 (a) | 100,000 | 124,233 |
| 4.40%, 11/06/42 | 450,000 | 549,864 |
| 4.85%, 06/15/44 (a) | 150,000 | 192,483 |
| 4.75%, 03/15/45 (a) | 111,000 | 140,256 |
| 4.70%, 05/14/45 (a) | 700,000 | 882,427 |
| 4.45%, 05/14/46 (a) | 400,000 | 491,640 |
| 4.88%, 11/14/48 (a) | 300,000 | 392,979 |
| 4.25%, 11/21/49 (a) | 1,200,000 | 1,458,612 |
| Adventist Health System |
| 3.63%, 03/01/49 (a) | 100,000 | 113,277 |
Security
Rate, Maturity Date | Face
Amount ($) | Value ($) |
| Advocate Health & Hospitals Corp. |
| 3.83%, 08/15/28 (a) | 50,000 | 56,989 |
| 4.27%, 08/15/48 (a) | 150,000 | 193,158 |
| 3.39%, 10/15/49 (a) | 100,000 | 113,243 |
| Agilent Technologies, Inc. |
| 3.88%, 07/15/23 (a) | 150,000 | 158,421 |
| 2.75%, 09/15/29 (a) | 150,000 | 158,693 |
| 2.10%, 06/04/30 (a) | 150,000 | 150,150 |
| 2.30%, 03/12/31 (a) | 200,000 | 202,926 |
| Ahold Finance USA LLC |
| 6.88%, 05/01/29 | 75,000 | 100,980 |
| AHS Hospital Corp. |
| 5.02%, 07/01/45 | 150,000 | 209,127 |
| 2.78%, 07/01/51 (a) | 150,000 | 152,522 |
| Allina Health System |
| 3.89%, 04/15/49 | 100,000 | 119,778 |
| Altria Group, Inc. |
| 4.00%, 01/31/24 | 200,000 | 216,386 |
| 3.80%, 02/14/24 (a) | 150,000 | 160,976 |
| 2.35%, 05/06/25 (a) | 170,000 | 177,383 |
| 4.40%, 02/14/26 (a) | 350,000 | 395,773 |
| 2.63%, 09/16/26 (a) | 100,000 | 105,564 |
| 4.80%, 02/14/29 (a) | 450,000 | 523,458 |
| 3.40%, 05/06/30 (a) | 200,000 | 214,554 |
| 2.45%, 02/04/32 (a) | 200,000 | 195,476 |
| 5.80%, 02/14/39 (a) | 300,000 | 375,909 |
| 3.40%, 02/04/41 (a) | 300,000 | 289,182 |
| 4.25%, 08/09/42 | 200,000 | 212,094 |
| 4.50%, 05/02/43 | 100,000 | 109,768 |
| 5.38%, 01/31/44 | 445,000 | 536,826 |
| 3.88%, 09/16/46 (a) | 200,000 | 202,254 |
| 5.95%, 02/14/49 (a) | 500,000 | 652,055 |
| 4.45%, 05/06/50 (a) | 200,000 | 218,546 |
| 3.70%, 02/04/51 (a) | 250,000 | 242,943 |
| 4.00%, 02/04/61 (a) | 200,000 | 196,718 |
| AmerisourceBergen Corp. |
| 0.74%, 03/15/23 (a) | 300,000 | 300,480 |
| 3.40%, 05/15/24 (a) | 200,000 | 212,644 |
| 3.25%, 03/01/25 (a) | 100,000 | 107,081 |
| 3.45%, 12/15/27 (a) | 100,000 | 109,938 |
| 2.80%, 05/15/30 (a) | 150,000 | 157,850 |
| 2.70%, 03/15/31 (a) | 200,000 | 207,764 |
| 4.25%, 03/01/45 (a) | 200,000 | 236,116 |
| 4.30%, 12/15/47 (a) | 100,000 | 118,196 |
| Amgen, Inc. |
| 2.25%, 08/19/23 (a) | 200,000 | 206,728 |
| 3.63%, 05/22/24 (a) | 250,000 | 268,420 |
| 1.90%, 02/21/25 (a) | 100,000 | 103,307 |
| 3.13%, 05/01/25 (a) | 250,000 | 268,025 |
| 2.60%, 08/19/26 (a) | 330,000 | 351,285 |
| 2.20%, 02/21/27 (a) | 300,000 | 312,858 |
| 3.20%, 11/02/27 (a) | 150,000 | 164,640 |
| 1.65%, 08/15/28 (a) | 300,000 | 299,156 |
| 2.45%, 02/21/30 (a) | 200,000 | 207,058 |
| 2.30%, 02/25/31 (a) | 225,000 | 229,354 |
| 2.00%, 01/15/32 (a) | 300,000 | 294,906 |
| 3.15%, 02/21/40 (a) | 400,000 | 419,456 |
| 2.80%, 08/15/41 (a) | 200,000 | 198,199 |
| 4.95%, 10/01/41 | 300,000 | 388,020 |
| 5.15%, 11/15/41 (a) | 200,000 | 263,178 |
| 4.40%, 05/01/45 (a) | 600,000 | 733,524 |
| 4.56%, 06/15/48 (a) | 300,000 | 379,359 |
| 3.38%, 02/21/50 (a) | 400,000 | 426,092 |
| 4.66%, 06/15/51 (a) | 725,000 | 941,949 |
| 3.00%, 01/15/52 (a) | 300,000 | 300,285 |
| 2.77%, 09/01/53 (a) | 269,000 | 258,071 |
Schwab Taxable Bond Funds | Annual Report
Schwab U.S. Aggregate Bond Index Fund
Portfolio Holdings as of August 31, 2021 (continued)
Security
Rate, Maturity Date | Face
Amount ($) | Value ($) |
| Anheuser-Busch Cos., LLC/Anheuser-Busch InBev Worldwide, Inc. |
| 3.65%, 02/01/26 (a) | 750,000 | 828,900 |
| 4.70%, 02/01/36 (a) | 1,055,000 | 1,303,368 |
| 4.90%, 02/01/46 (a) | 2,000,000 | 2,558,820 |
| Anheuser-Busch InBev Finance, Inc. |
| 3.65%, 02/01/26 (a) | 350,000 | 386,267 |
| 4.70%, 02/01/36 (a) | 150,000 | 184,574 |
| 4.00%, 01/17/43 | 100,000 | 113,725 |
| 4.63%, 02/01/44 | 400,000 | 489,264 |
| 4.90%, 02/01/46 (a) | 200,000 | 253,854 |
| Anheuser-Busch InBev Worldwide, Inc. |
| 4.00%, 04/13/28 (a) | 450,000 | 512,892 |
| 4.75%, 01/23/29 (a) | 800,000 | 953,000 |
| 3.50%, 06/01/30 (a) | 300,000 | 334,278 |
| 4.90%, 01/23/31 (a) | 250,000 | 308,205 |
| 4.38%, 04/15/38 (a) | 250,000 | 299,265 |
| 8.20%, 01/15/39 | 250,000 | 420,692 |
| 5.45%, 01/23/39 (a) | 300,000 | 396,612 |
| 8.00%, 11/15/39 | 150,000 | 248,313 |
| 4.35%, 06/01/40 (a) | 450,000 | 540,612 |
| 4.95%, 01/15/42 | 200,000 | 253,706 |
| 3.75%, 07/15/42 | 100,000 | 110,130 |
| 4.60%, 04/15/48 (a) | 600,000 | 741,174 |
| 4.44%, 10/06/48 (a) | 400,000 | 483,760 |
| 5.55%, 01/23/49 (a) | 800,000 | 1,115,976 |
| 4.50%, 06/01/50 (a) | 400,000 | 496,672 |
| 4.75%, 04/15/58 (a) | 300,000 | 382,476 |
| 5.80%, 01/23/59 (a) | 300,000 | 445,686 |
| 4.60%, 06/01/60 (a) | 400,000 | 500,368 |
| Archer-Daniels-Midland Co. |
| 2.75%, 03/27/25 (a) | 200,000 | 212,388 |
| 2.50%, 08/11/26 (a) | 200,000 | 213,178 |
| 3.25%, 03/27/30 (a) | 200,000 | 222,810 |
| 4.54%, 03/26/42 | 100,000 | 132,427 |
| 3.75%, 09/15/47 (a) | 200,000 | 242,900 |
| 4.50%, 03/15/49 (a) | 100,000 | 134,815 |
| Ascension Health |
| 3.11%, 11/15/39 (a) | 100,000 | 109,132 |
| 3.95%, 11/15/46 | 250,000 | 311,487 |
| 4.85%, 11/15/53 | 200,000 | 292,886 |
| Astrazeneca Finance LLC |
| 0.70%, 05/28/24 (a) | 400,000 | 400,604 |
| 1.20%, 05/28/26 (a) | 250,000 | 251,210 |
| 1.75%, 05/28/28 (a) | 250,000 | 253,807 |
| 2.25%, 05/28/31 (a) | 250,000 | 258,092 |
| AstraZeneca PLC |
| 3.50%, 08/17/23 (a) | 100,000 | 105,891 |
| 3.38%, 11/16/25 | 450,000 | 493,308 |
| 0.70%, 04/08/26 (a) | 300,000 | 294,981 |
| 3.13%, 06/12/27 (a) | 250,000 | 273,545 |
| 4.00%, 01/17/29 (a) | 250,000 | 288,805 |
| 1.38%, 08/06/30 (a) | 250,000 | 240,398 |
| 6.45%, 09/15/37 | 430,000 | 647,911 |
| 4.00%, 09/18/42 | 250,000 | 304,920 |
| 4.38%, 11/16/45 | 100,000 | 129,342 |
| 4.38%, 08/17/48 (a) | 150,000 | 194,996 |
| 2.13%, 08/06/50 (a) | 250,000 | 225,015 |
| 3.00%, 05/28/51 (a) | 200,000 | 213,316 |
| Banner Health |
| 2.34%, 01/01/30 (a) | 150,000 | 155,165 |
| 1.90%, 01/01/31 (a) | 100,000 | 100,125 |
| Baptist Healthcare System Obligated Group |
| 3.54%, 08/15/50 (a) | 200,000 | 221,804 |
| BAT Capital Corp. |
| 3.22%, 08/15/24 (a) | 400,000 | 424,632 |
| 2.79%, 09/06/24 (a) | 150,000 | 157,587 |
Security
Rate, Maturity Date | Face
Amount ($) | Value ($) |
| 3.22%, 09/06/26 (a) | 200,000 | 213,818 |
| 4.70%, 04/02/27 (a) | 150,000 | 170,595 |
| 3.56%, 08/15/27 (a) | 800,000 | 866,152 |
| 2.26%, 03/25/28 (a) | 350,000 | 351,834 |
| 3.46%, 09/06/29 (a) | 100,000 | 106,581 |
| 4.91%, 04/02/30 (a) | 225,000 | 261,452 |
| 2.73%, 03/25/31 (a) | 250,000 | 250,195 |
| 4.39%, 08/15/37 (a) | 250,000 | 272,372 |
| 3.73%, 09/25/40 (a) | 350,000 | 347,805 |
| 4.54%, 08/15/47 (a) | 500,000 | 536,785 |
| 4.76%, 09/06/49 (a) | 150,000 | 165,420 |
| 5.28%, 04/02/50 (a) | 100,000 | 118,028 |
| 3.98%, 09/25/50 (a) | 350,000 | 347,266 |
| BAT International Finance PLC |
| 1.67%, 03/25/26 (a) | 350,000 | 352,415 |
| Baxalta, Inc. |
| 4.00%, 06/23/25 (a) | 150,000 | 165,384 |
| 5.25%, 06/23/45 (a) | 99,000 | 135,985 |
| Baxter International, Inc. |
| 2.60%, 08/15/26 (a) | 129,000 | 137,373 |
| 3.95%, 04/01/30 (a) | 125,000 | 144,204 |
| 1.73%, 04/01/31 (a) | 150,000 | 146,879 |
| 3.50%, 08/15/46 (a) | 85,000 | 94,534 |
| BayCare Health System, Inc. |
| 3.83%, 11/15/50 (a) | 100,000 | 123,483 |
| Baylor Scott & White Holdings |
| 1.78%, 11/15/30 (a) | 100,000 | 99,376 |
| 4.19%, 11/15/45 (a) | 100,000 | 124,467 |
| 2.84%, 11/15/50 (a) | 200,000 | 204,250 |
| Becton Dickinson & Co. |
| 3.36%, 06/06/24 (a) | 391,000 | 417,643 |
| 3.73%, 12/15/24 (a) | 252,000 | 273,622 |
| 3.70%, 06/06/27 (a) | 298,000 | 332,449 |
| 2.82%, 05/20/30 (a) | 200,000 | 212,098 |
| 1.96%, 02/11/31 (a) | 200,000 | 197,244 |
| 4.69%, 12/15/44 (a) | 250,000 | 318,280 |
| 4.67%, 06/06/47 (a) | 200,000 | 254,458 |
| 3.79%, 05/20/50 (a) | 200,000 | 227,456 |
| Biogen, Inc. |
| 3.63%, 09/15/22 | 150,000 | 155,100 |
| 4.05%, 09/15/25 (a) | 500,000 | 555,960 |
| 2.25%, 05/01/30 (a) | 300,000 | 303,372 |
| 3.15%, 05/01/50 (a) | 300,000 | 297,183 |
| 3.25%, 02/15/51 (a) | 392,000 | 395,026 |
| Bon Secours Mercy Health, Inc. |
| 2.10%, 06/01/31 (a) | 100,000 | 100,555 |
| 3.21%, 06/01/50 (a) | 100,000 | 106,542 |
| Boston Scientific Corp. |
| 3.85%, 05/15/25 | 275,000 | 303,366 |
| 1.90%, 06/01/25 (a) | 200,000 | 206,420 |
| 3.75%, 03/01/26 (a) | 250,000 | 276,975 |
| 4.00%, 03/01/28 (a) | 150,000 | 172,649 |
| 4.00%, 03/01/29 (a) | 300,000 | 343,758 |
| 4.55%, 03/01/39 (a) | 150,000 | 185,265 |
| 4.70%, 03/01/49 (a) | 300,000 | 390,585 |
| Bristol-Myers Squibb Co. |
| 2.75%, 02/15/23 (a) | 200,000 | 206,772 |
| 3.25%, 02/20/23 (a) | 144,000 | 149,917 |
| 0.54%, 11/13/23 (a) | 500,000 | 500,180 |
| 2.90%, 07/26/24 (a) | 500,000 | 533,135 |
| 3.88%, 08/15/25 (a) | 400,000 | 443,716 |
| 0.75%, 11/13/25 (a) | 250,000 | 249,042 |
| 3.20%, 06/15/26 (a) | 450,000 | 493,987 |
| 3.25%, 02/27/27 | 150,000 | 166,461 |
| 1.13%, 11/13/27 (a) | 250,000 | 248,510 |
| 3.45%, 11/15/27 (a) | 250,000 | 280,002 |
Schwab Taxable Bond Funds | Annual Report
Schwab U.S. Aggregate Bond Index Fund
Portfolio Holdings as of August 31, 2021 (continued)
Security
Rate, Maturity Date | Face
Amount ($) | Value ($) |
| 3.90%, 02/20/28 (a) | 300,000 | 344,061 |
| 3.40%, 07/26/29 (a) | 800,000 | 899,288 |
| 1.45%, 11/13/30 (a) | 150,000 | 146,223 |
| 4.13%, 06/15/39 (a) | 400,000 | 488,144 |
| 2.35%, 11/13/40 (a) | 300,000 | 291,732 |
| 3.25%, 08/01/42 | 200,000 | 219,804 |
| 4.63%, 05/15/44 (a) | 300,000 | 397,455 |
| 5.00%, 08/15/45 (a) | 450,000 | 620,856 |
| 4.35%, 11/15/47 (a) | 350,000 | 447,972 |
| 4.55%, 02/20/48 (a) | 150,000 | 197,690 |
| 4.25%, 10/26/49 (a) | 600,000 | 765,120 |
| 2.55%, 11/13/50 (a) | 300,000 | 291,744 |
| Brown-Forman Corp. |
| 4.00%, 04/15/38 (a) | 150,000 | 179,370 |
| Brunswick Corp. |
| 0.85%, 08/18/24 (a) | 100,000 | 100,048 |
| 2.40%, 08/18/31 | 150,000 | 147,298 |
| Bunge Ltd. Finance Corp. |
| 3.00%, 09/25/22 (a) | 100,000 | 102,546 |
| 1.63%, 08/17/25 (a) | 200,000 | 203,294 |
| 3.25%, 08/15/26 (a) | 150,000 | 162,356 |
| 3.75%, 09/25/27 (a) | 250,000 | 277,900 |
| 2.75%, 05/14/31 (a) | 150,000 | 154,125 |
| Campbell Soup Co. |
| 3.65%, 03/15/23 (a) | 150,000 | 156,894 |
| 3.95%, 03/15/25 (a) | 100,000 | 109,822 |
| 3.30%, 03/19/25 (a) | 150,000 | 161,391 |
| 4.15%, 03/15/28 (a) | 250,000 | 285,075 |
| 4.80%, 03/15/48 (a) | 100,000 | 126,831 |
| 3.13%, 04/24/50 (a) | 200,000 | 199,484 |
| Cardinal Health, Inc. |
| 3.20%, 03/15/23 | 150,000 | 156,216 |
| 3.08%, 06/15/24 (a) | 350,000 | 370,926 |
| 3.75%, 09/15/25 (a) | 130,000 | 142,734 |
| 3.41%, 06/15/27 (a) | 250,000 | 274,437 |
| 4.50%, 11/15/44 (a) | 100,000 | 115,535 |
| 4.90%, 09/15/45 (a) | 180,000 | 219,170 |
| 4.37%, 06/15/47 (a) | 100,000 | 113,565 |
| Catholic Health Services of Long Island Obligated Group |
| 3.37%, 07/01/50 (a) | 150,000 | 158,900 |
| Children's Health System of Texas |
| 2.51%, 08/15/50 (a) | 150,000 | 143,882 |
| Children's Hospital |
| 2.93%, 07/15/50 (a) | 100,000 | 103,013 |
| Children's Hospital Medical Center |
| 4.27%, 05/15/44 | 100,000 | 126,926 |
| Church & Dwight Co., Inc. |
| 3.15%, 08/01/27 (a) | 100,000 | 109,494 |
| 3.95%, 08/01/47 (a) | 100,000 | 120,296 |
| Cigna Corp. |
| 3.05%, 11/30/22 (a) | 200,000 | 206,286 |
| 3.00%, 07/15/23 (a) | 150,000 | 156,585 |
| 3.75%, 07/15/23 (a) | 271,000 | 286,984 |
| 3.50%, 06/15/24 (a) | 145,000 | 155,382 |
| 3.25%, 04/15/25 (a) | 200,000 | 215,406 |
| 4.13%, 11/15/25 (a) | 450,000 | 503,163 |
| 4.50%, 02/25/26 (a) | 194,000 | 220,256 |
| 1.25%, 03/15/26 (a) | 200,000 | 201,286 |
| 3.40%, 03/01/27 (a) | 142,000 | 156,572 |
| 3.05%, 10/15/27 (a) | 145,000 | 157,334 |
| 4.38%, 10/15/28 (a) | 760,000 | 887,642 |
| 2.40%, 03/15/30 (a) | 400,000 | 412,580 |
| 2.38%, 03/15/31 (a) | 250,000 | 256,970 |
| 4.80%, 08/15/38 (a) | 380,000 | 476,246 |
| 3.20%, 03/15/40 (a) | 250,000 | 262,842 |
Security
Rate, Maturity Date | Face
Amount ($) | Value ($) |
| 6.13%, 11/15/41 | 100,000 | 144,334 |
| 4.80%, 07/15/46 (a) | 320,000 | 410,131 |
| 3.88%, 10/15/47 (a) | 145,000 | 165,083 |
| 4.90%, 12/15/48 (a) | 700,000 | 916,062 |
| 3.40%, 03/15/50 (a) | 250,000 | 266,832 |
| 3.40%, 03/15/51 (a) | 300,000 | 320,412 |
| City of Hope |
| 5.62%, 11/15/43 | 100,000 | 146,048 |
| Coca-Cola Consolidated, Inc. |
| 3.80%, 11/25/25 (a) | 100,000 | 110,635 |
| Coca-Cola Femsa S.A.B. de CV |
| 2.75%, 01/22/30 (a) | 200,000 | 209,600 |
| 1.85%, 09/01/32 (a) | 250,000 | 242,503 |
| 5.25%, 11/26/43 | 150,000 | 204,608 |
| Colgate-Palmolive Co. |
| 2.25%, 11/15/22 | 100,000 | 102,434 |
| 1.95%, 02/01/23 | 100,000 | 102,432 |
| 2.10%, 05/01/23 | 150,000 | 154,500 |
| 3.25%, 03/15/24 | 100,000 | 107,128 |
| 4.00%, 08/15/45 | 100,000 | 128,476 |
| 3.70%, 08/01/47 (a) | 100,000 | 124,021 |
| CommonSpirit Health |
| 2.95%, 11/01/22 | 100,000 | 102,799 |
| 2.76%, 10/01/24 (a) | 100,000 | 105,360 |
| 1.55%, 10/01/25 (a) | 325,000 | 329,426 |
| 3.35%, 10/01/29 (a) | 150,000 | 163,100 |
| 4.35%, 11/01/42 | 150,000 | 178,206 |
| 3.82%, 10/01/49 (a) | 150,000 | 172,787 |
| 4.19%, 10/01/49 (a) | 350,000 | 409,601 |
| 3.91%, 10/01/50 (a) | 100,000 | 112,288 |
| Community Health Network, Inc. |
| 3.10%, 05/01/50 (a) | 150,000 | 153,011 |
| Conagra Brands, Inc. |
| 3.20%, 01/25/23 (a) | 104,000 | 107,305 |
| 4.30%, 05/01/24 (a) | 200,000 | 217,978 |
| 4.60%, 11/01/25 (a) | 150,000 | 169,487 |
| 1.38%, 11/01/27 (a) | 250,000 | 245,360 |
| 4.85%, 11/01/28 (a) | 250,000 | 298,527 |
| 5.30%, 11/01/38 (a) | 400,000 | 517,964 |
| 5.40%, 11/01/48 (a) | 250,000 | 341,170 |
| Constellation Brands, Inc. |
| 3.20%, 02/15/23 (a) | 400,000 | 415,252 |
| 4.75%, 11/15/24 | 150,000 | 167,915 |
| 4.40%, 11/15/25 (a) | 100,000 | 112,805 |
| 4.75%, 12/01/25 | 100,000 | 114,779 |
| 3.70%, 12/06/26 (a) | 250,000 | 277,912 |
| 3.50%, 05/09/27 (a) | 100,000 | 110,686 |
| 3.15%, 08/01/29 (a) | 50,000 | 54,042 |
| 2.88%, 05/01/30 (a) | 400,000 | 422,108 |
| 4.50%, 05/09/47 (a) | 150,000 | 182,970 |
| 5.25%, 11/15/48 (a) | 150,000 | 203,357 |
| 3.75%, 05/01/50 (a) | 200,000 | 224,090 |
| Cottage Health Obligated Group |
| 3.30%, 11/01/49 (a) | 100,000 | 111,507 |
| CVS Health Corp. |
| 2.75%, 12/01/22 (a) | 250,000 | 256,027 |
| 3.70%, 03/09/23 (a) | 550,000 | 575,965 |
| 3.38%, 08/12/24 (a) | 230,000 | 246,157 |
| 2.63%, 08/15/24 (a) | 150,000 | 158,136 |
| 4.10%, 03/25/25 (a) | 300,000 | 330,939 |
| 3.88%, 07/20/25 (a) | 500,000 | 550,625 |
| 2.88%, 06/01/26 (a) | 200,000 | 214,890 |
| 3.00%, 08/15/26 (a) | 200,000 | 216,280 |
| 3.63%, 04/01/27 (a) | 150,000 | 166,607 |
| 1.30%, 08/21/27 (a) | 400,000 | 396,560 |
| 4.30%, 03/25/28 (a) | 1,445,000 | 1,665,998 |
Schwab Taxable Bond Funds | Annual Report
Schwab U.S. Aggregate Bond Index Fund
Portfolio Holdings as of August 31, 2021 (continued)
Security
Rate, Maturity Date | Face
Amount ($) | Value ($) |
| 3.25%, 08/15/29 (a) | 300,000 | 327,582 |
| 3.75%, 04/01/30 (a) | 300,000 | 338,337 |
| 1.75%, 08/21/30 (a) | 400,000 | 389,732 |
| 1.88%, 02/28/31 (a) | 250,000 | 245,200 |
| 4.88%, 07/20/35 (a) | 200,000 | 246,578 |
| 4.78%, 03/25/38 (a) | 1,000,000 | 1,244,610 |
| 4.13%, 04/01/40 (a) | 300,000 | 351,597 |
| 2.70%, 08/21/40 (a) | 400,000 | 393,000 |
| 5.30%, 12/05/43 (a) | 250,000 | 335,902 |
| 5.13%, 07/20/45 (a) | 600,000 | 792,462 |
| 5.05%, 03/25/48 (a) | 1,700,000 | 2,251,361 |
| 4.25%, 04/01/50 (a) | 200,000 | 243,268 |
| Danaher Corp. |
| 3.35%, 09/15/25 (a) | 50,000 | 54,733 |
| 4.38%, 09/15/45 (a) | 100,000 | 127,336 |
| 2.60%, 10/01/50 (a) | 250,000 | 244,560 |
| DENTSPLY SIRONA, Inc. |
| 3.25%, 06/01/30 (a) | 250,000 | 271,172 |
| DH Europe Finance II Sarl |
| 2.05%, 11/15/22 | 100,000 | 102,138 |
| 2.20%, 11/15/24 (a) | 100,000 | 104,475 |
| 2.60%, 11/15/29 (a) | 100,000 | 105,530 |
| 3.25%, 11/15/39 (a) | 250,000 | 272,565 |
| 3.40%, 11/15/49 (a) | 250,000 | 278,972 |
| Diageo Capital PLC |
| 2.63%, 04/29/23 (a) | 50,000 | 51,643 |
| 3.50%, 09/18/23 (a) | 200,000 | 212,354 |
| 1.38%, 09/29/25 (a) | 400,000 | 406,676 |
| 3.88%, 05/18/28 (a) | 200,000 | 229,256 |
| 2.38%, 10/24/29 (a) | 200,000 | 209,066 |
| 2.00%, 04/29/30 (a) | 250,000 | 252,292 |
| 2.13%, 04/29/32 (a) | 200,000 | 202,270 |
| 3.88%, 04/29/43 (a) | 100,000 | 120,161 |
| Diageo Investment Corp. |
| 8.00%, 09/15/22 | 150,000 | 161,984 |
| 4.25%, 05/11/42 | 150,000 | 185,985 |
| Dignity Health |
| 4.50%, 11/01/42 | 50,000 | 60,710 |
| 5.27%, 11/01/64 | 100,000 | 141,269 |
| Duke University Health System, Inc. |
| 3.92%, 06/01/47 (a) | 200,000 | 243,850 |
| Edwards Lifesciences Corp. |
| 4.30%, 06/15/28 (a) | 100,000 | 116,343 |
| Eli Lilly & Co. |
| 2.75%, 06/01/25 (a) | 100,000 | 106,627 |
| 3.10%, 05/15/27 (a) | 100,000 | 109,673 |
| 3.38%, 03/15/29 (a) | 350,000 | 394,061 |
| 3.88%, 03/15/39 (a) | 100,000 | 121,404 |
| 3.70%, 03/01/45 (a) | 100,000 | 117,681 |
| 3.95%, 05/15/47 (a) | 100,000 | 121,491 |
| 3.95%, 03/15/49 (a) | 200,000 | 246,862 |
| 2.25%, 05/15/50 (a) | 350,000 | 325,206 |
| 4.15%, 03/15/59 (a) | 200,000 | 260,212 |
| 2.50%, 09/15/60 (a) | 250,000 | 235,780 |
| Flowers Foods, Inc. |
| 2.40%, 03/15/31 (a) | 100,000 | 101,143 |
| Fomento Economico Mexicano S.A.B. de CV |
| 4.38%, 05/10/43 | 200,000 | 244,254 |
| 3.50%, 01/16/50 (a) | 500,000 | 535,245 |
| General Mills, Inc. |
| 2.60%, 10/12/22 (a) | 400,000 | 409,132 |
| 4.00%, 04/17/25 (a) | 300,000 | 331,572 |
| 4.20%, 04/17/28 (a) | 375,000 | 432,105 |
| 2.88%, 04/15/30 (a) | 150,000 | 160,712 |
Security
Rate, Maturity Date | Face
Amount ($) | Value ($) |
| 5.40%, 06/15/40 | 150,000 | 205,239 |
| 3.00%, 02/01/51 (a)(c) | 300,000 | 312,153 |
| Gilead Sciences, Inc. |
| 3.25%, 09/01/22 (a) | 400,000 | 410,084 |
| 2.50%, 09/01/23 (a) | 200,000 | 207,760 |
| 0.75%, 09/29/23 (a) | 500,000 | 500,135 |
| 3.50%, 02/01/25 (a) | 500,000 | 541,390 |
| 3.65%, 03/01/26 (a) | 450,000 | 496,449 |
| 2.95%, 03/01/27 (a) | 200,000 | 216,150 |
| 4.60%, 09/01/35 (a) | 500,000 | 617,655 |
| 4.00%, 09/01/36 (a) | 100,000 | 117,325 |
| 5.65%, 12/01/41 (a) | 674,000 | 945,433 |
| 4.80%, 04/01/44 (a) | 300,000 | 386,196 |
| 4.50%, 02/01/45 (a) | 350,000 | 434,024 |
| 4.75%, 03/01/46 (a) | 470,000 | 605,327 |
| 4.15%, 03/01/47 (a) | 150,000 | 180,027 |
| 2.80%, 10/01/50 (a) | 250,000 | 244,143 |
| GlaxoSmithKline Capital PLC |
| 0.53%, 10/01/23 (a) | 250,000 | 250,515 |
| 3.00%, 06/01/24 (a) | 200,000 | 212,768 |
| 3.38%, 06/01/29 (a) | 200,000 | 223,660 |
| GlaxoSmithKline Capital, Inc. |
| 2.80%, 03/18/23 | 250,000 | 259,715 |
| 3.38%, 05/15/23 | 200,000 | 210,454 |
| 3.63%, 05/15/25 | 300,000 | 330,180 |
| 3.88%, 05/15/28 | 400,000 | 459,900 |
| 6.38%, 05/15/38 | 713,000 | 1,076,245 |
| 4.20%, 03/18/43 | 100,000 | 124,709 |
| Hackensack Meridian Health, Inc. |
| 2.68%, 09/01/41 (a) | 250,000 | 251,252 |
| 2.88%, 09/01/50 (a) | 100,000 | 102,384 |
| 4.50%, 07/01/57 (a) | 50,000 | 68,943 |
| Hartford HealthCare Corp. |
| 3.45%, 07/01/54 | 75,000 | 80,827 |
| Hasbro, Inc. |
| 2.60%, 11/19/22 | 150,000 | 154,163 |
| 3.00%, 11/19/24 (a) | 100,000 | 106,315 |
| 3.55%, 11/19/26 (a) | 150,000 | 164,597 |
| 3.90%, 11/19/29 (a) | 100,000 | 111,891 |
| 6.35%, 03/15/40 | 200,000 | 280,678 |
| 5.10%, 05/15/44 (a) | 150,000 | 184,653 |
| HCA, Inc. |
| 4.75%, 05/01/23 | 250,000 | 266,622 |
| 5.00%, 03/15/24 | 600,000 | 660,564 |
| 5.25%, 04/15/25 | 300,000 | 342,588 |
| 5.25%, 06/15/26 (a) | 350,000 | 404,992 |
| 4.50%, 02/15/27 (a) | 200,000 | 226,908 |
| 4.13%, 06/15/29 (a) | 350,000 | 396,490 |
| 2.38%, 07/15/31 (a) | 200,000 | 200,172 |
| 5.13%, 06/15/39 (a) | 150,000 | 188,796 |
| 5.50%, 06/15/47 (a) | 450,000 | 595,282 |
| 5.25%, 06/15/49 (a) | 350,000 | 456,935 |
| 3.50%, 07/15/51 (a) | 200,000 | 204,418 |
| Hormel Foods Corp. |
| 0.65%, 06/03/24 (a) | 250,000 | 250,450 |
| 3.05%, 06/03/51 (a) | 250,000 | 266,492 |
| Illumina, Inc. |
| 2.55%, 03/23/31 (a) | 150,000 | 153,817 |
| Indiana University Health, Inc. Obligated Group |
| 3.97%, 11/01/48 (a) | 55,000 | 68,774 |
| Ingredion, Inc. |
| 2.90%, 06/01/30 (a) | 250,000 | 265,447 |
| 3.90%, 06/01/50 (a) | 100,000 | 115,608 |
| Integris Baptist Medical Center, Inc. |
| 3.88%, 08/15/50 (a) | 150,000 | 173,261 |
Schwab Taxable Bond Funds | Annual Report
Schwab U.S. Aggregate Bond Index Fund
Portfolio Holdings as of August 31, 2021 (continued)
Security
Rate, Maturity Date | Face
Amount ($) | Value ($) |
| Johnson & Johnson |
| 2.05%, 03/01/23 (a) | 300,000 | 307,233 |
| 3.38%, 12/05/23 | 400,000 | 428,580 |
| 2.63%, 01/15/25 (a) | 100,000 | 106,266 |
| 0.55%, 09/01/25 (a) | 500,000 | 495,985 |
| 2.45%, 03/01/26 (a) | 250,000 | 266,680 |
| 2.95%, 03/03/27 (a) | 100,000 | 109,669 |
| 0.95%, 09/01/27 (a) | 400,000 | 396,064 |
| 2.90%, 01/15/28 (a) | 200,000 | 218,582 |
| 1.30%, 09/01/30 (a) | 400,000 | 392,168 |
| 4.38%, 12/05/33 (a) | 150,000 | 188,528 |
| 3.55%, 03/01/36 (a) | 100,000 | 117,848 |
| 3.63%, 03/03/37 (a) | 600,000 | 707,040 |
| 3.40%, 01/15/38 (a) | 150,000 | 172,341 |
| 2.10%, 09/01/40 (a) | 350,000 | 339,356 |
| 4.50%, 09/01/40 | 150,000 | 196,901 |
| 3.70%, 03/01/46 (a) | 530,000 | 639,577 |
| 3.75%, 03/03/47 (a) | 200,000 | 244,760 |
| 3.50%, 01/15/48 (a) | 150,000 | 177,678 |
| 2.25%, 09/01/50 (a) | 350,000 | 336,147 |
| 2.45%, 09/01/60 (a) | 250,000 | 243,043 |
| Kaiser Foundation Hospitals |
| 3.15%, 05/01/27 (a) | 300,000 | 329,649 |
| 2.81%, 06/01/41 (a) | 250,000 | 258,277 |
| 4.88%, 04/01/42 | 150,000 | 205,520 |
| 4.15%, 05/01/47 (a) | 350,000 | 441,332 |
| 3.27%, 11/01/49 (a) | 150,000 | 165,537 |
| 3.00%, 06/01/51 (a) | 250,000 | 262,417 |
| Kellogg Co. |
| 2.65%, 12/01/23 | 300,000 | 314,553 |
| 3.40%, 11/15/27 (a) | 100,000 | 110,420 |
| 4.30%, 05/15/28 (a) | 100,000 | 116,242 |
| 2.10%, 06/01/30 (a) | 250,000 | 252,235 |
| 7.45%, 04/01/31 | 100,000 | 145,084 |
| 4.50%, 04/01/46 | 100,000 | 125,190 |
| Keurig Dr Pepper, Inc. |
| 4.06%, 05/25/23 (a) | 176,000 | 186,701 |
| 3.13%, 12/15/23 (a) | 250,000 | 263,925 |
| 0.75%, 03/15/24 (a) | 100,000 | 100,119 |
| 4.42%, 05/25/25 (a) | 250,000 | 279,877 |
| 2.55%, 09/15/26 (a) | 100,000 | 106,288 |
| 4.60%, 05/25/28 (a) | 550,000 | 645,848 |
| 3.20%, 05/01/30 (a) | 200,000 | 218,080 |
| 2.25%, 03/15/31 (a) | 100,000 | 101,534 |
| 4.99%, 05/25/38 (a) | 200,000 | 255,654 |
| 4.50%, 11/15/45 (a) | 250,000 | 308,765 |
| 5.09%, 05/25/48 (a) | 100,000 | 134,255 |
| 3.80%, 05/01/50 (a) | 150,000 | 171,260 |
| Kimberly-Clark Corp. |
| 2.75%, 02/15/26 | 150,000 | 162,437 |
| 1.05%, 09/15/27 (a) | 250,000 | 248,395 |
| 3.95%, 11/01/28 (a) | 200,000 | 232,548 |
| 3.20%, 04/25/29 (a) | 100,000 | 111,484 |
| 3.10%, 03/26/30 (a) | 250,000 | 278,315 |
| 3.20%, 07/30/46 (a) | 200,000 | 221,676 |
| 3.90%, 05/04/47 (a) | 100,000 | 123,043 |
| 2.88%, 02/07/50 (a) | 100,000 | 105,338 |
| Koninklijke Ahold Delhaize N.V. |
| 5.70%, 10/01/40 | 38,000 | 53,022 |
| Koninklijke Philips N.V. |
| 5.00%, 03/15/42 | 195,000 | 260,112 |
| Laboratory Corp. of America Holdings |
| 4.00%, 11/01/23 (a) | 200,000 | 212,806 |
| 3.25%, 09/01/24 (a) | 100,000 | 106,712 |
| 2.30%, 12/01/24 (a) | 100,000 | 104,468 |
| 3.60%, 02/01/25 (a) | 150,000 | 161,546 |
Security
Rate, Maturity Date | Face
Amount ($) | Value ($) |
| 3.60%, 09/01/27 (a) | 150,000 | 166,257 |
| 2.95%, 12/01/29 (a) | 100,000 | 106,540 |
| 2.70%, 06/01/31 (a) | 150,000 | 155,409 |
| 4.70%, 02/01/45 (a) | 200,000 | 248,736 |
| Mass General Brigham, Inc. |
| 3.77%, 07/01/48 (a) | 100,000 | 120,595 |
| 4.12%, 07/01/55 | 100,000 | 128,129 |
| 3.34%, 07/01/60 (a) | 100,000 | 112,397 |
| Mayo Clinic |
| 4.00%, 11/15/47 | 150,000 | 188,826 |
| McCormick & Co., Inc. |
| 3.15%, 08/15/24 (a) | 150,000 | 159,882 |
| 0.90%, 02/15/26 (a) | 200,000 | 197,796 |
| 3.40%, 08/15/27 (a) | 150,000 | 166,740 |
| 1.85%, 02/15/31 (a) | 100,000 | 97,970 |
| 4.20%, 08/15/47 (a) | 150,000 | 182,624 |
| McKesson Corp. |
| 2.70%, 12/15/22 (a) | 100,000 | 102,378 |
| 2.85%, 03/15/23 (a) | 100,000 | 103,081 |
| 3.80%, 03/15/24 (a) | 100,000 | 107,230 |
| 0.90%, 12/03/25 (a) | 200,000 | 198,038 |
| 3.95%, 02/16/28 (a) | 100,000 | 113,397 |
| McLaren Health Care Corp. |
| 4.39%, 05/15/48 (a) | 100,000 | 128,770 |
| Mead Johnson Nutrition Co. |
| 4.13%, 11/15/25 (a) | 150,000 | 168,381 |
| 5.90%, 11/01/39 | 150,000 | 217,701 |
| Medtronic Global Holdings SCA |
| 3.35%, 04/01/27 (a) | 150,000 | 165,612 |
| Medtronic, Inc. |
| 3.50%, 03/15/25 | 350,000 | 382,497 |
| 4.38%, 03/15/35 | 400,000 | 502,448 |
| 4.63%, 03/15/45 | 475,000 | 635,023 |
| Memorial Sloan-Kettering Cancer Center |
| 5.00%, 07/01/42 | 100,000 | 138,731 |
| 4.20%, 07/01/55 | 190,000 | 249,688 |
| Merck & Co., Inc. |
| 2.40%, 09/15/22 (a) | 150,000 | 152,609 |
| 2.80%, 05/18/23 | 500,000 | 521,075 |
| 2.90%, 03/07/24 (a) | 150,000 | 158,774 |
| 2.75%, 02/10/25 (a) | 480,000 | 510,974 |
| 0.75%, 02/24/26 (a) | 250,000 | 248,842 |
| 3.40%, 03/07/29 (a) | 350,000 | 393,977 |
| 1.45%, 06/24/30 (a) | 250,000 | 245,995 |
| 3.90%, 03/07/39 (a) | 450,000 | 538,083 |
| 2.35%, 06/24/40 (a) | 250,000 | 245,570 |
| 3.60%, 09/15/42 (a) | 100,000 | 116,304 |
| 4.15%, 05/18/43 | 200,000 | 249,178 |
| 3.70%, 02/10/45 (a) | 550,000 | 645,557 |
| 4.00%, 03/07/49 (a) | 300,000 | 372,129 |
| 2.45%, 06/24/50 (a) | 250,000 | 240,610 |
| Molson Coors Beverage Co. |
| 3.00%, 07/15/26 (a) | 350,000 | 376,288 |
| 5.00%, 05/01/42 | 250,000 | 312,280 |
| 4.20%, 07/15/46 (a) | 330,000 | 373,606 |
| Mondelez International, Inc. |
| 1.50%, 05/04/25 (a) | 175,000 | 178,344 |
| 3.63%, 02/13/26 (a) | 100,000 | 110,436 |
| 2.75%, 04/13/30 (a) | 300,000 | 318,114 |
| 1.50%, 02/04/31 (a) | 150,000 | 143,805 |
| 1.88%, 10/15/32 (a) | 250,000 | 244,703 |
| 2.63%, 09/04/50 (a) | 300,000 | 286,581 |
| Montefiore Obligated Group |
| 4.29%, 09/01/50 | 100,000 | 107,196 |
Schwab Taxable Bond Funds | Annual Report
Schwab U.S. Aggregate Bond Index Fund
Portfolio Holdings as of August 31, 2021 (continued)
Security
Rate, Maturity Date | Face
Amount ($) | Value ($) |
| Mount Sinai Hospitals Group, Inc. |
| 3.74%, 07/01/49 (a) | 100,000 | 113,445 |
| 3.39%, 07/01/50 (a) | 250,000 | 268,430 |
| MultiCare Health System |
| 2.80%, 08/15/50 (a) | 100,000 | 102,661 |
| Mylan, Inc. |
| 4.20%, 11/29/23 (a) | 230,000 | 245,868 |
| 4.55%, 04/15/28 (a) | 300,000 | 346,452 |
| 5.40%, 11/29/43 (a) | 100,000 | 126,575 |
| 5.20%, 04/15/48 (a) | 100,000 | 124,753 |
| Northwell Healthcare, Inc. |
| 3.98%, 11/01/46 (a) | 45,000 | 52,011 |
| 4.26%, 11/01/47 (a) | 150,000 | 181,134 |
| 3.81%, 11/01/49 (a) | 100,000 | 114,739 |
| Novant Health, Inc. |
| 2.64%, 11/01/36 (a) | 100,000 | 103,978 |
| 3.17%, 11/01/51 (a) | 100,000 | 108,195 |
| Novartis Capital Corp. |
| 3.40%, 05/06/24 | 350,000 | 376,789 |
| 1.75%, 02/14/25 (a) | 550,000 | 568,056 |
| 3.00%, 11/20/25 (a) | 250,000 | 270,902 |
| 2.00%, 02/14/27 (a) | 200,000 | 208,548 |
| 3.10%, 05/17/27 (a) | 550,000 | 603,454 |
| 2.20%, 08/14/30 (a) | 250,000 | 260,535 |
| 3.70%, 09/21/42 | 100,000 | 118,348 |
| 4.40%, 05/06/44 | 350,000 | 456,365 |
| 4.00%, 11/20/45 (a) | 300,000 | 372,171 |
| 2.75%, 08/14/50 (a) | 200,000 | 207,496 |
| NY Society for Relief of Ruptured & Crippled Maintaining Hosp Special Surgery |
| 2.67%, 10/01/50 (a) | 150,000 | 144,819 |
| NYU Langone Hospitals |
| 4.78%, 07/01/44 | 100,000 | 132,964 |
| 4.37%, 07/01/47 (a) | 100,000 | 121,341 |
| 3.38%, 07/01/55 (a) | 150,000 | 160,310 |
| Orlando Health Obligated Group |
| 4.09%, 10/01/48 (a) | 50,000 | 61,865 |
| 3.33%, 10/01/50 (a) | 100,000 | 109,046 |
| PeaceHealth Obligated Group |
| 1.38%, 11/15/25 (a) | 200,000 | 203,104 |
| 4.79%, 11/15/48 (a) | 100,000 | 137,358 |
| 3.22%, 11/15/50 (a) | 150,000 | 163,304 |
| PepsiCo, Inc. |
| 2.75%, 03/01/23 | 200,000 | 207,692 |
| 0.75%, 05/01/23 | 150,000 | 151,335 |
| 0.40%, 10/07/23 | 200,000 | 200,710 |
| 3.60%, 03/01/24 (a) | 300,000 | 321,366 |
| 2.25%, 03/19/25 (a) | 500,000 | 525,610 |
| 2.75%, 04/30/25 (a) | 150,000 | 160,208 |
| 3.50%, 07/17/25 (a) | 150,000 | 164,579 |
| 2.85%, 02/24/26 (a) | 250,000 | 270,380 |
| 2.38%, 10/06/26 (a) | 250,000 | 267,740 |
| 2.63%, 03/19/27 (a) | 150,000 | 161,594 |
| 3.00%, 10/15/27 (a) | 250,000 | 275,990 |
| 2.63%, 07/29/29 (a) | 350,000 | 376,848 |
| 2.75%, 03/19/30 (a) | 350,000 | 379,648 |
| 1.63%, 05/01/30 (a) | 200,000 | 199,456 |
| 1.40%, 02/25/31 (a) | 300,000 | 294,153 |
| 3.50%, 03/19/40 (a) | 350,000 | 401,996 |
| 3.60%, 08/13/42 | 150,000 | 175,214 |
| 4.60%, 07/17/45 (a) | 300,000 | 397,794 |
| 4.45%, 04/14/46 (a) | 300,000 | 392,571 |
| 3.45%, 10/06/46 (a) | 300,000 | 341,568 |
| 4.00%, 05/02/47 (a) | 100,000 | 123,649 |
| 3.38%, 07/29/49 (a) | 150,000 | 170,283 |
| 2.88%, 10/15/49 (a) | 150,000 | 157,674 |
Security
Rate, Maturity Date | Face
Amount ($) | Value ($) |
| 3.63%, 03/19/50 (a) | 350,000 | 416,517 |
| 3.88%, 03/19/60 (a) | 200,000 | 251,596 |
| PerkinElmer, Inc. |
| 3.30%, 09/15/29 (a) | 150,000 | 162,840 |
| 2.55%, 03/15/31 (a) | 100,000 | 103,058 |
| Perrigo Finance Unlimited Co. |
| 3.90%, 12/15/24 (a) | 91,000 | 97,271 |
| 4.38%, 03/15/26 (a) | 200,000 | 218,102 |
| 3.15%, 06/15/30 (a) | 250,000 | 262,482 |
| Pfizer, Inc. |
| 3.00%, 06/15/23 | 500,000 | 524,200 |
| 3.20%, 09/15/23 (a) | 200,000 | 211,216 |
| 2.95%, 03/15/24 (a) | 350,000 | 371,336 |
| 0.80%, 05/28/25 (a) | 250,000 | 250,510 |
| 2.75%, 06/03/26 | 200,000 | 217,248 |
| 3.00%, 12/15/26 | 450,000 | 495,589 |
| 3.60%, 09/15/28 (a) | 200,000 | 227,840 |
| 3.45%, 03/15/29 (a) | 300,000 | 338,850 |
| 2.63%, 04/01/30 (a) | 300,000 | 322,074 |
| 1.70%, 05/28/30 (a) | 200,000 | 200,386 |
| 1.75%, 08/18/31 (a) | 200,000 | 199,031 |
| 4.00%, 12/15/36 | 150,000 | 182,526 |
| 4.10%, 09/15/38 (a) | 150,000 | 183,875 |
| 3.90%, 03/15/39 (a) | 200,000 | 239,906 |
| 7.20%, 03/15/39 | 460,000 | 755,177 |
| 2.55%, 05/28/40 (a) | 200,000 | 203,304 |
| 4.30%, 06/15/43 | 200,000 | 252,730 |
| 4.40%, 05/15/44 | 180,000 | 231,887 |
| 4.13%, 12/15/46 | 250,000 | 313,197 |
| 4.20%, 09/15/48 (a) | 250,000 | 317,747 |
| 4.00%, 03/15/49 (a) | 250,000 | 310,437 |
| 2.70%, 05/28/50 (a) | 250,000 | 253,672 |
| Philip Morris International, Inc. |
| 1.13%, 05/01/23 | 200,000 | 202,652 |
| 2.13%, 05/10/23 (a) | 150,000 | 154,094 |
| 3.60%, 11/15/23 | 100,000 | 107,090 |
| 2.88%, 05/01/24 (a) | 150,000 | 158,778 |
| 3.25%, 11/10/24 | 230,000 | 248,497 |
| 1.50%, 05/01/25 (a) | 175,000 | 178,516 |
| 3.38%, 08/11/25 (a) | 330,000 | 359,010 |
| 0.88%, 05/01/26 (a) | 250,000 | 247,227 |
| 3.13%, 03/02/28 (a) | 150,000 | 163,731 |
| 3.38%, 08/15/29 (a) | 150,000 | 166,422 |
| 2.10%, 05/01/30 (a) | 200,000 | 202,256 |
| 6.38%, 05/16/38 | 250,000 | 357,482 |
| 4.38%, 11/15/41 | 200,000 | 235,980 |
| 4.50%, 03/20/42 | 250,000 | 298,065 |
| 3.88%, 08/21/42 | 100,000 | 110,482 |
| 4.13%, 03/04/43 | 350,000 | 399,651 |
| 4.88%, 11/15/43 | 100,000 | 125,779 |
| 4.25%, 11/10/44 | 200,000 | 234,902 |
| Providence St Joseph Health Obligated Group |
| 2.53%, 10/01/29 (a) | 200,000 | 210,864 |
| 3.93%, 10/01/48 (a) | 100,000 | 120,674 |
| Quest Diagnostics, Inc. |
| 3.50%, 03/30/25 (a) | 150,000 | 162,390 |
| 3.45%, 06/01/26 (a) | 150,000 | 164,481 |
| 4.20%, 06/30/29 (a) | 100,000 | 115,905 |
| 2.95%, 06/30/30 (a) | 150,000 | 160,733 |
| 2.80%, 06/30/31 (a) | 200,000 | 212,012 |
| Regeneron Pharmaceuticals, Inc. |
| 1.75%, 09/15/30 (a) | 300,000 | 288,975 |
| 2.80%, 09/15/50 (a) | 250,000 | 237,403 |
| Reynolds American, Inc. |
| 4.85%, 09/15/23 | 150,000 | 163,116 |
| 4.45%, 06/12/25 (a) | 495,000 | 548,980 |
Schwab Taxable Bond Funds | Annual Report
Schwab U.S. Aggregate Bond Index Fund
Portfolio Holdings as of August 31, 2021 (continued)
Security
Rate, Maturity Date | Face
Amount ($) | Value ($) |
| 5.70%, 08/15/35 (a) | 150,000 | 183,504 |
| 7.25%, 06/15/37 | 250,000 | 343,162 |
| 6.15%, 09/15/43 | 100,000 | 126,844 |
| 5.85%, 08/15/45 (a) | 350,000 | 434,143 |
| Royalty Pharma PLC |
| 0.75%, 09/02/23 | 250,000 | 251,165 |
| 1.20%, 09/02/25 (a) | 250,000 | 249,682 |
| 1.75%, 09/02/27 (a) | 200,000 | 200,820 |
| 2.20%, 09/02/30 (a) | 200,000 | 198,314 |
| 2.15%, 09/02/31 (a) | 250,000 | 244,210 |
| 3.30%, 09/02/40 (a) | 300,000 | 304,767 |
| 3.55%, 09/02/50 (a) | 150,000 | 150,447 |
| 3.35%, 09/02/51 (a) | 200,000 | 194,226 |
| Rush Obligated Group |
| 3.92%, 11/15/29 (a) | 100,000 | 114,563 |
| RWJ Barnabas Health, Inc. |
| 3.95%, 07/01/46 (a) | 40,000 | 48,462 |
| Sanofi |
| 3.38%, 06/19/23 (a) | 150,000 | 157,962 |
| 3.63%, 06/19/28 (a) | 250,000 | 286,042 |
| Sharp HealthCare |
| 2.68%, 08/01/50 (a) | 150,000 | 148,683 |
| Shire Acquisitions Investments Ireland DAC |
| 2.88%, 09/23/23 (a) | 525,000 | 548,221 |
| 3.20%, 09/23/26 (a) | 635,000 | 689,534 |
| Smith & Nephew PLC |
| 2.03%, 10/14/30 (a) | 250,000 | 246,370 |
| Spectrum Health System Obligated Group |
| 3.49%, 07/15/49 (a) | 50,000 | 57,150 |
| Stanford Health Care |
| 3.31%, 08/15/30 (a) | 100,000 | 111,213 |
| 3.80%, 11/15/48 (a) | 200,000 | 241,760 |
| STERIS Irish FinCo Unlimited Co. |
| 2.70%, 03/15/31 (a) | 150,000 | 155,060 |
| 3.75%, 03/15/51 (a) | 150,000 | 164,921 |
| Stryker Corp. |
| 0.60%, 12/01/23 (a) | 200,000 | 200,036 |
| 1.15%, 06/15/25 (a) | 200,000 | 201,198 |
| 3.38%, 11/01/25 (a) | 150,000 | 163,550 |
| 3.50%, 03/15/26 (a) | 150,000 | 164,882 |
| 3.65%, 03/07/28 (a) | 150,000 | 169,136 |
| 1.95%, 06/15/30 (a) | 250,000 | 250,662 |
| 4.38%, 05/15/44 (a) | 100,000 | 125,036 |
| 4.63%, 03/15/46 (a) | 250,000 | 329,085 |
| 2.90%, 06/15/50 (a) | 200,000 | 205,134 |
| Sutter Health |
| 1.32%, 08/15/25 (a) | 200,000 | 202,312 |
| 2.29%, 08/15/30 (a) | 100,000 | 102,602 |
| 3.16%, 08/15/40 (a) | 100,000 | 106,865 |
| 4.09%, 08/15/48 (a) | 65,000 | 80,062 |
| 3.36%, 08/15/50 (a) | 200,000 | 218,608 |
| Sysco Corp. |
| 3.55%, 03/15/25 (a) | 100,000 | 108,682 |
| 5.65%, 04/01/25 (a) | 100,000 | 115,397 |
| 3.75%, 10/01/25 (a) | 100,000 | 110,025 |
| 3.30%, 07/15/26 (a) | 150,000 | 163,157 |
| 3.25%, 07/15/27 (a) | 150,000 | 163,922 |
| 2.40%, 02/15/30 (a) | 200,000 | 206,360 |
| 5.95%, 04/01/30 (a) | 300,000 | 387,072 |
| 4.85%, 10/01/45 (a) | 100,000 | 127,868 |
| 4.50%, 04/01/46 (a) | 150,000 | 182,909 |
| 4.45%, 03/15/48 (a) | 100,000 | 122,165 |
| 3.30%, 02/15/50 (a) | 100,000 | 104,894 |
| 6.60%, 04/01/50 (a) | 250,000 | 400,762 |
Security
Rate, Maturity Date | Face
Amount ($) | Value ($) |
| Takeda Pharmaceutical Co., Ltd. |
| 4.40%, 11/26/23 (a) | 200,000 | 216,158 |
| 5.00%, 11/26/28 (a) | 450,000 | 543,762 |
| 2.05%, 03/31/30 (a) | 500,000 | 498,520 |
| 3.03%, 07/09/40 (a) | 400,000 | 411,924 |
| 3.18%, 07/09/50 (a) | 450,000 | 467,010 |
| 3.38%, 07/09/60 (a) | 200,000 | 213,232 |
| Texas Health Resources |
| 2.33%, 11/15/50 (a) | 250,000 | 231,298 |
| The Children's Hospital Corp. |
| 4.12%, 01/01/47 (a) | 100,000 | 129,130 |
| 2.59%, 02/01/50 (a) | 80,000 | 78,822 |
| The Children's Hospital of Philadelphia |
| 2.70%, 07/01/50 (a) | 250,000 | 250,575 |
| The Cleveland Clinic Foundation |
| 4.86%, 01/01/14 | 100,000 | 148,471 |
| The Clorox Co. |
| 3.50%, 12/15/24 (a) | 250,000 | 270,870 |
| 3.10%, 10/01/27 (a) | 150,000 | 163,808 |
| 3.90%, 05/15/28 (a) | 100,000 | 114,236 |
| The Coca-Cola Co. |
| 1.75%, 09/06/24 | 400,000 | 416,400 |
| 3.38%, 03/25/27 | 300,000 | 335,679 |
| 1.45%, 06/01/27 | 200,000 | 203,982 |
| 1.50%, 03/05/28 | 200,000 | 201,862 |
| 1.00%, 03/15/28 | 350,000 | 341,827 |
| 2.13%, 09/06/29 | 150,000 | 156,008 |
| 3.45%, 03/25/30 | 200,000 | 227,452 |
| 1.65%, 06/01/30 | 300,000 | 297,753 |
| 2.00%, 03/05/31 | 200,000 | 203,990 |
| 1.38%, 03/15/31 | 350,000 | 337,827 |
| 2.25%, 01/05/32 | 350,000 | 362,467 |
| 2.50%, 06/01/40 | 200,000 | 200,838 |
| 2.88%, 05/05/41 | 150,000 | 157,701 |
| 4.20%, 03/25/50 | 150,000 | 192,336 |
| 2.60%, 06/01/50 | 350,000 | 347,441 |
| 3.00%, 03/05/51 | 350,000 | 373,912 |
| 2.50%, 03/15/51 | 300,000 | 291,372 |
| 2.75%, 06/01/60 | 200,000 | 201,704 |
| The Estee Lauder Cos., Inc. |
| 2.00%, 12/01/24 (a) | 200,000 | 209,208 |
| 3.15%, 03/15/27 (a) | 100,000 | 110,341 |
| 2.38%, 12/01/29 (a) | 100,000 | 105,289 |
| 2.60%, 04/15/30 (a) | 150,000 | 159,785 |
| 1.95%, 03/15/31 (a) | 150,000 | 152,105 |
| 6.00%, 05/15/37 | 90,000 | 130,520 |
| 4.15%, 03/15/47 (a) | 100,000 | 127,834 |
| 3.13%, 12/01/49 (a) | 150,000 | 166,586 |
| The Hershey Co. |
| 3.38%, 05/15/23 (a) | 100,000 | 104,936 |
| 2.05%, 11/15/24 (a) | 100,000 | 104,506 |
| 0.90%, 06/01/25 (a) | 150,000 | 150,554 |
| 2.45%, 11/15/29 (a) | 100,000 | 105,998 |
| 3.13%, 11/15/49 (a) | 100,000 | 108,832 |
| 2.65%, 06/01/50 (a) | 200,000 | 201,366 |
| The JM Smucker Co. |
| 3.50%, 03/15/25 | 487,000 | 529,715 |
| 2.38%, 03/15/30 (a) | 100,000 | 103,318 |
| 4.38%, 03/15/45 | 100,000 | 122,070 |
| 3.55%, 03/15/50 (a) | 100,000 | 111,607 |
| The Johns Hopkins Health System Corp. |
| 3.84%, 05/15/46 | 150,000 | 179,819 |
| The Kroger Co. |
| 3.50%, 02/01/26 (a) | 200,000 | 220,442 |
| 2.65%, 10/15/26 (a) | 150,000 | 159,942 |
Schwab Taxable Bond Funds | Annual Report
Schwab U.S. Aggregate Bond Index Fund
Portfolio Holdings as of August 31, 2021 (continued)
Security
Rate, Maturity Date | Face
Amount ($) | Value ($) |
| 3.70%, 08/01/27 (a) | 100,000 | 112,442 |
| 4.50%, 01/15/29 (a) | 200,000 | 237,358 |
| 2.20%, 05/01/30 (a) | 400,000 | 406,652 |
| 1.70%, 01/15/31 (a) | 100,000 | 96,965 |
| 5.40%, 07/15/40 (a) | 200,000 | 267,682 |
| 5.00%, 04/15/42 (a) | 100,000 | 129,652 |
| 3.88%, 10/15/46 (a) | 100,000 | 112,931 |
| 4.45%, 02/01/47 (a) | 350,000 | 427,654 |
| 4.65%, 01/15/48 (a) | 150,000 | 188,760 |
| 3.95%, 01/15/50 (a) | 150,000 | 175,215 |
| The Methodist Hospital |
| 2.71%, 12/01/50 (a) | 150,000 | 150,605 |
| The New York & Presbyterian Hospital |
| 2.26%, 08/01/40 (a) | 250,000 | 240,530 |
| 4.02%, 08/01/45 | 150,000 | 187,157 |
| 2.61%, 08/01/60 (a) | 100,000 | 96,429 |
| 3.95%, 08/01/19 (a) | 100,000 | 122,053 |
| The Procter & Gamble Co. |
| 3.10%, 08/15/23 | 150,000 | 158,346 |
| 0.55%, 10/29/25 | 325,000 | 322,754 |
| 2.70%, 02/02/26 | 150,000 | 161,996 |
| 1.00%, 04/23/26 | 250,000 | 251,617 |
| 2.45%, 11/03/26 | 241,000 | 258,321 |
| 2.80%, 03/25/27 | 200,000 | 217,700 |
| 2.85%, 08/11/27 | 150,000 | 164,283 |
| 3.00%, 03/25/30 | 200,000 | 222,158 |
| 1.20%, 10/29/30 | 150,000 | 144,705 |
| 1.95%, 04/23/31 | 150,000 | 154,175 |
| 3.55%, 03/25/40 | 300,000 | 358,071 |
| 3.50%, 10/25/47 | 200,000 | 243,000 |
| 3.60%, 03/25/50 | 175,000 | 219,259 |
| The Toledo Hospital |
| 5.33%, 11/15/28 | 150,000 | 173,085 |
| 6.02%, 11/15/48 | 50,000 | 61,676 |
| Thermo Fisher Scientific, Inc. |
| 4.13%, 03/25/25 (a) | 150,000 | 165,822 |
| 2.95%, 09/19/26 (a) | 400,000 | 432,260 |
| 3.20%, 08/15/27 (a) | 100,000 | 109,778 |
| 1.75%, 10/15/28 (a) | 200,000 | 201,998 |
| 2.60%, 10/01/29 (a) | 150,000 | 158,603 |
| 4.50%, 03/25/30 (a) | 250,000 | 299,050 |
| 2.00%, 10/15/31 (a) | 250,000 | 249,714 |
| 2.80%, 10/15/41 (a) | 250,000 | 255,463 |
| 5.30%, 02/01/44 (a) | 145,000 | 204,025 |
| 4.10%, 08/15/47 (a) | 150,000 | 186,600 |
| Trinity Health Corp. |
| 4.13%, 12/01/45 | 100,000 | 126,315 |
| Tyson Foods, Inc. |
| 3.90%, 09/28/23 (a) | 150,000 | 160,163 |
| 3.95%, 08/15/24 (a) | 300,000 | 325,650 |
| 4.00%, 03/01/26 (a) | 100,000 | 111,747 |
| 3.55%, 06/02/27 (a) | 350,000 | 390,544 |
| 4.35%, 03/01/29 (a) | 150,000 | 175,589 |
| 4.88%, 08/15/34 (a) | 150,000 | 188,421 |
| 5.15%, 08/15/44 (a) | 150,000 | 199,991 |
| 4.55%, 06/02/47 (a) | 100,000 | 125,751 |
| 5.10%, 09/28/48 (a) | 200,000 | 274,078 |
| Unilever Capital Corp. |
| 0.38%, 09/14/23 | 250,000 | 250,527 |
| 2.60%, 05/05/24 (a) | 200,000 | 210,450 |
| 3.38%, 03/22/25 (a) | 100,000 | 108,840 |
| 2.00%, 07/28/26 | 500,000 | 523,755 |
| 2.90%, 05/05/27 (a) | 250,000 | 272,047 |
| 3.50%, 03/22/28 (a) | 250,000 | 281,302 |
| 2.13%, 09/06/29 (a) | 150,000 | 155,375 |
| 1.38%, 09/14/30 (a) | 250,000 | 243,393 |
Security
Rate, Maturity Date | Face
Amount ($) | Value ($) |
| 5.90%, 11/15/32 | 300,000 | 413,354 |
| 2.63%, 08/12/51 (a) | 100,000 | 100,701 |
| Universal Health Services, Inc. |
| 2.65%, 10/15/30 (a)(c) | 225,000 | 229,480 |
| Utah Acquisition Sub, Inc. |
| 3.95%, 06/15/26 (a) | 300,000 | 332,580 |
| 5.25%, 06/15/46 (a) | 200,000 | 248,866 |
| Viatris, Inc. |
| 1.65%, 06/22/25 (a)(c) | 150,000 | 152,460 |
| 2.30%, 06/22/27 (a)(c) | 250,000 | 257,367 |
| 2.70%, 06/22/30 (a)(c) | 300,000 | 306,978 |
| 3.85%, 06/22/40 (a)(c) | 300,000 | 325,251 |
| 4.00%, 06/22/50 (a)(c) | 400,000 | 435,828 |
| West Virginia United Health System Obligated Group |
| 3.13%, 06/01/50 (a) | 100,000 | 103,721 |
| Whirlpool Corp. |
| 3.70%, 05/01/25 | 100,000 | 109,463 |
| 4.75%, 02/26/29 (a) | 100,000 | 118,755 |
| 2.40%, 05/15/31 (a) | 100,000 | 102,070 |
| 4.50%, 06/01/46 (a) | 100,000 | 122,734 |
| 4.60%, 05/15/50 (a) | 100,000 | 126,563 |
| Wyeth LLC |
| 6.50%, 02/01/34 | 150,000 | 219,267 |
| 6.00%, 02/15/36 | 100,000 | 144,282 |
| 5.95%, 04/01/37 | 500,000 | 718,785 |
| Yale-New Haven Health Services Corp. |
| 2.50%, 07/01/50 (a) | 150,000 | 143,232 |
| Zimmer Biomet Holdings, Inc. |
| 3.70%, 03/19/23 (a) | 250,000 | 261,575 |
| 3.55%, 04/01/25 (a) | 350,000 | 378,514 |
| 3.05%, 01/15/26 (a) | 100,000 | 107,698 |
| 3.55%, 03/20/30 (a) | 100,000 | 110,721 |
| 4.45%, 08/15/45 (a) | 150,000 | 181,350 |
| Zoetis, Inc. |
| 3.25%, 02/01/23 (a) | 70,000 | 72,358 |
| 3.00%, 09/12/27 (a) | 200,000 | 217,406 |
| 3.90%, 08/20/28 (a) | 200,000 | 228,336 |
| 2.00%, 05/15/30 (a) | 250,000 | 251,712 |
| 4.70%, 02/01/43 (a) | 195,000 | 253,954 |
| 4.45%, 08/20/48 (a) | 100,000 | 130,003 |
| 3.00%, 05/15/50 (a) | 200,000 | 210,248 |
| | | 226,619,334 |
| Energy 2.0% |
| Baker Hughes a GE Co., LLC/Baker Hughes Co-Obligor, Inc. |
| 2.77%, 12/15/22 (a) | 200,000 | 206,002 |
| 3.34%, 12/15/27 (a) | 200,000 | 219,442 |
| 3.14%, 11/07/29 (a) | 100,000 | 108,376 |
| 4.49%, 05/01/30 (a) | 150,000 | 177,552 |
| 4.08%, 12/15/47 (a) | 300,000 | 343,986 |
| Baker Hughes Holdings LLC |
| 5.13%, 09/15/40 | 350,000 | 453,407 |
| Boardwalk Pipelines LP |
| 4.95%, 12/15/24 (a) | 350,000 | 389,889 |
| 4.80%, 05/03/29 (a) | 100,000 | 115,769 |
| 3.40%, 02/15/31 (a) | 250,000 | 267,417 |
| BP Capital Markets America, Inc. |
| 2.94%, 04/06/23 | 200,000 | 208,170 |
| 2.75%, 05/10/23 | 300,000 | 312,243 |
| 3.22%, 11/28/23 (a) | 250,000 | 264,290 |
| 3.79%, 02/06/24 (a) | 150,000 | 161,066 |
| 3.22%, 04/14/24 (a) | 250,000 | 265,712 |
| 3.19%, 04/06/25 (a) | 250,000 | 268,795 |
| 3.80%, 09/21/25 (a) | 300,000 | 331,572 |
Schwab Taxable Bond Funds | Annual Report
Schwab U.S. Aggregate Bond Index Fund
Portfolio Holdings as of August 31, 2021 (continued)
Security
Rate, Maturity Date | Face
Amount ($) | Value ($) |
| 3.41%, 02/11/26 (a) | 150,000 | 164,190 |
| 3.12%, 05/04/26 (a) | 200,000 | 217,144 |
| 3.02%, 01/16/27 (a) | 100,000 | 108,194 |
| 3.59%, 04/14/27 (a) | 200,000 | 222,186 |
| 3.94%, 09/21/28 (a) | 150,000 | 170,984 |
| 4.23%, 11/06/28 (a) | 250,000 | 289,450 |
| 3.63%, 04/06/30 (a) | 300,000 | 338,658 |
| 1.75%, 08/10/30 (a) | 350,000 | 344,967 |
| 3.06%, 06/17/41 (a) | 200,000 | 206,292 |
| 3.00%, 02/24/50 (a) | 400,000 | 397,176 |
| 2.77%, 11/10/50 (a) | 400,000 | 379,904 |
| 2.94%, 06/04/51 (a) | 450,000 | 442,152 |
| 3.38%, 02/08/61 (a) | 400,000 | 415,328 |
| BP Capital Markets PLC |
| 2.50%, 11/06/22 | 150,000 | 153,932 |
| 3.81%, 02/10/24 | 250,000 | 269,547 |
| 3.54%, 11/04/24 | 200,000 | 216,894 |
| 3.51%, 03/17/25 | 100,000 | 108,887 |
| 3.28%, 09/19/27 (a) | 650,000 | 717,918 |
| 3.72%, 11/28/28 (a) | 150,000 | 169,160 |
| Burlington Resources LLC |
| 5.95%, 10/15/36 | 100,000 | 139,462 |
| Canadian Natural Resources Ltd. |
| 2.95%, 01/15/23 (a) | 250,000 | 257,945 |
| 3.80%, 04/15/24 (a) | 100,000 | 106,921 |
| 3.90%, 02/01/25 (a) | 130,000 | 140,959 |
| 2.05%, 07/15/25 (a) | 150,000 | 154,494 |
| 3.85%, 06/01/27 (a) | 250,000 | 275,610 |
| 6.45%, 06/30/33 | 295,000 | 390,727 |
| 6.25%, 03/15/38 | 330,000 | 446,236 |
| 6.75%, 02/01/39 | 150,000 | 211,846 |
| 4.95%, 06/01/47 (a) | 100,000 | 125,747 |
| Cenovus Energy, Inc. |
| 4.00%, 04/15/24 (a) | 200,000 | 213,948 |
| 5.38%, 07/15/25 (a) | 250,000 | 283,900 |
| 4.25%, 04/15/27 (a) | 300,000 | 333,678 |
| 4.40%, 04/15/29 (a) | 200,000 | 225,002 |
| 6.75%, 11/15/39 | 400,000 | 541,492 |
| 5.40%, 06/15/47 (a) | 200,000 | 247,592 |
| Cheniere Corpus Christi Holdings LLC |
| 7.00%, 06/30/24 (a) | 400,000 | 454,632 |
| 5.88%, 03/31/25 (a) | 300,000 | 341,187 |
| 5.13%, 06/30/27 (a) | 400,000 | 466,548 |
| 3.70%, 11/15/29 (a) | 200,000 | 219,866 |
| Chevron Corp. |
| 2.36%, 12/05/22 (a) | 600,000 | 612,960 |
| 1.14%, 05/11/23 | 250,000 | 253,752 |
| 3.19%, 06/24/23 (a) | 650,000 | 679,666 |
| 1.55%, 05/11/25 (a) | 450,000 | 461,880 |
| 2.95%, 05/16/26 (a) | 500,000 | 542,230 |
| 2.00%, 05/11/27 (a) | 200,000 | 207,712 |
| 2.24%, 05/11/30 (a) | 200,000 | 207,562 |
| 2.98%, 05/11/40 (a) | 200,000 | 210,398 |
| 3.08%, 05/11/50 (a) | 200,000 | 211,514 |
| Chevron USA, Inc. |
| 0.43%, 08/11/23 | 200,000 | 200,526 |
| 3.90%, 11/15/24 (a) | 200,000 | 219,308 |
| 0.69%, 08/12/25 (a) | 100,000 | 99,494 |
| 1.02%, 08/12/27 (a) | 250,000 | 246,340 |
| 3.85%, 01/15/28 (a) | 200,000 | 226,838 |
| 3.25%, 10/15/29 (a) | 100,000 | 110,919 |
| 6.00%, 03/01/41 (a) | 150,000 | 221,877 |
| 5.25%, 11/15/43 (a) | 100,000 | 138,044 |
| 5.05%, 11/15/44 (a) | 150,000 | 203,303 |
| 4.95%, 08/15/47 (a) | 100,000 | 137,030 |
Security
Rate, Maturity Date | Face
Amount ($) | Value ($) |
| 4.20%, 10/15/49 (a) | 100,000 | 124,510 |
| 2.34%, 08/12/50 (a) | 250,000 | 229,732 |
| Cimarex Energy Co. |
| 4.38%, 06/01/24 (a) | 180,000 | 194,873 |
| 4.38%, 03/15/29 (a) | 100,000 | 113,861 |
| Columbia Pipeline Group, Inc. |
| 4.50%, 06/01/25 (a) | 200,000 | 224,066 |
| 5.80%, 06/01/45 (a) | 100,000 | 140,577 |
| Conoco Funding Co. |
| 7.25%, 10/15/31 | 150,000 | 218,683 |
| ConocoPhillips |
| 3.75%, 10/01/27 (a) | 150,000 | 168,836 |
| 4.30%, 08/15/28 (a)(c) | 200,000 | 231,740 |
| 2.40%, 02/15/31 (a)(c) | 250,000 | 257,205 |
| 4.88%, 10/01/47 (a)(c) | 100,000 | 132,611 |
| 4.85%, 08/15/48 (a)(c) | 100,000 | 132,546 |
| ConocoPhillips Co. |
| 3.35%, 11/15/24 (a) | 100,000 | 107,627 |
| 4.95%, 03/15/26 (a) | 450,000 | 521,842 |
| 6.95%, 04/15/29 | 400,000 | 541,688 |
| 6.50%, 02/01/39 | 800,000 | 1,181,336 |
| 4.30%, 11/15/44 (a) | 150,000 | 182,660 |
| 5.95%, 03/15/46 (a) | 100,000 | 150,313 |
| Devon Energy Corp. |
| 5.85%, 12/15/25 (a) | 150,000 | 174,758 |
| 5.25%, 10/15/27 (a) | 130,000 | 138,483 |
| 5.88%, 06/15/28 (a)(c) | 30,000 | 33,057 |
| 4.50%, 01/15/30 (a)(c) | 130,000 | 142,095 |
| 7.95%, 04/15/32 | 300,000 | 431,226 |
| 5.60%, 07/15/41 (a) | 400,000 | 500,980 |
| 4.75%, 05/15/42 (a) | 100,000 | 114,126 |
| 5.00%, 06/15/45 (a) | 100,000 | 118,566 |
| Diamondback Energy, Inc. |
| 2.88%, 12/01/24 (a) | 300,000 | 315,195 |
| 4.75%, 05/31/25 (a) | 150,000 | 167,993 |
| 3.25%, 12/01/26 (a) | 200,000 | 214,770 |
| 3.50%, 12/01/29 (a) | 150,000 | 161,786 |
| 3.13%, 03/24/31 (a) | 500,000 | 522,890 |
| Eastern Energy Gas Holdings LLC |
| 3.55%, 11/01/23 (a) | 200,000 | 211,378 |
| 2.50%, 11/15/24 (a) | 100,000 | 104,794 |
| Eastern Gas Transmission & Storage, Inc. |
| 3.00%, 11/15/29 (a)(c) | 200,000 | 212,998 |
| 4.80%, 11/01/43 (a)(c) | 100,000 | 124,232 |
| Enable Midstream Partners LP |
| 3.90%, 05/15/24 (a) | 150,000 | 159,629 |
| 4.95%, 05/15/28 (a) | 300,000 | 341,529 |
| 4.15%, 09/15/29 (a) | 150,000 | 164,600 |
| 5.00%, 05/15/44 (a) | 75,000 | 82,142 |
| Enbridge Energy Partners LP |
| 5.88%, 10/15/25 (a) | 200,000 | 234,964 |
| 5.50%, 09/15/40 (a) | 180,000 | 236,315 |
| 7.38%, 10/15/45 (a) | 100,000 | 160,625 |
| Enbridge, Inc. |
| 4.00%, 10/01/23 (a) | 250,000 | 265,547 |
| 3.70%, 07/15/27 (a) | 350,000 | 388,248 |
| 3.13%, 11/15/29 (a) | 250,000 | 268,772 |
| 2.50%, 08/01/33 (a) | 200,000 | 202,346 |
| 4.50%, 06/10/44 (a) | 200,000 | 237,332 |
| 5.50%, 12/01/46 (a) | 200,000 | 274,074 |
| 4.00%, 11/15/49 (a) | 100,000 | 113,404 |
| 3.40%, 08/01/51 (a) | 150,000 | 155,784 |
| Energy Transfer LP |
| 3.45%, 01/15/23 (a) | 150,000 | 154,491 |
| 3.60%, 02/01/23 (a) | 150,000 | 155,088 |
Schwab Taxable Bond Funds | Annual Report
Schwab U.S. Aggregate Bond Index Fund
Portfolio Holdings as of August 31, 2021 (continued)
Security
Rate, Maturity Date | Face
Amount ($) | Value ($) |
| 4.25%, 03/15/23 (a) | 250,000 | 261,177 |
| 4.20%, 09/15/23 (a) | 200,000 | 212,968 |
| 5.88%, 01/15/24 (a) | 250,000 | 275,497 |
| 4.25%, 04/01/24 (a) | 250,000 | 268,290 |
| 4.05%, 03/15/25 (a) | 150,000 | 162,474 |
| 2.90%, 05/15/25 (a) | 250,000 | 262,797 |
| 5.95%, 12/01/25 (a) | 200,000 | 233,722 |
| 4.75%, 01/15/26 (a) | 150,000 | 168,411 |
| 3.90%, 07/15/26 (a) | 100,000 | 109,918 |
| 4.20%, 04/15/27 (a) | 100,000 | 111,180 |
| 5.50%, 06/01/27 (a) | 150,000 | 176,960 |
| 4.00%, 10/01/27 (a) | 200,000 | 222,244 |
| 4.95%, 06/15/28 (a) | 150,000 | 173,921 |
| 5.25%, 04/15/29 (a) | 150,000 | 176,942 |
| 3.75%, 05/15/30 (a) | 300,000 | 326,418 |
| 4.90%, 03/15/35 (a) | 230,000 | 265,135 |
| 5.80%, 06/15/38 (a) | 150,000 | 186,185 |
| 7.50%, 07/01/38 | 150,000 | 210,761 |
| 6.05%, 06/01/41 (a) | 100,000 | 125,920 |
| 6.50%, 02/01/42 (a) | 425,000 | 556,903 |
| 6.10%, 02/15/42 | 100,000 | 126,306 |
| 5.95%, 10/01/43 (a) | 200,000 | 249,198 |
| 5.30%, 04/01/44 (a) | 200,000 | 233,906 |
| 5.15%, 03/15/45 (a) | 250,000 | 291,077 |
| 5.35%, 05/15/45 (a) | 100,000 | 117,930 |
| 6.13%, 12/15/45 (a) | 265,000 | 341,370 |
| 5.30%, 04/15/47 (a) | 100,000 | 118,048 |
| 5.40%, 10/01/47 (a) | 350,000 | 422,817 |
| 6.00%, 06/15/48 (a) | 150,000 | 192,554 |
| 6.25%, 04/15/49 (a) | 250,000 | 331,580 |
| 5.00%, 05/15/50 (a) | 350,000 | 410,539 |
| Energy Transfer LP/Regency Energy Finance Corp |
| 5.00%, 10/01/22 (a) | 100,000 | 103,541 |
| 4.50%, 11/01/23 (a) | 150,000 | 160,320 |
| Energy Transfer Partners LP |
| 5.15%, 02/01/43 (a) | 100,000 | 114,028 |
| Enterprise Products Operating LLC |
| 3.35%, 03/15/23 (a) | 400,000 | 414,860 |
| 3.90%, 02/15/24 (a) | 195,000 | 208,917 |
| 3.75%, 02/15/25 (a) | 230,000 | 250,035 |
| 3.70%, 02/15/26 (a) | 250,000 | 276,345 |
| 3.95%, 02/15/27 (a) | 150,000 | 168,152 |
| 4.15%, 10/16/28 (a) | 250,000 | 287,930 |
| 3.13%, 07/31/29 (a) | 200,000 | 216,816 |
| 2.80%, 01/31/30 (a) | 350,000 | 371,910 |
| 7.55%, 04/15/38 | 100,000 | 154,796 |
| 6.13%, 10/15/39 | 350,000 | 490,472 |
| 5.95%, 02/01/41 | 100,000 | 139,045 |
| 5.70%, 02/15/42 | 200,000 | 272,608 |
| 4.85%, 08/15/42 (a) | 100,000 | 123,731 |
| 4.45%, 02/15/43 (a) | 200,000 | 236,382 |
| 4.85%, 03/15/44 (a) | 300,000 | 371,646 |
| 5.10%, 02/15/45 (a) | 300,000 | 380,508 |
| 4.90%, 05/15/46 (a) | 350,000 | 436,502 |
| 4.25%, 02/15/48 (a) | 400,000 | 463,172 |
| 4.80%, 02/01/49 (a) | 150,000 | 186,795 |
| 4.20%, 01/31/50 (a) | 250,000 | 289,212 |
| 3.70%, 01/31/51 (a) | 200,000 | 216,520 |
| 3.20%, 02/15/52 (a) | 250,000 | 250,695 |
| 3.95%, 01/31/60 (a) | 150,000 | 167,403 |
| 5.25%, 08/16/77 (a)(b) | 100,000 | 104,329 |
| 5.38%, 02/15/78 (a)(b) | 100,000 | 103,543 |
| EOG Resources, Inc. |
| 2.63%, 03/15/23 (a) | 260,000 | 267,886 |
| 3.15%, 04/01/25 (a) | 100,000 | 107,416 |
| 4.15%, 01/15/26 (a) | 100,000 | 112,265 |
| 4.38%, 04/15/30 (a) | 150,000 | 177,365 |
Security
Rate, Maturity Date | Face
Amount ($) | Value ($) |
| 3.90%, 04/01/35 (a) | 174,000 | 200,547 |
| 4.95%, 04/15/50 (a) | 150,000 | 202,520 |
| Exxon Mobil Corp. |
| 2.73%, 03/01/23 (a) | 350,000 | 361,245 |
| 1.57%, 04/15/23 | 600,000 | 612,150 |
| 2.02%, 08/16/24 (a) | 250,000 | 260,822 |
| 2.71%, 03/06/25 (a) | 300,000 | 318,633 |
| 2.99%, 03/19/25 (a) | 700,000 | 749,287 |
| 3.04%, 03/01/26 (a) | 500,000 | 542,405 |
| 2.28%, 08/16/26 (a) | 150,000 | 158,273 |
| 3.29%, 03/19/27 (a) | 150,000 | 165,927 |
| 2.44%, 08/16/29 (a) | 200,000 | 210,268 |
| 3.48%, 03/19/30 (a) | 600,000 | 675,096 |
| 2.61%, 10/15/30 (a) | 200,000 | 212,106 |
| 3.00%, 08/16/39 (a) | 150,000 | 157,742 |
| 4.23%, 03/19/40 (a) | 450,000 | 545,800 |
| 3.57%, 03/06/45 (a) | 230,000 | 256,379 |
| 4.11%, 03/01/46 (a) | 550,000 | 659,873 |
| 3.10%, 08/16/49 (a) | 300,000 | 311,337 |
| 4.33%, 03/19/50 (a) | 500,000 | 628,415 |
| 3.45%, 04/15/51 (a) | 700,000 | 774,585 |
| Halliburton Co. |
| 3.50%, 08/01/23 (a) | 200,000 | 210,044 |
| 3.80%, 11/15/25 (a) | 250,000 | 275,397 |
| 2.92%, 03/01/30 (a) | 250,000 | 260,510 |
| 4.85%, 11/15/35 (a) | 150,000 | 177,767 |
| 6.70%, 09/15/38 | 100,000 | 138,296 |
| 7.45%, 09/15/39 | 200,000 | 293,304 |
| 4.50%, 11/15/41 (a) | 300,000 | 334,947 |
| 4.75%, 08/01/43 (a) | 200,000 | 229,690 |
| 5.00%, 11/15/45 (a) | 230,000 | 277,704 |
| Helmerich & Payne, Inc. |
| 4.65%, 03/15/25 (a) | 180,000 | 200,335 |
| Hess Corp. |
| 4.30%, 04/01/27 (a) | 250,000 | 278,122 |
| 7.88%, 10/01/29 | 100,000 | 136,903 |
| 7.30%, 08/15/31 | 100,000 | 136,084 |
| 6.00%, 01/15/40 | 100,000 | 128,949 |
| 5.60%, 02/15/41 | 100,000 | 124,888 |
| 5.80%, 04/01/47 (a) | 450,000 | 586,651 |
| HollyFrontier Corp. |
| 2.63%, 10/01/23 | 100,000 | 103,291 |
| 5.88%, 04/01/26 (a) | 150,000 | 172,508 |
| 4.50%, 10/01/30 (a) | 200,000 | 215,398 |
| Kinder Morgan Energy Partners LP |
| 3.95%, 09/01/22 (a) | 450,000 | 462,100 |
| 4.15%, 02/01/24 (a) | 100,000 | 107,277 |
| 4.30%, 05/01/24 (a) | 296,000 | 320,840 |
| 7.30%, 08/15/33 | 200,000 | 285,274 |
| 5.80%, 03/15/35 | 150,000 | 194,399 |
| 6.95%, 01/15/38 | 330,000 | 473,071 |
| 6.55%, 09/15/40 | 150,000 | 211,712 |
| 7.50%, 11/15/40 | 100,000 | 149,865 |
| 5.63%, 09/01/41 | 200,000 | 257,473 |
| 5.00%, 08/15/42 (a) | 100,000 | 121,182 |
| 4.70%, 11/01/42 (a) | 195,000 | 226,816 |
| 5.00%, 03/01/43 (a) | 200,000 | 242,870 |
| 5.50%, 03/01/44 (a) | 200,000 | 255,894 |
| 5.40%, 09/01/44 (a) | 195,000 | 247,157 |
| Kinder Morgan, Inc. |
| 3.15%, 01/15/23 (a) | 150,000 | 155,286 |
| 4.30%, 06/01/25 (a) | 395,000 | 437,763 |
| 4.30%, 03/01/28 (a) | 200,000 | 228,792 |
| 2.00%, 02/15/31 (a) | 250,000 | 243,995 |
| 7.75%, 01/15/32 | 150,000 | 217,227 |
| 5.30%, 12/01/34 (a) | 250,000 | 310,932 |
Schwab Taxable Bond Funds | Annual Report
Schwab U.S. Aggregate Bond Index Fund
Portfolio Holdings as of August 31, 2021 (continued)
Security
Rate, Maturity Date | Face
Amount ($) | Value ($) |
| 5.55%, 06/01/45 (a) | 330,000 | 428,904 |
| 5.05%, 02/15/46 (a) | 200,000 | 246,454 |
| 5.20%, 03/01/48 (a) | 100,000 | 126,938 |
| 3.25%, 08/01/50 (a) | 250,000 | 246,747 |
| Magellan Midstream Partners LP |
| 3.25%, 06/01/30 (a) | 200,000 | 215,646 |
| 5.15%, 10/15/43 (a) | 250,000 | 311,822 |
| 4.85%, 02/01/49 (a) | 150,000 | 183,858 |
| 3.95%, 03/01/50 (a) | 150,000 | 164,325 |
| Marathon Oil Corp. |
| 3.85%, 06/01/25 | 200,000 | 220,944 |
| 4.40%, 07/15/27 (a) | 200,000 | 226,330 |
| 6.80%, 03/15/32 | 100,000 | 131,635 |
| 6.60%, 10/01/37 | 150,000 | 199,526 |
| 5.20%, 06/01/45 (a) | 200,000 | 242,580 |
| Marathon Petroleum Corp. |
| 4.50%, 05/01/23 (a) | 200,000 | 212,052 |
| 4.75%, 12/15/23 (a) | 150,000 | 162,582 |
| 3.63%, 09/15/24 (a) | 230,000 | 247,370 |
| 4.70%, 05/01/25 (a) | 200,000 | 224,216 |
| 5.13%, 12/15/26 (a) | 100,000 | 117,095 |
| 3.80%, 04/01/28 (a) | 100,000 | 110,965 |
| 6.50%, 03/01/41 (a) | 100,000 | 139,170 |
| 4.75%, 09/15/44 (a) | 150,000 | 177,843 |
| 4.50%, 04/01/48 (a) | 150,000 | 171,692 |
| 5.00%, 09/15/54 (a) | 250,000 | 305,490 |
| MPLX LP |
| 3.50%, 12/01/22 (a) | 150,000 | 155,202 |
| 4.50%, 07/15/23 (a) | 200,000 | 212,488 |
| 4.88%, 12/01/24 (a) | 300,000 | 333,972 |
| 4.00%, 02/15/25 (a) | 100,000 | 108,957 |
| 4.88%, 06/01/25 (a) | 300,000 | 337,512 |
| 1.75%, 03/01/26 (a) | 250,000 | 253,285 |
| 4.13%, 03/01/27 (a) | 200,000 | 224,500 |
| 4.25%, 12/01/27 (a) | 350,000 | 397,001 |
| 4.00%, 03/15/28 (a) | 150,000 | 167,564 |
| 4.80%, 02/15/29 (a) | 150,000 | 175,892 |
| 2.65%, 08/15/30 (a) | 250,000 | 254,387 |
| 4.50%, 04/15/38 (a) | 350,000 | 401,366 |
| 5.20%, 03/01/47 (a) | 250,000 | 307,675 |
| 5.20%, 12/01/47 (a) | 100,000 | 122,306 |
| 4.70%, 04/15/48 (a) | 300,000 | 349,401 |
| 5.50%, 02/15/49 (a) | 250,000 | 323,727 |
| 4.90%, 04/15/58 (a) | 100,000 | 119,173 |
| National Fuel Gas Co. |
| 5.20%, 07/15/25 (a) | 100,000 | 112,344 |
| 5.50%, 01/15/26 (a) | 100,000 | 115,691 |
| 3.95%, 09/15/27 (a) | 100,000 | 108,247 |
| 4.75%, 09/01/28 (a) | 100,000 | 113,386 |
| Northwest Pipeline LLC |
| 4.00%, 04/01/27 (a) | 200,000 | 223,762 |
| NOV, Inc. |
| 3.60%, 12/01/29 (a) | 100,000 | 106,093 |
| 3.95%, 12/01/42 (a) | 150,000 | 149,985 |
| ONEOK Partners LP |
| 3.38%, 10/01/22 (a) | 100,000 | 102,374 |
| 5.00%, 09/15/23 (a) | 150,000 | 161,114 |
| 4.90%, 03/15/25 (a) | 150,000 | 167,370 |
| 6.65%, 10/01/36 | 250,000 | 338,845 |
| 6.13%, 02/01/41 (a) | 150,000 | 194,090 |
| ONEOK, Inc. |
| 7.50%, 09/01/23 (a) | 150,000 | 167,562 |
| 2.75%, 09/01/24 (a) | 150,000 | 157,388 |
| 2.20%, 09/15/25 (a) | 50,000 | 51,432 |
| 5.85%, 01/15/26 (a) | 155,000 | 182,446 |
| 4.55%, 07/15/28 (a) | 150,000 | 171,617 |
Security
Rate, Maturity Date | Face
Amount ($) | Value ($) |
| 3.40%, 09/01/29 (a) | 150,000 | 161,262 |
| 3.10%, 03/15/30 (a) | 200,000 | 210,362 |
| 6.35%, 01/15/31 (a) | 220,000 | 283,800 |
| 5.20%, 07/15/48 (a) | 250,000 | 308,802 |
| 4.45%, 09/01/49 (a) | 150,000 | 169,409 |
| 4.50%, 03/15/50 (a) | 200,000 | 225,556 |
| 7.15%, 01/15/51 (a) | 200,000 | 294,894 |
| Phillips 66 |
| 3.85%, 04/09/25 (a) | 400,000 | 437,548 |
| 1.30%, 02/15/26 (a) | 150,000 | 150,048 |
| 3.90%, 03/15/28 (a) | 150,000 | 168,113 |
| 2.15%, 12/15/30 (a) | 250,000 | 246,037 |
| 4.65%, 11/15/34 (a) | 150,000 | 178,202 |
| 5.88%, 05/01/42 | 300,000 | 413,667 |
| 4.88%, 11/15/44 (a) | 350,000 | 440,874 |
| Phillips 66 Partners LP |
| 2.45%, 12/15/24 (a) | 150,000 | 156,161 |
| 3.61%, 02/15/25 (a) | 130,000 | 140,022 |
| 3.55%, 10/01/26 (a) | 150,000 | 162,828 |
| 3.75%, 03/01/28 (a) | 100,000 | 109,338 |
| 3.15%, 12/15/29 (a) | 100,000 | 105,786 |
| 4.68%, 02/15/45 (a) | 100,000 | 115,382 |
| 4.90%, 10/01/46 (a) | 100,000 | 119,592 |
| Pioneer Natural Resources Co. |
| 0.75%, 01/15/24 (a) | 200,000 | 199,768 |
| 1.13%, 01/15/26 (a) | 200,000 | 198,502 |
| 4.45%, 01/15/26 (a) | 250,000 | 281,025 |
| 1.90%, 08/15/30 (a) | 200,000 | 193,244 |
| Plains All American Pipeline LP/PAA Finance Corp. |
| 2.85%, 01/31/23 (a) | 250,000 | 256,032 |
| 4.50%, 12/15/26 (a) | 230,000 | 258,324 |
| 3.55%, 12/15/29 (a) | 150,000 | 159,291 |
| 3.80%, 09/15/30 (a) | 250,000 | 269,510 |
| 6.65%, 01/15/37 | 250,000 | 331,297 |
| 5.15%, 06/01/42 (a) | 100,000 | 112,708 |
| 4.30%, 01/31/43 (a) | 100,000 | 102,558 |
| 4.70%, 06/15/44 (a) | 100,000 | 106,748 |
| 4.90%, 02/15/45 (a) | 100,000 | 109,092 |
| Sabine Pass Liquefaction LLC |
| 5.63%, 04/15/23 (a) | 300,000 | 320,001 |
| 5.75%, 05/15/24 (a) | 380,000 | 423,882 |
| 5.63%, 03/01/25 (a) | 450,000 | 512,946 |
| 5.88%, 06/30/26 (a) | 200,000 | 236,446 |
| 5.00%, 03/15/27 (a) | 400,000 | 462,972 |
| 4.20%, 03/15/28 (a) | 350,000 | 393,540 |
| 4.50%, 05/15/30 (a) | 375,000 | 435,585 |
| Schlumberger Finance Canada Ltd. |
| 1.40%, 09/17/25 (a) | 150,000 | 152,259 |
| Schlumberger Investment S.A. |
| 3.65%, 12/01/23 (a) | 200,000 | 212,772 |
| 2.65%, 06/26/30 (a) | 350,000 | 367,878 |
| Shell International Finance BV |
| 2.25%, 01/06/23 | 200,000 | 205,348 |
| 3.40%, 08/12/23 | 150,000 | 159,017 |
| 0.38%, 09/15/23 | 350,000 | 350,588 |
| 3.50%, 11/13/23 (a) | 250,000 | 266,612 |
| 2.00%, 11/07/24 (a) | 200,000 | 208,550 |
| 2.38%, 04/06/25 (a) | 300,000 | 315,102 |
| 3.25%, 05/11/25 | 430,000 | 466,528 |
| 2.88%, 05/10/26 | 400,000 | 432,256 |
| 2.50%, 09/12/26 | 250,000 | 266,327 |
| 3.88%, 11/13/28 (a) | 450,000 | 517,005 |
| 2.38%, 11/07/29 (a) | 400,000 | 418,124 |
| 2.75%, 04/06/30 (a) | 500,000 | 535,435 |
| 4.13%, 05/11/35 | 400,000 | 478,028 |
| 6.38%, 12/15/38 | 500,000 | 741,830 |
Schwab Taxable Bond Funds | Annual Report
Schwab U.S. Aggregate Bond Index Fund
Portfolio Holdings as of August 31, 2021 (continued)
Security
Rate, Maturity Date | Face
Amount ($) | Value ($) |
| 5.50%, 03/25/40 | 250,000 | 349,495 |
| 3.63%, 08/21/42 | 230,000 | 259,652 |
| 4.55%, 08/12/43 | 150,000 | 190,859 |
| 4.38%, 05/11/45 | 530,000 | 662,277 |
| 4.00%, 05/10/46 | 430,000 | 514,418 |
| 3.75%, 09/12/46 | 200,000 | 231,180 |
| 3.13%, 11/07/49 (a) | 300,000 | 317,745 |
| 3.25%, 04/06/50 (a) | 500,000 | 542,855 |
| Spectra Energy Partners LP |
| 4.75%, 03/15/24 (a) | 300,000 | 327,288 |
| 3.50%, 03/15/25 (a) | 200,000 | 215,428 |
| 4.50%, 03/15/45 (a) | 150,000 | 178,559 |
| Suncor Energy, Inc. |
| 2.80%, 05/15/23 | 300,000 | 311,178 |
| 3.60%, 12/01/24 (a) | 200,000 | 217,448 |
| 3.10%, 05/15/25 (a) | 100,000 | 106,690 |
| 5.35%, 07/15/33 | 100,000 | 124,562 |
| 6.80%, 05/15/38 | 100,000 | 143,638 |
| 6.50%, 06/15/38 | 500,000 | 703,960 |
| 6.85%, 06/01/39 | 200,000 | 293,306 |
| 4.00%, 11/15/47 (a) | 100,000 | 112,602 |
| 3.75%, 03/04/51 (a) | 150,000 | 163,631 |
| TC PipeLines LP |
| 4.38%, 03/13/25 (a) | 150,000 | 164,975 |
| Tennessee Gas Pipeline Co., LLC |
| 7.00%, 10/15/28 | 200,000 | 261,474 |
| The Williams Cos., Inc. |
| 3.70%, 01/15/23 (a) | 150,000 | 155,469 |
| 4.50%, 11/15/23 (a) | 150,000 | 161,228 |
| 4.30%, 03/04/24 (a) | 850,000 | 916,997 |
| 4.55%, 06/24/24 (a) | 100,000 | 109,630 |
| 3.90%, 01/15/25 (a) | 100,000 | 108,554 |
| 3.75%, 06/15/27 (a) | 200,000 | 222,234 |
| 7.50%, 01/15/31 | 150,000 | 210,510 |
| 8.75%, 03/15/32 | 250,000 | 386,802 |
| 6.30%, 04/15/40 | 300,000 | 412,287 |
| 5.80%, 11/15/43 (a) | 222,000 | 294,572 |
| 5.40%, 03/04/44 (a) | 100,000 | 127,332 |
| 5.75%, 06/24/44 (a) | 100,000 | 133,613 |
| 4.90%, 01/15/45 (a) | 200,000 | 243,394 |
| 5.10%, 09/15/45 (a) | 100,000 | 125,269 |
| 4.85%, 03/01/48 (a) | 150,000 | 185,337 |
| TotalEnergies Capital Canada Ltd. |
| 2.75%, 07/15/23 | 400,000 | 417,776 |
| TotalEnergies Capital International S.A. |
| 3.70%, 01/15/24 | 200,000 | 215,048 |
| 3.75%, 04/10/24 | 400,000 | 433,324 |
| 2.43%, 01/10/25 (a) | 150,000 | 157,451 |
| 3.46%, 02/19/29 (a) | 300,000 | 335,799 |
| 2.83%, 01/10/30 (a) | 200,000 | 215,374 |
| 2.99%, 06/29/41 (a) | 200,000 | 207,676 |
| 3.46%, 07/12/49 (a) | 200,000 | 219,686 |
| 3.13%, 05/29/50 (a) | 450,000 | 466,155 |
| 3.39%, 06/29/60 (a) | 200,000 | 214,702 |
| TotalEnergies Capital S.A. |
| 3.88%, 10/11/28 | 150,000 | 172,539 |
| TransCanada PipeLines Ltd. |
| 3.75%, 10/16/23 (a) | 100,000 | 106,072 |
| 4.88%, 01/15/26 (a) | 200,000 | 229,598 |
| 4.25%, 05/15/28 (a) | 450,000 | 517,468 |
| 4.10%, 04/15/30 (a) | 200,000 | 229,420 |
| 4.63%, 03/01/34 (a) | 350,000 | 414,078 |
| 5.60%, 03/31/34 | 100,000 | 128,075 |
| 5.85%, 03/15/36 | 100,000 | 132,533 |
| 6.20%, 10/15/37 | 300,000 | 412,002 |
| 4.75%, 05/15/38 (a) | 100,000 | 121,093 |
Security
Rate, Maturity Date | Face
Amount ($) | Value ($) |
| 7.63%, 01/15/39 | 150,000 | 235,218 |
| 6.10%, 06/01/40 | 150,000 | 207,462 |
| 5.00%, 10/16/43 (a) | 200,000 | 252,156 |
| 4.88%, 05/15/48 (a) | 250,000 | 320,817 |
| 5.10%, 03/15/49 (a) | 250,000 | 332,477 |
| Transcontinental Gas Pipe Line Co. LLC |
| 3.25%, 05/15/30 (a) | 200,000 | 216,406 |
| 5.40%, 08/15/41 (a) | 100,000 | 131,273 |
| 4.60%, 03/15/48 (a) | 100,000 | 122,400 |
| 3.95%, 05/15/50 (a) | 100,000 | 113,771 |
| Valero Energy Corp. |
| 1.20%, 03/15/24 | 200,000 | 201,676 |
| 2.85%, 04/15/25 (a) | 550,000 | 580,701 |
| 3.40%, 09/15/26 (a) | 400,000 | 431,176 |
| 2.15%, 09/15/27 (a) | 250,000 | 254,967 |
| 4.00%, 04/01/29 (a) | 150,000 | 166,338 |
| 7.50%, 04/15/32 | 150,000 | 209,228 |
| 6.63%, 06/15/37 | 200,000 | 273,264 |
| 4.90%, 03/15/45 | 230,000 | 279,641 |
| Valero Energy Partners LP |
| 4.50%, 03/15/28 (a) | 150,000 | 170,195 |
| | | 112,485,769 |
| Industrial Other 0.1% |
| Brown University in Providence in the State of Rhode Island and Providence Plant |
| 2.92%, 09/01/50 (a) | 100,000 | 109,523 |
| California Institute of Technology |
| 4.32%, 08/01/45 | 100,000 | 131,979 |
| 3.65%, 09/01/19 (a) | 200,000 | 238,160 |
| Cintas Corp. No. 2 |
| 3.70%, 04/01/27 (a) | 300,000 | 336,876 |
| Duke University |
| 2.68%, 10/01/44 | 100,000 | 103,909 |
| 2.76%, 10/01/50 | 100,000 | 105,565 |
| 2.83%, 10/01/55 | 100,000 | 105,099 |
| Emory University |
| 2.97%, 09/01/50 (a) | 250,000 | 269,905 |
| Johns Hopkins University |
| 4.08%, 07/01/53 | 100,000 | 131,732 |
| Massachusetts Institute of Technology |
| 3.96%, 07/01/38 | 150,000 | 181,944 |
| 2.99%, 07/01/50 (a) | 100,000 | 111,207 |
| 2.29%, 07/01/51 (a) | 100,000 | 96,982 |
| 5.60%, 07/01/11 | 150,000 | 268,438 |
| 4.68%, 07/01/14 | 100,000 | 152,158 |
| Northeastern University |
| 2.89%, 10/01/50 | 150,000 | 156,117 |
| Northwestern University |
| 4.64%, 12/01/44 | 100,000 | 133,243 |
| 2.64%, 12/01/50 (a) | 100,000 | 102,374 |
| President & Fellows of Harvard College |
| 3.15%, 07/15/46 (a) | 100,000 | 113,548 |
| 2.52%, 10/15/50 (a) | 100,000 | 101,862 |
| 3.30%, 07/15/56 (a) | 100,000 | 118,463 |
| Princeton University |
| 5.70%, 03/01/39 | 200,000 | 298,250 |
| Quanta Services, Inc. |
| 2.90%, 10/01/30 (a) | 250,000 | 263,155 |
| Steelcase, Inc. |
| 5.13%, 01/18/29 (a) | 100,000 | 117,162 |
| The American University |
| 3.67%, 04/01/49 | 100,000 | 116,611 |
Schwab Taxable Bond Funds | Annual Report
Schwab U.S. Aggregate Bond Index Fund
Portfolio Holdings as of August 31, 2021 (continued)
Security
Rate, Maturity Date | Face
Amount ($) | Value ($) |
| The George Washington University |
| 4.30%, 09/15/44 | 100,000 | 129,114 |
| 4.87%, 09/15/45 | 50,000 | 69,306 |
| 4.13%, 09/15/48 (a) | 250,000 | 316,267 |
| The Georgetown University |
| 4.32%, 04/01/49 (a) | 50,000 | 63,689 |
| 2.94%, 04/01/50 | 100,000 | 102,998 |
| 5.22%, 10/01/18 (a) | 50,000 | 76,209 |
| The Leland Stanford Junior University |
| 1.29%, 06/01/27 (a) | 200,000 | 203,456 |
| 3.65%, 05/01/48 (a) | 100,000 | 124,441 |
| The Trustees of the University of Pennsylvania |
| 2.40%, 10/01/50 (a) | 150,000 | 147,464 |
| 4.67%, 09/01/12 | 50,000 | 73,402 |
| The Trustees of the University of Princeton |
| 2.52%, 07/01/50 (a) | 100,000 | 102,241 |
| The University of Chicago |
| 2.76%, 04/01/45 (a) | 100,000 | 104,598 |
| 2.55%, 04/01/50 (a) | 100,000 | 97,502 |
| Trustees of Boston College |
| 3.13%, 07/01/52 | 150,000 | 164,140 |
| University of Notre Dame du Lac |
| 3.39%, 02/15/48 (a) | 100,000 | 117,726 |
| University of Southern California |
| 3.03%, 10/01/39 | 350,000 | 380,968 |
| 3.84%, 10/01/47 (a) | 150,000 | 186,057 |
| 3.23%, 10/01/20 (a) | 100,000 | 104,271 |
| William Marsh Rice University |
| 3.57%, 05/15/45 | 200,000 | 234,412 |
| Yale University |
| 0.87%, 04/15/25 (a) | 100,000 | 100,926 |
| 1.48%, 04/15/30 (a) | 200,000 | 198,682 |
| 2.40%, 04/15/50 (a) | 100,000 | 99,046 |
| | | 7,061,177 |
| Technology 2.7% |
| Adobe, Inc. |
| 1.70%, 02/01/23 | 150,000 | 153,132 |
| 1.90%, 02/01/25 (a) | 200,000 | 207,626 |
| 3.25%, 02/01/25 (a) | 150,000 | 161,840 |
| 2.15%, 02/01/27 (a) | 200,000 | 210,258 |
| 2.30%, 02/01/30 (a) | 200,000 | 209,086 |
| Alphabet, Inc. |
| 3.38%, 02/25/24 | 345,000 | 370,734 |
| 0.45%, 08/15/25 (a) | 150,000 | 148,640 |
| 2.00%, 08/15/26 (a) | 200,000 | 210,362 |
| 0.80%, 08/15/27 (a) | 250,000 | 245,718 |
| 1.10%, 08/15/30 (a) | 250,000 | 240,148 |
| 1.90%, 08/15/40 (a) | 300,000 | 278,748 |
| 2.05%, 08/15/50 (a) | 500,000 | 454,060 |
| 2.25%, 08/15/60 (a) | 500,000 | 455,600 |
| Amdocs Ltd. |
| 2.54%, 06/15/30 (a) | 250,000 | 253,335 |
| Analog Devices, Inc. |
| 3.13%, 12/05/23 (a) | 150,000 | 158,349 |
| 2.95%, 04/01/25 (a) | 150,000 | 160,449 |
| 3.90%, 12/15/25 (a) | 150,000 | 167,234 |
| 3.50%, 12/05/26 (a) | 100,000 | 110,756 |
| 5.30%, 12/15/45 (a) | 100,000 | 138,614 |
| Apple Inc. |
| 1.70%, 09/11/22 | 200,000 | 203,126 |
| 2.10%, 09/12/22 (a) | 200,000 | 203,626 |
| 2.40%, 01/13/23 (a) | 250,000 | 256,957 |
| 2.85%, 02/23/23 (a) | 150,000 | 155,139 |
Security
Rate, Maturity Date | Face
Amount ($) | Value ($) |
| 2.40%, 05/03/23 | 1,080,000 | 1,118,761 |
| 0.75%, 05/11/23 | 350,000 | 353,066 |
| 3.00%, 02/09/24 (a) | 250,000 | 264,465 |
| 3.45%, 05/06/24 | 400,000 | 431,652 |
| 2.85%, 05/11/24 (a) | 300,000 | 318,057 |
| 1.80%, 09/11/24 (a) | 100,000 | 103,710 |
| 2.75%, 01/13/25 (a) | 200,000 | 212,940 |
| 2.50%, 02/09/25 | 539,000 | 570,176 |
| 1.13%, 05/11/25 (a) | 400,000 | 404,936 |
| 3.20%, 05/13/25 | 450,000 | 488,745 |
| 0.55%, 08/20/25 (a) | 350,000 | 347,203 |
| 0.70%, 02/08/26 (a) | 600,000 | 596,490 |
| 3.25%, 02/23/26 (a) | 680,000 | 745,470 |
| 2.45%, 08/04/26 (a) | 550,000 | 586,998 |
| 2.05%, 09/11/26 (a) | 450,000 | 472,230 |
| 3.35%, 02/09/27 (a) | 300,000 | 333,414 |
| 3.20%, 05/11/27 (a) | 350,000 | 387,772 |
| 3.00%, 06/20/27 (a) | 300,000 | 330,822 |
| 2.90%, 09/12/27 (a) | 500,000 | 546,180 |
| 3.00%, 11/13/27 (a) | 350,000 | 384,814 |
| 1.20%, 02/08/28 (a) | 500,000 | 494,885 |
| 1.40%, 08/05/28 (a) | 450,000 | 449,085 |
| 2.20%, 09/11/29 (a) | 450,000 | 470,038 |
| 1.65%, 05/11/30 (a) | 400,000 | 398,788 |
| 1.25%, 08/20/30 (a) | 500,000 | 482,320 |
| 1.65%, 02/08/31 (a) | 500,000 | 495,150 |
| 1.70%, 08/05/31 (a) | 400,000 | 396,788 |
| 4.50%, 02/23/36 (a) | 200,000 | 254,424 |
| 2.38%, 02/08/41 (a) | 500,000 | 491,440 |
| 3.85%, 05/04/43 | 480,000 | 575,203 |
| 4.45%, 05/06/44 | 150,000 | 195,314 |
| 3.45%, 02/09/45 | 400,000 | 452,468 |
| 4.38%, 05/13/45 | 300,000 | 385,101 |
| 4.65%, 02/23/46 (a) | 850,000 | 1,134,359 |
| 3.85%, 08/04/46 (a) | 400,000 | 479,672 |
| 4.25%, 02/09/47 (a) | 195,000 | 246,369 |
| 3.75%, 09/12/47 (a) | 250,000 | 295,070 |
| 3.75%, 11/13/47 (a) | 350,000 | 413,140 |
| 2.95%, 09/11/49 (a) | 400,000 | 416,816 |
| 2.65%, 05/11/50 (a) | 600,000 | 595,152 |
| 2.40%, 08/20/50 (a) | 300,000 | 284,133 |
| 2.65%, 02/08/51 (a) | 500,000 | 493,975 |
| 2.70%, 08/05/51 (a) | 350,000 | 348,471 |
| 2.55%, 08/20/60 (a) | 400,000 | 376,428 |
| 2.80%, 02/08/61 (a) | 250,000 | 247,978 |
| 2.85%, 08/05/61 (a) | 300,000 | 299,772 |
| Applied Materials, Inc. |
| 3.90%, 10/01/25 (a) | 250,000 | 278,587 |
| 3.30%, 04/01/27 (a) | 150,000 | 166,250 |
| 1.75%, 06/01/30 (a) | 250,000 | 249,040 |
| 5.10%, 10/01/35 (a) | 150,000 | 200,328 |
| 4.35%, 04/01/47 (a) | 150,000 | 192,686 |
| 2.75%, 06/01/50 (a) | 200,000 | 201,150 |
| Arrow Electronics, Inc. |
| 4.50%, 03/01/23 (a) | 100,000 | 104,787 |
| 3.25%, 09/08/24 (a) | 250,000 | 265,297 |
| Autodesk, Inc. |
| 4.38%, 06/15/25 (a) | 200,000 | 222,996 |
| 2.85%, 01/15/30 (a) | 100,000 | 106,295 |
| Automatic Data Processing, Inc. |
| 3.38%, 09/15/25 (a) | 200,000 | 219,276 |
| 1.70%, 05/15/28 (a) | 200,000 | 203,592 |
| 1.25%, 09/01/30 (a) | 300,000 | 288,441 |
| Avnet, Inc. |
| 4.88%, 12/01/22 | 100,000 | 105,078 |
| 4.63%, 04/15/26 (a) | 200,000 | 224,398 |
Schwab Taxable Bond Funds | Annual Report
Schwab U.S. Aggregate Bond Index Fund
Portfolio Holdings as of August 31, 2021 (continued)
Security
Rate, Maturity Date | Face
Amount ($) | Value ($) |
| Baidu, Inc. |
| 3.50%, 11/28/22 | 200,000 | 206,760 |
| 3.88%, 09/29/23 (a) | 200,000 | 212,128 |
| 4.13%, 06/30/25 | 500,000 | 551,605 |
| 1.72%, 04/09/26 (a) | 200,000 | 202,422 |
| 4.88%, 11/14/28 (a) | 200,000 | 236,262 |
| 2.38%, 10/09/30 (a) | 200,000 | 200,904 |
| Broadcom Corp./Broadcom Cayman Finance Ltd. |
| 3.63%, 01/15/24 (a) | 150,000 | 159,482 |
| 3.13%, 01/15/25 (a) | 100,000 | 106,364 |
| 3.88%, 01/15/27 (a) | 1,000,000 | 1,104,100 |
| 3.50%, 01/15/28 (a) | 250,000 | 272,100 |
| Broadcom, Inc. |
| 3.63%, 10/15/24 (a) | 150,000 | 162,273 |
| 4.70%, 04/15/25 (a) | 300,000 | 335,877 |
| 3.15%, 11/15/25 (a) | 400,000 | 428,620 |
| 4.25%, 04/15/26 (a) | 400,000 | 447,504 |
| 3.46%, 09/15/26 (a) | 356,000 | 386,737 |
| 1.95%, 02/15/28 (a)(c) | 250,000 | 249,530 |
| 4.11%, 09/15/28 (a) | 413,000 | 463,613 |
| 4.75%, 04/15/29 (a) | 700,000 | 813,883 |
| 5.00%, 04/15/30 (a) | 400,000 | 474,640 |
| 4.15%, 11/15/30 (a) | 450,000 | 506,839 |
| 2.45%, 02/15/31 (a)(c) | 450,000 | 446,035 |
| 4.30%, 11/15/32 (a) | 350,000 | 401,208 |
| 2.60%, 02/15/33 (a)(c) | 400,000 | 395,980 |
| 3.42%, 04/15/33 (a)(c) | 350,000 | 371,479 |
| 3.47%, 04/15/34 (a)(c) | 650,000 | 689,188 |
| 3.50%, 02/15/41 (a)(c) | 650,000 | 665,938 |
| 3.75%, 02/15/51 (a)(c) | 450,000 | 470,763 |
| Broadridge Financial Solutions, Inc. |
| 3.40%, 06/27/26 (a) | 100,000 | 109,966 |
| 2.90%, 12/01/29 (a) | 150,000 | 159,255 |
| 2.60%, 05/01/31 (a) | 200,000 | 205,960 |
| CDW LLC/CDW Finance Corp. |
| 4.13%, 05/01/25 (a) | 200,000 | 208,250 |
| 4.25%, 04/01/28 (a) | 200,000 | 209,500 |
| 3.25%, 02/15/29 (a) | 200,000 | 205,500 |
| Cisco Systems, Inc. |
| 2.20%, 09/20/23 (a) | 150,000 | 155,583 |
| 3.50%, 06/15/25 | 512,000 | 564,434 |
| 2.95%, 02/28/26 | 200,000 | 218,300 |
| 2.50%, 09/20/26 (a) | 100,000 | 107,646 |
| 5.90%, 02/15/39 | 100,000 | 145,762 |
| 5.50%, 01/15/40 | 650,000 | 920,062 |
| Citrix Systems, Inc. |
| 1.25%, 03/01/26 (a) | 250,000 | 247,215 |
| 4.50%, 12/01/27 (a) | 100,000 | 114,100 |
| 3.30%, 03/01/30 (a) | 125,000 | 131,790 |
| Corning, Inc. |
| 4.75%, 03/15/42 | 100,000 | 127,821 |
| 5.35%, 11/15/48 (a) | 200,000 | 279,644 |
| 3.90%, 11/15/49 (a) | 100,000 | 115,320 |
| 4.38%, 11/15/57 (a) | 100,000 | 123,273 |
| 5.85%, 11/15/68 (a) | 100,000 | 149,928 |
| 5.45%, 11/15/79 (a) | 190,000 | 270,136 |
| Dell International LLC/EMC Corp. |
| 5.45%, 06/15/23 (a) | 850,000 | 916,402 |
| 4.00%, 07/15/24 (a) | 250,000 | 271,420 |
| 5.85%, 07/15/25 (a) | 200,000 | 233,702 |
| 6.02%, 06/15/26 (a) | 980,000 | 1,173,129 |
| 4.90%, 10/01/26 (a) | 350,000 | 405,545 |
| 6.10%, 07/15/27 (a) | 100,000 | 123,566 |
| 5.30%, 10/01/29 (a) | 300,000 | 365,496 |
| 6.20%, 07/15/30 (a) | 200,000 | 257,910 |
Security
Rate, Maturity Date | Face
Amount ($) | Value ($) |
| 8.10%, 07/15/36 (a) | 350,000 | 538,748 |
| 8.35%, 07/15/46 (a) | 400,000 | 661,140 |
| DXC Technology Co. |
| 4.25%, 04/15/24 (a) | 100,000 | 107,989 |
| 4.13%, 04/15/25 (a) | 200,000 | 219,604 |
| 4.75%, 04/15/27 (a) | 100,000 | 114,687 |
| Equifax, Inc. |
| 2.60%, 12/01/24 (a) | 300,000 | 315,765 |
| 2.60%, 12/15/25 (a) | 200,000 | 211,724 |
| 3.10%, 05/15/30 (a) | 200,000 | 214,464 |
| 2.35%, 09/15/31 (a) | 250,000 | 251,878 |
| Equinix, Inc. |
| 2.63%, 11/18/24 (a) | 150,000 | 157,677 |
| 1.25%, 07/15/25 (a) | 250,000 | 250,280 |
| 1.00%, 09/15/25 (a) | 200,000 | 199,082 |
| 2.90%, 11/18/26 (a) | 100,000 | 107,146 |
| 1.55%, 03/15/28 (a) | 250,000 | 247,608 |
| 3.20%, 11/18/29 (a) | 200,000 | 215,650 |
| 2.15%, 07/15/30 (a) | 300,000 | 299,403 |
| 3.00%, 07/15/50 (a) | 250,000 | 244,523 |
| 2.95%, 09/15/51 (a) | 150,000 | 145,197 |
| 3.40%, 02/15/52 (a) | 150,000 | 157,772 |
| Fidelity National Information Services, Inc. |
| 0.38%, 03/01/23 | 200,000 | 200,018 |
| 0.60%, 03/01/24 | 150,000 | 150,035 |
| 1.15%, 03/01/26 (a) | 250,000 | 249,120 |
| 1.65%, 03/01/28 (a) | 200,000 | 200,146 |
| 3.75%, 05/21/29 (a) | 250,000 | 282,500 |
| 2.25%, 03/01/31 (a) | 200,000 | 201,966 |
| 3.10%, 03/01/41 (a) | 200,000 | 208,172 |
| Fiserv, Inc. |
| 3.80%, 10/01/23 (a) | 150,000 | 159,989 |
| 2.75%, 07/01/24 (a) | 450,000 | 475,564 |
| 3.85%, 06/01/25 (a) | 100,000 | 109,843 |
| 3.20%, 07/01/26 (a) | 450,000 | 489,339 |
| 2.25%, 06/01/27 (a) | 250,000 | 259,952 |
| 4.20%, 10/01/28 (a) | 150,000 | 172,446 |
| 3.50%, 07/01/29 (a) | 650,000 | 715,656 |
| 2.65%, 06/01/30 (a) | 250,000 | 259,892 |
| 4.40%, 07/01/49 (a) | 475,000 | 583,385 |
| Flex Ltd. |
| 4.75%, 06/15/25 (a) | 200,000 | 223,006 |
| 3.75%, 02/01/26 (a) | 200,000 | 218,452 |
| 4.88%, 06/15/29 (a) | 100,000 | 116,314 |
| 4.88%, 05/12/30 (a) | 200,000 | 233,162 |
| Fortinet, Inc. |
| 1.00%, 03/15/26 (a) | 150,000 | 149,141 |
| 2.20%, 03/15/31 (a) | 100,000 | 100,905 |
| Global Payments, Inc. |
| 3.75%, 06/01/23 (a) | 200,000 | 209,512 |
| 4.00%, 06/01/23 (a) | 100,000 | 105,679 |
| 2.65%, 02/15/25 (a) | 250,000 | 262,882 |
| 1.20%, 03/01/26 (a) | 200,000 | 198,924 |
| 4.45%, 06/01/28 (a) | 100,000 | 115,462 |
| 3.20%, 08/15/29 (a) | 200,000 | 214,936 |
| 2.90%, 05/15/30 (a) | 225,000 | 236,729 |
| 4.15%, 08/15/49 (a) | 200,000 | 230,448 |
| Hewlett Packard Enterprise Co. |
| 4.40%, 10/15/22 (a) | 250,000 | 259,327 |
| 2.25%, 04/01/23 (a) | 150,000 | 153,908 |
| 1.45%, 04/01/24 (a) | 500,000 | 508,710 |
| 4.65%, 10/01/24 (a) | 300,000 | 332,799 |
| 4.90%, 10/15/25 (a) | 350,000 | 398,944 |
| 1.75%, 04/01/26 (a) | 400,000 | 408,264 |
| 6.20%, 10/15/35 (a) | 150,000 | 204,524 |
| 6.35%, 10/15/45 (a) | 262,000 | 362,943 |
Schwab Taxable Bond Funds | Annual Report
Schwab U.S. Aggregate Bond Index Fund
Portfolio Holdings as of August 31, 2021 (continued)
Security
Rate, Maturity Date | Face
Amount ($) | Value ($) |
| HP, Inc. |
| 4.05%, 09/15/22 | 150,000 | 155,625 |
| 2.20%, 06/17/25 (a) | 150,000 | 155,709 |
| 1.45%, 06/17/26 (a)(c) | 200,000 | 199,988 |
| 3.00%, 06/17/27 (a) | 300,000 | 323,139 |
| 3.40%, 06/17/30 (a) | 200,000 | 214,290 |
| 2.65%, 06/17/31 (a)(c) | 200,000 | 200,662 |
| 6.00%, 09/15/41 | 250,000 | 328,880 |
| IHS Markit Ltd. |
| 4.13%, 08/01/23 (a) | 100,000 | 106,215 |
| 4.75%, 08/01/28 (a) | 150,000 | 177,564 |
| 4.25%, 05/01/29 (a) | 175,000 | 202,461 |
| Intel Corp. |
| 2.70%, 12/15/22 | 350,000 | 361,119 |
| 2.88%, 05/11/24 (a) | 300,000 | 318,315 |
| 3.40%, 03/25/25 (a) | 350,000 | 380,849 |
| 3.70%, 07/29/25 (a) | 450,000 | 495,751 |
| 2.60%, 05/19/26 (a) | 150,000 | 160,977 |
| 3.75%, 03/25/27 (a) | 250,000 | 283,005 |
| 1.60%, 08/12/28 (a) | 400,000 | 402,372 |
| 2.45%, 11/15/29 (a) | 450,000 | 475,042 |
| 3.90%, 03/25/30 (a) | 300,000 | 348,945 |
| 2.00%, 08/12/31 (a) | 300,000 | 301,655 |
| 4.00%, 12/15/32 | 150,000 | 181,272 |
| 4.60%, 03/25/40 (a) | 350,000 | 446,187 |
| 4.80%, 10/01/41 | 295,000 | 387,149 |
| 4.25%, 12/15/42 | 100,000 | 123,554 |
| 4.10%, 05/19/46 (a) | 550,000 | 665,901 |
| 4.10%, 05/11/47 (a) | 100,000 | 120,925 |
| 3.73%, 12/08/47 (a) | 350,000 | 401,586 |
| 3.25%, 11/15/49 (a) | 300,000 | 320,757 |
| 4.75%, 03/25/50 (a) | 400,000 | 537,192 |
| 3.05%, 08/12/51 (a) | 250,000 | 257,733 |
| 3.10%, 02/15/60 (a) | 160,000 | 163,677 |
| 4.95%, 03/25/60 (a) | 300,000 | 424,350 |
| 3.20%, 08/12/61 (a) | 200,000 | 207,305 |
| International Business Machines Corp. |
| 2.88%, 11/09/22 | 300,000 | 309,282 |
| 3.38%, 08/01/23 | 350,000 | 369,810 |
| 3.63%, 02/12/24 | 400,000 | 429,732 |
| 3.00%, 05/15/24 | 650,000 | 691,905 |
| 3.45%, 02/19/26 | 300,000 | 331,260 |
| 3.30%, 05/15/26 | 550,000 | 605,682 |
| 3.30%, 01/27/27 | 250,000 | 275,925 |
| 1.70%, 05/15/27 (a) | 300,000 | 306,084 |
| 6.22%, 08/01/27 | 230,000 | 291,553 |
| 3.50%, 05/15/29 | 550,000 | 616,401 |
| 1.95%, 05/15/30 (a) | 200,000 | 200,902 |
| 4.15%, 05/15/39 | 450,000 | 540,873 |
| 5.60%, 11/30/39 | 150,000 | 211,943 |
| 2.85%, 05/15/40 (a) | 400,000 | 408,668 |
| 4.00%, 06/20/42 | 200,000 | 237,216 |
| 4.70%, 02/19/46 | 150,000 | 197,318 |
| 4.25%, 05/15/49 | 650,000 | 813,117 |
| 2.95%, 05/15/50 (a) | 200,000 | 203,054 |
| Intuit, Inc. |
| 0.65%, 07/15/23 | 150,000 | 150,897 |
| 0.95%, 07/15/25 (a) | 200,000 | 200,892 |
| 1.35%, 07/15/27 (a) | 250,000 | 252,765 |
| Jabil, Inc. |
| 4.70%, 09/15/22 | 200,000 | 208,756 |
| 1.70%, 04/15/26 (a) | 200,000 | 202,120 |
| 3.60%, 01/15/30 (a) | 100,000 | 108,336 |
| 3.00%, 01/15/31 (a) | 200,000 | 206,352 |
Security
Rate, Maturity Date | Face
Amount ($) | Value ($) |
| Juniper Networks, Inc. |
| 1.20%, 12/10/25 (a) | 250,000 | 249,960 |
| 3.75%, 08/15/29 (a) | 150,000 | 166,496 |
| 5.95%, 03/15/41 | 100,000 | 135,169 |
| Keysight Technologies, Inc. |
| 4.60%, 04/06/27 (a) | 150,000 | 175,001 |
| 3.00%, 10/30/29 (a) | 100,000 | 108,024 |
| KLA Corp. |
| 4.65%, 11/01/24 (a) | 230,000 | 255,371 |
| 4.10%, 03/15/29 (a) | 100,000 | 115,401 |
| 5.00%, 03/15/49 (a) | 100,000 | 137,443 |
| 3.30%, 03/01/50 (a) | 200,000 | 218,678 |
| Lam Research Corp. |
| 3.80%, 03/15/25 (a) | 230,000 | 252,379 |
| 3.75%, 03/15/26 (a) | 200,000 | 223,582 |
| 4.00%, 03/15/29 (a) | 150,000 | 174,117 |
| 1.90%, 06/15/30 (a) | 200,000 | 201,836 |
| 4.88%, 03/15/49 (a) | 200,000 | 276,710 |
| 2.88%, 06/15/50 (a) | 200,000 | 206,014 |
| Leidos, Inc. |
| 2.95%, 05/15/23 (a) | 100,000 | 103,736 |
| 3.63%, 05/15/25 (a) | 150,000 | 162,669 |
| 4.38%, 05/15/30 (a) | 150,000 | 172,275 |
| 2.30%, 02/15/31 (a) | 250,000 | 247,723 |
| Marvell Technology, Inc. |
| 4.20%, 06/22/23 (a)(c) | 150,000 | 158,958 |
| 1.65%, 04/15/26 (a)(c) | 100,000 | 100,733 |
| 2.45%, 04/15/28 (a)(c) | 100,000 | 102,931 |
| 4.88%, 06/22/28 (a)(c) | 100,000 | 116,579 |
| 2.95%, 04/15/31 (a)(c) | 100,000 | 104,004 |
| Mastercard, Inc. |
| 2.00%, 03/03/25 (a) | 400,000 | 417,936 |
| 2.95%, 11/21/26 (a) | 250,000 | 273,310 |
| 3.30%, 03/26/27 (a) | 150,000 | 166,632 |
| 3.50%, 02/26/28 (a) | 100,000 | 112,580 |
| 2.95%, 06/01/29 (a) | 150,000 | 164,589 |
| 3.35%, 03/26/30 (a) | 300,000 | 339,111 |
| 1.90%, 03/15/31 (a) | 150,000 | 153,443 |
| 3.80%, 11/21/46 (a) | 200,000 | 240,520 |
| 3.95%, 02/26/48 (a) | 150,000 | 184,557 |
| 3.65%, 06/01/49 (a) | 250,000 | 295,715 |
| 3.85%, 03/26/50 (a) | 200,000 | 244,398 |
| 2.95%, 03/15/51 (a) | 150,000 | 158,909 |
| Maxim Integrated Products, Inc. |
| 3.45%, 06/15/27 (a) | 100,000 | 111,025 |
| Microchip Technology, Inc. |
| 4.33%, 06/01/23 (a) | 350,000 | 371,220 |
| 2.67%, 09/01/23 | 200,000 | 207,692 |
| Micron Technology, Inc. |
| 2.50%, 04/24/23 | 200,000 | 206,450 |
| 4.98%, 02/06/26 (a) | 250,000 | 287,842 |
| 4.19%, 02/15/27 (a) | 150,000 | 170,567 |
| 5.33%, 02/06/29 (a) | 200,000 | 242,150 |
| 4.66%, 02/15/30 (a) | 150,000 | 175,979 |
| Microsoft Corp. |
| 2.65%, 11/03/22 (a) | 150,000 | 153,765 |
| 2.38%, 05/01/23 (a) | 300,000 | 309,204 |
| 2.00%, 08/08/23 (a) | 400,000 | 412,748 |
| 3.63%, 12/15/23 (a) | 350,000 | 374,409 |
| 2.88%, 02/06/24 (a) | 450,000 | 475,362 |
| 2.70%, 02/12/25 (a) | 450,000 | 479,785 |
| 3.13%, 11/03/25 (a) | 530,000 | 578,188 |
| 2.40%, 08/08/26 (a) | 800,000 | 855,904 |
| 3.30%, 02/06/27 (a) | 750,000 | 837,135 |
| 3.50%, 02/12/35 (a) | 250,000 | 294,102 |
| 4.20%, 11/03/35 (a) | 250,000 | 314,057 |
Schwab Taxable Bond Funds | Annual Report
Schwab U.S. Aggregate Bond Index Fund
Portfolio Holdings as of August 31, 2021 (continued)
Security
Rate, Maturity Date | Face
Amount ($) | Value ($) |
| 3.45%, 08/08/36 (a) | 350,000 | 410,291 |
| 4.10%, 02/06/37 (a) | 450,000 | 561,060 |
| 5.30%, 02/08/41 | 100,000 | 144,756 |
| 4.45%, 11/03/45 (a) | 100,000 | 134,952 |
| 3.70%, 08/08/46 (a) | 749,000 | 912,200 |
| 4.25%, 02/06/47 (a) | 200,000 | 265,120 |
| 2.53%, 06/01/50 (a) | 1,050,000 | 1,049,223 |
| 2.92%, 03/17/52 (a) | 1,675,000 | 1,803,003 |
| 4.00%, 02/12/55 (a) | 100,000 | 128,428 |
| 3.95%, 08/08/56 (a) | 150,000 | 191,934 |
| 4.50%, 02/06/57 (a) | 150,000 | 213,266 |
| 2.68%, 06/01/60 (a) | 529,000 | 534,110 |
| 3.04%, 03/17/62 (a) | 445,000 | 484,196 |
| Moody's Corp. |
| 4.50%, 09/01/22 (a) | 150,000 | 154,602 |
| 2.63%, 01/15/23 (a) | 150,000 | 154,404 |
| 3.75%, 03/24/25 (a) | 200,000 | 218,644 |
| 4.25%, 02/01/29 (a) | 150,000 | 174,368 |
| 2.00%, 08/19/31 (a) | 200,000 | 198,542 |
| 4.88%, 12/17/48 (a) | 150,000 | 201,117 |
| 3.25%, 05/20/50 (a) | 100,000 | 105,694 |
| 2.55%, 08/18/60 (a) | 150,000 | 135,620 |
| Motorola Solutions, Inc. |
| 4.00%, 09/01/24 | 200,000 | 218,476 |
| 4.60%, 02/23/28 (a) | 150,000 | 174,617 |
| 4.60%, 05/23/29 (a) | 150,000 | 176,031 |
| 2.30%, 11/15/30 (a) | 250,000 | 248,943 |
| 2.75%, 05/24/31 (a) | 150,000 | 154,728 |
| 5.50%, 09/01/44 | 100,000 | 131,581 |
| NetApp, Inc. |
| 1.88%, 06/22/25 (a) | 250,000 | 257,682 |
| 2.38%, 06/22/27 (a) | 150,000 | 157,583 |
| NVIDIA Corp. |
| 0.31%, 06/15/23 (a) | 250,000 | 250,105 |
| 0.58%, 06/14/24 (a) | 200,000 | 200,552 |
| 3.20%, 09/16/26 (a) | 300,000 | 330,303 |
| 1.55%, 06/15/28 (a) | 250,000 | 251,335 |
| 2.85%, 04/01/30 (a) | 250,000 | 270,930 |
| 2.00%, 06/15/31 (a) | 250,000 | 252,488 |
| 3.50%, 04/01/40 (a) | 250,000 | 285,135 |
| 3.50%, 04/01/50 (a) | 450,000 | 517,909 |
| 3.70%, 04/01/60 (a) | 100,000 | 119,452 |
| NXP BV/NXP Funding LLC |
| 4.88%, 03/01/24 (a)(c) | 200,000 | 219,096 |
| 5.35%, 03/01/26 (a)(c) | 250,000 | 291,402 |
| 5.55%, 12/01/28 (a)(c) | 200,000 | 245,166 |
| 2.50%, 05/11/31 (a)(c) | 200,000 | 205,818 |
| 3.25%, 05/11/41 (a)(c) | 200,000 | 212,350 |
| NXP BV/NXP Funding LLC/NXP USA, Inc. |
| 2.70%, 05/01/25 (a)(c) | 175,000 | 184,203 |
| 4.30%, 06/18/29 (a)(c) | 150,000 | 172,566 |
| 3.40%, 05/01/30 (a)(c) | 200,000 | 219,668 |
| Oracle Corp. |
| 2.50%, 10/15/22 | 450,000 | 460,989 |
| 2.63%, 02/15/23 (a) | 400,000 | 412,300 |
| 3.63%, 07/15/23 | 212,000 | 224,510 |
| 2.40%, 09/15/23 (a) | 500,000 | 518,220 |
| 3.40%, 07/08/24 (a) | 250,000 | 267,702 |
| 2.95%, 11/15/24 (a) | 450,000 | 479,376 |
| 2.50%, 04/01/25 (a) | 750,000 | 787,117 |
| 2.95%, 05/15/25 (a) | 601,000 | 639,764 |
| 1.65%, 03/25/26 (a) | 750,000 | 762,210 |
| 2.65%, 07/15/26 (a) | 600,000 | 635,742 |
| 2.80%, 04/01/27 (a) | 400,000 | 427,100 |
| 3.25%, 11/15/27 (a) | 400,000 | 436,964 |
| 2.30%, 03/25/28 (a) | 500,000 | 516,465 |
Security
Rate, Maturity Date | Face
Amount ($) | Value ($) |
| 2.95%, 04/01/30 (a) | 700,000 | 743,904 |
| 3.25%, 05/15/30 (a) | 200,000 | 217,962 |
| 2.88%, 03/25/31 (a) | 450,000 | 474,183 |
| 4.30%, 07/08/34 (a) | 300,000 | 349,326 |
| 3.90%, 05/15/35 (a) | 250,000 | 281,235 |
| 3.85%, 07/15/36 (a) | 150,000 | 166,679 |
| 3.80%, 11/15/37 (a) | 400,000 | 439,064 |
| 6.50%, 04/15/38 | 200,000 | 284,914 |
| 6.13%, 07/08/39 | 250,000 | 345,672 |
| 3.60%, 04/01/40 (a) | 800,000 | 852,008 |
| 5.38%, 07/15/40 | 600,000 | 778,830 |
| 3.65%, 03/25/41 (a) | 500,000 | 534,560 |
| 4.50%, 07/08/44 (a) | 230,000 | 272,594 |
| 4.13%, 05/15/45 (a) | 450,000 | 505,584 |
| 4.00%, 07/15/46 (a) | 470,000 | 518,730 |
| 4.00%, 11/15/47 (a) | 500,000 | 550,975 |
| 3.60%, 04/01/50 (a) | 850,000 | 888,641 |
| 3.95%, 03/25/51 (a) | 700,000 | 776,251 |
| 4.38%, 05/15/55 (a) | 350,000 | 411,418 |
| 3.85%, 04/01/60 (a) | 650,000 | 699,959 |
| 4.10%, 03/25/61 (a) | 300,000 | 338,610 |
| PayPal Holdings, Inc. |
| 2.20%, 09/26/22 | 150,000 | 153,140 |
| 1.35%, 06/01/23 | 200,000 | 203,582 |
| 2.40%, 10/01/24 (a) | 250,000 | 263,537 |
| 1.65%, 06/01/25 (a) | 250,000 | 257,500 |
| 2.65%, 10/01/26 (a) | 250,000 | 268,797 |
| 2.85%, 10/01/29 (a) | 300,000 | 323,919 |
| 2.30%, 06/01/30 (a) | 200,000 | 208,148 |
| 3.25%, 06/01/50 (a) | 250,000 | 276,177 |
| Qorvo, Inc. |
| 4.38%, 10/15/29 (a) | 200,000 | 221,876 |
| QUALCOMM, Inc. |
| 2.60%, 01/30/23 (a) | 150,000 | 154,760 |
| 2.90%, 05/20/24 (a) | 150,000 | 159,239 |
| 3.45%, 05/20/25 (a) | 350,000 | 381,188 |
| 3.25%, 05/20/27 (a) | 350,000 | 387,712 |
| 1.30%, 05/20/28 (a) | 367,000 | 362,636 |
| 2.15%, 05/20/30 (a) | 200,000 | 204,902 |
| 1.65%, 05/20/32 (a) | 283,000 | 273,686 |
| 4.65%, 05/20/35 (a) | 300,000 | 381,603 |
| 4.80%, 05/20/45 (a) | 350,000 | 470,095 |
| 4.30%, 05/20/47 (a) | 200,000 | 254,718 |
| 3.25%, 05/20/50 (a) | 225,000 | 248,027 |
| RELX Capital, Inc. |
| 3.50%, 03/16/23 (a) | 100,000 | 104,442 |
| 4.00%, 03/18/29 (a) | 150,000 | 169,697 |
| 3.00%, 05/22/30 (a) | 250,000 | 268,480 |
| S&P Global, Inc. |
| 4.00%, 06/15/25 (a) | 200,000 | 221,840 |
| 2.50%, 12/01/29 (a) | 100,000 | 106,013 |
| 1.25%, 08/15/30 (a) | 250,000 | 238,480 |
| 3.25%, 12/01/49 (a) | 100,000 | 109,476 |
| 2.30%, 08/15/60 (a) | 250,000 | 220,485 |
| salesforce.com, Inc. |
| 3.25%, 04/11/23 (a) | 250,000 | 261,400 |
| 0.63%, 07/15/24 (a) | 200,000 | 200,450 |
| 3.70%, 04/11/28 (a) | 300,000 | 341,403 |
| 1.95%, 07/15/31 (a) | 450,000 | 456,741 |
| 2.70%, 07/15/41 (a) | 350,000 | 357,399 |
| 2.90%, 07/15/51 (a) | 500,000 | 514,290 |
| 3.05%, 07/15/61 (a) | 150,000 | 156,579 |
| ServiceNow, Inc. |
| 1.40%, 09/01/30 (a) | 300,000 | 285,408 |
Schwab Taxable Bond Funds | Annual Report
Schwab U.S. Aggregate Bond Index Fund
Portfolio Holdings as of August 31, 2021 (continued)
Security
Rate, Maturity Date | Face
Amount ($) | Value ($) |
| Skyworks Solutions, Inc. |
| 1.80%, 06/01/26 (a) | 200,000 | 203,430 |
| 3.00%, 06/01/31 (a) | 200,000 | 208,338 |
| SYNNEX Corp. |
| 1.75%, 08/09/26 (a)(c) | 250,000 | 249,043 |
| 2.38%, 08/09/28 (a)(c) | 200,000 | 199,849 |
| Teledyne FLIR LLC |
| 2.50%, 08/01/30 (a) | 250,000 | 256,340 |
| Tencent Music Entertainment Group |
| 1.38%, 09/03/25 (a) | 200,000 | 197,660 |
| Texas Instruments, Inc. |
| 1.38%, 03/12/25 (a) | 250,000 | 255,120 |
| 2.90%, 11/03/27 (a) | 75,000 | 82,139 |
| 2.25%, 09/04/29 (a) | 100,000 | 104,614 |
| 1.75%, 05/04/30 (a) | 200,000 | 200,264 |
| 3.88%, 03/15/39 (a) | 150,000 | 181,764 |
| 4.15%, 05/15/48 (a) | 350,000 | 444,122 |
| The Western Union Co. |
| 4.25%, 06/09/23 (a) | 100,000 | 106,036 |
| 2.85%, 01/10/25 (a) | 100,000 | 105,469 |
| 1.35%, 03/15/26 (a) | 200,000 | 198,888 |
| 6.20%, 11/17/36 | 100,000 | 125,765 |
| Thomson Reuters Corp. |
| 4.30%, 11/23/23 (a) | 150,000 | 161,046 |
| 3.35%, 05/15/26 (a) | 150,000 | 163,769 |
| 5.65%, 11/23/43 (a) | 150,000 | 208,733 |
| Trimble, Inc. |
| 4.15%, 06/15/23 (a) | 150,000 | 158,586 |
| 4.75%, 12/01/24 (a) | 200,000 | 222,048 |
| 4.90%, 06/15/28 (a) | 100,000 | 116,773 |
| Tyco Electronics Group S.A. |
| 3.45%, 08/01/24 (a) | 100,000 | 106,936 |
| 3.70%, 02/15/26 (a) | 100,000 | 110,062 |
| 3.13%, 08/15/27 (a) | 100,000 | 109,696 |
| VeriSign, Inc. |
| 4.75%, 07/15/27 (a) | 150,000 | 159,245 |
| 2.70%, 06/15/31 (a) | 250,000 | 257,845 |
| Verisk Analytics, Inc. |
| 4.00%, 06/15/25 (a) | 150,000 | 165,672 |
| 4.13%, 03/15/29 (a) | 150,000 | 171,882 |
| 5.50%, 06/15/45 (a) | 50,000 | 68,469 |
| 3.63%, 05/15/50 (a) | 100,000 | 109,302 |
| Visa, Inc. |
| 2.15%, 09/15/22 (a) | 200,000 | 203,706 |
| 2.80%, 12/14/22 (a) | 400,000 | 411,668 |
| 3.15%, 12/14/25 (a) | 800,000 | 874,472 |
| 1.90%, 04/15/27 (a) | 300,000 | 312,054 |
| 0.75%, 08/15/27 (a) | 250,000 | 245,963 |
| 2.05%, 04/15/30 (a) | 300,000 | 309,633 |
| 1.10%, 02/15/31 (a) | 350,000 | 333,329 |
| 4.15%, 12/14/35 (a) | 330,000 | 406,025 |
| 2.70%, 04/15/40 (a) | 250,000 | 260,285 |
| 4.30%, 12/14/45 (a) | 745,000 | 954,986 |
| 3.65%, 09/15/47 (a) | 200,000 | 236,182 |
| 2.00%, 08/15/50 (a) | 250,000 | 223,078 |
| VMware, Inc. |
| 0.60%, 08/15/23 | 200,000 | 200,202 |
| 1.00%, 08/15/24 (a) | 250,000 | 251,100 |
| 4.50%, 05/15/25 (a) | 150,000 | 167,618 |
| 1.40%, 08/15/26 (a) | 300,000 | 299,751 |
| 4.65%, 05/15/27 (a) | 150,000 | 173,541 |
| 3.90%, 08/21/27 (a) | 200,000 | 224,248 |
| 1.80%, 08/15/28 (a) | 200,000 | 198,330 |
| 4.70%, 05/15/30 (a) | 150,000 | 179,373 |
| 2.20%, 08/15/31 (a) | 350,000 | 347,693 |
Security
Rate, Maturity Date | Face
Amount ($) | Value ($) |
| Xilinx, Inc. |
| 2.95%, 06/01/24 (a) | 100,000 | 105,658 |
| 2.38%, 06/01/30 (a) | 200,000 | 205,894 |
| | | 147,354,951 |
| Transportation 0.6% |
| American Airlines 2015-2 Class AA Pass-Through Trust |
| 3.60%, 09/22/27 | 152,634 | 158,136 |
| American Airlines 2016-1 Class AA Pass-Through Trust |
| 3.58%, 01/15/28 | 152,374 | 157,875 |
| American Airlines 2016-2 Class AA Pass-Through Trust |
| 3.20%, 06/15/28 | 153,465 | 155,641 |
| American Airlines 2017-1 Class AA Pass-Through Trust |
| 3.65%, 02/15/29 | 117,188 | 121,709 |
| American Airlines 2019-1 Class AA Pass-Through Trust |
| 3.15%, 02/15/32 | 110,246 | 112,912 |
| Burlington Northern Santa Fe LLC |
| 3.00%, 03/15/23 (a) | 150,000 | 155,255 |
| 3.85%, 09/01/23 (a) | 150,000 | 159,269 |
| 3.75%, 04/01/24 (a) | 200,000 | 215,084 |
| 3.40%, 09/01/24 (a) | 200,000 | 215,536 |
| 3.65%, 09/01/25 (a) | 200,000 | 220,536 |
| 3.25%, 06/15/27 (a) | 200,000 | 222,108 |
| 6.20%, 08/15/36 | 150,000 | 216,957 |
| 5.75%, 05/01/40 (a) | 100,000 | 142,292 |
| 5.05%, 03/01/41 (a) | 100,000 | 133,468 |
| 5.40%, 06/01/41 (a) | 100,000 | 138,888 |
| 4.95%, 09/15/41 (a) | 200,000 | 264,590 |
| 4.38%, 09/01/42 (a) | 250,000 | 312,042 |
| 5.15%, 09/01/43 (a) | 100,000 | 137,637 |
| 4.90%, 04/01/44 (a) | 100,000 | 134,355 |
| 4.55%, 09/01/44 (a) | 90,000 | 115,356 |
| 4.15%, 04/01/45 (a) | 250,000 | 306,035 |
| 4.70%, 09/01/45 (a) | 100,000 | 131,476 |
| 3.90%, 08/01/46 (a) | 250,000 | 297,387 |
| 4.05%, 06/15/48 (a) | 400,000 | 489,120 |
| 4.15%, 12/15/48 (a) | 500,000 | 622,405 |
| 3.55%, 02/15/50 (a) | 100,000 | 114,239 |
| 3.05%, 02/15/51 (a) | 100,000 | 105,242 |
| 3.30%, 09/15/51 (a) | 200,000 | 219,936 |
| Canadian National Railway Co. |
| 2.75%, 03/01/26 (a) | 300,000 | 321,414 |
| 6.90%, 07/15/28 | 150,000 | 200,373 |
| 3.20%, 08/02/46 (a) | 150,000 | 158,883 |
| 3.65%, 02/03/48 (a) | 100,000 | 114,236 |
| 4.45%, 01/20/49 (a) | 150,000 | 192,915 |
| 2.45%, 05/01/50 (a) | 200,000 | 185,226 |
| Canadian Pacific Railway Co. |
| 2.90%, 02/01/25 (a) | 200,000 | 212,192 |
| 4.00%, 06/01/28 (a) | 150,000 | 170,785 |
| 2.05%, 03/05/30 (a) | 100,000 | 100,145 |
| 4.80%, 09/15/35 (a) | 150,000 | 186,037 |
| 5.95%, 05/15/37 | 200,000 | 278,482 |
| 4.80%, 08/01/45 (a) | 100,000 | 129,271 |
| 6.13%, 09/15/15 (a) | 100,000 | 157,447 |
| CSX Corp. |
| 3.40%, 08/01/24 (a) | 150,000 | 161,336 |
| 3.35%, 11/01/25 (a) | 100,000 | 109,028 |
| 2.60%, 11/01/26 (a) | 100,000 | 106,679 |
| 3.25%, 06/01/27 (a) | 150,000 | 164,549 |
| 3.80%, 03/01/28 (a) | 200,000 | 225,474 |
| 4.25%, 03/15/29 (a) | 150,000 | 174,595 |
| 2.40%, 02/15/30 (a) | 150,000 | 155,258 |
| 6.22%, 04/30/40 | 500,000 | 736,510 |
| 4.75%, 05/30/42 (a) | 250,000 | 319,785 |
Schwab Taxable Bond Funds | Annual Report
Schwab U.S. Aggregate Bond Index Fund
Portfolio Holdings as of August 31, 2021 (continued)
Security
Rate, Maturity Date | Face
Amount ($) | Value ($) |
| 4.10%, 03/15/44 (a) | 200,000 | 236,800 |
| 3.80%, 11/01/46 (a) | 100,000 | 115,075 |
| 4.30%, 03/01/48 (a) | 200,000 | 247,018 |
| 4.75%, 11/15/48 (a) | 100,000 | 131,683 |
| 4.50%, 03/15/49 (a) | 150,000 | 190,614 |
| 3.35%, 09/15/49 (a) | 100,000 | 108,129 |
| 3.80%, 04/15/50 (a) | 100,000 | 116,086 |
| 3.95%, 05/01/50 (a) | 200,000 | 238,334 |
| 2.50%, 05/15/51 (a) | 250,000 | 231,512 |
| 4.50%, 08/01/54 (a) | 100,000 | 128,904 |
| 4.65%, 03/01/68 (a) | 50,000 | 66,493 |
| Delta Air Lines 2019-1 Class AA Pass-Through Trust |
| 3.20%, 04/25/24 | 200,000 | 211,814 |
| Delta Air Lines 2020-1 Class AA Pass-Through Trust |
| 2.00%, 06/10/28 | 94,021 | 94,158 |
| FedEx Corp. |
| 3.25%, 04/01/26 (a) | 250,000 | 273,210 |
| 3.40%, 02/15/28 (a) | 150,000 | 166,695 |
| 3.10%, 08/05/29 (a) | 200,000 | 216,836 |
| 4.90%, 01/15/34 | 150,000 | 188,469 |
| 1.88%, 02/20/34 | 236,632 | 237,725 |
| 3.90%, 02/01/35 | 200,000 | 230,696 |
| 3.88%, 08/01/42 | 150,000 | 170,085 |
| 4.10%, 04/15/43 | 100,000 | 115,748 |
| 5.10%, 01/15/44 | 75,000 | 98,336 |
| 4.10%, 02/01/45 | 400,000 | 465,648 |
| 4.75%, 11/15/45 (a) | 300,000 | 378,825 |
| 4.55%, 04/01/46 (a) | 300,000 | 369,201 |
| 4.40%, 01/15/47 (a) | 100,000 | 121,112 |
| 4.05%, 02/15/48 (a) | 250,000 | 291,665 |
| 4.95%, 10/17/48 (a) | 150,000 | 197,653 |
| 5.25%, 05/15/50 (a) | 300,000 | 414,687 |
| GXO Logistics, Inc. |
| 1.65%, 07/15/26 (a)(c) | 150,000 | 150,243 |
| JB Hunt Transport Services, Inc. |
| 3.88%, 03/01/26 (a) | 150,000 | 167,336 |
| JetBlue 2019-1 Class AA Pass-Through Trust |
| 2.75%, 05/15/32 | 93,904 | 94,756 |
| JetBlue 2020-1 Class A Pass Through Trust |
| 4.00%, 11/15/32 | 241,820 | 265,495 |
| Kansas City Southern |
| 2.88%, 11/15/29 (a) | 150,000 | 158,946 |
| 4.95%, 08/15/45 (a) | 100,000 | 128,759 |
| 4.70%, 05/01/48 (a) | 150,000 | 187,629 |
| 3.50%, 05/01/50 (a) | 100,000 | 107,580 |
| 4.20%, 11/15/69 (a) | 100,000 | 117,327 |
| Kirby Corp. |
| 4.20%, 03/01/28 (a) | 100,000 | 111,717 |
| Norfolk Southern Corp. |
| 2.90%, 02/15/23 (a) | 150,000 | 154,551 |
| 3.65%, 08/01/25 (a) | 100,000 | 109,682 |
| 2.90%, 06/15/26 (a) | 200,000 | 216,260 |
| 3.15%, 06/01/27 (a) | 200,000 | 218,138 |
| 3.80%, 08/01/28 (a) | 150,000 | 170,229 |
| 2.55%, 11/01/29 (a) | 100,000 | 105,140 |
| 3.95%, 10/01/42 (a) | 330,000 | 388,143 |
| 4.45%, 06/15/45 (a) | 150,000 | 187,149 |
| 4.65%, 01/15/46 (a) | 150,000 | 191,148 |
| 3.94%, 11/01/47 (a) | 200,000 | 233,552 |
| 4.15%, 02/28/48 (a) | 100,000 | 120,162 |
| 4.10%, 05/15/49 (a) | 100,000 | 120,573 |
| 3.40%, 11/01/49 (a) | 100,000 | 107,997 |
| 3.05%, 05/15/50 (a) | 200,000 | 204,618 |
| 4.05%, 08/15/52 (a) | 150,000 | 179,778 |
| 3.16%, 05/15/55 (a) | 150,000 | 155,090 |
| 4.10%, 05/15/21 (a) | 100,000 | 115,470 |
Security
Rate, Maturity Date | Face
Amount ($) | Value ($) |
| Ryder System, Inc. |
| 3.75%, 06/09/23 (a) | 150,000 | 158,253 |
| 3.88%, 12/01/23 (a) | 150,000 | 160,626 |
| 3.65%, 03/18/24 (a) | 100,000 | 107,184 |
| 4.63%, 06/01/25 (a) | 150,000 | 168,630 |
| 3.35%, 09/01/25 (a) | 150,000 | 162,183 |
| 2.90%, 12/01/26 (a) | 100,000 | 107,373 |
| Southwest Airlines Co. |
| 4.75%, 05/04/23 | 225,000 | 240,383 |
| 5.25%, 05/04/25 (a) | 320,000 | 362,890 |
| 3.00%, 11/15/26 (a) | 145,000 | 155,234 |
| 5.13%, 06/15/27 (a) | 400,000 | 468,380 |
| 3.45%, 11/16/27 (a) | 100,000 | 108,566 |
| 2.63%, 02/10/30 (a) | 150,000 | 153,348 |
| Union Pacific Corp. |
| 3.65%, 02/15/24 (a) | 500,000 | 534,065 |
| 3.15%, 03/01/24 (a) | 200,000 | 212,546 |
| 3.25%, 01/15/25 (a) | 100,000 | 107,552 |
| 3.75%, 07/15/25 (a) | 150,000 | 165,725 |
| 2.75%, 03/01/26 (a) | 150,000 | 160,724 |
| 3.00%, 04/15/27 (a) | 200,000 | 217,084 |
| 3.95%, 09/10/28 (a) | 250,000 | 286,267 |
| 3.70%, 03/01/29 (a) | 150,000 | 169,474 |
| 2.40%, 02/05/30 (a) | 200,000 | 207,772 |
| 2.38%, 05/20/31 (a) | 200,000 | 207,062 |
| 3.60%, 09/15/37 (a) | 350,000 | 396,802 |
| 3.55%, 08/15/39 (a) | 100,000 | 113,054 |
| 3.20%, 05/20/41 (a) | 200,000 | 213,726 |
| 4.05%, 11/15/45 (a) | 150,000 | 177,312 |
| 4.05%, 03/01/46 (a) | 150,000 | 177,303 |
| 4.30%, 03/01/49 (a) | 100,000 | 124,568 |
| 3.25%, 02/05/50 (a) | 450,000 | 480,582 |
| 3.80%, 10/01/51 (a) | 150,000 | 175,096 |
| 3.88%, 02/01/55 (a) | 50,000 | 57,847 |
| 3.95%, 08/15/59 (a) | 100,000 | 118,738 |
| 3.84%, 03/20/60 (a) | 450,000 | 523,692 |
| 2.97%, 09/16/62 (a) | 150,000 | 148,329 |
| 4.10%, 09/15/67 (a) | 100,000 | 121,021 |
| 3.75%, 02/05/70 (a) | 200,000 | 228,378 |
| 3.80%, 04/06/71 (a)(c) | 450,000 | 517,878 |
| United Airlines 2012-1 Class A Pass Through Trust |
| 4.15%, 04/11/24 | 90,938 | 96,013 |
| United Airlines 2014-1 Class A Pass-Through Trust |
| 4.00%, 04/11/26 | 267,818 | 283,504 |
| United Airlines 2014-2 Class A Pass-Through Trust |
| 3.75%, 09/03/26 | 103,567 | 109,584 |
| United Airlines 2016-1 Class AA Pass-Through Trust |
| 3.10%, 07/07/28 | 118,340 | 124,025 |
| United Airlines 2016-2 Class AA Pass-Through Trust |
| 2.88%, 10/07/28 | 81,498 | 83,255 |
| United Airlines 2018-1 Class AA Pass-Through Trust |
| 3.50%, 03/01/30 | 132,519 | 139,632 |
| United Airlines 2019-1 Class AA Pass-Through Trust |
| 4.15%, 08/25/31 | 81,946 | 89,497 |
| United Airlines 2019-2 Class AA Pass-Through Trust |
| 2.70%, 05/01/32 | 96,111 | 96,491 |
| United Airlines 2020-1 Class A Pass-Through Trust |
| 5.88%, 10/15/27 | 556,485 | 619,206 |
| United Airlines 2020-1 Class B Pass Through Trust |
| 4.88%, 01/15/26 | 140,137 | 147,797 |
| United Parcel Service, Inc. |
| 2.45%, 10/01/22 | 350,000 | 358,372 |
| 2.50%, 04/01/23 (a) | 250,000 | 258,320 |
| 2.20%, 09/01/24 (a) | 100,000 | 104,672 |
| 3.90%, 04/01/25 (a) | 150,000 | 165,560 |
Schwab Taxable Bond Funds | Annual Report
Schwab U.S. Aggregate Bond Index Fund
Portfolio Holdings as of August 31, 2021 (continued)
Security
Rate, Maturity Date | Face
Amount ($) | Value ($) |
| 3.05%, 11/15/27 (a) | 250,000 | 277,612 |
| 3.40%, 03/15/29 (a) | 100,000 | 112,425 |
| 4.45%, 04/01/30 (a) | 250,000 | 302,350 |
| 6.20%, 01/15/38 | 295,000 | 439,408 |
| 5.20%, 04/01/40 (a) | 100,000 | 136,800 |
| 4.88%, 11/15/40 (a) | 250,000 | 333,730 |
| 3.40%, 11/15/46 (a) | 100,000 | 113,855 |
| 3.75%, 11/15/47 (a) | 350,000 | 419,979 |
| 4.25%, 03/15/49 (a) | 100,000 | 128,873 |
| 3.40%, 09/01/49 (a) | 100,000 | 114,083 |
| 5.30%, 04/01/50 (a) | 300,000 | 445,644 |
| | | 34,553,119 |
| | | 877,932,282 |
| |
| Utility 2.2% |
| Electric 1.9% |
| AEP Texas, Inc. |
| 3.95%, 06/01/28 (a) | 250,000 | 282,315 |
| 2.10%, 07/01/30 (a) | 175,000 | 173,779 |
| 4.15%, 05/01/49 (a) | 100,000 | 118,848 |
| AEP Transmission Co. LLC |
| 3.75%, 12/01/47 (a) | 150,000 | 173,678 |
| 3.80%, 06/15/49 (a) | 100,000 | 117,494 |
| 3.65%, 04/01/50 (a) | 200,000 | 231,812 |
| Alabama Power Co. |
| 1.45%, 09/15/30 (a) | 250,000 | 242,247 |
| 6.00%, 03/01/39 | 100,000 | 143,011 |
| 3.85%, 12/01/42 | 150,000 | 176,177 |
| 4.15%, 08/15/44 (a) | 150,000 | 182,322 |
| 3.70%, 12/01/47 (a) | 250,000 | 286,722 |
| 4.30%, 07/15/48 (a) | 150,000 | 189,892 |
| 3.45%, 10/01/49 (a) | 100,000 | 110,773 |
| 3.13%, 07/15/51 (a) | 100,000 | 105,894 |
| Ameren Corp. |
| 2.50%, 09/15/24 (a) | 100,000 | 104,832 |
| 3.50%, 01/15/31 (a) | 200,000 | 221,494 |
| Ameren Illinois Co. |
| 2.70%, 09/01/22 (a) | 263,000 | 267,813 |
| 4.15%, 03/15/46 (a) | 150,000 | 185,047 |
| 3.70%, 12/01/47 (a) | 350,000 | 410,182 |
| 4.50%, 03/15/49 (a) | 100,000 | 131,563 |
| 2.90%, 06/15/51 (a) | 100,000 | 103,669 |
| American Electric Power Co., Inc. |
| 3.20%, 11/13/27 (a) | 150,000 | 163,497 |
| 4.30%, 12/01/28 (a) | 100,000 | 115,524 |
| 2.30%, 03/01/30 (a) | 150,000 | 151,463 |
| 3.25%, 03/01/50 (a) | 150,000 | 153,404 |
| Appalachian Power Co. |
| 3.30%, 06/01/27 (a) | 100,000 | 108,982 |
| 2.70%, 04/01/31 (a) | 150,000 | 156,599 |
| 7.00%, 04/01/38 | 100,000 | 150,897 |
| 4.50%, 03/01/49 (a) | 100,000 | 125,429 |
| 3.70%, 05/01/50 (a) | 200,000 | 224,026 |
| Arizona Public Service Co. |
| 2.60%, 08/15/29 (a) | 100,000 | 105,498 |
| 4.50%, 04/01/42 (a) | 300,000 | 370,524 |
| 4.25%, 03/01/49 (a) | 100,000 | 122,991 |
| 3.35%, 05/15/50 (a) | 250,000 | 268,020 |
| 2.65%, 09/15/50 (a) | 150,000 | 142,211 |
| Atlantic City Electric Co. |
| 4.00%, 10/15/28 (a) | 100,000 | 114,816 |
Security
Rate, Maturity Date | Face
Amount ($) | Value ($) |
| Avangrid, Inc. |
| 3.15%, 12/01/24 (a) | 350,000 | 373,866 |
| 3.20%, 04/15/25 (a) | 150,000 | 160,707 |
| 3.80%, 06/01/29 (a) | 100,000 | 112,995 |
| Avista Corp. |
| 4.35%, 06/01/48 (a) | 100,000 | 128,319 |
| Baltimore Gas & Electric Co. |
| 3.35%, 07/01/23 (a) | 100,000 | 104,714 |
| 6.35%, 10/01/36 | 100,000 | 145,862 |
| 3.50%, 08/15/46 (a) | 150,000 | 167,588 |
| 3.75%, 08/15/47 (a) | 150,000 | 175,841 |
| Berkshire Hathaway Energy Co. |
| 2.80%, 01/15/23 (a) | 600,000 | 618,846 |
| 3.75%, 11/15/23 (a) | 200,000 | 213,438 |
| 4.05%, 04/15/25 (a) | 400,000 | 442,572 |
| 3.25%, 04/15/28 (a) | 350,000 | 385,987 |
| 3.70%, 07/15/30 (a) | 350,000 | 399,087 |
| 6.13%, 04/01/36 | 298,000 | 420,609 |
| 5.15%, 11/15/43 (a) | 100,000 | 132,887 |
| 4.50%, 02/01/45 (a) | 250,000 | 308,182 |
| 3.80%, 07/15/48 (a) | 150,000 | 171,662 |
| 4.45%, 01/15/49 (a) | 300,000 | 379,299 |
| 4.25%, 10/15/50 (a) | 100,000 | 123,634 |
| 2.85%, 05/15/51 (a) | 250,000 | 244,242 |
| Black Hills Corp. |
| 3.15%, 01/15/27 (a) | 350,000 | 375,424 |
| 2.50%, 06/15/30 (a) | 250,000 | 257,640 |
| 4.35%, 05/01/33 (a) | 150,000 | 176,903 |
| 3.88%, 10/15/49 (a) | 100,000 | 111,465 |
| CenterPoint Energy Houston Electric LLC |
| 2.40%, 09/01/26 (a) | 257,000 | 273,065 |
| 3.00%, 02/01/27 (a) | 150,000 | 163,199 |
| 4.50%, 04/01/44 (a) | 250,000 | 325,220 |
| 4.25%, 02/01/49 (a) | 100,000 | 128,590 |
| 2.90%, 07/01/50 (a) | 200,000 | 207,338 |
| 3.35%, 04/01/51 (a) | 150,000 | 168,297 |
| CenterPoint Energy, Inc. |
| 2.50%, 09/01/24 (a) | 250,000 | 261,857 |
| 4.25%, 11/01/28 (a) | 150,000 | 172,794 |
| 2.95%, 03/01/30 (a) | 100,000 | 106,111 |
| 3.70%, 09/01/49 (a) | 100,000 | 110,734 |
| Cleco Corporate Holdings LLC |
| 3.74%, 05/01/26 (a) | 150,000 | 163,925 |
| CMS Energy Corp. |
| 3.45%, 08/15/27 (a) | 100,000 | 110,834 |
| 4.88%, 03/01/44 (a) | 100,000 | 131,565 |
| 4.75%, 06/01/50 (a)(b) | 100,000 | 112,894 |
| Commonwealth Edison Co. |
| 2.55%, 06/15/26 (a) | 200,000 | 213,100 |
| 2.95%, 08/15/27 (a) | 150,000 | 162,737 |
| 2.20%, 03/01/30 (a) | 100,000 | 102,994 |
| 3.80%, 10/01/42 (a) | 350,000 | 409,304 |
| 4.60%, 08/15/43 (a) | 100,000 | 129,058 |
| 3.70%, 03/01/45 (a) | 200,000 | 230,758 |
| 4.35%, 11/15/45 (a) | 100,000 | 125,761 |
| 3.65%, 06/15/46 (a) | 100,000 | 114,694 |
| 3.75%, 08/15/47 (a) | 250,000 | 293,332 |
| 4.00%, 03/01/48 (a) | 150,000 | 180,665 |
| 4.00%, 03/01/49 (a) | 150,000 | 182,585 |
| 3.20%, 11/15/49 (a) | 100,000 | 108,322 |
| 3.00%, 03/01/50 (a) | 150,000 | 155,939 |
| 3.13%, 03/15/51 (a) | 200,000 | 212,244 |
| Consolidated Edison Co. of New York, Inc. |
| 4.00%, 12/01/28 (a) | 50,000 | 57,541 |
| 3.35%, 04/01/30 (a) | 200,000 | 222,026 |
| 5.30%, 03/01/35 | 230,000 | 293,374 |
Schwab Taxable Bond Funds | Annual Report
Schwab U.S. Aggregate Bond Index Fund
Portfolio Holdings as of August 31, 2021 (continued)
Security
Rate, Maturity Date | Face
Amount ($) | Value ($) |
| 5.85%, 03/15/36 | 150,000 | 205,708 |
| 5.50%, 12/01/39 | 200,000 | 269,448 |
| 4.20%, 03/15/42 | 450,000 | 528,763 |
| 4.45%, 03/15/44 (a) | 230,000 | 280,869 |
| 4.50%, 12/01/45 (a) | 150,000 | 184,442 |
| 3.85%, 06/15/46 (a) | 200,000 | 225,214 |
| 3.88%, 06/15/47 (a) | 150,000 | 171,242 |
| 4.65%, 12/01/48 (a) | 100,000 | 125,904 |
| 4.13%, 05/15/49 (a) | 100,000 | 118,656 |
| 3.95%, 04/01/50 (a) | 250,000 | 291,752 |
| 4.63%, 12/01/54 (a) | 100,000 | 128,308 |
| 4.00%, 11/15/57 (a) | 100,000 | 116,180 |
| 4.50%, 05/15/58 (a) | 100,000 | 124,273 |
| 3.70%, 11/15/59 (a) | 100,000 | 109,545 |
| 3.00%, 12/01/60 (a) | 200,000 | 191,572 |
| 3.60%, 06/15/61 (a) | 200,000 | 216,382 |
| Consolidated Edison, Inc. |
| 0.65%, 12/01/23 (a) | 250,000 | 250,037 |
| Consumers Energy Co. |
| 3.38%, 08/15/23 (a) | 330,000 | 346,827 |
| 3.95%, 05/15/43 (a) | 330,000 | 396,370 |
| 4.05%, 05/15/48 (a) | 100,000 | 123,550 |
| 4.35%, 04/15/49 (a) | 100,000 | 128,953 |
| 3.50%, 08/01/51 (a) | 200,000 | 230,584 |
| 2.50%, 05/01/60 (a) | 200,000 | 184,200 |
| Delmarva Power & Light Co. |
| 3.50%, 11/15/23 (a) | 200,000 | 212,256 |
| Dominion Energy South Carolina, Inc. |
| 6.05%, 01/15/38 | 100,000 | 144,151 |
| 5.45%, 02/01/41 (a) | 100,000 | 139,536 |
| 5.10%, 06/01/65 (a) | 100,000 | 148,724 |
| Dominion Energy, Inc. |
| 3.07%, 08/15/24 | 150,000 | 159,195 |
| 3.90%, 10/01/25 (a) | 150,000 | 165,287 |
| 2.85%, 08/15/26 (a) | 550,000 | 588,379 |
| 4.25%, 06/01/28 (a) | 150,000 | 172,877 |
| 3.38%, 04/01/30 (a) | 350,000 | 383,729 |
| 5.25%, 08/01/33 | 180,000 | 228,897 |
| 5.95%, 06/15/35 | 100,000 | 136,844 |
| 7.00%, 06/15/38 | 100,000 | 150,822 |
| 4.90%, 08/01/41 (a) | 100,000 | 127,726 |
| 4.05%, 09/15/42 (a) | 100,000 | 115,931 |
| 4.70%, 12/01/44 (a) | 150,000 | 189,997 |
| 4.60%, 03/15/49 (a) | 100,000 | 128,817 |
| 5.75%, 10/01/54 (a)(b) | 150,000 | 164,621 |
| DTE Electric Co. |
| 2.25%, 03/01/30 (a) | 150,000 | 155,261 |
| 2.63%, 03/01/31 (a) | 300,000 | 318,897 |
| 3.70%, 03/15/45 (a) | 250,000 | 290,135 |
| 3.75%, 08/15/47 (a) | 150,000 | 176,733 |
| 4.05%, 05/15/48 (a) | 100,000 | 123,149 |
| 3.95%, 03/01/49 (a) | 150,000 | 182,838 |
| 2.95%, 03/01/50 (a) | 100,000 | 104,289 |
| DTE Energy Co. |
| 0.55%, 11/01/22 | 200,000 | 200,536 |
| 2.25%, 11/01/22 | 250,000 | 255,407 |
| 2.53%, 10/01/24 | 100,000 | 104,841 |
| 1.05%, 06/01/25 (a) | 200,000 | 199,650 |
| 2.85%, 10/01/26 (a) | 200,000 | 214,112 |
| 3.40%, 06/15/29 (a) | 100,000 | 109,939 |
| 2.95%, 03/01/30 (a) | 100,000 | 106,498 |
| Duke Energy Carolinas LLC |
| 3.05%, 03/15/23 (a) | 250,000 | 260,032 |
| 2.95%, 12/01/26 (a) | 150,000 | 162,498 |
| 3.95%, 11/15/28 (a) | 150,000 | 172,431 |
| 2.45%, 08/15/29 (a) | 150,000 | 157,172 |
Security
Rate, Maturity Date | Face
Amount ($) | Value ($) |
| 2.45%, 02/01/30 (a) | 100,000 | 104,279 |
| 6.45%, 10/15/32 | 230,000 | 319,088 |
| 6.05%, 04/15/38 | 150,000 | 214,758 |
| 5.30%, 02/15/40 | 150,000 | 205,830 |
| 4.25%, 12/15/41 (a) | 155,000 | 188,091 |
| 3.75%, 06/01/45 (a) | 150,000 | 172,790 |
| 3.88%, 03/15/46 (a) | 100,000 | 116,916 |
| 3.70%, 12/01/47 (a) | 150,000 | 171,749 |
| 3.95%, 03/15/48 (a) | 100,000 | 118,662 |
| 3.20%, 08/15/49 (a) | 150,000 | 160,076 |
| 3.45%, 04/15/51 (a) | 150,000 | 167,886 |
| Duke Energy Corp. |
| 3.05%, 08/15/22 (a) | 200,000 | 203,940 |
| 3.75%, 04/15/24 (a) | 455,000 | 488,479 |
| 0.90%, 09/15/25 (a) | 200,000 | 198,544 |
| 2.65%, 09/01/26 (a) | 450,000 | 478,746 |
| 3.15%, 08/15/27 (a) | 200,000 | 217,422 |
| 3.40%, 06/15/29 (a) | 200,000 | 219,498 |
| 2.45%, 06/01/30 (a) | 250,000 | 256,385 |
| 2.55%, 06/15/31 (a) | 200,000 | 205,906 |
| 4.80%, 12/15/45 (a) | 200,000 | 251,364 |
| 3.75%, 09/01/46 (a) | 250,000 | 271,920 |
| 3.95%, 08/15/47 (a) | 100,000 | 112,095 |
| 4.20%, 06/15/49 (a) | 100,000 | 116,733 |
| 3.50%, 06/15/51 (a) | 200,000 | 211,624 |
| Duke Energy Florida LLC |
| 3.20%, 01/15/27 (a) | 555,000 | 608,802 |
| 3.80%, 07/15/28 (a) | 150,000 | 170,054 |
| 1.75%, 06/15/30 (a) | 250,000 | 246,800 |
| 6.35%, 09/15/37 | 150,000 | 222,861 |
| 3.40%, 10/01/46 (a) | 350,000 | 385,959 |
| 4.20%, 07/15/48 (a) | 150,000 | 185,592 |
| Duke Energy Indiana LLC |
| 6.35%, 08/15/38 | 200,000 | 294,602 |
| 4.90%, 07/15/43 (a) | 100,000 | 130,302 |
| 3.25%, 10/01/49 (a) | 150,000 | 159,893 |
| 2.75%, 04/01/50 (a) | 100,000 | 98,104 |
| Duke Energy Ohio, Inc. |
| 2.13%, 06/01/30 (a) | 150,000 | 151,821 |
| 4.30%, 02/01/49 (a) | 150,000 | 189,582 |
| Duke Energy Progress LLC |
| 3.70%, 09/01/28 (a) | 200,000 | 226,878 |
| 4.10%, 05/15/42 (a) | 100,000 | 119,355 |
| 4.10%, 03/15/43 (a) | 150,000 | 182,664 |
| 4.15%, 12/01/44 (a) | 278,000 | 337,595 |
| 4.20%, 08/15/45 (a) | 200,000 | 244,320 |
| 3.70%, 10/15/46 (a) | 250,000 | 286,142 |
| 2.50%, 08/15/50 (a) | 250,000 | 234,955 |
| Edison International |
| 2.40%, 09/15/22 (a) | 100,000 | 101,620 |
| 3.55%, 11/15/24 (a) | 100,000 | 106,343 |
| 4.95%, 04/15/25 (a) | 350,000 | 387,362 |
| 5.75%, 06/15/27 (a) | 100,000 | 114,472 |
| 4.13%, 03/15/28 (a) | 100,000 | 107,176 |
| El Paso Electric Co. |
| 6.00%, 05/15/35 | 44,000 | 59,735 |
| Emera US Finance LP |
| 3.55%, 06/15/26 (a) | 150,000 | 163,907 |
| 4.75%, 06/15/46 (a) | 250,000 | 298,240 |
| Enel Americas S.A. |
| 4.00%, 10/25/26 (a) | 100,000 | 109,780 |
| Enel Chile S.A. |
| 4.88%, 06/12/28 (a) | 100,000 | 115,662 |
| Enel Generacion Chile S.A. |
| 4.25%, 04/15/24 (a) | 100,000 | 107,585 |
Schwab Taxable Bond Funds | Annual Report
Schwab U.S. Aggregate Bond Index Fund
Portfolio Holdings as of August 31, 2021 (continued)
Security
Rate, Maturity Date | Face
Amount ($) | Value ($) |
| Entergy Arkansas LLC |
| 3.70%, 06/01/24 (a) | 200,000 | 215,264 |
| 4.20%, 04/01/49 (a) | 150,000 | 186,900 |
| 2.65%, 06/15/51 (a) | 250,000 | 241,257 |
| Entergy Corp. |
| 0.90%, 09/15/25 (a) | 250,000 | 247,190 |
| 2.95%, 09/01/26 (a) | 300,000 | 322,191 |
| 2.80%, 06/15/30 (a) | 250,000 | 261,912 |
| 2.40%, 06/15/31 (a) | 150,000 | 151,301 |
| 3.75%, 06/15/50 (a) | 150,000 | 165,347 |
| Entergy Louisiana LLC |
| 4.05%, 09/01/23 (a) | 100,000 | 106,237 |
| 0.62%, 11/17/23 (a) | 200,000 | 200,112 |
| 2.40%, 10/01/26 (a) | 400,000 | 421,480 |
| 3.25%, 04/01/28 (a) | 250,000 | 273,860 |
| 4.00%, 03/15/33 (a) | 100,000 | 117,428 |
| 4.20%, 09/01/48 (a) | 100,000 | 123,056 |
| 4.20%, 04/01/50 (a) | 150,000 | 187,317 |
| 2.90%, 03/15/51 (a) | 200,000 | 200,668 |
| Entergy Mississippi LLC |
| 3.85%, 06/01/49 (a) | 100,000 | 117,476 |
| Entergy Texas, Inc. |
| 1.75%, 03/15/31 (a) | 250,000 | 241,255 |
| 4.50%, 03/30/39 (a) | 250,000 | 302,315 |
| 3.55%, 09/30/49 (a) | 100,000 | 109,591 |
| Evergy Kansas Central, Inc. |
| 3.10%, 04/01/27 (a) | 200,000 | 217,660 |
| 4.13%, 03/01/42 (a) | 100,000 | 120,387 |
| 4.25%, 12/01/45 (a) | 100,000 | 123,754 |
| 3.45%, 04/15/50 (a) | 150,000 | 166,631 |
| Evergy Metro, Inc. |
| 4.20%, 03/15/48 (a) | 300,000 | 372,897 |
| Evergy, Inc. |
| 2.45%, 09/15/24 (a) | 200,000 | 209,100 |
| 2.90%, 09/15/29 (a) | 250,000 | 266,450 |
| Eversource Energy |
| 3.80%, 12/01/23 (a) | 150,000 | 160,350 |
| 3.15%, 01/15/25 (a) | 330,000 | 352,879 |
| 0.80%, 08/15/25 (a) | 200,000 | 198,018 |
| 3.30%, 01/15/28 (a) | 100,000 | 109,918 |
| 1.65%, 08/15/30 (a) | 250,000 | 241,770 |
| 2.55%, 03/15/31 (a) | 100,000 | 103,808 |
| 3.45%, 01/15/50 (a) | 250,000 | 271,075 |
| Exelon Corp. |
| 3.95%, 06/15/25 (a) | 250,000 | 274,620 |
| 4.05%, 04/15/30 (a) | 300,000 | 344,268 |
| 4.95%, 06/15/35 (a)(c) | 230,000 | 285,667 |
| 5.63%, 06/15/35 | 400,000 | 530,712 |
| 4.45%, 04/15/46 (a) | 200,000 | 247,312 |
| 4.70%, 04/15/50 (a) | 100,000 | 128,348 |
| Exelon Generation Co., LLC |
| 3.25%, 06/01/25 (a) | 250,000 | 268,960 |
| 6.25%, 10/01/39 | 262,000 | 326,033 |
| 5.75%, 10/01/41 (a) | 100,000 | 119,776 |
| Florida Power & Light Co. |
| 2.85%, 04/01/25 (a) | 150,000 | 160,097 |
| 5.63%, 04/01/34 | 150,000 | 205,650 |
| 5.65%, 02/01/37 | 100,000 | 139,053 |
| 5.96%, 04/01/39 | 200,000 | 295,524 |
| 5.69%, 03/01/40 | 150,000 | 216,441 |
| 5.25%, 02/01/41 (a) | 150,000 | 208,602 |
| 4.05%, 06/01/42 (a) | 250,000 | 306,462 |
| 3.70%, 12/01/47 (a) | 100,000 | 119,231 |
| 3.95%, 03/01/48 (a) | 100,000 | 122,813 |
| 4.13%, 06/01/48 (a) | 250,000 | 315,107 |
Security
Rate, Maturity Date | Face
Amount ($) | Value ($) |
| 3.99%, 03/01/49 (a) | 250,000 | 310,300 |
| 3.15%, 10/01/49 (a) | 100,000 | 109,521 |
| Fortis, Inc. |
| 3.06%, 10/04/26 (a) | 155,000 | 167,367 |
| Georgia Power Co. |
| 2.10%, 07/30/23 | 200,000 | 206,488 |
| 2.20%, 09/15/24 (a) | 200,000 | 208,402 |
| 2.65%, 09/15/29 (a) | 150,000 | 158,484 |
| 4.75%, 09/01/40 | 150,000 | 186,984 |
| 4.30%, 03/15/42 | 150,000 | 178,619 |
| 4.30%, 03/15/43 | 100,000 | 120,598 |
| 3.70%, 01/30/50 (a) | 100,000 | 110,853 |
| Gulf Power Co. |
| 3.30%, 05/30/27 (a) | 450,000 | 494,523 |
| Iberdrola International BV |
| 6.75%, 07/15/36 | 100,000 | 154,615 |
| Idaho Power Co. |
| 4.20%, 03/01/48 (a) | 200,000 | 246,958 |
| Indiana Michigan Power Co. |
| 4.55%, 03/15/46 (a) | 200,000 | 255,632 |
| 3.75%, 07/01/47 (a) | 100,000 | 114,689 |
| 4.25%, 08/15/48 (a) | 100,000 | 125,070 |
| 3.25%, 05/01/51 (a) | 150,000 | 160,577 |
| Interstate Power & Light Co. |
| 3.25%, 12/01/24 (a) | 100,000 | 107,288 |
| 2.30%, 06/01/30 (a) | 200,000 | 205,034 |
| 6.25%, 07/15/39 | 150,000 | 216,076 |
| 3.50%, 09/30/49 (a) | 100,000 | 111,378 |
| ITC Holdings Corp. |
| 2.70%, 11/15/22 (a) | 200,000 | 205,056 |
| 3.25%, 06/30/26 (a) | 100,000 | 108,987 |
| 5.30%, 07/01/43 (a) | 100,000 | 134,469 |
| Kentucky Utilities Co. |
| 5.13%, 11/01/40 (a) | 100,000 | 132,244 |
| 4.38%, 10/01/45 (a) | 100,000 | 124,483 |
| 3.30%, 06/01/50 (a) | 250,000 | 269,372 |
| Louisville Gas & Electric Co. |
| 4.25%, 04/01/49 (a) | 150,000 | 186,058 |
| McCormick & Co., Inc. |
| 2.90%, 03/01/50 (a) | 150,000 | 157,316 |
| MidAmerican Energy Co. |
| 6.75%, 12/30/31 | 100,000 | 142,440 |
| 4.80%, 09/15/43 (a) | 100,000 | 131,607 |
| 4.40%, 10/15/44 (a) | 100,000 | 125,810 |
| 4.25%, 05/01/46 (a) | 100,000 | 124,557 |
| 3.95%, 08/01/47 (a) | 150,000 | 180,140 |
| 3.65%, 08/01/48 (a) | 150,000 | 172,749 |
| 4.25%, 07/15/49 (a) | 150,000 | 189,165 |
| 3.15%, 04/15/50 (a) | 100,000 | 107,096 |
| 2.70%, 08/01/52 (a) | 200,000 | 197,420 |
| Mississippi Power Co. |
| 4.25%, 03/15/42 | 100,000 | 120,684 |
| National Rural Utilities Cooperative Finance Corp. |
| 0.35%, 02/08/24 | 100,000 | 99,472 |
| 3.25%, 11/01/25 (a) | 250,000 | 271,562 |
| 3.40%, 02/07/28 (a) | 200,000 | 221,206 |
| 3.70%, 03/15/29 (a) | 250,000 | 284,127 |
| 2.40%, 03/15/30 (a) | 150,000 | 155,403 |
| 1.35%, 03/15/31 (a) | 250,000 | 235,550 |
| 1.65%, 06/15/31 (a) | 200,000 | 193,254 |
| 4.02%, 11/01/32 (a) | 150,000 | 178,218 |
| 4.75%, 04/30/43 (a)(b) | 100,000 | 104,834 |
| 4.40%, 11/01/48 (a) | 150,000 | 197,451 |
| 4.30%, 03/15/49 (a) | 100,000 | 128,155 |
Schwab Taxable Bond Funds | Annual Report
Schwab U.S. Aggregate Bond Index Fund
Portfolio Holdings as of August 31, 2021 (continued)
Security
Rate, Maturity Date | Face
Amount ($) | Value ($) |
| Nevada Power Co. |
| 3.70%, 05/01/29 (a) | 250,000 | 282,677 |
| 6.75%, 07/01/37 | 100,000 | 150,878 |
| 3.13%, 08/01/50 (a) | 100,000 | 105,060 |
| NextEra Energy Capital Holdings, Inc. |
| 0.65%, 03/01/23 | 500,000 | 502,000 |
| 3.15%, 04/01/24 (a) | 250,000 | 265,082 |
| 2.75%, 05/01/25 (a) | 400,000 | 424,676 |
| 3.25%, 04/01/26 (a) | 100,000 | 108,505 |
| 3.55%, 05/01/27 (a) | 250,000 | 277,050 |
| 1.90%, 06/15/28 (a) | 300,000 | 304,086 |
| 3.50%, 04/01/29 (a) | 150,000 | 166,509 |
| 2.75%, 11/01/29 (a) | 150,000 | 158,981 |
| 2.25%, 06/01/30 (a) | 300,000 | 306,021 |
| 4.80%, 12/01/77 (a)(b) | 200,000 | 225,648 |
| Northern States Power Co. |
| 5.30%, 06/01/42 (a) | 37,000 | 52,187 |
| 3.40%, 08/15/42 (a) | 250,000 | 281,137 |
| 4.00%, 08/15/45 (a) | 150,000 | 182,286 |
| 3.60%, 05/15/46 (a) | 200,000 | 231,120 |
| 3.60%, 09/15/47 (a) | 350,000 | 405,793 |
| NSTAR Electric Co. |
| 5.50%, 03/15/40 | 300,000 | 423,543 |
| OGE Energy Corp. |
| 0.70%, 05/26/23 (a) | 200,000 | 200,068 |
| Oglethorpe Power Corp. |
| 5.95%, 11/01/39 | 100,000 | 136,902 |
| 5.38%, 11/01/40 | 200,000 | 259,316 |
| 3.75%, 08/01/50 (a) | 250,000 | 273,302 |
| Ohio Edison Co. |
| 6.88%, 07/15/36 | 100,000 | 145,944 |
| Ohio Power Co. |
| 2.60%, 04/01/30 (a) | 200,000 | 211,180 |
| 1.63%, 01/15/31 (a) | 150,000 | 146,160 |
| 4.00%, 06/01/49 (a) | 50,000 | 60,384 |
| Oklahoma Gas & Electric Co. |
| 0.55%, 05/26/23 (a) | 200,000 | 200,142 |
| 3.80%, 08/15/28 (a) | 250,000 | 284,267 |
| 3.30%, 03/15/30 (a) | 100,000 | 110,176 |
| 3.25%, 04/01/30 (a) | 150,000 | 164,691 |
| Oncor Electric Delivery Co., LLC |
| 2.75%, 06/01/24 (a) | 250,000 | 264,687 |
| 2.95%, 04/01/25 (a) | 100,000 | 106,868 |
| 0.55%, 10/01/25 (a) | 250,000 | 245,397 |
| 3.70%, 11/15/28 (a) | 100,000 | 113,903 |
| 4.55%, 12/01/41 (a) | 480,000 | 616,853 |
| 3.80%, 06/01/49 (a) | 100,000 | 119,624 |
| 3.10%, 09/15/49 (a) | 150,000 | 160,670 |
| 3.70%, 05/15/50 (a) | 100,000 | 118,700 |
| 5.35%, 10/01/52 (a) | 178,000 | 268,460 |
| Pacific Gas & Electric Co. |
| 1.37%, 03/10/23 (a) | 200,000 | 198,754 |
| 4.25%, 08/01/23 (a) | 500,000 | 522,970 |
| 3.40%, 08/15/24 (a) | 200,000 | 207,780 |
| 3.45%, 07/01/25 | 200,000 | 207,152 |
| 3.15%, 01/01/26 | 500,000 | 512,495 |
| 2.10%, 08/01/27 (a) | 450,000 | 436,198 |
| 3.30%, 12/01/27 (a) | 250,000 | 256,385 |
| 3.00%, 06/15/28 (a) | 150,000 | 149,919 |
| 3.75%, 07/01/28 | 200,000 | 209,016 |
| 4.55%, 07/01/30 (a) | 750,000 | 804,427 |
| 2.50%, 02/01/31 (a) | 450,000 | 425,520 |
| 3.25%, 06/01/31 (a) | 150,000 | 147,932 |
| 4.50%, 07/01/40 (a) | 600,000 | 610,086 |
| 3.30%, 08/01/40 (a) | 300,000 | 277,209 |
| 4.75%, 02/15/44 (a) | 200,000 | 204,010 |
Security
Rate, Maturity Date | Face
Amount ($) | Value ($) |
| 4.30%, 03/15/45 (a) | 200,000 | 196,556 |
| 3.95%, 12/01/47 (a) | 200,000 | 190,084 |
| 4.95%, 07/01/50 (a) | 750,000 | 794,617 |
| 3.50%, 08/01/50 (a) | 350,000 | 316,242 |
| PacifiCorp |
| 3.50%, 06/15/29 (a) | 150,000 | 167,726 |
| 2.70%, 09/15/30 (a) | 200,000 | 212,248 |
| 6.25%, 10/15/37 | 100,000 | 144,419 |
| 6.00%, 01/15/39 | 330,000 | 471,662 |
| 4.13%, 01/15/49 (a) | 150,000 | 181,934 |
| 4.15%, 02/15/50 (a) | 300,000 | 365,400 |
| 3.30%, 03/15/51 (a) | 100,000 | 109,146 |
| 2.90%, 06/15/52 (a) | 200,000 | 200,252 |
| PECO Energy Co. |
| 4.15%, 10/01/44 (a) | 100,000 | 123,504 |
| 3.90%, 03/01/48 (a) | 150,000 | 180,773 |
| 3.00%, 09/15/49 (a) | 100,000 | 105,263 |
| 2.80%, 06/15/50 (a) | 100,000 | 101,306 |
| Pinnacle West Capital Corp. |
| 1.30%, 06/15/25 (a) | 175,000 | 176,834 |
| Potomac Electric Power Co. |
| 3.60%, 03/15/24 (a) | 150,000 | 160,461 |
| 4.15%, 03/15/43 (a) | 100,000 | 122,238 |
| PPL Capital Funding, Inc. |
| 3.10%, 05/15/26 (a) | 250,000 | 269,105 |
| 4.13%, 04/15/30 (a) | 200,000 | 233,668 |
| PPL Electric Utilities Corp. |
| 4.75%, 07/15/43 (a) | 50,000 | 65,873 |
| 4.13%, 06/15/44 (a) | 100,000 | 122,089 |
| 3.95%, 06/01/47 (a) | 150,000 | 181,253 |
| 4.15%, 06/15/48 (a) | 100,000 | 125,990 |
| Progress Energy, Inc. |
| 7.75%, 03/01/31 | 150,000 | 215,700 |
| 6.00%, 12/01/39 | 250,000 | 351,390 |
| Public Service Co. of Colorado |
| 3.70%, 06/15/28 (a) | 200,000 | 226,274 |
| 1.90%, 01/15/31 (a) | 150,000 | 150,516 |
| 6.25%, 09/01/37 | 100,000 | 149,139 |
| 3.60%, 09/15/42 (a) | 100,000 | 114,376 |
| 4.30%, 03/15/44 (a) | 40,000 | 49,354 |
| 3.80%, 06/15/47 (a) | 200,000 | 236,730 |
| 4.05%, 09/15/49 (a) | 200,000 | 249,922 |
| 3.20%, 03/01/50 (a) | 100,000 | 108,398 |
| Public Service Co. of New Hampshire |
| 3.50%, 11/01/23 (a) | 200,000 | 211,852 |
| 3.60%, 07/01/49 (a) | 150,000 | 174,104 |
| Public Service Electric & Gas Co. |
| 0.95%, 03/15/26 (a) | 250,000 | 250,007 |
| 2.25%, 09/15/26 (a) | 300,000 | 315,888 |
| 3.20%, 05/15/29 (a) | 300,000 | 331,899 |
| 1.90%, 08/15/31 (a) | 250,000 | 250,325 |
| 3.95%, 05/01/42 (a) | 150,000 | 180,020 |
| 3.80%, 03/01/46 (a) | 150,000 | 177,813 |
| 3.60%, 12/01/47 (a) | 100,000 | 115,456 |
| 3.85%, 05/01/49 (a) | 150,000 | 180,762 |
| 3.15%, 01/01/50 (a) | 100,000 | 108,161 |
| 2.70%, 05/01/50 (a) | 250,000 | 250,337 |
| 2.05%, 08/01/50 (a) | 200,000 | 176,498 |
| Public Service Enterprise Group, Inc. |
| 2.88%, 06/15/24 (a) | 100,000 | 105,785 |
| 0.80%, 08/15/25 (a) | 250,000 | 247,502 |
| 1.60%, 08/15/30 (a) | 200,000 | 191,350 |
| Puget Energy, Inc. |
| 4.10%, 06/15/30 (a) | 250,000 | 281,020 |
Schwab Taxable Bond Funds | Annual Report
Schwab U.S. Aggregate Bond Index Fund
Portfolio Holdings as of August 31, 2021 (continued)
Security
Rate, Maturity Date | Face
Amount ($) | Value ($) |
| Puget Sound Energy, Inc. |
| 6.27%, 03/15/37 | 362,000 | 516,328 |
| 4.22%, 06/15/48 (a) | 100,000 | 124,204 |
| 3.25%, 09/15/49 (a) | 100,000 | 107,141 |
| San Diego Gas & Electric Co. |
| 2.50%, 05/15/26 (a) | 150,000 | 159,024 |
| 1.70%, 10/01/30 (a) | 200,000 | 195,116 |
| 6.00%, 06/01/39 | 150,000 | 214,047 |
| 4.50%, 08/15/40 | 100,000 | 125,516 |
| 4.15%, 05/15/48 (a) | 100,000 | 121,812 |
| 4.10%, 06/15/49 (a) | 100,000 | 121,575 |
| 3.32%, 04/15/50 (a) | 100,000 | 107,691 |
| 2.95%, 08/15/51 (a) | 150,000 | 150,489 |
| Southern California Edison Co. |
| 3.40%, 06/01/23 (a) | 100,000 | 104,713 |
| 3.50%, 10/01/23 (a) | 300,000 | 316,050 |
| 3.70%, 08/01/25 (a) | 200,000 | 219,022 |
| 1.20%, 02/01/26 (a) | 250,000 | 249,340 |
| 3.65%, 03/01/28 (a) | 250,000 | 274,617 |
| 4.20%, 03/01/29 (a) | 100,000 | 113,465 |
| 2.85%, 08/01/29 (a) | 100,000 | 104,928 |
| 2.25%, 06/01/30 (a) | 150,000 | 150,134 |
| 5.55%, 01/15/37 | 150,000 | 187,159 |
| 5.95%, 02/01/38 | 100,000 | 130,521 |
| 5.50%, 03/15/40 | 100,000 | 126,510 |
| 4.50%, 09/01/40 (a) | 150,000 | 173,787 |
| 4.05%, 03/15/42 (a) | 100,000 | 107,535 |
| 3.90%, 03/15/43 (a) | 150,000 | 158,663 |
| 4.65%, 10/01/43 (a) | 150,000 | 172,796 |
| 3.60%, 02/01/45 (a) | 100,000 | 101,177 |
| 4.00%, 04/01/47 (a) | 400,000 | 425,068 |
| 4.13%, 03/01/48 (a) | 250,000 | 270,360 |
| 4.88%, 03/01/49 (a) | 100,000 | 119,981 |
| 3.65%, 02/01/50 (a) | 200,000 | 204,232 |
| 2.95%, 02/01/51 (a) | 200,000 | 183,638 |
| 3.65%, 06/01/51 (a) | 200,000 | 203,972 |
| Southern Power Co. |
| 4.15%, 12/01/25 (a) | 100,000 | 111,837 |
| 0.90%, 01/15/26 (a) | 250,000 | 246,717 |
| 5.25%, 07/15/43 | 50,000 | 63,882 |
| 4.95%, 12/15/46 (a) | 100,000 | 123,691 |
| Southwestern Electric Power Co. |
| 1.65%, 03/15/26 (a) | 150,000 | 152,480 |
| 2.75%, 10/01/26 (a) | 150,000 | 159,543 |
| 4.10%, 09/15/28 (a) | 150,000 | 171,785 |
| 6.20%, 03/15/40 | 100,000 | 142,193 |
| 3.90%, 04/01/45 (a) | 200,000 | 225,362 |
| 3.85%, 02/01/48 (a) | 150,000 | 168,978 |
| Southwestern Public Service Co. |
| 4.50%, 08/15/41 (a) | 150,000 | 187,585 |
| 3.40%, 08/15/46 (a) | 150,000 | 163,367 |
| 3.70%, 08/15/47 (a) | 100,000 | 114,491 |
| 3.15%, 05/01/50 (a) | 150,000 | 159,852 |
| Tampa Electric Co. |
| 2.40%, 03/15/31 (a) | 100,000 | 103,157 |
| 4.10%, 06/15/42 (a) | 200,000 | 235,182 |
| 4.30%, 06/15/48 (a) | 250,000 | 313,760 |
| The AES Corp. |
| 1.38%, 01/15/26 (a) | 150,000 | 149,351 |
| 2.45%, 01/15/31 (a) | 400,000 | 404,012 |
| The Connecticut Light and Power Co |
| 2.05%, 07/01/31 (a) | 100,000 | 101,333 |
| 4.00%, 04/01/48 (a) | 200,000 | 246,220 |
| The Dayton Power & Light Co |
| 3.95%, 06/15/49 (a) | 100,000 | 115,319 |
Security
Rate, Maturity Date | Face
Amount ($) | Value ($) |
| The Southern Co. |
| 2.95%, 07/01/23 (a) | 250,000 | 260,447 |
| 0.60%, 02/26/24 (a) | 200,000 | 200,016 |
| 3.25%, 07/01/26 (a) | 400,000 | 433,652 |
| 3.70%, 04/30/30 (a) | 250,000 | 278,867 |
| 4.25%, 07/01/36 (a) | 150,000 | 176,469 |
| 4.40%, 07/01/46 (a) | 450,000 | 541,728 |
| 4.00%, 01/15/51 (a)(b) | 250,000 | 265,872 |
| 3.75%, 09/15/51 (a)(b) | 200,000 | 204,764 |
| The Toledo Edison Co. |
| 6.15%, 05/15/37 | 100,000 | 139,671 |
| Tucson Electric Power Co. |
| 1.50%, 08/01/30 (a) | 200,000 | 192,422 |
| 4.85%, 12/01/48 (a) | 50,000 | 66,281 |
| 4.00%, 06/15/50 (a) | 100,000 | 120,875 |
| Union Electric Co. |
| 3.50%, 03/15/29 (a) | 150,000 | 167,873 |
| 2.95%, 03/15/30 (a) | 200,000 | 216,746 |
| 2.15%, 03/15/32 (a) | 100,000 | 101,224 |
| 3.90%, 09/15/42 (a) | 40,000 | 46,746 |
| 4.00%, 04/01/48 (a) | 250,000 | 302,397 |
| 2.63%, 03/15/51 (a) | 250,000 | 244,405 |
| Virginia Electric & Power Co. |
| 3.45%, 09/01/22 (a) | 350,000 | 358,186 |
| 2.75%, 03/15/23 (a) | 100,000 | 103,152 |
| 3.50%, 03/15/27 (a) | 250,000 | 277,812 |
| 3.80%, 04/01/28 (a) | 150,000 | 169,989 |
| 2.88%, 07/15/29 (a) | 250,000 | 270,000 |
| 6.00%, 05/15/37 | 300,000 | 423,972 |
| 8.88%, 11/15/38 | 150,000 | 270,048 |
| 4.00%, 01/15/43 (a) | 100,000 | 118,122 |
| 4.65%, 08/15/43 (a) | 200,000 | 255,624 |
| 4.45%, 02/15/44 (a) | 100,000 | 125,283 |
| 4.20%, 05/15/45 (a) | 100,000 | 121,923 |
| 3.80%, 09/15/47 (a) | 150,000 | 174,161 |
| 4.60%, 12/01/48 (a) | 150,000 | 198,655 |
| 3.30%, 12/01/49 (a) | 350,000 | 382,102 |
| WEC Energy Group, Inc. |
| 0.55%, 09/15/23 | 200,000 | 200,200 |
| 1.38%, 10/15/27 (a) | 200,000 | 197,988 |
| 1.80%, 10/15/30 (a) | 250,000 | 243,617 |
| Wisconsin Electric Power Co. |
| 4.30%, 10/15/48 (a) | 100,000 | 127,440 |
| Wisconsin Power & Light Co. |
| 3.00%, 07/01/29 (a) | 100,000 | 108,989 |
| 3.65%, 04/01/50 (a) | 100,000 | 115,792 |
| Wisconsin Public Service Corp. |
| 3.67%, 12/01/42 | 250,000 | 290,790 |
| Xcel Energy, Inc. |
| 0.50%, 10/15/23 (a) | 450,000 | 451,111 |
| 4.00%, 06/15/28 (a) | 250,000 | 285,262 |
| 2.60%, 12/01/29 (a) | 100,000 | 105,119 |
| 3.40%, 06/01/30 (a) | 100,000 | 110,951 |
| 3.50%, 12/01/49 (a) | 100,000 | 109,843 |
| | | 106,075,173 |
| Natural Gas 0.2% |
| Atmos Energy Corp. |
| 0.63%, 03/09/23 (a) | 250,000 | 250,037 |
| 2.63%, 09/15/29 (a) | 125,000 | 131,923 |
| 1.50%, 01/15/31 (a) | 400,000 | 384,288 |
| 4.13%, 10/15/44 (a) | 300,000 | 359,472 |
| 4.30%, 10/01/48 (a) | 100,000 | 125,540 |
| 4.13%, 03/15/49 (a) | 100,000 | 123,614 |
| 3.38%, 09/15/49 (a) | 100,000 | 110,713 |
Schwab Taxable Bond Funds | Annual Report
Schwab U.S. Aggregate Bond Index Fund
Portfolio Holdings as of August 31, 2021 (continued)
Security
Rate, Maturity Date | Face
Amount ($) | Value ($) |
| CenterPoint Energy Resources Corp. |
| 4.00%, 04/01/28 (a) | 100,000 | 113,121 |
| 1.75%, 10/01/30 (a) | 250,000 | 243,467 |
| 5.85%, 01/15/41 (a) | 100,000 | 140,224 |
| NiSource, Inc. |
| 0.95%, 08/15/25 (a) | 350,000 | 347,739 |
| 3.49%, 05/15/27 (a) | 250,000 | 276,257 |
| 2.95%, 09/01/29 (a) | 100,000 | 106,550 |
| 3.60%, 05/01/30 (a) | 200,000 | 223,010 |
| 1.70%, 02/15/31 (a) | 250,000 | 240,168 |
| 5.25%, 02/15/43 (a) | 195,000 | 259,648 |
| 4.80%, 02/15/44 (a) | 409,000 | 521,455 |
| 3.95%, 03/30/48 (a) | 100,000 | 116,232 |
| ONE Gas, Inc. |
| 0.85%, 03/11/23 (a) | 200,000 | 200,126 |
| 1.10%, 03/11/24 (a) | 200,000 | 200,064 |
| 2.00%, 05/15/30 (a) | 200,000 | 199,932 |
| 4.66%, 02/01/44 (a) | 100,000 | 125,193 |
| 4.50%, 11/01/48 (a) | 100,000 | 124,507 |
| Piedmont Natural Gas Co., Inc. |
| 3.50%, 06/01/29 (a) | 150,000 | 165,666 |
| 3.64%, 11/01/46 (a) | 100,000 | 109,429 |
| 3.35%, 06/01/50 (a) | 100,000 | 105,706 |
| Sempra Energy |
| 2.90%, 02/01/23 (a) | 250,000 | 258,020 |
| 3.55%, 06/15/24 (a) | 150,000 | 160,544 |
| 3.75%, 11/15/25 (a) | 150,000 | 164,565 |
| 3.25%, 06/15/27 (a) | 200,000 | 217,826 |
| 3.40%, 02/01/28 (a) | 200,000 | 218,388 |
| 3.80%, 02/01/38 (a) | 150,000 | 168,414 |
| 6.00%, 10/15/39 | 150,000 | 210,735 |
| 4.00%, 02/01/48 (a) | 150,000 | 170,351 |
| Southern California Gas Co. |
| 3.15%, 09/15/24 (a) | 50,000 | 53,468 |
| 2.60%, 06/15/26 (a) | 130,000 | 138,645 |
| 2.55%, 02/01/30 (a) | 100,000 | 104,543 |
| 3.75%, 09/15/42 (a) | 150,000 | 170,850 |
| 4.30%, 01/15/49 (a) | 250,000 | 315,857 |
| 3.95%, 02/15/50 (a) | 100,000 | 120,439 |
| Southern Co. Gas Capital Corp. |
| 2.45%, 10/01/23 (a) | 150,000 | 155,606 |
| 1.75%, 01/15/31 (a) | 250,000 | 241,797 |
| 5.88%, 03/15/41 (a) | 150,000 | 211,311 |
| 4.40%, 06/01/43 (a) | 75,000 | 90,368 |
| 3.95%, 10/01/46 (a) | 150,000 | 170,985 |
| 4.40%, 05/30/47 (a) | 200,000 | 240,122 |
| Southwest Gas Corp. |
| 2.20%, 06/15/30 (a) | 250,000 | 253,265 |
| 4.15%, 06/01/49 (a) | 100,000 | 117,314 |
| Washington Gas Light Co. |
| 3.80%, 09/15/46 (a) | 100,000 | 115,378 |
| | | 9,372,872 |
| Utility Other 0.1% |
| American Water Capital Corp. |
| 3.40%, 03/01/25 (a) | 150,000 | 162,575 |
| 3.75%, 09/01/28 (a) | 240,000 | 272,611 |
| 3.45%, 06/01/29 (a) | 300,000 | 334,239 |
| 2.80%, 05/01/30 (a) | 200,000 | 213,822 |
| 2.30%, 06/01/31 (a) | 200,000 | 205,498 |
| 3.75%, 09/01/47 (a) | 600,000 | 689,766 |
| 4.15%, 06/01/49 (a) | 150,000 | 183,880 |
| 3.45%, 05/01/50 (a) | 100,000 | 109,940 |
Security
Rate, Maturity Date | Face
Amount ($) | Value ($) |
| Essential Utilities, Inc. |
| 3.57%, 05/01/29 (a) | 100,000 | 111,512 |
| 2.70%, 04/15/30 (a) | 100,000 | 104,775 |
| 2.40%, 05/01/31 (a) | 200,000 | 204,092 |
| 4.28%, 05/01/49 (a) | 100,000 | 121,126 |
| 3.35%, 04/15/50 (a) | 100,000 | 105,382 |
| | | 2,819,218 |
| | | 118,267,263 |
| Total Corporates |
| (Cost $1,352,946,519) | | 1,439,513,850 |
|
| Treasuries 38.1% of net assets |
| Bonds |
| 7.63%, 11/15/22 | 327,600 | 357,308 |
| 7.13%, 02/15/23 | 1,000,000 | 1,101,816 |
| 6.25%, 08/15/23 | 1,375,000 | 1,537,825 |
| 7.50%, 11/15/24 | 800,000 | 981,250 |
| 7.63%, 02/15/25 | 550,000 | 684,879 |
| 6.88%, 08/15/25 | 500,000 | 622,910 |
| 6.00%, 02/15/26 | 1,310,800 | 1,617,456 |
| 6.75%, 08/15/26 | 750,000 | 968,262 |
| 6.50%, 11/15/26 | 955,300 | 1,233,270 |
| 6.63%, 02/15/27 | 696,400 | 912,012 |
| 0.38%, 07/31/27 | 8,800,000 | 8,526,375 |
| 6.38%, 08/15/27 | 743,300 | 980,024 |
| 0.50%, 08/31/27 | 8,200,000 | 7,993,398 |
| 6.13%, 11/15/27 | 1,509,500 | 1,982,221 |
| 5.50%, 08/15/28 | 1,780,000 | 2,314,278 |
| 5.25%, 11/15/28 | 1,588,100 | 2,050,262 |
| 5.25%, 02/15/29 | 1,295,300 | 1,680,449 |
| 6.13%, 08/15/29 | 900,000 | 1,244,039 |
| 6.25%, 05/15/30 | 1,450,000 | 2,059,227 |
| 0.63%, 08/15/30 (h) | 22,500,000 | 21,316,992 |
| 5.38%, 02/15/31 | 1,760,000 | 2,413,125 |
| 4.50%, 02/15/36 | 2,108,700 | 2,949,215 |
| 4.75%, 02/15/37 | 1,730,000 | 2,502,959 |
| 5.00%, 05/15/37 | 2,520,000 | 3,743,578 |
| 4.38%, 02/15/38 | 2,777,600 | 3,904,698 |
| 4.50%, 05/15/38 | 2,810,000 | 4,010,397 |
| 3.50%, 02/15/39 | 1,755,300 | 2,248,567 |
| 4.25%, 05/15/39 | 2,629,500 | 3,682,122 |
| 4.50%, 08/15/39 | 2,523,300 | 3,638,875 |
| 4.38%, 11/15/39 | 2,475,900 | 3,524,095 |
| 4.63%, 02/15/40 | 2,348,600 | 3,448,222 |
| 1.13%, 05/15/40 | 9,000,000 | 8,023,359 |
| 4.38%, 05/15/40 | 2,677,000 | 3,827,273 |
| 1.13%, 08/15/40 | 11,200,000 | 9,948,750 |
| 3.88%, 08/15/40 | 2,309,100 | 3,111,512 |
| 1.38%, 11/15/40 | 11,500,000 | 10,652,773 |
| 4.25%, 11/15/40 | 2,573,600 | 3,635,210 |
| 1.88%, 02/15/41 | 14,000,000 | 14,115,937 |
| 4.75%, 02/15/41 | 2,900,000 | 4,357,250 |
| 2.25%, 05/15/41 | 14,400,000 | 15,412,500 |
| 4.38%, 05/15/41 | 2,413,700 | 3,472,522 |
| 1.75%, 08/15/41 | 5,600,000 | 5,512,937 |
| 3.75%, 08/15/41 | 2,503,600 | 3,334,873 |
| 3.13%, 11/15/41 | 2,581,600 | 3,159,636 |
| 3.13%, 02/15/42 | 2,930,900 | 3,594,474 |
| 3.00%, 05/15/42 | 2,805,300 | 3,373,812 |
| 2.75%, 08/15/42 | 3,368,100 | 3,899,628 |
| 2.75%, 11/15/42 | 4,610,800 | 5,338,442 |
| 3.13%, 02/15/43 | 4,232,900 | 5,189,602 |
| 2.88%, 05/15/43 | 6,472,800 | 7,645,995 |
| 3.63%, 08/15/43 | 4,692,900 | 6,197,561 |
| 3.75%, 11/15/43 | 5,302,900 | 7,140,686 |
Schwab Taxable Bond Funds | Annual Report
Schwab U.S. Aggregate Bond Index Fund
Portfolio Holdings as of August 31, 2021 (continued)
Security
Rate, Maturity Date | Face
Amount ($) | Value ($) |
| 3.63%, 02/15/44 | 6,762,900 | 8,965,598 |
| 3.38%, 05/15/44 | 4,993,600 | 6,392,588 |
| 3.13%, 08/15/44 | 6,438,200 | 7,941,620 |
| 3.00%, 11/15/44 | 5,753,600 | 6,962,306 |
| 2.50%, 02/15/45 | 6,807,000 | 7,587,678 |
| 3.00%, 05/15/45 | 4,268,600 | 5,182,014 |
| 2.88%, 08/15/45 | 5,488,200 | 6,531,387 |
| 3.00%, 11/15/45 | 2,618,600 | 3,187,736 |
| 2.50%, 02/15/46 | 5,857,900 | 6,546,661 |
| 2.50%, 05/15/46 | 5,867,800 | 6,561,851 |
| 2.25%, 08/15/46 | 6,595,800 | 7,044,108 |
| 2.88%, 11/15/46 | 2,848,900 | 3,409,109 |
| 3.00%, 02/15/47 | 6,236,600 | 7,634,963 |
| 3.00%, 05/15/47 | 4,219,000 | 5,171,901 |
| 2.75%, 08/15/47 | 6,875,000 | 8,067,920 |
| 2.75%, 11/15/47 | 7,450,000 | 8,750,258 |
| 3.00%, 02/15/48 | 8,250,000 | 10,138,477 |
| 3.13%, 05/15/48 | 8,500,000 | 10,688,086 |
| 3.00%, 08/15/48 | 9,450,000 | 11,635,312 |
| 3.38%, 11/15/48 | 8,700,000 | 11,445,937 |
| 3.00%, 02/15/49 | 10,050,000 | 12,410,965 |
| 2.88%, 05/15/49 | 10,050,000 | 12,147,152 |
| 2.25%, 08/15/49 | 10,600,000 | 11,357,734 |
| 2.38%, 11/15/49 | 8,650,000 | 9,522,434 |
| 2.00%, 02/15/50 | 10,920,000 | 11,105,981 |
| 1.25%, 05/15/50 | 13,500,000 | 11,458,125 |
| 1.38%, 08/15/50 | 14,100,000 | 12,345,211 |
| 1.63%, 11/15/50 | 13,900,000 | 12,946,547 |
| 1.88%, 02/15/51 | 15,500,000 | 15,315,937 |
| 2.38%, 05/15/51 | 16,100,000 | 17,785,469 |
| 2.00%, 08/15/51 | 5,800,000 | 5,904,219 |
| Notes |
| 1.50%, 09/15/22 | 4,700,000 | 4,769,123 |
| 0.13%, 09/30/22 | 10,700,000 | 10,704,598 |
| 1.75%, 09/30/22 | 6,298,900 | 6,411,837 |
| 1.88%, 09/30/22 | 5,500,000 | 5,606,025 |
| 1.38%, 10/15/22 | 5,600,000 | 5,680,391 |
| 0.13%, 10/31/22 | 9,600,000 | 9,603,000 |
| 1.88%, 10/31/22 | 6,466,200 | 6,600,197 |
| 2.00%, 10/31/22 | 6,000,000 | 6,132,422 |
| 1.63%, 11/15/22 | 10,954,400 | 11,154,874 |
| 0.13%, 11/30/22 | 12,000,000 | 12,002,344 |
| 2.00%, 11/30/22 | 10,471,600 | 10,719,073 |
| 1.63%, 12/15/22 | 6,100,000 | 6,219,141 |
| 0.13%, 12/31/22 | 11,000,000 | 11,000,430 |
| 2.13%, 12/31/22 | 10,660,800 | 10,944,602 |
| 1.50%, 01/15/23 | 5,000,000 | 5,094,531 |
| 0.13%, 01/31/23 | 12,000,000 | 12,000,000 |
| 1.75%, 01/31/23 | 4,910,800 | 5,023,307 |
| 2.38%, 01/31/23 | 5,500,000 | 5,674,883 |
| 1.38%, 02/15/23 | 8,400,000 | 8,552,250 |
| 2.00%, 02/15/23 | 9,414,600 | 9,671,295 |
| 0.13%, 02/28/23 | 11,000,000 | 10,997,852 |
| 1.50%, 02/28/23 | 4,393,600 | 4,483,446 |
| 2.63%, 02/28/23 | 3,500,000 | 3,630,703 |
| 0.50%, 03/15/23 | 6,300,000 | 6,334,945 |
| 0.13%, 03/31/23 | 12,000,000 | 11,995,547 |
| 1.50%, 03/31/23 | 4,600,000 | 4,698,559 |
| 2.50%, 03/31/23 | 5,500,000 | 5,704,209 |
| 0.25%, 04/15/23 | 7,000,000 | 7,010,938 |
| 0.13%, 04/30/23 | 11,500,000 | 11,493,936 |
| 1.63%, 04/30/23 | 3,260,800 | 3,340,537 |
| 2.75%, 04/30/23 | 5,200,000 | 5,424,047 |
| 0.13%, 05/15/23 | 8,200,000 | 8,195,355 |
| 1.75%, 05/15/23 | 7,884,400 | 8,098,449 |
| 0.13%, 05/31/23 | 12,000,000 | 11,991,094 |
| 1.63%, 05/31/23 | 4,329,900 | 4,440,515 |
| 2.75%, 05/31/23 | 3,600,000 | 3,762,281 |
Security
Rate, Maturity Date | Face
Amount ($) | Value ($) |
| 0.25%, 06/15/23 | 7,200,000 | 7,209,844 |
| 0.13%, 06/30/23 | 12,500,000 | 12,490,723 |
| 1.38%, 06/30/23 | 4,913,000 | 5,020,952 |
| 2.63%, 06/30/23 | 5,500,000 | 5,745,459 |
| 0.13%, 07/15/23 | 8,500,000 | 8,491,035 |
| 0.13%, 07/31/23 | 12,000,000 | 11,986,406 |
| 1.25%, 07/31/23 | 5,500,000 | 5,611,826 |
| 2.75%, 07/31/23 | 4,800,000 | 5,034,750 |
| 0.13%, 08/15/23 | 7,700,000 | 7,690,074 |
| 2.50%, 08/15/23 | 8,402,200 | 8,779,478 |
| 0.13%, 08/31/23 | 12,500,000 | 12,480,713 |
| 1.38%, 08/31/23 | 5,500,000 | 5,628,047 |
| 2.75%, 08/31/23 | 4,800,000 | 5,043,281 |
| 0.13%, 09/15/23 | 8,500,000 | 8,484,727 |
| 1.38%, 09/30/23 | 4,574,500 | 4,684,395 |
| 2.88%, 09/30/23 | 5,200,000 | 5,485,797 |
| 0.13%, 10/15/23 | 8,300,000 | 8,281,844 |
| 1.63%, 10/31/23 | 5,450,000 | 5,613,713 |
| 2.88%, 10/31/23 | 5,600,000 | 5,918,719 |
| 0.25%, 11/15/23 | 10,000,000 | 10,001,562 |
| 2.75%, 11/15/23 | 11,438,200 | 12,069,088 |
| 2.13%, 11/30/23 | 4,200,000 | 4,376,695 |
| 2.88%, 11/30/23 | 5,200,000 | 5,505,906 |
| 0.13%, 12/15/23 | 10,400,000 | 10,368,313 |
| 2.25%, 12/31/23 | 4,575,200 | 4,786,088 |
| 2.63%, 12/31/23 | 5,750,000 | 6,064,902 |
| 0.13%, 01/15/24 | 9,000,000 | 8,967,656 |
| 2.25%, 01/31/24 | 5,024,500 | 5,263,164 |
| 2.50%, 01/31/24 | 6,000,000 | 6,320,156 |
| 0.13%, 02/15/24 | 12,000,000 | 11,954,063 |
| 2.75%, 02/15/24 | 9,450,000 | 10,020,691 |
| 2.13%, 02/29/24 | 4,964,100 | 5,190,587 |
| 2.38%, 02/29/24 | 4,500,000 | 4,732,910 |
| 0.25%, 03/15/24 | 12,000,000 | 11,984,063 |
| 2.13%, 03/31/24 | 11,254,400 | 11,779,312 |
| 0.38%, 04/15/24 | 10,000,000 | 10,010,937 |
| 2.00%, 04/30/24 | 1,500,000 | 1,566,621 |
| 2.25%, 04/30/24 | 7,050,000 | 7,408,834 |
| 0.25%, 05/15/24 | 10,500,000 | 10,472,520 |
| 2.50%, 05/15/24 | 11,757,600 | 12,442,388 |
| 2.00%, 05/31/24 | 8,100,000 | 8,465,449 |
| 0.25%, 06/15/24 | 11,500,000 | 11,464,062 |
| 1.75%, 06/30/24 | 6,600,000 | 6,858,328 |
| 2.00%, 06/30/24 | 4,750,000 | 4,969,131 |
| 0.38%, 07/15/24 | 12,000,000 | 11,996,719 |
| 1.75%, 07/31/24 | 7,100,000 | 7,383,445 |
| 2.13%, 07/31/24 | 4,500,000 | 4,728,164 |
| 0.38%, 08/15/24 | 12,000,000 | 11,991,563 |
| 2.38%, 08/15/24 | 12,926,900 | 13,683,326 |
| 1.25%, 08/31/24 | 5,600,000 | 5,742,188 |
| 1.88%, 08/31/24 | 4,665,000 | 4,870,734 |
| 1.50%, 09/30/24 | 7,300,000 | 7,543,238 |
| 2.13%, 09/30/24 | 4,750,000 | 4,998,447 |
| 1.50%, 10/31/24 | 7,300,000 | 7,545,520 |
| 2.25%, 10/31/24 | 5,400,000 | 5,708,180 |
| 2.25%, 11/15/24 | 11,926,900 | 12,614,560 |
| 1.50%, 11/30/24 | 7,710,000 | 7,971,116 |
| 2.13%, 11/30/24 | 5,500,000 | 5,795,840 |
| 1.75%, 12/31/24 | 7,200,000 | 7,504,875 |
| 2.25%, 12/31/24 | 5,100,000 | 5,400,023 |
| 1.38%, 01/31/25 | 7,100,000 | 7,311,059 |
| 2.50%, 01/31/25 | 4,500,000 | 4,806,563 |
| 2.00%, 02/15/25 | 12,298,900 | 12,930,180 |
| 1.13%, 02/28/25 | 6,950,000 | 7,096,873 |
| 2.75%, 02/28/25 | 5,250,000 | 5,658,516 |
| 0.50%, 03/31/25 | 8,100,000 | 8,090,824 |
| 2.63%, 03/31/25 | 3,700,000 | 3,974,898 |
| 0.38%, 04/30/25 | 8,000,000 | 7,949,062 |
Schwab Taxable Bond Funds | Annual Report
Schwab U.S. Aggregate Bond Index Fund
Portfolio Holdings as of August 31, 2021 (continued)
Security
Rate, Maturity Date | Face
Amount ($) | Value ($) |
| 2.88%, 04/30/25 | 5,300,000 | 5,747,809 |
| 2.13%, 05/15/25 | 11,221,600 | 11,865,527 |
| 0.25%, 05/31/25 | 7,900,000 | 7,804,645 |
| 2.88%, 05/31/25 | 4,600,000 | 4,993,156 |
| 0.25%, 06/30/25 | 9,000,000 | 8,885,391 |
| 2.75%, 06/30/25 | 3,850,000 | 4,166,422 |
| 0.25%, 07/31/25 | 10,100,000 | 9,963,098 |
| 2.88%, 07/31/25 | 4,500,000 | 4,896,914 |
| 2.00%, 08/15/25 | 11,607,400 | 12,243,087 |
| 0.25%, 08/31/25 | 10,400,000 | 10,248,469 |
| 2.75%, 08/31/25 | 4,400,000 | 4,771,594 |
| 0.25%, 09/30/25 | 10,900,000 | 10,730,965 |
| 3.00%, 09/30/25 | 3,900,000 | 4,272,633 |
| 0.25%, 10/31/25 | 10,400,000 | 10,228,156 |
| 3.00%, 10/31/25 | 4,100,000 | 4,498,148 |
| 2.25%, 11/15/25 | 12,080,200 | 12,883,345 |
| 0.38%, 11/30/25 | 11,000,000 | 10,867,227 |
| 2.88%, 11/30/25 | 5,200,000 | 5,683,438 |
| 0.38%, 12/31/25 | 11,300,000 | 11,153,012 |
| 2.63%, 12/31/25 | 4,400,000 | 4,766,781 |
| 0.38%, 01/31/26 | 12,400,000 | 12,227,078 |
| 2.63%, 01/31/26 | 4,400,000 | 4,771,422 |
| 1.63%, 02/15/26 | 10,545,800 | 10,975,047 |
| 0.50%, 02/28/26 | 12,100,000 | 11,992,234 |
| 2.50%, 02/28/26 | 5,000,000 | 5,399,023 |
| 0.75%, 03/31/26 | 11,700,000 | 11,716,910 |
| 2.25%, 03/31/26 | 5,100,000 | 5,453,414 |
| 0.75%, 04/30/26 | 11,000,000 | 11,010,742 |
| 2.38%, 04/30/26 | 3,500,000 | 3,765,371 |
| 1.63%, 05/15/26 | 10,924,500 | 11,373,002 |
| 0.75%, 05/31/26 | 12,000,000 | 12,004,688 |
| 2.13%, 05/31/26 | 5,200,000 | 5,536,375 |
| 0.88%, 06/30/26 | 11,700,000 | 11,765,812 |
| 1.88%, 06/30/26 | 4,950,000 | 5,213,549 |
| 0.63%, 07/31/26 | 12,000,000 | 11,917,969 |
| 1.88%, 07/31/26 | 5,000,000 | 5,269,336 |
| 1.50%, 08/15/26 | 10,071,600 | 10,427,647 |
| 0.75%, 08/31/26 | 13,000,000 | 12,985,781 |
| 1.38%, 08/31/26 | 3,600,000 | 3,706,453 |
| 1.63%, 09/30/26 | 4,000,000 | 4,166,875 |
| 1.63%, 10/31/26 | 4,800,000 | 5,001,000 |
| 2.00%, 11/15/26 | 10,473,900 | 11,112,972 |
| 1.63%, 11/30/26 | 4,900,000 | 5,104,613 |
| 1.75%, 12/31/26 | 5,000,000 | 5,241,602 |
| 1.50%, 01/31/27 | 4,700,000 | 4,865,418 |
| 2.25%, 02/15/27 | 9,442,600 | 10,150,795 |
| 1.13%, 02/28/27 | 3,400,000 | 3,450,469 |
| 0.63%, 03/31/27 | 4,650,000 | 4,590,059 |
| 0.50%, 04/30/27 | 6,600,000 | 6,461,297 |
| 2.38%, 05/15/27 | 11,500,000 | 12,454,141 |
| 0.50%, 05/31/27 | 7,800,000 | 7,626,328 |
| 0.50%, 06/30/27 | 7,600,000 | 7,425,141 |
| 2.25%, 08/15/27 | 9,942,000 | 10,709,786 |
| 0.38%, 09/30/27 | 9,400,000 | 9,082,016 |
| 0.50%, 10/31/27 | 9,700,000 | 9,431,355 |
| 2.25%, 11/15/27 | 10,000,000 | 10,779,687 |
| 0.63%, 11/30/27 | 10,100,000 | 9,884,586 |
| 0.63%, 12/31/27 | 11,900,000 | 11,634,109 |
| 0.75%, 01/31/28 | 12,100,000 | 11,908,574 |
| 2.75%, 02/15/28 | 12,350,000 | 13,707,535 |
| 1.13%, 02/29/28 | 12,900,000 | 12,995,742 |
| 1.25%, 03/31/28 | 12,000,000 | 12,171,563 |
| 1.25%, 04/30/28 | 10,000,000 | 10,138,281 |
| 2.88%, 05/15/28 | 13,350,000 | 14,947,828 |
| 1.25%, 05/31/28 | 12,800,000 | 12,969,000 |
| 1.25%, 06/30/28 | 12,200,000 | 12,351,547 |
| 1.00%, 07/31/28 | 12,000,000 | 11,940,938 |
| 2.88%, 08/15/28 | 13,550,000 | 15,197,172 |
Security
Rate, Maturity Date | Face
Amount ($) | Value ($) |
| 1.13%, 08/31/28 | 13,000,000 | 13,036,562 |
| 3.13%, 11/15/28 | 12,550,000 | 14,323,668 |
| 2.63%, 02/15/29 | 13,000,000 | 14,403,594 |
| 2.38%, 05/15/29 | 10,750,000 | 11,730,098 |
| 1.63%, 08/15/29 | 9,600,000 | 9,942,000 |
| 1.75%, 11/15/29 | 7,300,000 | 7,630,781 |
| 1.50%, 02/15/30 | 12,700,000 | 13,004,602 |
| 0.63%, 05/15/30 | 17,905,000 | 17,009,750 |
| 0.88%, 11/15/30 (h) | 24,400,000 | 23,586,031 |
| 1.13%, 02/15/31 (h) | 25,200,000 | 24,867,281 |
| 1.63%, 05/15/31 (h) | 25,150,000 | 25,930,043 |
| 1.25%, 08/15/31 | 10,000,000 | 9,950,000 |
| Total Treasuries |
| (Cost $2,045,487,251) | | 2,101,604,489 |
|
| Government Related 5.7% of net assets |
| |
| Agency 2.3% |
| Foreign 0.9% |
| Austria 0.0% |
| Oesterreichische Kontrollbank AG |
| 1.63%, 09/17/22 | 200,000 | 203,064 |
| 2.88%, 03/13/23 | 250,000 | 260,165 |
| 1.50%, 02/12/25 | 350,000 | 360,850 |
| 0.38%, 09/17/25 | 500,000 | 493,680 |
| 0.50%, 02/02/26 | 500,000 | 494,305 |
| | | 1,812,064 |
| Canada 0.0% |
| Export Development Canada |
| 1.38%, 10/21/21 | 250,000 | 250,447 |
| 2.00%, 05/17/22 | 150,000 | 152,015 |
| 1.75%, 07/18/22 | 400,000 | 405,756 |
| 2.50%, 01/24/23 | 150,000 | 154,880 |
| 1.38%, 02/24/23 | 350,000 | 356,233 |
| 2.75%, 03/15/23 | 200,000 | 207,832 |
| 2.63%, 02/21/24 | 250,000 | 263,812 |
| | | 1,790,975 |
| China 0.0% |
| Industrial & Commercial Bank of China Ltd. |
| 2.45%, 10/20/21 | 250,000 | 250,593 |
| Germany 0.4% |
| FMS Wertmanagement |
| 2.00%, 08/01/22 (i) | 450,000 | 457,700 |
| 2.75%, 03/06/23 (i) | 200,000 | 207,720 |
| Kreditanstalt Fuer Wiederaufbau |
| 1.75%, 09/15/21 (i) | 150,000 | 150,092 |
| 2.50%, 02/15/22 (i) | 775,000 | 783,401 |
| 1.75%, 08/22/22 (i) | 200,000 | 203,190 |
| 2.00%, 09/29/22 (i) | 1,000,000 | 1,020,240 |
| 2.00%, 10/04/22 (i) | 100,000 | 102,045 |
| 2.38%, 12/29/22 (i) | 650,000 | 669,220 |
| 2.13%, 01/17/23 (i) | 1,250,000 | 1,283,912 |
| 1.63%, 02/15/23 (i) | 750,000 | 765,945 |
| 0.25%, 04/25/23 (i) | 1,000,000 | 1,001,160 |
| 0.25%, 10/19/23 (i) | 1,000,000 | 999,600 |
| 2.63%, 02/28/24 (i) | 950,000 | 1,003,447 |
| 0.25%, 03/08/24 (i) | 1,000,000 | 997,370 |
| 1.38%, 08/05/24 (i) | 550,000 | 564,932 |
| 0.50%, 09/20/24 (i) | 1,000,000 | 1,001,130 |
| 2.50%, 11/20/24 (i) | 1,030,000 | 1,095,632 |
Schwab Taxable Bond Funds | Annual Report
Schwab U.S. Aggregate Bond Index Fund
Portfolio Holdings as of August 31, 2021 (continued)
Security
Rate, Maturity Date | Face
Amount ($) | Value ($) |
| 2.00%, 05/02/25 (i) | 450,000 | 473,053 |
| 0.38%, 07/18/25 (i) | 1,250,000 | 1,238,437 |
| 0.63%, 01/22/26 (i) | 1,000,000 | 995,590 |
| 2.88%, 04/03/28 (i) | 750,000 | 836,347 |
| 1.75%, 09/14/29 (i) | 400,000 | 416,960 |
| 0.75%, 09/30/30 (i) | 250,000 | 238,480 |
| 0.00%, 04/18/36 (i)(j) | 300,000 | 233,931 |
| 0.00%, 06/29/37 (i)(j) | 450,000 | 343,796 |
| Landwirtschaftliche Rentenbank |
| 1.75%, 09/24/21 (i) | 150,000 | 150,156 |
| 2.25%, 10/01/21 (i) | 250,000 | 250,443 |
| 2.00%, 01/13/25 (i) | 300,000 | 314,397 |
| 0.50%, 05/27/25 (i) | 300,000 | 298,587 |
| 2.38%, 06/10/25 (i) | 750,000 | 798,555 |
| 0.88%, 03/30/26 (i) | 250,000 | 251,260 |
| 1.75%, 07/27/26 (i) | 250,000 | 261,168 |
| 0.88%, 09/03/30 (i) | 500,000 | 480,785 |
| | | 19,888,681 |
| Japan 0.2% |
| Japan Bank for International Cooperation |
| 2.50%, 06/01/22 | 200,000 | 203,486 |
| 2.38%, 07/21/22 | 400,000 | 407,740 |
| 2.38%, 11/16/22 | 250,000 | 256,460 |
| 1.75%, 01/23/23 | 350,000 | 357,427 |
| 0.63%, 05/22/23 | 600,000 | 603,552 |
| 3.25%, 07/20/23 | 400,000 | 422,036 |
| 0.38%, 09/15/23 | 500,000 | 500,005 |
| 3.38%, 10/31/23 | 500,000 | 531,990 |
| 2.50%, 05/23/24 | 750,000 | 790,200 |
| 3.00%, 05/29/24 | 200,000 | 213,482 |
| 1.75%, 10/17/24 | 200,000 | 206,996 |
| 2.50%, 05/28/25 | 250,000 | 266,020 |
| 0.63%, 07/15/25 | 500,000 | 497,110 |
| 2.75%, 01/21/26 | 200,000 | 216,076 |
| 2.38%, 04/20/26 | 500,000 | 532,715 |
| 1.88%, 07/21/26 | 200,000 | 208,548 |
| 2.25%, 11/04/26 | 300,000 | 318,225 |
| 2.88%, 06/01/27 | 200,000 | 219,394 |
| 2.88%, 07/21/27 | 200,000 | 219,622 |
| 2.75%, 11/16/27 | 450,000 | 491,792 |
| 3.25%, 07/20/28 | 200,000 | 226,362 |
| 3.50%, 10/31/28 | 200,000 | 230,298 |
| 2.00%, 10/17/29 | 200,000 | 209,748 |
| 1.25%, 01/21/31 | 250,000 | 245,130 |
| 1.88%, 04/15/31 | 500,000 | 517,250 |
| Japan International Cooperation Agency |
| 2.13%, 10/20/26 | 200,000 | 211,094 |
| 2.75%, 04/27/27 | 200,000 | 217,980 |
| 1.00%, 07/22/30 | 380,000 | 365,347 |
| | | 9,686,085 |
| Norway 0.1% |
| Equinor A.S.A. |
| 2.75%, 11/10/21 | 150,000 | 150,720 |
| 3.15%, 01/23/22 | 200,000 | 202,264 |
| 2.45%, 01/17/23 | 100,000 | 102,966 |
| 2.65%, 01/15/24 | 150,000 | 157,403 |
| 3.70%, 03/01/24 | 393,000 | 423,729 |
| 2.88%, 04/06/25 (a) | 350,000 | 373,800 |
| 1.75%, 01/22/26 (a) | 300,000 | 309,135 |
| 3.00%, 04/06/27 (a) | 200,000 | 217,186 |
| 3.63%, 09/10/28 (a) | 400,000 | 453,044 |
| 3.13%, 04/06/30 (a) | 250,000 | 274,877 |
| 2.38%, 05/22/30 (a) | 500,000 | 520,330 |
| 3.63%, 04/06/40 (a) | 100,000 | 114,233 |
Security
Rate, Maturity Date | Face
Amount ($) | Value ($) |
| 5.10%, 08/17/40 | 114,000 | 153,571 |
| 4.25%, 11/23/41 | 100,000 | 123,104 |
| 3.95%, 05/15/43 | 150,000 | 177,241 |
| 4.80%, 11/08/43 | 100,000 | 131,760 |
| 3.25%, 11/18/49 (a) | 300,000 | 325,056 |
| 3.70%, 04/06/50 (a) | 250,000 | 293,495 |
| | | 4,503,914 |
| Republic of Korea 0.1% |
| Export-Import Bank of Korea |
| 2.75%, 01/25/22 | 350,000 | 353,353 |
| 4.00%, 01/14/24 | 500,000 | 541,785 |
| 2.38%, 06/25/24 | 200,000 | 210,636 |
| 2.88%, 01/21/25 | 400,000 | 426,680 |
| 0.75%, 09/21/25 | 1,000,000 | 993,580 |
| 3.25%, 11/10/25 | 750,000 | 821,925 |
| 1.25%, 09/21/30 | 500,000 | 483,885 |
| The Korea Development Bank |
| 3.00%, 09/14/22 | 488,000 | 501,332 |
| 3.75%, 01/22/24 | 500,000 | 538,960 |
| 2.13%, 10/01/24 | 250,000 | 262,360 |
| 3.00%, 01/13/26 | 200,000 | 217,520 |
| | | 5,352,016 |
| Sweden 0.1% |
| Svensk Exportkredit AB |
| 1.63%, 11/14/22 | 200,000 | 203,462 |
| 2.88%, 03/14/23 | 750,000 | 780,360 |
| 0.25%, 09/29/23 | 200,000 | 199,710 |
| 1.75%, 12/12/23 | 500,000 | 515,820 |
| 0.38%, 07/30/24 | 400,000 | 398,552 |
| 0.63%, 05/14/25 | 275,000 | 274,538 |
| 0.50%, 08/26/25 | 350,000 | 347,053 |
| | | 2,719,495 |
| | | 46,003,823 |
| U.S. 1.4% |
| Fannie Mae |
| 1.38%, 09/06/22 | 500,000 | 506,665 |
| 2.38%, 01/19/23 | 2,100,000 | 2,164,932 |
| 0.25%, 05/22/23 | 3,000,000 | 3,005,220 |
| 2.50%, 02/05/24 | 1,300,000 | 1,370,486 |
| 1.75%, 07/02/24 | 1,000,000 | 1,038,630 |
| 2.63%, 09/06/24 | 1,830,000 | 1,953,873 |
| 1.63%, 01/07/25 | 3,500,000 | 3,639,405 |
| 0.63%, 04/22/25 | 1,000,000 | 1,003,270 |
| 0.50%, 06/17/25 | 2,000,000 | 1,994,680 |
| 2.13%, 04/24/26 | 1,000,000 | 1,063,740 |
| 1.88%, 09/24/26 | 1,000,000 | 1,054,290 |
| 6.03%, 10/08/27 | 164,000 | 212,491 |
| 6.63%, 11/15/30 | 2,180,000 | 3,168,020 |
| 5.63%, 07/15/37 | 500,000 | 769,275 |
| Federal Farm Credit Banks Funding Corp. |
| 0.13%, 02/03/23 | 600,000 | 600,114 |
| 0.25%, 02/26/24 | 800,000 | 799,104 |
| Federal Home Loan Bank |
| 1.88%, 12/09/22 | 3,640,000 | 3,721,536 |
| 1.38%, 02/17/23 | 1,000,000 | 1,018,680 |
| 2.50%, 02/13/24 | 1,300,000 | 1,370,980 |
| 1.50%, 08/15/24 | 4,000,000 | 4,132,440 |
| 0.50%, 04/14/25 | 1,000,000 | 999,760 |
| 0.88%, 06/12/26 | 500,000 | 502,645 |
| 3.25%, 11/16/28 | 2,850,000 | 3,264,618 |
| 5.50%, 07/15/36 | 330,000 | 493,904 |
Schwab Taxable Bond Funds | Annual Report
Schwab U.S. Aggregate Bond Index Fund
Portfolio Holdings as of August 31, 2021 (continued)
Security
Rate, Maturity Date | Face
Amount ($) | Value ($) |
| Federal Home Loan Mortgage Corp. |
| 0.38%, 05/05/23 | 2,000,000 | 2,007,340 |
| 0.25%, 09/08/23 | 1,000,000 | 1,000,830 |
| 0.13%, 10/16/23 | 2,500,000 | 2,494,975 |
| 0.25%, 11/06/23 | 3,500,000 | 3,500,875 |
| 0.25%, 12/04/23 | 1,000,000 | 999,980 |
| 0.38%, 09/23/25 | 2,000,000 | 1,980,060 |
| Federal National Mortgage Association |
| 0.25%, 07/10/23 | 3,000,000 | 3,003,870 |
| 0.25%, 11/27/23 | 1,000,000 | 1,000,700 |
| 0.38%, 08/25/25 | 1,500,000 | 1,486,500 |
| 0.50%, 11/07/25 | 2,000,000 | 1,988,080 |
| 0.75%, 10/08/27 | 500,000 | 492,950 |
| 0.88%, 08/05/30 | 1,000,000 | 958,520 |
| Freddie Mac |
| 2.75%, 06/19/23 | 500,000 | 523,065 |
| 0.25%, 06/26/23 | 4,000,000 | 4,004,880 |
| 0.25%, 08/24/23 | 5,000,000 | 5,005,100 |
| 1.50%, 02/12/25 | 4,000,000 | 4,137,400 |
| 0.38%, 07/21/25 | 1,000,000 | 991,920 |
| 6.75%, 03/15/31 | 200,000 | 296,148 |
| 6.25%, 07/15/32 | 1,100,000 | 1,634,721 |
| Tennessee Valley Authority |
| 2.88%, 09/15/24 | 500,000 | 536,510 |
| 4.65%, 06/15/35 | 655,000 | 875,342 |
| 4.63%, 09/15/60 | 150,000 | 228,909 |
| | | 78,997,433 |
| | | 125,001,256 |
| |
| Local Authority 0.9% |
| Foreign 0.3% |
| Canada 0.3% |
| Hydro-Quebec |
| 8.05%, 07/07/24 | 350,000 | 421,375 |
| 8.50%, 12/01/29 | 100,000 | 152,491 |
| Province of Alberta |
| 3.35%, 11/01/23 | 359,000 | 382,012 |
| 2.95%, 01/23/24 | 250,000 | 265,045 |
| 1.88%, 11/13/24 | 550,000 | 572,561 |
| 1.00%, 05/20/25 | 400,000 | 404,164 |
| 3.30%, 03/15/28 | 500,000 | 563,720 |
| 1.35%, 05/28/30 | 250,000 | 247,708 |
| 1.30%, 07/22/30 | 650,000 | 633,717 |
| Province of British Columbia |
| 2.65%, 09/22/21 | 100,000 | 100,144 |
| 2.00%, 10/23/22 | 350,000 | 357,262 |
| 1.75%, 09/27/24 | 400,000 | 415,228 |
| 2.25%, 06/02/26 | 150,000 | 159,902 |
| 0.90%, 07/20/26 | 300,000 | 300,945 |
| 1.30%, 01/29/31 | 500,000 | 492,865 |
| Province of Manitoba |
| 3.05%, 05/14/24 | 324,000 | 345,980 |
| 2.13%, 06/22/26 | 330,000 | 348,487 |
| Province of New Brunswick |
| 3.63%, 02/24/28 | 150,000 | 172,599 |
| Province of Ontario |
| 2.50%, 09/10/21 | 200,000 | 200,106 |
| 2.40%, 02/08/22 | 250,000 | 252,468 |
| 2.20%, 10/03/22 | 400,000 | 408,764 |
| 1.75%, 01/24/23 | 600,000 | 612,972 |
| 3.40%, 10/17/23 | 450,000 | 479,295 |
| 3.05%, 01/29/24 | 500,000 | 531,780 |
| 3.20%, 05/16/24 | 200,000 | 214,670 |
Security
Rate, Maturity Date | Face
Amount ($) | Value ($) |
| 0.63%, 01/21/26 | 250,000 | 248,108 |
| 1.05%, 04/14/26 | 500,000 | 504,640 |
| 2.50%, 04/27/26 | 200,000 | 214,998 |
| 2.30%, 06/15/26 | 200,000 | 213,276 |
| 1.05%, 05/21/27 | 450,000 | 449,680 |
| 2.00%, 10/02/29 | 200,000 | 209,332 |
| 1.13%, 10/07/30 | 500,000 | 483,305 |
| 1.60%, 02/25/31 | 250,000 | 250,680 |
| 1.90%, 04/21/31 | 250,000 | 258,062 |
| Province of Quebec |
| 2.63%, 02/13/23 | 250,000 | 258,760 |
| 2.50%, 04/09/24 | 150,000 | 158,007 |
| 2.88%, 10/16/24 | 300,000 | 321,870 |
| 1.50%, 02/11/25 | 350,000 | 360,349 |
| 0.60%, 07/23/25 | 1,200,000 | 1,195,584 |
| 2.50%, 04/20/26 | 450,000 | 484,281 |
| 2.75%, 04/12/27 | 200,000 | 218,670 |
| 7.50%, 09/15/29 | 421,000 | 611,023 |
| | | 15,476,885 |
| U.S. 0.6% |
| American Municipal Power, Inc. |
| RB (Build America Bonds) Series 2010 | | |
| 6.27%, 02/15/50 | 100,000 | 144,156 |
| 8.08%, 02/15/50 | 250,000 | 475,282 |
| Bay Area Toll Authority |
| 2.57%, 04/01/31 | 200,000 | 213,192 |
| San Francisco Bay Area Toll Bridge RB (Build America Bonds) Series 2009F2 | | |
| 6.26%, 04/01/49 | 400,000 | 655,620 |
| San Francisco Bay Area Toll Bridge RB (Build America Bonds) Series 2010S3 | | |
| 6.91%, 10/01/50 | 230,000 | 416,141 |
| Board of Regents of the University of Texas System |
| 3.35%, 08/15/47 (a) | 250,000 | 293,805 |
| California |
| GO (Build America Bonds) Series 2009 | | |
| 7.50%, 04/01/34 | 900,000 | 1,416,402 |
| 7.55%, 04/01/39 | 400,000 | 686,996 |
| 7.30%, 10/01/39 | 500,000 | 806,187 |
| 7.35%, 11/01/39 | 200,000 | 324,967 |
| California State University |
| 2.98%, 11/01/51 (a) | 200,000 | 208,580 |
| Series 2017B | | |
| 3.90%, 11/01/47 (a) | 50,000 | 60,271 |
| Chicago O'Hare International Airport |
| RB (Build America Bonds) Series 2010 | | |
| 6.40%, 01/01/40 | 100,000 | 153,305 |
| RB Series 2018C | | |
| 4.47%, 01/01/49 | 150,000 | 198,275 |
| Chicago Transit Authority Sales & Transfer Tax Receipts Revenue |
| RB Bonds (Pension Funding) Series 2008 | | |
| 6.90%, 12/01/40 | 750,000 | 1,079,800 |
| City of Atlanta GA Water & Wastewater Revenue |
| Wstwtr Revenu Atlutl 11/35 Fixed 2.257 | | |
| 2.26%, 11/01/35 (a) | 125,000 | 127,539 |
Schwab Taxable Bond Funds | Annual Report
Schwab U.S. Aggregate Bond Index Fund
Portfolio Holdings as of August 31, 2021 (continued)
Security
Rate, Maturity Date | Face
Amount ($) | Value ($) |
| City of Houston TX |
| GO Bonds (Pension Funding) Series 2017 | | |
| 3.96%, 03/01/47 | 120,000 | 142,981 |
| City of New York |
| 6.27%, 12/01/37 | 200,000 | 294,979 |
| City of San Antonio TX Electric & Gas Systems |
| RB (Build America Bonds) Series 2009 | | |
| 5.99%, 02/01/39 | 190,000 | 274,291 |
| City of San Antonio TX Electric & Gas Systems Revenue |
| 2.91%, 02/01/48 (a) | 125,000 | 126,119 |
| City of San Francisco CA Public Utilities Commission |
| RB Series 2020A | | |
| 3.30%, 11/01/39 (a) | 150,000 | 162,822 |
| RB Series 2020E | | |
| 2.83%, 11/01/41 (a) | 100,000 | 103,638 |
| Commonwealth of Massachusetts |
| GO (Build America Bonds) Series 2009 | | |
| 5.46%, 12/01/39 | 100,000 | 140,459 |
| GO Series 2019D | | |
| 2.66%, 09/01/39 | 145,000 | 153,632 |
| 2.81%, 09/01/43 | 100,000 | 105,365 |
| GO Series 2019H | | |
| 2.90%, 09/01/49 | 100,000 | 107,827 |
| GO Series 2020C | | |
| 2.51%, 07/01/41 (a) | 185,000 | 186,154 |
| Commonwealth of Massachusetts Transportation Fund |
| RB (Build America Bonds) Series 2010 | | |
| 5.73%, 06/01/40 | 100,000 | 139,355 |
| Commonwealth of Pennsylvania Financing Authority |
| RB Series 2016A | | |
| 4.14%, 06/01/38 | 200,000 | 237,927 |
| Connecticut |
| GO (Teachers' Retirement Fund) Series 2008A | | |
| 5.85%, 03/15/32 | 250,000 | 332,485 |
| County of Clark Department of Aviation |
| RB (Build America Bonds) Series 2010C | | |
| 6.82%, 07/01/45 | 150,000 | 240,764 |
| County of Miami-Dade FL Water & Sewer System |
| RB Series 2019C | | |
| 3.49%, 10/01/42 (a) | 100,000 | 107,965 |
| Dallas Area Rapid Transit |
| RB (Build America Bonds) Series 2009B | | |
| 6.00%, 12/01/44 | 140,000 | 217,836 |
| Dallas County Hospital District |
| GO (Build America Bonds) Series 2009C | | |
| 5.62%, 08/15/44 | 100,000 | 142,917 |
| Dallas/Fort Worth International Airport |
| RB Series 2019A | | |
| 2.99%, 11/01/38 | 100,000 | 108,365 |
| RB Series 2020C | | |
| 3.09%, 11/01/40 (a) | 250,000 | 261,056 |
| 2.92%, 11/01/50 | 250,000 | 255,977 |
| District of Columbia Water & Sewer Authority |
| 4.81%, 10/01/14 | 100,000 | 148,516 |
Security
Rate, Maturity Date | Face
Amount ($) | Value ($) |
| East Bay Municipal Utility District Water System |
| Water System RB (Build America Bonds) Series 2010 | | |
| 5.87%, 06/01/40 | 330,000 | 481,849 |
| Foothill-Eastern Transportation Corridor Agency |
| RB Series 2019A | | |
| 3.92%, 01/15/53 (a) | 100,000 | 106,989 |
| Grand Parkway Transportation Corp. |
| RB Series 2013E | | |
| 5.18%, 10/01/42 | 100,000 | 136,682 |
| Health & Educational Facilities Authority of the State of Missouri |
| 3.23%, 05/15/50 (a) | 150,000 | 168,666 |
| Illinois |
| GO Bonds (Pension Funding) Series 2003 | | |
| 5.10%, 06/01/33 | 1,537,000 | 1,820,968 |
| GO Bonds (Pension Funding) Series 2010 | | |
| 6.73%, 04/01/35 | 110,000 | 139,594 |
| Illinois State Toll Highway Authority |
| 6.18%, 01/01/34 | 100,000 | 141,791 |
| JobsOhio Beverage System |
| 4.53%, 01/01/35 | 300,000 | 374,236 |
| Statewide Senior Lien Liquor Profits RB Series 2013B | | |
| 3.99%, 01/01/29 | 490,000 | 556,676 |
| Kansas Development Finance Authority |
| 4.93%, 04/15/45 | 100,000 | 133,207 |
| Los Angeles Community College District/CA |
| 1.61%, 08/01/28 | 275,000 | 280,560 |
| 2.11%, 08/01/32 (a) | 250,000 | 256,345 |
| Los Angeles Department of Water & Power Power System |
| 5.72%, 07/01/39 | 100,000 | 143,981 |
| RB (Build America Bonds) Series 2010 | | |
| 6.57%, 07/01/45 | 200,000 | 331,730 |
| Los Angeles Unified School District |
| GO (Build America Bonds) Series 2009 | | |
| 5.75%, 07/01/34 | 250,000 | 338,399 |
| GO (Build America Bonds) Series 2010 | | |
| 6.76%, 07/01/34 | 500,000 | 721,320 |
| Maryland Health & Higher Educational Facilities Authority |
| RB Series 2020D | | |
| 3.05%, 07/01/40 (a) | 150,000 | 160,765 |
| 3.20%, 07/01/50 | 150,000 | 158,834 |
| Massachusetts School Building Authority |
| RB Series 2020B | | |
| 1.75%, 08/15/30 | 500,000 | 504,592 |
| Metropolitan Government Nashville & Davidson County Health & Educational Facs Board |
| RB (Build America Bonds) Series 2016B | | |
| 4.05%, 07/01/26 (a) | 130,000 | 144,801 |
| Metropolitan Transportation Authority |
| RB (Build America Bonds) Series 2009 | | |
| 7.34%, 11/15/39 | 200,000 | 329,328 |
| RB (Build America Bonds) Series 2010E | | |
| 6.81%, 11/15/40 | 330,000 | 490,588 |
Schwab Taxable Bond Funds | Annual Report
Schwab U.S. Aggregate Bond Index Fund
Portfolio Holdings as of August 31, 2021 (continued)
Security
Rate, Maturity Date | Face
Amount ($) | Value ($) |
| Michigan Finance Authority |
| RB Series 2019T | | |
| 3.38%, 12/01/40 | 200,000 | 223,588 |
| Michigan State Building Authority |
| 2.71%, 10/15/40 (a) | 250,000 | 250,538 |
| Municipal Electric Authority of Georgia |
| 7.06%, 04/01/57 | 300,000 | 447,573 |
| RB (Build America Bonds) Series 2010 | | |
| 6.64%, 04/01/57 | 146,000 | 224,214 |
| RB (Build America Bonds) Series 2010 | | |
| 6.66%, 04/01/57 | 146,000 | 228,951 |
| New Jersey Economic Development Authority |
| RB Bonds (Pension Funding) Series 1997A | | |
| 7.43%, 02/15/29 | 250,000 | 323,597 |
| New Jersey Transportation Trust Fund Authority |
| RB (Build America Bonds) Series 2010C | | |
| 5.75%, 12/15/28 | 330,000 | 397,739 |
| RB Series 2019B | | |
| 4.13%, 06/15/42 | 200,000 | 228,458 |
| New Jersey Turnpike Authority |
| RB (Build America Bonds) Series 2009F | | |
| 7.41%, 01/01/40 | 350,000 | 583,838 |
| RB (Build America Bonds) Series 2010A | | |
| 7.10%, 01/01/41 | 350,000 | 566,692 |
| New York City Transitional Finance Authority |
| RB (Build America Bonds) Series 2010 | | |
| 5.57%, 11/01/38 | 200,000 | 268,082 |
| New York City Water & Sewer System |
| RB (Build America Bonds) Series 2010 | | |
| 5.72%, 06/15/42 | 125,000 | 189,931 |
| Water and Sewer Systems Second General Resolution RB (Build America Bonds) Series 2011CC | | |
| 5.88%, 06/15/44 | 100,000 | 156,821 |
| Water System RB (Build America Bonds) Series 2010 | | |
| 6.01%, 06/15/42 | 250,000 | 387,717 |
| New York State Dormitory Authority |
| RB (Build America Bonds) Series 2010 | | |
| 5.60%, 03/15/40 | 50,000 | 69,341 |
| RB Series 2009F | | |
| 5.63%, 03/15/39 | 100,000 | 133,378 |
| RB Series 2019B | | |
| 3.14%, 07/01/43 | 220,000 | 231,967 |
| New York State Urban Development Corp. |
| RB (Build America Bonds) Series 2009 | | |
| 5.77%, 03/15/39 | 100,000 | 125,905 |
| North Texas Tollway Authority |
| RB (Build America Bonds) Series 2009 | | |
| 6.72%, 01/01/49 | 150,000 | 256,347 |
Security
Rate, Maturity Date | Face
Amount ($) | Value ($) |
| Oregon |
| GO Bonds (Pension Funding) Series 2003 | | |
| 5.89%, 06/01/27 | 430,000 | 521,615 |
| Oregon School Boards Association |
| GO Bonds (Pension Funding) Series 2002B | | |
| 5.55%, 06/30/28 | 240,000 | 287,793 |
| Port Authority of New York & New Jersey |
| Consolidated Bonds 164th Series | | |
| 5.65%, 11/01/40 | 150,000 | 214,657 |
| Consolidated Bonds 165th Series | | |
| 5.65%, 11/01/40 | 100,000 | 143,580 |
| Consolidated Bonds 168th Series | | |
| 4.93%, 10/01/51 | 200,000 | 282,758 |
| Consolidated Bonds 181th Series | | |
| 4.96%, 08/01/46 | 100,000 | 138,172 |
| Consolidated Bonds 192th Series | | |
| 4.81%, 10/15/65 | 170,000 | 239,967 |
| Consolidated Bonds AAA Series | | |
| 1.09%, 07/01/23 | 400,000 | 405,590 |
| New Je Portrn 08/69 Fixed 3.287 | | |
| 3.29%, 08/01/69 | 100,000 | 111,800 |
| RB (Build America Bonds) Series 2012 | | |
| 4.46%, 10/01/62 | 450,000 | 619,816 |
| Regents of the University of California Medical Center Pooled Revenue |
| 6.55%, 05/15/48 | 100,000 | 156,286 |
| 6.58%, 05/15/49 | 75,000 | 116,834 |
| Regional Transportation District Sales Tax Revenue |
| RB (Build America Bonds) Series 2010B | | |
| 5.84%, 11/01/50 | 50,000 | 81,902 |
| Rutgers The State University of New Jersey |
| GO Series 2019P | | |
| 3.92%, 05/01/19 (a) | 100,000 | 116,459 |
| Sales Tax Securitization Corp. |
| 3.59%, 01/01/43 | 15,000 | 16,547 |
| RB Series 2018B | | |
| 3.82%, 01/01/48 | 150,000 | 170,513 |
| San Diego County Regional Transportation Commission |
| RB Series 2019A | | |
| 3.25%, 04/01/48 (a) | 150,000 | 158,957 |
| San Diego County Water Authority., Class B |
| 6.14%, 05/01/49 | 100,000 | 154,289 |
| San Jose Redevelopment Agency Successor Agency |
| Tax Allocation Series 2017A-T | | |
| 3.38%, 08/01/34 (a) | 100,000 | 108,326 |
| Santa Clara Valley Transportation Authority |
| RB (Build America Bonds) Series 2010 | | |
| 5.88%, 04/01/32 | 100,000 | 125,516 |
| State Board of Administration Finance Corp. |
| 1.26%, 07/01/25 | 300,000 | 303,385 |
| 1.71%, 07/01/27 | 400,000 | 408,640 |
| 2.15%, 07/01/30 | 600,000 | 617,439 |
| State of California |
| 2.38%, 10/01/26 | 175,000 | 185,690 |
| 7.63%, 03/01/40 | 300,000 | 509,704 |
| GO Bonds | | |
| 7.60%, 11/01/40 | 300,000 | 533,665 |
| State of Illinois |
| GO (Build America Bonds) Series 2010 | | |
| 7.35%, 07/01/35 | 100,000 | 129,335 |
Schwab Taxable Bond Funds | Annual Report
Schwab U.S. Aggregate Bond Index Fund
Portfolio Holdings as of August 31, 2021 (continued)
Security
Rate, Maturity Date | Face
Amount ($) | Value ($) |
| State of Washington |
| 5.14%, 08/01/40 | 100,000 | 139,753 |
| Texas |
| GO (Build America Bonds) Series 2009A | | |
| 5.52%, 04/01/39 | 580,000 | 839,347 |
| Texas Private Activity Bond Surface Transportation Corp. |
| RB Series 2019B | | |
| 3.92%, 12/31/49 | 150,000 | 170,214 |
| Texas Transportation Commission |
| GO Bonds Series 2020 | | |
| 2.47%, 10/01/44 (a) | 400,000 | 401,416 |
| The Ohio State University |
| RB (Build America Bonds) Series 2010 | | |
| 4.91%, 06/01/40 | 300,000 | 411,711 |
| RB Series 2016A | | |
| 3.80%, 12/01/46 | 100,000 | 122,100 |
| The Pennsylvania State University |
| 2.84%, 09/01/50 | 150,000 | 157,587 |
| University of California |
| 0.88%, 05/15/25 (a) | 500,000 | 504,970 |
| 4.60%, 05/15/31 | 100,000 | 118,966 |
| RB (Build America Bonds) Series 2009 | | |
| 5.77%, 05/15/43 | 500,000 | 711,147 |
| RB Series 2012AD | | |
| 4.86%, 05/15/12 | 100,000 | 147,079 |
| RB Series 2015AQ | | |
| 4.77%, 05/15/15 | 150,000 | 216,572 |
| RB Series 2020BG | | |
| 1.32%, 05/15/27 (a) | 195,000 | 197,346 |
| 1.61%, 05/15/30 (a) | 250,000 | 248,826 |
| University of Michigan |
| 2.44%, 04/01/40 (a) | 250,000 | 256,869 |
| University of Pittsburgh-of the Commonwealth System of Higher Education |
| GO Bonds Series 2019A | | |
| 3.56%, 09/15/19 (a) | 100,000 | 111,909 |
| University of Virginia |
| RB Series 2017C | | |
| 4.18%, 09/01/17 (a) | 100,000 | 133,045 |
| RB Series 2020 | | |
| 2.26%, 09/01/50 (a) | 400,000 | 374,318 |
| Westchester County Local Development Corp. |
| RB Series 2020 | | |
| 3.85%, 11/01/50 (a) | 250,000 | 265,475 |
| | | 36,856,411 |
| | | 52,333,296 |
| |
| Sovereign 1.1% |
| Canada 0.0% |
| Canada Government International Bond |
| 2.00%, 11/15/22 | 300,000 | 306,708 |
| 1.63%, 01/22/25 | 650,000 | 674,394 |
| 0.75%, 05/19/26 | 250,000 | 249,978 |
| | | 1,231,080 |
| Chile 0.1% |
| Chile Government International Bond |
| 3.13%, 03/27/25 | 200,000 | 214,518 |
| 3.13%, 01/21/26 | 200,000 | 216,458 |
| 3.24%, 02/06/28 (a) | 450,000 | 489,766 |
| 2.45%, 01/31/31 (a) | 300,000 | 308,328 |
Security
Rate, Maturity Date | Face
Amount ($) | Value ($) |
| 2.55%, 01/27/32 (a) | 400,000 | 412,000 |
| 2.55%, 07/27/33 (a) | 500,000 | 510,345 |
| 3.10%, 05/07/41 (a) | 550,000 | 562,056 |
| 3.63%, 10/30/42 | 150,000 | 163,419 |
| 3.86%, 06/21/47 | 200,000 | 227,202 |
| 3.50%, 01/25/50 (a) | 500,000 | 537,375 |
| 3.10%, 01/22/61 (a) | 450,000 | 440,762 |
| | | 4,082,229 |
| Hungary 0.0% |
| Hungary Government International Bond |
| 5.38%, 02/21/23 | 500,000 | 536,670 |
| 5.75%, 11/22/23 | 300,000 | 334,626 |
| 5.38%, 03/25/24 | 300,000 | 336,216 |
| 7.63%, 03/29/41 | 350,000 | 596,641 |
| | | 1,804,153 |
| Indonesia 0.1% |
| Indonesia Government International Bond |
| 2.95%, 01/11/23 | 150,000 | 155,067 |
| 3.50%, 01/11/28 | 200,000 | 220,490 |
| 4.10%, 04/24/28 | 250,000 | 284,888 |
| 4.75%, 02/11/29 | 200,000 | 236,606 |
| 3.40%, 09/18/29 | 450,000 | 492,102 |
| 2.85%, 02/14/30 | 1,000,000 | 1,051,360 |
| 3.85%, 10/15/30 | 300,000 | 339,918 |
| 4.35%, 01/11/48 | 400,000 | 464,340 |
| 5.35%, 02/11/49 | 200,000 | 263,482 |
| 3.70%, 10/30/49 | 300,000 | 320,037 |
| 3.50%, 02/14/50 | 200,000 | 209,342 |
| 4.20%, 10/15/50 | 250,000 | 289,097 |
| 3.05%, 03/12/51 | 200,000 | 198,830 |
| 4.45%, 04/15/70 | 200,000 | 238,924 |
| 3.35%, 03/12/71 | 200,000 | 196,552 |
| | | 4,961,035 |
| Israel 0.1% |
| Israel Government International Bond |
| 3.15%, 06/30/23 | 500,000 | 524,975 |
| 2.88%, 03/16/26 | 200,000 | 215,916 |
| 3.25%, 01/17/28 | 200,000 | 221,208 |
| 2.75%, 07/03/30 | 350,000 | 377,398 |
| 4.50%, 01/30/43 | 500,000 | 638,190 |
| 4.13%, 01/17/48 | 200,000 | 247,288 |
| 3.88%, 07/03/50 | 500,000 | 590,705 |
| 4.50%, 04/03/20 | 200,000 | 259,822 |
| State of Israel |
| 2.50%, 01/15/30 | 200,000 | 211,662 |
| 3.38%, 01/15/50 | 350,000 | 382,840 |
| | | 3,670,004 |
| Italy 0.1% |
| Republic of Italy Government International Bond |
| 6.88%, 09/27/23 | 730,000 | 822,374 |
| 0.88%, 05/06/24 | 250,000 | 249,905 |
| 2.38%, 10/17/24 | 550,000 | 572,654 |
| 1.25%, 02/17/26 | 700,000 | 695,569 |
| 2.88%, 10/17/29 | 675,000 | 713,097 |
| 5.38%, 06/15/33 | 250,000 | 321,423 |
| 4.00%, 10/17/49 | 550,000 | 631,372 |
| 3.88%, 05/06/51 | 250,000 | 281,803 |
| | | 4,288,197 |
Schwab Taxable Bond Funds | Annual Report
Schwab U.S. Aggregate Bond Index Fund
Portfolio Holdings as of August 31, 2021 (continued)
Security
Rate, Maturity Date | Face
Amount ($) | Value ($) |
| Mexico 0.3% |
| Mexico Government International Bond |
| 8.00%, 09/24/22 | 150,000 | 163,529 |
| 4.00%, 10/02/23 (e) | 108,000 | 116,328 |
| 3.60%, 01/30/25 | 750,000 | 823,890 |
| 3.90%, 04/27/25 (a) | 200,000 | 221,904 |
| 4.13%, 01/21/26 | 288,000 | 326,287 |
| 4.15%, 03/28/27 | 500,000 | 571,855 |
| 3.75%, 01/11/28 | 400,000 | 443,436 |
| 4.50%, 04/22/29 | 600,000 | 688,218 |
| 3.25%, 04/16/30 (a) | 900,000 | 947,781 |
| 2.66%, 05/24/31 (a) | 400,000 | 396,876 |
| 8.30%, 08/15/31 | 150,000 | 223,740 |
| 4.75%, 04/27/32 (a) | 700,000 | 812,427 |
| 6.75%, 09/27/34 | 362,000 | 490,568 |
| 6.05%, 01/11/40 | 900,000 | 1,150,614 |
| 4.28%, 08/14/41 (a) | 400,000 | 429,500 |
| 4.75%, 03/08/44 | 950,000 | 1,071,001 |
| 5.55%, 01/21/45 | 750,000 | 925,455 |
| 4.60%, 01/23/46 | 450,000 | 495,193 |
| 4.35%, 01/15/47 | 300,000 | 320,448 |
| 4.60%, 02/10/48 | 400,000 | 439,012 |
| 4.50%, 01/31/50 (a) | 675,000 | 735,703 |
| 5.00%, 04/27/51 (a) | 650,000 | 759,070 |
| 3.77%, 05/24/61 (a) | 600,000 | 573,360 |
| 5.75%, 10/12/10 | 420,000 | 513,765 |
| | | 13,639,960 |
| Panama 0.1% |
| Panama Government International Bond |
| 4.00%, 09/22/24 (a) | 400,000 | 433,756 |
| 3.75%, 03/16/25 (a) | 300,000 | 325,290 |
| 8.88%, 09/30/27 | 250,000 | 346,465 |
| 3.88%, 03/17/28 (a) | 600,000 | 665,304 |
| 9.38%, 04/01/29 | 100,000 | 148,682 |
| 3.16%, 01/23/30 (a) | 200,000 | 212,484 |
| 2.25%, 09/29/32 (a) | 1,000,000 | 977,540 |
| 6.70%, 01/26/36 | 131,000 | 180,066 |
| 4.50%, 05/15/47 | 250,000 | 287,658 |
| 4.50%, 04/16/50 (a) | 400,000 | 459,112 |
| 4.30%, 04/29/53 | 200,000 | 224,304 |
| 4.50%, 04/01/56 (a) | 550,000 | 629,821 |
| 3.87%, 07/23/60 (a) | 850,000 | 879,682 |
| | | 5,770,164 |
| Peru 0.1% |
| Peruvian Government International Bond |
| 7.35%, 07/21/25 | 250,000 | 306,070 |
| 2.39%, 01/23/26 (a) | 200,000 | 207,410 |
| 4.13%, 08/25/27 | 450,000 | 507,258 |
| 2.84%, 06/20/30 | 150,000 | 155,283 |
| 2.78%, 01/23/31 (a) | 900,000 | 921,276 |
| 1.86%, 12/01/32 (a) | 500,000 | 471,185 |
| 8.75%, 11/21/33 | 450,000 | 709,713 |
| 6.55%, 03/14/37 | 300,000 | 416,313 |
| 3.30%, 03/11/41 (a) | 250,000 | 254,390 |
| 5.63%, 11/18/50 | 395,000 | 551,175 |
| 3.55%, 03/10/51 (a)(e) | 200,000 | 208,788 |
| 2.78%, 12/01/60 (a) | 250,000 | 225,328 |
| 3.23%, 07/28/21 (a) | 250,000 | 220,505 |
| | | 5,154,694 |
Security
Rate, Maturity Date | Face
Amount ($) | Value ($) |
| Philippines 0.1% |
| Philippine Government International Bond |
| 4.20%, 01/21/24 | 400,000 | 433,680 |
| 10.63%, 03/16/25 | 300,000 | 403,269 |
| 5.50%, 03/30/26 | 600,000 | 719,466 |
| 3.00%, 02/01/28 | 400,000 | 435,856 |
| 3.75%, 01/14/29 | 400,000 | 456,612 |
| 9.50%, 02/02/30 | 250,000 | 396,007 |
| 2.46%, 05/05/30 | 200,000 | 211,154 |
| 7.75%, 01/14/31 | 350,000 | 519,281 |
| 6.38%, 01/15/32 | 300,000 | 416,682 |
| 6.38%, 10/23/34 | 600,000 | 854,610 |
| 3.95%, 01/20/40 | 600,000 | 684,390 |
| 3.70%, 03/01/41 | 750,000 | 830,475 |
| 3.70%, 02/02/42 | 400,000 | 443,216 |
| 2.95%, 05/05/45 | 200,000 | 201,284 |
| 3.20%, 07/06/46 | 500,000 | 516,155 |
| | | 7,522,137 |
| Poland 0.0% |
| Republic of Poland Government International Bond |
| 3.00%, 03/17/23 | 400,000 | 416,876 |
| 4.00%, 01/22/24 | 450,000 | 488,174 |
| 3.25%, 04/06/26 | 450,000 | 496,759 |
| | | 1,401,809 |
| Republic of Korea 0.0% |
| Korea International Bond |
| 3.88%, 09/11/23 | 200,000 | 214,202 |
| 2.00%, 06/19/24 | 200,000 | 208,394 |
| 5.63%, 11/03/25 | 232,000 | 276,744 |
| 2.75%, 01/19/27 | 250,000 | 271,485 |
| 3.50%, 09/20/28 | 200,000 | 227,942 |
| 2.50%, 06/19/29 | 200,000 | 215,544 |
| 4.13%, 06/10/44 | 200,000 | 262,918 |
| | | 1,677,229 |
| Uruguay 0.1% |
| Uruguay Government International Bond |
| 4.50%, 08/14/24 | 113,000 | 122,193 |
| 4.38%, 10/27/27 | 500,000 | 580,640 |
| 4.38%, 01/23/31 (a) | 350,000 | 413,392 |
| 7.63%, 03/21/36 | 350,000 | 537,292 |
| 4.13%, 11/20/45 | 150,000 | 180,788 |
| 5.10%, 06/18/50 | 750,000 | 1,004,242 |
| 4.98%, 04/20/55 | 600,000 | 792,318 |
| | | 3,630,865 |
| | | 58,833,556 |
| |
| Supranational* 1.4% |
| African Development Bank |
| 1.63%, 09/16/22 | 500,000 | 507,725 |
| 2.13%, 11/16/22 | 800,000 | 819,232 |
| 0.75%, 04/03/23 | 500,000 | 504,395 |
| 3.00%, 09/20/23 | 250,000 | 263,913 |
| 0.88%, 03/23/26 | 250,000 | 251,248 |
| 0.88%, 07/22/26 | 500,000 | 501,220 |
| Asian Development Bank |
| 1.88%, 02/18/22 | 250,000 | 252,053 |
| 1.88%, 07/19/22 | 650,000 | 660,211 |
| 1.88%, 08/10/22 | 600,000 | 609,984 |
| 1.75%, 09/13/22 | 500,000 | 508,365 |
| 1.63%, 01/24/23 | 450,000 | 459,202 |
| 2.75%, 03/17/23 | 600,000 | 623,856 |
Schwab Taxable Bond Funds | Annual Report
Schwab U.S. Aggregate Bond Index Fund
Portfolio Holdings as of August 31, 2021 (continued)
Security
Rate, Maturity Date | Face
Amount ($) | Value ($) |
| 0.25%, 07/14/23 | 750,000 | 750,480 |
| 0.25%, 10/06/23 | 1,000,000 | 999,530 |
| 2.63%, 01/30/24 | 450,000 | 474,763 |
| 0.38%, 06/11/24 | 750,000 | 749,415 |
| 1.50%, 10/18/24 | 400,000 | 412,616 |
| 2.00%, 01/22/25 | 851,000 | 892,835 |
| 0.63%, 04/29/25 | 400,000 | 400,528 |
| 0.38%, 09/03/25 | 1,000,000 | 988,880 |
| 0.50%, 02/04/26 | 750,000 | 742,155 |
| 1.00%, 04/14/26 | 1,000,000 | 1,010,780 |
| 2.00%, 04/24/26 | 500,000 | 528,120 |
| 2.63%, 01/12/27 | 500,000 | 545,005 |
| 2.50%, 11/02/27 | 500,000 | 544,470 |
| 2.75%, 01/19/28 | 200,000 | 221,084 |
| 5.82%, 06/16/28 | 250,000 | 326,493 |
| 1.75%, 09/19/29 | 250,000 | 260,270 |
| 1.88%, 01/24/30 | 400,000 | 419,676 |
| 0.75%, 10/08/30 | 750,000 | 713,827 |
| 1.50%, 03/04/31 | 500,000 | 507,500 |
| Corp. Andina de Fomento |
| 4.38%, 06/15/22 | 362,000 | 373,179 |
| 2.75%, 01/06/23 | 250,000 | 257,810 |
| 2.38%, 05/12/23 | 350,000 | 360,385 |
| 1.63%, 09/23/25 | 300,000 | 304,404 |
| Council of Europe Development Bank |
| 1.75%, 09/26/22 | 350,000 | 356,038 |
| 2.63%, 02/13/23 | 250,000 | 258,853 |
| 0.25%, 06/10/23 | 150,000 | 150,087 |
| 0.25%, 10/20/23 | 350,000 | 349,748 |
| 1.38%, 02/27/25 | 150,000 | 154,152 |
| European Bank for Reconstruction & Development |
| 1.50%, 11/02/21 | 200,000 | 200,478 |
| 2.75%, 03/07/23 | 350,000 | 363,601 |
| 0.25%, 07/10/23 | 250,000 | 250,135 |
| 1.63%, 09/27/24 | 250,000 | 258,738 |
| 0.50%, 05/19/25 | 350,000 | 348,625 |
| 0.50%, 11/25/25 | 500,000 | 495,865 |
| 0.50%, 01/28/26 | 500,000 | 495,160 |
| European Investment Bank |
| 1.38%, 09/15/21 | 400,000 | 400,192 |
| 2.38%, 06/15/22 | 600,000 | 610,722 |
| 2.25%, 08/15/22 | 750,000 | 765,277 |
| 1.38%, 09/06/22 | 400,000 | 405,052 |
| 2.00%, 12/15/22 | 250,000 | 255,980 |
| 2.50%, 03/15/23 | 850,000 | 880,387 |
| 1.38%, 05/15/23 | 500,000 | 510,055 |
| 2.88%, 08/15/23 | 650,000 | 683,358 |
| 0.25%, 09/15/23 | 250,000 | 249,993 |
| 3.13%, 12/14/23 | 750,000 | 798,142 |
| 3.25%, 01/29/24 | 1,000,000 | 1,069,780 |
| 2.63%, 03/15/24 | 500,000 | 528,590 |
| 2.25%, 06/24/24 | 500,000 | 525,690 |
| 2.50%, 10/15/24 | 400,000 | 425,160 |
| 1.88%, 02/10/25 | 450,000 | 470,484 |
| 1.63%, 03/14/25 | 700,000 | 725,970 |
| 0.63%, 07/25/25 | 1,000,000 | 999,990 |
| 0.38%, 12/15/25 | 1,000,000 | 986,910 |
| 0.38%, 03/26/26 | 500,000 | 491,915 |
| 2.13%, 04/13/26 | 500,000 | 531,325 |
| 0.75%, 10/26/26 (k) | 500,000 | 498,145 |
| 2.38%, 05/24/27 | 450,000 | 486,130 |
| 1.63%, 10/09/29 | 350,000 | 361,736 |
| 0.88%, 05/17/30 | 170,000 | 164,450 |
| 0.75%, 09/23/30 | 750,000 | 715,342 |
| 1.25%, 02/14/31 | 500,000 | 496,295 |
| 1.63%, 05/13/31 | 250,000 | 256,398 |
| 4.88%, 02/15/36 | 500,000 | 704,255 |
Security
Rate, Maturity Date | Face
Amount ($) | Value ($) |
| Inter-American Development Bank |
| 1.25%, 09/14/21 | 250,000 | 250,100 |
| 1.75%, 09/14/22 | 500,000 | 508,370 |
| 2.50%, 01/18/23 | 600,000 | 619,494 |
| 0.50%, 05/24/23 | 1,050,000 | 1,055,722 |
| 3.00%, 10/04/23 | 200,000 | 211,386 |
| 0.25%, 11/15/23 | 1,500,000 | 1,498,740 |
| 2.63%, 01/16/24 | 500,000 | 527,110 |
| 3.00%, 02/21/24 | 1,000,000 | 1,064,980 |
| 2.13%, 01/15/25 | 1,000,000 | 1,052,700 |
| 1.75%, 03/14/25 | 500,000 | 520,635 |
| 0.88%, 04/03/25 | 300,000 | 303,123 |
| 0.63%, 07/15/25 | 400,000 | 400,012 |
| 0.88%, 04/20/26 | 250,000 | 251,310 |
| 2.00%, 06/02/26 | 524,000 | 553,501 |
| 2.00%, 07/23/26 | 300,000 | 316,872 |
| 2.38%, 07/07/27 | 350,000 | 377,836 |
| 0.63%, 09/16/27 | 1,000,000 | 978,310 |
| 1.13%, 07/20/28 | 500,000 | 499,665 |
| 3.13%, 09/18/28 | 650,000 | 737,626 |
| 2.25%, 06/18/29 | 700,000 | 754,215 |
| 1.13%, 01/13/31 | 750,000 | 736,560 |
| 4.38%, 01/24/44 | 350,000 | 493,395 |
| International Bank for Reconstruction & Development |
| 2.00%, 01/26/22 | 750,000 | 755,722 |
| 1.63%, 02/10/22 | 705,000 | 709,688 |
| 2.13%, 07/01/22 | 600,000 | 610,086 |
| 1.88%, 10/07/22 | 200,000 | 203,836 |
| 2.13%, 02/13/23 | 505,000 | 519,362 |
| 1.88%, 06/19/23 | 250,000 | 257,488 |
| 3.00%, 09/27/23 | 1,250,000 | 1,320,662 |
| 2.50%, 03/19/24 | 1,150,000 | 1,212,330 |
| 1.50%, 08/28/24 | 500,000 | 515,650 |
| 2.50%, 11/25/24 | 600,000 | 638,532 |
| 1.63%, 01/15/25 | 750,000 | 777,697 |
| 0.75%, 03/11/25 | 850,000 | 855,397 |
| 0.63%, 04/22/25 | 1,500,000 | 1,502,430 |
| 0.38%, 07/28/25 | 1,250,000 | 1,237,850 |
| 2.50%, 07/29/25 | 1,150,000 | 1,232,719 |
| 0.50%, 10/28/25 | 1,000,000 | 993,000 |
| 0.88%, 07/15/26 | 750,000 | 753,135 |
| 1.88%, 10/27/26 | 200,000 | 210,364 |
| 2.50%, 11/22/27 | 350,000 | 381,567 |
| 0.75%, 11/24/27 | 1,000,000 | 983,440 |
| 1.38%, 04/20/28 | 500,000 | 509,205 |
| 1.75%, 10/23/29 | 450,000 | 468,378 |
| 0.88%, 05/14/30 | 500,000 | 483,850 |
| 0.75%, 08/26/30 | 750,000 | 715,275 |
| 1.25%, 02/10/31 | 750,000 | 744,127 |
| 4.75%, 02/15/35 | 830,000 | 1,130,734 |
| International Finance Corp. |
| 2.00%, 10/24/22 | 200,000 | 204,240 |
| 0.50%, 03/20/23 | 200,000 | 201,024 |
| 2.88%, 07/31/23 | 550,000 | 577,626 |
| 1.38%, 10/16/24 | 350,000 | 359,636 |
| 0.38%, 07/16/25 | 450,000 | 445,820 |
| 2.13%, 04/07/26 | 200,000 | 212,344 |
| 0.75%, 08/27/30 | 400,000 | 381,376 |
| Nordic Investment Bank |
| 2.25%, 09/30/21 | 200,000 | 200,342 |
| 0.38%, 05/19/23 | 200,000 | 200,572 |
| 2.88%, 07/19/23 | 250,000 | 262,293 |
| 2.25%, 05/21/24 | 250,000 | 262,440 |
| 0.38%, 09/11/25 | 450,000 | 444,969 |
| 0.50%, 01/21/26 | 250,000 | 247,710 |
Schwab Taxable Bond Funds | Annual Report
Schwab U.S. Aggregate Bond Index Fund
Portfolio Holdings as of August 31, 2021 (continued)
Security
Rate, Maturity Date | Face
Amount ($) | Value ($) |
| The Asian Infrastructure Investment Bank |
| 0.25%, 09/29/23 | 1,000,000 | 999,420 |
| 2.25%, 05/16/24 | 400,000 | 419,740 |
| 0.50%, 05/28/25 | 500,000 | 497,690 |
| 0.50%, 01/27/26 | 750,000 | 742,170 |
| | | 78,518,410 |
| Total Government Related |
| (Cost $303,745,531) | | 314,686,518 |
|
| Securitized 29.6% of net assets |
| |
| Asset-Backed Securities 0.2% |
| Automobile 0.1% |
| Ally Auto Receivables Trust |
| Series 2018-3 Class A4 | | |
| 3.12%, 07/17/23 (a) | 695,000 | 701,275 |
| Ford Credit Auto Owner Trust |
| Series 2018-A Class A4 | | |
| 3.16%, 10/15/23 (a) | 1,615,000 | 1,630,305 |
| Ford Credit Floorplan Master Owner Trust A |
| Series 2013-5 Class A2 | | |
| 3.06%, 04/15/26 (a) | 172,000 | 182,912 |
| Nissan Auto Receivables Owner Trust |
| Series 2017-C Class A4 | | |
| 2.28%, 02/15/24 (a) | 344,047 | 345,639 |
| Toyota Auto Receivables Owner Trust |
| Series 2019-B Class A3 | | |
| 2.57%, 08/15/23 (a) | 378,439 | 382,403 |
| Series 2018-C Class A4 | | |
| 3.13%, 02/15/24 (a) | 150,000 | 153,236 |
| 1.68%, 05/15/25 (a) | 1,030,000 | 1,056,152 |
| | | 4,451,922 |
| Credit Card 0.1% |
| Capital One Multi-Asset Execution Trust |
| Series 2017-A6 Class A6 | | |
| 2.29%, 07/15/25 (a) | 450,000 | 459,849 |
| American Express Credit Account Master Trust |
| Series 2018-2A | | |
| 3.01%, 10/15/25 (a) | 1,800,000 | 1,877,082 |
| Capital One Multi-Asset Execution Trust |
| Series 2019-A3 Class A3 | | |
| 2.06%, 08/15/28 (a) | 1,000,000 | 1,053,047 |
| American Express Credit Account Master Trust |
| 2.00%, 04/15/25 (a) | 1,000,000 | 1,018,954 |
| Discover Card Execution Note Trust |
| Series 2018-A1 Class A1 | | |
| 3.03%, 08/15/25 (a) | 300,000 | 312,185 |
| Citibank Credit Card Issuance Trust |
| Series 2018-A6 Class A6 | | |
| 3.21%, 12/07/24 (a) | 600,000 | 622,728 |
| Discover Card Execution Note Trust |
| Series 2018-A5 Class A5 | | |
| 3.32%, 03/15/24 (a) | 500,000 | 500,573 |
| | | 5,844,418 |
| | | 10,296,340 |
| |
| Commercial Mortgage-Backed Securities 2.2% |
| Banc of America Commercial Mortgage Trust |
| Series 2016-UB10 Class A3 | | |
| 2.90%, 07/15/49 (a) | 350,000 | 373,052 |
Security
Rate, Maturity Date | Face
Amount ($) | Value ($) |
| BANK |
| Series 2017-BNK8 Class A4 | | |
| 3.49%, 11/15/50 (a) | 1,190,000 | 1,324,822 |
| Series 2017-BNK9 Class A4 | | |
| 3.54%, 11/15/54 (a) | 950,000 | 1,061,243 |
| Series 2017-BNK7 Class A5 | | |
| 3.44%, 09/15/60 (a) | 150,000 | 166,365 |
| Series 2019-BN19 Class A3 | | |
| 3.18%, 08/15/61 (a) | 600,000 | 661,142 |
| 2.40%, 03/15/63 (a) | 300,000 | 313,717 |
| BBCMS Mortgage Trust |
| Series 2017-C1 Class A2 | | |
| 3.19%, 02/15/50 (a) | 153,146 | 154,651 |
| Series 2018-C2 Class A4 | | |
| 4.05%, 12/15/51 (a) | 449,000 | 515,741 |
| Benchmark Mortgage Trust |
| Series 2019-B9 Class A5 | | |
| 4.02%, 03/15/52 (a) | 600,000 | 691,910 |
| Series 2019-B12 Class A5 | | |
| 3.12%, 08/15/52 (a) | 700,000 | 766,239 |
| 2.73%, 02/15/53 (a) | 1,000,000 | 1,067,057 |
| 2.95%, 08/15/57 (a) | 2,000,000 | 2,165,525 |
| 3.72%, 03/15/62 (a) | 5,090,000 | 5,776,439 |
| CD Mortgage Trust |
| Series 2016-CD2 Class A4 | | |
| 3.53%, 11/10/49 (a) | 240,000 | 264,256 |
| CFCRE Commercial Mortgage Trust |
| Series 2016-C3 Class A3 | | |
| 3.87%, 01/10/48 (a) | 402,000 | 445,236 |
| Series 2016-C7 Class A3 | | |
| 3.84%, 12/10/54 (a) | 2,200,000 | 2,462,629 |
| Series 2016-C4 Class A4 | | |
| 3.28%, 05/10/58 (a) | 430,000 | 465,594 |
| Citigroup Commercial Mortgage Trust |
| Series 2012-GC8 Class A4 | | |
| 3.02%, 09/10/45 (a) | 112,375 | 114,115 |
| Series 2014-GC25 Class A4 | | |
| 3.64%, 10/10/47 (a) | 253,748 | 273,915 |
| Series 2016-GC36 Class A5 | | |
| 3.62%, 02/10/49 (a) | 2,260,000 | 2,485,290 |
| Series 2016-GC37 Class A4 | | |
| 3.31%, 04/10/49 (a) | 100,000 | 108,760 |
| Series 2017-C4 Class A4 | | |
| 3.47%, 10/12/50 (a) | 5,700,000 | 6,316,887 |
| COMM Mortgage Trust |
| Series 2012-LC4 Class A4 | | |
| 3.29%, 12/10/44 (a) | 54,374 | 54,520 |
| Series 2013-CCRE6 Class A4 | | |
| 3.10%, 03/10/46 (a) | 300,000 | 309,899 |
| Series 2014-CCRE15 Class A4 | | |
| 4.07%, 02/10/47 (a)(g)(l) | 1,200,000 | 1,290,137 |
| Series 2014-LC15 Class A4 | | |
| 4.01%, 04/10/47 (a) | 250,000 | 268,943 |
| Series 2014-CR18 Class A4 | | |
| 3.55%, 07/15/47 (a) | 424,583 | 452,590 |
| Series 2014-UBS4 Class A5 | | |
| 3.69%, 08/10/47 (a) | 1,120,000 | 1,203,774 |
| Series 2014-LC17 Class A5 | | |
| 3.92%, 10/10/47 (a) | 45,000 | 48,888 |
| Series 2014-CR20 Class A3 | | |
| 3.33%, 11/10/47 (a) | 603,129 | 637,675 |
| Series 2015-DC1 Class A5 | | |
| 3.35%, 02/10/48 (a) | 500,000 | 538,121 |
| Series 2015-CR24 Class A5 | | |
| 3.70%, 08/10/48 (a) | 1,148,000 | 1,256,758 |
Schwab Taxable Bond Funds | Annual Report
Schwab U.S. Aggregate Bond Index Fund
Portfolio Holdings as of August 31, 2021 (continued)
Security
Rate, Maturity Date | Face
Amount ($) | Value ($) |
| Series 2015-LC23 Class A4 | | |
| 3.77%, 10/10/48 (a) | 330,000 | 363,364 |
| Series 2016-CR28 Class A4 | | |
| 3.76%, 02/10/49 (a) | 602,000 | 665,965 |
| Series 2016-DC2 Class A5 | | |
| 3.77%, 02/10/49 (a) | 300,000 | 331,338 |
| Series 2015-PC1 Class ASB | | |
| 3.61%, 07/10/50 (a) | 764,943 | 802,348 |
| Series 2013-CCRE11 Class A4 | | |
| 4.26%, 08/10/50 (a) | 2,350,000 | 2,513,541 |
| CSAIL Commercial Mortgage Trust |
| Series 2015-C1 Class A4 | | |
| 3.51%, 04/15/50 (a) | 1,405,000 | 1,512,490 |
| 3.02%, 09/15/52 (a) | 2,500,000 | 2,723,061 |
| CSMC Trust |
| Series 2016 Class A4 | | |
| 3.79%, 12/15/49 (a) | 2,000,000 | 2,218,812 |
| Fannie Mae-ACES |
| Series 2014-M2 Class A2 | | |
| 3.51%, 12/25/23 (a) | 80,145 | 85,411 |
| Series 2015-M13 Class A2 | | |
| 2.80%, 06/25/25 (a)(g)(m) | 190,929 | 202,757 |
| Series 2016-M11 Class A2 | | |
| 2.37%, 07/25/26 (a)(g)(m) | 785,000 | 835,221 |
| Freddie Mac Multifamily Structured Pass-Through Certificates |
| Series K021 Class A2 | | |
| 2.40%, 06/25/22 (a) | 125,833 | 127,363 |
| Series K024 Class A2 | | |
| 2.57%, 09/25/22 (a) | 531,000 | 540,828 |
| Series K029 Class A2 | | |
| 3.32%, 02/25/23 (a)(g)(n) | 923,000 | 956,560 |
| Series K030 Class A2 | | |
| 3.25%, 04/25/23 (a)(g)(n) | 200,000 | 207,476 |
| Series K033 Class A2 | | |
| 3.06%, 07/25/23 (a) | 381,000 | 396,097 |
| Series K034 Class A2 | | |
| 3.53%, 07/25/23 (a) | 100,000 | 105,217 |
| Series K725 Class A2 | | |
| 3.00%, 01/25/24 (a) | 1,000,000 | 1,051,642 |
| Series K037 Class A2 | | |
| 3.49%, 01/25/24 (a) | 750,000 | 798,063 |
| Series K727 Class A2 | | |
| 2.95%, 07/25/24 (a) | 100,000 | 105,300 |
| Series K728 Class A2 | | |
| 3.06%, 08/25/24 (a)(g)(n) | 400,000 | 424,616 |
| Series K040 Class A2 | | |
| 3.24%, 09/25/24 (a) | 100,000 | 107,392 |
| Series K042 Class A2 | | |
| 2.67%, 12/25/24 (a) | 400,000 | 424,373 |
| Series K043 Class A2 | | |
| 3.06%, 12/25/24 (a) | 200,000 | 214,840 |
| Series K044 Class A2 | | |
| 2.81%, 01/25/25 (a) | 645,000 | 688,112 |
| Series KS03 Class A4 | | |
| 3.16%, 05/25/25 (a)(g)(n) | 150,000 | 160,739 |
| Series K047 Class A2 | | |
| 3.33%, 05/25/25 (a)(g)(n) | 400,000 | 435,490 |
| Series K048 Class A2 | | |
| 3.28%, 06/25/25 (a)(g)(n) | 1,150,000 | 1,251,047 |
| Series K733 Class A2 | | |
| 3.75%, 08/25/25 (a)(g)(n) | 1,400,000 | 1,538,515 |
| Series K052 Class A2 | | |
| 3.15%, 11/25/25 (a) | 100,000 | 108,886 |
| Series K054 Class A2 | | |
| 2.75%, 01/25/26 (a) | 10,000 | 10,754 |
| Series K735 Class A2 | | |
| 2.86%, 05/25/26 (a) | 830,000 | 897,548 |
Security
Rate, Maturity Date | Face
Amount ($) | Value ($) |
| Series K058 Class A2 | | |
| 2.65%, 08/25/26 (a) | 600,000 | 647,084 |
| Series K061 Class A2 | | |
| 3.35%, 11/25/26 (a)(g)(n) | 2,500,000 | 2,781,463 |
| Series K062 Class A2 | | |
| 3.41%, 12/25/26 (a) | 300,000 | 335,548 |
| Series K067 Class A1 | | |
| 2.90%, 03/25/27 (a) | 1,760,062 | 1,862,601 |
| Series K064 Class A2 | | |
| 3.22%, 03/25/27 (a) | 750,000 | 832,129 |
| Series K066 Class A2 | | |
| 3.12%, 06/25/27 (a) | 1,200,000 | 1,328,993 |
| Series K074 Class A1 | | |
| 3.60%, 09/25/27 (a) | 139,545 | 153,286 |
| Series K071 Class A2 | | |
| 3.29%, 11/25/27 (a) | 2,000,000 | 2,246,851 |
| Series K070 Class A2 | | |
| 3.30%, 11/25/27 (a)(g)(n) | 500,000 | 562,019 |
| Series K072 Class A2 | | |
| 3.44%, 12/25/27 (a) | 900,000 | 1,020,707 |
| Series K074 Class A2 | | |
| 3.60%, 01/25/28 (a) | 3,500,000 | 4,006,823 |
| Series K078 Class A2 | | |
| 3.85%, 06/25/28 (a) | 1,182,367 | 1,373,827 |
| Series K083 Class A2 | | |
| 4.05%, 09/25/28 (a)(g)(n) | 250,000 | 295,063 |
| Series K085 Class A2 | | |
| 4.06%, 10/25/28 (a)(g)(n) | 700,000 | 824,916 |
| Series K087 Class A2 | | |
| 3.77%, 12/25/28 (a) | 100,000 | 116,457 |
| Series K099 Class A2 | | |
| 2.60%, 09/25/29 (a) | 2,210,000 | 2,418,387 |
| Series K-1512 Class A2 | | |
| 2.99%, 05/25/31 (a) | 2,500,000 | 2,766,575 |
| Series K154 Class A2 | | |
| 3.42%, 04/25/32 (a) | 700,000 | 804,067 |
| Series K157 Class A2 | | |
| 3.99%, 05/25/33 (a) | 360,000 | 427,808 |
| Series K045 Class A2 | | |
| 3.02%, 04/25/48 (a) | 500,000 | 537,305 |
| GS Mortgage Securities Trust |
| Series 2012-GCJ7 Class A4 | | |
| 3.38%, 05/10/45 (a) | 176,021 | 176,724 |
| Series 2014-GC20 Class A5 | | |
| 4.00%, 04/10/47 (a) | 225,000 | 241,726 |
| 2.91%, 02/13/53 (a) | 3,000,000 | 3,244,599 |
| JP Morgan Chase Commercial Mortgage Securities Trust |
| 3.65%, 12/15/49 (a)(g)(n) | 2,034,000 | 2,260,081 |
| JPMBB Commercial Mortgage Securities Trust |
| Series 2013-C17 Class A4 | | |
| 4.20%, 01/15/47 (a) | 200,000 | 214,691 |
| Series 2015-C33 Class A3 | | |
| 3.50%, 12/15/48 (a) | 782,456 | 845,994 |
| Series 2015-C33 Class A4 | | |
| 3.77%, 12/15/48 (a) | 2,550,000 | 2,816,819 |
| JPMCC Commercial Mortgage Securities Trust |
| 3.72%, 03/15/50 (a) | 2,430,000 | 2,719,733 |
| JPMDB Commercial Mortgage Securities Trust |
| Series 2015-C32 Class A5 | | |
| 3.60%, 11/15/48 (a) | 1,000,000 | 1,081,965 |
| Series 2018-C8 Class A3 | | |
| 3.94%, 06/15/51 (a) | 300,000 | 334,514 |
| Morgan Stanley Bank of America Merrill Lynch Trust |
| Series 2013-C11 Class A4 | | |
| 4.30%, 08/15/46 (a)(g)(n) | 350,000 | 366,250 |
Schwab Taxable Bond Funds | Annual Report
Schwab U.S. Aggregate Bond Index Fund
Portfolio Holdings as of August 31, 2021 (continued)
Security
Rate, Maturity Date | Face
Amount ($) | Value ($) |
| Series 2013-C13 Class A4 | | |
| 4.04%, 11/15/46 (a) | 360,000 | 384,466 |
| Series 2013-C8 Class AS | | |
| 3.38%, 12/15/48 (a) | 100,000 | 103,523 |
| Series 2016-C28 Class A4 | | |
| 3.54%, 01/15/49 (a) | 1,300,000 | 1,421,149 |
| Morgan Stanley Capital I Trust |
| Series 2015-A4 Class A4 | | |
| 3.78%, 05/15/48 (a) | 50,000 | 54,577 |
| Series 2015-UBS8 Class A4 | | |
| 3.81%, 12/15/48 (a) | 400,000 | 440,759 |
| Morgan Stanley Capital I Trust 2017-H1 |
| 3.26%, 06/15/50 (a) | 250,000 | 269,090 |
| Morgan Stanley Capital I Trust 2020-HR8 |
| 2.04%, 07/15/53 (a) | 1,000,000 | 1,012,668 |
| UBS Commercial Mortgage Trust |
| Series 2017-C3 Class A4 | | |
| 3.43%, 08/15/50 (a) | 200,000 | 221,083 |
| Series 2017-C6 Class A5 | | |
| 3.58%, 12/15/50 (a) | 600,000 | 668,086 |
| UBS-Barclays Commercial Mortgage Trust |
| Series 2013-C5 Class A4 | | |
| 3.18%, 03/10/46 (a) | 250,000 | 258,121 |
| Wells Fargo Commercial Mortgage Trust |
| Series 2013-LC12 Class A4 | | |
| 4.22%, 07/15/46 (a)(g)(l) | 1,409,000 | 1,490,448 |
| Series 2015-C28 Class A3 | | |
| 3.29%, 05/15/48 (a) | 265,138 | 280,631 |
| 3.72%, 12/15/48 (a) | 2,100,000 | 2,314,447 |
| Series 2016-NXS6 Class ASB | | |
| 2.83%, 11/15/49 (a) | 350,000 | 365,294 |
| 3.58%, 10/15/50 (a) | 1,020,000 | 1,136,302 |
| Series 2017-C41 Class A4 | | |
| 3.47%, 11/15/50 (a) | 300,000 | 332,486 |
| Series 2017-C42 Class A4 | | |
| 3.59%, 12/15/50 (a) | 1,400,000 | 1,565,180 |
| Series 2018-C44 Class A5 | | |
| 4.21%, 05/15/51 (a) | 950,000 | 1,097,822 |
| Series 2019-C50 Class A5 | | |
| 3.73%, 05/15/52 (a) | 675,000 | 766,798 |
| 3.04%, 10/15/52 (a) | 500,000 | 545,956 |
| 2.73%, 02/15/53 (a) | 1,950,000 | 2,082,865 |
| 2.09%, 07/15/53 (a) | 1,645,000 | 1,672,105 |
| Series 2015-C30 Class A4 | | |
| 3.66%, 09/15/58 (a) | 200,000 | 219,196 |
| Series 2016-NXS5 Class A4 | | |
| 3.37%, 01/15/59 (a) | 700,000 | 750,206 |
| Series 2016-C32 Class A4 | | |
| 3.56%, 01/15/59 (a) | 1,200,000 | 1,317,158 |
| Series 2016-NXS5 Class A6 | | |
| 3.64%, 01/15/59 (a) | 1,330,400 | 1,466,348 |
| Series 2013-C33 Class A3 | | |
| 3.16%, 03/15/59 (a) | 127,075 | 135,803 |
| 4.18%, 09/15/61 (a) | 500,000 | 572,979 |
| WFRBS Commercial Mortgage Trust |
| Series 2013-C15 Class A4 | | |
| 4.15%, 08/15/46 (a)(g)(n) | 710,000 | 749,816 |
| 3.90%, 12/15/46 (a) | 422,862 | 446,236 |
| Series 2014-C20 Class ASB | | |
| 3.64%, 05/15/47 (a) | 541,481 | 562,324 |
| | | 121,189,983 |
| |
Security
Rate, Maturity Date | Face
Amount ($) | Value ($) |
| Mortgage-Backed Securities Pass-Through 27.2% |
| Fannie Mae |
| 4.00%, 04/01/24 to 08/01/50 (a) | 58,077,953 | 63,229,456 |
| 4.50%, 12/01/24 to 05/01/50 (a) | 23,345,078 | 25,771,772 |
| 3.50%, 10/01/25 to 09/01/50 (a) | 87,125,678 | 93,481,691 |
| 3.00%, 10/01/26 to 06/01/51 (a) | 106,620,498 | 112,585,018 |
| 2.50%, 07/01/27 to 09/01/51 (a) | 118,804,345 | 123,668,536 |
| 2.00%, 12/01/27 to 09/01/51 (a) | 167,917,362 | 171,141,166 |
| 5.50%, 12/01/32 to 11/01/48 (a) | 3,907,802 | 4,505,209 |
| 5.00%, 11/01/33 to 01/01/50 (a) | 7,228,910 | 8,121,546 |
| 6.50%, 08/01/34 to 05/01/40 (a) | 175,148 | 208,505 |
| 6.00%, 04/01/35 to 07/01/41 (a) | 1,599,286 | 1,874,374 |
| 1.50%, 08/01/35 to 08/01/51 (a) | 34,678,354 | 34,735,395 |
| 1.00%, 03/01/36 to 07/01/36 (a) | 970,993 | 966,671 |
| Freddie Mac |
| 2.00%, 08/01/23 to 09/01/51 (a) | 144,935,471 | 147,579,235 |
| 4.00%, 03/01/24 to 07/01/50 (a) | 25,038,176 | 27,175,381 |
| 3.50%, 01/01/26 to 09/01/51 (a) | 39,225,370 | 42,049,712 |
| 3.00%, 08/01/26 to 09/01/50 (a) | 62,007,596 | 65,447,404 |
| 2.50%, 04/01/27 to 09/01/51 (a) | 78,035,974 | 81,197,515 |
| 6.00%, 05/01/32 to 07/01/40 (a) | 978,390 | 1,148,977 |
| 5.50%, 06/01/33 to 08/01/41 (a) | 2,051,879 | 2,366,873 |
| 5.00%, 11/01/33 to 12/01/49 (a) | 4,527,008 | 5,105,518 |
| 4.50%, 05/01/34 to 08/01/49 (a) | 13,067,350 | 14,485,075 |
| 1.50%, 08/01/35 to 08/01/51 (a) | 46,687,772 | 46,462,344 |
| 6.50%, 02/01/36 (a) | 103,167 | 122,448 |
| Ginnie Mae |
| 3.00%, 04/20/27 to 08/20/51 (a) | 61,851,308 | 65,080,691 |
| 2.50%, 08/20/27 to 08/20/51 (a) | 71,031,363 | 73,695,183 |
| 3.50%, 09/20/32 to 06/20/51 (a) | 57,013,164 | 60,832,144 |
| 5.00%, 02/20/33 to 07/20/49 (a) | 5,932,449 | 6,680,503 |
| 5.50%, 04/15/33 to 03/20/49 (a) | 927,050 | 1,072,042 |
| 2.00%, 04/20/36 to 08/20/51 (a) | 65,628,756 | 67,049,704 |
| 4.00%, 06/15/39 to 04/20/50 (a) | 27,174,891 | 29,347,219 |
| 4.50%, 07/15/39 to 02/20/50 (a) | 11,407,486 | 12,530,464 |
| 6.00%, 04/20/44 (a) | 195,897 | 235,757 |
| 1.50%, 03/20/51 to 04/20/51 (a) | 784,070 | 775,544 |
| Ginnie Mae TBA |
| 2.00%, 09/21/51 (a)(k) | 1,500,000 | 1,530,915 |
| 2.50%, 09/21/51 (a)(k) | 2,000,000 | 2,073,852 |
| 3.00%, 09/21/51 (a)(k) | 7,500,000 | 7,840,989 |
| UMBS TBA |
| 1.50%, 09/16/36 to 09/14/51 (a)(k) | 3,000,000 | 2,980,677 |
| 2.00%, 09/16/36 (a)(k) | 6,000,000 | 6,210,542 |
| 2.50%, 09/16/36 (a)(k) | 8,500,000 | 8,892,498 |
| 2.00%, 09/14/51 (a)(k) | 33,500,000 | 33,962,123 |
| 2.50%, 09/14/51 (a)(k) | 31,500,000 | 32,722,553 |
| 3.00%, 09/14/51 (a)(k) | 9,500,000 | 9,937,293 |
| | | 1,496,880,514 |
| Total Securitized |
| (Cost $1,612,646,125) | | 1,628,366,837 |
Schwab Taxable Bond Funds | Annual Report
Schwab U.S. Aggregate Bond Index Fund
Portfolio Holdings as of August 31, 2021 (continued)
| Security | Number
of Shares | Value ($) |
| Short-Term Investments 2.8% of net assets |
| |
| Money Market Funds 2.8% |
| Wells Fargo Government Money Market Fund, Select Class 0.03% (o)(p) | 660,675 | 660,675 |
| State Street Institutional U.S. Government Money Market Fund, Premier Class 0.03% (o) | 152,256,068 | 152,256,068 |
| Total Short-Term Investments |
| (Cost $152,916,743) | | 152,916,743 |
| * | Supranational bonds represent the debt of international organizations or institutions such as the World Bank, the International Monetary Fund, regional multilateral development banks and others. |
| (a) | The effective maturity may be shorter than the final maturity shown because of the possibility of interim principal payments and prepayments or as the result of embedded demand features (puts or calls). |
| (b) | Security converts to floating rate after the fixed-rate coupon period. |
| (c) | Securities exempt from registration under Rule 144A of the Securities Act of 1933, as amended. These securities may be resold in transactions exempt from registrations, normally to qualified institutional buyers. At the period end, the value of these amounted to $23,446,497 or 0.4% of net assets. |
| (d) | Issuer is affiliated with the fund’s investment adviser. |
| (e) | All or a portion of this security is on loan. Securities on loan were valued at $639,130. |
| (f) | Interest rate is subject to adjustments from time to time if a nationally recognized statistical rating organization downgrades (or subsequently upgrades) the debt rating assigned to the bond. |
| (g) | Variable-rate security. |
| (h) | All or a portion of this security is designated as collateral for delayed-delivery securities. |
| (i) | Guaranteed by the Republic of Germany. |
| (j) | Zero Coupon Bond. |
| (k) | Security or a portion of the security purchased on a delayed-delivery or when-issued basis. |
| (l) | Security is a type of structured MBS that involves tranching (i.e. dividing) the underlying MBS pools’ cash flows into securities that have varying coupon and principal payback profiles. Tranches pay an investor an interest rate, which is determined by a formula set forth in the security’s offering documents. The floating interest rate may reset once a year and is generally tied to LIBOR, CMT, or COFI. A variable interest rate can also be affected by the current WAC. |
| (m) | Variable rate is determined by formula set forth in the security’s offering documents and is affected by the MBS pass-through rate, which is the rate earned from a securitized asset pool once management fees and guarantee fees have been paid to the securitizing corporation. |
| (n) | Variable rate is determined by formula set forth in the security’s offering documents and is affected by the current WAC. |
| (o) | The rate shown is the 7-day yield. |
| (p) | Security purchased with cash collateral received for securities on loan. |
| | |
| ACES — | Alternate Credit Enhancement Securities |
| CMT — | Constant Maturity Treasury is an index published by the Federal Reserve Board based on the monthly average yield of a range of Treasury securities maturing at different periods, adjusted to the equivalent of a one-year maturity. |
| COFI — | Cost of Funds Index is a regional index of the average interest expenses paid by financial institutions on money market accounts, passbooks, CDs, and other liabilities. |
| GO — | General obligation |
| LIBOR — | London Interbank Offered Rate is the interest rate banks charge each other for short-term loans. |
| MBS — | Mortgage-Backed Security |
| RB — | Revenue bond |
| REIT — | Real Estate Investment Trust |
| TBA — | To-be-announced |
| UMBS — | Uniform Mortgage-Backed Securities are single-class securities backed by mortgage loans purchased by either Freddie Mac or Fannie Mae. |
| WAC — | Weighted Average Coupon, which is the weighted average gross interest rate of the securitized asset pool and is determined by the different speeds at which the underlying mortgages are paid down. |
Schwab Taxable Bond Funds | Annual Report
Schwab U.S. Aggregate Bond Index Fund
Portfolio Holdings as of August 31, 2021 (continued)
The fund owns corporate bonds of affiliates, The Charles Schwab Corp. and TD Ameritrade Holding Corp., since those corporate bonds are included in its index. Below is a summary of investment activities involving The Charles Schwab Corp. and TD Ameritrade Holding Corp. notes owned by the fund during the period ended August 31, 2021:
| |
Value at
08/31/20 | Gross
Purchases* | Gross
Sales | Realized
Gains (Losses) | Net Change
in Unrealized
Appreciation
(depreciation) |
Value at
08/31/21 | Face
Amount at
08/31/21 | Interest Income
Earned |
| TD Ameritrade Holding Corp., 2.95%, 04/01/22 | $155,666 | $297 | ($153,032) | $3,446 | ($6,377) | $— | — | $2,987 |
| TD Ameritrade Holding Corp., 3.75%, 04/01/24 | 110,929 | 61 | (54,487) | 4,616 | (7,129) | 53,990 | 50,000 | 2,901 |
| TD Ameritrade Holding Corp., 3.63%, 04/01/25 | 168,864 | (963) | (54,655) | 3,138 | (7,128) | 109,256 | 100,000 | 4,617 |
| TD Ameritrade Holding Corp., 3.30%, 04/01/27 | — | 110,086 | — | — | 310 | 110,396 | 100,000 | 385 |
| TD Ameritrade Holding Corp., 2.75%, 10/01/29 | 111,923 | (707) | — | — | (3,994) | 107,222 | 100,000 | 2,750 |
| The Charles Schwab Corp., 2.65%, 01/25/23 | 158,122 | (3,202) | — | — | (250) | 154,670 | 150,000 | 3,975 |
| The Charles Schwab Corp., 3.55%, 02/01/24 | — | 107,328 | — | — | 4 | 107,332 | 100,000 | 2,051 |
| The Charles Schwab Corp., 0.75%, 03/18/24 | — | 251,727 | — | — | (25) | 251,702 | 250,000 | 447 |
| The Charles Schwab Corp., 4.20%, 03/24/25 | 174,274 | 111,738 | (168,228) | 2,061 | (8,334) | 111,511 | 100,000 | 5,968 |
| The Charles Schwab Corp., 3.85%, 05/21/25 | 171,406 | (2,278) | — | — | (3,502) | 165,626 | 150,000 | 5,775 |
| The Charles Schwab Corp., 0.90%, 03/11/26 | — | 251,778 | — | — | (2,478) | 249,300 | 250,000 | 1,350 |
| The Charles Schwab Corp., 1.15%, 05/13/26 | — | 201,147 | — | — | 263 | 201,410 | 200,000 | 511 |
| The Charles Schwab Corp., 3.20%, 03/02/27 | — | 111,373 | — | — | (1,484) | 109,889 | 100,000 | 1,849 |
| The Charles Schwab Corp., 3.20%, 01/25/28 | 171,118 | (829) | (54,145) | 1,864 | (7,744) | 110,264 | 100,000 | 4,151 |
| The Charles Schwab Corp., 2.00%, 03/20/28 | — | 151,604 | — | — | 3,154 | 154,758 | 150,000 | 975 |
| The Charles Schwab Corp., 4.00%, 02/01/29 | 180,172 | (1,896) | (56,761) | 558 | (6,407) | 115,666 | 100,000 | 5,094 |
| The Charles Schwab Corp., 3.25%, 05/22/29 | 231,464 | (1,233) | (108,798) | 2,364 | (13,024) | 110,773 | 100,000 | 5,028 |
| The Charles Schwab Corp., 4.63%, 03/22/30 | 127,599 | (1,004) | — | — | (4,315) | 122,280 | 100,000 | 4,625 |
| The Charles Schwab Corp., 1.65%, 03/11/31 | — | 99,194 | — | — | (1,281) | 97,913 | 100,000 | 990 |
| The Charles Schwab Corp., 2.30%, 05/13/31 | — | 103,657 | — | — | (287) | 103,370 | 100,000 | 249 |
| Total | $1,761,537 | $1,487,878 | ($650,106) | $18,047 | ($70,028) | $2,547,328 | | $56,678 |
* Amount includes amortization of premiums and/or accretion of discounts.
Schwab Taxable Bond Funds | Annual Report
Schwab U.S. Aggregate Bond Index Fund
Portfolio Holdings as of August 31, 2021 (continued)
The following is a summary of the inputs used to value the fund’s investments as of August 31, 2021 (see financial note 2(a) for additional information):
| Description | Quoted Prices in
Active Markets for
Identical Assets
(Level 1) | Other Significant
Observable Inputs
(Level 2) | Significant
Unobservable Inputs
(Level 3) | Total | |
| Assets | | | | | |
| Corporates 1 | $— | $1,439,513,850 | $— | $1,439,513,850 | |
| Treasuries | — | 2,101,604,489 | — | 2,101,604,489 | |
| Government Related1 | — | 314,686,518 | — | 314,686,518 | |
| Securitized 1 | — | 1,628,366,837 | — | 1,628,366,837 | |
| Short-Term Investments1 | 152,916,743 | — | — | 152,916,743 | |
| Total | $152,916,743 | $5,484,171,694 | $— | $5,637,088,437 | |
| 1 | As categorized in the Portfolio Holdings. |
Fund investments in mutual funds are classified as Level 1, without consideration to the classification level of the underlying securities held by the mutual funds, which could be Level 1, Level 2 or Level 3.
Schwab Taxable Bond Funds | Annual Report
Schwab U.S. Aggregate Bond Index Fund
Statement of Assets and Liabilities
As of August 31, 2021
| Assets |
| Investments in securities, at value — affiliated (cost $2,496,774) | | $2,547,328 |
| Investments in securities, at value — unaffiliated (cost $5,464,584,720) including securities on loan of $639,130 | | 5,633,880,434 |
| Collateral invested for securities on loan, at value (cost $660,675) | | 660,675 |
| Cash | | 967,505 |
| Deposits with brokers for TBA margin | | 260,000 |
| Receivables: | | |
| Investments sold | | 69,822,790 |
| Fund shares sold | | 25,321,430 |
| Interest | | 23,904,675 |
| Dividends | | 2,532 |
| Income from securities on loan | + | 358 |
| Total assets | | 5,757,367,727 |
| Liabilities |
| Collateral held for securities on loan | | 660,675 |
| Payables: | | |
| Investments bought | | 133,567,947 |
| Investments bought — delayed-delivery | | 107,567,340 |
| Investment adviser fees | | 186,041 |
| Fund shares redeemed | | 3,811,871 |
| Distributions to shareholders | + | 1,918,932 |
| Total liabilities | | 247,712,806 |
| Net Assets |
| Total assets | | 5,757,367,727 |
| Total liabilities | – | 247,712,806 |
| Net assets | | $5,509,654,921 |
| Net Assets by Source | | |
| Capital received from investors | | 5,363,799,314 |
| Total distributable earnings | | 145,855,607 |
| Net Asset Value (NAV) |
| Net Assets | ÷ | Shares
Outstanding | = | NAV |
| $5,509,654,921 | | 521,143,560 | | $10.57 |
| | | | | |
Schwab Taxable Bond Funds | Annual Report
Schwab U.S. Aggregate Bond Index Fund
Statement of Operations
For the period September 1, 2020 through August 31, 2021
| Investment Income |
| Interest received from securities — affiliated | | $56,678 |
| Interest received from securities — unaffiliated (net of foreign withholding taxes of $48) | | 86,529,355 |
| Dividends received from securities — unaffiliated | | 32,283 |
| Securities on loan, net | + | 3,925 |
| Total investment income | | 86,622,241 |
| Expenses |
| Investment adviser fees | | 2,036,896 |
| Total expenses | – | 2,036,896 |
| Net investment income | | 84,585,345 |
| Realized and Unrealized Gains (Losses) |
| Net realized gains on sales of securities — affiliated | | 18,047 |
| Net realized gains on sales of securities — unaffiliated | + | 2,009,133 |
| Net realized gains | | 2,027,180 |
| Net change in unrealized appreciation (depreciation) on securities — affiliated | | (70,028) |
| Net change in unrealized appreciation (depreciation) on securities — unaffiliated | + | (96,572,749) |
| Net change in unrealized appreciation (depreciation) | + | (96,642,777) |
| Net realized and unrealized losses | | (94,615,597) |
| Decrease in net assets resulting from operations | | ($10,030,252) |
Schwab Taxable Bond Funds | Annual Report
Schwab U.S. Aggregate Bond Index Fund
Statement of Changes in Net Assets
For the current and prior report periods
| Operations | |
| | 9/1/20-8/31/21 | 9/1/19-8/31/20 |
| Net investment income | | $84,585,345 | $84,805,970 |
| Net realized gains | | 2,027,180 | 27,475,771 |
| Net change in unrealized appreciation (depreciation) | + | (96,642,777) | 116,887,984 |
| Increase (decrease) in net assets from operations | | (10,030,252) | 229,169,725 |
| Distributions to Shareholders | |
| Total distributions | | ($112,841,716) | ($93,281,965) |
| Transactions in Fund Shares | | | |
| | | 9/1/20-8/31/21 | 9/1/19-8/31/20 |
| | | SHARES | VALUE | SHARES | VALUE |
| Shares sold | | 207,229,520 | $2,204,914,044 | 244,861,715 | $2,598,835,807 |
| Shares reinvested | | 8,579,233 | 91,136,260 | 7,326,953 | 77,716,227 |
| Shares redeemed | + | (128,161,408) | (1,360,610,590) | (102,784,206) | (1,086,743,664) |
| Net transactions in fund shares | | 87,647,345 | $935,439,714 | 149,404,462 | $1,589,808,370 |
| Shares Outstanding and Net Assets | | | |
| | | 9/1/20-8/31/21 | 9/1/19-8/31/20 |
| | | SHARES | NET ASSETS | SHARES | NET ASSETS |
| Beginning of period | | 433,496,215 | $4,697,087,175 | 284,091,753 | $2,971,391,045 |
| Total increase | + | 87,647,345 | 812,567,746 | 149,404,462 | 1,725,696,130 |
| End of period | | 521,143,560 | $5,509,654,921 | 433,496,215 | $4,697,087,175 |
Schwab Taxable Bond Funds | Annual Report
Schwab Short-Term Bond Index Fund
Financial Statements
Financial Highlights
| | 9/1/20–
8/31/21 | 9/1/19–
8/31/20 | 9/1/18–
8/31/19 | 9/1/17–
8/31/18 | 2/23/17 1–
8/31/17 | |
| Per-Share Data |
| Net asset value at beginning of period | $10.39 | $10.13 | $9.80 | $10.04 | $10.00 | |
| Income (loss) from investment operations: | | | | | | |
| Net investment income (loss)2 | 0.10 | 0.19 | 0.24 | 0.19 | 0.08 | |
| Net realized and unrealized gains (losses) | (0.08) | 0.27 | 0.33 | (0.24) | 0.04 | |
| Total from investment operations | 0.02 | 0.46 | 0.57 | (0.05) | 0.12 | |
| Less distributions: | | | | | | |
| Distributions from net investment income | (0.10) | (0.20) | (0.24) | (0.19) | (0.08) | |
| Distributions from net realized gains | (0.03) | — | — | — | — | |
| Total distributions | (0.13) | (0.20) | (0.24) | (0.19) | (0.08) | |
| Net asset value at end of period | $10.28 | $10.39 | $10.13 | $9.80 | $10.04 | |
| Total return | 0.18% | 4.59% | 5.89% | (0.51%) | 1.25% 3 | |
| Ratios/Supplemental Data |
| Ratios to average net assets: | | | | | | |
| Total expenses | 0.06% | 0.06% | 0.06% | 0.06% | 0.06% 4 | |
| Net investment income (loss) | 0.96% | 1.89% | 2.43% | 1.92% | 1.64% 4 | |
| Portfolio turnover rate | 61% | 65% | 46% | 61% | 49% 3,5 | |
| Net assets, end of period (x 1,000,000) | $2,228 | $1,694 | $877 | $522 | $381 | |
| |
1
Commencement of operations.
2
Calculated based on the average shares outstanding during the period.
3
Not annualized.
4
Annualized.
5
Portfolio turnover rate excludes in-kind transactions.
Schwab Taxable Bond Funds | Annual Report
Schwab Short-Term Bond Index Fund
Portfolio Holdings as of August 31, 2021
This section shows all the securities in the fund’s portfolio and their values as of the report date.
The fund files its complete schedule of portfolio holdings with the U.S. Securities and Exchange Commission (SEC) for the first and third quarters of each fiscal year on Form N-PORT Part F. The fund’s Form N-PORT Part F is available on the SEC’s website at www.sec.gov. You can also obtain this information at no cost on the fund’s website at www.schwabassetmanagement.com/schwabfunds_prospectus, by calling 1-866-414-6349, or by sending an email request to orders@mysummaryprospectus.com. The fund also makes available its complete schedule of portfolio holdings 15 to 20 days after the end of the month on the fund’s website.
For fixed-rate obligations, the rate shown is the interest rate (the rate established when the obligation was issued). For variable-rate obligations, the rate shown is the rate as of the report date based on each security’s rate reset date. The reference rate and spread used is shown parenthetically in the security description, if available; if not, the reference rate is described in a footnote. The maturity date shown for all the securities is the final legal maturity.
Security
Rate, Maturity Date | Face
Amount ($) | Value ($) |
| Corporates 26.1% of net assets |
| |
| Financial Institutions 11.3% |
| Banking 8.9% |
| Ally Financial, Inc. |
| 3.05%, 06/05/23 (a) | 200,000 | 208,012 |
| 1.45%, 10/02/23 (a) | 500,000 | 507,815 |
| 3.88%, 05/21/24 (a) | 100,000 | 107,848 |
| 5.13%, 09/30/24 | 250,000 | 281,310 |
| 4.63%, 03/30/25 | 100,000 | 111,726 |
| 5.80%, 05/01/25 (a) | 200,000 | 231,534 |
| American Express Co. |
| 2.65%, 12/02/22 | 500,000 | 515,175 |
| 3.40%, 02/27/23 (a) | 500,000 | 521,445 |
| 3.70%, 08/03/23 (a) | 500,000 | 530,465 |
| 3.40%, 02/22/24 (a) | 150,000 | 160,040 |
| 2.50%, 07/30/24 (a) | 400,000 | 421,368 |
| 3.00%, 10/30/24 (a) | 450,000 | 482,067 |
| 3.63%, 12/05/24 (a) | 100,000 | 109,034 |
| 4.20%, 11/06/25 (a) | 250,000 | 283,790 |
| 3.13%, 05/20/26 (a) | 250,000 | 273,075 |
| Australia & New Zealand Banking Group Ltd. |
| 2.63%, 11/09/22 | 250,000 | 257,143 |
| 3.70%, 11/16/25 | 500,000 | 558,970 |
| Banco Bilbao Vizcaya Argentaria S.A. |
| 0.88%, 09/18/23 | 200,000 | 201,066 |
| 1.13%, 09/18/25 | 200,000 | 199,084 |
| Banco Santander S.A. |
| 3.13%, 02/23/23 | 200,000 | 207,652 |
| 3.85%, 04/12/23 | 400,000 | 421,252 |
| 2.71%, 06/27/24 | 600,000 | 634,122 |
| 2.75%, 05/28/25 | 400,000 | 421,872 |
| 5.18%, 11/19/25 | 400,000 | 457,516 |
| 1.85%, 03/25/26 | 400,000 | 406,724 |
| BancorpSouth Bank |
| 4.13%, 11/20/29 (a)(b) | 50,000 | 52,791 |
| Bank of America Corp. |
| 2.50%, 10/21/22 (a) | 400,000 | 401,220 |
| 3.30%, 01/11/23 | 1,250,000 | 1,301,975 |
| 4.10%, 07/24/23 | 650,000 | 695,942 |
| 3.00%, 12/20/23 (a)(b) | 1,450,000 | 1,497,154 |
| 4.13%, 01/22/24 | 500,000 | 542,675 |
| 3.55%, 03/05/24 (a)(b) | 900,000 | 940,338 |
| 4.00%, 04/01/24 | 550,000 | 598,191 |
| 1.49%, 05/19/24 (a)(b) | 150,000 | 152,513 |
| 0.52%, 06/14/24 (a)(b) | 150,000 | 149,921 |
| 3.86%, 07/23/24 (a)(b) | 500,000 | 530,190 |
| 4.20%, 08/26/24 | 800,000 | 877,584 |
| 0.81%, 10/24/24 (a)(b) | 750,000 | 753,180 |
| 4.00%, 01/22/25 | 750,000 | 821,002 |
Security
Rate, Maturity Date | Face
Amount ($) | Value ($) |
| 3.46%, 03/15/25 (a)(b) | 650,000 | 694,297 |
| 3.95%, 04/21/25 | 650,000 | 712,179 |
| 0.98%, 04/22/25 (a)(b) | 500,000 | 503,090 |
| 3.88%, 08/01/25 | 350,000 | 388,825 |
| 0.98%, 09/25/25 (a)(b) | 550,000 | 551,903 |
| 3.09%, 10/01/25 (a)(b) | 300,000 | 319,617 |
| 2.46%, 10/22/25 (a)(b) | 750,000 | 785,947 |
| 3.37%, 01/23/26 (a)(b) | 600,000 | 644,808 |
| 2.02%, 02/13/26 (a)(b) | 450,000 | 463,437 |
| 4.45%, 03/03/26 | 550,000 | 620,779 |
| 3.50%, 04/19/26 | 600,000 | 660,990 |
| 1.32%, 06/19/26 (a)(b) | 750,000 | 752,857 |
| 1.20%, 10/24/26 (a)(b) | 750,000 | 747,285 |
| 1.66%, 03/11/27 (a)(b) | 650,000 | 657,579 |
| 3.56%, 04/23/27 (a)(b) | 750,000 | 822,915 |
| 1.73%, 07/22/27 (a)(b) | 1,500,000 | 1,520,760 |
| Bank of Montreal |
| 2.35%, 09/11/22 | 350,000 | 357,787 |
| 2.55%, 11/06/22 (a) | 150,000 | 153,806 |
| 0.45%, 12/08/23 | 150,000 | 150,173 |
| 3.30%, 02/05/24 | 300,000 | 320,100 |
| 2.50%, 06/28/24 | 450,000 | 473,764 |
| 0.63%, 07/09/24 | 250,000 | 250,028 |
| 1.85%, 05/01/25 | 350,000 | 361,893 |
| 0.95%, 01/22/27 (a)(b) | 350,000 | 346,629 |
| 4.34%, 10/05/28 (a)(b) | 300,000 | 320,928 |
| BankUnited, Inc. |
| 4.88%, 11/17/25 (a) | 200,000 | 227,822 |
| Barclays Bank PLC |
| 3.75%, 05/15/24 | 200,000 | 217,012 |
| Barclays PLC |
| 3.68%, 01/10/23 (a) | 400,000 | 404,708 |
| 4.34%, 05/16/24 (a)(b) | 400,000 | 424,612 |
| 4.38%, 09/11/24 | 400,000 | 437,028 |
| 1.01%, 12/10/24 (a)(b) | 300,000 | 301,470 |
| 3.65%, 03/16/25 | 425,000 | 460,938 |
| 3.93%, 05/07/25 (a)(b) | 600,000 | 646,746 |
| 4.38%, 01/12/26 | 650,000 | 731,646 |
| 2.85%, 05/07/26 (a)(b) | 400,000 | 423,224 |
| 5.20%, 05/12/26 | 600,000 | 690,576 |
| BBVA USA |
| 2.50%, 08/27/24 (a) | 250,000 | 263,315 |
| 3.88%, 04/10/25 (a) | 250,000 | 275,570 |
| BNP Paribas S.A. |
| 3.25%, 03/03/23 | 400,000 | 418,384 |
| 4.25%, 10/15/24 | 200,000 | 219,594 |
| BPCE S.A. |
| 4.00%, 04/15/24 | 250,000 | 272,538 |
| Canadian Imperial Bank of Commerce |
| 0.45%, 06/22/23 | 300,000 | 300,102 |
| 0.95%, 06/23/23 | 500,000 | 504,710 |
Schwab Taxable Bond Funds | Annual Report
Schwab Short-Term Bond Index Fund
Portfolio Holdings as of August 31, 2021 (continued)
Security
Rate, Maturity Date | Face
Amount ($) | Value ($) |
| 3.50%, 09/13/23 | 150,000 | 159,570 |
| 0.50%, 12/14/23 | 250,000 | 249,830 |
| 3.10%, 04/02/24 | 150,000 | 159,354 |
| 2.25%, 01/28/25 | 150,000 | 156,773 |
| 0.95%, 10/23/25 | 250,000 | 249,818 |
| 1.25%, 06/22/26 | 200,000 | 200,094 |
| Capital One Bank USA NA |
| 3.38%, 02/15/23 | 250,000 | 260,575 |
| Capital One Financial Corp. |
| 3.20%, 01/30/23 (a) | 150,000 | 155,664 |
| 2.60%, 05/11/23 (a) | 150,000 | 155,345 |
| 3.50%, 06/15/23 | 500,000 | 526,905 |
| 3.90%, 01/29/24 (a) | 150,000 | 161,139 |
| 3.75%, 04/24/24 (a) | 100,000 | 107,673 |
| 3.30%, 10/30/24 (a) | 700,000 | 752,871 |
| 3.20%, 02/05/25 (a) | 350,000 | 376,547 |
| 4.25%, 04/30/25 (a) | 300,000 | 334,509 |
| 4.20%, 10/29/25 (a) | 500,000 | 557,775 |
| 3.75%, 07/28/26 (a) | 250,000 | 276,650 |
| Capital One NA |
| 2.15%, 09/06/22 (a) | 250,000 | 254,315 |
| CIT Bank NA |
| 2.97%, 09/27/25 (a)(b) | 250,000 | 264,563 |
| Citibank NA |
| 3.65%, 01/23/24 (a) | 500,000 | 536,105 |
| Citigroup, Inc. |
| 2.70%, 10/27/22 (a) | 500,000 | 513,100 |
| 3.50%, 05/15/23 | 400,000 | 420,212 |
| 3.88%, 10/25/23 | 400,000 | 430,012 |
| 1.68%, 05/15/24 (a)(b) | 250,000 | 255,210 |
| 4.04%, 06/01/24 (a)(b) | 350,000 | 371,367 |
| 3.75%, 06/16/24 | 100,000 | 108,513 |
| 4.00%, 08/05/24 | 300,000 | 326,316 |
| 0.78%, 10/30/24 (a)(b) | 500,000 | 501,665 |
| 3.88%, 03/26/25 | 200,000 | 218,952 |
| 3.35%, 04/24/25 (a)(b) | 900,000 | 959,679 |
| 3.30%, 04/27/25 | 500,000 | 542,530 |
| 0.98%, 05/01/25 (a)(b) | 500,000 | 502,440 |
| 4.40%, 06/10/25 | 700,000 | 779,667 |
| 5.50%, 09/13/25 | 400,000 | 464,852 |
| 3.70%, 01/12/26 | 500,000 | 552,870 |
| 4.60%, 03/09/26 | 350,000 | 399,094 |
| 3.11%, 04/08/26 (a)(b) | 750,000 | 802,200 |
| 3.40%, 05/01/26 | 500,000 | 548,135 |
| 1.12%, 01/28/27 (a)(b) | 750,000 | 744,585 |
| 1.46%, 06/09/27 (a)(b) | 750,000 | 751,642 |
| Citizens Bank NA |
| 3.70%, 03/29/23 (a) | 250,000 | 262,068 |
| 2.25%, 04/28/25 (a) | 250,000 | 261,558 |
| Citizens Financial Group, Inc. |
| 4.30%, 12/03/25 (a) | 200,000 | 223,096 |
| Comerica Bank |
| 2.50%, 07/23/24 | 250,000 | 263,170 |
| Comerica, Inc. |
| 3.70%, 07/31/23 (a) | 200,000 | 212,004 |
| Cooperatieve Rabobank UA |
| 3.95%, 11/09/22 | 250,000 | 260,430 |
| 2.75%, 01/10/23 | 500,000 | 516,950 |
| 4.63%, 12/01/23 | 750,000 | 816,112 |
| 3.38%, 05/21/25 | 250,000 | 273,593 |
| 4.38%, 08/04/25 | 250,000 | 279,267 |
| 3.75%, 07/21/26 | 500,000 | 553,985 |
| Credit Suisse AG |
| 1.00%, 05/05/23 | 550,000 | 555,670 |
| 0.52%, 08/09/23 | 400,000 | 400,849 |
Security
Rate, Maturity Date | Face
Amount ($) | Value ($) |
| 0.50%, 02/02/24 | 250,000 | 249,775 |
| 3.63%, 09/09/24 | 900,000 | 975,537 |
| 2.95%, 04/09/25 | 300,000 | 320,568 |
| 1.25%, 08/07/26 | 500,000 | 497,560 |
| Credit Suisse Group AG |
| 3.80%, 06/09/23 | 500,000 | 527,480 |
| 3.75%, 03/26/25 | 500,000 | 542,640 |
| 4.55%, 04/17/26 | 600,000 | 680,130 |
| Credit Suisse Group Funding Guernsey Ltd. |
| 3.80%, 09/15/22 | 500,000 | 517,780 |
| Deutsche Bank AG |
| 3.30%, 11/16/22 | 200,000 | 206,668 |
| 3.95%, 02/27/23 | 400,000 | 419,136 |
| 0.90%, 05/28/24 | 300,000 | 300,288 |
| 3.70%, 05/30/24 | 300,000 | 321,184 |
| 2.22%, 09/18/24 (a)(b) | 450,000 | 461,875 |
| 1.45%, 04/01/25 (a)(b) | 200,000 | 201,590 |
| 3.96%, 11/26/25 (a)(b) | 600,000 | 651,768 |
| 4.10%, 01/13/26 | 200,000 | 219,898 |
| 1.69%, 03/19/26 | 200,000 | 202,676 |
| 2.13%, 11/24/26 (a)(b) | 500,000 | 510,835 |
| Discover Bank |
| 4.20%, 08/08/23 | 250,000 | 267,833 |
| 2.45%, 09/12/24 (a) | 250,000 | 261,308 |
| 3.45%, 07/27/26 (a) | 250,000 | 272,948 |
| 4.68%, 08/09/28 (a)(b) | 250,000 | 265,733 |
| Discover Financial Services |
| 3.95%, 11/06/24 (a) | 250,000 | 272,295 |
| 3.75%, 03/04/25 (a) | 200,000 | 217,386 |
| 4.50%, 01/30/26 (a) | 250,000 | 282,515 |
| Fifth Third Bancorp |
| 1.63%, 05/05/23 (a) | 100,000 | 101,988 |
| 4.30%, 01/16/24 (a) | 250,000 | 270,110 |
| 3.65%, 01/25/24 (a) | 300,000 | 320,964 |
| 2.38%, 01/28/25 (a) | 250,000 | 261,740 |
| Fifth Third Bank |
| 1.80%, 01/30/23 (a) | 250,000 | 255,260 |
| 3.95%, 07/28/25 (a) | 250,000 | 279,732 |
| 3.85%, 03/15/26 (a) | 200,000 | 222,580 |
| First Citizens BancShares, Inc. |
| 3.38%, 03/15/30 (a)(b) | 50,000 | 51,280 |
| First Horizon Corp. |
| 3.55%, 05/26/23 (a) | 200,000 | 209,592 |
| 4.00%, 05/26/25 (a) | 100,000 | 109,902 |
| First Republic Bank/CA |
| 1.91%, 02/12/24 (a)(b) | 250,000 | 255,013 |
| FNB Corp/PA |
| 2.20%, 02/24/23 (a) | 50,000 | 50,810 |
| HSBC Holdings PLC |
| 3.60%, 05/25/23 | 400,000 | 422,016 |
| 3.03%, 11/22/23 (a)(b) | 350,000 | 361,389 |
| 4.25%, 03/14/24 | 650,000 | 701,226 |
| 3.95%, 05/18/24 (a)(b) | 600,000 | 634,416 |
| 0.73%, 08/17/24 (a)(b) | 400,000 | 400,668 |
| 3.80%, 03/11/25 (a)(b) | 600,000 | 643,320 |
| 0.98%, 05/24/25 (a)(b) | 200,000 | 200,210 |
| 4.25%, 08/18/25 | 350,000 | 387,257 |
| 2.63%, 11/07/25 (a)(b) | 600,000 | 628,128 |
| 4.30%, 03/08/26 | 800,000 | 901,720 |
| 1.65%, 04/18/26 (a)(b) | 625,000 | 632,912 |
| 3.90%, 05/25/26 | 800,000 | 889,840 |
| 2.10%, 06/04/26 (a)(b) | 350,000 | 359,971 |
| 4.29%, 09/12/26 (a)(b) | 600,000 | 666,732 |
| 1.59%, 05/24/27 (a)(b) | 600,000 | 602,292 |
Schwab Taxable Bond Funds | Annual Report
Schwab Short-Term Bond Index Fund
Portfolio Holdings as of August 31, 2021 (continued)
Security
Rate, Maturity Date | Face
Amount ($) | Value ($) |
| HSBC USA, Inc. |
| 3.50%, 06/23/24 | 100,000 | 107,815 |
| Huntington Bancshares, Inc. |
| 2.63%, 08/06/24 (a) | 350,000 | 368,392 |
| ING Groep N.V. |
| 4.10%, 10/02/23 | 200,000 | 214,764 |
| 3.55%, 04/09/24 | 450,000 | 483,750 |
| 1.73%, 04/01/27 (a)(b) | 400,000 | 405,584 |
| JPMorgan Chase & Co. |
| 3.25%, 09/23/22 | 850,000 | 877,540 |
| 2.97%, 01/15/23 (a) | 500,000 | 505,030 |
| 3.20%, 01/25/23 | 550,000 | 572,764 |
| 3.38%, 05/01/23 | 600,000 | 628,896 |
| 2.70%, 05/18/23 (a) | 500,000 | 518,635 |
| 3.88%, 02/01/24 | 250,000 | 270,240 |
| 0.70%, 03/16/24 (a)(b) | 500,000 | 501,785 |
| 3.56%, 04/23/24 (a)(b) | 450,000 | 472,720 |
| 3.63%, 05/13/24 | 450,000 | 486,616 |
| 1.51%, 06/01/24 (a)(b) | 400,000 | 407,488 |
| 3.80%, 07/23/24 (a)(b) | 650,000 | 689,832 |
| 3.88%, 09/10/24 | 800,000 | 870,952 |
| 0.65%, 09/16/24 (a)(b) | 300,000 | 300,933 |
| 4.02%, 12/05/24 (a)(b) | 800,000 | 859,656 |
| 3.13%, 01/23/25 (a) | 550,000 | 589,138 |
| 0.56%, 02/16/25 (a)(b) | 250,000 | 249,375 |
| 3.22%, 03/01/25 (a)(b) | 550,000 | 583,594 |
| 0.82%, 06/01/25 (a)(b) | 550,000 | 550,918 |
| 0.97%, 06/23/25 (a)(b) | 250,000 | 250,905 |
| 3.90%, 07/15/25 (a) | 600,000 | 661,572 |
| 7.75%, 07/15/25 | 100,000 | 125,294 |
| 0.77%, 08/09/25 (a)(b) | 250,000 | 249,550 |
| 2.30%, 10/15/25 (a)(b) | 650,000 | 676,780 |
| 2.01%, 03/13/26 (a)(b) | 550,000 | 567,446 |
| 3.30%, 04/01/26 (a) | 700,000 | 764,484 |
| 2.08%, 04/22/26 (a)(b) | 850,000 | 878,220 |
| 3.20%, 06/15/26 (a) | 350,000 | 381,143 |
| 1.05%, 11/19/26 (a)(b) | 850,000 | 842,664 |
| 3.96%, 01/29/27 (a)(b) | 500,000 | 556,630 |
| 1.04%, 02/04/27 (a)(b) | 500,000 | 493,990 |
| 1.58%, 04/22/27 (a)(b) | 950,000 | 959,091 |
| KeyBank NA |
| 2.30%, 09/14/22 | 250,000 | 255,368 |
| 3.38%, 03/07/23 | 250,000 | 261,515 |
| 1.25%, 03/10/23 | 250,000 | 253,588 |
| 0.42%, 01/03/24 (a)(b) | 250,000 | 250,150 |
| KeyCorp |
| 4.15%, 10/29/25 | 250,000 | 281,240 |
| Lloyds Banking Group PLC |
| 4.05%, 08/16/23 | 400,000 | 427,224 |
| 2.91%, 11/07/23 (a)(b) | 500,000 | 513,950 |
| 3.90%, 03/12/24 | 200,000 | 215,992 |
| 0.70%, 05/11/24 (a)(b) | 200,000 | 200,720 |
| 4.50%, 11/04/24 | 200,000 | 220,962 |
| 4.45%, 05/08/25 | 450,000 | 504,072 |
| 3.87%, 07/09/25 (a)(b) | 500,000 | 540,550 |
| 4.58%, 12/10/25 | 450,000 | 507,334 |
| 2.44%, 02/05/26 (a)(b) | 400,000 | 417,072 |
| 4.65%, 03/24/26 | 400,000 | 453,544 |
| 1.63%, 05/11/27 (a)(b) | 250,000 | 251,220 |
| M&T Bank Corp. |
| 3.55%, 07/26/23 (a) | 250,000 | 264,640 |
| Manufacturers & Traders Trust Co. |
| 2.90%, 02/06/25 (a) | 250,000 | 267,348 |
| Mitsubishi UFJ Financial Group, Inc. |
| 3.46%, 03/02/23 | 150,000 | 157,017 |
| 3.76%, 07/26/23 | 450,000 | 478,602 |
Security
Rate, Maturity Date | Face
Amount ($) | Value ($) |
| 3.41%, 03/07/24 | 650,000 | 695,155 |
| 2.80%, 07/18/24 | 200,000 | 211,528 |
| 0.85%, 09/15/24 (a)(b) | 800,000 | 804,128 |
| 2.19%, 02/25/25 | 550,000 | 572,225 |
| 3.78%, 03/02/25 | 250,000 | 273,870 |
| 1.41%, 07/17/25 | 400,000 | 405,000 |
| 0.95%, 07/19/25 (a)(b) | 250,000 | 251,043 |
| 3.85%, 03/01/26 | 650,000 | 725,686 |
| 1.54%, 07/20/27 (a)(b) | 550,000 | 553,448 |
| Mizuho Financial Group, Inc. |
| 2.60%, 09/11/22 | 200,000 | 204,780 |
| 3.55%, 03/05/23 | 300,000 | 314,412 |
| 1.24%, 07/10/24 (a)(b) | 250,000 | 253,023 |
| 0.85%, 09/08/24 (a)(b) | 375,000 | 376,789 |
| 3.92%, 09/11/24 (a)(b) | 200,000 | 213,222 |
| 2.84%, 07/16/25 (a)(b) | 200,000 | 211,132 |
| 2.56%, 09/13/25 (a)(b) | 200,000 | 209,788 |
| 2.23%, 05/25/26 (a)(b) | 250,000 | 259,075 |
| 1.23%, 05/22/27 (a)(b) | 400,000 | 396,796 |
| Morgan Stanley |
| 4.88%, 11/01/22 | 400,000 | 420,576 |
| 3.13%, 01/23/23 | 650,000 | 675,103 |
| 3.75%, 02/25/23 | 850,000 | 892,542 |
| 4.10%, 05/22/23 | 500,000 | 530,235 |
| 0.56%, 11/10/23 (a)(b) | 400,000 | 400,692 |
| 0.53%, 01/25/24 (a)(b) | 750,000 | 750,757 |
| 0.73%, 04/05/24 (a)(b) | 500,000 | 501,845 |
| 3.74%, 04/24/24 (a)(b) | 700,000 | 736,946 |
| 3.88%, 04/29/24 | 750,000 | 812,295 |
| 3.70%, 10/23/24 | 650,000 | 708,032 |
| 0.79%, 01/22/25 (a)(b) | 500,000 | 500,800 |
| 0.79%, 05/30/25 (a)(b) | 500,000 | 499,160 |
| 2.72%, 07/22/25 (a)(b) | 500,000 | 525,650 |
| 4.00%, 07/23/25 | 750,000 | 832,155 |
| 0.86%, 10/21/25 (a)(b) | 500,000 | 500,330 |
| 5.00%, 11/24/25 | 600,000 | 691,056 |
| 3.88%, 01/27/26 | 750,000 | 836,362 |
| 2.19%, 04/28/26 (a)(b) | 750,000 | 779,467 |
| 3.13%, 07/27/26 | 900,000 | 976,986 |
| 0.99%, 12/10/26 (a)(b) | 750,000 | 741,262 |
| 1.59%, 05/04/27 (a)(b) | 900,000 | 909,243 |
| 1.51%, 07/20/27 (a)(b) | 750,000 | 753,420 |
| National Australia Bank Ltd. |
| 1.88%, 12/13/22 | 250,000 | 255,360 |
| 2.88%, 04/12/23 | 300,000 | 312,459 |
| 3.63%, 06/20/23 | 250,000 | 264,968 |
| 2.50%, 07/12/26 | 400,000 | 427,596 |
| National Bank of Canada |
| 2.10%, 02/01/23 | 250,000 | 256,065 |
| 0.75%, 08/06/24 | 250,000 | 249,988 |
| Natwest Group PLC |
| 6.13%, 12/15/22 | 400,000 | 427,684 |
| 3.88%, 09/12/23 | 800,000 | 851,312 |
| 6.00%, 12/19/23 | 400,000 | 445,752 |
| 2.36%, 05/22/24 (a)(b) | 200,000 | 205,620 |
| 5.13%, 05/28/24 | 400,000 | 443,100 |
| 4.52%, 06/25/24 (a)(b) | 200,000 | 213,564 |
| 4.27%, 03/22/25 (a)(b) | 600,000 | 650,070 |
| 4.80%, 04/05/26 | 200,000 | 229,166 |
| 1.64%, 06/14/27 (a)(b) | 400,000 | 401,692 |
| 3.75%, 11/01/29 (a)(b) | 200,000 | 212,730 |
| Northern Trust Corp. |
| 3.95%, 10/30/25 | 200,000 | 225,518 |
| People's United Financial, Inc. |
| 3.65%, 12/06/22 (a) | 100,000 | 103,254 |
Schwab Taxable Bond Funds | Annual Report
Schwab Short-Term Bond Index Fund
Portfolio Holdings as of August 31, 2021 (continued)
Security
Rate, Maturity Date | Face
Amount ($) | Value ($) |
| PNC Bank NA |
| 2.70%, 11/01/22 (a) | 250,000 | 256,605 |
| 2.95%, 01/30/23 (a) | 250,000 | 258,668 |
| 3.50%, 06/08/23 (a) | 250,000 | 263,590 |
| 3.80%, 07/25/23 (a) | 250,000 | 265,110 |
| 2.95%, 02/23/25 (a) | 250,000 | 268,193 |
| 3.25%, 06/01/25 (a) | 250,000 | 271,788 |
| Regions Financial Corp. |
| 2.25%, 05/18/25 (a) | 200,000 | 208,952 |
| Royal Bank of Canada |
| 1.95%, 01/17/23 | 200,000 | 204,652 |
| 1.60%, 04/17/23 | 300,000 | 306,393 |
| 3.70%, 10/05/23 | 325,000 | 347,223 |
| 0.50%, 10/26/23 | 750,000 | 751,717 |
| 0.43%, 01/19/24 | 250,000 | 249,645 |
| 2.55%, 07/16/24 | 250,000 | 263,748 |
| 2.25%, 11/01/24 | 200,000 | 209,806 |
| 1.15%, 06/10/25 | 300,000 | 302,052 |
| 0.88%, 01/20/26 | 500,000 | 496,315 |
| 4.65%, 01/27/26 | 500,000 | 572,990 |
| 1.20%, 04/27/26 | 200,000 | 200,422 |
| 1.15%, 07/14/26 | 250,000 | 249,973 |
| Santander Holdings USA, Inc. |
| 3.40%, 01/18/23 (a) | 100,000 | 103,678 |
| 3.50%, 06/07/24 (a) | 100,000 | 106,739 |
| 3.45%, 06/02/25 (a) | 300,000 | 322,215 |
| 4.50%, 07/17/25 (a) | 500,000 | 554,190 |
| Santander UK Group Holdings PLC |
| 3.57%, 01/10/23 (a) | 200,000 | 202,256 |
| 3.37%, 01/05/24 (a)(b) | 250,000 | 259,120 |
| 4.80%, 11/15/24 (a)(b) | 200,000 | 217,498 |
| 1.09%, 03/15/25 (a)(b) | 200,000 | 200,760 |
| 1.53%, 08/21/26 (a)(b) | 400,000 | 401,924 |
| 1.67%, 06/14/27 (a)(b) | 250,000 | 250,683 |
| Santander UK PLC |
| 2.10%, 01/13/23 | 400,000 | 409,688 |
| 4.00%, 03/13/24 | 200,000 | 217,132 |
| 2.88%, 06/18/24 | 200,000 | 212,182 |
| Signature Bank |
| 4.00%, 10/15/30 (a)(b) | 100,000 | 107,672 |
| State Street Corp. |
| 3.10%, 05/15/23 | 250,000 | 261,793 |
| 3.70%, 11/20/23 | 350,000 | 376,635 |
| 3.78%, 12/03/24 (a)(b) | 100,000 | 107,488 |
| 3.30%, 12/16/24 | 200,000 | 217,344 |
| 3.55%, 08/18/25 | 400,000 | 442,232 |
| 2.35%, 11/01/25 (a)(b) | 450,000 | 473,134 |
| 2.90%, 03/30/26 (a)(b) | 150,000 | 160,259 |
| Sumitomo Mitsui Banking Corp. |
| 3.00%, 01/18/23 | 250,000 | 259,223 |
| 3.95%, 07/19/23 | 250,000 | 267,280 |
| 3.95%, 01/10/24 | 250,000 | 269,883 |
| 3.40%, 07/11/24 | 250,000 | 268,865 |
| Sumitomo Mitsui Financial Group, Inc. |
| 2.78%, 10/18/22 | 150,000 | 154,281 |
| 3.10%, 01/17/23 | 250,000 | 259,593 |
| 3.75%, 07/19/23 | 200,000 | 212,546 |
| 3.94%, 10/16/23 | 400,000 | 429,424 |
| 0.51%, 01/12/24 | 200,000 | 199,666 |
| 2.70%, 07/16/24 | 400,000 | 421,684 |
| 2.45%, 09/27/24 | 200,000 | 210,020 |
| 2.35%, 01/15/25 | 400,000 | 418,028 |
| 1.47%, 07/08/25 | 700,000 | 710,171 |
| 0.95%, 01/12/26 | 250,000 | 248,023 |
| 3.78%, 03/09/26 | 200,000 | 223,116 |
| 2.63%, 07/14/26 | 600,000 | 639,702 |
Security
Rate, Maturity Date | Face
Amount ($) | Value ($) |
| SVB Financial Group |
| 3.50%, 01/29/25 | 100,000 | 108,089 |
| Svenska Handelsbanken AB |
| 3.90%, 11/20/23 | 500,000 | 539,695 |
| Synchrony Financial |
| 4.38%, 03/19/24 (a) | 75,000 | 81,250 |
| 4.25%, 08/15/24 (a) | 400,000 | 434,456 |
| 4.50%, 07/23/25 (a) | 250,000 | 278,367 |
| The Bank of New York Mellon Corp. |
| 1.85%, 01/27/23 (a) | 100,000 | 102,203 |
| 2.95%, 01/29/23 (a) | 150,000 | 155,394 |
| 3.50%, 04/28/23 | 150,000 | 158,007 |
| 3.45%, 08/11/23 | 250,000 | 265,320 |
| 2.20%, 08/16/23 (a) | 350,000 | 362,082 |
| 0.35%, 12/07/23 (a) | 250,000 | 250,075 |
| 3.65%, 02/04/24 (a) | 150,000 | 161,081 |
| 3.25%, 09/11/24 (a) | 100,000 | 107,687 |
| 2.10%, 10/24/24 | 400,000 | 418,848 |
| 3.00%, 02/24/25 (a) | 200,000 | 215,280 |
| 1.60%, 04/24/25 (a) | 200,000 | 205,602 |
| 3.95%, 11/18/25 (a) | 250,000 | 280,245 |
| 0.75%, 01/28/26 (a) | 250,000 | 248,485 |
| 2.80%, 05/04/26 (a) | 200,000 | 215,662 |
| 2.45%, 08/17/26 (a) | 300,000 | 319,375 |
| The Bank of Nova Scotia |
| 2.38%, 01/18/23 | 150,000 | 154,361 |
| 1.95%, 02/01/23 | 300,000 | 307,077 |
| 1.63%, 05/01/23 | 300,000 | 306,699 |
| 0.80%, 06/15/23 | 200,000 | 201,588 |
| 0.55%, 09/15/23 | 650,000 | 652,093 |
| 3.40%, 02/11/24 | 250,000 | 266,958 |
| 0.70%, 04/15/24 | 300,000 | 300,714 |
| 2.20%, 02/03/25 | 200,000 | 209,064 |
| 1.30%, 06/11/25 | 200,000 | 202,452 |
| 4.50%, 12/16/25 | 250,000 | 283,425 |
| 1.05%, 03/02/26 | 400,000 | 398,104 |
| 1.35%, 06/24/26 | 250,000 | 252,100 |
| 2.70%, 08/03/26 | 400,000 | 428,008 |
| The Goldman Sachs Group, Inc. |
| 3.63%, 01/22/23 | 750,000 | 784,560 |
| 0.48%, 01/27/23 (a) | 500,000 | 500,170 |
| 3.20%, 02/23/23 (a) | 450,000 | 467,662 |
| 0.63%, 11/17/23 (a)(b) | 600,000 | 600,984 |
| 3.63%, 02/20/24 (a) | 350,000 | 374,615 |
| 4.00%, 03/03/24 | 850,000 | 920,541 |
| 0.67%, 03/08/24 (a)(b) | 450,000 | 450,760 |
| 3.85%, 07/08/24 (a) | 700,000 | 756,959 |
| 0.66%, 09/10/24 (a)(b) | 450,000 | 449,725 |
| 3.50%, 01/23/25 (a) | 625,000 | 673,500 |
| 3.50%, 04/01/25 (a) | 850,000 | 920,592 |
| 3.75%, 05/22/25 (a) | 500,000 | 545,290 |
| 3.27%, 09/29/25 (a)(b) | 550,000 | 589,517 |
| 4.25%, 10/21/25 | 500,000 | 558,150 |
| 0.86%, 02/12/26 (a)(b) | 250,000 | 248,653 |
| 3.75%, 02/25/26 (a) | 500,000 | 552,820 |
| 1.09%, 12/09/26 (a)(b) | 550,000 | 546,205 |
| 1.43%, 03/09/27 (a)(b) | 750,000 | 752,280 |
| The Huntington National Bank |
| 3.55%, 10/06/23 (a) | 250,000 | 265,738 |
| The PNC Financial Services Group Inc |
| 1.15%, 08/13/26 (a) | 250,000 | 251,964 |
| The PNC Financial Services Group, Inc. |
| 2.85%, 11/09/22 | 250,000 | 257,775 |
| 3.50%, 01/23/24 (a) | 200,000 | 213,830 |
| 3.90%, 04/29/24 (a) | 100,000 | 108,218 |
Schwab Taxable Bond Funds | Annual Report
Schwab Short-Term Bond Index Fund
Portfolio Holdings as of August 31, 2021 (continued)
Security
Rate, Maturity Date | Face
Amount ($) | Value ($) |
| 2.20%, 11/01/24 (a) | 200,000 | 210,176 |
| 2.60%, 07/23/26 (a) | 250,000 | 267,830 |
| The Toronto-Dominion Bank |
| 1.90%, 12/01/22 | 250,000 | 255,323 |
| 0.25%, 01/06/23 | 250,000 | 250,110 |
| 0.30%, 06/02/23 | 250,000 | 249,905 |
| 0.75%, 06/12/23 | 850,000 | 856,426 |
| 3.50%, 07/19/23 | 400,000 | 424,240 |
| 0.45%, 09/11/23 | 400,000 | 400,588 |
| 3.25%, 03/11/24 | 150,000 | 160,260 |
| 2.65%, 06/12/24 | 300,000 | 317,211 |
| 1.15%, 06/12/25 | 250,000 | 252,373 |
| 0.75%, 09/11/25 | 400,000 | 397,160 |
| 0.75%, 01/06/26 | 250,000 | 247,723 |
| 1.20%, 06/03/26 | 350,000 | 352,432 |
| Truist Bank |
| 1.25%, 03/09/23 (a) | 400,000 | 405,880 |
| 2.75%, 05/01/23 (a) | 200,000 | 207,926 |
| 3.20%, 04/01/24 (a) | 200,000 | 213,372 |
| 3.69%, 08/02/24 (a)(b) | 100,000 | 106,367 |
| 2.15%, 12/06/24 (a) | 250,000 | 261,550 |
| 1.50%, 03/10/25 (a) | 500,000 | 511,985 |
| 3.63%, 09/16/25 (a) | 300,000 | 330,150 |
| 2.64%, 09/17/29 (a)(b) | 250,000 | 261,585 |
| Truist Financial Corp. |
| 2.20%, 03/16/23 (a) | 350,000 | 359,831 |
| 3.75%, 12/06/23 (a) | 450,000 | 482,670 |
| 2.50%, 08/01/24 (a) | 200,000 | 210,818 |
| 2.85%, 10/26/24 (a) | 150,000 | 160,218 |
| 4.00%, 05/01/25 (a) | 500,000 | 554,655 |
| 1.20%, 08/05/25 (a) | 250,000 | 253,430 |
| 1.27%, 03/02/27 (a)(b) | 400,000 | 401,372 |
| US Bancorp |
| 3.70%, 01/30/24 (a) | 200,000 | 214,984 |
| 3.38%, 02/05/24 (a) | 250,000 | 266,908 |
| 2.40%, 07/30/24 (a) | 350,000 | 368,410 |
| 3.60%, 09/11/24 (a) | 300,000 | 326,082 |
| 1.45%, 05/12/25 (a) | 400,000 | 409,456 |
| 3.95%, 11/17/25 (a) | 250,000 | 280,897 |
| 3.10%, 04/27/26 (a) | 300,000 | 326,940 |
| 2.38%, 07/22/26 (a) | 400,000 | 425,744 |
| US Bank NA |
| 2.80%, 01/27/25 (a) | 250,000 | 266,958 |
| US Bank NA/Cincinnati OH |
| 1.95%, 01/09/23 (a) | 250,000 | 255,473 |
| 3.40%, 07/24/23 (a) | 250,000 | 264,200 |
| 2.05%, 01/21/25 (a) | 250,000 | 260,948 |
| Wells Fargo & Co. |
| 3.07%, 01/24/23 (a) | 250,000 | 252,823 |
| 3.45%, 02/13/23 | 500,000 | 522,155 |
| 4.13%, 08/15/23 | 400,000 | 427,964 |
| 4.48%, 01/16/24 | 100,000 | 108,884 |
| 3.75%, 01/24/24 (a) | 750,000 | 804,547 |
| 1.65%, 06/02/24 (a)(b) | 600,000 | 613,626 |
| 3.30%, 09/09/24 | 800,000 | 861,936 |
| 3.00%, 02/19/25 | 850,000 | 906,984 |
| 3.55%, 09/29/25 | 750,000 | 823,192 |
| 2.41%, 10/30/25 (a)(b) | 700,000 | 731,703 |
| 2.16%, 02/11/26 (a)(b) | 650,000 | 674,869 |
| 3.00%, 04/22/26 | 900,000 | 975,105 |
| 2.19%, 04/30/26 (a)(b) | 950,000 | 987,126 |
| 4.10%, 06/03/26 | 500,000 | 561,875 |
| 3.20%, 06/17/27 (a)(b) | 650,000 | 703,820 |
| Wells Fargo Bank NA |
| 3.55%, 08/14/23 (a) | 800,000 | 848,376 |
Security
Rate, Maturity Date | Face
Amount ($) | Value ($) |
| Western Alliance Bancorp |
| 3.00%, 06/15/31 (a)(b) | 200,000 | 205,308 |
| Westpac Banking Corp. |
| 2.75%, 01/11/23 | 500,000 | 517,280 |
| 2.00%, 01/13/23 | 150,000 | 153,612 |
| 3.65%, 05/15/23 | 500,000 | 528,725 |
| 3.30%, 02/26/24 | 150,000 | 160,553 |
| 2.35%, 02/19/25 | 200,000 | 210,834 |
| 2.85%, 05/13/26 | 400,000 | 433,788 |
| 1.15%, 06/03/26 | 250,000 | 251,823 |
| 2.70%, 08/19/26 | 300,000 | 324,571 |
| 2.89%, 02/04/30 (a)(b) | 400,000 | 416,572 |
| | | 198,234,640 |
| Brokerage/Asset Managers/Exchanges 0.4% |
| Affiliated Managers Group, Inc. |
| 4.25%, 02/15/24 | 100,000 | 108,610 |
| 3.50%, 08/01/25 | 200,000 | 217,942 |
| Ameriprise Financial, Inc. |
| 4.00%, 10/15/23 | 150,000 | 161,292 |
| 3.70%, 10/15/24 | 250,000 | 273,112 |
| 3.00%, 04/02/25 (a) | 200,000 | 213,642 |
| BGC Partners, Inc. |
| 5.38%, 07/24/23 | 250,000 | 269,345 |
| 3.75%, 10/01/24 (a) | 100,000 | 106,404 |
| BlackRock, Inc. |
| 3.50%, 03/18/24 | 250,000 | 269,625 |
| Brookfield Asset Management, Inc. |
| 4.00%, 01/15/25 (a) | 100,000 | 109,487 |
| Brookfield Finance, Inc. |
| 4.00%, 04/01/24 (a) | 300,000 | 323,739 |
| CME Group, Inc. |
| 3.00%, 09/15/22 | 250,000 | 257,077 |
| 3.00%, 03/15/25 (a) | 400,000 | 428,684 |
| Eaton Vance Corp. |
| 3.63%, 06/15/23 | 100,000 | 105,455 |
| Franklin Resources, Inc. |
| 2.85%, 03/30/25 | 100,000 | 106,957 |
| Intercontinental Exchange, Inc. |
| 2.35%, 09/15/22 (a) | 100,000 | 101,953 |
| 0.70%, 06/15/23 | 300,000 | 301,380 |
| 3.45%, 09/21/23 (a) | 200,000 | 211,856 |
| 4.00%, 10/15/23 | 100,000 | 107,290 |
| 3.75%, 12/01/25 (a) | 500,000 | 552,650 |
| Invesco Finance PLC |
| 3.13%, 11/30/22 | 100,000 | 103,410 |
| 4.00%, 01/30/24 | 100,000 | 107,863 |
| 3.75%, 01/15/26 | 150,000 | 166,046 |
| Jefferies Financial Group, Inc. |
| 5.50%, 10/18/23 (a) | 100,000 | 106,916 |
| Jefferies Group LLC |
| 5.13%, 01/20/23 | 250,000 | 265,465 |
| Lazard Group LLC |
| 3.75%, 02/13/25 | 100,000 | 108,742 |
| Legg Mason, Inc. |
| 4.75%, 03/15/26 | 150,000 | 173,737 |
| Nasdaq, Inc. |
| 0.45%, 12/21/22 (a) | 250,000 | 250,062 |
| 4.25%, 06/01/24 (a) | 50,000 | 54,476 |
| Nomura Holdings, Inc. |
| 2.65%, 01/16/25 | 400,000 | 419,240 |
| 1.85%, 07/16/25 | 400,000 | 408,660 |
| 1.65%, 07/14/26 | 400,000 | 400,796 |
Schwab Taxable Bond Funds | Annual Report
Schwab Short-Term Bond Index Fund
Portfolio Holdings as of August 31, 2021 (continued)
Security
Rate, Maturity Date | Face
Amount ($) | Value ($) |
| Stifel Financial Corp. |
| 4.25%, 07/18/24 | 200,000 | 219,060 |
| TD Ameritrade Holding Corp. |
| 3.63%, 04/01/25 (a)(c) | 100,000 | 109,256 |
| The Charles Schwab Corp. |
| 2.65%, 01/25/23 (a)(c) | 75,000 | 77,335 |
| 3.55%, 02/01/24 (a)(c) | 100,000 | 107,332 |
| 0.75%, 03/18/24 (a)(c) | 350,000 | 352,383 |
| 3.00%, 03/10/25 (a)(c) | 50,000 | 53,594 |
| 4.20%, 03/24/25 (a)(c) | 100,000 | 111,511 |
| 3.85%, 05/21/25 (a)(c) | 150,000 | 165,626 |
| 3.45%, 02/13/26 (a)(c) | 50,000 | 55,197 |
| 0.90%, 03/11/26 (a)(c) | 250,000 | 249,300 |
| 1.15%, 05/13/26 (a)(c) | 200,000 | 201,410 |
| | | 8,493,917 |
| Finance Companies 0.5% |
| AerCap Ireland Capital DAC/AerCap Global Aviation Trust |
| 3.30%, 01/23/23 (a) | 200,000 | 206,552 |
| 4.13%, 07/03/23 (a) | 200,000 | 211,168 |
| 4.50%, 09/15/23 (a) | 250,000 | 266,940 |
| 4.88%, 01/16/24 (a) | 300,000 | 325,239 |
| 3.15%, 02/15/24 (a) | 300,000 | 313,779 |
| 2.88%, 08/14/24 (a) | 150,000 | 156,450 |
| 3.50%, 01/15/25 (a) | 300,000 | 317,829 |
| 6.50%, 07/15/25 (a) | 350,000 | 409,059 |
| 4.45%, 10/01/25 (a) | 150,000 | 164,526 |
| 1.75%, 01/30/26 (a) | 250,000 | 247,517 |
| Air Lease Corp. |
| 2.25%, 01/15/23 | 100,000 | 102,366 |
| 2.75%, 01/15/23 (a) | 350,000 | 360,031 |
| 3.88%, 07/03/23 (a) | 150,000 | 158,462 |
| 3.00%, 09/15/23 (a) | 100,000 | 104,255 |
| 4.25%, 02/01/24 (a) | 300,000 | 323,406 |
| 0.70%, 02/15/24 (a) | 250,000 | 249,227 |
| 4.25%, 09/15/24 (a) | 100,000 | 108,864 |
| 2.30%, 02/01/25 (a) | 200,000 | 206,784 |
| 3.25%, 03/01/25 (a) | 200,000 | 212,548 |
| 3.38%, 07/01/25 (a) | 125,000 | 133,970 |
| 2.88%, 01/15/26 (a) | 400,000 | 420,684 |
| 3.75%, 06/01/26 (a) | 150,000 | 163,938 |
| 1.88%, 08/15/26 (a) | 350,000 | 351,232 |
| Aircastle Ltd. |
| 4.40%, 09/25/23 (a) | 150,000 | 160,097 |
| 4.13%, 05/01/24 (a) | 300,000 | 319,977 |
| 4.25%, 06/15/26 (a) | 150,000 | 165,028 |
| Ares Capital Corp. |
| 3.50%, 02/10/23 (a) | 75,000 | 77,665 |
| 4.20%, 06/10/24 (a) | 400,000 | 430,240 |
| 4.25%, 03/01/25 (a) | 100,000 | 108,096 |
| 3.25%, 07/15/25 (a) | 300,000 | 317,013 |
| 3.88%, 01/15/26 (a) | 250,000 | 269,345 |
| 2.15%, 07/15/26 (a) | 250,000 | 251,822 |
| Bain Capital Specialty Finance, Inc. |
| 2.95%, 03/10/26 (a) | 100,000 | 102,942 |
| BlackRock TCP Capital Corp. |
| 2.85%, 02/09/26 (a) | 100,000 | 102,401 |
| FS KKR Capital Corp. |
| 4.63%, 07/15/24 (a) | 100,000 | 107,961 |
| 4.13%, 02/01/25 (a) | 50,000 | 53,233 |
| 3.40%, 01/15/26 (a) | 250,000 | 261,375 |
| GATX Corp. |
| 4.35%, 02/15/24 (a) | 100,000 | 108,283 |
| GE Capital Funding LLC |
| 3.45%, 05/15/25 (a) | 400,000 | 433,664 |
Security
Rate, Maturity Date | Face
Amount ($) | Value ($) |
| GE Capital International Funding Co. |
| 3.37%, 11/15/25 | 500,000 | 546,925 |
| Goldman Sachs BDC, Inc. |
| 3.75%, 02/10/25 (a) | 50,000 | 53,444 |
| 2.88%, 01/15/26 (a) | 300,000 | 310,710 |
| Golub Capital BDC, Inc. |
| 3.38%, 04/15/24 (a) | 100,000 | 104,829 |
| 2.50%, 08/24/26 (a) | 100,000 | 101,779 |
| Main Street Capital Corp. |
| 5.20%, 05/01/24 | 50,000 | 54,310 |
| 3.00%, 07/14/26 (a) | 150,000 | 155,055 |
| Oaktree Specialty Lending Corp. |
| 3.50%, 02/25/25 (a) | 50,000 | 52,607 |
| Owl Rock Capital Corp. |
| 5.25%, 04/15/24 (a) | 150,000 | 164,329 |
| 4.00%, 03/30/25 (a) | 50,000 | 53,187 |
| 3.75%, 07/22/25 (a) | 250,000 | 264,520 |
| 3.40%, 07/15/26 (a) | 250,000 | 261,800 |
| Prospect Capital Corp. |
| 3.71%, 01/22/26 (a) | 150,000 | 154,974 |
| Sixth Street Specialty Lending, Inc. |
| 3.88%, 11/01/24 (a) | 100,000 | 107,085 |
| | | 11,169,522 |
| Financial Other 0.0% |
| Blackstone Secured Lending Fund |
| 3.65%, 07/14/23 | 200,000 | 208,890 |
| 3.63%, 01/15/26 (a) | 200,000 | 212,938 |
| ORIX Corp. |
| 4.05%, 01/16/24 | 150,000 | 161,739 |
| 3.25%, 12/04/24 | 200,000 | 215,410 |
| | | 798,977 |
| Insurance 0.8% |
| Aetna, Inc. |
| 2.75%, 11/15/22 (a) | 350,000 | 357,945 |
| 2.80%, 06/15/23 (a) | 300,000 | 311,319 |
| 3.50%, 11/15/24 (a) | 300,000 | 323,403 |
| Aflac, Inc. |
| 3.63%, 11/15/24 | 250,000 | 273,560 |
| 1.13%, 03/15/26 (a) | 100,000 | 100,644 |
| Allied World Assurance Co., Holdings Ltd. |
| 4.35%, 10/29/25 (a) | 150,000 | 164,219 |
| American International Group, Inc. |
| 4.13%, 02/15/24 | 400,000 | 433,452 |
| 2.50%, 06/30/25 (a) | 250,000 | 263,083 |
| 3.75%, 07/10/25 (a) | 500,000 | 548,670 |
| 3.90%, 04/01/26 (a) | 500,000 | 555,900 |
| Anthem, Inc. |
| 3.30%, 01/15/23 | 200,000 | 207,988 |
| 3.50%, 08/15/24 (a) | 350,000 | 375,952 |
| 3.35%, 12/01/24 (a) | 200,000 | 216,014 |
| 2.38%, 01/15/25 (a) | 300,000 | 314,064 |
| 1.50%, 03/15/26 (a) | 200,000 | 203,252 |
| Aon Corp. |
| 2.20%, 11/15/22 | 200,000 | 204,442 |
| Aon PLC |
| 4.00%, 11/27/23 (a) | 100,000 | 106,825 |
| 3.50%, 06/14/24 (a) | 250,000 | 268,190 |
| 3.88%, 12/15/25 (a) | 200,000 | 221,776 |
| Aspen Insurance Holdings Ltd. |
| 4.65%, 11/15/23 | 100,000 | 108,407 |
Schwab Taxable Bond Funds | Annual Report
Schwab Short-Term Bond Index Fund
Portfolio Holdings as of August 31, 2021 (continued)
Security
Rate, Maturity Date | Face
Amount ($) | Value ($) |
| Assurant, Inc. |
| 4.20%, 09/27/23 (a) | 100,000 | 106,942 |
| Assured Guaranty US Holdings, Inc. |
| 5.00%, 07/01/24 | 300,000 | 335,163 |
| Berkshire Hathaway, Inc. |
| 3.00%, 02/11/23 | 100,000 | 103,959 |
| 2.75%, 03/15/23 (a) | 350,000 | 361,987 |
| 3.13%, 03/15/26 (a) | 700,000 | 766,325 |
| Brown & Brown, Inc. |
| 4.20%, 09/15/24 (a) | 300,000 | 328,089 |
| Chubb INA Holdings, Inc. |
| 2.88%, 11/03/22 (a) | 100,000 | 102,661 |
| 2.70%, 03/13/23 | 150,000 | 155,505 |
| 3.35%, 05/15/24 | 100,000 | 107,483 |
| 3.15%, 03/15/25 | 450,000 | 486,378 |
| 3.35%, 05/03/26 (a) | 400,000 | 440,020 |
| CNA Financial Corp. |
| 3.95%, 05/15/24 (a) | 100,000 | 107,931 |
| 4.50%, 03/01/26 (a) | 150,000 | 170,103 |
| CNO Financial Group, Inc. |
| 5.25%, 05/30/25 (a) | 200,000 | 226,554 |
| Equitable Holdings, Inc. |
| 3.90%, 04/20/23 (a) | 65,000 | 68,461 |
| Fidelity National Financial, Inc. |
| 5.50%, 09/01/22 | 100,000 | 104,969 |
| Globe Life, Inc. |
| 3.80%, 09/15/22 | 100,000 | 103,538 |
| Humana, Inc. |
| 3.15%, 12/01/22 (a) | 200,000 | 205,548 |
| 2.90%, 12/15/22 (a) | 50,000 | 51,490 |
| 0.65%, 08/03/23 (a) | 400,000 | 400,264 |
| 3.85%, 10/01/24 (a) | 100,000 | 108,469 |
| 4.50%, 04/01/25 (a) | 250,000 | 279,077 |
| Kemper Corp. |
| 4.35%, 02/15/25 (a) | 100,000 | 109,421 |
| Lincoln National Corp. |
| 4.00%, 09/01/23 | 150,000 | 160,362 |
| Loews Corp. |
| 2.63%, 05/15/23 (a) | 150,000 | 154,958 |
| Manulife Financial Corp. |
| 4.15%, 03/04/26 | 250,000 | 282,367 |
| Marsh & McLennan Cos., Inc. |
| 3.30%, 03/14/23 (a) | 100,000 | 104,066 |
| 3.88%, 03/15/24 (a) | 250,000 | 269,897 |
| 3.50%, 06/03/24 (a) | 100,000 | 107,221 |
| 3.50%, 03/10/25 (a) | 150,000 | 162,840 |
| 3.75%, 03/14/26 (a) | 200,000 | 222,188 |
| MetLife, Inc. |
| 4.37%, 09/15/23 | 300,000 | 323,940 |
| 3.60%, 04/10/24 | 150,000 | 161,864 |
| 3.60%, 11/13/25 (a) | 250,000 | 275,982 |
| Old Republic International Corp. |
| 4.88%, 10/01/24 (a) | 300,000 | 334,488 |
| Principal Financial Group, Inc. |
| 3.30%, 09/15/22 | 100,000 | 103,056 |
| 3.13%, 05/15/23 | 200,000 | 209,106 |
| Prudential Financial, Inc. |
| 1.50%, 03/10/26 (a) | 100,000 | 102,025 |
| 5.88%, 09/15/42 (a)(b) | 250,000 | 262,663 |
| 5.63%, 06/15/43 (a)(b) | 350,000 | 374,479 |
| 5.20%, 03/15/44 (a)(b) | 200,000 | 215,866 |
| 5.38%, 05/15/45 (a)(b) | 200,000 | 222,346 |
Security
Rate, Maturity Date | Face
Amount ($) | Value ($) |
| Reinsurance Group of America, Inc. |
| 4.70%, 09/15/23 | 100,000 | 108,129 |
| The Allstate Corp. |
| 3.15%, 06/15/23 | 250,000 | 262,538 |
| 0.75%, 12/15/25 (a) | 150,000 | 149,160 |
| 5.75%, 08/15/53 (a)(b) | 175,000 | 190,075 |
| Trinity Acquisition PLC |
| 4.40%, 03/15/26 (a) | 150,000 | 169,079 |
| UnitedHealth Group, Inc. |
| 2.38%, 10/15/22 | 250,000 | 255,965 |
| 2.75%, 02/15/23 (a) | 250,000 | 257,575 |
| 2.88%, 03/15/23 | 300,000 | 311,967 |
| 3.50%, 06/15/23 | 100,000 | 105,660 |
| 3.50%, 02/15/24 | 297,000 | 318,743 |
| 2.38%, 08/15/24 | 100,000 | 105,389 |
| 3.75%, 07/15/25 | 500,000 | 555,680 |
| 3.70%, 12/15/25 | 200,000 | 223,008 |
| 1.25%, 01/15/26 | 250,000 | 253,345 |
| 3.10%, 03/15/26 | 400,000 | 437,248 |
| Unum Group |
| 4.00%, 03/15/24 | 70,000 | 75,357 |
| Voya Financial, Inc. |
| 3.13%, 07/15/24 (a) | 100,000 | 106,313 |
| 5.65%, 05/15/53 (a)(b) | 300,000 | 317,805 |
| Willis North America, Inc. |
| 3.60%, 05/15/24 (a) | 100,000 | 107,123 |
| XLIT Ltd. |
| 4.45%, 03/31/25 | 100,000 | 111,933 |
| | | 19,261,248 |
| REITs 0.7% |
| Alexandria Real Estate Equities, Inc. |
| 3.45%, 04/30/25 (a) | 200,000 | 217,202 |
| American Campus Communities Operating Partnership LP |
| 3.75%, 04/15/23 (a) | 100,000 | 104,375 |
| 4.13%, 07/01/24 (a) | 150,000 | 163,448 |
| AvalonBay Communities, Inc. |
| 2.95%, 09/15/22 | 100,000 | 102,035 |
| 3.50%, 11/15/24 (a) | 100,000 | 108,005 |
| 3.45%, 06/01/25 (a) | 200,000 | 217,988 |
| 3.50%, 11/15/25 (a) | 200,000 | 219,406 |
| Boston Properties LP |
| 3.85%, 02/01/23 (a) | 250,000 | 259,672 |
| 3.13%, 09/01/23 (a) | 200,000 | 209,236 |
| 3.80%, 02/01/24 (a) | 150,000 | 159,897 |
| 3.20%, 01/15/25 (a) | 200,000 | 213,692 |
| 3.65%, 02/01/26 (a) | 300,000 | 330,414 |
| Brixmor Operating Partnership LP |
| 3.25%, 09/15/23 | 100,000 | 105,151 |
| 3.65%, 06/15/24 (a) | 100,000 | 107,269 |
| 3.85%, 02/01/25 (a) | 100,000 | 108,551 |
| 4.13%, 06/15/26 (a) | 100,000 | 111,942 |
| Columbia Property Trust Operating Partnership LP |
| 4.15%, 04/01/25 (a) | 150,000 | 159,994 |
| Corporate Office Properties LP |
| 2.25%, 03/15/26 (a) | 100,000 | 103,159 |
| CyrusOne LP/CyrusOne Finance Corp. |
| 2.90%, 11/15/24 (a) | 300,000 | 315,111 |
| Digital Realty Trust LP |
| 4.75%, 10/01/25 (a) | 200,000 | 227,066 |
| Duke Realty LP |
| 3.25%, 06/30/26 (a) | 100,000 | 108,785 |
Schwab Taxable Bond Funds | Annual Report
Schwab Short-Term Bond Index Fund
Portfolio Holdings as of August 31, 2021 (continued)
Security
Rate, Maturity Date | Face
Amount ($) | Value ($) |
| ERP Operating LP |
| 3.00%, 04/15/23 (a) | 150,000 | 155,432 |
| 3.38%, 06/01/25 (a) | 100,000 | 108,337 |
| Essex Portfolio LP |
| 3.25%, 05/01/23 (a) | 100,000 | 103,908 |
| 3.88%, 05/01/24 (a) | 100,000 | 107,402 |
| 3.50%, 04/01/25 (a) | 150,000 | 162,506 |
| Federal Realty Investment Trust |
| 3.95%, 01/15/24 (a) | 75,000 | 80,190 |
| 1.25%, 02/15/26 (a) | 200,000 | 199,754 |
| Healthcare Trust of America Holdings LP |
| 3.50%, 08/01/26 (a) | 150,000 | 164,149 |
| Healthpeak Properties, Inc. |
| 3.40%, 02/01/25 (a) | 100,000 | 107,396 |
| 4.00%, 06/01/25 (a) | 200,000 | 220,474 |
| 3.25%, 07/15/26 (a) | 200,000 | 217,756 |
| Host Hotels & Resorts LP |
| 3.75%, 10/15/23 (a) | 150,000 | 157,859 |
| 3.88%, 04/01/24 (a) | 100,000 | 106,561 |
| 4.00%, 06/15/25 (a) | 100,000 | 108,186 |
| 4.50%, 02/01/26 (a) | 100,000 | 110,501 |
| Kilroy Realty LP |
| 3.80%, 01/15/23 (a) | 200,000 | 207,126 |
| 3.45%, 12/15/24 (a) | 100,000 | 107,059 |
| Kimco Realty Corp. |
| 3.40%, 11/01/22 (a) | 175,000 | 180,262 |
| 2.70%, 03/01/24 (a) | 200,000 | 208,934 |
| 3.30%, 02/01/25 (a) | 200,000 | 214,930 |
| LifeStorage LP/CA |
| 3.50%, 07/01/26 (a) | 200,000 | 219,922 |
| Mid-America Apartments LP |
| 4.30%, 10/15/23 (a) | 100,000 | 106,981 |
| 3.75%, 06/15/24 (a) | 100,000 | 107,616 |
| 4.00%, 11/15/25 (a) | 250,000 | 277,542 |
| National Retail Properties, Inc. |
| 3.90%, 06/15/24 (a) | 100,000 | 107,910 |
| 4.00%, 11/15/25 (a) | 200,000 | 221,990 |
| Office Properties Income Trust |
| 4.25%, 05/15/24 (a) | 100,000 | 106,787 |
| 4.50%, 02/01/25 (a) | 250,000 | 270,470 |
| Omega Healthcare Investors, Inc. |
| 4.38%, 08/01/23 (a) | 100,000 | 106,237 |
| 4.50%, 01/15/25 (a) | 100,000 | 109,842 |
| 5.25%, 01/15/26 (a) | 250,000 | 285,730 |
| Piedmont Operating Partnership LP |
| 3.40%, 06/01/23 (a) | 100,000 | 103,823 |
| 4.45%, 03/15/24 (a) | 300,000 | 322,422 |
| Public Storage |
| 2.37%, 09/15/22 (a) | 100,000 | 102,001 |
| 0.88%, 02/15/26 (a) | 150,000 | 149,102 |
| Realty Income Corp. |
| 4.65%, 08/01/23 (a) | 350,000 | 374,566 |
| 3.88%, 04/15/25 (a) | 250,000 | 275,422 |
| Sabra Health Care LP |
| 4.80%, 06/01/24 (a) | 100,000 | 109,476 |
| 5.13%, 08/15/26 (a) | 150,000 | 169,241 |
| Simon Property Group LP |
| 2.75%, 02/01/23 | 100,000 | 102,819 |
| 2.75%, 06/01/23 (a) | 250,000 | 259,075 |
| 3.75%, 02/01/24 (a) | 100,000 | 106,936 |
| 2.00%, 09/13/24 (a) | 300,000 | 310,893 |
| 3.38%, 10/01/24 (a) | 300,000 | 322,233 |
| 3.50%, 09/01/25 (a) | 350,000 | 381,972 |
| 3.30%, 01/15/26 (a) | 100,000 | 108,508 |
Security
Rate, Maturity Date | Face
Amount ($) | Value ($) |
| SITE Centers Corp. |
| 3.63%, 02/01/25 (a) | 50,000 | 53,043 |
| 4.25%, 02/01/26 (a) | 100,000 | 109,575 |
| SL Green Operating Partnership LP |
| 3.25%, 10/15/22 (a) | 400,000 | 410,776 |
| Ventas Realty LP |
| 3.13%, 06/15/23 | 150,000 | 157,211 |
| 3.50%, 04/15/24 (a) | 100,000 | 106,590 |
| 3.75%, 05/01/24 (a) | 100,000 | 106,949 |
| 2.65%, 01/15/25 (a) | 100,000 | 104,935 |
| 3.50%, 02/01/25 (a) | 100,000 | 107,545 |
| 4.13%, 01/15/26 (a) | 200,000 | 222,672 |
| VEREIT Operating Partnership LP |
| 4.60%, 02/06/24 (a) | 100,000 | 108,374 |
| 4.63%, 11/01/25 (a) | 250,000 | 283,425 |
| Vornado Realty LP |
| 3.50%, 01/15/25 (a) | 100,000 | 106,610 |
| 2.15%, 06/01/26 (a) | 100,000 | 102,426 |
| Welltower, Inc. |
| 4.50%, 01/15/24 (a) | 300,000 | 324,012 |
| 3.63%, 03/15/24 (a) | 250,000 | 267,067 |
| 4.00%, 06/01/25 (a) | 300,000 | 330,105 |
| WP Carey, Inc. |
| 4.00%, 02/01/25 (a) | 250,000 | 272,447 |
| | | 14,974,398 |
| | | 252,932,702 |
| |
| Industrial 13.5% |
| Basic Industry 0.5% |
| Air Products & Chemicals, Inc. |
| 2.75%, 02/03/23 | 79,000 | 81,726 |
| 3.35%, 07/31/24 (a) | 100,000 | 107,369 |
| 1.50%, 10/15/25 (a) | 200,000 | 205,304 |
| Albemarle Corp. |
| 4.15%, 12/01/24 (a) | 100,000 | 109,161 |
| BHP Billiton Finance (USA) Ltd. |
| 3.85%, 09/30/23 | 200,000 | 214,608 |
| Celanese US Holdings LLC |
| 3.50%, 05/08/24 (a) | 100,000 | 106,849 |
| 1.40%, 08/05/26 (a) | 150,000 | 149,745 |
| Celulosa Arauco y Constitucion S.A. |
| 4.50%, 08/01/24 (a) | 200,000 | 216,144 |
| DuPont de Nemours, Inc. |
| 4.21%, 11/15/23 (a) | 650,000 | 700,082 |
| 4.49%, 11/15/25 (a) | 500,000 | 564,880 |
| Eastman Chemical Co. |
| 3.80%, 03/15/25 (a) | 200,000 | 218,084 |
| Ecolab, Inc. |
| 2.38%, 08/10/22 | 100,000 | 101,859 |
| 3.25%, 01/14/23 | 100,000 | 103,495 |
| EI du Pont de Nemours & Co. |
| 1.70%, 07/15/25 (a) | 100,000 | 102,682 |
| FMC Corp. |
| 4.10%, 02/01/24 (a) | 100,000 | 106,938 |
| International Paper Co. |
| 3.80%, 01/15/26 (a) | 100,000 | 111,118 |
| Kinross Gold Corp. |
| 5.95%, 03/15/24 (a) | 350,000 | 389,266 |
| Linde, Inc. |
| 2.70%, 02/21/23 (a) | 100,000 | 103,042 |
| 2.65%, 02/05/25 (a) | 200,000 | 211,870 |
| 3.20%, 01/30/26 (a) | 100,000 | 109,200 |
Schwab Taxable Bond Funds | Annual Report
Schwab Short-Term Bond Index Fund
Portfolio Holdings as of August 31, 2021 (continued)
Security
Rate, Maturity Date | Face
Amount ($) | Value ($) |
| LYB International Finance BV |
| 4.00%, 07/15/23 | 255,000 | 271,440 |
| LYB International Finance III LLC |
| 1.25%, 10/01/25 (a) | 250,000 | 250,400 |
| LyondellBasell Industries N.V. |
| 5.75%, 04/15/24 (a) | 250,000 | 279,157 |
| Newmont Corp. |
| 3.70%, 03/15/23 (a) | 27,000 | 28,084 |
| Nucor Corp. |
| 4.13%, 09/15/22 (a) | 50,000 | 51,500 |
| 4.00%, 08/01/23 (a) | 100,000 | 105,985 |
| 2.00%, 06/01/25 (a) | 200,000 | 207,352 |
| Nutrien Ltd. |
| 3.15%, 10/01/22 (a) | 200,000 | 204,652 |
| 1.90%, 05/13/23 | 200,000 | 204,684 |
| 3.50%, 06/01/23 (a) | 250,000 | 261,060 |
| 3.38%, 03/15/25 (a) | 300,000 | 323,580 |
| 3.00%, 04/01/25 (a) | 100,000 | 106,557 |
| Packaging Corp. of America |
| 4.50%, 11/01/23 (a) | 300,000 | 322,734 |
| 3.65%, 09/15/24 (a) | 100,000 | 107,868 |
| PPG Industries, Inc. |
| 3.20%, 03/15/23 (a) | 100,000 | 104,002 |
| 2.40%, 08/15/24 (a) | 100,000 | 104,825 |
| 1.20%, 03/15/26 (a) | 200,000 | 200,188 |
| Reliance Steel & Aluminum Co. |
| 1.30%, 08/15/25 (a) | 100,000 | 100,425 |
| Rio Tinto Finance (USA) Ltd. |
| 3.75%, 06/15/25 (a) | 250,000 | 275,550 |
| RPM International, Inc. |
| 3.45%, 11/15/22 (a) | 100,000 | 102,750 |
| Southern Copper Corp. |
| 3.88%, 04/23/25 | 250,000 | 272,572 |
| Steel Dynamics, Inc. |
| 2.80%, 12/15/24 (a) | 150,000 | 158,153 |
| 2.40%, 06/15/25 (a) | 100,000 | 104,351 |
| The Dow Chemical Co. |
| 4.55%, 11/30/25 (a) | 150,000 | 170,651 |
| 3.63%, 05/15/26 (a) | 200,000 | 221,562 |
| The Mosaic Co. |
| 3.25%, 11/15/22 (a) | 250,000 | 257,792 |
| 4.25%, 11/15/23 (a) | 200,000 | 214,084 |
| The Sherwin-Williams Co. |
| 3.13%, 06/01/24 (a) | 100,000 | 106,385 |
| 3.45%, 08/01/25 (a) | 200,000 | 217,782 |
| 3.95%, 01/15/26 (a) | 100,000 | 111,272 |
| Vale Overseas Ltd. |
| 6.25%, 08/10/26 | 550,000 | 663,209 |
| Westlake Chemical Corp. |
| 0.88%, 08/15/24 (a) | 150,000 | 150,104 |
| WRKCo, Inc. |
| 3.00%, 09/15/24 (a) | 100,000 | 105,782 |
| 3.75%, 03/15/25 (a) | 350,000 | 381,318 |
| 4.65%, 03/15/26 (a) | 200,000 | 228,108 |
| | | 10,989,340 |
| Capital Goods 1.4% |
| 3M Co. |
| 1.75%, 02/14/23 (a) | 200,000 | 204,180 |
| 2.25%, 03/15/23 (a) | 150,000 | 154,242 |
| 3.25%, 02/14/24 (a) | 350,000 | 372,974 |
| 2.00%, 02/14/25 (a) | 100,000 | 104,052 |
| 2.65%, 04/15/25 (a) | 350,000 | 371,997 |
Security
Rate, Maturity Date | Face
Amount ($) | Value ($) |
| Allegion US Holding Co., Inc. |
| 3.20%, 10/01/24 (a) | 100,000 | 106,274 |
| Amcor Finance USA, Inc. |
| 3.63%, 04/28/26 (a) | 100,000 | 109,975 |
| Amphenol Corp. |
| 3.20%, 04/01/24 (a) | 100,000 | 105,862 |
| Berry Global, Inc. |
| 0.95%, 02/15/24 (a)(d) | 400,000 | 401,372 |
| 1.57%, 01/15/26 (a)(d) | 250,000 | 252,300 |
| Carlisle Cos., Inc. |
| 3.50%, 12/01/24 (a) | 100,000 | 107,655 |
| Carrier Global Corp. |
| 2.24%, 02/15/25 (a) | 700,000 | 729,071 |
| Caterpillar Financial Services Corp. |
| 1.90%, 09/06/22 | 300,000 | 305,169 |
| 1.95%, 11/18/22 | 200,000 | 204,174 |
| 2.55%, 11/29/22 | 125,000 | 128,615 |
| 0.25%, 03/01/23 | 300,000 | 300,015 |
| 2.63%, 03/01/23 | 100,000 | 103,519 |
| 3.45%, 05/15/23 | 150,000 | 157,992 |
| 0.65%, 07/07/23 | 350,000 | 352,331 |
| 0.45%, 09/14/23 | 400,000 | 401,156 |
| 3.75%, 11/24/23 | 100,000 | 107,553 |
| 3.65%, 12/07/23 | 100,000 | 107,384 |
| 0.45%, 05/17/24 | 300,000 | 299,601 |
| 2.85%, 05/17/24 | 100,000 | 106,270 |
| 3.30%, 06/09/24 | 100,000 | 107,600 |
| 2.15%, 11/08/24 | 200,000 | 209,678 |
| 3.25%, 12/01/24 | 100,000 | 108,622 |
| 1.45%, 05/15/25 | 200,000 | 204,714 |
| 0.80%, 11/13/25 | 400,000 | 399,532 |
| 0.90%, 03/02/26 | 150,000 | 150,081 |
| Caterpillar, Inc. |
| 3.40%, 05/15/24 (a) | 100,000 | 107,223 |
| CNH Industrial Capital LLC |
| 1.95%, 07/02/23 | 250,000 | 256,180 |
| 4.20%, 01/15/24 | 50,000 | 53,931 |
| 1.88%, 01/15/26 (a) | 200,000 | 204,608 |
| CNH Industrial N.V. |
| 4.50%, 08/15/23 | 100,000 | 107,267 |
| Deere & Co. |
| 2.75%, 04/15/25 (a) | 250,000 | 266,432 |
| Dover Corp. |
| 3.15%, 11/15/25 (a) | 200,000 | 215,548 |
| Eaton Corp. |
| 2.75%, 11/02/22 | 450,000 | 462,771 |
| Emerson Electric Co. |
| 2.63%, 02/15/23 (a) | 200,000 | 205,804 |
| Flowserve Corp. |
| 3.50%, 09/15/22 (a) | 100,000 | 102,150 |
| 4.00%, 11/15/23 (a) | 100,000 | 106,038 |
| Fortive Corp. |
| 3.15%, 06/15/26 (a) | 250,000 | 271,810 |
| Fortune Brands Home & Security, Inc. |
| 4.00%, 09/21/23 (a) | 350,000 | 373,730 |
| General Dynamics Corp. |
| 2.25%, 11/15/22 (a) | 300,000 | 305,745 |
| 3.38%, 05/15/23 (a) | 300,000 | 315,069 |
| 1.88%, 08/15/23 (a) | 200,000 | 205,464 |
| 3.25%, 04/01/25 (a) | 325,000 | 351,227 |
| 1.15%, 06/01/26 (a) | 150,000 | 151,659 |
Schwab Taxable Bond Funds | Annual Report
Schwab Short-Term Bond Index Fund
Portfolio Holdings as of August 31, 2021 (continued)
Security
Rate, Maturity Date | Face
Amount ($) | Value ($) |
| General Electric Co. |
| 3.38%, 03/11/24 | 150,000 | 160,292 |
| 3.45%, 05/15/24 (a) | 250,000 | 266,685 |
| 5.55%, 01/05/26 | 250,000 | 295,575 |
| Honeywell International, Inc. |
| 2.15%, 08/08/22 (a) | 200,000 | 203,418 |
| 3.35%, 12/01/23 | 50,000 | 53,322 |
| 2.30%, 08/15/24 (a) | 150,000 | 157,878 |
| 1.35%, 06/01/25 (a) | 300,000 | 306,144 |
| Huntington Ingalls Industries, Inc. |
| 0.67%, 08/16/23 (a)(d) | 150,000 | 150,081 |
| Illinois Tool Works, Inc. |
| 3.50%, 03/01/24 (a) | 150,000 | 160,076 |
| John Deere Capital Corp. |
| 2.15%, 09/08/22 | 250,000 | 254,970 |
| 2.70%, 01/06/23 | 250,000 | 258,227 |
| 2.80%, 03/06/23 | 150,000 | 155,823 |
| 1.20%, 04/06/23 | 100,000 | 101,528 |
| 3.45%, 06/07/23 | 350,000 | 369,337 |
| 0.70%, 07/05/23 | 250,000 | 251,833 |
| 0.40%, 10/10/23 | 150,000 | 150,284 |
| 3.65%, 10/12/23 | 100,000 | 107,029 |
| 3.45%, 01/10/24 | 200,000 | 213,882 |
| 2.60%, 03/07/24 | 150,000 | 158,003 |
| 0.45%, 06/07/24 | 100,000 | 100,016 |
| 2.65%, 06/24/24 | 100,000 | 105,997 |
| 2.05%, 01/09/25 | 100,000 | 104,533 |
| 3.45%, 03/13/25 | 400,000 | 437,836 |
| 0.70%, 01/15/26 | 300,000 | 297,768 |
| 1.05%, 06/17/26 | 250,000 | 250,483 |
| Johnson Controls International PLC |
| 3.63%, 07/02/24 (a) | 100,000 | 107,345 |
| 3.90%, 02/14/26 (a) | 200,000 | 222,012 |
| L3Harris Technologies, Inc. |
| 3.85%, 06/15/23 (a) | 100,000 | 105,807 |
| 3.83%, 04/27/25 (a) | 400,000 | 438,124 |
| Lennox International, Inc. |
| 1.35%, 08/01/25 (a) | 250,000 | 252,010 |
| Lockheed Martin Corp. |
| 3.10%, 01/15/23 (a) | 200,000 | 206,704 |
| 2.90%, 03/01/25 (a) | 100,000 | 106,813 |
| 3.55%, 01/15/26 (a) | 500,000 | 553,230 |
| Martin Marietta Materials, Inc. |
| 0.65%, 07/15/23 (a) | 150,000 | 150,349 |
| 4.25%, 07/02/24 (a) | 150,000 | 163,436 |
| Mohawk Industries, Inc. |
| 3.85%, 02/01/23 (a) | 200,000 | 207,928 |
| Northrop Grumman Corp. |
| 3.25%, 08/01/23 | 150,000 | 158,073 |
| 2.93%, 01/15/25 (a) | 500,000 | 531,740 |
| Otis Worldwide Corp. |
| 2.06%, 04/05/25 (a) | 450,000 | 466,515 |
| Owens Corning |
| 3.40%, 08/15/26 (a) | 150,000 | 163,153 |
| Parker-Hannifin Corp. |
| 3.50%, 09/15/22 | 50,000 | 51,587 |
| 2.70%, 06/14/24 (a) | 250,000 | 262,740 |
| 3.30%, 11/21/24 (a) | 50,000 | 53,714 |
| Precision Castparts Corp. |
| 2.50%, 01/15/23 (a) | 100,000 | 102,564 |
| 3.25%, 06/15/25 (a) | 250,000 | 271,310 |
Security
Rate, Maturity Date | Face
Amount ($) | Value ($) |
| Raytheon Technologies Corp. |
| 3.70%, 12/15/23 (a) | 150,000 | 159,897 |
| 3.20%, 03/15/24 (a) | 300,000 | 318,735 |
| 3.95%, 08/16/25 (a) | 350,000 | 388,136 |
| Republic Services, Inc. |
| 4.75%, 05/15/23 (a) | 109,000 | 115,823 |
| 2.50%, 08/15/24 (a) | 200,000 | 210,064 |
| 3.20%, 03/15/25 (a) | 100,000 | 107,503 |
| 0.88%, 11/15/25 (a) | 250,000 | 248,013 |
| Rockwell Automation, Inc. |
| 0.35%, 08/15/23 (a) | 150,000 | 150,034 |
| 2.88%, 03/01/25 (a) | 100,000 | 106,305 |
| Roper Technologies, Inc. |
| 3.65%, 09/15/23 (a) | 300,000 | 318,645 |
| 2.35%, 09/15/24 (a) | 100,000 | 104,701 |
| 1.00%, 09/15/25 (a) | 250,000 | 249,565 |
| Stanley Black & Decker, Inc. |
| 4.00%, 03/15/60 (a)(b) | 325,000 | 349,047 |
| Teledyne Technologies, Inc. |
| 0.65%, 04/01/23 | 100,000 | 100,048 |
| 0.95%, 04/01/24 (a) | 150,000 | 150,198 |
| 1.60%, 04/01/26 (a) | 100,000 | 101,283 |
| Textron, Inc. |
| 4.30%, 03/01/24 (a) | 350,000 | 377,426 |
| The Boeing Co. |
| 1.17%, 02/04/23 (a) | 350,000 | 350,934 |
| 2.80%, 03/01/23 (a) | 50,000 | 51,565 |
| 4.51%, 05/01/23 (a) | 630,000 | 667,932 |
| 1.88%, 06/15/23 (a) | 100,000 | 101,844 |
| 1.95%, 02/01/24 | 400,000 | 410,216 |
| 1.43%, 02/04/24 (a) | 750,000 | 751,875 |
| 2.80%, 03/01/24 (a) | 600,000 | 625,284 |
| 4.88%, 05/01/25 (a) | 900,000 | 1,006,560 |
| 2.75%, 02/01/26 (a) | 350,000 | 365,956 |
| 2.20%, 02/04/26 (a) | 1,450,000 | 1,461,875 |
| 3.10%, 05/01/26 (a) | 150,000 | 159,180 |
| The Timken Co. |
| 3.88%, 09/01/24 (a) | 150,000 | 160,904 |
| Trane Technologies Global Holding Co., Ltd. |
| 4.25%, 06/15/23 | 200,000 | 213,140 |
| Trane Technologies Luxembourg Finance S.A. |
| 3.55%, 11/01/24 (a) | 100,000 | 107,917 |
| Vontier Corp. |
| 1.80%, 04/01/26 (a)(d) | 150,000 | 150,372 |
| Vulcan Materials Co. |
| 4.50%, 04/01/25 (a) | 100,000 | 111,345 |
| Waste Management, Inc. |
| 2.90%, 09/15/22 (a) | 150,000 | 153,105 |
| 2.40%, 05/15/23 (a) | 100,000 | 103,131 |
| 3.13%, 03/01/25 (a) | 100,000 | 107,441 |
| 0.75%, 11/15/25 (a) | 200,000 | 198,570 |
| Westinghouse Air Brake Technologies Corp. |
| 4.40%, 03/15/24 (a)(e)(f) | 200,000 | 215,888 |
| 3.20%, 06/15/25 (a) | 100,000 | 106,697 |
| WW Grainger, Inc. |
| 1.85%, 02/15/25 (a) | 100,000 | 103,374 |
| | | 31,723,318 |
| Communications 1.2% |
| American Tower Corp. |
| 3.50%, 01/31/23 | 300,000 | 312,993 |
| 3.00%, 06/15/23 | 400,000 | 417,560 |
| 0.60%, 01/15/24 | 250,000 | 249,938 |
| 5.00%, 02/15/24 | 100,000 | 110,262 |
Schwab Taxable Bond Funds | Annual Report
Schwab Short-Term Bond Index Fund
Portfolio Holdings as of August 31, 2021 (continued)
Security
Rate, Maturity Date | Face
Amount ($) | Value ($) |
| 3.38%, 05/15/24 (a) | 100,000 | 106,786 |
| 2.95%, 01/15/25 (a) | 100,000 | 106,149 |
| 2.40%, 03/15/25 (a) | 500,000 | 522,110 |
| 4.40%, 02/15/26 (a) | 150,000 | 169,148 |
| 1.60%, 04/15/26 (a) | 100,000 | 101,087 |
| AT&T, Inc. |
| 2.63%, 12/01/22 (a) | 250,000 | 255,803 |
| 4.05%, 12/15/23 | 100,000 | 108,028 |
| 3.90%, 03/11/24 (a) | 100,000 | 107,402 |
| 0.90%, 03/25/24 (a) | 600,000 | 601,284 |
| 4.45%, 04/01/24 (a) | 350,000 | 380,947 |
| 3.95%, 01/15/25 (a) | 150,000 | 165,152 |
| 3.40%, 05/15/25 (a) | 750,000 | 814,575 |
| 3.60%, 07/15/25 (a) | 300,000 | 328,347 |
| 4.13%, 02/17/26 (a) | 500,000 | 560,215 |
| 1.70%, 03/25/26 (a) | 600,000 | 608,190 |
| British Telecommunications PLC |
| 4.50%, 12/04/23 (a) | 200,000 | 216,516 |
| CC Holdings GS V LLC/Crown Castle GS III Corp. |
| 3.85%, 04/15/23 | 150,000 | 158,067 |
| Charter Communications Operating LLC/Charter Communications Operating Capital |
| 4.50%, 02/01/24 (a) | 250,000 | 271,512 |
| 4.91%, 07/23/25 (a) | 1,250,000 | 1,415,837 |
| Comcast Cable Communications Holdings, Inc. |
| 9.46%, 11/15/22 | 250,000 | 277,687 |
| Comcast Corp. |
| 3.60%, 03/01/24 | 400,000 | 430,712 |
| 3.70%, 04/15/24 (a) | 650,000 | 702,019 |
| 3.38%, 02/15/25 (a) | 150,000 | 162,266 |
| 3.10%, 04/01/25 (a) | 300,000 | 322,608 |
| 3.38%, 08/15/25 (a) | 500,000 | 544,705 |
| 3.95%, 10/15/25 (a) | 750,000 | 836,782 |
| 3.15%, 03/01/26 (a) | 600,000 | 652,530 |
| Crown Castle International Corp. |
| 3.15%, 07/15/23 (a) | 300,000 | 314,238 |
| 3.20%, 09/01/24 (a) | 100,000 | 106,742 |
| 1.35%, 07/15/25 (a) | 200,000 | 201,684 |
| 4.45%, 02/15/26 (a) | 250,000 | 281,712 |
| 3.70%, 06/15/26 (a) | 200,000 | 220,288 |
| 1.05%, 07/15/26 (a) | 300,000 | 295,482 |
| Discovery Communications LLC |
| 2.95%, 03/20/23 (a) | 229,000 | 237,198 |
| 3.80%, 03/13/24 (a) | 200,000 | 213,834 |
| 3.90%, 11/15/24 (a) | 200,000 | 216,866 |
| 3.45%, 03/15/25 (a) | 50,000 | 53,679 |
| 4.90%, 03/11/26 (a) | 200,000 | 228,222 |
| Fox Corp. |
| 4.03%, 01/25/24 (a) | 300,000 | 323,289 |
| 3.05%, 04/07/25 (a) | 250,000 | 267,445 |
| Grupo Televisa S.A.B. |
| 6.63%, 03/18/25 | 100,000 | 118,055 |
| 4.63%, 01/30/26 (a) | 200,000 | 223,378 |
| Omnicom Group, Inc./Omnicom Capital, Inc. |
| 3.65%, 11/01/24 (a) | 200,000 | 216,886 |
| 3.60%, 04/15/26 (a) | 350,000 | 387,124 |
| Rogers Communications, Inc. |
| 3.00%, 03/15/23 (a) | 225,000 | 232,286 |
| 4.10%, 10/01/23 (a) | 250,000 | 266,118 |
| 3.63%, 12/15/25 (a) | 150,000 | 164,726 |
| T-Mobile USA, Inc. |
| 3.50%, 04/15/25 (a) | 800,000 | 865,176 |
| 1.50%, 02/15/26 (a) | 250,000 | 252,083 |
| The Bell Telephone Co of Canada |
| 0.75%, 03/17/24 | 100,000 | 100,409 |
Security
Rate, Maturity Date | Face
Amount ($) | Value ($) |
| The Walt Disney Co. |
| 1.65%, 09/01/22 | 150,000 | 152,154 |
| 3.00%, 09/15/22 | 200,000 | 205,688 |
| 1.75%, 08/30/24 (a) | 550,000 | 569,431 |
| 3.70%, 09/15/24 (a) | 100,000 | 108,582 |
| 3.35%, 03/24/25 | 575,000 | 625,128 |
| 1.75%, 01/13/26 | 500,000 | 516,720 |
| Time Warner Entertainment Co. LP |
| 8.38%, 03/15/23 | 150,000 | 167,777 |
| TWDC Enterprises 18 Corp. |
| 2.35%, 12/01/22 | 200,000 | 205,176 |
| 3.15%, 09/17/25 | 200,000 | 217,488 |
| 3.00%, 02/13/26 | 150,000 | 162,504 |
| 1.85%, 07/30/26 | 300,000 | 311,286 |
| Verizon Communications, Inc. |
| 4.15%, 03/15/24 (a) | 100,000 | 108,283 |
| 0.75%, 03/22/24 | 500,000 | 502,120 |
| 3.50%, 11/01/24 (a) | 350,000 | 378,458 |
| 3.38%, 02/15/25 | 800,000 | 866,920 |
| 0.85%, 11/20/25 (a) | 500,000 | 496,335 |
| 1.45%, 03/20/26 (a) | 700,000 | 709,667 |
| 2.63%, 08/15/26 | 450,000 | 478,920 |
| ViacomCBS, Inc. |
| 3.88%, 04/01/24 (a) | 100,000 | 107,164 |
| 3.70%, 08/15/24 (a) | 200,000 | 215,386 |
| 4.75%, 05/15/25 (a) | 600,000 | 677,406 |
| Vodafone Group PLC |
| 2.50%, 09/26/22 | 200,000 | 204,558 |
| 2.95%, 02/19/23 | 250,000 | 259,218 |
| 3.75%, 01/16/24 | 300,000 | 323,235 |
| 4.13%, 05/30/25 | 250,000 | 278,472 |
| Weibo Corp. |
| 3.50%, 07/05/24 (a) | 200,000 | 209,448 |
| WPP Finance 2010 |
| 3.75%, 09/19/24 | 100,000 | 108,780 |
| | | 26,970,441 |
| Consumer Cyclical 2.0% |
| Alibaba Group Holding Ltd. |
| 2.80%, 06/06/23 (a) | 200,000 | 207,626 |
| 3.60%, 11/28/24 (a) | 600,000 | 647,274 |
| Amazon.com, Inc. |
| 2.50%, 11/29/22 (a) | 100,000 | 102,254 |
| 2.40%, 02/22/23 (a) | 250,000 | 257,608 |
| 0.25%, 05/12/23 | 150,000 | 150,138 |
| 0.40%, 06/03/23 | 500,000 | 501,280 |
| 0.45%, 05/12/24 | 650,000 | 650,455 |
| 2.80%, 08/22/24 (a) | 550,000 | 585,447 |
| 3.80%, 12/05/24 (a) | 250,000 | 274,257 |
| 0.80%, 06/03/25 (a) | 200,000 | 200,538 |
| 5.20%, 12/03/25 (a) | 350,000 | 409,731 |
| 1.00%, 05/12/26 (a) | 750,000 | 754,012 |
| American Honda Finance Corp. |
| 2.60%, 11/16/22 | 350,000 | 359,761 |
| 2.05%, 01/10/23 | 250,000 | 256,033 |
| 1.95%, 05/10/23 | 150,000 | 153,986 |
| 0.88%, 07/07/23 | 250,000 | 252,245 |
| 0.65%, 09/08/23 | 450,000 | 452,511 |
| 3.63%, 10/10/23 | 100,000 | 106,684 |
| 3.55%, 01/12/24 | 150,000 | 160,385 |
| 2.90%, 02/16/24 | 250,000 | 264,065 |
| 2.40%, 06/27/24 | 200,000 | 209,768 |
| 0.55%, 07/12/24 | 100,000 | 99,762 |
| 2.15%, 09/10/24 | 200,000 | 208,606 |
Schwab Taxable Bond Funds | Annual Report
Schwab Short-Term Bond Index Fund
Portfolio Holdings as of August 31, 2021 (continued)
Security
Rate, Maturity Date | Face
Amount ($) | Value ($) |
| 1.20%, 07/08/25 | 250,000 | 252,438 |
| 1.00%, 09/10/25 | 250,000 | 250,578 |
| Aptiv Corp. |
| 4.15%, 03/15/24 (a) | 100,000 | 107,863 |
| Aptiv PLC |
| 4.25%, 01/15/26 (a) | 100,000 | 112,616 |
| AutoNation, Inc. |
| 3.50%, 11/15/24 (a) | 100,000 | 107,420 |
| AutoZone, Inc. |
| 3.13%, 07/15/23 (a) | 250,000 | 260,947 |
| 3.13%, 04/18/24 (a) | 100,000 | 106,197 |
| 3.63%, 04/15/25 (a) | 300,000 | 326,742 |
| Block Financial LLC |
| 5.50%, 11/01/22 (a) | 300,000 | 309,663 |
| 5.25%, 10/01/25 (a) | 100,000 | 114,314 |
| Booking Holdings, Inc. |
| 2.75%, 03/15/23 (a) | 100,000 | 103,582 |
| 3.60%, 06/01/26 (a) | 300,000 | 332,424 |
| BorgWarner, Inc. |
| 3.38%, 03/15/25 (a) | 50,000 | 53,916 |
| CBRE Services, Inc. |
| 4.88%, 03/01/26 (a) | 200,000 | 230,434 |
| Costco Wholesale Corp. |
| 2.75%, 05/18/24 (a) | 350,000 | 370,555 |
| Cummins, Inc. |
| 0.75%, 09/01/25 (a) | 300,000 | 299,055 |
| D.R. Horton, Inc. |
| 4.38%, 09/15/22 (a) | 100,000 | 103,005 |
| 4.75%, 02/15/23 (a) | 50,000 | 52,476 |
| 2.50%, 10/15/24 (a) | 300,000 | 314,697 |
| 2.60%, 10/15/25 (a) | 50,000 | 52,830 |
| Dollar General Corp. |
| 3.25%, 04/15/23 (a) | 350,000 | 363,615 |
| 4.15%, 11/01/25 (a) | 100,000 | 111,751 |
| Dollar Tree, Inc. |
| 3.70%, 05/15/23 (a) | 350,000 | 368,081 |
| 4.00%, 05/15/25 (a) | 200,000 | 219,758 |
| eBay, Inc. |
| 2.75%, 01/30/23 (a) | 150,000 | 154,754 |
| 3.45%, 08/01/24 (a) | 300,000 | 322,146 |
| 1.90%, 03/11/25 (a) | 250,000 | 258,693 |
| 1.40%, 05/10/26 (a) | 200,000 | 201,888 |
| Expedia Group, Inc. |
| 3.60%, 12/15/23 (a) | 250,000 | 265,267 |
| 4.50%, 08/15/24 (a) | 50,000 | 54,500 |
| 5.00%, 02/15/26 (a) | 200,000 | 226,094 |
| General Motors Co. |
| 4.88%, 10/02/23 | 200,000 | 216,932 |
| 5.40%, 10/02/23 | 450,000 | 492,592 |
| 6.13%, 10/01/25 (a) | 500,000 | 590,280 |
| General Motors Financial Co., Inc. |
| 3.25%, 01/05/23 (a) | 250,000 | 258,430 |
| 5.20%, 03/20/23 | 500,000 | 534,105 |
| 3.70%, 05/09/23 (a) | 350,000 | 365,956 |
| 4.25%, 05/15/23 | 200,000 | 212,018 |
| 4.15%, 06/19/23 (a) | 100,000 | 105,846 |
| 1.70%, 08/18/23 | 350,000 | 357,122 |
| 5.10%, 01/17/24 (a) | 400,000 | 438,116 |
| 3.95%, 04/13/24 (a) | 350,000 | 375,504 |
| 3.50%, 11/07/24 (a) | 350,000 | 375,046 |
| 4.00%, 01/15/25 (a) | 200,000 | 217,520 |
| 2.90%, 02/26/25 (a) | 400,000 | 422,780 |
| 4.35%, 04/09/25 (a) | 250,000 | 275,750 |
| 2.75%, 06/20/25 (a) | 250,000 | 262,935 |
Security
Rate, Maturity Date | Face
Amount ($) | Value ($) |
| 4.30%, 07/13/25 (a) | 400,000 | 441,720 |
| 1.25%, 01/08/26 (a) | 350,000 | 347,672 |
| 5.25%, 03/01/26 (a) | 350,000 | 403,000 |
| 1.50%, 06/10/26 (a) | 350,000 | 350,238 |
| GLP Capital LP/GLP Financing II, Inc. |
| 5.38%, 11/01/23 (a) | 100,000 | 108,540 |
| 3.35%, 09/01/24 (a) | 200,000 | 211,578 |
| 5.25%, 06/01/25 (a) | 150,000 | 168,537 |
| 5.38%, 04/15/26 (a) | 200,000 | 229,490 |
| Hyatt Hotels Corp. |
| 3.38%, 07/15/23 (a) | 100,000 | 103,975 |
| 5.38%, 04/23/25 (a) | 100,000 | 111,741 |
| 4.85%, 03/15/26 (a) | 100,000 | 111,690 |
| JD.com, Inc. |
| 3.88%, 04/29/26 | 200,000 | 219,524 |
| Kohl's Corp. |
| 4.25%, 07/17/25 (a) | 100,000 | 109,507 |
| Las Vegas Sands Corp. |
| 3.20%, 08/08/24 (a) | 400,000 | 416,560 |
| 2.90%, 06/25/25 (a) | 200,000 | 206,598 |
| Lennar Corp. |
| 4.88%, 12/15/23 (a) | 350,000 | 379,197 |
| 4.50%, 04/30/24 (a) | 150,000 | 163,041 |
| 4.75%, 05/30/25 (a) | 200,000 | 223,868 |
| Lowe's Cos., Inc. |
| 3.88%, 09/15/23 (a) | 300,000 | 318,783 |
| 3.13%, 09/15/24 (a) | 200,000 | 213,724 |
| 4.00%, 04/15/25 (a) | 175,000 | 192,847 |
| 2.50%, 04/15/26 (a) | 400,000 | 425,580 |
| Magna International, Inc. |
| 3.63%, 06/15/24 (a) | 100,000 | 107,966 |
| 4.15%, 10/01/25 (a) | 250,000 | 279,925 |
| Marriott International, Inc. |
| 4.15%, 12/01/23 (a) | 200,000 | 213,568 |
| 3.60%, 04/15/24 (a) | 250,000 | 266,765 |
| 5.75%, 05/01/25 (a) | 450,000 | 517,203 |
| 3.13%, 06/15/26 (a) | 200,000 | 213,946 |
| McDonald's Corp. |
| 3.35%, 04/01/23 (a) | 300,000 | 313,359 |
| 3.25%, 06/10/24 | 100,000 | 107,111 |
| 3.38%, 05/26/25 (a) | 150,000 | 162,533 |
| 3.30%, 07/01/25 (a) | 200,000 | 216,932 |
| 1.45%, 09/01/25 (a) | 150,000 | 153,068 |
| 3.70%, 01/30/26 (a) | 500,000 | 554,040 |
| NIKE, Inc. |
| 2.25%, 05/01/23 (a) | 100,000 | 102,862 |
| 2.40%, 03/27/25 (a) | 150,000 | 158,946 |
| NVR, Inc. |
| 3.95%, 09/15/22 (a) | 100,000 | 102,826 |
| O'Reilly Automotive, Inc. |
| 3.55%, 03/15/26 (a) | 150,000 | 165,654 |
| PACCAR Financial Corp. |
| 1.90%, 02/07/23 | 150,000 | 153,441 |
| 2.65%, 04/06/23 | 250,000 | 259,415 |
| 0.35%, 08/11/23 | 200,000 | 200,226 |
| 0.35%, 02/02/24 | 100,000 | 99,739 |
| 2.15%, 08/15/24 | 100,000 | 104,479 |
| 1.80%, 02/06/25 | 200,000 | 207,030 |
| PulteGroup, Inc. |
| 5.50%, 03/01/26 (a) | 150,000 | 175,535 |
| PVH Corp. |
| 4.63%, 07/10/25 (a)(d) | 250,000 | 278,210 |
Schwab Taxable Bond Funds | Annual Report
Schwab Short-Term Bond Index Fund
Portfolio Holdings as of August 31, 2021 (continued)
Security
Rate, Maturity Date | Face
Amount ($) | Value ($) |
| Ross Stores, Inc. |
| 4.60%, 04/15/25 (a) | 200,000 | 224,276 |
| 0.88%, 04/15/26 (a) | 150,000 | 147,678 |
| Sands China Ltd. |
| 4.60%, 08/08/23 (a) | 400,000 | 423,228 |
| 5.13%, 08/08/25 (a) | 500,000 | 556,995 |
| 3.80%, 01/08/26 (a) | 400,000 | 425,252 |
| Starbucks Corp. |
| 3.10%, 03/01/23 (a) | 200,000 | 207,786 |
| 3.85%, 10/01/23 (a) | 100,000 | 106,288 |
| 3.80%, 08/15/25 (a) | 300,000 | 331,539 |
| 2.45%, 06/15/26 (a) | 150,000 | 158,984 |
| Stellantis N.V. |
| 5.25%, 04/15/23 | 500,000 | 535,760 |
| Tapestry, Inc. |
| 4.25%, 04/01/25 (a) | 200,000 | 216,840 |
| Target Corp. |
| 3.50%, 07/01/24 | 200,000 | 216,928 |
| 2.25%, 04/15/25 (a) | 400,000 | 420,676 |
| 2.50%, 04/15/26 | 250,000 | 268,777 |
| The Home Depot, Inc. |
| 2.70%, 04/01/23 (a) | 225,000 | 232,391 |
| 3.75%, 02/15/24 (a) | 200,000 | 214,642 |
| 3.35%, 09/15/25 (a) | 300,000 | 328,464 |
| 3.00%, 04/01/26 (a) | 400,000 | 435,080 |
| The TJX Cos., Inc. |
| 2.50%, 05/15/23 (a) | 100,000 | 103,265 |
| Toyota Motor Corp. |
| 0.68%, 03/25/24 (a) | 400,000 | 401,340 |
| 2.36%, 07/02/24 | 100,000 | 104,973 |
| 1.34%, 03/25/26 (a) | 300,000 | 304,053 |
| Toyota Motor Credit Corp. |
| 2.15%, 09/08/22 | 150,000 | 152,945 |
| 0.35%, 10/14/22 | 300,000 | 300,504 |
| 2.63%, 01/10/23 | 300,000 | 309,654 |
| 2.70%, 01/11/23 | 500,000 | 516,450 |
| 2.90%, 03/30/23 | 650,000 | 676,702 |
| 0.50%, 08/14/23 | 450,000 | 451,624 |
| 1.35%, 08/25/23 | 200,000 | 203,938 |
| 3.45%, 09/20/23 | 350,000 | 371,959 |
| 2.25%, 10/18/23 | 100,000 | 103,869 |
| 0.45%, 01/11/24 | 200,000 | 199,930 |
| 2.90%, 04/17/24 | 100,000 | 106,098 |
| 2.00%, 10/07/24 | 200,000 | 208,164 |
| 1.80%, 02/13/25 | 300,000 | 309,567 |
| 3.00%, 04/01/25 | 350,000 | 375,669 |
| 3.40%, 04/14/25 | 150,000 | 163,470 |
| 0.80%, 10/16/25 | 350,000 | 347,882 |
| 0.80%, 01/09/26 | 100,000 | 98,997 |
| 1.13%, 06/18/26 | 200,000 | 200,728 |
| VF Corp. |
| 2.40%, 04/23/25 (a) | 150,000 | 157,182 |
| Walgreen Co. |
| 3.10%, 09/15/22 | 250,000 | 257,023 |
| Walgreens Boots Alliance, Inc. |
| 3.80%, 11/18/24 (a) | 400,000 | 434,488 |
| 3.45%, 06/01/26 (a) | 250,000 | 273,115 |
| Walmart, Inc. |
| 2.35%, 12/15/22 (a) | 250,000 | 256,513 |
| 2.55%, 04/11/23 (a) | 300,000 | 309,675 |
| 3.40%, 06/26/23 (a) | 850,000 | 896,648 |
| 3.30%, 04/22/24 (a) | 350,000 | 373,887 |
| 2.85%, 07/08/24 (a) | 450,000 | 479,340 |
| 2.65%, 12/15/24 (a) | 300,000 | 319,908 |
Security
Rate, Maturity Date | Face
Amount ($) | Value ($) |
| 3.55%, 06/26/25 (a) | 300,000 | 330,366 |
| 3.05%, 07/08/26 (a) | 400,000 | 438,284 |
| | | 45,735,640 |
| Consumer Non-Cyclical 3.2% |
| Abbott Laboratories |
| 3.40%, 11/30/23 (a) | 450,000 | 477,855 |
| 2.95%, 03/15/25 (a) | 245,000 | 262,542 |
| AbbVie, Inc. |
| 3.25%, 10/01/22 (a) | 400,000 | 409,672 |
| 2.90%, 11/06/22 | 850,000 | 875,151 |
| 3.20%, 11/06/22 (a) | 180,000 | 185,148 |
| 2.30%, 11/21/22 | 700,000 | 716,177 |
| 2.85%, 05/14/23 (a) | 150,000 | 155,556 |
| 3.75%, 11/14/23 (a) | 400,000 | 427,096 |
| 3.85%, 06/15/24 (a) | 250,000 | 269,960 |
| 2.60%, 11/21/24 (a) | 1,000,000 | 1,054,620 |
| 3.80%, 03/15/25 (a) | 800,000 | 872,560 |
| 3.60%, 05/14/25 (a) | 1,000,000 | 1,087,890 |
| 3.20%, 05/14/26 (a) | 550,000 | 597,278 |
| Agilent Technologies, Inc. |
| 3.88%, 07/15/23 (a) | 275,000 | 290,438 |
| Altria Group, Inc. |
| 4.00%, 01/31/24 | 200,000 | 216,386 |
| 3.80%, 02/14/24 (a) | 250,000 | 268,292 |
| 2.35%, 05/06/25 (a) | 200,000 | 208,686 |
| 4.40%, 02/14/26 (a) | 200,000 | 226,156 |
| AmerisourceBergen Corp. |
| 0.74%, 03/15/23 (a) | 400,000 | 400,640 |
| 3.40%, 05/15/24 (a) | 150,000 | 159,483 |
| 3.25%, 03/01/25 (a) | 97,000 | 103,869 |
| Amgen, Inc. |
| 2.25%, 08/19/23 (a) | 250,000 | 258,410 |
| 3.63%, 05/22/24 (a) | 250,000 | 268,420 |
| 1.90%, 02/21/25 (a) | 300,000 | 309,921 |
| 3.13%, 05/01/25 (a) | 200,000 | 214,420 |
| 2.60%, 08/19/26 (a) | 300,000 | 319,450 |
| Anheuser-Busch Cos., LLC/Anheuser-Busch InBev Worldwide, Inc. |
| 3.65%, 02/01/26 (a) | 800,000 | 884,160 |
| Anheuser-Busch InBev Finance, Inc. |
| 3.65%, 02/01/26 (a) | 500,000 | 551,810 |
| Archer-Daniels-Midland Co. |
| 2.75%, 03/27/25 (a) | 100,000 | 106,194 |
| 2.50%, 08/11/26 (a) | 250,000 | 266,240 |
| Astrazeneca Finance LLC |
| 0.70%, 05/28/24 (a) | 500,000 | 500,755 |
| 1.20%, 05/28/26 (a) | 250,000 | 251,210 |
| AstraZeneca PLC |
| 0.30%, 05/26/23 | 250,000 | 249,823 |
| 3.50%, 08/17/23 (a) | 200,000 | 211,782 |
| 3.38%, 11/16/25 | 500,000 | 548,120 |
| 0.70%, 04/08/26 (a) | 400,000 | 393,308 |
| BAT Capital Corp. |
| 3.22%, 08/15/24 (a) | 650,000 | 690,027 |
| 2.79%, 09/06/24 (a) | 150,000 | 157,587 |
| BAT International Finance PLC |
| 1.67%, 03/25/26 (a) | 400,000 | 402,760 |
| Baxalta, Inc. |
| 4.00%, 06/23/25 (a) | 200,000 | 220,512 |
| Becton Dickinson & Co. |
| 3.36%, 06/06/24 (a) | 500,000 | 534,070 |
| 3.73%, 12/15/24 (a) | 400,000 | 434,320 |
Schwab Taxable Bond Funds | Annual Report
Schwab Short-Term Bond Index Fund
Portfolio Holdings as of August 31, 2021 (continued)
Security
Rate, Maturity Date | Face
Amount ($) | Value ($) |
| Biogen, Inc. |
| 3.63%, 09/15/22 | 150,000 | 155,100 |
| 4.05%, 09/15/25 (a) | 500,000 | 555,960 |
| Boston Scientific Corp. |
| 3.45%, 03/01/24 (a) | 200,000 | 213,148 |
| 3.85%, 05/15/25 | 250,000 | 275,787 |
| 1.90%, 06/01/25 (a) | 200,000 | 206,420 |
| 3.75%, 03/01/26 (a) | 150,000 | 166,185 |
| Bristol-Myers Squibb Co. |
| 2.75%, 02/15/23 (a) | 350,000 | 361,851 |
| 3.25%, 02/20/23 (a) | 337,000 | 350,847 |
| 0.54%, 11/13/23 (a) | 400,000 | 400,144 |
| 2.90%, 07/26/24 (a) | 700,000 | 746,389 |
| 3.88%, 08/15/25 (a) | 550,000 | 610,109 |
| 0.75%, 11/13/25 (a) | 200,000 | 199,234 |
| 3.20%, 06/15/26 (a) | 500,000 | 548,875 |
| Bunge Ltd. Finance Corp. |
| 3.00%, 09/25/22 (a) | 100,000 | 102,546 |
| 4.35%, 03/15/24 (a) | 100,000 | 108,450 |
| 1.63%, 08/17/25 (a) | 250,000 | 254,118 |
| 3.25%, 08/15/26 (a) | 100,000 | 108,348 |
| Campbell Soup Co. |
| 3.65%, 03/15/23 (a) | 300,000 | 313,788 |
| 3.95%, 03/15/25 (a) | 150,000 | 164,733 |
| 3.30%, 03/19/25 (a) | 100,000 | 107,594 |
| Cardinal Health, Inc. |
| 3.20%, 03/15/23 | 200,000 | 208,288 |
| 3.08%, 06/15/24 (a) | 250,000 | 264,947 |
| 3.75%, 09/15/25 (a) | 150,000 | 164,693 |
| Cigna Corp. |
| 3.05%, 11/30/22 (a) | 100,000 | 103,143 |
| 3.00%, 07/15/23 (a) | 400,000 | 417,560 |
| 3.75%, 07/15/23 (a) | 348,000 | 368,525 |
| 3.50%, 06/15/24 (a) | 97,000 | 103,945 |
| 3.25%, 04/15/25 (a) | 300,000 | 323,109 |
| 4.13%, 11/15/25 (a) | 500,000 | 559,070 |
| 4.50%, 02/25/26 (a) | 300,000 | 340,602 |
| 1.25%, 03/15/26 (a) | 250,000 | 251,608 |
| Colgate-Palmolive Co. |
| 2.25%, 11/15/22 | 100,000 | 102,434 |
| 2.10%, 05/01/23 | 100,000 | 103,000 |
| 3.25%, 03/15/24 | 300,000 | 321,384 |
| CommonSpirit Health |
| 2.95%, 11/01/22 | 100,000 | 102,799 |
| 2.76%, 10/01/24 (a) | 150,000 | 158,040 |
| 1.55%, 10/01/25 (a) | 300,000 | 304,086 |
| Conagra Brands, Inc. |
| 3.20%, 01/25/23 (a) | 78,000 | 80,479 |
| 4.30%, 05/01/24 (a) | 200,000 | 217,978 |
| 4.60%, 11/01/25 (a) | 300,000 | 338,973 |
| Constellation Brands, Inc. |
| 3.20%, 02/15/23 (a) | 250,000 | 259,532 |
| 4.25%, 05/01/23 | 350,000 | 371,017 |
| 4.75%, 11/15/24 | 150,000 | 167,915 |
| 4.40%, 11/15/25 (a) | 150,000 | 169,208 |
| CVS Health Corp. |
| 2.75%, 12/01/22 (a) | 450,000 | 460,849 |
| 3.70%, 03/09/23 (a) | 750,000 | 785,407 |
| 3.38%, 08/12/24 (a) | 100,000 | 107,025 |
| 2.63%, 08/15/24 (a) | 100,000 | 105,424 |
| 4.10%, 03/25/25 (a) | 400,000 | 441,252 |
| 3.88%, 07/20/25 (a) | 700,000 | 770,875 |
| 2.88%, 06/01/26 (a) | 500,000 | 537,225 |
Security
Rate, Maturity Date | Face
Amount ($) | Value ($) |
| DH Europe Finance II Sarl |
| 2.05%, 11/15/22 | 200,000 | 204,276 |
| 2.20%, 11/15/24 (a) | 300,000 | 313,425 |
| Diageo Capital PLC |
| 2.63%, 04/29/23 (a) | 350,000 | 361,501 |
| 3.50%, 09/18/23 (a) | 200,000 | 212,354 |
| 2.13%, 10/24/24 (a) | 200,000 | 209,196 |
| 1.38%, 09/29/25 (a) | 200,000 | 203,338 |
| Diageo Investment Corp. |
| 8.00%, 09/15/22 | 50,000 | 53,995 |
| General Mills, Inc. |
| 2.60%, 10/12/22 (a) | 200,000 | 204,566 |
| 3.70%, 10/17/23 (a) | 250,000 | 266,290 |
| 3.65%, 02/15/24 (a) | 150,000 | 160,161 |
| 4.00%, 04/17/25 (a) | 100,000 | 110,524 |
| Gilead Sciences, Inc. |
| 3.25%, 09/01/22 (a) | 200,000 | 205,042 |
| 2.50%, 09/01/23 (a) | 200,000 | 207,760 |
| 0.75%, 09/29/23 (a) | 650,000 | 650,175 |
| 3.70%, 04/01/24 (a) | 250,000 | 267,942 |
| 3.50%, 02/01/25 (a) | 500,000 | 541,390 |
| 3.65%, 03/01/26 (a) | 750,000 | 827,415 |
| GlaxoSmithKline Capital PLC |
| 0.53%, 10/01/23 (a) | 400,000 | 400,824 |
| 3.00%, 06/01/24 (a) | 200,000 | 212,768 |
| GlaxoSmithKline Capital, Inc. |
| 2.80%, 03/18/23 | 200,000 | 207,772 |
| 3.38%, 05/15/23 | 500,000 | 526,135 |
| 3.63%, 05/15/25 | 250,000 | 275,150 |
| Hasbro, Inc. |
| 2.60%, 11/19/22 | 300,000 | 308,325 |
| 3.00%, 11/19/24 (a) | 100,000 | 106,315 |
| HCA, Inc. |
| 4.75%, 05/01/23 | 400,000 | 426,596 |
| 5.00%, 03/15/24 | 550,000 | 605,517 |
| 5.25%, 04/15/25 | 300,000 | 342,588 |
| 5.25%, 06/15/26 (a) | 500,000 | 578,560 |
| Hormel Foods Corp. |
| 0.65%, 06/03/24 (a) | 250,000 | 250,450 |
| Johnson & Johnson |
| 2.05%, 03/01/23 (a) | 300,000 | 307,233 |
| 2.63%, 01/15/25 (a) | 100,000 | 106,266 |
| 0.55%, 09/01/25 (a) | 400,000 | 396,788 |
| 2.45%, 03/01/26 (a) | 500,000 | 533,360 |
| Kellogg Co. |
| 2.65%, 12/01/23 | 150,000 | 157,277 |
| 3.25%, 04/01/26 | 200,000 | 218,616 |
| Keurig Dr Pepper, Inc. |
| 4.06%, 05/25/23 (a) | 251,000 | 266,261 |
| 3.13%, 12/15/23 (a) | 100,000 | 105,570 |
| 0.75%, 03/15/24 (a) | 200,000 | 200,238 |
| 4.42%, 05/25/25 (a) | 450,000 | 503,779 |
| Kimberly-Clark Corp. |
| 3.05%, 08/15/25 | 150,000 | 163,034 |
| 2.75%, 02/15/26 | 100,000 | 108,291 |
| Laboratory Corp. of America Holdings |
| 4.00%, 11/01/23 (a) | 55,000 | 58,522 |
| 3.25%, 09/01/24 (a) | 250,000 | 266,780 |
| 2.30%, 12/01/24 (a) | 100,000 | 104,468 |
| 3.60%, 02/01/25 (a) | 150,000 | 161,546 |
| McCormick & Co., Inc. |
| 3.15%, 08/15/24 (a) | 250,000 | 266,470 |
| 0.90%, 02/15/26 (a) | 200,000 | 197,796 |
Schwab Taxable Bond Funds | Annual Report
Schwab Short-Term Bond Index Fund
Portfolio Holdings as of August 31, 2021 (continued)
Security
Rate, Maturity Date | Face
Amount ($) | Value ($) |
| McKesson Corp. |
| 2.70%, 12/15/22 (a) | 200,000 | 204,756 |
| 2.85%, 03/15/23 (a) | 150,000 | 154,622 |
| 3.80%, 03/15/24 (a) | 150,000 | 160,845 |
| 0.90%, 12/03/25 (a) | 200,000 | 198,038 |
| Mead Johnson Nutrition Co. |
| 4.13%, 11/15/25 (a) | 200,000 | 224,508 |
| Medtronic, Inc. |
| 3.50%, 03/15/25 | 420,000 | 458,997 |
| Merck & Co., Inc. |
| 2.40%, 09/15/22 (a) | 250,000 | 254,348 |
| 2.80%, 05/18/23 | 500,000 | 521,075 |
| 2.90%, 03/07/24 (a) | 100,000 | 105,849 |
| 2.75%, 02/10/25 (a) | 600,000 | 638,718 |
| 0.75%, 02/24/26 (a) | 250,000 | 248,843 |
| Molson Coors Beverage Co. |
| 3.00%, 07/15/26 (a) | 600,000 | 645,066 |
| Mondelez International, Inc. |
| 1.50%, 05/04/25 (a) | 100,000 | 101,911 |
| 3.63%, 02/13/26 (a) | 100,000 | 110,436 |
| Mylan, Inc. |
| 4.20%, 11/29/23 (a) | 150,000 | 160,349 |
| Novartis Capital Corp. |
| 2.40%, 09/21/22 | 350,000 | 358,127 |
| 3.40%, 05/06/24 | 600,000 | 645,924 |
| 1.75%, 02/14/25 (a) | 300,000 | 309,849 |
| 3.00%, 11/20/25 (a) | 550,000 | 595,985 |
| PeaceHealth Obligated Group |
| 1.38%, 11/15/25 (a) | 250,000 | 253,880 |
| PepsiCo, Inc. |
| 2.75%, 03/01/23 | 400,000 | 415,384 |
| 0.75%, 05/01/23 | 250,000 | 252,225 |
| 0.40%, 10/07/23 | 200,000 | 200,710 |
| 3.60%, 03/01/24 (a) | 350,000 | 374,927 |
| 2.25%, 03/19/25 (a) | 400,000 | 420,488 |
| 2.75%, 04/30/25 (a) | 150,000 | 160,208 |
| 3.50%, 07/17/25 (a) | 200,000 | 219,438 |
| 2.85%, 02/24/26 (a) | 200,000 | 216,304 |
| Perrigo Finance Unlimited Co. |
| 3.90%, 12/15/24 (a) | 200,000 | 213,782 |
| 4.38%, 03/15/26 (a) | 200,000 | 218,102 |
| Pfizer, Inc. |
| 3.00%, 06/15/23 | 400,000 | 419,360 |
| 3.20%, 09/15/23 (a) | 300,000 | 316,824 |
| 2.95%, 03/15/24 (a) | 150,000 | 159,144 |
| 3.40%, 05/15/24 | 150,000 | 161,765 |
| 0.80%, 05/28/25 (a) | 250,000 | 250,510 |
| 2.75%, 06/03/26 | 300,000 | 325,872 |
| Philip Morris International, Inc. |
| 2.50%, 11/02/22 (a) | 150,000 | 153,644 |
| 2.63%, 03/06/23 | 250,000 | 258,960 |
| 1.13%, 05/01/23 | 250,000 | 253,315 |
| 2.13%, 05/10/23 (a) | 300,000 | 308,187 |
| 2.88%, 05/01/24 (a) | 200,000 | 211,704 |
| 3.25%, 11/10/24 | 200,000 | 216,084 |
| 1.50%, 05/01/25 (a) | 250,000 | 255,022 |
| 3.38%, 08/11/25 (a) | 200,000 | 217,582 |
| 0.88%, 05/01/26 (a) | 150,000 | 148,337 |
| Quest Diagnostics, Inc. |
| 3.50%, 03/30/25 (a) | 150,000 | 162,390 |
| 3.45%, 06/01/26 (a) | 200,000 | 219,308 |
| Reynolds American, Inc. |
| 4.85%, 09/15/23 | 100,000 | 108,744 |
| 4.45%, 06/12/25 (a) | 700,000 | 776,335 |
Security
Rate, Maturity Date | Face
Amount ($) | Value ($) |
| Royalty Pharma PLC |
| 0.75%, 09/02/23 | 250,000 | 251,165 |
| 1.20%, 09/02/25 (a) | 350,000 | 349,555 |
| Sanofi |
| 3.38%, 06/19/23 (a) | 150,000 | 157,962 |
| Shire Acquisitions Investments Ireland DAC |
| 2.88%, 09/23/23 (a) | 650,000 | 678,749 |
| Stryker Corp. |
| 0.60%, 12/01/23 (a) | 200,000 | 200,036 |
| 3.38%, 05/15/24 (a) | 100,000 | 106,995 |
| 1.15%, 06/15/25 (a) | 250,000 | 251,498 |
| 3.38%, 11/01/25 (a) | 200,000 | 218,066 |
| 3.50%, 03/15/26 (a) | 250,000 | 274,802 |
| Sutter Health |
| 1.32%, 08/15/25 (a) | 150,000 | 151,734 |
| Sysco Corp. |
| 3.55%, 03/15/25 (a) | 100,000 | 108,682 |
| 5.65%, 04/01/25 (a) | 350,000 | 403,889 |
| 3.75%, 10/01/25 (a) | 200,000 | 220,050 |
| 3.30%, 07/15/26 (a) | 300,000 | 326,313 |
| Takeda Pharmaceutical Co., Ltd. |
| 4.40%, 11/26/23 (a) | 400,000 | 432,316 |
| The Clorox Co. |
| 3.05%, 09/15/22 (a) | 200,000 | 204,280 |
| 3.50%, 12/15/24 (a) | 200,000 | 216,696 |
| The Coca-Cola Co. |
| 1.75%, 09/06/24 | 300,000 | 312,300 |
| The Estee Lauder Cos., Inc. |
| 2.00%, 12/01/24 (a) | 150,000 | 156,906 |
| The Hershey Co. |
| 3.38%, 05/15/23 (a) | 150,000 | 157,404 |
| 0.90%, 06/01/25 (a) | 100,000 | 100,369 |
| The JM Smucker Co. |
| 3.50%, 03/15/25 | 200,000 | 217,542 |
| The Kroger Co. |
| 4.00%, 02/01/24 (a) | 200,000 | 214,660 |
| 3.50%, 02/01/26 (a) | 200,000 | 220,442 |
| The Procter & Gamble Co. |
| 2.15%, 08/11/22 | 300,000 | 305,649 |
| 0.55%, 10/29/25 | 350,000 | 347,581 |
| 1.00%, 04/23/26 | 250,000 | 251,618 |
| Thermo Fisher Scientific, Inc. |
| 4.13%, 03/25/25 (a) | 200,000 | 221,096 |
| Tyson Foods, Inc. |
| 3.90%, 09/28/23 (a) | 100,000 | 106,775 |
| 3.95%, 08/15/24 (a) | 300,000 | 325,650 |
| 4.00%, 03/01/26 (a) | 250,000 | 279,367 |
| Unilever Capital Corp. |
| 0.38%, 09/14/23 | 250,000 | 250,528 |
| 3.25%, 03/07/24 (a) | 150,000 | 160,049 |
| 2.60%, 05/05/24 (a) | 300,000 | 315,675 |
| 3.38%, 03/22/25 (a) | 200,000 | 217,680 |
| 3.10%, 07/30/25 | 200,000 | 216,970 |
| UPMC |
| 1.80%, 04/15/26 (a) | 100,000 | 101,537 |
| Utah Acquisition Sub, Inc. |
| 3.95%, 06/15/26 (a) | 500,000 | 554,300 |
| Viatris, Inc. |
| 1.65%, 06/22/25 (a)(d) | 250,000 | 254,100 |
| Whirlpool Corp. |
| 4.00%, 03/01/24 | 100,000 | 108,135 |
| Wyeth LLC |
| 6.45%, 02/01/24 | 100,000 | 114,181 |
Schwab Taxable Bond Funds | Annual Report
Schwab Short-Term Bond Index Fund
Portfolio Holdings as of August 31, 2021 (continued)
Security
Rate, Maturity Date | Face
Amount ($) | Value ($) |
| Zimmer Biomet Holdings, Inc. |
| 3.70%, 03/19/23 (a) | 100,000 | 104,630 |
| 3.55%, 04/01/25 (a) | 450,000 | 486,661 |
| 3.05%, 01/15/26 (a) | 200,000 | 215,396 |
| Zoetis, Inc. |
| 3.25%, 02/01/23 (a) | 300,000 | 310,107 |
| 4.50%, 11/13/25 (a) | 250,000 | 283,557 |
| | | 70,791,851 |
| Energy 2.0% |
| Baker Hughes a GE Co., LLC/Baker Hughes Co-Obligor, Inc. |
| 2.77%, 12/15/22 (a) | 400,000 | 412,004 |
| Boardwalk Pipelines LP |
| 4.95%, 12/15/24 (a) | 100,000 | 111,397 |
| BP Capital Markets America, Inc. |
| 2.94%, 04/06/23 | 400,000 | 416,340 |
| 2.75%, 05/10/23 | 450,000 | 468,364 |
| 3.22%, 11/28/23 (a) | 450,000 | 475,722 |
| 3.79%, 02/06/24 (a) | 200,000 | 214,754 |
| 3.22%, 04/14/24 (a) | 100,000 | 106,285 |
| 3.19%, 04/06/25 (a) | 350,000 | 376,313 |
| 3.80%, 09/21/25 (a) | 500,000 | 552,620 |
| 3.41%, 02/11/26 (a) | 100,000 | 109,460 |
| BP Capital Markets PLC |
| 3.81%, 02/10/24 | 250,000 | 269,548 |
| 3.54%, 11/04/24 | 100,000 | 108,447 |
| 3.51%, 03/17/25 | 300,000 | 326,661 |
| Canadian Natural Resources Ltd. |
| 2.95%, 01/15/23 (a) | 250,000 | 257,945 |
| 3.80%, 04/15/24 (a) | 100,000 | 106,921 |
| 3.90%, 02/01/25 (a) | 200,000 | 216,860 |
| 2.05%, 07/15/25 (a) | 250,000 | 257,490 |
| Cenovus Energy, Inc. |
| 4.00%, 04/15/24 (a) | 100,000 | 106,974 |
| 5.38%, 07/15/25 (a) | 400,000 | 454,240 |
| Cheniere Corpus Christi Holdings LLC |
| 7.00%, 06/30/24 (a) | 300,000 | 340,974 |
| 5.88%, 03/31/25 (a) | 500,000 | 568,645 |
| Chevron Corp. |
| 2.36%, 12/05/22 (a) | 500,000 | 510,800 |
| 1.14%, 05/11/23 | 500,000 | 507,505 |
| 2.57%, 05/16/23 (a) | 150,000 | 155,109 |
| 3.19%, 06/24/23 (a) | 250,000 | 261,410 |
| 2.90%, 03/03/24 (a) | 150,000 | 158,577 |
| 1.55%, 05/11/25 (a) | 700,000 | 718,480 |
| 3.33%, 11/17/25 (a) | 300,000 | 328,410 |
| 2.95%, 05/16/26 (a) | 500,000 | 542,230 |
| Chevron USA, Inc. |
| 0.43%, 08/11/23 | 300,000 | 300,789 |
| 3.90%, 11/15/24 (a) | 100,000 | 109,654 |
| 0.69%, 08/12/25 (a) | 300,000 | 298,482 |
| Cimarex Energy Co. |
| 4.38%, 06/01/24 (a) | 200,000 | 216,526 |
| Columbia Pipeline Group, Inc. |
| 4.50%, 06/01/25 (a) | 300,000 | 336,099 |
| ConocoPhillips Co. |
| 3.35%, 11/15/24 (a) | 100,000 | 107,627 |
| 4.95%, 03/15/26 (a) | 400,000 | 463,860 |
| Devon Energy Corp. |
| 5.25%, 09/15/24 (a)(d) | 200,000 | 222,058 |
| 5.85%, 12/15/25 (a) | 200,000 | 233,010 |
| Diamondback Energy, Inc. |
| 2.88%, 12/01/24 (a) | 250,000 | 262,663 |
| 4.75%, 05/31/25 (a) | 150,000 | 167,993 |
Security
Rate, Maturity Date | Face
Amount ($) | Value ($) |
| Eastern Energy Gas Holdings LLC |
| 2.50%, 11/15/24 (a) | 200,000 | 209,588 |
| 3.60%, 12/15/24 (a) | 67,000 | 72,378 |
| Enable Midstream Partners LP |
| 3.90%, 05/15/24 (a) | 100,000 | 106,419 |
| Enbridge Energy Partners LP |
| 5.88%, 10/15/25 (a) | 200,000 | 234,964 |
| Enbridge, Inc. |
| 4.00%, 10/01/23 (a) | 200,000 | 212,438 |
| 3.50%, 06/10/24 (a) | 100,000 | 107,035 |
| Energy Transfer LP |
| 3.45%, 01/15/23 (a) | 150,000 | 154,491 |
| 3.60%, 02/01/23 (a) | 200,000 | 206,784 |
| 4.25%, 03/15/23 (a) | 250,000 | 261,178 |
| 4.20%, 09/15/23 (a) | 150,000 | 159,726 |
| 5.88%, 01/15/24 (a) | 400,000 | 440,796 |
| 4.90%, 02/01/24 (a) | 100,000 | 108,129 |
| 4.25%, 04/01/24 (a) | 100,000 | 107,316 |
| 4.50%, 04/15/24 (a) | 200,000 | 217,128 |
| 4.05%, 03/15/25 (a) | 350,000 | 379,106 |
| 2.90%, 05/15/25 (a) | 300,000 | 315,357 |
| 4.75%, 01/15/26 (a) | 250,000 | 280,685 |
| 3.90%, 07/15/26 (a) | 200,000 | 219,836 |
| Energy Transfer LP/Regency Energy Finance Corp |
| 5.00%, 10/01/22 (a) | 100,000 | 103,541 |
| 4.50%, 11/01/23 (a) | 100,000 | 106,880 |
| Enterprise Products Operating LLC |
| 3.35%, 03/15/23 (a) | 300,000 | 311,145 |
| 3.90%, 02/15/24 (a) | 300,000 | 321,411 |
| 3.75%, 02/15/25 (a) | 300,000 | 326,133 |
| 3.70%, 02/15/26 (a) | 250,000 | 276,345 |
| EOG Resources, Inc. |
| 2.63%, 03/15/23 (a) | 400,000 | 412,132 |
| 3.15%, 04/01/25 (a) | 100,000 | 107,416 |
| 4.15%, 01/15/26 (a) | 200,000 | 224,530 |
| Exxon Mobil Corp. |
| 2.73%, 03/01/23 (a) | 400,000 | 412,852 |
| 1.57%, 04/15/23 | 750,000 | 765,187 |
| 3.18%, 03/15/24 (a) | 100,000 | 106,251 |
| 2.02%, 08/16/24 (a) | 450,000 | 469,480 |
| 2.71%, 03/06/25 (a) | 600,000 | 637,266 |
| 2.99%, 03/19/25 (a) | 650,000 | 695,766 |
| 3.04%, 03/01/26 (a) | 500,000 | 542,405 |
| 2.28%, 08/16/26 (a) | 250,000 | 263,841 |
| Halliburton Co. |
| 3.50%, 08/01/23 (a) | 150,000 | 157,533 |
| 3.80%, 11/15/25 (a) | 350,000 | 385,556 |
| HollyFrontier Corp. |
| 2.63%, 10/01/23 | 250,000 | 258,228 |
| 5.88%, 04/01/26 (a) | 150,000 | 172,508 |
| Kinder Morgan Energy Partners LP |
| 3.45%, 02/15/23 (a) | 150,000 | 155,301 |
| 3.50%, 09/01/23 (a) | 100,000 | 105,050 |
| 4.15%, 02/01/24 (a) | 300,000 | 321,831 |
| 4.30%, 05/01/24 (a) | 400,000 | 433,568 |
| Kinder Morgan, Inc. |
| 3.15%, 01/15/23 (a) | 400,000 | 414,096 |
| 4.30%, 06/01/25 (a) | 400,000 | 443,304 |
| Magellan Midstream Partners LP |
| 5.00%, 03/01/26 (a) | 200,000 | 229,764 |
| Marathon Oil Corp. |
| 3.85%, 06/01/25 | 200,000 | 220,944 |
Schwab Taxable Bond Funds | Annual Report
Schwab Short-Term Bond Index Fund
Portfolio Holdings as of August 31, 2021 (continued)
Security
Rate, Maturity Date | Face
Amount ($) | Value ($) |
| Marathon Petroleum Corp. |
| 4.50%, 05/01/23 (a) | 200,000 | 212,052 |
| 4.75%, 12/15/23 (a) | 100,000 | 108,388 |
| 3.63%, 09/15/24 (a) | 100,000 | 107,552 |
| 4.70%, 05/01/25 (a) | 400,000 | 448,432 |
| MPLX LP |
| 3.50%, 12/01/22 (a) | 100,000 | 103,468 |
| 3.38%, 03/15/23 (a) | 100,000 | 104,064 |
| 4.50%, 07/15/23 (a) | 400,000 | 424,976 |
| 4.88%, 12/01/24 (a) | 200,000 | 222,648 |
| 4.00%, 02/15/25 (a) | 250,000 | 272,392 |
| 4.88%, 06/01/25 (a) | 250,000 | 281,260 |
| 1.75%, 03/01/26 (a) | 400,000 | 405,256 |
| National Fuel Gas Co. |
| 5.20%, 07/15/25 (a) | 250,000 | 280,860 |
| 5.50%, 01/15/26 (a) | 100,000 | 115,691 |
| ONEOK Partners LP |
| 3.38%, 10/01/22 (a) | 100,000 | 102,374 |
| 5.00%, 09/15/23 (a) | 400,000 | 429,636 |
| 4.90%, 03/15/25 (a) | 100,000 | 111,580 |
| ONEOK, Inc. |
| 7.50%, 09/01/23 (a) | 150,000 | 167,562 |
| 2.75%, 09/01/24 (a) | 100,000 | 104,925 |
| 5.85%, 01/15/26 (a) | 275,000 | 323,694 |
| Phillips 66 |
| 3.70%, 04/06/23 | 200,000 | 210,022 |
| 0.90%, 02/15/24 (a) | 250,000 | 250,130 |
| 3.85%, 04/09/25 (a) | 250,000 | 273,467 |
| 1.30%, 02/15/26 (a) | 100,000 | 100,032 |
| Phillips 66 Partners LP |
| 2.45%, 12/15/24 (a) | 100,000 | 104,107 |
| Pioneer Natural Resources Co. |
| 0.75%, 01/15/24 (a) | 250,000 | 249,710 |
| 1.13%, 01/15/26 (a) | 150,000 | 148,877 |
| 4.45%, 01/15/26 (a) | 200,000 | 224,820 |
| Plains All American Pipeline LP/PAA Finance Corp. |
| 2.85%, 01/31/23 (a) | 100,000 | 102,413 |
| 3.85%, 10/15/23 (a) | 100,000 | 105,426 |
| 3.60%, 11/01/24 (a) | 300,000 | 319,938 |
| 4.65%, 10/15/25 (a) | 250,000 | 278,727 |
| Sabine Pass Liquefaction LLC |
| 5.63%, 04/15/23 (a) | 400,000 | 426,668 |
| 5.75%, 05/15/24 (a) | 500,000 | 557,740 |
| 5.63%, 03/01/25 (a) | 500,000 | 569,940 |
| 5.88%, 06/30/26 (a) | 400,000 | 472,892 |
| Schlumberger Finance Canada Ltd. |
| 1.40%, 09/17/25 (a) | 250,000 | 253,765 |
| Schlumberger Investment S.A. |
| 3.65%, 12/01/23 (a) | 250,000 | 265,965 |
| Shell International Finance BV |
| 2.25%, 01/06/23 | 150,000 | 154,011 |
| 3.40%, 08/12/23 | 391,000 | 414,503 |
| 0.38%, 09/15/23 | 250,000 | 250,420 |
| 3.50%, 11/13/23 (a) | 250,000 | 266,613 |
| 2.00%, 11/07/24 (a) | 400,000 | 417,100 |
| 2.38%, 04/06/25 (a) | 450,000 | 472,653 |
| 3.25%, 05/11/25 | 700,000 | 759,465 |
| 2.88%, 05/10/26 | 500,000 | 540,320 |
| Spectra Energy Partners LP |
| 4.75%, 03/15/24 (a) | 200,000 | 218,192 |
| 3.50%, 03/15/25 (a) | 150,000 | 161,571 |
| Suncor Energy, Inc. |
| 2.80%, 05/15/23 | 200,000 | 207,452 |
| 3.60%, 12/01/24 (a) | 150,000 | 163,086 |
| 3.10%, 05/15/25 (a) | 250,000 | 266,725 |
Security
Rate, Maturity Date | Face
Amount ($) | Value ($) |
| TC PipeLines LP |
| 4.38%, 03/13/25 (a) | 200,000 | 219,966 |
| The Williams Cos., Inc. |
| 3.70%, 01/15/23 (a) | 200,000 | 207,292 |
| 4.50%, 11/15/23 (a) | 150,000 | 161,228 |
| 4.30%, 03/04/24 (a) | 200,000 | 215,764 |
| 4.55%, 06/24/24 (a) | 400,000 | 438,520 |
| 3.90%, 01/15/25 (a) | 250,000 | 271,385 |
| 4.00%, 09/15/25 (a) | 200,000 | 220,838 |
| Total Capital International S.A. |
| 2.70%, 01/25/23 | 100,000 | 103,412 |
| TotalEnergies Capital Canada Ltd. |
| 2.75%, 07/15/23 | 450,000 | 469,998 |
| TotalEnergies Capital International S.A. |
| 3.70%, 01/15/24 | 350,000 | 376,334 |
| 3.75%, 04/10/24 | 150,000 | 162,497 |
| 2.43%, 01/10/25 (a) | 300,000 | 314,901 |
| TransCanada PipeLines Ltd. |
| 3.75%, 10/16/23 (a) | 200,000 | 212,144 |
| 4.88%, 01/15/26 (a) | 100,000 | 114,763 |
| Transcontinental Gas Pipe Line Co. LLC |
| 7.85%, 02/01/26 (a) | 250,000 | 314,852 |
| Valero Energy Corp. |
| 2.70%, 04/15/23 | 100,000 | 103,357 |
| 1.20%, 03/15/24 | 250,000 | 252,095 |
| 3.65%, 03/15/25 | 250,000 | 270,757 |
| 2.85%, 04/15/25 (a) | 350,000 | 369,537 |
| | | 43,666,064 |
| Industrial Other 0.0% |
| Yale University |
| 0.87%, 04/15/25 (a) | 150,000 | 151,389 |
| Technology 2.8% |
| Adobe, Inc. |
| 1.70%, 02/01/23 | 350,000 | 357,308 |
| 1.90%, 02/01/25 (a) | 100,000 | 103,813 |
| 3.25%, 02/01/25 (a) | 100,000 | 107,893 |
| Alphabet, Inc. |
| 3.38%, 02/25/24 | 200,000 | 214,918 |
| 0.45%, 08/15/25 (a) | 250,000 | 247,733 |
| 2.00%, 08/15/26 (a) | 550,000 | 577,727 |
| Altera Corp. |
| 4.10%, 11/15/23 | 150,000 | 161,993 |
| Analog Devices, Inc. |
| 3.13%, 12/05/23 (a) | 200,000 | 211,132 |
| 2.95%, 04/01/25 (a) | 350,000 | 374,381 |
| Apple Inc. |
| 1.70%, 09/11/22 | 251,000 | 254,923 |
| 2.10%, 09/12/22 (a) | 100,000 | 101,813 |
| 2.40%, 01/13/23 (a) | 100,000 | 102,783 |
| 2.85%, 02/23/23 (a) | 400,000 | 413,704 |
| 2.40%, 05/03/23 | 1,500,000 | 1,553,835 |
| 0.75%, 05/11/23 | 600,000 | 605,256 |
| 3.00%, 02/09/24 (a) | 300,000 | 317,358 |
| 3.45%, 05/06/24 | 825,000 | 890,282 |
| 2.85%, 05/11/24 (a) | 500,000 | 530,095 |
| 1.80%, 09/11/24 (a) | 100,000 | 103,710 |
| 2.75%, 01/13/25 (a) | 450,000 | 479,115 |
| 2.50%, 02/09/25 | 250,000 | 264,460 |
| 1.13%, 05/11/25 (a) | 650,000 | 658,021 |
| 3.20%, 05/13/25 | 750,000 | 814,575 |
| 0.55%, 08/20/25 (a) | 550,000 | 545,605 |
| 0.70%, 02/08/26 (a) | 300,000 | 298,245 |
Schwab Taxable Bond Funds | Annual Report
Schwab Short-Term Bond Index Fund
Portfolio Holdings as of August 31, 2021 (continued)
Security
Rate, Maturity Date | Face
Amount ($) | Value ($) |
| 3.25%, 02/23/26 (a) | 750,000 | 822,210 |
| 2.45%, 08/04/26 (a) | 600,000 | 639,633 |
| Applied Materials, Inc. |
| 3.90%, 10/01/25 (a) | 200,000 | 222,870 |
| Arrow Electronics, Inc. |
| 4.50%, 03/01/23 (a) | 100,000 | 104,787 |
| 3.25%, 09/08/24 (a) | 100,000 | 106,119 |
| Autodesk, Inc. |
| 3.60%, 12/15/22 (a) | 100,000 | 103,179 |
| Automatic Data Processing, Inc. |
| 3.38%, 09/15/25 (a) | 250,000 | 274,095 |
| Avnet, Inc. |
| 4.88%, 12/01/22 | 100,000 | 105,078 |
| 4.63%, 04/15/26 (a) | 150,000 | 168,299 |
| Baidu, Inc. |
| 3.50%, 11/28/22 | 100,000 | 103,380 |
| 3.88%, 09/29/23 (a) | 200,000 | 212,128 |
| 4.38%, 05/14/24 (a) | 450,000 | 489,883 |
| 3.08%, 04/07/25 (a) | 250,000 | 264,857 |
| 1.72%, 04/09/26 (a) | 200,000 | 202,422 |
| Broadcom Corp./Broadcom Cayman Finance Ltd. |
| 3.63%, 01/15/24 (a) | 200,000 | 212,642 |
| 3.13%, 01/15/25 (a) | 200,000 | 212,728 |
| Broadcom, Inc. |
| 3.63%, 10/15/24 (a) | 150,000 | 162,273 |
| 4.70%, 04/15/25 (a) | 350,000 | 391,856 |
| 3.15%, 11/15/25 (a) | 750,000 | 803,662 |
| Cadence Design Systems, Inc. |
| 4.38%, 10/15/24 (a) | 100,000 | 109,769 |
| CDW LLC/CDW Finance Corp. |
| 4.13%, 05/01/25 (a) | 200,000 | 208,250 |
| Cisco Systems, Inc. |
| 2.60%, 02/28/23 | 250,000 | 258,920 |
| 2.20%, 09/20/23 (a) | 250,000 | 259,305 |
| 3.63%, 03/04/24 | 150,000 | 161,993 |
| 3.50%, 06/15/25 | 250,000 | 275,602 |
| 2.95%, 02/28/26 | 100,000 | 109,150 |
| Citrix Systems, Inc. |
| 1.25%, 03/01/26 (a) | 200,000 | 197,772 |
| Dell International LLC/EMC Corp. |
| 5.45%, 06/15/23 (a) | 950,000 | 1,024,214 |
| 4.00%, 07/15/24 (a) | 350,000 | 379,988 |
| 5.85%, 07/15/25 (a) | 250,000 | 292,127 |
| 6.02%, 06/15/26 (a) | 1,250,000 | 1,496,337 |
| DXC Technology Co. |
| 4.25%, 04/15/24 (a) | 100,000 | 107,989 |
| 4.13%, 04/15/25 (a) | 300,000 | 329,406 |
| Equifax, Inc. |
| 3.30%, 12/15/22 (a) | 400,000 | 411,852 |
| 2.60%, 12/01/24 (a) | 100,000 | 105,255 |
| Equinix, Inc. |
| 2.63%, 11/18/24 (a) | 350,000 | 367,913 |
| 1.25%, 07/15/25 (a) | 150,000 | 150,168 |
| 1.00%, 09/15/25 (a) | 250,000 | 248,853 |
| Fidelity National Information Services, Inc. |
| 0.38%, 03/01/23 | 200,000 | 200,018 |
| 0.60%, 03/01/24 | 200,000 | 200,046 |
| 1.15%, 03/01/26 (a) | 400,000 | 398,592 |
| Fiserv, Inc. |
| 3.50%, 10/01/22 (a) | 150,000 | 153,981 |
| 3.80%, 10/01/23 (a) | 400,000 | 426,636 |
| 2.75%, 07/01/24 (a) | 450,000 | 475,564 |
| 3.85%, 06/01/25 (a) | 250,000 | 274,607 |
| 3.20%, 07/01/26 (a) | 500,000 | 543,710 |
Security
Rate, Maturity Date | Face
Amount ($) | Value ($) |
| Flex Ltd. |
| 5.00%, 02/15/23 | 100,000 | 106,013 |
| 4.75%, 06/15/25 (a) | 150,000 | 167,255 |
| 3.75%, 02/01/26 (a) | 300,000 | 327,678 |
| Fortinet, Inc. |
| 1.00%, 03/15/26 (a) | 150,000 | 149,141 |
| Genpact Luxembourg SARL/Genpact USA, Inc. |
| 1.75%, 04/10/26 (a)(e)(f) | 150,000 | 152,142 |
| Global Payments, Inc. |
| 3.75%, 06/01/23 (a) | 150,000 | 157,134 |
| 4.00%, 06/01/23 (a) | 100,000 | 105,679 |
| 2.65%, 02/15/25 (a) | 250,000 | 262,883 |
| 1.20%, 03/01/26 (a) | 200,000 | 198,924 |
| 4.80%, 04/01/26 (a) | 250,000 | 286,157 |
| Hewlett Packard Enterprise Co. |
| 4.40%, 10/15/22 (a) | 150,000 | 155,597 |
| 2.25%, 04/01/23 (a) | 300,000 | 307,815 |
| 4.45%, 10/02/23 (a) | 300,000 | 322,875 |
| 1.45%, 04/01/24 (a) | 500,000 | 508,710 |
| 4.65%, 10/01/24 (a) | 350,000 | 388,265 |
| 4.90%, 10/15/25 (a) | 600,000 | 683,904 |
| 1.75%, 04/01/26 (a) | 150,000 | 153,099 |
| HP, Inc. |
| 4.05%, 09/15/22 | 350,000 | 363,125 |
| 2.20%, 06/17/25 (a) | 150,000 | 155,709 |
| 1.45%, 06/17/26 (a)(d) | 250,000 | 249,985 |
| IHS Markit Ltd. |
| 4.13%, 08/01/23 (a) | 250,000 | 265,537 |
| 3.63%, 05/01/24 (a) | 100,000 | 106,727 |
| Intel Corp. |
| 2.70%, 12/15/22 | 300,000 | 309,531 |
| 2.88%, 05/11/24 (a) | 450,000 | 477,472 |
| 3.40%, 03/25/25 (a) | 400,000 | 435,256 |
| 3.70%, 07/29/25 (a) | 550,000 | 605,918 |
| 2.60%, 05/19/26 (a) | 250,000 | 268,295 |
| International Business Machines Corp. |
| 2.88%, 11/09/22 | 150,000 | 154,641 |
| 3.38%, 08/01/23 | 450,000 | 475,470 |
| 3.63%, 02/12/24 | 700,000 | 752,031 |
| 3.00%, 05/15/24 | 850,000 | 904,799 |
| 3.45%, 02/19/26 | 400,000 | 441,680 |
| 3.30%, 05/15/26 | 800,000 | 880,992 |
| Intuit, Inc. |
| 0.65%, 07/15/23 | 150,000 | 150,897 |
| 0.95%, 07/15/25 (a) | 150,000 | 150,669 |
| Jabil, Inc. |
| 4.70%, 09/15/22 | 100,000 | 104,378 |
| 1.70%, 04/15/26 (a) | 150,000 | 151,590 |
| Juniper Networks, Inc. |
| 1.20%, 12/10/25 (a) | 200,000 | 199,968 |
| Keysight Technologies, Inc. |
| 4.55%, 10/30/24 (a) | 100,000 | 110,724 |
| KLA Corp. |
| 4.65%, 11/01/24 (a) | 300,000 | 333,093 |
| Lam Research Corp. |
| 3.80%, 03/15/25 (a) | 200,000 | 219,460 |
| 3.75%, 03/15/26 (a) | 100,000 | 111,791 |
| Leidos, Inc. |
| 3.63%, 05/15/25 (a) | 200,000 | 216,892 |
| Marvell Technology, Inc. |
| 4.20%, 06/22/23 (a)(d) | 100,000 | 105,972 |
| 1.65%, 04/15/26 (a)(d) | 100,000 | 100,733 |
Schwab Taxable Bond Funds | Annual Report
Schwab Short-Term Bond Index Fund
Portfolio Holdings as of August 31, 2021 (continued)
Security
Rate, Maturity Date | Face
Amount ($) | Value ($) |
| Mastercard, Inc. |
| 3.38%, 04/01/24 | 350,000 | 375,973 |
| 2.00%, 03/03/25 (a) | 100,000 | 104,484 |
| Maxim Integrated Products, Inc. |
| 3.38%, 03/15/23 (a) | 200,000 | 207,550 |
| Microchip Technology, Inc. |
| 4.33%, 06/01/23 (a) | 200,000 | 212,126 |
| 2.67%, 09/01/23 | 250,000 | 259,615 |
| Micron Technology, Inc. |
| 2.50%, 04/24/23 | 400,000 | 412,900 |
| 4.64%, 02/06/24 (a) | 150,000 | 163,292 |
| 4.98%, 02/06/26 (a) | 200,000 | 230,274 |
| Microsoft Corp. |
| 2.65%, 11/03/22 (a) | 150,000 | 153,765 |
| 2.38%, 05/01/23 (a) | 500,000 | 515,340 |
| 2.00%, 08/08/23 (a) | 250,000 | 257,968 |
| 3.63%, 12/15/23 (a) | 450,000 | 481,383 |
| 2.88%, 02/06/24 (a) | 850,000 | 897,906 |
| 2.70%, 02/12/25 (a) | 500,000 | 533,095 |
| 3.13%, 11/03/25 (a) | 800,000 | 872,736 |
| 2.40%, 08/08/26 (a) | 1,000,000 | 1,068,686 |
| Moody's Corp. |
| 2.63%, 01/15/23 (a) | 250,000 | 257,340 |
| 4.88%, 02/15/24 (a) | 250,000 | 273,467 |
| 3.75%, 03/24/25 (a) | 50,000 | 54,661 |
| Motorola Solutions, Inc. |
| 4.00%, 09/01/24 | 100,000 | 109,238 |
| NetApp, Inc. |
| 1.88%, 06/22/25 (a) | 250,000 | 257,683 |
| NVIDIA Corp. |
| 0.31%, 06/15/23 (a) | 250,000 | 250,105 |
| 0.58%, 06/14/24 (a) | 250,000 | 250,690 |
| NXP BV / NXP Funding LLC / NXP USA, Inc. |
| 3.88%, 06/18/26 (a)(d) | 200,000 | 221,800 |
| NXP BV/NXP Funding LLC |
| 4.88%, 03/01/24 (a)(d) | 250,000 | 273,870 |
| 5.35%, 03/01/26 (a)(d) | 200,000 | 233,122 |
| NXP BV/NXP Funding LLC/NXP USA, Inc. |
| 2.70%, 05/01/25 (a)(d) | 100,000 | 105,259 |
| Oracle Corp. |
| 2.50%, 10/15/22 | 600,000 | 614,652 |
| 2.63%, 02/15/23 (a) | 300,000 | 309,225 |
| 3.63%, 07/15/23 | 150,000 | 158,852 |
| 2.40%, 09/15/23 (a) | 750,000 | 777,330 |
| 3.40%, 07/08/24 (a) | 650,000 | 696,026 |
| 2.95%, 11/15/24 (a) | 600,000 | 639,168 |
| 2.50%, 04/01/25 (a) | 800,000 | 839,592 |
| 2.95%, 05/15/25 (a) | 650,000 | 691,925 |
| 1.65%, 03/25/26 (a) | 700,000 | 711,396 |
| 2.65%, 07/15/26 (a) | 750,000 | 794,677 |
| PayPal Holdings, Inc. |
| 2.20%, 09/26/22 | 300,000 | 306,279 |
| 1.35%, 06/01/23 | 350,000 | 356,268 |
| 2.40%, 10/01/24 (a) | 250,000 | 263,538 |
| 1.65%, 06/01/25 (a) | 250,000 | 257,500 |
| QUALCOMM, Inc. |
| 2.60%, 01/30/23 (a) | 250,000 | 257,933 |
| 2.90%, 05/20/24 (a) | 200,000 | 212,318 |
| 3.45%, 05/20/25 (a) | 400,000 | 435,644 |
| RELX Capital, Inc. |
| 3.50%, 03/16/23 (a) | 200,000 | 208,884 |
| S&P Global, Inc. |
| 4.00%, 06/15/25 (a) | 200,000 | 221,840 |
Security
Rate, Maturity Date | Face
Amount ($) | Value ($) |
| salesforce.com, Inc. |
| 3.25%, 04/11/23 (a) | 250,000 | 261,400 |
| 0.63%, 07/15/24 (a) | 250,000 | 250,563 |
| Skyworks Solutions, Inc. |
| 1.80%, 06/01/26 (a) | 250,000 | 254,288 |
| SYNNEX Corp. |
| 1.75%, 08/09/26 (a)(d) | 200,000 | 199,234 |
| Texas Instruments, Inc. |
| 1.38%, 03/12/25 (a) | 225,000 | 229,608 |
| The Western Union Co. |
| 2.85%, 01/10/25 (a) | 150,000 | 158,204 |
| 1.35%, 03/15/26 (a) | 250,000 | 248,610 |
| Thomson Reuters Corp. |
| 4.30%, 11/23/23 (a) | 200,000 | 214,728 |
| Trimble, Inc. |
| 4.15%, 06/15/23 (a) | 100,000 | 105,724 |
| Tyco Electronics Group S.A. |
| 3.45%, 08/01/24 (a) | 100,000 | 106,936 |
| VeriSign, Inc. |
| 5.25%, 04/01/25 (a) | 150,000 | 169,628 |
| Verisk Analytics, Inc. |
| 4.13%, 09/12/22 | 100,000 | 103,673 |
| 4.00%, 06/15/25 (a) | 200,000 | 220,896 |
| Visa, Inc. |
| 2.15%, 09/15/22 (a) | 250,000 | 254,633 |
| 2.80%, 12/14/22 (a) | 700,000 | 720,419 |
| 3.15%, 12/14/25 (a) | 1,000,000 | 1,093,090 |
| VMware, Inc. |
| 0.60%, 08/15/23 | 300,000 | 300,429 |
| 1.00%, 08/15/24 (a) | 300,000 | 301,320 |
| 4.50%, 05/15/25 (a) | 250,000 | 279,362 |
| 1.40%, 08/15/26 (a) | 200,000 | 199,878 |
| Xilinx, Inc. |
| 2.95%, 06/01/24 (a) | 150,000 | 158,487 |
| | | 61,915,887 |
| Transportation 0.4% |
| Burlington Northern Santa Fe LLC |
| 3.05%, 09/01/22 (a) | 400,000 | 408,352 |
| 3.85%, 09/01/23 (a) | 300,000 | 318,537 |
| 3.75%, 04/01/24 (a) | 100,000 | 107,542 |
| 3.40%, 09/01/24 (a) | 100,000 | 107,768 |
| 3.00%, 04/01/25 (a) | 250,000 | 268,595 |
| 7.00%, 12/15/25 | 200,000 | 248,962 |
| Canadian National Railway Co. |
| 2.95%, 11/21/24 (a) | 100,000 | 106,396 |
| 2.75%, 03/01/26 (a) | 150,000 | 160,707 |
| Canadian Pacific Railway Co. |
| 4.45%, 03/15/23 (a) | 100,000 | 105,116 |
| 2.90%, 02/01/25 (a) | 100,000 | 106,096 |
| Continental Airlines 2012-2 Class A Pass Through Trust |
| 4.00%, 10/29/24 | 62,541 | 66,021 |
| CSX Corp. |
| 3.40%, 08/01/24 (a) | 150,000 | 161,335 |
| 3.35%, 11/01/25 (a) | 250,000 | 272,570 |
| Delta Air Lines 2019-1 Class AA Pass-Through Trust |
| 3.20%, 04/25/24 | 200,000 | 211,814 |
| FedEx Corp. |
| 3.25%, 04/01/26 (a) | 100,000 | 109,284 |
| JB Hunt Transport Services, Inc. |
| 3.30%, 08/15/22 (a) | 100,000 | 102,336 |
| 3.88%, 03/01/26 (a) | 200,000 | 223,114 |
Schwab Taxable Bond Funds | Annual Report
Schwab Short-Term Bond Index Fund
Portfolio Holdings as of August 31, 2021 (continued)
Security
Rate, Maturity Date | Face
Amount ($) | Value ($) |
| Norfolk Southern Corp. |
| 3.85%, 01/15/24 (a) | 100,000 | 106,898 |
| 3.65%, 08/01/25 (a) | 200,000 | 219,364 |
| 2.90%, 06/15/26 (a) | 150,000 | 162,079 |
| Ryder System, Inc. |
| 3.40%, 03/01/23 (a) | 350,000 | 364,511 |
| 3.75%, 06/09/23 (a) | 150,000 | 158,253 |
| 3.88%, 12/01/23 (a) | 100,000 | 107,084 |
| 3.65%, 03/18/24 (a) | 100,000 | 107,184 |
| 4.63%, 06/01/25 (a) | 250,000 | 281,050 |
| 3.35%, 09/01/25 (a) | 75,000 | 81,092 |
| Southwest Airlines Co. |
| 2.75%, 11/16/22 (a) | 50,000 | 51,220 |
| 4.75%, 05/04/23 | 225,000 | 240,383 |
| 5.25%, 05/04/25 (a) | 600,000 | 680,418 |
| Union Pacific Corp. |
| 3.50%, 06/08/23 (a) | 150,000 | 158,029 |
| 3.65%, 02/15/24 (a) | 100,000 | 106,813 |
| 3.15%, 03/01/24 (a) | 100,000 | 106,273 |
| 3.75%, 03/15/24 (a) | 250,000 | 267,867 |
| 3.25%, 01/15/25 (a) | 300,000 | 322,656 |
| 2.75%, 03/01/26 (a) | 200,000 | 214,298 |
| United Airlines 2012-1 Class A Pass Through Trust |
| 4.15%, 04/11/24 | 30,313 | 32,004 |
| United Airlines 2013-1 Class A Pass Through Trust |
| 4.30%, 08/15/25 | 65,296 | 70,219 |
| United Airlines 2014-1 Class A Pass-Through Trust |
| 4.00%, 04/11/26 | 100,432 | 106,314 |
| United Airlines 2020-1 Class B Pass Through Trust |
| 4.88%, 01/15/26 | 186,850 | 197,063 |
| United Parcel Service, Inc. |
| 2.45%, 10/01/22 | 200,000 | 204,784 |
| 2.50%, 04/01/23 (a) | 250,000 | 258,320 |
| 2.20%, 09/01/24 (a) | 250,000 | 261,680 |
| 2.80%, 11/15/24 (a) | 75,000 | 80,072 |
| 3.90%, 04/01/25 (a) | 200,000 | 220,746 |
| | | 8,251,219 |
| | | 300,195,149 |
| |
| Utility 1.3% |
| Electric 1.2% |
| AEP Texas, Inc. |
| 2.40%, 10/01/22 (a) | 200,000 | 204,234 |
| Alabama Power Co. |
| 3.55%, 12/01/23 | 150,000 | 160,445 |
| Ameren Corp. |
| 2.50%, 09/15/24 (a) | 100,000 | 104,832 |
| 3.65%, 02/15/26 (a) | 250,000 | 274,025 |
| Ameren Illinois Co. |
| 2.70%, 09/01/22 (a) | 100,000 | 101,830 |
| American Electric Power Co., Inc. |
| 1.00%, 11/01/25 (a) | 250,000 | 248,795 |
| Avangrid, Inc. |
| 3.15%, 12/01/24 (a) | 250,000 | 267,047 |
| 3.20%, 04/15/25 (a) | 100,000 | 107,138 |
| Berkshire Hathaway Energy Co. |
| 2.80%, 01/15/23 (a) | 250,000 | 257,852 |
| 3.75%, 11/15/23 (a) | 300,000 | 320,157 |
| 3.50%, 02/01/25 (a) | 100,000 | 108,073 |
| 4.05%, 04/15/25 (a) | 450,000 | 497,893 |
| Black Hills Corp. |
| 4.25%, 11/30/23 (a) | 250,000 | 268,112 |
Security
Rate, Maturity Date | Face
Amount ($) | Value ($) |
| CenterPoint Energy, Inc. |
| 2.50%, 09/01/22 (a) | 150,000 | 152,966 |
| 2.50%, 09/01/24 (a) | 100,000 | 104,743 |
| Cleco Corporate Holdings LLC |
| 3.74%, 05/01/26 (a) | 200,000 | 218,373 |
| Consolidated Edison, Inc. |
| 0.65%, 12/01/23 (a) | 200,000 | 200,030 |
| Consumers Energy Co. |
| 3.38%, 08/15/23 (a) | 100,000 | 105,099 |
| Dominion Energy, Inc. |
| 3.07%, 08/15/24 | 300,000 | 318,390 |
| 3.30%, 03/15/25 (a) | 100,000 | 107,921 |
| 3.90%, 10/01/25 (a) | 250,000 | 275,477 |
| 1.45%, 04/15/26 (a) | 200,000 | 201,894 |
| 5.75%, 10/01/54 (a)(b) | 122,000 | 133,891 |
| DTE Electric Co. |
| 3.65%, 03/15/24 (a) | 100,000 | 106,950 |
| DTE Energy Co. |
| 0.55%, 11/01/22 | 250,000 | 250,670 |
| 2.53%, 10/01/24 | 100,000 | 104,841 |
| 1.05%, 06/01/25 (a) | 200,000 | 199,650 |
| Duke Energy Corp. |
| 3.75%, 04/15/24 (a) | 300,000 | 322,074 |
| 0.90%, 09/15/25 (a) | 300,000 | 297,816 |
| Duke Energy Ohio, Inc. |
| 3.80%, 09/01/23 (a) | 200,000 | 211,842 |
| Duke Energy Progress LLC |
| 3.25%, 08/15/25 (a) | 250,000 | 271,840 |
| Edison International |
| 2.40%, 09/15/22 (a) | 100,000 | 101,620 |
| 3.13%, 11/15/22 (a) | 250,000 | 256,727 |
| 3.55%, 11/15/24 (a) | 100,000 | 106,343 |
| 4.95%, 04/15/25 (a) | 150,000 | 166,013 |
| Emera US Finance LP |
| 3.55%, 06/15/26 (a) | 250,000 | 273,177 |
| Enel Generacion Chile S.A. |
| 4.25%, 04/15/24 (a) | 100,000 | 107,585 |
| Entergy Arkansas LLC |
| 3.70%, 06/01/24 (a) | 100,000 | 107,632 |
| Entergy Corp. |
| 0.90%, 09/15/25 (a) | 250,000 | 247,190 |
| Entergy Louisiana LLC |
| 0.62%, 11/17/23 (a) | 400,000 | 400,224 |
| 5.40%, 11/01/24 | 100,000 | 114,376 |
| Evergy, Inc. |
| 2.45%, 09/15/24 (a) | 250,000 | 261,375 |
| Eversource Energy |
| 2.80%, 05/01/23 (a) | 600,000 | 619,848 |
| 2.90%, 10/01/24 (a) | 200,000 | 212,194 |
| 0.80%, 08/15/25 (a) | 200,000 | 198,018 |
| Exelon Corp. |
| 3.95%, 06/15/25 (a) | 250,000 | 274,620 |
| 3.40%, 04/15/26 (a) | 200,000 | 218,342 |
| Exelon Generation Co., LLC |
| 3.25%, 06/01/25 (a) | 450,000 | 484,128 |
| Florida Power & Light Co. |
| 2.75%, 06/01/23 (a) | 200,000 | 206,250 |
| 2.85%, 04/01/25 (a) | 250,000 | 266,827 |
| 3.13%, 12/01/25 (a) | 200,000 | 216,880 |
| Georgia Power Co. |
| 2.10%, 07/30/23 | 100,000 | 103,244 |
| Interstate Power & Light Co. |
| 3.25%, 12/01/24 (a) | 250,000 | 268,220 |
Schwab Taxable Bond Funds | Annual Report
Schwab Short-Term Bond Index Fund
Portfolio Holdings as of August 31, 2021 (continued)
Security
Rate, Maturity Date | Face
Amount ($) | Value ($) |
| IPALCO Enterprises, Inc. |
| 3.70%, 09/01/24 (a) | 50,000 | 53,631 |
| ITC Holdings Corp. |
| 2.70%, 11/15/22 (a) | 100,000 | 102,528 |
| 3.65%, 06/15/24 (a) | 100,000 | 107,158 |
| MidAmerican Energy Co. |
| 3.50%, 10/15/24 (a) | 100,000 | 108,130 |
| National Rural Utilities Cooperative Finance Corp. |
| 2.30%, 09/15/22 (a) | 100,000 | 102,019 |
| 3.40%, 11/15/23 (a) | 350,000 | 370,461 |
| 2.95%, 02/07/24 (a) | 150,000 | 158,117 |
| 0.35%, 02/08/24 | 150,000 | 149,238 |
| 2.85%, 01/27/25 (a) | 100,000 | 106,254 |
| 3.25%, 11/01/25 (a) | 200,000 | 217,250 |
| 1.00%, 06/15/26 (a) | 200,000 | 199,242 |
| 4.75%, 04/30/43 (a)(b) | 250,000 | 262,085 |
| NextEra Energy Capital Holdings, Inc. |
| 1.95%, 09/01/22 | 350,000 | 355,806 |
| 2.80%, 01/15/23 (a) | 300,000 | 309,390 |
| 0.65%, 03/01/23 | 400,000 | 401,600 |
| 3.15%, 04/01/24 (a) | 145,000 | 153,748 |
| 2.75%, 05/01/25 (a) | 350,000 | 371,591 |
| Northern States Power Co. |
| 2.60%, 05/15/23 (a) | 150,000 | 154,113 |
| OGE Energy Corp. |
| 0.70%, 05/26/23 (a) | 100,000 | 100,034 |
| Oklahoma Gas & Electric Co. |
| 0.55%, 05/26/23 (a) | 100,000 | 100,071 |
| Oncor Electric Delivery Co., LLC |
| 2.75%, 06/01/24 (a) | 100,000 | 105,875 |
| 2.95%, 04/01/25 (a) | 200,000 | 213,736 |
| 0.55%, 10/01/25 (a) | 250,000 | 245,398 |
| Pacific Gas & Electric Co. |
| 3.25%, 06/15/23 (a) | 200,000 | 205,076 |
| 4.25%, 08/01/23 (a) | 200,000 | 209,188 |
| 3.40%, 08/15/24 (a) | 200,000 | 207,780 |
| 3.50%, 06/15/25 (a) | 150,000 | 155,639 |
| 3.45%, 07/01/25 | 400,000 | 414,304 |
| 3.15%, 01/01/26 | 500,000 | 512,495 |
| 2.95%, 03/01/26 (a) | 200,000 | 203,166 |
| PacifiCorp |
| 2.95%, 06/01/23 (a) | 250,000 | 259,465 |
| Pinnacle West Capital Corp. |
| 1.30%, 06/15/25 (a) | 425,000 | 429,454 |
| Potomac Electric Power Co. |
| 3.60%, 03/15/24 (a) | 100,000 | 106,974 |
| PPL Capital Funding, Inc. |
| 3.10%, 05/15/26 (a) | 200,000 | 215,284 |
| PSEG Power LLC |
| 3.85%, 06/01/23 (a) | 150,000 | 158,375 |
| Public Service Electric & Gas Co. |
| 2.38%, 05/15/23 (a) | 100,000 | 103,057 |
| 3.25%, 09/01/23 (a) | 150,000 | 158,159 |
| Public Service Enterprise Group, Inc. |
| 2.65%, 11/15/22 (a) | 250,000 | 256,533 |
| 2.88%, 06/15/24 (a) | 200,000 | 211,570 |
| 0.80%, 08/15/25 (a) | 250,000 | 247,503 |
| Puget Energy, Inc. |
| 3.65%, 05/15/25 (a) | 200,000 | 215,468 |
| San Diego Gas & Electric Co. |
| 3.60%, 09/01/23 (a) | 150,000 | 158,180 |
| Southern California Edison Co. |
| 3.40%, 06/01/23 (a) | 100,000 | 104,713 |
| 3.50%, 10/01/23 (a) | 150,000 | 158,025 |
Security
Rate, Maturity Date | Face
Amount ($) | Value ($) |
| 1.10%, 04/01/24 (a) | 250,000 | 251,115 |
| 3.70%, 08/01/25 (a) | 250,000 | 273,777 |
| 1.20%, 02/01/26 (a) | 100,000 | 99,736 |
| Southern Power Co. |
| 4.15%, 12/01/25 (a) | 250,000 | 279,592 |
| 0.90%, 01/15/26 (a) | 200,000 | 197,374 |
| Southwestern Electric Power Co. |
| 1.65%, 03/15/26 (a) | 150,000 | 152,480 |
| Southwestern Public Service Co. |
| 3.30%, 06/15/24 (a) | 100,000 | 106,132 |
| The AES Corp. |
| 1.38%, 01/15/26 (a) | 300,000 | 298,701 |
| The Southern Co. |
| 2.95%, 07/01/23 (a) | 500,000 | 520,895 |
| 3.25%, 07/01/26 (a) | 500,000 | 542,065 |
| 4.00%, 01/15/51 (a)(b) | 250,000 | 265,872 |
| Tucson Electric Power Co. |
| 3.05%, 03/15/25 (a) | 150,000 | 160,268 |
| Virginia Electric & Power Co. |
| 2.75%, 03/15/23 (a) | 150,000 | 154,728 |
| 3.45%, 02/15/24 (a) | 200,000 | 212,458 |
| 3.10%, 05/15/25 (a) | 100,000 | 107,225 |
| 3.15%, 01/15/26 (a) | 200,000 | 217,210 |
| WEC Energy Group, Inc. |
| 0.55%, 09/15/23 | 450,000 | 450,450 |
| 0.80%, 03/15/24 (a) | 200,000 | 201,056 |
| Xcel Energy, Inc. |
| 0.50%, 10/15/23 (a) | 500,000 | 501,235 |
| | | 25,845,985 |
| Natural Gas 0.1% |
| Atmos Energy Corp. |
| 0.63%, 03/09/23 (a) | 100,000 | 100,015 |
| CenterPoint Energy Resources Corp. |
| 0.70%, 03/02/23 (a) | 200,000 | 200,032 |
| 3.55%, 04/01/23 (a) | 100,000 | 104,614 |
| NiSource, Inc. |
| 0.95%, 08/15/25 (a) | 350,000 | 347,739 |
| ONE Gas, Inc. |
| 0.85%, 03/11/23 (a) | 300,000 | 300,189 |
| 1.10%, 03/11/24 (a) | 200,000 | 200,064 |
| Sempra Energy |
| 2.88%, 10/01/22 (a) | 250,000 | 254,915 |
| 2.90%, 02/01/23 (a) | 150,000 | 154,812 |
| 4.05%, 12/01/23 (a) | 100,000 | 106,959 |
| 3.55%, 06/15/24 (a) | 350,000 | 374,602 |
| 3.75%, 11/15/25 (a) | 150,000 | 164,565 |
| Southern California Gas Co. |
| 3.15%, 09/15/24 (a) | 50,000 | 53,468 |
| 2.60%, 06/15/26 (a) | 150,000 | 159,975 |
| Southern Co. Gas Capital Corp. |
| 2.45%, 10/01/23 (a) | 100,000 | 103,737 |
| 3.25%, 06/15/26 (a) | 100,000 | 108,366 |
| | | 2,734,052 |
| Utility Other 0.0% |
| American Water Capital Corp. |
| 3.40%, 03/01/25 (a) | 150,000 | 162,575 |
| | | 28,742,612 |
| Total Corporates |
| (Cost $572,250,542) | | 581,870,463 |
|
Schwab Taxable Bond Funds | Annual Report
Schwab Short-Term Bond Index Fund
Portfolio Holdings as of August 31, 2021 (continued)
Security
Rate, Maturity Date | Face
Amount ($) | Value ($) |
| Treasuries 63.3% of net assets |
| Bonds |
| 7.63%, 11/15/22 | 226,000 | 246,495 |
| 7.13%, 02/15/23 | 1,200,000 | 1,322,180 |
| 6.25%, 08/15/23 | 1,500,000 | 1,677,627 |
| 7.50%, 11/15/24 | 600,000 | 735,938 |
| 7.63%, 02/15/25 | 500,000 | 622,617 |
| 6.88%, 08/15/25 | 1,000,000 | 1,245,820 |
| 6.00%, 02/15/26 | 2,000,000 | 2,467,891 |
| 6.75%, 08/15/26 | 1,000,000 | 1,291,290 |
| Notes |
| 1.50%, 09/15/22 | 8,600,000 | 8,726,480 |
| 0.13%, 09/30/22 | 11,600,000 | 11,604,984 |
| 1.75%, 09/30/22 | 7,450,000 | 7,583,576 |
| 1.88%, 09/30/22 | 6,100,000 | 6,217,592 |
| 1.38%, 10/15/22 | 8,600,000 | 8,723,457 |
| 0.13%, 10/31/22 | 7,619,400 | 7,621,781 |
| 1.88%, 10/31/22 | 5,900,000 | 6,022,264 |
| 2.00%, 10/31/22 | 8,000,000 | 8,176,562 |
| 1.63%, 11/15/22 | 12,100,000 | 12,321,439 |
| 0.13%, 11/30/22 | 13,800,000 | 13,802,695 |
| 2.00%, 11/30/22 | 12,150,000 | 12,437,139 |
| 1.63%, 12/15/22 | 6,600,000 | 6,728,906 |
| 0.13%, 12/31/22 | 15,739,400 | 15,740,015 |
| 2.13%, 12/31/22 | 12,100,000 | 12,422,115 |
| 1.50%, 01/15/23 | 5,900,000 | 6,011,547 |
| 0.13%, 01/31/23 | 15,110,800 | 15,110,800 |
| 1.75%, 01/31/23 | 5,605,000 | 5,733,411 |
| 2.38%, 01/31/23 | 6,125,000 | 6,319,756 |
| 1.38%, 02/15/23 | 6,500,000 | 6,617,813 |
| 2.00%, 02/15/23 | 10,200,000 | 10,478,109 |
| 0.13%, 02/28/23 | 14,700,000 | 14,697,129 |
| 1.50%, 02/28/23 | 4,750,000 | 4,847,134 |
| 2.63%, 02/28/23 | 4,950,000 | 5,134,852 |
| 0.50%, 03/15/23 | 8,400,000 | 8,446,594 |
| 0.13%, 03/31/23 | 15,000,000 | 14,994,434 |
| 1.50%, 03/31/23 | 6,000,000 | 6,128,555 |
| 2.50%, 03/31/23 | 5,735,000 | 5,947,934 |
| 0.25%, 04/15/23 | 9,000,000 | 9,014,063 |
| 0.13%, 04/30/23 | 14,200,000 | 14,192,512 |
| 1.63%, 04/30/23 | 5,400,000 | 5,532,047 |
| 2.75%, 04/30/23 | 5,400,000 | 5,632,664 |
| 0.13%, 05/15/23 | 8,300,000 | 8,295,299 |
| 1.75%, 05/15/23 | 11,270,000 | 11,575,963 |
| 0.13%, 05/31/23 | 14,000,000 | 13,989,609 |
| 1.63%, 05/31/23 | 4,250,000 | 4,358,574 |
| 2.75%, 05/31/23 | 5,600,000 | 5,852,438 |
| 0.25%, 06/15/23 | 6,830,400 | 6,839,738 |
| 0.13%, 06/30/23 | 13,000,000 | 12,990,352 |
| 1.38%, 06/30/23 | 3,300,000 | 3,372,510 |
| 2.63%, 06/30/23 | 6,700,000 | 6,999,014 |
| 0.13%, 07/15/23 | 8,700,000 | 8,690,824 |
| 0.13%, 07/31/23 | 15,000,000 | 14,983,008 |
| 1.25%, 07/31/23 | 6,500,000 | 6,632,158 |
| 2.75%, 07/31/23 | 6,100,000 | 6,398,328 |
| 0.13%, 08/15/23 | 9,400,000 | 9,387,883 |
| 2.50%, 08/15/23 | 9,800,000 | 10,240,043 |
| 0.13%, 08/31/23 | 16,000,000 | 15,975,313 |
| 1.38%, 08/31/23 | 6,300,000 | 6,446,672 |
| 2.75%, 08/31/23 | 5,000,000 | 5,253,418 |
| 0.13%, 09/15/23 | 9,200,000 | 9,183,469 |
| 1.38%, 09/30/23 | 7,000,000 | 7,168,164 |
| 2.88%, 09/30/23 | 6,600,000 | 6,962,742 |
| 0.13%, 10/15/23 | 8,700,000 | 8,680,969 |
| 1.63%, 10/31/23 | 5,900,000 | 6,077,230 |
| 2.88%, 10/31/23 | 6,350,000 | 6,711,404 |
Security
Rate, Maturity Date | Face
Amount ($) | Value ($) |
| 0.25%, 11/15/23 | 11,500,000 | 11,501,797 |
| 2.75%, 11/15/23 | 13,150,000 | 13,875,305 |
| 2.13%, 11/30/23 | 7,300,000 | 7,607,113 |
| 2.88%, 11/30/23 | 6,900,000 | 7,305,914 |
| 0.13%, 12/15/23 | 11,476,000 | 11,441,034 |
| 2.25%, 12/31/23 | 6,400,000 | 6,695,000 |
| 2.63%, 12/31/23 | 6,800,000 | 7,172,406 |
| 0.13%, 01/15/24 | 12,046,000 | 12,002,710 |
| 2.25%, 01/31/24 | 6,500,000 | 6,808,750 |
| 2.50%, 01/31/24 | 7,750,000 | 8,163,535 |
| 0.13%, 02/15/24 | 15,000,000 | 14,942,578 |
| 2.75%, 02/15/24 | 12,500,000 | 13,254,883 |
| 2.13%, 02/29/24 | 5,600,000 | 5,855,500 |
| 2.38%, 02/29/24 | 6,200,000 | 6,520,898 |
| 0.25%, 03/15/24 | 14,300,000 | 14,281,008 |
| 2.13%, 03/31/24 | 13,350,000 | 13,972,652 |
| 0.38%, 04/15/24 | 11,000,000 | 11,012,031 |
| 2.00%, 04/30/24 | 6,300,000 | 6,579,809 |
| 2.25%, 04/30/24 | 9,350,000 | 9,825,900 |
| 0.25%, 05/15/24 | 12,100,000 | 12,068,332 |
| 2.50%, 05/15/24 | 15,500,000 | 16,402,754 |
| 2.00%, 05/31/24 | 10,550,000 | 11,025,986 |
| 0.25%, 06/15/24 | 12,500,000 | 12,460,938 |
| 1.75%, 06/30/24 | 8,700,000 | 9,040,523 |
| 2.00%, 06/30/24 | 5,685,000 | 5,947,265 |
| 0.38%, 07/15/24 | 15,000,000 | 14,995,898 |
| 1.75%, 07/31/24 | 8,500,000 | 8,839,336 |
| 2.13%, 07/31/24 | 5,700,000 | 5,989,008 |
| 0.38%, 08/15/24 | 14,000,000 | 13,990,156 |
| 2.38%, 08/15/24 | 16,200,000 | 17,147,953 |
| 1.25%, 08/31/24 | 7,400,000 | 7,587,891 |
| 1.88%, 08/31/24 | 5,900,000 | 6,160,199 |
| 1.50%, 09/30/24 | 8,300,000 | 8,576,559 |
| 2.13%, 09/30/24 | 5,310,000 | 5,587,738 |
| 1.50%, 10/31/24 | 9,250,000 | 9,561,104 |
| 2.25%, 10/31/24 | 5,800,000 | 6,131,008 |
| 2.25%, 11/15/24 | 15,300,000 | 16,182,141 |
| 1.50%, 11/30/24 | 8,650,000 | 8,942,951 |
| 2.13%, 11/30/24 | 6,100,000 | 6,428,113 |
| 1.75%, 12/31/24 | 7,600,000 | 7,921,813 |
| 2.25%, 12/31/24 | 6,800,000 | 7,200,031 |
| 1.38%, 01/31/25 | 7,750,000 | 7,980,381 |
| 2.50%, 01/31/25 | 7,100,000 | 7,583,688 |
| 2.00%, 02/15/25 | 14,800,000 | 15,559,656 |
| 1.13%, 02/28/25 | 9,500,000 | 9,700,762 |
| 2.75%, 02/28/25 | 6,800,000 | 7,329,125 |
| 0.50%, 03/31/25 | 10,488,600 | 10,476,718 |
| 2.63%, 03/31/25 | 4,700,000 | 5,049,195 |
| 0.38%, 04/30/25 | 11,400,000 | 11,327,414 |
| 2.88%, 04/30/25 | 6,250,000 | 6,778,076 |
| 2.13%, 05/15/25 | 13,800,000 | 14,591,883 |
| 0.25%, 05/31/25 | 11,600,000 | 11,459,984 |
| 2.88%, 05/31/25 | 6,400,000 | 6,947,000 |
| 0.25%, 06/30/25 | 11,700,000 | 11,551,008 |
| 2.75%, 06/30/25 | 4,900,000 | 5,302,719 |
| 0.25%, 07/31/25 | 11,700,000 | 11,541,410 |
| 2.88%, 07/31/25 | 5,700,000 | 6,202,758 |
| 2.00%, 08/15/25 | 15,300,000 | 16,137,914 |
| 0.25%, 08/31/25 | 12,900,000 | 12,712,043 |
| 2.75%, 08/31/25 | 5,800,000 | 6,289,828 |
| 0.25%, 09/30/25 | 13,900,000 | 13,684,441 |
| 3.00%, 09/30/25 | 5,800,000 | 6,354,172 |
| 0.25%, 10/31/25 | 14,665,000 | 14,422,684 |
| 3.00%, 10/31/25 | 5,700,000 | 6,253,523 |
| 2.25%, 11/15/25 | 15,700,000 | 16,743,805 |
| 0.38%, 11/30/25 | 13,841,600 | 13,674,528 |
| 2.88%, 11/30/25 | 6,300,000 | 6,885,703 |
| 0.38%, 12/31/25 | 14,830,000 | 14,637,094 |
Schwab Taxable Bond Funds | Annual Report
Schwab Short-Term Bond Index Fund
Portfolio Holdings as of August 31, 2021 (continued)
Security
Rate, Maturity Date | Face
Amount ($) | Value ($) |
| 2.63%, 12/31/25 | 6,000,000 | 6,500,156 |
| 0.38%, 01/31/26 | 15,740,600 | 15,521,092 |
| 2.63%, 01/31/26 | 7,073,000 | 7,670,061 |
| 1.63%, 02/15/26 | 13,800,000 | 14,361,703 |
| 0.50%, 02/28/26 | 15,800,000 | 15,659,281 |
| 2.50%, 02/28/26 | 7,300,000 | 7,882,574 |
| 0.75%, 03/31/26 | 15,100,000 | 15,121,824 |
| 2.25%, 03/31/26 | 6,900,000 | 7,378,148 |
| 0.75%, 04/30/26 | 15,200,000 | 15,214,844 |
| 2.38%, 04/30/26 | 5,300,000 | 5,701,848 |
| 1.63%, 05/15/26 | 14,000,000 | 14,574,766 |
| 0.75%, 05/31/26 | 16,000,000 | 16,006,250 |
| 2.13%, 05/31/26 | 6,600,000 | 7,026,938 |
| 0.88%, 06/30/26 | 15,800,000 | 15,888,875 |
| 1.88%, 06/30/26 | 6,300,000 | 6,635,426 |
| 0.63%, 07/31/26 | 16,600,000 | 16,486,523 |
| 1.88%, 07/31/26 | 6,300,000 | 6,639,363 |
| 1.50%, 08/15/26 | 14,300,000 | 14,805,527 |
| 0.75%, 08/31/26 | 15,000,000 | 14,983,594 |
| 1.38%, 08/31/26 | 5,800,000 | 5,970,375 |
| Total Treasuries |
| (Cost $1,402,187,325) | | 1,409,856,539 |
|
| Government Related 10.0% of net assets |
| |
| Agency 5.1% |
| Foreign 2.0% |
| Austria 0.1% |
| Oesterreichische Kontrollbank AG |
| 1.63%, 09/17/22 | 200,000 | 203,064 |
| 2.88%, 03/13/23 | 350,000 | 364,231 |
| 3.13%, 11/07/23 | 550,000 | 583,325 |
| 1.50%, 02/12/25 | 200,000 | 206,200 |
| 0.38%, 09/17/25 | 500,000 | 493,680 |
| 0.50%, 02/02/26 | 500,000 | 494,305 |
| | | 2,344,805 |
| Canada 0.1% |
| Export Development Canada |
| 2.00%, 05/17/22 | 450,000 | 456,043 |
| 1.75%, 07/18/22 | 400,000 | 405,756 |
| 2.50%, 01/24/23 | 500,000 | 516,265 |
| 1.38%, 02/24/23 | 750,000 | 763,357 |
| 2.75%, 03/15/23 | 150,000 | 155,874 |
| 2.63%, 02/21/24 | 250,000 | 263,813 |
| | | 2,561,108 |
| China 0.0% |
| Industrial & Commercial Bank of China Ltd. |
| 2.45%, 10/20/21 | 100,000 | 100,237 |
| Germany 0.9% |
| FMS Wertmanagement |
| 2.00%, 08/01/22 (g) | 200,000 | 203,422 |
| 2.75%, 03/06/23 (g) | 500,000 | 519,300 |
| 2.75%, 01/30/24 (g) | 250,000 | 264,330 |
| Kreditanstalt Fuer Wiederaufbau |
| 2.63%, 01/25/22 (g) | 605,000 | 611,098 |
| 2.13%, 03/07/22 (g) | 300,000 | 303,171 |
| 1.75%, 08/22/22 (g) | 1,000,000 | 1,015,950 |
| 2.00%, 09/29/22 (g) | 300,000 | 306,072 |
| 2.00%, 10/04/22 (g) | 600,000 | 612,270 |
| 2.38%, 12/29/22 (g) | 1,250,000 | 1,286,962 |
Security
Rate, Maturity Date | Face
Amount ($) | Value ($) |
| 2.13%, 01/17/23 (g) | 2,000,000 | 2,054,260 |
| 1.63%, 02/15/23 (g) | 1,400,000 | 1,429,764 |
| 0.25%, 10/19/23 (g) | 1,000,000 | 999,600 |
| 2.63%, 02/28/24 (g) | 950,000 | 1,003,447 |
| 0.25%, 03/08/24 (g) | 500,000 | 498,685 |
| 1.38%, 08/05/24 (g) | 850,000 | 873,078 |
| 0.50%, 09/20/24 (g) | 350,000 | 350,396 |
| 2.50%, 11/20/24 (g) | 1,850,000 | 1,967,882 |
| 0.38%, 07/18/25 (g) | 2,250,000 | 2,229,187 |
| 0.63%, 01/22/26 (g) | 1,600,000 | 1,592,944 |
| Landwirtschaftliche Rentenbank |
| 2.25%, 10/01/21 (g) | 100,000 | 100,177 |
| 3.13%, 11/14/23 (g) | 200,000 | 212,360 |
| 2.00%, 01/13/25 (g) | 250,000 | 261,998 |
| 0.50%, 05/27/25 (g) | 500,000 | 497,645 |
| 2.38%, 06/10/25 (g) | 750,000 | 798,555 |
| 0.88%, 03/30/26 (g) | 500,000 | 502,520 |
| 1.75%, 07/27/26 (g) | 400,000 | 417,868 |
| | | 20,912,941 |
| Japan 0.4% |
| Japan Bank for International Cooperation |
| 2.50%, 06/01/22 | 200,000 | 203,486 |
| 2.38%, 07/21/22 | 750,000 | 764,513 |
| 2.38%, 11/16/22 | 300,000 | 307,752 |
| 1.75%, 01/23/23 | 300,000 | 306,366 |
| 0.63%, 05/22/23 | 750,000 | 754,440 |
| 3.25%, 07/20/23 | 750,000 | 791,317 |
| 3.38%, 07/31/23 | 200,000 | 211,636 |
| 0.38%, 09/15/23 | 500,000 | 500,005 |
| 3.38%, 10/31/23 | 450,000 | 478,791 |
| 2.50%, 05/23/24 | 450,000 | 474,120 |
| 3.00%, 05/29/24 | 200,000 | 213,482 |
| 1.75%, 10/17/24 | 200,000 | 206,996 |
| 2.13%, 02/10/25 | 200,000 | 209,736 |
| 2.50%, 05/28/25 | 1,000,000 | 1,064,080 |
| 0.63%, 07/15/25 | 250,000 | 248,555 |
| 2.75%, 01/21/26 | 250,000 | 270,095 |
| 2.38%, 04/20/26 | 500,000 | 532,715 |
| 1.88%, 07/21/26 | 350,000 | 364,959 |
| | | 7,903,044 |
| Norway 0.1% |
| Equinor A.S.A. |
| 3.15%, 01/23/22 | 250,000 | 252,830 |
| 2.45%, 01/17/23 | 150,000 | 154,449 |
| 2.65%, 01/15/24 | 193,000 | 202,525 |
| 3.70%, 03/01/24 | 200,000 | 215,638 |
| 3.25%, 11/10/24 | 100,000 | 107,982 |
| 2.88%, 04/06/25 (a) | 250,000 | 267,000 |
| 1.75%, 01/22/26 (a) | 250,000 | 257,612 |
| | | 1,458,036 |
| Republic of Korea 0.2% |
| Export-Import Bank of Korea |
| 2.38%, 06/25/24 | 200,000 | 210,636 |
| 0.63%, 06/29/24 | 200,000 | 200,808 |
| 2.88%, 01/21/25 | 200,000 | 213,340 |
| 0.75%, 09/21/25 | 500,000 | 496,790 |
| 3.25%, 11/10/25 | 500,000 | 547,950 |
| 2.63%, 05/26/26 | 400,000 | 430,452 |
| The Korea Development Bank |
| 4.63%, 11/16/21 | 200,000 | 201,772 |
| 3.00%, 09/14/22 | 200,000 | 205,464 |
| 2.75%, 03/19/23 | 200,000 | 207,286 |
Schwab Taxable Bond Funds | Annual Report
Schwab Short-Term Bond Index Fund
Portfolio Holdings as of August 31, 2021 (continued)
Security
Rate, Maturity Date | Face
Amount ($) | Value ($) |
| 3.75%, 01/22/24 | 900,000 | 970,128 |
| 0.40%, 03/09/24 | 200,000 | 199,658 |
| 0.40%, 06/19/24 | 500,000 | 498,980 |
| 3.38%, 09/16/25 | 250,000 | 274,590 |
| | | 4,657,854 |
| Sweden 0.2% |
| Svensk Exportkredit AB |
| 1.63%, 09/12/21 | 200,000 | 200,086 |
| 2.38%, 03/09/22 | 300,000 | 303,510 |
| 1.63%, 11/14/22 | 200,000 | 203,462 |
| 2.88%, 03/14/23 | 250,000 | 260,120 |
| 0.25%, 09/29/23 | 500,000 | 499,275 |
| 1.75%, 12/12/23 | 550,000 | 567,402 |
| 0.38%, 03/11/24 | 500,000 | 499,480 |
| 0.38%, 07/30/24 | 500,000 | 498,190 |
| 0.63%, 05/14/25 | 225,000 | 224,622 |
| 0.50%, 08/26/25 | 350,000 | 347,053 |
| | | 3,603,200 |
| | | 43,541,225 |
| U.S. 3.1% |
| Fannie Mae |
| 1.38%, 09/06/22 | 3,000,000 | 3,039,990 |
| 2.38%, 01/19/23 | 1,250,000 | 1,288,650 |
| 0.25%, 05/22/23 | 3,000,000 | 3,005,220 |
| 2.88%, 09/12/23 | 800,000 | 843,232 |
| 1.75%, 07/02/24 | 500,000 | 519,315 |
| 1.63%, 01/07/25 | 1,500,000 | 1,559,745 |
| 0.63%, 04/22/25 | 1,000,000 | 1,003,270 |
| 0.50%, 06/17/25 | 1,500,000 | 1,496,010 |
| Federal Farm Credit Banks Funding Corp. |
| 0.13%, 11/23/22 | 1,000,000 | 1,000,190 |
| 0.13%, 02/03/23 | 400,000 | 400,076 |
| 0.13%, 03/09/23 | 1,000,000 | 999,910 |
| 0.20%, 10/02/23 | 1,500,000 | 1,498,920 |
| 0.25%, 02/26/24 | 400,000 | 399,552 |
| 0.30%, 03/18/24 | 1,000,000 | 999,850 |
| Federal Home Loan Bank |
| 0.13%, 10/21/22 | 2,000,000 | 2,000,300 |
| 1.88%, 12/09/22 | 3,000,000 | 3,067,200 |
| 1.38%, 02/17/23 | 3,000,000 | 3,056,040 |
| 0.13%, 03/17/23 | 2,000,000 | 2,000,100 |
| 2.50%, 02/13/24 | 1,800,000 | 1,898,280 |
| 1.50%, 08/15/24 | 200,000 | 206,622 |
| 0.50%, 04/14/25 | 3,000,000 | 2,999,280 |
| 0.50%, 06/13/25 | 500,000 | 497,820 |
| Federal Home Loan Mortgage Corp. |
| 0.38%, 04/20/23 | 3,000,000 | 3,011,850 |
| 0.13%, 10/16/23 | 5,000,000 | 4,989,950 |
| 0.25%, 12/04/23 | 3,000,000 | 2,999,940 |
| 0.38%, 09/23/25 | 1,000,000 | 990,030 |
| Federal National Mortgage Association |
| 0.25%, 07/10/23 | 3,000,000 | 3,003,870 |
| 0.25%, 11/27/23 | 3,000,000 | 3,002,100 |
| 1.63%, 10/15/24 | 1,700,000 | 1,763,104 |
| 0.38%, 08/25/25 | 2,000,000 | 1,982,000 |
| 0.50%, 11/07/25 | 3,000,000 | 2,982,120 |
| Freddie Mac |
| 2.75%, 06/19/23 | 2,100,000 | 2,196,873 |
| 0.25%, 06/26/23 | 3,000,000 | 3,003,660 |
| 0.25%, 08/24/23 | 5,000,000 | 5,005,100 |
Security
Rate, Maturity Date | Face
Amount ($) | Value ($) |
| 1.50%, 02/12/25 | 200,000 | 206,870 |
| 0.38%, 07/21/25 | 1,000,000 | 991,920 |
| | | 69,908,959 |
| | | 113,450,184 |
| |
| Local Authority 0.7% |
| Foreign 0.7% |
| Canada 0.7% |
| Hydro-Quebec |
| 8.05%, 07/07/24 | 300,000 | 361,179 |
| Province of Alberta |
| 2.20%, 07/26/22 | 250,000 | 254,583 |
| 3.35%, 11/01/23 | 323,000 | 343,704 |
| 2.95%, 01/23/24 | 600,000 | 636,108 |
| 1.88%, 11/13/24 | 1,000,000 | 1,041,020 |
| 1.00%, 05/20/25 | 600,000 | 606,246 |
| Province of British Columbia |
| 2.00%, 10/23/22 | 350,000 | 357,262 |
| 1.75%, 09/27/24 | 350,000 | 363,324 |
| 2.25%, 06/02/26 | 300,000 | 319,803 |
| 0.90%, 07/20/26 | 250,000 | 250,788 |
| Province of Manitoba |
| 2.10%, 09/06/22 | 100,000 | 101,937 |
| 2.60%, 04/16/24 | 250,000 | 263,843 |
| 3.05%, 05/14/24 | 300,000 | 320,352 |
| 2.13%, 06/22/26 | 200,000 | 211,204 |
| Province of New Brunswick |
| 2.50%, 12/12/22 | 100,000 | 102,677 |
| Province of Ontario |
| 2.20%, 10/03/22 | 500,000 | 510,955 |
| 1.75%, 01/24/23 | 900,000 | 919,458 |
| 3.40%, 10/17/23 | 1,000,000 | 1,065,100 |
| 3.05%, 01/29/24 | 700,000 | 744,492 |
| 7.13%, 02/09/24 | 100,000 | 115,832 |
| 3.20%, 05/16/24 | 200,000 | 214,670 |
| 0.63%, 01/21/26 | 1,000,000 | 992,430 |
| 1.05%, 04/14/26 | 500,000 | 504,640 |
| 2.50%, 04/27/26 | 250,000 | 268,748 |
| 2.30%, 06/15/26 | 400,000 | 426,552 |
| Province of Quebec |
| 2.38%, 01/31/22 | 200,000 | 201,858 |
| 2.63%, 02/13/23 | 250,000 | 258,760 |
| 2.50%, 04/09/24 | 250,000 | 263,345 |
| 2.88%, 10/16/24 | 1,000,000 | 1,072,900 |
| 1.50%, 02/11/25 | 450,000 | 463,306 |
| 0.60%, 07/23/25 | 750,000 | 747,240 |
| 2.50%, 04/20/26 | 500,000 | 538,090 |
| Province of Saskatchewan |
| 8.50%, 07/15/22 | 25,000 | 26,722 |
| | | 14,869,128 |
| U.S. 0.0% |
| Illinois |
| 4.95%, 06/01/23 | 63,636 | 66,898 |
| Port Authority of New York & New Jersey |
| 1.09%, 07/01/23 | 300,000 | 304,192 |
| State Board of Administration Finance Corp. |
| 1.26%, 07/01/25 | 350,000 | 353,950 |
| State of California |
| 5.70%, 11/01/21 | 85,000 | 85,767 |
Schwab Taxable Bond Funds | Annual Report
Schwab Short-Term Bond Index Fund
Portfolio Holdings as of August 31, 2021 (continued)
Security
Rate, Maturity Date | Face
Amount ($) | Value ($) |
| University of California |
| 0.88%, 05/15/25 (a) | 250,000 | 252,485 |
| | | 1,063,292 |
| | | 15,932,420 |
| |
| Sovereign 0.8% |
| Canada 0.1% |
| Canada Government International Bond |
| 2.00%, 11/15/22 | 650,000 | 664,534 |
| 1.63%, 01/22/25 | 900,000 | 933,777 |
| 0.75%, 05/19/26 | 750,000 | 749,932 |
| | | 2,348,243 |
| Chile 0.0% |
| Chile Government International Bond |
| 2.25%, 10/30/22 | 150,000 | 153,345 |
| 3.13%, 01/21/26 | 250,000 | 270,573 |
| | | 423,918 |
| Hungary 0.1% |
| Hungary Government International Bond |
| 5.38%, 02/21/23 | 500,000 | 536,670 |
| 5.75%, 11/22/23 | 210,000 | 234,238 |
| 5.38%, 03/25/24 | 700,000 | 784,504 |
| | | 1,555,412 |
| Indonesia 0.0% |
| Indonesia Government International Bond |
| 2.95%, 01/11/23 | 200,000 | 206,756 |
| 4.45%, 02/11/24 | 200,000 | 218,382 |
| | | 425,138 |
| Israel 0.0% |
| Israel Government International Bond |
| 4.00%, 06/30/22 | 250,000 | 257,785 |
| 3.15%, 06/30/23 | 250,000 | 262,488 |
| | | 520,273 |
| Italy 0.2% |
| Republic of Italy Government International Bond |
| 6.88%, 09/27/23 | 950,000 | 1,070,213 |
| 0.88%, 05/06/24 | 250,000 | 249,905 |
| 2.38%, 10/17/24 | 750,000 | 780,893 |
| 1.25%, 02/17/26 | 950,000 | 943,986 |
| | | 3,044,997 |
| Mexico 0.1% |
| Mexico Government International Bond |
| 8.00%, 09/24/22 | 250,000 | 272,548 |
| 4.00%, 10/02/23 | 148,000 | 159,412 |
| 3.60%, 01/30/25 | 750,000 | 823,890 |
| 3.90%, 04/27/25 (a) | 200,000 | 221,904 |
| 4.13%, 01/21/26 | 500,000 | 566,470 |
| | | 2,044,224 |
| Panama 0.1% |
| Panama Government International Bond |
| 4.00%, 09/22/24 (a) | 200,000 | 216,878 |
| 3.75%, 03/16/25 (a) | 400,000 | 433,720 |
| 7.13%, 01/29/26 | 350,000 | 433,912 |
| | | 1,084,510 |
Security
Rate, Maturity Date | Face
Amount ($) | Value ($) |
| Peru 0.0% |
| Peruvian Government International Bond |
| 7.35%, 07/21/25 | 350,000 | 428,498 |
| 2.39%, 01/23/26 (a) | 300,000 | 311,115 |
| | | 739,613 |
| Philippines 0.1% |
| Philippine Government International Bond |
| 4.20%, 01/21/24 | 600,000 | 650,520 |
| 10.63%, 03/16/25 | 500,000 | 672,115 |
| 5.50%, 03/30/26 | 300,000 | 359,733 |
| | | 1,682,368 |
| Poland 0.1% |
| Republic of Poland Government International Bond |
| 3.00%, 03/17/23 | 500,000 | 521,095 |
| 4.00%, 01/22/24 | 600,000 | 650,898 |
| 3.25%, 04/06/26 | 500,000 | 551,955 |
| | | 1,723,948 |
| Republic of Korea 0.0% |
| Korea International Bond |
| 3.88%, 09/11/23 | 200,000 | 214,202 |
| 2.00%, 06/19/24 | 200,000 | 208,394 |
| | | 422,596 |
| Uruguay 0.0% |
| Uruguay Government International Bond |
| 4.50%, 08/14/24 | 400,000 | 432,540 |
| | | 16,447,780 |
| |
| Supranational* 3.4% |
| African Development Bank |
| 1.63%, 09/16/22 | 250,000 | 253,863 |
| 2.13%, 11/16/22 | 450,000 | 460,818 |
| 0.75%, 04/03/23 | 875,000 | 882,691 |
| 3.00%, 09/20/23 | 850,000 | 897,302 |
| 0.88%, 03/23/26 | 500,000 | 502,495 |
| 0.88%, 07/22/26 | 750,000 | 751,830 |
| Asian Development Bank |
| 1.88%, 07/19/22 | 750,000 | 761,782 |
| 1.88%, 08/10/22 | 100,000 | 101,664 |
| 1.75%, 09/13/22 | 600,000 | 610,038 |
| 1.63%, 01/24/23 | 800,000 | 816,360 |
| 2.75%, 03/17/23 | 550,000 | 571,868 |
| 0.25%, 07/14/23 | 1,050,000 | 1,050,672 |
| 0.25%, 10/06/23 | 1,250,000 | 1,249,412 |
| 2.63%, 01/30/24 | 600,000 | 633,018 |
| 0.38%, 06/11/24 | 1,000,000 | 999,220 |
| 1.50%, 10/18/24 | 900,000 | 928,386 |
| 2.00%, 01/22/25 | 200,000 | 209,832 |
| 0.63%, 04/29/25 | 1,250,000 | 1,251,650 |
| 0.38%, 09/03/25 | 1,000,000 | 988,880 |
| 0.50%, 02/04/26 | 1,000,000 | 989,540 |
| 1.00%, 04/14/26 | 1,250,000 | 1,263,475 |
| 2.00%, 04/24/26 | 500,000 | 528,120 |
| Corp. Andina de Fomento |
| 2.75%, 01/06/23 | 100,000 | 103,124 |
| 2.38%, 05/12/23 | 300,000 | 308,901 |
| 3.75%, 11/23/23 | 150,000 | 159,653 |
| 1.63%, 09/23/25 | 400,000 | 405,872 |
Schwab Taxable Bond Funds | Annual Report
Schwab Short-Term Bond Index Fund
Portfolio Holdings as of August 31, 2021 (continued)
Security
Rate, Maturity Date | Face
Amount ($) | Value ($) |
| Council of Europe Development Bank |
| 1.75%, 09/26/22 | 200,000 | 203,450 |
| 2.63%, 02/13/23 | 250,000 | 258,853 |
| 0.25%, 06/10/23 | 150,000 | 150,087 |
| 0.25%, 10/20/23 | 400,000 | 399,712 |
| 2.50%, 02/27/24 | 400,000 | 421,100 |
| 1.38%, 02/27/25 | 150,000 | 154,152 |
| European Bank for Reconstruction & Development |
| 2.75%, 03/07/23 | 650,000 | 675,259 |
| 0.25%, 07/10/23 | 500,000 | 500,270 |
| 1.63%, 09/27/24 | 150,000 | 155,243 |
| 1.50%, 02/13/25 | 150,000 | 154,820 |
| 0.50%, 05/19/25 | 600,000 | 597,642 |
| 0.50%, 11/25/25 | 300,000 | 297,519 |
| 0.50%, 01/28/26 | 1,000,000 | 990,320 |
| European Investment Bank |
| 2.38%, 06/15/22 | 800,000 | 814,296 |
| 1.38%, 09/06/22 | 500,000 | 506,315 |
| 2.00%, 12/15/22 | 750,000 | 767,940 |
| 2.50%, 03/15/23 | 1,650,000 | 1,708,987 |
| 1.38%, 05/15/23 | 250,000 | 255,028 |
| 2.88%, 08/15/23 | 1,200,000 | 1,261,584 |
| 0.25%, 09/15/23 | 650,000 | 649,980 |
| 3.13%, 12/14/23 | 1,000,000 | 1,064,190 |
| 3.25%, 01/29/24 | 2,150,000 | 2,300,027 |
| 2.63%, 03/15/24 | 700,000 | 740,026 |
| 2.25%, 06/24/24 | 1,250,000 | 1,314,225 |
| 2.50%, 10/15/24 | 200,000 | 212,580 |
| 1.88%, 02/10/25 | 450,000 | 470,484 |
| 1.63%, 03/14/25 | 1,150,000 | 1,192,665 |
| 0.63%, 07/25/25 | 1,000,000 | 999,990 |
| 0.38%, 12/15/25 | 1,000,000 | 986,910 |
| 0.38%, 03/26/26 | 1,500,000 | 1,475,745 |
| Inter-American Development Bank |
| 1.75%, 09/14/22 | 100,000 | 101,674 |
| 2.50%, 01/18/23 | 1,100,000 | 1,135,739 |
| 0.50%, 05/24/23 | 1,250,000 | 1,256,812 |
| 3.00%, 10/04/23 | 950,000 | 1,004,083 |
| 0.25%, 11/15/23 | 1,000,000 | 999,160 |
| 2.63%, 01/16/24 | 1,100,000 | 1,159,642 |
| 3.00%, 02/21/24 | 600,000 | 638,988 |
| 2.13%, 01/15/25 | 1,600,000 | 1,684,320 |
| 1.75%, 03/14/25 | 400,000 | 416,508 |
| 0.88%, 04/03/25 | 150,000 | 151,562 |
| 0.63%, 07/15/25 | 1,100,000 | 1,100,033 |
| 0.88%, 04/20/26 | 1,250,000 | 1,256,550 |
| 2.00%, 06/02/26 | 750,000 | 792,225 |
| International Bank for Reconstruction & Development |
| 1.63%, 02/10/22 | 600,000 | 603,990 |
| 2.13%, 07/01/22 | 500,000 | 508,405 |
| 1.88%, 10/07/22 | 450,000 | 458,631 |
| 2.13%, 02/13/23 | 150,000 | 154,266 |
| 1.75%, 04/19/23 | 250,000 | 256,365 |
| 1.88%, 06/19/23 | 550,000 | 566,473 |
| 3.00%, 09/27/23 | 1,500,000 | 1,584,795 |
| 0.25%, 11/24/23 | 1,000,000 | 999,330 |
| 2.50%, 03/19/24 | 1,050,000 | 1,106,910 |
| 1.50%, 08/28/24 | 550,000 | 567,215 |
| 2.50%, 11/25/24 | 1,200,000 | 1,277,064 |
| 1.63%, 01/15/25 | 1,500,000 | 1,555,395 |
| 2.13%, 03/03/25 | 100,000 | 105,438 |
| 0.75%, 03/11/25 | 950,000 | 956,032 |
Security
Rate, Maturity Date | Face
Amount ($) | Value ($) |
| 0.63%, 04/22/25 | 2,000,000 | 2,003,240 |
| 0.38%, 07/28/25 | 1,250,000 | 1,237,850 |
| 2.50%, 07/29/25 | 1,500,000 | 1,607,895 |
| 0.50%, 10/28/25 | 1,500,000 | 1,489,500 |
| 0.88%, 07/15/26 | 500,000 | 502,090 |
| International Finance Corp. |
| 2.00%, 10/24/22 | 200,000 | 204,240 |
| 0.50%, 03/20/23 | 350,000 | 351,792 |
| 2.88%, 07/31/23 | 400,000 | 420,092 |
| 1.38%, 10/16/24 | 550,000 | 565,142 |
| 0.38%, 07/16/25 | 750,000 | 743,032 |
| 2.13%, 04/07/26 | 250,000 | 265,430 |
| Nordic Investment Bank |
| 2.25%, 09/30/21 | 200,000 | 200,342 |
| 0.38%, 05/19/23 | 200,000 | 200,572 |
| 2.25%, 05/21/24 | 400,000 | 419,904 |
| 0.38%, 09/11/25 | 400,000 | 395,528 |
| 0.50%, 01/21/26 | 250,000 | 247,710 |
| The Asian Infrastructure Investment Bank |
| 0.25%, 09/29/23 | 1,000,000 | 999,420 |
| 2.25%, 05/16/24 | 700,000 | 734,545 |
| 0.50%, 05/28/25 | 500,000 | 497,690 |
| 0.50%, 01/27/26 | 1,000,000 | 989,560 |
| | | 75,833,044 |
| Total Government Related |
| (Cost $219,984,453) | | 221,663,428 |
| Security | Number
of Shares | Value ($) |
| Short-Term Investment 0.4% of net assets |
| |
| Money Market Fund 0.4% |
| State Street Institutional U.S. Government Money Market Fund, Premier Class 0.03% (h) | 9,585,311 | 9,585,311 |
| Total Short-Term Investment |
| (Cost $9,585,311) | | 9,585,311 |
| * | Supranational bonds represent the debt of international organizations or institutions such as the World Bank, the International Monetary Fund, regional multilateral development banks and others. |
| (a) | The effective maturity may be shorter than the final maturity shown because of the possibility of interim principal payments and prepayments or as the result of embedded demand features (puts or calls). |
| (b) | Security converts to floating rate after the fixed-rate coupon period. |
| (c) | Issuer is affiliated with the fund’s investment adviser. |
| (d) | Securities exempt from registration under Rule 144A of the Securities Act of 1933, as amended. These securities may be resold in transactions exempt from registrations, normally to qualified institutional buyers. At the period end, the value of these amounted to $3,198,468 or 0.1% of net assets. |
| (e) | Variable-rate security. |
| (f) | Interest rate is subject to adjustments from time to time if a nationally recognized statistical rating organization downgrades (or subsequently upgrades) the debt rating assigned to the bond. |
| (g) | Guaranteed by the Republic of Germany. |
| (h) | The rate shown is the 7-day yield. |
| | |
| REIT — | Real Estate Investment Trust |
Schwab Taxable Bond Funds | Annual Report
Schwab Short-Term Bond Index Fund
Portfolio Holdings as of August 31, 2021 (continued)
The fund owns corporate bonds of affiliates, The Charles Schwab Corp. and TD Ameritrade Holding Corp., since those corporate bonds are included in its index. Below is a summary of investment activities involving The Charles Schwab Corp. and TD Ameritrade Holding Corp. notes owned by the fund during the period ended August 31, 2021:
| |
Value at
08/31/20 | Gross
Purchases* | Gross
Sales | Realized
Gains (Losses) | Net Change
in Unrealized
Appreciation
(depreciation) |
Value at
08/31/21 | Face
Amount at
08/31/21 | Interest Income
Earned |
| TD Ameritrade Holding Corp., 2.95%, 04/01/22 | $103,778 | $144 | ($102,046) | $2,246 | ($4,122) | $— | — | $1,991 |
| TD Ameritrade Holding Corp., 3.63%, 04/01/25 | 168,864 | (2,244) | (54,571) | 1,216 | (4,009) | 109,256 | 100,000 | 4,702 |
| The Charles Schwab Corp., 2.65%, 01/25/23 | 79,061 | (547) | — | — | (1,179) | 77,335 | 75,000 | 1,988 |
| The Charles Schwab Corp., 3.55%, 02/01/24 | 109,804 | (2,420) | — | — | (52) | 107,332 | 100,000 | 3,550 |
| The Charles Schwab Corp., 0.75%, 03/18/24 | — | 352,344 | — | — | 39 | 352,383 | 350,000 | 668 |
| The Charles Schwab Corp., 3.00%, 03/10/25 | — | 108,204 | (53,608) | (759) | (243) | 53,594 | 50,000 | 2,038 |
| The Charles Schwab Corp., 4.20%, 03/24/25 | 232,365 | (3,074) | (112,146) | (1,184) | (4,450) | 111,511 | 100,000 | 6,498 |
| The Charles Schwab Corp., 3.85%, 05/21/25 | 171,406 | (4,231) | — | — | (1,549) | 165,626 | 150,000 | 5,775 |
| The Charles Schwab Corp., 3.45%, 02/13/26 | — | 54,938 | — | — | 259 | 55,197 | 50,000 | 283 |
| The Charles Schwab Corp., 0.90%, 03/11/26 | — | 247,828 | — | — | 1,472 | 249,300 | 250,000 | 731 |
| The Charles Schwab Corp., 1.15%, 05/13/26 | — | 200,348 | — | — | 1,062 | 201,410 | 200,000 | 415 |
| Total | $865,278 | $951,290 | ($322,371) | $1,519 | ($12,772) | $1,482,944 | | $28,639 |
* Amount includes amortization of premiums and/or accretion of discounts.
The following is a summary of the inputs used to value the fund’s investments as of August 31, 2021 (see financial note 2(a) for additional information):
| Description | Quoted Prices in
Active Markets for
Identical Assets
(Level 1) | Other Significant
Observable Inputs
(Level 2) | Significant
Unobservable Inputs
(Level 3) | Total | |
| Assets | | | | | |
| Corporates 1 | $— | $581,870,463 | $— | $581,870,463 | |
| Treasuries | — | 1,409,856,539 | — | 1,409,856,539 | |
| Government Related1 | — | 221,663,428 | — | 221,663,428 | |
| Short-Term Investment1 | 9,585,311 | — | — | 9,585,311 | |
| Total | $9,585,311 | $2,213,390,430 | $— | $2,222,975,741 | |
| 1 | As categorized in the Portfolio Holdings. |
Fund investments in mutual funds are classified as Level 1, without consideration to the classification level of the underlying securities held by the mutual funds, which could be Level 1, Level 2 or Level 3.
Schwab Taxable Bond Funds | Annual Report
Schwab Short-Term Bond Index Fund
Statement of Assets and Liabilities
As of August 31, 2021
| Assets |
| Investments in securities, at value — affiliated (cost $1,466,854) | | $1,482,944 |
| Investments in securities, at value — unaffiliated (cost $2,202,540,777) | | 2,221,492,797 |
| Cash | | 100,165 |
| Receivables: | | |
| Investments sold | | 76,732,524 |
| Interest | | 8,968,411 |
| Fund shares sold | | 5,692,900 |
| Dividends | + | 163 |
| Total assets | | 2,314,469,904 |
| Liabilities |
| Payables: | | |
| Investments bought | | 82,622,586 |
| Investment adviser fees | | 113,183 |
| Fund shares redeemed | | 3,399,544 |
| Distributions to shareholders | + | 586,175 |
| Total liabilities | | 86,721,488 |
| Net Assets |
| Total assets | | 2,314,469,904 |
| Total liabilities | – | 86,721,488 |
| Net assets | | $2,227,748,416 |
| Net Assets by Source | | |
| Capital received from investors | | 2,203,717,284 |
| Total distributable earnings | | 24,031,132 |
| Net Asset Value (NAV) |
| Net Assets | ÷ | Shares
Outstanding | = | NAV |
| $2,227,748,416 | | 216,608,817 | | $10.28 |
| | | | | |
Schwab Taxable Bond Funds | Annual Report
Schwab Short-Term Bond Index Fund
Statement of Operations
For the period September 1, 2020 through August 31, 2021
| Investment Income |
| Interest received from securities — affiliated | | $28,639 |
| Interest received from securities — unaffiliated | | 21,047,996 |
| Dividends received from securities — unaffiliated | | 2,337 |
| Securities on loan, net | + | 1,685 |
| Total investment income | | 21,080,657 |
| Expenses |
| Investment adviser fees | | 1,237,200 |
| Total expenses | – | 1,237,200 |
| Net investment income | | 19,843,457 |
| Realized and Unrealized Gains (Losses) |
| Net realized gains on sales of securities — affiliated | | 1,519 |
| Net realized gains on sales of securities — unaffiliated | + | 6,358,075 |
| Net realized gains | | 6,359,594 |
| Net change in unrealized appreciation (depreciation) on securities — affiliated | | (12,772) |
| Net change in unrealized appreciation (depreciation) on securities — unaffiliated | + | (21,006,078) |
| Net change in unrealized appreciation (depreciation) | + | (21,018,850) |
| Net realized and unrealized losses | | (14,659,256) |
| Increase in net assets resulting from operations | | $5,184,201 |
Schwab Taxable Bond Funds | Annual Report
Schwab Short-Term Bond Index Fund
Statement of Changes in Net Assets
For the current and prior report periods
| Operations | |
| | 9/1/20-8/31/21 | 9/1/19-8/31/20 |
| Net investment income | | $19,843,457 | $21,005,690 |
| Net realized gains | | 6,359,594 | 7,072,187 |
| Net change in unrealized appreciation (depreciation) | + | (21,018,850) | 20,990,527 |
| Increase in net assets from operations | | 5,184,201 | 49,068,404 |
| Distributions to Shareholders | |
| Total distributions | | ($25,220,242) | ($21,004,922) |
| Transactions in Fund Shares | | | |
| | | 9/1/20-8/31/21 | 9/1/19-8/31/20 |
| | | SHARES | VALUE | SHARES | VALUE |
| Shares sold | | 140,140,927 | $1,447,080,406 | 120,290,629 | $1,236,682,012 |
| Shares reinvested | | 1,626,515 | 16,794,730 | 1,412,346 | 14,453,769 |
| Shares redeemed | + | (88,234,966) | (910,429,318) | (45,172,807) | (461,824,744) |
| Net transactions in fund shares | | 53,532,476 | $553,445,818 | 76,530,168 | $789,311,037 |
| Shares Outstanding and Net Assets | | | |
| | | 9/1/20-8/31/21 | 9/1/19-8/31/20 |
| | | SHARES | NET ASSETS | SHARES | NET ASSETS |
| Beginning of period | | 163,076,341 | $1,694,338,639 | 86,546,173 | $876,964,120 |
| Total increase | + | 53,532,476 | 533,409,777 | 76,530,168 | 817,374,519 |
| End of period | | 216,608,817 | $2,227,748,416 | 163,076,341 | $1,694,338,639 |
Schwab Taxable Bond Funds | Annual Report
Schwab Taxable Bond Funds
1. Business Structure of the Funds:
Each of the funds in this report is a series of Schwab Investments (the trust), a no-load, open-end management investment company. The trust is organized as a Massachusetts business trust and is registered under the Investment Company Act of 1940, as amended (the 1940 Act). The list below shows all the funds in the trust as of the end of the period, including the funds discussed in this report, which are highlighted:
| SCHWAB INVESTMENTS (ORGANIZED OCTOBER 26, 1990) |
| Schwab Treasury Inflation Protected Securities Index Fund | Schwab California Tax-Free Bond Fund |
| Schwab U.S. Aggregate Bond Index Fund | Schwab Opportunistic Municipal Bond Fund |
| Schwab Short-Term Bond Index Fund | Schwab 1000 Index® Fund |
| Schwab Tax-Free Bond Fund | Schwab Global Real Estate Fund |
Each fund in this report offers one share class. Shares are bought and sold at closing net asset value per share (NAV), which is the price for all outstanding shares of a fund. Each share has a par value of 1/1,000 of a cent, and the funds’ Board of Trustees (the Board) may authorize the issuance of as many shares as necessary.
Each fund maintains its own account for purposes of holding assets and accounting, and is considered a separate entity for tax purposes. Within its account, each fund may also keep certain assets in segregated accounts, as required by securities law.
2. Significant Accounting Policies:
The following is a summary of the significant accounting policies the funds use in their preparation of financial statements. The funds follow the investment company accounting and reporting guidance of the Financial Accounting Standards Board (FASB) Accounting Standard Codification Topic 946 Financial Services — Investment Companies. The accounting policies are in conformity with accounting principles generally accepted in the United States of America (GAAP).
The funds may invest in certain mutual funds and exchange-traded funds (ETFs) referred to as “underlying funds”. For more information about the underlying funds’ operations and policies, please refer to those funds’ semiannual and annual reports, which are filed with the U.S. Securities and Exchange Commission (SEC) and are available on the SEC’s website at www.sec.gov.
(a) Security Valuation:
Under procedures approved by the Board, the investment adviser has formed a Pricing Committee to administer the pricing and valuation of portfolio securities and other assets and to ensure that prices used for internal purposes or provided by third parties reasonably reflect fair value. Among other things, these procedures allow the funds to utilize independent pricing services, quotations from securities and financial instrument dealers and other market sources to determine fair value.
The funds value the securities in their portfolios every business day. The funds use the following policies to value various types of securities:
• Bonds and notes: Fixed income investments are generally valued using an evaluated price at the mid-point of the bid/ask spread provided by an approved, independent pricing service (mid-price). To determine the evaluated mid-price, a pricing service may use a variety of techniques and inputs. Techniques may include, but are not limited to, spread models that calculate an investment-specific price relative to a benchmark or yield curve models that establish a price based on yields of comparable bonds along a range of maturities. Inputs differ by valuation approach and technique, as appropriate, and examples of inputs may include, but are not limited to, interest rates, market conditions, comparable bonds, market trades, projected cash flows, credit reviews and issuer news.
• Short-term securities (60 days or less to maturity): Securities with remaining maturities of 60 days or less are generally valued at an evaluated price; however, such securities may be valued at their amortized cost if it approximates the security’s fair value.
• Mutual funds: Mutual funds are valued at their respective NAVs.
• Securities for which no quoted value is available: The Board has adopted procedures to fair value each fund’s securities when market prices are not “readily available” or are unreliable. For example, a fund may fair value a security when it is de-listed or its trading is halted or suspended; when a security’s primary pricing source is unable or unwilling to provide a price; or when a security’s primary trading market is closed during regular market hours. Each fund makes fair value determinations in good faith in accordance with the fund’s valuation procedures. The Pricing Committee considers a number of factors, including unobservable market inputs, when arriving at fair value. The Pricing Committee may employ techniques
Schwab Taxable Bond Funds | Annual Report
Schwab Taxable Bond Funds
Financial Notes (continued)
2. Significant Accounting Policies (continued):
such as the review of related or comparable assets or liabilities, related market activities, recent transactions, market multiples, book values, transactional back-testing, disposition analysis and other relevant information. The Pricing Committee regularly reviews these inputs and assumptions to calibrate the valuations. Due to the subjective and variable nature of fair value pricing, there can be no assurance that a fund could obtain the fair value assigned to the security upon the sale of such security. The Board convenes on a regular basis to review fair value determinations made by the funds pursuant to the valuation procedures.
In accordance with the authoritative guidance on fair value measurements and disclosures under GAAP, the funds disclose the fair value of their investments in a hierarchy that prioritizes the significant inputs to valuation techniques used to measure the fair value. The hierarchy gives the highest priority to valuations based upon unadjusted quoted prices in active markets for identical assets or liabilities (Level 1 measurements) and the lowest priority to valuations based upon unobservable inputs that are significant to the valuation (Level 3 measurements). If inputs used to measure the financial instruments fall within different levels of the hierarchy, the categorization is based on the lowest level input that is significant to the valuation. If the funds determine that either the volume and/or level of activity for an asset or liability has significantly decreased (from normal conditions for that asset or liability) or price quotations or observable inputs are not associated with orderly transactions, increased analysis and management judgment will be required to estimate fair value.
The three levels of the fair value hierarchy are as follows:
• Level 1—quoted prices in active markets for identical securities—Investments whose values are based on quoted market prices in active markets, and whose values are therefore classified as Level 1 prices, include active listed equities and mutual funds. Investments in mutual funds are valued daily at their NAVs, which are classified as Level 1 prices, without consideration to the classification level of the underlying securities held by an underlying fund.
• Level 2—other significant observable inputs (including quoted prices for similar securities, interest rates, prepayment speeds, credit risk, etc.)—Investments that trade in markets that are not considered to be active, but whose values are based on quoted market prices, dealer quotations or valuations provided by alternative pricing sources supported by observable inputs are classified as Level 2 prices. These generally include U.S. government and sovereign obligations, most government agency securities, investment-grade corporate bonds, certain mortgage products, less liquid listed equities, and state, municipal and provincial obligations.
• Level 3—significant unobservable inputs (including the funds’ own assumptions in determining the fair value of investments)—Investments whose values are classified as Level 3 prices have significant unobservable inputs, as they may trade infrequently or not at all. When observable prices are not available for these securities, the funds use one or more valuation techniques for which sufficient and reliable data is available. The inputs used by the funds in estimating the value of Level 3 prices may include the original transaction price, quoted prices for similar securities or assets in active markets, completed or pending third-party transactions in the underlying investment or comparable issuers, and changes in financial ratios or cash flows. Level 3 prices may also be adjusted to reflect illiquidity and/or non-transferability, with the amount of such discount estimated by the funds in the absence of market information. Assumptions used by the funds due to the lack of observable inputs may significantly impact the resulting fair value and therefore the funds’ results of operations.
The inputs or methodology used for valuing securities are not necessarily an indication of the risk associated with investing in those securities.
The levels associated with valuing the funds’ investments as of August 31, 2021 are disclosed in the Portfolio Holdings.
(b) Accounting Policies for certain Portfolio Investments (if held):
Inflation-Protected Securities: The Schwab Treasury Inflation Protected Securities Index Fund invests in inflation-protected securities. Inflation-protected securities are fixed-income securities whose principal value is periodically adjusted to the rate of inflation. The interest rate on these instruments is generally fixed at issuance at a rate lower than typical bonds or notes. Over the life of an inflation-indexed instrument, however, interest will be paid based on a principal value, which is adjusted for any inflation or deflation. Any increase or decrease in the principal amount of an inflation-protected security will be included as an addition or reduction to interest income on the Statement of Operations, even though investors do not receive their principal until maturity.
Schwab Taxable Bond Funds | Annual Report
Schwab Taxable Bond Funds
Financial Notes (continued)
2. Significant Accounting Policies (continued):
TBA Commitments: The funds may enter into “TBA” (to-be-announced) commitments to purchase or sell securities for a fixed price at a future date. Payments or proceeds of TBA commitments are not delivered until the contractual settlement date. Unsettled TBA commitments are valued at the current fair value generally according to the procedures described above in the Security Valuation section. The funds’ use of TBA commitments may cause the funds to experience higher portfolio turnover and higher transaction costs.
Agency MBS and TBA Transactions: The Treasury Market Practices Group (TMPG) of the Federal Reserve Bank of New York recommended the margining of certain forward-settling Agency MBS transactions to reduce counterparty credit risk. The TMPG recommended market participants exchange two-way variation margin on a regular basis. The Schwab U.S. Aggregate Bond Index Fund posts and receives variation margin with certain counterparties in instances where the unrealized gain/loss on such transactions exceeds certain pre-determined thresholds. The variation margin, if any, is disclosed on the Statement of Assets and Liabilities.
Delayed Delivery Transactions and When-Issued Securities: During the period, certain funds transacted in securities on a delayed delivery or when-issued basis. Payment and delivery may take place after the customary settlement period for that security. The price of the underlying securities and the date when the securities will be delivered and paid for are fixed at the time the transaction is negotiated. The securities purchased on a delayed delivery or when-issued basis are identified as such in the funds’ Portfolio Holdings. The funds may receive compensation for interest forgone in the purchase of a delayed delivery or when-issued security. With respect to purchase commitments, the funds identify securities as segregated in their records with a value at least equal to the amount of the commitment. Losses may arise due to changes in the value of the underlying securities or if the counterparty does not perform under the contract’s terms, or if the issuer does not issue the securities due to political, economic, or other factors.
Securities Lending: Under the trust’s Securities Lending Program, a fund (lender) may make short-term loans of its securities to another party (borrower) to generate additional revenue for the fund. The borrower pledges collateral in the form of cash, securities issued or fully guaranteed by the U.S. government or foreign governments, or letters of credit issued by a bank. Collateral at the individual loan level is required to be maintained on a daily marked-to-market basis in an amount at least equal to the current value of the securities loaned. The lending agent provides a fund with indemnification against borrower default (the borrower fails to return the security on loan) reducing the risk of loss as a result of default. The cash collateral of securities loaned is currently invested in money market portfolios operating pursuant to Rule 2a-7 under the 1940 Act. Each fund bears the risk of loss with respect to the investment of cash collateral. The terms of the securities lending agreement allow the funds or the lending agent to terminate any loan at any given time and the securities must be returned within the earlier of the standard trade settlement period or the specified time period under the relevant securities lending agreement. Securities lending income, as disclosed in each fund’s Statement of Operations, if applicable, represents the income earned from the investment of the cash collateral plus any fees paid by borrowers, less the fees paid to the lending agent and broker rebates which are subject to adjustments pursuant to the securities lending agreement. On loans not collateralized by cash, a fee is received from the borrower, and is allocated between a fund and the lending agent. The aggregate fair value of securities loaned will not at any time exceed one-third of the total assets of a fund, including collateral received from the loan. Securities lending fees paid to the unaffiliated lending agents start at 10% of gross lending revenue, with subsequent breakpoints to a low of 5%. In this context, the gross lending revenue equals the income received from the investment of cash collateral and fees paid by borrowers less any rebates paid to the borrowers. Any expenses charged by the cash collateral fund are in addition to these fees. All remaining revenue is retained by the fund, as applicable. No portion of lending revenue is paid to or retained by Charles Schwab Investment Management, Inc. (CSIM or the investment adviser) or any affiliate of CSIM.
As of August 31, 2021, the Schwab U.S. Aggregate Bond Index Fund had securities on loan, all of which were classified as corporate bonds and government related bonds. The value of the securities on loan and the related collateral as of August 31, 2021, are disclosed in the fund’s Portfolio Holdings and Statement of Assets and Liabilities.
(c) Security Transactions:
Security transactions are recorded as of the date the order to buy or sell the security is executed. Realized gains and losses from security transactions are based on the identified costs of the securities involved. Gains and losses from paydowns on mortgage and asset backed securities are recorded as adjustments to interest income.
(d) Investment Income:
Interest income is recorded as it accrues. If a fund buys a debt security at a discount (less than face value) or a premium (more than face value), it amortizes premiums and accretes discounts from the purchase settlement date up to maturity. The fund then increases (in the case of discounts) or reduces (in the case of premiums) the income it records from the security. Certain securities
Schwab Taxable Bond Funds | Annual Report
Schwab Taxable Bond Funds
Financial Notes (continued)
2. Significant Accounting Policies (continued):
may be callable (meaning that the issuer has the option to pay it off before its maturity date). The fund amortizes the premium and accretes the discount on each callable security to the security’s maturity date, except when the purchase price is higher than the call price at the security’s call date (in which case the premium is amortized to the call date). Any increase or decrease in the principal amount of an inflation-protected security is included as an addition or reduction to interest income on the Statement of Operations; such adjustments may have a significant impact on a fund’s distributions. Dividends from underlying funds are recorded on the date they are effective (the ex-dividend date). Any distributions from underlying funds are recorded in accordance with the character of the distributions as designated by the underlying funds.
(e) Expenses:
Pursuant to an Amended and Restated Investment Advisory Agreement between CSIM and the Schwab Treasury Inflation Protected Securities Index Fund and an Investment Advisory Agreement between CSIM and the Schwab U.S. Aggregate Bond Index Fund and Schwab Short-Term Bond Index Fund, CSIM pays the operating expenses of the funds, excluding acquired fund fees and expenses, taxes, any brokerage expenses, and extraordinary or non-routine expenses. Taxes, any brokerage expenses and extraordinary or non-routine expenses that are specific to a fund are charged directly to the fund.
(f) Agency Mortgage-Backed Securities Charges:
Due to market conditions or other reasons, delivery of U.S. Treasury securities, agency debt and agency mortgage-backed securities may not occur on a timely basis. In these instances, a fund may fail to receive a security purchased causing the fund to be unable to deliver a security sold. The TMPG recommends voluntary fail charges when securities are not delivered as agreed by the parties. These fails charges are included in net realized gains (losses) on each fund’s Statement of Operations, if any.
(g) Distributions to Shareholders:
The funds, except for the Schwab Treasury Inflation Protected Securities Index Fund, declare distributions from net investment income, if any, every day they are open for business. These distributions, which are substantially equal to a fund’s net investment income for that day, are paid out to shareholders once a month. The Schwab Treasury Inflation Protected Securities Index Fund declares and pays distributions from net investment income, if any, quarterly. All the funds make distributions from net realized capital gains, if any, once a year.
(h) Accounting Estimates:
The accounting policies described in this report conform to GAAP. Notwithstanding this, shareholders should understand that in order to follow these principles, fund management has to make estimates and assumptions that affect the information reported in the financial statements. It’s possible that once the results are known, they may turn out to be different from these estimates and these differences may be material.
(i) Federal Income Taxes:
The funds intend to meet federal income and excise tax requirements for regulated investment companies under subchapter M of the Internal Revenue Code, as amended. Accordingly, the funds distribute substantially all of their net investment income and net realized capital gains, if any, to their respective shareholders each year. As long as a fund meets the tax requirements, it is not required to pay federal income tax.
(j) Indemnification:
Under the funds’ organizational documents, the officers and trustees are indemnified against certain liabilities arising out of the performance of their duties to the funds. In addition, in the normal course of business the funds enter into contracts with their vendors and others that provide general indemnifications. The funds’ maximum exposure under these arrangements is unknown as this would involve future claims that may be made against the funds. However, based on experience, the funds expect the risk of loss attributable to these arrangements to be remote.
(k) Recent Accounting Standards:
In March 2020, the FASB issued Accounting Standards Update “Facilitation of the Effects of Reference Rate Reform on Financial Reporting (Topic 848)” (ASU 2020-04), which provides optional temporary financial reporting relief from the effect of certain types of contract modifications due to the planned discontinuation of the London Interbank Offered Rate (LIBOR) and other interbank offered
Schwab Taxable Bond Funds | Annual Report
Schwab Taxable Bond Funds
Financial Notes (continued)
2. Significant Accounting Policies (continued):
based reference rates at the end of 2021. The temporary relief provided is effective for certain reference rate-related contract modifications that occur during the period March 12, 2020 through December 31, 2022. At this time, management believes the adoption of ASU 2020-04 will not have a material impact to the financial statements.
3. Risk Factors:
The funds invest mainly in corporate bonds, mortgage-backed and asset-backed securities, government or municipal obligations, and other debt securities. These investments may involve certain risks, as discussed in the funds’ prospectus, including, but not limited to, those described below:
Market Risk. Financial markets rise and fall in response to a variety of factors, sometimes rapidly and unpredictably. Markets may be impacted by economic, political, regulatory and other conditions, including economic sanctions and other government actions. In addition, the occurrence of global events, such as war, terrorism, environmental disasters, natural disasters and epidemics, may also negatively affect the financial markets. As with any investment whose performance is tied to these markets, the value of an investment in a fund will fluctuate, which means that an investor could lose money over short or long periods.
Investment Style Risk. The funds are index funds. Therefore, they follow the securities included in their respective index during upturns as well as downturns. Because of their indexing strategies, the funds do not take steps to reduce market exposure or to lessen the effects of a declining market. In addition, because of a fund’s expenses, the fund’s performance may be below that of its index. Errors relating to the index may occur from time to time and may not be identified by the index provider for a period of time. In addition, market disruptions could cause delays in the index’s rebalancing schedule. Such errors and/or market disruptions may result in losses for the fund.
Interest Rate Risk. Interest rates rise and fall over time. As with any investment whose yield reflects current interest rates, a fund’s yield will change over time. During periods when interest rates are low, a fund’s yield (and total return) also may be low. Changes in interest rates also may affect a fund’s share price: a rise in interest rates generally causes a fund’s share price to fall. The longer a fund’s portfolio duration, the more sensitive to interest rate movements its share price is likely to be. Also, a change in a central bank’s monetary policy or economic conditions, among other things, may result in a change in interest rates, which could have sudden and unpredictable effects on the markets and significantly impact the value of fixed-income securities in which a fund invests.
Sampling Index Tracking Risk. An index fund may not fully replicate its respective index and may hold securities not included in the respective index. As a result, the fund is subject to the risk that the investment adviser’s investment management strategy, the implementation of which is subject to a number of constraints, may not produce the intended results. If the fund utilizes a sampling approach it may not track the return of the index as well as it would if the fund purchased all of the securities in the index.
Tracking Error Risk. As index funds, each fund seeks to track the performance of its respective index, although it may not be successful in doing so. The divergence between the performance of a fund and the index, positive or negative, is called “tracking error.” Tracking error can be caused by many factors and it may be significant.
Credit Risk. A decline in the credit quality of an issuer or guarantor or liquidity provider of a portfolio investment or a counterparty could cause the funds to lose money or underperform. The funds could lose money if, due to a decline in credit quality, the issuer or guarantor or liquidity provider of a portfolio investment or a counterparty fails to make, or is perceived as being unable or unwilling to make, timely principal or interest payments or otherwise honor its obligations.
Liquidity Risk. The funds may be unable to sell certain securities, such as illiquid securities, readily at a favorable time or price, or the funds may have to sell them at a loss.
Concentration Risk. To the extent that a fund’s or the index’s portfolio is concentrated in the securities of issuers in a particular market, industry, group of industries, sector or asset class, the fund may be adversely affected by the performance of those securities, may be subject to increased price volatility and may be more vulnerable to adverse economic, market, political or regulatory occurrences affecting that market, industry, group of industries, sector or asset class.
Prepayment and Extension Risk. Certain fixed-income securities are subject to the risk that the securities may be paid off earlier or later than expected, especially during periods of falling or rising interest rates, respectively. Prepayments of obligations could cause the fund to forgo future interest income on the portion of the security’s principal repaid early and force the fund to reinvest that money at the lower prevailing interest rates. Extensions of obligations could cause the fund to exhibit additional volatility and hold securities paying lower-than-market rates of interest. Either case could hurt the fund’s performance.
Schwab Taxable Bond Funds | Annual Report
Schwab Taxable Bond Funds
Financial Notes (continued)
3. Risk Factors (continued):
Non-U.S. Issuer Risk. Certain funds may invest in U.S.-registered, dollar-denominated bonds of non-U.S. corporations, governments, agencies and supra-national entities. A fund’s investments in bonds of non-U.S. issuers may involve certain risks that are greater than those associated with investments in securities of U.S. issuers. These include risks of adverse changes in foreign economic, political, regulatory and other conditions; the imposition of economic sanctions or other government restrictions; differing accounting, auditing, financial reporting and legal standards and practices; differing securities market structures; and higher transaction costs. These risks may be heightened in connection with bonds issued by non-U.S. corporations and entities in emerging markets.
Mortgage-Backed and Mortgage Pass-Through Securities Risk. Mortgage-backed securities tend to increase in value less than other debt securities when interest rates decline, but are subject to similar or greater risk of decline in market value during periods of rising interest rates. Certain of the mortgage-backed securities in which the fund may invest are issued or guaranteed by agencies or instrumentalities of the U.S. government but are not backed by the full faith and credit of the U.S. government. There can be no assurance that the U.S. government would provide financial support to its agencies or instrumentalities where it was not obligated to do so which can cause the fund to lose money or underperform. The risks of investing in mortgage-backed securities include, among others, interest rate risk, credit risk, prepayment risk and extension risk. Transactions in mortgage pass-through securities often occur through TBA transactions. The fund could lose money or underperform if a TBA counterparty defaults or goes bankrupt.
Mortgage Dollar Rolls Risk. Mortgage dollar rolls are transactions in which a fund sells mortgage-backed securities to a dealer and simultaneously agrees to repurchase similar securities in the future at a predetermined price. A fund’s mortgage dollar rolls could lose money if the price of the mortgage-backed securities sold falls below the agreed upon repurchase price, or if the counterparty is unable to honor the agreement.
Derivatives Risk. Certain funds may invest in derivative instruments. The principal types of derivatives used by the funds are futures contracts. A futures contract is an agreement to buy or sell a financial instrument at a specific price on a specific day. A fund’s use of derivatives that are subject to regulation by the Commodity Futures Trading Commission (CFTC) could cause a fund to become a commodity pool, which would require the fund to comply with certain CFTC rules.
A fund’s use of derivative instruments involves risks different from, or possibly greater than, the risks associated with investing directly in securities and other traditional investments. Certain of these risks, such as market risk, credit risk, liquidity risk and leverage risk, are discussed elsewhere in this section. A fund’s use of derivatives is also subject to lack of availability risk, valuation risk, correlation risk and tax risk. Lack of availability risk is the risk that suitable derivative transactions may not be available in all circumstances for risk management or other purposes. Valuation risk is the risk that a particular derivative may be valued incorrectly. Correlation risk is the risk that changes in the value of the derivative may not correlate perfectly with the underlying asset, rate or index. Tax risk is the risk that the use of derivatives may cause a fund to realize higher amounts of short-term capital gains. A fund’s use of derivatives could reduce the fund’s performance, increase the fund’s volatility, and cause the fund to lose more than the initial amount invested.
Securities Lending Risk. Securities lending involves the risk of loss of rights in, or delay in recovery of, the loaned securities if the borrower fails to return the security loaned or becomes insolvent.
Inflation-Protected Security Risk. The value of inflation-protected securities, including TIPS, generally will fluctuate in response to changes in “real” interest rates, generally decreasing when real interest rates rise and increasing when real interest rates fall. Real interest rates represent nominal (or stated) interest rates reduced by the expected impact of inflation. In addition, interest payments on inflation-indexed securities will generally vary up or down along with the rate of inflation.
Leverage Risk. Certain fund transactions, such as derivatives transactions, TBA transactions and mortgage dollar rolls, may give rise to a form of leverage and may expose the funds to greater risk. Leverage tends to magnify the effect of any decrease or increase in the value of a fund’s portfolio securities. The use of leverage may cause a fund to liquidate portfolio positions when it would not be advantageous to do so in order to satisfy its obligations.
Money Market Fund Risk. The funds may invest in underlying money market funds that either seek to maintain a stable $1.00 net asset value (“stable share price money market funds”) or that have a share price that fluctuates (“variable share price money market funds”). Although an underlying stable share price money market fund seeks to maintain a stable $1.00 net asset value, it is possible to lose money by investing in such a money market fund. Because the share price of an underlying variable share price money market fund will fluctuate, when a fund sells the shares it owns they may be worth more or less than what the fund originally paid for them. In addition, neither type of money market fund is designed to offer capital appreciation. Certain underlying money market funds may impose a fee upon the sale of shares or may temporarily suspend the ability to sell shares if such fund’s liquidity falls below required minimums.
Schwab Taxable Bond Funds | Annual Report
Schwab Taxable Bond Funds
Financial Notes (continued)
3. Risk Factors (continued):
Portfolio Turnover Risk (Schwab U.S. Aggregate Bond Index Fund only). A fund may engage in frequent trading of its portfolio securities in connection with its tracking of the index, primarily due to the fund rolling over its positions in TBAs as it tracks the portion of the index represented by mortgage-backed securities. A higher portfolio turnover rate may result in increased transaction costs, which may lower a fund’s performance. A higher portfolio turnover rate can also result in an increase in taxable capital gains distributions to a fund’s shareholders.
Please refer to the funds’ prospectuses for a more complete description of the principal risks of investing in the funds.
4. Affiliates and Affiliated Transactions:
Investment Adviser
CSIM, a wholly owned subsidiary of The Charles Schwab Corporation, serves as each fund’s investment adviser and administrator pursuant to an Advisory Agreement between it and the trust.
For its advisory and administrative services to the funds, CSIM is entitled to receive an annual fee, payable monthly, based on each fund’s average daily net assets as follows:
Schwab
Treasury Inflation
Protected Securities
Index Fund | Schwab
U.S. Aggregate Bond
Index Fund | Schwab
Short-Term Bond
Index Fund |
| 0.05% | 0.04% | 0.06% |
Investments from Affiliates
Certain funds in the Fund Complex (for definition refer to Trustees and Officers section) may own shares of other funds in the Fund Complex. The table below reflects the percentage of shares of each fund in this report that are owned by other funds in the Fund Complex as of August 31, 2021, as applicable:
| | Underlying Funds |
| | Schwab
Treasury Inflation
Protected Securities
Index Fund | Schwab
U.S. Aggregate Bond
Index Fund | Schwab
Short-Term Bond
Index Fund | | | |
| Schwab MarketTrack Growth Portfolio | —% | 2.8% | —% | | | |
| Schwab MarketTrack Balanced Portfolio | —% | 4.1% | 0.3% | | | |
| Schwab MarketTrack Conservative Portfolio | —% | 3.2% | 0.1% | | | |
| Schwab Target 2010 Fund | 0.2% | 0.3% | 0.3% | | | |
| Schwab Target 2015 Fund | 0.2% | 0.4% | 0.3% | | | |
| Schwab Target 2020 Fund | 1.4% | 2.3% | 2.1% | | | |
| Schwab Target 2025 Fund | 0.8% | 2.2% | 1.9% | | | |
| Schwab Target 2030 Fund | 0.4% | 2.7% | 2.4% | | | |
| Schwab Target 2035 Fund | —% | 1.0% | 0.9% | | | |
| Schwab Target 2040 Fund | —% | 1.4% | 1.1% | | | |
| Schwab Target 2045 Fund | —% | 0.2% | 0.1% | | | |
| Schwab Target 2050 Fund | —% | 0.1% | 0.1% | | | |
| Schwab Target 2055 Fund | —% | 0.0%* | 0.0%* | | | |
| Schwab Target 2060 Fund | —% | 0.0%* | 0.0%* | | | |
| Schwab Target 2065 Fund | —% | 0.0%* | 0.0%* | | | |
| Schwab Monthly Income Fund — Moderate Payout | —% | 0.5% | —% | | | |
| Schwab Monthly Income Fund — Enhanced Payout | —% | 1.2% | —% | | | |
| Schwab Monthly Income Fund — Maximum Payout | —% | 1.7% | —% | | | |
| Schwab Balanced Fund | —% | 5.2% | —% | | | |
Schwab Taxable Bond Funds | Annual Report
Schwab Taxable Bond Funds
Financial Notes (continued)
4. Affiliates and Affiliated Transactions (continued):
Interfund Borrowing and Lending
Pursuant to an exemptive order issued by the SEC, the funds may enter into interfund borrowing and lending transactions with other funds in the Fund Complex. All loans are for temporary or emergency purposes and the interest rate to be charged will be the average of the overnight repurchase agreement rate and the short-term bank loan rate. All loans are subject to numerous conditions designed to ensure fair and equitable treatment of all participating funds. The interfund lending facility is subject to the oversight and periodic review by the Board. The funds had no interfund borrowing or lending activity during the period.
5. Board of Trustees:
The Board may include people who are officers and/or directors of CSIM or its affiliates. Federal securities law limits the percentage of such “interested persons” who may serve on a trust’s board, and the trust was in compliance with these limitations throughout the report period. The trust did not pay any of these interested persons for their services as trustees. The independent trustees are paid by CSIM. For more information regarding the trustees, please refer to the Trustees and Officers table at the end of this report.
6. Borrowing from Banks:
During the period, the funds were participants with other funds in the Fund Complex in a joint, syndicated, committed $750 million line of credit (the Syndicated Credit Facility), which matured on October 1, 2020. On October 1, 2020, the Syndicated Credit Facility was amended to run for a new 364 day period with a line of credit of $850 million, maturing on September 30, 2021. Under the terms of the Syndicated Credit Facility, in addition to CSIM paying the interest charged on any borrowings by a fund, CSIM paid a commitment fee of 0.15% per annum on the funds’ proportionate share of the unused portion of the Syndicated Credit Facility.
During the period, the funds were participants with other funds in the Fund Complex in a joint, unsecured, uncommitted $500 million line of credit (the Uncommitted Credit Facility), with State Street Bank and Trust Company, which was scheduled to mature on November 27, 2020. However, on October 1, 2020, the Uncommitted Credit Facility was amended to run for a new 364 day period with a line of credit of $400 million, maturing on September 30, 2021. Under the terms of the Uncommitted Credit Facility, CSIM pays interest on the amount a fund borrows. There were no borrowings from either line of credit during the period.
All of the funds also have access to custodian overdraft facilities. The funds may have utilized the overdraft facility and incurred an interest expense, which is paid by CSIM. The interest expense is determined based on a negotiated rate above the current Federal Funds Rate.
7. Purchases and Sales/Maturities of Investment Securities:
For the period ended August 31, 2021, purchases and sales/maturities of securities (excluding short-term obligations) were as follows:
| | Purchases of Long-Term
U.S. Government
Securities* | Purchases of Other
Long-Term Securities | Total Purchases of
Long-Term Securities |
| Schwab Treasury Inflation Protected Securities Index Fund | $1,335,775,452 | $— | $1,335,775,452 |
| Schwab U.S. Aggregate Bond Index Fund | 3,329,543,798 | 436,372,652 | 3,765,916,450 |
| Schwab Short-Term Bond Index Fund | 1,434,811,963 | 366,658,768 | 1,801,470,731 |
| | Sales/Maturities of
Long-Term U.S. Government
Securities* | Sales/Maturities of
Other Long-Term Securities | Total Sales/Maturities of
Long-Term Securities |
| Schwab Treasury Inflation Protected Securities Index Fund | $470,338,797 | $— | $470,338,797 |
| Schwab U.S. Aggregate Bond Index Fund | 2,610,382,697 | 212,262,560 | 2,822,645,257 |
| Schwab Short-Term Bond Index Fund | 1,051,865,171 | 190,480,129 | 1,242,345,300 |
| * | Includes securities guaranteed by U.S. Government Agencies. |
Schwab Taxable Bond Funds | Annual Report
Schwab Taxable Bond Funds
Financial Notes (continued)
As of August 31, 2021, the tax basis cost of the funds’ investments and gross unrealized appreciation and depreciation were as follows:
| | Schwab
Treasury Inflation
Protected Securities
Index Fund | | Schwab
U.S. Aggregate
Bond Index Fund | | Schwab
Short-Term Bond
Index Fund |
| Tax cost | $2,250,179,537 | | $5,477,941,059 | | $2,204,576,311 |
| Gross unrealized appreciation | $156,820,448 | | $188,865,209 | | $22,201,243 |
| Gross unrealized depreciation | (9,717,928) | | (29,717,831) | | (3,801,813) |
| Net unrealized appreciation (depreciation) | $147,102,520 | | $159,147,378 | | $18,399,430 |
As of August 31, 2021, the components of distributable earnings on a tax basis were as follows:
| | Schwab
Treasury Inflation
Protected Securities
Index Fund | | Schwab
U.S. Aggregate
Bond Index Fund | | Schwab
Short-Term Bond
Index Fund |
| Undistributed ordinary income | $53,054,668 | | $1,913,059 | | $806,039 |
| Undistributed long-term capital gains | 2,810,087 | | — | | 5,411,838 |
| Net unrealized appreciation (depreciation) on investments | 147,102,520 | | 159,147,378 | | 18,399,430 |
| Capital loss carryforwards and other losses | — | | (13,285,898) | | — |
| Total | $202,967,275 | | $147,774,539 | | $24,617,307 |
The components of distributable earnings on a tax basis may not match the Total distributable earnings line item on the Statement of Assets and Liabilities due to other temporary timing differences. The primary difference between book basis and tax basis unrealized appreciation or unrealized depreciation of investments is the tax deferral of losses on wash sales. The tax cost of the funds’ investments, disclosed above, have been adjusted from their book amounts to reflect these appreciation or depreciation differences, as applicable.
Net investment income and realized capital gains and losses may differ for financial statement and tax purposes primarily due to differing treatments of paydown gains and losses and sales on TIPS.
Capital loss carryforwards may be used to offset future realized capital gains for federal income tax purposes. As of August 31, 2021, the Schwab U.S. Aggregate Bond Index Fund had capital loss carryforwards of $13,285,898 with no expiration available to offset future net capital gains. The Schwab Treasury Inflation Protected Securities Index Fund and Schwab Short-Term Bond Index Fund had no capital loss carryforwards available to offset future net capital gains.
For the fiscal year ended August 31, 2021, the funds had no capital loss carryforwards utilized.
The tax basis components of distributions paid during the current and prior fiscal years were as follows:
| | Schwab
Treasury Inflation
Protected Securities
Index Fund
| Schwab U.S.
Aggregate
Bond Index
Fund
| Schwab
Short-Term Bond
Index Fund |
| Current fiscal year end distributions | | | |
| Ordinary income | $42,448,667 | $107,400,469 | $21,736,122 |
| Long-term capital gains | 1,027,968 | 5,441,247 | 3,484,120 |
| Prior fiscal year end distributions | | | |
| Ordinary income | $14,928,816 | $93,281,965 | $21,004,922 |
Distributions paid to shareholders are based on net investment income and net realized gains determined on a tax basis, which may differ from net investment income and net realized gains for financial reporting purposes. These differences reflect the differing character of certain income items and net realized gains and losses for financial statement and tax purposes, and may result in reclassification among certain capital accounts on the financial statements.
Schwab Taxable Bond Funds | Annual Report
Schwab Taxable Bond Funds
Financial Notes (continued)
8. Federal Income Taxes (continued):
Permanent book and tax basis differences, which are mainly due to differing treatments of paydown gains and losses and TIPS, may result in reclassifications between components of net assets as required. The adjustments will have no impact on net assets or the results of operations.
As of August 31, 2021, management has reviewed the tax positions for open periods (for federal purposes, three years from the date of filing and for state purposes, four years from the date of filing) as applicable to the funds, and has determined that no provision for income tax is required in the funds’ financial statements. The funds recognize interest and penalties, if any, related to unrecognized tax benefits as income tax expense in the Statement of Operations. During the fiscal year ended August 31, 2021, the funds did not incur any interest or penalties.
9. Subsequent Events:
Management has determined there are no subsequent events or transactions through the date the financial statements were issued that would have materially impacted the financial statements as presented.
Schwab Taxable Bond Funds | Annual Report
Schwab Taxable Bond Funds
Report of Independent Registered Public Accounting Firm
To the Board of Trustees of Schwab Investments and Shareholders of Schwab Treasury Inflation Protected Securities Index Fund, Schwab U.S. Aggregate Bond Index Fund, and Schwab Short-Term Bond Index Fund:
Opinion on the Financial Statements and Financial Highlights
We have audited the accompanying statements of assets and liabilities, including the portfolio holdings, of Schwab Treasury Inflation Protected Securities Index Fund, Schwab U.S. Aggregate Bond Index Fund, and Schwab Short-Term Bond Index Fund (the “Funds”), three of the funds constituting Schwab Investments, as of August 31, 2021, and the related statements of operations for the year then ended, the related statements of changes in net assets and the financial highlights for the two years in the period then ended, and the related notes. In our opinion, the financial statements and financial highlights present fairly, in all material respects, the financial position of each of the Funds as of August 31, 2021, the results of their operations for the year then ended, and the changes in their net assets and the financial highlights for the two years in the period then ended in conformity with accounting principles generally accepted in the United States of America. The financial highlights for each of the three years or periods in the period ended August 31, 2019 were audited by other auditors, whose report, dated October 17, 2019, expressed an unqualified opinion on such financial highlights.
Basis for Opinion
These financial statements and financial highlights are the responsibility of the Funds’ management. Our responsibility is to express an opinion on the Funds’ financial statements and financial highlights based on our audits. We are a public accounting firm registered with the Public Company Accounting Oversight Board (United States) (PCAOB) and are required to be independent with respect to the Funds in accordance with the U.S. federal securities laws and the applicable rules and regulations of the Securities and Exchange Commission and the PCAOB.
We conducted our audits in accordance with the standards of the PCAOB. Those standards require that we plan and perform the audit to obtain reasonable assurance about whether the financial statements and financial highlights are free of material misstatement, whether due to error or fraud. The Funds are not required to have, nor were we engaged to perform, an audit of their internal control over financial reporting. As part of our audits we are required to obtain an understanding of internal control over financial reporting but not for the purpose of expressing an opinion on the effectiveness of the Funds’ internal control over financial reporting. Accordingly, we express no such opinion.
Our audits included performing procedures to assess the risks of material misstatement of the financial statements and financial highlights, whether due to error or fraud, and performing procedures that respond to those risks. Such procedures included examining, on a test basis, evidence regarding the amounts and disclosures in the financial statements and financial highlights. Our audits also included evaluating the accounting principles used and significant estimates made by management, as well as evaluating the overall presentation of the financial statements and financial highlights. Our procedures included confirmation of securities owned as of August 31, 2021, by correspondence with the custodian and brokers; when replies were not received from brokers, we performed other auditing procedures. We believe that our audits provide a reasonable basis for our opinion.
Deloitte & Touche LLP
Denver, Colorado
October 19, 2021
We have served as the auditor of one or more investment companies in the Schwab Funds Complex since 2020.
Schwab Taxable Bond Funds | Annual Report
Schwab Taxable Bond Funds
Other Federal Tax Information (unaudited)
Under section 852(b)(3)(C) of the Internal Revenue Code, certain funds hereby designate the following amounts as long-term capital gain dividends for the fiscal year ended August 31, 2021:
| Schwab Treasury Inflation Protected Securities Index Fund | $1,027,968 |
| Schwab U.S. Aggregate Bond Index Fund | 5,441,247 |
| Schwab Short-Term Bond Index Fund | 3,484,120 |
For the fiscal year ended August 31, 2021, the funds designate the following percentage of dividend income as business interest income under section 163(j) of the Internal Revenue Code.
| | Percentage |
| Schwab Treasury Inflation Protected Securities Index Fund | 99.3% |
| Schwab U.S. Aggregate Bond Index Fund | 99.4% |
| Schwab Short-Term Bond Index Fund | 97.0% |
Schwab Taxable Bond Funds | Annual Report
Schwab Taxable Bond Funds
Investment Advisory Agreement Approval
The Investment Company Act of 1940, as amended (the 1940 Act), requires that the continuation of a fund’s investment advisory agreement must be specifically approved (1) by the vote of the trustees or by a vote of the shareholders of the fund, and (2) by the vote of a majority of the trustees who are not parties to the investment advisory agreement or “interested persons” of any party (the Independent Trustees), cast in person at a meeting called for the purpose of voting on such approval. In connection with such approvals, the fund’s trustees must request and evaluate, and the investment adviser is required to furnish, such information as may be reasonably necessary to evaluate the terms of the investment advisory agreement.
The Board of Trustees (the Board or the Trustees, as appropriate) calls and holds one or more meetings each year that are dedicated, in whole or in part, to considering whether to renew the investment advisory and administration agreement (the Agreement) between Schwab Investments (the Trust) and Charles Schwab Investment Management, Inc. (CSIM) with respect to the existing funds in the Trust, including Schwab Treasury Inflation Protected Securities Index Fund, Schwab U.S. Aggregate Bond Index Fund and Schwab Short-Term Bond Index Fund (the Funds), and to review certain other agreements pursuant to which CSIM provides investment advisory services to certain other registered investment companies. In preparation for the meeting(s), the Board requests and reviews a wide variety of materials provided by CSIM, including information about CSIM’s affiliates, personnel, business goals and priorities, profitability, third-party oversight, corporate structure and operations. As part of the renewal process, the Independent Trustees’ legal counsel, on behalf of the Independent Trustees, sends an information request letter to CSIM seeking certain relevant information. The responses by CSIM are provided to the Trustees in the Board materials for their review prior to their meeting, and the Trustees are provided with the opportunity to request any additional materials. The Board also receives data provided by an independent provider of investment company data. This information is in addition to the detailed information about the Funds that the Board reviews during the course of each year, including information that relates to the Funds’ operations and performance, legal and compliance matters, risk management, portfolio turnover, and sales and marketing activity. In considering the renewal, the Independent Trustees receive advice from Independent Trustees’ legal counsel, including a memorandum regarding the responsibilities of trustees for the approval of investment advisory agreements. In addition, the Independent Trustees participate in question and answer sessions with representatives of CSIM and meet in executive session outside the presence of Fund management.
The Board, including a majority of the Independent Trustees, considered information specifically relating to the continuance
of the Agreement with respect to the Funds at meetings held on May 12, 2021 and June 8, 2021, and approved the renewal of the Agreement with respect to the Funds for an additional one-year term at the meeting on June 8, 2021 called for the purpose of voting on such approval.1
The Board’s approval of the continuance of the Agreement with respect to the Funds was based on consideration and evaluation of a variety of specific factors discussed at these meetings and at prior meetings, including:
| 1. | the nature, extent and quality of the services provided to each Fund under the Agreement, including the resources of CSIM and its affiliates dedicated to the Funds; |
| 2. | each Fund’s investment performance and how it compared to that of certain other comparable mutual funds and benchmark data; |
| 3. | each Fund’s expenses and how those expenses compared to those of certain other similar mutual funds; |
| 4. | the profitability of CSIM and its affiliates, including Charles Schwab & Co., Inc. (Schwab), with respect to each Fund, including both direct and indirect benefits accruing to CSIM and its affiliates; and |
| 5. | the extent to which economies of scale would be realized as each Fund grows and whether fee levels in the Agreement reflect those economies of scale for the benefit of Fund investors. |
Nature, Extent and Quality of Services. The Board considered the nature, extent and quality of the services provided by CSIM to the Funds and the resources of CSIM and its affiliates dedicated to the Funds. In this regard, the Trustees evaluated, among other things, CSIM’s experience, track record, compliance program, resources dedicated to hiring and retaining skilled personnel and specialized talent, and information security resources. The Trustees also considered information provided by CSIM relating to services and support provided with respect to the Funds’ portfolio management team, portfolio strategy, and internal investment guidelines, as well as trading infrastructure, liquidity management, product design and analysis, shareholder communications, securities valuation, fund accounting and custody, and vendor and risk oversight. The Trustees also considered investments CSIM has made in its infrastructure, including modernizing CSIM’s technology and use of data, increasing expertise in key areas (including portfolio management and trade operations), and improving business continuity, cybersecurity, due diligence, risk management processes, and information security programs, which are designed to provide enhanced services to the Funds and their shareholders. The Trustees considered CSIM’s effective implementation of its business continuity plan in response to the COVID-19 pandemic and
Schwab Taxable Bond Funds | Annual Report
Schwab Taxable Bond Funds
government-mandated restrictions during the prior year. The Trustees also considered Schwab’s wide range of products, services, and channel alternatives such as investment research tools and an array of account features that benefit Fund shareholders who are brokerage clients of Schwab. The Trustees also considered Schwab’s reputation as a full service brokerage firm and its overall financial condition, including Schwab’s ability to maintain consistent operations and service levels during recent periods of remote work and market volatility. Following such evaluation, the Board concluded, within the context of its full deliberations, that the nature, extent and quality of services provided by CSIM to the Funds and the resources of CSIM and its affiliates dedicated to the Funds supported renewal of the Agreement with respect to the Funds.
Fund Performance. The Board considered each Fund’s performance in determining whether to renew the Agreement with respect to such Fund. Specifically, the Trustees considered each Fund’s performance relative to a peer category of other mutual funds and applicable indices/benchmarks, in light of portfolio yield and market trends, as well as in consideration of each Fund’s investment style and strategy attributes and disclosures. As part of this review, the Trustees considered the composition of the peer category, selection criteria and the reputation of the independent provider of investment company data who prepared the peer category analysis. In evaluating the performance of each Fund, the Trustees considered the risk profile for such Fund and each Fund’s demonstrated performance in tracking its benchmark index. The Trustees further considered the level of Fund performance in the context of their review of Fund expenses and adviser profitability discussed below and also noted that the Board and a designated committee of the Board review performance throughout the year. Following such evaluation, the Board concluded, within the context of its full deliberations, that the performance of each Fund supported renewal of the Agreement with respect to such Fund.
Fund Expenses. With respect to each Fund’s expenses, the Trustees considered the rate of compensation called for by the Agreement and each Fund’s net operating expense ratio, in each case, in comparison to those of other similar mutual funds, such peer groups and comparisons having been selected and calculated by an independent provider of investment company data. CSIM reported to the Board, and the Board took into account, the risk assumed by CSIM in the development of the Funds and provision of services as well as the competitive marketplace for financial products. The Trustees also considered fees charged by CSIM to ETFs, other mutual funds and to other types of accounts, but, with respect to such other types of accounts, accorded less weight to such comparisons due to the different legal, regulatory, compliance and operating features of mutual funds as compared to these other types of accounts, and any differences in the nature and scope of the services CSIM provides to these other accounts,
as well as differences in the market for these types of accounts. Following such evaluation, the Board concluded, within the context of its full deliberations, that the expenses of each Fund are reasonable and supported renewal of the Agreement with respect to such Fund.
Profitability. The Trustees considered the compensation flowing to CSIM and its affiliates, directly or indirectly and reviewed profitability on a pre-tax basis, without regard to distribution expenses. In this connection, the Trustees reviewed management’s profitability analyses. The Trustees also reviewed profitability of CSIM relating to the Schwab fund complex as a whole, noting the benefits to Fund shareholders of being part of the Schwab fund complex, including the allocations of certain fixed costs across the Funds and other funds in the complex. The Trustees also considered any other benefits derived by CSIM from its relationship with the Funds, such as whether, by virtue of its management of the Funds, CSIM obtains investment information or other research resources that aid it in providing advisory services to other clients. The Trustees considered whether the compensation and profitability with respect to the Funds under the Agreement and other service agreements were reasonable and justified in light of the quality of all services rendered to the Funds by CSIM and its affiliates. The Trustees noted that CSIM continues to invest substantial sums in its business in order to provide enhanced research capabilities, services and systems to benefit the Funds. Based on this evaluation, the Board concluded, within the context of its full deliberations, that the profitability of CSIM with respect to each Fund is reasonable and supported renewal of the Agreement with respect to such Fund.
Economies of Scale. Although the Trustees recognized the difficulty of determining economies of scale with precision, the Trustees considered the potential existence of any economies of scale by way of the relatively low advisory fee and unitary fee structure of the Funds and whether those are passed along to a Fund’s shareholders through (i) the enhancement of services provided to the Funds in return for fees paid, including through investments by CSIM in CSIM’s infrastructure, including modernizing CSIM’s technology and use of data, increasing expertise and capabilities in key areas (including portfolio and trade operations), and improving business continuity, cybersecurity, due diligence, and information security programs, which are designed to provide enhanced services to the Funds and their shareholders; (ii) graduated investment advisory fee schedules or unitary fee structures, fee waivers, or expense caps by CSIM and its affiliates for those funds in the Schwab fund complex with such features; and (iii) pricing a fund to scale and keeping overall expenses down as the fund grows. The Trustees acknowledged that CSIM has shared any economies of scale with the Funds by investing in CSIM’s infrastructure, as discussed above, over time and that CSIM’s internal costs of providing investment management, technology, administrative, legal and compliance services to the Funds continue to increase as a result of regulatory or
Schwab Taxable Bond Funds | Annual Report
Schwab Taxable Bond Funds
other developments. Based on this evaluation, the Board concluded, within the context of its full deliberations, that each Fund obtains reasonable benefits from economies of scale.
In the course of their deliberations, the Trustees may have accorded different weights to various factors and did not identify any particular information or factor that was all important or controlling. Based on the Trustees’ deliberation and their evaluation of the information described above, the
Board, including all of the Independent Trustees, approved the continuation of the Agreement with respect to the Funds and concluded that the compensation under the Agreement with respect to the Funds is fair and reasonable in light of the services provided and the related expenses borne by CSIM and its affiliates and such other matters as the Trustees considered to be relevant in the exercise of their reasonable judgment.
| 1 | The meeting on June 8, 2021 was held by means of videoconference in reliance on exemptive relief from the in-person voting requirement under the 1940 Act as provided by the Securities and Exchange Commission. |
Schwab Taxable Bond Funds | Annual Report
Schwab Taxable Bond Funds
Trustees and Officers
The tables below give information about the trustees and officers of Schwab Investments, which includes the funds covered in this report. The “Fund Complex” includes The Charles Schwab Family of Funds, Schwab Capital Trust, Schwab Investments, Schwab Annuity Portfolios, Schwab Strategic Trust and Laudus Trust. The Fund Complex includes 102 funds.
The address for all trustees and officers is 211 Main Street, San Francisco, CA 94105. You can find more information about the trustees and officers in the funds’ Statement of Additional Information, which is available free by calling 1-877-824-5615.
| Independent Trustees |
Name, Year of Birth, and
Position(s) with the trust
(Terms of office, and
length of Time Served1) | Principal Occupations
During the Past Five Years | Number of
Portfolios in
Fund Complex
Overseen by
the Trustee | Other Directorships |
Robert W. Burns
1959
Trustee
(Trustee of Schwab Strategic Trust since 2009; The Charles Schwab Family of Funds, Schwab Investments, Schwab Capital Trust, Schwab Annuity Portfolios and Laudus Trust since 2016) | Retired/Private Investor (Jan. 2009 – present). Formerly, Managing Director, Pacific Investment Management Company, LLC (PIMCO) (investment management firm) and President, PIMCO Funds. | 102 | None |
John F. Cogan
1947
Trustee
(Trustee of The Charles Schwab Family of Funds, Schwab Investments, Schwab Capital Trust and Schwab Annuity Portfolios since 2008; Laudus Trust since 2010; Schwab Strategic Trust since 2016) | Senior Fellow (Oct. 1979 – present), The Hoover Institution at Stanford University (public policy think tank); Senior Fellow (2000 – present), Stanford Institute for Economic Policy Research; Professor of Public Policy (1994 – 2015), Stanford University. | 102 | Director (2005 – 2020), Gilead Sciences, Inc. |
Nancy F. Heller
1956
Trustee
(Trustee of The Charles Schwab Family of Funds, Schwab Investments, Schwab Capital Trust, Schwab Annuity Portfolios, Schwab Strategic Trust and Laudus Trust since 2018) | Retired. President and Chairman (2014 – 2016), TIAA Charitable (financial services); Senior Managing Director (2003 – 2016), TIAA (financial services). | 102 | None |
David L. Mahoney
1954
Trustee
(Trustee of The Charles Schwab Family of Funds, Schwab Investments, Schwab Capital Trust, Schwab Annuity Portfolios and Laudus Trust since 2011; Schwab Strategic Trust since 2016) | Private Investor. | 102 | Director (2004 – present), Corcept Therapeutics Incorporated
Director (2009 – present), Adamas Pharmaceuticals, Inc.
Director (2003 – 2019), Symantec Corporation |
Jane P. Moncreiff
1961
Trustee
(Trustee of The Charles Schwab Family of Funds, Schwab Investments, Schwab Capital Trust, Schwab Annuity Portfolios, Schwab Strategic Trust and Laudus Trust since 2019) | Consultant (2018 – present), Fulham Advisers LLC (management consulting); Chief Investment Officer (2009 – 2017), CareGroup Healthcare System, Inc. (healthcare). | 102 | None |
Schwab Taxable Bond Funds | Annual Report
Schwab Taxable Bond Funds
| Independent Trustees (continued) |
Name, Year of Birth, and
Position(s) with the trust
(Terms of office, and
length of Time Served1) | Principal Occupations
During the Past Five Years | Number of
Portfolios in
Fund Complex
Overseen by
the Trustee | Other Directorships |
Kiran M. Patel
1948
Trustee
(Trustee of The Charles Schwab Family of Funds, Schwab Investments, Schwab Capital Trust, Schwab Annuity Portfolios and Laudus Trust since 2011; Schwab Strategic Trust since 2016) | Retired. Executive Vice President and General Manager of Small Business Group (Dec. 2008 – Sept. 2013), Intuit, Inc. (financial software and services firm for consumers and small businesses). | 102 | Director (2008 – present), KLA-Tencor Corporation |
Kimberly S. Patmore
1956
Trustee
(Trustee of The Charles Schwab Family of Funds, Schwab Investments, Schwab Capital Trust, Schwab Annuity Portfolios, Schwab Strategic Trust and Laudus Trust since 2016) | Consultant (2008 – present), Patmore Management Consulting (management consulting). | 102 | None |
J. Derek Penn
1957
Trustee
(Trustee of The Charles Schwab Family of Funds, Schwab Investments, Schwab Capital Trust, Schwab Annuity Portfolios, Schwab Strategic Trust and Laudus Trust since 2021) | Head of Equity Sales and Trading (2006 – 2018), BNY Mellon (financial services). | 102 | None |
| Interested Trustees |
Name, Year of Birth, and
Position(s) with the trust
(Terms of office, and
length of Time Served1) | Principal Occupations
During the Past Five Years | Number of
Portfolios in
Fund Complex
Overseen by
the Trustee | Other Directorships |
Walter W. Bettinger II2
1960
Chairman and Trustee
(Trustee of The Charles Schwab Family of Funds, Schwab Investments, Schwab Capital Trust and Schwab Annuity Portfolios since 2008; Schwab Strategic Trust since 2009; Laudus Trust since 2010) | Director, President and Chief Executive Officer (Oct. 2008 – present), The Charles Schwab Corporation; President and Chief Executive Officer (Oct. 2008 – present) and Director (May 2008 – present), Charles Schwab & Co., Inc.; Director (Apr. 2006 – present), Charles Schwab Bank, SSB; Director (Nov. 2017 – present), Charles Schwab Premier Bank, SSB; Director (July 2019 – present), Charles Schwab Trust Bank; Director (May 2008 – present) and President and Chief Executive Officer (Aug. 2017 – present), Schwab Holdings, Inc.; Director (Oct. 2020 – present), TD Ameritrade Holding Corporation; Director (July 2016 – present), Charles Schwab Investment Management, Inc. | 102 | Director (2008 – present), The Charles Schwab Corporation |
Schwab Taxable Bond Funds | Annual Report
Schwab Taxable Bond Funds
| Interested Trustees (continued) |
Name, Year of Birth, and
Position(s) with the trust
(Terms of office, and
length of Time Served1) | Principal Occupations
During the Past Five Years | Number of
Portfolios in
Fund Complex
Overseen by
the Trustee | Other Directorships |
Joseph R. Martinetto2
1962
Trustee
(Trustee of The Charles Schwab Family of Funds, Schwab Investments, Schwab Capital Trust, Schwab Annuity Portfolios, Schwab Strategic Trust and Laudus Trust since 2016) | Chief Operating Officer (Feb. 2018 – present) and Senior Executive Vice President (July 2015 – Feb. 2018), The Charles Schwab Corporation; Senior Executive Vice President (July 2015 – present), Charles Schwab & Co., Inc.; Chief Financial Officer (July 2015 – Aug. 2017) and Executive Vice President and Chief Financial Officer (May 2007 – July 2015), The Charles Schwab Corporation and Charles Schwab & Co., Inc.; Director (May 2007 – present), Charles Schwab & Co., Inc.; Director (Apr. 2010 – present) and Chief Executive Officer (July 2013 – Apr. 2015), Charles Schwab Bank, SSB; Director (Nov. 2017 – present), Charles Schwab Premier Bank, SSB; Director (May 2007 – present), Chief Financial Officer (May 2007 – Aug. 2017), Senior Executive Vice President (Feb. 2016 – present), and Executive Vice President (May 2007 – Feb. 2016), Schwab Holdings, Inc.; Director (Oct. 2020 – present), TD Ameritrade Holding Corporation. | 102 | None |
| Officers of the Trust |
Name, Year of Birth, and Position(s) with the trust
(Terms of office, and length of Time Served3) | Principal Occupations During the Past Five Years |
Jonathan de St. Paer
1973
President and Chief Executive Officer
(Officer of The Charles Schwab Family of Funds, Schwab Investments, Schwab Capital Trust, Schwab Annuity Portfolios, Schwab Strategic Trust and Laudus Trust since 2018) | Director (Apr. 2019 – present), President (Oct. 2018 – present), Chief Operating Officer (Jan. 2020 – present), and Chief Executive Officer (Apr. 2019 – Nov. 2019), Charles Schwab Investment Management, Inc.; Senior Vice President (June 2020 – present) and Chief Operating Officer (Jan. 2020 – present), Charles Schwab Investment Advisory, Inc.; Chief Executive Officer (Apr. 2019 – present), President (Nov. 2018 – present) and Trustee (Apr. 2019 – Dec. 2020), Schwab Funds, Laudus Funds and Schwab ETFs; Director (Apr. 2019 – present), Charles Schwab Worldwide Funds plc and Charles Schwab Asset Management (Ireland) Limited; Senior Vice President (Apr. 2019 – present), Senior Vice President – Strategy and Product Development (CSIM) (Jan. 2014 – Mar. 2019), and Vice President (Jan. 2009 – Dec. 2013), Charles Schwab & Co., Inc. |
Mark Fischer
1970
Treasurer, Chief Financial Officer and Chief Operating Officer
(Officer of The Charles Schwab Family of Funds, Schwab Investments, Schwab Capital Trust, Schwab Annuity Portfolios, Schwab Strategic Trust and Laudus Trust since 2013) | Treasurer and Chief Financial Officer (Jan. 2016 – present) and Chief Operating Officer (Dec. 2020 – present), Schwab Funds, Laudus Funds and Schwab ETFs; Assistant Treasurer (Dec. 2013 – Dec. 2015), Schwab Funds and Laudus Funds; Assistant Treasurer (Nov. 2013 – Dec. 2015), Schwab ETFs; Chief Financial Officer (Mar. 2020 – present) and Vice President (Oct. 2013 – present), Charles Schwab Investment Management, Inc.; Executive Director (Apr. 2011 – Sept. 2013), J.P. Morgan Investor Services; Assistant Treasurer (May 2005 – Mar. 2011), Massachusetts Financial Service Investment Management. |
Omar Aguilar
1970
Senior Vice President and Chief Investment Officer
(Officer of The Charles Schwab Family of Funds, Schwab Investments, Schwab Capital Trust, Schwab Annuity Portfolios, Schwab Strategic Trust and Laudus Trust since 2011) | Senior Vice President and Chief Investment Officer (Apr. 2011 – present), Charles Schwab Investment Management, Inc.; Senior Vice President and Chief Investment Officer (June 2011 – present), Schwab Funds, Laudus Funds and Schwab ETFs; Head of the Portfolio Management Group and Vice President of Portfolio Management (May 2009 – Apr. 2011), Financial Engines, Inc. (investment management firm); Head of Quantitative Equity (July 2004 – Jan. 2009), ING Investment Management. |
Brett Wander
1961
Senior Vice President and Chief Investment Officer
(Officer of The Charles Schwab Family of Funds, Schwab Investments, Schwab Capital Trust, Schwab Annuity Portfolios, Schwab Strategic Trust and Laudus Trust since 2011) | Senior Vice President and Chief Investment Officer (Apr. 2011 – present), Charles Schwab Investment Management, Inc.; Senior Vice President and Chief Investment Officer (June 2011 – present), Schwab Funds, Laudus Funds and Schwab ETFs; Senior Managing Director and Global Head of Active Fixed-Income Strategies (Jan. 2008 – Oct. 2010), State Street Global Advisors; Director of Alpha Strategies (Apr. 2006 – Jan. 2008), Loomis, Sayles & Company (investment management firm). |
William P. McMahon, Jr.
1972
Senior Vice President and Chief Investment Officer
(Officer of The Charles Schwab Family of Funds, Schwab Investments, Schwab Capital Trust, Schwab Annuity Portfolios, Schwab Strategic Trust and Laudus Trust since 2021) | Senior Vice President and Chief Investment Officer (Jan. 2020 – present), Charles Schwab Investment Management, Inc.; Senior Vice President and Chief Investment Officer (June 2021 – present), Schwab Funds, Laudus Funds and Schwab ETFs; Senior Vice President and Chief Investment Officer – ThomasPartners Strategies (Apr. 2018 – Dec. 2019), Charles Schwab Investment Advisory, Inc.; Senior Vice President and Chief Investment Officer (May 2001 – Apr. 2018), ThomasPartners, Inc. |
Schwab Taxable Bond Funds | Annual Report
Schwab Taxable Bond Funds
| Officers of the Trust (continued) |
Name, Year of Birth, and Position(s) with the trust
(Terms of office, and length of Time Served3) | Principal Occupations During the Past Five Years |
David Lekich
1964
Vice President and Assistant Secretary, Schwab Funds and Schwab ETFs
Vice President and Assistant Clerk, Laudus Funds
(Officer of The Charles Schwab Family of Funds, Schwab Investments, Schwab Capital Trust, Schwab Annuity Portfolios, Schwab Strategic Trust and Laudus Trust since 2011) | Senior Vice President (Sept. 2011 – present) and Vice President (Mar. 2004 – Sept. 2011), Charles Schwab & Co., Inc.; Senior Vice President and Chief Counsel (Sept. 2011 – present) and Vice President (Jan. 2011 – Sept. 2011), Charles Schwab Investment Management, Inc.; Vice President and Assistant Secretary (Oct. 2021 – present), Secretary (Apr. 2011 – Oct. 2021) and Chief Legal Officer (Dec. 2011 – Oct. 2021), Schwab Funds; Vice President and Assistant Clerk (Apr. 2011 – present), Laudus Funds; Vice President and Assistant Secretary (Oct. 2021 – present), Secretary (May 2011 – Oct. 2021) and Chief Legal Officer (Nov. 2011 – Oct. 2021), Schwab ETFs. |
Catherine MacGregor
1964
Chief Legal Officer and Secretary, Schwab Funds and Schwab ETFs
Chief Legal Officer, Vice President and Clerk, Laudus Funds
(Officer of The Charles Schwab Family of Funds, Schwab Investments, Schwab Capital Trust, Schwab Annuity Portfolios and Laudus Trust since 2005; Schwab Strategic Trust since 2009) | Vice President (July 2005 – present), Charles Schwab & Co., Inc.; Vice President (Sept. 2005 – present), Charles Schwab Investment Management, Inc.; Vice President (Dec. 2005 – present) and Chief Legal Officer and Clerk (Mar. 2007 – present), Laudus Funds; Chief Legal Officer and Secretary (Oct. 2021 – present), Vice President (Nov. 2005 – Oct. 2021) and Assistant Secretary (June 2007 – Oct. 2021), Schwab Funds; Chief Legal Officer and Secretary (Oct. 2021 – present), Vice President and Assistant Secretary (Oct. 2009 – Oct. 2021), Schwab ETFs. |
| 1 | Each Trustee shall hold office until the election and qualification of his or her successor, or until he or she dies, resigns or is removed. The retirement policy requires that each independent trustee retire by December 31 of the year in which the Trustee turns 74 or the Trustee’s twentieth year of service as an independent trustee on any trust in the Fund Complex, whichever occurs first. |
| 2 | Mr. Bettinger and Mr. Martinetto are Interested Trustees. Mr. Bettinger is an Interested Trustee because he owns stock of The Charles Schwab Corporation (CSC), the parent company of Charles Schwab Investment Management, Inc. (CSIM), the investment adviser for the trusts in the Fund Complex, is an employee and director of Charles Schwab & Co., Inc. (Schwab), the principal underwriter for The Charles Schwab Family of Funds, Schwab Investments, Schwab Capital Trust, Schwab Annuity Portfolios and Laudus Trust, and is a director of CSIM. Mr. Martinetto is an Interested Trustee because he owns stock of CSC and is an employee and director of Schwab. |
| 3 | The President, Treasurer and Secretary/Clerk hold office until their respective successors are chosen and qualified or until he or she sooner dies, resigns, is removed or becomes disqualified. Each of the other officers serves at the pleasure of the Board. |
Schwab Taxable Bond Funds | Annual Report
Schwab Taxable Bond Funds
agency discount notes Notes issued by federal agencies—known as Government Sponsored Enterprises, or GSEs—at a discount to their value at maturity. An agency discount note is a short-term investment offering a high degree of credit quality.
Alternative Minimum Tax (AMT) A federal income tax designed to limit the extent to which high-income taxpayers (including individuals, estates, trusts and corporations) can benefit from certain deductions and exemptions. For example, some types of income that are exempt from regular federal income tax are not exempt from the AMT.
asset allocation The practice of dividing a portfolio among different asset classes, with each asset class assigned a particular percentage.
asset-backed securities Bond or other debt securities that represent ownership in a pool of assets such as credit card debt.
asset class A group of securities with similar structure and basic characteristics. Stocks, bonds and cash are the three main examples of asset classes.
average rate The average rate of interest paid annually by the fixed-income securities in a fund or portfolio.
Bloomberg US Aggregate Bond Index An index that is a broad-based benchmark measuring the performance of the U.S. investment grade, taxable bond market, including U.S. Treasuries, government-related and corporate bonds, mortgage pass-through securities, commercial mortgage-backed securities, and asset-backed securities that are publicly available for sale in the United States. To be eligible for inclusion in the index, securities must be fixed rate, non-convertible, U.S. dollar-denominated with at least $300 million or more of outstanding face value and have one or more years remaining to maturity. The index excludes certain types of securities, including tax-exempt state and local government series bonds, structured notes embedded with swaps or other special features, private placements, floating rate securities, inflation-linked bonds and Eurobonds. The index is market capitalization weighted and the securities in the index are updated on the last business day of each month.
Bloomberg US Government/Credit 1–5 Year Index An index that is a broad-based benchmark measuring the performance of U.S. dollar-denominated U.S. Treasury bonds, government related bonds (i.e., U.S. and non-U.S. agencies, sovereign, quasi-sovereign, supranational and local authority debt) and investment grade U.S. corporate bonds that have a remaining maturity of greater than or equal to one year and less than five years. To be eligible for inclusion in the index, securities must be fixed rate, non-convertible, U.S. dollar-denominated with at least $300 million or more of outstanding face value and have a remaining maturity greater than or equal to one year and less than five years. The index excludes certain types of securities, including, bonds with equity type features (e.g., warrants, convertibles and preferreds), tax-exempt municipal securities, inflation-linked bonds, floating rate issues, strips, private placements, U.S. dollar-denominated 25 and 50 par retail bonds, structured notes and pass-through certificates. The index is market capitalization weighted and the securities in the index are updated on the last business day of each month.
Bloomberg US Treasury Inflation-Linked Bond Index (Series-L) An index which includes all publicly-issued U.S. Treasury Inflation-Protected Securities (TIPS) that have at least one year remaining to maturity, are rated investment grade and have $500 million or more of outstanding face value. The TIPS in the index must be denominated in U.S. dollars and must be fixed-rate and non-convertible. The index is market capitalization weighted and the
TIPS in the index are updated on the last business day of each month. TIPS are publicly issued, dollar denominated U.S. Government securities issued by the U.S. Treasury that have principal and interest payments linked to an official inflation measure (as measured by the Consumer Price Index, or CPI) and their payments are supported by the full faith and credit of the United States.
bond A security representing a loan from the investor to the issuer. A bond typically pays interest at a fixed rate (the coupon rate) until a specified date (the maturity date), at which time the issuer returns the money borrowed (principal or face value) to the bondholder. Because of their structure, bonds are sometimes called “fixed income securities” or “debt securities.”
An individual bond is subject to the credit risk of the issuer. Changes in interest rates can affect a bond’s market value prior to call or maturity. There is no guarantee that a bond’s yield to call or maturity will provide a positive return over the rate of inflation.
bond fund A bond fund is subject to the same credit, interest rate, and inflation risks as bonds. In addition, a bond fund incurs ongoing fees and expenses. A bond fund’s net asset value will fluctuate with the price of the underlying bonds and the portfolio turnover activity; return of principal is not guaranteed.
call An early repayment of a bond’s principal by the issuer, usually done because the issuer is able to refinance its bond debt at a lower rate.
call protection A term used in reference to a bond that cannot be called by the issuer before maturity, or at least for many years from the present date. A bond that offers call protection can more reliably be expected to provide a given yield over a given number of years than a bond that could be called (assuming both bonds are of the same credit quality).
capital gain, capital loss The difference between the amount paid for an investment and its value at a later time. If the investment has been sold, the capital gain or loss is considered a realized gain or loss. If the investment is still held, the gain or loss is still “on paper” and is considered unrealized.
certificate of participation A municipal bond that is repaid from an annual budget appropriation rather than being backed by the full faith and credit of the issuer.
commercial mortgage-backed securities Bond or other debt securities that represent ownership in a pool of commercial mortgage loans.
coupon, coupon rate The annual rate of interest paid until maturity by the issuer of a debt security.
credit-enhanced securities Securities that are backed by the credit of an entity other than the issuer (such as a financial institution). Credit enhancements, which can equal up to 100% of the security’s value, are designed to help lower the risk of default on a security and may also make the security more liquid.
credit quality The capacity of an issuer to make its interest and principal payments; an assessment typically rendered by an independent third-party organization.
credit risk The risk that a bond issuer may be unable to pay interest or principal to its bondholders.
Schwab Taxable Bond Funds | Annual Report
Schwab Taxable Bond Funds
discount rate The implied rate on a debt security that does not pay interest but is bought at a discount and redeemed at face value when it matures.
duration A measure of an individual bond’s sensitivity to interest rates, expressed in years. Calculations of duration generally take into account the bond’s yield, interest payments, maturity date and call features.
weighted average duration A measure of the duration of all bonds in a fund’s portfolio, also expressed in years, based on the market value weighted average duration of each bond in the portfolio.
expense ratio The amount that is taken from a mutual fund’s assets each year to cover the fund’s operating expenses. An expense ratio of 0.50% means that a fund’s expenses amount to half of one percent of its average net assets a year.
general obligation bonds Municipal bonds that are secured by the issuer’s full faith and credit, which typically is backed by the power of the issuer to levy taxes.
interest Payments to bondholders (usually made twice a year) as compensation for loaning the bond principal to the issuer.
interest rate risk The risk that a bond’s value will fluctuate if market interest rates change or are expected to change. Bond prices tend to move in the opposite direction of interest rates: when interest rates rise, bond prices tend to fall.
liquidity-enhanced security A security that when tendered is paid from funds advanced by an entity other than the issuer (such as a large financial institution). Liquidity enhancements are often used on variable-rate securities where the portfolio manager has an option to tender the securities prior to their final maturity.
market risk Those elements of risk that are common to all securities in an asset class, and therefore cannot be significantly reduced by diversification within the asset class. Also known as “systemic risk.”
maturity The maturity of a bond will generally be determined using a portfolio security’s final maturity date (date on which the final principal payment of a bond is scheduled to be paid); however, for securitized products, such as mortgage-backed securities and certain other asset-backed securities, maturity will be determined on an average life basis (weighted average time to receipt of all principal payments) by the investment adviser. Because pre-payment rates of individual mortgage pools vary widely, the average life of a particular pool cannot be predicted precisely. For securities with embedded demand features, such as puts or calls, either the demand date or the final maturity date will be used depending on interest rates, yields and other market conditions. The weighted average maturity (WAM) of a fund is dollar-weighted based upon the market value of a fund’s securities at the time of the calculation.
mortgage-backed securities Bond or other debt securities that represent ownership in a pool of mortgage loans.
muni, municipal bonds, municipal securities Debt securities issued by a state, its counties, municipalities, authorities and other subdivisions, or the territories and possessions of the United States and the District of Columbia, including their subdivisions, agencies and instrumentalities and corporations. These securities may be issued to
obtain money for various public purposes, including the construction of a wide range of public facilities such as airports, bridges, highways, housing, hospitals, mass transportation, public utilities, schools, streets, and water and sewer works.
net asset value (NAV) The value of one share of a mutual fund. NAV is calculated by taking the fund’s total assets, subtracting liabilities, and dividing by the number of shares outstanding.
outstanding shares, shares outstanding When speaking of a company or mutual fund, indicates all shares currently held by investors.
prepayment risk The risk that a mortgage-backed security may be paid off early, typically because interest rates have fallen and the homeowners who hold the underlying mortgages have refinanced those mortgages at lower rates. In this type of situation, the investor who held the mortgage-backed security will usually have to settle for a lower rate when reinvesting the principal.
refunded bond A bond for which the principal and interest payments are secured or guaranteed by cash or U.S. government securities held in an escrow account.
restricted securities Securities that are subject to contractual restrictions on resale. These securities are often purchased in private placement transactions.
revenue bonds Municipal bonds that are issued to finance public works projects and are secured by revenue generated by the project (such as water and sewer fees) rather than the full faith and credit of the issuer.
S&P 500 Index An index that is designed to measure the performance of 500 leading publicly traded companies from a broad range of industries.
section 4(2)/144A securities Securities exempt from registration under Section 4(2) of the Securities Act of 1933. These securities may be sold only to qualified institutional buyers under Securities Act Rule 144A.
taxable equivalent yield The yield an investor would need to get from a taxable investment in order to match the yield paid by a given tax-exempt investment, once the effect of all applicable taxes is taken into account. For example, if your tax rate were 25%, a tax-exempt investment paying 4.5% would have a taxable equivalent yield for you of 6.0% (4.5% ÷ [1 – 0.25%] = 6.0%).
total return The percentage that an investor would have earned or lost on an investment in the fund assuming dividends and distributions were reinvested.
weighted average For mutual funds, an average that gives the same weight to each security as the security represents in the fund’s portfolio.
yield The income paid out by an investment, expressed as a percentage of the investment’s market value.
yield to maturity The annualized rate of return a bondholder could expect if the bond were held to maturity. In addition to interest payments, yield to maturity also factors in any difference between a bond’s current price and its principal amount, or face value.
Schwab Taxable Bond Funds | Annual Report
Schwab Taxable Bond Funds
Charles Schwab Investment Management
With a straightforward lineup of core products and solutions for building the foundation of a portfolio, Charles Schwab Investment Management advocates for investors of all sizes with a steadfast focus on lowering costs and reducing unnecessary complexity. The list below shows all currently available Schwab Funds®.
Investors should carefully consider information contained in the prospectus, or if available, the summary prospectus, including investment objectives, risks, charges and expenses before investing. Please call 1-877-824-5615 for a prospectus for any Schwab Fund. Please read the prospectus carefully before you invest. This report must be preceded or accompanied by a current prospectus.
Proxy Voting Policies, Procedures and Results
A description of the proxy voting policies and procedures used to determine how to vote proxies on behalf of the funds is available without charge, upon request, by visiting the Schwab Funds’ website at www.schwabassetmanagement.com/schwabfunds_prospectus, the SEC’s website at www.sec.gov, or by contacting Schwab Funds at 1-877-824-5615.
Information regarding how a fund voted proxies relating to portfolio securities during the most recent twelve-month period ended June 30 is available, without charge, by visiting the fund’s website at www.schwabassetmanagement.com/schwabfunds_prospectus or the SEC’s website at www.sec.gov.
Equity Funds
Schwab Core Equity Fund
Schwab Dividend Equity Fund
Schwab Large-Cap Growth Fund
Schwab Small-Cap Equity Fund
Schwab Health Care Fund
Schwab International Core Equity Fund
Schwab Fundamental US Large Company Index Fund
Schwab Fundamental US Small Company Index Fund
Schwab Fundamental International Large Company Index Fund
Schwab Fundamental International Small Company Index Fund
Schwab Fundamental Emerging Markets Large Company Index Fund
Schwab Fundamental Global Real Estate Index Fund
Schwab Global Real Estate Fund
Schwab S&P 500 Index Fund
Schwab 1000 Index® Fund
Schwab Small-Cap Index Fund®
Schwab Total Stock Market Index Fund®
Schwab U.S. Large-Cap Growth Index Fund
Schwab U.S. Large-Cap Value Index Fund
Schwab U.S. Mid-Cap Index Fund
Schwab International Index Fund®
Asset Allocation Funds
Schwab Balanced Fund
Schwab MarketTrack Portfolios®
Schwab Target Funds
Schwab Target Index Funds
Schwab Monthly Income Funds
Bond Funds
Schwab Treasury Inflation Protected Securities Index Fund
Schwab U.S. Aggregate Bond Index Fund
Schwab Short-Term Bond Index Fund
Schwab Tax-Free Bond Fund1
Schwab California Tax-Free Bond Fund1
Schwab Opportunistic Municipal Bond Fund
Schwab Money Funds2
Schwab provides a broad choice of taxable and tax-exempt money market funds for both retail and institutional client types.
Investment Adviser
Charles Schwab Investment Management, Inc.
211 Main Street, San Francisco, CA 94105
Funds
Schwab Funds
1-877-824-5615
© 2021 Charles Schwab & Co., Inc. All rights reserved.
Member SIPC®
Printed on recycled paper.
| ¹ | State, local, and the Federal Alternative Minimum Tax may apply. Capital gains are not exempt from Federal Taxation. |
| ² | You could lose money by investing in the Schwab Money Funds. All Schwab Money Funds with the exception of Schwab Variable Share Price Money Fund seek to preserve the value of your investment at $1.00 per share, but cannot guarantee they will do so. Because the share price of Schwab Variable Share Price Money Fund will fluctuate, when you sell your shares they may be worth more or less than what you originally paid for them. All Schwab Money Funds with the exception of Schwab Government Money Fund, Schwab Retirement Government Money Fund, Schwab U.S. Treasury Money Fund, Schwab Treasury Obligations Money Fund and Schwab Government Money Market Portfolio may impose a fee upon the sale of your shares or may temporarily suspend your ability to sell shares if the Fund’s liquidity falls below required minimums because of market conditions or other factors. An investment in the Schwab Money Funds is not insured or guaranteed by the Federal Deposit Insurance Corporation or any other government agency. The Schwab Money Funds’ sponsor has no legal obligation to provide financial support to the Funds, and you should not expect that the sponsor will provide financial support to the Funds at any time. |
This page is intentionally left blank.
Annual Report | August 31, 2021
Schwab Municipal Bond Funds
Schwab Tax-Free Bond Fund
Schwab California Tax-Free Bond Fund
Schwab Opportunistic Municipal Bond Fund
(formerly Schwab High Yield Municipal Bond Fund)
This page is intentionally left blank.
Three ways investors can include bond funds in an asset allocation strategy.
Fund investment adviser: Charles Schwab Investment Management, Inc. (CSIM)
Distributor: Charles Schwab & Co., Inc. (Schwab)
Schwab Municipal Bond Funds | Annual Report
Schwab Municipal Bond Funds
The performance data quoted represents past performance. Past performance does not guarantee future results. Investment returns and principal value of an investment will fluctuate so that an investor’s shares may be worth more or less than their original cost. Current performance may be lower or higher than performance data quoted. To obtain performance information current to the most recent month end, please visit www.schwabassetmanagement.com/schwabfunds_prospectus.
| Total Returns for the 12 Months Ended August 31, 2021 |
| Schwab Tax-Free Bond Fund (Ticker Symbol: SWNTX) | 3.03% |
| Bloomberg Municipal 3-15 Year Blend Index | 2.73% |
| Fund Category: Morningstar Municipal National Intermediate Bond* | 3.80% |
| Performance Details | pages 8-10 |
| |
| Schwab California Tax-Free Bond Fund (Ticker Symbol: SWCAX) | 2.25% |
| Bloomberg California Municipal 3-15 Year Blend Index | 1.98% |
| S&P California AMT-Free Municipal Bond Index | 2.22% |
| Fund Category: Morningstar Municipal California Intermediate/Short Bond* | 2.93% |
| Performance Details | pages 11-13 |
| |
| Schwab Opportunistic Municipal Bond Fund (Ticker Symbol: SWHYX) | 5.26% 1 |
| Bloomberg Municipal Bond Index2 | 3.40% |
| Bloomberg High Yield Municipal Index | 12.17% |
| Fund Category: Morningstar High Yield Muni* | 9.23% |
| Performance Details | pages 14-16 |
All total return figures on this page assume dividends and distributions were reinvested. Index figures do not include trading and management costs, which would lower performance. Indices are unmanaged and cannot be invested in directly. Performance results less than one year are not annualized.
The first index listed for each fund is the fund’s primary benchmark, as shown in the prospectus. Additional indices shown are provided for comparative purposes.
For index definitions, please see the Glossary.
Expenses may have been partially absorbed by CSIM and its affiliates. Without these reductions, a fund’s total return would have been lower. Performance does not reflect the deduction of taxes that a shareholder would pay on fund distributions or on the redemption of fund shares.
| * | Source for category information: Morningstar, Inc. The Morningstar Category return represents all active and index mutual funds within the category as of the report date. |
| 1 | Total return for the report period presented in the table differs from the return in the Financial Highlights. The total return presented in the above table is calculated based on the NAV at which shareholder transactions were processed. The total return presented in the Financial Highlights section of the report is calculated in the same manner, but also takes into account certain adjustments that are necessary under generally accepted accounting principles required in the annual and semiannual reports. |
| 2 | Effective July 1, 2021, the fund changed its primary benchmark index from the Bloomberg High Yield Municipal Index to the Bloomberg Municipal Bond Index. CSIM believes the benchmark indices change provides a more appropriate comparison for evaluating the fund’s performance. |
Schwab Municipal Bond Funds | Annual Report
Schwab Municipal Bond Funds
Jonathan de St. Paer
President of Charles Schwab
Investment Management, Inc.
and the funds covered
in this report.
Dear Shareholder,
Despite the hopes of last winter and spring that large-scale vaccine distribution would bring the COVID-19 pandemic under control, the spread of the Delta variant of the virus continues to pose significant social, health, and economic challenges across the United States and the world. Nevertheless, during the 12-month period ended August 31, 2021, the U.S. economy made dramatic progress toward reopening and renewed growth backed by continued monetary and fiscal support by the U.S. Congress and U.S. Federal Reserve. The U.S. gross domestic product (GDP) growth rate increased by over 6% during the first half of 2021 after declining in 2020. U.S. equity markets rallied sharply as well, with the S&P 500® Index, a bellwether for the overall U.S. stock market, retuning 31.2% for the reporting period and repeatedly reaching new record territory. Bond prices, which typically move in the opposite direction of yields, struggled in early 2021 due to the increasing inflationary pressures of the improving economy and pandemic-constrained supply chains, then recovered in the second quarter of the year as the U.S. Federal Reserve opined that the acceleration in inflation was likely to prove transitory. The broad U.S. bond market, as measured by the Bloomberg US Aggregate Bond Index, struggled in this uncertain environment, ending the reporting period flat. However, municipal bonds, as measured by Bloomberg Municipal Bond Index, returned 3.4% over the same period as local municipalities benefited from improving economic fundamentals and federal financial support.
At Charles Schwab Investment Management, we believe the varied performance of asset classes during the reporting period reinforces the importance of establishing and maintaining a diversified, long-term investing plan that reflects your risk tolerance and long-term financial goals. The Schwab Municipal Bond Funds can provide tax-exempt income and help to manage overall portfolio volatility. The funds also offer active management by an experienced investment team that employs extensive credit research in maintaining a mix of securities that seek to maximize current income while maintaining each fund’s credit standards. In addition, the Schwab Opportunistic Municipal Bond Fund (formerly the Schwab High Yield Municipal Bond Fund) now features lowered expenses and no longer has a redemption fee.
Thank you for investing with Charles Schwab Investment Management. For more information about the Schwab Municipal Bond Funds, please continue reading this report. In addition, you can find further details about these funds by visiting our website at www.schwabassetmanagement.com. We are also happy to hear from you at 1-877-824-5615.
Sincerely,
“ In addition, the Schwab Opportunistic Municipal Bond Fund (formerly the Schwab High Yield Municipal Bond Fund) now features lowered expenses and no longer has a redemption fee.”
Past performance is no guarantee of future results.
Diversification and asset allocation strategies do not ensure a profit and cannot protect against losses in a declining market.
Management views may have changed since the report date.
Schwab Municipal Bond Funds | Annual Report
Schwab Municipal Bond Funds
The Investment Environment
For the 12-month reporting period ended August 31, 2021, fixed-income markets were mixed. Despite persisting COVID-19 pandemic-driven stresses on the U.S. economy and a resurgence of COVID-19 cases in the fall and into the winter, along with the emergence and rapid spread of the Delta variant during the summer, equity markets continued to rise on economic recovery, strong earnings, ongoing fiscal stimulus measures, and optimism related to the rapid rollout of COVID-19 vaccines that began in December 2020. Taxable bond yields remained relatively flat for the first four months of the reporting period before demand waned and yields rose in January and February of 2021. (Bond yields and bond prices typically move in opposite directions.) Demand began to recover and yields dipped again over the second half of the reporting period. Demand for municipal (muni) bonds was robust over most of the reporting period, and muni bonds generally outperformed taxable bonds. For the reporting period, the Bloomberg Municipal 3-15 Year Blend Index returned 2.73% and the Bloomberg California Municipal 3-15 Year Blend Index returned 1.98%, while the Bloomberg Municipal Bond Index and Bloomberg High Yield Municipal Bond Index returned 3.40% and 12.17%, respectively. For comparison to taxable bonds, the Bloomberg US Aggregate Bond Index, representing the broad U.S. bond market, returned -0.08% for the reporting period.
Bolstered by the extensive emergency rescue and fiscal stimulus measures passed by the U.S. Congress and U.S. Federal Reserve (Fed) beginning in March 2020, the U.S. economy began to recover from the dramatic impact of the COVID-19 pandemic. After falling by an annualized rate of 31.4% in the second quarter of 2020, U.S. gross domestic product (GDP) jumped by an annualized rate of 33.4% for the third quarter of 2020, reflecting pent-up consumer demand and government support. GDP growth stabilized beginning in the fourth quarter of 2020, growing at an annualized rate of 4.3% for the fourth quarter of 2020, 6.3% for the first quarter of 2021, and 6.7% for the second quarter of 2021. Unemployment, which skyrocketed in April 2020 but began falling starting in May 2020, fell over the reporting period. Inflation, which had remained well below the Fed’s traditional 2% target until March 2021, when it jumped, continued to rise through June 2021 and remained elevated through August 2021, largely due to supply and demand imbalances in the labor market, supply chain bottlenecks, increased consumer demand, particularly for travel-related services over most of the reporting period, and higher energy costs.
Yield Advantage of Munis over Treasuries: For Five-Year bonds; Tax Brackets Shown are the Highest Applicable
Index figures assume dividends and distributions were reinvested. Index figures do not include trading and management costs, which would lower performance. Indices are unmanaged and cannot be invested in directly. Performance results less than one year are not annualized. Past performance is not an indication of future results.
For index definitions, please see the Glossary.
Data source: Bloomberg L.P.
Nothing in this report represents a recommendation of a security by the investment adviser.
Management views may have changed since the report date.
Schwab Municipal Bond Funds | Annual Report
Schwab Municipal Bond Funds
The Investment Environment (continued)
For the most part, central banks around the world maintained the low—and for some international central banks, negative—interest rates instituted prior to, and in response to, the COVID-19 pandemic. In the U.S., despite improving economic data, the Fed reiterated several times during the reporting period its intention to continue its support of the economy for as long as is needed to achieve a full recovery, while acknowledging that it was keeping an eye on rising inflation. The Fed maintained the federal funds rate in a range of 0.00% to 0.25% throughout the reporting period. By the end of the reporting period, the Fed indicated that it would likely begin reducing its bond purchases as early as late 2021 with Fed Chair Jerome Powell noting that the Fed’s bond tapering should not be seen as an indication of an imminent interest rate hike. In developed international markets, most central banks were similarly accommodative. The European Central Bank held its interest rate at 0.00%, unchanged since March 2016, and confirmed it would continue its asset purchase program to help counter the economic impacts of the COVID-19 pandemic. The Bank of Japan upheld its short-term interest rate target of -0.1%, also unchanged since 2016, and maintained its ongoing program of purchasing exchange-traded funds (ETFs) and other assets. The Bank of England maintained its key official bank rate at 0.1% and also reiterated its commitment to its bond-buying program.
As of the beginning of the reporting period, the muni bond market had recovered to pre-COVID-19 pandemic levels following plummeting demand in March 2020, demonstrating resilience. Demand was strong throughout most of the reporting period, driving yields lower, as investors sought tax-exempt yield and looked to shelter income from the potential of future higher taxes. Muni bond issuers took advantage of low interest rates to increase issuance as demand rose.
Schwab Municipal Bond Funds | Annual Report
Schwab Municipal Bond Funds
California State Investment Environment
California generated record revenues in fiscal 2021 (ended June 30, 2021), far surpassing expectations from a year earlier. The strong revenue performance, along with sizable federal stimulus funds, has given the state the opportunity to address many of its social, environmental and infrastructure needs. However, the state’s lofty spending plans are expected to deplete a large portion of the surplus revenues generated during the past year.
California estimates it generated $184 billion of revenue in fiscal 2021, an amount 31% higher than in fiscal 2020 and 41% higher than the very conservative budget approved in June 2020 at the beginning of the COVID-19 pandemic. Revenue performance was driven by the strength of the stock market and associated capital gains, lower than anticipated unemployment among high income taxpayers, and steady spending by consumers despite the economic impact of the COVID-19 pandemic-induced recession. State personal income and sales and use taxes, which are the state’s leading revenues, increased 31% and 12%, respectively, over fiscal 2020 receipts. Expenditures were also up substantially at $166 billion, or 24% above the original budget. The state estimates it ended fiscal 2021 with reserves of $43 billion, more than double the amount at the end of fiscal 2020.
The state enacted a $196 billion budget for fiscal 2022 which is 47% larger than the fiscal 2021 enacted budget. A large portion of the increase in general fund spending is dedicated for K-12 education, as required under the state constitution, and a portion will be used to restore other spending that was reduced in the fiscal 2021 budget. Much of the increase in spending is also targeted for one-time investments in programs addressing major issues such as wildfire risk, climate change, and income inequality. Total general fund revenues are projected to be $179 billion, and the state will draw down a large portion of the prior year’s surplus revenues to pay for the balance of its spending plans. The state estimates it will end fiscal 2022 with $28 billion of reserves. The budget excludes the $27 billion of federal stimulus funds expected to be received under the American Rescue Plan. The state plans to spend the federal stimulus funds over the next few years on healthcare, homeless housing, grants to small businesses and other allowable purposes.
California’s economy has strengthened as the vaccination rollout has progressed, businesses have reopened, and tourist activities have ramped up. However, its economic recovery lags the nation. The state reports that it has recovered more than half of the 2.7 million jobs lost due to the pandemic, reducing the unemployment rate to 7.6% as of July 2021 from a peak of 16.0% in April 2020. The state’s unemployment rate remains well above the national average of 5.4%.
Unemployment rates vary widely throughout the state. In many communities, unemployment rates reflect the disproportionate impact of the response to the pandemic on certain segments of the economy. Los Angeles County, which is the most populous county in the state, reported a 10.2% unemployment rate for July 2021, reflecting its dependence on the tourism and entertainment industries, while Santa Clara County, the sixth largest and the center of the Silicon Valley high tech industry, reported a 4.9% rate. The spread of the COVID-19 virus and its variants could continue to slow economic recovery, but local governments are expected to benefit in the near-term from federal stimulus grants, the strong real estate market, and the overall increase in state spending.
California’s credit quality is strong. At the end of the reporting period, the state’s general obligation ratings were AA from Fitch Ratings, Aa2 by Moody’s Investors Service, and AA- by S&P Global Ratings with all ratings assigned stable outlooks.
Management views may have changed since the report date.
Schwab Municipal Bond Funds | Annual Report
Schwab Municipal Bond Funds
 | Kenneth Salinger, CFA, Managing Director and Head of Tax-Exempt Bond Strategies, leads the portfolio management team for the Schwab Municipal Bond Funds. He also has overall responsibility for all aspects of the management of the funds. Prior to joining Schwab in 2008, Mr. Salinger was a senior portfolio manager at Wells Capital Management, working on a team that managed municipal bond assets. He worked at American Century Investments from 1992 to 2006, where he was a vice president and senior portfolio manager, responsible for daily management of a number of national and state-specific municipal bond funds. Mr. Salinger has worked in fixed-income asset management since 1994. |
 | James Cortez, CFA, Portfolio Manager, is responsible for the day-to-day co-management of the Schwab Tax-Free Bond Fund and Schwab California Tax-Free Bond Fund. Mr. Cortez joined the firm in 2006 as a director on Schwab Asset Management’s municipal research team, responsible for conducting credit research for municipal fixed-income funds and money market funds with a focus on healthcare and higher education credits. Prior to joining Schwab in 2006, Mr. Cortez was an associate director in Standard & Poor’s healthcare group. |
 | Jason D. Diefenthaler, Senior Portfolio Manager and the Head of Wasmer Schroeder Municipal Bond Strategies at Schwab Asset Management, is responsible for the day-to-day co-management of the Schwab Opportunistic Municipal Bond Fund. Previously, Mr. Diefenthaler was the director of tax-exempt portfolio management at Wasmer Schroeder & Company, LLC (Schwab Asset Management became the investment adviser for the Wasmer Schroeder Strategies in 2020). He oversaw all tax-exempt strategies and the management of the Wasmer Schroeder High Yield Municipal Fund, which subsequently reorganized into the Schwab Opportunistic Municipal Bond Fund. Mr. Diefenthaler began his career with Wasmer Schroeder in 2000. He was a credit analyst for taxable and tax-exempt strategies before becoming a portfolio manager. |
 | John Khodarahmi, Senior Portfolio Manager, is responsible for the day-to-day co-management of the Schwab Tax-Free Bond Fund and Schwab California Tax-Free Bond Fund. Prior to joining Schwab in 2015, Mr. Khodarahmi was a vice president and senior municipal trader at Eaton Vance Management for the firm’s tax-free bond funds since 2002. Previous to Eaton Vance, he was a vice president at both Banc of America Montgomery Securities and Thomas Weisel Partners, and also spent time as a corporate cash and high net worth portfolio manager/trader at Thomas Weisel. Prior to those roles, Mr. Khodarahmi was a municipal trader and underwriter for Fleet Securities, Inc. (now part of Bank of America). |
Schwab Municipal Bond Funds | Annual Report
Schwab Tax-Free Bond Fund as of August 31, 2021
The Schwab Tax-Free Bond Fund (the fund) seeks high current income that is exempt from federal income tax, consistent with capital preservation. To pursue its goal, the fund primarily invests in investment-grade municipal securities (munis)—those in the four highest credit rating categories (rated AAA to BBB- or the unrated equivalent as determined by the investment adviser). The fund normally invests at least 80% of its net assets (including, for this purpose, any borrowings for investment purposes) in munis the interest from which is exempt from federal income tax, including the federal alternative minimum tax. For more information on the fund’s investment objective and principal investment strategies, please see the fund’s prospectus.
Market Highlights. For the 12-month reporting period ended August 31, 2021, muni bonds generated positive returns. Despite persistent COVID-19 pandemic-driven stresses on the U.S. economy and a resurgence of COVID-19 cases in the fall and into the winter, along with the emergence and rapid spread of the Delta variant during the summer, equity markets continued to rise, with several key equity market indices ending the reporting period just off record highs. Markets continued to be buoyed by the extensive emergency rescue and fiscal stimulus measures passed by the U.S. Congress and U.S. Federal Reserve (Fed) beginning in March 2020 in response to the onset of the COVID-19 pandemic. Over the reporting period, the Fed maintained the federal funds rate in a range of 0.00% to 0.25%. By the end of the reporting period, the Fed indicated that it would likely begin reducing its bond purchases as early as late 2021 on signs of a strengthening economy and rising inflation, despite ongoing challenges. Taxable bond yields were relatively flat for the first four months of the period before demand waned in January and February and yields rose. Demand began to recover over the second half of the reporting period.
U.S. Treasury yields generally remained low. The yield on the 10-year U.S. Treasury began the reporting period at 0.72% and ended the reporting period at 1.30%. The yield on the three-month U.S. Treasury began the period at 0.11% and ended the reporting period at 0.04%.
As investors sought tax-exempt yield in the ongoing and extraordinarily low interest rate environment, as well as the potential of future higher taxes, muni demand—and prices—rose steadily throughout most of the reporting period, driving yields lower. (Bond yields and bond prices typically move in opposite directions.) As demand rose, muni bond issuers—many of whom weathered the COVID-19 pandemic better than expected—took advantage of low interest rates to increase issuance. Despite their added risk, high-yield muni bonds were in particular demand, significantly outperforming high-quality muni bonds.
Performance. The fund returned 3.03% for the 12-month period ended August 31, 2021, compared with the Bloomberg Municipal 3-15 Year Blend Index (the comparative index), which returned 2.73%.
Positioning and Strategies. The fund generally maintains a sensitivity to interest rates within a conservative range to limit unexpected performance swings. The fund’s duration, a measure of interest-rate sensitivity, was generally long in relation to the fund’s index as well as to the fund’s peers. The fund’s duration trended lower toward the end of the reporting period. Throughout most of the reporting period the fund maintained a somewhat “barbelled” position relative to the index, with a heavier concentration of securities with shorter and longer maturities and a smaller percentage of intermediate-term securities.
The fund increased its exposure to lower-rated securities during the reporting period, raising the fund’s credit exposure relative to its comparative index, which contributed to the fund’s relative performance. As compared to its peers, however, the fund remained underweight to credit exposure. The fund’s portfolio managers continue to monitor credit developments to assess risk and opportunity.
Management views and portfolio holdings may have changed since the report date.
Schwab Municipal Bond Funds | Annual Report
Schwab Tax-Free Bond Fund
Performance and Fund Facts as of August 31, 2021
Portfolio Composition % of investments
These charts show two different views of the fund’s portfolio: by type of security and credit quality of the security.
By Security Type
| Weighted Average Maturity1 | 5.6 Yrs |
| Weighted Average Duration1 | 5.6 Yrs |
Portfolio holdings may have changed since the report date.
| 1 | See Glossary for definitions of maturity and duration. |
| 2 | Bloomberg Index Rating: Based on the middle rating of Moody’s, S&P and Fitch; when a rating from only two agencies is available, the lower is used; when only one agency rates a bond, that rating is used. In cases where explicit bond level ratings may not be available, other sources may be used to classify securities by credit quality. Source: Bloomberg Index Service Ltd. |
Schwab Municipal Bond Funds | Annual Report
Schwab Tax-Free Bond Fund
Performance and Fund Facts as of August 31, 2021 (continued)
The performance data quoted represents past performance. Past performance does not guarantee future results. Investment returns and principal value of an investment will fluctuate so that an investor’s shares may be worth more or less than their original cost. Current performance may be lower or higher than performance data quoted. To obtain performance information current to the most recent month end, please visit www.schwabassetmanagement.com/schwabfunds_prospectus.
Performance of Hypothetical $10,000 Investment (August 31, 2011 – August 31, 2021)1,2
Average Annual Returns1,2
| Fund and Inception Date | 1 Year | 5 Years | 10 Years |
| Fund: Schwab Tax-Free Bond Fund (9/11/92) | 3.03% | 2.71% | 3.30% |
| Bloomberg Municipal 3-15 Year Blend Index | 2.73% | 3.08% | 3.61% |
| Fund Category: Morningstar Municipal National Intermediate Bond 3 | 3.80% | 2.80% | 3.44% |
| Fund Expense Ratios4: Net 0.49%; Gross 0.55% |
| 30-Day SEC Yield1,2 | 0.53% |
| 30-Day SEC Yield-No Waiver1,5 | 0.51% |
| Taxable Equivalent Yield6 | 0.89% |
| 12-Month Distribution Yield1,2 | 1.71% |
All total returns on this page assume dividends and distributions were reinvested. Index figures do not include trading and management costs, which would lower performance. Indices are unmanaged and cannot be invested in directly. Performance results less than one year are not annualized.
For index definitions, please see the Glossary.
| 1 | Performance does not reflect the deduction of taxes that a shareholder would pay on fund distributions or on the redemption of fund shares. |
| 2 | Fund expenses may have been partially absorbed by the investment adviser and its affiliates. Without these reductions, the total return/yield may have been lower. |
| 3 | Source for category information: Morningstar, Inc. The Morningstar Category return represents all active and index mutual funds within the category as of the report date. |
| 4 | As stated in the prospectus. Net Expense: Expenses reduced by a contractual fee waiver in effect for so long as CSIM serves as adviser to the fund. Gross Expense: Does not reflect the effect of contractual fee waivers. For actual expense ratios during the period, refer to the Financial Highlights section of the financial statements. |
| 5 | Yield if fund expenses had not been partially absorbed by the investment adviser and its affiliates. |
| 6 | Taxable equivalent yield assumes a federal regular income tax rate of 40.80%, which includes a Medicare surcharge rate of 3.8%. Your tax rate may be different. |
Schwab Municipal Bond Funds | Annual Report
Schwab California Tax-Free Bond Fund as of August 31, 2021
The Schwab California Tax-Free Bond Fund (the fund) seeks high current income exempt from federal and California personal income tax that is consistent with capital preservation. To pursue its goal, the fund primarily invests in investment-grade municipal securities (munis)—those in the four highest credit rating categories (rated AAA to BBB- or the unrated equivalent as determined by the investment adviser) from California issuers. The fund normally invests at least 80% of its net assets (including, for this purpose, any borrowings for investment purposes) in munis the interest from which is exempt from federal and California personal income tax and federal alternative minimum tax. For more information on the fund’s investment objective and principal investment strategies, please see the fund’s prospectus.
Market Highlights. For the 12-month reporting period ended August 31, 2021, muni bonds generated positive returns. Despite persistent COVID-19 pandemic-driven stresses on the U.S. economy and a resurgence of COVID-19 cases in the fall and into the winter, along with the emergence and rapid spread of the Delta variant during the summer, equity markets continued to rise, with several key equity market indices ending the reporting period just off record highs. Markets continued to be buoyed by the extensive emergency rescue and fiscal stimulus measures passed by the U.S. Congress and U.S. Federal Reserve (Fed) beginning in March 2020 in response to the onset of the COVID-19 pandemic. Over the reporting period, the Fed maintained the federal funds rate in a range of 0.00% to 0.25%. By the end of the reporting period, the Fed indicated that it would likely begin reducing its bond purchases as early as late 2021 on signs of a strengthening economy and rising inflation, despite ongoing challenges. Taxable bond yields were relatively flat for the first four months of the period before demand waned in January and February and yields rose. Demand began to recover over the second half of the reporting period.
U.S. Treasury yields generally remained low. The yield on the 10-year U.S. Treasury began the reporting period at 0.72% and ended the reporting period at 1.30%. The yield on the three-month U.S. Treasury began the period at 0.11% and ended the reporting period at 0.04%.
As investors sought tax-exempt yield in the ongoing and extraordinarily low interest rate environment, as well as the potential of future higher taxes, muni demand—and prices—rose steadily throughout most of the reporting period, driving yields lower. (Bond yields and bond prices typically move in opposite directions.) As demand rose, muni bond issuers—many of whom weathered the COVID-19 pandemic better than expected—took advantage of low interest rates to increase issuance. Despite their added risk, high-yield muni bonds were in particular demand, significantly outperforming high-quality muni bonds.
Performance. The fund returned 2.25% for the 12-month period ended August 31, 2021, compared with the Bloomberg California Municipal 3-15 Year Blend Index (the comparative index), which returned 1.98%.
Positioning and Strategies. The fund generally maintains a sensitivity to interest rates within a conservative range to limit unexpected performance swings. The fund’s duration, a measure of interest-rate sensitivity, was generally long in relation to the fund’s index as well as to the fund’s peers. The fund’s duration trended lower toward the end of the reporting period. Throughout most of the reporting period the fund maintained a somewhat “barbelled” position relative to the index, with a heavier concentration of securities with shorter and longer maturities and a smaller percentage of intermediate-term securities.
The fund increased its exposure to lower-rated securities during the reporting period, raising the fund’s credit exposure relative to its comparative index, which contributed to the fund’s relative performance. As compared to its peers, however, the fund remained underweight to credit exposure. The fund’s portfolio managers continue to monitor credit developments to assess risk and opportunity.
Management views and portfolio holdings may have changed since the report date.
Schwab Municipal Bond Funds | Annual Report
Schwab California Tax-Free Bond Fund
Performance and Fund Facts as of August 31, 2021
Portfolio Composition % of investments
These charts show two different views of the fund’s portfolio: by type of security and credit quality of the security.
By Security Type
| Weighted Average Maturity1 | 5.2 Yrs |
| Weighted Average Duration1 | 5.6 Yrs |
Portfolio holdings may have changed since the report date.
| 1 | See Glossary for definitions of maturity and duration. |
| 2 | Bloomberg Index Rating: Based on the middle rating of Moody’s, S&P and Fitch; when a rating from only two agencies is available, the lower is used; when only one agency rates a bond, that rating is used. In cases where explicit bond level ratings may not be available, other sources may be used to classify securities by credit quality. Source: Bloomberg Index Service Ltd. |
Schwab Municipal Bond Funds | Annual Report
Schwab California Tax-Free Bond Fund
Performance and Fund Facts as of August 31, 2021 (continued)
The performance data quoted represents past performance. Past performance does not guarantee future results. Investment returns and principal value of an investment will fluctuate so that an investor’s shares may be worth more or less than their original cost. Current performance may be lower or higher than performance data quoted. To obtain performance information current to the most recent month end, please visit www.schwabassetmanagement.com/schwabfunds_prospectus.
Performance of Hypothetical $10,000 Investment (August 31, 2011 – August 31, 2021)1,2
Average Annual Returns1,2
| Fund and Inception Date | 1 Year | 5 Years | 10 Years |
| Fund: Schwab California Tax-Free Bond Fund (2/24/92) | 2.25% | 2.46% | 3.37% |
| Bloomberg California Municipal 3-15 Year Blend Index 3 | 1.98% | N/A 4 | N/A 4 |
| S&P California AMT-Free Municipal Bond Index | 2.22% | 2.92% | 4.18% |
| Fund Category: Morningstar Municipal California Intermediate/Short Bond 5 | 2.93% | 2.33% | 3.34% |
| Fund Expense Ratios6: Net 0.49%; Gross 0.58% |
| 30-Day SEC Yield1,2 | 0.37% |
| 30-Day SEC Yield-No Waiver1,7 | 0.32% |
| Taxable Equivalent Yield8 | 0.80% |
| 12-Month Distribution Yield1,2 | 1.64% |
All total returns on this page assume dividends and distributions were reinvested. Index figures do not include trading and management costs, which would lower performance. Indices are unmanaged and cannot be invested in directly. Performance results less than one year are not annualized.
The first index listed for the fund is the fund’s primary benchmark, as shown in the prospectus. Additional indices shown are provided for comparative purposes.
For index definitions, please see the Glossary.
| 1 | Performance does not reflect the deduction of taxes that a shareholder would pay on fund distributions or on the redemption of fund shares. |
| 2 | Fund expenses may have been partially absorbed by the investment adviser and its affiliates. Without these reductions, the total return/yield may have been lower. |
| 3 | The Bloomberg California Municipal 3-15 Year Blend Index was established effective January 1, 2020. Performance shown prior to January 1, 2020 is based on a subset of securities included in the Bloomberg Municipal 3-15 Year Blend Index. |
| 4 | Information not available to the fund. |
| 5 | Source for category information: Morningstar, Inc. The Morningstar Category return represents all active and index mutual funds within the category as of the report date. |
| 6 | As stated in the prospectus. Net Expense: Expenses reduced by a contractual fee waiver in effect for so long as CSIM serves as adviser to the fund. Gross Expense: Does not reflect the effect of contractual fee waivers. For actual expense ratios during the period, refer to the Financial Highlights section of the financial statements. |
| 7 | Yield if fund expenses had not been partially absorbed by the investment adviser and its affiliates. |
| 8 | Taxable equivalent yield assumes a federal regular income tax rate of 40.80%, which includes a Medicare surcharge rate of 3.8%, and effective California state personal income tax rate of 13.30%. Your tax rate may be different. |
Schwab Municipal Bond Funds | Annual Report
Schwab Opportunistic Municipal Bond Fund as of August 31, 2021
The Schwab Opportunistic Municipal Bond Fund (the fund) seeks to generate interest income that is not subject to federal income tax. To pursue its goal, the fund invests at least 80% of its net assets (including, for this purpose, any borrowings for investment purposed) in municipal securities (munis), including debt obligations of U.S. states, territories, counties, cities, political subdivisions, government agencies and instrumentalities that pay interest not subject to regular federal income tax. Some munis in which the fund invests may pay interest that is not exempt from the federal alternative minimum tax. For more information on the fund’s investment objective and principal investment strategies, please see the fund’s prospectus.
Market Highlights. For the 12-month reporting period ended August 31, 2021, muni bonds generated positive returns. Despite persistent COVID-19 pandemic-driven stresses on the U.S. economy and a resurgence of COVID-19 cases in the fall and into the winter, along with the emergence and rapid spread of the Delta variant during the summer, equity markets continued to rise, with several key equity market indices ending the reporting period just off record highs. Markets continued to be buoyed by the extensive emergency rescue and fiscal stimulus measures passed by the U.S. Congress and U.S. Federal Reserve (Fed) beginning in March 2020 in response to the onset of the COVID-19 pandemic. Over the reporting period, the Fed maintained the federal funds rate in a range of 0.00% to 0.25%. By the end of the reporting period, the Fed indicated that it would likely begin reducing its bond purchases as early as late 2021 on signs of a strengthening economy and rising inflation, despite ongoing challenges. Taxable bond yields were relatively flat for the first four months of the period before demand waned in January and February and yields rose. Demand began to recover over the second half of the reporting period.
U.S. Treasury yields generally remained low. The yield on the 10-year U.S. Treasury began the reporting period at 0.72% and ended the reporting period at 1.30%. The yield on the three-month U.S. Treasury began the period at 0.11% and ended the reporting period at 0.04%.
As investors sought tax-exempt yield in the ongoing and extraordinarily low interest rate environment, as well as the potential of future higher taxes, muni demand—and prices—rose steadily throughout most of the reporting period, driving yields lower. (Bond yields and bond prices typically move in opposite directions.) As demand rose, muni bond issuers—many of whom weathered the COVID-19 pandemic better than expected—took advantage of low interest rates to increase issuance. Despite their added risk, high-yield muni bonds were in particular demand, significantly outperforming high-quality muni bonds.
Performance. The fund returned 5.26%* for the 12-month period ended August 31, 2021. On July 1, 2021, the fund changes it comparative index from the Bloomberg Municipal High Yield Index, which returned 12.17% for the 12-month reporting period, to the Bloomberg Municipal Bond Index (the comparative index), which returned 3.40%.
Positioning and Strategies. The fund’s duration, a measure of interest-rate sensitivity, was shorter than its comparative index throughout most of the reporting period (when its comparative index was the Bloomberg Municipal High Yield Index). The fund’s duration was extended later in the reporting period, resulting a slightly longer duration than the Bloomberg Municipal Bond Index. Effective July 1, 2021, the fund changed its comparative index to the Bloomberg Municipal Bond Index, which resulted in a slightly longer duration as compared to that comparative index. In addition, to align the fund with changes to its investment strategies, the fund’s credit risk was modestly reduced over the reporting period through selling lower-rated securities and buying higher-rated ones. The fund’s portfolio managers continue to monitor credit developments to assess risk and opportunity.
Management views and portfolio holdings may have changed since the report date.
| * | Total return for the report period above differs from the return in the Financial Highlights. The total return presented above is calculated based on the net asset value (NAV) at which shareholder transactions were processed. The total return presented in the Financial Highlights section of the report is calculated in the same manner, but also takes into account certain adjustments that are necessary under generally accepted accounting principles required in the annual and semiannual reports. |
Schwab Municipal Bond Funds | Annual Report
Schwab Opportunistic Municipal Bond Fund
Performance and Fund Facts as of August 31, 2021
Portfolio Composition % of investments
These charts show two different views of the fund’s portfolio: by type of security and credit quality of the security.
By Security Type
| Weighted Average Maturity1 | 6.1 Yrs |
| Weighted Average Duration1 | 7.3 Yrs |
Portfolio holdings may have changed since the report date.
| 1 | See Glossary for definitions of maturity and duration. |
| 2 | Bloomberg Index Rating: Based on the middle rating of Moody’s, S&P and Fitch; when a rating from only two agencies is available, the lower is used; when only one agency rates a bond, that rating is used. In cases where explicit bond level ratings may not be available, other sources may be used to classify securities by credit quality. Source: Bloomberg Index Service Ltd. |
Schwab Municipal Bond Funds | Annual Report
Schwab Opportunistic Municipal Bond Fund
Performance and Fund Facts as of August 31, 2021 (continued)
The performance data quoted represents past performance. Past performance does not guarantee future results. Investment returns and principal value of an investment will fluctuate so that an investor’s shares may be worth more or less than their original cost. Current performance may be lower or higher than performance data quoted. To obtain performance information current to the most recent month end, please visit www.schwabassetmanagement.com/schwabfunds_prospectus.
Performance of Hypothetical $10,000 Investment (March 31, 2014 – August 31, 2021)1,2,3
Average Annual Returns1,2,3
| Fund and Inception Date | 1 Year | 5 Years | Since Inception |
| Fund: Schwab Opportunistic Municipal Bond Fund (3/31/14)4 | 5.26% 5 | 3.15% | 5.18% |
| Bloomberg Municipal Bond Index 6 | 3.40% | 3.30% | 4.03% |
| Bloomberg High Yield Municipal Index | 12.17% | 6.19% | 6.65% |
| Fund Category: Morningstar High Yield Muni 7 | 9.23% | 4.33% | N/A |
| Fund Expense Ratios8: Net 0.50%; Gross 0.63% |
| 30-Day SEC Yield1,2 | 1.67% |
| 30-Day SEC Yield-No Waiver1,9 | 1.56% |
| Taxable Equivalent Yield10 | 2.82% |
| 12-Month Distribution Yield1,2 | 2.45% |
All total returns on this page assume dividends and distributions were reinvested. Index figures do not include trading and management costs, which would lower performance. Indices are unmanaged and cannot be invested in directly. Performance results less than one year are not annualized.
The first index listed for the fund is the fund’s primary benchmark, as shown in the prospectus. Additional indices shown are provided for comparative purposes.
For index definitions, please see the Glossary.
| 1 | Performance does not reflect the deduction of taxes that a shareholder would pay on fund distributions or on the redemption of fund shares. |
| 2 | Fund expenses may have been partially absorbed by the investment adviser and its affiliates. Without these reductions, the total return/yield may have been lower. |
| 3 | Effective August 10, 2020, the Wasmer Schroeder High Yield Municipal Fund (the predecessor fund) was reorganized into the Schwab Opportunistic Municipal Bond Fund. The performance and financial history prior to August 10, 2020 are that of the predecessor fund. |
| 4 | Inception date is that of the predecessor fund. |
| 5 | Total return for the report period presented in the table differs from the return in the Financial Highlights. The total return presented in the above table is calculated based on the NAV at which shareholder transactions were processed. The total return presented in the Financial Highlights section of the report is calculated in the same manner, but also takes into account certain adjustments that are necessary under generally accepted accounting principles required in the annual and semiannual reports. |
| 6 | Effective July 1, 2021, the fund changed its primary benchmark index from the Bloomberg High Yield Municipal Index to the Bloomberg Municipal Bond Index. CSIM believes the benchmark indices change provides a more appropriate comparison for evaluating the fund’s performance. |
| 7 | Source for category information: Morningstar, Inc. The Morningstar Category return represents all active and index mutual funds within the category as of the report date. |
| 8 | As stated in the prospectus. Effective July 1, 2021, the management fee was reduced to 0.40%. For more information, see financial note 4 or refer to the prospectus. Net Expense: Expenses reduced by a contractual fee waiver in effect for so long as CSIM serves as adviser to the fund. Gross Expense: Does not reflect the effect of contractual fee waivers. For actual expense ratios during the period, refer to the Financial Highlights section of the financial statements. |
| 9 | Yield if fund expenses had not been partially absorbed by the investment adviser and its affiliates. |
| 10 | Taxable equivalent yield assumes a federal regular income tax rate of 40.80%, which includes a Medicare surcharge rate of 3.8%. Your tax rate may be different. |
Schwab Municipal Bond Funds | Annual Report
Schwab Municipal Bond Funds
Fund Expenses (Unaudited)
Examples for a $1,000 Investment
As a fund shareholder, you may incur two types of costs: (1) transaction costs; and (2) ongoing costs, including management fees, transfer agent and shareholder services fees, and other fund expenses.
The expense examples below are intended to help you understand your ongoing cost (in dollars) of investing in a fund and to compare this cost with the ongoing cost of investing in other mutual funds. These examples are based on an investment of $1,000 invested for six months beginning March 1, 2021 and held through August 31, 2021.
Actual Return lines in the table below provide information about actual account values and actual expenses. You may use this information, together with the amount you invested, to estimate the expenses that you paid over the period. To do so, simply divide your account value by $1,000 (for example, an $8,600 account value ÷ $1,000 = 8.6), then multiply the result by the number given for your fund under the heading entitled “Expenses Paid During Period.”
Hypothetical Return lines in the table below provide information about hypothetical account values and hypothetical expenses based on a fund’s actual expense ratio and an assumed return of 5% per year before expenses. Because the return used is not an actual return, it may not be used to estimate the actual ending account value or expenses you paid for the period.
You may use this information to compare the ongoing costs of investing in a fund and other funds. To do so, compare this 5% hypothetical example with the 5% hypothetical examples that appear in the shareholder reports of the other funds.
Please note that the expenses shown in the table are meant to highlight your ongoing costs only, and do not reflect any transactional costs. Therefore, the hypothetical return lines of the table are useful in comparing ongoing costs only, and will not help you determine the relative total costs of owning different funds. In addition, if these transactional costs were included, your costs would have been higher.
| | Expense Ratio
(Annualized)1 | Beginning
Account Value
at 3/1/21 | Ending
Account Value
(Net of Expenses)
at 8/31/21 | Expenses Paid
During Period
3/1/21-8/31/212 |
| Schwab Tax-Free Bond Fund | | | | |
| Actual Return | 0.49% | $1,000.00 | $1,022.40 | $2.50 |
| Hypothetical 5% Return | 0.49% | $1,000.00 | $1,022.73 | $2.50 |
| Schwab California Tax-Free Bond Fund | | | | |
| Actual Return | 0.49% | $1,000.00 | $1,019.50 | $2.49 |
| Hypothetical 5% Return | 0.49% | $1,000.00 | $1,022.73 | $2.50 |
| Schwab Opportunistic Municipal Bond Fund3 | | | | |
| Actual Return | 0.57% | $1,000.00 | $1,031.40 | $2.92 |
| Hypothetical 5% Return | 0.57% | $1,000.00 | $1,022.33 | $2.91 |
| 1 | Based on the most recent six-month expense ratio; may differ from the expense ratio provided in the Financial Highlights. |
| 2 | Expenses for each fund are equal to its annualized expense ratio, multiplied by the average account value over the period, multiplied by 184 days of the period, and divided by 365 days of the fiscal year. |
| 3 | Effective July 1, 2021, the Schwab Opportunistic Municipal Bond Fund’s net operating expense limitation was reduced to 0.50%. If the fund expense change had been in place throughout the most recent fiscal half-year, the expenses paid during the period under the actual return and hypothetical 5% return would have been $2.56 and $2.55 (see financial note 4). |
Schwab Municipal Bond Funds | Annual Report
Schwab Tax-Free Bond Fund
Financial Statements
Financial Highlights
| | 9/1/20–
8/31/21 | 9/1/19–
8/31/20 | 9/1/18–
8/31/19 | 9/1/17–
8/31/18 | 9/1/16–
8/31/17 | |
| Per-Share Data |
| Net asset value at beginning of period | $12.13 | $12.12 | $11.52 | $11.82 | $12.13 | |
| Income (loss) from investment operations: | | | | | | |
| Net investment income (loss)1 | 0.21 | 0.26 | 0.28 | 0.27 | 0.27 | |
| Net realized and unrealized gains (losses) | 0.16 | 0.04 2 | 0.60 | (0.30) | (0.21) | |
| Total from investment operations | 0.37 | 0.30 | 0.88 | (0.03) | 0.06 | |
| Less distributions: | | | | | | |
| Distributions from net investment income | (0.21) | (0.26) | (0.28) | (0.27) | (0.27) | |
| Distributions from net realized gains | (0.07) | (0.03) | — | — | (0.10) | |
| Total distributions | (0.28) | (0.29) | (0.28) | (0.27) | (0.37) | |
| Net asset value at end of period | $12.22 | $12.13 | $12.12 | $11.52 | $11.82 | |
| Total return | 3.03% | 2.52% | 7.77% | (0.22%) | 0.63% | |
| Ratios/Supplemental Data |
| Ratios to average net assets: | | | | | | |
| Net operating expenses | 0.49% | 0.49% | 0.49% | 0.49% | 0.49% | |
| Gross operating expenses | 0.55% | 0.55% | 0.56% | 0.57% | 0.56% | |
| Net investment income (loss) | 1.72% | 2.14% | 2.41% | 2.35% | 2.32% | |
| Portfolio turnover rate | 53% | 99% | 129% | 82% | 83% | |
| Net assets, end of period (x 1,000,000) | $801 | $758 | $751 | $650 | $667 | |
| |
1
Calculated based on the average shares outstanding during the period.
2
The per share amount does not accord with the change in aggregate gains and losses in securities during the period because of the timing of sales and repurchases of fund shares in relation to fluctuating market values.
Schwab Municipal Bond Funds | Annual Report
Schwab Tax-Free Bond Fund
Portfolio Holdings as of August 31, 2021
This section shows all the securities in the fund’s portfolio and their values as of the report date.
The fund files its complete schedule of portfolio holdings with the U.S. Securities and Exchange Commission (SEC) for the first and third quarters of each fiscal year on Form N-PORT Part F. The fund’s Form N-PORT Part F is available on the SEC’s website at www.sec.gov. You can also obtain this information at no cost on the fund’s website at www.schwabassetmanagement.com/schwabfunds_prospectus, by calling 1-866-414-6349, or by sending an email request to orders@mysummaryprospectus.com. The fund also makes available its complete schedule of portfolio holdings 15 to 20 days after the end of the month on the fund’s website.
For fixed-rate obligations, the rate shown is the interest rate (the rate established when the obligation was issued). For variable-rate obligations, the rate shown is the rate as of the report date based on each security’s rate reset date. The reference rate and spread used is shown parenthetically in the security description, if available; if not, the reference rate is described in a footnote. The maturity date shown for all the securities is the final legal maturity.
Issuer
Type of Security, Series | Rate | | Maturity | Face
Amount ($) | Value ($) |
| Fixed-Rate Obligations 87.1% of net assets |
| ALABAMA 1.4% |
| Montgomery Cnty |
| GO Refunding Warrants Series 2021A | 4.00% | | 03/01/27 | 1,000,000 | 1,186,888 |
| Pell Special Care Facilities Financing Auth |
| RB (Noland Health Services) Series 2016A | 5.00% | | 12/01/31 (a) | 2,000,000 | 2,020,216 |
| Southeast Energy Auth | | | |
| Commodity Supply RB Series 2021B1 | 4.00% | | 06/01/30 (a) | 2,000,000 | 2,455,970 |
| Commodity Supply RB Series 2021B1 | 4.00% | | 06/01/31 (a) | 1,850,000 | 2,301,127 |
| Univ of Montevallo | | | |
| RB Series 2017 | 5.00% | | 05/01/26 | 200,000 | 240,196 |
| RB Series 2017 | 5.00% | | 05/01/27 | 250,000 | 308,870 |
| RB Series 2017 | 5.00% | | 05/01/42 (a) | 2,150,000 | 2,580,664 |
| | | | | | 11,093,931 |
| ARIZONA 0.3% |
| Arizona Health Facilities Auth |
| RB (Phoenix Childrens Hospital) Series 2013B | 5.00% | | 02/01/43 (a) | 1,000,000 | 1,062,103 |
| Tucson | | | |
| Refunding COP Series 2014 | 4.00% | | 07/01/22 | 700,000 | 722,796 |
| Refunding COP Series 2014 | 4.00% | | 07/01/23 | 700,000 | 749,820 |
| | | | | | 2,534,719 |
| ARKANSAS 1.5% |
| Bella Vista |
| Sales & Use Tax Bonds Series 2020 | 1.13% | | 10/01/45 (a) | 2,750,000 | 2,766,781 |
| Bentonville Sales & Use Tax |
| Sales & Use Tax Refunding RB Series 2021B | 1.05% | | 11/01/46 (a) | 1,605,000 | 1,592,558 |
| Fayetteville |
| Sales Tax RB Series 2019A | 1.60% | | 11/01/35 (a) | 175,000 | 174,628 |
| Forrest City |
| Sales & Use Tax RB Series 2021 | 1.55% | | 11/01/44 (a) | 1,000,000 | 983,578 |
| Little Rock | | | |
| Sewer Refunding RB Series 2015 | 3.00% | | 04/01/23 | 735,000 | 767,477 |
| Sewer Refunding RB Series 2015 | 3.00% | | 04/01/24 | 560,000 | 595,289 |
| Marion |
| Sales & Use Tax RB Series 2017 | 2.90% | | 09/01/47 (a) | 320,000 | 323,246 |
Schwab Municipal Bond Funds | Annual Report
Schwab Tax-Free Bond Fund
Portfolio Holdings as of August 31, 2021 (continued)
Issuer
Type of Security, Series | Rate | | Maturity | Face
Amount ($) | Value ($) |
| Rogers |
| Sales & Use Tax Bonds Series 2018B | 3.25% | | 11/01/43 (a) | 2,580,000 | 2,713,292 |
| Sherwood |
| Sales & Use Tax Bonds Series 2018 | 3.05% | | 12/01/43 (a) | 335,000 | 345,825 |
| Springdale |
| Sales & Use Tax Refunding & Improvement Bonds Series 2018 | 3.00% | | 04/01/43 (a) | 1,500,000 | 1,538,611 |
| | | | | | 11,801,285 |
| CALIFORNIA 9.2% |
| Anaheim Housing & Public Improvement Auth |
| Electric System Refunding RB Series 2016 | 5.00% | | 10/01/41 (a)(b) | 640,000 | 642,477 |
| California | | | |
| GO Bonds | 5.00% | | 08/01/24 | 1,000,000 | 1,140,095 |
| GO Bonds | 3.00% | | 03/01/26 | 5,000,000 | 5,590,329 |
| GO Bonds | 5.00% | | 03/01/27 (a) | 2,600,000 | 3,024,035 |
| GO Refunding Bonds | 5.00% | | 12/01/26 (c) | 10,000,000 | 12,361,307 |
| GO Refunding Bonds | 5.00% | | 09/01/41 (a)(d) | 2,250,000 | 2,998,124 |
| GO Refunding Bonds Series 2017 | 5.00% | | 08/01/32 (a) | 590,000 | 715,183 |
| California Health Facilities Financing Auth |
| Refunding RB (Lucile Salter Packard Childrens Hospital) Series 2022A | 4.00% | | 05/15/51 (a)(d) | 1,000,000 | 1,150,015 |
| California Statewide Communities Development Auth | | | |
| Hospital Refunding RB (Methodist Hospital of Southern California) Series 2018 | 5.00% | | 01/01/23 | 455,000 | 482,493 |
| Hospital Refunding RB (Methodist Hospital of Southern California) Series 2018 | 5.00% | | 01/01/24 | 600,000 | 662,437 |
| Hospital Refunding RB (Methodist Hospital of Southern California) Series 2018 | 5.00% | | 01/01/25 | 1,000,000 | 1,145,601 |
| Hospital Refunding RB (Methodist Hospital of Southern California) Series 2018 | 5.00% | | 01/01/26 | 1,050,000 | 1,242,641 |
| RB (Loma Linda Univ Medical Center) Series 2016A | 5.00% | | 12/01/36 (a) | 1,500,000 | 1,703,674 |
| RB (Loma Linda Univ Medical Center) Series 2018A | 5.25% | | 12/01/43 (a) | 1,065,000 | 1,259,145 |
| Hastings Campus Housing Financing Auth |
| Campus Housing RB Series 2020A | 5.00% | | 07/01/45 (a) | 3,700,000 | 4,476,693 |
| Jurupa Public Finance Auth | | | |
| Special Tax RB Series 2014A | 5.00% | | 09/01/21 | 450,000 | 450,000 |
| Special Tax RB Series 2014A | 5.00% | | 09/01/22 | 60,000 | 62,764 |
| Los Angeles Dept of Airports |
| Sub RB Series 2019F | 5.00% | | 05/15/28 | 2,115,000 | 2,677,263 |
| Lynwood USD | | | |
| GO Bonds Series E | 0.00% | | 08/01/42 (a)(e) | 1,380,000 | 829,830 |
| GO Bonds Series E | 0.00% | | 08/01/44 (a)(e) | 4,640,000 | 2,619,701 |
| Oakland USD | | | |
| GO Bonds Series 2015A | 5.00% | | 08/01/27 (a) | 1,295,000 | 1,523,679 |
| GO Bonds Series 2015A | 5.00% | | 08/01/28 (a) | 1,000,000 | 1,176,160 |
| Oroville |
| RB (Oroville Hospital) Series 2019 | 5.25% | | 04/01/49 (a) | 2,700,000 | 3,008,052 |
| Pasadena |
| Refunding COP Series 2015A | 5.00% | | 02/01/29 (a) | 585,000 | 676,612 |
| Pleasant Valley SD |
| GO Refunding Bonds Series 2002A | 5.85% | | 08/01/31 | 3,000,000 | 3,789,980 |
| Rancho Cucamonga Successor Redevelopment Agency |
| Tax Allocation Refunding Bonds Series 2014 | 5.00% | | 09/01/26 (a) | 755,000 | 857,153 |
Schwab Municipal Bond Funds | Annual Report
Schwab Tax-Free Bond Fund
Portfolio Holdings as of August 31, 2021 (continued)
Issuer
Type of Security, Series | Rate | | Maturity | Face
Amount ($) | Value ($) |
| San Bruno Public Finance Auth | | | |
| Lease RB Series 2019 | 5.00% | | 05/01/30 (a) | 460,000 | 598,081 |
| Lease RB Series 2019 | 5.00% | | 05/01/31 (a) | 485,000 | 625,312 |
| San Diego USD | | | |
| GO Bonds Series 2010C | 0.00% | | 07/01/31 (e) | 1,250,000 | 1,104,805 |
| GO Bonds Series 2010C | 0.00% | | 07/01/32 (e) | 1,500,000 | 1,292,902 |
| GO Bonds Series 2010C | 0.00% | | 07/01/33 (e) | 1,000,000 | 839,700 |
| GO Bonds Series 2010C | 0.00% | | 07/01/35 (e) | 1,300,000 | 1,029,273 |
| San Francisco Airport Commission |
| RB 2nd Series 2019E | 5.00% | | 05/01/40 (a) | 2,875,000 | 3,587,956 |
| San Francisco Public Utilities Commission |
| Water RB Series 2017A | 5.00% | | 11/01/36 (a) | 2,685,000 | 3,075,559 |
| Santa Cruz Cnty Successor Redevelopment Agency | | | |
| Tax Allocation Refunding Bonds 2014 | 5.00% | | 09/01/22 | 605,000 | 633,115 |
| Tax Allocation Refunding Bonds 2014 | 5.00% | | 09/01/23 | 375,000 | 410,126 |
| Tax Allocation Refunding Bonds 2014 | 5.00% | | 09/01/24 | 1,060,000 | 1,206,742 |
| Sonoma Valley USD |
| GO Bonds Series 2021 | 4.00% | | 08/01/39 (a) | 1,400,000 | 1,653,662 |
| Stockton Public Financing Auth | | | |
| Water Refunding RB Series 2018A | 5.00% | | 10/01/23 | 300,000 | 329,038 |
| Water Refunding RB Series 2018A | 5.00% | | 10/01/24 | 300,000 | 342,090 |
| Water Refunding RB Series 2018A | 5.00% | | 10/01/25 | 500,000 | 590,261 |
| | | | | | 73,584,065 |
| COLORADO 0.8% |
| Centennial Water & Sanitation District | | | |
| Water & Wastewater RB Series 2019 | 5.00% | | 12/01/34 (a) | 420,000 | 534,744 |
| Water & Wastewater RB Series 2019 | 5.00% | | 12/01/35 (a) | 500,000 | 635,504 |
| Colorado Health Facilities Auth | | | |
| RB (CommonSpirit Health) Series 2019A1 | 4.00% | | 08/01/37 (a) | 1,250,000 | 1,465,244 |
| Refunding RB (Evangelical Lutheran Good Samaritan Society) Series 2017 | 5.00% | | 06/01/31 (a)(b) | 1,250,000 | 1,549,862 |
| Colorado Regional Transportation District | | | |
| RB (Denver Transit Partners) Series 2020A | 5.00% | | 07/15/30 | 300,000 | 392,857 |
| RB (Denver Transit Partners) Series 2020A | 5.00% | | 01/15/31 | 500,000 | 661,585 |
| RB (Denver Transit Partners) Series 2020A | 4.00% | | 07/15/34 (a) | 1,000,000 | 1,212,882 |
| Denver |
| Dedicated Tax RB Series 2018A-2 | 0.00% | | 08/01/31 (a)(e) | 380,000 | 297,835 |
| | | | | | 6,750,513 |
| CONNECTICUT 1.9% |
| Connecticut | | | |
| GO Bonds Series 2020C | 4.00% | | 06/01/33 (a) | 650,000 | 798,971 |
| GO Bonds Series 2020C | 4.00% | | 06/01/34 (a) | 1,000,000 | 1,224,921 |
| GO Bonds Series 2020C | 4.00% | | 06/01/35 (a) | 250,000 | 304,171 |
| GO Bonds Series 2020C | 4.00% | | 06/01/36 (a) | 1,250,000 | 1,512,344 |
| GO Bonds Series 2021A | 4.00% | | 01/15/31 | 2,000,000 | 2,520,808 |
| GO Refunding Bonds Series 2016B | 5.00% | | 05/15/27 (a) | 2,095,000 | 2,532,494 |
| Special Tax Obligation Bonds Series 2020A | 5.00% | | 05/01/25 | 850,000 | 996,267 |
| Special Tax Obligation Bonds Series 2020A | 5.00% | | 05/01/26 | 1,200,000 | 1,452,876 |
Schwab Municipal Bond Funds | Annual Report
Schwab Tax-Free Bond Fund
Portfolio Holdings as of August 31, 2021 (continued)
Issuer
Type of Security, Series | Rate | | Maturity | Face
Amount ($) | Value ($) |
| Univ of Connecticut | | | |
| GO Bonds Series 2019A | 5.00% | | 11/01/34 (a)(f) | 2,000,000 | 2,520,233 |
| GO Bonds Series 2019A | 5.00% | | 11/01/36 (a)(f) | 1,000,000 | 1,255,579 |
| | | | | | 15,118,664 |
| FLORIDA 3.2% |
| Florida Higher Educational Facilities Financing Auth | | | |
| Educational Facilities RB (Florida Institute of Technology) Series 2019 | 5.00% | | 10/01/24 | 375,000 | 422,951 |
| Educational Facilities RB (Florida Institute of Technology) Series 2019 | 5.00% | | 10/01/25 | 450,000 | 523,951 |
| Educational Facilities RB (Florida Institute of Technology) Series 2019 | 5.00% | | 10/01/26 | 765,000 | 917,047 |
| Educational Facilities RB (Florida Institute of Technology) Series 2019 | 5.00% | | 10/01/27 | 685,000 | 840,801 |
| Florida Ports Financing Commission |
| Transportation Trust Fund Refunding RB Series 2011A | 5.00% | | 10/01/28 (a)(b) | 1,500,000 | 1,505,930 |
| Greater Orlando Aviation Auth |
| Airport Facilities RB Series 2019A | 5.00% | | 10/01/26 | 5,000,000 | 6,093,358 |
| Hollywood Community Redevelopment Agency |
| Refunding RB Series 2015 | 5.00% | | 03/01/24 | 3,000,000 | 3,332,812 |
| Jacksonville |
| Health Care Facilities Refunding RB (Baptist Health) Series 2017 | 5.00% | | 08/15/34 (a) | 910,000 | 1,104,952 |
| Miami Beach Health Facilities Auth | | | |
| Hospital Refunding & RB (Mt Sinai Medical Center) Series 2014 | 5.00% | | 11/15/21 | 100,000 | 100,939 |
| Hospital Refunding & RB (Mt Sinai Medical Center) Series 2014 | 5.00% | | 11/15/22 | 150,000 | 158,316 |
| Hospital Refunding & RB (Mt Sinai Medical Center) Series 2014 | 5.00% | | 11/15/24 | 400,000 | 457,177 |
| Hospital Refunding & RB (Mt Sinai Medical Center) Series 2014 | 5.00% | | 11/15/25 (a) | 250,000 | 286,323 |
| Miami-Dade Cnty Expressway Auth | | | |
| Toll System RB Series 2014A | 5.00% | | 07/01/22 | 550,000 | 571,581 |
| Toll System RB Series 2014A | 4.00% | | 07/01/23 | 1,730,000 | 1,843,237 |
| Toll System RB Series 2014A | 5.00% | | 07/01/24 | 625,000 | 704,086 |
| Palm Beach Cnty Health Facilities Auth |
| Hospital Refunding RB (Boca Raton Regional Hospital) Series 2014 | 5.00% | | 12/01/22 (b) | 800,000 | 848,223 |
| Port St. Lucie | | | |
| Utility System Refunding RB Series 2014 | 5.00% | | 09/01/21 | 175,000 | 175,000 |
| Utility System Refunding RB Series 2014 | 5.00% | | 09/01/22 | 485,000 | 508,489 |
| Utility System Refunding RB Series 2014 | 5.00% | | 09/01/23 | 350,000 | 383,522 |
| Tallahassee |
| Consolidated Utility Systems RB Series 2018 | 5.00% | | 10/01/35 (a) | 1,495,000 | 1,761,563 |
| Tampa | | | |
| Tax Allocation RBs (Moffitt Cancer Center) Series 2020A | 0.00% | | 09/01/35 (a)(e) | 1,550,000 | 1,068,147 |
| Tax Allocation RBs (Moffitt Cancer Center) Series 2020A | 0.00% | | 09/01/36 (a)(e) | 800,000 | 528,038 |
| Tax Allocation RBs (Moffitt Cancer Center) Series 2020A | 0.00% | | 09/01/37 (a)(e) | 855,000 | 539,422 |
| Tax Allocation RBs (Moffitt Cancer Center) Series 2020A | 0.00% | | 09/01/38 (a)(e) | 1,000,000 | 602,075 |
| Tax Allocation RBs (Moffitt Cancer Center) Series 2020A | 0.00% | | 09/01/49 (a)(e) | 1,200,000 | 437,812 |
| | | | | | 25,715,752 |
| GEORGIA 1.4% |
| Atlanta Hartsfield-Jackson Airport | | | |
| Airport Refunding RB Series 2020B | 5.00% | | 07/01/27 | 2,500,000 | 3,103,803 |
| Airport Refunding RB Series 2020B | 5.00% | | 07/01/28 | 2,400,000 | 3,045,259 |
| Brookhaven Development Auth |
| RB (Children’s Healthcare of Atlanta) Series 2019A | 5.00% | | 07/01/27 | 1,500,000 | 1,877,840 |
Schwab Municipal Bond Funds | Annual Report
Schwab Tax-Free Bond Fund
Portfolio Holdings as of August 31, 2021 (continued)
Issuer
Type of Security, Series | Rate | | Maturity | Face
Amount ($) | Value ($) |
| Carroll County |
| GO Sales Tax Bonds Series 2021 | 5.00% | | 06/01/27 | 1,000,000 | 1,250,326 |
| Milledgeville-Baldwin Cnty Development Auth |
| RB (Univ of Georgia) Series 2021 | 5.00% | | 06/15/33 (a) | 1,700,000 | 2,283,553 |
| | | | | | 11,560,781 |
| HAWAII 0.2% |
| Hawaii | | | |
| Harbor System RB Series 2020A | 4.00% | | 07/01/34 (a) | 750,000 | 899,162 |
| Harbor System RB Series 2020A | 4.00% | | 07/01/35 (a) | 500,000 | 598,195 |
| | | | | | 1,497,357 |
| IDAHO 0.4% |
| Canyon Cnty SD #139 | | | |
| GO Bonds Series 2019A | 5.00% | | 09/15/26 (f) | 450,000 | 550,444 |
| GO Bonds Series 2019A | 5.00% | | 09/15/27 (f) | 400,000 | 503,264 |
| GO Bonds Series 2019A | 5.00% | | 09/15/28 (f) | 425,000 | 548,467 |
| GO Bonds Series 2019A | 5.00% | | 09/15/29 (a)(f) | 400,000 | 520,412 |
| Nampa SD #131 |
| GO Refunding Bonds Series 2011B | 4.00% | | 08/15/22 (f) | 695,000 | 720,954 |
| | | | | | 2,843,541 |
| ILLINOIS 7.0% |
| Bellwood Village | | | |
| GO Refunding Bonds Series 2014 | 4.00% | | 12/01/21 | 500,000 | 504,541 |
| GO Refunding Bonds Series 2014 | 5.00% | | 12/01/32 (a) | 1,705,000 | 1,953,583 |
| GO Refunding Bonds Series 2016B | 5.00% | | 12/01/28 (a) | 1,855,000 | 2,274,638 |
| Chicago | | | |
| GO Bonds Series 2019A | 5.50% | | 01/01/35 (a) | 1,450,000 | 1,841,785 |
| OHare General Airport Sr Lien Refunding RB Series 2012A | 5.00% | | 01/01/25 (a)(b) | 290,000 | 294,606 |
| OHare General Airport Sr Lien Refunding RB Series 2012A | 5.00% | | 01/01/33 (a) | 400,000 | 469,698 |
| OHare General Airport Sr Lien Refunding RB Series 2015B | 5.00% | | 01/01/28 (a) | 1,750,000 | 2,009,810 |
| OHare General Airport Sr Lien Refunding RB Series 2015B | 5.00% | | 01/01/29 (a) | 1,135,000 | 1,303,099 |
| OHare General Airport Sr Lien Refunding RB Series 2016C | 5.00% | | 01/01/29 (a) | 400,000 | 474,070 |
| OHare General Airport Sr Lien Refunding RB Series 2016C | 5.00% | | 01/01/31 (a) | 1,000,000 | 1,180,803 |
| Refunding GO Bonds Series 2014A | 5.00% | | 01/01/35 (a) | 750,000 | 812,646 |
| Chicago Housing Auth | | | |
| GO Bonds Series 2018A | 5.00% | | 01/01/27 | 1,000,000 | 1,198,890 |
| GO Bonds Series 2018A | 5.00% | | 01/01/28 | 1,000,000 | 1,226,267 |
| Community Unit SD #300 |
| GO Refunding Bonds Series 2013 | 5.25% | | 01/01/31 (a) | 4,840,000 | 5,158,558 |
| Dupage Cnty HSD #88 |
| GO Refunding Bonds Series 2016 | 5.00% | | 01/15/26 | 2,500,000 | 2,971,675 |
| Illinois | | | |
| GO Bonds Series 2018 | 5.00% | | 05/01/31 (a) | 1,000,000 | 1,221,415 |
| GO Bonds Series 2020 | 5.38% | | 05/01/23 | 500,000 | 541,732 |
| GO Bonds Series 2020 | 5.50% | | 05/01/24 | 1,000,000 | 1,133,567 |
| GO Bonds Series 2020 | 5.50% | | 05/01/25 | 1,500,000 | 1,764,444 |
| GO Bonds Series 2021A | 5.00% | | 03/01/46 (a) | 1,000,000 | 1,247,832 |
Schwab Municipal Bond Funds | Annual Report
Schwab Tax-Free Bond Fund
Portfolio Holdings as of August 31, 2021 (continued)
Issuer
Type of Security, Series | Rate | | Maturity | Face
Amount ($) | Value ($) |
| GO Refunding Bonds Series 2016 | 5.00% | | 02/01/28 (a) | 1,500,000 | 1,805,955 |
| GO Refunding Bonds Series 2018B | 5.00% | | 10/01/33 (a) | 1,500,000 | 1,838,579 |
| Illinois Finance Auth | | | |
| Facilities RB (Univ of Illinois) Series 2019A | 5.00% | | 10/01/44 (a) | 500,000 | 617,472 |
| Facilities RB (Univ of Illinois) Series 2019A | 5.00% | | 10/01/51 (a) | 150,000 | 183,917 |
| RB (Rosalind Franklin Univ) Series 2017A | 5.00% | | 08/01/30 (a) | 900,000 | 1,086,149 |
| RB (Rosalind Franklin Univ) Series 2017A | 5.00% | | 08/01/33 (a) | 960,000 | 1,148,491 |
| RB (Rosalind Franklin Univ) Series 2017A | 5.00% | | 08/01/34 (a) | 1,330,000 | 1,586,499 |
| Refunding RB (Northwestern Memorial Health) Series 2021A | 4.00% | | 07/15/37 (a) | 2,500,000 | 3,013,278 |
| Refunding RB (Southern Illinois Healthcare Enterprises) Series 2017C | 5.00% | | 03/01/26 | 700,000 | 836,062 |
| Refunding RB (Southern Illinois Healthcare Enterprises) Series 2017C | 5.00% | | 03/01/30 (a) | 400,000 | 481,941 |
| Illinois Toll Highway Auth | | | |
| Toll Highway Sr RB Series 2019A | 5.00% | | 01/01/44 (a) | 2,500,000 | 3,117,899 |
| Toll Highway Sr Refunding RB Series 2019C | 5.00% | | 01/01/29 | 2,000,000 | 2,595,922 |
| Toll Highway Sr Refunding RB Series 2019C | 5.00% | | 01/01/30 | 1,000,000 | 1,323,958 |
| Kankakee River Metropolitan Agency |
| Sr Lien Sewage Treatment Facility Refunding RB Series 2016 | 5.00% | | 05/01/26 | 1,305,000 | 1,554,680 |
| Northern Illinois Univ | | | |
| Auxiliary Facilities Refunding RB Series 2020B | 5.00% | | 04/01/29 | 400,000 | 508,033 |
| Auxiliary Facilities Refunding RB Series 2020B | 5.00% | | 04/01/30 | 450,000 | 581,244 |
| Auxiliary Facilities Refunding RB Series 2020B | 5.00% | | 04/01/31 (a) | 500,000 | 641,586 |
| Auxiliary Facilities Refunding RB Series 2020B | 4.00% | | 04/01/35 (a) | 1,050,000 | 1,238,413 |
| Auxiliary Facilities Refunding RB Series 2020B | 4.00% | | 04/01/37 (a) | 600,000 | 703,044 |
| Auxiliary Facilities System RB Series 2021 | 5.00% | | 10/01/26 | 250,000 | 300,502 |
| Auxiliary Facilities System RB Series 2021 | 5.00% | | 10/01/27 | 325,000 | 398,944 |
| Auxiliary Facilities System RB Series 2021 | 5.00% | | 10/01/28 | 325,000 | 407,644 |
| Auxiliary Facilities System RB Series 2021 | 5.00% | | 10/01/29 | 300,000 | 383,566 |
| Auxiliary Facilities System RB Series 2021 | 5.00% | | 10/01/30 | 325,000 | 422,723 |
| | | | | | 56,360,160 |
| INDIANA 0.2% |
| Indiana Finance Auth |
| Educational Facilities Refunding RB (Butler Univ) Series 2012A | 5.00% | | 02/01/24 (a) | 1,790,000 | 1,825,467 |
| KANSAS 0.9% |
| Crawford Cnty USD #250 | | | |
| GO Bonds Series 2017 | 5.00% | | 09/01/26 | 250,000 | 304,761 |
| GO Bonds Series 2017 | 5.00% | | 09/01/27 | 450,000 | 564,083 |
| Hutchinson | | | |
| Hospital Facilities RB (Hutchinson Regional Medical Center) Series 2016 | 5.00% | | 12/01/27 (a) | 375,000 | 445,805 |
| Hospital Facilities RB (Hutchinson Regional Medical Center) Series 2016 | 5.00% | | 12/01/28 (a) | 400,000 | 472,900 |
| Hospital Facilities RB (Hutchinson Regional Medical Center) Series 2016 | 5.00% | | 12/01/29 (a) | 440,000 | 517,479 |
| Hospital Facilities RB (Hutchinson Regional Medical Center) Series 2016 | 5.00% | | 12/01/30 (a) | 445,000 | 521,003 |
| Hospital Facilities RB (Hutchinson Regional Medical Center) Series 2016 | 5.00% | | 12/01/31 (a) | 150,000 | 175,145 |
| Johnson & Miami County USD No. 230 | | | |
| GO Bonds Series 2018A | 5.00% | | 09/01/26 | 250,000 | 304,347 |
| GO Bonds Series 2018A | 5.00% | | 09/01/27 | 800,000 | 1,000,145 |
| GO Bonds Series 2018A | 5.00% | | 09/01/31 (a) | 2,575,000 | 3,196,771 |
| | | | | | 7,502,439 |
Schwab Municipal Bond Funds | Annual Report
Schwab Tax-Free Bond Fund
Portfolio Holdings as of August 31, 2021 (continued)
Issuer
Type of Security, Series | Rate | | Maturity | Face
Amount ($) | Value ($) |
| KENTUCKY 0.1% |
| Kentucky | | | |
| COP 2015 | 4.00% | | 06/15/24 | 400,000 | 439,034 |
| COP 2015 | 5.00% | | 06/15/25 | 400,000 | 466,602 |
| | | | | | 905,636 |
| LOUISIANA 0.4% |
| Louisiana Public Facilities Auth |
| Refunding RB (Ochsner Clinic Fdn) Series 2017 | 5.00% | | 05/15/27 | 500,000 | 618,368 |
| Louisiana Stadium & Exposition District |
| BAN 2021 | 4.00% | | 07/03/23 (a) | 2,000,000 | 2,108,841 |
| New Orleans |
| Sewerage Service Refunding RB Series 2014 | 5.00% | | 06/01/22 | 250,000 | 259,001 |
| | | | | | 2,986,210 |
| MAINE 1.0% |
| Maine Health & Educational Facilities Auth | | | |
| Educational Facilities RB Series 2021A | 5.00% | | 07/01/32 (a) | 550,000 | 741,038 |
| Educational Facilities RB Series 2021A | 4.00% | | 07/01/36 (a) | 500,000 | 612,424 |
| Educational Facilities RB Series 2021A | 4.00% | | 07/01/46 (a) | 750,000 | 894,667 |
| RB (MaineHealth) Series 2020A | 5.00% | | 07/01/30 | 800,000 | 1,061,045 |
| RB (MaineHealth) Series 2020A | 4.00% | | 07/01/36 (a) | 400,000 | 478,473 |
| RB (MaineHealth) Series 2020A | 4.00% | | 07/01/37 (a) | 1,000,000 | 1,192,522 |
| Portland | | | |
| General Airport Refunding RB Series 2019 | 5.00% | | 01/01/28 | 500,000 | 621,733 |
| General Airport Refunding RB Series 2019 | 5.00% | | 01/01/32 (a) | 560,000 | 715,722 |
| General Airport Refunding RB Series 2019 | 5.00% | | 01/01/33 (a) | 695,000 | 885,485 |
| General Airport Refunding RB Series 2019 | 5.00% | | 01/01/34 (a) | 620,000 | 787,369 |
| | | | | | 7,990,478 |
| MARYLAND 1.5% |
| Maryland |
| GO Bonds First Series 2017A | 5.00% | | 03/15/26 | 5,080,000 | 6,137,975 |
| Maryland Health & Higher Educational Facilities Auth | | | |
| RB (Frederick Health System) Series 2020 | 4.00% | | 07/01/45 (a) | 600,000 | 699,379 |
| RB (Meritus Medical Center) Series 2015 | 5.00% | | 07/01/23 | 1,000,000 | 1,086,173 |
| Washington Cnty | | | |
| RB (Diakon Lutheran Social Ministries) Series 2019B | 5.00% | | 01/01/24 | 320,000 | 353,874 |
| RB (Diakon Lutheran Social Ministries) Series 2019B | 5.00% | | 01/01/25 | 550,000 | 630,856 |
| RB (Diakon Lutheran Social Ministries) Series 2019B | 5.00% | | 01/01/27 | 645,000 | 788,350 |
| RB (Diakon Lutheran Social Ministries) Series 2019B | 5.00% | | 01/01/28 | 1,405,000 | 1,750,851 |
| RB (Diakon Lutheran Social Ministries) Series 2019B | 5.00% | | 01/01/29 | 505,000 | 644,969 |
| | | | | | 12,092,427 |
| MASSACHUSETTS 1.9% |
| Massachusetts Development Finance Agency | | | |
| RB (Beth Israel Lahey Health) Series 2019K | 5.00% | | 07/01/29 | 500,000 | 650,182 |
| RB (Beth Israel Lahey Health) Series 2019K | 5.00% | | 07/01/31 (a) | 1,120,000 | 1,431,394 |
| RB (Beth Israel Lahey Health) Series 2019K | 5.00% | | 07/01/32 (a) | 500,000 | 637,024 |
Schwab Municipal Bond Funds | Annual Report
Schwab Tax-Free Bond Fund
Portfolio Holdings as of August 31, 2021 (continued)
Issuer
Type of Security, Series | Rate | | Maturity | Face
Amount ($) | Value ($) |
| RB (Boston Medical Center) Series 2016E | 5.00% | | 07/01/31 (a) | 2,815,000 | 3,311,188 |
| RB (Boston Medical Center) Series 2017F | 5.00% | | 07/01/28 (a) | 240,000 | 294,414 |
| RB (Lahey Health System) Series 2015F | 5.00% | | 08/15/28 (a) | 950,000 | 1,110,265 |
| RB (Lesley Univ) Series 2019A | 5.00% | | 07/01/35 (a) | 1,065,000 | 1,335,333 |
| RB (Lesley Univ) Series 2019A | 5.00% | | 07/01/39 (a) | 1,065,000 | 1,322,016 |
| RB (Wellforce) Series 2019A | 5.00% | | 07/01/24 | 1,200,000 | 1,350,036 |
| RB (Wellforce) Series 2020C | 4.00% | | 10/01/45 (a) | 750,000 | 877,448 |
| Massachusetts HFA | | | |
| S/F Housing RB Series 183 | 3.50% | | 12/01/46 (a) | 1,035,000 | 1,090,472 |
| S/F Housing RB Series 203 | 4.50% | | 12/01/48 (a) | 1,490,000 | 1,650,787 |
| | | | | | 15,060,559 |
| MICHIGAN 1.0% |
| Grand Rapids | | | |
| Sanitary Sewer System Refunding RB Series 2010 | 5.00% | | 01/01/25 | 600,000 | 693,611 |
| Sanitary Sewer System Refunding RB Series 2010 | 5.00% | | 01/01/27 | 1,145,000 | 1,414,118 |
| Karegnondi Water Auth | | | |
| RB Series 2014A | 5.00% | | 11/01/24 (a) | 1,645,000 | 1,813,407 |
| RB Series 2014A | 5.00% | | 11/01/25 (a) | 1,100,000 | 1,212,108 |
| Michigan Finance Auth |
| Tobacco Settlement Asset-Backed Bonds Series 2020B1 Class 2 | 1.25% | | 06/01/30 | 225,000 | 226,404 |
| Michigan Housing Development Auth |
| S/F Mortgage RB Series 2015A | 4.00% | | 06/01/46 (a) | 1,080,000 | 1,136,865 |
| Wayne Cnty Airport Auth | | | |
| Airport RB Series 2014B | 5.00% | | 12/01/32 (a) | 550,000 | 630,957 |
| Airport RB Series 2014B | 5.00% | | 12/01/33 (a) | 625,000 | 716,778 |
| | | | | | 7,844,248 |
| MINNESOTA 0.6% |
| Center City | | | |
| Health Care Facilities Refunding RB (Hazelden Betty Ford Fdn) Series 2019 | 4.00% | | 11/01/26 | 315,000 | 365,573 |
| Health Care Facilities Refunding RB (Hazelden Betty Ford Fdn) Series 2019 | 4.00% | | 11/01/27 | 250,000 | 296,253 |
| Health Care Facilities Refunding RB (Hazelden Betty Ford Fdn) Series 2019 | 4.00% | | 11/01/28 (a) | 330,000 | 394,704 |
| Health Care Facilities Refunding RB (Hazelden Betty Ford Fdn) Series 2019 | 4.00% | | 11/01/29 (a) | 265,000 | 315,189 |
| Health Care Facilities Refunding RB (Hazelden Betty Ford Fdn) Series 2019 | 4.00% | | 11/01/30 (a) | 250,000 | 296,025 |
| Health Care Facilities Refunding RB (Hazelden Betty Ford Fdn) Series 2019 | 4.00% | | 11/01/34 (a) | 300,000 | 349,619 |
| Health Care Facilities Refunding RB (Hazelden Betty Ford Fdn) Series 2019 | 4.00% | | 11/01/41 (a) | 220,000 | 252,665 |
| Duluth ISD #709 | | | |
| Refunding COP Series 2019C | 5.00% | | 02/01/24 (f) | 400,000 | 440,916 |
| Refunding COP Series 2019C | 5.00% | | 02/01/25 (f) | 375,000 | 427,953 |
| Refunding COP Series 2019C | 5.00% | | 02/01/26 (f) | 400,000 | 470,585 |
| Maple Grove |
| Health Care Facilities Refunding RB (North Memorial Health) Series 2015 | 4.00% | | 09/01/21 | 400,000 | 400,000 |
| Minnesota Higher Educational Facilities Auth | | | |
| RB (Univ of St. Thomas) Series 2019 | 5.00% | | 10/01/33 (a) | 400,000 | 510,574 |
| RB (Univ of St. Thomas) Series 2019 | 5.00% | | 10/01/34 (a) | 250,000 | 318,146 |
| | | | | | 4,838,202 |
Schwab Municipal Bond Funds | Annual Report
Schwab Tax-Free Bond Fund
Portfolio Holdings as of August 31, 2021 (continued)
Issuer
Type of Security, Series | Rate | | Maturity | Face
Amount ($) | Value ($) |
| MISSISSIPPI 0.3% |
| Mississippi Development Bank | | | |
| Special Obligation (Jackson Public SD) RB Series 2018 | 5.00% | | 10/01/25 | 1,000,000 | 1,184,084 |
| Special Obligation (Jackson Public SD) RB Series 2018 | 5.00% | | 10/01/26 | 590,000 | 721,002 |
| Special Obligation (Jackson Public SD) Refunding RB Series 2012A | 5.00% | | 04/01/28 (a)(b) | 345,000 | 371,233 |
| Special Obligation (Jackson Public SD) Refunding RB Series 2012A | 5.00% | | 04/01/28 (a) | 220,000 | 234,992 |
| | | | | | 2,511,311 |
| MISSOURI 2.3% |
| Jackson Cnty SD #4 | | | |
| School Building GO Bonds Series 2018A | 5.50% | | 03/01/36 (a)(f) | 5,000,000 | 6,579,968 |
| School Building GO Bonds Series 2018A | 6.00% | | 03/01/38 (a)(f) | 2,440,000 | 3,295,810 |
| Missouri Health & Educational Facilities Auth | | | |
| Educational Facilities RB (Kansas City Univ of Medicine) Series 2017A | 5.00% | | 06/01/35 (a) | 1,000,000 | 1,223,882 |
| Educational Facilities RB (Kansas City Univ of Medicine) Series 2017A | 5.00% | | 06/01/36 (a) | 1,050,000 | 1,282,824 |
| Hospital Facilities RB (CoxHealth) Series 2019A | 5.00% | | 11/15/31 (a) | 2,490,000 | 3,188,485 |
| Missouri Housing Development Commission | | | |
| S/F Mortgage RB Series 2017D | 4.00% | | 05/01/47 (a) | 940,000 | 1,019,530 |
| S/F Mortgage RB Series 2018A | 4.25% | | 05/01/49 (a) | 1,800,000 | 1,990,267 |
| | | | | | 18,580,766 |
| MONTANA 0.2% |
| Montana Board of Housing |
| S/F Housing RB Series 2018A | 4.00% | | 06/01/49 (a) | 1,310,000 | 1,422,219 |
| NEBRASKA 0.6% |
| Boys Town Village |
| RB (Father Flanagan Boys Home) Series 2017 | 3.00% | | 09/01/28 | 3,365,000 | 3,802,117 |
| Nebraska Investment Finance Auth |
| S/F Housing RB Series 2016A | 3.50% | | 03/01/46 (a) | 160,000 | 162,361 |
| Papio-Missouri River Natural Resource District | | | |
| Flood Protection & Water Quality Enhancement Refunding Bonds Series 2017 | 4.00% | | 12/15/27 (a)(b) | 250,000 | 257,659 |
| Flood Protection & Water Quality Enhancement Refunding Bonds Series 2017 | 4.00% | | 12/15/28 (a)(b) | 275,000 | 283,425 |
| Flood Protection & Water Quality Enhancement Refunding Bonds Series 2017 | 4.00% | | 12/15/30 (a)(b) | 500,000 | 515,319 |
| | | | | | 5,020,881 |
| NEVADA 0.2% |
| Carson City | | | |
| Hospital Refunding RB (Carson Tahoe Regional Healthcare) Series 2017 | 5.00% | | 09/01/25 | 600,000 | 701,445 |
| Hospital Refunding RB (Carson Tahoe Regional Healthcare) Series 2017 | 5.00% | | 09/01/27 | 605,000 | 745,965 |
| | | | | | 1,447,410 |
| NEW HAMPSHIRE 0.0% |
| New Hampshire HFA |
| S/F Mortgage Acquisition RB Series 2011E | 4.50% | | 01/01/28 (a) | 15,000 | 15,189 |
Schwab Municipal Bond Funds | Annual Report
Schwab Tax-Free Bond Fund
Portfolio Holdings as of August 31, 2021 (continued)
Issuer
Type of Security, Series | Rate | | Maturity | Face
Amount ($) | Value ($) |
| NEW JERSEY 3.3% |
| Atlantic City | | | |
| Tax Appeal Refunding Bonds Series 2017A | 5.00% | | 03/01/24 | 200,000 | 222,240 |
| Tax Appeal Refunding Bonds Series 2017A | 5.00% | | 03/01/25 | 300,000 | 345,639 |
| Tax Appeal Refunding Bonds Series 2017A | 5.00% | | 03/01/27 | 250,000 | 305,839 |
| Flemington-Raritan Regional SD |
| GO Refunding Bonds Series 2014 | 4.00% | | 06/15/22 | 635,000 | 654,575 |
| New Jersey Economic Development Auth | | | |
| School Facilities Construction Bonds Series 2014 UU | 5.00% | | 06/15/29 (a) | 1,045,000 | 1,173,511 |
| School Facilities Construction Bonds Series 2018 EEE | 5.00% | | 06/15/43 (a) | 2,000,000 | 2,468,331 |
| School Facilities Construction Refunding Bonds Series 2019LLL | 5.00% | | 06/15/34 (a) | 750,000 | 957,179 |
| School Facilities Construction Refunding Bonds Series 2019MMM | 5.00% | | 06/15/33 (a) | 500,000 | 639,603 |
| New Jersey Educational Facilities Auth |
| RBs (Princeton Univ) Series 2016A | 5.00% | | 07/01/25 | 4,555,000 | 5,374,594 |
| New Jersey Housing & Mortgage Finance Agency |
| S/F Housing RB Series 2020E | 3.50% | | 04/01/51 (a) | 2,855,000 | 3,170,970 |
| New Jersey Transportation Trust Fund Auth | | | |
| Transportation Program Notes Series 2014 BB-1 | 5.00% | | 06/15/33 (a) | 4,500,000 | 5,653,884 |
| Transportation System RB Series 2019AA | 5.00% | | 06/15/31 (a) | 1,250,000 | 1,574,659 |
| Transportation System RB Series 2019BB | 5.00% | | 06/15/44 (a) | 3,000,000 | 3,695,567 |
| | | | | | 26,236,591 |
| NEW MEXICO 0.2% |
| New Mexico Mortgage Finance Auth |
| S/F Mortgage RB Series 2018B | 4.00% | | 01/01/49 (a) | 1,455,000 | 1,597,266 |
| NEW YORK 13.3% |
| Build NYC Resource Corp |
| RB (YMCA of Greater New York) Series 2015 | 5.00% | | 08/01/25 (b) | 250,000 | 294,401 |
| Hempstead Local Development Corp | | | |
| RB (Hofstra Univ) Series 2021A | 5.00% | | 07/01/26 | 800,000 | 972,000 |
| RB (Hofstra Univ) Series 2021A | 5.00% | | 07/01/27 | 750,000 | 935,507 |
| RB (Hofstra Univ) Series 2021A | 5.00% | | 07/01/28 | 840,000 | 1,073,510 |
| RB (Hofstra Univ) Series 2021A | 4.00% | | 07/01/36 (a) | 340,000 | 419,590 |
| RB (Hofstra Univ) Series 2021A | 4.00% | | 07/01/37 (a) | 550,000 | 676,465 |
| RB (Hofstra Univ) Series 2021A | 4.00% | | 07/01/38 (a) | 515,000 | 631,674 |
| RB (Hofstra Univ) Series 2021A | 4.00% | | 07/01/39 (a) | 575,000 | 703,241 |
| Metropolitan Transportation Auth |
| Transportation RB Series 2015A2 | 5.00% | | 11/15/45 (a) | 2,845,000 | 3,716,202 |
| Nassau Cnty Local Economic Assistance Corp | | | |
| RB (Catholic Health Services Long Island) Series 2014 | 5.00% | | 07/01/25 (a) | 500,000 | 564,630 |
| RB (Catholic Health Services Long Island) Series 2014 | 5.00% | | 07/01/26 (a) | 250,000 | 281,635 |
| New York City | | | |
| GO Bonds Fiscal 2013 Series E | 5.00% | | 08/01/25 (a) | 3,360,000 | 3,589,935 |
| GO Bonds Fiscal 2014 Series B | 5.00% | | 08/01/22 | 1,050,000 | 1,097,203 |
| GO Bonds Fiscal 2014 Series I1 | 5.00% | | 03/01/23 (b) | 315,000 | 337,988 |
| GO Bonds Fiscal 2014 Series I1 | 5.00% | | 03/01/23 | 805,000 | 864,054 |
| GO Bonds Fiscal 2021 Series A-1 | 5.00% | | 08/01/32 (a) | 1,500,000 | 1,976,006 |
| GO Bonds Fiscal 2021 Series A-1 | 5.00% | | 08/01/33 (a) | 1,500,000 | 1,969,215 |
| GO Bonds Fiscal Series 2018A | 5.00% | | 08/01/28 (a) | 3,165,000 | 3,954,466 |
Schwab Municipal Bond Funds | Annual Report
Schwab Tax-Free Bond Fund
Portfolio Holdings as of August 31, 2021 (continued)
Issuer
Type of Security, Series | Rate | | Maturity | Face
Amount ($) | Value ($) |
| GO Bonds Fiscal Series 2018E-1 | 5.25% | | 03/01/34 (a) | 2,000,000 | 2,535,884 |
| GO Bonds Fiscal Series 2019E | 5.00% | | 08/01/32 (a) | 1,000,000 | 1,275,278 |
| New York City Municipal Water Finance Auth |
| Water & Sewer System RB Fiscal 2021 Series DD | 5.00% | | 06/15/26 | 3,250,000 | 3,965,647 |
| New York City Transitional Finance Auth | | | |
| Building Aid RB Fiscal 2019 Series S3A | 5.00% | | 07/15/35 (a) | 2,000,000 | 2,524,275 |
| Building Aid RB Fiscal 2019 Series S3A | 5.00% | | 07/15/36 (a) | 1,450,000 | 1,827,762 |
| Future Tax Secured Sub RB Fiscal 2014 Series B1 | 5.00% | | 11/01/23 | 2,200,000 | 2,430,785 |
| Future Tax Secured Sub RB Fiscal 2017 Series E1 | 5.00% | | 02/01/30 (a) | 3,000,000 | 3,681,358 |
| New York City Trust for Cultural Resources | | | |
| Refunding RB (Juilliard School) Series 2018A | 5.00% | | 01/01/34 (a) | 1,000,000 | 1,269,479 |
| Refunding RB (Juilliard School) Series 2018A | 5.00% | | 01/01/37 (a) | 1,750,000 | 2,197,393 |
| Refunding RB (Juilliard School) Series 2018A | 5.00% | | 01/01/38 (a) | 1,000,000 | 1,252,242 |
| Refunding RB (Lincoln Ctr for the Performing Arts) Series 2020A | 5.00% | | 12/01/32 (a) | 2,000,000 | 2,641,672 |
| Refunding RB (Lincoln Ctr for the Performing Arts) Series 2020A | 4.00% | | 12/01/34 (a) | 1,000,000 | 1,206,310 |
| Refunding RB (Lincoln Ctr for the Performing Arts) Series 2020A | 4.00% | | 12/01/35 (a) | 1,000,000 | 1,203,693 |
| Refunding RB (Whitney Museum of American Art) Series 2021 | 5.00% | | 07/01/31 | 2,500,000 | 3,420,024 |
| New York Health & Hospital Corp |
| Health System RB Series 2020A | 5.00% | | 02/15/30 | 2,500,000 | 3,306,147 |
| New York State Dormitory Auth | | | |
| RB (Catholic Health System) Series 2019A | 5.00% | | 07/01/34 (a) | 150,000 | 189,177 |
| RB (Catholic Health System) Series 2019A | 4.00% | | 07/01/38 (a) | 925,000 | 1,064,885 |
| RB (Montefiore Health) Series 2018A | 5.00% | | 08/01/28 | 1,700,000 | 2,137,842 |
| RB (Rockefeller Univ) Series 2019C | 4.00% | | 07/01/49 (a) | 1,000,000 | 1,185,539 |
| State Personal Income Tax RB Series 2019A | 5.00% | | 03/15/38 (a) | 3,850,000 | 4,869,073 |
| State Personal Income Tax Refunding RB Series 2012A | 5.00% | | 12/15/24 (a) | 1,300,000 | 1,381,703 |
| State Sales Tax RB Series 2014A | 5.00% | | 03/15/26 (a) | 3,700,000 | 4,149,538 |
| State Sales Tax RB Series 2018 | 5.00% | | 03/15/34 (a) | 5,000,000 | 6,271,443 |
| New York State Mortgage Agency |
| Homeowner Mortgage RB Series 226 | 3.50% | | 10/01/50 (a) | 3,415,000 | 3,716,883 |
| New York State Urban Development Corp |
| State Personal Income Tax RB Series 2020C | 5.00% | | 03/15/33 (a) | 1,500,000 | 1,992,963 |
| New York Transportation Development Corp | | | |
| Special Facility RB (JFK Airport) Series 2020A | 5.00% | | 12/01/28 | 1,000,000 | 1,259,315 |
| Special Facility RB (JFK Airport) Series 2020A | 5.00% | | 12/01/31 (a) | 500,000 | 650,508 |
| Special Facility RB (JFK Airport) Series 2020C | 5.00% | | 12/01/33 (a) | 2,500,000 | 3,252,486 |
| Port Auth of New York & New Jersey | | | |
| Consolidated Bonds 221st Series | 5.00% | | 07/15/35 (a) | 2,835,000 | 3,654,351 |
| Consolidated Bonds 221st Series | 4.00% | | 07/15/36 (a) | 2,000,000 | 2,390,329 |
| Consolidated Bonds 221st Series | 4.00% | | 07/15/45 (a) | 3,000,000 | 3,493,600 |
| Sales Tax Asset Receivable Corp |
| RB Fiscal 2015 Series A | 5.00% | | 10/15/31 (a)(b) | 5,330,000 | 6,128,789 |
| | | | | | 106,584,095 |
| NORTH CAROLINA 3.0% |
| Asheville | | | |
| Special Obligation Bonds Series 2021 | 5.00% | | 04/01/27 | 700,000 | 871,164 |
| Special Obligation Bonds Series 2021 | 5.00% | | 04/01/30 | 600,000 | 800,743 |
| Special Obligation Bonds Series 2021 | 5.00% | | 04/01/31 | 375,000 | 511,121 |
Schwab Municipal Bond Funds | Annual Report
Schwab Tax-Free Bond Fund
Portfolio Holdings as of August 31, 2021 (continued)
Issuer
Type of Security, Series | Rate | | Maturity | Face
Amount ($) | Value ($) |
| Charlotte | | | |
| Airport RB (Charlotte Douglas Intl) Series 2021B | 5.00% | | 07/01/25 | 625,000 | 732,754 |
| Airport RB (Charlotte Douglas Intl) Series 2021B | 4.00% | | 07/01/41 (a) | 1,190,000 | 1,436,731 |
| North Carolina Capital Facilities Finance Agency | | | |
| Educational Facilities Refunding RB (Meredith College) Series 2018 | 5.00% | | 06/01/25 | 500,000 | 580,274 |
| Educational Facilities Refunding RB (Meredith College) Series 2018 | 5.00% | | 06/01/26 | 1,735,000 | 2,072,787 |
| Educational Facilities Refunding RB (Meredith College) Series 2018 | 5.00% | | 06/01/30 (a) | 1,000,000 | 1,167,205 |
| Educational Facilities Refunding RB (Meredith College) Series 2018 | 5.00% | | 06/01/31 (a) | 1,305,000 | 1,515,795 |
| Educational Facilities Refunding RB (Meredith College) Series 2018 | 5.00% | | 06/01/32 (a) | 1,255,000 | 1,453,462 |
| North Carolina Medical Care Commission | | | |
| Health Care Facilities RB (Presbyterian Homes) Series 2020A | 4.00% | | 10/01/27 | 420,000 | 501,537 |
| Health Care Facilities RB (Presbyterian Homes) Series 2020A | 4.00% | | 10/01/35 (a) | 450,000 | 533,579 |
| Health Care Facilities RB (Presbyterian Homes) Series 2020A | 5.00% | | 10/01/40 (a) | 1,000,000 | 1,230,720 |
| Health Care Facilities Refunding RB (WakeMed) Series 2012A | 5.00% | | 10/01/21 | 5,000,000 | 5,019,237 |
| North Carolina Turnpike Auth | | | |
| RB (Triangle Expressway) Series 2019 | 5.00% | | 01/01/49 (a) | 500,000 | 629,795 |
| Triangle Expressway Appropriation RB Series 2019 | 0.00% | | 01/01/45 (a)(e) | 1,700,000 | 878,620 |
| Raleigh-Durham Airport Auth |
| Refunding RB Series 2020A | 5.00% | | 05/01/33 (a) | 1,000,000 | 1,296,096 |
| Winston-Salem |
| Water & Sewer System Refunding RB Series 2020A | 5.00% | | 06/01/30 | 2,000,000 | 2,693,971 |
| | | | | | 23,925,591 |
| NORTH DAKOTA 0.4% |
| West Fargo | | | |
| Refunding Bonds Series 2019B | 4.00% | | 05/01/25 | 400,000 | 451,600 |
| Refunding Bonds Series 2019B | 4.00% | | 05/01/26 | 465,000 | 537,346 |
| Refunding Bonds Series 2019B | 4.00% | | 05/01/27 (a) | 225,000 | 259,726 |
| Williston | | | |
| Public Safety Sales Tax RB Series 2018A | 5.00% | | 07/15/22 | 500,000 | 517,542 |
| Public Safety Sales Tax RB Series 2018A | 4.00% | | 07/15/23 (a) | 1,650,000 | 1,699,175 |
| | | | | | 3,465,389 |
| OHIO 3.3% |
| Buckeye Tobacco Settlement Financing Auth |
| Tobacco Settlement Refunding Bonds Series 2020A-2 | 5.00% | | 06/01/34 (a) | 5,000,000 | 6,434,193 |
| Butler Cnty |
| Hospital Facilities Refunding RB (UC Health) Series 2017 | 5.00% | | 11/15/30 (a) | 800,000 | 983,273 |
| Cleveland | | | |
| Airport System RB Series 2019B | 5.00% | | 01/01/26 | 1,045,000 | 1,242,634 |
| Water RB Series 2020FF | 5.00% | | 01/01/26 | 1,180,000 | 1,414,936 |
| Water RB Series 2020FF | 5.00% | | 01/01/28 | 800,000 | 1,014,418 |
| Columbus |
| ULT GO Bonds Series 2021A | 5.00% | | 04/01/34 (a)(c) | 5,500,000 | 7,350,644 |
| Hamilton Cnty |
| Hospital Facilities RB (UC Health) Series 2014 | 5.00% | | 02/01/24 | 55,000 | 61,075 |
| Northeast Ohio Medical Univ | | | |
| General Refunding RB Series 2021A | 5.00% | | 12/01/25 | 200,000 | 232,980 |
| General Refunding RB Series 2021A | 4.00% | | 12/01/35 (a) | 300,000 | 351,548 |
Schwab Municipal Bond Funds | Annual Report
Schwab Tax-Free Bond Fund
Portfolio Holdings as of August 31, 2021 (continued)
Issuer
Type of Security, Series | Rate | | Maturity | Face
Amount ($) | Value ($) |
| General Refunding RB Series 2021A | 3.00% | | 12/01/40 (a) | 475,000 | 497,501 |
| General Refunding RB Series 2021A | 4.00% | | 12/01/45 (a) | 225,000 | 256,312 |
| Ohio | | | |
| Common Schools GO Bonds Series 2021A | 5.00% | | 06/15/25 | 500,000 | 588,816 |
| Common Schools GO Bonds Series 2021A | 5.00% | | 06/15/26 | 800,000 | 974,033 |
| Common Schools GO Bonds Series 2021A | 5.00% | | 06/15/27 | 650,000 | 813,990 |
| Higher Education GO Bonds Series 2021A | 5.00% | | 05/01/25 | 700,000 | 820,735 |
| Higher Education GO Bonds Series 2021A | 5.00% | | 05/01/26 | 875,000 | 1,061,195 |
| Higher Education GO Bonds Series 2021A | 5.00% | | 05/01/27 | 595,000 | 742,600 |
| Ohio Higher Educational Facility Commission | | | |
| Higher Educational Facility RB (Univ of Dayton) Series 2020 | 5.00% | | 02/01/35 (a) | 700,000 | 897,075 |
| Higher Educational Facility RB (Univ of Dayton) Series 2020 | 4.00% | | 02/01/36 (a) | 555,000 | 660,047 |
| | | | | | 26,398,005 |
| OKLAHOMA 1.1% |
| Norman Regional Hospital Auth |
| Hospital RB Series 2019 | 5.00% | | 09/01/45 (a) | 1,050,000 | 1,294,916 |
| Oklahoma City Zoological Trust |
| Sales Tax RB Series 2021 | 4.00% | | 06/01/29 | 1,340,000 | 1,648,748 |
| Oklahoma Development Finance Auth | | | |
| Lease RB Series 2014A | 4.00% | | 06/01/27 (a) | 29,000 | 31,702 |
| Limited Obligation RB (Gilcrease Expressway West) Series 2020 | 1.63% | | 07/06/23 (a) | 4,500,000 | 4,542,968 |
| Tulsa Cnty Industrial Auth |
| Educational Facilities Lease RB (Tulsa Cnty ISD #11) Series 2018 | 5.00% | | 09/01/23 | 1,000,000 | 1,094,301 |
| | | | | | 8,612,635 |
| OREGON 2.7% |
| Beaverton SD #48J |
| GO Bonds Series 2017D | 5.00% | | 06/15/36 (a)(f) | 2,920,000 | 3,571,727 |
| Forest Grove | | | |
| Campus Refunding & RB (Pacific Univ) Series 2014A | 5.25% | | 05/01/34 (a) | 1,075,000 | 1,106,742 |
| Campus Refunding & RB (Pacific Univ) Series 2015A | 5.00% | | 05/01/24 | 250,000 | 278,090 |
| Campus Refunding & RB (Pacific Univ) Series 2015A | 5.00% | | 05/01/25 | 145,000 | 166,512 |
| Gresham-Barlow SD #10Jt | | | |
| GO Bonds Series 2019 | 0.00% | | 06/15/34 (a)(e)(f) | 300,000 | 224,375 |
| GO Bonds Series 2019 | 0.00% | | 06/15/35 (a)(e)(f) | 265,000 | 190,276 |
| GO Bonds Series 2019 | 0.00% | | 06/15/36 (a)(e)(f) | 420,000 | 288,899 |
| GO Bonds Series 2019 | 0.00% | | 06/15/37 (a)(e)(f) | 500,000 | 329,228 |
| Hermiston SD #8R | | | |
| Refunding GO Bonds Series 2020A | 0.00% | | 06/15/28 (e)(f) | 1,700,000 | 1,585,146 |
| Refunding GO Bonds Series 2020A | 0.00% | | 06/15/35 (a)(e)(f) | 1,400,000 | 1,040,706 |
| Lane Cnty SD #52 |
| GO Bonds Series 2021A | 0.00% | | 06/15/42 (a)(e)(f) | 1,000,000 | 618,057 |
| Medford Hospital Facilities Auth |
| Hospital Facilities RB (Asante) Series 2020A | 4.00% | | 08/15/39 (a) | 1,000,000 | 1,197,998 |
| Morrow & Gilliam County SD | | | |
| GO Bonds Series 2021A | 4.00% | | 06/15/27 (d)(f) | 205,000 | 242,267 |
| GO Bonds Series 2021A | 4.00% | | 06/15/28 (d)(f) | 200,000 | 240,576 |
| GO Bonds Series 2021A | 4.00% | | 06/15/29 (d)(f) | 150,000 | 183,214 |
| GO Bonds Series 2021A | 4.00% | | 06/15/30 (d)(f) | 350,000 | 432,787 |
Schwab Municipal Bond Funds | Annual Report
Schwab Tax-Free Bond Fund
Portfolio Holdings as of August 31, 2021 (continued)
Issuer
Type of Security, Series | Rate | | Maturity | Face
Amount ($) | Value ($) |
| Phoenix-Talent SD #4 |
| GO Bonds Series 2018 | 0.00% | | 06/15/32 (a)(e)(f) | 400,000 | 309,649 |
| Port Morrow | | | |
| GO Obligations Series 2016 | 5.00% | | 12/01/30 (a)(b) | 330,000 | 357,674 |
| GO Obligations Series 2016 | 5.00% | | 12/01/31 (a)(b) | 375,000 | 406,447 |
| GO Obligations Series 2016 | 5.00% | | 12/01/36 (a)(b) | 1,155,000 | 1,251,857 |
| Port of Portland |
| Airport Refunding RB Series 26C | 5.00% | | 07/01/22 | 1,100,000 | 1,142,408 |
| Salem Hospital Facility Auth |
| RB (Salem Health) Series 2019A | 5.00% | | 05/15/26 | 2,180,000 | 2,630,211 |
| Seaside |
| Transient Lodging Tax RB Series 2018 | 5.00% | | 12/15/37 (a) | 1,875,000 | 2,308,009 |
| West Linn-Wilsonville SD #3Jt | | | |
| GO Bonds Series 2020A | 0.00% | | 06/15/35 (a)(e)(f) | 1,000,000 | 759,086 |
| GO Bonds Series 2020A | 0.00% | | 06/15/40 (a)(e)(f) | 640,000 | 409,169 |
| | | | | | 21,271,110 |
| PENNSYLVANIA 1.0% |
| Beaver Cnty | | | |
| GO Bonds Series 2017 | 4.00% | | 04/15/28 (b)(f) | 510,000 | 618,307 |
| GO Bonds Series 2017 | 4.00% | | 04/15/28 | 1,625,000 | 1,905,376 |
| Delaware Cnty Auth | | | |
| RB (Cabrini Univ) Series 2017 | 5.00% | | 07/01/24 | 220,000 | 244,545 |
| RB (Cabrini Univ) Series 2017 | 5.00% | | 07/01/27 | 485,000 | 584,306 |
| RB (Cabrini Univ) Series 2017 | 5.00% | | 07/01/31 (a) | 515,000 | 608,006 |
| Philadelphia | | | |
| GO Refunding Bonds Series 2019A | 5.00% | | 08/01/25 | 745,000 | 878,147 |
| GO Refunding Bonds Series 2019A | 5.00% | | 08/01/26 | 1,000,000 | 1,217,594 |
| GO Refunding Bonds Series 2019A | 5.00% | | 08/01/27 | 500,000 | 624,724 |
| GO Refunding Bonds Series 2019A | 5.00% | | 08/01/28 | 300,000 | 381,843 |
| GO Refunding Bonds Series 2019A | 5.00% | | 08/01/29 | 245,000 | 318,708 |
| GO Refunding Bonds Series 2019A | 5.00% | | 08/01/30 | 285,000 | 378,011 |
| GO Refunding Bonds Series 2019A | 5.00% | | 08/01/31 | 300,000 | 406,079 |
| | | | | | 8,165,646 |
| RHODE ISLAND 0.1% |
| Rhode Island Housing & Mortgage Finance Corp |
| Homeownership Opportunity RB Series 67B | 3.50% | | 10/01/46 (a) | 385,000 | 394,377 |
| SOUTH CAROLINA 1.1% |
| Kershaw Cnty Public Schools Foundation |
| Installment Purchase Refunding RB Series 2015 | 5.00% | | 12/01/22 | 800,000 | 847,007 |
| South Carolina Public Service Auth | | | |
| Revenue & Refunding Bonds Series 2020A | 4.00% | | 12/01/37 (a) | 1,750,000 | 2,091,692 |
| Revenue & Refunding Bonds Series 2020A | 4.00% | | 12/01/39 (a) | 4,000,000 | 4,751,851 |
| Univ of South Carolina |
| Higher Education RB Series 2015 | 5.00% | | 05/01/24 | 1,000,000 | 1,127,099 |
| | | | | | 8,817,649 |
Schwab Municipal Bond Funds | Annual Report
Schwab Tax-Free Bond Fund
Portfolio Holdings as of August 31, 2021 (continued)
Issuer
Type of Security, Series | Rate | | Maturity | Face
Amount ($) | Value ($) |
| SOUTH DAKOTA 0.1% |
| Sioux Falls SD #49-5 | | | |
| LT Capital Outlay Refunding Certificates Series 2017A | 3.00% | | 08/01/28 (a) | 200,000 | 224,277 |
| LT Capital Outlay Refunding Certificates Series 2017B | 3.00% | | 08/01/28 (a) | 425,000 | 476,590 |
| LT Capital Outlay Refunding Certificates Series 2017C | 5.00% | | 08/01/22 | 150,000 | 156,616 |
| | | | | | 857,483 |
| TENNESSEE 1.0% |
| Chattanooga-Hamilton Cnty Hospital Auth | | | |
| Hospital Refunding & RB (Erlanger Health) Series 2014A | 5.00% | | 10/01/23 | 450,000 | 492,373 |
| Hospital Refunding & RB (Erlanger Health) Series 2014A | 5.00% | | 10/01/24 | 600,000 | 682,198 |
| Hospital Refunding & RB (Erlanger Health) Series 2014A | 5.00% | | 10/01/25 (a) | 950,000 | 1,079,179 |
| Tennessee Housing Development Agency |
| Residential RB Series 2020-4 | 3.00% | | 01/01/51 (a) | 4,930,000 | 5,376,339 |
| | | | | | 7,630,089 |
| TEXAS 9.2% |
| Alamo Heights ISD | | | |
| ULT Refunding GO Bonds Series 2020a | 5.00% | | 02/01/25 (f) | 1,265,000 | 1,468,254 |
| ULT Refunding GO Bonds Series 2020A | 5.00% | | 02/01/26 (f) | 530,000 | 636,770 |
| ULT Refunding GO Bonds Series 2020A | 5.00% | | 02/01/27 (f) | 425,000 | 526,413 |
| ULT Refunding RB Series 2020A | 5.00% | | 02/01/24 (f) | 1,260,000 | 1,405,964 |
| ULT Refunding RB Series 2020A | 5.00% | | 02/01/28 (f) | 325,000 | 413,466 |
| Arlington Higher Education Finance Corp |
| Education RB (Uplift Education) Series 2018A | 5.00% | | 12/01/28 (a)(f) | 200,000 | 239,144 |
| Atlanta ISD | | | |
| ULT Refunding GO Bonds Series 2020 | 4.00% | | 08/15/26 (f) | 310,000 | 363,923 |
| ULT Refunding GO Bonds Series 2020 | 4.00% | | 08/15/27 (f) | 325,000 | 389,029 |
| ULT Refunding GO Bonds Series 2020 | 4.00% | | 08/15/28 (f) | 340,000 | 414,639 |
| ULT Refunding GO Series 2020 | 4.00% | | 08/15/25 (f) | 150,000 | 171,294 |
| Brady ISD |
| ULT GO Refunding Bonds Series 2015 | 5.00% | | 08/15/24 (f) | 170,000 | 193,417 |
| Central Texas Regional Mobility Auth | | | |
| Sr Lien RB Series 2015A | 5.00% | | 01/01/27 (a) | 1,100,000 | 1,284,687 |
| Sr Lien RB Series 2015A | 5.00% | | 01/01/30 (a) | 1,520,000 | 1,764,311 |
| Sr Lien RB Series 2021B | 5.00% | | 01/01/29 | 850,000 | 1,098,367 |
| Sr Lien RB Series 2021B | 5.00% | | 01/01/31 | 500,000 | 673,576 |
| Corpus Christi | | | |
| Utility System Jr Lien Refunding & RB Series 2020A | 5.00% | | 07/15/27 | 300,000 | 375,765 |
| Utility System Jr Lien Refunding & RB Series 2020A | 5.00% | | 07/15/28 | 565,000 | 724,028 |
| Utility System Jr Lien Refunding & RB Series 2020A | 5.00% | | 07/15/29 | 1,000,000 | 1,306,687 |
| Dallas-Fort Worth International Airport | | | |
| Airport RB Series 2013B | 5.00% | | 11/01/38 (a) | 2,300,000 | 2,425,933 |
| Jt Refunding RB Series 2020A | 5.00% | | 11/01/29 | 2,500,000 | 3,298,429 |
| Jt Refunding RB Series 2020A | 4.00% | | 11/01/34 (a) | 1,000,000 | 1,234,505 |
| Donna ISD | | | |
| ULT Refunding Bonds Series 2019 | 5.00% | | 02/15/27 (f) | 775,000 | 961,912 |
| ULT Refunding Bonds Series 2019 | 5.00% | | 02/15/28 (f) | 425,000 | 542,140 |
| ULT Refunding Bonds Series 2019 | 5.00% | | 02/15/29 (f) | 575,000 | 751,798 |
Schwab Municipal Bond Funds | Annual Report
Schwab Tax-Free Bond Fund
Portfolio Holdings as of August 31, 2021 (continued)
Issuer
Type of Security, Series | Rate | | Maturity | Face
Amount ($) | Value ($) |
| Falls City ISD |
| ULT GO Bonds Series 2014 | 5.00% | | 08/15/30 (a)(f) | 930,000 | 933,616 |
| Forney ISD |
| ULT GO Refunding Bonds Series 2015 | 5.00% | | 08/15/32 (a)(f) | 400,000 | 469,020 |
| Godley ISD | | | |
| ULT GO Refunding Bonds Series 2021 | 5.00% | | 02/15/30 (f) | 240,000 | 315,120 |
| ULT GO Refunding Bonds Series 2021 | 5.00% | | 02/15/31 (f) | 260,000 | 347,579 |
| Houston Airport System |
| Sub Lien Refunding RB Series 2021A | 4.00% | | 07/01/46 (a) | 2,500,000 | 2,933,133 |
| Lewisville ISD |
| ULT Refunding GO Bonds Series 2020 | 5.00% | | 08/15/23 (f) | 2,500,000 | 2,738,333 |
| North Fort Bend Water Auth |
| Water System Refunding RB Series 2021 | 5.00% | | 12/15/31 (d)(f) | 1,670,000 | 2,275,890 |
| North Texas Tollway Auth | | | |
| System 2nd Tier Refunding RB Series 2021B | 4.00% | | 01/01/34 (a) | 1,000,000 | 1,226,149 |
| System 2nd Tier Refunding RB Series 2021B | 4.00% | | 01/01/35 (a) | 1,000,000 | 1,218,492 |
| System 2nd Tier Refunding RB Series 2021B | 4.00% | | 01/01/36 (a) | 1,000,000 | 1,212,269 |
| System 2nd Tier Refunding RB Series 2021B | 4.00% | | 01/01/37 (a) | 1,100,000 | 1,330,273 |
| System RB Series 2011A | 5.00% | | 09/01/21 (b) | 500,000 | 500,000 |
| Pearland |
| GO Refunding Bonds Series 2015 | 5.00% | | 03/01/24 | 1,650,000 | 1,841,796 |
| San Antonio |
| Water System Jr Lien RB Series 2019A | 2.63% | | 05/01/49 (a)(g) | 5,000,000 | 5,328,506 |
| San Marcos Consolidated ISD | | | |
| ULT GO Refunding Bonds Series 2021A | 3.00% | | 08/01/27 (f) | 5,185,000 | 5,910,756 |
| ULT GO Refunding Bonds Series 2021A | 3.25% | | 08/01/28 (f) | 5,445,000 | 6,369,117 |
| Seguin ISD |
| ULT GO Refunding Bonds Series 2016 | 5.00% | | 08/15/28 (a)(f) | 445,000 | 523,312 |
| Spring Branch ISD |
| ULT GO Bonds Series 2019 | 5.00% | | 02/01/28 (f) | 620,000 | 787,873 |
| Spring ISD | | | |
| ULT Refunding GO Bonds Series 2020 | 5.00% | | 08/15/22 (f) | 750,000 | 784,854 |
| ULT Refunding GO Bonds Series 2020 | 5.00% | | 08/15/23 (f) | 625,000 | 683,809 |
| ULT Refunding GO Bonds Series 2020 | 5.00% | | 08/15/24 (f) | 1,000,000 | 1,139,970 |
| ULT Refunding GO Bonds Series 2020 | 5.00% | | 08/15/25 (f) | 1,000,000 | 1,181,155 |
| ULT Refunding GO Bonds Series 2020 | 5.00% | | 08/15/26 (f) | 1,000,000 | 1,218,489 |
| Texas Dept of Housing & Community Affairs | | | |
| Residential Mortgage RB Series 2019A | 4.75% | | 01/01/49 (a) | 1,710,000 | 1,917,071 |
| S/F Mortgage RB Series 2018A | 4.75% | | 03/01/49 (a) | 1,225,000 | 1,372,162 |
| Texas Municipal Gas Corp III | | | |
| Gas Supply Refunding RB Series 2021 | 5.00% | | 12/15/31 | 1,000,000 | 1,338,872 |
| Gas Supply Refunding RB Series 2021 | 5.00% | | 12/15/32 | 1,250,000 | 1,696,893 |
| Texas State Affordable Housing Corp | | | |
| S/F Mortgage RB Series 2011B | 4.45% | | 09/01/28 (a) | 70,000 | 70,000 |
| S/F Mortgage RB Series 2019A | 4.25% | | 03/01/49 (a) | 1,300,000 | 1,444,809 |
| Texas Transportation Corp |
| Sr Lien Refunding RB (LBJ Infrastructure) Series 2020A | 4.00% | | 12/31/30 | 500,000 | 613,878 |
Schwab Municipal Bond Funds | Annual Report
Schwab Tax-Free Bond Fund
Portfolio Holdings as of August 31, 2021 (continued)
Issuer
Type of Security, Series | Rate | | Maturity | Face
Amount ($) | Value ($) |
| Texas Water Dev Brd | | | |
| State Revolving Fund RB Series 2020 | 5.00% | | 08/01/23 | 500,000 | 546,733 |
| State Revolving Fund RB Series 2020 | 5.00% | | 08/01/24 | 750,000 | 854,364 |
| | | | | | 73,788,744 |
| UTAH 0.1% |
| Utah Board of Regents | | | |
| Student Building Fee RB Series 2018 | 5.00% | | 03/01/27 (a) | 360,000 | 417,893 |
| Student Building Fee RB Series 2018 | 5.00% | | 03/01/28 (a) | 425,000 | 492,862 |
| | | | | | 910,755 |
| VERMONT 0.8% |
| Vermont HFA | | | |
| Multiple Purpose Bonds Series 2017D | 4.00% | | 05/01/48 (a) | 770,000 | 821,064 |
| Multiple Purpose Bonds Series 2018A | 4.00% | | 11/01/48 (a) | 3,660,000 | 3,963,507 |
| Multiple Purpose Bonds Series 2018C | 4.75% | | 11/01/48 (a) | 1,783,000 | 1,970,750 |
| | | | | | 6,755,321 |
| VIRGINIA 1.5% |
| Chesapeake Bay Bridge & Tunnel District |
| BAN 2019 | 5.00% | | 11/01/23 | 4,250,000 | 4,681,197 |
| Fairfax Cnty |
| GO Bonds Series 2020A | 5.00% | | 10/01/33 (a) | 5,000,000 | 6,633,939 |
| Prince William Cnty IDA |
| RB (George Mason Univ) Series 2011AA | 5.50% | | 09/01/34 (a)(b) | 220,000 | 220,000 |
| Richmond Metropolitan Auth |
| Expressway Refunding & RB Series 1998 | 5.25% | | 07/15/22 (b) | 305,000 | 318,373 |
| | | | | | 11,853,509 |
| WASHINGTON 4.0% |
| Energy Northwest | | | |
| Electric Refunding RBs Series 2020A | 5.00% | | 07/01/27 | 1,000,000 | 1,251,242 |
| Electric Refunding RBs Series 2020A | 5.00% | | 07/01/28 | 3,585,000 | 4,603,558 |
| King Cnty Public Hospital District #2 | | | |
| LT GO Refunding Bonds (EvergreenHealth) Series 2015 | 5.00% | | 12/01/22 | 1,755,000 | 1,861,769 |
| LT GO Refunding Bonds (EvergreenHealth) Series 2015 | 5.00% | | 12/01/24 | 690,000 | 793,498 |
| Lake Washington SD #414 |
| ULT Refunding GO Bonds Series 2020 | 4.00% | | 12/01/28 (c)(f) | 10,000,000 | 12,291,048 |
| Mason Cnty Public Hospital District #1 |
| Hospital RB Series 2018 | 5.00% | | 12/01/48 (a) | 505,000 | 608,412 |
| Moses Lake SD #161 | | | |
| ULT GO Bonds Series 2018 | 5.00% | | 12/01/33 (a)(f) | 1,000,000 | 1,258,008 |
| ULT GO Bonds Series 2018 | 5.00% | | 12/01/34 (a)(f) | 1,000,000 | 1,256,505 |
| ULT GO Bonds Series 2018 | 5.00% | | 12/01/35 (a)(f) | 1,250,000 | 1,570,866 |
| Ocosta SD #172 |
| ULT GO Bonds 2013 | 5.00% | | 12/01/23 (f) | 340,000 | 376,266 |
| Port of Bellingham | | | |
| Refunding RB 2019 | 5.00% | | 12/01/27 | 500,000 | 631,932 |
| Refunding RB 2019 | 5.00% | | 12/01/28 | 460,000 | 594,401 |
Schwab Municipal Bond Funds | Annual Report
Schwab Tax-Free Bond Fund
Portfolio Holdings as of August 31, 2021 (continued)
Issuer
Type of Security, Series | Rate | | Maturity | Face
Amount ($) | Value ($) |
| Refunding RB 2019 | 5.00% | | 12/01/29 (a) | 500,000 | 649,267 |
| Refunding RB 2019 | 5.00% | | 12/01/30 (a) | 625,000 | 804,799 |
| Tukwila SD #406 |
| ULT GO Series 2018 | 5.00% | | 12/01/37 (a)(f) | 2,830,000 | 3,531,568 |
| | | | | | 32,083,139 |
| WEST VIRGINIA 0.2% |
| West Virginia Hospital Finance Auth |
| Hospital Refunding RB (Cabell Huntington Hospital) Series 2018A | 5.00% | | 01/01/36 (a) | 1,400,000 | 1,729,312 |
| WISCONSIN 1.7% |
| Wisconsin Center District | | | |
| Jr Dedicated Tax RB Series 2020D | 0.00% | | 12/15/30 (e) | 410,000 | 355,688 |
| Jr Dedicated Tax RB Series 2020D | 0.00% | | 12/15/31 (a)(e) | 640,000 | 534,497 |
| Jr Dedicated Tax RB Series 2020D | 0.00% | | 12/15/32 (a)(e) | 1,250,000 | 1,005,614 |
| Jr Dedicated Tax RB Series 2020D | 0.00% | | 12/15/33 (a)(e) | 2,000,000 | 1,546,914 |
| Jr Dedicated Tax RB Series 2020D | 0.00% | | 12/15/34 (a)(e) | 1,820,000 | 1,353,692 |
| Jr Dedicated Tax RB Series 2020D | 0.00% | | 12/15/35 (a)(e) | 2,900,000 | 2,071,914 |
| Jr Dedicated Tax RB Series 2020D | 0.00% | | 12/15/36 (a)(e) | 3,000,000 | 2,056,982 |
| Wisconsin Health & Educational Facilities Auth | | | |
| RB (Franciscan Sisters of Christian Charity) Series 2017A | 5.00% | | 09/01/31 (a)(b) | 1,000,000 | 1,245,457 |
| RB (Franciscan Sisters of Christian Charity) Series 2017A | 5.00% | | 09/01/32 (a)(b) | 1,025,000 | 1,276,594 |
| RB (Thedacare) Series 2015 | 5.00% | | 12/15/21 | 200,000 | 202,761 |
| RB (Thedacare) Series 2015 | 5.00% | | 12/15/22 | 1,045,000 | 1,109,555 |
| RB (UnityPoint Health) Series 2014A | 5.00% | | 12/01/24 (a) | 1,000,000 | 1,148,191 |
| | | | | | 13,907,859 |
| WYOMING 0.5% |
| Laramie Cnty | | | |
| Hospital Refunding RB (Cheyenne Regional Medical Center) Series 2021 | 4.00% | | 05/01/28 | 440,000 | 524,932 |
| Hospital Refunding RB (Cheyenne Regional Medical Center) Series 2021 | 4.00% | | 05/01/30 | 500,000 | 610,621 |
| Hospital Refunding RB (Cheyenne Regional Medical Center) Series 2021 | 4.00% | | 05/01/34 (a) | 495,000 | 604,414 |
| Hospital Refunding RB (Cheyenne Regional Medical Center) Series 2021 | 4.00% | | 05/01/36 (a) | 400,000 | 485,322 |
| Hospital Refunding RB (Cheyenne Regional Medical Center) Series 2021 | 4.00% | | 05/01/38 (a) | 400,000 | 482,408 |
| Hospital Refunding RB (Cheyenne Regional Medical Center) Series 2021 | 3.00% | | 05/01/42 (a) | 1,000,000 | 1,073,091 |
| | | | | | 3,780,788 |
| Total Fixed-Rate Obligations |
| (Cost $656,303,252) | | | | | 697,669,563 |
|
| Variable-Rate Obligations 14.6% of net assets |
| ARIZONA 0.4% |
| Arizona Health Facilities Auth |
| Refunding RB (Phoenix Childrens Hospital) Series 2013A3 | | | | | |
| (SIFMA Municipal Swap Index + 1.85%) | 1.87% | | 02/01/48 (a) | 3,000,000 | 3,037,195 |
Schwab Municipal Bond Funds | Annual Report
Schwab Tax-Free Bond Fund
Portfolio Holdings as of August 31, 2021 (continued)
Issuer
Type of Security, Series | Rate | | Maturity | Face
Amount ($) | Value ($) |
| CALIFORNIA 1.8% |
| Bay Area Toll Auth | | | |
| Toll Bridge RB Series 2017H | 2.13% | | 04/01/53 (a)(g) | 3,000,000 | 3,155,268 |
| Toll Bridge RB Series 2018A | 2.63% | | 04/01/45 (a)(g) | 3,000,000 | 3,254,285 |
| Toll Bridge RB Series 2021C | | | | | |
| (SIFMA Municipal Swap Index + 0.45%) | 0.47% | | 04/01/56 (a) | 5,000,000 | 5,030,877 |
| California Health Facilities Financing Auth |
| RB (Adventist Health System) Series 2011A | 3.00% | | 03/01/41 (a)(g) | 2,685,000 | 2,814,229 |
| | | | | | 14,254,659 |
| COLORADO 1.5% |
| Colorado Health Facilities Auth |
| Hospital RB (AdventHealth) Series 2019B | 5.00% | | 11/15/49 (a)(g) | 4,000,000 | 4,925,568 |
| Denver |
| Airport System RB Series 2019D | 5.00% | | 11/15/31 (a)(g) | 1,750,000 | 1,849,420 |
| Univ of Colorado |
| Refunding RB Series 2019C | 2.00% | | 06/01/54 (a)(g) | 5,000,000 | 5,251,528 |
| | | | | | 12,026,516 |
| DISTRICT OF COLUMBIA 0.4% |
| District of Columbia Water & Sewer Auth |
| Public Utility Sub Lien RB Series 2019C | 1.75% | | 10/01/54 (a)(g) | 3,000,000 | 3,126,619 |
| FLORIDA 0.6% |
| Hillsborough Cnty IDA |
| Health System RB (Baycare Health) Series 2020B | 0.01% | | 11/01/38 (a)(f)(h) | 815,000 | 815,000 |
| Orlando Utilities Commission |
| Utilities System RB Series 2021B | 1.25% | | 10/01/46 (a)(g) | 4,000,000 | 4,051,937 |
| | | | | | 4,866,937 |
| GEORGIA 0.6% |
| Main St Natural Gas Inc |
| Gas Supply RB Series 2018E | | | | | |
| (SIFMA Municipal Swap Index + 0.57%) | 0.59% | | 08/01/48 (a) | 5,000,000 | 5,019,204 |
| IOWA 0.9% |
| Iowa Finance Auth | | | |
| Health Facilities RB (UnityPoint Health) Series 2013B2 | 0.01% | | 02/15/39 (a)(f)(h) | 500,000 | 500,000 |
| RB (UnityPoint Health) Series 2018E | 0.01% | | 02/15/41 (a)(f)(h) | 520,000 | 520,000 |
| Public Energy Financing Auth |
| Gas Project RB Series 2019 | 5.00% | | 09/01/49 (a)(f)(g) | 5,000,000 | 6,013,345 |
| | | | | | 7,033,345 |
| MONTANA 0.7% |
| Montana Facility Finance Auth |
| RB (Billings Clinic) Series 2018C | | | | | |
| (SIFMA Municipal Swap Index + 0.55%) | 0.57% | | 08/15/37 (a) | 3,000,000 | 3,003,954 |
Schwab Municipal Bond Funds | Annual Report
Schwab Tax-Free Bond Fund
Portfolio Holdings as of August 31, 2021 (continued)
Issuer
Type of Security, Series | Rate | | Maturity | Face
Amount ($) | Value ($) |
| Montana State Board of Regents |
| Educational Facilities Refunding RB (Montana State Univ) Series 2012A | | | | | |
| (SIFMA Municipal Swap Index + 0.45%) | 0.47% | | 11/15/35 (a) | 3,090,000 | 3,099,029 |
| | | | | | 6,102,983 |
| NEW YORK 0.8% |
| New York City |
| GO Bonds Fiscal 2017 Series A5 | 0.01% | | 08/01/44 (a)(f)(h) | 2,665,000 | 2,665,000 |
| New York Liberty Development Corp |
| RB (Goldman Sachs Headquarters) Series 2005 | 0.27% | | 10/01/35 (a)(f)(i)(j) | 3,750,000 | 3,750,000 |
| | | | | | 6,415,000 |
| OREGON 1.2% |
| Marion & Polk Cnty SD |
| GO Bonds Series 2020B | 5.00% | | 06/15/34 (a)(f) | 1,000,000 | 1,316,326 |
| Oregon Business Development Commission |
| Recovery Zone Facility Bonds (Intel Corp) Series 232 | 2.40% | | 12/01/40 (a)(g) | 3,000,000 | 3,117,543 |
| St. Helens SD #502 |
| GO Bonds Series 2020B | 0.00% | | 06/15/45 (a)(f)(k) | 1,665,000 | 2,042,458 |
| Umatilla SD #6R | | | |
| GO Bonds Series 2017 | 0.00% | | 06/15/29 (a)(f)(k) | 340,000 | 384,416 |
| GO Bonds Series 2017 | 0.00% | | 06/15/30 (a)(f)(k) | 300,000 | 338,110 |
| GO Bonds Series 2017 | 0.00% | | 06/15/31 (a)(f)(k) | 300,000 | 336,792 |
| GO Bonds Series 2017 | 0.00% | | 06/15/32 (a)(f)(k) | 350,000 | 391,911 |
| GO Bonds Series 2017 | 0.00% | | 06/15/33 (a)(f)(k) | 520,000 | 580,823 |
| GO Bonds Series 2017 | 0.00% | | 06/15/34 (a)(f)(k) | 350,000 | 389,962 |
| GO Bonds Series 2017 | 0.00% | | 06/15/35 (a)(f)(k) | 410,000 | 456,108 |
| | | | | | 9,354,449 |
| SOUTH CAROLINA 0.2% |
| South Carolina Educational Facilities Auth |
| Educational Facilities RB (Wofford College) Series 2007B | 2.38% | | 04/01/27 (a)(g) | 1,515,000 | 1,531,580 |
| TEXAS 4.4% |
| Clear Creek ISD |
| ULT GO Bonds Series 2013B | 0.28% | | 02/15/38 (a)(f)(g) | 4,000,000 | 3,997,648 |
| Denton ISD |
| ULT GO Series 2014B | 2.00% | | 08/01/44 (a)(f)(g) | 2,000,000 | 2,098,115 |
| Fort Bend ISD |
| ULT GO Refunding Bonds Series 2020B | 0.88% | | 08/01/50 (a)(f)(g) | 2,385,000 | 2,423,923 |
| Gulf Coast IDA |
| RB (ExxonMobil) Series 2012 | 0.01% | | 11/01/41 (a)(h) | 5,775,000 | 5,775,000 |
| Katy ISD |
| ULT GO Bonds Series 2021C | 1.50% | | 08/15/50 (a)(d)(f)(g) | 12,000,000 | 12,427,774 |
| Lower Neches Valley Auth Industrial Development Corp |
| RB (ExxonMobil) Series 2010 | 0.01% | | 11/01/38 (a)(h) | 600,000 | 600,000 |
Schwab Municipal Bond Funds | Annual Report
Schwab Tax-Free Bond Fund
Portfolio Holdings as of August 31, 2021 (continued)
Issuer
Type of Security, Series | Rate | | Maturity | Face
Amount ($) | Value ($) |
| Northside ISD | | | |
| ULT GO Refunding Bonds Series 2020 | 0.70% | | 06/01/50 (a)(f)(g) | 5,000,000 | 5,037,924 |
| ULT GO Series 2019 | 1.60% | | 08/01/49 (a)(f)(g) | 2,960,000 | 3,063,884 |
| | | | | | 35,424,268 |
| WISCONSIN 0.3% |
| Wisconsin Health & Educational Facilities Auth | | | |
| RB (Advocate Aurora Health) Series 2018C4 | | | | | |
| (SIFMA Municipal Swap Index + 0.65%) | 0.67% | | 08/15/54 (a) | 1,700,000 | 1,714,124 |
| Refunding RB (Froedtert Health) Series 2021A | 0.01% | | 04/01/35 (a)(f)(h) | 700,000 | 700,000 |
| | | | | | 2,414,124 |
| WYOMING 0.8% |
| Sublette Cnty |
| Pollution Control Refunding RB (Exxon Mobil) Series 2014 | 0.02% | | 10/01/44 (a)(h) | 6,450,000 | 6,450,000 |
| Total Variable-Rate Obligations |
| (Cost $114,658,392) | | | | | 117,056,879 |
| (a) | The effective maturity may be shorter than the final maturity shown because the security is subject to a put, demand or call feature. |
| (b) | Refunded bond. |
| (c) | All or a portion of this security is designated as collateral for delayed-delivery securities. |
| (d) | Security or a portion of the security purchased on a delayed-delivery or when-issued basis. |
| (e) | Zero coupon bond. |
| (f) | Credit-enhanced or liquidity-enhanced. |
| (g) | Bond currently pays a fixed coupon rate and will be remarketed at a to be determined rate at the end of the current fixed rate term. |
| (h) | VRDN is a municipal security which allows holders to sell their security through a put or tender feature, at par value plus accrued interest. The interest rate resets on a periodic basis, the majority of which are weekly but may be daily or monthly. Unless a reference rate and spread is shown parenthetically, the Remarketing Agent, generally a dealer, determines the interest rate for the security at each interest rate reset date. The rate is typically based on the SIFMA Municipal Swap Index. |
| (i) | Securities exempt from registration under Rule 144A of the Securities Act of 1933, as amended. These securities may be resold in transactions exempt from registrations, normally to qualified institutional buyers. At the period end, the value of these amounted to $3,750,000 or 0.5% of net assets. |
| (j) | TOB is a synthetically created VRDN where the owner of a long-term bond places the bond in a trust in combination with a liquidity facility. The trust then sells certificates which mirror the VRDN sold directly by a municipal issuer. VRDN is a municipal security which allows holders to sell their security through a put or tender feature, at par value plus accrued interest. The interest rate resets on a periodic basis, the majority of which are weekly but may be daily or monthly. Unless a reference rate and spread is shown parenthetically, the Remarketing Agent, generally a dealer, determines the interest rate for the security at each interest rate reset date. The rate is typically based on the SIFMA Municipal Swap Index. |
| (k) | Step up bond that pays an initial coupon rate for a set period and increased coupon rates at one or more preset intervals. Rate shown is as of period end. |
| | |
| BAN — | Bond anticipation note |
| COP — | Certificate of participation |
| GO — | General obligation |
| HFA — | Housing finance agency/authority |
| HSD — | High school district |
| IDA — | Industrial development agency/authority |
| ISD — | Independent school district |
| LT — | Limited tax |
| RB — | Revenue bond |
| SD — | School district |
| S/F — | Single-family |
| SIFMA — | Securities Industry and Financial Markets Association. The SIFMA Municipal Swap Index is a market index comprised of high-grade 7-day tax-exempt Variable Rate Demand Obligations with certain characteristics. |
| TOB — | Tender option bond |
| ULT — | Unlimited tax |
| USD — | Unified school district |
| VRDN — | Variable rate demand note |
Schwab Municipal Bond Funds | Annual Report
Schwab Tax-Free Bond Fund
Portfolio Holdings as of August 31, 2021 (continued)
The following is a summary of the inputs used to value the fund’s investments as of August 31, 2021 (see financial note 2(a) for additional information):
| Description | Quoted Prices in
Active Markets for
Identical Assets
(Level 1) | Other Significant
Observable Inputs
(Level 2) | Significant
Unobservable Inputs
(Level 3) | Total | |
| Assets | | | | | |
| Fixed-Rate Obligations1 | $— | $697,669,563 | $— | $697,669,563 | |
| Variable-Rate Obligations1 | — | 117,056,879 | — | 117,056,879 | |
| Total | $— | $814,726,442 | $— | $814,726,442 | |
| 1 | As categorized in the Portfolio Holdings. |
Schwab Municipal Bond Funds | Annual Report
Schwab Tax-Free Bond Fund
Statement of Assets and Liabilities
As of August 31, 2021
| Assets |
| Investments in securities, at value - unaffiliated (cost $770,961,644) | | $814,726,442 |
| Cash | | 638,230 |
| Receivables: | | |
| Investments sold | | 63,946 |
| Interest | | 7,207,717 |
| Fund shares sold | | 203,638 |
| Prepaid expenses | + | 23,455 |
| Total assets | | 822,863,428 |
| Liabilities |
| Payables: | | |
| Investments bought | | 40,205 |
| Investments bought - delayed-delivery | | 19,849,608 |
| Investment adviser and administrator fees | | 155,455 |
| Shareholder service fees | | 166,093 |
| Fund shares redeemed | | 836,607 |
| Distributions to shareholders | | 449,496 |
| Accrued expenses | + | 132,275 |
| Total liabilities | | 21,629,739 |
| Net Assets |
| Total assets | | 822,863,428 |
| Total liabilities | – | 21,629,739 |
| Net assets | | $801,233,689 |
| Net Assets by Source | | |
| Capital received from investors | | 754,456,844 |
| Total distributable earnings | | 46,776,845 |
| Net Asset Value (NAV) |
| Net Assets | ÷ | Shares
Outstanding | = | NAV |
| $801,233,689 | | 65,588,931 | | $12.22 |
| | | | | |
Schwab Municipal Bond Funds | Annual Report
Schwab Tax-Free Bond Fund
Statement of Operations
For the period September 1, 2020 through August 31, 2021
| Investment Income |
| Interest received from securities — unaffiliated | | $17,552,516 |
| Expenses |
| Investment adviser and administrator fees | | 2,149,552 |
| Shareholder service fees | | 1,930,890 |
| Portfolio accounting fees | | 99,607 |
| Registration fees | | 48,103 |
| Shareholder reports | | 41,252 |
| Professional fees | | 40,284 |
| Independent trustees’ fees | | 14,991 |
| Custodian fees | | 10,807 |
| Transfer agent fees | | 7,421 |
| Other expenses | + | 10,785 |
| Total expenses | | 4,353,692 |
| Expense reduction by CSIM and its affiliates | – | 456,204 |
| Net expenses | – | 3,897,488 |
| Net investment income | | 13,655,028 |
| Realized and Unrealized Gains (Losses) |
| Net realized gains on sales of securities — unaffiliated | | 5,327,481 |
| Net change in unrealized appreciation (depreciation) on securities — unaffiliated | + | 4,317,351 |
| Net realized and unrealized gains | | 9,644,832 |
| Increase in net assets resulting from operations | | $23,299,860 |
Schwab Municipal Bond Funds | Annual Report
Schwab Tax-Free Bond Fund
Statement of Changes in Net Assets
For the current and prior report periods
| Operations | |
| | 9/1/20-8/31/21 | 9/1/19-8/31/20 |
| Net investment income | | $13,655,028 | $15,983,456 |
| Net realized gains | | 5,327,481 | 2,034,233 |
| Net change in unrealized appreciation (depreciation) | + | 4,317,351 | (2,763,710) |
| Increase in net assets from operations | | 23,299,860 | 15,253,979 |
| Distributions to Shareholders | |
| Total distributions | | ($17,872,764) | ($18,059,870) |
| Transactions in Fund Shares | | | |
| | | 9/1/20-8/31/21 | 9/1/19-8/31/20 |
| | | SHARES | VALUE | SHARES | VALUE |
| Shares sold | | 16,057,282 | $195,525,698 | 22,312,965 | $266,887,982 |
| Shares reinvested | | 848,917 | 10,335,421 | 839,847 | 10,070,852 |
| Shares redeemed | + | (13,794,704) | (167,898,476) | (22,653,985) | (267,662,212) |
| Net transactions in fund shares | | 3,111,495 | $37,962,643 | 498,827 | $9,296,622 |
| Shares Outstanding and Net Assets | | | |
| | | 9/1/20-8/31/21 | 9/1/19-8/31/20 |
| | | SHARES | NET ASSETS | SHARES | NET ASSETS |
| Beginning of period | | 62,477,436 | $757,843,950 | 61,978,609 | $751,353,219 |
| Total increase | + | 3,111,495 | 43,389,739 | 498,827 | 6,490,731 |
| End of period | | 65,588,931 | $801,233,689 | 62,477,436 | $757,843,950 |
Schwab Municipal Bond Funds | Annual Report
Schwab California Tax-Free Bond Fund
Financial Statements
Financial Highlights
| | 9/1/20–
8/31/21 | 9/1/19–
8/31/20 | 9/1/18–
8/31/19 | 9/1/17–
8/31/18 | 9/1/16–
8/31/17 | |
| Per-Share Data |
| Net asset value at beginning of period | $12.26 | $12.23 | $11.69 | $11.96 | $12.30 | |
| Income (loss) from investment operations: | | | | | | |
| Net investment income (loss)1 | 0.20 | 0.24 | 0.29 | 0.28 | 0.28 | |
| Net realized and unrealized gains (losses) | 0.07 | 0.07 | 0.54 | (0.27) | (0.25) | |
| Total from investment operations | 0.27 | 0.31 | 0.83 | 0.01 | 0.03 | |
| Less distributions: | | | | | | |
| Distributions from net investment income | (0.20) | (0.24) | (0.29) | (0.28) | (0.28) | |
| Distributions from net realized gains | (0.09) | (0.04) | — | — | (0.09) | |
| Total distributions | (0.29) | (0.28) | (0.29) | (0.28) | (0.37) | |
| Net asset value at end of period | $12.24 | $12.26 | $12.23 | $11.69 | $11.96 | |
| Total return | 2.25% | 2.54% | 7.19% | 0.14% | 0.36% | |
| Ratios/Supplemental Data |
| Ratios to average net assets: | | | | | | |
| Net operating expenses | 0.49% | 0.49% | 0.49% | 0.49% | 0.49% | |
| Gross operating expenses | 0.58% | 0.58% | 0.60% | 0.60% | 0.59% | |
| Net investment income (loss) | 1.64% | 1.97% | 2.42% | 2.42% | 2.38% | |
| Portfolio turnover rate | 43% | 78% | 75% | 59% | 64% | |
| Net assets, end of period (x 1,000,000) | $504 | $488 | $488 | $395 | $427 | |
| |
1
Calculated based on the average shares outstanding during the period.
Schwab Municipal Bond Funds | Annual Report
Schwab California Tax-Free Bond Fund
Portfolio Holdings as of August 31, 2021
This section shows all the securities in the fund’s portfolio and their values as of the report date.
The fund files its complete schedule of portfolio holdings with the U.S. Securities and Exchange Commission (SEC) for the first and third quarters of each fiscal year on Form N-PORT Part F. The fund’s Form N-PORT Part F is available on the SEC’s website at www.sec.gov. You can also obtain this information at no cost on the fund’s website at www.schwabassetmanagement.com/schwabfunds_prospectus, by calling 1-866-414-6349, or by sending an email request to orders@mysummaryprospectus.com. The fund also makes available its complete schedule of portfolio holdings 15 to 20 days after the end of the month on the fund’s website.
For fixed-rate obligations, the rate shown is the interest rate (the rate established when the obligation was issued). For variable-rate obligations, the rate shown is the rate as of the report date based on each security’s rate reset date. The reference rate and spread used is shown parenthetically in the security description, if available; if not, the reference rate is described in a footnote. The maturity date shown for all the securities is the final legal maturity.
Issuer
Type of Security, Series | Rate | | Maturity | Face
Amount ($) | Value ($) |
| Fixed-Rate Obligations 90.8% of net assets |
| CALIFORNIA 90.8% |
| Alameda City USD | | | |
| GO Bonds Series C | 4.00% | | 08/01/28 (a) | 400,000 | 480,488 |
| GO Bonds Series C | 4.00% | | 08/01/30 (a) | 450,000 | 533,606 |
| GO Bonds Series C | 4.00% | | 08/01/32 (a) | 250,000 | 293,745 |
| Alameda Corridor Transportation Auth |
| Sr Lien Refunding RB Series 2013A | 5.00% | | 10/01/28 (a) | 2,060,000 | 2,262,567 |
| American Canyon Finance Auth | | | |
| Refunding RB Series 2015 | 5.00% | | 09/02/22 | 345,000 | 362,040 |
| Refunding RB Series 2015 | 5.00% | | 09/02/23 | 575,000 | 630,023 |
| Refunding RB Series 2015 | 5.00% | | 09/02/25 | 690,000 | 816,016 |
| Banning Financing Auth |
| Electric System Refunding RB Series 2015 | 5.00% | | 06/01/27 (a) | 650,000 | 754,846 |
| Beverly Hills USD | | | |
| GO Bonds Series 2009 | 0.00% | | 08/01/26 (b) | 555,000 | 541,006 |
| GO Bonds Series 2017 | 0.00% | | 08/01/34 (a)(b) | 7,705,000 | 5,363,429 |
| California | | | |
| GO Bonds | 5.00% | | 09/01/25 (a) | 1,815,000 | 1,989,987 |
| GO Bonds | 5.00% | | 09/01/42 (a) | 1,500,000 | 1,570,479 |
| GO Bonds Series 2010 | 4.00% | | 11/01/34 (a) | 1,000,000 | 1,242,315 |
| GO Bonds Series CQ | 4.00% | | 12/01/47 (a) | 3,280,000 | 3,559,762 |
| GO Refunding Bonds | 5.00% | | 12/01/26 | 5,000,000 | 6,180,653 |
| GO Refunding Bonds | 5.00% | | 08/01/27 | 2,730,000 | 3,438,056 |
| GO Refunding Bonds | 5.25% | | 10/01/32 (a) | 1,960,000 | 1,968,016 |
| GO Refunding Bonds | 5.00% | | 09/01/41 (a)(c) | 4,000,000 | 5,329,998 |
| GO Refunding Bonds Series 2016 | 5.00% | | 09/01/29 (a) | 1,290,000 | 1,571,853 |
| GO Refunding Bonds Series 2017 | 5.00% | | 08/01/32 (a) | 2,000,000 | 2,424,350 |
| California Cnty Tobacco Securitization Agency | | | |
| Tobacco Settlement (Gold Country) Sr Refunding Bonds Series 2020A | 4.00% | | 06/01/37 (a) | 1,095,000 | 1,337,849 |
| Tobacco Settlement (Gold Country) Sub Refunding Bonds Series 2020B1 | 1.10% | | 06/01/30 | 10,000 | 10,048 |
| Tobacco Settlement (Gold Country) Sub Refunding Bonds Series 2020B1 | 4.00% | | 06/01/49 (a) | 325,000 | 372,878 |
| Tobacco Settlement (Los Angeles Cnty Securitization) RB Series 2020A | 4.00% | | 06/01/36 (a) | 1,510,000 | 1,845,701 |
| Tobacco Settlement (Los Angeles Cnty Securitization) RB Series 2020A | 4.00% | | 06/01/37 (a) | 310,000 | 377,620 |
| Tobacco Settlement (Los Angeles Cnty Securitization) RB Series 2020A | 4.00% | | 06/01/38 (a) | 340,000 | 413,249 |
| Tobacco Settlement (Los Angeles Cnty Securitization) Series 2020B-1 | 1.75% | | 06/01/30 | 40,000 | 40,353 |
| Tobacco Settlement (Los Angeles Cnty Securitization) Sr RB Series 2020A | 4.00% | | 06/01/49 (a) | 1,530,000 | 1,813,639 |
Schwab Municipal Bond Funds | Annual Report
Schwab California Tax-Free Bond Fund
Portfolio Holdings as of August 31, 2021 (continued)
Issuer
Type of Security, Series | Rate | | Maturity | Face
Amount ($) | Value ($) |
| Tobacco Settlement Sr RB (Sonoma Cnty Securitization Corp) Series 2020A | 5.00% | | 06/01/24 | 210,000 | 236,349 |
| Tobacco Settlement Sr RB (Sonoma Cnty Securitization Corp) Series 2020A | 5.00% | | 06/01/25 | 175,000 | 204,128 |
| Tobacco Settlement Sr RB (Sonoma Cnty Securitization Corp) Series 2020A | 5.00% | | 06/01/26 | 225,000 | 271,084 |
| Tobacco Settlement Sr RB (Sonoma Cnty Securitization Corp) Series 2020A | 5.00% | | 06/01/27 | 250,000 | 310,321 |
| Tobacco Settlement Sr RB (Sonoma Cnty Securitization Corp) Series 2020A | 5.00% | | 06/01/28 | 150,000 | 190,896 |
| Tobacco Settlement Sub RB (Sonoma Cnty Securitization Corp) Series 2020B1 | 1.38% | | 06/01/30 | 20,000 | 20,162 |
| California Educational Facilities Auth | | | |
| RB (Art Center College of Design) Series 2018A | 5.00% | | 12/01/35 (a) | 1,250,000 | 1,541,707 |
| RB (Art Center College of Design) Series 2018A | 5.00% | | 12/01/44 (a) | 1,000,000 | 1,210,026 |
| California Health Facilities Financing Auth | | | |
| Insured RB (Northern CA Presbyterian Home & Services) Series 2015 | 5.00% | | 07/01/23 (d) | 175,000 | 190,114 |
| RB (Childrens Hospital of Orange Cnty) Series 2019A | 4.00% | | 11/01/29 | 500,000 | 625,814 |
| RB (Childrens Hospital of Orange Cnty) Series 2019A | 5.00% | | 11/01/30 (a) | 500,000 | 663,388 |
| RB (Childrens Hospital of Orange Cnty) Series 2019A | 5.00% | | 11/01/31 (a) | 965,000 | 1,275,956 |
| RB (CommonSpirit Health) Series 2020A | 4.00% | | 04/01/36 (a) | 2,500,000 | 3,006,370 |
| RB (On Lok Sr Health Services) Series 2020 | 5.00% | | 08/01/40 (a) | 650,000 | 817,852 |
| RB (On Lok Sr Health Services) Series 2020 | 5.00% | | 08/01/50 (a) | 1,000,000 | 1,238,064 |
| Refunding RB (Marshall Medical Center) Series 2015 | 5.00% | | 11/01/22 (d) | 275,000 | 290,556 |
| Refunding RB (Marshall Medical Center) Series 2015 | 5.00% | | 11/01/25 (a)(d) | 200,000 | 228,197 |
| Refunding RB (Marshall Medical Center) Series 2015 | 5.00% | | 11/01/28 (a)(d) | 800,000 | 908,876 |
| California Infrastructure & Economic Development Bank | | | |
| Lease RB (California State Retirement System) Series 2019 | 5.00% | | 08/01/49 (a) | 1,150,000 | 1,438,427 |
| RB (Academy of Motion Picture Arts & Sciences) Series 2015A | 5.00% | | 11/01/24 (a) | 1,635,000 | 1,804,260 |
| Refunding RB (Cal ISO Corp) Series 2013 | 5.00% | | 02/01/30 (a)(e) | 4,130,000 | 4,412,798 |
| Refunding RB (Los Angeles Cnty Museum of Natural History) Series 2020 | 4.00% | | 07/01/50 (a) | 2,500,000 | 2,887,004 |
| Refunding RB (Los Angeles Cnty Museum) Series 2021A | 1.20% | | 12/01/50 (a) | 3,000,000 | 3,039,016 |
| Refunding RB (Performing Arts Center of Los Angeles Cnty) Series 2020 | 4.00% | | 12/01/36 (a) | 430,000 | 519,693 |
| Refunding RB (Performing Arts Center of Los Angeles Cnty) Series 2020 | 4.00% | | 12/01/37 (a) | 475,000 | 572,250 |
| Refunding RB (Performing Arts Center of Los Angeles Cnty) Series 2020 | 5.00% | | 12/01/39 (a) | 1,000,000 | 1,299,568 |
| Refunding RB (Performing Arts Center of Los Angeles Cnty) Series 2020 | 5.00% | | 12/01/41 (a) | 995,000 | 1,285,628 |
| Refunding RB (Walt Disney Family Museum) Series 2016 | 5.00% | | 02/01/29 (a) | 250,000 | 292,539 |
| Refunding RB (Walt Disney Family Museum) Series 2016 | 5.00% | | 02/01/30 (a) | 330,000 | 384,903 |
| Refunding RB (Walt Disney Family Museum) Series 2016 | 5.00% | | 02/01/31 (a) | 350,000 | 407,269 |
| Refunding RBs (Academy of Motion Picture Arts & Sciences) Series 2020B | 5.00% | | 11/01/29 (a) | 1,500,000 | 1,982,364 |
| California Municipal Finance Auth | | | |
| Insured Refunding RB (Channing House) Series 2017A | 5.00% | | 05/15/26 (d) | 360,000 | 435,466 |
| Insured Refunding RB (Channing House) Series 2017A | 5.00% | | 05/15/27 (d) | 350,000 | 434,847 |
| Insured Refunding RB (Channing House) Series 2017A | 5.00% | | 05/15/34 (a)(d) | 1,040,000 | 1,281,554 |
| RB (Clinicas del Camino Real) Series 2020 | 4.00% | | 03/01/28 | 1,455,000 | 1,717,019 |
| RB (Clinicas del Camino Real) Series 2020 | 4.00% | | 03/01/29 | 1,515,000 | 1,808,150 |
| RB (Clinicas del Camino Real) Series 2020 | 4.00% | | 03/01/30 | 790,000 | 950,894 |
| RB (Inland Christian Home) Series 2020 | 4.00% | | 12/01/39 (a)(d) | 1,240,000 | 1,484,752 |
| RB (National Univ) Series 2019A | 5.00% | | 04/01/26 | 650,000 | 780,614 |
| RB (National Univ) Series 2019A | 5.00% | | 04/01/27 | 1,100,000 | 1,358,741 |
| RB (Univ of La Verne) Series 2017A | 5.00% | | 06/01/29 (a) | 1,000,000 | 1,233,382 |
| Refunding RB (Biola Univ) Series 2017 | 5.00% | | 10/01/25 | 155,000 | 181,473 |
| Refunding RB (Eisenhower Medical Center) Series 2017B | 5.00% | | 07/01/27 | 600,000 | 742,595 |
| Refunding RB (Eisenhower Medical Center) Series 2017B | 5.00% | | 07/01/30 (a) | 1,150,000 | 1,404,763 |
| Refunding RB (HumanGood California) Series 2019A | 4.00% | | 10/01/29 (a) | 645,000 | 747,568 |
| Refunding RB (HumanGood California) Series 2019A | 4.00% | | 10/01/30 (a) | 750,000 | 864,671 |
Schwab Municipal Bond Funds | Annual Report
Schwab California Tax-Free Bond Fund
Portfolio Holdings as of August 31, 2021 (continued)
Issuer
Type of Security, Series | Rate | | Maturity | Face
Amount ($) | Value ($) |
| Refunding RB (HumanGood California) Series 2019A | 4.00% | | 10/01/31 (a) | 500,000 | 574,551 |
| Refunding RB (Institute of Aging) Series 2017 | 5.00% | | 08/15/29 (a)(d) | 250,000 | 309,184 |
| Refunding RB (Institute of Aging) Series 2017 | 5.00% | | 08/15/31 (a)(d) | 575,000 | 707,308 |
| Refunding RB (Institute of Aging) Series 2017 | 5.00% | | 08/15/32 (a)(d) | 250,000 | 307,294 |
| Refunding RB (Institute of Aging) Series 2017 | 5.00% | | 08/15/33 (a)(d) | 250,000 | 306,710 |
| California Public Finance Auth | | | |
| RB (Henry Mayo Newhall Hospital) Series 2017 | 5.00% | | 10/15/21 | 410,000 | 412,188 |
| RB (Henry Mayo Newhall Hospital) Series 2017 | 5.00% | | 10/15/33 (a) | 425,000 | 506,920 |
| RB (Henry Mayo Newhall Hospital) Series 2017 | 5.00% | | 10/15/47 (a) | 600,000 | 703,500 |
| California Public Works Board | | | |
| Lease RB Series 2011C | 5.75% | | 10/01/31 (a) | 1,000,000 | 1,004,474 |
| Lease RB Series 2011D | 5.00% | | 12/01/22 (a) | 500,000 | 505,940 |
| Lease RB Series 2012A | 5.00% | | 04/01/23 (a) | 1,850,000 | 1,902,377 |
| Lease RB Series 2014B | 5.00% | | 10/01/24 | 1,000,000 | 1,146,276 |
| Lease Refunding RB Series 2022A | 5.00% | | 08/01/31 (c) | 2,000,000 | 2,656,093 |
| California School Finance Auth | | | |
| School Facility RB (Kipp LA) Series 2017A | 4.00% | | 07/01/22 | 300,000 | 308,749 |
| School Facility RB (Kipp LA) Series 2017A | 4.00% | | 07/01/23 | 200,000 | 212,712 |
| School Facility RB (Kipp LA) Series 2017A | 5.00% | | 07/01/24 | 165,000 | 184,886 |
| School Facility RB (Kipp LA) Series 2017A | 5.00% | | 07/01/37 (a) | 590,000 | 700,578 |
| California Statewide Communities Development Auth | | | |
| Hospital Refunding RB (Methodist Hospital of Southern California) Series 2018 | 5.00% | | 01/01/24 | 870,000 | 960,534 |
| Hospital Refunding RB (Methodist Hospital of Southern California) Series 2018 | 5.00% | | 01/01/31 (a) | 1,700,000 | 2,092,782 |
| Hospital Refunding RB (Methodist Hospital of Southern California) Series 2018 | 5.00% | | 01/01/33 (a) | 1,355,000 | 1,658,780 |
| Insured Health Facility Refunding RB (Los Angeles Jewish Home for the Aging) Series 2019A | 5.00% | | 11/15/34 (a)(d) | 750,000 | 967,211 |
| Insured Health Facility Refunding RB (Los Angeles Jewish Home for the Aging) Series 2019A | 5.00% | | 11/15/37 (a)(d) | 735,000 | 941,445 |
| RB (Adventist Health System West) Series 2018A | 5.00% | | 03/01/48 (a) | 2,765,000 | 3,347,112 |
| RB (Loma Linda Univ Medical Center) Series 2018A | 5.25% | | 12/01/43 (a) | 2,500,000 | 2,955,738 |
| RB (Redlands Community Hospital) Series 2016 | 5.00% | | 10/01/30 (a) | 800,000 | 957,105 |
| RB (Redlands Community Hospital) Series 2016 | 5.00% | | 10/01/32 (a) | 700,000 | 833,474 |
| RB (Viamonte Sr Living 1) Series 2018A | 5.00% | | 07/01/29 (a)(d) | 300,000 | 380,804 |
| RB (Viamonte Sr Living 1) Series 2018A | 5.00% | | 07/01/30 (a)(d) | 235,000 | 296,729 |
| RB (Viamonte Sr Living 1) Series 2018A | 5.00% | | 07/01/32 (a)(d) | 900,000 | 1,131,251 |
| RB (Viamonte Sr Living 1) Series 2018A | 4.00% | | 07/01/35 (a)(d) | 275,000 | 319,171 |
| RB (Viamonte Sr Living 1) Series 2018A | 4.00% | | 07/01/36 (a)(d) | 425,000 | 492,001 |
| RBs (Emanate Health) Series 2020A | 4.00% | | 04/01/36 (a) | 2,025,000 | 2,420,748 |
| RBs (Emanate Health) Series 2020A | 4.00% | | 04/01/45 (a) | 1,750,000 | 2,045,884 |
| Refunding RB (CHF-Irvine) Series 2016 | 5.00% | | 05/15/30 (a) | 500,000 | 597,494 |
| Refunding RB (CHF-Irvine) Series 2016 | 5.00% | | 05/15/32 (a) | 1,250,000 | 1,486,724 |
| Refunding RB (Episcopal Communities & Services) Series 2012 | 5.00% | | 05/15/24 (a) | 440,000 | 453,917 |
| Refunding RB (Huntington Memorial Hospital) Series 2014B | 5.00% | | 07/01/22 | 400,000 | 415,866 |
| Salinas Transportation Revenue COPs Series 2018B | 5.00% | | 12/01/33 (a) | 1,075,000 | 1,376,476 |
| Salinas Transportation Revenue COPs Series 2018B | 5.00% | | 12/01/36 (a) | 1,475,000 | 1,877,247 |
| Carlsbad USD |
| GO Bonds Series B | 3.00% | | 08/01/46 (a) | 2,000,000 | 2,157,480 |
| Carpinteria Valley Water District | | | |
| Refunding RB Series 2020A | 5.00% | | 07/01/29 | 125,000 | 163,643 |
| Refunding RB Series 2020A | 5.00% | | 07/01/30 | 150,000 | 200,136 |
| Refunding RB Series 2020A | 5.00% | | 07/01/31 (a) | 145,000 | 192,462 |
Schwab Municipal Bond Funds | Annual Report
Schwab California Tax-Free Bond Fund
Portfolio Holdings as of August 31, 2021 (continued)
Issuer
Type of Security, Series | Rate | | Maturity | Face
Amount ($) | Value ($) |
| Refunding RB Series 2020A | 5.00% | | 07/01/33 (a) | 200,000 | 263,647 |
| Refunding RB Series 2020A | 5.00% | | 07/01/34 (a) | 250,000 | 327,217 |
| Refunding RB Series 2020A | 5.00% | | 07/01/35 (a) | 350,000 | 456,493 |
| Cathedral City Successor Redevelopment Agency | | | |
| Sub Tax Allocation Refunding RB Series 2021C | 4.00% | | 08/01/24 | 650,000 | 711,413 |
| Sub Tax Allocation Refunding RB Series 2021C | 4.00% | | 08/01/26 | 575,000 | 657,797 |
| Sub Tax Allocation Refunding RB Series 2021C | 4.00% | | 08/01/28 | 250,000 | 294,703 |
| Sub Tax Allocation Refunding RB Series 2021C | 4.00% | | 08/01/29 | 250,000 | 298,502 |
| Sub Tax Allocation Refunding RB Series 2021C | 4.00% | | 08/01/30 | 570,000 | 685,356 |
| Tax Allocation Refunding RB Series 2021A | 4.00% | | 08/01/31 (a) | 375,000 | 452,071 |
| Tax Allocation Refunding RB Series 2021A | 4.00% | | 08/01/32 (a) | 525,000 | 632,173 |
| Tax Allocation Refunding RB Series 2021A | 4.00% | | 08/01/33 (a) | 250,000 | 300,437 |
| Tax Allocation Refunding RB Series 2021A | 4.00% | | 08/01/34 (a) | 1,000,000 | 1,199,367 |
| Centinela Valley UHSD |
| GO Bonds Series 2013B | 6.00% | | 08/01/36 (a)(e) | 1,300,000 | 1,442,895 |
| Ceres Successor Redevelopment Agency | | | |
| Sub Tax Allocation Refunding Bonds Series 2020 | 4.00% | | 12/15/34 (a) | 500,000 | 604,292 |
| Sub Tax Allocation Refunding Bonds Series 2020 | 4.00% | | 12/15/35 (a) | 500,000 | 603,071 |
| Ceres Water |
| Water System RB Series 2020 | 0.50% | | 06/01/50 (a) | 1,375,000 | 1,375,247 |
| Chaffey Joint UHSD | | | |
| GO Bonds Series D | 0.00% | | 08/01/34 (a)(b) | 450,000 | 332,558 |
| GO Bonds Series D | 0.00% | | 08/01/35 (a)(b) | 550,000 | 391,032 |
| Chico | | | |
| Sewer Refunding RB Series 2020 | 5.00% | | 12/01/22 | 625,000 | 663,348 |
| Sewer Refunding RB Series 2020 | 5.00% | | 12/01/23 | 780,000 | 864,690 |
| Sewer Refunding RB Series 2020 | 5.00% | | 12/01/24 | 770,000 | 888,203 |
| Sewer Refunding RB Series 2020 | 5.00% | | 12/01/25 | 400,000 | 477,927 |
| Sewer Refunding RB Series 2020 | 5.00% | | 12/01/26 | 320,000 | 394,439 |
| Sewer Refunding RB Series 2020 | 5.00% | | 12/01/27 | 425,000 | 536,252 |
| Sewer Refunding RB Series 2020 | 5.00% | | 12/01/28 | 450,000 | 581,113 |
| Sewer Refunding RB Series 2020 | 5.00% | | 12/01/29 | 450,000 | 592,247 |
| Clovis |
| Wastewater Refunding RB Series 2015 | 5.25% | | 08/01/30 (a) | 1,060,000 | 1,252,919 |
| Compton USD | | | |
| GO Refunding Bonds Series 2016F | 5.50% | | 06/01/28 (a) | 250,000 | 306,445 |
| GO Refunding Bonds Series 2016F | 5.50% | | 06/01/30 (a) | 500,000 | 610,008 |
| GO Refunding Bonds Series 2016F | 5.50% | | 06/01/31 (a) | 750,000 | 915,012 |
| Cordova Recreation & Park District |
| COP Series 2018 | 5.00% | | 03/01/43 (a) | 880,000 | 1,029,260 |
| Cotati-Rohnert Park USD |
| GO Refunding Bonds Series 2014B | 5.00% | | 08/01/23 | 735,000 | 803,697 |
| Cucamonga Valley Water District Financing Auth | | | |
| Water Refunding RB Series 2021B | 5.00% | | 09/01/26 | 415,000 | 508,430 |
| Water Refunding RB Series 2021B | 5.00% | | 09/01/27 | 140,000 | 176,337 |
| Water Refunding RB Series 2021B | 5.00% | | 09/01/28 | 150,000 | 193,752 |
| Water Refunding RB Series 2021B | 5.00% | | 09/01/31 | 200,000 | 275,694 |
| Desert CCD | | | |
| GO Bonds Series 2018 | 5.00% | | 08/01/37 (a)(e) | 415,000 | 453,788 |
| GO Bonds Series 2018 | 5.00% | | 08/01/38 (a)(e) | 500,000 | 546,732 |
Schwab Municipal Bond Funds | Annual Report
Schwab California Tax-Free Bond Fund
Portfolio Holdings as of August 31, 2021 (continued)
Issuer
Type of Security, Series | Rate | | Maturity | Face
Amount ($) | Value ($) |
| Diablo Water District | | | |
| Water Revenue COP Series 2019 | 4.00% | | 01/01/23 | 400,000 | 420,793 |
| Water Revenue COP Series 2019 | 4.00% | | 01/01/27 | 470,000 | 558,244 |
| Water Revenue COP Series 2019 | 4.00% | | 01/01/28 | 490,000 | 594,055 |
| Water Revenue COP Series 2019 | 4.00% | | 01/01/29 (a) | 505,000 | 606,775 |
| Water Revenue COP Series 2019 | 4.00% | | 01/01/30 (a) | 480,000 | 567,582 |
| Discovery Bay Public Financing Auth | | | |
| Water & Wastewater RB Series 2017 | 5.00% | | 12/01/25 | 225,000 | 268,414 |
| Water & Wastewater RB Series 2017 | 5.00% | | 12/01/26 | 240,000 | 295,130 |
| Water & Wastewater RB Series 2017 | 5.00% | | 12/01/27 | 250,000 | 315,966 |
| East Bay Municipal Utility District |
| Water System Refunding Bonds Series 2015A | 5.00% | | 06/01/35 (a) | 475,000 | 554,917 |
| East Side UHSD | | | |
| Refunding GO Bonds Series 2020 | 5.00% | | 08/01/22 | 1,230,000 | 1,285,528 |
| Refunding GO Bonds Series 2020 | 5.00% | | 08/01/24 | 1,000,000 | 1,141,353 |
| Refunding GO Bonds Series 2020 | 5.00% | | 08/01/26 | 1,200,000 | 1,466,339 |
| Refunding GO Bonds Series 2020 | 5.00% | | 08/01/27 | 1,150,000 | 1,445,215 |
| El Camino Hospital District |
| GO Bonds Series 2006 | 0.00% | | 08/01/29 (b) | 1,250,000 | 1,124,508 |
| Elk Grove Finance Auth | | | |
| Special Tax RB Series 2015 | 5.00% | | 09/01/22 | 450,000 | 471,283 |
| Special Tax RB Series 2015 | 5.00% | | 09/01/23 | 775,000 | 843,200 |
| Franklin-McKinley SD |
| GO Bonds Series C | 0.00% | | 08/01/40 (a)(b)(e) | 1,000,000 | 344,065 |
| Fresno Jt Power Finance Auth | | | |
| Lease Refunding RB Series 2017A | 5.00% | | 04/01/26 | 850,000 | 1,006,401 |
| Lease Refunding RB Series 2017A | 5.00% | | 04/01/28 (a) | 1,415,000 | 1,728,455 |
| Fresno USD | | | |
| GO Bonds Series 2016A | 0.00% | | 08/01/33 (a)(b) | 1,120,000 | 795,961 |
| GO Bonds Series 2016A | 0.00% | | 08/01/34 (a)(b) | 1,900,000 | 1,284,831 |
| Gilroy Wastewater System |
| Wastewater RB Series 2021A | 3.00% | | 08/01/46 (a) | 3,720,000 | 4,012,912 |
| Glendale Successor Redevelopment Agency |
| Sub Tax Allocation Refunding Bonds Series 2013 | 5.00% | | 12/01/21 | 1,250,000 | 1,264,848 |
| Golden West Schools Financing Auth |
| GO RB (Rowland USD) Series 2005 | 5.25% | | 09/01/24 | 1,675,000 | 1,931,859 |
| Goleta Water District |
| Refunding COP Series 2014A | 5.00% | | 12/01/24 (a) | 900,000 | 997,935 |
| Greenfield Redevelopment Agency | | | |
| Tax Allocation Refunding Bonds Series 2016 | 4.00% | | 02/01/25 | 790,000 | 886,945 |
| Tax Allocation Refunding Bonds Series 2016 | 5.00% | | 02/01/29 (a) | 730,000 | 864,616 |
| Hastings Campus Housing Financing Auth |
| Campus Housing RB Series 2020A | 5.00% | | 07/01/45 (a) | 2,800,000 | 3,387,768 |
| Hastings College of the Law | | | |
| Refunding Bonds Series 2017 | 5.00% | | 04/01/25 | 400,000 | 463,069 |
| Refunding Bonds Series 2017 | 5.00% | | 04/01/27 | 175,000 | 214,336 |
| Refunding Bonds Series 2017 | 5.00% | | 04/01/28 (a) | 180,000 | 219,984 |
| Refunding Bonds Series 2017 | 5.00% | | 04/01/32 (a) | 1,100,000 | 1,332,530 |
| Refunding Bonds Series 2017 | 5.00% | | 04/01/34 (a) | 1,115,000 | 1,345,262 |
Schwab Municipal Bond Funds | Annual Report
Schwab California Tax-Free Bond Fund
Portfolio Holdings as of August 31, 2021 (continued)
Issuer
Type of Security, Series | Rate | | Maturity | Face
Amount ($) | Value ($) |
| Healdsburg |
| Wastewater Refunding RB Series 2015A | 4.00% | | 10/01/22 | 1,095,000 | 1,141,580 |
| Healdsburg Redevelopment Agency |
| Tax Allocation Refunding Bonds (Sotoyome) Series 2017 | 4.00% | | 08/01/22 | 695,000 | 717,097 |
| Imperial USD |
| GO Bonds Series A | 5.25% | | 08/01/43 (a) | 1,430,000 | 1,780,418 |
| Independent Cities Finance Auth | | | |
| Mobile Home Park Refunding RB (Union City Tropics) Series 2019 | 4.25% | | 05/15/25 | 780,000 | 883,154 |
| Mobile Home Park Refunding RB (Union City Tropics) Series 2019 | 4.25% | | 05/15/26 | 810,000 | 938,481 |
| Mobile Home Park Refunding RB (Union City Tropics) Series 2019 | 5.00% | | 05/15/48 (a) | 2,000,000 | 2,428,208 |
| Indian Wells Successor Redevelopment Agency | | | |
| Consolidated Whitewater Redevelopment Sub Tax Allocation Refunding Bonds Series 2015A | 5.00% | | 09/01/23 | 1,075,000 | 1,176,827 |
| Consolidated Whitewater Redevelopment Sub Tax Allocation Refunding Bonds Series 2015A | 5.00% | | 09/01/27 (a) | 1,250,000 | 1,469,678 |
| Inglewood Successor Redevelopment Agency | | | |
| Sub Lien Tax Allocation RB Series 2017A | 5.00% | | 05/01/26 | 500,000 | 602,025 |
| Sub Lien Tax Allocation RB Series 2017A | 5.00% | | 05/01/27 | 500,000 | 618,053 |
| Inglewood USD | | | |
| GO Bonds Series A | 6.25% | | 08/01/37 (a)(e) | 685,000 | 764,264 |
| GO Bonds Series B | 5.00% | | 08/01/31 (a) | 150,000 | 179,413 |
| GO Bonds Series B | 5.00% | | 08/01/32 (a) | 200,000 | 238,262 |
| GO Bonds Series B | 5.00% | | 08/01/33 (a) | 125,000 | 148,451 |
| GO Bonds Series B | 5.00% | | 08/01/35 (a) | 200,000 | 236,469 |
| GO Bonds Series B | 5.00% | | 08/01/37 (a) | 720,000 | 847,896 |
| Irvine | | | |
| Limited Obligation (Assessment District NO 21-1) Bonds | 4.00% | | 09/02/36 (a) | 220,000 | 273,486 |
| Limited Obligation (Assessment District NO 21-1) Bonds | 4.00% | | 09/02/37 (a) | 245,000 | 303,009 |
| Limited Obligation (Assessment District NO 21-1) Bonds | 4.00% | | 09/02/38 (a) | 300,000 | 369,056 |
| Limited Obligation (Assessment District NO 21-1) Bonds | 4.00% | | 09/02/46 (a) | 1,000,000 | 1,206,072 |
| Kern CCD |
| GO BANs 2020 | 0.00% | | 08/01/23 (b) | 4,200,000 | 4,185,566 |
| Kern Cnty |
| Refunding COP Series 2016A | 5.00% | | 11/01/23 | 3,020,000 | 3,322,254 |
| Kern Cnty Water Agency Improvement District #4 |
| Refunding RB Series 2016A | 5.00% | | 05/01/30 (a) | 1,500,000 | 1,797,648 |
| Kern High School District |
| GO Bonds Series 2016A | 3.00% | | 08/01/29 (a) | 1,000,000 | 1,117,534 |
| Lake Tahoe USD | | | |
| GO Refunding Bonds Series 2019 | 4.00% | | 08/01/26 | 550,000 | 639,242 |
| GO Refunding Bonds Series 2019 | 4.00% | | 08/01/28 | 630,000 | 761,169 |
| GO Refunding Bonds Series 2019 | 4.00% | | 08/01/29 | 605,000 | 742,696 |
| Lancaster Redevelopment Agency | | | |
| Tax Allocation Refunding Bonds Series 2017 | 4.00% | | 08/01/26 | 1,360,000 | 1,584,257 |
| Tax Allocation Refunding Bonds Series 2017 | 5.00% | | 08/01/29 (a) | 820,000 | 985,562 |
| Livermore Valley Joint USD | | | |
| GO Bonds Series 2019 | 4.00% | | 08/01/30 (a) | 430,000 | 496,413 |
| GO Bonds Series 2019 | 4.00% | | 08/01/31 (a) | 325,000 | 374,417 |
| GO Bonds Series 2019 | 4.00% | | 08/01/32 (a) | 335,000 | 385,501 |
| Long Beach CCD |
| GO Refunding Bonds Series 2015F | 5.00% | | 06/01/25 | 925,000 | 1,087,805 |
Schwab Municipal Bond Funds | Annual Report
Schwab California Tax-Free Bond Fund
Portfolio Holdings as of August 31, 2021 (continued)
Issuer
Type of Security, Series | Rate | | Maturity | Face
Amount ($) | Value ($) |
| Long Beach Cnty Redevelopment Agency | | | |
| Tax Allocation Refunding Bonds Series 2021 | 4.00% | | 08/01/28 | 220,000 | 267,947 |
| Tax Allocation Refunding Bonds Series 2021 | 4.00% | | 08/01/29 | 285,000 | 353,043 |
| Tax Allocation Refunding Bonds Series 2021 | 4.00% | | 08/01/38 (a) | 345,000 | 414,124 |
| Long Beach Harbor Dept | | | |
| Refunding RB Series 2020B | 5.00% | | 05/15/23 | 1,430,000 | 1,547,059 |
| Refunding RB Series 2020B | 5.00% | | 05/15/24 (f) | 6,260,000 | 7,019,761 |
| Los Angeles Cnty Public Works Financing Auth |
| Lease RB Series 2019 E1 | 5.00% | | 12/01/30 (a) | 600,000 | 792,665 |
| Los Angeles Cnty Redevelopment Refunding Auth |
| Tax Allocation Refunding RB (South Gate) Series 2014A | 5.00% | | 09/01/24 | 1,390,000 | 1,586,012 |
| Los Angeles Cnty Sanitation Districts Financing Auth |
| Sub RB (District #14) Series 2015A | 5.00% | | 10/01/31 (a) | 3,880,000 | 4,576,980 |
| Los Angeles Community Facilities District #4 | | | |
| Special Tax Refunding Bonds Series 2014 | 5.00% | | 09/01/22 | 735,000 | 769,989 |
| Special Tax Refunding Bonds Series 2014 | 5.00% | | 09/01/23 | 980,000 | 1,070,764 |
| Los Angeles Dept of Airports | | | |
| Sr Refunding RB Series 2018B | 5.00% | | 05/15/32 (a) | 1,675,000 | 2,100,758 |
| Sr Refunding RB Series 2018B | 5.00% | | 05/15/33 (a) | 3,325,000 | 4,171,295 |
| Sub RB Series 2018D | 5.00% | | 05/15/31 (a) | 1,510,000 | 1,937,070 |
| Sub RB Series 2019F | 5.00% | | 05/15/28 | 1,310,000 | 1,658,257 |
| Sub Refunding RB Series 2021A | 5.00% | | 05/15/27 | 1,230,000 | 1,521,960 |
| Sub Refunding RB Series 2021A | 5.00% | | 05/15/28 | 1,250,000 | 1,582,307 |
| Sub Refunding RB Series 2021A | 5.00% | | 05/15/29 | 1,410,000 | 1,823,742 |
| Los Angeles Dept of Water & Power | | | |
| Power System RB Series 2015A | 5.00% | | 07/01/30 (a) | 3,015,000 | 3,474,525 |
| Water System RB Series 2021B | 5.00% | | 07/01/39 (a) | 2,000,000 | 2,657,385 |
| Water System RB Series 2021B | 5.00% | | 07/01/40 (a) | 1,000,000 | 1,321,552 |
| Water System RB Series 2021B | 5.00% | | 07/01/46 (a) | 3,000,000 | 3,909,395 |
| Los Angeles Harbor Dept | | | |
| RB Series 2014C | 5.00% | | 08/01/31 (a) | 1,450,000 | 1,639,182 |
| Refunding RB Series 2011B | 5.00% | | 08/01/24 (a) | 1,000,000 | 1,003,939 |
| Refunding RB Series 2015A | 5.00% | | 08/01/26 (a) | 850,000 | 1,000,949 |
| Los Angeles Municipal Improvement Corp |
| Lease RB Series 2014A | 5.00% | | 05/01/31 (a)(e) | 1,050,000 | 1,184,734 |
| Los Osos Community Facilities Wastewater Assessment District #1 | | | |
| Limited Obligation Refunding Bonds Series 2019 | 5.00% | | 09/02/24 | 675,000 | 763,749 |
| Limited Obligation Refunding Bonds Series 2019 | 5.00% | | 09/02/26 | 740,000 | 885,974 |
| Lynwood USD |
| GO Bonds Series E | 0.00% | | 08/01/43 (a)(b) | 3,890,000 | 2,267,504 |
| Madera Irrigation District |
| Water Refunding RB Series 2015 | 5.00% | | 09/01/28 (a) | 2,205,000 | 2,609,415 |
| Monte Vista Water District |
| Revenue COP Series 2020A | 5.00% | | 10/01/44 (a) | 2,445,000 | 3,063,184 |
| Moreno Valley Public Financing Auth |
| Lease Refunding RB Series 2013 | 5.00% | | 11/01/22 | 810,000 | 855,722 |
| Moreno Valley USD |
| GO Bonds Series C | 3.00% | | 08/01/46 (a) | 1,685,000 | 1,827,101 |
| Mountain View Shoreline Regional Park Community |
| RB Series 2011A | 5.75% | | 08/01/40 (a) | 700,000 | 702,776 |
Schwab Municipal Bond Funds | Annual Report
Schwab California Tax-Free Bond Fund
Portfolio Holdings as of August 31, 2021 (continued)
Issuer
Type of Security, Series | Rate | | Maturity | Face
Amount ($) | Value ($) |
| Northern California Energy Auth |
| Commodity Supply RB Series 2018 | 5.00% | | 07/01/24 (d) | 3,000,000 | 3,406,002 |
| Novato | | | |
| Special Tax Refunding Bonds Series 2020 | 4.00% | | 09/01/24 | 100,000 | 110,549 |
| Special Tax Refunding Bonds Series 2020 | 4.00% | | 09/01/25 | 150,000 | 170,094 |
| Special Tax Refunding Bonds Series 2020 | 4.00% | | 09/01/26 | 150,000 | 173,706 |
| Special Tax Refunding Bonds Series 2020 | 4.00% | | 09/01/27 | 250,000 | 294,365 |
| Special Tax Refunding Bonds Series 2020 | 4.00% | | 09/01/28 (a) | 200,000 | 238,686 |
| Special Tax Refunding Bonds Series 2020 | 4.00% | | 09/01/30 (a) | 140,000 | 165,017 |
| Special Tax Refunding Bonds Series 2020 | 4.00% | | 09/01/31 (a) | 285,000 | 333,891 |
| Special Tax Refunding Bonds Series 2020 | 4.00% | | 09/01/32 (a) | 150,000 | 175,319 |
| Novato Successor Redevelopment Agency |
| Tax Allocation Bonds (Hamilton Field) Series 2011 | 6.75% | | 09/01/40 (a)(e) | 1,000,000 | 1,000,000 |
| Oakland |
| GO Refunding Bonds Series 2015A | 5.00% | | 01/15/31 (a) | 620,000 | 726,808 |
| Oakland USD | | | |
| GO Bonds Series 2015A | 5.00% | | 08/01/22 | 500,000 | 521,911 |
| GO Bonds Series 2015A | 5.00% | | 08/01/23 | 700,000 | 763,021 |
| GO Bonds Series 2015A | 5.00% | | 08/01/24 | 600,000 | 681,421 |
| GO Bonds Series 2019A | 5.00% | | 08/01/29 (a) | 1,500,000 | 1,872,878 |
| GO Bonds Series 2019A | 5.00% | | 08/01/31 (a) | 500,000 | 622,526 |
| GO Refunding Bonds Series 2017C | 5.00% | | 08/01/34 (a) | 2,000,000 | 2,472,256 |
| Oakley Successor Redevelopment Agency | | | |
| Tax Allocation Refunding Bonds Series 2018 | 5.00% | | 09/01/29 (a) | 250,000 | 317,985 |
| Tax Allocation Refunding Bonds Series 2018 | 5.00% | | 09/01/30 (a) | 500,000 | 631,824 |
| Tax Allocation Refunding Bonds Series 2018 | 5.00% | | 09/01/31 (a) | 660,000 | 830,853 |
| Tax Allocation Refunding Bonds Series 2018 | 5.00% | | 09/01/32 (a) | 350,000 | 439,440 |
| Tax Allocation Refunding Bonds Series 2018 | 5.00% | | 09/01/33 (a) | 725,000 | 907,719 |
| Tax Allocation Refunding Bonds Series 2018 | 5.00% | | 09/01/34 (a) | 525,000 | 655,487 |
| Oceanside Successor Redevelopment Agency | | | |
| Tax Allocation Refunding Bonds Series 2015A | 5.00% | | 09/01/24 | 600,000 | 683,062 |
| Tax Allocation Refunding Bonds Series 2015A | 5.00% | | 09/01/25 | 225,000 | 265,579 |
| Ontario Int’l Airport | | | |
| RB Series 2021B | 5.00% | | 05/15/31 | 515,000 | 692,496 |
| RB Series 2021B | 5.00% | | 05/15/33 (a) | 545,000 | 724,952 |
| RB Series 2021B | 5.00% | | 05/15/34 (a) | 500,000 | 662,640 |
| RB Series 2021B | 4.00% | | 05/15/35 (a) | 500,000 | 606,813 |
| Oroville |
| RB (Oroville Hospital) Series 2019 | 5.25% | | 04/01/49 (a) | 1,800,000 | 2,005,368 |
| Oxnard | | | |
| Lease Refunding RB Series 2018 | 5.00% | | 06/01/33 (a) | 1,250,000 | 1,556,185 |
| Lease Refunding RB Series 2018 | 5.00% | | 06/01/34 (a) | 1,235,000 | 1,533,358 |
| Lease Refunding RB Series 2018 | 5.00% | | 06/01/35 (a) | 770,000 | 954,378 |
| Oxnard Financing Auth | | | |
| Wastewater Refunding RB Series 2014 | 5.00% | | 06/01/23 | 500,000 | 541,799 |
| Wastewater Refunding RB Series 2014 | 5.00% | | 06/01/24 | 1,750,000 | 1,976,008 |
| Oxnard SD | | | |
| GO Bonds Series D | 5.00% | | 08/01/31 (a)(e) | 1,365,000 | 1,615,023 |
| GO Bonds Series D | 5.00% | | 08/01/32 (a)(e) | 1,490,000 | 1,762,919 |
| GO Bonds Series D | 5.00% | | 08/01/33 (a)(e) | 1,685,000 | 1,993,637 |
Schwab Municipal Bond Funds | Annual Report
Schwab California Tax-Free Bond Fund
Portfolio Holdings as of August 31, 2021 (continued)
Issuer
Type of Security, Series | Rate | | Maturity | Face
Amount ($) | Value ($) |
| Pacifica |
| Wastewater RB Series 2017 | 5.00% | | 10/01/32 (a) | 1,030,000 | 1,287,101 |
| Palmdale SD |
| GO Bonds Series 2017B | 5.25% | | 08/01/42 (a) | 2,500,000 | 3,143,334 |
| Palo Alto |
| COP Series 2019A | 5.00% | | 11/01/44 (a) | 2,000,000 | 2,503,750 |
| Pasadena |
| Refunding COP Series 2015A | 5.00% | | 02/01/26 (a) | 600,000 | 696,851 |
| Pico Rivera Public Financing Auth | | | |
| Lease Refunding RB Series 2016 | 5.50% | | 09/01/29 (a) | 350,000 | 434,888 |
| Lease Refunding RB Series 2016 | 5.25% | | 09/01/33 (a) | 800,000 | 972,292 |
| Piner-Olivet Union Elementary SD | | | |
| GO Bonds Series 2021 | 0.00% | | 08/01/42 (a)(b) | 500,000 | 294,710 |
| GO Bonds Series 2021 | 0.00% | | 08/01/44 (a)(b) | 500,000 | 275,448 |
| Pleasant Hill Recreation & Park District |
| Refunding GO Bonds Series 2017 | 5.00% | | 08/01/30 (a) | 770,000 | 943,494 |
| Pleasant Valley SD |
| GO Refunding Bonds Series 2002A | 5.85% | | 08/01/31 | 2,000,000 | 2,526,653 |
| Pomona |
| S/F Mortgage Refunding RB Series 1990B | 7.50% | | 08/01/23 (e) | 220,000 | 238,132 |
| Port of Oakland |
| Refunding RB Series 2017D | 5.00% | | 11/01/27 (f) | 4,895,000 | 6,096,076 |
| Reedley |
| Water Refunding RB Series 2017 | 5.00% | | 09/01/25 | 540,000 | 641,645 |
| Richmond California Redevelopment Agency | | | |
| Refunding RB Series 2021A | 4.00% | | 09/01/22 | 200,000 | 207,223 |
| Refunding RB Series 2021A | 4.00% | | 09/01/24 | 300,000 | 330,606 |
| Refunding RB Series 2021A | 4.00% | | 09/01/25 | 535,000 | 610,314 |
| Refunding RB Series 2021A | 4.00% | | 09/01/26 | 400,000 | 466,851 |
| Refunding RB Series 2021A | 4.00% | | 09/01/27 | 1,150,000 | 1,366,630 |
| Richmond Jt Powers Financing Auth | | | |
| Refunding RB Series 2019B | 4.00% | | 05/01/22 | 1,250,000 | 1,282,300 |
| Refunding RB Series 2019B | 5.00% | | 05/01/23 | 1,000,000 | 1,080,892 |
| Refunding RB Series 2019B | 5.00% | | 05/01/24 | 650,000 | 726,885 |
| Rio Elementary SD | | | |
| GO Bonds Series 2018C | 0.00% | | 08/01/31 (a)(b) | 100,000 | 81,102 |
| GO Bonds Series 2018C | 0.00% | | 08/01/32 (a)(b) | 115,000 | 88,936 |
| Riverside Cnty | | | |
| 2020 Series A Teeter Obligation Notes | 0.50% | | 10/21/21 | 5,500,000 | 5,503,307 |
| Lease Refunding RB Series 2015A | 5.00% | | 11/01/25 (e) | 180,000 | 213,992 |
| Lease Refunding RB Series 2015A | 5.00% | | 11/01/25 | 1,020,000 | 1,208,788 |
| Riverside Cnty Transportation Commission |
| Sales Tax RB Series 2013A | 5.25% | | 06/01/24 (a)(e) | 710,000 | 773,683 |
| Rosedale-Rio Bravo Water Storage District | | | |
| Refunding RB Series 2020A | 5.00% | | 01/01/23 | 810,000 | 861,074 |
| Refunding RB Series 2020A | 5.00% | | 01/01/24 | 500,000 | 554,129 |
| Refunding RB Series 2020A | 5.00% | | 01/01/25 | 545,000 | 626,694 |
| Refunding RB Series 2020A | 5.00% | | 01/01/26 | 825,000 | 978,691 |
| Refunding RB Series 2020A | 5.00% | | 01/01/27 | 865,000 | 1,052,034 |
| Refunding RB Series 2020A | 5.00% | | 01/01/28 | 810,000 | 1,006,085 |
Schwab Municipal Bond Funds | Annual Report
Schwab California Tax-Free Bond Fund
Portfolio Holdings as of August 31, 2021 (continued)
Issuer
Type of Security, Series | Rate | | Maturity | Face
Amount ($) | Value ($) |
| Refunding RB Series 2020A | 5.00% | | 01/01/29 | 855,000 | 1,082,618 |
| Refunding RB Series 2020A | 5.00% | | 01/01/30 | 890,000 | 1,146,217 |
| Ross Valley Public Financing Auth | | | |
| RB (Marin Cnty Sanitary District #1) Series 2013 | 5.00% | | 10/01/27 (a) | 200,000 | 219,799 |
| RB (Marin Cnty Sanitary District #1) Series 2013 | 5.00% | | 10/01/43 (a) | 1,000,000 | 1,092,411 |
| Sacramento Cnty | | | |
| Airport System Sr Refunding RB Series 2018C | 5.00% | | 07/01/39 (a) | 1,000,000 | 1,231,101 |
| Airport System Sr Refunding RB Series 2020 | 5.00% | | 07/01/34 (a) | 1,550,000 | 2,040,850 |
| Sacramento Regional Transit District | | | |
| Refunding RB Series 2021A | 4.00% | | 03/01/35 (a) | 825,000 | 1,008,763 |
| Refunding RB Series 2021A | 4.00% | | 03/01/36 (a) | 625,000 | 761,111 |
| Refunding RB Series 2021A | 4.00% | | 03/01/37 (a) | 750,000 | 910,355 |
| San Diego Assoc of Governments | | | |
| Capital Grant Receipts RB (Mid Coast Corridor Transit) Series 2019A | 5.00% | | 11/15/25 (a) | 2,500,000 | 2,876,343 |
| Capital Grant Receipts RB (Mid Coast Corridor Transit) Series 2019B | 1.80% | | 11/15/27 (a) | 2,500,000 | 2,635,811 |
| San Diego Cnty | | | |
| RB (Sanford Burnham Institute) Series 2015A | 4.00% | | 11/01/23 | 745,000 | 805,372 |
| RB (Sanford Burnham Institute) Series 2015A | 5.00% | | 11/01/24 | 550,000 | 630,566 |
| RB (Sanford Burnham Institute) Series 2015A | 5.00% | | 11/01/25 | 350,000 | 415,258 |
| RB (Sanford Burnham Institute) Series 2015A | 5.00% | | 11/01/26 (a) | 1,000,000 | 1,189,186 |
| San Diego Cnty Regional Airport Auth | | | |
| RB Series 2017B | 5.00% | | 07/01/31 (a) | 1,360,000 | 1,661,311 |
| Sub Refunding & RB Series 2019A | 4.00% | | 07/01/37 (a) | 1,000,000 | 1,176,108 |
| San Diego Unified Port District | | | |
| Refunding RB Series 2013A | 5.00% | | 09/01/22 | 300,000 | 314,622 |
| Refunding RB Series 2013A | 5.00% | | 09/01/23 | 550,000 | 600,245 |
| Refunding RB Series 2013A | 5.00% | | 09/01/25 (a) | 245,000 | 267,536 |
| San Francisco Airport Commission | | | |
| RB 2nd Series 2019E | 5.00% | | 05/01/40 (a) | 2,875,000 | 3,587,956 |
| Refunding RB Series 2012A | 5.00% | | 05/01/26 (a) | 290,000 | 299,259 |
| San Francisco Bay Area Rapid Transit District |
| GO Bonds Series 2019 F1 | 5.00% | | 08/01/28 | 1,995,000 | 2,588,854 |
| San Francisco Public Utilities Commission |
| Water RB Series 2017A | 5.00% | | 11/01/36 (a) | 2,000,000 | 2,290,919 |
| San Francisco Successor Redevelopment Agency | | | |
| Subordinate Tax Allocation Refunding Bonds Series 2014C | 5.00% | | 08/01/23 | 265,000 | 289,393 |
| Subordinate Tax Allocation Refunding Bonds Series 2014C | 5.00% | | 08/01/25 (a) | 150,000 | 170,279 |
| Subordinate Tax Allocation Refunding Bonds Series 2014C | 5.00% | | 08/01/26 (a) | 165,000 | 187,635 |
| Subordinate Tax Allocation Refunding Bonds Series 2014C | 5.00% | | 08/01/28 (a) | 305,000 | 346,190 |
| Subordinate Tax Allocation Refunding Bonds Series 2014C | 5.00% | | 08/01/29 (a) | 430,000 | 487,763 |
| San Jacinto USD | | | |
| GO Bonds Series 2017 | 5.00% | | 08/01/34 (a) | 1,205,000 | 1,479,397 |
| GO Bonds Series 2017 | 5.00% | | 08/01/36 (a) | 925,000 | 1,137,078 |
| San Joaquin Cnty |
| Solid Waste System Refunding Revenue COP 2014 | 5.00% | | 04/01/22 | 350,000 | 359,566 |
| San Lorenzo USD |
| GO Refunding Bonds Series 2021B | 4.00% | | 08/01/47 (a) | 1,150,000 | 1,329,328 |
| San Lorenzo Valley USD |
| GO Bonds Series 2004 | 0.00% | | 08/01/28 (b) | 990,000 | 907,754 |
Schwab Municipal Bond Funds | Annual Report
Schwab California Tax-Free Bond Fund
Portfolio Holdings as of August 31, 2021 (continued)
Issuer
Type of Security, Series | Rate | | Maturity | Face
Amount ($) | Value ($) |
| San Mateo Cnty CCD | | | |
| GO Refunding Bonds Series 2018 | 5.00% | | 09/01/39 (a) | 1,045,000 | 1,354,735 |
| GO Refunding Bonds Series 2018 | 5.00% | | 09/01/40 (a) | 1,150,000 | 1,487,887 |
| San Mateo Foster City PFA |
| Wastewater RB Series 2019 | 5.00% | | 08/01/29 | 1,310,000 | 1,736,841 |
| San Mateo Foster City Public Finance Auth | | | |
| RB Series 2020A | 5.00% | | 05/01/33 (a) | 190,000 | 241,477 |
| RB Series 2020A | 5.00% | | 05/01/36 (a) | 500,000 | 633,120 |
| RB Series 2020A | 5.00% | | 05/01/37 (a) | 250,000 | 316,184 |
| Wastewater RB Series 2021A | 5.00% | | 08/01/25 | 4,400,000 | 5,210,885 |
| Sanger Public Financing Auth |
| Lease RB Series 2020A | 4.00% | | 02/01/40 (a) | 1,250,000 | 1,451,649 |
| Santa Cruz Cnty Capital Financing Auth | | | |
| Lease RB Series 2014 | 3.00% | | 08/01/24 | 175,000 | 188,340 |
| Lease RB Series 2014 | 5.00% | | 08/01/25 (a) | 175,000 | 199,462 |
| Lease RB Series 2014 | 5.00% | | 08/01/26 (a) | 165,000 | 187,908 |
| Lease RB Series 2014 | 5.00% | | 08/01/27 (a) | 320,000 | 364,127 |
| Santa Monica Public Financing Auth | | | |
| Lease RB Series 2018 | 5.00% | | 07/01/35 (a) | 575,000 | 714,690 |
| Lease RB Series 2018 | 5.00% | | 07/01/38 (a) | 175,000 | 216,212 |
| Santa Rosa HSD | | | |
| GO Bonds Series 2018C | 5.00% | | 08/01/34 (a) | 250,000 | 301,025 |
| GO Bonds Series 2018C | 5.00% | | 08/01/35 (a) | 300,000 | 360,587 |
| GO Bonds Series 2018C | 5.00% | | 08/01/36 (a) | 850,000 | 1,019,846 |
| Shasta UHSD |
| GO Bonds Series 2018 | 5.25% | | 08/01/43 (a) | 680,000 | 843,100 |
| Sierra View Healthcare District | | | |
| RB Series 2019 | 5.00% | | 07/01/24 | 915,000 | 1,028,300 |
| RB Series 2019 | 4.00% | | 07/01/25 | 1,270,000 | 1,428,399 |
| Refunding RB Series 2020 | 4.00% | | 07/01/26 | 300,000 | 345,234 |
| Refunding RB Series 2020 | 5.00% | | 07/01/27 | 630,000 | 774,883 |
| Refunding RB Series 2020 | 5.00% | | 07/01/30 | 645,000 | 844,713 |
| South Bay USD |
| GO BAN Series 2019 | 0.00% | | 08/01/22 (b) | 2,000,000 | 1,992,200 |
| South Placer Wastewater Auth |
| Wastewater Refunding RB Series 2020 | 5.00% | | 11/01/34 | 1,000,000 | 1,421,116 |
| South San Francisco Public Facilities Auth |
| Lease RB Series 2021A | 4.00% | | 06/01/46 (a) | 2,000,000 | 2,378,859 |
| Southern California Metropolitan Water District |
| Water Refunding RB Series 2016A | 5.00% | | 07/01/34 (a) | 390,000 | 458,630 |
| Southern California Public Power Auth | | | |
| Refunding RB (Canyon Power) Series 2020A | 5.00% | | 07/01/35 (a) | 3,000,000 | 3,496,045 |
| Refunding RB (Milford Wind Corridor) Series 2021-1 | 5.00% | | 07/01/25 | 800,000 | 944,954 |
| Refunding RB (Milford Wind Corridor) Series 2021-1 | 5.00% | | 07/01/26 | 750,000 | 917,280 |
| Refunding RB (Milford Wind Corridor) Series 2021-1 | 5.00% | | 07/01/27 | 950,000 | 1,196,752 |
| Refunding RB (Milford Wind Corridor) Series 2021-1 | 5.00% | | 07/01/28 | 1,050,000 | 1,358,857 |
| Refunding RB Series 2020-1 | 5.00% | | 07/01/30 (a) | 3,000,000 | 3,316,622 |
| Susanville Natural Gas | | | |
| Natural Gas Refunding RB Series 2019 | 2.00% | | 06/01/22 | 455,000 | 460,062 |
| Natural Gas Refunding RB Series 2019 | 3.00% | | 06/01/25 | 575,000 | 626,606 |
Schwab Municipal Bond Funds | Annual Report
Schwab California Tax-Free Bond Fund
Portfolio Holdings as of August 31, 2021 (continued)
Issuer
Type of Security, Series | Rate | | Maturity | Face
Amount ($) | Value ($) |
| Natural Gas Refunding RB Series 2019 | 4.00% | | 06/01/28 (a) | 615,000 | 730,606 |
| Natural Gas Refunding RB Series 2019 | 4.00% | | 06/01/30 (a) | 680,000 | 797,233 |
| Natural Gas Refunding RB Series 2019 | 4.00% | | 06/01/33 (a) | 580,000 | 671,995 |
| Tobacco Securitization Auth of Northern California | | | |
| Sr Refunding Bonds (Sacramento Cnty Tobacco Corp) Series 2021A1 | 4.00% | | 06/01/49 (a) | 1,000,000 | 1,200,107 |
| Sr Refunding Bonds (Sacramento Cnty Tobacco Corp) Series 2021B1 | 0.45% | | 06/01/30 | 50,000 | 51,229 |
| Sr Refunding Bonds (Sacramento Cnty Tobacco Corp) Series 2021B1 | 4.00% | | 06/01/49 (a) | 250,000 | 296,654 |
| Truckee Donner Public Utility District | | | |
| Water System Refunding RB Series 2015 | 4.00% | | 11/15/22 | 630,000 | 659,717 |
| Water System Refunding RB Series 2015 | 4.00% | | 11/15/23 | 655,000 | 710,052 |
| Water System Refunding RB Series 2015 | 4.00% | | 11/15/24 | 680,000 | 761,161 |
| Water System Refunding RB Series 2015 | 4.00% | | 11/15/25 | 710,000 | 817,461 |
| Univ of California |
| Limited Project RB Series 2012G | 5.00% | | 05/15/42 (a) | 3,000,000 | 3,103,894 |
| Upland |
| COP (San Antonio Regional Hospital) Series 2017 | 5.00% | | 01/01/24 | 1,200,000 | 1,322,219 |
| West Hills CCD | | | |
| GO Refunding Bonds Series 2016B | 5.00% | | 08/01/25 | 320,000 | 377,054 |
| GO Refunding Bonds Series 2016B | 5.00% | | 08/01/26 | 450,000 | 547,184 |
| GO Refunding Bonds Series 2016B | 5.00% | | 08/01/30 (a) | 595,000 | 719,959 |
| GO Refunding Bonds Series 2016B | 5.00% | | 08/01/31 (a) | 635,000 | 767,333 |
| Total Fixed-Rate Obligations |
| (Cost $433,977,561) | | | | | 458,019,983 |
|
| Variable-Rate Obligations 9.6% of net assets |
| CALIFORNIA 9.6% |
| Bay Area Toll Auth | | | |
| Toll Bridge RB Series 2006C1 | | | | | |
| (SIFMA Municipal Swap Index + 0.90%) | 0.92% | | 04/01/45 (a) | 5,000,000 | 5,038,546 |
| Toll Bridge RB Series 2017H | 2.13% | | 04/01/53 (a)(g) | 3,000,000 | 3,155,268 |
| Toll Bridge RB Series 2018A | 2.63% | | 04/01/45 (a)(g) | 3,000,000 | 3,254,285 |
| California |
| GO Bonds Series 2003A1 | 0.01% | | 05/01/33 (a)(d)(f)(h) | 4,350,000 | 4,350,000 |
| California Health Facilities Financing Auth | | | |
| RB (Adventist Health System) Series 2011A | 3.00% | | 03/01/41 (a)(g) | 2,685,000 | 2,814,229 |
| RB (Kaiser Permanente) Series 2006C | 5.00% | | 06/01/41 (a)(f)(g) | 5,000,000 | 6,606,072 |
| RB (Providence St Joseph Health) Series 2019B | 5.00% | | 10/01/39 (a)(g) | 3,400,000 | 4,269,074 |
| RB (Providence St Joseph Health) Series 2019C | 5.00% | | 10/01/39 (a)(g) | 5,000,000 | 5,945,010 |
| Refunding RB (St. Joseph Health) Series 2009C | 5.00% | | 07/01/34 (a)(g) | 1,200,000 | 1,265,231 |
| California Municipal Finance Auth |
| Recovery Zone Facility RB (Chevron) Series 2010A | 0.01% | | 11/01/35 (a)(h) | 4,195,000 | 4,195,000 |
| California Statewide Communities Development Auth |
| RB (Adventist Health System) Series 2007A | 5.00% | | 03/01/37 (a)(g) | 1,715,000 | 2,049,482 |
| Eastern Municipal Water District |
| Water & Wastewater Refunding RB Series 2018A | 0.01% | | 07/01/46 (a)(d)(h) | 4,450,000 | 4,450,000 |
Schwab Municipal Bond Funds | Annual Report
Schwab California Tax-Free Bond Fund
Portfolio Holdings as of August 31, 2021 (continued)
Issuer
Type of Security, Series | Rate | | Maturity | Face
Amount ($) | Value ($) |
| San Mateo Cnty Transportation Auth |
| Sub Sales Tax RB Series 2020B | 0.01% | | 06/01/49 (a)(d)(h) | 1,000,000 | 1,000,000 |
| Total Variable-Rate Obligations |
| (Cost $47,596,762) | | | | | 48,392,197 |
| (a) | The effective maturity may be shorter than the final maturity shown because the security is subject to a put, demand or call feature. |
| (b) | Zero coupon bond. |
| (c) | Security or a portion of the security purchased on a delayed-delivery or when-issued basis. |
| (d) | Credit-enhanced or liquidity-enhanced. |
| (e) | Refunded bond. |
| (f) | All or a portion of this security is designated as collateral for delayed-delivery securities. |
| (g) | Bond currently pays a fixed coupon rate and will be remarketed at a to be determined rate at the end of the current fixed rate term. |
| (h) | VRDN is a municipal security which allows holders to sell their security through a put or tender feature, at par value plus accrued interest. The interest rate resets on a periodic basis, the majority of which are weekly but may be daily or monthly. Unless a reference rate and spread is shown parenthetically, the Remarketing Agent, generally a dealer, determines the interest rate for the security at each interest rate reset date. The rate is typically based on the SIFMA Municipal Swap Index. |
| | |
| BAN — | Bond anticipation note |
| CCD — | Community college district |
| COP — | Certificate of participation |
| GO — | General obligation |
| HSD — | High school district |
| PFA — | Public Financing Authority |
| RB — | Revenue bond |
| SD — | School district |
| S/F — | Single-family |
| SIFMA — | Securities Industry and Financial Markets Association. The SIFMA Municipal Swap Index is a market index comprised of high-grade 7-day tax-exempt Variable Rate Demand Obligations with certain characteristics. |
| UHSD — | Union high school district |
| USD — | Unified school district |
| VRDN — | Variable rate demand note |
The following is a summary of the inputs used to value the fund’s investments as of August 31, 2021 (see financial note 2(a) for additional information):
| Description | Quoted Prices in
Active Markets for
Identical Assets
(Level 1) | Other Significant
Observable Inputs
(Level 2) | Significant
Unobservable Inputs
(Level 3) | Total | |
| Assets | | | | | |
| Fixed-Rate Obligations1 | $— | $458,019,983 | $— | $458,019,983 | |
| Variable-Rate Obligations1 | — | 48,392,197 | — | 48,392,197 | |
| Total | $— | $506,412,180 | $— | $506,412,180 | |
| 1 | As categorized in the Portfolio Holdings. |
Schwab Municipal Bond Funds | Annual Report
Schwab California Tax-Free Bond Fund
Statement of Assets and Liabilities
As of August 31, 2021
| Assets |
| Investments in securities, at value - unaffiliated (cost $481,574,323) | | $506,412,180 |
| Cash | | 1,566,985 |
| Receivables: | | |
| Interest | | 4,804,714 |
| Fund shares sold | | 277,140 |
| Prepaid expenses | + | 20,065 |
| Total assets | | 513,081,084 |
| Liabilities |
| Payables: | | |
| Investments bought - delayed-delivery | | 7,724,741 |
| Investment adviser and administrator fees | | 99,522 |
| Shareholder service fees | | 103,378 |
| Fund shares redeemed | | 325,035 |
| Distributions to shareholders | | 224,999 |
| Accrued expenses | + | 112,745 |
| Total liabilities | | 8,590,420 |
| Net Assets |
| Total assets | | 513,081,084 |
| Total liabilities | – | 8,590,420 |
| Net assets | | $504,490,664 |
| Net Assets by Source | | |
| Capital received from investors | | 477,334,965 |
| Total distributable earnings | | 27,155,699 |
| Net Asset Value (NAV) |
| Net Assets | ÷ | Shares
Outstanding | = | NAV |
| $504,490,664 | | 41,203,662 | | $12.24 |
| | | | | |
Schwab Municipal Bond Funds | Annual Report
Schwab California Tax-Free Bond Fund
Statement of Operations
For the period September 1, 2020 through August 31, 2021
| Investment Income |
| Interest received from securities — unaffiliated | | $10,630,556 |
| Expenses |
| Investment adviser and administrator fees | | 1,495,977 |
| Shareholder service fees | | 1,200,477 |
| Portfolio accounting fees | | 89,936 |
| Professional fees | | 51,521 |
| Registration fees | | 25,667 |
| Shareholder reports | | 17,635 |
| Independent trustees’ fees | | 13,738 |
| Custodian fees | | 5,185 |
| Transfer agent fees | | 4,378 |
| Other expenses | + | 7,415 |
| Total expenses | | 2,911,929 |
| Expense reduction by CSIM and its affiliates | – | 468,154 |
| Net expenses | – | 2,443,775 |
| Net investment income | | 8,186,781 |
| Realized and Unrealized Gains (Losses) |
| Net realized gains on sales of securities — unaffiliated | | 3,172,000 |
| Net change in unrealized appreciation (depreciation) on securities — unaffiliated | + | (183,038) |
| Net realized and unrealized gains | | 2,988,962 |
| Increase in net assets resulting from operations | | $11,175,743 |
Schwab Municipal Bond Funds | Annual Report
Schwab California Tax-Free Bond Fund
Statement of Changes in Net Assets
For the current and prior report periods
| Operations | |
| | 9/1/20-8/31/21 | 9/1/19-8/31/20 |
| Net investment income | | $8,186,781 | $9,330,349 |
| Net realized gains | | 3,172,000 | 3,706,315 |
| Net change in unrealized appreciation (depreciation) | + | (183,038) | (2,479,671) |
| Increase in net assets from operations | | 11,175,743 | 10,556,993 |
| Distributions to Shareholders | |
| Total distributions | | ($11,896,900) | ($10,732,869) |
| Transactions in Fund Shares | | | |
| | | 9/1/20-8/31/21 | 9/1/19-8/31/20 |
| | | SHARES | VALUE | SHARES | VALUE |
| Shares sold | | 8,761,515 | $107,272,240 | 13,056,152 | $158,302,131 |
| Shares reinvested | | 628,988 | 7,693,244 | 545,637 | 6,611,595 |
| Shares redeemed | + | (8,029,362) | (98,211,493) | (13,632,904) | (163,782,365) |
| Net transactions in fund shares | | 1,361,141 | $16,753,991 | (31,115) | $1,131,361 |
| Shares Outstanding and Net Assets | | | |
| | | 9/1/20-8/31/21 | 9/1/19-8/31/20 |
| | | SHARES | NET ASSETS | SHARES | NET ASSETS |
| Beginning of period | | 39,842,521 | $488,457,830 | 39,873,636 | $487,502,345 |
| Total increase (decrease) | + | 1,361,141 | 16,032,834 | (31,115) | 955,485 |
| End of period | | 41,203,662 | $504,490,664 | 39,842,521 | $488,457,830 |
Schwab Municipal Bond Funds | Annual Report
Schwab Opportunistic Municipal Bond Fund
Financial Statements
Financial Highlights
| | 9/1/20–
8/31/21 | 3/1/20–
8/31/201 | 3/1/19–
2/29/20 | 3/1/18–
2/28/19 | 3/1/17–
2/28/18 | 3/1/16–
2/28/17 |
| Per-Share Data |
| Net asset value at beginning of period | $10.42 | $11.25 | $10.61 | $10.63 | $10.44 | $10.76 |
| Income (loss) from investment operations: | | | | | | |
| Net investment income (loss)2 | 0.32 | 0.20 | 0.38 | 0.40 | 0.36 | 0.40 |
| Net realized and unrealized gains (losses) | 0.23 | (0.83) | 0.73 | 0.01 | 0.20 | (0.22) |
| Total from investment operations | 0.55 | (0.63) | 1.11 | 0.41 | 0.56 | 0.18 |
| Less distributions: | | | | | | |
| Distributions from net investment income | (0.26) | (0.20) | (0.38) | (0.41) | (0.35) | (0.40) |
| Distributions from net realized gains | (0.07) | — | (0.09) | (0.02) | (0.02) | (0.10) |
| Total distributions | (0.33) | (0.20) | (0.47) | (0.43) | (0.37) | (0.50) |
| Redemption fees2 | – 3 | 0.00 4 | 0.00 4 | 0.00 4 | 0.00 4 | 0.00 4 |
| Net asset value at end of period | $10.64 | $10.42 | $11.25 | $10.61 | $10.63 | $10.44 |
| Total return | 5.36% | (5.56%) 5 | 10.71% | 3.93% | 5.42% | 1.65% |
| Ratios/Supplemental Data |
| Ratios to average net assets: | | | | | | |
| Net operating expenses | 0.58% 6 | 0.73% 7,8 | 0.75% | 0.75% | 0.92% 9 | 0.97% 9 |
| Gross operating expenses | 0.70% | 0.90% 7 | 0.78% | 0.76% | 0.88% 10 | 0.95% 10 |
| Net investment income (loss) | 2.99% | 3.81% 7 | 3.48% | 3.80% | 3.30% | 3.74% |
| Portfolio turnover rate | 83% | 36% 5 | 27% | 18% | 11% | 32% |
| Net assets, end of period (x 1,000,000) | $69 | $66 | $83 | $77 | $118 | $99 |
| |
1
Effective August 10, 2020, the Wasmer Schroeder High Yield Municipal Fund was reorganized into the Schwab Opportunistic Municipal Bond Fund (formerly, Schwab High Yield Municipal Bond Fund), which commenced operations on that day. The Financial Highlights above present the shares of the Wasmer Schroeder High Yield Municipal Fund prior to the acquisition date of August 10, 2020 and Schwab Opportunistic Municipal Bond Fund subsequent to that date. (Note that the Wasmer Schroeder High Yield Municipal Fund had a fiscal year ending the last day of February whereas the Schwab Opportunistic Municipal Bond Fund has a fiscal year ending August 31). Certain prior numbers have been restated to meet current year presentation.
2
Calculated based on the average shares outstanding during the period.
3
Effective July 1, 2021, redemption fees were eliminated.
4
Amount is less than $0.01 per share.
5
Not annualized
6
Effective July 1, 2021, the net operating expense limitation was lowered from 0.60% to 0.50%. The ratio presented for the year ended August 31, 2021 is a blended ratio (see financial note 4 for additional information).
7
Annualized.
8
Effective August 10, 2020, the net operating expense limitation was lowered from 0.75% to 0.60%. The ratio presented for the period ended August 31, 2020 is a blended ratio.
9
Includes predecessor adviser recoupment of previously waived fees.
10
Excludes predecessor adviser recoupment of previously waived fees.
Schwab Municipal Bond Funds | Annual Report
Schwab Opportunistic Municipal Bond Fund
Portfolio Holdings as of August 31, 2021
This section shows all the securities in the fund’s portfolio and their values as of the report date.
The fund files its complete schedule of portfolio holdings with the U.S. Securities and Exchange Commission (SEC) for the first and third quarters of each fiscal year on Form N-PORT Part F. The fund’s Form N-PORT Part F is available on the SEC’s website at www.sec.gov. You can also obtain this information at no cost on the fund’s website at www.schwabassetmanagement.com/schwabfunds_prospectus, by calling 1-866-414-6349, or by sending an email request to orders@mysummaryprospectus.com. The fund also makes available its complete schedule of portfolio holdings 15 to 20 days after the end of the month on the fund’s website.
For fixed-rate obligations, the rate shown is the interest rate (the rate established when the obligation was issued). For variable-rate obligations, the rate shown is the rate as of the report date based on each security’s rate reset date. The reference rate and spread used is shown parenthetically in the security description, if available; if not, the reference rate is described in a footnote. The maturity date shown for all the securities is the final legal maturity.
Issuer
Type of Security, Series | Rate | | Maturity | Face
Amount ($) | Value ($) |
| Fixed-Rate Obligations 93.6% of net assets |
| ALABAMA 0.8% |
| Jefferson Cnty Sales Tax |
| Limited Obligation Refunding RB Series 2017 | 4.00% | | 09/15/36 (a) | 500,000 | 577,442 |
| ARIZONA 2.5% |
| La Paz Cnty Industrial Development Auth |
| Education Facility Lease RB (Harmony Public Schools) Series 2018A | 5.00% | | 02/15/38 (a) | 700,000 | 827,405 |
| Phoenix Civic Improvement Corp |
| Jr Lien Airport RB Series 2019B | 4.00% | | 07/01/39 (a) | 800,000 | 934,635 |
| | | | | | 1,762,040 |
| CALIFORNIA 2.4% |
| California Health Facilities Financing Auth |
| Refunding RB (Lucile Salter Packard Childrens Hospital) Series 2022A | 4.00% | | 05/15/51 (a)(b) | 500,000 | 575,008 |
| Los Angeles USD |
| GO Bonds Series 2020 RYQ | 4.00% | | 07/01/44 (a) | 665,000 | 791,386 |
| Lynwood USD |
| GO Bonds Series E | 0.00% | | 08/01/43 (a)(c) | 520,000 | 303,111 |
| | | | | | 1,669,505 |
| COLORADO 1.3% |
| Park Creek Metropolitan Dist |
| Sr LT RB Series 2019A | 4.00% | | 12/01/34 (a) | 745,000 | 903,653 |
| CONNECTICUT 0.6% |
| Connecticut |
| GO Refunding Bonds Series 2018B | 5.00% | | 04/15/28 | 315,000 | 402,145 |
| DISTRICT OF COLUMBIA 1.6% |
| Washington DC Convention Center Auth | | | |
| Sr Lien Dedicated Tax Refunding RB Series 2021A | 4.00% | | 10/01/34 (a) | 400,000 | 485,058 |
| Sr Lien Dedicated Tax Refunding RB Series 2021A | 4.00% | | 10/01/40 (a) | 500,000 | 596,623 |
| | | | | | 1,081,681 |
Schwab Municipal Bond Funds | Annual Report
Schwab Opportunistic Municipal Bond Fund
Portfolio Holdings as of August 31, 2021 (continued)
Issuer
Type of Security, Series | Rate | | Maturity | Face
Amount ($) | Value ($) |
| FLORIDA 7.2% |
| Broward Cnty SD |
| COP Series 2020A | 5.00% | | 07/01/30 | 500,000 | 662,660 |
| Florida Gulf Coast Univ |
| Improvement Refunding RB Series 2017A | 5.00% | | 08/01/26 | 435,000 | 524,017 |
| Florida Higher Educational Facilities Financing Auth |
| Educational Facilities Refunding RB (Nova Southeastern Univ) Series 2016 | 5.00% | | 04/01/30 (a) | 750,000 | 884,596 |
| Halifax Hospital Medical Center |
| Hospital Revenue & Refunding Bonds Series 2016 | 5.00% | | 06/01/36 (a) | 500,000 | 587,391 |
| Lee Cnty Industrial Development Auth |
| Healthcare Facilities Improvement RB (Shell Point Alliance) Series 2019 | 5.00% | | 11/15/49 (a) | 1,000,000 | 1,180,591 |
| Miami-Dade Cnty Educational Facilities Auth |
| Revenue & Refunding Bonds (Univ of Miami) Series 2015A | 5.00% | | 04/01/30 (a) | 500,000 | 575,442 |
| Tampa |
| Revenue & Refunding Bonds (Univ of Tampa) Series 2020A | 4.00% | | 04/01/50 (a) | 500,000 | 569,918 |
| | | | | | 4,984,615 |
| GEORGIA 2.9% |
| Cobb Cnty-Kennestone Hospital Auth |
| Revenue Anticipation Refunding Certificates Series 2012 | 5.00% | | 04/01/28 (a) | 415,000 | 444,031 |
| Milledgeville-Baldwin Cnty Development Auth |
| RB (Univ of Georgia) Series 2021 | 4.00% | | 06/15/36 (a) | 1,300,000 | 1,600,366 |
| | | | | | 2,044,397 |
| GUAM 1.2% |
| Guam Power Auth |
| RB Series 2012A | 5.00% | | 10/01/34 (a) | 250,000 | 260,642 |
| Guam Waterworks Auth |
| Water & Wastewater System Refunding RB Series 2014A | 5.00% | | 07/01/35 (a) | 500,000 | 544,883 |
| | | | | | 805,525 |
| ILLINOIS 2.7% |
| Chicago |
| 2nd Lien Water RB Series 2014 | 5.00% | | 11/01/44 (a) | 500,000 | 561,371 |
| Illinois Regional Transportation Auth |
| GO Bonds Series 2018B | 5.00% | | 06/01/24 | 250,000 | 282,066 |
| Illinois Toll Highway Auth |
| Toll Highway Sr RB Series 2017A | 5.00% | | 01/01/42 (a) | 450,000 | 545,746 |
| Northern Illinois Univ |
| Auxiliary Facilities System RB Series 2021 | 4.00% | | 10/01/43 (a)(d) | 400,000 | 468,460 |
| | | | | | 1,857,643 |
| LOUISIANA 4.8% |
| Louisiana Local Government Environmental Facilities & Community Development Auth |
| Refunding RB (Westlake Chemical Corp) Series 2017 | 3.50% | | 11/01/32 (a) | 1,000,000 | 1,116,692 |
| Louisiana Public Facilities Auth | | | |
| Refunding RB (Tulane Univ) Series 2020A | 4.00% | | 04/01/50 (a) | 500,000 | 577,528 |
| Revenue & Refunding Bonds (Ochsner Clinic) Series 2017 | 5.00% | | 05/15/42 (a) | 500,000 | 596,267 |
Schwab Municipal Bond Funds | Annual Report
Schwab Opportunistic Municipal Bond Fund
Portfolio Holdings as of August 31, 2021 (continued)
Issuer
Type of Security, Series | Rate | | Maturity | Face
Amount ($) | Value ($) |
| Louisiana Stadium & Exposition District |
| BAN 2021 | 4.00% | | 07/03/23 (a) | 400,000 | 421,768 |
| New Orleans |
| Sewerage Service RB Series 2020B | 5.00% | | 06/01/34 (a) | 500,000 | 647,012 |
| | | | | | 3,359,267 |
| MAINE 1.3% |
| Maine Health & Educational Facilities Auth |
| Educational Facilities RB Series 2021A | 4.00% | | 07/01/50 (a) | 750,000 | 891,174 |
| MARYLAND 0.9% |
| Maryland Economic Development Corp |
| Refunding RB (Transportation Facilities) Series 2017A | 5.00% | | 06/01/35 (a) | 500,000 | 609,609 |
| MASSACHUSETTS 1.8% |
| Massachusetts Bay Transportation Auth |
| Sub Sales Tax Bonds Series 2021A1 | 4.00% | | 07/01/51 (a) | 500,000 | 600,168 |
| Massachusetts Development Finance Agency | | | |
| RB (Southcoast Health System) Series 2021G | 4.00% | | 07/01/46 (a) | 200,000 | 235,626 |
| RB (Southcoast Health System) Series 2021G | 5.00% | | 07/01/50 (a) | 300,000 | 383,264 |
| | | | | | 1,219,058 |
| MICHIGAN 2.9% |
| Detroit SD |
| ULT Refunding RB Series 2020A | 5.00% | | 05/01/39 (a)(d) | 500,000 | 642,345 |
| Great Lakes Water Auth |
| 2nd Lien Water System Refunding RB Series 2016D | 5.00% | | 07/01/30 (a) | 500,000 | 604,307 |
| Michigan Finance Auth |
| Local Gov’t Loan Program RB (Detroit Public Lighting Auth) Series 2014B | 5.00% | | 07/01/44 (a) | 700,000 | 746,614 |
| | | | | | 1,993,266 |
| MINNESOTA 6.8% |
| South Central Minnesota Multi-Cnty Hsg & Redevelopment Auth | | | |
| Pooled Housing Development RB Series 1993 | 4.37% | | 02/01/00 (e) | 15,000 | 7,050 |
| Pooled Housing Development RB Series 1993 | 4.72% | | 02/01/02 (e) | 30,000 | 14,100 |
| Pooled Housing Development RB Series 1993 | 4.93% | | 02/01/05 (e) | 20,000 | 9,400 |
| Pooled Housing Development RB Series 1993 | 4.96% | | 02/01/06 (e) | 20,000 | 9,400 |
| Pooled Housing Development RB Series 1993 | 5.04% | | 02/01/07 (e) | 65,000 | 30,550 |
| Pooled Housing Development RB Series 1993 | 5.07% | | 02/01/08 (e) | 10,000 | 4,700 |
| Pooled Housing Development RB Series 1993 | 5.24% | | 02/01/17 (e) | 450,000 | 211,500 |
| Pooled Housing Development RB Series 1993 | 5.59% | | 02/01/25 (e) | 9,500,000 | 4,465,000 |
| | | | | | 4,751,700 |
| MISSOURI 0.8% |
| St Louis |
| Airport Revenue & Refunding Bonds (St Louis Lambert) Series 2019C | 5.00% | | 07/01/32 (a) | 425,000 | 544,748 |
Schwab Municipal Bond Funds | Annual Report
Schwab Opportunistic Municipal Bond Fund
Portfolio Holdings as of August 31, 2021 (continued)
Issuer
Type of Security, Series | Rate | | Maturity | Face
Amount ($) | Value ($) |
| NEVADA 1.0% |
| Clark Cnty SD |
| Refunding GO Bonds Series 2017C | 5.00% | | 06/15/31 (a) | 580,000 | 718,311 |
| NEW JERSEY 4.5% |
| New Jersey Economic Development Auth |
| School Facilities Construction Bonds Series 2014 UU | 5.00% | | 06/15/34 (a) | 1,000,000 | 1,118,782 |
| South Jersey Transportation Auth |
| Transportation System Refunding RB Series 2014A | 5.00% | | 11/01/39 (a) | 1,000,000 | 1,109,845 |
| Tobacco Settlement Financing Corp |
| Tobacco Settlement Bonds Series 2018A | 5.25% | | 06/01/46 (a) | 750,000 | 918,491 |
| | | | | | 3,147,118 |
| NEW YORK 11.0% |
| Hempstead Local Development Corp |
| RB (Hofstra Univ) Series 2021A | 4.00% | | 07/01/40 (a) | 710,000 | 866,240 |
| Metropolitan Transportation Auth |
| Transportation RB Series 2020C1 | 5.25% | | 11/15/55 (a) | 500,000 | 621,046 |
| Nassau Cnty |
| GO Bonds Series 2017B | 5.00% | | 04/01/31 (a) | 450,000 | 548,157 |
| New York City |
| GO Bonds Fiscal 2020 Series C1 | 5.00% | | 08/01/30 | 695,000 | 925,285 |
| New York City Transitional Finance Auth |
| Future Tax Secured Sub Bonds Fiscal 2017 Series E1 | 5.00% | | 02/01/43 (a) | 500,000 | 603,220 |
| New York Liberty Development Corp |
| RB (Goldman Sachs Headquarters) Series 2005 | 5.25% | | 10/01/35 | 500,000 | 718,889 |
| New York State Dormitory Auth |
| RB (NYU Langone Hospitals) Series 2020A | 4.00% | | 07/01/53 (a) | 500,000 | 582,750 |
| New York Transportation Development Corp |
| Special Facility RB (JFK Airport) Series 2020A | 5.00% | | 12/01/31 (a) | 500,000 | 650,508 |
| Port Auth of New York & New Jersey |
| Consolidated Bonds 223rd Series | 4.00% | | 07/15/61 (a) | 500,000 | 579,422 |
| Triborough Bridge & Tunnel Auth |
| Sr Lien RB Series 2021A1 | 5.00% | | 05/15/51 (a) | 600,000 | 772,040 |
| Troy Capital Resource Corp | | | |
| Refunding RB (Rensselaer Polytechnic Institute) Series 2021 | 4.00% | | 09/01/34 (a) | 150,000 | 180,532 |
| Refunding RB (Rensselaer Polytechnic Institute) Series 2021 | 4.00% | | 09/01/35 (a) | 190,000 | 228,431 |
| Refunding RB (Rensselaer Polytechnic Institute) Series 2021 | 4.00% | | 09/01/36 (a) | 280,000 | 335,641 |
| | | | | | 7,612,161 |
| NORTH CAROLINA 0.9% |
| Charlotte |
| Airport RB (Charlotte Douglas Intl) Series 2021B | 4.00% | | 07/01/51 (a) | 250,000 | 297,353 |
| North Carolina Medical Care Commission |
| Health Care Facilities RB (Presbyterian Homes) Series 2020A | 4.00% | | 10/01/40 (a) | 300,000 | 349,151 |
| | | | | | 646,504 |
Schwab Municipal Bond Funds | Annual Report
Schwab Opportunistic Municipal Bond Fund
Portfolio Holdings as of August 31, 2021 (continued)
Issuer
Type of Security, Series | Rate | | Maturity | Face
Amount ($) | Value ($) |
| OHIO 1.0% |
| Butler Cnty |
| Hospital Facilities Refunding RB (UC Health) Series 2017 | 5.00% | | 11/15/30 (a) | 500,000 | 614,546 |
| Northeast Ohio Medical Univ |
| General Refunding RB Series 2021A | 3.00% | | 12/01/21 | 100,000 | 100,689 |
| | | | | | 715,235 |
| OKLAHOMA 0.9% |
| Oklahoma Development Finance Auth |
| Health System RB (OU Medicine) Series 2018B | 5.50% | | 08/15/57 (a) | 500,000 | 617,798 |
| OREGON 0.8% |
| Lane Cnty SD #52 |
| GO Bonds Series 2021A | 0.00% | | 06/15/44 (a)(c)(d) | 1,000,000 | 580,361 |
| PENNSYLVANIA 5.7% |
| Commonwealth Financing Auth |
| Tobacco Settlement RB Series 2018 | 5.00% | | 06/01/35 (a) | 500,000 | 614,282 |
| Pennsylvania Economic Development Financing Auth | | | |
| RB (Univ of Pittsburgh Medical Center) Series 2021A | 3.00% | | 10/15/46 (a) | 500,000 | 536,796 |
| Sewage Sludge Disposal Refunding RB (Philadelphia Biosolids) Series 2020 | 4.00% | | 01/01/30 | 1,300,000 | 1,535,016 |
| Pennsylvania State Turnpike Commission |
| Sub RB Series 2017B1 | 5.25% | | 06/01/47 (a) | 250,000 | 305,942 |
| Philadelphia |
| Water & Wastewater RB Series 2019B | 5.00% | | 11/01/54 (a) | 500,000 | 629,590 |
| Philadelphia SD |
| GO Bonds Series 2018A | 5.00% | | 09/01/31 (a) | 250,000 | 316,254 |
| | | | | | 3,937,880 |
| PUERTO RICO 1.5% |
| Puerto Rico Highway & Transportation Auth |
| Transportation RB Series A | 4.75% | | 07/01/38 (a)(d) | 500,000 | 508,560 |
| Puerto Rico Pwr Auth | | | |
| Power Refunding RB Series PP | 5.00% | | 07/01/22 (a)(d) | 305,000 | 309,740 |
| Power Refunding RB Series UU | 5.00% | | 07/01/24 (a)(d) | 200,000 | 203,227 |
| | | | | | 1,021,527 |
| SOUTH CAROLINA 0.9% |
| South Carolina Public Service Auth |
| Revenue & Refunding Bonds Series 2016B | 5.00% | | 12/01/56 (a) | 500,000 | 594,080 |
| TENNESSEE 1.7% |
| Chattanooga Health Educational & Housing Facilities Board |
| Student Housing Refunding RB (CDFI Univ of Tennessee at Chattanooga) Series 2015 | 5.00% | | 10/01/29��� (a) | 500,000 | 568,586 |
| Memphis |
| GO Refunding Bonds Series 2020 | 4.00% | | 05/01/34 (a) | 500,000 | 594,669 |
| | | | | | 1,163,255 |
Schwab Municipal Bond Funds | Annual Report
Schwab Opportunistic Municipal Bond Fund
Portfolio Holdings as of August 31, 2021 (continued)
Issuer
Type of Security, Series | Rate | | Maturity | Face
Amount ($) | Value ($) |
| TEXAS 12.0% |
| Arlington Higher Education Finance Corp | | | |
| Education RB (Harmony Public Schools) Series 2021A | 4.00% | | 02/15/28 (d) | 300,000 | 359,133 |
| Education RB (Harmony Public Schools) Series 2021A | 4.00% | | 02/15/29 (d) | 285,000 | 346,709 |
| Education RB (Harmony Public Schools) Series 2021A | 4.00% | | 02/15/30 (d) | 305,000 | 376,198 |
| Education RB (Harmony Public Schools) Series 2021A | 4.00% | | 02/15/31 (d) | 315,000 | 393,059 |
| Central Texas Regional Mobility Auth |
| Senior Lien Refunding RB Series 2016 | 5.00% | | 01/01/46 (a) | 750,000 | 873,866 |
| Love Field Airport Modernization Corp |
| General Airport Refunding RB Series 2021 | 5.00% | | 11/01/29 (b) | 500,000 | 645,262 |
| New Hope Cultural Educational Facilities Corp |
| Education RB (Beta Academy) Series 2019A | 5.00% | | 08/15/49 (a) | 500,000 | 525,710 |
| North Texas Tollway Auth | | | |
| 1st Tier System Revenue & Refunding Bonds Series 2017A | 5.00% | | 01/01/43 (a) | 500,000 | 615,639 |
| System 2nd Tier Refunding RB Series 2021B | 4.00% | | 01/01/37 (a) | 500,000 | 604,670 |
| Northside ISD |
| ULT GO Refunding Bonds Series 2021 | 5.00% | | 08/15/30 (d) | 1,000,000 | 1,344,414 |
| San Antonio |
| Water System Junior Lien Refunding RB Series 2019C | 5.00% | | 05/15/29 | 1,050,000 | 1,376,246 |
| Texas Transportation Commission |
| Central Texas Turnpike System 2nd Tier Refunding RB Series 2015C | 5.00% | | 08/15/34 (a) | 750,000 | 843,291 |
| | | | | | 8,304,197 |
| UTAH 1.8% |
| Vineyard Redevelopment Agency | | | |
| Tax Increment Refunding RB Series 2021 | 5.00% | | 05/01/29 | 175,000 | 224,979 |
| Tax Increment Refunding RB Series 2021 | 5.00% | | 05/01/30 | 200,000 | 261,354 |
| Tax Increment Refunding RB Series 2021 | 4.00% | | 05/01/35 (a) | 100,000 | 120,697 |
| Tax Increment Refunding RB Series 2021 | 4.00% | | 05/01/36 (a) | 135,000 | 162,457 |
| Tax Increment Refunding RB Series 2021 | 4.00% | | 05/01/38 (a) | 225,000 | 269,138 |
| Tax Increment Refunding RB Series 2021 | 4.00% | | 05/01/39 (a) | 175,000 | 208,910 |
| | | | | | 1,247,535 |
| VIRGINIA 1.1% |
| Virginia College Building Auth |
| Educational Facilities RB (Randolph-Mason College) Series 2021A | 3.00% | | 01/15/46 (a) | 700,000 | 753,612 |
| WASHINGTON 1.8% |
| Greater Wenatchee Regional Events Center Public Facilities Dist | | | |
| Limited Sales Tax RB Series 2012A | 4.50% | | 09/01/22 | 190,000 | 196,370 |
| Limited Sales Tax RB Series 2012A | 5.25% | | 09/01/32 (a) | 500,000 | 516,166 |
| Skagit Cnty Hospital Dist |
| Refunding RB (Skagit Valley Hospital) Series 2013A | 5.00% | | 12/01/37 (a) | 500,000 | 539,348 |
| | | | | | 1,251,884 |
| WEST VIRGINIA 1.1% |
| Marshall Univ |
| Improvement Refunding RB Series 2020A | 4.00% | | 05/01/50 (a) | 635,000 | 737,067 |
Schwab Municipal Bond Funds | Annual Report
Schwab Opportunistic Municipal Bond Fund
Portfolio Holdings as of August 31, 2021 (continued)
Issuer
Type of Security, Series | Rate | | Maturity | Face
Amount ($) | Value ($) |
| WISCONSIN 2.6% |
| Wisconsin Health & Educational Facilities Auth | | | |
| RB (Hmong American Peace Academy) Series 2020 | 5.00% | | 03/15/50 (a) | 1,075,000 | 1,299,491 |
| RB (Woodland Hill Sr Housing) Series 2014 | 5.25% | | 12/01/49 (a) | 500,000 | 520,700 |
| | | | | | 1,820,191 |
| WYOMING 0.8% |
| Laramie Cnty |
| Hospital Refunding RB (Cheyenne Regional Medical Center) Series 2021 | 3.00% | | 05/01/42 (a) | 500,000 | 536,545 |
| Total Fixed-Rate Obligations |
| (Cost $61,648,731) | | | | | 64,862,729 |
|
| Variable-Rate Obligations 4.4% of net assets |
| TENNESSEE 1.7% |
| Tennergy Corp |
| Gas Supply RB Series 2021A | 4.00% | | 12/01/51 (a) | 1,000,000 | 1,195,050 |
| TEXAS 2.7% |
| Harris Cnty Cultural Education Facilities Finance Corp |
| RB (Houston Methodist) Series 2020B | 0.01% | | 12/01/59 (a)(f) | 635,000 | 635,000 |
| Harris Cnty Health Facilities Development Corp |
| RB (Methodist Hospital) Series 2008A2 | 0.01% | | 12/01/41 (a)(f) | 1,230,000 | 1,230,000 |
| | | | | | 1,865,000 |
| Total Variable-Rate Obligations |
| (Cost $3,047,230) | | | | | 3,060,050 |
| (a) | The effective maturity may be shorter than the final maturity shown because the security is subject to a put, demand or call feature. |
| (b) | Security or a portion of the security purchased on a delayed-delivery or when-issued basis. |
| (c) | Zero coupon bond. |
| (d) | Credit-enhanced or liquidity-enhanced. |
| (e) | The securities are in default and are not making full payments of interest and principal when due. The securities are making semiannual distributions of variable amounts of cash flow. These amounts are determined by factors including, but not limited to, property occupancy levels, per unit rental rates and capital reinvestment expenses. The coupon accrual rate utilized by the Fund for accruing interest income is reviewed at least semiannually and will generally be based on interest payments received historically along with any known changes in the previously mentioned factors. |
| (f) | VRDN is a municipal security which allows holders to sell their security through a put or tender feature, at par value plus accrued interest. The interest rate resets on a periodic basis, the majority of which are weekly but may be daily or monthly. Unless a reference rate and spread is shown parenthetically, the Remarketing Agent, generally a dealer, determines the interest rate for the security at each interest rate reset date. The rate is typically based on the SIFMA Municipal Swap Index. |
| | |
| BAN — | Bond anticipation note |
| COP — | Certificate of participation |
| GO — | General obligation |
| ISD — | Independent school district |
| LT — | Limited tax |
| RB — | Revenue bond |
| SD — | School district |
| SIFMA — | Securities Industry and Financial Markets Association. The SIFMA Municipal Swap Index is a market index comprised of high-grade 7-day tax-exempt Variable Rate Demand Obligations with certain characteristics. |
| ULT — | Unlimited tax |
| USD — | Unified school district |
| VRDN — | Variable rate demand note |
Schwab Municipal Bond Funds | Annual Report
Schwab Opportunistic Municipal Bond Fund
Portfolio Holdings as of August 31, 2021 (continued)
The following is a summary of the inputs used to value the fund’s investments as of August 31, 2021 (see financial note 2(a) for additional information):
| Description | Quoted Prices in
Active Markets for
Identical Assets
(Level 1) | Other Significant
Observable Inputs
(Level 2) | Significant
Unobservable Inputs
(Level 3) | Total | |
| Assets | | | | | |
| Fixed-Rate Obligations1 | $— | $64,862,729 | $— | $64,862,729 | |
| Variable-Rate Obligations1 | — | 3,060,050 | — | 3,060,050 | |
| Total | $— | $67,922,779 | $— | $67,922,779 | |
| 1 | As categorized in the Portfolio Holdings. |
Schwab Municipal Bond Funds | Annual Report
Schwab Opportunistic Municipal Bond Fund
Statement of Assets and Liabilities
As of August 31, 2021
| Assets |
| Investments in securities, at value — unaffiliated (cost $64,695,961) | | $67,922,779 |
| Cash | | 2,362,033 |
| Receivables: | | |
| Interest | | 614,405 |
| Fund shares sold | | 141,919 |
| Prepaid expenses | + | 18,546 |
| Total assets | | 71,059,682 |
| Liabilities |
| Payables: | | |
| Investments bought — delayed-delivery | | 1,201,815 |
| Investment adviser and administrator fees | | 16,585 |
| Fund shares redeemed | | 364,941 |
| Distributions to shareholders | | 83,518 |
| Accrued expenses | + | 79,228 |
| Total liabilities | | 1,746,087 |
| Net Assets |
| Total assets | | 71,059,682 |
| Total liabilities | – | 1,746,087 |
| Net assets | | $69,313,595 |
| Net Assets by Source | | |
| Capital received from investors | | 66,765,531 |
| Total distributable earnings | | 2,548,064 |
| Net Asset Value (NAV) |
| Net Assets | ÷ | Shares
Outstanding | = | NAV |
| $69,313,595 | | 6,516,915 | | $10.64 |
| | | | | |
Schwab Municipal Bond Funds | Annual Report
Schwab Opportunistic Municipal Bond Fund
Statement of Operations
For the period September 1, 2020 through August 31, 2021
| Investment Income |
| Interest received from securities - unaffiliated | | $2,239,989 |
| Expenses |
| Investment adviser and administrator fees | | 302,213 |
| Professional fees | | 49,002 |
| Portfolio accounting fees | | 41,086 |
| Shareholder reports | | 15,394 |
| Independent trustees’ fees | | 11,872 |
| Registration fees | | 7,722 |
| Custodian fees | | 2,130 |
| Transfer agent fees | | 1,810 |
| Other expenses | + | 5,236 |
| Total expenses | | 436,465 |
| Expense reduction by CSIM and its affiliates | – | 71,341 |
| Net expenses | – | 365,124 |
| Net investment income | | 1,874,865 |
| Realized and Unrealized Gains (Losses) |
| Net realized gains on sales of securities - unaffiliated | | 363,437 |
| Net change in unrealized appreciation (depreciation) on securities - unaffiliated | + | 807,354 |
| Net realized and unrealized gains | | 1,170,791 |
| Increase in net assets resulting from operations | | $3,045,656 |
Schwab Municipal Bond Funds | Annual Report
Schwab Opportunistic Municipal Bond Fund
Statement of Changes in Net Assets
For the current and prior report periods
| Operations | | |
| | 9/1/20-8/31/21 | 3/1/20-8/31/20* | 3/1/19-2/29/20* |
| Net investment income | | $1,874,865 | $1,323,212 | $2,795,785 |
| Net realized gains (losses) | | 363,437 | (1,391,261) | 1,094,859 |
| Net change in unrealized appreciation (depreciation) | + | 807,354 | (4,700,465) | 4,387,184 |
| Increase (decrease) in net assets from operations | | 3,045,656 | (4,768,514) | 8,277,828 |
| Distributions to Shareholders | | |
| Total distributions | | ($1,939,895) | ($1,323,194) | ($3,474,037) |
| Transactions in Fund Shares | | | | | |
| | | 9/1/20-8/31/21 | 3/1/20-8/31/20 | 3/1/19-2/29/20 |
| | | SHARES | VALUE | SHARES | VALUE | SHARES | VALUE |
| Shares sold | | 3,154,653 | $33,506,685 | 446,549 | $4,447,398 | 2,501,038 | $27,367,682 |
| Shares reinvested | | 77,942 | 823,990 | 49,033 | 500,310 | 133,301 | 1,463,537 |
| Shares redeemed1 | + | (3,074,591) | (32,413,338) | (1,508,684) | (15,534,493) | (2,521,340) | (27,695,273) |
| Net transactions in fund shares | | 158,004 | $1,917,337 | (1,013,102) | ($10,586,785) | 112,999 | $1,135,946 |
| Shares Outstanding and Net Assets | | | | | |
| | | 9/1/20-8/31/21 | 3/1/20-8/31/20 | 3/1/19-2/29/20 |
| | | SHARES | NET ASSETS | SHARES | NET ASSETS | SHARES | NET ASSETS |
| Beginning of period | | 6,358,911 | $66,290,497 | 7,372,013 | $82,968,990 | 7,259,014 | $77,029,253 |
| Total increase (decrease) | + | 158,004 | 3,023,098 | (1,013,102) | (16,678,493) | 112,999 | 5,939,737 |
| End of period | | 6,516,915 | $69,313,595 | 6,358,911 | $66,290,497 | 7,372,013 | $82,968,990 |
| * | Effective August 10, 2020, the Wasmer Schroeder High Yield Municipal Fund was reorganized into the Schwab Opportunistic Municipal Bond Fund, which commenced operations on that day. The Statement of Changes above presents the fiscal year ended February 29, 2020 of the Wasmer Schroeder High Yield Municipal Fund (see financial note 1 for additional information). |
| 1 | Effective July 1, 2021, redemption fees were eliminated. Net of redemption fees amounting to $0, $21,209 and $2,945, respectively, are included in the periods ended August 31, 2021, August 31, 2020 and February 29, 2020, respectively (see financial note 6 for additional information). |
Schwab Municipal Bond Funds | Annual Report
Schwab Municipal Bond Funds
1. Business Structure of the Funds:
Each of the funds in this report is a series of Schwab Investments (the trust), a no-load, open-end management investment company. The trust is organized as a Massachusetts business trust and is registered under the Investment Company Act of 1940, as amended (the 1940 Act). The list below shows all the funds in the trust as of the end of the period, including the funds discussed in this report, which are highlighted:
| SCHWAB INVESTMENTS (ORGANIZED OCTOBER 26, 1990) |
| Schwab Tax-Free Bond Fund | Schwab U.S. Aggregate Bond Index Fund |
| Schwab California Tax-Free Bond Fund | Schwab Short-Term Bond Index Fund |
| Schwab Opportunistic Municipal Bond Fund | Schwab 1000 Index® Fund |
| Schwab Treasury Inflation Protected Securities Index Fund | Schwab Global Real Estate Fund |
Effective July 1, 2021, Schwab High Yield Municipal Bond Fund changed its name to Schwab Opportunistic Municipal Bond Fund.
Effective August 10, 2020, the Wasmer Schroder High Yield Municipal Fund (Predecessor Fund) was reorganized into the Schwab Opportunistic Municipal Bond Fund. Shareholders of the Predecessor Fund received equivalent shares of the Schwab Opportunistic Municipal Bond Fund. Although the Schwab Opportunistic Municipal Bond Fund commenced its operations on August 10, 2020, it inherited the performance history of the Predecessor Fund. Effective August 31, 2020, the fund changed its fiscal year end from the last day in February to August 31st.
Each fund in this report offers one share class. Shares are bought and sold at closing net asset value per share (NAV), which is the price for all outstanding shares of a fund. Each share has a par value of 1/1,000 of a cent, and the funds’ Board of Trustees (the Board) may authorize the issuance of as many shares as necessary.
Each fund maintains its own account for purposes of holding assets and accounting, and is considered a separate entity for tax purposes. Within its account, each fund may also keep certain assets in segregated accounts, as required by securities law.
2. Significant Accounting Policies:
The following is a summary of the significant accounting policies the funds use in their preparation of financial statements. The funds follow the investment company accounting and reporting guidance of the Financial Accounting Standards Board (FASB) Accounting Standard Codification Topic 946 Financial Services — Investment Companies. The accounting policies are in conformity with accounting principles generally accepted in the United States of America (GAAP).
(a) Security Valuation:
Under procedures approved by the Board, the investment adviser has formed a Pricing Committee to administer the pricing and valuation of portfolio securities and other assets and to ensure that prices used for internal purposes or provided by third parties reasonably reflect fair value. Among other things, these procedures allow the funds to utilize independent pricing services, quotations from securities and financial instrument dealers and other market sources to determine fair value.
The funds value the securities in their portfolios every business day. The funds use the following policies to value various types of securities:
• Bonds and notes: Fixed income investments are generally valued using an evaluated price at the mid-point of the bid/ask spread provided by an approved, independent pricing service (mid-price). To determine the evaluated mid-price, a pricing service may use a variety of techniques and inputs. Techniques may include, but are not limited to, spread models that calculate an investment-specific price relative to a benchmark or yield curve models that establish a price based on yields of comparable bonds along a range of maturities. Inputs differ by valuation approach and technique, as appropriate, and examples of inputs may include, but are not limited to, interest rates, market conditions, comparable bonds, market trades, projected cash flows, credit reviews and issuer news.
• Short-term securities (60 days or less to maturity): Securities with remaining maturities of 60 days or less are generally valued at an evaluated price; however, such securities may be valued at their amortized cost if it approximates the security’s fair value.
• Securities for which no quoted value is available: The Board has adopted procedures to fair value each fund’s securities when market prices are not “readily available” or are unreliable. For example, a fund may fair value a security when it is de-listed or its trading is halted or suspended; when a security’s primary pricing source is unable or unwilling to provide a price; or when a security’s primary trading market is closed during regular market hours. Each fund makes fair value
Schwab Municipal Bond Funds | Annual Report
Schwab Municipal Bond Funds
Financial Notes (continued)
2. Significant Accounting Policies (continued):
determinations in good faith in accordance with the fund’s valuation procedures. The Pricing Committee considers a number of factors, including unobservable market inputs, when arriving at fair value. The Pricing Committee may employ techniques such as the review of related or comparable assets or liabilities, related market activities, recent transactions, market multiples, book values, transactional back-testing, disposition analysis and other relevant information. The Pricing Committee regularly reviews these inputs and assumptions to calibrate the valuations. Due to the subjective and variable nature of fair value pricing, there can be no assurance that a fund could obtain the fair value assigned to the security upon the sale of such security. The Board convenes on a regular basis to review fair value determinations made by the funds pursuant to the valuation procedures.
In accordance with the authoritative guidance on fair value measurements and disclosures under GAAP, the funds disclose the fair value of their investments in a hierarchy that prioritizes the significant inputs to valuation techniques used to measure the fair value. The hierarchy gives the highest priority to valuations based upon unadjusted quoted prices in active markets for identical assets or liabilities (Level 1 measurements) and the lowest priority to valuations based upon unobservable inputs that are significant to the valuation (Level 3 measurements). If inputs used to measure the financial instruments fall within different levels of the hierarchy, the categorization is based on the lowest level input that is significant to the valuation. If the funds determine that either the volume and/or level of activity for an asset or liability has significantly decreased (from normal conditions for that asset or liability) or price quotations or observable inputs are not associated with orderly transactions, increased analysis and management judgment will be required to estimate fair value.
The three levels of the fair value hierarchy are as follows:
• Level 1—quoted prices in active markets for identical securities—Investments whose values are based on quoted market prices in active markets, and whose values are therefore classified as Level 1 prices, include active listed equities.
• Level 2—other significant observable inputs (including quoted prices for similar securities, interest rates, prepayment speeds, credit risk, etc.)—Investments that trade in markets that are not considered to be active, but whose values are based on quoted market prices, dealer quotations or valuations provided by alternative pricing sources supported by observable inputs are classified as Level 2 prices. These generally include U.S. government and sovereign obligations, most government agency securities, investment-grade corporate bonds, certain mortgage products, less liquid listed equities, and state, municipal and provincial obligations.
• Level 3—significant unobservable inputs (including the funds’ own assumptions in determining the fair value of investments)—Investments whose values are classified as Level 3 prices have significant unobservable inputs, as they may trade infrequently or not at all. When observable prices are not available for these securities, the funds use one or more valuation techniques for which sufficient and reliable data is available. The inputs used by the funds in estimating the value of Level 3 prices may include the original transaction price, quoted prices for similar securities or assets in active markets, completed or pending third-party transactions in the underlying investment or comparable issuers, and changes in financial ratios or cash flows. Level 3 prices may also be adjusted to reflect illiquidity and/or non-transferability, with the amount of such discount estimated by the funds in the absence of market information. Assumptions used by the funds due to the lack of observable inputs may significantly impact the resulting fair value and therefore the funds’ results of operations.
The inputs or methodology used for valuing securities are not necessarily an indication of the risk associated with investing in those securities.
The levels associated with valuing the funds’ investments as of August 31, 2021 are disclosed in the Portfolio Holdings.
(b) Accounting Policies for certain Portfolio Investments (if held):
Futures Contracts: Futures contracts are instruments that represent an agreement between two parties that obligates one party to buy, and the other party to sell, specific instruments at an agreed upon price on a stipulated future date. A fund must give the broker a deposit of cash and/or securities (initial margin) whenever it enters into a futures contract. The amount of the deposit may vary from one contract to another. Subsequent payments (variation margin) are made or received by a fund depending on the daily fluctuations in the value of the futures contract and are accounted for as unrealized appreciation or depreciation until the contract is closed, at which time the gains or losses are realized. Futures contracts are traded publicly on exchanges, and their value may change daily.
Delayed Delivery Transactions and When-Issued Securities: During the period, certain funds transacted in securities on a delayed delivery or when-issued basis. Payment and delivery may take place after the customary settlement period for that security. The price of the underlying securities and the date when the securities will be delivered and paid for are fixed at the time the transaction
Schwab Municipal Bond Funds | Annual Report
Schwab Municipal Bond Funds
Financial Notes (continued)
2. Significant Accounting Policies (continued):
is negotiated. The securities purchased on a delayed delivery or when-issued basis are identified as such in the funds’ Portfolio Holdings. The funds may receive compensation for interest forgone in the purchase of a delayed delivery or when-issued security. With respect to purchase commitments, the funds identify securities as segregated in their records with a value at least equal to the amount of the commitment. Losses may arise due to changes in the value of the underlying securities or if the counterparty does not perform under the contract’s terms, or if the issuer does not issue the securities due to political, economic, or other factors.
(c) Security Transactions:
Security transactions are recorded as of the date the order to buy or sell the security is executed. Realized gains and losses from security transactions are based on the identified costs of the securities involved.
When a fund closes out a futures contract position, it calculates the difference between the value of the position at the beginning and at the end of the contract, and records a realized gain or loss accordingly.
(d) Investment Income:
Interest income is recorded as it accrues. If a fund buys a debt security at a discount (less than face value) or a premium (more than face value), it amortizes premiums and accretes discounts from the purchase settlement date up to maturity. The fund then increases (in the case of discounts) or reduces (in the case of premiums) the income it records from the security. Certain securities may be callable (meaning that the issuer has the option to pay it off before its maturity date). The fund amortizes the premium and accretes the discount on each callable security to the security’s maturity date, except when the purchase price is higher than the call price at the security’s call date (in which case the premium is amortized to the call date). Debt securities may be placed on non-accrual status and set to accrue at a rate of interest less than the contractual coupon or have the interest receivable written off when the collection of all or a portion of interest has become doubtful.
(e) Expenses:
Expenses that are specific to a fund are charged directly to the fund. Expenses that are common to more than one fund in the trusts generally are allocated among those funds in proportion to their average daily net assets.
(f) Distributions to Shareholders:
The funds, except Schwab Opportunistic Municipal Bond Fund, declare distributions from net investment income, if any, every day they are open for business. These distributions, which are substantially equal to a fund’s net investment income for that day, are paid out to shareholders once a month. The Schwab Opportunistic Municipal Bond Fund declares and pays its dividends on the last business day of every month, based on its determination of net investment income. The funds make distributions from net realized capital gains, if any, once a year.
(g) Accounting Estimates:
The accounting policies described in this report conform to GAAP. Notwithstanding this, shareholders should understand that in order to follow these principles, fund management has to make estimates and assumptions that affect the information reported in the financial statements. It’s possible that once the results are known, they may turn out to be different from these estimates and these differences may be material.
(h) Federal Income Taxes:
The funds intend to meet federal income and excise tax requirements for regulated investment companies under subchapter M of the Internal Revenue Code, as amended. Accordingly, the funds distribute substantially all of their net investment income and net realized capital gains, if any, to their respective shareholders each year. As long as a fund meets the tax requirements, it is not required to pay federal income tax.
(i) Indemnification:
Under the funds’ organizational documents, the officers and trustees are indemnified against certain liabilities arising out of the performance of their duties to the funds. In addition, in the normal course of business the funds enter into contracts with their vendors and others that provide general indemnifications. The funds’ maximum exposure under these arrangements is unknown as this would involve future claims that may be made against the funds. However, based on experience, the funds expect the risk of loss attributable to these arrangements to be remote.
Schwab Municipal Bond Funds | Annual Report
Schwab Municipal Bond Funds
Financial Notes (continued)
2. Significant Accounting Policies (continued):
(j) Recent Accounting Standards:
In March 2020, the FASB issued Accounting Standards Update “Facilitation of the Effects of Reference Rate Reform on Financial Reporting (Topic 848)” (ASU 2020-04), which provides optional temporary financial reporting relief from the effect of certain types of contract modifications due to the planned discontinuation of the London Interbank Offered Rate (LIBOR) and other interbank offered based reference rates at the end of 2021. The temporary relief provided is effective for certain reference rate-related contract modifications that occur during the period March 12, 2020 through December 31, 2022. At this time, management believes the adoption of ASU 2020-04 will not have a material impact to the financial statements.
3. Risk Factors:
The funds invest primarily in investment-grade municipal bond securities. These investments may involve certain risks, as discussed in the funds’ prospectus, including, but not limited to, those described below:
Market Risk. Financial markets rise and fall in response to a variety of factors, sometimes rapidly and unpredictably. Markets may be impacted by economic, political, regulatory and other conditions, including economic sanctions and other government actions. In addition, the occurrence of global events, such as war, terrorism, environmental disasters, natural disasters and epidemics, may also negatively affect the financial markets. As with any investment whose performance is tied to these markets, the value of an investment in a fund will fluctuate, which means that an investor could lose money over short or long periods.
Management Risk. As actively managed mutual funds, the funds are subject to the risk that their investment adviser will select investments or allocate assets in a manner that could cause a fund to underperform or otherwise not meet its investment objective. The funds’ investment adviser applies its own investment techniques and risk analyses in making investment decisions for each fund, but there can be no guarantee that they will produce the desired results.
Investment Style Risk. The funds are not designed to offer substantial capital appreciation. In exchange for its goal of capital preservation, a fund may offer lower long-term performance than stock investments or certain other types of bond investments. A fund’s emphasis on quality and preservation of capital also could cause it to underperform certain other types of bond investments, particularly those that take greater maturity and credit risks. At the same time, some of the funds’ investments may have greater risks than investments in some taxable bonds.
Municipal Securities Risk. The funds primarily invest in municipal securities whose interest, in the opinion of the issuers’ counsel, is exempt from federal income tax and from the AMT. Neither the investment adviser nor the funds guarantee that this opinion is correct, and there is no assurance that the Internal Revenue Service (IRS) will agree with such counsel’s opinion. If certain types of investments a fund buys as tax-exempt are later ruled to be taxable, a portion of the fund’s income could be taxable. To the extent that a fund invests in municipal securities from a given state or geographic region, its share price and performance could be affected by local, state and regional factors, including erosion of the tax base and changes in the economic climate. In addition, many municipal securities are issued to finance specific projects (especially those relating to education, health care, transportation and utilities) and conditions in those sectors can affect the overall municipal market. National governmental actions, such as the elimination of tax-exempt status, or the reduction of financial support to municipalities, also could affect performance. Municipalities continue to experience difficulties in the current economic and political environment.
Interest Rate Risk. Interest rates rise and fall over time. As with any investment whose yield reflects current interest rates, a fund’s yield will change over time. During periods when interest rates are low, a fund’s yield (and total return) also may be low. Changes in interest rates also may affect a fund’s share price: a rise in interest rates generally causes a fund’s share price to fall. The longer a fund’s portfolio duration, the more sensitive to interest rate movements its share price is likely to be. Also, a change in a central bank’s monetary policy or economic conditions, among other things, may result in a change in interest rates, which could have sudden and unpredictable effects on the markets and significantly impact the value of fixed-income securities in which a fund invests.
Credit Risk. A decline in the credit quality of an issuer or guarantor or liquidity provider of a portfolio investment or a counterparty could cause the funds to lose money or underperform. The funds could lose money if, due to a decline in credit quality, the issuer or guarantor or liquidity provider of a portfolio investment or a counterparty fails to make, or is perceived as being unable or unwilling to make, timely principal or interest payments or otherwise honor its obligations.
Liquidity Risk. The funds may be unable to sell certain securities, such as illiquid securities, readily at a favorable time or price, or the funds may have to sell them at a loss.
Schwab Municipal Bond Funds | Annual Report
Schwab Municipal Bond Funds
Financial Notes (continued)
3. Risk Factors (continued):
High-Yield Risk. High-yield securities and unrated securities of similar credit quality (junk bonds) are subject to greater levels of credit and liquidity risks, and may be more volatile than higher-rated securities. High-yield securities are considered predominately speculative with respect to the issuer’s continuing ability to make principal and interest payments.
Prepayment and Extension Risk. Certain fixed-income securities are subject to the risk that the securities may be paid off earlier or later than expected, especially during periods of falling or rising interest rates, respectively. Prepayments of obligations could cause the fund to forgo future interest income on the portion of the security’s principal repaid early and force the fund to reinvest that money at the lower prevailing interest rates. Extensions of obligations could cause the fund to exhibit additional volatility and hold securities paying lower-than-market rates of interest. Either case could hurt the fund’s performance.
Derivatives Risk. Currently, the only type of derivatives the funds invest in is futures. A future is an agreement to buy or sell a financial instrument at a specific price on a specific day. A fund’s use of futures involves risks different from, or possibly greater than, the risks associated with investing directly in securities and other traditional investments. Certain of these risks, such as liquidity risk, credit risk, leverage risk, market risk and management risk, are discussed elsewhere in this section. A fund’s use of futures is also subject to lack of availability risk, valuation risk, correlation risk and tax risk. Lack of availability risk is the risk that suitable futures transactions may not be available in all circumstances for risk management or other purposes. Valuation risk is the risk that a particular future may be valued incorrectly. Correlation risk is the risk that changes in the value of the future may not correlate perfectly with the underlying asset, rate or index. Tax risk is the risk that the use of futures may cause a fund to realize higher amounts of short-term capital gains. A fund’s use of derivatives could reduce the fund’s performance, increase the fund’s volatility, and cause the fund to lose more than the initial amount invested. However, these risks are less severe when a fund uses derivatives for hedging rather than to enhance the fund’s returns or as a substitute for a position or security. The use of derivatives that are subject to regulation by the Commodity Futures Trading Commission (CFTC) could cause a fund to become a commodity pool, which would require the fund to comply with certain CFTC rules.
Distressed or Defaulted Securities Risk. Investments in defaulted securities and obligations of distressed issuers, including securities that are, or may be, involved in reorganizations or other financial restructurings, either out of court or in bankruptcy, involve substantial risks in addition to the risks of investing in high-yield debt securities. A fund’s share price may decline if the reorganization or restructuring is not completed as anticipated. A fund will generally not receive interest payments on the distressed securities and may incur costs to protect its investment. Repayment of defaulted securities and obligations of distressed issuers is subject to significant uncertainties. A fund could lose its entire investment in such securities.
Rule 144A Securities Risk. The market for Rule 144A securities typically is less active than the market for publicly-traded securities. Rule 144A securities carry the risk that the liquidity of these securities may become impaired, making it more difficult for a fund to sell these bonds.
Zero Coupon Securities Risk. While interest payments are not made on such securities, holders of such securities are deemed to have received income annually, notwithstanding that cash may not be received currently. Some of these securities may be subject to substantially greater price fluctuations during periods of changing market interest rates than are comparable securities that pay interest currently. Longer term zero coupon bonds are more exposed to interest rate risk than shorter term zero coupon bonds.
California State-Specific Risk. Because the Schwab California Tax-Free Bond Fund concentrates its investments in California municipal securities, the fund may be affected significantly by economic, regulatory, social or political developments affecting the ability of California issuers to pay interest or repay principal.
Taxable Investments Risk. A fund may invest a portion of its assets in securities that generate income that is not exempt from federal income tax and in securities whose interest is subject to the AMT. These investments could generate taxable income for shareholders.
Please refer to the funds’ prospectus for a more complete description of the principal risks of investing in the funds.
4. Affiliates and Affiliated Transactions:
Investment Adviser
Charles Schwab Investment Management, Inc. (CSIM or the investment adviser), a wholly owned subsidiary of The Charles Schwab Corporation, serves as each fund’s investment adviser and administrator pursuant to an Investment Advisory and Administration Agreement between it and the trust.
Schwab Municipal Bond Funds | Annual Report
Schwab Municipal Bond Funds
Financial Notes (continued)
4. Affiliates and Affiliated Transactions (continued):
For its advisory and administrative services to the Schwab Tax-Free Bond Fund and Schwab California Tax-Free Bond Fund, CSIM is entitled to receive an annual fee, payable monthly, based on each fund’s average daily net assets as follows:
| % of Average Daily Net Assets | Schwab
Tax-Free
Bond Fund | Schwab
California Tax-Free
Bond Fund |
| First $500 million | 0.30% | 0.30% |
| Over $500 million | 0.22% | 0.22% |
For its advisory and administrative services to the Schwab Opportunistic Municipal Bond Fund, CSIM is entitled to receive an annual fee, payable monthly, equal to 0.40% of the fund’s average daily net assets. Prior to July 1, 2021, the annual fee was 0.50%.
For the period ended August 31, 2021, the aggregate advisory fees paid to CSIM by the funds, as a percentage of each fund’s average daily net assets were as follows:
| Schwab Tax-Free Bond Fund | 0.27% |
| Schwab California Tax-Free Bond Fund | 0.30% |
| Schwab Opportunistic Municipal Bond Fund | 0.48% |
Shareholder Servicing
The Board has adopted a Shareholder Servicing Plan (the Plan) on behalf of the funds, except the Schwab Opportunistic Municipal Bond Fund. The Plan enables each fund to bear expenses relating to the provision by financial intermediaries, including Charles Schwab & Co., Inc. (a broker-dealer affiliate of CSIM, Schwab) (together, service providers), of certain account maintenance, customer liaison and shareholder services to the current shareholders of the funds.
Pursuant to the Plan, each fund’s shares, excluding the Schwab Opportunistic Municipal Bond Fund, are subject to an annual shareholder servicing fee up to 0.25%. The shareholder servicing fee paid to a particular service provider is made pursuant to its written agreement with Schwab, as distributor of the funds (or, in the case of payments made to Schwab acting as a service provider, pursuant to Schwab’s written agreement with the funds), and a fund will pay no more than 0.25% of the average annual daily net asset value of the fund shares owned by shareholders holding shares through such service provider. Payments under the Plan are made as described above without regard to whether the fee is more or less than the service provider’s actual cost of providing the services, and if more, such excess may be retained as profit by the service provider.
Expense Limitation
Although these agreements specify certain fees for these services, CSIM and its affiliates have made an additional agreement with the funds, for so long as CSIM serves as the investment adviser to the funds, which may only be amended or terminated with the approval of the Board, to limit the total annual fund operating expenses charged, excluding interest, taxes and certain non-routine expenses (expense limitation) to 0.49% for Schwab Tax-Free Bond Fund and Schwab California Tax-Free Bond Fund, and 0.50% for the Schwab Opportunistic Municipal Bond Fund. Prior to July 1, 2021, Schwab Opportunistic Municipal Bond Fund’s expense limitation was 0.60%.
Interfund Transactions
The funds may engage in transactions with certain other funds in the Fund Complex (for definition refer to Trustees and Officers section) in accordance with procedures adopted by the Board pursuant to Rule 17a-7 under the 1940 Act. When one fund is seeking to sell a security that another is seeking to buy, an interfund transaction can allow both funds to benefit by reducing transaction costs. This practice is limited to funds that share the same investment adviser, trustees and/or officers. For the period ended August 31, 2021, only Schwab California Tax-Free Bond Fund had aggregate security transactions with other funds in the Fund Complex in the amount of $4,195,014 and includes realized gains/losses of $0.
Interfund Borrowing and Lending
Pursuant to an exemptive order issued by the SEC, the funds may enter into interfund borrowing and lending transactions with other funds in the Fund Complex. All loans are for temporary or emergency purposes and the interest rate to be charged will be the average of the overnight repurchase agreement rate and the short-term bank loan rate. All loans are subject to numerous conditions designed to ensure fair and equitable treatment of all participating funds. The interfund lending facility is subject to the oversight and periodic review by the Board. The funds had no interfund borrowing or lending activity during the period.
Schwab Municipal Bond Funds | Annual Report
Schwab Municipal Bond Funds
Financial Notes (continued)
The Board may include people who are officers and/or directors of CSIM or its affiliates. Federal securities law limits the percentage of such “interested persons” who may serve on a trust’s board, and the trust was in compliance with these limitations throughout the report period. The trust did not pay any of these interested persons for their services as trustees, but it did pay non-interested persons (independent trustees), as noted on each fund’s Statement of Operations. For information regarding the trustees, please refer to the Trustees and Officers table at the end of this report.
6. Redemption Fees:
Prior to July 1, 2021, the Schwab Opportunistic Municipal Bond charged a 1.00% redemption fee on shares sold or exchanged within 60 days of the original purchase date. Such amounts are netted against the redemption proceeds on the Statement of Changes in Net Assets. The redemption fee was suspended from April 13, 2020 through August 10, 2020. Amounts prior to August 10, 2020 were charged by the Predecessor Fund. The fees charged during the current and prior periods were:
| | Current Period
(9/1/20-8/31/21) | Prior Period
(3/1/20-8/31/20) | Prior Period
(3/1/19-2/29/20) |
| Schwab Opportunistic Municipal Bond Fund | $0 | $21,209 | $2,945 |
7. Borrowing from Banks:
During the period, the funds were participants with other funds in the Fund Complex in a joint, syndicated, committed $750 million line of credit (the Syndicated Credit Facility), which matured on October 1, 2020. On October 1, 2020, the Syndicated Credit Facility was amended to run for a new 364 day period with a line of credit of $850 million, maturing on September 30, 2021. Under the terms of the Syndicated Credit Facility, in addition to the interest charged on any borrowings by a fund, each fund paid a commitment fee of 0.15% per annum on its proportionate share of the unused portion of the Syndicated Credit Facility.
During the period, the funds were participants with other funds in the Fund Complex in a joint, unsecured, uncommitted $500 million line of credit (the Uncommitted Credit Facility), with State Street Bank and Trust Company, which was scheduled to mature on November 27, 2020. However, on October 1, 2020, the Uncommitted Credit Facility was amended to run for a new 364 day period with a line of credit of $400 million, maturing on September 30, 2021. Under the terms of the Uncommitted Credit Facility, each fund pays interest on the amount it borrows. There were no borrowings from either line of credit during the period.
The funds also have access to custodian overdraft facilities. A fund may have utilized the overdraft facility and incurred an interest expense, which is disclosed on each fund’s Statement of Operations, if any. The interest expense is determined based on a negotiated rate above the current Federal Funds Rate.
8. Purchases and Sales/Maturities of Investment Securities:
For the period ended August 31, 2021, purchases and sales/maturities of securities (excluding short-term obligations) were as follows:
| | Purchases
of Securities | Sales/Maturities
of Securities |
| Schwab Tax-Free Bond Fund | $475,842,618 | $420,962,547 |
| Schwab California Tax-Free Bond Fund | 229,467,685 | 214,875,283 |
| Schwab Opportunistic Municipal Bond Fund | 54,139,019 | 52,331,000 |
Schwab Municipal Bond Funds | Annual Report
Schwab Municipal Bond Funds
Financial Notes (continued)
As of August 31, 2021, the tax basis cost of the funds’ investments and gross unrealized appreciation and depreciation were as follows:
| | Schwab
Tax-Free
Bond Fund | | Schwab
California Tax-Free
Bond Fund | | Schwab
Opportunistic
Municipal
Bond Fund |
| Tax cost | $770,956,606 | | $481,607,822 | | $64,695,961 |
| Gross unrealized appreciation | $43,942,061 | | $25,026,175 | | $3,255,590 |
| Gross unrealized depreciation | (172,225) | | (221,817) | | (28,772) |
| Net unrealized appreciation (depreciation) | $43,769,836 | | $24,804,358 | | $3,226,818 |
As of August 31, 2021, the components of distributable earnings on a tax basis were as follows:
| | Schwab
Tax-Free
Bond Fund | | Schwab
California Tax-Free
Bond Fund | | Schwab
Opportunistic
Municipal
Bond Fund |
| Undistributed tax-exempt income | $490,550 | | $221,316 | | $428,744 |
| Undistributed ordinary income | 966,096 | | 962,515 | | 3,844 |
| Undistributed long-term capital gains | 1,999,859 | | 1,392,509 | | — |
| Net unrealized appreciation (depreciation) on investments | 43,769,836 | | 24,804,358 | | 3,226,818 |
| Capital loss carryforwards and other losses | — | | — | | (1,027,824) |
| Total | $47,226,341 | | $27,380,698 | | $2,631,582 |
The components of distributable earnings on a tax basis may not match the Total distributable earnings line item on the Statement of Assets and Liabilities due to other temporary timing differences. The primary difference between book basis and tax basis unrealized appreciation or unrealized depreciation of investments are the tax deferral of losses on wash sales and the differing treatment of amortization of bond discounts and premiums. The tax cost of the funds’ investments, disclosed above, have been adjusted from their book amounts to reflect these appreciation or depreciation differences, as applicable.
Net investment income and realized capital gains and losses may differ for financial statement and tax purposes primarily due to differing treatments of amortization of bond discounts and premiums.
Capital loss carryforwards may be used to offset future realized capital gains for federal income tax purposes. As of August 31, 2021, the Schwab Opportunistic Municipal Bond Fund had capital loss carryforwards of $1,027,824 with no expiration available to offset future net capital gains. The Schwab Tax-Free Bond Fund and Schwab California Tax-Free Bond Fund had no capital loss carryforwards available to offset future net capital gains.
For the fiscal year ended August 31, 2021, the funds had capital loss carryforwards utilized as follows:
| | Schwab
Tax-Free
Bond Fund | Schwab
California Tax-Free
Bond Fund | Schwab
Opportunistic
Municipal
Bond Fund |
| Capital loss carryforwards utilized | $— | $— | $363,437 |
Schwab Municipal Bond Funds | Annual Report
Schwab Municipal Bond Funds
Financial Notes (continued)
9. Federal Income Taxes (continued):
The tax basis components of distributions paid during the current and prior fiscal years/periods were as follows:
| | Schwab
Tax-Free Bond
Fund | Schwab California
Tax-Free
Bond Fund | Schwab
Opportunistic Municipal
Bond Fund |
| Current fiscal year end distributions | | | |
| Tax-exempt income | $13,651,332 | $8,184,103 | $1,545,297 |
| Ordinary income | — | 14,234 | 48,978 |
| Long-term capital gains | 4,221,432 | 3,698,563 | 345,620 |
| Prior fiscal year/period end distributions | | | |
| Tax-exempt income | $15,978,747 | $9,329,822 | $1,323,194 |
| Ordinary income | 920,038 | 120,150 | — |
| Long-term capital gains | 1,161,085 | 1,282,897 | — |
| Year ended February 29, 2020 distributions* | | | |
| Tax-exempt income | N/A | N/A | $2,788,936 |
| Ordinary income | N/A | N/A | 83,594 |
| Long-term capital gains | N/A | N/A | 601,506 |
* These distributions represent those of the Predecessor Fund.
Permanent book and tax basis differences may result in reclassifications between components of net assets as required. The adjustments will have no impact on net assets or the results of operations.
As of August 31, 2021, management has reviewed the tax positions for open periods (for federal purposes, three years from the date of filing and for state purposes, four years from the date of filing) as applicable to the funds, and has determined that no provision for income tax is required in the funds’ financial statements. The funds recognize interest and penalties, if any, related to unrecognized tax benefits as income tax expense in the Statement of Operations. During the fiscal year ended August 31, 2021, the funds did not incur any interest or penalties.
10. Subsequent Events:
Management has determined there are no subsequent events or transactions through the date the financial statements were issued that would have materially impacted the financial statements as presented.
Schwab Municipal Bond Funds | Annual Report
Schwab Municipal Bond Funds
Report of Independent Registered Public Accounting Firm
To the Board of Trustees of Schwab Investments and Shareholders of Schwab Tax-Free Bond Fund, Schwab California Tax-Free Bond Fund, and Schwab Opportunistic Municipal Bond Fund:
Opinion on the Financial Statements and Financial Highlights
We have audited the accompanying statements of assets and liabilities, including the portfolio holdings, of Schwab Tax-Free Bond Fund, Schwab California Tax-Free Bond Fund, and Schwab Opportunistic Municipal Bond Fund (formerly, Schwab High Yield Municipal Bond Fund) (the “Funds”), three of the funds constituting Schwab Investments, as of August 31, 2021, and the related statements of operations for the year then ended, the related statements of changes in net assets and the financial highlights for the two years then ended; except for Schwab Opportunistic Municipal Bond Fund, the related statement of changes in net assets and the financial highlights for the year ended August 31, 2021 and for the period from March 1, 2020 through August 31, 2020; and the related notes. In our opinion, the financial statements and financial highlights present fairly, in all material respects, the financial position of each of the Funds (excluding Schwab Opportunistic Municipal Bond Fund) as of August 31, 2021, the results of their operations for the year then ended, and the changes in their net assets and the financial highlights for the two years in the period then ended in conformity with accounting principles generally accepted in the United States of America. Also, in our opinion, the financial statements and financial highlights present fairly, in all material respects, the financial position of Schwab Opportunistic Municipal Bond Fund as of August 31, 2021, the results of its operations for the year then ended, and the changes in its net assets and financial highlights for the year then ended and for the period from March 1, 2020 through August 31, 2020 in conformity with accounting principles generally accepted in the United States of America. The financial highlights for each of the three years in the period ended August 31, 2019 were audited by other auditors, whose report, dated October 17, 2019, expressed an unqualified opinion on such financial highlights, except for Schwab Opportunistic Municipal Bond Fund. For Schwab Opportunistic Municipal Bond Fund, the statement of changes in net assets for the period ended February 29, 2020 and the financial highlights for each of the four years in the period ended February 29, 2020 were audited by other auditors, whose report, dated April 29, 2020, expressed an unqualified opinion on such financial statements and financial highlights.
Basis for Opinion
These financial statements and financial highlights are the responsibility of the Funds’ management. Our responsibility is to express an opinion on the Funds’ financial statements and financial highlights based on our audits. We are a public accounting firm registered with the Public Company Accounting Oversight Board (United States) (PCAOB) and are required to be independent with respect to the Funds in accordance with the U.S. federal securities laws and the applicable rules and regulations of the Securities and Exchange Commission and the PCAOB.
We conducted our audits in accordance with the standards of the PCAOB. Those standards require that we plan and perform the audit to obtain reasonable assurance about whether the financial statements and financial highlights are free of material misstatement, whether due to error or fraud. The Funds are not required to have, nor were we engaged to perform, an audit of their internal control over financial reporting. As part of our audits we are required to obtain an understanding of internal control over financial reporting but not for the purpose of expressing an opinion on the effectiveness of the Funds’ internal control over financial reporting. Accordingly, we express no such opinion.
Our audits included performing procedures to assess the risks of material misstatement of the financial statements and financial highlights, whether due to error or fraud, and performing procedures that respond to those risks. Such procedures included examining, on a test basis, evidence regarding the amounts and disclosures in the financial statements and financial highlights. Our audits also included evaluating the accounting principles used and significant estimates made by management, as well as evaluating the overall presentation of the financial statements and financial highlights. Our procedures included confirmation of securities owned as of August 31, 2021, by correspondence with the custodian and brokers; when replies were not received from brokers, we performed other auditing procedures. We believe that our audits provide a reasonable basis for our opinion.
Deloitte & Touche LLP
Denver, Colorado
October 19, 2021
We have served as the auditor of one or more investment companies in the Schwab Funds Complex since 2020.
Schwab Municipal Bond Funds | Annual Report
Schwab Municipal Bond Funds
Other Federal Tax Information (unaudited)
Under section 852(b)(5) of the Internal Revenue Code (and section 17145 of the California Revenue and Taxation Code with respect to the Schwab California Tax-Free Bond Fund), the funds designate the following percentage of the distributions paid from net investment income as exempt-interest dividends for the fiscal year ended August 31, 2021.
| | Percentage |
| Schwab Tax-Free Bond Fund | 100.0% |
| Schwab California Tax-Free Bond Fund | 100.0% |
| Schwab Opportunistic Municipal Bond Fund | 99.8% |
Under section 852(b)(3)(C) of the Internal Revenue Code, the funds hereby designate the following amounts as long-term capital gain dividends for the fiscal year ended August 31, 2021:
| Schwab Tax-Free Bond Fund | $4,221,432 |
| Schwab California Tax-Free Bond Fund | 3,698,563 |
| Schwab Opportunistic Municipal Bond Fund | 345,620 |
Schwab Municipal Bond Funds | Annual Report
Schwab Municipal Bond Funds
Investment Advisory Agreement Approval
Approval of Amendment to Investment Advisory Agreement
At a meeting held on February 24, 20211 (the Meeting), the Board, including a majority of the Independent Trustees, considered information relating to a proposed amendment to the investment advisory agreement (the Amendment) between Schwab Investments (the Trust) and Charles Schwab Investment Management, Inc. (CSIM) with respect to Schwab Opportunistic Municipal Bond Fund (the Fund), to reflect a reduction in the advisory fee to be paid by the Fund to CSIM as compensation for CSIM’s services rendered to the Fund. The Board also considered an amendment to the Fund’s expense limitation agreement to reduce the expense limitation for the Fund. The Board reviewed materials provided by CSIM relating to these and other proposed changes, including changes to the Fund’s name, principal investment strategy and performance benchmarks. The Board considered CSIM’s representation that the Amendment and reduction in the Fund’s expense limitation will not result in any reduction in the nature and level of services provided to the Fund by CSIM. In addition to the extensive information that the Board reviewed and the conclusions it reached at its May and June 2020 meetings (the 2020 Annual Meetings) in connection with its annual consideration and approval of the continuation of the Fund’s investment advisory agreement, the Board considered how the Fund’s proposed fees and expenses compared to those of funds with investment strategies similar to those proposed for the Fund.
Based on the Trustees’ deliberation and their evaluation of the information described at the Meeting and the 2020 Annual Meetings, the Board, including a majority of the Independent Trustees, approved the Amendment with respect to the Fund effective July 1, 2021 and concluded that the compensation payable by the Fund to CSIM under the Agreement is fair and reasonable in light of the services CSIM renders to (and the expenses it bears relating to) the Fund and such other matters as the Trustees considered to be relevant in the exercise of their reasonable judgment.
Annual Approval of Investment Advisory Agreement
The Investment Company Act of 1940, as amended (the 1940 Act), requires that the continuation of a fund’s investment advisory agreement must be specifically approved (1) by the vote of the trustees or by a vote of the shareholders of the fund, and (2) by the vote of a majority of the trustees who are not parties to the investment advisory agreement or “interested persons” of any party (the Independent Trustees), cast in person at a meeting called for the purpose of voting on such approval. In connection with such approvals, the fund’s trustees must request and evaluate, and the investment adviser is required to furnish, such information as may be reasonably necessary to evaluate the terms of the investment advisory agreement.
The Board of Trustees (the Board or the Trustees, as appropriate) calls and holds one or more meetings each year that are dedicated, in whole or in part, to considering whether to renew the investment advisory and administration agreement (the Agreement) between Schwab Investments (the Trust) and Charles Schwab Investment Management, Inc. (CSIM) with respect to the existing funds in the Trust, including Schwab Tax-Free Bond Fund, Schwab California Tax-Free Bond Fund and Schwab Opportunistic Municipal Bond Fund (the Funds), and to review certain other agreements pursuant to which CSIM provides investment advisory services to certain other registered investment companies. In preparation for the meeting(s), the Board requests and reviews a wide variety of materials provided by CSIM, including information about CSIM’s affiliates, personnel, business goals and priorities, profitability, third-party oversight, corporate structure and operations. As part of the renewal process, the Independent Trustees’ legal counsel, on behalf of the Independent Trustees, sends an information request letter to CSIM seeking certain relevant information. The responses by CSIM are provided to the Trustees in the Board materials for their review prior to their meeting, and the Trustees are provided with the opportunity to request any additional materials. The Board also receives data provided by an independent provider of investment company data. This information is in addition to the detailed information about the Funds that the Board reviews during the course of each year, including information that relates to the Funds’ operations and performance, legal and compliance matters, risk management, portfolio turnover, and sales and marketing activity. In considering the renewal, the Independent Trustees receive advice from Independent Trustees’ legal counsel, including a memorandum regarding the responsibilities of trustees for the approval of investment advisory agreements. In addition, the Independent Trustees participate in question and answer sessions with representatives of CSIM and meet in executive session outside the presence of Fund management.
The Board, including a majority of the Independent Trustees, considered information specifically relating to the continuance of the Agreement with respect to the Funds at meetings held on May 12, 2021 and June 8, 2021, and approved the renewal of the Agreement with respect to the Funds for an additional one-year term at the meeting on June 8, 2021 called for the purpose of voting on such approval.1
The Board’s approval of the continuance of the Agreement with respect to the Funds was based on consideration and evaluation of a variety of specific factors discussed at these meetings and at prior meetings, including:
| 1. | the nature, extent and quality of the services provided to each Fund under the Agreement, including the resources of CSIM and its affiliates dedicated to the Funds; |
Schwab Municipal Bond Funds | Annual Report
Schwab Municipal Bond Funds
| 2. | each Fund’s investment performance and how it compared to that of certain other comparable mutual funds and benchmark data; |
| 3. | each Fund’s expenses and how those expenses compared to those of certain other similar mutual funds; |
| 4. | the profitability of CSIM and its affiliates, including Charles Schwab & Co., Inc. (Schwab), with respect to each Fund, including both direct and indirect benefits accruing to CSIM and its affiliates; and |
| 5. | the extent to which economies of scale would be realized as each Fund grows and whether fee levels in the Agreement reflect those economies of scale for the benefit of Fund investors. |
Nature, Extent and Quality of Services. The Board considered the nature, extent and quality of the services provided by CSIM to the Funds and the resources of CSIM and its affiliates dedicated to the Funds. In this regard, the Trustees evaluated, among other things, CSIM’s experience, track record, compliance program, resources dedicated to hiring and retaining skilled personnel and specialized talent, and information security resources. The Trustees also considered information provided by CSIM relating to services and support provided with respect to the Funds’ portfolio management team, portfolio strategy, and internal investment guidelines, as well as trading infrastructure, liquidity management, product design and analysis, shareholder communications, securities valuation, fund accounting and custody, and vendor and risk oversight. The Trustees also considered investments CSIM has made in its infrastructure, including modernizing CSIM’s technology and use of data, increasing expertise in key areas (including portfolio management and trade operations), and improving business continuity, cybersecurity, due diligence, risk management processes, and information security programs, which are designed to provide enhanced services to the Funds and their shareholders. The Trustees considered CSIM’s effective implementation of its business continuity plan in response to the COVID-19 pandemic and government-mandated restrictions during the prior year. The Trustees also considered Schwab’s wide range of products, services, and channel alternatives such as investment research tools and an array of account features that benefit Fund shareholders who are brokerage clients of Schwab. The Trustees also considered Schwab’s reputation as a full service brokerage firm and its overall financial condition, including Schwab’s ability to maintain consistent operations and service levels during recent periods of remote work and market volatility. Following such evaluation, the Board concluded, within the context of its full deliberations, that the nature, extent and quality of services provided by CSIM to the Funds and the resources of CSIM and its affiliates dedicated to the Funds supported renewal of the Agreement with respect to the Funds.
Fund Performance. The Board considered each Fund’s performance in determining whether to renew the Agreement
with respect to such Fund. Specifically, the Trustees considered each Fund’s performance relative to a peer category of other mutual funds and applicable indices/benchmarks, in light of portfolio yield and market trends, as well as in consideration of each Fund’s investment style and strategy attributes and disclosures. As part of this review, the Trustees considered the composition of the peer category, selection criteria and the reputation of the independent provider of investment company data who prepared the peer category analysis. In evaluating the performance of each Fund, the Trustees considered the risk profile for such Fund and the appropriateness of the benchmark used to compare the performance of each Fund. The Trustees further considered the level of Fund performance in the context of their review of Fund expenses and adviser profitability discussed below and also noted that the Board and a designated committee of the Board review performance throughout the year. Although the Schwab Opportunistic Municipal Bond Fund had performance that lagged that of a relevant peer group for certain periods considered, the Board concluded that other factors relevant to performance supported renewal of the Agreement with respect to the Fund including that the underperformance was attributable, to a significant extent, to investment decisions by CSIM that were reasonable and consistent with the Fund’s investment objective and policies and that CSIM had taken steps designed to help improve performance. Following such evaluation, the Board concluded, within the context of its full deliberations, that the performance of each Fund supported renewal of the Agreement with respect to such Fund.
Fund Expenses. With respect to each Fund’s expenses, the Trustees considered the rate of compensation called for by the Agreement and each Fund’s net operating expense ratio, in each case, in comparison to those of other similar mutual funds, such peer groups and comparisons having been selected and calculated by an independent provider of investment company data. CSIM reported to the Board, and the Board took into account, the risk assumed by CSIM in the development of the Funds and provision of services as well as the competitive marketplace for financial products. The Trustees considered the effects of CSIM’s and Schwab’s practice of waiving certain fees to prevent total annual operating expenses of the Funds from exceeding a specified cap. The Trustees also considered CSIM’s contractual commitment to keep each Fund’s expense cap for so long as CSIM serves as the adviser to the Fund. The Trustees also considered fees charged by CSIM to ETFs, other mutual funds and to other types of accounts, but, with respect to such other types of accounts, accorded less weight to such comparisons due to the different legal, regulatory, compliance and operating features of mutual funds as compared to these other types of accounts, and any differences in the nature and scope of the services CSIM provides to these other accounts, as well as differences in the market for these types of accounts. Following such evaluation, the Board concluded, within the
Schwab Municipal Bond Funds | Annual Report
Schwab Municipal Bond Funds
context of its full deliberations, that the expenses of each Fund are reasonable and supported renewal of the Agreement with respect to such Fund.
Profitability. The Trustees considered the compensation flowing to CSIM and its affiliates, directly or indirectly and reviewed profitability on a pre-tax basis, without regard to distribution expenses. In this connection, the Trustees reviewed management’s profitability analyses. The Trustees also reviewed profitability of CSIM relating to the Schwab fund complex as a whole, noting the benefits to Fund shareholders of being part of the Schwab fund complex, including the allocations of certain fixed costs across the Funds and other funds in the complex. The Trustees also considered any other benefits derived by CSIM from its relationship with the Funds, such as whether, by virtue of its management of the Funds, CSIM obtains investment information or other research resources that aid it in providing advisory services to other clients. The Trustees considered whether the compensation and profitability with respect to the Funds under the Agreement and other service agreements were reasonable and justified in light of the quality of all services rendered to the Funds by CSIM and its affiliates. The Trustees noted that CSIM continues to invest substantial sums in its business in order to provide enhanced research capabilities, services and systems to benefit the Funds. Based on this evaluation, the Board concluded, within the context of its full deliberations, that the profitability of CSIM with respect to each Fund is reasonable and supported renewal of the Agreement with respect to such Fund.
Economies of Scale. Although the Trustees recognized the difficulty of determining economies of scale with precision, the Trustees considered the potential existence of any economies of scale and whether those are passed along to a Fund’s shareholders through (i) the enhancement of services provided to the Funds in return for fees paid, including through investments by CSIM in CSIM’s infrastructure, including modernizing CSIM’s technology and use of data, increasing
expertise and capabilities in key areas (including portfolio and trade operations), and improving business continuity, cybersecurity, due diligence and information security programs, which are designed to provide enhanced services to the Funds and their shareholders; (ii) graduated investment advisory fee schedules or unitary fee structures, fee waivers, or expense caps by CSIM and its affiliates for those funds in the Schwab fund complex with such features; and (iii) pricing a fund to scale and keeping overall expenses down as the fund grows. The Trustees acknowledged that CSIM has shared any economies of scale with the Funds by investing in CSIM’s infrastructure, as discussed above, over time and that CSIM’s internal costs of providing investment management, technology, administrative, legal and compliance services to the Funds continue to increase as a result of regulatory or other developments. The Trustees considered that CSIM and its affiliates may employ contractual expense caps to protect shareholders from high fees when fund assets are relatively small, for example, in the case of newer funds or funds with investment strategies that are from time to time out of favor, because, among other reasons, shareholders may benefit from the continued availability of such funds at subsidized expense levels. Based on this evaluation, the Board concluded, within the context of its full deliberations, that each Fund obtains reasonable benefits from economies of scale.
In the course of their deliberations, the Trustees may have accorded different weights to various factors and did not identify any particular information or factor that was all important or controlling. Based on the Trustees’ deliberation and their evaluation of the information described above, the Board, including all of the Independent Trustees, approved the continuation of the Agreement with respect to the Funds and concluded that the compensation under the Agreement with respect to the Funds is fair and reasonable in light of the services provided and the related expenses borne by CSIM and its affiliates and such other matters as the Trustees considered to be relevant in the exercise of their reasonable judgment.
| 1 | The meetings on February 24, 2021 and June 8, 2021 were held by means of videoconference in reliance on exemptive relief from the in-person voting requirement under the 1940 Act as provided by the Securities and Exchange Commission. |
Schwab Municipal Bond Funds | Annual Report
Schwab Municipal Bond Funds
Trustees and Officers
The tables below give information about the trustees and officers of Schwab Investments, which includes the funds covered in this report. The “Fund Complex” includes The Charles Schwab Family of Funds, Schwab Capital Trust, Schwab Investments, Schwab Annuity Portfolios, Schwab Strategic Trust and Laudus Trust. The Fund Complex includes 102 funds.
The address for all trustees and officers is 211 Main Street, San Francisco, CA 94105. You can find more information about the trustees and officers in the funds’ Statement of Additional Information, which is available free by calling 1-877-824-5615.
| Independent Trustees |
Name, Year of Birth, and
Position(s) with the trust
(Terms of office, and
length of Time Served1) | Principal Occupations
During the Past Five Years | Number of
Portfolios in
Fund Complex
Overseen by
the Trustee | Other Directorships |
Robert W. Burns
1959
Trustee
(Trustee of Schwab Strategic Trust since 2009; The Charles Schwab Family of Funds, Schwab Investments, Schwab Capital Trust, Schwab Annuity Portfolios and Laudus Trust since 2016) | Retired/Private Investor (Jan. 2009 – present). Formerly, Managing Director, Pacific Investment Management Company, LLC (PIMCO) (investment management firm) and President, PIMCO Funds. | 102 | None |
John F. Cogan
1947
Trustee
(Trustee of The Charles Schwab Family of Funds, Schwab Investments, Schwab Capital Trust and Schwab Annuity Portfolios since 2008; Laudus Trust since 2010; Schwab Strategic Trust since 2016) | Senior Fellow (Oct. 1979 – present), The Hoover Institution at Stanford University (public policy think tank); Senior Fellow (2000 – present), Stanford Institute for Economic Policy Research; Professor of Public Policy (1994 – 2015), Stanford University. | 102 | Director (2005 – 2020), Gilead Sciences, Inc. |
Nancy F. Heller
1956
Trustee
(Trustee of The Charles Schwab Family of Funds, Schwab Investments, Schwab Capital Trust, Schwab Annuity Portfolios, Schwab Strategic Trust and Laudus Trust since 2018) | Retired. President and Chairman (2014 – 2016), TIAA Charitable (financial services); Senior Managing Director (2003 – 2016), TIAA (financial services). | 102 | None |
David L. Mahoney
1954
Trustee
(Trustee of The Charles Schwab Family of Funds, Schwab Investments, Schwab Capital Trust, Schwab Annuity Portfolios and Laudus Trust since 2011; Schwab Strategic Trust since 2016) | Private Investor. | 102 | Director (2004 – present), Corcept Therapeutics Incorporated
Director (2009 – present), Adamas Pharmaceuticals, Inc.
Director (2003 – 2019), Symantec Corporation |
Jane P. Moncreiff
1961
Trustee
(Trustee of The Charles Schwab Family of Funds, Schwab Investments, Schwab Capital Trust, Schwab Annuity Portfolios, Schwab Strategic Trust and Laudus Trust since 2019) | Consultant (2018 – present), Fulham Advisers LLC (management consulting); Chief Investment Officer (2009 – 2017), CareGroup Healthcare System, Inc. (healthcare). | 102 | None |
Schwab Municipal Bond Funds | Annual Report
Schwab Municipal Bond Funds
| Independent Trustees (continued) |
Name, Year of Birth, and
Position(s) with the trust
(Terms of office, and
length of Time Served1) | Principal Occupations
During the Past Five Years | Number of
Portfolios in
Fund Complex
Overseen by
the Trustee | Other Directorships |
Kiran M. Patel
1948
Trustee
(Trustee of The Charles Schwab Family of Funds, Schwab Investments, Schwab Capital Trust, Schwab Annuity Portfolios and Laudus Trust since 2011; Schwab Strategic Trust since 2016) | Retired. Executive Vice President and General Manager of Small Business Group (Dec. 2008 – Sept. 2013), Intuit, Inc. (financial software and services firm for consumers and small businesses). | 102 | Director (2008 – present), KLA-Tencor Corporation |
Kimberly S. Patmore
1956
Trustee
(Trustee of The Charles Schwab Family of Funds, Schwab Investments, Schwab Capital Trust, Schwab Annuity Portfolios, Schwab Strategic Trust and Laudus Trust since 2016) | Consultant (2008 – present), Patmore Management Consulting (management consulting). | 102 | None |
J. Derek Penn
1957
Trustee
(Trustee of The Charles Schwab Family of Funds, Schwab Investments, Schwab Capital Trust, Schwab Annuity Portfolios, Schwab Strategic Trust and Laudus Trust since 2021) | Head of Equity Sales and Trading (2006 – 2018), BNY Mellon (financial services). | 102 | None |
| Interested Trustees |
Name, Year of Birth, and
Position(s) with the trust
(Terms of office, and
length of Time Served1) | Principal Occupations
During the Past Five Years | Number of
Portfolios in
Fund Complex
Overseen by
the Trustee | Other Directorships |
Walter W. Bettinger II2
1960
Chairman and Trustee
(Trustee of The Charles Schwab Family of Funds, Schwab Investments, Schwab Capital Trust and Schwab Annuity Portfolios since 2008; Schwab Strategic Trust since 2009; Laudus Trust since 2010) | Director, President and Chief Executive Officer (Oct. 2008 – present), The Charles Schwab Corporation; President and Chief Executive Officer (Oct. 2008 – present) and Director (May 2008 – present), Charles Schwab & Co., Inc.; Director (Apr. 2006 – present), Charles Schwab Bank, SSB; Director (Nov. 2017 – present), Charles Schwab Premier Bank, SSB; Director (July 2019 – present), Charles Schwab Trust Bank; Director (May 2008 – present) and President and Chief Executive Officer (Aug. 2017 – present), Schwab Holdings, Inc.; Director (Oct. 2020 – present), TD Ameritrade Holding Corporation; Director (July 2016 – present), Charles Schwab Investment Management, Inc. | 102 | Director (2008 – present), The Charles Schwab Corporation |
Schwab Municipal Bond Funds | Annual Report
Schwab Municipal Bond Funds
| Interested Trustees (continued) |
Name, Year of Birth, and
Position(s) with the trust
(Terms of office, and
length of Time Served1) | Principal Occupations
During the Past Five Years | Number of
Portfolios in
Fund Complex
Overseen by
the Trustee | Other Directorships |
Joseph R. Martinetto2
1962
Trustee
(Trustee of The Charles Schwab Family of Funds, Schwab Investments, Schwab Capital Trust, Schwab Annuity Portfolios, Schwab Strategic Trust and Laudus Trust since 2016) | Chief Operating Officer (Feb. 2018 – present) and Senior Executive Vice President (July 2015 – Feb. 2018), The Charles Schwab Corporation; Senior Executive Vice President (July 2015 – present), Charles Schwab & Co., Inc.; Chief Financial Officer (July 2015 – Aug. 2017) and Executive Vice President and Chief Financial Officer (May 2007 – July 2015), The Charles Schwab Corporation and Charles Schwab & Co., Inc.; Director (May 2007 – present), Charles Schwab & Co., Inc.; Director (Apr. 2010 – present) and Chief Executive Officer (July 2013 – Apr. 2015), Charles Schwab Bank, SSB; Director (Nov. 2017 – present), Charles Schwab Premier Bank, SSB; Director (May 2007 – present), Chief Financial Officer (May 2007 – Aug. 2017), Senior Executive Vice President (Feb. 2016 – present), and Executive Vice President (May 2007 – Feb. 2016), Schwab Holdings, Inc.; Director (Oct. 2020 – present), TD Ameritrade Holding Corporation. | 102 | None |
| Officers of the Trust |
Name, Year of Birth, and Position(s) with the trust
(Terms of office, and length of Time Served3) | Principal Occupations During the Past Five Years |
Jonathan de St. Paer
1973
President and Chief Executive Officer
(Officer of The Charles Schwab Family of Funds, Schwab Investments, Schwab Capital Trust, Schwab Annuity Portfolios, Schwab Strategic Trust and Laudus Trust since 2018) | Director (Apr. 2019 – present), President (Oct. 2018 – present), Chief Operating Officer (Jan. 2020 – present), and Chief Executive Officer (Apr. 2019 – Nov. 2019), Charles Schwab Investment Management, Inc.; Senior Vice President (June 2020 – present) and Chief Operating Officer (Jan. 2020 – present), Charles Schwab Investment Advisory, Inc.; Chief Executive Officer (Apr. 2019 – present), President (Nov. 2018 – present) and Trustee (Apr. 2019 – Dec. 2020), Schwab Funds, Laudus Funds and Schwab ETFs; Director (Apr. 2019 – present), Charles Schwab Worldwide Funds plc and Charles Schwab Asset Management (Ireland) Limited; Senior Vice President (Apr. 2019 – present), Senior Vice President – Strategy and Product Development (CSIM) (Jan. 2014 – Mar. 2019), and Vice President (Jan. 2009 – Dec. 2013), Charles Schwab & Co., Inc. |
Mark Fischer
1970
Treasurer, Chief Financial Officer and Chief Operating Officer
(Officer of The Charles Schwab Family of Funds, Schwab Investments, Schwab Capital Trust, Schwab Annuity Portfolios, Schwab Strategic Trust and Laudus Trust since 2013) | Treasurer and Chief Financial Officer (Jan. 2016 – present) and Chief Operating Officer (Dec. 2020 – present), Schwab Funds, Laudus Funds and Schwab ETFs; Assistant Treasurer (Dec. 2013 – Dec. 2015), Schwab Funds and Laudus Funds; Assistant Treasurer (Nov. 2013 – Dec. 2015), Schwab ETFs; Chief Financial Officer (Mar. 2020 – present) and Vice President (Oct. 2013 – present), Charles Schwab Investment Management, Inc.; Executive Director (Apr. 2011 – Sept. 2013), J.P. Morgan Investor Services; Assistant Treasurer (May 2005 – Mar. 2011), Massachusetts Financial Service Investment Management. |
Omar Aguilar
1970
Senior Vice President and Chief Investment Officer
(Officer of The Charles Schwab Family of Funds, Schwab Investments, Schwab Capital Trust, Schwab Annuity Portfolios, Schwab Strategic Trust and Laudus Trust since 2011) | Senior Vice President and Chief Investment Officer (Apr. 2011 – present), Charles Schwab Investment Management, Inc.; Senior Vice President and Chief Investment Officer (June 2011 – present), Schwab Funds, Laudus Funds and Schwab ETFs; Head of the Portfolio Management Group and Vice President of Portfolio Management (May 2009 – Apr. 2011), Financial Engines, Inc. (investment management firm); Head of Quantitative Equity (July 2004 – Jan. 2009), ING Investment Management. |
Brett Wander
1961
Senior Vice President and Chief Investment Officer
(Officer of The Charles Schwab Family of Funds, Schwab Investments, Schwab Capital Trust, Schwab Annuity Portfolios, Schwab Strategic Trust and Laudus Trust since 2011) | Senior Vice President and Chief Investment Officer (Apr. 2011 – present), Charles Schwab Investment Management, Inc.; Senior Vice President and Chief Investment Officer (June 2011 – present), Schwab Funds, Laudus Funds and Schwab ETFs; Senior Managing Director and Global Head of Active Fixed-Income Strategies (Jan. 2008 – Oct. 2010), State Street Global Advisors; Director of Alpha Strategies (Apr. 2006 – Jan. 2008), Loomis, Sayles & Company (investment management firm). |
William P. McMahon, Jr.
1972
Senior Vice President and Chief Investment Officer
(Officer of The Charles Schwab Family of Funds, Schwab Investments, Schwab Capital Trust, Schwab Annuity Portfolios, Schwab Strategic Trust and Laudus Trust since 2021) | Senior Vice President and Chief Investment Officer (Jan. 2020 – present), Charles Schwab Investment Management, Inc.; Senior Vice President and Chief Investment Officer (June 2021 – present), Schwab Funds, Laudus Funds and Schwab ETFs; Senior Vice President and Chief Investment Officer – ThomasPartners Strategies (Apr. 2018 – Dec. 2019), Charles Schwab Investment Advisory, Inc.; Senior Vice President and Chief Investment Officer (May 2001 – Apr. 2018), ThomasPartners, Inc. |
Schwab Municipal Bond Funds | Annual Report
Schwab Municipal Bond Funds
| Officers of the Trust (continued) |
Name, Year of Birth, and Position(s) with the trust
(Terms of office, and length of Time Served3) | Principal Occupations During the Past Five Years |
David Lekich
1964
Vice President and Assistant Secretary, Schwab Funds and Schwab ETFs
Vice President and Assistant Clerk, Laudus Funds
(Officer of The Charles Schwab Family of Funds, Schwab Investments, Schwab Capital Trust, Schwab Annuity Portfolios, Schwab Strategic Trust and Laudus Trust since 2011) | Senior Vice President (Sept. 2011 – present) and Vice President (Mar. 2004 – Sept. 2011), Charles Schwab & Co., Inc.; Senior Vice President and Chief Counsel (Sept. 2011 – present) and Vice President (Jan. 2011 – Sept. 2011), Charles Schwab Investment Management, Inc.; Vice President and Assistant Secretary (Oct. 2021 – present), Secretary (Apr. 2011 – Oct. 2021) and Chief Legal Officer (Dec. 2011 – Oct. 2021), Schwab Funds; Vice President and Assistant Clerk (Apr. 2011 – present), Laudus Funds; Vice President and Assistant Secretary (Oct. 2021 – present), Secretary (May 2011 – Oct. 2021) and Chief Legal Officer (Nov. 2011 – Oct. 2021), Schwab ETFs. |
Catherine MacGregor
1964
Chief Legal Officer and Secretary, Schwab Funds and Schwab ETFs
Chief Legal Officer, Vice President and Clerk, Laudus Funds
(Officer of The Charles Schwab Family of Funds, Schwab Investments, Schwab Capital Trust, Schwab Annuity Portfolios and Laudus Trust since 2005; Schwab Strategic Trust since 2009) | Vice President (July 2005 – present), Charles Schwab & Co., Inc.; Vice President (Sept. 2005 – present), Charles Schwab Investment Management, Inc.; Vice President (Dec. 2005 – present) and Chief Legal Officer and Clerk (Mar. 2007 – present), Laudus Funds; Chief Legal Officer and Secretary (Oct. 2021 – present), Vice President (Nov. 2005 – Oct. 2021) and Assistant Secretary (June 2007 – Oct. 2021), Schwab Funds; Chief Legal Officer and Secretary (Oct. 2021 – present), Vice President and Assistant Secretary (Oct. 2009 – Oct. 2021), Schwab ETFs. |
| 1 | Each Trustee shall hold office until the election and qualification of his or her successor, or until he or she dies, resigns or is removed. The retirement policy requires that each independent trustee retire by December 31 of the year in which the Trustee turns 74 or the Trustee’s twentieth year of service as an independent trustee on any trust in the Fund Complex, whichever occurs first. |
| 2 | Mr. Bettinger and Mr. Martinetto are Interested Trustees. Mr. Bettinger is an Interested Trustee because he owns stock of The Charles Schwab Corporation (CSC), the parent company of Charles Schwab Investment Management, Inc. (CSIM), the investment adviser for the trusts in the Fund Complex, is an employee and director of Charles Schwab & Co., Inc. (Schwab), the principal underwriter for The Charles Schwab Family of Funds, Schwab Investments, Schwab Capital Trust, Schwab Annuity Portfolios and Laudus Trust, and is a director of CSIM. Mr. Martinetto is an Interested Trustee because he owns stock of CSC and is an employee and director of Schwab. |
| 3 | The President, Treasurer and Secretary/Clerk hold office until their respective successors are chosen and qualified or until he or she sooner dies, resigns, is removed or becomes disqualified. Each of the other officers serves at the pleasure of the Board. |
Schwab Municipal Bond Funds | Annual Report
Schwab Municipal Bond Funds
agency discount notes Notes issued by federal agencies—known as Government Sponsored Enterprises, or GSEs—at a discount to their value at maturity. An agency discount note is a short-term investment offering a high degree of credit quality.
Alternative Minimum Tax (AMT) A federal income tax designed to limit the extent to which high-income taxpayers (including individuals, estates, trusts and corporations) can benefit from certain deductions and exemptions. For example, some types of income that are exempt from regular federal income tax are not exempt from the AMT.
asset allocation The practice of dividing a portfolio among different asset classes, with each asset class assigned a particular percentage.
asset-backed securities Bond or other debt securities that represent ownership in a pool of assets such as credit card debt.
asset class A group of securities with similar structure and basic characteristics. Stocks, bonds and cash are the three main examples of asset classes.
average rate The average rate of interest paid annually by the fixed-income securities in a fund or portfolio.
Bloomberg California Municipal 3-15 Year Blend Index An index that measures the performance of U.S. tax exempt bonds issued in the State of California with maturities greater than or equal to three years and less than fifteen years that have par value of at least $7 million. The securities in the index must be denominated in U.S. dollars and must be fixed-rate. The index has four main sectors: state and local general obligation bonds, revenue bonds, insured bonds, and prerefunded bonds. The securities in the index must be rated investment grade. The index is rebalanced at each month-end. At each rebalancing, cash is effectively reinvested into the return universe for the following month.
Bloomberg High Yield Municipal Index An index that measures the performance of the non-investment grade and non-rated tax exempt bond market. Included in the index are securities from all 50 U.S. states and four other qualifying regions (Washington DC, Puerto Rico, Guam, and the Virgin Islands) that have par value of at least $3 million. The securities in the index must be denominated in U.S. dollars and must be fixed-rate. The index includes state and local general obligation bonds and revenue bonds. Both high yield (Ba1/BB+/BB+ or below) and non-rated securities are eligible to be included in the index. The index is rebalanced at each month-end. At each rebalancing, cash is effectively reinvested into the return universe for the following month.
Bloomberg Municipal 3-15 Year Blend Index An index that measures the performance of U.S. tax exempt bonds with maturities greater than or equal to three years and less than fifteen years that have par value of at least $7 million. The securities in the index must be denominated in U.S. dollars and must be fixed-rate. The index has four main sectors: state and local general obligation bonds, revenue bonds, insured bonds, and prerefunded bonds. The securities in the index must be rated investment grade. The index is rebalanced at each month-end. At each rebalancing, cash is effectively reinvested into the return universe for the following month.
Bloomberg Municipal Bond Index An index that measures the performance of U.S. tax exempt bonds that have par value of at least $7 million. The securities in the index must be denominated in U.S. dollars and must be fixed-rate. The index has four main sectors: state and local general obligation bonds, revenue bonds, insured bonds, and prerefunded bonds. The securities in the index must be rated investment grade. The index is rebalanced at each month-end. At each rebalancing, cash is effectively reinvested into the return universe for the following month.
Bloomberg US Aggregate Bond Index An index that is a broad-based benchmark measuring the performance of the U.S. investment grade, taxable bond market, including U.S. Treasuries, government-related and corporate bonds, mortgage pass-through securities, commercial mortgage-backed securities, and asset-backed securities that are publicly available for sale in the United States. To be eligible for inclusion in the index, securities must be fixed rate, non-convertible, U.S. dollar-denominated with at least $300 million or more of outstanding face value and have one or more years remaining to maturity. The index excludes certain types of securities, including tax-exempt state and local government series bonds, structured notes embedded with swaps or other special features, private placements, floating rate securities, inflation-linked bonds and Eurobonds. The index is market capitalization weighted and the securities in the index are updated on the last business day of each month.
bond A security representing a loan from the investor to the issuer. A bond typically pays interest at a fixed rate (the coupon rate) until a specified date (the maturity date), at which time the issuer returns the money borrowed (principal or face value) to the bondholder. Because of their structure, bonds are sometimes called “fixed income securities” or “debt securities.”
An individual bond is subject to the credit risk of the issuer. Changes in interest rates can affect a bond’s market value prior to call or maturity. There is no guarantee that a bond’s yield to call or maturity will provide a positive return over the rate of inflation.
bond fund A bond fund is subject to the same credit, interest rate, and inflation risks as bonds. In addition, a bond fund incurs ongoing fees and expenses. A bond fund’s net asset value will fluctuate with the price of the underlying bonds and the portfolio turnover activity; return of principal is not guaranteed.
call An early repayment of a bond’s principal by the issuer, usually done because the issuer is able to refinance its bond debt at a lower rate.
call protection A term used in reference to a bond that cannot be called by the issuer before maturity, or at least for many years from the present date. A bond that offers call protection can more reliably be expected to provide a given yield over a given number of years than a bond that could be called (assuming both bonds are of the same credit quality).
capital gain, capital loss The difference between the amount paid for an investment and its value at a later time. If the investment has been sold, the capital gain or loss is considered a realized gain or loss. If the investment is still held, the gain or loss is still “on paper” and is considered unrealized.
certificate of participation A municipal bond that is repaid from an annual budget appropriation rather than being backed by the full faith and credit of the issuer.
coupon, coupon rate The annual rate of interest paid until maturity by the issuer of a debt security.
credit-enhanced securities Securities that are backed by the credit of an entity other than the issuer (such as a financial institution). Credit enhancements, which can equal up to 100% of the security’s value, are designed to help lower the risk of default on a security and may also make the security more liquid.
Schwab Municipal Bond Funds | Annual Report
Schwab Municipal Bond Funds
Credit Ratings
Most major bond issuers arrange with a recognized independent rating organization, such as Standard & Poor’s (S&P) or Moody’s Investors Service, to rate the creditworthiness of their bonds. The spectrum of these ratings is divided into two major categories: investment grade and below investment grade (sometimes called “junk bonds”). Bonds rated below investment grade range from those that are considered to have some vulnerability to default to those that appear on the brink of default or are in default.
credit quality The capacity of an issuer to make its interest and principal payments. See chart below.
credit risk The risk that a bond issuer may be unable to pay interest or principal to its bondholders.
discount rate The implied rate on a debt security that does not pay interest but is bought at a discount and redeemed at face value when it matures.
duration A measure of an individual bond’s sensitivity to interest rates, expressed in years. Calculations of duration generally take into account the bond’s yield, interest payments, maturity date and call features.
weighted average duration A measure of the duration of all bonds in a fund’s portfolio, also expressed in years, based on the market value weighted average duration of each bond in the portfolio.
expense ratio The amount that is taken from a mutual fund’s assets each year to cover the fund’s operating expenses. An expense ratio of 0.50% means that a fund’s expenses amount to half of one percent of its average net assets a year.
general obligation bonds Municipal bonds that are secured by the issuer’s full faith and credit, which typically is backed by the power of the issuer to levy taxes.
interest Payments to bondholders (usually made twice a year) as compensation for loaning the bond principal to the issuer.
interest rate risk The risk that a bond’s value will fluctuate if market interest rates change or are expected to change. Bond prices tend to move in the opposite direction of interest rates: when interest rates rise, bond prices tend to fall.
liquidity-enhanced security A security that when tendered is paid from funds advanced by an entity other than the issuer (such as a large financial institution). Liquidity enhancements are often used on variable-rate securities where the portfolio manager has an option to tender the securities prior to their final maturity.
market risk Those elements of risk that are common to all securities in an asset class, and therefore cannot be significantly reduced by diversification within the asset class. Also known as “systemic risk.”
maturity The maturity of a bond will generally be determined using a portfolio security’s final maturity date (date on which the final principal payment of a bond is scheduled to be paid); however, for securitized products, such as mortgage-backed securities and certain other asset-backed securities, maturity will be determined on an average life basis (weighted average time to receipt of all principal payments) by the investment adviser. Because pre-payment rates of individual mortgage pools vary widely, the average life of a particular pool cannot be predicted precisely. For securities with embedded demand features, such as puts or calls, either the demand date or the final maturity date will be used depending on interest rates, yields and other market conditions. The weighted average maturity (WAM) of a fund is dollar-weighted based upon the market value of a fund’s securities at the time of the calculation.
mortgage-backed securities Bond or other debt securities that represent ownership in a pool of mortgage loans.
muni, municipal bonds, municipal securities Debt securities issued by a state, its counties, municipalities, authorities and other subdivisions, or the territories and possessions of the United States and the District of Columbia, including their subdivisions, agencies and instrumentalities and corporations. These securities may be issued to obtain money for various public purposes, including the construction of a wide range of public facilities such as airports, bridges, highways, housing, hospitals, mass transportation, public utilities, schools, streets, and water and sewer works.
net asset value (NAV) The value of one share of a mutual fund. NAV is calculated by taking the fund’s total assets, subtracting liabilities, and dividing by the number of shares outstanding.
outstanding shares, shares outstanding When speaking of a company or mutual fund, indicates all shares currently held by investors.
prepayment risk The risk that a mortgage-backed security may be paid off early, typically because interest rates have fallen and the homeowners who hold the underlying mortgages have refinanced those mortgages at lower rates. In this type of situation, the investor who held the mortgage-backed security will usually have to settle for a lower rate when reinvesting the principal.
refunded bond A bond for which the principal and interest payments are secured or guaranteed by cash or U.S. government securities held in an escrow account.
restricted securities Securities that are subject to contractual restrictions on resale. These securities are often purchased in private placement transactions.
revenue bonds Municipal bonds that are issued to finance public works projects and are secured by revenue generated by the project (such as water and sewer fees) rather than the full faith and credit of the issuer.
S&P 500 Index An index that is designed to measure the performance of 500 leading publicly traded companies from a broad range of industries.
S&P California AMT-Free Municipal Bond Index A broad, comprehensive market value-weighted index designed to measure the performance of investment-grade tax-exempt bonds issues within California.
Schwab Municipal Bond Funds | Annual Report
Schwab Municipal Bond Funds
section 4(2)/144A securities Securities exempt from registration under Section 4(2) of the Securities Act of 1933. These securities may be sold only to qualified institutional buyers under Securities Act Rule 144A.
taxable equivalent yield The yield an investor would need to get from a taxable investment in order to match the yield paid by a given tax-exempt investment, once the effect of all applicable taxes is taken into account. For example, if your tax rate were 25%, a tax-exempt investment paying 4.5% would have a taxable equivalent yield for you of 6.0% (4.5% ÷ [1 – 0.25%] = 6.0%).
total return The percentage that an investor would have earned or lost on an investment in the fund assuming dividends and distributions were reinvested.
weighted average For mutual funds, an average that gives the same weight to each security as the security represents in the fund’s portfolio.
yield The income paid out by an investment, expressed as a percentage of the investment’s market value.
yield to maturity The annualized rate of return a bondholder could expect if the bond were held to maturity. In addition to interest payments, yield to maturity also factors in any difference between a bond’s current price and its principal amount, or face value.
Schwab Municipal Bond Funds | Annual Report
Schwab Municipal Bond Funds
Charles Schwab Investment Management
With a straightforward lineup of core products and solutions for building the foundation of a portfolio, Charles Schwab Investment Management advocates for investors of all sizes with a steadfast focus on lowering costs and reducing unnecessary complexity. The list below shows all currently available Schwab Funds®.
Investors should carefully consider information contained in the prospectus, or if available, the summary prospectus, including investment objectives, risks, charges and expenses before investing. Please call 1-877-824-5615 for a prospectus for any Schwab Fund. Please read the prospectus carefully before you invest. This report must be preceded or accompanied by a current prospectus.
Proxy Voting Policies, Procedures and Results
A description of the proxy voting policies and procedures used to determine how to vote proxies on behalf of the funds is available without charge, upon request, by visiting the Schwab Funds’ website at www.schwabassetmanagement.com/schwabfunds_prospectus, the SEC’s website at www.sec.gov, or by contacting Schwab Funds at 1-877-824-5615.
Information regarding how a fund voted proxies relating to portfolio securities during the most recent twelve-month period ended June 30 is available, without charge, by visiting the fund’s website at www.schwabassetmanagement.com/schwabfunds_prospectus or the SEC’s website at www.sec.gov.
Equity Funds
Schwab Core Equity Fund
Schwab Dividend Equity Fund
Schwab Large-Cap Growth Fund
Schwab Small-Cap Equity Fund
Schwab Health Care Fund
Schwab International Core Equity Fund
Schwab Fundamental US Large Company Index Fund
Schwab Fundamental US Small Company Index Fund
Schwab Fundamental International Large Company Index Fund
Schwab Fundamental International Small Company Index Fund
Schwab Fundamental Emerging Markets Large Company Index Fund
Schwab Fundamental Global Real Estate Index Fund
Schwab Global Real Estate Fund
Schwab S&P 500 Index Fund
Schwab 1000 Index® Fund
Schwab Small-Cap Index Fund®
Schwab Total Stock Market Index Fund®
Schwab U.S. Large-Cap Growth Index Fund
Schwab U.S. Large-Cap Value Index Fund
Schwab U.S. Mid-Cap Index Fund
Schwab International Index Fund®
Asset Allocation Funds
Schwab Balanced Fund
Schwab MarketTrack Portfolios®
Schwab Target Funds
Schwab Target Index Funds
Schwab Monthly Income Funds
Bond Funds
Schwab Treasury Inflation Protected Securities Index Fund
Schwab U.S. Aggregate Bond Index Fund
Schwab Short-Term Bond Index Fund
Schwab Tax-Free Bond Fund1
Schwab California Tax-Free Bond Fund1
Schwab Opportunistic Municipal Bond Fund
Schwab Money Funds2
Schwab provides a broad choice of taxable and tax-exempt money market funds for both retail and institutional client types.
Investment Adviser
Charles Schwab Investment Management, Inc.
211 Main Street, San Francisco, CA 94105
Funds
Schwab Funds
1-877-824-5615
© 2021 Charles Schwab & Co., Inc. All rights reserved.
Member SIPC®
Printed on recycled paper.
| ¹ | State, local, and the Federal Alternative Minimum Tax may apply. Capital gains are not exempt from Federal Taxation. |
| ² | You could lose money by investing in the Schwab Money Funds. All Schwab Money Funds with the exception of Schwab Variable Share Price Money Fund seek to preserve the value of your investment at $1.00 per share, but cannot guarantee they will do so. Because the share price of Schwab Variable Share Price Money Fund will fluctuate, when you sell your shares they may be worth more or less than what you originally paid for them. All Schwab Money Funds with the exception of Schwab Government Money Fund, Schwab Retirement Government Money Fund, Schwab U.S. Treasury Money Fund, Schwab Treasury Obligations Money Fund and Schwab Government Money Market Portfolio may impose a fee upon the sale of your shares or may temporarily suspend your ability to sell shares if the Fund’s liquidity falls below required minimums because of market conditions or other factors. An investment in the Schwab Money Funds is not insured or guaranteed by the Federal Deposit Insurance Corporation or any other government agency. The Schwab Money Funds’ sponsor has no legal obligation to provide financial support to the Funds, and you should not expect that the sponsor will provide financial support to the Funds at any time. |
This page is intentionally left blank.
Item 2: Code of Ethics.
| (a) | Registrant has adopted a code of ethics that applies to its principal executive officer, principal financial officer, and any other persons who perform a similar function, regardless of whether these individuals are employed by Registrant or a third party. |
| (c) | During the period covered by the report, no amendments were made to the provisions of this code of ethics. |
| (d) | During the period covered by the report, Registrant did not grant any waivers, including implicit waivers, from the provisions of this code of ethics. |
| (f)(1) | Registrant has filed this code of ethics as an exhibit pursuant to Item 13(a)(1) of Form N-CSR. |
Item 3: Audit Committee Financial Expert.
Registrant’s Board of Trustees has determined that Kiran M. Patel, Kimberly S. Patmore and J. Derek Penn, each currently serving on its audit, compliance and valuation committee, are each an “audit committee financial expert,” as such term is defined in Item 3 of Form N-CSR. Each member of Registrant’s audit, compliance and valuation committee is “independent” under the standards set forth in Item 3 of Form N-CSR.
The designation of each of Mr. Patel, Ms. Patmore and Mr. Penn as an “audit committee financial expert” pursuant to Item 3 of Form N-CSR does not (i) impose upon such individual any duties, obligations, or liability that are greater than the duties, obligations and liability imposed upon such individual as a member of Registrant’s audit, compliance and valuation committee or Board of Trustees in the absence of such designation; and (ii) affect the duties, obligations or liability of any other member of Registrant’s audit, compliance and valuation committee or Board of Trustees.
Item 4: Principal Accountant Fees and Services.
Registrant is composed of eight series. Six series have a fiscal year-end of August 31, whose annual financial statements are reported in Item 1, one series has a fiscal year-end of October 31, and one series has a fiscal year-end of the last day of February. Principal accountant fees disclosed in Items 4(a)-(d) and 4(g) include fees billed for services rendered to each of the eight operational series during 2021/2022 and 2020/2021, based on their respective 2021/2022 and 2020/2021 fiscal years, as applicable.
The following table presents fees billed by the principal accountant in each of the last two fiscal years for the services rendered to the Funds:
| | | | | | | | | | | | | | | | | | | | | | | | | | | | | | |
| (a)Audit Fees | | | (b)Audit-Related Fees | | | (c) Tax Fees1 | | | (d) All Other Fees | |
Fiscal Year
2021/2022 | | | Fiscal Year
2020/2021 | | | Fiscal Year
2021/2022 | | | Fiscal Year
2020/2021 | | | Fiscal Year
2021/2022 | | | Fiscal Year
2020/2021 | | | Fiscal Year
2021/2022 | | | Fiscal Year
2020/2021 | |
| $ | 264,750 | | | $ | 259,000 | | | $ | 0 | | | $ | 0 | | | $ | 24,800 | | | $ | 24,800 | | | $ | 0 | | | $ | 0 | |
| 1 | The nature of the services includes tax compliance, tax advice and tax planning. |
(e)(1) Registrant’s audit, compliance and valuation committee does not have pre-approval policies and procedures as described in paragraph (c)(7) of Rule 2-01 of Regulation S-X.
(2) There were no services described in each of paragraphs (b) through (d) above (including services required to be approved by Registrant’s audit, compliance and valuation committee pursuant to paragraph (c)(7)(ii) of Rule 2-01 of Regulation S-X) that were approved by Registrant’s audit, compliance and valuation committee pursuant to paragraph (c)(7)(i)(C) of Rule 2-01 of Regulation S-X.
(f) Not applicable.
(g) Below are the aggregate non-audit fees billed in each of the last two fiscal years by Registrant’s principal accountant for services rendered to Registrant, to Registrant’s investment adviser, and to any entity controlling, controlled by, or under common control with Registrant’s investment adviser that provides ongoing services to Registrant.
| | | | | | |
| 2021/2022: $ | 3,622,031 | | | 2020/2021: $ | 4,263,876 | |
(h) During the past fiscal year, all non-audit services provided by Registrant’s principal accountant to either Registrant’s investment adviser or to any entity controlling, controlled by, or under common control with Registrant’s investment adviser that provides ongoing services to Registrant were pre-approved. Included in the audit, compliance and valuation committee’s pre-approval was the review and consideration as to whether the provision of these non-audit services is compatible with maintaining the principal accountant’s independence.
Item 5: Audit Committee of Listed Registrants.
Not applicable.
Item 6: Schedule of Investments.
The schedules of investments are included as part of the report to shareholders filed under Item 1 of this Form.
Item 7: Disclosure of Proxy Voting Policies and Procedures for Closed-End Management Investment Companies.
Not applicable.
Item 8: Portfolio Managers of Closed-End Management Investment Companies.
Not applicable.
Item 9: Purchases of Equity Securities by Closed-End Management Investment Company and Affiliated Purchasers.
Not applicable.
Item 10: Submission of Matters to a Vote of Security Holders.
Not applicable.
Item 11: Controls and Procedures.
| (a) | Based on their evaluation of Registrant’s disclosure controls and procedures, as of a date within 90 days of the filing date, Registrant’s Chief Executive Officer, Jonathan de St. Paer and Registrant’s Chief Financial Officer, Mark Fischer, have concluded that Registrant’s disclosure controls and procedures are: (i) reasonably designed to ensure that information required to be disclosed in this report is appropriately communicated to Registrant’s officers to allow timely decisions regarding disclosures required in this report; (ii) reasonably designed to ensure that information required to be disclosed in this report is recorded, processed, summarized and reported in a timely manner; and (iii) are effective in achieving the goals described in (i) and (ii) above. |
| | (b) | During the period covered by this report, there have been no changes in Registrant’s internal control over financial reporting that the above officers believe to have materially affected, or to be reasonably likely to materially affect, Registrant’s internal control over financial reporting. |
Item 12: Disclosure of Securities Lending Activities for Closed-End Management Investment Companies.
Not applicable.
Item 13: Exhibits.
Pursuant to the requirements of the Securities Exchange Act of 1934 and the Investment Company Act of 1940, the registrant has duly caused this report to be signed on its behalf by the undersigned, thereunto duly authorized.
(Registrant) Schwab Investments - Schwab Taxable Bond Funds and Schwab Municipal Bond Funds
| | |
| By: | | /s/ Jonathan de St. Paer |
| | Jonathan de St. Paer Chief Executive Officer |
| |
| Date: | | October 19, 2021 |
Pursuant to the requirements of the Securities Exchange Act of 1934 and the Investment Company Act of 1940, this report has been signed below by the following persons on behalf of the registrant and in the capacities and on the dates indicated.
| | |
| By: | | /s/ Jonathan de St. Paer |
| | Jonathan de St. Paer Chief Executive Officer |
| |
| Date: | | October 19, 2021 |
| |
| By: | | /s/ Mark Fischer |
| | Mark Fischer Chief Financial Officer |
| |
| Date: | | October 19, 2021 |