UNITED STATES
SECURITIES AND EXCHANGE COMMISSION
Washington, D.C. 20549
FORM N-CSRS
CERTIFIED SHAREHOLDER REPORT OF REGISTERED
MANAGEMENT INVESTMENT COMPANIES
Investment Company Act file number: 811-06200
Schwab Investments – Schwab 1000 Index Fund
(Exact name of registrant as specified in charter)
211 Main Street, San Francisco, California 94105
(Address of principal executive offices) (Zip code)
Jonathan de St. Paer
Schwab Investments – Schwab 1000 Index Fund
211 Main Street, San Francisco, California 94105
(Name and address of agent for service)
Registrant’s telephone number, including area code: (415) 636-7000
Date of fiscal year end: October 31
Date of reporting period: April 30, 2023
Item 1: Report(s) to Shareholders.
Semiannual Report | April 30, 2023
Schwab Equity Index Funds®
Schwab S&P 500 Index Fund
Schwab 1000 Index® Fund
Schwab Small-Cap Index Fund®
Schwab Total Stock Market Index Fund®
Schwab U.S. Large-Cap Growth
Index Fund
Schwab U.S. Large-Cap Value
Index Fund
Schwab U.S. Mid-Cap Index Fund
Schwab International Index Fund®
This page is intentionally left blank.
Eight cost-efficient ways to tap into the power of the stock market for long-term growth potential.
Fund investment adviser: Charles Schwab Investment Management, Inc., dba Schwab Asset ManagementTM
Distributor: Charles Schwab & Co., Inc. (Schwab)
The Sector/Industry classifications in this report use the Global Industry Classification Standard (GICS) which was developed by and is the exclusive property of MSCI Inc. (MSCI) and Standard & Poor’s (S&P). GICS is a service mark of MSCI and S&P and has been licensed for use by Schwab. The Industry classifications used in the Portfolio Holdings are sub-categories of Sector classifications.
Schwab Equity Index Funds | Semiannual Report1
Schwab Equity Index Funds
The performance data quoted represents past performance. Past performance does not guarantee future results. Investment returns and principal value of an investment will fluctuate so that an investor’s shares may be worth more or less than their original cost. Current performance may be lower or higher than performance data quoted. To obtain performance information current to the most recent month end, please visit www.schwabassetmanagement.com/schwabfunds_prospectus.
Total Return for the 6 Months Ended April 30, 2023 |
Schwab S&P 500 Index Fund (Ticker Symbol: SWPPX) | |
| |
Fund Category: Morningstar Large Blend1 | |
| |
| |
Schwab 1000 Index Fund (Ticker Symbol: SNXFX) | |
| |
| |
Fund Category: Morningstar Large Blend1 | |
| |
| |
Schwab Small-Cap Index Fund (Ticker Symbol: SWSSX) | |
| |
Fund Category: Morningstar Small Blend1 | |
| |
| |
Schwab Total Stock Market Index Fund (Ticker Symbol: SWTSX) | |
Dow Jones U.S. Total Stock Market IndexSM | |
Fund Category: Morningstar Large Blend1 | |
| |
Total Return for the 6 Months Ended April 30, 2023 |
Schwab U.S. Large-Cap Growth Index Fund (Ticker Symbol: SWLGX) | |
Russell 1000® Growth Index | |
Fund Category: Morningstar Large Growth1 | |
| |
| |
Schwab U.S. Large-Cap Value Index Fund (Ticker Symbol: SWLVX) | |
Russell 1000® Value Index | |
Fund Category: Morningstar Large Value1 | |
| |
| |
Schwab U.S. Mid-Cap Index Fund (Ticker Symbol: SWMCX) | |
| |
Fund Category: Morningstar Mid-Cap Blend1 | |
| |
| |
Schwab International Index Fund2 (Ticker Symbol: SWISX) | |
| |
Fund Category: Morningstar Foreign Large Blend1 | |
| |
All total returns on this page assume dividends and distributions were reinvested. Index figures do not include trading and management costs, which would lower performance. Indices are unmanaged and cannot be invested in directly. Performance results less than one year are not annualized.
For index definitions, please see the Glossary.
Performance does not reflect the deduction of taxes that a shareholder would pay on fund distributions or on the redemption of fund shares.
1
Source for category information: Morningstar, Inc. The Morningstar Category return represents all active and index mutual funds and ETFs within the category as of the report date.
2
The fund’s performance relative to the index may be affected by fair-value pricing and timing differences in foreign exchange calculations. See financial note 2 for more information.
3
The net version of the index reflects reinvested dividends net of withholding taxes but reflects no deductions for expenses or other taxes.
2Schwab Equity Index Funds | Semiannual Report
Schwab Equity Index Funds
| Christopher Bliss, CFA, Managing Director and Head of Passive Equity Strategies for Schwab Asset Management, is responsible for overseeing the investment process and portfolio management of investment strategies for passive equity Schwab Funds and Schwab ETFs, and Schwab Personalized Indexing™ separately managed accounts. Before joining Schwab in 2016, Mr. Bliss spent 12 years at BlackRock (formerly Barclays Global Investors) managing and leading institutional index teams, most recently as a managing director and the head of the Americas institutional index team. In this role, Mr. Bliss was responsible for overseeing a team of portfolio managers managing domestic, developed international and emerging markets index strategies. Prior to BlackRock, he worked as an equity analyst and portfolio manager for Harris Bretall and before that, as a research analyst for JP Morgan. |
| Jeremy Brown, CFA, Senior Portfolio Manager for Schwab Asset Management, is responsible for the day-to-day co-management of the funds, except for the Schwab International Index Fund. Prior to joining Schwab in 2017, Mr. Brown spent six years with ALPS Advisors, Inc. in Denver, most recently as a senior analyst on the ETF portfolio management and research team where he performed portfolio management, trading, and analytics/research functions for ALPS ETFs and passive funds. Additionally, Mr. Brown led a number of investment research, commentary, industry trend analysis, and sales and marketing support initiatives. |
| Ferian Juwono, CFA, Senior Portfolio Manager for Schwab Asset Management, is responsible for the oversight and day-to-day co-management of the funds, except for the Schwab International Index Fund. Prior to joining Schwab in 2010, Mr. Juwono worked at BlackRock (formerly Barclays Global Investors) where he spent more than three years as a portfolio manager, managing equity index funds for institutional clients, and two years as a senior business analyst. Prior to that, Mr. Juwono worked for more than four years as a senior financial analyst with Union Bank of California. |
| David Rios, Portfolio Manager for Schwab Asset Management, is responsible for the day-to-day co-management of the Schwab International Index Fund. Prior to this role, Mr. Rios was an associate portfolio manager on the equity index strategies team for four years. His first role with Schwab Asset Management was as a trade operations specialist. Prior to joining Schwab in 2008, Mr. Rios was a senior fund accountant at Investors Bank & Trust (subsequently acquired by State Street Corporation). |
| Sabya Sinha, Portfolio Manager for Schwab Asset Management, is responsible for the day-to-day co-management of the funds, except for the Schwab International Index Fund. Prior to joining Schwab in 2015, Mr. Sinha spent a year at F-Squared Investments on the product development and analytics team. Prior to F-Squared, he worked at IndexIQ Advisors as a senior index portfolio manager for three years and for Bank of America’s Columbia Management subsidiary as a portfolio manager for three years. Mr. Sinha also spent time as a software consultant at DPM Mellon, LLC and an equity trader at Jane Street Capital. |
| Agnes Zau, CFA, Portfolio Manager for Schwab Asset Management, is responsible for the day-to-day co-management of the funds, except for the Schwab International Index Fund. Prior to joining Schwab in 2018, Ms. Zau was at BlackRock for three years, most recently as a multi-asset portfolio investment consultant where she advised institutional clients on asset allocation and strategy, constructed risk decomposition and portfolio optimization, and conducted scenario analyses for the core multi-asset target risk strategies. She spent the preceding three years as a derivatives specialist at Mellon Capital. |
Schwab Equity Index Funds | Semiannual Report3
Schwab S&P 500 Index Fund
The performance data quoted represents past performance. Past performance does not guarantee future results. Investment returns and principal value of an investment will fluctuate so that an investor’s shares may be worth more or less than their original cost. Current performance may be lower or higher than performance data quoted. To obtain performance information current to the most recent month end, please visit www.schwabassetmanagement.com/schwabfunds_prospectus.
Average Annual Total Returns1
| | | | |
Fund: Schwab S&P 500 Index Fund (5/19/97) | | | | |
| | | | |
Fund Category: Morningstar Large Blend2 | | | | |
Fund Expense Ratio3: 0.02% |
All total returns on this page assume dividends and distributions were reinvested. Index figures do not include trading and management costs, which would lower performance. Indices are unmanaged and cannot be invested in directly. Performance results less than one year are not annualized.
For index definitions, please see the Glossary.
Index ownership – “Standard & Poor’s®,” “S&P®,” and “S&P 500®” are registered trademarks of Standard & Poor’s Financial Services LLC (S&P), and “Dow Jones®” is a registered trademark of Dow Jones Trademark Holdings LLC (Dow Jones) and have been licensed for use by S&P Dow Jones Indices LLC and its affiliates and sublicensed for certain purposes by Charles Schwab Investment Management, Inc. The “S&P 500® Index” is a product of S&P Dow Jones Indices LLC or its affiliates, and has been licensed for use by Charles Schwab Investment Management, Inc. The Schwab S&P 500 Index Fund is not sponsored, endorsed, sold or promoted by S&P Dow Jones Indices LLC, Dow Jones, S&P, or their respective affiliates, and neither S&P Dow Jones Indices LLC, Dow Jones, S&P, nor their respective affiliates make any representation regarding the advisability of investing in the fund.
1
Performance does not reflect the deduction of taxes that a shareholder would pay on fund distributions or the redemption of fund shares.
2
Source for category information: Morningstar, Inc. The Morningstar Category return represents all active and index mutual funds and ETFs within the category as of the report date.
3
As stated in the prospectus.
4Schwab Equity Index Funds | Semiannual Report
Schwab S&P 500 Index Fund
Performance and Fund Facts as of April 30, 2023
| |
Weighted Average Market Cap (millions) | |
Price/Earnings Ratio (P/E) | |
| |
| |
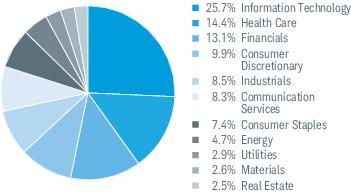
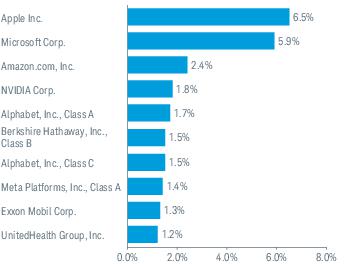
Sector Weightings % of Investments3
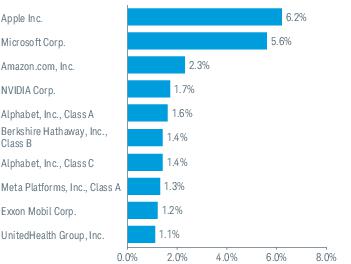
Top Equity Holdings % of Net Assets4
Portfolio holdings may have changed since the report date.
Source of Sector Classification: S&P and MSCI.
3
The percentage may differ from the Portfolio Holdings because the above calculation is based on a percentage of total investments, excluding derivatives, whereas the calculation in the Portfolio Holdings is based on a percentage of net assets.
4
This list is not a recommendation of any security by the investment adviser.
Schwab Equity Index Funds | Semiannual Report5
The performance data quoted represents past performance. Past performance does not guarantee future results. Investment returns and principal value of an investment will fluctuate so that an investor’s shares may be worth more or less than their original cost. Current performance may be lower or higher than performance data quoted. To obtain performance information current to the most recent month end, please visit www.schwabassetmanagement.com/schwabfunds_prospectus.
Average Annual Total Returns1
| | | | |
Fund: Schwab 1000 Index Fund (4/2/91) | | | | |
| | | | |
| | | | |
Fund Category: Morningstar Large Blend2 | | | | |
Fund Expense Ratio3: 0.05% |
All total returns on this page assume dividends and distributions were reinvested. Index figures do not include trading and management costs, which would lower performance. Indices are unmanaged and cannot be invested in directly. Performance results less than one year are not annualized.
For index definitions, please see the Glossary.
1
Performance does not reflect the deduction of taxes that a shareholder would pay on fund distributions or the redemption of fund shares.
2
Source for category information: Morningstar, Inc. The Morningstar Category return represents all active and index mutual funds and ETFs within the category as of the report date.
3
As stated in the prospectus.
6Schwab Equity Index Funds | Semiannual Report
Performance and Fund Facts as of April 30, 2023
| |
Weighted Average Market Cap (millions) | |
Price/Earnings Ratio (P/E) | |
| |
| |
Sector Weightings % of Investments5
Top Equity Holdings % of Net Assets6
Portfolio holdings may have changed since the report date.
Source of Sector Classification: S&P and MSCI.
2
As a result of the Schwab 1000 Index®’s once per year reconstitution and the effects of certain corporate actions, the fund may hold more or less than 1,000 securities.
3
Portfolio turnover rate excludes in-kind transactions.
5
The percentage may differ from the Portfolio Holdings because the above calculation is based on a percentage of total investments, excluding derivatives, whereas the calculation in the Portfolio Holdings is based on a percentage of net assets.
6
This list is not a recommendation of any security by the investment adviser.
Schwab Equity Index Funds | Semiannual Report7
Schwab Small-Cap Index Fund
The performance data quoted represents past performance. Past performance does not guarantee future results. Investment returns and principal value of an investment will fluctuate so that an investor’s shares may be worth more or less than their original cost. Current performance may be lower or higher than performance data quoted. To obtain performance information current to the most recent month end, please visit www.schwabassetmanagement.com/schwabfunds_prospectus.
Average Annual Total Returns1
| | | | |
Fund: Schwab Small-Cap Index Fund (5/19/97) | | | | |
| | | | |
Fund Category: Morningstar Small Blend2 | | | | |
Fund Expense Ratio3: 0.04% |
All total returns on this page assume dividends and distributions were reinvested. Index figures do not include trading and management costs, which would lower performance. Indices are unmanaged and cannot be invested in directly. Performance results less than one year are not annualized.
For index definitions, please see the Glossary.
Index ownership – “Russell 2000®” is a registered mark of the Frank Russell Company (Russell) and has been licensed for use by the Schwab Small-Cap Index Fund. The Schwab Small-Cap Index Fund is not sponsored, endorsed, sold or promoted by Russell and Russell makes no representation regarding the advisability of investing in the fund.
1
Performance does not reflect the deduction of taxes that a shareholder would pay on fund distributions or the redemption of fund shares.
2
Source for category information: Morningstar, Inc. The Morningstar Category return represents all active and index mutual funds and ETFs within the category as of the report date.
3
As stated in the prospectus.
8Schwab Equity Index Funds | Semiannual Report
Schwab Small-Cap Index Fund
Performance and Fund Facts as of April 30, 2023
| |
Weighted Average Market Cap (millions) | |
Price/Earnings Ratio (P/E) | |
| |
| |
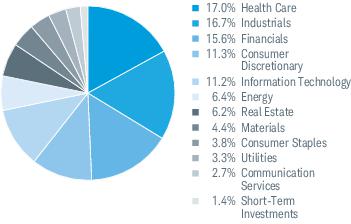
Sector Weightings % of Investments4
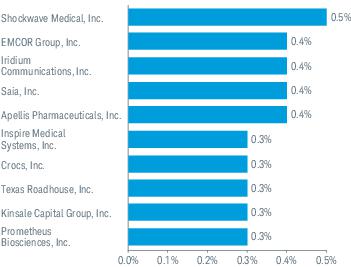
Top Equity Holdings % of Net Assets5
Portfolio holdings may have changed since the report date.
Source of Sector Classification: S&P and MSCI.
Small-company stocks are subject to greater volatility than many other asset classes.
2
Portfolio turnover rate excludes in-kind transactions.
4
The percentage may differ from the Portfolio Holdings because the above calculation is based on a percentage of total investments, excluding derivatives, whereas the calculation in the Portfolio Holdings is based on a percentage of net assets.
5
This list is not a recommendation of any security by the investment adviser.
Schwab Equity Index Funds | Semiannual Report9
Schwab Total Stock Market Index Fund
The performance data quoted represents past performance. Past performance does not guarantee future results. Investment returns and principal value of an investment will fluctuate so that an investor’s shares may be worth more or less than their original cost. Current performance may be lower or higher than performance data quoted. To obtain performance information current to the most recent month end, please visit www.schwabassetmanagement.com/schwabfunds_prospectus.
Average Annual Total Returns1
| | | | |
Fund: Schwab Total Stock Market Index Fund (6/1/99) | | | | |
Dow Jones U.S. Total Stock Market IndexSM | | | | |
Fund Category: Morningstar Large Blend2 | | | | |
Fund Expense Ratio3: 0.03% |
All total returns on this page assume dividends and distributions were reinvested. Index figures do not include trading and management costs, which would lower performance. Indices are unmanaged and cannot be invested in directly. Performance results less than one year are not annualized.
For index definitions, please see the Glossary.
Index ownership – “Standard & Poor’s®” and “S&P®” are registered trademarks of Standard & Poor’s Financial Services LLC (S&P), and “Dow Jones®” is a registered trademark of Dow Jones Trademark Holdings LLC (Dow Jones) and have been licensed for use by S&P Dow Jones Indices LLC and its affiliates and sublicensed for certain purposes by Charles Schwab Investment Management, Inc. The “Dow Jones U.S. Total Stock Market IndexSM” is a product of S&P Dow Jones Indices LLC or its affiliates, and has been licensed for use by Charles Schwab Investment Management, Inc. The Schwab Total Stock Market Index Fund is not sponsored, endorsed, sold or promoted by S&P Dow Jones Indices LLC, Dow Jones, S&P, or their respective affiliates, and neither S&P Dow Jones Indices LLC, Dow Jones, S&P, nor their respective affiliates make any representation regarding the advisability of investing in the fund.
1
Performance does not reflect the deduction of taxes that a shareholder would pay on fund distributions or the redemption of fund shares.
2
Source for category information: Morningstar, Inc. The Morningstar Category return represents all active and index mutual funds and ETFs within the category as of the report date.
3
As stated in the prospectus.
10Schwab Equity Index Funds | Semiannual Report
Schwab Total Stock Market Index Fund
Performance and Fund Facts as of April 30, 2023
| |
Weighted Average Market Cap (millions) | |
Price/Earnings Ratio (P/E) | |
| |
| |
Sector Weightings % of Investments3
Top Equity Holdings % of Net Assets4
Portfolio holdings may have changed since the report date.
Source of Sector Classification: S&P and MSCI.
3
The percentage may differ from the Portfolio Holdings because the above calculation is based on a percentage of total investments, excluding derivatives, whereas the calculation in the Portfolio Holdings is based on a percentage of net assets.
4
This list is not a recommendation of any security by the investment adviser.
Schwab Equity Index Funds | Semiannual Report11
Schwab U.S. Large-Cap Growth Index Fund
The performance data quoted represents past performance. Past performance does not guarantee future results. Investment returns and principal value of an investment will fluctuate so that an investor’s shares may be worth more or less than their original cost. Current performance may be lower or higher than performance data quoted. To obtain performance information current to the most recent month end, please visit www.schwabassetmanagement.com/schwabfunds_prospectus.
| | | | |
Fund: Schwab U.S. Large-Cap Growth Index Fund (12/20/17) | | | | |
Russell 1000® Growth Index | | | | |
Fund Category: Morningstar Large Growth2 | | | | |
Fund Expense Ratio3: 0.035% |
All total returns on this page assume dividends and distributions were reinvested. Index figures do not include trading and management costs, which would lower performance. Indices are unmanaged and cannot be invested in directly. Performance results less than one year are not annualized.
For index definitions, please see the Glossary.
Index ownership – The Russell 1000® Growth Index is a registered mark of the Frank Russell Company (Russell) and has been licensed for use by the Schwab U.S. Large-Cap Growth Index Fund. The Schwab U.S. Large-Cap Growth Index Fund is not sponsored, endorsed, sold or promoted by Russell and Russell makes no representation regarding the advisability of investing in the fund.
1
Performance does not reflect the deduction of taxes that a shareholder would pay on fund distributions or the redemption of fund shares.
2
Source for category information: Morningstar, Inc. The Morningstar Category return represents all active and index mutual funds and ETFs within the category as of the report date.
3
As stated in the prospectus.
12Schwab Equity Index Funds | Semiannual Report
Schwab U.S. Large-Cap Growth Index Fund
Performance and Fund Facts as of April 30, 2023
| |
Weighted Average Market Cap (millions) | |
Price/Earnings Ratio (P/E) | |
| |
| |
Sector Weightings % of Investments3
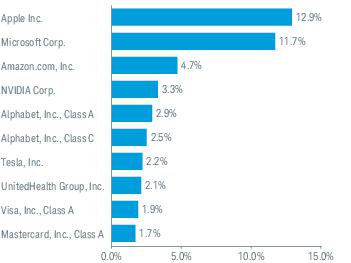
Top Equity Holdings % of Net Assets4
Portfolio holdings may have changed since the report date.
Source of Sector Classification: S&P and MSCI.
3
The percentage may differ from the Portfolio Holdings because the above calculation is based on a percentage of total investments, excluding derivatives, whereas the calculation in the Portfolio Holdings is based on a percentage of net assets.
4
This list is not a recommendation of any security by the investment adviser.
Schwab Equity Index Funds | Semiannual Report13
Schwab U.S. Large-Cap Value Index Fund
The performance data quoted represents past performance. Past performance does not guarantee future results. Investment returns and principal value of an investment will fluctuate so that an investor’s shares may be worth more or less than their original cost. Current performance may be lower or higher than performance data quoted. To obtain performance information current to the most recent month end, please visit www.schwabassetmanagement.com/schwabfunds_prospectus.
| | | | |
Fund: Schwab U.S. Large-Cap Value Index Fund (12/20/17) | | | | |
Russell 1000® Value Index | | | | |
Fund Category: Morningstar Large Value2 | | | | |
Fund Expense Ratio3: 0.035% |
All total returns on this page assume dividends and distributions were reinvested. Index figures do not include trading and management costs, which would lower performance. Indices are unmanaged and cannot be invested in directly. Performance results less than one year are not annualized.
For index definitions, please see the Glossary.
Index ownership – The Russell 1000® Value Index is a registered mark of the Frank Russell Company (Russell) and has been licensed for use by the Schwab U.S. Large-Cap Value Index Fund. The Schwab U.S. Large-Cap Value Index Fund is not sponsored, endorsed, sold or promoted by Russell and Russell makes no representation regarding the advisability of investing in the fund.
1
Performance does not reflect the deduction of taxes that a shareholder would pay on fund distributions or the redemption of fund shares.
2
Source for category information: Morningstar, Inc. The Morningstar Category return represents all active and index mutual funds and ETFs within the category as of the report date.
3
As stated in the prospectus.
14Schwab Equity Index Funds | Semiannual Report
Schwab U.S. Large-Cap Value Index Fund
Performance and Fund Facts as of April 30, 2023
| |
Weighted Average Market Cap (millions) | |
Price/Earnings Ratio (P/E) | |
| |
| |
Sector Weightings % of Investments3
Top Equity Holdings % of Net Assets4
Portfolio holdings may have changed since the report date.
Source of Sector Classification: S&P and MSCI.
3
The percentage may differ from the Portfolio Holdings because the above calculation is based on a percentage of total investments, excluding derivatives, whereas the calculation in the Portfolio Holdings is based on a percentage of net assets.
4
This list is not a recommendation of any security by the investment adviser.
Schwab Equity Index Funds | Semiannual Report15
Schwab U.S. Mid-Cap Index Fund
The performance data quoted represents past performance. Past performance does not guarantee future results. Investment returns and principal value of an investment will fluctuate so that an investor’s shares may be worth more or less than their original cost. Current performance may be lower or higher than performance data quoted. To obtain performance information current to the most recent month end, please visit www.schwabassetmanagement.com/schwabfunds_prospectus.
| | | | |
Fund: Schwab U.S. Mid-Cap Index Fund (12/20/17) | | | | |
| | | | |
Fund Category: Morningstar Mid-Cap Blend2 | | | | |
Fund Expense Ratio3: 0.04% |
All total returns on this page assume dividends and distributions were reinvested. Index figures do not include trading and management costs, which would lower performance. Indices are unmanaged and cannot be invested in directly. Performance results less than one year are not annualized.
For index definitions, please see the Glossary.
Index ownership – The Russell Midcap® Index is a registered mark of the Frank Russell Company (Russell) and has been licensed for use by the Schwab U.S. Mid-Cap Index Fund. The Schwab U.S. Mid-Cap Index Fund is not sponsored, endorsed, sold or promoted by Russell and Russell makes no representation regarding the advisability of investing in the fund.
1
Performance does not reflect the deduction of taxes that a shareholder would pay on fund distributions or the redemption of fund shares.
2
Source for category information: Morningstar, Inc. The Morningstar Category return represents all active and index mutual funds and ETFs within the category as of the report date.
3
As stated in the prospectus.
16Schwab Equity Index Funds | Semiannual Report
Schwab U.S. Mid-Cap Index Fund
Performance and Fund Facts as of April 30, 2023
| |
Weighted Average Market Cap (millions) | |
Price/Earnings Ratio (P/E) | |
| |
| |
Sector Weightings % of Investments3
Top Equity Holdings % of Net Assets4
Portfolio holdings may have changed since the report date.
Source of Sector Classification: S&P and MSCI.
3
The percentage may differ from the Portfolio Holdings because the above calculation is based on a percentage of total investments, excluding derivatives, whereas the calculation in the Portfolio Holdings is based on a percentage of net assets.
4
This list is not a recommendation of any security by the investment adviser.
Schwab Equity Index Funds | Semiannual Report17
Schwab International Index Fund
The performance data quoted represents past performance. Past performance does not guarantee future results. Investment returns and principal value of an investment will fluctuate so that an investor’s shares may be worth more or less than their original cost. Current performance may be lower or higher than performance data quoted. To obtain performance information current to the most recent month end, please visit www.schwabassetmanagement.com/schwabfunds_prospectus.
Average Annual Total Returns1,2
| | | | |
Fund: Schwab International Index Fund (5/19/97) | | | | |
| | | | |
Fund Category: Morningstar Foreign Large Blend4 | | | | |
Fund Expense Ratio5: 0.06% |
All total returns on this page assume dividends and distributions were reinvested. Index figures do not include trading and management costs, which would lower performance. Indices are unmanaged and cannot be invested in directly. Performance results less than one year are not annualized.
For index definitions, please see the Glossary.
Index ownership – “MSCI EAFE®” is a registered mark of MSCI and has been licensed for use by the Schwab International Index Fund. The Schwab International Index Fund is not sponsored, endorsed, sold or promoted by MSCI and MSCI bears no liability with respect to the fund. The Statement of Additional Information contains a more detailed description of the limited relationship MSCI has with the fund.
1
Performance does not reflect the deduction of taxes that a shareholder would pay on fund distributions or the redemption of fund shares.
2
The fund’s performance relative to the index may be affected by fair-value pricing. See financial note 2 for more information.
3
The net version of the index reflects reinvested dividends net of withholding taxes but reflects no deductions for expenses or other taxes.
4
Source for category information: Morningstar, Inc. The Morningstar Category return represents all active and index mutual funds and ETFs within the category as of the report date.
5
As stated in the prospectus.
18Schwab Equity Index Funds | Semiannual Report
Schwab International Index Fund
Performance and Fund Facts as of April 30, 2023
| |
Weighted Average Market Cap (millions) | |
Price/Earnings Ratio (P/E) | |
| |
| |
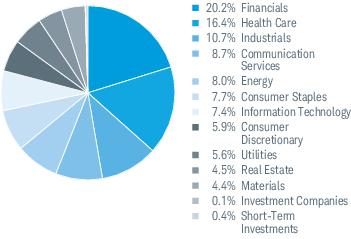
Sector Weightings % of Investments1
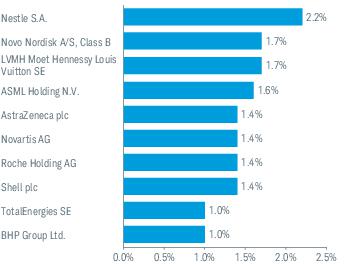
Top Equity Holdings % of Net Assets3
Top Country Weightings % of Investments4
Portfolio holdings may have changed since the report date.
Source of Sector Classification: S&P and MSCI.
International investments are subject to additional risks such as currency fluctuation, geopolitical risk and the potential for illiquid markets.
3
This list is not a recommendation of any security by the investment adviser.
4
The percentage may differ from the Portfolio Holdings because the above calculation is based on a percentage of total investments, excluding derivatives, whereas the calculation in the Portfolio Holdings is based on a percentage of net assets.
Schwab Equity Index Funds | Semiannual Report19
Schwab Equity Index Funds
Fund Expenses (Unaudited)
Examples for a $1,000 Investment
As a fund shareholder, you may incur two types of costs: (1) transaction costs; and (2) ongoing costs, including management fees.
The expense examples below are intended to help you understand your ongoing cost (in dollars) of investing in a fund and to compare this cost with the ongoing cost of investing in other mutual funds. These examples are based on an investment of $1,000 invested for six months beginning November 1, 2022 and held through April 30, 2023.
Actual Return lines in the table below provide information about actual account values and actual expenses. You may use this information, together with the amount you invested, to estimate the expenses that you paid over the period. To do so, simply divide your account value by $1,000 (for example, an $8,600 account value ÷ $1,000 = 8.6), then multiply the result by the number given for your fund under the heading entitled “Expenses Paid During Period.”
Hypothetical Return lines in the table below provide information about hypothetical account values and hypothetical expenses based on a fund’s actual expense ratio and an assumed return of 5% per year before expenses. Because the return used is not an actual return, it may not be used to estimate the actual ending account value or expenses you paid for the period.
You may use this information to compare the ongoing costs of investing in a fund and other funds. To do so, compare this 5% hypothetical example with the 5% hypothetical examples that appear in the shareholder reports of the other funds.
Please note that the expenses shown in the table are meant to highlight your ongoing costs only and do not reflect any transactional costs. Therefore, the hypothetical return lines of the table are useful in comparing ongoing costs only and will not help you determine the relative total costs of owning different funds. In addition, if these transactional costs were included, your costs would have been higher.
| | BEGINNING
ACCOUNT VALUE
AT 11/1/22 | ENDING
ACCOUNT VALUE
(NET OF EXPENSES)
AT 4/30/23 | EXPENSES PAID
DURING PERIOD
|
Schwab S&P 500 Index Fund | | | | |
| | | | |
| | | | |
| | | | |
| | | | |
| | | | |
Schwab Small-Cap Index Fund | | | | |
| | | | |
| | | | |
Schwab Total Stock Market Index Fund | | | | |
| | | | |
| | | | |
Schwab U.S. Large-Cap Growth Index Fund | | | | |
| | | | |
| | | | |
Schwab U.S. Large-Cap Value Index Fund | | | | |
| | | | |
| | | | |
Schwab U.S. Mid-Cap Index Fund | | | | |
| | | | |
| | | | |
Schwab International Index Fund | | | | |
| | | | |
| | | | |
| Based on the most recent six-month expense ratio. |
| Expenses for each fund are equal to its annualized expense ratio, multiplied by the average account value over the period, multiplied by 181 days in the period, and divided by 365 days in the fiscal year. |
20Schwab Equity Index Funds | Semiannual Report
Schwab S&P 500 Index Fund
Financial Statements
| | | | | | |
|
Net asset value at beginning of period | | | | | | |
Income (loss) from investment operations: | | | | | | |
Net investment income (loss)1 | | | | | | |
Net realized and unrealized gains (losses) | | | | | | |
Total from investment operations | | | | | | |
| | | | | | |
Distributions from net investment income | | | | | | |
Distributions from net realized gains | | | | | | |
| | | | | | |
Net asset value at end of period | | | | | | |
| | | | | | |
|
Ratios to average net assets: | | | | | | |
| | | | | | |
Net investment income (loss) | | | | | | |
| | | | | | |
Net assets, end of period (x 1,000,000) | | | | | | |
| |
| Calculated based on the average shares outstanding during the period. |
| |
| |
| Ratio includes less than 0.005% of non-routine proxy expenses. |
| Effective December 20, 2018, the annual operating expense ratio was reduced to 0.02%. The ratio presented for period ended 10/31/19 is a blended ratio. |
Schwab Equity Index Funds | Semiannual Report21
Schwab S&P 500 Index Fund
Portfolio Holdings as of April 30, 2023 (Unaudited)
This section shows all the securities in the fund’s portfolio and their values as of the report date.
The fund files its complete schedule of portfolio holdings with the U.S. Securities and Exchange Commission (SEC) for the first and third quarters of each fiscal year on Form N-PORT Part F. The fund’s Form N-PORT Part F is available on the SEC’s website at www.sec.gov. You can also obtain this information at no cost on the fund’s website at www.schwabassetmanagement.com/schwabfunds_prospectus, by calling 1-866-414-6349, or by sending an email request to orders@mysummaryprospectus.com. The fund also makes available its complete schedule of portfolio holdings 15 to 20 days after the end of the month on the fund’s website.
| | |
COMMON STOCKS 99.5% OF NET ASSETS |
|
Automobiles & Components 1.6% |
| | |
| | |
| | |
| | |
| | |
| | |
|
|
| | |
| | |
Citizens Financial Group, Inc. | | |
| | |
| | |
| | |
Huntington Bancshares, Inc. | | |
| | |
| | |
| | |
| | |
The PNC Financial Services Group, Inc. | | |
| | |
| | |
| | |
| | |
| | |
|
|
| | |
| | |
| | |
| | |
| | |
| | |
| | |
| | |
| | |
| | |
| | |
| | |
| | |
| | |
| | |
| | |
Honeywell International, Inc. | | |
| | |
Huntington Ingalls Industries, Inc. | | |
| | |
Illinois Tool Works, Inc. | | |
| | |
Johnson Controls International plc | | |
L3Harris Technologies, Inc. | | |
| | |
| | |
| | |
| | |
| | |
| | |
| | |
| | |
| | |
| | |
Raytheon Technologies Corp. | | |
Rockwell Automation, Inc. | | |
| | |
Stanley Black & Decker, Inc. | | |
| | |
| | |
| | |
| | |
| | |
| | |
Westinghouse Air Brake Technologies Corp. | | |
| | |
| | |
|
Commercial & Professional Services 1.3% |
Automatic Data Processing, Inc. | | |
Broadridge Financial Solutions, Inc. | | |
Ceridian HCM Holding, Inc. * | | |
| | |
| | |
| | |
| | |
| | |
| | |
| | |
| | |
| | |
Robert Half International, Inc. | | |
| | |
| | |
| | |
| | |
|
Consumer Discretionary Distribution & Retail 5.1% |
| | |
| | |
| | |
| | |
| | |
| | |
| | |
| | |
| | |
| | |
| | |
O'Reilly Automotive, Inc. * | | |
22Schwab Equity Index Funds | Semiannual Report
Schwab S&P 500 Index Fund
Portfolio Holdings as of April 30, 2023 (Unaudited) (continued)
| | |
| | |
| | |
| | |
| | |
| | |
| | |
| | |
|
Consumer Durables & Apparel 0.9% |
| | |
| | |
| | |
| | |
Mohawk Industries, Inc. * | | |
| | |
| | |
| | |
| | |
| | |
| | |
| | |
| | |
| | |
|
|
| | |
Caesars Entertainment, Inc. * | | |
| | |
Chipotle Mexican Grill, Inc. * | | |
| | |
| | |
| | |
Hilton Worldwide Holdings, Inc. | | |
| | |
Marriott International, Inc., Class A | | |
| | |
MGM Resorts International | | |
Norwegian Cruise Line Holdings Ltd. * | | |
Royal Caribbean Cruises Ltd. * | | |
| | |
| | |
| | |
| | |
|
Consumer Staples Distribution & Retail 1.9% |
| | |
| | |
| | |
| | |
| | |
| | |
Walgreens Boots Alliance, Inc. | | |
| | |
| | |
|
|
| | |
| | |
| | |
| | |
| | |
| | |
| | |
| | |
| | |
| | |
| | |
| | |
| | |
| | |
| | |
| | |
Occidental Petroleum Corp. | | |
| | |
| | |
Pioneer Natural Resources Co. | | |
| | |
| | |
| | |
| | |
| | |
|
Equity Real Estate Investment Trusts (REITs) 2.5% |
Alexandria Real Estate Equities, Inc. | | |
| | |
AvalonBay Communities, Inc. | | |
| | |
| | |
| | |
Digital Realty Trust, Inc. | | |
| | |
| | |
Essex Property Trust, Inc. | | |
Extra Space Storage, Inc. | | |
Federal Realty Investment Trust | | |
Healthpeak Properties, Inc. | | |
Host Hotels & Resorts, Inc. | | |
| | |
| | |
| | |
Mid-America Apartment Communities, Inc. | | |
| | |
| | |
| | |
| | |
| | |
Simon Property Group, Inc. | | |
| | |
| | |
| | |
| | |
| | |
| | |
|
|
| | |
Ameriprise Financial, Inc. | | |
Berkshire Hathaway, Inc., Class B * | | |
| | |
Capital One Financial Corp. | | |
Cboe Global Markets, Inc. | | |
| | |
Discover Financial Services | | |
FactSet Research Systems, Inc. | | |
Fidelity National Information Services, Inc. | | |
| | |
FleetCor Technologies, Inc. * | | |
| | |
| | |
Schwab Equity Index Funds | Semiannual Report23
Schwab S&P 500 Index Fund
Portfolio Holdings as of April 30, 2023 (Unaudited) (continued)
| | |
Intercontinental Exchange, Inc. | | |
| | |
Jack Henry & Associates, Inc. | | |
MarketAxess Holdings, Inc. | | |
Mastercard, Inc., Class A | | |
| | |
| | |
| | |
| | |
| | |
| | |
Raymond James Financial, Inc. | | |
| | |
| | |
| | |
T. Rowe Price Group, Inc. | | |
The Bank of New York Mellon Corp. | | |
The Charles Schwab Corp. (b) | | |
The Goldman Sachs Group, Inc. | | |
| | |
| | |
|
Food, Beverage & Tobacco 3.7% |
| | |
Archer-Daniels-Midland Co. | | |
Brown-Forman Corp., Class B | | |
| | |
| | |
| | |
Constellation Brands, Inc., Class A | | |
| | |
| | |
| | |
| | |
Lamb Weston Holdings, Inc. | | |
McCormick & Co., Inc. - Non Voting Shares | | |
Molson Coors Beverage Co., Class B | | |
Mondelez International, Inc., Class A | | |
| | |
| | |
Philip Morris International, Inc. | | |
| | |
| | |
| | |
| | |
Tyson Foods, Inc., Class A | | |
| | |
|
Health Care Equipment & Services 6.1% |
| | |
| | |
| | |
Baxter International, Inc. | | |
| | |
Boston Scientific Corp. * | | |
| | |
| | |
| | |
| | |
| | |
| | |
| | |
Edwards Lifesciences Corp. * | | |
| | |
| | |
| | |
| | |
| | |
| | |
| | |
IDEXX Laboratories, Inc. * | | |
| | |
Intuitive Surgical, Inc. * | | |
Laboratory Corp. of America Holdings | | |
| | |
| | |
Molina Healthcare, Inc. * | | |
| | |
| | |
| | |
| | |
| | |
| | |
| | |
Universal Health Services, Inc., Class B | | |
Zimmer Biomet Holdings, Inc. | | |
| | |
|
Household & Personal Products 1.7% |
Church & Dwight Co., Inc. | | |
| | |
| | |
| | |
The Estee Lauder Cos., Inc., Class A | | |
| | |
| | |
|
|
| | |
American International Group, Inc. | | |
| | |
Arch Capital Group Ltd. * | | |
Arthur J. Gallagher & Co. | | |
| | |
| | |
| | |
Cincinnati Financial Corp. | | |
| | |
| | |
| | |
| | |
Marsh & McLennan Cos., Inc. | | |
| | |
Principal Financial Group, Inc. | | |
Prudential Financial, Inc. | | |
| | |
The Hartford Financial Services Group, Inc. | | |
| | |
| | |
| | |
| | |
| | |
|
|
Air Products & Chemicals, Inc. | | |
| | |
| | |
| | |
| | |
24Schwab Equity Index Funds | Semiannual Report
Schwab S&P 500 Index Fund
Portfolio Holdings as of April 30, 2023 (Unaudited) (continued)
| | |
| | |
CF Industries Holdings, Inc. | | |
| | |
| | |
| | |
| | |
| | |
| | |
| | |
International Flavors & Fragrances, Inc. | | |
| | |
| | |
LyondellBasell Industries N.V., Class A | | |
Martin Marietta Materials, Inc. | | |
| | |
| | |
Packaging Corp. of America | | |
| | |
| | |
| | |
| | |
| | |
| | |
| | |
| | |
|
Media & Entertainment 7.2% |
Activision Blizzard, Inc. * | | |
Alphabet, Inc., Class A * | | |
Alphabet, Inc., Class C * | | |
Charter Communications, Inc., Class A * | | |
| | |
DISH Network Corp., Class A * | | |
| | |
| | |
| | |
Live Nation Entertainment, Inc. * | | |
| | |
Meta Platforms, Inc., Class A * | | |
| | |
| | |
| | |
| | |
Paramount Global, Class B | | |
Take-Two Interactive Software, Inc. * | | |
The Interpublic Group of Cos., Inc. | | |
| | |
Warner Bros Discovery, Inc. * | | |
| | |
|
Pharmaceuticals, Biotechnology & Life Sciences 8.2% |
| | |
Agilent Technologies, Inc. | | |
| | |
| | |
Bio-Rad Laboratories, Inc., Class A * | | |
| | |
| | |
| | |
Charles River Laboratories International, Inc. * | | |
| | |
| | |
| | |
| | |
| | |
| | |
| | |
| | |
| | |
Mettler-Toledo International, Inc. * | | |
| | |
| | |
| | |
| | |
Regeneron Pharmaceuticals, Inc. * | | |
Thermo Fisher Scientific, Inc. | | |
Vertex Pharmaceuticals, Inc. * | | |
| | |
| | |
West Pharmaceutical Services, Inc. | | |
| | |
| | |
|
Real Estate Management & Development 0.1% |
CBRE Group, Inc., Class A * | | |
|
Semiconductors & Semiconductor Equipment 6.0% |
Advanced Micro Devices, Inc. * | | |
| | |
| | |
| | |
| | |
| | |
| | |
| | |
| | |
Microchip Technology, Inc. | | |
| | |
Monolithic Power Systems, Inc. | | |
| | |
| | |
| | |
| | |
| | |
| | |
SolarEdge Technologies, Inc. * | | |
| | |
| | |
| | |
|
Software & Services 10.7% |
| | |
| | |
Akamai Technologies, Inc. * | | |
| | |
| | |
Cadence Design Systems, Inc. * | | |
Cognizant Technology Solutions Corp., Class A | | |
| | |
| | |
| | |
| | |
| | |
| | |
International Business Machines Corp. | | |
| | |
Schwab Equity Index Funds | Semiannual Report25
Schwab S&P 500 Index Fund
Portfolio Holdings as of April 30, 2023 (Unaudited) (continued)
| | |
| | |
| | |
| | |
| | |
| | |
| | |
| | |
Tyler Technologies, Inc. * | | |
| | |
| | |
|
Technology Hardware & Equipment 8.9% |
| | |
| | |
| | |
| | |
| | |
| | |
| | |
Hewlett Packard Enterprise Co. | | |
| | |
| | |
Keysight Technologies, Inc. * | | |
| | |
| | |
Seagate Technology Holdings plc | | |
| | |
Teledyne Technologies, Inc. * | | |
| | |
| | |
Zebra Technologies Corp., Class A * | | |
| | |
|
Telecommunication Services 1.1% |
| | |
| | |
Verizon Communications, Inc. | | |
| | |
|
|
| | |
American Airlines Group, Inc. * | | |
C.H. Robinson Worldwide, Inc. | | |
| | |
| | |
Expeditors International of Washington, Inc. | | |
| | |
JB Hunt Transport Services, Inc. | | |
| | |
Old Dominion Freight Line, Inc. | | |
| | |
| | |
United Airlines Holdings, Inc. * | | |
United Parcel Service, Inc., Class B | | |
| | |
|
| | |
|
| | |
| | |
American Electric Power Co., Inc. | | |
American Water Works Co., Inc. | | |
| | |
| | |
| | |
Consolidated Edison, Inc. | | |
Constellation Energy Corp. | | |
| | |
| | |
| | |
| | |
| | |
| | |
| | |
| | |
| | |
| | |
| | |
| | |
| | |
Pinnacle West Capital Corp. | | |
| | |
Public Service Enterprise Group, Inc. | | |
| | |
| | |
| | |
| | |
| | |
| | |
Total Common Stocks
(Cost $31,047,235,765) | |
Total Investments in Securities
(Cost $31,047,235,765) | |
| | | CURRENT VALUE/
UNREALIZED
APPRECIATION
($) |
|
| | | |
S&P 500 Index, e-mini, expires 06/16/23 | | | |
| Non-income producing security. |
| First Republic Bank was placed into receivership with the Federal Deposit Insurance Corp. due to inadequate liquidity and insolvency on May 1, 2023 and the position has subsequently been sold. |
| Issuer is affiliated with the fund’s investment adviser. |
26Schwab Equity Index Funds | Semiannual Report
Schwab S&P 500 Index Fund
Portfolio Holdings as of April 30, 2023 (Unaudited) (continued)
Below is a summary of the fund’s transactions with affiliated issuers during the period ended April 30, 2023:
| | | | | NET CHANGE IN UNREALIZED APPRECIATION (DEPRECIATION) | | BALANCE OF SHARES HELD AT 4/30/23 | |
COMMON STOCKS 0.2% OF NET ASSETS |
|
|
| | | | | | | | |
The following is a summary of the inputs used to value the fund’s investments as of April 30, 2023 (see financial note 2(a) for additional information):
| QUOTED PRICES IN
ACTIVE MARKETS FOR
IDENTICAL ASSETS
(LEVEL 1) | OTHER SIGNIFICANT
OBSERVABLE INPUTS
(LEVEL 2) | SIGNIFICANT
UNOBSERVABLE INPUTS
(LEVEL 3) | |
| | | | |
| | | | |
| | | | |
| | | | |
| As categorized in the Portfolio Holdings. |
| Futures contracts are reported at cumulative unrealized appreciation or depreciation. |
Schwab Equity Index Funds | Semiannual Report27
Schwab S&P 500 Index Fund
Statement of Assets and Liabilities
As of April 30, 2023; unaudited
|
Investments in securities, at value - affiliated (cost $96,529,934) | | |
Investments in securities, at value - unaffiliated (cost $30,950,705,831) | | |
| | |
Deposit with broker for futures contracts | | |
| | |
| | |
| | |
Variation margin on future contracts | | |
| | |
|
|
| | |
| | |
| | |
| | |
| | |
|
|
Capital received from investors | | |
Total distributable earnings | | |
| | |
28Schwab Equity Index Funds | Semiannual Report
Schwab S&P 500 Index Fund
Statement of Operations
For the period November 1, 2022 through April 30, 2023; unaudited |
|
Dividends received from securities - unaffiliated (net of foreign withholding tax of $137,516) | | |
Dividends received from securities - affiliated | | |
| | |
| | |
|
|
| | |
| | |
| | |
| | |
|
REALIZED AND UNREALIZED GAINS (LOSSES) |
Net realized losses on sales of securities - unaffiliated | | |
Net realized gains on futures contracts | | |
| | |
Net change in unrealized appreciation (depreciation) on securities - affiliated | | |
Net change in unrealized appreciation (depreciation) on securities - unaffiliated | | |
Net change in unrealized appreciation (depreciation) on futures contracts | | |
Net change in unrealized appreciation (depreciation) | | |
Net realized and unrealized gains | | |
Increase in net assets resulting from operations | | |
| Proxy fees are non-routine expenses (see financial note 2(e) for additional information). |
Schwab Equity Index Funds | Semiannual Report29
Schwab S&P 500 Index Fund
Statement of Changes in Net Assets
For the current and prior report periods
Figures for the current period are unaudited
|
| | |
| | | |
| | | |
Net change in unrealized appreciation (depreciation) | | | |
Increase (decrease) in net assets resulting from operations | | | |
|
DISTRIBUTIONS TO SHAREHOLDERS |
| | | |
TRANSACTIONS IN FUND SHARES |
| | |
| | | | | |
| | | | | |
| | | | | |
| | | | | |
Net transactions in fund shares | | | | | |
|
SHARES OUTSTANDING AND NET ASSETS |
| | |
| | | | | |
| | | | | |
Total increase (decrease) | | | | | |
| | | | | |
30Schwab Equity Index Funds | Semiannual Report
Financial Statements
| | | | | | |
|
Net asset value at beginning of period | | | | | | |
Income (loss) from investment operations: | | | | | | |
Net investment income (loss)1 | | | | | | |
Net realized and unrealized gains (losses) | | | | | | |
Total from investment operations | | | | | | |
| | | | | | |
Distributions from net investment income | | | | | | |
Distributions from net realized gains | | | | | | |
| | | | | | |
Net asset value at end of period | | | | | | |
| | | | | | |
|
Ratios to average net assets: | | | | | | |
| | | | | | |
Net investment income (loss) | | | | | | |
| | | | | | |
Net assets, end of period (x 1,000,000) | | | | | | |
| |
| Calculated based on the average shares outstanding during the period. |
| |
| |
| Ratio includes less than 0.005% of non-routine proxy expenses. |
| Portfolio turnover rate excludes in-kind transactions. |
Schwab Equity Index Funds | Semiannual Report31
Portfolio Holdings as of April 30, 2023 (Unaudited)
This section shows all the securities in the fund’s portfolio and their values as of the report date.
The fund files its complete schedule of portfolio holdings with the U.S. Securities and Exchange Commission (SEC) for the first and third quarters of each fiscal year on Form N-PORT Part F. The fund’s Form N-PORT Part F is available on the SEC’s website at www.sec.gov. You can also obtain this information at no cost on the fund’s website at www.schwabassetmanagement.com/schwabfunds_prospectus, by calling 1-866-414-6349, or by sending an email request to orders@mysummaryprospectus.com. The fund also makes available its complete schedule of portfolio holdings 15 to 20 days after the end of the month on the fund’s website.
| | |
COMMON STOCKS 99.6% OF NET ASSETS |
|
Automobiles & Components 1.6% |
| | |
| | |
| | |
| | |
| | |
| | |
| | |
| | |
| | |
Rivian Automotive, Inc., Class A * | | |
| | |
| | |
| | |
|
|
| | |
| | |
| | |
| | |
| | |
Citizens Financial Group, Inc. | | |
| | |
Commerce Bancshares, Inc. | | |
Cullen/Frost Bankers, Inc. | | |
| | |
| | |
| | |
First Citizens BancShares, Inc., Class A | | |
First Financial Bankshares, Inc. | | |
| | |
First Interstate BancSystem, Inc., Class A | | |
| | |
| | |
| | |
Huntington Bancshares, Inc. | | |
| | |
| | |
| | |
New York Community Bancorp, Inc. | | |
| | |
Pinnacle Financial Partners, Inc. | | |
| | |
Prosperity Bancshares, Inc. | | |
| | |
ServisFirst Bancshares, Inc. | | |
| | |
| | |
The PNC Financial Services Group, Inc. | | |
| | |
| | |
| | |
| | |
| | |
| | |
| | |
| | |
| | |
| | |
| | |
| | |
|
|
| | |
| | |
| | |
Advanced Drainage Systems, Inc. | | |
| | |
| | |
| | |
| | |
| | |
Bloom Energy Corp., Class A * | | |
Builders FirstSource, Inc. * | | |
| | |
| | |
| | |
| | |
ChargePoint Holdings, Inc. *(a) | | |
| | |
| | |
| | |
| | |
| | |
| | |
| | |
| | |
| | |
| | |
| | |
Evoqua Water Technologies Corp. * | | |
| | |
| | |
Fortune Brands Innovations, Inc. | | |
| | |
| | |
| | |
| | |
| | |
| | |
| | |
Honeywell International, Inc. | | |
| | |
| | |
Huntington Ingalls Industries, Inc. | | |
| | |
Illinois Tool Works, Inc. | | |
| | |
| | |
32Schwab Equity Index Funds | Semiannual Report
Portfolio Holdings as of April 30, 2023 (Unaudited) (continued)
| | |
Johnson Controls International plc | | |
L3Harris Technologies, Inc. | | |
Lennox International, Inc. | | |
Lincoln Electric Holdings, Inc. | | |
| | |
| | |
| | |
| | |
MDU Resources Group, Inc. | | |
| | |
| | |
| | |
| | |
| | |
| | |
| | |
| | |
| | |
| | |
| | |
| | |
Raytheon Technologies Corp. | | |
| | |
| | |
Rockwell Automation, Inc. | | |
Sensata Technologies Holding plc | | |
SiteOne Landscape Supply, Inc. * | | |
| | |
Stanley Black & Decker, Inc. | | |
| | |
| | |
| | |
| | |
| | |
| | |
| | |
| | |
| | |
| | |
| | |
| | |
| | |
| | |
| | |
| | |
WESCO International, Inc. | | |
Westinghouse Air Brake Technologies Corp. | | |
WillScot Mobile Mini Holdings Corp. * | | |
| | |
| | |
Zurn Elkay Water Solutions Corp. | | |
| | |
|
Commercial & Professional Services 1.6% |
| | |
Automatic Data Processing, Inc. | | |
Booz Allen Hamilton Holding Corp. | | |
Broadridge Financial Solutions, Inc. | | |
CACI International, Inc., Class A * | | |
Casella Waste Systems, Inc., Class A * | | |
Ceridian HCM Holding, Inc. * | | |
| | |
| | |
| | |
| | |
| | |
| | |
| | |
Driven Brands Holdings, Inc. * | | |
Dun & Bradstreet Holdings, Inc. | | |
| | |
ExlService Holdings, Inc. * | | |
| | |
| | |
| | |
| | |
| | |
| | |
| | |
| | |
| | |
| | |
| | |
Paylocity Holding Corp. * | | |
| | |
Robert Half International, Inc. | | |
| | |
Science Applications International Corp. | | |
SS&C Technologies Holdings, Inc. | | |
| | |
| | |
| | |
| | |
| | |
| | |
| | |
|
Consumer Discretionary Distribution & Retail 4.9% |
| | |
| | |
| | |
| | |
| | |
| | |
Burlington Stores, Inc. * | | |
| | |
Dick's Sporting Goods, Inc. | | |
| | |
| | |
| | |
Floor & Decor Holdings, Inc., Class A * | | |
GameStop Corp., Class A *(a) | | |
| | |
| | |
| | |
| | |
| | |
| | |
O'Reilly Automotive, Inc. * | | |
Penske Automotive Group, Inc. | | |
| | |
| | |
| | |
| | |
| | |
| | |
| | |
| | |
| | |
| | |
|
Schwab Equity Index Funds | Semiannual Report33
Portfolio Holdings as of April 30, 2023 (Unaudited) (continued)
| | |
Consumer Durables & Apparel 1.1% |
| | |
| | |
| | |
| | |
| | |
| | |
| | |
| | |
| | |
| | |
Lululemon Athletica, Inc. * | | |
| | |
Mohawk Industries, Inc. * | | |
| | |
| | |
| | |
| | |
| | |
Skechers U.S.A., Inc., Class A * | | |
| | |
Tempur Sealy International, Inc. | | |
| | |
| | |
| | |
| | |
| | |
|
|
| | |
| | |
| | |
| | |
| | |
Caesars Entertainment, Inc. * | | |
| | |
Chipotle Mexican Grill, Inc. * | | |
Choice Hotels International, Inc. | | |
| | |
| | |
| | |
DoorDash, Inc., Class A * | | |
DraftKings, Inc., Class A * | | |
| | |
| | |
Hilton Grand Vacations, Inc. * | | |
Hilton Worldwide Holdings, Inc. | | |
Hyatt Hotels Corp., Class A * | | |
| | |
| | |
Marriott International, Inc., Class A | | |
Marriott Vacations Worldwide Corp. | | |
| | |
MGM Resorts International | | |
Norwegian Cruise Line Holdings Ltd. * | | |
Penn Entertainment, Inc. * | | |
Planet Fitness, Inc., Class A * | | |
Royal Caribbean Cruises Ltd. * | | |
Service Corp. International | | |
| | |
| | |
| | |
| | |
Wyndham Hotels & Resorts, Inc. | | |
| | |
| | |
| | |
| | |
|
Consumer Staples Distribution & Retail 1.9% |
Albertsons Cos., Inc., Class A | | |
BJ's Wholesale Club Holdings, Inc. * | | |
Casey's General Stores, Inc. | | |
| | |
| | |
| | |
Performance Food Group Co. * | | |
| | |
| | |
| | |
U.S. Foods Holding Corp. * | | |
Walgreens Boots Alliance, Inc. | | |
| | |
| | |
|
|
| | |
| | |
| | |
| | |
| | |
| | |
| | |
| | |
| | |
| | |
| | |
| | |
| | |
| | |
| | |
| | |
| | |
| | |
| | |
| | |
| | |
| | |
| | |
| | |
Magnolia Oil & Gas Corp., Class A | | |
| | |
| | |
| | |
| | |
New Fortress Energy, Inc. | | |
| | |
Occidental Petroleum Corp. | | |
| | |
| | |
PBF Energy, Inc., Class A | | |
| | |
| | |
Pioneer Natural Resources Co. | | |
| | |
| | |
| | |
Southwestern Energy Co. * | | |
| | |
| | |
| | |
| | |
34Schwab Equity Index Funds | Semiannual Report
Portfolio Holdings as of April 30, 2023 (Unaudited) (continued)
| | |
| | |
| | |
|
Equity Real Estate Investment Trusts (REITs) 2.8% |
| | |
Alexandria Real Estate Equities, Inc. | | |
American Homes 4 Rent, Class A | | |
| | |
Americold Realty Trust, Inc. | | |
Apartment Income REIT Corp. | | |
AvalonBay Communities, Inc. | | |
| | |
Brixmor Property Group, Inc. | | |
| | |
| | |
| | |
Digital Realty Trust, Inc. | | |
EastGroup Properties, Inc. | | |
| | |
Equity LifeStyle Properties, Inc. | | |
| | |
Essex Property Trust, Inc. | | |
Extra Space Storage, Inc. | | |
Federal Realty Investment Trust | | |
First Industrial Realty Trust, Inc. | | |
Gaming & Leisure Properties, Inc. | | |
Healthcare Realty Trust, Inc. | | |
Healthpeak Properties, Inc. | | |
Host Hotels & Resorts, Inc. | | |
Independence Realty Trust, Inc. | | |
| | |
| | |
| | |
| | |
| | |
Lamar Advertising Co., Class A | | |
| | |
Medical Properties Trust, Inc. | | |
Mid-America Apartment Communities, Inc. | | |
National Retail Properties, Inc. | | |
National Storage Affiliates Trust | | |
Omega Healthcare Investors, Inc. | | |
| | |
| | |
| | |
| | |
| | |
Rexford Industrial Realty, Inc. | | |
Ryman Hospitality Properties, Inc. | | |
| | |
Simon Property Group, Inc. | | |
Spirit Realty Capital, Inc. | | |
| | |
| | |
| | |
| | |
| | |
| | |
| | |
| | |
| | |
| | |
| | |
|
| | |
|
Affiliated Managers Group, Inc. | | |
| | |
| | |
| | |
| | |
Ameriprise Financial, Inc. | | |
Annaly Capital Management, Inc. | | |
Apollo Global Management, Inc. | | |
Ares Management Corp., Class A | | |
Berkshire Hathaway, Inc., Class B * | | |
| | |
Blackstone Mortgage Trust, Inc., Class A | | |
| | |
| | |
| | |
Capital One Financial Corp. | | |
Cboe Global Markets, Inc. | | |
| | |
Coinbase Global, Inc., Class A *(a) | | |
Credit Acceptance Corp. * | | |
Discover Financial Services | | |
| | |
| | |
Euronet Worldwide, Inc. * | | |
FactSet Research Systems, Inc. | | |
Fidelity National Information Services, Inc. | | |
| | |
FleetCor Technologies, Inc. * | | |
| | |
| | |
Interactive Brokers Group, Inc., Class A | | |
Intercontinental Exchange, Inc. | | |
| | |
Jack Henry & Associates, Inc. | | |
Jefferies Financial Group, Inc. | | |
| | |
LPL Financial Holdings, Inc. | | |
MarketAxess Holdings, Inc. | | |
Mastercard, Inc., Class A | | |
| | |
| | |
| | |
| | |
| | |
| | |
| | |
| | |
| | |
Raymond James Financial, Inc. | | |
| | |
Robinhood Markets, Inc., Class A * | | |
| | |
| | |
SoFi Technologies, Inc. * | | |
Starwood Property Trust, Inc. | | |
| | |
| | |
| | |
T. Rowe Price Group, Inc. | | |
The Bank of New York Mellon Corp. | | |
| | |
The Charles Schwab Corp. (c) | | |
The Goldman Sachs Group, Inc. | | |
Schwab Equity Index Funds | Semiannual Report35
Portfolio Holdings as of April 30, 2023 (Unaudited) (continued)
| | |
| | |
| | |
Tradeweb Markets, Inc., Class A | | |
| | |
| | |
| | |
| | |
|
Food, Beverage & Tobacco 3.5% |
| | |
Archer-Daniels-Midland Co. | | |
Brown-Forman Corp., Class B | | |
| | |
| | |
| | |
| | |
Constellation Brands, Inc., Class A | | |
Darling Ingredients, Inc. * | | |
| | |
| | |
| | |
| | |
| | |
| | |
Lamb Weston Holdings, Inc. | | |
| | |
McCormick & Co., Inc. - Non Voting Shares | | |
Molson Coors Beverage Co., Class B | | |
Mondelez International, Inc., Class A | | |
| | |
National Beverage Corp. * | | |
| | |
Philip Morris International, Inc. | | |
| | |
| | |
| | |
| | |
| | |
| | |
| | |
Tyson Foods, Inc., Class A | | |
| | |
|
Health Care Equipment & Services 6.0% |
| | |
Acadia Healthcare Co., Inc. * | | |
| | |
| | |
| | |
AMN Healthcare Services, Inc. * | | |
Baxter International, Inc. | | |
| | |
Boston Scientific Corp. * | | |
| | |
| | |
| | |
| | |
| | |
| | |
| | |
| | |
Edwards Lifesciences Corp. * | | |
| | |
| | |
| | |
| | |
| | |
Globus Medical, Inc., Class A * | | |
| | |
| | |
| | |
| | |
| | |
| | |
IDEXX Laboratories, Inc. * | | |
Inspire Medical Systems, Inc. * | | |
| | |
Intuitive Surgical, Inc. * | | |
iRhythm Technologies, Inc. * | | |
Laboratory Corp. of America Holdings | | |
Lantheus Holdings, Inc. * | | |
| | |
| | |
| | |
Molina Healthcare, Inc. * | | |
| | |
Oak Street Health, Inc. * | | |
| | |
Option Care Health, Inc. * | | |
| | |
| | |
Privia Health Group, Inc. * | | |
| | |
| | |
| | |
| | |
Shockwave Medical, Inc. * | | |
| | |
| | |
| | |
| | |
| | |
| | |
| | |
| | |
| | |
Universal Health Services, Inc., Class B | | |
Veeva Systems, Inc., Class A * | | |
Zimmer Biomet Holdings, Inc. | | |
| | |
|
Household & Personal Products 1.5% |
Church & Dwight Co., Inc. | | |
| | |
| | |
| | |
| | |
Reynolds Consumer Products, Inc. | | |
| | |
The Estee Lauder Cos., Inc., Class A | | |
| | |
| | |
|
|
| | |
American Financial Group, Inc. | | |
American International Group, Inc. | | |
| | |
Arch Capital Group Ltd. * | | |
Arthur J. Gallagher & Co. | | |
| | |
36Schwab Equity Index Funds | Semiannual Report
Portfolio Holdings as of April 30, 2023 (Unaudited) (continued)
| | |
Axis Capital Holdings Ltd. | | |
| | |
| | |
Cincinnati Financial Corp. | | |
| | |
Erie Indemnity Co., Class A | | |
| | |
F&G Annuities & Life, Inc. | | |
Fidelity National Financial, Inc. | | |
First American Financial Corp. | | |
| | |
Kinsale Capital Group, Inc. | | |
| | |
| | |
| | |
Marsh & McLennan Cos., Inc. | | |
| | |
Old Republic International Corp. | | |
| | |
Principal Financial Group, Inc. | | |
Prudential Financial, Inc. | | |
Reinsurance Group of America, Inc. | | |
RenaissanceRe Holdings Ltd. | | |
| | |
Ryan Specialty Holdings, Inc., Class A * | | |
Selective Insurance Group, Inc. | | |
| | |
The Hanover Insurance Group, Inc. | | |
The Hartford Financial Services Group, Inc. | | |
| | |
| | |
| | |
| | |
| | |
| | |
|
|
Air Products & Chemicals, Inc. | | |
| | |
| | |
| | |
| | |
| | |
| | |
Axalta Coating Systems Ltd. * | | |
| | |
| | |
| | |
| | |
CF Industries Holdings, Inc. | | |
| | |
| | |
| | |
| | |
| | |
| | |
| | |
| | |
| | |
| | |
| | |
| | |
Graphic Packaging Holding Co. | | |
| | |
| | |
International Flavors & Fragrances, Inc. | | |
| | |
| | |
| | |
LyondellBasell Industries N.V., Class A | | |
Martin Marietta Materials, Inc. | | |
| | |
| | |
| | |
| | |
Packaging Corp. of America | | |
| | |
Reliance Steel & Aluminum Co. | | |
| | |
| | |
| | |
| | |
| | |
| | |
| | |
| | |
| | |
United States Steel Corp. | | |
| | |
| | |
| | |
| | |
|
Media & Entertainment 6.9% |
Activision Blizzard, Inc. * | | |
Alphabet, Inc., Class A * | | |
Alphabet, Inc., Class C * | | |
AMC Entertainment Holdings, Inc., Class A (a) | | |
| | |
Charter Communications, Inc., Class A * | | |
| | |
DISH Network Corp., Class A * | | |
| | |
Endeavor Group Holdings, Inc., Class A * | | |
| | |
| | |
Getty Images Holdings, Inc. *(a) | | |
| | |
Liberty Broadband Corp., Class C * | | |
Liberty Media Corp. - Liberty Formula One, Class C * | | |
Liberty Media Corp. - Liberty SiriusXM, Class C * | | |
Live Nation Entertainment, Inc. * | | |
| | |
Meta Platforms, Inc., Class A * | | |
| | |
| | |
Nexstar Media Group, Inc., Class A | | |
| | |
Paramount Global, Class B | | |
Pinterest, Inc., Class A * | | |
| | |
| | |
| | |
Sirius XM Holdings, Inc. (a) | | |
Schwab Equity Index Funds | Semiannual Report37
Portfolio Holdings as of April 30, 2023 (Unaudited) (continued)
| | |
| | |
Take-Two Interactive Software, Inc. * | | |
| | |
The Interpublic Group of Cos., Inc. | | |
The New York Times Co., Class A | | |
The Trade Desk, Inc., Class A * | | |
| | |
Warner Bros Discovery, Inc. * | | |
ZoomInfo Technologies, Inc. * | | |
| | |
|
Pharmaceuticals, Biotechnology & Life Sciences 8.1% |
| | |
Agilent Technologies, Inc. | | |
Alnylam Pharmaceuticals, Inc. * | | |
| | |
Apellis Pharmaceuticals, Inc. * | | |
Arrowhead Pharmaceuticals, Inc. * | | |
| | |
| | |
| | |
BioMarin Pharmaceutical, Inc. * | | |
Bio-Rad Laboratories, Inc., Class A * | | |
| | |
Blueprint Medicines Corp. * | | |
| | |
| | |
| | |
Cerevel Therapeutics Holdings, Inc. * | | |
Charles River Laboratories International, Inc. * | | |
| | |
| | |
| | |
Elanco Animal Health, Inc. * | | |
| | |
| | |
| | |
| | |
Halozyme Therapeutics, Inc. * | | |
Horizon Therapeutics plc * | | |
| | |
| | |
Intellia Therapeutics, Inc. * | | |
Intra-Cellular Therapies, Inc. * | | |
Ionis Pharmaceuticals, Inc. * | | |
| | |
Jazz Pharmaceuticals plc * | | |
| | |
Karuna Therapeutics, Inc. * | | |
| | |
| | |
Mettler-Toledo International, Inc. * | | |
Mirati Therapeutics, Inc. * | | |
| | |
| | |
Neurocrine Biosciences, Inc. * | | |
| | |
| | |
| | |
| | |
Regeneron Pharmaceuticals, Inc. * | | |
| | |
Royalty Pharma plc, Class A | | |
Sarepta Therapeutics, Inc. * | | |
| | |
| | |
| | |
| | |
Thermo Fisher Scientific, Inc. | | |
United Therapeutics Corp. * | | |
Vertex Pharmaceuticals, Inc. * | | |
| | |
| | |
West Pharmaceutical Services, Inc. | | |
| | |
| | |
|
Real Estate Management & Development 0.1% |
CBRE Group, Inc., Class A * | | |
Jones Lang LaSalle, Inc. * | | |
Zillow Group, Inc., Class C * | | |
| | |
|
Semiconductors & Semiconductor Equipment 5.7% |
Advanced Micro Devices, Inc. * | | |
Allegro MicroSystems, Inc. * | | |
| | |
| | |
| | |
| | |
| | |
| | |
| | |
| | |
GLOBALFOUNDRIES, Inc. *(a) | | |
| | |
| | |
| | |
Lattice Semiconductor Corp. * | | |
| | |
Microchip Technology, Inc. | | |
| | |
| | |
Monolithic Power Systems, Inc. | | |
| | |
| | |
| | |
| | |
| | |
| | |
SolarEdge Technologies, Inc. * | | |
| | |
| | |
| | |
| | |
| | |
| | |
|
Software & Services 11.0% |
| | |
| | |
Akamai Technologies, Inc. * | | |
| | |
| | |
AppLovin Corp., Class A * | | |
| | |
| | |
Bentley Systems, Inc., Class B | | |
Bill.com Holdings, Inc. * | | |
| | |
Cadence Design Systems, Inc. * | | |
38Schwab Equity Index Funds | Semiannual Report
Portfolio Holdings as of April 30, 2023 (Unaudited) (continued)
| | |
CCC Intelligent Solutions Holdings, Inc. * | | |
Cloudflare, Inc., Class A * | | |
Cognizant Technology Solutions Corp., Class A | | |
Crowdstrike Holdings, Inc., Class A * | | |
| | |
| | |
Dolby Laboratories, Inc., Class A | | |
DoubleVerify Holdings, Inc. * | | |
| | |
| | |
| | |
| | |
| | |
| | |
| | |
| | |
| | |
| | |
| | |
Guidewire Software, Inc. * | | |
| | |
Informatica, Inc., Class A * | | |
International Business Machines Corp. | | |
| | |
Manhattan Associates, Inc. * | | |
| | |
| | |
| | |
| | |
| | |
| | |
Palantir Technologies, Inc., Class A * | | |
Palo Alto Networks, Inc. * | | |
Procore Technologies, Inc. * | | |
| | |
| | |
| | |
| | |
SentinelOne, Inc., Class A * | | |
| | |
Smartsheet, Inc., Class A * | | |
Snowflake, Inc., Class A * | | |
| | |
| | |
| | |
| | |
| | |
Tyler Technologies, Inc. * | | |
| | |
| | |
| | |
| | |
| | |
Zoom Video Communications, Inc., Class A * | | |
| | |
| | |
|
Technology Hardware & Equipment 8.3% |
| | |
| | |
| | |
Arrow Electronics, Inc. * | | |
| | |
| | |
| | |
| | |
| | |
| | |
| | |
Dell Technologies, Inc., Class C | | |
| | |
Hewlett Packard Enterprise Co. | | |
| | |
| | |
| | |
| | |
Keysight Technologies, Inc. * | | |
| | |
Lumentum Holdings, Inc. * | | |
| | |
National Instruments Corp. | | |
| | |
| | |
Pure Storage, Inc., Class A * | | |
| | |
Seagate Technology Holdings plc | | |
| | |
| | |
Teledyne Technologies, Inc. * | | |
| | |
| | |
| | |
Zebra Technologies Corp., Class A * | | |
| | |
|
Telecommunication Services 1.0% |
| | |
Frontier Communications Parent, Inc. * | | |
Iridium Communications, Inc. | | |
Liberty Global plc, Class C * | | |
| | |
| | |
Verizon Communications, Inc. | | |
| | |
|
|
| | |
American Airlines Group, Inc. * | | |
Avis Budget Group, Inc. * | | |
C.H. Robinson Worldwide, Inc. | | |
| | |
| | |
Expeditors International of Washington, Inc. | | |
| | |
| | |
Hertz Global Holdings, Inc. * | | |
JB Hunt Transport Services, Inc. | | |
Knight-Swift Transportation Holdings, Inc. | | |
| | |
| | |
| | |
Old Dominion Freight Line, Inc. | | |
| | |
| | |
| | |
Uber Technologies, Inc. * | | |
| | |
Schwab Equity Index Funds | Semiannual Report39
Portfolio Holdings as of April 30, 2023 (Unaudited) (continued)
| | |
U-Haul Holding Co. - Non Voting | | |
| | |
United Airlines Holdings, Inc. * | | |
United Parcel Service, Inc., Class B | | |
| | |
| | |
|
|
| | |
| | |
American Electric Power Co., Inc. | | |
American Water Works Co., Inc. | | |
| | |
| | |
| | |
| | |
| | |
Consolidated Edison, Inc. | | |
Constellation Energy Corp. | | |
| | |
| | |
| | |
| | |
| | |
Essential Utilities, Inc. | | |
| | |
| | |
| | |
| | |
Hawaiian Electric Industries, Inc. | | |
| | |
| | |
New Jersey Resources Corp. | | |
| | |
| | |
| | |
| | |
| | |
| | |
| | |
Pinnacle West Capital Corp. | | |
| | |
Portland General Electric Co. | | |
| | |
Public Service Enterprise Group, Inc. | | |
| | |
Southwest Gas Holdings, Inc. | | |
| | |
| | |
| | |
| | |
| | |
| | |
| | |
| | |
Total Common Stocks
(Cost $3,259,524,977) | |
| | |
SHORT-TERM INVESTMENTS 0.3% OF NET ASSETS |
|
|
State Street Institutional U.S. Government Money Market Fund, Premier Class 4.76% (d) | | |
State Street Institutional U.S. Government Money Market Fund, Premier Class 4.76% (d)(e) | | |
| | |
Total Short-Term Investments
(Cost $41,711,309) | |
Total Investments in Securities
(Cost $3,301,236,286) | |
| | | CURRENT VALUE/
UNREALIZED
APPRECIATION
($) |
|
| | | |
S&P 500 Index, e-mini, expires 06/16/23 | | | |
| Non-income producing security. |
| All or a portion of this security is on loan. Securities on loan were valued at $9,986,517. |
| First Republic Bank was placed into receivership with the Federal Deposit Insurance Corp. due to inadequate liquidity and insolvency on May 1, 2023 and the position has subsequently been sold. |
| Issuer is affiliated with the fund’s investment adviser. |
| The rate shown is the annualized 7-day yield. |
| Security purchased with cash collateral received for securities on loan. |
| Real Estate Investment Trust |
Below is a summary of the fund’s transactions with affiliated issuers during the period ended April 30, 2023:
| | | | | NET CHANGE IN UNREALIZED APPRECIATION (DEPRECIATION) | | BALANCE OF SHARES HELD AT 4/30/23 | |
COMMON STOCKS 0.2% OF NET ASSETS |
|
|
| | | | | | | | |
40Schwab Equity Index Funds | Semiannual Report
Portfolio Holdings as of April 30, 2023 (Unaudited) (continued)
The following is a summary of the inputs used to value the fund’s investments as of April 30, 2023 (see financial note 2(a) for additional information):
| QUOTED PRICES IN
ACTIVE MARKETS FOR
IDENTICAL ASSETS
(LEVEL 1) | OTHER SIGNIFICANT
OBSERVABLE INPUTS
(LEVEL 2) | SIGNIFICANT
UNOBSERVABLE INPUTS
(LEVEL 3) | |
| | | | |
| | | | |
| | | | |
| | | | |
| | | | |
| As categorized in the Portfolio Holdings. |
| Futures contracts are reported at cumulative unrealized appreciation or depreciation. |
Fund investments in mutual funds are classified as Level 1, without consideration to the classification level of the underlying
securities held by the mutual funds, which could be Level 1, Level 2 or Level 3.
Schwab Equity Index Funds | Semiannual Report41
Statement of Assets and Liabilities
As of April 30, 2023; unaudited
|
Investments in securities, at value - affiliated (cost $5,326,629) | | |
Investments in securities, at value - unaffiliated (cost $3,295,909,657) including securities on loan of $9,986,517 | | |
| | |
Deposit with broker for futures contracts | | |
| | |
| | |
| | |
Variation margin on future contracts | | |
Income from securities on loan | | |
| | |
|
|
Collateral held for securities on loan | | |
| | |
| | |
| | |
| | |
| | |
|
|
Capital received from investors | | |
Total distributable earnings | | |
| | |
42Schwab Equity Index Funds | Semiannual Report
Statement of Operations
For the period November 1, 2022 through April 30, 2023; unaudited |
|
Dividends received from securities - unaffiliated (net of foreign withholding tax of $26,398) | | |
Dividends received from securities - affiliated | | |
| | |
| | |
|
|
| | |
| | |
| | |
|
REALIZED AND UNREALIZED GAINS (LOSSES) |
Net realized losses on sales of securities - affiliated | | |
Net realized losses on sales of securities - unaffiliated | | |
Net realized gains on sales of in-kind redemptions - unaffiliated | | |
Net realized gains on futures contracts | | |
| | |
Net change in unrealized appreciation (depreciation) on securities - affiliated | | |
Net change in unrealized appreciation (depreciation) on securities - unaffiliated | | |
Net change in unrealized appreciation (depreciation) on futures contracts | | |
Net change in unrealized appreciation (depreciation) | | |
Net realized and unrealized gains | | |
Increase in net assets resulting from operations | | |
Schwab Equity Index Funds | Semiannual Report43
Statement of Changes in Net Assets
For the current and prior report periods
Figures for the current period are unaudited
|
| | |
| | | |
| | | |
Net change in unrealized appreciation (depreciation) | | | |
Increase (decrease) in net assets resulting from operations | | | |
|
DISTRIBUTIONS TO SHAREHOLDERS |
| | | |
TRANSACTIONS IN FUND SHARES |
| | |
| | | | | |
| | | | | |
| | | | | |
| | | | | |
Net transactions in fund shares | | | | | |
|
SHARES OUTSTANDING AND NET ASSETS |
| | |
| | | | | |
| | | | | |
Total increase (decrease) | | | | | |
| | | | | |
44Schwab Equity Index Funds | Semiannual Report
Schwab Small-Cap Index Fund
Financial Statements
| | | | | | |
|
Net asset value at beginning of period | | | | | | |
Income (loss) from investment operations: | | | | | | |
Net investment income (loss)1 | | | | | | |
Net realized and unrealized gains (losses) | | | | | | |
Total from investment operations | | | | | | |
| | | | | | |
Distributions from net investment income | | | | | | |
Distributions from net realized gains | | | | | | |
| | | | | | |
Net asset value at end of period | | | | | | |
| | | | | | |
|
Ratios to average net assets: | | | | | | |
| | | | | | |
Net investment income (loss) | | | | | | |
| | | | | | |
Net assets, end of period (x 1,000,000) | | | | | | |
| |
| Calculated based on the average shares outstanding during the period. |
| |
| |
| Ratio includes less than 0.005% of non-routine proxy expenses. |
| Effective December 20, 2018, the annual operating expense ratio was reduced to 0.04%. The ratio presented for period ended 10/31/19 is a blended ratio. |
| Portfolio turnover rate excludes in-kind transactions. |
Schwab Equity Index Funds | Semiannual Report45
Schwab Small-Cap Index Fund
Portfolio Holdings as of April 30, 2023 (Unaudited)
This section shows all the securities in the fund’s portfolio and their values as of the report date.
The fund files its complete schedule of portfolio holdings with the U.S. Securities and Exchange Commission (SEC) for the first and third quarters of each fiscal year on Form N-PORT Part F. The fund’s Form N-PORT Part F is available on the SEC’s website at www.sec.gov. You can also obtain this information at no cost on the fund’s website at www.schwabassetmanagement.com/schwabfunds_prospectus, by calling 1-866-414-6349, or by sending an email request to orders@mysummaryprospectus.com. The fund also makes available its complete schedule of portfolio holdings 15 to 20 days after the end of the month on the fund’s website.
| | |
COMMON STOCKS 99.5% OF NET ASSETS |
|
Automobiles & Components 1.6% |
| | |
American Axle & Manufacturing Holdings, Inc. * | | |
| | |
Cenntro Electric Group Ltd. * | | |
| | |
| | |
Faraday Future Intelligent Electric, Inc. * | | |
| | |
Fox Factory Holding Corp. * | | |
| | |
| | |
| | |
Lordstown Motors Corp., Class A *(a) | | |
Luminar Technologies, Inc. *(a) | | |
Modine Manufacturing Co. * | | |
Motorcar Parts of America, Inc. * | | |
Mullen Automotive, Inc. *(a) | | |
| | |
| | |
Standard Motor Products, Inc. | | |
| | |
The Goodyear Tire & Rubber Co. * | | |
| | |
Winnebago Industries, Inc. | | |
Workhorse Group, Inc. *(a) | | |
| | |
| | |
|
|
| | |
| | |
Amalgamated Financial Corp. | | |
| | |
American National Bankshares, Inc. | | |
| | |
| | |
| | |
Atlantic Union Bankshares Corp. | | |
| | |
| | |
| | |
| | |
| | |
| | |
Bankwell Financial Group, Inc. | | |
| | |
| | |
| | |
| | |
Berkshire Hills Bancorp, Inc. | | |
| | |
Blue Ridge Bankshares, Inc. | | |
| | |
Bridgewater Bancshares, Inc. * | | |
| | |
Business First Bancshares, Inc. | | |
| | |
| | |
| | |
| | |
| | |
Capital City Bank Group, Inc. | | |
Capitol Federal Financial, Inc. | | |
Capstar Financial Holdings, Inc. | | |
Carter Bankshares, Inc. * | | |
| | |
Central Pacific Financial Corp. | | |
Citizens & Northern Corp. | | |
| | |
| | |
| | |
Coastal Financial Corp. * | | |
| | |
Columbia Financial, Inc. * | | |
Community Bank System, Inc. | | |
Community Trust Bancorp, Inc. | | |
| | |
CrossFirst Bankshares, Inc. * | | |
Customers Bancorp, Inc. * | | |
| | |
Dime Community Bancshares, Inc. | | |
| | |
| | |
| | |
Enterprise Financial Services Corp. | | |
Equity Bancshares, Inc., Class A | | |
Esquire Financial Holdings, Inc. | | |
Farmers & Merchants Bancorp, Inc. | | |
Farmers National Banc Corp. | | |
| | |
Financial Institutions, Inc. | | |
| | |
First Bancorp/Southern Pines NC | | |
| | |
| | |
First Business Financial Services, Inc. | | |
First Commonwealth Financial Corp. | | |
First Community Bankshares, Inc. | | |
| | |
First Financial Bankshares, Inc. | | |
| | |
| | |
First Guaranty Bancshares, Inc. | | |
| | |
First Interstate BancSystem, Inc., Class A | | |
| | |
First Mid Bancshares, Inc. | | |
First Western Financial, Inc. * | | |
| | |
| | |
46Schwab Equity Index Funds | Semiannual Report
Schwab Small-Cap Index Fund
Portfolio Holdings as of April 30, 2023 (Unaudited) (continued)
| | |
| | |
| | |
German American Bancorp, Inc. | | |
| | |
Great Southern Bancorp, Inc. | | |
Greene County Bancorp, Inc. | | |
Guaranty Bancshares, Inc. | | |
| | |
| | |
| | |
| | |
Heartland Financial USA, Inc. | | |
| | |
| | |
| | |
| | |
| | |
| | |
HomeTrust Bancshares, Inc. | | |
| | |
| | |
| | |
Independent Bank Corp., Michigan | | |
Independent Bank Group, Inc. | | |
International Bancshares Corp. | | |
John Marshall Bancorp, Inc. | | |
| | |
| | |
| | |
Live Oak Bancshares, Inc. | | |
| | |
| | |
| | |
Metrocity Bankshares, Inc. | | |
Metropolitan Bank Holding Corp. * | | |
| | |
Midland States Bancorp, Inc. | | |
MidWestOne Financial Group, Inc. | | |
| | |
National Bank Holdings Corp., Class A | | |
| | |
Nicolet Bankshares, Inc. * | | |
| | |
| | |
Northwest Bancshares, Inc. | | |
OceanFirst Financial Corp. | | |
| | |
| | |
| | |
| | |
Orrstown Financial Services, Inc. | | |
Pacific Premier Bancorp, Inc. | | |
| | |
| | |
| | |
| | |
Peapack-Gladstone Financial Corp. | | |
| | |
Peoples Financial Services Corp. | | |
| | |
| | |
| | |
| | |
| | |
Provident Financial Services, Inc. | | |
| | |
| | |
Red River Bancshares, Inc. | | |
| | |
| | |
Republic Bancorp, Inc., Class A | | |
Republic First Bancorp, Inc. *(a) | | |
| | |
Sandy Spring Bancorp, Inc. | | |
Seacoast Banking Corp. of Florida | | |
ServisFirst Bancshares, Inc. | | |
| | |
| | |
Simmons First National Corp., Class A | | |
| | |
South Plains Financial, Inc. | | |
Southern First Bancshares, Inc. * | | |
Southern Missouri Bancorp, Inc. | | |
Southside Bancshares, Inc. | | |
| | |
| | |
| | |
Stock Yards Bancorp, Inc. | | |
Summit Financial Group, Inc. | | |
Texas Capital Bancshares, Inc. * | | |
| | |
The Bank of N.T. Butterfield & Son Ltd. | | |
| | |
The First Bancshares, Inc. | | |
The First of Long Island Corp. | | |
The Hingham Institution For Savings | | |
Third Coast Bancshares, Inc. * | | |
| | |
| | |
| | |
| | |
| | |
| | |
| | |
| | |
United Community Banks, Inc. | | |
| | |
| | |
USCB Financial Holdings, Inc. * | | |
| | |
| | |
| | |
Washington Trust Bancorp, Inc. | | |
| | |
| | |
| | |
| | |
| | |
|
|
| | |
| | |
| | |
Aerojet Rocketdyne Holdings, Inc. * | | |
| | |
| | |
| | |
Albany International Corp., Class A | | |
Allied Motion Technologies, Inc. | | |
Alta Equipment Group, Inc. | | |
Ameresco, Inc., Class A * | | |
American Woodmark Corp. * | | |
| | |
| | |
Applied Industrial Technologies, Inc. | | |
Archer Aviation, Inc., Class A * | | |
Schwab Equity Index Funds | Semiannual Report47
Schwab Small-Cap Index Fund
Portfolio Holdings as of April 30, 2023 (Unaudited) (continued)
| | |
| | |
| | |
Array Technologies, Inc. * | | |
| | |
| | |
| | |
| | |
| | |
Babcock & Wilcox Enterprises, Inc. * | | |
| | |
Beacon Roofing Supply, Inc. * | | |
| | |
| | |
Bloom Energy Corp., Class A * | | |
| | |
BlueLinx Holdings, Inc. * | | |
| | |
Brookfield Business Corp., Class A | | |
| | |
| | |
| | |
CIRCOR International, Inc. * | | |
| | |
Comfort Systems USA, Inc. | | |
Concrete Pumping Holdings, Inc. * | | |
Construction Partners, Inc., Class A * | | |
| | |
Custom Truck One Source, Inc. * | | |
Desktop Metal, Inc., Class A *(a) | | |
Distribution Solutions Group, Inc. * | | |
| | |
| | |
| | |
| | |
| | |
| | |
| | |
Energy Vault Holdings, Inc. *(a) | | |
| | |
| | |
| | |
| | |
| | |
| | |
Evoqua Water Technologies Corp. * | | |
Fathom Digital Manufacturing Corp., Class A * | | |
| | |
| | |
| | |
Franklin Electric Co., Inc. | | |
| | |
| | |
| | |
Gibraltar Industries, Inc. * | | |
| | |
| | |
GrafTech International Ltd. | | |
Granite Construction, Inc. | | |
Great Lakes Dredge & Dock Corp. * | | |
| | |
H&E Equipment Services, Inc. | | |
| | |
Helios Technologies, Inc. | | |
| | |
| | |
Hillman Solutions Corp. * | | |
Hudson Technologies, Inc. * | | |
| | |
Hydrofarm Holdings Group, Inc. * | | |
| | |
Hyster-Yale Materials Handling, Inc. | | |
| | |
| | |
| | |
Janus International Group, Inc. * | | |
| | |
John Bean Technologies Corp. | | |
| | |
| | |
| | |
| | |
Kratos Defense & Security Solutions, Inc. * | | |
Lightning eMotors, Inc. * | | |
| | |
| | |
Markforged Holding Corp. * | | |
Masonite International Corp. * | | |
| | |
| | |
Microvast Holdings, Inc. * | | |
| | |
| | |
| | |
| | |
| | |
Mueller Water Products, Inc., Class A | | |
| | |
National Presto Industries, Inc. | | |
NEXTracker, Inc., Class A * | | |
| | |
| | |
| | |
| | |
| | |
| | |
| | |
| | |
| | |
Preformed Line Products Co. | | |
| | |
| | |
| | |
Quanex Building Products Corp. | | |
| | |
| | |
Resideo Technologies, Inc. * | | |
| | |
| | |
Rush Enterprises, Inc., Class A | | |
Rush Enterprises, Inc., Class B | | |
Sarcos Technology and Robotics Corp. * | | |
Shoals Technologies Group, Inc., Class A * | | |
Simpson Manufacturing Co., Inc. | | |
| | |
Standex International Corp. | | |
| | |
Sterling Infrastructure, Inc. * | | |
| | |
| | |
| | |
Terran Orbital Corp. *(a) | | |
Textainer Group Holdings Ltd. | | |
| | |
The Greenbrier Cos., Inc. | | |
48Schwab Equity Index Funds | Semiannual Report
Schwab Small-Cap Index Fund
Portfolio Holdings as of April 30, 2023 (Unaudited) (continued)
| | |
The Manitowoc Co., Inc. * | | |
| | |
Thermon Group Holdings, Inc. * | | |
Titan International, Inc. * | | |
| | |
| | |
| | |
| | |
Triton International Ltd. | | |
| | |
| | |
| | |
| | |
| | |
| | |
| | |
| | |
Virgin Galactic Holdings, Inc. *(a) | | |
| | |
Watts Water Technologies, Inc., Class A | | |
| | |
| | |
Zurn Elkay Water Solutions Corp. | | |
| | |
|
Commercial & Professional Services 3.9% |
| | |
| | |
ACV Auctions, Inc., Class A * | | |
| | |
Aris Water Solution, Inc., Class A | | |
| | |
Barrett Business Services, Inc. | | |
| | |
BrightView Holdings, Inc. * | | |
Casella Waste Systems, Inc., Class A * | | |
| | |
| | |
CompX International, Inc. | | |
| | |
| | |
| | |
CSG Systems International, Inc. | | |
| | |
| | |
ExlService Holdings, Inc. * | | |
| | |
| | |
Forrester Research, Inc. * | | |
| | |
| | |
Healthcare Services Group, Inc. | | |
Heidrick & Struggles International, Inc. | | |
Heritage-Crystal Clean, Inc. * | | |
HireRight Holdings Corp. * | | |
| | |
Huron Consulting Group, Inc. * | | |
| | |
| | |
| | |
| | |
KAR Auction Services, Inc. * | | |
Kelly Services, Inc., Class A | | |
| | |
Kimball International, Inc., Class B | | |
| | |
| | |
| | |
Li-Cycle Holdings Corp. *(a) | | |
Liquidity Services, Inc. * | | |
Matthews International Corp., Class A | | |
| | |
| | |
Montrose Environmental Group, Inc. * | | |
| | |
| | |
| | |
| | |
| | |
| | |
Resources Connection, Inc. | | |
| | |
| | |
| | |
| | |
| | |
| | |
| | |
| | |
| | |
| | |
| | |
| | |
| | |
| | |
| | |
| | |
| | |
|
Consumer Discretionary Distribution & Retail 2.7% |
1-800-Flowers.com, Inc., Class A * | | |
| | |
Abercrombie & Fitch Co., Class A * | | |
Academy Sports & Outdoors, Inc. | | |
aka Brands Holding Corp. * | | |
American Eagle Outfitters, Inc. | | |
America's Car-Mart, Inc. * | | |
| | |
Asbury Automotive Group, Inc. * | | |
| | |
Big 5 Sporting Goods Corp. (a) | | |
| | |
Boot Barn Holdings, Inc. * | | |
Build-A-Bear Workshop, Inc. | | |
| | |
Camping World Holdings, Inc., Class A (a) | | |
| | |
| | |
| | |
| | |
ContextLogic, Inc., Class A *(a) | | |
Designer Brands, Inc., Class A | | |
Destination XL Group, Inc. * | | |
| | |
Duluth Holdings, Inc., Class B * | | |
| | |
| | |
| | |
| | |
| | |
| | |
| | |
| | |
| | |
Schwab Equity Index Funds | Semiannual Report49
Schwab Small-Cap Index Fund
Portfolio Holdings as of April 30, 2023 (Unaudited) (continued)
| | |
| | |
Haverty Furniture Cos., Inc. | | |
| | |
| | |
| | |
LL Flooring Holdings, Inc. * | | |
Lulu's Fashion Lounge Holdings, Inc. *(a) | | |
| | |
| | |
| | |
National Vision Holdings, Inc. * | | |
OneWater Marine, Inc., Class A * | | |
| | |
| | |
Qurate Retail, Inc., Series A * | | |
Rent the Runway, Inc., Class A *(a) | | |
| | |
RumbleON, Inc., Class B * | | |
Sally Beauty Holdings, Inc. * | | |
| | |
| | |
| | |
Sonic Automotive, Inc., Class A | | |
Sportsman's Warehouse Holdings, Inc. * | | |
Stitch Fix, Inc., Class A * | | |
| | |
| | |
| | |
The Children's Place, Inc. * | | |
The Container Store Group, Inc. * | | |
| | |
| | |
| | |
Tile Shop Holdings, Inc. * | | |
| | |
Torrid Holdings, Inc. *(a) | | |
TravelCenters of America, Inc. * | | |
| | |
| | |
Warby Parker, Inc., Class A * | | |
| | |
| | |
| | |
| | |
|
Consumer Durables & Apparel 3.3% |
| | |
Allbirds, Inc., Class A *(a) | | |
| | |
| | |
| | |
| | |
Century Communities, Inc. | | |
| | |
| | |
Dream Finders Homes, Inc., Class A * | | |
| | |
Ethan Allen Interiors, Inc. | | |
| | |
G-III Apparel Group Ltd. * | | |
| | |
Green Brick Partners, Inc. * | | |
| | |
Hovnanian Enterprises, Inc., Class A * | | |
Installed Building Products, Inc. | | |
| | |
Johnson Outdoors, Inc., Class A | | |
| | |
| | |
| | |
| | |
| | |
| | |
| | |
| | |
| | |
| | |
| | |
Malibu Boats, Inc., Class A * | | |
| | |
MasterCraft Boat Holdings, Inc. * | | |
| | |
| | |
| | |
| | |
| | |
| | |
| | |
Smith & Wesson Brands, Inc. | | |
Snap One Holdings Corp. * | | |
Solo Brands, Inc., Class A * | | |
| | |
| | |
| | |
Superior Group of Cos., Inc. | | |
Taylor Morrison Home Corp. * | | |
| | |
Topgolf Callaway Brands Corp. * | | |
| | |
| | |
Tupperware Brands Corp. * | | |
| | |
Universal Electronics, Inc. * | | |
| | |
Vizio Holding Corp., Class A * | | |
| | |
Wolverine World Wide, Inc. | | |
| | |
|
|
| | |
Accel Entertainment, Inc. * | | |
Adtalem Global Education, Inc. * | | |
American Public Education, Inc. * | | |
| | |
Biglari Holdings, Inc., Class B * | | |
| | |
| | |
Bluegreen Vacations Holding Corp. | | |
| | |
Brinker International, Inc. * | | |
| | |
| | |
| | |
| | |
| | |
Cracker Barrel Old Country Store, Inc. | | |
Dave & Buster's Entertainment, Inc. * | | |
| | |
| | |
| | |
El Pollo Loco Holdings, Inc. | | |
European Wax Center, Inc., Class A * | | |
| | |
F45 Training Holdings, Inc. * | | |
50Schwab Equity Index Funds | Semiannual Report
Schwab Small-Cap Index Fund
Portfolio Holdings as of April 30, 2023 (Unaudited) (continued)
| | |
First Watch Restaurant Group, Inc. * | | |
| | |
Full House Resorts, Inc. * | | |
Golden Entertainment, Inc. * | | |
Graham Holdings Co., Class B | | |
Hilton Grand Vacations, Inc. * | | |
| | |
Inspired Entertainment, Inc. * | | |
International Game Technology plc | | |
| | |
| | |
Kura Sushi USA, Inc., Class A * | | |
| | |
Life Time Group Holdings, Inc. * | | |
| | |
Lindblad Expeditions Holdings, Inc. * | | |
Monarch Casino & Resort, Inc. | | |
| | |
| | |
| | |
OneSpaWorld Holdings Ltd. * | | |
Papa John's International, Inc. | | |
Perdoceo Education Corp. * | | |
Portillo's, Inc., Class A * | | |
RCI Hospitality Holdings, Inc. | | |
Red Rock Resorts, Inc., Class A | | |
| | |
Rush Street Interactive, Inc. * | | |
Ruth's Hospitality Group, Inc. | | |
| | |
SeaWorld Entertainment, Inc. * | | |
Shake Shack, Inc., Class A * | | |
Sonder Holdings, Inc. *(a) | | |
Strategic Education, Inc. | | |
| | |
Sweetgreen, Inc., Class A * | | |
Target Hospitality Corp. * | | |
| | |
The Beachbody Co., Inc. * | | |
The Cheesecake Factory, Inc. | | |
The ONE Group Hospitality, Inc. * | | |
| | |
Universal Technical Institute, Inc. * | | |
| | |
| | |
| | |
Xponential Fitness, Inc., Class A * | | |
| | |
|
Consumer Staples Distribution & Retail 0.6% |
| | |
Ingles Markets, Inc., Class A | | |
Natural Grocers by Vitamin Cottage, Inc. | | |
| | |
| | |
| | |
Sprouts Farmers Market, Inc. * | | |
| | |
The Chefs' Warehouse, Inc. * | | |
United Natural Foods, Inc. * | | |
Village Super Market, Inc., Class A | | |
| | |
| | |
|
| | |
|
| | |
| | |
| | |
| | |
| | |
| | |
| | |
| | |
| | |
| | |
California Resources Corp. | | |
| | |
Centrus Energy Corp., Class A * | | |
| | |
| | |
| | |
Clean Energy Fuels Corp. * | | |
| | |
| | |
| | |
Crescent Energy Co., Class A | | |
| | |
| | |
| | |
| | |
Diamond Offshore Drilling, Inc. * | | |
| | |
| | |
| | |
Earthstone Energy, Inc., Class A * | | |
| | |
| | |
Equitrans Midstream Corp. | | |
Excelerate Energy, Inc., Class A | | |
Expro Group Holdings N.V. * | | |
| | |
| | |
| | |
| | |
| | |
| | |
Helix Energy Solutions Group, Inc. * | | |
| | |
| | |
International Seaways, Inc. | | |
| | |
| | |
| | |
Magnolia Oil & Gas Corp., Class A | | |
| | |
| | |
| | |
NACCO Industries, Inc., Class A | | |
Newpark Resources, Inc. * | | |
| | |
NexTier Oilfield Solutions, Inc. * | | |
| | |
Nordic American Tankers Ltd. | | |
Northern Oil and Gas, Inc. | | |
Oceaneering International, Inc. * | | |
Oil States International, Inc. * | | |
Par Pacific Holdings, Inc. * | | |
Patterson-UTI Energy, Inc. | | |
PBF Energy, Inc., Class A | | |
| | |
| | |
Schwab Equity Index Funds | Semiannual Report51
Schwab Small-Cap Index Fund
Portfolio Holdings as of April 30, 2023 (Unaudited) (continued)
| | |
ProFrac Holding Corp., Class A * | | |
| | |
Ranger Oil Corp., Class A | | |
REX American Resources Corp. * | | |
Riley Exploration Permian, Inc. | | |
| | |
| | |
| | |
| | |
Select Energy Services, Inc., Class A | | |
| | |
SilverBow Resources, Inc. * | | |
Sitio Royalties Corp., Class A | | |
| | |
Solaris Oilfield Infrastructure, Inc., Class A | | |
| | |
| | |
Teekay Tankers Ltd., Class A * | | |
| | |
TETRA Technologies, Inc. * | | |
| | |
| | |
| | |
US Silica Holdings, Inc. * | | |
| | |
| | |
| | |
| | |
| | |
Weatherford International plc * | | |
World Fuel Services Corp. | | |
| | |
|
Equity Real Estate Investment Trusts (REITs) 5.6% |
| | |
| | |
Alexander & Baldwin, Inc. | | |
| | |
American Assets Trust, Inc. | | |
Apartment Investment & Management Co., Class A | | |
Apple Hospitality REIT, Inc. | | |
Armada Hoffler Properties, Inc. | | |
Ashford Hospitality Trust, Inc. * | | |
Bluerock Homes Trust, Inc. * | | |
Braemar Hotels & Resorts, Inc. | | |
| | |
Broadstone Net Lease, Inc. | | |
| | |
| | |
CBL & Associates Properties, Inc. | | |
| | |
| | |
| | |
| | |
Community Healthcare Trust, Inc. | | |
Corporate Office Properties Trust | | |
| | |
DiamondRock Hospitality Co. | | |
Diversified Healthcare Trust | | |
Easterly Government Properties, Inc. | | |
| | |
Empire State Realty Trust, Inc., Class A | | |
| | |
Essential Properties Realty Trust, Inc. | | |
| | |
| | |
Four Corners Property Trust, Inc. | | |
Franklin Street Properties Corp. | | |
| | |
Gladstone Commercial Corp. | | |
| | |
Global Medical REIT, Inc. | | |
| | |
Hersha Hospitality Trust, Class A | | |
Independence Realty Trust, Inc. | | |
| | |
Industrial Logistics Properties Trust | | |
Innovative Industrial Properties, Inc. | | |
InvenTrust Properties Corp. | | |
| | |
| | |
| | |
National Health Investors, Inc. | | |
| | |
NexPoint Residential Trust, Inc. | | |
Office Properties Income Trust | | |
One Liberty Properties, Inc. | | |
| | |
| | |
| | |
| | |
Phillips Edison & Co., Inc. | | |
| | |
Piedmont Office Realty Trust, Inc., Class A | | |
Plymouth Industrial REIT, Inc. | | |
Postal Realty Trust, Inc., Class A | | |
| | |
Retail Opportunity Investments Corp. | | |
| | |
| | |
Ryman Hospitality Properties, Inc. | | |
Sabra Health Care REIT, Inc. | | |
| | |
| | |
| | |
| | |
| | |
| | |
Summit Hotel Properties, Inc. | | |
Sunstone Hotel Investors, Inc. | | |
Tanger Factory Outlet Centers, Inc. | | |
| | |
| | |
The Necessity Retail REIT, Inc. | | |
| | |
| | |
Universal Health Realty Income Trust | | |
| | |
Urstadt Biddle Properties, Inc., Class A | | |
Veris Residential, Inc. * | | |
| | |
Xenia Hotels & Resorts, Inc. | | |
| | |
|
|
| | |
| | |
A-Mark Precious Metals, Inc. | | |
Angel Oak Mortgage, Inc. (a) | | |
Apollo Commercial Real Estate Finance, Inc. | | |
Arbor Realty Trust, Inc. (a) | | |
52Schwab Equity Index Funds | Semiannual Report
Schwab Small-Cap Index Fund
Portfolio Holdings as of April 30, 2023 (Unaudited) (continued)
| | |
Ares Commercial Real Estate Corp. | | |
ARMOUR Residential REIT, Inc. | | |
Artisan Partners Asset Management, Inc., Class A | | |
Assetmark Financial Holdings, Inc. * | | |
Associated Capital Group, Inc., Class A | | |
Atlanticus Holdings Corp. * | | |
| | |
AvidXchange Holdings, Inc. * | | |
B. Riley Financial, Inc. (a) | | |
Bakkt Holdings, Inc. *(a) | | |
Banco Latinoamericano de Comercio Exterior S.A., Class E | | |
BGC Partners, Inc., Class A | | |
Blackstone Mortgage Trust, Inc., Class A | | |
Bread Financial Holdings, Inc. | | |
Brightsphere Investment Group, Inc. | | |
BrightSpire Capital, Inc. | | |
Broadmark Realty Capital, Inc. | | |
| | |
| | |
Cass Information Systems, Inc. | | |
Chicago Atlantic Real Estate Finance, Inc. | | |
| | |
Claros Mortgage Trust, Inc. | | |
| | |
Compass Diversified Holdings | | |
Consumer Portfolio Services, Inc. * | | |
Curo Group Holdings Corp. | | |
Diamond Hill Investment Group, Inc. | | |
Donnelley Financial Solutions, Inc. * | | |
| | |
Ellington Financial, Inc. | | |
| | |
Encore Capital Group, Inc. * | | |
Enova International, Inc. * | | |
| | |
| | |
| | |
Federal Agricultural Mortgage Corp., Class C | | |
| | |
Finance Of America Cos., Inc., Class A * | | |
| | |
| | |
Focus Financial Partners, Inc., Class A * | | |
Franklin BSP Realty Trust, Inc. | | |
GCM Grosvenor, Inc., Class A | | |
Granite Point Mortgage Trust, Inc. | | |
Green Dot Corp., Class A * | | |
Hamilton Lane, Inc., Class A | | |
Hannon Armstrong Sustainable Infrastructure Capital, Inc. | | |
| | |
| | |
I3 Verticals, Inc., Class A * | | |
International Money Express, Inc. * | | |
Invesco Mortgage Capital, Inc. | | |
Jackson Financial, Inc., Class A | | |
KKR Real Estate Finance Trust, Inc. | | |
Ladder Capital Corp. REIT | | |
| | |
| | |
| | |
| | |
| | |
| | |
| | |
| | |
MoneyGram International, Inc. * | | |
| | |
| | |
| | |
| | |
NerdWallet, Inc., Class A * | | |
New York Mortgage Trust, Inc. | | |
Nexpoint Real Estate Finance, Inc. | | |
NMI Holdings, Inc., Class A * | | |
Open Lending Corp., Class A * | | |
Oportun Financial Corp. * | | |
Oppenheimer Holdings, Inc., Class A | | |
| | |
Orchid Island Capital, Inc. | | |
| | |
| | |
PennyMac Financial Services, Inc. | | |
PennyMac Mortgage Investment Trust | | |
Perella Weinberg Partners, Class A | | |
| | |
PJT Partners, Inc., Class A | | |
| | |
Priority Technology Holdings, Inc. * | | |
| | |
| | |
| | |
| | |
Regional Management Corp. | | |
| | |
| | |
Sculptor Capital Management, Inc. | | |
Silvercrest Asset Management Group, Inc., Class A | | |
StepStone Group, Inc., Class A | | |
| | |
| | |
Sunlight Financial Holdings, Inc. * | | |
| | |
TPG RE Finance Trust, Inc. | | |
Two Harbors Investment Corp. | | |
| | |
Velocity Financial, Inc. * | | |
Victory Capital Holdings, Inc., Class A | | |
Virtus Investment Partners, Inc. | | |
| | |
Waterstone Financial, Inc. | | |
| | |
| | |
| | |
|
Food, Beverage & Tobacco 2.1% |
22nd Century Group, Inc. * | | |
| | |
| | |
| | |
| | |
| | |
Brookfield Realty Capital Corp., Class A *(a) | | |
| | |
| | |
| | |
Coca-Cola Consolidated, Inc. | | |
Fresh Del Monte Produce, Inc. | | |
| | |
Schwab Equity Index Funds | Semiannual Report53
Schwab Small-Cap Index Fund
Portfolio Holdings as of April 30, 2023 (Unaudited) (continued)
| | |
| | |
John B. Sanfilippo & Son, Inc. | | |
| | |
Lifecore Biomedical, Inc. * | | |
| | |
| | |
| | |
National Beverage Corp. * | | |
| | |
Seneca Foods Corp., Class A * | | |
| | |
| | |
| | |
The Duckhorn Portfolio, Inc. * | | |
The Hain Celestial Group, Inc. * | | |
The Simply Good Foods Co. * | | |
The Vita Coco Co., Inc. * | | |
Tootsie Roll Industries, Inc. | | |
| | |
Turning Point Brands, Inc. | | |
| | |
| | |
| | |
Vintage Wine Estates, Inc. * | | |
| | |
Whole Earth Brands, Inc. * | | |
| | |
|
Health Care Equipment & Services 7.3% |
23andMe Holding Co., Class A * | | |
| | |
| | |
| | |
| | |
AirSculpt Technologies, Inc. (a) | | |
Alignment Healthcare, Inc. * | | |
Alphatec Holdings, Inc. * | | |
American Well Corp., Class A * | | |
AMN Healthcare Services, Inc. * | | |
| | |
Apollo Medical Holdings, Inc. * | | |
| | |
ATI Physical Therapy, Inc. * | | |
| | |
| | |
| | |
Aveanna Healthcare Holdings, Inc. * | | |
| | |
| | |
Babylon Holdings Ltd., Class A *(a) | | |
Bioventus, Inc., Class A * | | |
Brookdale Senior Living, Inc. * | | |
Butterfly Network, Inc. *(a) | | |
| | |
| | |
Castle Biosciences, Inc. * | | |
| | |
Clover Health Investments Corp. * | | |
Community Health Systems, Inc. * | | |
Computer Programs & Systems, Inc. * | | |
| | |
| | |
Cross Country Healthcare, Inc. * | | |
| | |
| | |
| | |
| | |
| | |
Evolent Health, Inc., Class A * | | |
| | |
| | |
| | |
| | |
| | |
| | |
| | |
| | |
| | |
Hims & Hers Health, Inc. * | | |
| | |
| | |
| | |
Inspire Medical Systems, Inc. * | | |
| | |
| | |
| | |
iRhythm Technologies, Inc. * | | |
Lantheus Holdings, Inc. * | | |
| | |
LifeStance Health Group, Inc. *(a) | | |
| | |
Merit Medical Systems, Inc. * | | |
| | |
| | |
| | |
| | |
National HealthCare Corp. | | |
| | |
| | |
| | |
| | |
NextGen Healthcare, Inc. * | | |
| | |
| | |
OmniAb, Inc., Class A *(b) | | |
OmniAb, Inc., Class B *(b) | | |
| | |
| | |
| | |
Option Care Health, Inc. * | | |
OraSure Technologies, Inc. * | | |
| | |
| | |
| | |
| | |
| | |
P3 Health Partners, Inc. * | | |
| | |
| | |
Pediatrix Medical Group, Inc. * | | |
| | |
| | |
Privia Health Group, Inc. * | | |
PROCEPT BioRobotics Corp. * | | |
| | |
| | |
| | |
| | |
| | |
| | |
Select Medical Holdings Corp. | | |
Senseonics Holdings, Inc. *(a) | | |
| | |
Shockwave Medical, Inc. * | | |
| | |
| | |
54Schwab Equity Index Funds | Semiannual Report
Schwab Small-Cap Index Fund
Portfolio Holdings as of April 30, 2023 (Unaudited) (continued)
| | |
Silk Road Medical, Inc. * | | |
| | |
| | |
| | |
| | |
Tactile Systems Technology, Inc. * | | |
| | |
| | |
| | |
The Oncology Institute, Inc. * | | |
The Pennant Group, Inc. * | | |
TransMedics Group, Inc. * | | |
Treace Medical Concepts, Inc. * | | |
U.S. Physical Therapy, Inc. | | |
| | |
Utah Medical Products, Inc. | | |
| | |
| | |
Vicarious Surgical, Inc. *(a) | | |
| | |
| | |
| | |
| | |
|
Household & Personal Products 1.2% |
| | |
Central Garden & Pet Co. * | | |
Central Garden & Pet Co., Class A * | | |
Edgewell Personal Care Co. | | |
| | |
| | |
Herbalife Nutrition Ltd. * | | |
| | |
| | |
Nature's Sunshine Products, Inc. * | | |
Nu Skin Enterprises, Inc., Class A | | |
| | |
| | |
Thorne HealthTech, Inc. * | | |
USANA Health Sciences, Inc. * | | |
| | |
| | |
| | |
|
|
Ambac Financial Group, Inc. * | | |
American Equity Investment Life Holding Co. | | |
| | |
Argo Group International Holdings Ltd. | | |
Bright Health Group, Inc. * | | |
BRP Group, Inc., Class A * | | |
CNO Financial Group, Inc. | | |
| | |
Donegal Group, Inc., Class A | | |
| | |
| | |
| | |
Genworth Financial, Inc., Class A * | | |
Goosehead Insurance, Inc., Class A * | | |
Greenlight Capital Re Ltd., Class A * | | |
| | |
| | |
Horace Mann Educators Corp. | | |
| | |
James River Group Holdings Ltd. | | |
| | |
Kinsale Capital Group, Inc. | | |
| | |
| | |
| | |
National Western Life Group, Inc., Class A | | |
| | |
Oscar Health, Inc., Class A * | | |
| | |
| | |
| | |
| | |
Safety Insurance Group, Inc. | | |
Selective Insurance Group, Inc. | | |
| | |
| | |
Skyward Specialty Insurance Group, Inc. * | | |
Stewart Information Services Corp. | | |
| | |
| | |
| | |
Universal Insurance Holdings, Inc. | | |
| | |
|
|
5E Advanced Materials, Inc. *(a) | | |
| | |
Alpha Metallurgical Resources, Inc. | | |
| | |
| | |
| | |
| | |
| | |
| | |
| | |
| | |
| | |
Carpenter Technology Corp. | | |
| | |
| | |
| | |
| | |
| | |
Compass Minerals International, Inc. | | |
| | |
| | |
Danimer Scientific, Inc. *(a) | | |
| | |
| | |
| | |
| | |
| | |
| | |
| | |
| | |
| | |
Haynes International, Inc. | | |
| | |
Hycroft Mining Holding Corp. * | | |
| | |
| | |
| | |
| | |
| | |
| | |
| | |
Schwab Equity Index Funds | Semiannual Report55
Schwab Small-Cap Index Fund
Portfolio Holdings as of April 30, 2023 (Unaudited) (continued)
| | |
| | |
| | |
| | |
| | |
Minerals Technologies, Inc. | | |
| | |
Novagold Resources, Inc. * | | |
| | |
| | |
| | |
Orion Engineered Carbons S.A. | | |
| | |
Perimeter Solutions S.A. * | | |
| | |
| | |
PureCycle Technologies, Inc. *(a) | | |
| | |
| | |
| | |
Rayonier Advanced Materials, Inc. * | | |
| | |
Schnitzer Steel Industries, Inc., Class A | | |
Sensient Technologies Corp. | | |
| | |
Summit Materials, Inc., Class A * | | |
| | |
| | |
| | |
| | |
| | |
| | |
Tronox Holdings plc, Class A | | |
United States Lime & Minerals, Inc. | | |
| | |
| | |
Worthington Industries, Inc. | | |
| | |
|
Media & Entertainment 1.9% |
AdTheorent Holding Co., Inc. *(a) | | |
Advantage Solutions, Inc. * | | |
AMC Networks, Inc., Class A * | | |
| | |
Boston Omaha Corp., Class A * | | |
| | |
| | |
| | |
| | |
Cinemark Holdings, Inc. * | | |
Clear Channel Outdoor Holdings, Inc. * | | |
Cumulus Media, Inc., Class A * | | |
| | |
| | |
Entravision Communications Corp., Class A | | |
Eventbrite, Inc., Class A * | | |
EverQuote, Inc., Class A * | | |
| | |
Gambling.com Group Ltd. * | | |
| | |
| | |
iHeartMedia, Inc., Class A * | | |
| | |
| | |
Integral Ad Science Holding Corp. * | | |
John Wiley & Sons, Inc., Class A | | |
| | |
| | |
Liberty Media Corp. - Liberty Braves, Class A * | | |
Liberty Media Corp. - Liberty Braves, Class C * | | |
Lions Gate Entertainment Corp., Class A * | | |
Lions Gate Entertainment Corp., Class B * | | |
Madison Square Garden Entertainment Corp. * | | |
| | |
MediaAlpha, Inc., Class A * | | |
| | |
| | |
PubMatic, Inc., Class A * | | |
| | |
Quotient Technology, Inc. * | | |
Reservoir Media, Inc. *(a) | | |
| | |
| | |
Sinclair Broadcast Group, Inc., Class A | | |
| | |
Sphere Entertainment Co. * | | |
| | |
| | |
| | |
The Arena Group Holdings, Inc. * | | |
The E.W. Scripps Co., Class A * | | |
| | |
| | |
| | |
| | |
| | |
| | |
| | |
Vivid Seats, Inc., Class A *(a) | | |
| | |
| | |
| | |
| | |
ZipRecruiter, Inc., Class A * | | |
| | |
|
Pharmaceuticals, Biotechnology & Life Sciences 9.8% |
| | |
4D Molecular Therapeutics, Inc. * | | |
| | |
AbCellera Biologics, Inc. * | | |
| | |
ACADIA Pharmaceuticals, Inc. * | | |
Aclaris Therapeutics, Inc. * | | |
Acrivon Therapeutics, Inc. * | | |
Adaptive Biotechnologies Corp. * | | |
| | |
| | |
Aerovate Therapeutics, Inc. * | | |
| | |
| | |
Agios Pharmaceuticals, Inc. * | | |
Akero Therapeutics, Inc. * | | |
Akoya Biosciences, Inc. * | | |
| | |
| | |
Allogene Therapeutics, Inc. * | | |
| | |
| | |
56Schwab Equity Index Funds | Semiannual Report
Schwab Small-Cap Index Fund
Portfolio Holdings as of April 30, 2023 (Unaudited) (continued)
| | |
Alpine Immune Sciences, Inc. * | | |
ALX Oncology Holdings, Inc. * | | |
Amicus Therapeutics, Inc. * | | |
Amneal Pharmaceuticals, Inc. * | | |
Amphastar Pharmaceuticals, Inc. * | | |
Amylyx Pharmaceuticals, Inc. * | | |
AN2 Therapeutics, Inc. *(a) | | |
| | |
Anavex Life Sciences Corp. *(a) | | |
ANI Pharmaceuticals, Inc. * | | |
Anika Therapeutics, Inc. * | | |
Apellis Pharmaceuticals, Inc. * | | |
Arbutus Biopharma Corp. * | | |
| | |
Arcturus Therapeutics Holdings, Inc. * | | |
Arcus Biosciences, Inc. * | | |
Arcutis Biotherapeutics, Inc. * | | |
Arrowhead Pharmaceuticals, Inc. * | | |
| | |
Atara Biotherapeutics, Inc. * | | |
Atea Pharmaceuticals, Inc. * | | |
| | |
| | |
Aurinia Pharmaceuticals, Inc. * | | |
| | |
Avidity Biosciences, Inc. * | | |
Axsome Therapeutics, Inc. * | | |
Beam Therapeutics, Inc. * | | |
| | |
BioCryst Pharmaceuticals, Inc. * | | |
| | |
BioLife Solutions, Inc. * | | |
Bionano Genomics, Inc. *(a) | | |
Bioxcel Therapeutics, Inc. * | | |
| | |
Blueprint Medicines Corp. * | | |
| | |
| | |
Cara Therapeutics, Inc. * | | |
| | |
Caribou Biosciences, Inc. * | | |
Cassava Sciences, Inc. *(a) | | |
Catalyst Pharmaceuticals, Inc. * | | |
Celldex Therapeutics, Inc. * | | |
| | |
Century Therapeutics, Inc. * | | |
Cerevel Therapeutics Holdings, Inc. * | | |
| | |
Chinook Therapeutics, Inc. * | | |
| | |
Cogent Biosciences, Inc. * | | |
Coherus Biosciences, Inc. * | | |
Collegium Pharmaceutical, Inc. * | | |
Corcept Therapeutics, Inc. * | | |
Crinetics Pharmaceuticals, Inc. * | | |
| | |
| | |
Cullinan Oncology, Inc. * | | |
Cytek Biosciences, Inc. * | | |
| | |
Day One Biopharmaceuticals, Inc. * | | |
Deciphera Pharmaceuticals, Inc. * | | |
Denali Therapeutics, Inc. * | | |
Design Therapeutics, Inc. *(a) | | |
DICE Therapeutics, Inc. * | | |
Dynavax Technologies Corp. * | | |
Dyne Therapeutics, Inc. * | | |
Eagle Pharmaceuticals, Inc. * | | |
| | |
Edgewise Therapeutics, Inc. * | | |
| | |
Eiger BioPharmaceuticals, Inc. * | | |
Emergent BioSolutions, Inc. * | | |
Enanta Pharmaceuticals, Inc. * | | |
Enochian Biosciences, Inc. *(a) | | |
| | |
| | |
Esperion Therapeutics, Inc. * | | |
| | |
EyePoint Pharmaceuticals, Inc. * | | |
Fate Therapeutics, Inc. * | | |
| | |
Foghorn Therapeutics, Inc. * | | |
Fulcrum Therapeutics, Inc. * | | |
| | |
| | |
| | |
GreenLight Biosciences Holdings PBC * | | |
Halozyme Therapeutics, Inc. * | | |
Harmony Biosciences Holdings, Inc. * | | |
Heron Therapeutics, Inc. * | | |
| | |
| | |
| | |
Ideaya Biosciences, Inc. * | | |
IGM Biosciences, Inc. *(a) | | |
| | |
| | |
| | |
| | |
| | |
| | |
Inovio Pharmaceuticals, Inc. * | | |
| | |
| | |
Intellia Therapeutics, Inc. * | | |
Intercept Pharmaceuticals, Inc. * | | |
Intra-Cellular Therapies, Inc. * | | |
| | |
Iovance Biotherapeutics, Inc. * | | |
Ironwood Pharmaceuticals, Inc. * | | |
iTeos Therapeutics, Inc. * | | |
| | |
Janux Therapeutics, Inc. * | | |
Jounce Therapeutics, Inc. * | | |
KalVista Pharmaceuticals, Inc. * | | |
Karuna Therapeutics, Inc. * | | |
Karyopharm Therapeutics, Inc. * | | |
Keros Therapeutics, Inc. * | | |
Kezar Life Sciences, Inc. * | | |
Kiniksa Pharmaceuticals Ltd., Class A * | | |
Kinnate Biopharma, Inc. * | | |
| | |
| | |
| | |
| | |
Kymera Therapeutics, Inc. * | | |
Lexicon Pharmaceuticals, Inc. * | | |
Ligand Pharmaceuticals, Inc. * | | |
| | |
Lyell Immunopharma, Inc. * | | |
| | |
Madrigal Pharmaceuticals, Inc. * | | |
| | |
| | |
| | |
| | |
Schwab Equity Index Funds | Semiannual Report57
Schwab Small-Cap Index Fund
Portfolio Holdings as of April 30, 2023 (Unaudited) (continued)
| | |
Mersana Therapeutics, Inc. * | | |
| | |
Mineralys Therapeutics, Inc. * | | |
MiNK Therapeutics, Inc. * | | |
Mirum Pharmaceuticals, Inc. * | | |
Monte Rosa Therapeutics, Inc. * | | |
| | |
| | |
NanoString Technologies, Inc. * | | |
Nautilus Biotechnology, Inc. * | | |
| | |
NGM Biopharmaceuticals, Inc. * | | |
| | |
Nurix Therapeutics, Inc. * | | |
Nuvalent, Inc., Class A * | | |
| | |
| | |
Ocular Therapeutix, Inc. * | | |
| | |
Organogenesis Holdings, Inc. * | | |
Outlook Therapeutics, Inc. *(a) | | |
Pacific Biosciences of California, Inc. * | | |
Pacira BioSciences, Inc. * | | |
Pardes Biosciences, Inc. * | | |
| | |
Phathom Pharmaceuticals, Inc. *(a) | | |
Phibro Animal Health Corp., Class A | | |
PMV Pharmaceuticals, Inc. * | | |
Point Biopharma Global, Inc. * | | |
Praxis Precision Medicines, Inc. * | | |
| | |
Prestige Consumer Healthcare, Inc. * | | |
Prime Medicine, Inc. *(a) | | |
Prometheus Biosciences, Inc. * | | |
Protagonist Therapeutics, Inc. * | | |
| | |
| | |
| | |
| | |
| | |
RAPT Therapeutics, Inc. * | | |
Reata Pharmaceuticals, Inc., Class A * | | |
Recursion Pharmaceuticals, Inc., Class A * | | |
| | |
Relay Therapeutics, Inc. * | | |
Relmada Therapeutics, Inc. * | | |
| | |
Revance Therapeutics, Inc. * | | |
REVOLUTION Medicines, Inc. * | | |
Rigel Pharmaceuticals, Inc. * | | |
Rocket Pharmaceuticals, Inc. * | | |
Sage Therapeutics, Inc. * | | |
Sana Biotechnology, Inc. *(a) | | |
Sangamo Therapeutics, Inc. * | | |
Science 37 Holdings, Inc. * | | |
| | |
| | |
Seres Therapeutics, Inc. * | | |
| | |
Singular Genomics Systems, Inc. *(a) | | |
| | |
SpringWorks Therapeutics, Inc. * | | |
Stoke Therapeutics, Inc. * | | |
Supernus Pharmaceuticals, Inc. * | | |
| | |
Syndax Pharmaceuticals, Inc. * | | |
Talaris Therapeutics, Inc. * | | |
| | |
Tango Therapeutics, Inc. * | | |
Tarsus Pharmaceuticals, Inc. * | | |
Tenaya Therapeutics, Inc. * | | |
| | |
Theravance Biopharma, Inc. * | | |
Theseus Pharmaceuticals, Inc. * | | |
Third Harmonic Bio, Inc. *(a) | | |
Travere Therapeutics, Inc. * | | |
| | |
| | |
Vanda Pharmaceuticals, Inc. * | | |
| | |
| | |
| | |
Ventyx Biosciences, Inc. * | | |
Vera Therapeutics, Inc. *(a) | | |
| | |
| | |
Verve Therapeutics, Inc. * | | |
Vir Biotechnology, Inc. * | | |
Viridian Therapeutics, Inc. * | | |
VistaGen Therapeutics, Inc. * | | |
| | |
Xeris Biopharma Holdings, Inc. * | | |
Y-mAbs Therapeutics, Inc. * | | |
Zentalis Pharmaceuticals, Inc. * | | |
| | |
|
Real Estate Management & Development 0.6% |
American Realty Investors, Inc. * | | |
Anywhere Real Estate, Inc. * | | |
| | |
Cushman & Wakefield plc * | | |
DigitalBridge Group, Inc. | | |
| | |
| | |
| | |
| | |
| | |
Kennedy-Wilson Holdings, Inc. | | |
| | |
Newmark Group, Inc., Class A | | |
Offerpad Solutions, Inc. * | | |
RE/MAX Holdings, Inc., Class A | | |
| | |
| | |
| | |
The RMR Group, Inc., Class A | | |
| | |
Transcontinental Realty Investors, Inc. * | | |
| | |
|
Semiconductors & Semiconductor Equipment 2.6% |
ACM Research, Inc., Class A * | | |
Alpha & Omega Semiconductor Ltd. * | | |
| | |
| | |
| | |
Axcelis Technologies, Inc. * | | |
| | |
| | |
| | |
Credo Technology Group Holding Ltd. * | | |
| | |
| | |
| | |
58Schwab Equity Index Funds | Semiannual Report
Schwab Small-Cap Index Fund
Portfolio Holdings as of April 30, 2023 (Unaudited) (continued)
| | |
| | |
indie Semiconductor, Inc., Class A * | | |
Kulicke & Soffa Industries, Inc. | | |
MACOM Technology Solutions Holdings, Inc. * | | |
| | |
| | |
| | |
| | |
| | |
| | |
Rigetti Computing, Inc., Class A * | | |
| | |
Silicon Laboratories, Inc. * | | |
| | |
SkyWater Technology, Inc. * | | |
SMART Global Holdings, Inc. * | | |
| | |
| | |
Ultra Clean Holdings, Inc. * | | |
Veeco Instruments, Inc. * | | |
| | |
|
|
| | |
| | |
| | |
| | |
| | |
Alarm.com Holdings, Inc. * | | |
Alkami Technology, Inc. * | | |
Altair Engineering, Inc., Class A * | | |
American Software, Inc., Class A | | |
Amplitude, Inc., Class A * | | |
Appfolio, Inc., Class A * | | |
| | |
Applied Digital Corp. *(a) | | |
| | |
| | |
| | |
BigCommerce Holdings, Inc. * | | |
| | |
| | |
Blend Labs, Inc., Class A * | | |
| | |
| | |
C3.ai, Inc., Class A *(a) | | |
Cerberus Cyber Sentinel Corp. * | | |
| | |
| | |
| | |
Clear Secure, Inc., Class A | | |
CommVault Systems, Inc. * | | |
Consensus Cloud Solutions, Inc. * | | |
| | |
| | |
| | |
Cyxtera Technologies, Inc. * | | |
| | |
| | |
DigitalOcean Holdings, Inc. * | | |
| | |
E2open Parent Holdings, Inc. * | | |
| | |
| | |
| | |
Enfusion, Inc., Class A * | | |
| | |
| | |
| | |
| | |
| | |
| | |
ForgeRock, Inc., Class A * | | |
Greenidge Generation Holdings, Inc. * | | |
Grid Dynamics Holdings, Inc. * | | |
Information Services Group, Inc. | | |
Instructure Holdings, Inc. * | | |
| | |
| | |
| | |
| | |
| | |
| | |
LiveRamp Holdings, Inc. * | | |
| | |
Marathon Digital Holdings, Inc. *(a) | | |
| | |
| | |
MicroStrategy, Inc., Class A *(a) | | |
| | |
| | |
| | |
| | |
| | |
| | |
| | |
| | |
| | |
| | |
| | |
| | |
PowerSchool Holdings, Inc., Class A * | | |
| | |
| | |
| | |
| | |
Rackspace Technology, Inc. * | | |
| | |
| | |
Riot Platforms, Inc. *(a) | | |
Sapiens International Corp. N.V. | | |
SecureWorks Corp., Class A * | | |
| | |
| | |
Sprout Social, Inc., Class A * | | |
| | |
Squarespace, Inc., Class A * | | |
| | |
| | |
| | |
| | |
| | |
| | |
| | |
| | |
| | |
| | |
| | |
Viant Technology, Inc., Class A * | | |
Weave Communications, Inc. * | | |
| | |
| | |
| | |
| | |
Zeta Global Holdings Corp., Class A * | | |
Schwab Equity Index Funds | Semiannual Report59
Schwab Small-Cap Index Fund
Portfolio Holdings as of April 30, 2023 (Unaudited) (continued)
| | |
| | |
| | |
|
Technology Hardware & Equipment 3.5% |
| | |
| | |
Advanced Energy Industries, Inc. | | |
Aeva Technologies, Inc. * | | |
| | |
Akoustis Technologies, Inc. * | | |
Arlo Technologies, Inc. * | | |
| | |
| | |
| | |
| | |
Benchmark Electronics, Inc. | | |
| | |
| | |
| | |
| | |
| | |
CommScope Holding Co., Inc. * | | |
| | |
Comtech Telecommunications Corp. | | |
| | |
| | |
| | |
Digi International, Inc. * | | |
| | |
| | |
| | |
Evolv Technologies Holdings, Inc. * | | |
| | |
| | |
FARO Technologies, Inc. * | | |
Focus Universal, Inc. *(a) | | |
| | |
| | |
| | |
| | |
Insight Enterprises, Inc. * | | |
| | |
| | |
Kimball Electronics, Inc. * | | |
| | |
Lightwave Logic, Inc. *(a) | | |
Methode Electronics, Inc. | | |
| | |
Mirion Technologies, Inc. * | | |
Napco Security Technologies, Inc. * | | |
| | |
| | |
| | |
| | |
Ondas Holdings, Inc. *(a) | | |
| | |
| | |
| | |
| | |
| | |
Ribbon Communications, Inc. * | | |
| | |
| | |
| | |
| | |
Super Micro Computer, Inc. * | | |
| | |
| | |
| | |
| | |
Vishay Intertechnology, Inc. | | |
Vishay Precision Group, Inc. * | | |
| | |
| | |
|
Telecommunication Services 0.9% |
| | |
| | |
Bandwidth, Inc., Class A * | | |
Charge Enterprises, Inc. * | | |
Cogent Communications Holdings, Inc. | | |
Consolidated Communications Holdings, Inc. * | | |
EchoStar Corp., Class A * | | |
| | |
| | |
| | |
Iridium Communications, Inc. | | |
KORE Group Holdings, Inc. * | | |
Liberty Latin America Ltd., Class A * | | |
Liberty Latin America Ltd., Class C * | | |
| | |
Radius Global Infrastructure, Inc., Class A * | | |
Shenandoah Telecommunications Co. | | |
Telephone & Data Systems, Inc. | | |
United States Cellular Corp. * | | |
| | |
|
|
Air Transport Services Group, Inc. * | | |
| | |
| | |
Bird Global, Inc., Class A * | | |
Blade Air Mobility, Inc. * | | |
| | |
Covenant Logistics Group, Inc. | | |
| | |
Eagle Bulk Shipping, Inc. | | |
| | |
| | |
Frontier Group Holdings, Inc. * | | |
Genco Shipping & Trading Ltd. | | |
Golden Ocean Group Ltd. *(a) | | |
Hawaiian Holdings, Inc. * | | |
| | |
Hub Group, Inc., Class A * | | |
| | |
| | |
| | |
P.A.M. Transportation Services, Inc. * | | |
Radiant Logistics, Inc. * | | |
| | |
| | |
| | |
| | |
Sun Country Airlines Holdings, Inc. * | | |
TuSimple Holdings, Inc., Class A * | | |
Universal Logistics Holdings, Inc. | | |
| | |
Wheels Up Experience, Inc. * | | |
| | |
|
60Schwab Equity Index Funds | Semiannual Report
Schwab Small-Cap Index Fund
Portfolio Holdings as of April 30, 2023 (Unaudited) (continued)
| | |
|
| | |
| | |
American States Water Co. | | |
Artesian Resources Corp., Class A | | |
| | |
| | |
Brookfield Infrastructure Corp., Class A | | |
California Water Service Group | | |
Chesapeake Utilities Corp. | | |
Clearway Energy, Inc., Class A | | |
Clearway Energy, Inc., Class C | | |
Global Water Resources, Inc. | | |
| | |
| | |
Montauk Renewables, Inc. * | | |
New Jersey Resources Corp. | | |
Northwest Natural Holding Co. | | |
| | |
| | |
| | |
| | |
| | |
Portland General Electric Co. | | |
| | |
| | |
Southwest Gas Holdings, Inc. | | |
| | |
Sunnova Energy International, Inc. *(a) | | |
| | |
| | |
| | |
| | |
Total Common Stocks
(Cost $4,312,268,205) | |
|
RIGHTS 0.0% OF NET ASSETS |
|
Pharmaceuticals, Biotechnology & Life Sciences 0.0% |
Aduro Biotech, Inc. CVR *(b) | | |
Oncternal Therapeutics, Inc. CVR *(b) | | |
| | |
Tobira Therapeutics, Inc. CVR *(b) | | |
| | |
Total Rights
(Cost $2,055) | |
| | |
SHORT-TERM INVESTMENTS 1.4% OF NET ASSETS |
|
|
State Street Institutional U.S. Government Money Market Fund, Premier Class 4.76% (c)(d) | | |
Total Short-Term Investments
(Cost $72,902,773) | |
Total Investments in Securities
(Cost $4,385,173,033) | |
| | | CURRENT VALUE/
UNREALIZED
DEPRECIATION
($) |
|
| | | |
Russell 2000 Index, e-mini, expires 06/16/23 | | | |
| Non-income producing security. |
| All or a portion of this security is on loan. Securities on loan were valued at $68,930,091. |
| Fair valued using significant unobservable inputs (see financial note 2(a), Securities for which no quoted value is available, for additional information). |
| The rate shown is the annualized 7-day yield. |
| Security purchased with cash collateral received for securities on loan. |
| |
| Real Estate Investment Trust |
Schwab Equity Index Funds | Semiannual Report61
Schwab Small-Cap Index Fund
Portfolio Holdings as of April 30, 2023 (Unaudited) (continued)
The following is a summary of the inputs used to value the fund’s investments as of April 30, 2023 (see financial note 2(a) for additional information):
| QUOTED PRICES IN
ACTIVE MARKETS FOR
IDENTICAL ASSETS
(LEVEL 1) | OTHER SIGNIFICANT
OBSERVABLE INPUTS
(LEVEL 2) | SIGNIFICANT
UNOBSERVABLE INPUTS
(LEVEL 3) | |
| | | | |
| | | | |
Health Care Equipment & Services | | | | |
Pharmaceuticals, Biotechnology & Life Sciences | | | | |
| | | | |
Pharmaceuticals, Biotechnology & Life Sciences | | | | |
| | | | |
| | | | |
| | | | |
| | | | |
| Level 3 amount shown includes securities determined to have no value at April 30, 2023. |
| As categorized in the Portfolio Holdings. |
| Futures contracts are reported at cumulative unrealized appreciation or depreciation. |
Fund investments in mutual funds are classified as Level 1, without consideration to the classification level of the underlying
securities held by the mutual funds, which could be Level 1, Level 2 or Level 3.
62Schwab Equity Index Funds | Semiannual Report
Schwab Small-Cap Index Fund
Statement of Assets and Liabilities
As of April 30, 2023; unaudited
|
Investments in securities, at value - unaffiliated (cost $4,385,173,033) including securities on loan of $68,930,091 | | |
| | |
Deposit with broker for futures contracts | | |
| | |
| | |
| | |
Income from securities on loan | | |
| | |
Variation margin on future contracts | | |
| | |
| | |
|
|
Collateral held for securities on loan | | |
| | |
| | |
| | |
| | |
| | |
| | |
|
|
Capital received from investors | | |
Total distributable earnings | | |
| | |
Schwab Equity Index Funds | Semiannual Report63
Schwab Small-Cap Index Fund
Statement of Operations
For the period November 1, 2022 through April 30, 2023; unaudited |
|
Dividends received from securities - unaffiliated (net of foreign withholding tax of $54,838) | | |
| | |
| | |
|
|
| | |
| | |
| | |
|
REALIZED AND UNREALIZED GAINS (LOSSES) |
Net realized losses on sales of securities - unaffiliated | | |
Net realized gains on sales of in-kind redemptions - unaffiliated | | |
Net realized losses on futures contracts | | |
| | |
Net change in unrealized appreciation (depreciation) on securities - unaffiliated | | |
Net change in unrealized appreciation (depreciation) on futures contracts | | |
Net change in unrealized appreciation (depreciation) | | |
Net realized and unrealized losses | | |
Decrease in net assets resulting from operations | | |
64Schwab Equity Index Funds | Semiannual Report
Schwab Small-Cap Index Fund
Statement of Changes in Net Assets
For the current and prior report periods
Figures for the current period are unaudited
|
| | |
| | | |
| | | |
Net change in unrealized appreciation (depreciation) | | | |
Decrease in net assets from operations | | | |
|
DISTRIBUTIONS TO SHAREHOLDERS |
| | | |
TRANSACTIONS IN FUND SHARES |
| | |
| | | | | |
| | | | | |
| | | | | |
| | | | | |
Net transactions in fund shares | | | | | |
|
SHARES OUTSTANDING AND NET ASSETS |
| | |
| | | | | |
| | | | | |
Total increase (decrease) | | | | | |
| | | | | |
Schwab Equity Index Funds | Semiannual Report65
Schwab Total Stock Market Index Fund
Financial Statements
| | | | | | |
|
Net asset value at beginning of period | | | | | | |
Income (loss) from investment operations: | | | | | | |
Net investment income (loss)1 | | | | | | |
Net realized and unrealized gains (losses) | | | | | | |
Total from investment operations | | | | | | |
| | | | | | |
Distributions from net investment income | | | | | | |
Distributions from net realized gains | | | | | | |
| | | | | | |
Net asset value at end of period | | | | | | |
| | | | | | |
|
Ratios to average net assets: | | | | | | |
| | | | | | |
Net investment income (loss) | | | | | | |
| | | | | | |
Net assets, end of period (x 1,000,000) | | | | | | |
| |
| Calculated based on the average shares outstanding during the period. |
| |
| |
| Ratio includes less than 0.005% of non-routine proxy expenses. |
66Schwab Equity Index Funds | Semiannual Report
Schwab Total Stock Market Index Fund
Portfolio Holdings as of April 30, 2023 (Unaudited)
This section shows all the securities in the fund’s portfolio and their values as of the report date.
The fund files its complete schedule of portfolio holdings with the U.S. Securities and Exchange Commission (SEC) for the first and third quarters of each fiscal year on Form N-PORT Part F. The fund’s Form N-PORT Part F is available on the SEC’s website at www.sec.gov. You can also obtain this information at no cost on the fund’s website at www.schwabassetmanagement.com/schwabfunds_prospectus, by calling 1-866-414-6349, or by sending an email request to orders@mysummaryprospectus.com. The fund also makes available its complete schedule of portfolio holdings 15 to 20 days after the end of the month on the fund’s website.
| | |
COMMON STOCKS 99.5% OF NET ASSETS |
|
Automobiles & Components 1.6% |
| | |
American Axle & Manufacturing Holdings, Inc. * | | |
| | |
| | |
| | |
| | |
| | |
Cooper-Standard Holdings, Inc. * | | |
| | |
| | |
Envirotech Vehicles, Inc. * | | |
Faraday Future Intelligent Electric, Inc. * | | |
| | |
| | |
Fox Factory Holding Corp. * | | |
| | |
| | |
| | |
| | |
| | |
| | |
| | |
| | |
| | |
Luminar Technologies, Inc. *(a) | | |
Mobileye Global, Inc., Class A *(a) | | |
Modine Manufacturing Co. * | | |
Motorcar Parts of America, Inc. * | | |
Mullen Automotive, Inc. *(a) | | |
| | |
| | |
Rivian Automotive, Inc., Class A * | | |
| | |
Standard Motor Products, Inc. | | |
| | |
Strattec Security Corp. * | | |
Superior Industries International, Inc. * | | |
| | |
The Goodyear Tire & Rubber Co. * | | |
| | |
| | |
Winnebago Industries, Inc. | | |
Workhorse Group, Inc. *(a) | | |
| | |
| | |
|
|
1895 Bancorp of Wisconsin, Inc. * | | |
| | |
| | |
| | |
Affinity Bancshares, Inc. * | | |
Amalgamated Financial Corp. | | |
| | |
American National Bankshares, Inc. | | |
| | |
AmeriServ Financial, Inc. | | |
| | |
| | |
| | |
Atlantic Union Bankshares Corp. | | |
Auburn National BanCorp, Inc. | | |
| | |
| | |
| | |
| | |
| | |
| | |
| | |
Bank of South Carolina Corp. | | |
Bank of the James Financial Group, Inc. | | |
| | |
| | |
| | |
| | |
Bankwell Financial Group, Inc. | | |
| | |
| | |
| | |
| | |
| | |
Berkshire Hills Bancorp, Inc. | | |
| | |
Blue Ridge Bankshares, Inc. | | |
| | |
| | |
Bridgewater Bancshares, Inc. * | | |
Broadway Financial Corp. * | | |
| | |
Business First Bancshares, Inc. | | |
| | |
| | |
| | |
| | |
| | |
| | |
| | |
Capital City Bank Group, Inc. | | |
Capitol Federal Financial, Inc. | | |
Capstar Financial Holdings, Inc. | | |
Carter Bankshares, Inc. * | | |
| | |
| | |
CB Financial Services, Inc. | | |
Central Pacific Financial Corp. | | |
Central Valley Community Bancorp | | |
| | |
| | |
Schwab Equity Index Funds | Semiannual Report67
Schwab Total Stock Market Index Fund
Portfolio Holdings as of April 30, 2023 (Unaudited) (continued)
| | |
ChoiceOne Financial Services, Inc. | | |
| | |
Citizens & Northern Corp. | | |
Citizens Community Bancorp Inc/WI | | |
Citizens Financial Group, Inc. | | |
Citizens Financial Services, Inc. | | |
| | |
| | |
| | |
| | |
Coastal Financial Corp. * | | |
Codorus Valley Bancorp, Inc. | | |
| | |
Columbia Banking System, Inc. | | |
Columbia Financial, Inc. * | | |
| | |
Commerce Bancshares, Inc. | | |
Community Bank System, Inc. | | |
Community Trust Bancorp, Inc. | | |
Community West Bancshares | | |
| | |
CrossFirst Bankshares, Inc. * | | |
Cullen/Frost Bankers, Inc. | | |
| | |
Customers Bancorp, Inc. * | | |
| | |
Dime Community Bancshares, Inc. | | |
Eagle Bancorp Montana, Inc. | | |
| | |
| | |
| | |
| | |
| | |
Enterprise Financial Services Corp. | | |
Equity Bancshares, Inc., Class A | | |
Esquire Financial Holdings, Inc. | | |
| | |
| | |
| | |
Farmers & Merchants Bancorp, Inc. | | |
Farmers National Banc Corp. | | |
| | |
Fidelity D&D Bancorp, Inc. | | |
| | |
Financial Institutions, Inc. | | |
| | |
| | |
| | |
First Bancorp/Southern Pines NC | | |
| | |
| | |
First Business Financial Services, Inc. | | |
| | |
First Citizens BancShares, Inc., Class A | | |
First Commonwealth Financial Corp. | | |
First Community Bankshares, Inc. | | |
| | |
| | |
First Financial Bankshares, Inc. | | |
| | |
First Financial Northwest, Inc. | | |
| | |
First Guaranty Bancshares, Inc. | | |
| | |
| | |
| | |
| | |
First Interstate BancSystem, Inc., Class A | | |
| | |
First Mid Bancshares, Inc. | | |
| | |
| | |
| | |
First Savings Financial Group, Inc. | | |
First Seacoast Bancorp, Inc. * | | |
| | |
First Western Financial, Inc. * | | |
| | |
| | |
| | |
Franklin Financial Services Corp. | | |
| | |
| | |
| | |
German American Bancorp, Inc. | | |
| | |
Great Southern Bancorp, Inc. | | |
Greene County Bancorp, Inc. | | |
Guaranty Bancshares, Inc. | | |
| | |
| | |
| | |
Hawthorn Bancshares, Inc. | | |
| | |
Heartland Financial USA, Inc. | | |
| | |
| | |
| | |
| | |
| | |
| | |
| | |
HomeTrust Bancshares, Inc. | | |
| | |
| | |
Huntington Bancshares, Inc. | | |
| | |
| | |
Independent Bank Corp., Michigan | | |
Independent Bank Group, Inc. | | |
International Bancshares Corp. | | |
| | |
John Marshall Bancorp, Inc. | | |
| | |
| | |
| | |
| | |
| | |
| | |
| | |
| | |
| | |
Live Oak Bancshares, Inc. | | |
| | |
| | |
| | |
| | |
MainStreet Bancshares, Inc. | | |
| | |
| | |
| | |
Metrocity Bankshares, Inc. | | |
Metropolitan Bank Holding Corp. * | | |
| | |
68Schwab Equity Index Funds | Semiannual Report
Schwab Total Stock Market Index Fund
Portfolio Holdings as of April 30, 2023 (Unaudited) (continued)
| | |
| | |
Midland States Bancorp, Inc. | | |
MidWestOne Financial Group, Inc. | | |
| | |
National Bank Holdings Corp., Class A | | |
National Bankshares, Inc. | | |
| | |
New York Community Bancorp, Inc. | | |
Nicolet Bankshares, Inc. * | | |
| | |
Northeast Community Bancorp, Inc. | | |
| | |
| | |
Northwest Bancshares, Inc. | | |
| | |
| | |
| | |
OceanFirst Financial Corp. | | |
| | |
| | |
| | |
Old Point Financial Corp. | | |
| | |
| | |
Orange County Bancorp, Inc. | | |
| | |
Orrstown Financial Services, Inc. | | |
Pacific Premier Bancorp, Inc. | | |
| | |
| | |
| | |
| | |
| | |
| | |
| | |
| | |
Peapack-Gladstone Financial Corp. | | |
Penns Woods Bancorp, Inc. | | |
Peoples Bancorp of North Carolina, Inc. | | |
| | |
Peoples Financial Services Corp. | | |
Pinnacle Financial Partners, Inc. | | |
| | |
| | |
Ponce Financial Group, Inc. * | | |
| | |
| | |
| | |
| | |
| | |
Prosperity Bancshares, Inc. | | |
| | |
Provident Financial Holdings, Inc. | | |
Provident Financial Services, Inc. | | |
| | |
| | |
Red River Bancshares, Inc. | | |
| | |
| | |
Republic Bancorp, Inc., Class A | | |
Republic First Bancorp, Inc. * | | |
Richmond Mutual BanCorp., Inc. | | |
| | |
| | |
| | |
Sandy Spring Bancorp, Inc. | | |
| | |
| | |
Seacoast Banking Corp. of Florida | | |
ServisFirst Bancshares, Inc. | | |
| | |
| | |
Simmons First National Corp., Class A | | |
| | |
Sound Financial Bancorp, Inc. | | |
South Plains Financial, Inc. | | |
Southern First Bancshares, Inc. * | | |
Southern Missouri Bancorp, Inc. | | |
Southern States Bancshares, Inc. | | |
Southside Bancshares, Inc. | | |
| | |
| | |
| | |
Stock Yards Bancorp, Inc. | | |
Summit Financial Group, Inc. | | |
| | |
| | |
| | |
Territorial Bancorp, Inc. | | |
Texas Capital Bancshares, Inc. * | | |
| | |
The Community Financial Corp. | | |
| | |
The First Bancshares, Inc. | | |
The First of Long Island Corp. | | |
The Hingham Institution For Savings | | |
The PNC Financial Services Group, Inc. | | |
Third Coast Bancshares, Inc. * | | |
| | |
| | |
| | |
| | |
| | |
| | |
| | |
| | |
| | |
| | |
| | |
| | |
| | |
United Community Banks, Inc. | | |
United Security Bancshares | | |
| | |
| | |
USCB Financial Holdings, Inc. * | | |
| | |
| | |
Virginia National Bankshares Corp. | | |
| | |
Washington Trust Bancorp, Inc. | | |
| | |
| | |
| | |
| | |
| | |
| | |
Western New England Bancorp, Inc. | | |
William Penn Bancorp, Inc. | | |
| | |
| | |
Schwab Equity Index Funds | Semiannual Report69
Schwab Total Stock Market Index Fund
Portfolio Holdings as of April 30, 2023 (Unaudited) (continued)
| | |
| | |
| | |
|
|
| | |
| | |
| | |
| | |
| | |
| | |
| | |
Advanced Drainage Systems, Inc. | | |
Advent Technologies Holdings, Inc. *(a) | | |
| | |
Aerojet Rocketdyne Holdings, Inc. * | | |
| | |
| | |
| | |
AgEagle Aerial Systems, Inc. * | | |
| | |
| | |
Albany International Corp., Class A | | |
| | |
Allied Motion Technologies, Inc. | | |
Allison Transmission Holdings, Inc. | | |
| | |
Alta Equipment Group, Inc. | | |
Ameresco, Inc., Class A * | | |
American Superconductor Corp. * | | |
American Woodmark Corp. * | | |
| | |
Amprius Technologies, Inc. * | | |
| | |
| | |
Applied Industrial Technologies, Inc. | | |
Archer Aviation, Inc., Class A * | | |
| | |
| | |
Armstrong World Industries, Inc. | | |
Array Technologies, Inc. * | | |
| | |
| | |
| | |
| | |
| | |
| | |
| | |
Babcock & Wilcox Enterprises, Inc. * | | |
| | |
Beacon Roofing Supply, Inc. * | | |
| | |
| | |
Bloom Energy Corp., Class A * | | |
| | |
BlueLinx Holdings, Inc. * | | |
| | |
Bowman Consulting Group Ltd. * | | |
| | |
Builders FirstSource, Inc. * | | |
| | |
Byrna Technologies, Inc. * | | |
| | |
Capstone Green Energy Corp. * | | |
| | |
| | |
| | |
| | |
ChargePoint Holdings, Inc. *(a) | | |
| | |
CIRCOR International, Inc. * | | |
| | |
Comfort Systems USA, Inc. | | |
Commercial Vehicle Group, Inc. * | | |
Concrete Pumping Holdings, Inc. * | | |
Construction Partners, Inc., Class A * | | |
Core & Main, Inc., Class A * | | |
| | |
| | |
| | |
| | |
| | |
Custom Truck One Source, Inc. * | | |
| | |
Desktop Metal, Inc., Class A *(a) | | |
Distribution Solutions Group, Inc. * | | |
| | |
| | |
| | |
Dragonfly Energy Holdings Corp. *(a) | | |
| | |
| | |
| | |
| | |
| | |
| | |
| | |
| | |
| | |
Energy Vault Holdings, Inc. *(a) | | |
| | |
| | |
| | |
| | |
Eos Energy Enterprises, Inc. *(a) | | |
| | |
| | |
| | |
| | |
Evoqua Water Technologies Corp. * | | |
| | |
| | |
| | |
| | |
| | |
| | |
Flux Power Holdings, Inc. * | | |
| | |
Fortune Brands Innovations, Inc. | | |
Franklin Electric Co., Inc. | | |
FreightCar America, Inc. * | | |
FTAI Aviation Ltd., Class A | | |
| | |
| | |
Gates Industrial Corp. plc * | | |
| | |
Gencor Industries, Inc. * | | |
| | |
| | |
| | |
Gibraltar Industries, Inc. * | | |
| | |
| | |
| | |
GrafTech International Ltd. | | |
| | |
70Schwab Equity Index Funds | Semiannual Report
Schwab Total Stock Market Index Fund
Portfolio Holdings as of April 30, 2023 (Unaudited) (continued)
| | |
Granite Construction, Inc. | | |
Great Lakes Dredge & Dock Corp. * | | |
| | |
H&E Equipment Services, Inc. | | |
| | |
| | |
| | |
Helios Technologies, Inc. | | |
| | |
| | |
| | |
Hillman Solutions Corp. * | | |
Honeywell International, Inc. | | |
| | |
| | |
Hudson Technologies, Inc. * | | |
Huntington Ingalls Industries, Inc. | | |
| | |
Hydrofarm Holdings Group, Inc. * | | |
| | |
Hyster-Yale Materials Handling, Inc. | | |
| | |
| | |
| | |
Illinois Tool Works, Inc. | | |
| | |
| | |
Innovative Solutions and Support, Inc. * | | |
| | |
| | |
| | |
Janus International Group, Inc. * | | |
| | |
John Bean Technologies Corp. | | |
Johnson Controls International plc | | |
| | |
| | |
| | |
| | |
Kratos Defense & Security Solutions, Inc. * | | |
KULR Technology Group, Inc. * | | |
L.B. Foster Co., Class A * | | |
L3Harris Technologies, Inc. | | |
Lennox International, Inc. | | |
| | |
Lincoln Electric Holdings, Inc. | | |
| | |
| | |
| | |
| | |
Manitex International, Inc. * | | |
Markforged Holding Corp. * | | |
| | |
Masonite International Corp. * | | |
| | |
| | |
| | |
| | |
Mayville Engineering Co., Inc. * | | |
| | |
MDU Resources Group, Inc. | | |
| | |
| | |
| | |
| | |
| | |
| | |
| | |
MSC Industrial Direct Co., Inc., Class A | | |
| | |
Mueller Water Products, Inc., Class A | | |
| | |
National Presto Industries, Inc. | | |
Nauticus Robotics, Inc. *(a) | | |
| | |
NEXTracker, Inc., Class A * | | |
| | |
| | |
| | |
| | |
| | |
| | |
| | |
| | |
| | |
Ocean Power Technologies, Inc. * | | |
| | |
Orion Energy Systems, Inc. * | | |
Orion Group Holdings, Inc. * | | |
| | |
| | |
| | |
| | |
| | |
| | |
| | |
| | |
| | |
Perma-Pipe International Holdings, Inc. * | | |
| | |
| | |
| | |
Preformed Line Products Co. | | |
| | |
| | |
| | |
Quanex Building Products Corp. | | |
| | |
Raytheon Technologies Corp. | | |
| | |
| | |
| | |
Resideo Technologies, Inc. * | | |
| | |
| | |
Rockwell Automation, Inc. | | |
Rush Enterprises, Inc., Class A | | |
Rush Enterprises, Inc., Class B | | |
Sensata Technologies Holding plc | | |
| | |
Shoals Technologies Group, Inc., Class A * | | |
Simpson Manufacturing Co., Inc. | | |
SiteOne Landscape Supply, Inc. * | | |
SKYX Platforms Corp. *(a) | | |
| | |
Spirit AeroSystems Holdings, Inc., Class A | | |
| | |
Standex International Corp. | | |
Stanley Black & Decker, Inc. | | |
| | |
Sterling Infrastructure, Inc. * | | |
Schwab Equity Index Funds | Semiannual Report71
Schwab Total Stock Market Index Fund
Portfolio Holdings as of April 30, 2023 (Unaudited) (continued)
| | |
| | |
| | |
| | |
| | |
| | |
| | |
| | |
| | |
Terran Orbital Corp. *(a) | | |
| | |
| | |
| | |
| | |
| | |
The Greenbrier Cos., Inc. | | |
The LS Starrett Co., Class A * | | |
The Manitowoc Co., Inc. * | | |
| | |
| | |
| | |
| | |
Thermon Group Holdings, Inc. * | | |
Titan International, Inc. * | | |
| | |
| | |
| | |
| | |
| | |
| | |
| | |
Triton International Ltd. | | |
| | |
| | |
| | |
| | |
| | |
| | |
| | |
| | |
| | |
| | |
| | |
| | |
| | |
| | |
Virgin Galactic Holdings, Inc. *(a) | | |
| | |
| | |
| | |
| | |
Watts Water Technologies, Inc., Class A | | |
WESCO International, Inc. | | |
Westinghouse Air Brake Technologies Corp. | | |
Westwater Resources, Inc. * | | |
Willis Lease Finance Corp. * | | |
WillScot Mobile Mini Holdings Corp. * | | |
| | |
| | |
| | |
| | |
Zurn Elkay Water Solutions Corp. | | |
| | |
|
| | |
Commercial & Professional Services 1.7% |
| | |
| | |
| | |
ACV Auctions, Inc., Class A * | | |
| | |
| | |
ARC Document Solutions, Inc. | | |
Aris Water Solution, Inc., Class A | | |
| | |
| | |
Aurora Innovation, Inc. * | | |
Automatic Data Processing, Inc. | | |
Barrett Business Services, Inc. | | |
| | |
BlackSky Technology, Inc. *(a) | | |
Booz Allen Hamilton Holding Corp. | | |
| | |
BrightView Holdings, Inc. * | | |
Broadridge Financial Solutions, Inc. | | |
CACI International, Inc., Class A * | | |
Casella Waste Systems, Inc., Class A * | | |
| | |
CECO Environmental Corp. * | | |
Ceridian HCM Holding, Inc. * | | |
| | |
| | |
| | |
| | |
| | |
| | |
| | |
| | |
| | |
| | |
CSG Systems International, Inc. | | |
| | |
| | |
Driven Brands Holdings, Inc. * | | |
Dun & Bradstreet Holdings, Inc. | | |
| | |
| | |
ExlService Holdings, Inc. * | | |
| | |
| | |
FiscalNote Holdings, Inc. * | | |
Forrester Research, Inc. * | | |
| | |
| | |
| | |
| | |
| | |
| | |
Healthcare Services Group, Inc. | | |
Heidrick & Struggles International, Inc. | | |
Heritage-Crystal Clean, Inc. * | | |
| | |
HireRight Holdings Corp. * | | |
| | |
| | |
Huron Consulting Group, Inc. * | | |
| | |
| | |
| | |
| | |
| | |
72Schwab Equity Index Funds | Semiannual Report
Schwab Total Stock Market Index Fund
Portfolio Holdings as of April 30, 2023 (Unaudited) (continued)
| | |
KAR Auction Services, Inc. * | | |
| | |
Kelly Services, Inc., Class A | | |
| | |
Kimball International, Inc., Class B | | |
Knightscope, Inc., Class A * | | |
| | |
| | |
| | |
Liquidity Services, Inc. * | | |
| | |
| | |
Matthews International Corp., Class A | | |
| | |
| | |
| | |
Montrose Environmental Group, Inc. * | | |
| | |
| | |
| | |
Odyssey Marine Exploration, Inc. * | | |
| | |
| | |
| | |
Paylocity Holding Corp. * | | |
Performant Financial Corp. * | | |
Perma-Fix Environmental Services, Inc. * | | |
| | |
| | |
| | |
Quest Resource Holding Corp. * | | |
| | |
| | |
| | |
Resources Connection, Inc. | | |
Robert Half International, Inc. | | |
| | |
Science Applications International Corp. | | |
| | |
| | |
| | |
SS&C Technologies Holdings, Inc. | | |
| | |
| | |
| | |
| | |
| | |
| | |
| | |
| | |
| | |
| | |
| | |
| | |
| | |
| | |
| | |
| | |
| | |
| | |
| | |
| | |
Where Food Comes From, Inc. * | | |
| | |
| | |
|
| | |
Consumer Discretionary Distribution & Retail 4.8% |
1-800-Flowers.com, Inc., Class A * | | |
| | |
Abercrombie & Fitch Co., Class A * | | |
Academy Sports & Outdoors, Inc. | | |
| | |
| | |
American Eagle Outfitters, Inc. | | |
America's Car-Mart, Inc. * | | |
| | |
| | |
Asbury Automotive Group, Inc. * | | |
| | |
| | |
| | |
Barnes & Noble Education, Inc. * | | |
| | |
| | |
Big 5 Sporting Goods Corp. (a) | | |
| | |
Boot Barn Holdings, Inc. * | | |
Brilliant Earth Group, Inc., Class A * | | |
Build-A-Bear Workshop, Inc. | | |
Burlington Stores, Inc. * | | |
| | |
Camping World Holdings, Inc., Class A | | |
| | |
| | |
| | |
| | |
| | |
| | |
| | |
Designer Brands, Inc., Class A | | |
Destination XL Group, Inc. * | | |
Dick's Sporting Goods, Inc. | | |
| | |
Duluth Holdings, Inc., Class B * | | |
| | |
| | |
| | |
| | |
| | |
| | |
Floor & Decor Holdings, Inc., Class A * | | |
| | |
| | |
| | |
GameStop Corp., Class A *(a) | | |
| | |
| | |
| | |
| | |
| | |
| | |
Haverty Furniture Cos., Inc. | | |
| | |
| | |
| | |
| | |
| | |
| | |
Lazydays Holdings, Inc. * | | |
| | |
| | |
| | |
Schwab Equity Index Funds | Semiannual Report73
Schwab Total Stock Market Index Fund
Portfolio Holdings as of April 30, 2023 (Unaudited) (continued)
| | |
LL Flooring Holdings, Inc. * | | |
| | |
Lulu's Fashion Lounge Holdings, Inc. * | | |
| | |
| | |
| | |
| | |
National Vision Holdings, Inc. * | | |
| | |
Ollie's Bargain Outlet Holdings, Inc. * | | |
OneWater Marine, Inc., Class A * | | |
O'Reilly Automotive, Inc. * | | |
| | |
Penske Automotive Group, Inc. | | |
Petco Health & Wellness Co., Inc. * | | |
| | |
| | |
| | |
Qurate Retail, Inc., Series A * | | |
Rent the Runway, Inc., Class A *(a) | | |
| | |
| | |
| | |
RumbleON, Inc., Class B * | | |
Sally Beauty Holdings, Inc. * | | |
Shift Technologies, Inc. * | | |
| | |
| | |
| | |
Sonic Automotive, Inc., Class A | | |
Sportsman's Warehouse Holdings, Inc. * | | |
| | |
| | |
| | |
The Children's Place, Inc. * | | |
The Container Store Group, Inc. * | | |
| | |
| | |
| | |
| | |
| | |
| | |
Tile Shop Holdings, Inc. * | | |
| | |
| | |
TravelCenters of America, Inc. * | | |
| | |
| | |
| | |
| | |
Victoria's Secret & Co. * | | |
| | |
Warby Parker, Inc., Class A * | | |
| | |
| | |
| | |
| | |
| | |
| | |
|
Consumer Durables & Apparel 1.3% |
| | |
Allbirds, Inc., Class A * | | |
American Outdoor Brands, Inc. * | | |
| | |
| | |
| | |
Bassett Furniture Industries, Inc. | | |
| | |
| | |
| | |
| | |
| | |
Century Communities, Inc. | | |
| | |
| | |
Cricut, Inc., Class A (a) | | |
| | |
| | |
| | |
| | |
| | |
| | |
Dream Finders Homes, Inc., Class A * | | |
| | |
Ethan Allen Interiors, Inc. | | |
Flexsteel Industries, Inc. | | |
| | |
| | |
G-III Apparel Group Ltd. * | | |
| | |
Green Brick Partners, Inc. * | | |
Hamilton Beach Brands Holding Co., Class A | | |
| | |
| | |
| | |
| | |
Hovnanian Enterprises, Inc., Class A * | | |
Installed Building Products, Inc. | | |
| | |
| | |
Johnson Outdoors, Inc., Class A | | |
| | |
| | |
Lakeland Industries, Inc. | | |
| | |
| | |
| | |
| | |
| | |
| | |
Levi Strauss & Co., Class A | | |
| | |
| | |
| | |
Lululemon Athletica, Inc. * | | |
| | |
| | |
Malibu Boats, Inc., Class A * | | |
| | |
MasterCraft Boat Holdings, Inc. * | | |
| | |
| | |
Mohawk Industries, Inc. * | | |
| | |
| | |
| | |
| | |
| | |
| | |
Peloton Interactive, Inc., Class A * | | |
| | |
| | |
| | |
74Schwab Equity Index Funds | Semiannual Report
Schwab Total Stock Market Index Fund
Portfolio Holdings as of April 30, 2023 (Unaudited) (continued)
| | |
| | |
| | |
| | |
| | |
Skechers U.S.A., Inc., Class A * | | |
| | |
Smith & Wesson Brands, Inc. | | |
Snap One Holdings Corp. * | | |
Solo Brands, Inc., Class A * | | |
| | |
| | |
| | |
Superior Group of Cos., Inc. | | |
| | |
Taylor Morrison Home Corp. * | | |
Tempur Sealy International, Inc. | | |
| | |
| | |
| | |
Topgolf Callaway Brands Corp. * | | |
| | |
| | |
Tupperware Brands Corp. * | | |
Under Armour, Inc., Class A * | | |
Under Armour, Inc., Class C * | | |
| | |
Universal Electronics, Inc. * | | |
| | |
| | |
| | |
Vizio Holding Corp., Class A * | | |
VOXX International Corp. * | | |
| | |
| | |
Wolverine World Wide, Inc. | | |
| | |
| | |
|
|
| | |
Accel Entertainment, Inc. * | | |
| | |
Adtalem Global Education, Inc. * | | |
| | |
American Public Education, Inc. * | | |
| | |
| | |
Biglari Holdings, Inc., Class B * | | |
| | |
| | |
Bluegreen Vacations Holding Corp. | | |
| | |
| | |
| | |
Bright Horizons Family Solutions, Inc. * | | |
Brinker International, Inc. * | | |
Caesars Entertainment, Inc. * | | |
Canterbury Park Holding Corp. | | |
| | |
| | |
Carrols Restaurant Group, Inc. * | | |
| | |
| | |
Chipotle Mexican Grill, Inc. * | | |
Choice Hotels International, Inc. | | |
| | |
| | |
| | |
| | |
Cracker Barrel Old Country Store, Inc. | | |
| | |
Dave & Buster's Entertainment, Inc. * | | |
| | |
| | |
| | |
DoorDash, Inc., Class A * | | |
DraftKings, Inc., Class A * | | |
| | |
Dutch Bros, Inc., Class A *(a) | | |
El Pollo Loco Holdings, Inc. | | |
European Wax Center, Inc., Class A * | | |
| | |
| | |
F45 Training Holdings, Inc. * | | |
Fiesta Restaurant Group, Inc. * | | |
First Watch Restaurant Group, Inc. * | | |
| | |
Full House Resorts, Inc. * | | |
| | |
Global Business Travel Group I * | | |
Golden Entertainment, Inc. * | | |
Graham Holdings Co., Class B | | |
Grand Canyon Education, Inc. * | | |
| | |
Hall of Fame Resort & Entertainment Co. *(a) | | |
Hilton Grand Vacations, Inc. * | | |
Hilton Worldwide Holdings, Inc. | | |
Hyatt Hotels Corp., Class A * | | |
Inspired Entertainment, Inc. * | | |
| | |
| | |
Kura Sushi USA, Inc., Class A * | | |
| | |
| | |
Life Time Group Holdings, Inc. * | | |
| | |
Lincoln Educational Services Corp. * | | |
Lindblad Expeditions Holdings, Inc. * | | |
Marriott International, Inc., Class A | | |
Marriott Vacations Worldwide Corp. | | |
| | |
Membership Collective Group, Inc., Class A * | | |
MGM Resorts International | | |
| | |
Monarch Casino & Resort, Inc. | | |
| | |
| | |
| | |
Norwegian Cruise Line Holdings Ltd. * | | |
OneSpaWorld Holdings Ltd. * | | |
Papa John's International, Inc. | | |
Penn Entertainment, Inc. * | | |
Perdoceo Education Corp. * | | |
Planet Fitness, Inc., Class A * | | |
Playa Hotels & Resorts N.V. * | | |
| | |
Portillo's, Inc., Class A * | | |
| | |
RCI Hospitality Holdings, Inc. | | |
Red Robin Gourmet Burgers, Inc. * | | |
Red Rock Resorts, Inc., Class A | | |
| | |
Royal Caribbean Cruises Ltd. * | | |
Schwab Equity Index Funds | Semiannual Report75
Schwab Total Stock Market Index Fund
Portfolio Holdings as of April 30, 2023 (Unaudited) (continued)
| | |
Rush Street Interactive, Inc. * | | |
Ruth's Hospitality Group, Inc. | | |
| | |
SeaWorld Entertainment, Inc. * | | |
Service Corp. International | | |
Shake Shack, Inc., Class A * | | |
Six Flags Entertainment Corp. * | | |
| | |
| | |
Strategic Education, Inc. | | |
| | |
Sweetgreen, Inc., Class A * | | |
Target Hospitality Corp. * | | |
| | |
The Beachbody Co., Inc. * | | |
The Cheesecake Factory, Inc. | | |
The ONE Group Hospitality, Inc. * | | |
| | |
| | |
| | |
Universal Technical Institute, Inc. * | | |
| | |
| | |
| | |
| | |
Wyndham Hotels & Resorts, Inc. | | |
| | |
Xponential Fitness, Inc., Class A * | | |
| | |
| | |
|
Consumer Staples Distribution & Retail 1.8% |
Albertsons Cos., Inc., Class A | | |
BJ's Wholesale Club Holdings, Inc. * | | |
Casey's General Stores, Inc. | | |
| | |
| | |
| | |
Grocery Outlet Holding Corp. * | | |
| | |
Ingles Markets, Inc., Class A | | |
MedAvail Holdings, Inc. * | | |
Natural Grocers by Vitamin Cottage, Inc. | | |
Performance Food Group Co. * | | |
| | |
| | |
Sprouts Farmers Market, Inc. * | | |
| | |
| | |
| | |
The Chefs' Warehouse, Inc. * | | |
| | |
U.S. Foods Holding Corp. * | | |
United Natural Foods, Inc. * | | |
Village Super Market, Inc., Class A | | |
Walgreens Boots Alliance, Inc. | | |
| | |
| | |
| | |
|
|
Adams Resources & Energy, Inc. | | |
| | |
American Resources Corp. * | | |
| | |
| | |
| | |
| | |
| | |
| | |
| | |
| | |
| | |
| | |
| | |
California Resources Corp. | | |
| | |
Centrus Energy Corp., Class A * | | |
| | |
| | |
| | |
| | |
| | |
| | |
Clean Energy Fuels Corp. * | | |
| | |
| | |
| | |
| | |
| | |
| | |
Crescent Energy Co., Class A | | |
| | |
| | |
| | |
| | |
Diamond Offshore Drilling, Inc. * | | |
| | |
| | |
| | |
| | |
| | |
Earthstone Energy, Inc., Class A * | | |
| | |
| | |
| | |
| | |
| | |
Equitrans Midstream Corp. | | |
Evolution Petroleum Corp. | | |
Excelerate Energy, Inc., Class A | | |
Expro Group Holdings N.V. * | | |
| | |
Forum Energy Technologies, Inc. * | | |
Geospace Technologies Corp. * | | |
| | |
Granite Ridge Resources, Inc. | | |
| | |
Gulf Island Fabrication, Inc. * | | |
| | |
| | |
| | |
Helix Energy Solutions Group, Inc. * | | |
| | |
| | |
| | |
HighPeak Energy, Inc. (a) | | |
Houston American Energy Corp. * | | |
Independence Contract Drilling, Inc. * | | |
International Seaways, Inc. | | |
| | |
| | |
KLX Energy Services Holdings, Inc. * | | |
| | |
76Schwab Equity Index Funds | Semiannual Report
Schwab Total Stock Market Index Fund
Portfolio Holdings as of April 30, 2023 (Unaudited) (continued)
| | |
| | |
| | |
Magnolia Oil & Gas Corp., Class A | | |
Mammoth Energy Services, Inc. * | | |
| | |
| | |
| | |
| | |
| | |
NACCO Industries, Inc., Class A | | |
Natural Gas Services Group, Inc. * | | |
New Fortress Energy, Inc. | | |
Newpark Resources, Inc. * | | |
| | |
NexTier Oilfield Solutions, Inc. * | | |
Nine Energy Service, Inc. * | | |
| | |
Northern Oil and Gas, Inc. | | |
| | |
Occidental Petroleum Corp. | | |
Oceaneering International, Inc. * | | |
Oil States International, Inc. * | | |
| | |
Overseas Shipholding Group, Inc., Class A * | | |
| | |
Par Pacific Holdings, Inc. * | | |
Patterson-UTI Energy, Inc. | | |
PBF Energy, Inc., Class A | | |
| | |
| | |
| | |
| | |
| | |
Pioneer Natural Resources Co. | | |
PrimeEnergy Resources Corp. * | | |
| | |
ProFrac Holding Corp., Class A * | | |
| | |
| | |
Ranger Energy Services, Inc. * | | |
Ranger Oil Corp., Class A | | |
REX American Resources Corp. * | | |
Riley Exploration Permian, Inc. | | |
| | |
| | |
| | |
| | |
SEACOR Marine Holdings, Inc. * | | |
Select Energy Services, Inc., Class A | | |
SilverBow Resources, Inc. * | | |
Sitio Royalties Corp., Class A | | |
| | |
| | |
Solaris Oilfield Infrastructure, Inc., Class A | | |
Southwestern Energy Co. * | | |
| | |
| | |
| | |
| | |
TETRA Technologies, Inc. * | | |
| | |
| | |
| | |
| | |
| | |
US Silica Holdings, Inc. * | | |
| | |
| | |
| | |
| | |
| | |
| | |
| | |
| | |
Weatherford International plc * | | |
World Fuel Services Corp. | | |
| | |
|
Equity Real Estate Investment Trusts (REITs) 2.9% |
| | |
| | |
Alexander & Baldwin, Inc. | | |
| | |
Alexandria Real Estate Equities, Inc. | | |
Alpine Income Property Trust, Inc. | | |
American Assets Trust, Inc. | | |
American Homes 4 Rent, Class A | | |
| | |
Americold Realty Trust, Inc. | | |
Apartment Income REIT Corp. | | |
Apartment Investment & Management Co., Class A | | |
Apple Hospitality REIT, Inc. | | |
Armada Hoffler Properties, Inc. | | |
Ashford Hospitality Trust, Inc. * | | |
AvalonBay Communities, Inc. | | |
Bluerock Homes Trust, Inc. * | | |
| | |
Braemar Hotels & Resorts, Inc. | | |
| | |
Brixmor Property Group, Inc. | | |
Broadstone Net Lease, Inc. | | |
| | |
| | |
| | |
CBL & Associates Properties, Inc. | | |
| | |
| | |
| | |
| | |
Community Healthcare Trust, Inc. | | |
Corporate Office Properties Trust | | |
| | |
Creative Media & Community Trust Corp. | | |
| | |
| | |
| | |
DiamondRock Hospitality Co. | | |
Digital Realty Trust, Inc. | | |
Diversified Healthcare Trust | | |
| | |
Easterly Government Properties, Inc. | | |
EastGroup Properties, Inc. | | |
| | |
Empire State Realty Trust, Inc., Class A | | |
| | |
| | |
| | |
Equity LifeStyle Properties, Inc. | | |
| | |
Essential Properties Realty Trust, Inc. | | |
Essex Property Trust, Inc. | | |
Schwab Equity Index Funds | Semiannual Report77
Schwab Total Stock Market Index Fund
Portfolio Holdings as of April 30, 2023 (Unaudited) (continued)
| | |
Extra Space Storage, Inc. | | |
| | |
Federal Realty Investment Trust | | |
First Industrial Realty Trust, Inc. | | |
Four Corners Property Trust, Inc. | | |
Franklin Street Properties Corp. | | |
Gaming & Leisure Properties, Inc. | | |
| | |
Gladstone Commercial Corp. | | |
| | |
Global Medical REIT, Inc. | | |
| | |
Global Self Storage, Inc. | | |
Healthcare Realty Trust, Inc. | | |
Healthpeak Properties, Inc. | | |
Hersha Hospitality Trust, Class A | | |
Highwoods Properties, Inc. | | |
Host Hotels & Resorts, Inc. | | |
Hudson Pacific Properties, Inc. | | |
Independence Realty Trust, Inc. | | |
| | |
Industrial Logistics Properties Trust | | |
Innovative Industrial Properties, Inc. | | |
InvenTrust Properties Corp. | | |
| | |
| | |
| | |
| | |
| | |
| | |
Lamar Advertising Co., Class A | | |
| | |
| | |
| | |
Medical Properties Trust, Inc. (a) | | |
Mid-America Apartment Communities, Inc. | | |
| | |
National Health Investors, Inc. | | |
National Retail Properties, Inc. | | |
National Storage Affiliates Trust | | |
| | |
New Century Financial Corp. *(c) | | |
NexPoint Diversified Real Estate Trust | | |
NexPoint Residential Trust, Inc. | | |
Office Properties Income Trust | | |
Omega Healthcare Investors, Inc. | | |
One Liberty Properties, Inc. | | |
| | |
| | |
| | |
Park Hotels & Resorts, Inc. | | |
| | |
Phillips Edison & Co., Inc. | | |
| | |
Piedmont Office Realty Trust, Inc., Class A | | |
Plymouth Industrial REIT, Inc. | | |
Postal Realty Trust, Inc., Class A | | |
| | |
| | |
Presidio Property Trust, Inc., Class A | | |
| | |
| | |
| | |
| | |
| | |
Retail Opportunity Investments Corp. | | |
| | |
Rexford Industrial Realty, Inc. | | |
| | |
| | |
Ryman Hospitality Properties, Inc. | | |
Sabra Health Care REIT, Inc. | | |
| | |
| | |
| | |
| | |
Simon Property Group, Inc. | | |
| | |
SL Green Realty Corp. (a) | | |
Spirit Realty Capital, Inc. | | |
| | |
| | |
Summit Hotel Properties, Inc. | | |
| | |
Sunstone Hotel Investors, Inc. | | |
Tanger Factory Outlet Centers, Inc. | | |
| | |
| | |
The Necessity Retail REIT, Inc. | | |
| | |
| | |
| | |
Universal Health Realty Income Trust | | |
| | |
Urstadt Biddle Properties, Inc., Class A | | |
| | |
Veris Residential, Inc. * | | |
| | |
| | |
| | |
| | |
| | |
| | |
Xenia Hotels & Resorts, Inc. | | |
| | |
|
|
| | |
ACRES Commercial Realty Corp. | | |
| | |
Affiliated Managers Group, Inc. | | |
| | |
AG Mortgage Investment Trust, Inc. | | |
| | |
| | |
| | |
| | |
A-Mark Precious Metals, Inc. | | |
| | |
Ameriprise Financial, Inc. | | |
Angel Oak Mortgage, Inc. (a) | | |
Annaly Capital Management, Inc. | | |
Apollo Commercial Real Estate Finance, Inc. | | |
Apollo Global Management, Inc. | | |
Arbor Realty Trust, Inc. (a) | | |
Ares Commercial Real Estate Corp. | | |
Ares Management Corp., Class A | | |
Arlington Asset Investment Corp., Class A * | | |
ARMOUR Residential REIT, Inc. | | |
Artisan Partners Asset Management, Inc., Class A | | |
78Schwab Equity Index Funds | Semiannual Report
Schwab Total Stock Market Index Fund
Portfolio Holdings as of April 30, 2023 (Unaudited) (continued)
| | |
Assetmark Financial Holdings, Inc. * | | |
Associated Capital Group, Inc., Class A | | |
Atlanticus Holdings Corp. * | | |
| | |
AvidXchange Holdings, Inc. * | | |
B. Riley Financial, Inc. (a) | | |
Bakkt Holdings, Inc. *(a) | | |
Berkshire Hathaway, Inc., Class B * | | |
BGC Partners, Inc., Class A | | |
| | |
Blackstone Mortgage Trust, Inc., Class A | | |
| | |
| | |
| | |
| | |
Bread Financial Holdings, Inc. | | |
Bridge Investment Group Holdings, Inc., Class A | | |
Brightsphere Investment Group, Inc. | | |
BrightSpire Capital, Inc. | | |
Broadmark Realty Capital, Inc. | | |
| | |
| | |
Capital One Financial Corp. | | |
Cass Information Systems, Inc. | | |
Cboe Global Markets, Inc. | | |
Cherry Hill Mortgage Investment Corp. (a) | | |
Chicago Atlantic Real Estate Finance, Inc. | | |
| | |
Claros Mortgage Trust, Inc. | | |
| | |
| | |
Coinbase Global, Inc., Class A *(a) | | |
Consumer Portfolio Services, Inc. * | | |
Corebridge Financial, Inc. | | |
Credit Acceptance Corp. * | | |
Curo Group Holdings Corp. | | |
Diamond Hill Investment Group, Inc. | | |
Discover Financial Services | | |
Donnelley Financial Solutions, Inc. * | | |
| | |
Ellington Financial, Inc. | | |
Ellington Residential Mortgage REIT | | |
| | |
Encore Capital Group, Inc. * | | |
Enova International, Inc. * | | |
| | |
| | |
Euronet Worldwide, Inc. * | | |
| | |
| | |
| | |
FactSet Research Systems, Inc. | | |
Federal Agricultural Mortgage Corp., Class C | | |
| | |
Fidelity National Information Services, Inc. | | |
Finance Of America Cos., Inc., Class A * | | |
| | |
| | |
FleetCor Technologies, Inc. * | | |
| | |
| | |
Focus Financial Partners, Inc., Class A * | | |
Forge Global Holdings, Inc. * | | |
Franklin BSP Realty Trust, Inc. | | |
| | |
GCM Grosvenor, Inc., Class A | | |
| | |
Granite Point Mortgage Trust, Inc. | | |
| | |
Green Dot Corp., Class A * | | |
| | |
Guild Holdings Co., Class A * | | |
Hamilton Lane, Inc., Class A | | |
Hannon Armstrong Sustainable Infrastructure Capital, Inc. | | |
| | |
| | |
I3 Verticals, Inc., Class A * | | |
Interactive Brokers Group, Inc., Class A | | |
Intercontinental Exchange, Inc. | | |
International Money Express, Inc. * | | |
| | |
Invesco Mortgage Capital, Inc. | | |
Jack Henry & Associates, Inc. | | |
Jackson Financial, Inc., Class A | | |
Janus Henderson Group plc | | |
Jefferies Financial Group, Inc. | | |
| | |
KKR Real Estate Finance Trust, Inc. | | |
Ladder Capital Corp. REIT | | |
| | |
| | |
| | |
loanDepot, Inc., Class A * | | |
LPL Financial Holdings, Inc. | | |
Lument Finance Trust, Inc. | | |
MarketAxess Holdings, Inc. | | |
| | |
| | |
Mastercard, Inc., Class A | | |
Medallion Financial Corp. | | |
| | |
| | |
| | |
| | |
MoneyGram International, Inc. * | | |
| | |
| | |
| | |
| | |
| | |
| | |
| | |
| | |
| | |
NerdWallet, Inc., Class A * | | |
New York Mortgage Trust, Inc. | | |
Nexpoint Real Estate Finance, Inc. | | |
Nicholas Financial, Inc. * | | |
NMI Holdings, Inc., Class A * | | |
| | |
| | |
| | |
Open Lending Corp., Class A * | | |
Oportun Financial Corp. * | | |
Oppenheimer Holdings, Inc., Class A | | |
Schwab Equity Index Funds | Semiannual Report79
Schwab Total Stock Market Index Fund
Portfolio Holdings as of April 30, 2023 (Unaudited) (continued)
| | |
| | |
Orchid Island Capital, Inc. (a) | | |
| | |
Paymentus Holdings, Inc., Class A * | | |
| | |
| | |
| | |
PennyMac Financial Services, Inc. | | |
PennyMac Mortgage Investment Trust | | |
Perella Weinberg Partners, Class A | | |
| | |
PJT Partners, Inc., Class A | | |
| | |
Priority Technology Holdings, Inc. * | | |
| | |
| | |
Raymond James Financial, Inc. | | |
| | |
| | |
Regional Management Corp. | | |
| | |
| | |
| | |
Robinhood Markets, Inc., Class A * | | |
Rocket Cos., Inc., Class A *(a) | | |
| | |
| | |
| | |
Safeguard Scientifics, Inc. * | | |
Sculptor Capital Management, Inc. | | |
Security National Financial Corp., Class A * | | |
| | |
| | |
Shift4 Payments, Inc., Class A * | | |
Silvercrest Asset Management Group, Inc., Class A | | |
| | |
SoFi Technologies, Inc. * | | |
Starwood Property Trust, Inc. | | |
| | |
StepStone Group, Inc., Class A | | |
| | |
| | |
Sunlight Financial Holdings, Inc. * | | |
| | |
| | |
T. Rowe Price Group, Inc. | | |
| | |
The Bank of New York Mellon Corp. | | |
| | |
The Charles Schwab Corp. (d) | | |
The Goldman Sachs Group, Inc. | | |
| | |
| | |
TPG RE Finance Trust, Inc. | | |
| | |
Tradeweb Markets, Inc., Class A | | |
Two Harbors Investment Corp. | | |
U.S. Global Investors, Inc., Class A | | |
Upstart Holdings, Inc. *(a) | | |
| | |
| | |
Velocity Financial, Inc. * | | |
Victory Capital Holdings, Inc., Class A | | |
Virtu Financial, Inc., Class A | | |
Virtus Investment Partners, Inc. | | |
| | |
| | |
| | |
| | |
Waterstone Financial, Inc. | | |
Western Asset Mortgage Capital Corp. | | |
Westwood Holdings Group, Inc. | | |
| | |
| | |
| | |
| | |
|
Food, Beverage & Tobacco 3.4% |
22nd Century Group, Inc. * | | |
| | |
| | |
| | |
Archer-Daniels-Midland Co. | | |
| | |
| | |
| | |
Brookfield Realty Capital Corp., Class A *(a) | | |
Brown-Forman Corp., Class A | | |
Brown-Forman Corp., Class B | | |
| | |
| | |
| | |
| | |
| | |
Coca-Cola Consolidated, Inc. | | |
| | |
Constellation Brands, Inc., Class A | | |
Darling Ingredients, Inc. * | | |
| | |
| | |
Fresh Del Monte Produce, Inc. | | |
| | |
| | |
| | |
| | |
| | |
| | |
John B. Sanfilippo & Son, Inc. | | |
| | |
| | |
Lamb Weston Holdings, Inc. | | |
| | |
Lifecore Biomedical, Inc. * | | |
| | |
MamaMancini's Holdings, Inc. * | | |
McCormick & Co., Inc. - Non Voting Shares | | |
| | |
| | |
Molson Coors Beverage Co., Class B | | |
Mondelez International, Inc., Class A | | |
| | |
National Beverage Corp. * | | |
| | |
Philip Morris International, Inc. | | |
| | |
| | |
| | |
Seneca Foods Corp., Class A * | | |
| | |
Splash Beverage Group, Inc. * | | |
| | |
80Schwab Equity Index Funds | Semiannual Report
Schwab Total Stock Market Index Fund
Portfolio Holdings as of April 30, 2023 (Unaudited) (continued)
| | |
The Boston Beer Co., Inc., Class A * | | |
| | |
The Duckhorn Portfolio, Inc. * | | |
The Hain Celestial Group, Inc. * | | |
| | |
| | |
| | |
The Real Good Food Co., Inc. * | | |
The Simply Good Foods Co. * | | |
The Vita Coco Co., Inc. * | | |
Tootsie Roll Industries, Inc. | | |
| | |
Turning Point Brands, Inc. | | |
Tyson Foods, Inc., Class A | | |
| | |
| | |
| | |
| | |
| | |
Whole Earth Brands, Inc. * | | |
| | |
| | |
|
Health Care Equipment & Services 6.0% |
23andMe Holding Co., Class A * | | |
| | |
Acadia Healthcare Co., Inc. * | | |
Accelerate Diagnostics, Inc. * | | |
| | |
| | |
| | |
| | |
| | |
| | |
AirSculpt Technologies, Inc. (a) | | |
| | |
| | |
| | |
Alignment Healthcare, Inc. * | | |
Alphatec Holdings, Inc. * | | |
| | |
American Well Corp., Class A * | | |
| | |
AMN Healthcare Services, Inc. * | | |
| | |
Apollo Medical Holdings, Inc. * | | |
| | |
| | |
| | |
| | |
| | |
| | |
| | |
Aveanna Healthcare Holdings, Inc. * | | |
| | |
| | |
Baxter International, Inc. | | |
| | |
| | |
| | |
| | |
Bioventus, Inc., Class A * | | |
Boston Scientific Corp. * | | |
Brookdale Senior Living, Inc. * | | |
Butterfly Network, Inc. *(a) | | |
| | |
| | |
| | |
| | |
Castle Biosciences, Inc. * | | |
| | |
| | |
| | |
| | |
| | |
| | |
Clover Health Investments Corp. * | | |
| | |
Community Health Systems, Inc. * | | |
Computer Programs & Systems, Inc. * | | |
| | |
| | |
Cross Country Healthcare, Inc. * | | |
| | |
| | |
| | |
| | |
| | |
| | |
| | |
Definitive Healthcare Corp. * | | |
| | |
| | |
| | |
| | |
Doximity, Inc., Class A * | | |
Edwards Lifesciences Corp. * | | |
| | |
| | |
| | |
| | |
| | |
| | |
| | |
| | |
| | |
| | |
Evolent Health, Inc., Class A * | | |
| | |
| | |
| | |
| | |
| | |
| | |
| | |
Globus Medical, Inc., Class A * | | |
| | |
| | |
| | |
| | |
| | |
| | |
| | |
| | |
| | |
Hims & Hers Health, Inc. * | | |
| | |
| | |
| | |
| | |
| | |
IDEXX Laboratories, Inc. * | | |
| | |
InfuSystem Holdings, Inc. * | | |
| | |
| | |
Schwab Equity Index Funds | Semiannual Report81
Schwab Total Stock Market Index Fund
Portfolio Holdings as of April 30, 2023 (Unaudited) (continued)
| | |
Inspire Medical Systems, Inc. * | | |
| | |
| | |
Integra LifeSciences Holdings Corp. * | | |
Intuitive Surgical, Inc. * | | |
| | |
iRhythm Technologies, Inc. * | | |
| | |
KORU Medical Systems, Inc. * | | |
Laboratory Corp. of America Holdings | | |
Lantheus Holdings, Inc. * | | |
| | |
| | |
LifeStance Health Group, Inc. * | | |
| | |
| | |
| | |
| | |
Merit Medical Systems, Inc. * | | |
| | |
| | |
Molina Healthcare, Inc. * | | |
National HealthCare Corp. | | |
| | |
| | |
| | |
| | |
| | |
| | |
NextGen Healthcare, Inc. * | | |
| | |
| | |
Oak Street Health, Inc. * | | |
OmniAb, Inc., Class A *(c) | | |
OmniAb, Inc., Class B *(c) | | |
| | |
| | |
| | |
Option Care Health, Inc. * | | |
OraSure Technologies, Inc. * | | |
Orchestra BioMed Holdings, Inc. * | | |
| | |
| | |
| | |
| | |
| | |
| | |
Pediatrix Medical Group, Inc. * | | |
| | |
| | |
| | |
| | |
Privia Health Group, Inc. * | | |
PROCEPT BioRobotics Corp. * | | |
| | |
| | |
| | |
| | |
| | |
| | |
| | |
| | |
| | |
| | |
| | |
Select Medical Holdings Corp. | | |
Semler Scientific, Inc. * | | |
Senseonics Holdings, Inc. *(a) | | |
| | |
Sensus Healthcare, Inc. * | | |
| | |
Shockwave Medical, Inc. * | | |
| | |
| | |
Silk Road Medical, Inc. * | | |
| | |
| | |
| | |
Sonida Senior Living, Inc. * | | |
| | |
| | |
| | |
Streamline Health Solutions, Inc. * | | |
| | |
| | |
| | |
Tabula Rasa HealthCare, Inc. * | | |
Tactile Systems Technology, Inc. * | | |
| | |
Tandem Diabetes Care, Inc. * | | |
| | |
| | |
| | |
| | |
| | |
| | |
| | |
The Oncology Institute, Inc. * | | |
The Pennant Group, Inc. * | | |
TransMedics Group, Inc. * | | |
Treace Medical Concepts, Inc. * | | |
U.S. Physical Therapy, Inc. | | |
| | |
| | |
Universal Health Services, Inc., Class B | | |
Utah Medical Products, Inc. | | |
| | |
Veeva Systems, Inc., Class A * | | |
| | |
Vicarious Surgical, Inc. * | | |
| | |
| | |
| | |
Zimmer Biomet Holdings, Inc. | | |
| | |
| | |
| | |
| | |
|
Household & Personal Products 1.5% |
| | |
Central Garden & Pet Co. * | | |
Central Garden & Pet Co., Class A * | | |
Church & Dwight Co., Inc. | | |
| | |
| | |
Edgewell Personal Care Co. | | |
| | |
| | |
Herbalife Nutrition Ltd. * | | |
| | |
| | |
| | |
| | |
82Schwab Equity Index Funds | Semiannual Report
Schwab Total Stock Market Index Fund
Portfolio Holdings as of April 30, 2023 (Unaudited) (continued)
| | |
Natural Alternatives International, Inc. * | | |
Nature's Sunshine Products, Inc. * | | |
Nu Skin Enterprises, Inc., Class A | | |
| | |
| | |
Reynolds Consumer Products, Inc. | | |
Spectrum Brands Holdings, Inc. | | |
| | |
| | |
The Estee Lauder Cos., Inc., Class A | | |
| | |
| | |
Thorne HealthTech, Inc. * | | |
USANA Health Sciences, Inc. * | | |
| | |
| | |
| | |
|
|
| | |
Ambac Financial Group, Inc. * | | |
American Equity Investment Life Holding Co. | | |
American Financial Group, Inc. | | |
American International Group, Inc. | | |
| | |
| | |
Arch Capital Group Ltd. * | | |
Argo Group International Holdings Ltd. | | |
Arthur J. Gallagher & Co. | | |
| | |
| | |
Axis Capital Holdings Ltd. | | |
Bright Health Group, Inc. * | | |
Brighthouse Financial, Inc. * | | |
| | |
BRP Group, Inc., Class A * | | |
| | |
Cincinnati Financial Corp. | | |
| | |
| | |
CNO Financial Group, Inc. | | |
| | |
Donegal Group, Inc., Class A | | |
| | |
| | |
| | |
Erie Indemnity Co., Class A | | |
| | |
F&G Annuities & Life, Inc. | | |
Fidelity National Financial, Inc. | | |
First American Financial Corp. | | |
Genworth Financial, Inc., Class A * | | |
| | |
GoHealth, Inc., Class A * | | |
Goosehead Insurance, Inc., Class A * | | |
Greenlight Capital Re Ltd., Class A * | | |
Hagerty, Inc., Class A *(a) | | |
Hallmark Financial Services, Inc. * | | |
| | |
Heritage Insurance Holdings, Inc. | | |
Horace Mann Educators Corp. | | |
| | |
James River Group Holdings Ltd. | | |
| | |
| | |
Kingsway Financial Services, Inc. * | | |
Kinsale Capital Group, Inc. | | |
| | |
| | |
| | |
| | |
| | |
Marsh & McLennan Cos., Inc. | | |
| | |
| | |
| | |
| | |
National Western Life Group, Inc., Class A | | |
| | |
Old Republic International Corp. | | |
Oscar Health, Inc., Class A * | | |
| | |
| | |
Principal Financial Group, Inc. | | |
| | |
Prudential Financial, Inc. | | |
Reinsurance Group of America, Inc. | | |
RenaissanceRe Holdings Ltd. | | |
| | |
| | |
Ryan Specialty Holdings, Inc., Class A * | | |
Safety Insurance Group, Inc. | | |
Selective Insurance Group, Inc. | | |
| | |
| | |
Skyward Specialty Insurance Group, Inc. * | | |
Stewart Information Services Corp. | | |
| | |
The Hanover Insurance Group, Inc. | | |
The Hartford Financial Services Group, Inc. | | |
| | |
| | |
| | |
| | |
| | |
United Insurance Holdings Corp. * | | |
Universal Insurance Holdings, Inc. | | |
| | |
| | |
White Mountains Insurance Group Ltd. | | |
| | |
| | |
|
|
5E Advanced Materials, Inc. *(a) | | |
Advanced Emissions Solutions, Inc. * | | |
| | |
Air Products & Chemicals, Inc. | | |
| | |
| | |
Alpha Metallurgical Resources, Inc. | | |
| | |
| | |
| | |
| | |
| | |
Schwab Equity Index Funds | Semiannual Report83
Schwab Total Stock Market Index Fund
Portfolio Holdings as of April 30, 2023 (Unaudited) (continued)
| | |
| | |
| | |
| | |
| | |
| | |
| | |
| | |
| | |
Axalta Coating Systems Ltd. * | | |
| | |
| | |
| | |
| | |
Carpenter Technology Corp. | | |
| | |
| | |
CF Industries Holdings, Inc. | | |
| | |
| | |
| | |
| | |
| | |
Compass Minerals International, Inc. | | |
| | |
Core Molding Technologies, Inc. * | | |
| | |
| | |
| | |
Danimer Scientific, Inc. * | | |
| | |
| | |
| | |
| | |
| | |
| | |
| | |
| | |
Flotek Industries, Inc. * | | |
| | |
| | |
Friedman Industries, Inc. | | |
| | |
| | |
Ginkgo Bioworks Holdings, Inc. *(a) | | |
| | |
| | |
| | |
Graphic Packaging Holding Co. | | |
| | |
| | |
| | |
Haynes International, Inc. | | |
| | |
| | |
Hycroft Mining Holding Corp. * | | |
Idaho Strategic Resources, Inc. * | | |
| | |
| | |
International Flavors & Fragrances, Inc. | | |
| | |
| | |
| | |
| | |
| | |
| | |
| | |
Loop Industries, Inc. *(a) | | |
| | |
| | |
| | |
LyondellBasell Industries N.V., Class A | | |
Martin Marietta Materials, Inc. | | |
| | |
| | |
| | |
Mercer International, Inc. | | |
Minerals Technologies, Inc. | | |
| | |
| | |
| | |
| | |
Northern Technologies International Corp. | | |
| | |
| | |
| | |
| | |
| | |
Orion Engineered Carbons S.A. | | |
Packaging Corp. of America | | |
| | |
Perimeter Solutions S.A. * | | |
| | |
| | |
PureCycle Technologies, Inc. *(a) | | |
| | |
| | |
| | |
Rayonier Advanced Materials, Inc. * | | |
Reliance Steel & Aluminum Co. | | |
| | |
| | |
| | |
Schnitzer Steel Industries, Inc., Class A | | |
| | |
Sensient Technologies Corp. | | |
| | |
| | |
| | |
| | |
| | |
| | |
Summit Materials, Inc., Class A * | | |
| | |
| | |
| | |
| | |
The Scotts Miracle-Gro Co. | | |
| | |
| | |
| | |
| | |
| | |
Tronox Holdings plc, Class A | | |
| | |
| | |
United States Lime & Minerals, Inc. | | |
United States Steel Corp. | | |
Universal Stainless & Alloy Products, Inc. * | | |
| | |
| | |
| | |
| | |
84Schwab Equity Index Funds | Semiannual Report
Schwab Total Stock Market Index Fund
Portfolio Holdings as of April 30, 2023 (Unaudited) (continued)
| | |
| | |
Worthington Industries, Inc. | | |
| | |
|
Media & Entertainment 6.6% |
Activision Blizzard, Inc. * | | |
AdTheorent Holding Co., Inc. * | | |
Advantage Solutions, Inc. * | | |
Alphabet, Inc., Class A * | | |
Alphabet, Inc., Class C * | | |
Altice USA, Inc., Class A * | | |
AMC Entertainment Holdings, Inc., Class A (a) | | |
AMC Networks, Inc., Class A * | | |
| | |
Boston Omaha Corp., Class A * | | |
| | |
| | |
| | |
| | |
| | |
| | |
Charter Communications, Inc., Class A * | | |
Cinedigm Corp., Class A * | | |
Cinemark Holdings, Inc. * | | |
Clear Channel Outdoor Holdings, Inc. * | | |
| | |
| | |
Cumulus Media, Inc., Class A * | | |
| | |
| | |
| | |
DISH Network Corp., Class A * | | |
| | |
| | |
Endeavor Group Holdings, Inc., Class A * | | |
Entravision Communications Corp., Class A | | |
Eventbrite, Inc., Class A * | | |
EverQuote, Inc., Class A * | | |
| | |
| | |
| | |
| | |
| | |
Genius Brands International, Inc. * | | |
Golden Matrix Group, Inc. * | | |
| | |
| | |
| | |
| | |
iHeartMedia, Inc., Class A * | | |
| | |
Integral Ad Science Holding Corp. * | | |
| | |
John Wiley & Sons, Inc., Class A | | |
| | |
Liberty Broadband Corp., Class A * | | |
Liberty Broadband Corp., Class C * | | |
Liberty Media Corp. - Liberty Braves, Class A * | | |
Liberty Media Corp. - Liberty Braves, Class C * | | |
| | |
Liberty Media Corp. - Liberty Formula One, Class A * | | |
Liberty Media Corp. - Liberty Formula One, Class C * | | |
Liberty Media Corp. - Liberty SiriusXM, Class A * | | |
Liberty Media Corp. - Liberty SiriusXM, Class C * | | |
Lions Gate Entertainment Corp., Class A * | | |
Lions Gate Entertainment Corp., Class B * | | |
Live Nation Entertainment, Inc. * | | |
| | |
| | |
Madison Square Garden Entertainment Corp. * | | |
Madison Square Garden Sports Corp. | | |
| | |
| | |
| | |
MediaAlpha, Inc., Class A * | | |
Meta Platforms, Inc., Class A * | | |
| | |
| | |
| | |
Nexstar Media Group, Inc., Class A | | |
Nextdoor Holdings, Inc. * | | |
| | |
| | |
Paramount Global, Class B | | |
Pinterest, Inc., Class A * | | |
| | |
| | |
PubMatic, Inc., Class A * | | |
| | |
Quotient Technology, Inc. * | | |
Reading International, Inc., Class B * | | |
| | |
| | |
| | |
| | |
Saga Communications, Inc., Class A | | |
| | |
| | |
| | |
Sinclair Broadcast Group, Inc., Class A | | |
Sirius XM Holdings, Inc. (a) | | |
| | |
| | |
Sphere Entertainment Co. * | | |
| | |
| | |
Take-Two Interactive Software, Inc. * | | |
| | |
| | |
The Arena Group Holdings, Inc. * | | |
The E.W. Scripps Co., Class A * | | |
The Interpublic Group of Cos., Inc. | | |
| | |
The New York Times Co., Class A | | |
The Trade Desk, Inc., Class A * | | |
| | |
| | |
Townsquare Media, Inc., Class A | | |
| | |
Schwab Equity Index Funds | Semiannual Report85
Schwab Total Stock Market Index Fund
Portfolio Holdings as of April 30, 2023 (Unaudited) (continued)
| | |
| | |
| | |
| | |
| | |
| | |
Vivid Seats, Inc., Class A * | | |
Warner Bros Discovery, Inc. * | | |
Warner Music Group Corp., Class A | | |
| | |
| | |
World Wrestling Entertainment, Inc., Class A | | |
| | |
| | |
| | |
ZipRecruiter, Inc., Class A * | | |
ZoomInfo Technologies, Inc. * | | |
| | |
|
Pharmaceuticals, Biotechnology & Life Sciences 8.2% |
10X Genomics, Inc., Class A * | | |
| | |
4D Molecular Therapeutics, Inc. * | | |
| | |
| | |
| | |
Abeona Therapeutics, Inc. * | | |
| | |
ACADIA Pharmaceuticals, Inc. * | | |
AcelRx Pharmaceuticals, Inc. * | | |
Achieve Life Sciences, Inc. * | | |
Aclaris Therapeutics, Inc. * | | |
Acrivon Therapeutics, Inc. * | | |
Actinium Pharmaceuticals, Inc. * | | |
Acumen Pharmaceuticals, Inc. * | | |
Adaptive Biotechnologies Corp. * | | |
| | |
| | |
Adverum Biotechnologies, Inc. * | | |
Aerovate Therapeutics, Inc. * | | |
| | |
Agilent Technologies, Inc. | | |
Agios Pharmaceuticals, Inc. * | | |
Akebia Therapeutics, Inc. * | | |
Akero Therapeutics, Inc. * | | |
Akoya Biosciences, Inc. * | | |
Aldeyra Therapeutics, Inc. * | | |
| | |
| | |
| | |
Allogene Therapeutics, Inc. * | | |
| | |
Alnylam Pharmaceuticals, Inc. * | | |
| | |
Alpine Immune Sciences, Inc. * | | |
| | |
| | |
| | |
Amicus Therapeutics, Inc. * | | |
Amphastar Pharmaceuticals, Inc. * | | |
Amylyx Pharmaceuticals, Inc. * | | |
AN2 Therapeutics, Inc. *(a) | | |
| | |
Anavex Life Sciences Corp. *(a) | | |
ANI Pharmaceuticals, Inc. * | | |
Anika Therapeutics, Inc. * | | |
Anixa Biosciences, Inc. * | | |
| | |
| | |
| | |
Apellis Pharmaceuticals, Inc. * | | |
AquaBounty Technologies, Inc. * | | |
| | |
Arbutus Biopharma Corp. * | | |
| | |
| | |
Arcturus Therapeutics Holdings, Inc. * | | |
Arcus Biosciences, Inc. * | | |
Arcutis Biotherapeutics, Inc. * | | |
| | |
Arrowhead Pharmaceuticals, Inc. * | | |
ARS Pharmaceuticals, Inc. * | | |
| | |
Assembly Biosciences, Inc. * | | |
Assertio Holdings, Inc. * | | |
Astria Therapeutics, Inc. * | | |
Atara Biotherapeutics, Inc. * | | |
Atea Pharmaceuticals, Inc. * | | |
| | |
Atossa Therapeutics, Inc. * | | |
| | |
| | |
| | |
| | |
| | |
Avidity Biosciences, Inc. * | | |
| | |
| | |
| | |
Axsome Therapeutics, Inc. * | | |
| | |
Beam Therapeutics, Inc. * | | |
Bellerophon Therapeutics, Inc. * | | |
| | |
| | |
BioCryst Pharmaceuticals, Inc. * | | |
| | |
| | |
BioLife Solutions, Inc. * | | |
BioMarin Pharmaceutical, Inc. * | | |
| | |
Bionano Genomics, Inc. *(a) | | |
Bio-Rad Laboratories, Inc., Class A * | | |
| | |
| | |
| | |
Bioxcel Therapeutics, Inc. * | | |
Blueprint Medicines Corp. * | | |
Bolt Biotherapeutics, Inc. * | | |
BrainStorm Cell Therapeutics, Inc. * | | |
| | |
| | |
| | |
| | |
| | |
Capricor Therapeutics, Inc. * | | |
Cara Therapeutics, Inc. * | | |
| | |
| | |
Caribou Biosciences, Inc. * | | |
Carisma Therapeutics, Inc. | | |
Cassava Sciences, Inc. *(a) | | |
| | |
Catalyst Pharmaceuticals, Inc. * | | |
| | |
Celldex Therapeutics, Inc. * | | |
86Schwab Equity Index Funds | Semiannual Report
Schwab Total Stock Market Index Fund
Portfolio Holdings as of April 30, 2023 (Unaudited) (continued)
| | |
| | |
| | |
Century Therapeutics, Inc. * | | |
Cerevel Therapeutics Holdings, Inc. * | | |
Charles River Laboratories International, Inc. * | | |
Checkpoint Therapeutics, Inc. *(a) | | |
| | |
Chinook Therapeutics, Inc. * | | |
| | |
Cidara Therapeutics, Inc. * | | |
Citius Pharmaceuticals, Inc. * | | |
Clearside Biomedical, Inc. * | | |
| | |
| | |
Cogent Biosciences, Inc. * | | |
Coherus Biosciences, Inc. * | | |
Collegium Pharmaceutical, Inc. * | | |
Compass Therapeutics, Inc. * | | |
Corbus Pharmaceuticals Holdings, Inc. * | | |
Corcept Therapeutics, Inc. * | | |
| | |
Crinetics Pharmaceuticals, Inc. * | | |
| | |
| | |
| | |
| | |
Cullinan Oncology, Inc. * | | |
| | |
Cymabay Therapeutics, Inc. * | | |
Cytek Biosciences, Inc. * | | |
| | |
CytomX Therapeutics, Inc. * | | |
| | |
| | |
Day One Biopharmaceuticals, Inc. * | | |
Decibel Therapeutics, Inc. * | | |
Deciphera Pharmaceuticals, Inc. * | | |
Denali Therapeutics, Inc. * | | |
| | |
Design Therapeutics, Inc. *(a) | | |
DICE Therapeutics, Inc. * | | |
| | |
| | |
Dynavax Technologies Corp. * | | |
Dyne Therapeutics, Inc. * | | |
Eagle Pharmaceuticals, Inc. * | | |
Edgewise Therapeutics, Inc. * | | |
| | |
Elanco Animal Health, Inc. * | | |
Eledon Pharmaceuticals, Inc. * | | |
| | |
Emergent BioSolutions, Inc. * | | |
Enanta Pharmaceuticals, Inc. * | | |
Enliven Therapeutics, Inc. * | | |
Entrada Therapeutics, Inc. * | | |
| | |
| | |
Esperion Therapeutics, Inc. * | | |
Eton Pharmaceuticals, Inc. * | | |
| | |
| | |
| | |
| | |
EyePoint Pharmaceuticals, Inc. * | | |
Fate Therapeutics, Inc. * | | |
| | |
| | |
Finch Therapeutics Group, Inc. * | | |
Foghorn Therapeutics, Inc. * | | |
| | |
Frequency Therapeutics, Inc. * | | |
Fulcrum Therapeutics, Inc. * | | |
Galectin Therapeutics, Inc. * | | |
| | |
| | |
| | |
| | |
| | |
| | |
Greenwich Lifesciences, Inc. * | | |
| | |
Halozyme Therapeutics, Inc. * | | |
Harmony Biosciences Holdings, Inc. * | | |
| | |
Harvard Bioscience, Inc. * | | |
Hepion Pharmaceuticals, Inc. * | | |
| | |
Homology Medicines, Inc. * | | |
| | |
Horizon Therapeutics plc * | | |
| | |
| | |
Ideaya Biosciences, Inc. * | | |
IGM Biosciences, Inc. *(a) | | |
| | |
| | |
Immuneering Corp., Class A * | | |
| | |
| | |
| | |
| | |
| | |
Impel Pharmaceuticals, Inc. *(a) | | |
| | |
| | |
| | |
| | |
| | |
| | |
| | |
Intellia Therapeutics, Inc. * | | |
Intercept Pharmaceuticals, Inc. * | | |
Intra-Cellular Therapies, Inc. * | | |
| | |
Ionis Pharmaceuticals, Inc. * | | |
Iovance Biotherapeutics, Inc. * | | |
| | |
Ironwood Pharmaceuticals, Inc. * | | |
iTeos Therapeutics, Inc. * | | |
| | |
Janux Therapeutics, Inc. * | | |
Jasper Therapeutics, Inc. * | | |
Jazz Pharmaceuticals plc * | | |
| | |
KalVista Pharmaceuticals, Inc. * | | |
Karuna Therapeutics, Inc. * | | |
Karyopharm Therapeutics, Inc. * | | |
| | |
Keros Therapeutics, Inc. * | | |
Kezar Life Sciences, Inc. * | | |
| | |
Kiniksa Pharmaceuticals Ltd., Class A * | | |
| | |
| | |
Schwab Equity Index Funds | Semiannual Report87
Schwab Total Stock Market Index Fund
Portfolio Holdings as of April 30, 2023 (Unaudited) (continued)
| | |
| | |
| | |
Kymera Therapeutics, Inc. * | | |
| | |
Larimar Therapeutics, Inc. * | | |
Leap Therapeutics, Inc. * | | |
Lexicon Pharmaceuticals, Inc. * | | |
Ligand Pharmaceuticals, Inc. * | | |
Lineage Cell Therapeutics, Inc. * | | |
| | |
| | |
Longboard Pharmaceuticals, Inc. * | | |
Lyell Immunopharma, Inc. * | | |
Lyra Therapeutics, Inc. * | | |
| | |
Madrigal Pharmaceuticals, Inc. * | | |
Magenta Therapeutics, Inc. * | | |
| | |
| | |
Maravai LifeSciences Holdings, Inc., Class A * | | |
Marinus Pharmaceuticals, Inc. * | | |
Matinas BioPharma Holdings, Inc. * | | |
| | |
| | |
| | |
| | |
Merrimack Pharmaceuticals, Inc. * | | |
Mersana Therapeutics, Inc. * | | |
Mettler-Toledo International, Inc. * | | |
| | |
Mind Medicine MindMed, Inc. * | | |
Mineralys Therapeutics, Inc. * | | |
MiNK Therapeutics, Inc. * | | |
Mirati Therapeutics, Inc. * | | |
Miromatrix Medical, Inc. * | | |
Mirum Pharmaceuticals, Inc. * | | |
| | |
Moleculin Biotech, Inc. * | | |
Monte Rosa Therapeutics, Inc. * | | |
| | |
MyMD Pharmaceuticals, Inc. *(a) | | |
| | |
NanoString Technologies, Inc. * | | |
| | |
Nautilus Biotechnology, Inc. * | | |
Neubase Therapeutics, Inc. * | | |
Neurocrine Biosciences, Inc. * | | |
| | |
NGM Biopharmaceuticals, Inc. * | | |
| | |
| | |
| | |
NRX Pharmaceuticals, Inc. * | | |
Nurix Therapeutics, Inc. * | | |
Nuvalent, Inc., Class A * | | |
| | |
| | |
Ocular Therapeutix, Inc. * | | |
| | |
Olema Pharmaceuticals, Inc. * | | |
Omega Therapeutics, Inc. * | | |
| | |
| | |
| | |
Oncternal Therapeutics, Inc. * | | |
| | |
| | |
| | |
Organogenesis Holdings, Inc. * | | |
| | |
| | |
ORIC Pharmaceuticals, Inc. * | | |
Osmotica Pharmaceuticals plc *(a) | | |
Outlook Therapeutics, Inc. *(a) | | |
Ovid therapeutics, Inc. * | | |
Pacific Biosciences of California, Inc. * | | |
Pacira BioSciences, Inc. * | | |
Palatin Technologies, Inc. * | | |
Paratek Pharmaceuticals, Inc. * | | |
| | |
PDS Biotechnology Corp. * | | |
| | |
| | |
| | |
| | |
Perspective Therapeutics, Inc. * | | |
| | |
PharmaCyte Biotech, Inc. * | | |
Phathom Pharmaceuticals, Inc. *(a) | | |
Phibro Animal Health Corp., Class A | | |
Pieris Pharmaceuticals, Inc. * | | |
Pliant Therapeutics, Inc. * | | |
PMV Pharmaceuticals, Inc. * | | |
Point Biopharma Global, Inc. * | | |
Poseida Therapeutics, Inc. * | | |
Praxis Precision Medicines, Inc. * | | |
| | |
Precision BioSciences, Inc. * | | |
Prelude Therapeutics, Inc. * | | |
Prestige Consumer Healthcare, Inc. * | | |
Prime Medicine, Inc. *(a) | | |
| | |
Prometheus Biosciences, Inc. * | | |
| | |
Protagonist Therapeutics, Inc. * | | |
| | |
| | |
Puma Biotechnology, Inc. * | | |
Pyxis Oncology, Inc. *(a) | | |
| | |
| | |
Quince Therapeutics, Inc. * | | |
| | |
| | |
Rani Therapeutics Holdings, Inc., Class A * | | |
Rapid Micro Biosystems, Inc., Class A * | | |
RAPT Therapeutics, Inc. * | | |
Reata Pharmaceuticals, Inc., Class A * | | |
Recursion Pharmaceuticals, Inc., Class A * | | |
Regeneron Pharmaceuticals, Inc. * | | |
| | |
Regulus Therapeutics, Inc. * | | |
Relay Therapeutics, Inc. * | | |
Relmada Therapeutics, Inc. * | | |
Reneo Pharmaceuticals, Inc. * | | |
| | |
| | |
Revance Therapeutics, Inc. * | | |
Reviva Pharmaceuticals Holdings, Inc. *(a) | | |
REVOLUTION Medicines, Inc. * | | |
| | |
Rhythm Pharmaceuticals, Inc. * | | |
88Schwab Equity Index Funds | Semiannual Report
Schwab Total Stock Market Index Fund
Portfolio Holdings as of April 30, 2023 (Unaudited) (continued)
| | |
Rigel Pharmaceuticals, Inc. * | | |
Rocket Pharmaceuticals, Inc. * | | |
| | |
Royalty Pharma plc, Class A | | |
SAB Biotherapeutics, Inc. * | | |
Sage Therapeutics, Inc. * | | |
Sangamo Therapeutics, Inc. * | | |
Sarepta Therapeutics, Inc. * | | |
Satsuma Pharmaceuticals, Inc. * | | |
| | |
Scholar Rock Holding Corp. * | | |
| | |
scPharmaceuticals, Inc. *(a) | | |
| | |
| | |
Seelos Therapeutics, Inc. * | | |
Selecta Biosciences, Inc. * | | |
SELLAS Life Sciences Group, Inc. * | | |
Sera Prognostics, Inc., Class A * | | |
Seres Therapeutics, Inc. * | | |
| | |
| | |
Singular Genomics Systems, Inc. * | | |
| | |
Solid Biosciences, Inc. * | | |
| | |
| | |
Spectrum Pharmaceuticals, Inc. * | | |
Spero Therapeutics, Inc. * | | |
SpringWorks Therapeutics, Inc. * | | |
Standard BioTools, Inc. * | | |
Stoke Therapeutics, Inc. * | | |
Summit Therapeutics, Inc. * | | |
Supernus Pharmaceuticals, Inc. * | | |
| | |
| | |
Syndax Pharmaceuticals, Inc. * | | |
| | |
| | |
Synthetic Biologics, Inc. * | | |
Syros Pharmaceuticals, Inc. * | | |
Tango Therapeutics, Inc. * | | |
Tarsus Pharmaceuticals, Inc. * | | |
Taysha Gene Therapies, Inc. * | | |
TCR2 Therapeutics, Inc. * | | |
Tenaya Therapeutics, Inc. * | | |
Terns Pharmaceuticals, Inc. * | | |
| | |
| | |
Theravance Biopharma, Inc. * | | |
Thermo Fisher Scientific, Inc. | | |
Theseus Pharmaceuticals, Inc. * | | |
Third Harmonic Bio, Inc. *(a) | | |
Tracon Pharmaceuticals, Inc. * | | |
Travere Therapeutics, Inc. * | | |
Trevi Therapeutics, Inc. * | | |
| | |
| | |
Ultragenyx Pharmaceutical, Inc. * | | |
| | |
United Therapeutics Corp. * | | |
UNITY Biotechnology, Inc. * | | |
Vanda Pharmaceuticals, Inc. * | | |
| | |
| | |
Vaxxinity, Inc., Class A * | | |
| | |
Ventyx Biosciences, Inc. * | | |
| | |
Vera Therapeutics, Inc. * | | |
| | |
| | |
| | |
Verrica Pharmaceuticals, Inc. *(a) | | |
Vertex Pharmaceuticals, Inc. * | | |
Verve Therapeutics, Inc. * | | |
| | |
Vigil Neuroscience, Inc. * | | |
Viking Therapeutics, Inc. * | | |
Vir Biotechnology, Inc. * | | |
Viracta Therapeutics, Inc. * | | |
Viridian Therapeutics, Inc. * | | |
| | |
Voyager Therapeutics, Inc. * | | |
| | |
WaVe Life Sciences Ltd. * | | |
Werewolf Therapeutics, Inc. * | | |
West Pharmaceutical Services, Inc. | | |
X4 Pharmaceuticals, Inc. * | | |
| | |
| | |
Xeris Biopharma Holdings, Inc. * | | |
| | |
Zentalis Pharmaceuticals, Inc. * | | |
| | |
Zynerba Pharmaceuticals, Inc. * | | |
| | |
|
Real Estate Management & Development 0.2% |
Altisource Asset Management Corp. * | | |
Altisource Portfolio Solutions S.A. * | | |
Anywhere Real Estate, Inc. * | | |
CBRE Group, Inc., Class A * | | |
| | |
Cushman & Wakefield plc * | | |
DigitalBridge Group, Inc. | | |
| | |
| | |
| | |
| | |
| | |
| | |
Jones Lang LaSalle, Inc. * | | |
Kennedy-Wilson Holdings, Inc. | | |
| | |
Maui Land & Pineapple Co., Inc. * | | |
Newmark Group, Inc., Class A | | |
Opendoor Technologies, Inc. * | | |
Rafael Holdings, Inc., Class B * | | |
RE/MAX Holdings, Inc., Class A | | |
| | |
Seritage Growth Properties, Class A * | | |
| | |
| | |
The Howard Hughes Corp. * | | |
The RMR Group, Inc., Class A | | |
| | |
Trinity Place Holdings, Inc. * | | |
Zillow Group, Inc., Class A * | | |
Zillow Group, Inc., Class C * | | |
| | |
|
Semiconductors & Semiconductor Equipment 5.5% |
ACM Research, Inc., Class A * | | |
Advanced Micro Devices, Inc. * | | |
Schwab Equity Index Funds | Semiannual Report89
Schwab Total Stock Market Index Fund
Portfolio Holdings as of April 30, 2023 (Unaudited) (continued)
| | |
| | |
Allegro MicroSystems, Inc. * | | |
Alpha & Omega Semiconductor Ltd. * | | |
| | |
| | |
| | |
| | |
| | |
| | |
Axcelis Technologies, Inc. * | | |
| | |
| | |
| | |
| | |
| | |
Credo Technology Group Holding Ltd. * | | |
| | |
| | |
| | |
| | |
| | |
Everspin Technologies, Inc. * | | |
| | |
| | |
| | |
| | |
indie Semiconductor, Inc., Class A * | | |
| | |
| | |
| | |
| | |
Kulicke & Soffa Industries, Inc. | | |
| | |
Lattice Semiconductor Corp. * | | |
MACOM Technology Solutions Holdings, Inc. * | | |
| | |
| | |
| | |
Microchip Technology, Inc. | | |
| | |
| | |
Monolithic Power Systems, Inc. | | |
Navitas Semiconductor Corp. * | | |
| | |
| | |
| | |
| | |
| | |
| | |
| | |
| | |
| | |
| | |
| | |
| | |
| | |
Rigetti Computing, Inc., Class A * | | |
| | |
Silicon Laboratories, Inc. * | | |
| | |
SkyWater Technology, Inc. * | | |
| | |
SMART Global Holdings, Inc. * | | |
SolarEdge Technologies, Inc. * | | |
| | |
| | |
| | |
| | |
| | |
Ultra Clean Holdings, Inc. * | | |
| | |
Veeco Instruments, Inc. * | | |
| | |
| | |
|
Software & Services 10.7% |
| | |
| | |
| | |
| | |
| | |
| | |
| | |
| | |
Akamai Technologies, Inc. * | | |
Alarm.com Holdings, Inc. * | | |
Alkami Technology, Inc. * | | |
Altair Engineering, Inc., Class A * | | |
| | |
American Software, Inc., Class A | | |
Amplitude, Inc., Class A * | | |
| | |
Appfolio, Inc., Class A * | | |
| | |
AppLovin Corp., Class A * | | |
| | |
| | |
| | |
Atlassian Corp., Class A * | | |
| | |
| | |
| | |
Backblaze, Inc., Class A * | | |
Bentley Systems, Inc., Class B | | |
BigCommerce Holdings, Inc. * | | |
Bill.com Holdings, Inc. * | | |
| | |
| | |
| | |
Blend Labs, Inc., Class A * | | |
| | |
| | |
| | |
C3.ai, Inc., Class A *(a) | | |
Cadence Design Systems, Inc. * | | |
| | |
CCC Intelligent Solutions Holdings, Inc. * | | |
| | |
| | |
| | |
Clear Secure, Inc., Class A | | |
Clearwater Analytics Holdings, Inc., Class A * | | |
Cloudflare, Inc., Class A * | | |
Cognizant Technology Solutions Corp., Class A | | |
CommVault Systems, Inc. * | | |
Computer Task Group, Inc. * | | |
Confluent, Inc., Class A * | | |
Consensus Cloud Solutions, Inc. * | | |
| | |
| | |
Crowdstrike Holdings, Inc., Class A * | | |
90Schwab Equity Index Funds | Semiannual Report
Schwab Total Stock Market Index Fund
Portfolio Holdings as of April 30, 2023 (Unaudited) (continued)
| | |
| | |
| | |
Cyxtera Technologies, Inc. * | | |
| | |
DecisionPoint Systems, Inc. * | | |
| | |
| | |
DigitalOcean Holdings, Inc. * | | |
| | |
Dolby Laboratories, Inc., Class A | | |
| | |
DoubleVerify Holdings, Inc. * | | |
| | |
| | |
| | |
| | |
E2open Parent Holdings, Inc. * | | |
| | |
| | |
| | |
| | |
Embark Technology, Inc. * | | |
Enfusion, Inc., Class A * | | |
| | |
| | |
| | |
| | |
| | |
Expensify, Inc., Class A * | | |
| | |
| | |
| | |
ForgeRock, Inc., Class A * | | |
| | |
Freshworks, Inc., Class A * | | |
| | |
| | |
| | |
| | |
| | |
Grid Dynamics Holdings, Inc. * | | |
Guidewire Software, Inc. * | | |
HashiCorp, Inc., Class A * | | |
| | |
Informatica, Inc., Class A * | | |
Information Services Group, Inc. | | |
Instructure Holdings, Inc. * | | |
| | |
| | |
International Business Machines Corp. | | |
| | |
| | |
| | |
| | |
| | |
| | |
| | |
| | |
LiveRamp Holdings, Inc. * | | |
Manhattan Associates, Inc. * | | |
Marathon Digital Holdings, Inc. *(a) | | |
| | |
| | |
| | |
| | |
MicroStrategy, Inc., Class A * | | |
| | |
| | |
| | |
| | |
| | |
| | |
| | |
| | |
| | |
| | |
| | |
| | |
| | |
| | |
| | |
| | |
| | |
| | |
Palantir Technologies, Inc., Class A * | | |
Palo Alto Networks, Inc. * | | |
| | |
| | |
| | |
| | |
| | |
| | |
PowerSchool Holdings, Inc., Class A * | | |
Procore Technologies, Inc. * | | |
| | |
| | |
| | |
| | |
Qualtrics International, Inc., Class A * | | |
| | |
Quantum Computing, Inc. * | | |
| | |
| | |
| | |
RingCentral, Inc., Class A * | | |
Riot Platforms, Inc. *(a) | | |
| | |
| | |
| | |
SecureWorks Corp., Class A * | | |
SEMrush Holdings, Inc., Class A * | | |
SentinelOne, Inc., Class A * | | |
| | |
| | |
Smartsheet, Inc., Class A * | | |
Smith Micro Software, Inc. * | | |
Snowflake, Inc., Class A * | | |
| | |
SoundHound AI, Inc., Class A *(a) | | |
| | |
Sprinklr, Inc., Class A * | | |
Sprout Social, Inc., Class A * | | |
| | |
Squarespace, Inc., Class A * | | |
| | |
Synchronoss Technologies, Inc. * | | |
| | |
| | |
| | |
| | |
Thoughtworks Holding, Inc. * | | |
| | |
| | |
Tyler Technologies, Inc. * | | |
| | |
| | |
Schwab Equity Index Funds | Semiannual Report91
Schwab Total Stock Market Index Fund
Portfolio Holdings as of April 30, 2023 (Unaudited) (continued)
| | |
| | |
| | |
| | |
| | |
| | |
| | |
| | |
Viant Technology, Inc., Class A * | | |
| | |
| | |
Weave Communications, Inc. * | | |
| | |
| | |
| | |
| | |
| | |
| | |
Zeta Global Holdings Corp., Class A * | | |
Zoom Video Communications, Inc., Class A * | | |
| | |
| | |
| | |
|
Technology Hardware & Equipment 8.0% |
| | |
| | |
Advanced Energy Industries, Inc. | | |
Aeva Technologies, Inc. * | | |
| | |
| | |
Airspan Networks Holdings, Inc. * | | |
Akoustis Technologies, Inc. * | | |
Alpine 4 Holdings, Inc. * | | |
| | |
| | |
Applied Optoelectronics, Inc. * | | |
| | |
Arlo Technologies, Inc. * | | |
Arrow Electronics, Inc. * | | |
| | |
| | |
| | |
| | |
| | |
| | |
| | |
| | |
Benchmark Electronics, Inc. | | |
Boxlight Corp., Class A * | | |
| | |
| | |
| | |
| | |
| | |
| | |
| | |
| | |
| | |
Coda Octopus Group, Inc. * | | |
| | |
| | |
CommScope Holding Co., Inc. * | | |
Comtech Telecommunications Corp. | | |
| | |
| | |
| | |
| | |
| | |
| | |
Dell Technologies, Inc., Class C | | |
| | |
Digi International, Inc. * | | |
| | |
| | |
| | |
| | |
Evolv Technologies Holdings, Inc. * | | |
| | |
| | |
| | |
FARO Technologies, Inc. * | | |
Focus Universal, Inc. *(a) | | |
Frequency Electronics, Inc. | | |
| | |
| | |
Hewlett Packard Enterprise Co. | | |
| | |
| | |
| | |
| | |
Insight Enterprises, Inc. * | | |
| | |
| | |
| | |
| | |
| | |
| | |
| | |
| | |
Keysight Technologies, Inc. * | | |
Kimball Electronics, Inc. * | | |
| | |
| | |
| | |
Lightwave Logic, Inc. *(a) | | |
| | |
Lumentum Holdings, Inc. * | | |
| | |
Methode Electronics, Inc. | | |
| | |
| | |
Mirion Technologies, Inc. * | | |
| | |
| | |
Napco Security Technologies, Inc. * | | |
National Instruments Corp. | | |
| | |
| | |
| | |
| | |
| | |
| | |
Ondas Holdings, Inc. *(a) | | |
| | |
| | |
| | |
| | |
| | |
| | |
| | |
| | |
Presto Automation, Inc. * | | |
Pure Storage, Inc., Class A * | | |
| | |
| | |
92Schwab Equity Index Funds | Semiannual Report
Schwab Total Stock Market Index Fund
Portfolio Holdings as of April 30, 2023 (Unaudited) (continued)
| | |
Research Frontiers, Inc. * | | |
| | |
Ribbon Communications, Inc. * | | |
Richardson Electronics Ltd/United States | | |
| | |
| | |
| | |
Seagate Technology Holdings plc | | |
| | |
| | |
Super Micro Computer, Inc. * | | |
| | |
| | |
Teledyne Technologies, Inc. * | | |
TransAct Technologies, Inc. * | | |
| | |
| | |
| | |
| | |
| | |
| | |
Vishay Intertechnology, Inc. | | |
Vishay Precision Group, Inc. * | | |
| | |
Wayside Technology Group, Inc. | | |
| | |
Wireless Telecom Group, Inc. * | | |
Wrap Technologies, Inc. *(a) | | |
| | |
Zebra Technologies Corp., Class A * | | |
| | |
|
Telecommunication Services 1.0% |
| | |
AST SpaceMobile, Inc. *(a) | | |
| | |
| | |
Bandwidth, Inc., Class A * | | |
Charge Enterprises, Inc. * | | |
Cogent Communications Holdings, Inc. | | |
Consolidated Communications Holdings, Inc. * | | |
EchoStar Corp., Class A * | | |
Frontier Communications Parent, Inc. * | | |
| | |
| | |
| | |
Iridium Communications, Inc. | | |
KORE Group Holdings, Inc. * | | |
Liberty Global plc, Class A * | | |
Liberty Global plc, Class C * | | |
Liberty Latin America Ltd., Class A * | | |
Liberty Latin America Ltd., Class C * | | |
| | |
NII Holdings, Inc. Escrow *(c) | | |
| | |
Radius Global Infrastructure, Inc., Class A * | | |
Shenandoah Telecommunications Co. | | |
| | |
| | |
Telephone & Data Systems, Inc. | | |
| | |
| | |
United States Cellular Corp. * | | |
Verizon Communications, Inc. | | |
| | |
|
|
Air Transport Services Group, Inc. * | | |
| | |
| | |
American Airlines Group, Inc. * | | |
| | |
Avis Budget Group, Inc. * | | |
Bird Global, Inc., Class A * | | |
Blade Air Mobility, Inc. * | | |
C.H. Robinson Worldwide, Inc. | | |
Covenant Logistics Group, Inc. | | |
| | |
| | |
| | |
Eagle Bulk Shipping, Inc. | | |
Expeditors International of Washington, Inc. | | |
| | |
| | |
Frontier Group Holdings, Inc. * | | |
FTAI Infrastructure, Inc. | | |
Genco Shipping & Trading Ltd. | | |
| | |
Hawaiian Holdings, Inc. * | | |
| | |
Hertz Global Holdings, Inc. * | | |
Hub Group, Inc., Class A * | | |
JB Hunt Transport Services, Inc. | | |
| | |
| | |
| | |
Knight-Swift Transportation Holdings, Inc. | | |
| | |
| | |
| | |
| | |
| | |
| | |
Old Dominion Freight Line, Inc. | | |
P.A.M. Transportation Services, Inc. * | | |
Pangaea Logistics Solutions Ltd. | | |
Radiant Logistics, Inc. * | | |
| | |
| | |
| | |
Schneider National, Inc., Class B | | |
| | |
| | |
| | |
Sun Country Airlines Holdings, Inc. * | | |
Uber Technologies, Inc. * | | |
| | |
U-Haul Holding Co. - Non Voting | | |
| | |
United Airlines Holdings, Inc. * | | |
United Parcel Service, Inc., Class B | | |
Universal Logistics Holdings, Inc. | | |
US Xpress Enterprises, Inc., Class A * | | |
| | |
| | |
Schwab Equity Index Funds | Semiannual Report93
Schwab Total Stock Market Index Fund
Portfolio Holdings as of April 30, 2023 (Unaudited) (continued)
| | |
| | |
| | |
|
|
| | |
| | |
| | |
| | |
American Electric Power Co., Inc. | | |
American States Water Co. | | |
American Water Works Co., Inc. | | |
Artesian Resources Corp., Class A | | |
| | |
| | |
| | |
| | |
| | |
California Water Service Group | | |
| | |
Chesapeake Utilities Corp. | | |
Clearway Energy, Inc., Class A | | |
Clearway Energy, Inc., Class C | | |
| | |
Consolidated Edison, Inc. | | |
Consolidated Water Co., Ltd. | | |
Constellation Energy Corp. | | |
| | |
| | |
| | |
| | |
| | |
Essential Utilities, Inc. | | |
| | |
| | |
| | |
| | |
Genie Energy Ltd., Class B | | |
Global Water Resources, Inc. | | |
Hawaiian Electric Industries, Inc. | | |
| | |
| | |
| | |
Montauk Renewables, Inc. * | | |
| | |
New Jersey Resources Corp. | | |
| | |
| | |
Northwest Natural Holding Co. | | |
| | |
| | |
| | |
| | |
| | |
| | |
| | |
Pinnacle West Capital Corp. | | |
| | |
Portland General Electric Co. | | |
| | |
Public Service Enterprise Group, Inc. | | |
| | |
| | |
| | |
| | |
Southwest Gas Holdings, Inc. | | |
| | |
Spruce Power Holding Corp. * | | |
| | |
Sunnova Energy International, Inc. * | | |
| | |
| | |
| | |
| | |
| | |
| | |
| | |
| | |
| | |
| | |
Total Common Stocks
(Cost $9,650,261,464) | |
|
PREFERRED STOCKS 0.0% OF NET ASSETS |
|
|
| | |
Total Preferred Stocks
(Cost $529) | |
|
RIGHTS 0.0% OF NET ASSETS |
|
Pharmaceuticals, Biotechnology & Life Sciences 0.0% |
Aduro Biotech, Inc. CVR *(c) | | |
Carisma Therapeutics, Inc. CVR *(c) | | |
F-star Therapeutics, Inc. Agonist CVR *(c) | | |
F-star Therapeutics, Inc. Antagonist CVR *(c) | | |
| | |
| | |
Total Rights
(Cost $3,686) | |
| | |
SHORT-TERM INVESTMENTS 0.2% OF NET ASSETS |
|
|
State Street Institutional U.S. Government Money Market Fund, Premier Class 4.76% (e)(f) | | |
Total Short-Term Investments
(Cost $30,743,334) | |
Total Investments in Securities
(Cost $9,681,009,013) | |
94Schwab Equity Index Funds | Semiannual Report
Schwab Total Stock Market Index Fund
Portfolio Holdings as of April 30, 2023 (Unaudited) (continued)
| | | CURRENT VALUE/
UNREALIZED
APPRECIATION
(DEPRECIATION)
($) |
|
| | | |
Russell 2000 Index, e-mini, expires 06/16/23 | | | |
S&P 500 Index, e-mini, expires 06/16/23 | | | |
Net Unrealized Appreciation | |
| Non-income producing security. |
| All or a portion of this security is on loan. Securities on loan were valued at $29,250,234. |
| First Republic Bank was placed into receivership with the Federal Deposit Insurance Corp. due to inadequate liquidity and insolvency on May 1, 2023 and the position has subsequently been sold. |
| Fair valued using significant unobservable inputs (see financial note 2(a), Securities for which no quoted value is available, for additional information). |
| Issuer is affiliated with the fund’s investment adviser. |
| The rate shown is the annualized 7-day yield. |
| Security purchased with cash collateral received for securities on loan. |
| |
| Real Estate Investment Trust |
Below is a summary of the fund’s transactions with affiliated issuers during the period ended April 30, 2023:
| | | | | NET CHANGE IN UNREALIZED APPRECIATION (DEPRECIATION) | | BALANCE OF SHARES HELD AT 4/30/23 | |
COMMON STOCKS 0.2% OF NET ASSETS |
|
|
| | | | | | | | |
The following is a summary of the inputs used to value the fund’s investments as of April 30, 2023 (see financial note 2(a) for additional information):
| QUOTED PRICES IN
ACTIVE MARKETS FOR
IDENTICAL ASSETS
(LEVEL 1) | OTHER SIGNIFICANT
OBSERVABLE INPUTS
(LEVEL 2) | SIGNIFICANT
UNOBSERVABLE INPUTS
(LEVEL 3) | |
| | | | |
| | | | |
Equity Real Estate Investment Trusts (REITs) | | | | |
Health Care Equipment & Services | | | | |
Pharmaceuticals, Biotechnology & Life Sciences | | | | |
Telecommunication Services | | | | |
| | | | |
| | | | |
| | | | |
Pharmaceuticals, Biotechnology & Life Sciences | | | | |
| | | | |
| | | | |
| | | | |
| | | | |
| | | | |
| Level 3 amount shown includes securities determined to have no value at April 30, 2023. |
| As categorized in the Portfolio Holdings. |
| Futures contracts are reported at cumulative unrealized appreciation or depreciation. |
Fund investments in mutual funds are classified as Level 1, without consideration to the classification level of the underlying
securities held by the mutual funds, which could be Level 1, Level 2 or Level 3.
Schwab Equity Index Funds | Semiannual Report95
Schwab Total Stock Market Index Fund
Statement of Assets and Liabilities
As of April 30, 2023; unaudited
|
Investments in securities, at value - affiliated (cost $24,850,160) | | |
Investments in securities, at value - unaffiliated (cost $9,656,158,853) including securities on loan of $29,250,234 | | |
| | |
Deposit with broker for futures contracts | | |
| | |
| | |
| | |
Variation margin on future contracts | | |
Income from securities on loan | | |
| | |
| | |
|
|
Collateral held for securities on loan | | |
| | |
| | |
| | |
| | |
| | |
| | |
|
|
Capital received from investors | | |
Total distributable earnings | | |
| | |
96Schwab Equity Index Funds | Semiannual Report
Schwab Total Stock Market Index Fund
Statement of Operations
For the period November 1, 2022 through April 30, 2023; unaudited |
|
Dividends received from securities - unaffiliated (net of foreign withholding tax of $37,125) | | |
Dividends received from securities - affiliated | | |
| | |
| | |
|
|
| | |
| | |
| | |
| | |
|
REALIZED AND UNREALIZED GAINS (LOSSES) |
Net realized losses on sales of securities - affiliated | | |
Net realized losses on sales of securities - unaffiliated | | |
Net realized gains on futures contracts | | |
| | |
Net change in unrealized appreciation (depreciation) on securities - affiliated | | |
Net change in unrealized appreciation (depreciation) on securities - unaffiliated | | |
Net change in unrealized appreciation (depreciation) on futures contracts | | |
Net change in unrealized appreciation (depreciation) | | |
Net realized and unrealized gains | | |
Increase in net assets resulting from operations | | |
| Proxy fees are non-routine expenses (see financial note 2(e) for additional information). |
Schwab Equity Index Funds | Semiannual Report97
Schwab Total Stock Market Index Fund
Statement of Changes in Net Assets
For the current and prior report periods
Figures for the current period are unaudited
|
| | |
| | | |
| | | |
Net change in unrealized appreciation (depreciation) | | | |
Increase (decrease) in net assets resulting from operations | | | |
|
DISTRIBUTIONS TO SHAREHOLDERS |
| | | |
TRANSACTIONS IN FUND SHARES |
| | |
| | | | | |
| | | | | |
| | | | | |
| | | | | |
Net transactions in fund shares | | | | | |
|
SHARES OUTSTANDING AND NET ASSETS |
| | |
| | | | | |
| | | | | |
Total increase (decrease) | | | | | |
| | | | | |
98Schwab Equity Index Funds | Semiannual Report
Schwab U.S. Large-Cap Growth Index Fund
Financial Statements
| | | | | | |
|
Net asset value at beginning of period | | | | | | |
Income (loss) from investment operations: | | | | | | |
Net investment income (loss)2 | | | | | | |
Net realized and unrealized gains (losses) | | | | | | |
Total from investment operations | | | | | | |
| | | | | | |
Distributions from net investment income | | | | | | |
Distributions from net realized gains | | | | | | |
| | | | | | |
Net asset value at end of period | | | | | | |
| | | | | | |
|
Ratios to average net assets: | | | | | | |
| | | | | | |
| | | | | | |
Net investment income (loss) | | | | | | |
| | | | | | |
Net assets, end of period (x 1,000,000) | | | | | | |
| |
| Commencement of operations. |
| Calculated based on the average shares outstanding during the period. |
| The per share amount does not accord with the change in aggregate gains and losses in securities during the period because of the timing of fund transactions in relation to fluctuating market values. |
| |
| |
| Ratio includes less than 0.0005% of non-routine proxy expenses. |
| Effective December 20, 2018, the annual operating expense ratio was reduced to 0.035%. The ratio presented for period ended 10/31/19 is a blended ratio. |
| The investment adviser voluntarily agreed to waive the fund’s management fees to 0.00% beginning with the fund’s commencement of operations through June 30, 2018. The ratio presented for period ended 10/31/18 is a blended ratio. |
Schwab Equity Index Funds | Semiannual Report99
Schwab U.S. Large-Cap Growth Index Fund
Portfolio Holdings as of April 30, 2023 (Unaudited)
This section shows all the securities in the fund’s portfolio and their values as of the report date.
The fund files its complete schedule of portfolio holdings with the U.S. Securities and Exchange Commission (SEC) for the first and third quarters of each fiscal year on Form N-PORT Part F. The fund’s Form N-PORT Part F is available on the SEC’s website at www.sec.gov. You can also obtain this information at no cost on the fund’s website at www.schwabassetmanagement.com/schwabfunds_prospectus, by calling 1-866-414-6349, or by sending an email request to orders@mysummaryprospectus.com. The fund also makes available its complete schedule of portfolio holdings 15 to 20 days after the end of the month on the fund’s website.
| | |
COMMON STOCKS 99.5% OF NET ASSETS |
|
Automobiles & Components 2.2% |
| | |
| | |
| | |
| | |
|
|
First Citizens BancShares, Inc., Class A | | |
| | |
| | |
|
|
| | |
Advanced Drainage Systems, Inc. | | |
| | |
| | |
| | |
Allison Transmission Holdings, Inc. | | |
Armstrong World Industries, Inc. | | |
| | |
| | |
| | |
| | |
ChargePoint Holdings, Inc. *(a) | | |
Core & Main, Inc., Class A * | | |
| | |
| | |
| | |
| | |
Fortune Brands Innovations, Inc. | | |
| | |
| | |
| | |
| | |
| | |
Honeywell International, Inc. | | |
| | |
Huntington Ingalls Industries, Inc. | | |
| | |
Illinois Tool Works, Inc. | | |
Lincoln Electric Holdings, Inc. | | |
| | |
| | |
| | |
| | |
| | |
| | |
| | |
| | |
| | |
Rockwell Automation, Inc. | | |
SiteOne Landscape Supply, Inc. * | | |
| | |
Spirit AeroSystems Holdings, Inc., Class A | | |
| | |
| | |
| | |
| | |
| | |
| | |
| | |
| | |
| | |
| | |
| | |
WESCO International, Inc. | | |
WillScot Mobile Mini Holdings Corp. * | | |
| | |
| | |
|
Commercial & Professional Services 2.0% |
Automatic Data Processing, Inc. | | |
Booz Allen Hamilton Holding Corp. | | |
Broadridge Financial Solutions, Inc. | | |
Ceridian HCM Holding, Inc. * | | |
| | |
| | |
| | |
Driven Brands Holdings, Inc. * | | |
| | |
| | |
| | |
| | |
| | |
| | |
| | |
Paylocity Holding Corp. * | | |
| | |
Ritchie Bros Auctioneers, Inc. | | |
Robert Half International, Inc. | | |
| | |
| | |
| | |
| | |
| | |
| | |
|
Consumer Discretionary Distribution & Retail 7.8% |
| | |
| | |
| | |
| | |
Burlington Stores, Inc. * | | |
| | |
| | |
| | |
| | |
| | |
100Schwab Equity Index Funds | Semiannual Report
Schwab U.S. Large-Cap Growth Index Fund
Portfolio Holdings as of April 30, 2023 (Unaudited) (continued)
| | |
Floor & Decor Holdings, Inc., Class A * | | |
| | |
| | |
| | |
| | |
Ollie's Bargain Outlet Holdings, Inc. * | | |
O'Reilly Automotive, Inc. * | | |
| | |
| | |
| | |
| | |
| | |
| | |
| | |
| | |
Victoria's Secret & Co. * | | |
| | |
| | |
| | |
|
Consumer Durables & Apparel 1.3% |
| | |
| | |
| | |
Lululemon Athletica, Inc. * | | |
| | |
| | |
| | |
| | |
| | |
Skechers U.S.A., Inc., Class A * | | |
| | |
| | |
| | |
| | |
| | |
|
|
| | |
| | |
Bright Horizons Family Solutions, Inc. * | | |
Caesars Entertainment, Inc. * | | |
Chipotle Mexican Grill, Inc. * | | |
Choice Hotels International, Inc. | | |
| | |
| | |
| | |
DoorDash, Inc., Class A * | | |
DraftKings, Inc., Class A * | | |
| | |
| | |
Hilton Worldwide Holdings, Inc. | | |
| | |
Marriott International, Inc., Class A | | |
| | |
| | |
Norwegian Cruise Line Holdings Ltd. * | | |
Planet Fitness, Inc., Class A * | | |
Six Flags Entertainment Corp. * | | |
| | |
| | |
| | |
| | |
Wyndham Hotels & Resorts, Inc. | | |
| | |
| | |
| | |
| | |
|
Consumer Staples Distribution & Retail 1.9% |
BJ's Wholesale Club Holdings, Inc. * | | |
| | |
| | |
| | |
Grocery Outlet Holding Corp. * | | |
Performance Food Group Co. * | | |
| | |
| | |
| | |
|
|
| | |
| | |
| | |
| | |
| | |
| | |
| | |
| | |
| | |
New Fortress Energy, Inc. | | |
Occidental Petroleum Corp. | | |
| | |
| | |
| | |
Pioneer Natural Resources Co. | | |
| | |
Southwestern Energy Co. * | | |
| | |
| | |
| | |
|
Equity Real Estate Investment Trusts (REITs) 1.4% |
| | |
Apartment Income REIT Corp. | | |
| | |
| | |
| | |
Equity LifeStyle Properties, Inc. | | |
Extra Space Storage, Inc. | | |
| | |
Lamar Advertising Co., Class A | | |
| | |
| | |
Simon Property Group, Inc. | | |
| | |
|
|
| | |
Ameriprise Financial, Inc. | | |
Apollo Global Management, Inc. | | |
Ares Management Corp., Class A | | |
| | |
| | |
Credit Acceptance Corp. * | | |
Euronet Worldwide, Inc. * | | |
FactSet Research Systems, Inc. | | |
| | |
FleetCor Technologies, Inc. * | | |
Jack Henry & Associates, Inc. | | |
Schwab Equity Index Funds | Semiannual Report101
Schwab U.S. Large-Cap Growth Index Fund
Portfolio Holdings as of April 30, 2023 (Unaudited) (continued)
| | |
LPL Financial Holdings, Inc. | | |
MarketAxess Holdings, Inc. | | |
Mastercard, Inc., Class A | | |
| | |
| | |
| | |
| | |
Raymond James Financial, Inc. | | |
Rocket Cos., Inc., Class A *(a) | | |
Shift4 Payments, Inc., Class A * | | |
The Charles Schwab Corp. (b) | | |
| | |
| | |
Tradeweb Markets, Inc., Class A | | |
Upstart Holdings, Inc. *(a) | | |
| | |
| | |
| | |
| | |
|
Food, Beverage & Tobacco 2.6% |
Brown-Forman Corp., Class A | | |
Brown-Forman Corp., Class B | | |
Darling Ingredients, Inc. * | | |
| | |
| | |
Lamb Weston Holdings, Inc. | | |
| | |
| | |
| | |
The Boston Beer Co., Inc., Class A * | | |
| | |
| | |
| | |
|
Health Care Equipment & Services 5.3% |
| | |
| | |
| | |
| | |
Baxter International, Inc. | | |
| | |
| | |
| | |
| | |
Definitive Healthcare Corp. * | | |
| | |
Doximity, Inc., Class A * | | |
Edwards Lifesciences Corp. * | | |
| | |
| | |
Globus Medical, Inc., Class A * | | |
| | |
| | |
| | |
| | |
IDEXX Laboratories, Inc. * | | |
| | |
Intuitive Surgical, Inc. * | | |
| | |
| | |
Molina Healthcare, Inc. * | | |
| | |
| | |
| | |
| | |
| | |
Tandem Diabetes Care, Inc. * | | |
| | |
| | |
Veeva Systems, Inc., Class A * | | |
| | |
|
Household & Personal Products 1.6% |
Church & Dwight Co., Inc. | | |
| | |
| | |
| | |
| | |
The Estee Lauder Cos., Inc., Class A | | |
| | |
| | |
|
|
| | |
Arch Capital Group Ltd. * | | |
Arthur J. Gallagher & Co. | | |
| | |
| | |
Erie Indemnity Co., Class A | | |
| | |
| | |
| | |
Marsh & McLennan Cos., Inc. | | |
RenaissanceRe Holdings Ltd. | | |
Ryan Specialty Holdings, Inc., Class A * | | |
| | |
| | |
|
|
| | |
Ardagh Metal Packaging S.A. | | |
| | |
Axalta Coating Systems Ltd. * | | |
| | |
| | |
CF Industries Holdings, Inc. | | |
| | |
| | |
| | |
| | |
Ginkgo Bioworks Holdings, Inc. * | | |
Graphic Packaging Holding Co. | | |
| | |
| | |
Martin Marietta Materials, Inc. | | |
| | |
| | |
| | |
| | |
| | |
| | |
| | |
| | |
The Scotts Miracle-Gro Co. | | |
| | |
| | |
| | |
|
102Schwab Equity Index Funds | Semiannual Report
Schwab U.S. Large-Cap Growth Index Fund
Portfolio Holdings as of April 30, 2023 (Unaudited) (continued)
| | |
Media & Entertainment 7.3% |
Alphabet, Inc., Class A * | | |
Alphabet, Inc., Class C * | | |
| | |
Charter Communications, Inc., Class A * | | |
| | |
Liberty Broadband Corp., Class A * | | |
Liberty Broadband Corp., Class C * | | |
Liberty Media Corp. - Liberty Formula One, Class C * | | |
Liberty Media Corp. - Liberty SiriusXM, Class A * | | |
Liberty Media Corp. - Liberty SiriusXM, Class C * | | |
Live Nation Entertainment, Inc. * | | |
Madison Square Garden Sports Corp. | | |
| | |
Meta Platforms, Inc., Class A * | | |
| | |
Nexstar Media Group, Inc., Class A | | |
Pinterest, Inc., Class A * | | |
| | |
| | |
| | |
Spotify Technology S.A. * | | |
Take-Two Interactive Software, Inc. * | | |
The Trade Desk, Inc., Class A * | | |
| | |
| | |
Warner Bros Discovery, Inc. * | | |
World Wrestling Entertainment, Inc., Class A | | |
ZoomInfo Technologies, Inc. * | | |
| | |
|
Pharmaceuticals, Biotechnology & Life Sciences 6.7% |
10X Genomics, Inc., Class A * | | |
| | |
Agilent Technologies, Inc. | | |
Alnylam Pharmaceuticals, Inc. * | | |
| | |
| | |
| | |
| | |
| | |
Charles River Laboratories International, Inc. * | | |
| | |
| | |
| | |
| | |
Horizon Therapeutics plc * | | |
| | |
Ionis Pharmaceuticals, Inc. * | | |
| | |
Maravai LifeSciences Holdings, Inc., Class A * | | |
| | |
Mettler-Toledo International, Inc. * | | |
| | |
| | |
Neurocrine Biosciences, Inc. * | | |
| | |
Regeneron Pharmaceuticals, Inc. * | | |
| | |
Sarepta Therapeutics, Inc. * | | |
| | |
| | |
| | |
| | |
Thermo Fisher Scientific, Inc. | | |
Ultragenyx Pharmaceutical, Inc. * | | |
Vertex Pharmaceuticals, Inc. * | | |
| | |
West Pharmaceutical Services, Inc. | | |
| | |
| | |
|
Real Estate Management & Development 0.1% |
CBRE Group, Inc., Class A * | | |
Opendoor Technologies, Inc. * | | |
Zillow Group, Inc., Class C * | | |
| | |
|
Semiconductors & Semiconductor Equipment 8.3% |
Advanced Micro Devices, Inc. * | | |
Allegro MicroSystems, Inc. * | | |
| | |
| | |
| | |
| | |
| | |
GLOBALFOUNDRIES, Inc. *(a) | | |
| | |
| | |
Lattice Semiconductor Corp. * | | |
Microchip Technology, Inc. | | |
| | |
Monolithic Power Systems, Inc. | | |
| | |
| | |
| | |
| | |
| | |
| | |
| | |
|
Software & Services 19.2% |
| | |
| | |
| | |
| | |
AppLovin Corp., Class A * | | |
| | |
Atlassian Corp., Class A * | | |
| | |
Bentley Systems, Inc., Class B | | |
| | |
Cadence Design Systems, Inc. * | | |
CCC Intelligent Solutions Holdings, Inc. * | | |
Cloudflare, Inc., Class A * | | |
Confluent, Inc., Class A * | | |
Crowdstrike Holdings, Inc., Class A * | | |
| | |
| | |
DoubleVerify Holdings, Inc. * | | |
| | |
| | |
| | |
| | |
| | |
| | |
Schwab Equity Index Funds | Semiannual Report103
Schwab U.S. Large-Cap Growth Index Fund
Portfolio Holdings as of April 30, 2023 (Unaudited) (continued)
| | |
| | |
| | |
| | |
| | |
| | |
| | |
Informatica, Inc., Class A * | | |
International Business Machines Corp. | | |
| | |
| | |
Manhattan Associates, Inc. * | | |
| | |
| | |
| | |
| | |
| | |
| | |
| | |
| | |
Palantir Technologies, Inc., Class A * | | |
Palo Alto Networks, Inc. * | | |
| | |
Procore Technologies, Inc. * | | |
| | |
RingCentral, Inc., Class A * | | |
| | |
SentinelOne, Inc., Class A * | | |
| | |
Smartsheet, Inc., Class A * | | |
Snowflake, Inc., Class A * | | |
| | |
| | |
| | |
Thoughtworks Holding, Inc. * | | |
| | |
Tyler Technologies, Inc. * | | |
| | |
| | |
| | |
| | |
| | |
| | |
Zoom Video Communications, Inc., Class A * | | |
| | |
| | |
|
Technology Hardware & Equipment 13.8% |
| | |
| | |
| | |
Arrow Electronics, Inc. * | | |
| | |
| | |
| | |
| | |
Dell Technologies, Inc., Class C | | |
| | |
| | |
Keysight Technologies, Inc. * | | |
National Instruments Corp. | | |
| | |
Pure Storage, Inc., Class A * | | |
| | |
| | |
| | |
Zebra Technologies Corp., Class A * | | |
| | |
|
|
C.H. Robinson Worldwide, Inc. | | |
| | |
| | |
Expeditors International of Washington, Inc. | | |
| | |
JB Hunt Transport Services, Inc. | | |
| | |
| | |
Old Dominion Freight Line, Inc. | | |
| | |
Uber Technologies, Inc. * | | |
| | |
United Parcel Service, Inc., Class B | | |
| | |
| | |
|
|
| | |
| | |
| | |
| | |
Total Common Stocks
(Cost $838,243,004) | |
|
INVESTMENT COMPANIES 0.1% OF NET ASSETS |
|
|
iShares Russell 1000 Growth ETF | | |
Total Investment Companies
(Cost $1,031,060) | |
| | |
SHORT-TERM INVESTMENTS 0.3% OF NET ASSETS |
|
|
State Street Institutional U.S. Government Money Market Fund, Premier Class 4.76% (c) | | |
State Street Institutional U.S. Government Money Market Fund, Premier Class 4.76% (c)(d) | | |
| | |
Total Short-Term Investments
(Cost $3,174,731) | |
Total Investments in Securities
(Cost $842,448,795) | |
104Schwab Equity Index Funds | Semiannual Report
Schwab U.S. Large-Cap Growth Index Fund
Portfolio Holdings as of April 30, 2023 (Unaudited) (continued)
| | | CURRENT VALUE/
UNREALIZED
APPRECIATION
($) |
|
| | | |
Russell 1000 Growth Index, e-mini, expires 06/16/23 | | | |
S&P 500 Index, e-mini, expires 06/16/23 | | | |
Net Unrealized Appreciation | |
| Non-income producing security. |
| All or a portion of this security is on loan. Securities on loan were valued at $714,099. |
| Issuer is affiliated with the fund’s investment adviser. |
| The rate shown is the annualized 7-day yield. |
| Security purchased with cash collateral received for securities on loan. |
| |
| Real Estate Investment Trust |
Below is a summary of the fund’s transactions with affiliated issuers during the period ended April 30, 2023:
| | | | | NET CHANGE IN UNREALIZED APPRECIATION (DEPRECIATION) | | BALANCE OF SHARES HELD AT 4/30/23 | |
COMMON STOCKS 0.2% OF NET ASSETS |
|
|
| | | | | | | | |
The following is a summary of the inputs used to value the fund’s investments as of April 30, 2023 (see financial note 2(a) for additional information):
| QUOTED PRICES IN
ACTIVE MARKETS FOR
IDENTICAL ASSETS
(LEVEL 1) | OTHER SIGNIFICANT
OBSERVABLE INPUTS
(LEVEL 2) | SIGNIFICANT
UNOBSERVABLE INPUTS
(LEVEL 3) | |
| | | | |
| | | | |
| | | | |
| | | | |
| | | | |
| | | | |
| As categorized in the Portfolio Holdings. |
| Futures contracts are reported at cumulative unrealized appreciation or depreciation. |
Fund investments in mutual funds and ETFs are classified as Level 1, without consideration to the classification level of the
underlying securities held by the underlying mutual funds and ETFs, which could be Level 1, Level 2 or Level 3.
Schwab Equity Index Funds | Semiannual Report105
Schwab U.S. Large-Cap Growth Index Fund
Statement of Assets and Liabilities
As of April 30, 2023; unaudited
|
Investments in securities, at value - affiliated (cost $3,012,549) | | |
Investments in securities, at value - unaffiliated (cost $839,436,246) including securities on loan of $714,099 | | |
Deposit with broker for futures contracts | | |
| | |
| | |
| | |
Variation margin on future contracts | | |
Income from securities on loan | | |
| | |
|
|
Collateral held for securities on loan | | |
| | |
| | |
| | |
| | |
| | |
|
|
Capital received from investors | | |
Total distributable earnings | | |
| | |
106Schwab Equity Index Funds | Semiannual Report
Schwab U.S. Large-Cap Growth Index Fund
Statement of Operations
For the period November 1, 2022 through April 30, 2023; unaudited |
|
Dividends received from securities - unaffiliated (net of foreign withholding tax of $66) | | |
Dividends received from securities - affiliated | | |
| | |
| | |
|
|
| | |
| | |
| | |
|
REALIZED AND UNREALIZED GAINS (LOSSES) |
Net realized losses on sales of securities - affiliated | | |
Net realized losses on sales of securities - unaffiliated | | |
Net realized gains on futures contracts | | |
| | |
Net change in unrealized appreciation (depreciation) on securities - affiliated | | |
Net change in unrealized appreciation (depreciation) on securities - unaffiliated | | |
Net change in unrealized appreciation (depreciation) on futures contracts | | |
Net change in unrealized appreciation (depreciation) | | |
Net realized and unrealized gains | | |
Increase in net assets resulting from operations | | |
Schwab Equity Index Funds | Semiannual Report107
Schwab U.S. Large-Cap Growth Index Fund
Statement of Changes in Net Assets
For the current and prior report periods
Figures for the current period are unaudited
|
| | |
| | | |
| | | |
Net change in unrealized appreciation (depreciation) | | | |
Increase (decrease) in net assets resulting from operations | | | |
|
DISTRIBUTIONS TO SHAREHOLDERS |
| | | |
TRANSACTIONS IN FUND SHARES |
| | |
| | | | | |
| | | | | |
| | | | | |
| | | | | |
Net transactions in fund shares | | | | | |
|
SHARES OUTSTANDING AND NET ASSETS |
| | |
| | | | | |
| | | | | |
| | | | | |
| | | | | |
108Schwab Equity Index Funds | Semiannual Report
Schwab U.S. Large-Cap Value Index Fund
Financial Statements
| | | | | | |
|
Net asset value at beginning of period | | | | | | |
Income (loss) from investment operations: | | | | | | |
Net investment income (loss)2 | | | | | | |
Net realized and unrealized gains (losses) | | | | | | |
Total from investment operations | | | | | | |
| | | | | | |
Distributions from net investment income | | | | | | |
Distributions from net realized gains | | | | | | |
| | | | | | |
Net asset value at end of period | | | | | | |
| | | | | | |
|
Ratios to average net assets: | | | | | | |
| | | | | | |
| | | | | | |
Net investment income (loss) | | | | | | |
| | | | | | |
Net assets, end of period (x 1,000) | | | | | | |
| |
| Commencement of operations. |
| Calculated based on the average shares outstanding during the period. |
| |
| |
| Ratio includes less than 0.0005% of non-routine proxy expenses. |
| Effective December 20, 2018, the annual operating expense ratio was reduced to 0.035%. The ratio presented for period ended 10/31/19 is a blended ratio. |
| The investment adviser voluntarily agreed to waive the fund’s management fees to 0.00% beginning with the fund’s commencement of operations through June 30, 2018. The ratio presented for period ended 10/31/18 is a blended ratio. |
| Portfolio turnover rate excludes in-kind transactions. |
Schwab Equity Index Funds | Semiannual Report109
Schwab U.S. Large-Cap Value Index Fund
Portfolio Holdings as of April 30, 2023 (Unaudited)
This section shows all the securities in the fund’s portfolio and their values as of the report date.
The fund files its complete schedule of portfolio holdings with the U.S. Securities and Exchange Commission (SEC) for the first and third quarters of each fiscal year on Form N-PORT Part F. The fund’s Form N-PORT Part F is available on the SEC’s website at www.sec.gov. You can also obtain this information at no cost on the fund’s website at www.schwabassetmanagement.com/schwabfunds_prospectus, by calling 1-866-414-6349, or by sending an email request to orders@mysummaryprospectus.com. The fund also makes available its complete schedule of portfolio holdings 15 to 20 days after the end of the month on the fund’s website.
| | |
COMMON STOCKS 99.5% OF NET ASSETS |
|
Automobiles & Components 0.8% |
| | |
| | |
| | |
| | |
| | |
| | |
| | |
| | |
| | |
Rivian Automotive, Inc., Class A * | | |
| | |
| | |
|
|
| | |
| | |
| | |
| | |
| | |
Citizens Financial Group, Inc. | | |
Columbia Banking System, Inc. | | |
| | |
Commerce Bancshares, Inc. | | |
Cullen/Frost Bankers, Inc. | | |
| | |
| | |
| | |
First Citizens BancShares, Inc., Class A | | |
| | |
| | |
| | |
Huntington Bancshares, Inc. | | |
| | |
| | |
| | |
New York Community Bancorp, Inc. | | |
| | |
Pinnacle Financial Partners, Inc. | | |
| | |
Prosperity Bancshares, Inc. | | |
| | |
| | |
The PNC Financial Services Group, Inc. | | |
| | |
| | |
| | |
| | |
| | |
| | |
| | |
| | |
|
| | |
|
| | |
| | |
| | |
| | |
| | |
| | |
| | |
Allison Transmission Holdings, Inc. | | |
| | |
Armstrong World Industries, Inc. | | |
| | |
Builders FirstSource, Inc. * | | |
| | |
| | |
| | |
| | |
Core & Main, Inc., Class A * | | |
| | |
| | |
| | |
| | |
| | |
| | |
| | |
| | |
| | |
| | |
| | |
Fortune Brands Innovations, Inc. | | |
Gates Industrial Corp. plc * | | |
| | |
| | |
| | |
| | |
| | |
| | |
| | |
Honeywell International, Inc. | | |
| | |
| | |
Huntington Ingalls Industries, Inc. | | |
| | |
Illinois Tool Works, Inc. | | |
| | |
| | |
Johnson Controls International plc | | |
L3Harris Technologies, Inc. | | |
Lennox International, Inc. | | |
| | |
| | |
| | |
MDU Resources Group, Inc. | | |
| | |
MSC Industrial Direct Co., Inc., Class A | | |
| | |
| | |
110Schwab Equity Index Funds | Semiannual Report
Schwab U.S. Large-Cap Value Index Fund
Portfolio Holdings as of April 30, 2023 (Unaudited) (continued)
| | |
| | |
| | |
| | |
| | |
| | |
| | |
| | |
| | |
| | |
Raytheon Technologies Corp. | | |
| | |
Rockwell Automation, Inc. | | |
Sensata Technologies Holding plc | | |
SiteOne Landscape Supply, Inc. * | | |
| | |
Spirit AeroSystems Holdings, Inc., Class A | | |
Stanley Black & Decker, Inc. | | |
| | |
| | |
| | |
| | |
| | |
| | |
| | |
| | |
| | |
| | |
| | |
| | |
| | |
WESCO International, Inc. | | |
Westinghouse Air Brake Technologies Corp. | | |
WillScot Mobile Mini Holdings Corp. * | | |
| | |
| | |
| | |
|
Commercial & Professional Services 1.1% |
Automatic Data Processing, Inc. | | |
Broadridge Financial Solutions, Inc. | | |
CACI International, Inc., Class A * | | |
Ceridian HCM Holding, Inc. * | | |
| | |
| | |
| | |
| | |
| | |
Driven Brands Holdings, Inc. * | | |
Dun & Bradstreet Holdings, Inc. | | |
| | |
| | |
| | |
| | |
| | |
| | |
| | |
| | |
| | |
| | |
Ritchie Bros Auctioneers, Inc. | | |
Robert Half International, Inc. | | |
| | |
Science Applications International Corp. | | |
SS&C Technologies Holdings, Inc. | | |
| | |
| | |
| | |
| | |
| | |
| | |
|
Consumer Discretionary Distribution & Retail 1.8% |
| | |
| | |
| | |
| | |
| | |
Burlington Stores, Inc. * | | |
| | |
Dick's Sporting Goods, Inc. | | |
| | |
GameStop Corp., Class A *(a) | | |
| | |
| | |
| | |
| | |
| | |
| | |
| | |
| | |
Ollie's Bargain Outlet Holdings, Inc. * | | |
O'Reilly Automotive, Inc. * | | |
Penske Automotive Group, Inc. | | |
Petco Health & Wellness Co., Inc. * | | |
| | |
| | |
| | |
| | |
Victoria's Secret & Co. * | | |
| | |
| | |
| | |
|
Consumer Durables & Apparel 1.0% |
| | |
| | |
| | |
| | |
| | |
| | |
| | |
| | |
| | |
| | |
| | |
| | |
| | |
Mohawk Industries, Inc. * | | |
| | |
| | |
Peloton Interactive, Inc., Class A * | | |
| | |
| | |
| | |
| | |
Skechers U.S.A., Inc., Class A * | | |
| | |
Tempur Sealy International, Inc. | | |
| | |
| | |
Under Armour, Inc., Class A * | | |
Under Armour, Inc., Class C * | | |
| | |
Schwab Equity Index Funds | Semiannual Report111
Schwab U.S. Large-Cap Value Index Fund
Portfolio Holdings as of April 30, 2023 (Unaudited) (continued)
| | |
| | |
| | |
|
|
| | |
| | |
| | |
Bright Horizons Family Solutions, Inc. * | | |
Caesars Entertainment, Inc. * | | |
| | |
| | |
| | |
DoorDash, Inc., Class A * | | |
Grand Canyon Education, Inc. * | | |
| | |
Hilton Worldwide Holdings, Inc. | | |
Hyatt Hotels Corp., Class A * | | |
| | |
Marriott Vacations Worldwide Corp. | | |
| | |
MGM Resorts International | | |
| | |
Norwegian Cruise Line Holdings Ltd. * | | |
Penn Entertainment, Inc. * | | |
Planet Fitness, Inc., Class A * | | |
Royal Caribbean Cruises Ltd. * | | |
Service Corp. International | | |
Six Flags Entertainment Corp. * | | |
| | |
| | |
| | |
Wyndham Hotels & Resorts, Inc. | | |
| | |
| | |
| | |
|
Consumer Staples Distribution & Retail 1.9% |
Albertsons Cos., Inc., Class A | | |
BJ's Wholesale Club Holdings, Inc. * | | |
Casey's General Stores, Inc. | | |
| | |
Grocery Outlet Holding Corp. * | | |
Performance Food Group Co. * | | |
| | |
| | |
U.S. Foods Holding Corp. * | | |
Walgreens Boots Alliance, Inc. | | |
| | |
| | |
|
|
| | |
| | |
| | |
| | |
| | |
| | |
| | |
| | |
| | |
| | |
| | |
| | |
| | |
| | |
| | |
| | |
| | |
| | |
| | |
| | |
| | |
| | |
| | |
Occidental Petroleum Corp. | | |
| | |
| | |
| | |
| | |
Pioneer Natural Resources Co. | | |
| | |
| | |
Southwestern Energy Co. * | | |
| | |
| | |
| | |
| | |
|
Equity Real Estate Investment Trusts (REITs) 4.3% |
Alexandria Real Estate Equities, Inc. | | |
American Homes 4 Rent, Class A | | |
| | |
Americold Realty Trust, Inc. | | |
Apartment Income REIT Corp. | | |
AvalonBay Communities, Inc. | | |
| | |
Brixmor Property Group, Inc. | | |
| | |
| | |
| | |
Digital Realty Trust, Inc. | | |
| | |
EastGroup Properties, Inc. | | |
| | |
| | |
Equity LifeStyle Properties, Inc. | | |
| | |
Essex Property Trust, Inc. | | |
Extra Space Storage, Inc. | | |
Federal Realty Investment Trust | | |
First Industrial Realty Trust, Inc. | | |
Gaming & Leisure Properties, Inc. | | |
Healthcare Realty Trust, Inc. | | |
Healthpeak Properties, Inc. | | |
Highwoods Properties, Inc. | | |
Host Hotels & Resorts, Inc. | | |
Hudson Pacific Properties, Inc. | | |
| | |
| | |
| | |
| | |
| | |
Lamar Advertising Co., Class A | | |
| | |
Medical Properties Trust, Inc. | | |
Mid-America Apartment Communities, Inc. | | |
National Retail Properties, Inc. | | |
National Storage Affiliates Trust | | |
Omega Healthcare Investors, Inc. | | |
Park Hotels & Resorts, Inc. | | |
| | |
| | |
| | |
112Schwab Equity Index Funds | Semiannual Report
Schwab U.S. Large-Cap Value Index Fund
Portfolio Holdings as of April 30, 2023 (Unaudited) (continued)
| | |
| | |
| | |
Rexford Industrial Realty, Inc. | | |
| | |
Simon Property Group, Inc. | | |
| | |
Spirit Realty Capital, Inc. | | |
| | |
| | |
| | |
| | |
| | |
| | |
| | |
| | |
| | |
|
|
Affiliated Managers Group, Inc. | | |
| | |
| | |
| | |
| | |
Ameriprise Financial, Inc. | | |
Annaly Capital Management, Inc. | | |
Apollo Global Management, Inc. | | |
Berkshire Hathaway, Inc., Class B * | | |
| | |
| | |
Capital One Financial Corp. | | |
Cboe Global Markets, Inc. | | |
| | |
Coinbase Global, Inc., Class A *(a) | | |
Corebridge Financial, Inc. | | |
Credit Acceptance Corp. * | | |
Discover Financial Services | | |
| | |
Euronet Worldwide, Inc. * | | |
| | |
Fidelity National Information Services, Inc. | | |
| | |
| | |
| | |
Interactive Brokers Group, Inc., Class A | | |
Intercontinental Exchange, Inc. | | |
| | |
Janus Henderson Group plc | | |
Jefferies Financial Group, Inc. | | |
| | |
| | |
| | |
| | |
| | |
| | |
| | |
| | |
| | |
| | |
| | |
Raymond James Financial, Inc. | | |
| | |
Robinhood Markets, Inc., Class A * | | |
Rocket Cos., Inc., Class A *(a) | | |
| | |
| | |
| | |
SoFi Technologies, Inc. * | | |
| | |
Starwood Property Trust, Inc. | | |
| | |
| | |
| | |
T. Rowe Price Group, Inc. | | |
| | |
The Bank of New York Mellon Corp. | | |
| | |
The Charles Schwab Corp. (c) | | |
The Goldman Sachs Group, Inc. | | |
| | |
Tradeweb Markets, Inc., Class A | | |
| | |
| | |
Virtu Financial, Inc., Class A | | |
| | |
| | |
| | |
|
Food, Beverage & Tobacco 4.3% |
| | |
Archer-Daniels-Midland Co. | | |
Brown-Forman Corp., Class A | | |
Brown-Forman Corp., Class B | | |
| | |
| | |
| | |
Constellation Brands, Inc., Class A | | |
Darling Ingredients, Inc. * | | |
| | |
| | |
| | |
| | |
| | |
| | |
| | |
McCormick & Co., Inc. - Non Voting Shares | | |
Molson Coors Beverage Co., Class B | | |
Mondelez International, Inc., Class A | | |
| | |
| | |
Philip Morris International, Inc. | | |
| | |
| | |
| | |
The Boston Beer Co., Inc., Class A * | | |
| | |
| | |
| | |
| | |
Tyson Foods, Inc., Class A | | |
| | |
|
Health Care Equipment & Services 6.6% |
| | |
Acadia Healthcare Co., Inc. * | | |
| | |
| | |
| | |
Baxter International, Inc. | | |
| | |
Boston Scientific Corp. * | | |
| | |
| | |
| | |
| | |
Schwab Equity Index Funds | Semiannual Report113
Schwab U.S. Large-Cap Value Index Fund
Portfolio Holdings as of April 30, 2023 (Unaudited) (continued)
| | |
| | |
| | |
Definitive Healthcare Corp. * | | |
| | |
Doximity, Inc., Class A * | | |
| | |
| | |
| | |
| | |
| | |
| | |
Globus Medical, Inc., Class A * | | |
| | |
| | |
| | |
| | |
| | |
Integra LifeSciences Holdings Corp. * | | |
Intuitive Surgical, Inc. * | | |
Laboratory Corp. of America Holdings | | |
| | |
| | |
| | |
Molina Healthcare, Inc. * | | |
Oak Street Health, Inc. * | | |
| | |
| | |
| | |
| | |
| | |
Tandem Diabetes Care, Inc. * | | |
| | |
| | |
| | |
| | |
| | |
Universal Health Services, Inc., Class B | | |
Zimmer Biomet Holdings, Inc. | | |
| | |
|
Household & Personal Products 1.5% |
Church & Dwight Co., Inc. | | |
| | |
| | |
| | |
Reynolds Consumer Products, Inc. | | |
Spectrum Brands Holdings, Inc. | | |
| | |
| | |
| | |
|
|
| | |
American Financial Group, Inc. | | |
American International Group, Inc. | | |
| | |
Arch Capital Group Ltd. * | | |
Arthur J. Gallagher & Co. | | |
| | |
| | |
Axis Capital Holdings Ltd. | | |
Brighthouse Financial, Inc. * | | |
| | |
| | |
Cincinnati Financial Corp. | | |
| | |
| | |
Erie Indemnity Co., Class A | | |
| | |
F&G Annuities & Life, Inc. | | |
Fidelity National Financial, Inc. | | |
First American Financial Corp. | | |
| | |
| | |
| | |
| | |
| | |
Marsh & McLennan Cos., Inc. | | |
| | |
Old Republic International Corp. | | |
| | |
Principal Financial Group, Inc. | | |
Prudential Financial, Inc. | | |
Reinsurance Group of America, Inc. | | |
RenaissanceRe Holdings Ltd. | | |
| | |
The Hanover Insurance Group, Inc. | | |
The Hartford Financial Services Group, Inc. | | |
| | |
| | |
| | |
| | |
White Mountains Insurance Group Ltd. | | |
| | |
| | |
|
|
Air Products & Chemicals, Inc. | | |
| | |
| | |
| | |
| | |
Ardagh Metal Packaging S.A. | | |
| | |
| | |
Axalta Coating Systems Ltd. * | | |
| | |
| | |
| | |
| | |
| | |
| | |
| | |
| | |
| | |
| | |
| | |
| | |
| | |
| | |
Ginkgo Bioworks Holdings, Inc. *(a) | | |
Graphic Packaging Holding Co. | | |
| | |
International Flavors & Fragrances, Inc. | | |
| | |
| | |
| | |
LyondellBasell Industries N.V., Class A | | |
Martin Marietta Materials, Inc. | | |
| | |
| | |
| | |
| | |
Packaging Corp. of America | | |
114Schwab Equity Index Funds | Semiannual Report
Schwab U.S. Large-Cap Value Index Fund
Portfolio Holdings as of April 30, 2023 (Unaudited) (continued)
| | |
| | |
Reliance Steel & Aluminum Co. | | |
| | |
| | |
| | |
| | |
| | |
| | |
| | |
| | |
| | |
The Scotts Miracle-Gro Co. | | |
United States Steel Corp. | | |
| | |
| | |
| | |
| | |
|
Media & Entertainment 6.7% |
Activision Blizzard, Inc. * | | |
Alphabet, Inc., Class A * | | |
Alphabet, Inc., Class C * | | |
Altice USA, Inc., Class A * | | |
AMC Entertainment Holdings, Inc., Class A (a) | | |
| | |
| | |
DISH Network Corp., Class A * | | |
| | |
| | |
| | |
| | |
Liberty Broadband Corp., Class A * | | |
Liberty Broadband Corp., Class C * | | |
Liberty Media Corp. - Liberty Formula One, Class A * | | |
Liberty Media Corp. - Liberty Formula One, Class C * | | |
Liberty Media Corp. - Liberty SiriusXM, Class A * | | |
Liberty Media Corp. - Liberty SiriusXM, Class C * | | |
Live Nation Entertainment, Inc. * | | |
Madison Square Garden Sports Corp. | | |
| | |
Meta Platforms, Inc., Class A * | | |
| | |
| | |
| | |
Nexstar Media Group, Inc., Class A | | |
| | |
Paramount Global, Class A | | |
Paramount Global, Class B | | |
Pinterest, Inc., Class A * | | |
| | |
| | |
Sirius XM Holdings, Inc. (a) | | |
Take-Two Interactive Software, Inc. * | | |
The Interpublic Group of Cos., Inc. | | |
The New York Times Co., Class A | | |
| | |
| | |
Warner Bros Discovery, Inc. * | | |
| | |
|
| | |
Pharmaceuticals, Biotechnology & Life Sciences 9.8% |
10X Genomics, Inc., Class A * | | |
Agilent Technologies, Inc. | | |
| | |
| | |
| | |
| | |
BioMarin Pharmaceutical, Inc. * | | |
Bio-Rad Laboratories, Inc., Class A * | | |
| | |
| | |
Charles River Laboratories International, Inc. * | | |
| | |
Elanco Animal Health, Inc. * | | |
| | |
| | |
| | |
| | |
Horizon Therapeutics plc * | | |
| | |
| | |
Ionis Pharmaceuticals, Inc. * | | |
Jazz Pharmaceuticals plc * | | |
| | |
| | |
Mirati Therapeutics, Inc. * | | |
| | |
| | |
| | |
| | |
| | |
| | |
| | |
Regeneron Pharmaceuticals, Inc. * | | |
| | |
Royalty Pharma plc, Class A | | |
| | |
Thermo Fisher Scientific, Inc. | | |
Ultragenyx Pharmaceutical, Inc. * | | |
United Therapeutics Corp. * | | |
Vertex Pharmaceuticals, Inc. * | | |
| | |
| | |
|
Real Estate Management & Development 0.2% |
CBRE Group, Inc., Class A * | | |
Jones Lang LaSalle, Inc. * | | |
Opendoor Technologies, Inc. * | | |
The Howard Hughes Corp. * | | |
| | |
Zillow Group, Inc., Class A * | | |
Zillow Group, Inc., Class C * | | |
| | |
|
Semiconductors & Semiconductor Equipment 2.4% |
Advanced Micro Devices, Inc. * | | |
| | |
| | |
| | |
GLOBALFOUNDRIES, Inc. *(a) | | |
| | |
| | |
Microchip Technology, Inc. | | |
| | |
Schwab Equity Index Funds | Semiannual Report115
Schwab U.S. Large-Cap Value Index Fund
Portfolio Holdings as of April 30, 2023 (Unaudited) (continued)
| | |
| | |
| | |
| | |
| | |
| | |
| | |
| | |
| | |
|
|
Akamai Technologies, Inc. * | | |
| | |
| | |
Bill.com Holdings, Inc. * | | |
| | |
CCC Intelligent Solutions Holdings, Inc. * | | |
Cognizant Technology Solutions Corp., Class A | | |
Dolby Laboratories, Inc., Class A | | |
DoubleVerify Holdings, Inc. * | | |
| | |
| | |
| | |
| | |
Guidewire Software, Inc. * | | |
Informatica, Inc., Class A * | | |
International Business Machines Corp. | | |
| | |
| | |
Manhattan Associates, Inc. * | | |
| | |
| | |
| | |
| | |
| | |
Procore Technologies, Inc. * | | |
| | |
| | |
SentinelOne, Inc., Class A * | | |
Snowflake, Inc., Class A * | | |
| | |
| | |
Tyler Technologies, Inc. * | | |
| | |
| | |
| | |
| | |
| | |
Zoom Video Communications, Inc., Class A * | | |
| | |
|
Technology Hardware & Equipment 2.4% |
| | |
Arrow Electronics, Inc. * | | |
| | |
| | |
| | |
| | |
| | |
| | |
Dell Technologies, Inc., Class C | | |
| | |
Hewlett Packard Enterprise Co. | | |
| | |
| | |
| | |
| | |
| | |
Keysight Technologies, Inc. * | | |
| | |
Lumentum Holdings, Inc. * | | |
| | |
National Instruments Corp. | | |
| | |
Teledyne Technologies, Inc. * | | |
| | |
| | |
| | |
| | |
| | |
Zebra Technologies Corp., Class A * | | |
| | |
|
Telecommunication Services 2.0% |
| | |
Frontier Communications Parent, Inc. * | | |
| | |
| | |
Verizon Communications, Inc. | | |
| | |
|
|
| | |
American Airlines Group, Inc. * | | |
Avis Budget Group, Inc. * | | |
C.H. Robinson Worldwide, Inc. | | |
Copa Holdings S.A., Class A | | |
| | |
Expeditors International of Washington, Inc. | | |
| | |
| | |
Hertz Global Holdings, Inc. * | | |
JB Hunt Transport Services, Inc. | | |
| | |
| | |
Knight-Swift Transportation Holdings, Inc. | | |
| | |
| | |
| | |
| | |
| | |
Schneider National, Inc., Class B | | |
| | |
Uber Technologies, Inc. * | | |
| | |
U-Haul Holding Co. - Non Voting | | |
United Airlines Holdings, Inc. * | | |
United Parcel Service, Inc., Class B | | |
| | |
| | |
|
|
| | |
| | |
American Electric Power Co., Inc. | | |
American Water Works Co., Inc. | | |
| | |
| | |
Brookfield Renewable Corp., Class A | | |
| | |
116Schwab Equity Index Funds | Semiannual Report
Schwab U.S. Large-Cap Value Index Fund
Portfolio Holdings as of April 30, 2023 (Unaudited) (continued)
| | |
| | |
Consolidated Edison, Inc. | | |
Constellation Energy Corp. | | |
| | |
| | |
| | |
| | |
| | |
Essential Utilities, Inc. | | |
| | |
| | |
| | |
| | |
Hawaiian Electric Industries, Inc. | | |
| | |
| | |
| | |
| | |
| | |
| | |
| | |
Pinnacle West Capital Corp. | | |
| | |
Public Service Enterprise Group, Inc. | | |
| | |
| | |
| | |
| | |
| | |
| | |
| | |
| | |
Total Common Stocks
(Cost $506,745,151) | |
|
INVESTMENT COMPANIES 0.1% OF NET ASSETS |
|
|
iShares Russell 1000 Value ETF | | |
Total Investment Companies
(Cost $677,077) | |
| | |
SHORT-TERM INVESTMENTS 0.4% OF NET ASSETS |
|
|
State Street Institutional U.S. Government Money Market Fund, Premier Class 4.76% (d) | | |
State Street Institutional U.S. Government Money Market Fund, Premier Class 4.76% (d)(e) | | |
| | |
Total Short-Term Investments
(Cost $2,696,354) | |
Total Investments in Securities
(Cost $510,118,582) | |
| | | CURRENT VALUE/
UNREALIZED
APPRECIATION
($) |
|
| | | |
Russell 1000 Value Index, e-mini, expires 06/16/23 | | | |
S&P 500 Index, e-mini, expires 06/16/23 | | | |
Net Unrealized Appreciation | |
| Non-income producing security. |
| All or a portion of this security is on loan. Securities on loan were valued at $874,904. |
| First Republic Bank was placed into receivership with the Federal Deposit Insurance Corp. due to inadequate liquidity and insolvency on May 1, 2023 and the position has subsequently been sold. |
| Issuer is affiliated with the fund’s investment adviser. |
| The rate shown is the annualized 7-day yield. |
| Security purchased with cash collateral received for securities on loan. |
| |
| Real Estate Investment Trust |
Schwab Equity Index Funds | Semiannual Report117
Schwab U.S. Large-Cap Value Index Fund
Portfolio Holdings as of April 30, 2023 (Unaudited) (continued)
Below is a summary of the fund’s transactions with affiliated issuers during the period ended April 30, 2023:
| | | | | NET CHANGE IN UNREALIZED APPRECIATION (DEPRECIATION) | | BALANCE OF SHARES HELD AT 4/30/23 | |
COMMON STOCKS 0.2% OF NET ASSETS |
|
|
| | | | | | | | |
The following is a summary of the inputs used to value the fund’s investments as of April 30, 2023 (see financial note 2(a) for additional information):
| QUOTED PRICES IN
ACTIVE MARKETS FOR
IDENTICAL ASSETS
(LEVEL 1) | OTHER SIGNIFICANT
OBSERVABLE INPUTS
(LEVEL 2) | SIGNIFICANT
UNOBSERVABLE INPUTS
(LEVEL 3) | |
| | | | |
| | | | |
| | | | |
| | | | |
| | | | |
| | | | |
| As categorized in the Portfolio Holdings. |
| Futures contracts are reported at cumulative unrealized appreciation or depreciation. |
Fund investments in mutual funds and ETFs are classified as Level 1, without consideration to the classification level of the
underlying securities held by the underlying mutual funds and ETFs, which could be Level 1, Level 2 or Level 3.
118Schwab Equity Index Funds | Semiannual Report
Schwab U.S. Large-Cap Value Index Fund
Statement of Assets and Liabilities
As of April 30, 2023; unaudited
|
Investments in securities, at value - affiliated (cost $945,685) | | |
Investments in securities, at value - unaffiliated (cost $509,172,897) including securities on loan of $874,904 | | |
Deposit with broker for futures contracts | | |
| | |
| | |
| | |
Variation margin on future contracts | | |
Income from securities on loan | | |
| | |
|
|
Collateral held for securities on loan | | |
| | |
| | |
| | |
| | |
| | |
|
|
Capital received from investors | | |
Total distributable earnings | | |
| | |
Schwab Equity Index Funds | Semiannual Report119
Schwab U.S. Large-Cap Value Index Fund
Statement of Operations
For the period November 1, 2022 through April 30, 2023; unaudited |
|
Dividends received from securities - unaffiliated (net of foreign withholding tax of $961) | | |
Dividends received from securities - affiliated | | |
| | |
| | |
|
|
| | |
| | |
| | |
|
REALIZED AND UNREALIZED GAINS (LOSSES) |
Net realized gains on sales of securities - affiliated | | |
Net realized losses on sales of securities - unaffiliated | | |
Net realized gains on futures contracts | | |
| | |
Net change in unrealized appreciation (depreciation) on securities - affiliated | | |
Net change in unrealized appreciation (depreciation) on securities - unaffiliated | | |
Net change in unrealized appreciation (depreciation) on futures contracts | | |
Net change in unrealized appreciation (depreciation) | | |
Net realized and unrealized gains | | |
Increase in net assets resulting from operations | | |
120Schwab Equity Index Funds | Semiannual Report
Schwab U.S. Large-Cap Value Index Fund
Statement of Changes in Net Assets
For the current and prior report periods
Figures for the current period are unaudited
|
| | |
| | | |
Net realized gains (losses) | | | |
Net change in unrealized appreciation (depreciation) | | | |
Increase (decrease) in net assets resulting from operations | | | |
|
DISTRIBUTIONS TO SHAREHOLDERS |
| | | |
TRANSACTIONS IN FUND SHARES |
| | |
| | | | | |
| | | | | |
| | | | | |
| | | | | |
Net transactions in fund shares | | | | | |
|
SHARES OUTSTANDING AND NET ASSETS |
| | |
| | | | | |
| | | | | |
Total increase (decrease) | | | | | |
| | | | | |
Schwab Equity Index Funds | Semiannual Report121
Schwab U.S. Mid-Cap Index Fund
Financial Statements
| | | | | | |
|
Net asset value at beginning of period | | | | | | |
Income (loss) from investment operations: | | | | | | |
Net investment income (loss)2 | | | | | | |
Net realized and unrealized gains (losses) | | | | | | |
Total from investment operations | | | | | | |
| | | | | | |
Distributions from net investment income | | | | | | |
Distributions from net realized gains | | | | | | |
| | | | | | |
Net asset value at end of period | | | | | | |
| | | | | | |
|
Ratios to average net assets: | | | | | | |
| | | | | | |
| | | | | | |
Net investment income (loss) | | | | | | |
| | | | | | |
Net assets, end of period (x 1,000,000) | | | | | | |
| |
| Commencement of operations. |
| Calculated based on the average shares outstanding during the period. |
| |
| |
| Ratio includes less than 0.005% of non-routine proxy expenses. |
| Effective December 20, 2018, the annual operating expense ratio was reduced to 0.04%. The ratio presented for period ended 10/31/19 is a blended ratio. |
| The investment adviser voluntarily agreed to waive the fund’s management fees to 0.00% beginning with the fund’s commencement of operations through June 30, 2018. The ratio presented for period ended 10/31/18 is a blended ratio. |
| Portfolio turnover rate excludes in-kind transactions. |
122Schwab Equity Index Funds | Semiannual Report
Schwab U.S. Mid-Cap Index Fund
Portfolio Holdings as of April 30, 2023 (Unaudited)
This section shows all the securities in the fund’s portfolio and their values as of the report date.
The fund files its complete schedule of portfolio holdings with the U.S. Securities and Exchange Commission (SEC) for the first and third quarters of each fiscal year on Form N-PORT Part F. The fund’s Form N-PORT Part F is available on the SEC’s website at www.sec.gov. You can also obtain this information at no cost on the fund’s website at www.schwabassetmanagement.com/schwabfunds_prospectus, by calling 1-866-414-6349, or by sending an email request to orders@mysummaryprospectus.com. The fund also makes available its complete schedule of portfolio holdings 15 to 20 days after the end of the month on the fund’s website.
| | |
COMMON STOCKS 99.6% OF NET ASSETS |
|
Automobiles & Components 0.8% |
| | |
| | |
| | |
| | |
| | |
| | |
| | |
Rivian Automotive, Inc., Class A * | | |
| | |
| | |
|
|
| | |
| | |
| | |
Citizens Financial Group, Inc. | | |
Columbia Banking System, Inc. | | |
| | |
Commerce Bancshares, Inc. | | |
Cullen/Frost Bankers, Inc. | | |
| | |
| | |
| | |
First Citizens BancShares, Inc., Class A | | |
| | |
| | |
| | |
Huntington Bancshares, Inc. | | |
| | |
| | |
New York Community Bancorp, Inc. | | |
| | |
Pinnacle Financial Partners, Inc. | | |
| | |
Prosperity Bancshares, Inc. | | |
| | |
| | |
| | |
| | |
| | |
| | |
| | |
|
|
| | |
| | |
Advanced Drainage Systems, Inc. | | |
| | |
| | |
| | |
| | |
Allison Transmission Holdings, Inc. | | |
| | |
| | |
Armstrong World Industries, Inc. | | |
| | |
Builders FirstSource, Inc. * | | |
| | |
| | |
| | |
ChargePoint Holdings, Inc. *(a) | | |
Core & Main, Inc., Class A * | | |
| | |
| | |
| | |
| | |
| | |
| | |
| | |
| | |
| | |
| | |
Fortune Brands Innovations, Inc. | | |
Gates Industrial Corp. plc * | | |
| | |
| | |
| | |
| | |
| | |
| | |
| | |
| | |
Huntington Ingalls Industries, Inc. | | |
| | |
| | |
| | |
Lennox International, Inc. | | |
Lincoln Electric Holdings, Inc. | | |
| | |
| | |
| | |
MDU Resources Group, Inc. | | |
| | |
MSC Industrial Direct Co., Inc., Class A | | |
| | |
| | |
| | |
| | |
| | |
| | |
| | |
| | |
| | |
| | |
| | |
Rockwell Automation, Inc. | | |
Sensata Technologies Holding plc | | |
SiteOne Landscape Supply, Inc. * | | |
| | |
Spirit AeroSystems Holdings, Inc., Class A | | |
Schwab Equity Index Funds | Semiannual Report123
Schwab U.S. Mid-Cap Index Fund
Portfolio Holdings as of April 30, 2023 (Unaudited) (continued)
| | |
Stanley Black & Decker, Inc. | | |
| | |
| | |
| | |
| | |
| | |
| | |
| | |
| | |
| | |
| | |
| | |
| | |
| | |
| | |
| | |
WESCO International, Inc. | | |
Westinghouse Air Brake Technologies Corp. | | |
WillScot Mobile Mini Holdings Corp. * | | |
| | |
| | |
| | |
|
Commercial & Professional Services 4.5% |
Booz Allen Hamilton Holding Corp. | | |
Broadridge Financial Solutions, Inc. | | |
CACI International, Inc., Class A * | | |
Ceridian HCM Holding, Inc. * | | |
| | |
| | |
| | |
| | |
| | |
| | |
Driven Brands Holdings, Inc. * | | |
Dun & Bradstreet Holdings, Inc. | | |
| | |
| | |
| | |
| | |
| | |
| | |
| | |
| | |
| | |
| | |
| | |
Paylocity Holding Corp. * | | |
| | |
Ritchie Bros Auctioneers, Inc. | | |
Robert Half International, Inc. | | |
| | |
Science Applications International Corp. | | |
SS&C Technologies Holdings, Inc. | | |
| | |
| | |
| | |
| | |
| | |
|
Consumer Discretionary Distribution & Retail 4.5% |
| | |
| | |
| | |
| | |
| | |
| | |
Burlington Stores, Inc. * | | |
| | |
| | |
Dick's Sporting Goods, Inc. | | |
| | |
| | |
| | |
Floor & Decor Holdings, Inc., Class A * | | |
GameStop Corp., Class A *(a) | | |
| | |
| | |
| | |
| | |
| | |
| | |
| | |
Ollie's Bargain Outlet Holdings, Inc. * | | |
O'Reilly Automotive, Inc. * | | |
Penske Automotive Group, Inc. | | |
Petco Health & Wellness Co., Inc. * | | |
| | |
| | |
| | |
| | |
| | |
| | |
| | |
Victoria's Secret & Co. * | | |
| | |
| | |
| | |
|
Consumer Durables & Apparel 3.0% |
| | |
| | |
| | |
| | |
| | |
| | |
| | |
| | |
| | |
| | |
| | |
| | |
Lululemon Athletica, Inc. * | | |
| | |
Mohawk Industries, Inc. * | | |
| | |
| | |
Peloton Interactive, Inc., Class A * | | |
| | |
| | |
| | |
| | |
Skechers U.S.A., Inc., Class A * | | |
| | |
Tempur Sealy International, Inc. | | |
| | |
| | |
Under Armour, Inc., Class A * | | |
Under Armour, Inc., Class C * | | |
| | |
| | |
124Schwab Equity Index Funds | Semiannual Report
Schwab U.S. Mid-Cap Index Fund
Portfolio Holdings as of April 30, 2023 (Unaudited) (continued)
| | |
| | |
| | |
|
|
| | |
| | |
| | |
Bright Horizons Family Solutions, Inc. * | | |
Caesars Entertainment, Inc. * | | |
| | |
Chipotle Mexican Grill, Inc. * | | |
Choice Hotels International, Inc. | | |
| | |
| | |
| | |
DoorDash, Inc., Class A * | | |
DraftKings, Inc., Class A * | | |
| | |
Grand Canyon Education, Inc. * | | |
| | |
Hilton Worldwide Holdings, Inc. | | |
Hyatt Hotels Corp., Class A * | | |
| | |
Marriott Vacations Worldwide Corp. | | |
MGM Resorts International | | |
| | |
Norwegian Cruise Line Holdings Ltd. * | | |
Penn Entertainment, Inc. * | | |
Planet Fitness, Inc., Class A * | | |
Royal Caribbean Cruises Ltd. * | | |
Service Corp. International | | |
Six Flags Entertainment Corp. * | | |
| | |
| | |
| | |
Wyndham Hotels & Resorts, Inc. | | |
| | |
| | |
| | |
|
Consumer Staples Distribution & Retail 1.1% |
Albertsons Cos., Inc., Class A | | |
BJ's Wholesale Club Holdings, Inc. * | | |
Casey's General Stores, Inc. | | |
| | |
Grocery Outlet Holding Corp. * | | |
Performance Food Group Co. * | | |
| | |
U.S. Foods Holding Corp. * | | |
| | |
|
|
| | |
| | |
| | |
| | |
| | |
| | |
| | |
| | |
| | |
| | |
| | |
| | |
| | |
| | |
| | |
| | |
| | |
New Fortress Energy, Inc. | | |
| | |
| | |
| | |
| | |
| | |
| | |
Southwestern Energy Co. * | | |
| | |
| | |
| | |
| | |
| | |
|
Equity Real Estate Investment Trusts (REITs) 6.9% |
Alexandria Real Estate Equities, Inc. | | |
American Homes 4 Rent, Class A | | |
Americold Realty Trust, Inc. | | |
Apartment Income REIT Corp. | | |
AvalonBay Communities, Inc. | | |
| | |
Brixmor Property Group, Inc. | | |
| | |
| | |
| | |
| | |
EastGroup Properties, Inc. | | |
| | |
Equity LifeStyle Properties, Inc. | | |
| | |
Essex Property Trust, Inc. | | |
Extra Space Storage, Inc. | | |
Federal Realty Investment Trust | | |
First Industrial Realty Trust, Inc. | | |
Gaming & Leisure Properties, Inc. | | |
Healthcare Realty Trust, Inc. | | |
Healthpeak Properties, Inc. | | |
Highwoods Properties, Inc. | | |
Host Hotels & Resorts, Inc. | | |
Hudson Pacific Properties, Inc. | | |
| | |
| | |
| | |
| | |
| | |
Lamar Advertising Co., Class A | | |
| | |
Medical Properties Trust, Inc. | | |
Mid-America Apartment Communities, Inc. | | |
National Retail Properties, Inc. | | |
National Storage Affiliates Trust | | |
Omega Healthcare Investors, Inc. | | |
Park Hotels & Resorts, Inc. | | |
| | |
| | |
| | |
Rexford Industrial Realty, Inc. | | |
| | |
Simon Property Group, Inc. | | |
SL Green Realty Corp. (a) | | |
Spirit Realty Capital, Inc. | | |
| | |
| | |
Schwab Equity Index Funds | Semiannual Report125
Schwab U.S. Mid-Cap Index Fund
Portfolio Holdings as of April 30, 2023 (Unaudited) (continued)
| | |
| | |
| | |
| | |
| | |
| | |
| | |
| | |
|
|
Affiliated Managers Group, Inc. | | |
| | |
| | |
| | |
Ameriprise Financial, Inc. | | |
Annaly Capital Management, Inc. | | |
Apollo Global Management, Inc. | | |
Ares Management Corp., Class A | | |
| | |
Cboe Global Markets, Inc. | | |
Coinbase Global, Inc., Class A *(a) | | |
Corebridge Financial, Inc. | | |
Credit Acceptance Corp. * | | |
Discover Financial Services | | |
| | |
Euronet Worldwide, Inc. * | | |
| | |
FactSet Research Systems, Inc. | | |
FleetCor Technologies, Inc. * | | |
| | |
| | |
Interactive Brokers Group, Inc., Class A | | |
| | |
Jack Henry & Associates, Inc. | | |
Janus Henderson Group plc | | |
Jefferies Financial Group, Inc. | | |
| | |
| | |
LPL Financial Holdings, Inc. | | |
MarketAxess Holdings, Inc. | | |
| | |
| | |
| | |
| | |
| | |
| | |
Raymond James Financial, Inc. | | |
| | |
Robinhood Markets, Inc., Class A * | | |
Rocket Cos., Inc., Class A *(a) | | |
| | |
Shift4 Payments, Inc., Class A * | | |
| | |
SoFi Technologies, Inc. * | | |
Starwood Property Trust, Inc. | | |
| | |
| | |
| | |
T. Rowe Price Group, Inc. | | |
| | |
The Bank of New York Mellon Corp. | | |
| | |
| | |
| | |
Tradeweb Markets, Inc., Class A | | |
Upstart Holdings, Inc. *(a) | | |
| | |
Virtu Financial, Inc., Class A | | |
| | |
| | |
| | |
| | |
|
Food, Beverage & Tobacco 2.5% |
Brown-Forman Corp., Class A | | |
Brown-Forman Corp., Class B | | |
| | |
| | |
| | |
Darling Ingredients, Inc. * | | |
| | |
| | |
| | |
| | |
| | |
Lamb Weston Holdings, Inc. | | |
McCormick & Co., Inc. - Non Voting Shares | | |
Molson Coors Beverage Co., Class B | | |
| | |
| | |
| | |
The Boston Beer Co., Inc., Class A * | | |
| | |
| | |
Tyson Foods, Inc., Class A | | |
| | |
|
Health Care Equipment & Services 5.6% |
Acadia Healthcare Co., Inc. * | | |
| | |
| | |
| | |
| | |
| | |
| | |
| | |
| | |
Definitive Healthcare Corp. * | | |
| | |
| | |
Doximity, Inc., Class A * | | |
| | |
| | |
| | |
| | |
Globus Medical, Inc., Class A * | | |
| | |
| | |
| | |
| | |
IDEXX Laboratories, Inc. * | | |
| | |
Integra LifeSciences Holdings Corp. * | | |
Laboratory Corp. of America Holdings | | |
| | |
Molina Healthcare, Inc. * | | |
| | |
Oak Street Health, Inc. * | | |
| | |
| | |
| | |
| | |
| | |
| | |
126Schwab Equity Index Funds | Semiannual Report
Schwab U.S. Mid-Cap Index Fund
Portfolio Holdings as of April 30, 2023 (Unaudited) (continued)
| | |
Tandem Diabetes Care, Inc. * | | |
| | |
| | |
| | |
| | |
Universal Health Services, Inc., Class B | | |
Veeva Systems, Inc., Class A * | | |
Zimmer Biomet Holdings, Inc. | | |
| | |
|
Household & Personal Products 0.6% |
Church & Dwight Co., Inc. | | |
| | |
| | |
Reynolds Consumer Products, Inc. | | |
Spectrum Brands Holdings, Inc. | | |
| | |
| | |
|
|
| | |
American Financial Group, Inc. | | |
Arch Capital Group Ltd. * | | |
Arthur J. Gallagher & Co. | | |
| | |
| | |
Axis Capital Holdings Ltd. | | |
Brighthouse Financial, Inc. * | | |
| | |
Cincinnati Financial Corp. | | |
| | |
Erie Indemnity Co., Class A | | |
| | |
F&G Annuities & Life, Inc. | | |
Fidelity National Financial, Inc. | | |
First American Financial Corp. | | |
| | |
| | |
| | |
| | |
| | |
Old Republic International Corp. | | |
| | |
Principal Financial Group, Inc. | | |
Prudential Financial, Inc. | | |
Reinsurance Group of America, Inc. | | |
RenaissanceRe Holdings Ltd. | | |
Ryan Specialty Holdings, Inc., Class A * | | |
| | |
The Hanover Insurance Group, Inc. | | |
The Hartford Financial Services Group, Inc. | | |
| | |
| | |
White Mountains Insurance Group Ltd. | | |
| | |
| | |
|
|
| | |
| | |
| | |
| | |
Ardagh Metal Packaging S.A. | | |
| | |
| | |
| | |
Axalta Coating Systems Ltd. * | | |
| | |
| | |
| | |
CF Industries Holdings, Inc. | | |
| | |
| | |
| | |
| | |
| | |
| | |
| | |
| | |
Ginkgo Bioworks Holdings, Inc. *(a) | | |
Graphic Packaging Holding Co. | | |
| | |
International Flavors & Fragrances, Inc. | | |
| | |
| | |
LyondellBasell Industries N.V., Class A | | |
Martin Marietta Materials, Inc. | | |
| | |
| | |
| | |
| | |
Packaging Corp. of America | | |
| | |
Reliance Steel & Aluminum Co. | | |
| | |
| | |
| | |
| | |
| | |
| | |
| | |
| | |
| | |
The Scotts Miracle-Gro Co. | | |
United States Steel Corp. | | |
| | |
| | |
| | |
| | |
|
Media & Entertainment 3.5% |
Altice USA, Inc., Class A * | | |
AMC Entertainment Holdings, Inc., Class A (a) | | |
| | |
DISH Network Corp., Class A * | | |
| | |
| | |
| | |
| | |
Liberty Broadband Corp., Class A * | | |
Liberty Broadband Corp., Class C * | | |
Liberty Media Corp. - Liberty Formula One, Class A * | | |
Liberty Media Corp. - Liberty Formula One, Class C * | | |
Liberty Media Corp. - Liberty SiriusXM, Class A * | | |
Liberty Media Corp. - Liberty SiriusXM, Class C * | | |
Live Nation Entertainment, Inc. * | | |
Schwab Equity Index Funds | Semiannual Report127
Schwab U.S. Mid-Cap Index Fund
Portfolio Holdings as of April 30, 2023 (Unaudited) (continued)
| | |
Madison Square Garden Sports Corp. | | |
| | |
| | |
| | |
Nexstar Media Group, Inc., Class A | | |
| | |
Paramount Global, Class A | | |
Paramount Global, Class B | | |
Pinterest, Inc., Class A * | | |
| | |
| | |
| | |
Sirius XM Holdings, Inc. (a) | | |
Spotify Technology S.A. * | | |
Take-Two Interactive Software, Inc. * | | |
The Interpublic Group of Cos., Inc. | | |
The New York Times Co., Class A | | |
The Trade Desk, Inc., Class A * | | |
| | |
Warner Bros Discovery, Inc. * | | |
World Wrestling Entertainment, Inc., Class A | | |
ZoomInfo Technologies, Inc. * | | |
| | |
|
Pharmaceuticals, Biotechnology & Life Sciences 5.5% |
10X Genomics, Inc., Class A * | | |
Agilent Technologies, Inc. | | |
Alnylam Pharmaceuticals, Inc. * | | |
| | |
| | |
| | |
BioMarin Pharmaceutical, Inc. * | | |
Bio-Rad Laboratories, Inc., Class A * | | |
| | |
| | |
| | |
Charles River Laboratories International, Inc. * | | |
Elanco Animal Health, Inc. * | | |
| | |
| | |
Horizon Therapeutics plc * | | |
| | |
Ionis Pharmaceuticals, Inc. * | | |
| | |
Jazz Pharmaceuticals plc * | | |
Maravai LifeSciences Holdings, Inc., Class A * | | |
Mettler-Toledo International, Inc. * | | |
Mirati Therapeutics, Inc. * | | |
| | |
Neurocrine Biosciences, Inc. * | | |
| | |
| | |
| | |
| | |
| | |
| | |
Royalty Pharma plc, Class A | | |
Sarepta Therapeutics, Inc. * | | |
| | |
| | |
| | |
Ultragenyx Pharmaceutical, Inc. * | | |
United Therapeutics Corp. * | | |
| | |
| | |
| | |
West Pharmaceutical Services, Inc. | | |
| | |
|
Real Estate Management & Development 0.5% |
CBRE Group, Inc., Class A * | | |
Jones Lang LaSalle, Inc. * | | |
Opendoor Technologies, Inc. * | | |
The Howard Hughes Corp. * | | |
WeWork, Inc., Class A *(a) | | |
Zillow Group, Inc., Class A * | | |
Zillow Group, Inc., Class C * | | |
| | |
|
Semiconductors & Semiconductor Equipment 2.3% |
Allegro MicroSystems, Inc. * | | |
| | |
| | |
| | |
| | |
GLOBALFOUNDRIES, Inc. *(a) | | |
Lattice Semiconductor Corp. * | | |
Microchip Technology, Inc. | | |
| | |
Monolithic Power Systems, Inc. | | |
| | |
| | |
| | |
| | |
| | |
| | |
| | |
|
|
Akamai Technologies, Inc. * | | |
| | |
| | |
| | |
AppLovin Corp., Class A * | | |
| | |
Bentley Systems, Inc., Class B | | |
Bill.com Holdings, Inc. * | | |
| | |
Cadence Design Systems, Inc. * | | |
CCC Intelligent Solutions Holdings, Inc. * | | |
Cloudflare, Inc., Class A * | | |
Confluent, Inc., Class A * | | |
Crowdstrike Holdings, Inc., Class A * | | |
| | |
| | |
Dolby Laboratories, Inc., Class A | | |
DoubleVerify Holdings, Inc. * | | |
| | |
| | |
| | |
| | |
| | |
| | |
| | |
| | |
| | |
| | |
| | |
| | |
Guidewire Software, Inc. * | | |
128Schwab Equity Index Funds | Semiannual Report
Schwab U.S. Mid-Cap Index Fund
Portfolio Holdings as of April 30, 2023 (Unaudited) (continued)
| | |
| | |
Informatica, Inc., Class A * | | |
| | |
| | |
Manhattan Associates, Inc. * | | |
| | |
| | |
| | |
| | |
| | |
| | |
Palantir Technologies, Inc., Class A * | | |
| | |
Procore Technologies, Inc. * | | |
| | |
RingCentral, Inc., Class A * | | |
SentinelOne, Inc., Class A * | | |
Smartsheet, Inc., Class A * | | |
| | |
| | |
| | |
Thoughtworks Holding, Inc. * | | |
| | |
Tyler Technologies, Inc. * | | |
| | |
| | |
| | |
| | |
Zoom Video Communications, Inc., Class A * | | |
| | |
| | |
|
Technology Hardware & Equipment 4.5% |
| | |
| | |
Arrow Electronics, Inc. * | | |
| | |
| | |
| | |
| | |
| | |
| | |
Dell Technologies, Inc., Class C | | |
| | |
Hewlett Packard Enterprise Co. | | |
| | |
| | |
| | |
| | |
Keysight Technologies, Inc. * | | |
| | |
Lumentum Holdings, Inc. * | | |
| | |
National Instruments Corp. | | |
| | |
Pure Storage, Inc., Class A * | | |
| | |
Teledyne Technologies, Inc. * | | |
| | |
| | |
| | |
| | |
| | |
Zebra Technologies Corp., Class A * | | |
| | |
|
| | |
Telecommunication Services 0.1% |
Frontier Communications Parent, Inc. * | | |
| | |
| | |
|
|
| | |
American Airlines Group, Inc. * | | |
Avis Budget Group, Inc. * | | |
C.H. Robinson Worldwide, Inc. | | |
Copa Holdings S.A., Class A | | |
| | |
Expeditors International of Washington, Inc. | | |
| | |
Hertz Global Holdings, Inc. * | | |
JB Hunt Transport Services, Inc. | | |
| | |
| | |
Knight-Swift Transportation Holdings, Inc. | | |
| | |
| | |
Old Dominion Freight Line, Inc. | | |
| | |
| | |
Schneider National, Inc., Class B | | |
| | |
| | |
U-Haul Holding Co. - Non Voting | | |
United Airlines Holdings, Inc. * | | |
| | |
| | |
|
|
| | |
| | |
American Water Works Co., Inc. | | |
| | |
| | |
Brookfield Renewable Corp., Class A | | |
| | |
| | |
Consolidated Edison, Inc. | | |
Constellation Energy Corp. | | |
| | |
| | |
| | |
Essential Utilities, Inc. | | |
| | |
| | |
| | |
Hawaiian Electric Industries, Inc. | | |
| | |
| | |
| | |
| | |
| | |
| | |
Pinnacle West Capital Corp. | | |
| | |
Public Service Enterprise Group, Inc. | | |
| | |
| | |
| | |
Schwab Equity Index Funds | Semiannual Report129
Schwab U.S. Mid-Cap Index Fund
Portfolio Holdings as of April 30, 2023 (Unaudited) (continued)
| | |
| | |
| | |
| | |
Total Common Stocks
(Cost $923,051,161) | |
|
INVESTMENT COMPANIES 0.1% OF NET ASSETS |
|
|
iShares Russell Mid-Cap ETF | | |
Total Investment Companies
(Cost $870,911) | |
| | |
SHORT-TERM INVESTMENTS 0.7% OF NET ASSETS |
|
|
State Street Institutional U.S. Government Money Market Fund, Premier Class 4.76% (c) | | |
State Street Institutional U.S. Government Money Market Fund, Premier Class 4.76% (c)(d) | | |
| | |
Total Short-Term Investments
(Cost $7,187,586) | |
Total Investments in Securities
(Cost $931,109,658) | |
| | | CURRENT VALUE/
UNREALIZED
DEPRECIATION
($) |
|
| | | |
S&P 400 Mid-Cap Index, e-mini, expires 06/16/23 | | | |
| Non-income producing security. |
| All or a portion of this security is on loan. Securities on loan were valued at $4,486,170. |
| First Republic Bank was placed into receivership with the Federal Deposit Insurance Corp. due to inadequate liquidity and insolvency on May 1, 2023 and the position has subsequently been sold. |
| The rate shown is the annualized 7-day yield. |
| Security purchased with cash collateral received for securities on loan. |
| |
| Real Estate Investment Trust |
The following is a summary of the inputs used to value the fund’s investments as of April 30, 2023 (see financial note 2(a) for additional information):
| QUOTED PRICES IN
ACTIVE MARKETS FOR
IDENTICAL ASSETS
(LEVEL 1) | OTHER SIGNIFICANT
OBSERVABLE INPUTS
(LEVEL 2) | SIGNIFICANT
UNOBSERVABLE INPUTS
(LEVEL 3) | |
| | | | |
| | | | |
| | | | |
| | | | |
| | | | |
| | | | |
| | | | |
| As categorized in the Portfolio Holdings. |
| Futures contracts are reported at cumulative unrealized appreciation or depreciation. |
Fund investments in mutual funds and ETFs are classified as Level 1, without consideration to the classification level of the
underlying securities held by the underlying mutual funds and ETFs, which could be Level 1, Level 2 or Level 3.
130Schwab Equity Index Funds | Semiannual Report
Schwab U.S. Mid-Cap Index Fund
Statement of Assets and Liabilities
As of April 30, 2023; unaudited
|
Investments in securities, at value - unaffiliated (cost $931,109,658) including securities on loan of $4,486,170 | | |
Deposit with broker for futures contracts | | |
| | |
| | |
| | |
Income from securities on loan | | |
Variation margin on future contracts | | |
| | |
|
|
Collateral held for securities on loan | | |
| | |
| | |
| | |
| | |
| | |
|
|
Capital received from investors | | |
Total distributable earnings | | |
| | |
Schwab Equity Index Funds | Semiannual Report131
Schwab U.S. Mid-Cap Index Fund
Statement of Operations
For the period November 1, 2022 through April 30, 2023; unaudited |
|
Dividends received from securities - unaffiliated (net of foreign withholding tax of $2,939) | | |
| | |
| | |
|
|
| | |
| | |
| | |
|
REALIZED AND UNREALIZED GAINS (LOSSES) |
Net realized losses on sales of securities - unaffiliated | | |
Net realized losses on futures contracts | | |
| | |
Net change in unrealized appreciation (depreciation) on securities - unaffiliated | | |
Net change in unrealized appreciation (depreciation) on futures contracts | | |
Net change in unrealized appreciation (depreciation) | | |
Net realized and unrealized gains | | |
Increase in net assets resulting from operations | | |
132Schwab Equity Index Funds | Semiannual Report
Schwab U.S. Mid-Cap Index Fund
Statement of Changes in Net Assets
For the current and prior report periods
Figures for the current period are unaudited
|
| | |
| | | |
| | | |
Net change in unrealized appreciation (depreciation) | | | |
Increase (decrease) in net assets resulting from operations | | | |
|
DISTRIBUTIONS TO SHAREHOLDERS |
| | | |
TRANSACTIONS IN FUND SHARES |
| | |
| | | | | |
| | | | | |
| | | | | |
| | | | | |
Net transactions in fund shares | | | | | |
|
SHARES OUTSTANDING AND NET ASSETS |
| | |
| | | | | |
| | | | | |
| | | | | |
| | | | | |
Schwab Equity Index Funds | Semiannual Report133
Schwab International Index Fund
Financial Statements
| | | | | | |
|
Net asset value at beginning of period | | | | | | |
Income (loss) from investment operations: | | | | | | |
Net investment income (loss)1 | | | | | | |
Net realized and unrealized gains (losses) | | | | | | |
Total from investment operations | | | | | | |
| | | | | | |
Distributions from net investment income | | | | | | |
Net asset value at end of period | | | | | | |
| | | | | | |
|
Ratios to average net assets: | | | | | | |
| | | | | | |
Net investment income (loss) | | | | | | |
| | | | | | |
Net assets, end of period (x 1,000,000) | | | | | | |
| |
| Calculated based on the average shares outstanding during the period. |
| |
| |
| Ratio includes less than 0.005% of non-routine proxy expenses. |
134Schwab Equity Index Funds | Semiannual Report
Schwab International Index Fund
Portfolio Holdings as of April 30, 2023 (Unaudited)
This section shows all the securities in the fund’s portfolio and their values as of the report date.
The fund files its complete schedule of portfolio holdings with the U.S. Securities and Exchange Commission (SEC) for the first and third quarters of each fiscal year on Form N-PORT Part F. The fund’s Form N-PORT Part F is available on the SEC’s website at www.sec.gov. You can also obtain this information at no cost on the fund’s website at www.schwabassetmanagement.com/schwabfunds_prospectus, by calling 1-866-414-6349, or by sending an email request to orders@mysummaryprospectus.com. The fund also makes available its complete schedule of portfolio holdings 15 to 20 days after the end of the month on the fund’s website.
| | |
COMMON STOCKS 98.5% OF NET ASSETS |
|
|
| | |
| | |
| | |
| | |
| | |
| | |
| | |
| | |
| | |
| | |
| | |
Commonwealth Bank of Australia | | |
| | |
| | |
| | |
| | |
Fortescue Metals Group Ltd. | | |
| | |
| | |
| | |
Insurance Australia Group Ltd. | | |
James Hardie Industries plc | | |
| | |
| | |
| | |
| | |
| | |
National Australia Bank Ltd. | | |
| | |
Northern Star Resources Ltd. | | |
| | |
| | |
| | |
| | |
| | |
| | |
| | |
| | |
| | |
| | |
| | |
| | |
| | |
| | |
| | |
| | |
| | |
| | |
| | |
| | |
Treasury Wine Estates Ltd. | | |
| | |
Washington H Soul Pattinson & Co., Ltd. | | |
| | |
| | |
| | |
| | |
Woodside Energy Group Ltd. | | |
| | |
| | |
| | |
|
|
| | |
| | |
| | |
| | |
| | |
|
|
| | |
Anheuser-Busch InBev S.A./N.V. | | |
| | |
| | |
| | |
Groupe Bruxelles Lambert N.V. | | |
| | |
| | |
| | |
| | |
| | |
| | |
| | |
|
|
AP Moller - Maersk A/S, Class A | | |
AP Moller - Maersk A/S, Class B | | |
| | |
| | |
| | |
| | |
| | |
| | |
| | |
Novo Nordisk A/S, Class B | | |
| | |
| | |
| | |
| | |
| | |
Vestas Wind Systems A/S * | | |
| | |
|
|
| | |
| | |
| | |
| | |
Schwab Equity Index Funds | Semiannual Report135
Schwab International Index Fund
Portfolio Holdings as of April 30, 2023 (Unaudited) (continued)
| | |
| | |
| | |
| | |
| | |
| | |
| | |
| | |
| | |
| | |
|
|
| | |
| | |
| | |
| | |
| | |
| | |
| | |
| | |
| | |
| | |
| | |
| | |
| | |
| | |
| | |
| | |
| | |
Cie Generale des Etablissements Michelin S.C.A. | | |
| | |
| | |
| | |
| | |
| | |
| | |
| | |
| | |
| | |
| | |
| | |
| | |
| | |
| | |
| | |
| | |
| | |
| | |
La Francaise des Jeux SAEM | | |
| | |
| | |
LVMH Moet Hennessy Louis Vuitton SE | | |
| | |
| | |
| | |
| | |
| | |
| | |
| | |
| | |
| | |
| | |
| | |
| | |
| | |
| | |
| | |
| | |
| | |
Unibail-Rodamco-Westfield * | | |
| | |
Veolia Environnement S.A. | | |
| | |
| | |
| | |
| | |
| | |
|
|
| | |
| | |
| | |
| | |
| | |
Bayerische Motoren Werke AG | | |
| | |
| | |
| | |
Carl Zeiss Meditec AG, Class B | | |
| | |
| | |
| | |
Daimler Truck Holding AG * | | |
| | |
| | |
| | |
| | |
| | |
| | |
| | |
| | |
Fresenius Medical Care AG & Co. KGaA | | |
| | |
| | |
| | |
| | |
| | |
| | |
| | |
| | |
| | |
| | |
| | |
| | |
Muenchener Rueckversicherungs-Gesellschaft AG in Muenchen * | | |
| | |
| | |
| | |
| | |
| | |
| | |
| | |
| | |
| | |
| | |
| | |
| | |
Telefonica Deutschland Holding AG | | |
| | |
| | |
| | |
136Schwab Equity Index Funds | Semiannual Report
Schwab International Index Fund
Portfolio Holdings as of April 30, 2023 (Unaudited) (continued)
| | |
| | |
| | |
|
|
| | |
BOC Hong Kong Holdings Ltd. | | |
Budweiser Brewing Co. APAC Ltd. | | |
| | |
CK Hutchison Holdings Ltd. | | |
CK Infrastructure Holdings Ltd. | | |
| | |
| | |
Futu Holdings Ltd., ADR * | | |
Galaxy Entertainment Group Ltd. * | | |
Hang Lung Properties Ltd. | | |
| | |
Henderson Land Development Co., Ltd. | | |
| | |
Hong Kong & China Gas Co., Ltd. | | |
Hong Kong Exchanges & Clearing Ltd. | | |
Hongkong Land Holdings Ltd. | | |
Jardine Matheson Holdings Ltd. | | |
| | |
| | |
New World Development Co., Ltd. | | |
Power Assets Holdings Ltd. | | |
| | |
| | |
SITC International Holdings Co., Ltd. | | |
Sun Hung Kai Properties Ltd. | | |
Swire Pacific Ltd., A Shares | | |
| | |
Techtronic Industries Co., Ltd. | | |
| | |
Wharf Real Estate Investment Co., Ltd. | | |
Xinyi Glass Holdings Ltd. | | |
| | |
|
|
| | |
Bank of Ireland Group plc | | |
| | |
Flutter Entertainment plc * | | |
| | |
| | |
| | |
| | |
|
|
| | |
| | |
Bank Leumi Le-Israel B.M. | | |
Bezeq The Israeli Telecommunication Corp., Ltd. | | |
Check Point Software Technologies Ltd. * | | |
| | |
| | |
| | |
Israel Discount Bank Ltd., A Shares | | |
Mizrahi Tefahot Bank Ltd. | | |
| | |
Teva Pharmaceutical Industries Ltd. ADR, ADR * | | |
| | |
The First International Bank of Israel Ltd. | | |
Tower Semiconductor Ltd. * | | |
| | |
| | |
|
|
| | |
Assicurazioni Generali S.p.A. | | |
| | |
Davide Campari-Milano N.V. | | |
| | |
| | |
| | |
| | |
FinecoBank Banca Fineco S.p.A. | | |
Infrastrutture Wireless Italiane S.p.A. | | |
| | |
Mediobanca Banca di Credito Finanziario S.p.A. | | |
| | |
| | |
| | |
| | |
Recordati Industria Chimica e Farmaceutica S.p.A. | | |
| | |
| | |
| | |
| | |
Terna - Rete Elettrica Nazionale | | |
| | |
| | |
|
|
| | |
| | |
| | |
| | |
| | |
| | |
Asahi Group Holdings Ltd. | | |
| | |
| | |
| | |
| | |
Bandai Namco Holdings, Inc. | | |
BayCurrent Consulting, Inc. | | |
| | |
| | |
| | |
| | |
Central Japan Railway Co. | | |
Chubu Electric Power Co., Inc. | | |
Chugai Pharmaceutical Co., Ltd. | | |
Concordia Financial Group Ltd. | | |
| | |
Dai Nippon Printing Co., Ltd. | | |
| | |
Dai-ichi Life Holdings, Inc. | | |
| | |
| | |
Daito Trust Construction Co., Ltd. | | |
Daiwa House Industry Co., Ltd. | | |
Daiwa House REIT Investment Corp. | | |
Daiwa Securities Group, Inc. | | |
Schwab Equity Index Funds | Semiannual Report137
Schwab International Index Fund
Portfolio Holdings as of April 30, 2023 (Unaudited) (continued)
| | |
| | |
| | |
| | |
| | |
| | |
| | |
| | |
| | |
| | |
| | |
| | |
| | |
GMO Payment Gateway, Inc. | | |
Hakuhodo DY Holdings, Inc. | | |
| | |
Hankyu Hanshin Holdings, Inc. | | |
| | |
Hirose Electric Co., Ltd. | | |
Hitachi Construction Machinery Co., Ltd. | | |
| | |
| | |
| | |
| | |
| | |
| | |
| | |
Iida Group Holdings Co., Ltd. | | |
| | |
| | |
| | |
Itochu Techno-Solutions Corp. | | |
| | |
Japan Exchange Group, Inc. | | |
Japan Metropolitan Fund Invest | | |
Japan Post Bank Co., Ltd. | | |
Japan Post Holdings Co., Ltd. | | |
Japan Post Insurance Co., Ltd. | | |
Japan Real Estate Investment Corp. | | |
| | |
| | |
| | |
| | |
| | |
| | |
| | |
Keisei Electric Railway Co., Ltd. | | |
| | |
| | |
Kintetsu Group Holdings Co., Ltd. | | |
| | |
Kobayashi Pharmaceutical Co., Ltd. | | |
| | |
Koei Tecmo Holdings Co., Ltd. | | |
Koito Manufacturing Co., Ltd. | | |
| | |
| | |
| | |
| | |
Kurita Water Industries Ltd. | | |
| | |
| | |
| | |
| | |
| | |
| | |
| | |
| | |
| | |
| | |
McDonald's Holdings Co., Japan Ltd. | | |
| | |
| | |
| | |
Mitsubishi Chemical Group Corp. | | |
| | |
Mitsubishi Electric Corp. | | |
Mitsubishi Estate Co., Ltd. | | |
Mitsubishi HC Capital, Inc. | | |
Mitsubishi Heavy Industries Ltd. | | |
Mitsubishi UFJ Financial Group, Inc. | | |
| | |
| | |
| | |
| | |
Mizuho Financial Group, Inc. | | |
| | |
MS&AD Insurance Group Holdings, Inc. | | |
Murata Manufacturing Co., Ltd. | | |
| | |
| | |
| | |
| | |
Nihon M&A Center Holdings, Inc. | | |
| | |
Nippon Building Fund, Inc. | | |
Nippon Express Holdings, Inc. | | |
Nippon Paint Holdings Co., Ltd. | | |
Nippon Prologis REIT, Inc. | | |
Nippon Sanso Holdings Corp. | | |
Nippon Shinyaku Co., Ltd. | | |
| | |
Nippon Telegraph & Telephone Corp. | | |
| | |
| | |
| | |
Nisshin Seifun Group, Inc. | | |
Nissin Foods Holdings Co., Ltd. | | |
Nitori Holdings Co., Ltd. | | |
| | |
| | |
Nomura Real Estate Holdings, Inc. | | |
Nomura Real Estate Master Fund, Inc. | | |
Nomura Research Institute Ltd. | | |
| | |
| | |
| | |
Odakyu Electric Railway Co., Ltd. | | |
| | |
| | |
| | |
Ono Pharmaceutical Co., Ltd. | | |
Open House Group Co., Ltd. | | |
| | |
| | |
| | |
| | |
| | |
Otsuka Holdings Co., Ltd. | | |
Pan Pacific International Holdings Corp. | | |
| | |
Persol Holdings Co., Ltd. | | |
| | |
Recruit Holdings Co., Ltd. | | |
Renesas Electronics Corp. * | | |
138Schwab Equity Index Funds | Semiannual Report
Schwab International Index Fund
Portfolio Holdings as of April 30, 2023 (Unaudited) (continued)
| | |
| | |
| | |
| | |
| | |
| | |
| | |
| | |
Sekisui Chemical Co., Ltd. | | |
| | |
Seven & i Holdings Co., Ltd. | | |
| | |
| | |
| | |
| | |
| | |
Shin-Etsu Chemical Co., Ltd. | | |
| | |
| | |
Shizuoka Financial Group, Inc. | | |
| | |
| | |
| | |
| | |
| | |
Square Enix Holdings Co., Ltd. | | |
| | |
| | |
Sumitomo Chemical Co., Ltd. | | |
| | |
Sumitomo Electric Industries Ltd. | | |
Sumitomo Metal Mining Co., Ltd. | | |
Sumitomo Mitsui Financial Group, Inc. | | |
Sumitomo Mitsui Trust Holdings, Inc. | | |
Sumitomo Realty & Development Co., Ltd. | | |
Suntory Beverage & Food Ltd. | | |
| | |
| | |
| | |
| | |
Takeda Pharmaceutical Co., Ltd. | | |
| | |
| | |
| | |
The Kansai Electric Power Co., Inc. | | |
| | |
| | |
| | |
Tokio Marine Holdings, Inc. | | |
Tokyo Electric Power Co. Holdings, Inc. * | | |
| | |
| | |
| | |
| | |
| | |
| | |
| | |
| | |
| | |
| | |
| | |
| | |
| | |
| | |
Welcia Holdings Co., Ltd. | | |
| | |
| | |
| | |
| | |
| | |
Yamato Holdings Co., Ltd. | | |
| | |
| | |
| | |
| | |
| | |
|
|
| | |
| | |
| | |
| | |
| | |
| | |
| | |
BNP Paribas Emissions- und Handelsgesellschaft mbH | | |
Coca-Cola Europacific Partners plc | | |
| | |
| | |
| | |
| | |
| | |
| | |
Just Eat Takeaway.com N.V * | | |
Koninklijke Ahold Delhaize N.V. | | |
| | |
| | |
| | |
| | |
| | |
| | |
Universal Music Group N.V. | | |
| | |
| | |
|
|
Auckland International Airport Ltd. * | | |
| | |
Fisher & Paykel Healthcare Corp., Ltd. | | |
| | |
| | |
| | |
| | |
|
|
| | |
| | |
| | |
| | |
Gjensidige Forsikring A.S.A. | | |
| | |
| | |
| | |
| | |
| | |
| | |
Yara International A.S.A. | | |
| | |
|
Schwab Equity Index Funds | Semiannual Report139
Schwab International Index Fund
Portfolio Holdings as of April 30, 2023 (Unaudited) (continued)
| | |
|
EDP - Energias de Portugal S.A. | | |
| | |
| | |
Jeronimo Martins, SGPS, S.A. | | |
| | |
|
|
| | |
| | |
CapitaLand Integrated Commercial Trust | | |
Capitaland Investment Ltd. | | |
| | |
| | |
| | |
Grab Holdings Ltd., Class A * | | |
Jardine Cycle & Carriage Ltd. | | |
| | |
Mapletree Logistics Trust | | |
Mapletree Pan Asia Commercial Trust | | |
Oversea-Chinese Banking Corp., Ltd. | | |
| | |
| | |
| | |
| | |
Singapore Technologies Engineering Ltd. | | |
Singapore Telecommunications Ltd. | | |
United Overseas Bank Ltd. | | |
| | |
| | |
Wilmar International Ltd. | | |
| | |
|
|
| | |
ACS, Actividades de Construccion y Servicios S.A. | | |
| | |
| | |
Banco Bilbao Vizcaya Argentaria S.A. | | |
| | |
| | |
| | |
Corp. ACCIONA Energias Renovables S.A. * | | |
| | |
| | |
| | |
| | |
| | |
Industria de Diseno Textil S.A. | | |
Naturgy Energy Group S.A. | | |
| | |
| | |
| | |
| | |
|
|
| | |
| | |
| | |
| | |
| | |
| | |
| | |
| | |
| | |
| | |
| | |
| | |
| | |
Fastighets AB Balder, B Shares * | | |
| | |
H & M Hennes & Mauritz AB, B Shares | | |
| | |
| | |
| | |
Industrivarden AB, A Shares | | |
Industrivarden AB, C Shares | | |
| | |
Investment AB Latour, B Shares | | |
| | |
| | |
| | |
L E Lundbergfortagen AB, B Shares | | |
| | |
Nibe Industrier AB, B Shares | | |
| | |
| | |
| | |
| | |
Skandinaviska Enskilda Banken AB, A Shares | | |
| | |
| | |
Svenska Cellulosa AB, S.C.A., B Shares | | |
Svenska Handelsbanken AB, A Shares | | |
| | |
Swedish Orphan Biovitrum AB * | | |
| | |
Telefonaktiebolaget LM Ericsson, B Shares | | |
| | |
| | |
| | |
Volvo Car AB, B Shares *(a) | | |
| | |
|
|
| | |
| | |
| | |
Bachem Holding AG, Class B | | |
| | |
Banque Cantonale Vaudoise | | |
| | |
| | |
Chocoladefabriken Lindt & Spruengli AG | | |
Chocoladefabriken Lindt & Spruengli AG, Participation Certificates | | |
Cie Financiere Richemont S.A., Class A | | |
| | |
| | |
| | |
| | |
| | |
| | |
140Schwab Equity Index Funds | Semiannual Report
Schwab International Index Fund
Portfolio Holdings as of April 30, 2023 (Unaudited) (continued)
| | |
| | |
Kuehne & Nagel International AG (a) | | |
Logitech International S.A. | | |
| | |
| | |
| | |
Partners Group Holding AG | | |
| | |
Roche Holding AG, Bearer Shares | | |
| | |
Schindler Holding AG, Participation Certificates | | |
| | |
| | |
| | |
| | |
| | |
| | |
| | |
| | |
| | |
| | |
| | |
The Swatch Group AG, Bearer Shares | | |
| | |
| | |
Zurich Insurance Group AG | | |
| | |
|
|
| | |
| | |
| | |
| | |
| | |
| | |
Associated British Foods plc | | |
| | |
| | |
| | |
| | |
| | |
| | |
Berkeley Group Holdings plc | | |
| | |
British American Tobacco plc | | |
| | |
| | |
| | |
| | |
| | |
| | |
| | |
| | |
| | |
| | |
| | |
| | |
| | |
| | |
| | |
Hikma Pharmaceuticals plc | | |
| | |
| | |
| | |
InterContinental Hotels Group plc | | |
| | |
| | |
| | |
| | |
| | |
| | |
Land Securities Group plc | | |
Legal & General Group plc | | |
| | |
London Stock Exchange Group plc | | |
| | |
| | |
| | |
| | |
| | |
| | |
| | |
| | |
| | |
Phoenix Group Holdings plc | | |
| | |
Reckitt Benckiser Group plc | | |
| | |
| | |
| | |
Rolls-Royce Holdings plc * | | |
| | |
| | |
| | |
| | |
| | |
| | |
Spirax-Sarco Engineering plc | | |
| | |
| | |
| | |
| | |
| | |
The British Land Co., plc | | |
| | |
| | |
United Utilities Group plc | | |
| | |
| | |
| | |
| | |
Total Common Stocks
(Cost $6,493,131,662) | |
|
PREFERRED STOCKS 0.5% OF NET ASSETS |
|
|
Bayerische Motoren Werke AG | | |
| | |
| | |
Porsche Automobil Holding SE | | |
| | |
| | |
| | |
Total Preferred Stocks
(Cost $40,178,344) | |
Schwab Equity Index Funds | Semiannual Report141
Schwab International Index Fund
Portfolio Holdings as of April 30, 2023 (Unaudited) (continued)
| | |
SHORT-TERM INVESTMENTS 0.4% OF NET ASSETS |
|
|
State Street Institutional U.S. Government Money Market Fund, Premier Class 4.76% (c)(d) | | |
Total Short-Term Investments
(Cost $39,710,223) | |
Total Investments in Securities
(Cost $6,573,020,229) | |
| | | CURRENT VALUE/
UNREALIZED
APPRECIATION
($) |
|
| | | |
MSCI EAFE Index, expires 06/16/23 | | | |
| Non-income producing security. |
| All or a portion of this security is on loan. Securities on loan were valued at $36,891,342. |
| Fair valued using significant unobservable inputs (see financial note 2(a), Securities for which no quoted value is available, for additional information). |
| The rate shown is the annualized 7-day yield. |
| Security purchased with cash collateral received for securities on loan. |
| American Depositary Receipt |
| |
| Global Depositary Receipt |
| Real Estate Investment Trust |
The following is a summary of the inputs used to value the fund’s investments as of April 30, 2023 (see financial note 2(a) for additional information):
| QUOTED PRICES IN
ACTIVE MARKETS FOR
IDENTICAL ASSETS
(LEVEL 1) | OTHER SIGNIFICANT
OBSERVABLE INPUTS
(LEVEL 2) | SIGNIFICANT
UNOBSERVABLE INPUTS
(LEVEL 3) | |
| | | | |
| | | | |
| | | | |
| | | | |
| | | | |
| | | | |
| | | | |
| | | | |
| | | | |
| | | | |
| | | | |
| | | | |
| Level 3 amount shown includes securities determined to have no value at April 30, 2023. |
| As categorized in the Portfolio Holdings. |
| Futures contracts are valued at unrealized appreciation or depreciation. |
Fund investments in mutual funds are classified as Level 1, without consideration to the classification level of the underlying
securities held by the mutual funds, which could be Level 1, Level 2 or Level 3.
142Schwab Equity Index Funds | Semiannual Report
Schwab International Index Fund
Statement of Assets and Liabilities
As of April 30, 2023; unaudited
|
Investments in securities, at value - unaffiliated (cost $6,573,020,229) including securities on loan of $36,891,342 | | |
| | |
Foreign currency, at value (cost $6,966,461) | | |
Deposit with broker for futures contracts | | |
| | |
| | |
| | |
| | |
Income from securities on loan | | |
| | |
|
|
Collateral held for securities on loan | | |
| | |
| | |
| | |
| | |
Variation margin on futures contracts | | |
| | |
| | |
|
|
Capital received from investors | | |
Total distributable earnings | | |
| | |
Schwab Equity Index Funds | Semiannual Report143
Schwab International Index Fund
Statement of Operations
For the period November 1, 2022 through April 30, 2023; unaudited |
|
Dividends received from securities - unaffiliated (net of foreign withholding tax of $15,639,535) | | |
| | |
| | |
|
|
| | |
| | |
| | |
| | |
| | |
| | |
|
REALIZED AND UNREALIZED GAINS (LOSSES) |
Net realized losses on sales of securities - unaffiliated | | |
Net realized gains on futures contracts | | |
Net realized gains on foreign currency transactions | | |
| | |
Net change in unrealized appreciation (depreciation) on securities - unaffiliated | | |
Net change in unrealized appreciation (depreciation) on futures contracts | | |
Net change in unrealized appreciation (depreciation) on foreign currency translations | | |
Net change in unrealized appreciation (depreciation) | | |
Net realized and unrealized gains | | |
Increase in net assets resulting from operations | | |
| Professional fees associated with the filing of tax claims in the European Union deemed to be non-contingent and non-routine expenses of the fund (see financial notes 2(d) and 4 for additional information). |
144Schwab Equity Index Funds | Semiannual Report
Schwab International Index Fund
Statement of Changes in Net Assets
For the current and prior report periods
Figures for the current period are unaudited
|
| | |
| | | |
| | | |
Net change in unrealized appreciation (depreciation) | | | |
Increase (decrease) in net assets resulting from operations | | | |
|
DISTRIBUTIONS TO SHAREHOLDERS |
| | | |
TRANSACTIONS IN FUND SHARES |
| | |
| | | | | |
| | | | | |
| | | | | |
| | | | | |
Net transactions in fund shares | | | | | |
|
SHARES OUTSTANDING AND NET ASSETS |
| | |
| | | | | |
| | | | | |
Total increase (decrease) | | | | | |
| | | | | |
Schwab Equity Index Funds | Semiannual Report145
Schwab Equity Index Funds
Financial Notes, unaudited
1. Business Structure of the Funds:
Each of the funds in this report is a series of Schwab Capital Trust, except Schwab 1000 Index Fund, which is a series of Schwab Investments. Both Schwab Capital Trust and Schwab Investments (the trusts) are no-load, open-end management investment companies. Each trust is organized as a Massachusetts business trust and is registered under the Investment Company Act of 1940, as amended (the 1940 Act). The list below shows all the funds in the trusts as of the end of the period, including the funds discussed in this report, which are highlighted:
SCHWAB CAPITAL TRUST (ORGANIZED MAY 7, 1993) |
Schwab S&P 500 Index Fund | |
Schwab Small-Cap Index Fund | |
Schwab Total Stock Market Index Fund | |
Schwab U.S. Large-Cap Growth Index Fund | |
Schwab U.S. Large-Cap Value Index Fund | |
Schwab U.S. Mid-Cap Index Fund | Schwab Fundamental US Large Company Index Fund |
Schwab International Index Fund | Schwab Fundamental US Small Company Index Fund |
Schwab MarketTrack All Equity Portfolio™ | Schwab Fundamental International Large Company Index Fund |
Schwab MarketTrack Growth Portfolio™ | Schwab Fundamental International Small Company Index Fund |
Schwab MarketTrack Balanced Portfolio™ | Schwab Fundamental Emerging Markets Large Company Index Fund |
Schwab MarketTrack Conservative Portfolio™ | Schwab Fundamental Global Real Estate Index Fund |
Schwab International Opportunities Fund | Schwab Target 2010 Index Fund |
| Schwab Target 2015 Index Fund |
| Schwab Target 2020 Index Fund |
Schwab Dividend Equity Fund | Schwab Target 2025 Index Fund |
Schwab Large-Cap Growth Fund | Schwab Target 2030 Index Fund |
Schwab Small-Cap Equity Fund | Schwab Target 2035 Index Fund |
| Schwab Target 2040 Index Fund |
Schwab International Core Equity Fund | Schwab Target 2045 Index Fund |
| Schwab Target 2050 Index Fund |
| Schwab Target 2055 Index Fund |
| Schwab Target 2060 Index Fund |
| Schwab Target 2065 Index Fund |
| Schwab Monthly Income Fund – Target Payout |
| Schwab Monthly Income Fund – Flexible Payout |
| Schwab Monthly Income Fund – Income Payout |
| |
SCHWAB INVESTMENTS (ORGANIZED OCTOBER 26, 1990) |
| Schwab Tax-Free Bond Fund |
Schwab Treasury Inflation Protected Securities Index Fund | Schwab California Tax-Free Bond Fund |
Schwab U.S. Aggregate Bond Index Fund | Schwab Opportunistic Municipal Bond Fund |
Schwab Short-Term Bond Index Fund | Schwab Global Real Estate Fund |
Each fund in this report offers one share class. Shares are bought and sold at closing net asset value per share (NAV), which is the price for all outstanding shares of a fund. Each share has a par value of 1/1,000 of a cent, and the funds’ Board of Trustees (the Board) may authorize the issuance of as many shares as necessary.
Each fund maintains its own account for purposes of holding assets and accounting, and is considered a separate entity for tax purposes. Within its account, each fund may also keep certain assets in segregated accounts, as required by securities law. The "Fund Complex" includes The Charles Schwab Family of Funds, Schwab Capital Trust, Schwab Investments, Schwab Annuity Portfolios, Schwab Strategic Trust and Laudus Trust.
2. Significant Accounting Policies:The following is a summary of the significant accounting policies the funds use in their preparation of financial statements. The funds follow the investment company accounting and reporting guidance of the Financial Accounting Standards Board (FASB) Accounting Standard Codification Topic 946 Financial Services — Investment Companies. The accounting policies are in conformity with accounting principles generally accepted in the United States of America (GAAP).
146Schwab Equity Index Funds | Semiannual Report
Schwab Equity Index Funds
Financial Notes, unaudited (continued)
2. Significant Accounting Policies (continued):
The funds may invest in certain mutual funds and exchange-traded funds (ETFs), which are referred to as "underlying funds". For more information about the underlying funds’ operations and policies, please refer to those funds’ semiannual and annual reports, which are filed with the U.S. Securities and Exchange Commission (SEC) and are available on the SEC’s website at www.sec.gov.
(a) Security Valuation:
Pursuant to Rule 2a-5 under the 1940 Act, the Board has designated authority to a Valuation Designee, the funds’ investment adviser, to make fair valuation determinations under adopted procedures, subject to Board oversight. The investment adviser has formed a Pricing Committee to administer the pricing and valuation of portfolio securities and other assets and liabilities as well as to ensure that prices used for internal purposes or provided by third parties reasonably reflect fair value. The Valuation Designee may utilize independent pricing services, quotations from securities and financial instrument dealers and other market sources to determine fair value.
Securities held in the funds’ portfolio are valued every business day. The following valuation policies and procedures are used by the Valuation Designee to value various types of securities:
• Securities traded on an exchange or over-the-counter: Traded securities are valued at the closing value for the day, or, on days when no closing value has been reported, at the mean of the most recent bid and ask quotes. Securities that are primarily traded on foreign exchanges are valued at the official closing price or the last sales price on the exchange where the securities are principally traded with these values then translated into U.S. dollars at the current exchange rate, unless these securities are fair valued as discussed below.
• Foreign equity security fair valuation: The Valuation Designee has adopted procedures to fair value foreign equity securities that are traded in markets that close prior to the valuation of a fund’s holdings. By fair valuing securities whose prices may have been affected by events occurring after the close of trading, the Valuation Designee seeks to establish prices that investors might expect to realize upon the current sales of these securities. This methodology is designed to deter “arbitrage” market timers, who seek to exploit delays between the change in the value of a fund’s portfolio holdings and the NAV of a fund’s shares and seeks to help ensure that the prices at which a fund’s shares are purchased and redeemed are fair and do not result in dilution of shareholder interest or other harm to shareholders. When fair value pricing is used at the open or close of a reporting period, it may cause a temporary divergence between the return of a fund and that of its comparative index or benchmark.
• Futures contracts: Futures contracts are valued at their settlement prices as of the close of their exchanges.
• Mutual funds: Mutual funds are valued at their respective NAVs.
• Securities for which no quoted value is available: The Valuation Designee has adopted procedures to fair value a fund’s securities when market prices are not “readily available” or are unreliable. For example, a security may be fair valued when it’s de-listed or its trading is halted or suspended; when a security’s primary pricing source is unable or unwilling to provide a price; or when a security’s primary trading market is closed during regular market hours. Fair value determinations are made in good faith in accordance with adopted valuation procedures. The Valuation Designee considers a number of factors, including unobservable market inputs, when arriving at fair value. The Valuation Designee may employ methods such as the review of related or comparable assets or liabilities, related market activities, recent transactions, market multiples, book values, transactional back-testing, disposition analysis and other relevant information. Due to the subjective and variable nature of fair value pricing, there can be no assurance that a fund could obtain the fair value assigned to the security upon the sale of such security.
In accordance with the authoritative guidance on fair value measurements and disclosures under GAAP, the funds disclose the fair value of their investments in a hierarchy that prioritizes the significant inputs to valuation methods used to measure the fair value. The hierarchy gives the highest priority to valuations based upon unadjusted quoted prices in active markets for identical assets or liabilities (Level 1 measurements) and the lowest priority to valuations based upon unobservable inputs that are significant to the valuation (Level 3 measurements). If inputs used to measure the financial instruments fall within different levels of the hierarchy, the categorization is based on the lowest level input that is significant to the valuation. If it is determined that either the volume and/or level of activity for an asset or liability has significantly decreased (from normal conditions for that asset or liability) or price quotations or observable inputs are not associated with orderly transactions, increased analysis and the Valuation Designee’s judgment will be required to estimate fair value.
Schwab Equity Index Funds | Semiannual Report147
Schwab Equity Index Funds
Financial Notes, unaudited (continued)
2. Significant Accounting Policies (continued):
The three levels of the fair value hierarchy are as follows:
• Level 1 — quoted prices in active markets for identical investments — Investments whose values are based on quoted market prices in active markets. These generally include active listed equities, mutual funds, ETFs and futures contracts. Mutual funds and ETFs are classified as Level 1 prices, without consideration to the classification level of the underlying securities held.
• Level 2 — other significant observable inputs (including quoted prices for similar securities, interest rates, prepayment speeds, credit risk, etc.) — Investments that trade in markets that are not considered to be active, but whose values are based on quoted market prices, dealer quotations or valuations provided by alternative pricing sources supported by observable inputs are classified as Level 2 prices. These generally include U.S. government and sovereign obligations, most government agency securities, investment-grade corporate bonds, certain mortgage products, less liquid listed equities, and state, municipal and provincial obligations. In addition, international securities whose markets close hours before the valuation of a fund’s holdings may require fair valuations due to significant movement in the U.S. markets occurring after the daily close of foreign markets. The Valuation Designee has approved a vendor that calculates fair valuations of international equity securities based on a number of factors that appear to correlate to the movements in the U.S. markets.
• Level 3 — significant unobservable inputs (including the Valuation Designee’s assumptions in determining the fair value of investments) — Investments whose values are classified as Level 3 prices have significant unobservable inputs, as they may trade infrequently or not at all. When observable prices are not readily available for these securities, one or more valuation methods are used for which sufficient and reliable data is available. The inputs used in estimating the value of Level 3 prices may include the original transaction price, quoted prices for similar securities or assets in active markets, completed or pending third-party transactions in the underlying investment or comparable issuers, and changes in financial ratios or cash flows. Level 3 prices may also be adjusted to reflect illiquidity and/or non-transferability, with the amount of such discount estimated in the absence of market information. Assumptions used due to the lack of observable inputs may significantly impact the resulting fair value and therefore a fund’s results of operations.
The inputs or methodology used for valuing securities are not necessarily an indication of the risk associated with investing in those securities.
The levels associated with valuing the funds’ investments as of April 30, 2023 are disclosed in the Portfolio Holdings.
(b) Accounting Policies for certain Portfolio Investments (if held):
Futures Contracts: Futures contracts are instruments that represent an agreement between two parties that obligates one party to buy, and the other party to sell, specific instruments at an agreed upon price on a stipulated future date. A fund must give the broker a deposit of cash and/or securities (initial margin) whenever it enters into a futures contract. The amount of the deposit may vary from one contract to another. Subsequent payments (variation margin) are made or received by a fund depending on the daily fluctuations in the value of the futures contract and are accounted for as unrealized appreciation or depreciation until the contract is closed, at which time the gains or losses are realized. Futures contracts are traded publicly on exchanges, and their value may change daily.
Securities Lending: Under the trusts’ Securities Lending Program, a fund (lender), may make short-term loans of its securities to another party (borrower) to generate additional revenue for the fund. The borrower pledges collateral in the form of cash, securities issued or fully guaranteed by the U.S. government or foreign governments, or letters of credit issued by a bank. Collateral at the individual loan level is required to be maintained on a daily marked-to-market basis in an amount at least equal to the current value of the securities loaned. The lending agent provides a fund with indemnification against borrower default (the borrower fails to return the security on loan) reducing the risk of loss as a result of default. The cash collateral of securities loaned is currently invested in money market portfolios operating pursuant to Rule 2a-7 under the 1940 Act. Each fund bears the risk of loss with respect to the investment of cash collateral. The terms of the securities lending agreement allow the funds or the lending agent to terminate any loan at any given time and the securities must be returned within the earlier of the standard trade settlement period or the specified time period under the relevant securities lending agreement. Securities lending income, as disclosed in each fund’s Statement of Operations, if applicable, represents the income earned from the investment of the cash collateral plus any fees paid by borrowers, less the fees paid to the lending agent and broker rebates which are subject to adjustments pursuant to the securities lending agreement. On loans not collateralized by cash, a fee is received from the borrower, and is allocated between a fund and the lending agent. The aggregate fair value of securities loaned will not at any time exceed one-third of the total assets of a fund, including collateral received from the loan. Securities lending fees paid to the unaffiliated lending agents start at 9% of gross lending revenue, with subsequent breakpoints to a low of 5%. In this context, the gross lending revenue equals the income received from
148Schwab Equity Index Funds | Semiannual Report
Schwab Equity Index Funds
Financial Notes, unaudited (continued)
2. Significant Accounting Policies (continued):
the investment of cash collateral and fees paid by borrowers less any rebates paid to the borrowers. Any expenses charged by the cash collateral fund are in addition to these fees. All remaining revenue is retained by the fund, as applicable. No portion of lending revenue is paid to or retained by the investment adviser or any of its affiliates.
As of April 30, 2023, Schwab 1000 Index Fund, Schwab Small-Cap Index Fund, Schwab Total Stock Market Index Fund, Schwab U.S. Large-Cap Growth Index Fund, Schwab U.S. Large-Cap Value Index Fund, Schwab U.S. Mid-Cap Index Fund and Schwab International Index Fund had securities on loan, all of which were classified as common stocks. The value of the securities on loan and the related collateral as of April 30, 2023, if any, are disclosed in each fund’s Portfolio Holdings and Statement of Assets and Liabilities.
Passive Foreign Investment Companies: Certain funds may own shares in certain foreign corporations that meet the Internal Revenue Code definition of a Passive Foreign Investment Company (PFIC). The funds may elect for tax purposes to mark-to-market annually the shares of each PFIC lot held and would be required to distribute as ordinary income to shareholders any such marked-to-market gains (as well as any gains realized on sale).
Cash Investments: The funds may invest a portion of their assets in cash. Cash includes cash bank balances in an interest-bearing demand deposit account with maturity on demand by the funds.
Central Securities Depositories Regulation: The Central Securities Depositories Regulation (CSDR) introduced new measures for the authorization and supervision of European Union Central Security Depositories and created a common set of prudential, organizational, and conduct of business standards at a European level. CSDR is designed to support securities settlement and operational aspects of securities settlement, including the provision of shorter settlement periods; mandatory buy-ins; and cash penalties, to prevent and address settlement fails. CSDR measures are aimed to prevent settlement fails by ensuring that all transaction details are provided to facilitate settlement, as well as further incentivizing timely settlement by imposing cash penalty fines and buy-ins. The Schwab International Index Fund may be subject to pay cash penalties and may also receive cash penalties with certain counterparties in instances where there are settlement fails. These cash penalties are included in net realized gains (losses) on sales of securities in each fund’s Statement of Operations, if any.
(c) Security Transactions:
Security transactions are recorded as of the date the order to buy or sell the security is executed. Realized gains and losses from security transactions are based on the identified costs of the securities involved.
Assets and liabilities denominated in foreign currencies are reported in U.S. dollars. For assets and liabilities held on a given date, the dollar value is based on market exchange rates in effect on that date. Transactions involving foreign currencies, including purchases, sales, income receipts and expense payments, are calculated using exchange rates in effect on the transaction date. Realized foreign exchange gains or losses arise from sales of foreign currencies, currency gains or losses realized between the trade and settlement dates on securities transactions and the difference between the recorded amounts of dividends, interest, and foreign withholding taxes and the U.S. dollar equivalent of the amounts actually received or paid. Net unrealized foreign exchange appreciation or depreciation arises from changes in foreign exchange rates on foreign denominated assets and liabilities other than investments in securities held at the end of the reporting period. These realized and unrealized foreign exchange gains or losses are reported in foreign currency transactions or translations in each fund’s Statement of Operations, if any. The funds do not isolate the portion of the fluctuations on investments resulting from changes in foreign currency exchange rates from the fluctuations in market prices of investments held. Such fluctuations are included with the net realized and unrealized gain or loss from investments, if any.
Gains realized by the funds on the sale of securities in certain foreign countries may be subject to non-U.S. taxes. In those instances, the funds record a liability based on unrealized gains to provide for potential non-U.S. taxes payable upon the sale of these securities.
When a fund closes out a futures contract position, it calculates the difference between the value of the position at the beginning and at the end of the contract, and records a realized gain or loss accordingly.
(d) Investment Income:
Interest income is recorded as it accrues. Dividends, in the form of cash or non-cash income such as in the form of additional securities, and distributions from portfolio securities and underlying funds are recorded on the date they are effective (the ex-dividend date), although the funds record certain foreign security dividends on the date the ex-dividend date is confirmed. Any distributions from underlying funds are recorded in accordance with the character of the distributions as designated by the underlying funds.
Schwab Equity Index Funds | Semiannual Report149
Schwab Equity Index Funds
Financial Notes, unaudited (continued)
2. Significant Accounting Policies (continued):
Income received from foreign sources may result in withholding tax. Withholding taxes are accrued at the same time as the related income if the tax rate is fixed and known, unless a tax withheld is reclaimable from the local tax authorities in which case it is recorded as receivable. If the tax rate is not known or estimable, such expense or reclaim receivable is recorded when the net proceeds are received.
The Schwab International Index Fund filed claims to recover taxes previously withheld in certain European Union countries on the basis that those countries had purportedly violated certain provisions in the Treaty on the Functioning of the European Union. These filings are subject to various administrative and judicial proceedings within these countries, and all professional fees associated with these filings have been paid by the investment adviser. The professional fees are non-contingent and non-routine fees which are subject to repayment to the investment adviser (see financial note 4 for additional information).
For U.S. income tax purposes, European Union reclaims received reduce the amounts of foreign taxes that the fund passes through to its shareholders. If European Union reclaims received exceed foreign withholding taxes paid, the Schwab International Index Fund will evaluate the requirements for entering into a closing agreement with the Internal Revenue Service (IRS) to address any prior years’ U.S. income tax liabilities attributable to fund shareholders resulting from the recovery of foreign taxes. The closing agreement would result in the fund paying a compliance fee to the IRS, on behalf of its shareholders, representing the estimated tax savings generated from foreign tax credits claimed by fund shareholders on their tax returns in prior years. During the period ended April 30, 2023, the Schwab International Index Fund did not incur any compliance fees.
(e) Expenses:
Pursuant to an Amended and Restated Investment Advisory and Administration Agreement (Advisory Agreement) between the investment adviser and each trust, the investment adviser pays the operating expenses of each fund, excluding acquired fund fees and expenses, taxes, any brokerage expenses, and extraordinary or non-routine expenses. Taxes, any brokerage expenses and extraordinary or non-routine expenses that are specific to a fund are charged directly to the fund. Acquired fund fees and expenses are indirect expenses incurred by a fund through its investments in underlying funds. Such expenses are reflected in the net asset values of the underlying funds.
(f) Distributions to Shareholders:
The funds make distributions from net investment income and net realized capital gains, if any, once a year. To receive a distribution, you must be a registered shareholder on the record date. Distributions are paid to shareholders on the payable date.
(g) Accounting Estimates:
The accounting policies described in this report conform to GAAP. Notwithstanding this, shareholders should understand that in order to follow these principles, fund management has to make estimates and assumptions that affect the information reported in the financial statements. It’s possible that once the results are known, they may turn out to be different from these estimates and these differences may be material.
(h) Federal Income Taxes:
The funds intend to meet federal income and excise tax requirements for regulated investment companies under subchapter M of the Internal Revenue Code, as amended. Accordingly, the funds distribute substantially all of their net investment income and net realized capital gains, if any, to their respective shareholders each year. As long as a fund meets the tax requirements, it is not required to pay federal income tax.
(i) Foreign Taxes:
The funds may be subject to foreign taxes (a portion of which may be reclaimable) on income, corporate events, foreign currency exchanges and capital gains on investments. All foreign taxes are recorded in accordance with the applicable foreign tax regulations and rates that exist in foreign markets in which the funds invest. These foreign taxes, if any, are paid by the funds and are disclosed in each fund’s Statement of Operations. Foreign taxes accrued as of April 30, 2023, if any, are reflected in each fund’s Statement of Assets and Liabilities.
150Schwab Equity Index Funds | Semiannual Report
Schwab Equity Index Funds
Financial Notes, unaudited (continued)
2. Significant Accounting Policies (continued):
(j) Indemnification:
Under the funds’ organizational documents, the officers and trustees are indemnified against certain liabilities arising out of the performance of their duties to the funds. In addition, in the normal course of business the funds enter into contracts with their vendors and others that provide general indemnifications. The funds’ maximum exposure under these arrangements is unknown as this would involve future claims that may be made against the funds. However, based on experience, the funds expect the risk of loss attributable to these arrangements to be remote.
(k) Regulatory Update:
Effective January 24, 2023, the SEC adopted rule and form amendments to require mutual funds and ETFs to transmit concise and visually engaging streamlined annual and semiannual reports to shareholders that highlight key information deemed important for retail investors to assess and monitor their fund investments. Other information, including financial statements, will no longer appear in a streamlined shareholder report but must be available online, delivered free of charge upon request, and filed on a semiannual basis on Form N-CSR. The rule and form amendments have a compliance date of July 24, 2024. At this time, management is evaluating the impact of these rule and form amendment changes on the content of the current shareholder report and the newly created annual and semiannual streamlined shareholder reports.
3. Risk Factors:Investing in the funds may involve certain risks, as discussed in the funds’ prospectuses, including, but not limited to, those described below. Any of these risks could cause an investor to lose money.
Market Risk. Financial markets rise and fall in response to a variety of factors, sometimes rapidly and unpredictably. Markets may be impacted by economic, political, regulatory and other conditions, including economic sanctions and other government actions. In addition, the occurrence of global events, such as war, terrorism, environmental disasters, natural disasters and epidemics, may also negatively affect the financial markets. As with any investment whose performance is tied to these markets, the value of an investment in a fund will fluctuate, which means that an investor could lose money over short or long periods.
Equity Risk. The prices of equity securities rise and fall daily. These price movements may result from factors affecting individual companies, industries or the securities market as a whole. In addition, equity markets tend to move in cycles, which may cause stock prices to fall over short or extended periods of time.
Investment Style Risk. The funds are index funds. Therefore, each fund follows the securities included in its respective index during upturns as well as downturns. Because of its indexing strategy, a fund does not take steps to reduce market exposure or to lessen the effects of a declining market. In addition, because of a fund’s expenses, a fund’s performance may be below that of the index. Errors relating to the index may occur from time to time and may not be identified by the index provider for a period of time. In addition, market disruptions could cause delays in an index’s rebalancing schedule. Such errors and/or market disruptions may result in losses for a fund.
Tracking Error Risk. As index funds, each fund seeks to track the performance of its respective index, although it may not be successful in doing so. The divergence between the performance of a fund and the index, positive or negative, is called “tracking error.” Tracking error can be caused by many factors and it may be significant.
Sampling Index Tracking Risk. To the extent a fund uses sampling techniques, a fund will not fully replicate its index and may hold securities not included in the index. As a result, a fund will be subject to the risk that the investment adviser’s investment strategy, the implementation of which is subject to a number of constraints, may not produce the intended results. If a fund utilizes a sampling approach, it may not track the return of the index as well as it would if the fund purchased all of the securities in the index.
Concentration Risk. To the extent that a fund’s or its respective index’s portfolio is concentrated in the securities of issuers in a particular market, industry, group of industries, sector, country or asset class, the fund may be adversely affected by the performance of those securities, may be subject to increased price volatility and may be more vulnerable to adverse economic, market, political or regulatory occurrences affecting that market, industry, group of industries, sector, country or asset class.
Market Capitalization Risk. Securities issued by companies of different market capitalizations tend to go in and out of favor based on market and economic conditions. During a period when securities of a particular market capitalization fall behind other types of investments, the fund’s performance could be impacted.
Large-Cap Company Risk. Large-cap companies are generally more mature and the securities issued by these companies may not be able to reach the same levels of growth as the securities issued by small- or mid-cap companies.
Schwab Equity Index Funds | Semiannual Report151
Schwab Equity Index Funds
Financial Notes, unaudited (continued)
3. Risk Factors (continued):
Mid-Cap Company Risk. Mid-cap companies may be more vulnerable to adverse business or economic events than larger, more established companies and the value of securities issued by these companies may move sharply.
Small-Cap Company Risk. Securities issued by small-cap companies may be riskier than those issued by larger companies, and their prices may move sharply, especially during market upturns and downturns.
Growth Investing Risk. Growth stocks can be volatile. Growth companies usually invest a high portion of earnings in their businesses and may lack the dividends of value stocks that can cushion stock prices in a falling market. The prices of growth stocks are based largely on projections of the issuer’s future earnings and revenues. If a company’s earnings or revenues fall short of expectations, its stock price may fall dramatically. Growth stocks may also be more expensive relative to their earnings or assets compared to value or other stocks.
Value Investing Risk. Certain funds emphasize a “value” style of investing, which targets undervalued companies with characteristics for improved valuations. This style of investing is subject to the risk that the valuations never improve or that the returns on “value” securities may not move in tandem with the returns on other styles of investing or the stock market in general.
Foreign Investment Risk. A fund’s investments in securities of foreign issuers involve certain risks that may be greater than those associated with investments in securities of U.S. issuers. These include risks of adverse changes in foreign economic, political, regulatory and other conditions; changes in currency exchange rates or exchange control regulations (including limitations on currency movements and exchanges); the imposition of economic sanctions or other government restrictions; differing accounting, auditing, financial reporting and legal standards and practices; differing securities market structures; and higher transaction costs. These risks may negatively impact the value or liquidity of a fund’s investments, and could impair the fund’s ability to meet its investment objective or invest in accordance with its investment strategy. There is a risk that investments in securities denominated in, and/or receiving revenues in, foreign currencies will decline in value relative to the U.S. dollar. Foreign securities also include American Depositary Receipts, Global Depositary Receipts (GDRs) and European Depositary Receipts, which may be less liquid than the underlying shares in their primary trading market, and GDRs, in particular, many of which are issued by companies in emerging markets, may be more volatile. To the extent a fund’s investments in a single country or a limited number of countries represent a large percentage of the fund’s assets, the fund’s performance may be adversely affected by the economic, political, regulatory and social conditions in those countries, and the fund’s price may be more volatile than the price of a fund that is geographically diversified.
Derivatives Risk. A fund may use derivatives to enhance returns or hedge against market declines. Examples of derivatives are futures and options on futures. An option is the right to buy or sell an instrument at a specific price before a specific date. A future is an agreement to buy or sell a financial instrument at a specific price on a specific day. The use of derivatives that are subject to regulation by the Commodity Futures Trading Commission (CFTC) could cause a fund to become a commodity pool, which would require the fund to comply with certain CFTC rules.
A fund’s use of derivative instruments involves risks different from, or possibly greater than, the risks associated with investing directly in securities and other traditional investments. Certain of these risks, such as liquidity risk and market risk, are discussed elsewhere in this section. A fund’s use of derivatives is also subject to lack of availability risk, credit risk, leverage risk, valuation risk, correlation risk and tax risk. Lack of availability risk is the risk that suitable derivative transactions may not be available in all circumstances for risk management or other purposes. Credit risk is the risk that the counterparty to a derivatives transaction may not fulfill its obligations. Leverage risk is the risk that a small percentage of assets invested in derivatives can have a disproportionately large impact on a fund. Valuation risk is the risk that a particular derivative may be valued incorrectly. Correlation risk is the risk that changes in the value of the derivative may not correlate perfectly with the underlying asset, rate or index. Tax risk is the risk that the use of derivatives may cause a fund to realize higher amounts of short-term capital gains. A fund’s use of derivatives could reduce the fund’s performance, increase its volatility and cause the fund to lose more than the initial amount invested. A fund’s use of derivatives also could create a risk of counterparty default under certain transactions, risks that the fund would need to liquidate portfolio positions when it may not be advantageous to do so in order to meet margin and payment obligations, and legal risks relating to insufficient documentation, insufficient capacity or authority of a counterparty, or legality or enforceability of a contract.
Liquidity Risk. A fund may be unable to sell certain securities, such as illiquid securities, readily at a favorable time or price, or the fund may have to sell them at a loss.
Securities Lending Risk. Securities lending involves the risk of loss of rights in, or delay in recovery of, the loaned securities if the borrower fails to return the security loaned or becomes insolvent.
Please refer to the funds’ prospectus for a more complete description of the principal risks of investing in the funds.
152Schwab Equity Index Funds | Semiannual Report
Schwab Equity Index Funds
Financial Notes, unaudited (continued)
4. Affiliates and Affiliated Transactions:
Investment Adviser
Charles Schwab Investment Management Inc., dba Schwab Asset Management, a wholly owned subsidiary of The Charles Schwab Corporation, serves as each fund’s investment adviser and administrator pursuant to an Advisory Agreement between the investment adviser and each trust.
For its advisory and administrative services to the funds, the investment adviser is entitled to receive an annual fee, payable monthly, based on a percentage of each fund’s average daily net assets as follows:
| | SCHWAB SMALL-CAP INDEX FUND | SCHWAB TOTAL STOCK MARKET INDEX FUND | SCHWAB U.S. LARGE-CAP GROWTH INDEX FUND | SCHWAB U.S. LARGE-CAP VALUE INDEX FUND | SCHWAB U.S. MID-CAP INDEX FUND | SCHWAB INTERNATIONAL INDEX FUND |
| | | | | | | |
Investments from Affiliates
Certain funds in the Fund Complex may own shares of other funds in the Fund Complex. The table below reflects the percentages of shares of each fund in this report that are owned by other funds in the Fund Complex as of April 30, 2023, as applicable:
| |
| | SCHWAB SMALL-CAP INDEX FUND | SCHWAB U.S. LARGE-CAP GROWTH INDEX FUND | SCHWAB U.S. MID-CAP INDEX FUND | SCHWAB INTERNATIONAL INDEX FUND |
Schwab MarketTrack All Equity Portfolio | | | | | |
Schwab MarketTrack Balanced Portfolio | | | | | |
Schwab MarketTrack Conservative Portfolio | | | | | |
Schwab MarketTrack Growth Portfolio | | | | | |
| | | | | |
| | | | | |
| | | | | |
| | | | | |
| | | | | |
| | | | | |
| | | | | |
| | | | | |
| | | | | |
| | | | | |
| | | | | |
| | | | | |
Other Affiliated Transactions
The professional fees related to foreign withholding tax claims discussed in financial note 2(d) are non-contingent and non-routine fees. The investment adviser agreed to pay these professional fees, on behalf of the Schwab International Index Fund, subject to reimbursement by the fund to the extent the fund is able to successfully recover taxes withheld in the future.
For the period ended April 30, 2023, the professional fees incurred by the Schwab International Index Fund and paid by the investment adviser were $1,994, as shown as Professional fees in the fund’s Statement of Operations.
Schwab Equity Index Funds | Semiannual Report153
Schwab Equity Index Funds
Financial Notes, unaudited (continued)
4. Affiliates and Affiliated Transactions (continued):
For the period ended April 30, 2023, the Schwab International Index Fund recovered previously withheld foreign taxes from Sweden. The payments received by Schwab International Index Fund amounted to $489,800 and is recorded as Dividends received from securities — unaffiliated in the Statement of Operations. The investment adviser paid upfront professional fees associated with recovering these foreign taxes in the amount of $19,449, which has been reimbursed to the investment adviser by the Schwab International Index Fund and is recorded as Dividends received from securities — unaffiliated in the fund’s Statement of Operations.
As of April 30, 2023, the balance of professional fees related to foreign withholding tax subject to future reimbursement by the Schwab International Index Fund to the investment adviser was $0.
No other amounts for additional tax reclaims are reflected in the financial statements due to the uncertainty surrounding the ultimate resolution of proceedings, the likelihood of receipt of these claims, and the potential timing of payment.
Interfund Transactions
The funds may engage in direct transactions with certain other funds in the Fund Complex in accordance with procedures adopted by the Board pursuant to Rule 17a-7 under the 1940 Act. When one fund is seeking to sell a security that another is seeking to buy, an interfund transaction can allow both funds to benefit by reducing transaction costs. This practice is limited to funds that share the same investment adviser, trustees and/or officers. For the period ended April 30, 2023, each fund’s purchases and sales of securities with other funds in the Fund Complex as well as any realized gains (losses) were as follows:
| | | |
Schwab S&P 500 Index Fund | | | |
| | | |
Schwab Small-Cap Index Fund | | | |
Schwab Total Stock Market Index Fund | | | |
Schwab U.S. Large-Cap Growth Index Fund | | | |
Schwab U.S. Large-Cap Value Index Fund | | | |
Schwab U.S. Mid-Cap Index Fund | | | |
Schwab International Index Fund | | | |
| | | |
Interfund Borrowing and Lending
Pursuant to an exemptive order issued by the SEC, the funds may enter into interfund borrowing and lending transactions with other funds in the Fund Complex. All loans are for temporary or emergency purposes and the interest rate to be charged will be the average of the overnight repurchase agreement rate and the short-term bank loan rate. All loans are subject to numerous conditions designed to ensure fair and equitable treatment of all participating funds. The interfund lending facility is subject to the oversight and periodic review by the Board. The funds had no interfund borrowing or lending activity during the period.
5. Board of Trustees:The Board may include people who are officers and/or directors of the investment adviser or its affiliates. Federal securities law limits the percentage of such “interested persons” who may serve on a trust’s board, and the trusts were in compliance with these limitations throughout the report period. The funds do not pay any interested or non-interested (independent trustees) trustees. The independent trustees are paid by the investment adviser. For information regarding the trustees, please refer to the Trustees and Officers table at the end of this report.
6. Borrowing from Banks:During the period, the funds were participants with other funds in the Fund Complex in a joint, syndicated, committed $1 billion line of credit (the Syndicated Credit Facility), maturing on September 28, 2023. Under the terms of the Syndicated Credit Facility, in addition to the investment adviser paying the interest charged on any borrowings by a fund, the investment adviser paid a commitment fee of 0.15% per annum on the funds’ proportionate share of the unused portion of the Syndicated Credit Facility.
154Schwab Equity Index Funds | Semiannual Report
Schwab Equity Index Funds
Financial Notes, unaudited (continued)
6. Borrowing from Banks (continued):
During the period, the funds were participants with other funds in the Fund Complex in a joint, unsecured, uncommitted $400 million line of credit (the Uncommitted Credit Facility), with State Street Bank and Trust Company, maturing on September 28, 2023. Under the terms of the Uncommitted Credit Facility, the investment adviser pays interest on the amount a fund borrows. There were no borrowings by any of the funds from either line of credit during the period.
The funds also have access to custodian overdraft facilities. A fund may have utilized the overdraft facility and incurred an interest expense, which is paid by the investment adviser. The interest expense is determined based on a negotiated rate above the current Federal Funds Rate.
7. Derivatives:The funds entered into equity index futures contracts during the report period. The funds invested in futures contracts to equitize available cash. The value and variation margin for futures contracts held at April 30, 2023, if any, are presented in the Portfolio Holdings and Statement of Assets and Liabilities, respectively. The net realized gains (losses) and net change in unrealized appreciation (depreciation) on futures contracts are presented in the Statement of Operations, if any. Refer to financial note 2(b) for the funds’ accounting policies with respect to futures contracts and financial note 3 for disclosures concerning the risks of investing in futures contracts. During the period ended April 30, 2023, the month-end average notional amounts of futures contracts held by the funds and the month-end average number of contracts held were as follows:
| | |
Schwab S&P 500 Index Fund | | |
| | |
Schwab Small-Cap Index Fund | | |
Schwab Total Stock Market Index Fund | | |
Schwab U.S. Large-Cap Growth Index Fund | | |
Schwab U.S. Large-Cap Value Index Fund | | |
Schwab U.S. Mid-Cap Index Fund | | |
Schwab International Index Fund | | |
8. Purchases and Sales of Investment Securities:For the period ended April 30, 2023, purchases and sales of securities (excluding in-kind transactions and short-term obligations) were as follows:
| | |
Schwab S&P 500 Index Fund | | |
| | |
Schwab Small-Cap Index Fund | | |
Schwab Total Stock Market Index Fund | | |
Schwab U.S. Large-Cap Growth Index Fund | | |
Schwab U.S. Large-Cap Value Index Fund | | |
Schwab U.S. Mid-Cap Index Fund | | |
Schwab International Index Fund | | |
During the period ended April 30, 2023, the following funds had transactions in connection with in-kind transactions:
| IN-KIND PURCHASES
OF SECURITIES | IN-KIND SALES
OF SECURITIES |
| | |
Schwab Small-Cap Index Fund | | |
Schwab Equity Index Funds | Semiannual Report155
Schwab Equity Index Funds
Financial Notes, unaudited (continued)
8. Purchases and Sales of Investment Securities (continued):
For the period ended April 30, 2023, where applicable, the funds realized net capital gains or losses resulting from in-kind redemptions. Because such gains or losses are not taxable to the funds and are not distributed to existing fund shareholders, the gains or losses are reclassified from accumulated net realized gains or losses to capital received from investors at the end of the funds’ tax year. These reclassifications have no effect on net assets or net asset values per share. The net realized in-kind gains or losses on sales of in-kind redemptions for the period ended April 30, 2023, are disclosed in the funds’ Statements of Operations, if any.
9. Federal Income Taxes:As of April 30, 2023, the tax basis cost of the funds’ investments and gross unrealized appreciation and depreciation were as follows:
| | GROSS UNREALIZED
APPRECIATION | GROSS UNREALIZED
DEPRECIATION | NET UNREALIZED
APPRECIATION
(DEPRECIATION) |
Schwab S&P 500 Index Fund | | | | |
| | | | |
Schwab Small-Cap Index Fund | | | | |
Schwab Total Stock Market Index Fund | | | | |
Schwab U.S. Large-Cap Growth Index Fund | | | | |
Schwab U.S. Large-Cap Value Index Fund | | | | |
Schwab U.S. Mid-Cap Index Fund | | | | |
Schwab International Index Fund | | | | |
Capital loss carryforwards have no expiration and may be used to offset future realized capital gains for federal income tax purposes. As of October 31, 2022, the funds had capital loss carryforwards available as follows:
| |
Schwab S&P 500 Index Fund | |
| |
Schwab Small-Cap Index Fund | |
Schwab Total Stock Market Index Fund | |
Schwab U.S. Large-Cap Growth Index Fund | |
Schwab U.S. Large-Cap Value Index Fund | |
Schwab U.S. Mid-Cap Index Fund | |
Schwab International Index Fund | |
The tax-basis components of distributions and components of distributable earnings on a tax basis are finalized at fiscal year-end; accordingly, tax basis balances have not been determined as of April 30, 2023. The tax-basis components of distributions paid during the fiscal year ended October 31, 2022 were as follows:
| PRIOR FISCAL YEAR END DISTRIBUTIONS |
| | |
Schwab S&P 500 Index Fund | | |
| | |
Schwab Small-Cap Index Fund | | |
Schwab Total Stock Market Index Fund | | |
Schwab U.S. Large-Cap Growth Index Fund | | |
Schwab U.S. Large-Cap Value Index Fund | | |
Schwab U.S. Mid-Cap Index Fund | | |
Schwab International Index Fund | | |
156Schwab Equity Index Funds | Semiannual Report
Schwab Equity Index Funds
Financial Notes, unaudited (continued)
9. Federal Income Taxes (continued):
Distributions paid to shareholders are based on net investment income and net realized gains determined on a tax basis, which may differ from net investment income and net realized gains for financial reporting purposes. These differences reflect the differing character of certain income items and net realized gains and losses for financial statement and tax purposes, and may result in reclassification among certain capital accounts in the financial statements. The funds may also designate a portion of the amount paid to redeeming shareholders as a distribution for tax purposes.
As of October 31, 2022, management has reviewed the tax positions for open periods (for federal purposes, three years from the date of filing and for state purposes, four years from the date of filing) as applicable to the funds, and has determined that no provision for income tax is required in the funds’ financial statements. The funds recognize interest and penalties, if any, related to unrecognized tax benefits as income tax expense in each fund’s Statement of Operations. During the fiscal year ended October 31, 2022, the funds did not incur any interest or penalties.
10. Subsequent Events:Management has determined there are no subsequent events or transactions through the date the financial statements were issued that would have materially impacted the financial statements as presented.
Schwab Equity Index Funds | Semiannual Report157
Schwab Equity Index Funds
Trustees and Officers
The tables below give information about the trustees and officers of Schwab Capital Trust and Schwab Investments, which includes the funds covered in this report. The “Fund Complex” includes The Charles Schwab Family of Funds, Schwab Capital Trust, Schwab Investments, Schwab Annuity Portfolios, Schwab Strategic Trust and Laudus Trust. The Fund Complex includes 106 funds.
The address for all trustees and officers is 211 Main Street, San Francisco, CA 94105. You can find more information about the trustees and officers in the funds’ Statement of Additional Information, which is available free by calling 1-877-824-5615.
|
Name, Year of Birth, and Position(s) with the trust (Terms of office, and length of Time Served1) | Principal Occupations During the Past Five Years | Number of Portfolios in Fund Complex Overseen by the Trustee | |
Michael J. Beer 1961 Trustee (Trustee of The Charles Schwab Family of Funds, Schwab Investments, Schwab Capital Trust, Schwab Annuity Portfolios, Schwab Strategic Trust and Laudus Trust since 2022) | Retired. Director, President and Chief Executive Officer (Dec. 2016 – Sept. 2019), Principal Funds (investment management). | | Director (2016 – 2019), Principal Funds, Inc. |
Robert W. Burns 1959 Trustee (Trustee of Schwab Strategic Trust since 2009; The Charles Schwab Family of Funds, Schwab Investments, Schwab Capital Trust, Schwab Annuity Portfolios and Laudus Trust since 2016) | Retired/Private Investor. | | |
Nancy F. Heller 1956 Trustee (Trustee of The Charles Schwab Family of Funds, Schwab Investments, Schwab Capital Trust, Schwab Annuity Portfolios, Schwab Strategic Trust and Laudus Trust since 2018) | | | |
David L. Mahoney 1954 Trustee (Trustee of The Charles Schwab Family of Funds, Schwab Investments, Schwab Capital Trust, Schwab Annuity Portfolios and Laudus Trust since 2011; Schwab Strategic Trust since 2016) | | | Director (2004 – present), Corcept Therapeutics Incorporated Director (2009 – 2021), Adamas Pharmaceuticals, Inc. Director (2003 – 2019), Symantec Corporation |
Jane P. Moncreiff 1961 Trustee (Trustee of The Charles Schwab Family of Funds, Schwab Investments, Schwab Capital Trust, Schwab Annuity Portfolios, Schwab Strategic Trust and Laudus Trust since 2019) | Consultant (2018 – present), Fulham Advisers LLC (management consulting); Chief Investment Officer (2009 – 2017), CareGroup Healthcare System, Inc. (healthcare). | | |
158Schwab Equity Index Funds | Semiannual Report
Schwab Equity Index Funds
Independent Trustees (continued) |
Name, Year of Birth, and Position(s) with the trust (Terms of office, and length of Time Served1) | Principal Occupations During the Past Five Years | Number of Portfolios in Fund Complex Overseen by the Trustee | |
Kimberly S. Patmore 1956 Trustee (Trustee of The Charles Schwab Family of Funds, Schwab Investments, Schwab Capital Trust, Schwab Annuity Portfolios, Schwab Strategic Trust and Laudus Trust since 2016) | Consultant (2008 – present), Patmore Management Consulting (management consulting). | | |
J. Derek Penn 1957 Trustee (Trustee of The Charles Schwab Family of Funds, Schwab Investments, Schwab Capital Trust, Schwab Annuity Portfolios, Schwab Strategic Trust and Laudus Trust since 2021) | Head of Equity Sales and Trading (2006 – 2018), BNY Mellon (financial services). | | |
Schwab Equity Index Funds | Semiannual Report159
Schwab Equity Index Funds
|
Name, Year of Birth, and Position(s) with the trust (Terms of office, and length of Time Served1) | Principal Occupations During the Past Five Years | Number of Portfolios in Fund Complex Overseen by the Trustee | |
Walter W. Bettinger II2 1960 Chairman and Trustee (Trustee of The Charles Schwab Family of Funds, Schwab Investments, Schwab Capital Trust and Schwab Annuity Portfolios since 2008; Schwab Strategic Trust since 2009; Laudus Trust since 2010) | Co-Chairman of the Board (July 2022 – present), Director and Chief Executive Officer (Oct. 2008 – present) and President (Feb. 2007 – Oct. 2021), The Charles Schwab Corporation; President and Chief Executive Officer (Oct. 2008 – Oct. 2021) and Director (May 2008 – Oct. 2021), Charles Schwab & Co., Inc.; Director (Apr. 2006 – present), Charles Schwab Bank, SSB; Director (Nov. 2017 – present), Charles Schwab Premier Bank, SSB; Director (July 2019 – present), Charles Schwab Trust Bank; Director (May 2008 – present), Chief Executive Officer (Aug. 2017 – present) and President (Aug. 2017 – Nov. 2021), Schwab Holdings, Inc.; Director (Oct. 2020 – present), TD Ameritrade Holding Corporation; Director (July 2016 – Oct. 2021), Charles Schwab Investment Management, Inc. | | Director (2008 – present), The Charles Schwab Corporation |
Richard A. Wurster2 1973 Trustee (Trustee of The Charles Schwab Family of Funds, Schwab Investments, Schwab Capital Trust, Schwab Annuity Portfolios, Schwab Strategic Trust and Laudus Trust since 2022) | President (Oct. 2021 – present) and Executive Vice President – Schwab Asset Management Solutions (Apr. 2019 – Oct. 2021), The Charles Schwab Corporation; President, Director (Oct. 2021 – present), Executive Vice President – Schwab Asset Management Solutions (July 2019 – Oct. 2021) and Senior Vice President – Advisory (May 2016 – July 2019), Charles Schwab & Co., Inc.; President (Nov. 2021 – present), Schwab Holdings, Inc.; Director (Oct. 2021 – present) and Chief Executive Officer (Nov. 2019 – Jan. 2022), Charles Schwab Investment Management, Inc.; Director, Chief Executive Officer and President (Mar. 2018 – Oct. 2022), Charles Schwab Investment Advisory, Inc.; Chief Executive Officer (July 2016 – Apr. 2018) and President (Mar. 2017 – Apr. 2018), ThomasPartners, Inc.; Chief Executive Officer (July 2016 – Apr. 2018), Windhaven Investment Management, Inc. | | |
|
Name, Year of Birth, and Position(s) with the trust (Terms of office, and length of Time Served3) | Principal Occupations During the Past Five Years |
Jonathan de St. Paer 1973 President and Chief Executive Officer (Officer of The Charles Schwab Family of Funds, Schwab Investments, Schwab Capital Trust, Schwab Annuity Portfolios, Schwab Strategic Trust and Laudus Trust since 2018) | Director (Apr. 2019 – present), President (Oct. 2018 – present), Chief Operating Officer (Jan. 2021 – present), and Chief Executive Officer (Apr. 2019 – Nov. 2019), Charles Schwab Investment Management, Inc.; Senior Vice President (June 2020 – Mar. 2022) and Chief Operating Officer (Jan. 2021 – Mar. 2022), Charles Schwab Investment Advisory, Inc.; Chief Executive Officer (Apr. 2019 – present), President (Nov. 2018 – present) and Trustee (Apr. 2019 – Dec. 2020), Schwab Funds, Laudus Trust and Schwab ETFs; Managing Director (May 2022 – present), Senior Vice President (Apr. 2019 – May 2022) and Senior Vice President – Strategy and Product Development (CSIM) (Jan. 2014 – Mar. 2019), Charles Schwab & Co., Inc. |
Mark Fischer 1970 Chief Operating Officer (Officer of The Charles Schwab Family of Funds, Schwab Investments, Schwab Capital Trust, Schwab Annuity Portfolios, Schwab Strategic Trust and Laudus Trust since 2013) | Chief Operating Officer (Dec. 2020 – present) and Treasurer and Chief Financial Officer (Jan. 2016 – Dec. 2022), Schwab Funds, Laudus Trust and Schwab ETFs; Chief Financial Officer (Mar. 2020 – present) and Vice President (Oct. 2013 – present), Charles Schwab Investment Management, Inc. |
Dana Smith 1965 Treasurer and Chief Financial Officer (Officer of The Charles Schwab Family of Funds, Schwab Investments, Schwab Capital Trust, Schwab Annuity Portfolios, Schwab Strategic Trust and Laudus Trust since 2023) | Treasurer and Chief Financial Officer (Jan. 2023 – present) and Assistant Treasurer (Dec. 2015 – Dec. 2022), Schwab Funds, Laudus Trust and Schwab ETFs; Vice President (Mar. 2022 – present) and Director (Oct. 2015 – Mar. 2022), Charles Schwab Investment Management, Inc. |
160Schwab Equity Index Funds | Semiannual Report
Schwab Equity Index Funds
Officers of the Trust (continued) |
Name, Year of Birth, and Position(s) with the trust (Terms of office, and length of Time Served3) | Principal Occupations During the Past Five Years |
Omar Aguilar 1970 Vice President and Chief Investment Officer (Officer of The Charles Schwab Family of Funds, Schwab Investments, Schwab Capital Trust, Schwab Annuity Portfolios, Schwab Strategic Trust and Laudus Trust since 2011) | Chief Executive Officer (Jan. 2022 – present), Chief Investment Officer (Apr. 2011 – present) and Senior Vice President (Apr. 2011 – Dec. 2021), Charles Schwab Investment Management, Inc.; Director, Chief Executive Officer and President (Oct. 2022 – present), Charles Schwab Investment Advisory, Inc.; Vice President and Chief Investment Officer (June 2011 – present), Schwab Funds, Laudus Trust and Schwab ETFs. |
Brett Wander 1961 Vice President and Chief Investment Officer (Officer of The Charles Schwab Family of Funds, Schwab Investments, Schwab Capital Trust, Schwab Annuity Portfolios, Schwab Strategic Trust and Laudus Trust since 2011) | Senior Vice President and Chief Investment Officer (Apr. 2011 – present), Charles Schwab Investment Management, Inc.; Vice President and Chief Investment Officer (June 2011 – present), Schwab Funds, Laudus Trust and Schwab ETFs. |
William P. McMahon, Jr. 1972 Vice President and Chief Investment Officer (Officer of The Charles Schwab Family of Funds, Schwab Investments, Schwab Capital Trust, Schwab Annuity Portfolios, Schwab Strategic Trust and Laudus Trust since 2021) | Senior Vice President and Chief Investment Officer (Jan. 2020 – present), Charles Schwab Investment Management, Inc.; Vice President and Chief Investment Officer (June 2021 – present), Schwab Funds, Laudus Trust and Schwab ETFs; Senior Vice President and Chief Investment Officer – ThomasPartners Strategies (Apr. 2018 – Dec. 2019), Charles Schwab Investment Advisory, Inc.; Senior Vice President and Chief Investment Officer (May 2001 – Apr. 2018), ThomasPartners, Inc. |
Catherine MacGregor 1964 Chief Legal Officer and Secretary, Schwab Funds and Schwab ETFs Chief Legal Officer, Vice President and Clerk, Laudus Trust (Officer of The Charles Schwab Family of Funds, Schwab Investments, Schwab Capital Trust, Schwab Annuity Portfolios and Laudus Trust since 2005; Schwab Strategic Trust since 2009) | Chief Legal Officer (Mar. 2022 – present) and Vice President (Sept. 2005 – present), Charles Schwab Investment Management, Inc.; Managing Director (May 2022 – present) and Vice President (July 2005 – May 2022), Charles Schwab & Co., Inc.; Vice President (Dec. 2005 – present) and Chief Legal Officer and Clerk (Mar. 2007 – present), Laudus Trust; Chief Legal Officer and Secretary (Oct. 2021 – present), Vice President (Nov. 2005 – Oct. 2021) and Assistant Secretary (June 2007 – Oct. 2021), Schwab Funds; Chief Legal Officer and Secretary (Oct. 2021 – present), Vice President and Assistant Secretary (Oct. 2009 – Oct. 2021), Schwab ETFs. |
1
Each Trustee shall hold office until the election and qualification of his or her successor, or until he or she dies, resigns or is removed. The retirement policy requires that each independent trustee retire by December 31 of the year in which the Trustee turns 74 or the Trustee’s twentieth year of service as an independent trustee on any trust in the Fund Complex, whichever occurs first.
2
Mr. Bettinger and Mr. Wurster are Interested Trustees. Mr. Bettinger and Mr. Wurster are Interested Trustees because each owns stock of The Charles Schwab Corporation (CSC), the parent company of Charles Schwab Investment Management, Inc., the investment adviser for the trusts in the Fund Complex, and is an employee of Charles Schwab & Co., Inc. (Schwab), the principal underwriter for The Charles Schwab Family of Funds, Schwab Investments, Schwab Capital Trust, Schwab Annuity Portfolios and Laudus Trust.
3
The President, Treasurer and Secretary/Clerk hold office until their respective successors are chosen and qualified or until he or she sooner dies, resigns, is removed or becomes disqualified. Each of the other officers serves at the pleasure of the Board.
Schwab Equity Index Funds | Semiannual Report161
Schwab Equity Index Funds
asset allocation The practice of dividing a portfolio among different asset classes, with each asset class assigned a particular percentage.
asset class A group of securities with similar structure and basic characteristics. Stocks, bonds and cash are the three main examples of asset classes.
bond A security representing a loan from the investor to the issuer. A bond typically pays interest at a fixed rate (the coupon rate) until a specified date (the maturity date), at which time the issuer returns the money borrowed (principal or face value) to the bondholder. Because of their structure, bonds are sometimes called “fixed-income securities” or “debt securities.”
An individual bond is subject to the credit risk of the issuer. Changes in interest rates can affect a bond’s market value prior to call or maturity. There is no guarantee that a bond’s yield to call or maturity will provide a positive return over the rate of inflation.
bond fund A bond fund is subject to the same credit, interest rate, and inflation risks as bonds. In addition, a bond fund incurs ongoing fees and expenses. A bond fund’s net asset value will fluctuate with the price of the underlying bonds and the portfolio turnover activity; return of principal is not guaranteed.
cap, capitalization See “market cap.”
capital gain, capital loss the difference between the amount paid for an investment and its value at a later time. If the investment has been sold, the capital gain or loss is considered a realized gain or loss. If the investment is still held, the capital gain or loss is considered unrealized appreciation or depreciation.
Dow Jones U.S. Total Stock Market Index An index which includes all U.S. equity issues with readily available prices. The index is a float-adjusted market capitalization weighted index that reflects the shares of securities actually available to investors in the marketplace.
expense ratio The amount that is taken from a mutual fund’s assets each year to cover the fund’s operating expenses. An expense ratio of 0.50% means that a fund’s expenses amount to half of one percent of its average net assets a year.
market cap, market capitalization The value of a company as determined by the total value of all shares of its stock outstanding.
MSCI EAFE Index (Net) A free float-adjusted market capitalization index that is designed to measure the equity market performance of developed markets in Europe, Australasia, and the Far East. The Net version of the index reflects reinvested dividends net of withholding taxes, but reflects no deductions for expenses or other taxes; returns are calculated applying dividend withholding rates applicable to non-resident persons who do not benefit from double taxation treaties.
net asset value (NAV) The value of one share of a mutual fund. NAV is calculated by taking the fund’s total assets, subtracting liabilities, and dividing by the number of shares outstanding.
outstanding shares, shares outstanding When speaking of a company or mutual fund, indicates all shares currently held by investors.
price-to-book ratio (P/B) The market price of a company’s stock compared with its “book value.” A mutual fund’s P/B is the weighted average of the P/B of all stocks in the fund’s portfolio.
price-to-earnings ratio (P/E) The market price of a company’s stock compared with earnings over the past year. A mutual fund’s P/E is the weighted average of the P/E of all stocks in the fund’s portfolio.
restricted and illiquid securities Restricted securities are securities that are subject to legal restrictions on their sale. Restricted securities generally can be sold in privately negotiated transactions, pursuant to an exemption from registration under the Securities Act of 1933 (the 1933 Act), or in a registered public offering. Certain restricted securities, such as Section 4(a)(2) commercial paper and Rule 144A securities under the 1933 Act, may be considered to be liquid if they meet the criteria for liquidity established by the Board. Illiquid securities generally are any securities that cannot be disposed of promptly and in the ordinary course of business at approximately the amount at which a fund has valued the instruments. The liquidity of a fund’s investments is monitored under the supervision and direction of the Board. Investments currently not considered liquid include repurchase agreements not maturing within seven days and certain restricted securities.
return on equity (ROE) The average yearly rate of return for each dollar of investors’ money, measured over the past five years.
Russell 1000 Growth Index An index that measures the performance of those Russell 1000 Index companies with higher price-to-book ratios and higher forecasted growth values.
Russell 1000 Index An index that measures the performance of the 1,000 largest companies in the Russell 3000 Index, and represents approximately 92% of the total market capitalization of the Russell 3000 Index. The Russell 3000 Index measures the performance of the largest 3,000 U.S. companies representing approximately 98% of the investable U.S. equity market.
Russell 1000 Value Index An index that measures the performance of the large-cap value segment of the U.S. equity universe. It includes those Russell 1000 Index companies with lower price-to-book ratios and lower expected growth values.
Russell 2000 Index An index that measures the performance of the 2,000 smallest companies in the Russell 3000 Index. The Russell 3000 Index measures the performance of the largest 3,000 U.S. companies representing approximately 98% of the investable U.S. equity market.
Russell Midcap Index An index that measures the performance of the mid-cap segment of the U.S. equity universe. The Russell Midcap Index is a subset of the Russell 1000 Index. It includes approximately 800 of the smallest securities based on a combination of their market cap and current index membership.
S&P 500 Index An index that is designed to measure the performance of 500 leading publicly traded companies from a broad range of industries.
Schwab 1000 Index A float-adjusted market capitalization weighted index developed by Charles Schwab & Co., Inc. that represents the performance of the largest 1,000 publicly traded companies in the United States. As a result of corporate actions, the index may be comprised of more or less than 1,000 securities.
stock A share of ownership, or equity, in the issuing company.
total return The percentage that an investor would have earned or lost on an investment in the fund assuming dividends and distributions were reinvested.
weighted average For mutual funds, an average that gives the same weight to each security as the security represents in the fund’s portfolio.
yield The income paid out by an investment, expressed as a percentage of the investment’s market value.
162Schwab Equity Index Funds | Semiannual Report
Schwab Equity Index Funds
Schwab Asset Management
With a straightforward lineup of core products and solutions for building the foundation of a portfolio, Schwab Asset Management advocates for investors of all sizes with a steadfast focus on lowering costs and reducing unnecessary complexity. The list below shows all currently available Schwab Funds®.
Investors should carefully consider information contained in the prospectus, or if available, the summary prospectus, including investment objectives, risks, charges and expenses before investing. Please call 1-877-824-5615 for a prospectus for any Schwab Fund. Please read the prospectus carefully before you invest. This report must be preceded or accompanied by a current prospectus.
Proxy Voting Policies, Procedures and Results
A description of the proxy voting policies and procedures used to determine how to vote proxies on behalf of the funds is available without charge, upon request, by visiting the Schwab Funds’ website at www.schwabassetmanagement.com/schwabfunds_prospectus, the SEC’s website at www.sec.gov, or by contacting Schwab Funds at 1-877-824-5615.
Information regarding how a fund voted proxies relating to portfolio securities during the most recent twelve-month period ended June 30 is available, without charge, by visiting the fund’s website at www.schwabassetmanagement.com/schwabfunds_prospectus or the SEC’s website at www.sec.gov.
Schwab Funds
Equity Funds
Schwab Core Equity Fund
Schwab Dividend Equity Fund
Schwab Large-Cap Growth Fund
Schwab Small-Cap Equity Fund
Schwab Health Care Fund
Schwab International Core Equity Fund
Schwab International Opportunities Fund
Schwab Select Large Cap Growth Fund
Schwab Fundamental US Large Company Index Fund
Schwab Fundamental US Small Company Index Fund
Schwab Fundamental International Large Company Index Fund
Schwab Fundamental International Small Company Index Fund
Schwab Fundamental Emerging Markets Large Company Index Fund
Schwab Fundamental Global Real Estate Index Fund
Schwab Global Real Estate Fund
Schwab S&P 500 Index Fund
Schwab 1000 Index® Fund
Schwab Small-Cap Index Fund®
Schwab Total Stock Market Index Fund®
Schwab U.S. Large-Cap Growth Index Fund
Schwab U.S. Large-Cap Value Index Fund
Schwab U.S. Mid-Cap Index Fund
Schwab International Index Fund®
Asset Allocation Funds
Schwab Balanced Fund
Schwab MarketTrack Portfolios®
Schwab Target Funds
Schwab Target Index Funds
Schwab Monthly Income Funds
Bond Funds
Schwab Treasury Inflation Protected Securities Index Fund
Schwab U.S. Aggregate Bond Index Fund
Schwab Short-Term Bond Index Fund
Schwab Tax-Free Bond Fund1
Schwab California Tax-Free Bond Fund1
Schwab Opportunistic Municipal Bond Fund
Schwab Money Funds2
Schwab provides a broad choice of taxable and tax-exempt money market funds for both retail and institutional client types.
Investment Adviser
Charles Schwab Investment Management, Inc., dba Schwab Asset Management
211 Main Street, San Francisco, CA 94105
Funds
Schwab Funds
1-877-824-5615
© 2023 Charles Schwab & Co., Inc. All rights reserved.
Member SIPC®
Printed on recycled paper.
¹
State, local, and the Federal Alternative Minimum Tax may apply. Capital gains are not exempt from Federal Taxation.
²
You could lose money by investing in the Schwab Money Funds. All Schwab Money Funds with the exception of Schwab Variable Share Price Money Fund seek to preserve the value of your investment at $1.00 per share, but cannot guarantee they will do so. Because the share price of Schwab Variable Share Price Money Fund will fluctuate, when you sell your shares they may be worth more or less than what you originally paid for them. All Schwab Money Funds with the exception of Schwab Government Money Fund, Schwab Retirement Government Money Fund, Schwab U.S. Treasury Money Fund, Schwab Treasury Obligations Money Fund and Schwab Government Money Market Portfolio may impose a fee upon the sale of your shares or may temporarily suspend your ability to sell shares if the Fund’s liquidity falls below required minimums because of market conditions or other factors. An investment in the Schwab Money Funds is not insured or guaranteed by the Federal Deposit Insurance Corporation or any other government agency. The Schwab Money Funds’ sponsor has no legal obligation to provide financial support to the Funds, and you should not expect that the sponsor will provide financial support to the Funds at any time.
This page is intentionally left blank.
Item 2: Code of Ethics.
Not applicable to this semi-annual report.
Item 3: Audit Committee Financial Expert.
Not applicable to this semi-annual report.
Item 4: Principal Accountant Fees and Services.
Not applicable to this semi-annual report.
Item 5: Audit Committee of Listed Registrants.
Not applicable.
Item 6: Schedule of Investments.
The schedules of investments are included as part of the report to shareholders filed under Item 1 of this Form.
Item 7: Disclosure of Proxy Voting Policies and Procedures for Closed-End Management Investment Companies.
Not applicable.
Item 8: Portfolio Managers of Closed-End Management Investment Companies.
Not applicable.
Item 9: Purchases of Equity Securities by Closed-End Management Investment Company and Affiliated Purchasers.
Not applicable.
Item 10: Submission of Matters to a Vote of Security Holders.
Not applicable.
Item 11: Controls and Procedures.
| (a) | Based on their evaluation of Registrant’s disclosure controls and procedures, as of a date within 90 days of the filing date, Registrant’s Chief Executive Officer, Jonathan de St. Paer and Registrant’s Chief Financial Officer, Dana Smith, have concluded that Registrant’s disclosure controls and procedures are: (i) reasonably designed to ensure that information required to be disclosed in this report is appropriately communicated to Registrant’s officers to allow timely decisions regarding disclosures required in this report; (ii) reasonably designed to ensure that information required to be disclosed in this report is recorded, processed, summarized and reported in a timely manner; and (iii) are effective in achieving the goals described in (i) and (ii) above. |
| (b) | During the period covered by this report, there have been no changes in Registrant’s internal control over financial reporting that the above officers believe to have materially affected, or to be reasonably likely to materially affect, Registrant’s internal control over financial reporting. |
Item 12: Disclosure of Securities Lending Activities for Closed-End Management Investment Companies.
Not applicable.
Item 13: Exhibits.
Pursuant to the requirements of the Securities Exchange Act of 1934 and the Investment Company Act of 1940, the registrant has duly caused this report to be signed on its behalf by the undersigned, thereunto duly authorized.
(Registrant) Schwab Investments – Schwab 1000 Index Fund
| | |
| By: | | /s/ Jonathan de St. Paer |
| | Jonathan de St. Paer Chief Executive Officer |
| |
| Date: | | June 16, 2023 |
Pursuant to the requirements of the Securities Exchange Act of 1934 and the Investment Company Act of 1940, this report has been signed below by the following persons on behalf of the registrant and in the capacities and on the dates indicated.
| | |
| By: | | /s/ Jonathan de St. Paer |
| | Jonathan de St. Paer Chief Executive Officer |
| |
| Date: | | June 16, 2023 |
| | |
| By: | | /s/ Dana Smith |
| | Dana Smith Chief Financial Officer |
| |
| Date: | | June 16, 2023 |